RESEARCH ARTICLE Open Access Common risk factors for chronic non-communicable diseases among older adults in China, Ghana, Mexico, India, Russia and South Africa: the study on global AGEing and adult health (SAGE) wave 1 Fan Wu 1*† , Yanfei Guo 1† , Somnath Chatterji 2 , Yang Zheng 1 , Nirmala Naidoo 2 , Yong Jiang 3 , Richard Biritwum 4 , Alfred Yawson 4 , Nadia Minicuci 4,5 , Aaron Salinas-Rodriguez 6 , Betty Manrique-Espinoza 6 , Tamara Maximova 7 , Karl Peltzer 8,9,10 , Nancy Phaswanamafuya 10,11 , James J Snodgrass 12 , Elizabeth Thiele 13 , Nawi Ng 14 and Paul Kowal 2,15 Abstract Background: Behavioral risk factors such as tobacco use, unhealthy diet, insufficient physical activity and the harmful use of alcohol are known and modifiable contributors to a number of NCDs and health mediators. The purpose of this paper is to describe the distribution of main risk factors for NCDs by socioeconomic status (SES) among adults aged 50 years and older within a country and compare these risk factors across six lower- and upper-middle income countries. Methods: The study population in this paper draw from SAGE Wave 1 and consisted of adults aged 50-plus from China (N=13,157), Ghana (N=4,305), India (N=6,560), Mexico (N=2,318), the Russian Federation (N=3,938) and South Africa (N=3,836). Seven main common risk factors for NCDs were identified: daily tobacco use, frequent heavy drinking, low level physical activity, insufficient vegetable and fruit intake, high risk waist-hip ratio, obesity and hypertension. Multiple risk factors were also calculated by summing all these risk factors. Results: The prevalence of daily tobacco use ranged from 7.7% (Ghana) to 46.9% (India), frequent heavy drinker was the highest in China (6.3%) and lowest in India (0.2%), and the highest prevalence of low physical activity was in South Africa (59.7%). The highest prevalence of respondents with high waist-to-hip ratio risk was 84.5% in Mexico, and the prevalence of self-reported hypertension ranging from 33% (India) to 78% (South Africa). Obesity was more common in South Africa, the Russia Federation and Mexico (45.2%, 36% and 28.6%, respectively) compared with China, India and Ghana (15.3%, 9.7% and 6.4%, respectively). China, Ghana and India had a higher prevalence of respondents with multiple risk factors than Mexico, the Russia Federation and South Africa. The occurrence of three and four risk factors was more prevalent in Mexico, the Russia Federation and South Africa. Conclusion: There were substantial variations across countries and settings, even between upper-middle income countries and lower-middle income countries. The baseline information on the magnitude of the problem of risk factors provided by this study can help countries and health policymakers to set up interventions addressing the global non-communicable disease epidemic. Keywords: Chronic non-communicable diseases, SAGE, Tobacco use, Obesity, Low- and middle-income countries * Correspondence: [email protected] † Equal contributors 1 Shanghai Municipal Centre for Disease Control (Shanghai CDC), 1380 Zhongshan Rd (W), Shanghai 200336, P.R. China Full list of author information is available at the end of the article © 2015 Wu et al.; licensee BioMed Central. This is an Open Access article distributed under the terms of the Creative Commons Attribution License (http://creativecommons.org/licenses/by/4.0), which permits unrestricted use, distribution, and reproduction in any medium, provided the original work is properly credited. The Creative Commons Public Domain Dedication waiver (http://creativecommons.org/publicdomain/zero/1.0/) applies to the data made available in this article, unless otherwise stated. Wu et al. BMC Public Health (2015) 15:88 DOI 10.1186/s12889-015-1407-0

Welcome message from author
This document is posted to help you gain knowledge. Please leave a comment to let me know what you think about it! Share it to your friends and learn new things together.
Transcript
Wu et al. BMC Public Health (2015) 15:88 DOI 10.1186/s12889-015-1407-0
RESEARCH ARTICLE Open Access
Common risk factors for chronic non-communicablediseases among older adults in China, Ghana,Mexico, India, Russia and South Africa: the studyon global AGEing and adult health (SAGE) wave 1Fan Wu1*†, Yanfei Guo1†, Somnath Chatterji2, Yang Zheng1, Nirmala Naidoo2, Yong Jiang3, Richard Biritwum4,Alfred Yawson4, Nadia Minicuci4,5, Aaron Salinas-Rodriguez6, Betty Manrique-Espinoza6, Tamara Maximova7,Karl Peltzer8,9,10, Nancy Phaswanamafuya10,11, James J Snodgrass12, Elizabeth Thiele13, Nawi Ng14
and Paul Kowal2,15
Abstract
Background: Behavioral risk factors such as tobacco use, unhealthy diet, insufficient physical activity and the harmfuluse of alcohol are known and modifiable contributors to a number of NCDs and health mediators. The purpose of thispaper is to describe the distribution of main risk factors for NCDs by socioeconomic status (SES) among adults aged 50years and older within a country and compare these risk factors across six lower- and upper-middle income countries.
Methods: The study population in this paper draw from SAGE Wave 1 and consisted of adults aged 50-plus from China(N=13,157), Ghana (N=4,305), India (N=6,560), Mexico (N=2,318), the Russian Federation (N=3,938) and South Africa(N=3,836). Seven main common risk factors for NCDs were identified: daily tobacco use, frequent heavy drinking, lowlevel physical activity, insufficient vegetable and fruit intake, high risk waist-hip ratio, obesity and hypertension. Multiplerisk factors were also calculated by summing all these risk factors.
Results: The prevalence of daily tobacco use ranged from 7.7% (Ghana) to 46.9% (India), frequent heavy drinker wasthe highest in China (6.3%) and lowest in India (0.2%), and the highest prevalence of low physical activity was in SouthAfrica (59.7%). The highest prevalence of respondents with high waist-to-hip ratio risk was 84.5% in Mexico, and theprevalence of self-reported hypertension ranging from 33% (India) to 78% (South Africa). Obesity was more common inSouth Africa, the Russia Federation and Mexico (45.2%, 36% and 28.6%, respectively) compared with China, India andGhana (15.3%, 9.7% and 6.4%, respectively). China, Ghana and India had a higher prevalence of respondents withmultiple risk factors than Mexico, the Russia Federation and South Africa. The occurrence of three and four riskfactors was more prevalent in Mexico, the Russia Federation and South Africa.
Conclusion: There were substantial variations across countries and settings, even between upper-middle incomecountries and lower-middle income countries. The baseline information on the magnitude of the problem of riskfactors provided by this study can help countries and health policymakers to set up interventions addressing theglobal non-communicable disease epidemic.
Keywords: Chronic non-communicable diseases, SAGE, Tobacco use, Obesity, Low- and middle-income countries
* Correspondence: [email protected]†Equal contributors1Shanghai Municipal Centre for Disease Control (Shanghai CDC), 1380Zhongshan Rd (W), Shanghai 200336, P.R. ChinaFull list of author information is available at the end of the article
© 2015 Wu et al.; licensee BioMed Central. This is an Open Access article distributed under the terms of the CreativeCommons Attribution License (http://creativecommons.org/licenses/by/4.0), which permits unrestricted use, distribution, andreproduction in any medium, provided the original work is properly credited. The Creative Commons Public DomainDedication waiver (http://creativecommons.org/publicdomain/zero/1.0/) applies to the data made available in this article,unless otherwise stated.
Wu et al. BMC Public Health (2015) 15:88 Page 2 of 13
BackgroundChronic non-communicable diseases (NCDs) are the lead-ing causes of morbidity and mortality in most low- andmiddle-income countries (LMIC) [1]. Recent estimatesdemonstrate that nearly 80% of NCDs deaths occur inLMIC and about three fourth of global NCD-relateddeaths take place after the age of 60 [2]. Behavioral riskfactors such as tobacco use, unhealthy diet, insufficientphysical activity and the harmful use of alcohol are knownand modifiable contributors to a number of NCDs andhealth mediators [3,4]. Additionally, with over half of theglobal population in urban areas, risk factors associatedwith urbanization such as diet, obesity, hypertension, anda decrease in physical activity will all have significant im-pacts on the health of the population [5]. Self-report activ-ity data document a pattern of increased inactivity withadvancing age [6,7]. As part of the English LongitudinalStudy on Ageing, Shankar and colleagues found evidenceof clustering of health-related behaviors in older adults[8]. Some epidemiological evidence also suggests multiplerisk factors were common in rural Africa [9]. Independ-ently or in combination, these risk factors present anopportunity for interventions to reduce future healthburdens in ageing populations in LMIC.The development of a national risk factor profile for
NCDs provides key information required for planningprevention and control activities and could also help topredict the future burden of disease. Reliable and com-parable analysis of risks to health is especially importantfor preventing or modifying disease and injury. However,until recently, analysis of health risks were limited by in-consistent methodologies, dated assumptions and/orvariations in assessment criteria for evidence on preva-lence, causality and hazard size - all of which limited theability to produce comparable data to estimate popula-tion health status [10].This study used data from the six countries that im-
plemented the World Health Organization’s Study onglobal AGEing and adult health (SAGE) Wave 1. Thepurpose of this paper is to describe the distribution ofmain risk factors for NCDs by socioeconomic status(SES) within and across countries to better understandthe levels of modifiable NCD risk factors for adultsaged 50 years and older, and whether these risk factorsshow age, sex, rural/urban, wealth and country-specificdifferences.
MethodsStudy designThe study population was drawn from the SAGE Wave1, which is a longitudinal cohort survey of ageing andolder adults from 2007 to 2010 in six low- and middle-income countries (China, Ghana, India, Mexico, RussianFederation and South Africa) [11]. Multistage cluster
sampling strategies were used in all countries where, ex-cept for Mexico, households were classified into one oftwo mutually exclusive categories: (1) all persons aged50 years and older were selected from households classi-fied as ‘50-plus households’; and, (2) one person aged 18–49 years was selected from a household classified as an‘18–49 household’. The arrangement in Mexico was simi-lar, but included supplementary and replacement samplesto account for losses to follow up in selected samplingunits since Wave 0 [12]. The sample in India is also repre-sentative at the sub-national and sub-state levels for theselected states. Response rates for SAGE countries rangedfrom 51% in Mexico to 93% in China (India 68%, Ghana80%, Russia 83%, and South Africa 77%).
MeasuresSAGE used a standardized instrument for collection ofsociodemographic information and behavioral risk fac-tors based on the WHO STEPwise approach to Surveil-lance (WHO STEPS, WHO 2005). This includes alcoholand tobacco consumption, diet and physical activity. Inaddition, a number of more objective risk factors wereassessed, including, waist and hip circumferences, weight,height, and blood pressure.In our study, alcohol consumption was categorized
into two broad groups: non-drinkers and drinkers, withthe latter subdivided according to the number of alco-holic drinks consumed during the week before the inter-view. Heavy drinkers were defined as consuming five ormore standard drinks per day for men and four or morestandard drinks per day for women.The Global Physical Activity Questionnaire (GPAQ)
was used to measure the intensity, duration, and fre-quency of physical activity in three domains: occupa-tional; transport-related; and, discretionary or leisuretime [13]. The total time spent in physical activity duringa typical week, including the number of days and inten-sity, were used to generate low, moderate, and high cat-egories of physical activity levels.Tobacco use covered different forms and frequency of
tobacco use—manufactured or hand-rolled cigarettes, ci-gars, cheroots or whether tobacco is smoked, chewed,sucked or inhaled, each day over the week prior to theinterview [14].Information on fruit and vegetable consumption was
based on the number of daily servings typically eaten.Sufficient intake was determined according to thenumber of servings. Five or more servings are consid-ered sufficient, and fewer than five servings are insuf-ficient [15].Waist and hip circumferences were measured to calcu-
late waist-to-hip ratio [16]. Central obesity can be de-fined using adult waist-hip ratio (WHR), male WHRmore than 0.90 and female WHR more than 0.85.
Wu et al. BMC Public Health (2015) 15:88 Page 3 of 13
Blood pressure was measured three times on the rightarm/wrist of the seated respondent using a wrist bloodpressure monitor. Out of three measurements, an aver-age of the latter two measurements was used as theblood pressure value in this analysis. The definitionused to designate hypertension is systolic blood pres-sure greater than or equal to 140 mmHg and/or dia-stolic blood pressure greater than or equal to 90mmHg19 and/or self-reported treatment of hyperten-sion with antihypertensive medication currently (thelast two weeks before interview) [17].Weight and height were measured to calculate body
mass index (BMI), calculated as weight/height2 (kg/m2).According to the classification criteria proposed by theWHO [18]. A cut-off point of <18.5 kg/m2 is used to
Table 1 Percent distribution of respondent sociodemographicdata, SAGE Wave 1
China Ghana India
(n = 13,157) (n = 4,305) (n = 6
% % %
Age group
50-59 44.9 39.7 48.6
60-69 31.9 27.5 30.9
70-79 18.6 23.1 16
80+ 4.6 9.7 4.5
Sex
Men 49.8 52.4 51
Women 50.2 47.6 49
Residence
Urban 47.3 41.1 28.9
Rural 52.7 58.9 71.1
Education level
No formal education 23.1 54 51.2
Less than primary 18.9 10.4 10
Primary school completed 21 10.9 14.8
Secondary school completed 19.9 4 10.2
High school completed 12.6 17.1 8.6
College completed 4.4 3.4 3.4
Post graduate degree completed 0.1 0.2 1.7
Income quintile*
Lowest 16.3 18.2 18.2
Second 18.1 19.1 19.5
Third 20.5 20.5 18.8
Fourth 23.4 20.7 19.6
Highest 21.8 21.6 23.9
*Income levels were generated through a multi-step process, where asset ownershito generate raw continuous income estimates, and then transformed into quintiles.(Quintile 5) the quintile with the richest households.Note: Weighted estimates.
define underweight; a BMI of 25–29.9 kg/m2 indicatesoverweight; and a BMI of ≥30 kg/m2 indicates obesity.Modified BMI cutoffs for China and India were used toperform an additional set of analyses that describesmoderate-to-high risk (BMI 23.0-27.5) and high-to-veryhigh risk (BMI >27.5) in Asian populations [19].All these seven risk factors were summed, and a
new variable representing the cumulative number ofrisk factors reported/measured for each individualwas created, with the range from 0 (no risk factors) to7 (with all risk factors). SAGE was approved by theWorld Health Organization's Ethical Review Board aswell as a national approval in all six countries. In-formed consent has been obtained from all studyparticipants.
characteristics, by country and multi-country pooled
Mexico Russia South Africa Pooled
,560) (n = 2,318) (n = 3,938) (n = 3,836) (n = 34,114)
% % % %
48.1 44.1 49.9 45.8
25.6 26.7 30.6 29.7
17.8 21.4 14 18.7
8.6 7.7 5.5 5.8
46.8 41.9 44.1 47.2
53.2 58.1 55.9 52.8
78.8 70.1 64.9 50.4
21.2 29.9 35.1 49.6
17.2 0.5 25.2 23.8
38.4 1.2 24 10.1
24 5.3 22.4 13.5
9.9 17.9 14.2 16
2.4 54.3 8.4 26.2
5.5 20.7 3.9 9.9
2.6 0.1 1.8 0.6
15.3 13.3 20.7 15.9
24.7 17.1 19.9 18.2
16.8 19.6 18.2 19.6
16.6 22.1 19.8 21.7
26.6 27.8 21.3 24.5
p was converted to an asset ladder, a Bayesian post-estimation method usedLowest (Quintile 1) is the quintile with the poorest households and Highest
Wu et al. BMC Public Health (2015) 15:88 Page 4 of 13
Statistical analysisSAGE used a stratified multistage-cluster design in eachcountry. Each household and individual was assigned aknown non-zero probability of being selected. House-hold and individual weights were post-stratified accord-ing to country-specific population data. Prevalence ratesfor each risk factor were estimated using post-stratifiedindividual probability weights in each nation to compen-sate for undercoverage. According to the sampling designof each country, country-specific cluster and/or stratawere taken into account to estimate the 95% confidenceintervals (CIs). All statistical analyses were conductedusing STATA SE version 11 (STATA Corp, CollegeStation, TX).
ResultsA total of 38,670 individuals aged 50 and older partici-pated in the SAGE survey. Individuals who couldn’tcompleted or partially completed interview or with miss-ing sociodemographic variables were excluded from theanalyses. Finally, A total of 34,114 individuals aged 50and older in the six countries were considered in thisanalysis. China has the largest sample (N=13,157), andMexico (N=2,318) the smallest sample. The socio-demographic characteristics for each country are shownin Table 1. The demographic and socioeconomic charac-teristics of the older population differed widely acrossthe six countries, the proportion of women is higher
Frequent heavy drinker
Obesity
Current daily tobacco use
Low level of physical activity
Insufficient vegetable&fruit intake
Central obesity
Hypertension
Frequent heavy drink
Current daily tobac
Obesity
Low level of
H
Insufficient ve
Frequent heavy drinker
Current daily tobacco use
Obesity
Low level of physical activity
Hypertension
Insufficient vegetable&fruit intake
Central obesity
Frequent heavy drink
Current daily to
Low level of p
Obesity
Insufficient vege
0 20 40 60 80 100 0 20 40 60
China Ghana
Mexico Russia
(%)
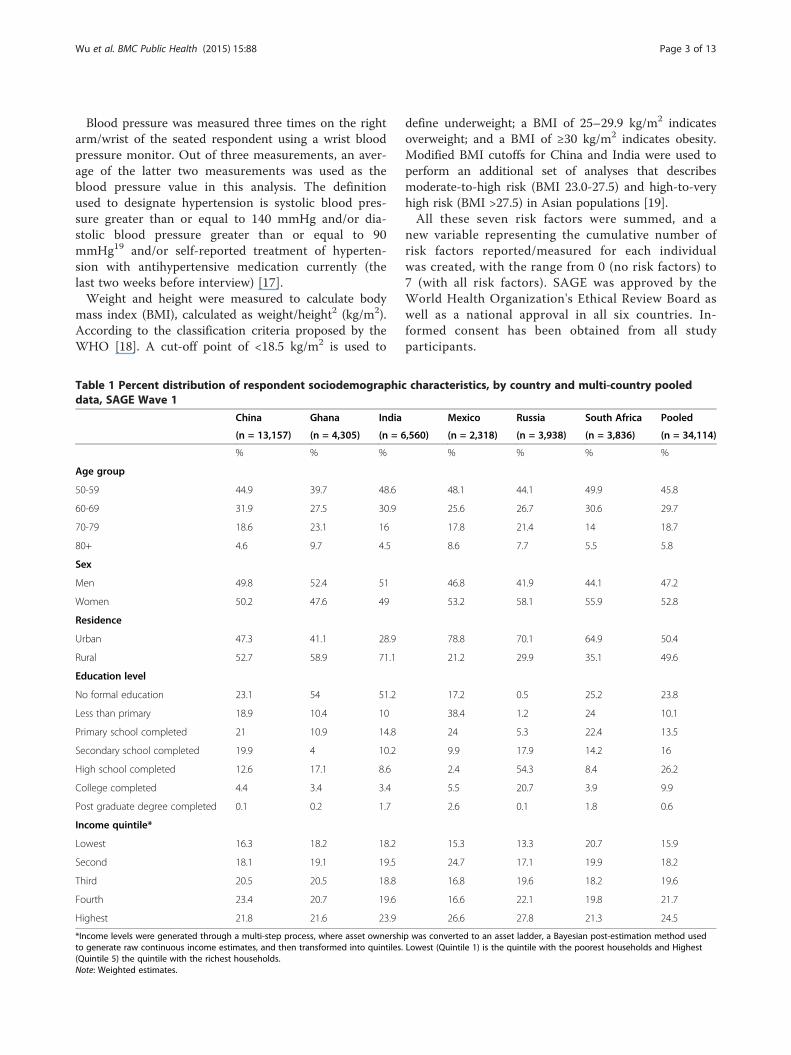
Figure 1 Ranking of selected risk factors among adults aged 50 years
than men except in the Ghana, which consisted of 52.4%men and 47.6% women. The 50–59 age groups were thehighest proportion in all countries. India remainedlargely a rural society, with more than two-thirds resid-ing in rural areas; in contrast, the majority of olderMexicans, Russians, and South Africans lived in urbanareas. Ghana and India had the lowest educational levelamong the SAGE countries, with over 54% and 51%, re-spectively, of the older population having no formaleducation. In contrast, only 0.5% of older Russians hadno formal education, and nearly one in five had a col-lege degree or higher.The ranking of all seven NCD risk factors for each
country is shown in Figure 1: central obesity, inadequatevegetable fruit intake and hypertension are the threemost common risk factors across all six countries, ex-cept in India where current daily tobacco use pushedhypertension to fourth among all seven NCD risk fac-tors. In India, the prevalence of inadequate vegetablefruit intake and current daily smoker are the highestamong all the six countries. In contrast, the rate ofhypertension (33%) in India is the lowest. The preva-lence of obesity in Mexico, Russia and South Africa aremarkedly higher than that in China, India and Ghana.
Tobacco abuseThe prevalence of daily tobacco use ranged from 7.7%(Ghana) to 46.9% (India). Men were much more likely
er
co use
physical activity
ypertension
getable&fruit intake
Central obesity
Frequent heavy drinker
Obesity
Low level of physical activity
Hypertension
Current daily tobacco use
Central obesity
Insufficient vegetable&fruit intake
er
bacco use
hysical activity
Central obesity
Hypertension
table&fruit intake
Frequent heavy drinker
Current daily tobacco use
Obesity
Low level of physical activity
Central obesity
Insufficient vegetable&fruit intake
Hypertension
80 100 0 20 40 60 80 100
India
South Africa
and older across six countries.
Wu et al. BMC Public Health (2015) 15:88 Page 5 of 13
than women to smoke in all six countries. With increas-ing age, prevalence of current daily smoker among mendecreased in China, and the Russian Federation; how-ever, only minor age differences were seen in Ghana andMexico. Tobacco use among women declined with agein Mexico and Russia Federation. Older urban residentsin China, Ghana, and India were less likely to use to-bacco than their rural counterparts, while it was the op-posite in Mexico (Table 2).
Alcohol consumptionHeavy alcohol consumption was highest in China, where6.3% of older Chinese were frequent heavy drinkers,compared to just 0.2% of older Indians, the lowestamong all six countries. Men were much more likely todrink than women in all countries. For men, the preva-lence of heavy alcohol consumption decreased with in-creasing age in China, Ghana and India. Older ruralresidents were more likely to drink than their urban
Table 2 Prevalence of current daily tobacco use by age, sex, raged 50 years and older across six countries
China Ghana India
% 95% CI % 95% CI % 95% CI
Men
50-59 58.8 [55.3,62.3] 11.1 [9.0,13.6] 63.8 [58.6,68.7]
60-69 50.1 [46.5,53.6] 11.2 [8.8,14.3] 64.3 [59.5,68.8]
70-79 35.1 [31.2,39.3] 10.7 [7.7,14.6] 60.0 [51.3,68.0]
80+ 29.8 [23.2,37.3] 13.8 [8.9,20.6] 54.7 [43.6,65.4]
Women
50-59 1.4 [1.0,2.0] 2.0 [1.1,3.5] 26.9 [23.7,30.3]
60-69 3.1 [2.2,4.2] 3.7 [2.4,5.8] 33.5 [28.8,38.6]
70-79 6.1 [4.5,8.2] 6.4 [4.2,9.5] 33.2 [25.5,41.8]
80+ 3.7 [1.8,7.5] 3.6 [1.6,7.7] 31.8 [23.3,41.8]
Residence
Urban 19.4 [17.9,21.1] 4.1 [3.0,5.5] 37.1 [31.0,43.6]
Rural 33.4 [31.0,35.9] 10.2 [8.7,11.9] 50.9 [48.4,53.4]
Income quintile*
Lowest 29.1 [25.6,32.8] 16.0 [12.9,19.7] 57.1 [51.9,62.2]
Second 30.9 [27.5,34.5] 9.1 [7.3,11.4] 54.7 [51.2,58.1]
Middle 26.2 [24.4,28.2] 8.0 [6.0,10.5] 49.8 [45.0,54.7]
Fourth 26.8 [25.1,28.5] 4.8 [3.5,6.5] 43.0 [38.9,47.1]
Highest 21.9 [19.4,24.7] 1.8 [1.0,3.4] 33.5 [29.3,38.1]
Total 26.7 [25.3,28.2] 7.7 [6.6,8.8] 46.9 [44.4,49.3]
*Income levels were generated through a multi-step process, where asset ownershito generate raw continuous income estimates, and then transformed into quintiles.(Quintile 5) the quintile with the richest households.Note: Weighted estimates.
dwelling counterparts in all countries, except SouthAfrica (Table 3).
Low level physical activityPrevalence of low level physical activity was highest inSouth Africa, at 59.7%. A significant age-gradient wasseen in all countries, where prevalence consistently in-creased with increasing age. Older urban residents weremore likely to engage in low level physical activity in allcountries (Table 4).
Inadequate fruit and vegetable consumptionPrevalence of inadequate fruit and vegetable intakeamong India’s older population were relatively higherthan any other SAGE country; while China had the low-est prevalence at 35.6%. In China and South Africa, re-spondents with the highest household income had thelowest prevalence (Table 5).
ural/urban area and income quintiles among persons
Mexico Russian Federation South Africa
% 95% CI % 95% CI % 95% CI
18.4 [7.2,39.6] 50.7 [39.2,62.1] 25.8 [19.9,32.7]
19.4 [13.7,26.6] 43.3 [30.4,57.2] 21.4 [21.4,21.4]
21.1 [12.5,33.5] 14.0 [8.2,23.0] 15.9 [10.6,23.2]
14.6 [7.5,26.5] 5.7 [1.9,15.9] 18.1 [5.7,44.5]
11.0 [3.6,28.9] 7.9 [5.3,11.6] 17.3 [13.6,21.6]
8.9 [4.5,17.1] 3.8 [2.1,6.9] 14.9 [11.2,19.6]
3.6 [2.0,6.7] 2.0 [0.7,5.8] 17.4 [11.5,25.5]
3.3 [1.5,7.1] 0.9 [0.1,5.6] 18.5 [9.7,32.5]
15.2 [9.5,23.4] 17.3 [14.4,20.5] 19.2 [16.1,22.9]
6.3 [3.9,10.2] 24.4 [16.5,34.6] 19.7 [15.7,24.3]
9.3 [5.6,15.3] 17.9 [11.0,27.6] 20.8 [15.6,27.2]
12.9 [5.8,26.4] 17.1 [11.5,24.7] 17.7 [13.0,23.7]
11.1 [5.4,21.4] 18.1 [10.9,28.7] 22.3 [17.4,28.1]
13.5 [8.2,21.4] 22.3 [14.8,32.1] 18.1 [13.4,24.0]
17.2 [7.3,35.4] 20.1 [14.4,27.4] 18.2 [13.1,24.7]
13.3 [8.6,19.9] 19.4 [16.1,23.3] 19.4 [16.8,22.2]
p was converted to an asset ladder, a Bayesian post-estimation method usedLowest (Quintile 1) is the quintile with the poorest households and Highest
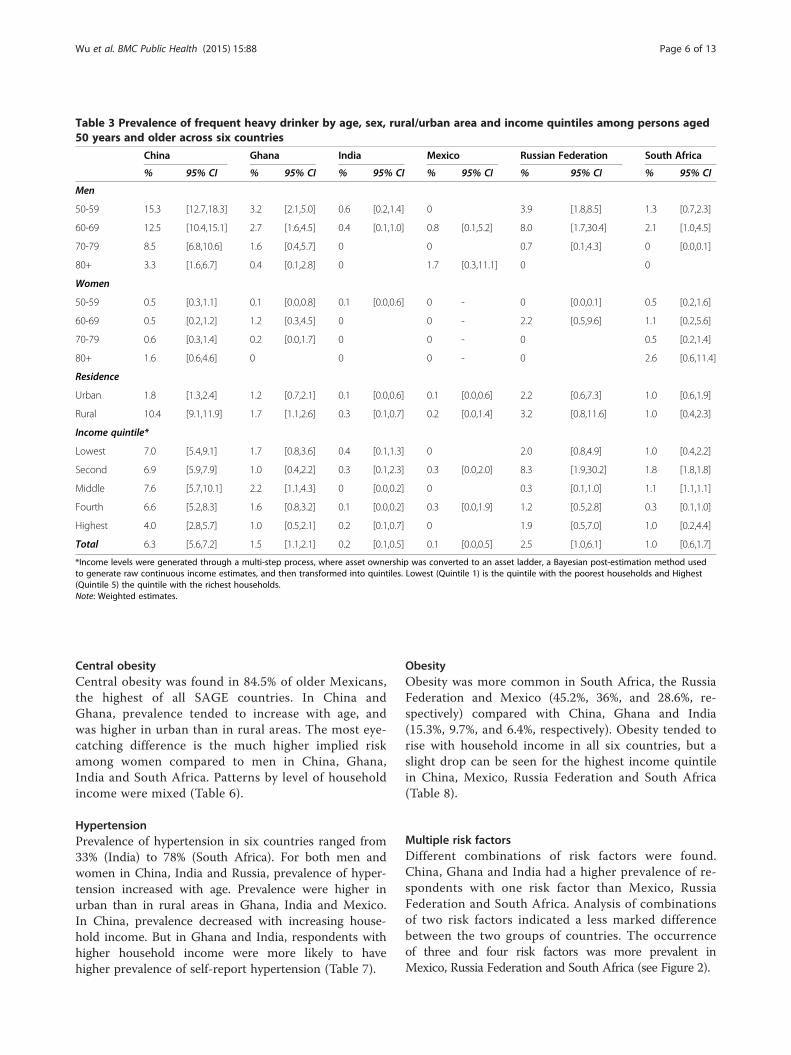
Table 3 Prevalence of frequent heavy drinker by age, sex, rural/urban area and income quintiles among persons aged50 years and older across six countries
China Ghana India Mexico Russian Federation South Africa
% 95% CI % 95% CI % 95% CI % 95% CI % 95% CI % 95% CI
Men
50-59 15.3 [12.7,18.3] 3.2 [2.1,5.0] 0.6 [0.2,1.4] 0 3.9 [1.8,8.5] 1.3 [0.7,2.3]
60-69 12.5 [10.4,15.1] 2.7 [1.6,4.5] 0.4 [0.1,1.0] 0.8 [0.1,5.2] 8.0 [1.7,30.4] 2.1 [1.0,4.5]
70-79 8.5 [6.8,10.6] 1.6 [0.4,5.7] 0 0 0.7 [0.1,4.3] 0 [0.0,0.1]
80+ 3.3 [1.6,6.7] 0.4 [0.1,2.8] 0 1.7 [0.3,11.1] 0 0
Women
50-59 0.5 [0.3,1.1] 0.1 [0.0,0.8] 0.1 [0.0,0.6] 0 - 0 [0.0,0.1] 0.5 [0.2,1.6]
60-69 0.5 [0.2,1.2] 1.2 [0.3,4.5] 0 0 - 2.2 [0.5,9.6] 1.1 [0.2,5.6]
70-79 0.6 [0.3,1.4] 0.2 [0.0,1.7] 0 0 - 0 0.5 [0.2,1.4]
80+ 1.6 [0.6,4.6] 0 0 0 - 0 2.6 [0.6,11.4]
Residence
Urban 1.8 [1.3,2.4] 1.2 [0.7,2.1] 0.1 [0.0,0.6] 0.1 [0.0,0.6] 2.2 [0.6,7.3] 1.0 [0.6,1.9]
Rural 10.4 [9.1,11.9] 1.7 [1.1,2.6] 0.3 [0.1,0.7] 0.2 [0.0,1.4] 3.2 [0.8,11.6] 1.0 [0.4,2.3]
Income quintile*
Lowest 7.0 [5.4,9.1] 1.7 [0.8,3.6] 0.4 [0.1,1.3] 0 2.0 [0.8,4.9] 1.0 [0.4,2.2]
Second 6.9 [5.9,7.9] 1.0 [0.4,2.2] 0.3 [0.1,2.3] 0.3 [0.0,2.0] 8.3 [1.9,30.2] 1.8 [1.8,1.8]
Middle 7.6 [5.7,10.1] 2.2 [1.1,4.3] 0 [0.0,0.2] 0 0.3 [0.1,1.0] 1.1 [1.1,1.1]
Fourth 6.6 [5.2,8.3] 1.6 [0.8,3.2] 0.1 [0.0,0.2] 0.3 [0.0,1.9] 1.2 [0.5,2.8] 0.3 [0.1,1.0]
Highest 4.0 [2.8,5.7] 1.0 [0.5,2.1] 0.2 [0.1,0.7] 0 1.9 [0.5,7.0] 1.0 [0.2,4.4]
Total 6.3 [5.6,7.2] 1.5 [1.1,2.1] 0.2 [0.1,0.5] 0.1 [0.0,0.5] 2.5 [1.0,6.1] 1.0 [0.6,1.7]
*Income levels were generated through a multi-step process, where asset ownership was converted to an asset ladder, a Bayesian post-estimation method usedto generate raw continuous income estimates, and then transformed into quintiles. Lowest (Quintile 1) is the quintile with the poorest households and Highest(Quintile 5) the quintile with the richest households.Note: Weighted estimates.
Wu et al. BMC Public Health (2015) 15:88 Page 6 of 13
Central obesityCentral obesity was found in 84.5% of older Mexicans,the highest of all SAGE countries. In China andGhana, prevalence tended to increase with age, andwas higher in urban than in rural areas. The most eye-catching difference is the much higher implied riskamong women compared to men in China, Ghana,India and South Africa. Patterns by level of householdincome were mixed (Table 6).
HypertensionPrevalence of hypertension in six countries ranged from33% (India) to 78% (South Africa). For both men andwomen in China, India and Russia, prevalence of hyper-tension increased with age. Prevalence were higher inurban than in rural areas in Ghana, India and Mexico.In China, prevalence decreased with increasing house-hold income. But in Ghana and India, respondents withhigher household income were more likely to havehigher prevalence of self-report hypertension (Table 7).
ObesityObesity was more common in South Africa, the RussiaFederation and Mexico (45.2%, 36%, and 28.6%, re-spectively) compared with China, Ghana and India(15.3%, 9.7%, and 6.4%, respectively). Obesity tended torise with household income in all six countries, but aslight drop can be seen for the highest income quintilein China, Mexico, Russia Federation and South Africa(Table 8).
Multiple risk factorsDifferent combinations of risk factors were found.China, Ghana and India had a higher prevalence of re-spondents with one risk factor than Mexico, RussiaFederation and South Africa. Analysis of combinationsof two risk factors indicated a less marked differencebetween the two groups of countries. The occurrenceof three and four risk factors was more prevalent inMexico, Russia Federation and South Africa (see Figure 2).
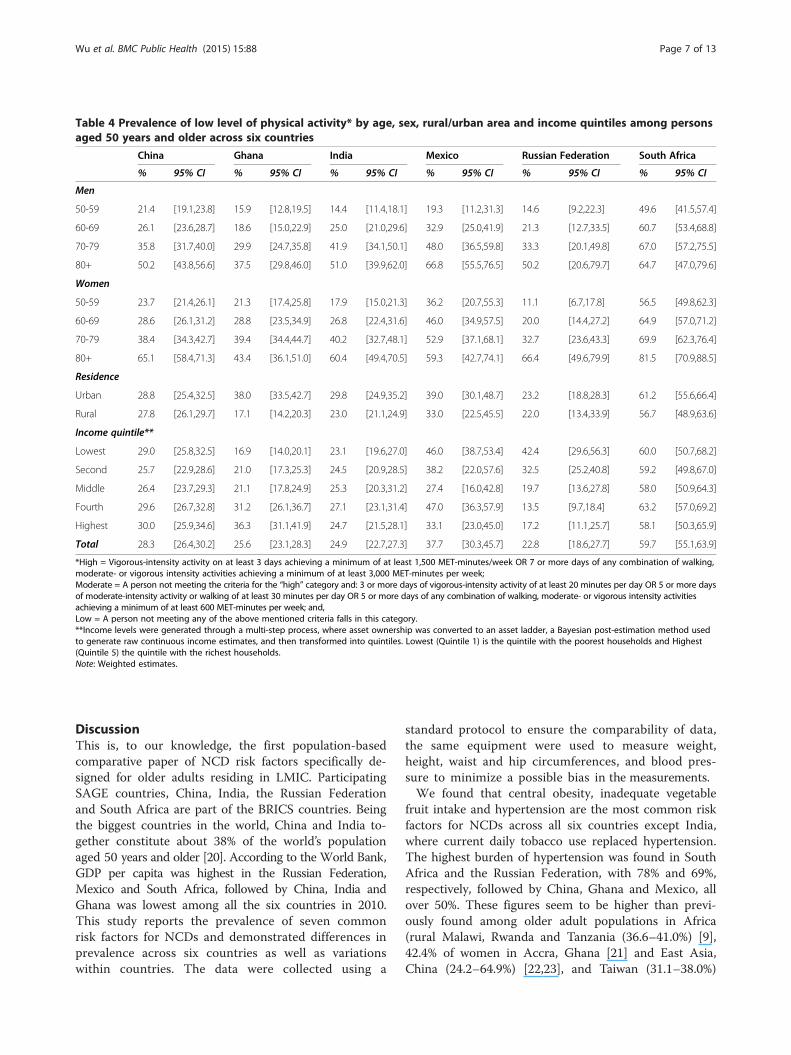
Table 4 Prevalence of low level of physical activity* by age, sex, rural/urban area and income quintiles among personsaged 50 years and older across six countries
China Ghana India Mexico Russian Federation South Africa
% 95% CI % 95% CI % 95% CI % 95% CI % 95% CI % 95% CI
Men
50-59 21.4 [19.1,23.8] 15.9 [12.8,19.5] 14.4 [11.4,18.1] 19.3 [11.2,31.3] 14.6 [9.2,22.3] 49.6 [41.5,57.4]
60-69 26.1 [23.6,28.7] 18.6 [15.0,22.9] 25.0 [21.0,29.6] 32.9 [25.0,41.9] 21.3 [12.7,33.5] 60.7 [53.4,68.8]
70-79 35.8 [31.7,40.0] 29.9 [24.7,35.8] 41.9 [34.1,50.1] 48.0 [36.5,59.8] 33.3 [20.1,49.8] 67.0 [57.2,75.5]
80+ 50.2 [43.8,56.6] 37.5 [29.8,46.0] 51.0 [39.9,62.0] 66.8 [55.5,76.5] 50.2 [20.6,79.7] 64.7 [47.0,79.6]
Women
50-59 23.7 [21.4,26.1] 21.3 [17.4,25.8] 17.9 [15.0,21.3] 36.2 [20.7,55.3] 11.1 [6.7,17.8] 56.5 [49.8,62.3]
60-69 28.6 [26.1,31.2] 28.8 [23.5,34.9] 26.8 [22.4,31.6] 46.0 [34.9,57.5] 20.0 [14.4,27.2] 64.9 [57.0,71.2]
70-79 38.4 [34.3,42.7] 39.4 [34.4,44.7] 40.2 [32.7,48.1] 52.9 [37.1,68.1] 32.7 [23.6,43.3] 69.9 [62.3,76.4]
80+ 65.1 [58.4,71.3] 43.4 [36.1,51.0] 60.4 [49.4,70.5] 59.3 [42.7,74.1] 66.4 [49.6,79.9] 81.5 [70.9,88.5]
Residence
Urban 28.8 [25.4,32.5] 38.0 [33.5,42.7] 29.8 [24.9,35.2] 39.0 [30.1,48.7] 23.2 [18.8,28.3] 61.2 [55.6,66.4]
Rural 27.8 [26.1,29.7] 17.1 [14.2,20.3] 23.0 [21.1,24.9] 33.0 [22.5,45.5] 22.0 [13.4,33.9] 56.7 [48.9,63.6]
Income quintile**
Lowest 29.0 [25.8,32.5] 16.9 [14.0,20.1] 23.1 [19.6,27.0] 46.0 [38.7,53.4] 42.4 [29.6,56.3] 60.0 [50.7,68.2]
Second 25.7 [22.9,28.6] 21.0 [17.3,25.3] 24.5 [20.9,28.5] 38.2 [22.0,57.6] 32.5 [25.2,40.8] 59.2 [49.8,67.0]
Middle 26.4 [23.7,29.3] 21.1 [17.8,24.9] 25.3 [20.3,31.2] 27.4 [16.0,42.8] 19.7 [13.6,27.8] 58.0 [50.9,64.3]
Fourth 29.6 [26.7,32.8] 31.2 [26.1,36.7] 27.1 [23.1,31.4] 47.0 [36.3,57.9] 13.5 [9.7,18.4] 63.2 [57.0,69.2]
Highest 30.0 [25.9,34.6] 36.3 [31.1,41.9] 24.7 [21.5,28.1] 33.1 [23.0,45.0] 17.2 [11.1,25.7] 58.1 [50.3,65.9]
Total 28.3 [26.4,30.2] 25.6 [23.1,28.3] 24.9 [22.7,27.3] 37.7 [30.3,45.7] 22.8 [18.6,27.7] 59.7 [55.1,63.9]
*High = Vigorous-intensity activity on at least 3 days achieving a minimum of at least 1,500 MET-minutes/week OR 7 or more days of any combination of walking,moderate- or vigorous intensity activities achieving a minimum of at least 3,000 MET-minutes per week;Moderate = A person not meeting the criteria for the “high” category and: 3 or more days of vigorous-intensity activity of at least 20 minutes per day OR 5 or more daysof moderate-intensity activity or walking of at least 30 minutes per day OR 5 or more days of any combination of walking, moderate- or vigorous intensity activitiesachieving a minimum of at least 600 MET-minutes per week; and,Low = A person not meeting any of the above mentioned criteria falls in this category.**Income levels were generated through a multi-step process, where asset ownership was converted to an asset ladder, a Bayesian post-estimation method usedto generate raw continuous income estimates, and then transformed into quintiles. Lowest (Quintile 1) is the quintile with the poorest households and Highest(Quintile 5) the quintile with the richest households.Note: Weighted estimates.
Wu et al. BMC Public Health (2015) 15:88 Page 7 of 13
DiscussionThis is, to our knowledge, the first population-basedcomparative paper of NCD risk factors specifically de-signed for older adults residing in LMIC. ParticipatingSAGE countries, China, India, the Russian Federationand South Africa are part of the BRICS countries. Beingthe biggest countries in the world, China and India to-gether constitute about 38% of the world’s populationaged 50 years and older [20]. According to the World Bank,GDP per capita was highest in the Russian Federation,Mexico and South Africa, followed by China, India andGhana was lowest among all the six countries in 2010.This study reports the prevalence of seven commonrisk factors for NCDs and demonstrated differences inprevalence across six countries as well as variationswithin countries. The data were collected using a
standard protocol to ensure the comparability of data,the same equipment were used to measure weight,height, waist and hip circumferences, and blood pres-sure to minimize a possible bias in the measurements.We found that central obesity, inadequate vegetable
fruit intake and hypertension are the most common riskfactors for NCDs across all six countries except India,where current daily tobacco use replaced hypertension.The highest burden of hypertension was found in SouthAfrica and the Russian Federation, with 78% and 69%,respectively, followed by China, Ghana and Mexico, allover 50%. These figures seem to be higher than previ-ously found among older adult populations in Africa(rural Malawi, Rwanda and Tanzania (36.6–41.0%) [9],42.4% of women in Accra, Ghana [21] and East Asia,China (24.2–64.9%) [22,23], and Taiwan (31.1–38.0%)
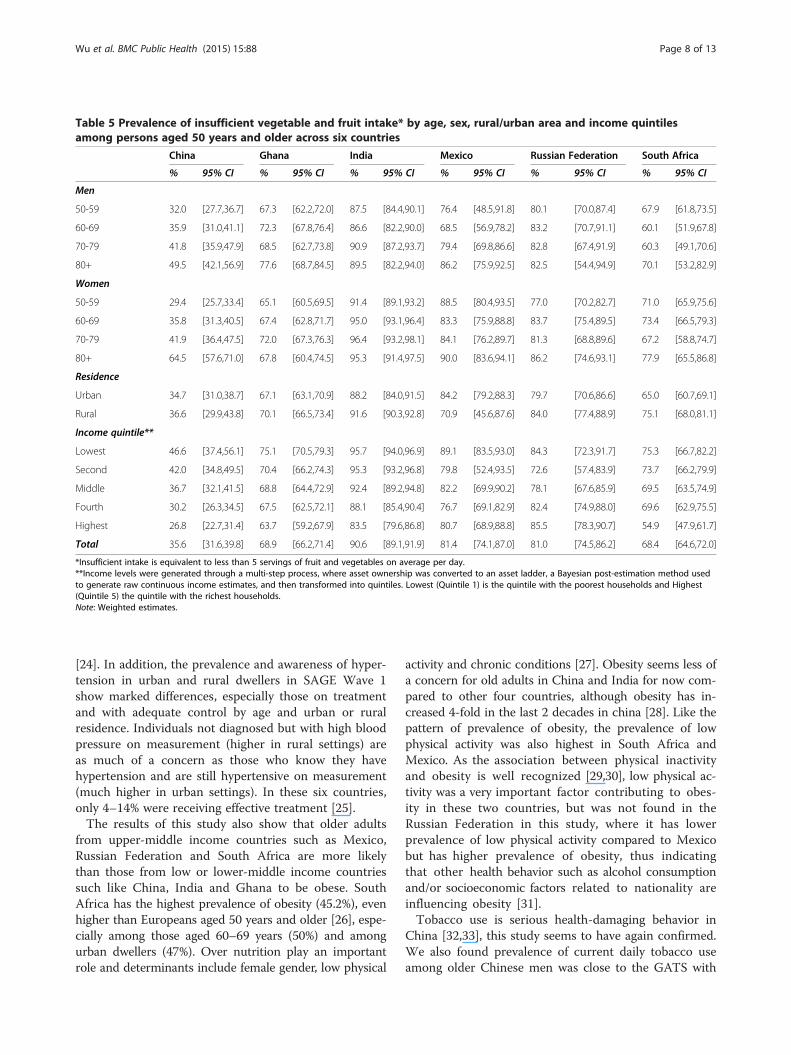
Table 5 Prevalence of insufficient vegetable and fruit intake* by age, sex, rural/urban area and income quintilesamong persons aged 50 years and older across six countries
China Ghana India Mexico Russian Federation South Africa
% 95% CI % 95% CI % 95% CI % 95% CI % 95% CI % 95% CI
Men
50-59 32.0 [27.7,36.7] 67.3 [62.2,72.0] 87.5 [84.4,90.1] 76.4 [48.5,91.8] 80.1 [70.0,87.4] 67.9 [61.8,73.5]
60-69 35.9 [31.0,41.1] 72.3 [67.8,76.4] 86.6 [82.2,90.0] 68.5 [56.9,78.2] 83.2 [70.7,91.1] 60.1 [51.9,67.8]
70-79 41.8 [35.9,47.9] 68.5 [62.7,73.8] 90.9 [87.2,93.7] 79.4 [69.8,86.6] 82.8 [67.4,91.9] 60.3 [49.1,70.6]
80+ 49.5 [42.1,56.9] 77.6 [68.7,84.5] 89.5 [82.2,94.0] 86.2 [75.9,92.5] 82.5 [54.4,94.9] 70.1 [53.2,82.9]
Women
50-59 29.4 [25.7,33.4] 65.1 [60.5,69.5] 91.4 [89.1,93.2] 88.5 [80.4,93.5] 77.0 [70.2,82.7] 71.0 [65.9,75.6]
60-69 35.8 [31.3,40.5] 67.4 [62.8,71.7] 95.0 [93.1,96.4] 83.3 [75.9,88.8] 83.7 [75.4,89.5] 73.4 [66.5,79.3]
70-79 41.9 [36.4,47.5] 72.0 [67.3,76.3] 96.4 [93.2,98.1] 84.1 [76.2,89.7] 81.3 [68.8,89.6] 67.2 [58.8,74.7]
80+ 64.5 [57.6,71.0] 67.8 [60.4,74.5] 95.3 [91.4,97.5] 90.0 [83.6,94.1] 86.2 [74.6,93.1] 77.9 [65.5,86.8]
Residence
Urban 34.7 [31.0,38.7] 67.1 [63.1,70.9] 88.2 [84.0,91.5] 84.2 [79.2,88.3] 79.7 [70.6,86.6] 65.0 [60.7,69.1]
Rural 36.6 [29.9,43.8] 70.1 [66.5,73.4] 91.6 [90.3,92.8] 70.9 [45.6,87.6] 84.0 [77.4,88.9] 75.1 [68.0,81.1]
Income quintile**
Lowest 46.6 [37.4,56.1] 75.1 [70.5,79.3] 95.7 [94.0,96.9] 89.1 [83.5,93.0] 84.3 [72.3,91.7] 75.3 [66.7,82.2]
Second 42.0 [34.8,49.5] 70.4 [66.2,74.3] 95.3 [93.2,96.8] 79.8 [52.4,93.5] 72.6 [57.4,83.9] 73.7 [66.2,79.9]
Middle 36.7 [32.1,41.5] 68.8 [64.4,72.9] 92.4 [89.2,94.8] 82.2 [69.9,90.2] 78.1 [67.6,85.9] 69.5 [63.5,74.9]
Fourth 30.2 [26.3,34.5] 67.5 [62.5,72.1] 88.1 [85.4,90.4] 76.7 [69.1,82.9] 82.4 [74.9,88.0] 69.6 [62.9,75.5]
Highest 26.8 [22.7,31.4] 63.7 [59.2,67.9] 83.5 [79.6,86.8] 80.7 [68.9,88.8] 85.5 [78.3,90.7] 54.9 [47.9,61.7]
Total 35.6 [31.6,39.8] 68.9 [66.2,71.4] 90.6 [89.1,91.9] 81.4 [74.1,87.0] 81.0 [74.5,86.2] 68.4 [64.6,72.0]
*Insufficient intake is equivalent to less than 5 servings of fruit and vegetables on average per day.**Income levels were generated through a multi-step process, where asset ownership was converted to an asset ladder, a Bayesian post-estimation method usedto generate raw continuous income estimates, and then transformed into quintiles. Lowest (Quintile 1) is the quintile with the poorest households and Highest(Quintile 5) the quintile with the richest households.Note: Weighted estimates.
Wu et al. BMC Public Health (2015) 15:88 Page 8 of 13
[24]. In addition, the prevalence and awareness of hyper-tension in urban and rural dwellers in SAGE Wave 1show marked differences, especially those on treatmentand with adequate control by age and urban or ruralresidence. Individuals not diagnosed but with high bloodpressure on measurement (higher in rural settings) areas much of a concern as those who know they havehypertension and are still hypertensive on measurement(much higher in urban settings). In these six countries,only 4–14% were receiving effective treatment [25].The results of this study also show that older adults
from upper-middle income countries such as Mexico,Russian Federation and South Africa are more likelythan those from low or lower-middle income countriessuch like China, India and Ghana to be obese. SouthAfrica has the highest prevalence of obesity (45.2%), evenhigher than Europeans aged 50 years and older [26], espe-cially among those aged 60–69 years (50%) and amongurban dwellers (47%). Over nutrition play an importantrole and determinants include female gender, low physical
activity and chronic conditions [27]. Obesity seems less ofa concern for old adults in China and India for now com-pared to other four countries, although obesity has in-creased 4-fold in the last 2 decades in china [28]. Like thepattern of prevalence of obesity, the prevalence of lowphysical activity was also highest in South Africa andMexico. As the association between physical inactivityand obesity is well recognized [29,30], low physical ac-tivity was a very important factor contributing to obes-ity in these two countries, but was not found in theRussian Federation in this study, where it has lowerprevalence of low physical activity compared to Mexicobut has higher prevalence of obesity, thus indicatingthat other health behavior such as alcohol consumptionand/or socioeconomic factors related to nationality areinfluencing obesity [31].Tobacco use is serious health-damaging behavior in
China [32,33], this study seems to have again confirmed.We also found prevalence of current daily tobacco useamong older Chinese men was close to the GATS with
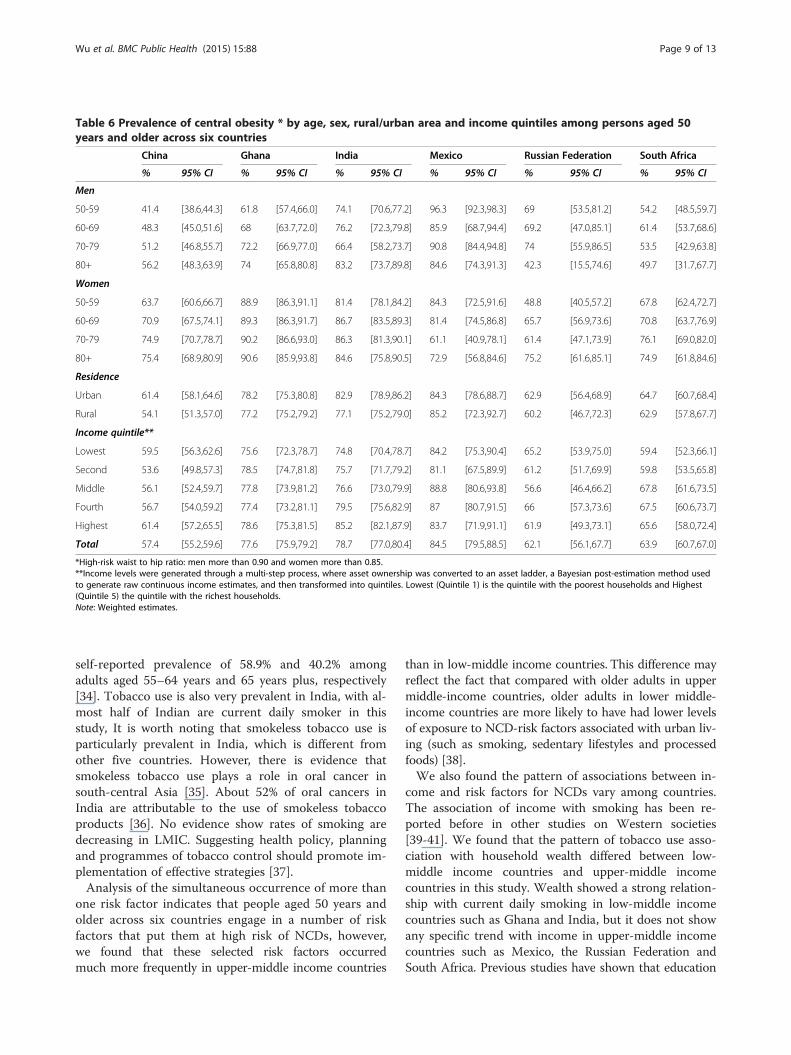
Table 6 Prevalence of central obesity * by age, sex, rural/urban area and income quintiles among persons aged 50years and older across six countries
China Ghana India Mexico Russian Federation South Africa
% 95% CI % 95% CI % 95% CI % 95% CI % 95% CI % 95% CI
Men
50-59 41.4 [38.6,44.3] 61.8 [57.4,66.0] 74.1 [70.6,77.2] 96.3 [92.3,98.3] 69 [53.5,81.2] 54.2 [48.5,59.7]
60-69 48.3 [45.0,51.6] 68 [63.7,72.0] 76.2 [72.3,79.8] 85.9 [68.7,94.4] 69.2 [47.0,85.1] 61.4 [53.7,68.6]
70-79 51.2 [46.8,55.7] 72.2 [66.9,77.0] 66.4 [58.2,73.7] 90.8 [84.4,94.8] 74 [55.9,86.5] 53.5 [42.9,63.8]
80+ 56.2 [48.3,63.9] 74 [65.8,80.8] 83.2 [73.7,89.8] 84.6 [74.3,91.3] 42.3 [15.5,74.6] 49.7 [31.7,67.7]
Women
50-59 63.7 [60.6,66.7] 88.9 [86.3,91.1] 81.4 [78.1,84.2] 84.3 [72.5,91.6] 48.8 [40.5,57.2] 67.8 [62.4,72.7]
60-69 70.9 [67.5,74.1] 89.3 [86.3,91.7] 86.7 [83.5,89.3] 81.4 [74.5,86.8] 65.7 [56.9,73.6] 70.8 [63.7,76.9]
70-79 74.9 [70.7,78.7] 90.2 [86.6,93.0] 86.3 [81.3,90.1] 61.1 [40.9,78.1] 61.4 [47.1,73.9] 76.1 [69.0,82.0]
80+ 75.4 [68.9,80.9] 90.6 [85.9,93.8] 84.6 [75.8,90.5] 72.9 [56.8,84.6] 75.2 [61.6,85.1] 74.9 [61.8,84.6]
Residence
Urban 61.4 [58.1,64.6] 78.2 [75.3,80.8] 82.9 [78.9,86.2] 84.3 [78.6,88.7] 62.9 [56.4,68.9] 64.7 [60.7,68.4]
Rural 54.1 [51.3,57.0] 77.2 [75.2,79.2] 77.1 [75.2,79.0] 85.2 [72.3,92.7] 60.2 [46.7,72.3] 62.9 [57.8,67.7]
Income quintile**
Lowest 59.5 [56.3,62.6] 75.6 [72.3,78.7] 74.8 [70.4,78.7] 84.2 [75.3,90.4] 65.2 [53.9,75.0] 59.4 [52.3,66.1]
Second 53.6 [49.8,57.3] 78.5 [74.7,81.8] 75.7 [71.7,79.2] 81.1 [67.5,89.9] 61.2 [51.7,69.9] 59.8 [53.5,65.8]
Middle 56.1 [52.4,59.7] 77.8 [73.9,81.2] 76.6 [73.0,79.9] 88.8 [80.6,93.8] 56.6 [46.4,66.2] 67.8 [61.6,73.5]
Fourth 56.7 [54.0,59.2] 77.4 [73.2,81.1] 79.5 [75.6,82.9] 87 [80.7,91.5] 66 [57.3,73.6] 67.5 [60.6,73.7]
Highest 61.4 [57.2,65.5] 78.6 [75.3,81.5] 85.2 [82.1,87.9] 83.7 [71.9,91.1] 61.9 [49.3,73.1] 65.6 [58.0,72.4]
Total 57.4 [55.2,59.6] 77.6 [75.9,79.2] 78.7 [77.0,80.4] 84.5 [79.5,88.5] 62.1 [56.1,67.7] 63.9 [60.7,67.0]
*High-risk waist to hip ratio: men more than 0.90 and women more than 0.85.**Income levels were generated through a multi-step process, where asset ownership was converted to an asset ladder, a Bayesian post-estimation method usedto generate raw continuous income estimates, and then transformed into quintiles. Lowest (Quintile 1) is the quintile with the poorest households and Highest(Quintile 5) the quintile with the richest households.Note: Weighted estimates.
Wu et al. BMC Public Health (2015) 15:88 Page 9 of 13
self-reported prevalence of 58.9% and 40.2% amongadults aged 55–64 years and 65 years plus, respectively[34]. Tobacco use is also very prevalent in India, with al-most half of Indian are current daily smoker in thisstudy, It is worth noting that smokeless tobacco use isparticularly prevalent in India, which is different fromother five countries. However, there is evidence thatsmokeless tobacco use plays a role in oral cancer insouth-central Asia [35]. About 52% of oral cancers inIndia are attributable to the use of smokeless tobaccoproducts [36]. No evidence show rates of smoking aredecreasing in LMIC. Suggesting health policy, planningand programmes of tobacco control should promote im-plementation of effective strategies [37].Analysis of the simultaneous occurrence of more than
one risk factor indicates that people aged 50 years andolder across six countries engage in a number of riskfactors that put them at high risk of NCDs, however,we found that these selected risk factors occurredmuch more frequently in upper-middle income countries
than in low-middle income countries. This difference mayreflect the fact that compared with older adults in uppermiddle-income countries, older adults in lower middle-income countries are more likely to have had lower levelsof exposure to NCD-risk factors associated with urban liv-ing (such as smoking, sedentary lifestyles and processedfoods) [38].We also found the pattern of associations between in-
come and risk factors for NCDs vary among countries.The association of income with smoking has been re-ported before in other studies on Western societies[39-41]. We found that the pattern of tobacco use asso-ciation with household wealth differed between low-middle income countries and upper-middle incomecountries in this study. Wealth showed a strong relation-ship with current daily smoking in low-middle incomecountries such as Ghana and India, but it does not showany specific trend with income in upper-middle incomecountries such as Mexico, the Russian Federation andSouth Africa. Previous studies have shown that education
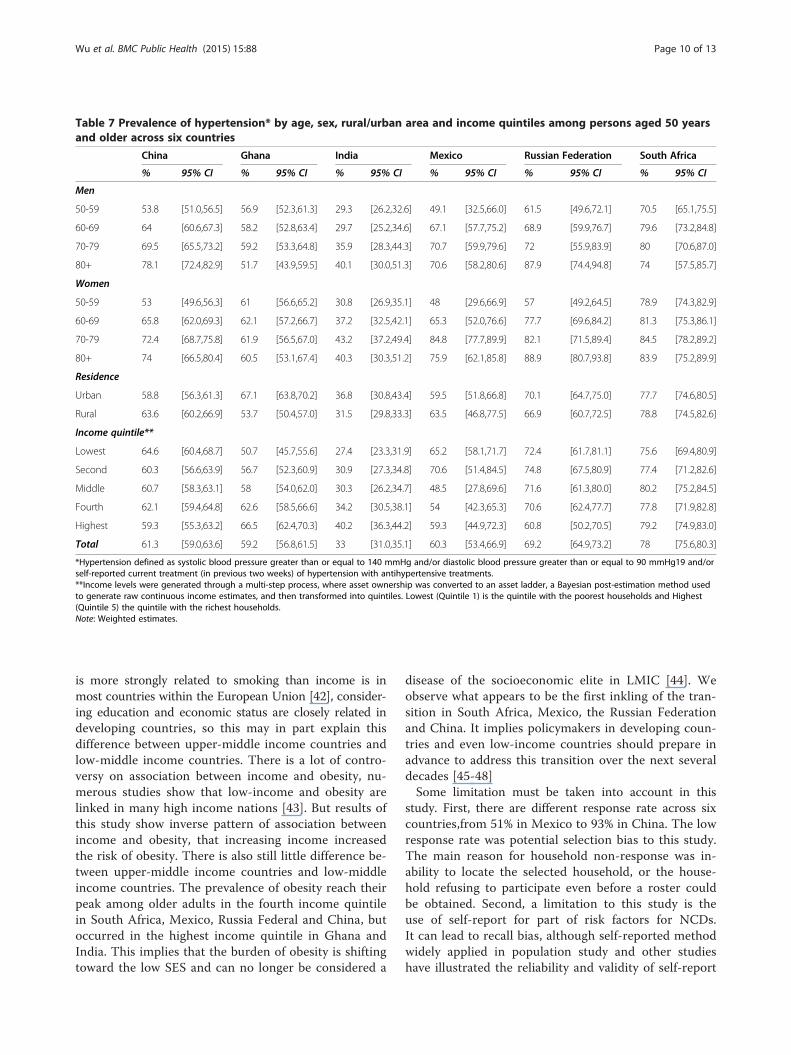
Table 7 Prevalence of hypertension* by age, sex, rural/urban area and income quintiles among persons aged 50 yearsand older across six countries
China Ghana India Mexico Russian Federation South Africa
% 95% CI % 95% CI % 95% CI % 95% CI % 95% CI % 95% CI
Men
50-59 53.8 [51.0,56.5] 56.9 [52.3,61.3] 29.3 [26.2,32.6] 49.1 [32.5,66.0] 61.5 [49.6,72.1] 70.5 [65.1,75.5]
60-69 64 [60.6,67.3] 58.2 [52.8,63.4] 29.7 [25.2,34.6] 67.1 [57.7,75.2] 68.9 [59.9,76.7] 79.6 [73.2,84.8]
70-79 69.5 [65.5,73.2] 59.2 [53.3,64.8] 35.9 [28.3,44.3] 70.7 [59.9,79.6] 72 [55.9,83.9] 80 [70.6,87.0]
80+ 78.1 [72.4,82.9] 51.7 [43.9,59.5] 40.1 [30.0,51.3] 70.6 [58.2,80.6] 87.9 [74.4,94.8] 74 [57.5,85.7]
Women
50-59 53 [49.6,56.3] 61 [56.6,65.2] 30.8 [26.9,35.1] 48 [29.6,66.9] 57 [49.2,64.5] 78.9 [74.3,82.9]
60-69 65.8 [62.0,69.3] 62.1 [57.2,66.7] 37.2 [32.5,42.1] 65.3 [52.0,76.6] 77.7 [69.6,84.2] 81.3 [75.3,86.1]
70-79 72.4 [68.7,75.8] 61.9 [56.5,67.0] 43.2 [37.2,49.4] 84.8 [77.7,89.9] 82.1 [71.5,89.4] 84.5 [78.2,89.2]
80+ 74 [66.5,80.4] 60.5 [53.1,67.4] 40.3 [30.3,51.2] 75.9 [62.1,85.8] 88.9 [80.7,93.8] 83.9 [75.2,89.9]
Residence
Urban 58.8 [56.3,61.3] 67.1 [63.8,70.2] 36.8 [30.8,43.4] 59.5 [51.8,66.8] 70.1 [64.7,75.0] 77.7 [74.6,80.5]
Rural 63.6 [60.2,66.9] 53.7 [50.4,57.0] 31.5 [29.8,33.3] 63.5 [46.8,77.5] 66.9 [60.7,72.5] 78.8 [74.5,82.6]
Income quintile**
Lowest 64.6 [60.4,68.7] 50.7 [45.7,55.6] 27.4 [23.3,31.9] 65.2 [58.1,71.7] 72.4 [61.7,81.1] 75.6 [69.4,80.9]
Second 60.3 [56.6,63.9] 56.7 [52.3,60.9] 30.9 [27.3,34.8] 70.6 [51.4,84.5] 74.8 [67.5,80.9] 77.4 [71.2,82.6]
Middle 60.7 [58.3,63.1] 58 [54.0,62.0] 30.3 [26.2,34.7] 48.5 [27.8,69.6] 71.6 [61.3,80.0] 80.2 [75.2,84.5]
Fourth 62.1 [59.4,64.8] 62.6 [58.5,66.6] 34.2 [30.5,38.1] 54 [42.3,65.3] 70.6 [62.4,77.7] 77.8 [71.9,82.8]
Highest 59.3 [55.3,63.2] 66.5 [62.4,70.3] 40.2 [36.3,44.2] 59.3 [44.9,72.3] 60.8 [50.2,70.5] 79.2 [74.9,83.0]
Total 61.3 [59.0,63.6] 59.2 [56.8,61.5] 33 [31.0,35.1] 60.3 [53.4,66.9] 69.2 [64.9,73.2] 78 [75.6,80.3]
*Hypertension defined as systolic blood pressure greater than or equal to 140 mmHg and/or diastolic blood pressure greater than or equal to 90 mmHg19 and/orself-reported current treatment (in previous two weeks) of hypertension with antihypertensive treatments.**Income levels were generated through a multi-step process, where asset ownership was converted to an asset ladder, a Bayesian post-estimation method usedto generate raw continuous income estimates, and then transformed into quintiles. Lowest (Quintile 1) is the quintile with the poorest households and Highest(Quintile 5) the quintile with the richest households.Note: Weighted estimates.
Wu et al. BMC Public Health (2015) 15:88 Page 10 of 13
is more strongly related to smoking than income is inmost countries within the European Union [42], consider-ing education and economic status are closely related indeveloping countries, so this may in part explain thisdifference between upper-middle income countries andlow-middle income countries. There is a lot of contro-versy on association between income and obesity, nu-merous studies show that low-income and obesity arelinked in many high income nations [43]. But results ofthis study show inverse pattern of association betweenincome and obesity, that increasing income increasedthe risk of obesity. There is also still little difference be-tween upper-middle income countries and low-middleincome countries. The prevalence of obesity reach theirpeak among older adults in the fourth income quintilein South Africa, Mexico, Russia Federal and China, butoccurred in the highest income quintile in Ghana andIndia. This implies that the burden of obesity is shiftingtoward the low SES and can no longer be considered a
disease of the socioeconomic elite in LMIC [44]. Weobserve what appears to be the first inkling of the tran-sition in South Africa, Mexico, the Russian Federationand China. It implies policymakers in developing coun-tries and even low-income countries should prepare inadvance to address this transition over the next severaldecades [45-48]Some limitation must be taken into account in this
study. First, there are different response rate across sixcountries,from 51% in Mexico to 93% in China. The lowresponse rate was potential selection bias to this study.The main reason for household non-response was in-ability to locate the selected household, or the house-hold refusing to participate even before a roster couldbe obtained. Second, a limitation to this study is theuse of self-report for part of risk factors for NCDs.It can lead to recall bias, although self-reported methodwidely applied in population study and other studieshave illustrated the reliability and validity of self-report
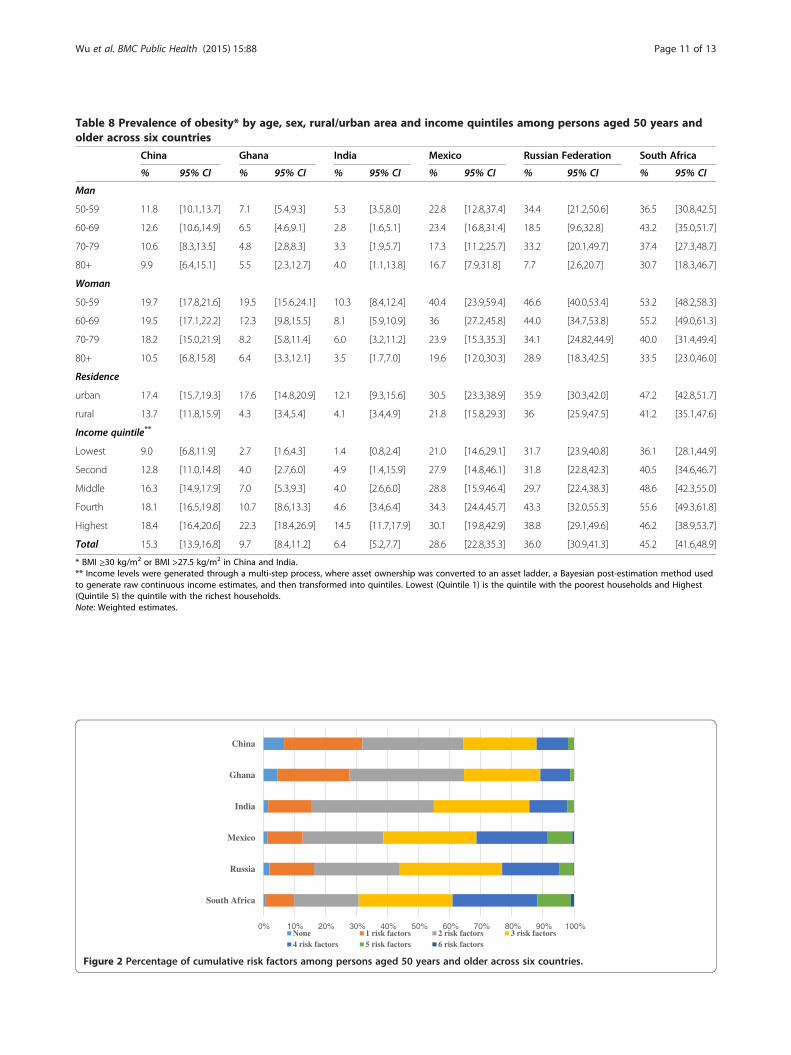
Table 8 Prevalence of obesity* by age, sex, rural/urban area and income quintiles among persons aged 50 years andolder across six countries
China Ghana India Mexico Russian Federation South Africa
% 95% CI % 95% CI % 95% CI % 95% CI % 95% CI % 95% CI
Man
50-59 11.8 [10.1,13.7] 7.1 [5.4,9.3] 5.3 [3.5,8.0] 22.8 [12.8,37.4] 34.4 [21.2,50.6] 36.5 [30.8,42.5]
60-69 12.6 [10.6,14.9] 6.5 [4.6,9.1] 2.8 [1.6,5.1] 23.4 [16.8,31.4] 18.5 [9.6,32.8] 43.2 [35.0,51.7]
70-79 10.6 [8.3,13.5] 4.8 [2.8,8.3] 3.3 [1.9,5.7] 17.3 [11.2,25.7] 33.2 [20.1,49.7] 37.4 [27.3,48.7]
80+ 9.9 [6.4,15.1] 5.5 [2.3,12.7] 4.0 [1.1,13.8] 16.7 [7.9,31.8] 7.7 [2.6,20.7] 30.7 [18.3,46.7]
Woman
50-59 19.7 [17.8,21.6] 19.5 [15.6,24.1] 10.3 [8.4,12.4] 40.4 [23.9,59.4] 46.6 [40.0,53.4] 53.2 [48.2,58.3]
60-69 19.5 [17.1,22.2] 12.3 [9.8,15.5] 8.1 [5.9,10.9] 36 [27.2,45.8] 44.0 [34.7,53.8] 55.2 [49.0,61.3]
70-79 18.2 [15.0,21.9] 8.2 [5.8,11.4] 6.0 [3.2,11.2] 23.9 [15.3,35.3] 34.1 [24.82,44.9] 40.0 [31.4,49.4]
80+ 10.5 [6.8,15.8] 6.4 [3.3,12.1] 3.5 [1.7,7.0] 19.6 [12.0,30.3] 28.9 [18.3,42.5] 33.5 [23.0,46.0]
Residence
urban 17.4 [15.7,19.3] 17.6 [14.8,20.9] 12.1 [9.3,15.6] 30.5 [23.3,38.9] 35.9 [30.3,42.0] 47.2 [42.8,51.7]
rural 13.7 [11.8,15.9] 4.3 [3.4,5.4] 4.1 [3.4,4.9] 21.8 [15.8,29.3] 36 [25.9,47.5] 41.2 [35.1,47.6]
Income quintile**
Lowest 9.0 [6.8,11.9] 2.7 [1.6,4.3] 1.4 [0.8,2.4] 21.0 [14.6,29.1] 31.7 [23.9,40.8] 36.1 [28.1,44.9]
Second 12.8 [11.0,14.8] 4.0 [2.7,6.0] 4.9 [1.4,15.9] 27.9 [14.8,46.1] 31.8 [22.8,42.3] 40.5 [34.6,46.7]
Middle 16.3 [14.9,17.9] 7.0 [5.3,9.3] 4.0 [2.6,6.0] 28.8 [15.9,46.4] 29.7 [22.4,38.3] 48.6 [42.3,55.0]
Fourth 18.1 [16.5,19.8] 10.7 [8.6,13.3] 4.6 [3.4,6.4] 34.3 [24.4,45.7] 43.3 [32.0,55.3] 55.6 [49.3,61.8]
Highest 18.4 [16.4,20.6] 22.3 [18.4,26.9] 14.5 [11.7,17.9] 30.1 [19.8,42.9] 38.8 [29.1,49.6] 46.2 [38.9,53.7]
Total 15.3 [13.9,16.8] 9.7 [8.4,11.2] 6.4 [5.2,7.7] 28.6 [22.8,35.3] 36.0 [30.9,41.3] 45.2 [41.6,48.9]
* BMI ≥30 kg/m2 or BMI >27.5 kg/m2 in China and India.** Income levels were generated through a multi-step process, where asset ownership was converted to an asset ladder, a Bayesian post-estimation method usedto generate raw continuous income estimates, and then transformed into quintiles. Lowest (Quintile 1) is the quintile with the poorest households and Highest(Quintile 5) the quintile with the richest households.Note: Weighted estimates.
0% 10% 20% 30% 40% 50% 60% 70% 80% 90% 100%
South Africa
Russia
Mexico
India
Ghana
China
None 1 risk factors 2 risk factors 3 risk factors4 risk factors 5 risk factors 6 risk factors
Figure 2 Percentage of cumulative risk factors among persons aged 50 years and older across six countries.
Wu et al. BMC Public Health (2015) 15:88 Page 11 of 13
Wu et al. BMC Public Health (2015) 15:88 Page 12 of 13
for behaviors such as cigarette smoking, alcohol con-sumption, and physical activity [49,50]. Finally, SAGEwave 1 is a cross-sectional study, which determines thatwe could not examined the changes in prevalence ofthese risk factors for NCDs over time, fortunately,SAGE Second and third waves of data collection will be2013 and 2015. It will provide an opportunity to trackthese changes.
ConclusionsIn conclusion, this study estimated the prevalence ratesof common risk factors for NCDs and showed the pat-tern of these risk factors in six main LMIC. The baselineinformation on the magnitude of the problem of riskfactors provided by this study can help countries andhealth policymakers to set up interventions addressingthe global non communicable disease epidemic. Under-standing the relationship of risk factors pattern and bur-den of NCDs in LMIC presents an important challengefor further research.
AbbreviationsNCDs: Chronic non-communicable diseases; SES: socioeconomic status;SAGE: Study on global AGEing and adult health; LMIC: low- and middle-income countries; GPAQ: The Global Physical Activity Questionnaire;WHR: waist-hip ratio.
Competing interestsThe authors declare that they have no competing interests.
Authors’ contributionsFW, SC, PK, YFG, YZ and YJ designed, implemented the conduct of thisstudy. FW and YFG conceived of the analysis, and drafted the manuscript.YFG, YZ and NN(5th) contributed to the statistical analyses. RB, AY, NM, AR,BE, TM, KP, NP, JJS, ET and NN (18th) contributed to the editing of initialdraft. All authors read and approved the final manuscript.
AcknowledgementsThe authors would like to thank more than 2000 field interviewers from sixSAGE countries for their support and hard work, we also thank Rong Sunand Shuangyuan Sun, both of whom are from Shanghai CDC, for help withliterature search and retrieval.FundingThis study was funded by the US National Institute on Aging throughInteragency Agreements (OGHA 04034785; YA1323-08-CN-0020; Y1-AG-1005-01) and through a research grant (R01-AG034479); Field work of china waspartially funded by Science and Technology Commission of ShanghaiMunicipality (Grant No. 10XD1403600) and the Health Fields SpecificResearch Grant(Grant No.201202012).
Author details1Shanghai Municipal Centre for Disease Control (Shanghai CDC), 1380Zhongshan Rd (W), Shanghai 200336, P.R. China. 2World Health Organization,HIS/HSI/MCS, Geneva, Switzerland. 3National Center for Chronic andNoncommunicable Disease Control and Prevention (NCNCD), Chinese Centerfor Disease Control and Prevention (China CDC), Beijing, P.R. China.4Department of Community Health, University of Ghana Medical School,Accra, Ghana. 5National Research Council, Institute of Neuroscience, Padova,Italy. 6National Institute of Public Health, Mexico City, Mexico. 7RussianAcademy of Medical Sciences, Moscow, Russian Federation. 8University ofLimpopo, Turfloop, South Africa. 9Mahidol University, Salaya, Thailand.10Human Sciences Research Council, Port Elizabeth/Pretoria, South Africa.11Office of the Deputy Vice Chancellor: Research and Engagement, NelsonMandela Metropolitan University, Port Elizabeth, South Africa. 12Departmentof Anthropology, University of Oregon, Eugene, Oregon, USA. 13Atlanta, GA,
USA. 14Epidemiology and Global Health, Umeå University, Umeå, Sweden.15University of Newcastle Research Centre for Gender, Health and Ageing,Newcastle, Australia.
Received: 8 August 2014 Accepted: 13 January 2015
References1. Miranda JJ, Kinra S, Casas JP, Davey Smith G, Ebrahim S. Non-communicable
diseases in low- and middle-income countries: context, determinants andhealth policy. Trop Med Int Health. 2008;13(10):1225–34.
2. World Health Organization. Global Status Report on NoncommunicableDiseases 2010. Geneva, Switzerland: World Health Organization; 2011.
3. Bauman AE. Updating the evidence that physical activity is good forhealth: an epidemiological review 2000–2003. J Sci Med Sport.2004;7(1 Suppl):6–19.
4. Abbondanno U, Aerts G, Alvarez-Velarde F, Alvarez-Pol H, Andriamonje S,Andrzejewski J, et al. Neutron capture cross section measurement of 151Smat the CERN neutron time of flight facility (n_TOF). Phys Rev Lett.2004;93(16):161103.
5. World Health Organization: Global health risks: mortality and burden ofdisease attributable to selected major risks. In. Geneva: World HealthOrganization; 2009.
6. Dumith SC, Hallal PC, Reis RS, Kohl 3rd HW. Worldwide prevalence ofphysical inactivity and its association with human development index in 76countries. Prev Med. 2011;53(1–2):24–8.
7. Hallal PC, Andersen LB, Bull FC, Guthold R, Haskell W, Ekelund U, et al.Global physical activity levels: surveillance progress, pitfalls, and prospects.Lancet. 2012;380(9838):247–57.
8. Shankar A, McMunn A, Steptoe A. Health-related behaviors in older adultsrelationships with socioeconomic status. Am J Prev Med. 2010;38(1):39–46.
9. Negin J, Cumming R, de Ramirez SS, Abimbola S, Sachs SE. Risk factors fornon-communicable diseases among older adults in rural Africa. Trop MedInt Health. 2011;16(5):640–6.
10. Lim SS, Vos T, Flaxman AD, Danaei G, Shibuya K, Adair-Rohani H, et al. Acomparative risk assessment of burden of disease and injury attributable to67 risk factors and risk factor clusters in 21 regions, 1990–2010: a systematicanalysis for the Global Burden of Disease Study 2010. Lancet.2012;380(9859):2224–60.
11. Kowal P, Chatterji S, Naidoo N, Biritwum R, Fan W, Lopez Ridaura R, et al.Data resource profile: the World Health Organization Study on globalAGEing and adult health (SAGE). Int J Epidemiol. 2012;41(6):1639–49.
12. Naidoo N. WHO Study on global AGEing and adult health (SAGE) Waves 0and 1 Sampling information for China, Ghana, India, Mexico, Russia andSouth Africa. In: SAGE Working Paper No 5. 2012.
13. Bull FC, Maslin TS, Armstrong T. Global physical activity questionnaire(GPAQ): nine country reliability and validity study. J Phys Act Health.2009;6(6):790–804.
14. World Health Organization. Guidelines for controlling and monitoring thetobacco epidemic. Geneva: World Health Organization; 1998. p. 76–101.
15. World Health Organization. Diet, nutrition and the prevention of chronicdiseases. Report of a joint WHO/FAO expert consultation. In: WHO TechnicalReport Series No 916. Geneva: World Health Organization; 2003.
16. World Health Organization. Waist circumference and waist-hip ratio: reportof a WHO expert consultation. Geneva, 8-11 December 2008. Geneva,Switzerland: WHO; 2011.
17. Chobanian AV, Bakris GL, Black HR, Cushman WC, Green LA, Izzo Jr JL, et al.The seventh report of the joint national committee on prevention,detection, evaluation, and treatment of high blood pressure: the JNC 7report. Jama. 2003;289(19):2560–71.
18. World Health Organization. Obesity: preventing and managing the globalepidemic. In: WHO Technical Report Series 894. Geneva: World HealthOrganization; 2000.
19. WHO. Appropriate body-mass index for Asian populations and its implicationsfor policy and intervention strategies. Lancet. 2004;363(9403):157–63.
20. UNPD. World population prospects, the 2010 revision. In: United NationsPopulation Division(UNPD). 2011.
21. Duda RB, Anarfi JK, Adanu RM, Seffah J, Darko R, Hill AG. The health of the“older women” in Accra, Ghana: results of the Women’s Health Study ofAccra. J Cross Cult Gerontol. 2011;26(3):299–314.
Wu et al. BMC Public Health (2015) 15:88 Page 13 of 13
22. Pang W, Li Z, Sun Z, Zheng L, Zhang X, Xu C, et al. Prevalence ofhypertension and associated factors among older rural adults: results fromLiaoning Province, China. Med Princ Pract. 2010;19(1):22–7.
23. Ruixing Y, Jiaqiang D, Dezhai Y, Weixiong L, Shangling P, Jinzhen W, et al.Effects of demographic characteristics, health-related behaviors and lifestylefactors on the prevalence of hypertension for the middle-aged and elderlyin the Guangxi Hei Yi Zhuang and Han populations. Kidney Blood Press Res.2006;29(5):312–20.
24. Tsai AC, Liou JC, Chang MC. Interview to study the determinants ofhypertension in older adults in Taiwan: a population based cross-sectionalsurvey. Asia Pac J Clin Nutr. 2007;16(2):338–45.
25. Kowal P, Arokiasamy P, Lopez Ridaura R, Yong J, Minicuci N, Chatterji S.Hypertension in developing countries. Lancet. 2012;380(9852):1471.
26. Andreyeva T, Michaud PC, van Soest A. Obesity and health in Europeansaged 50 years and older. Public Health. 2007;121(7):497–509.
27. Peltzer K, Phaswana-Mafuya, N, Ramlagan, S. Prevalence of obesity andassociated factors in South Africans 50 years and older. Afr J Phys HealthEduc Recreat Dan. Dec2011 Supplement, p772.
28. Asia Pacific Cohort Studies C. The burden of overweight and obesity in theAsia-Pacific region. Obes Rev. 2007;8(3):191–6.
29. DiPietro L. Physical activity in the prevention of obesity: current evidenceand research issues. Med Sci Sports Exerc. 1999;31(11 Suppl):S542–6.
30. Fogelholm M, Kukkonen-Harjula K. Does physical activity prevent weightgain–a systematic review. Obes Rev. 2000;1(2):95–111.
31. Gatineau M, Mathrani S. Obesity and alcohol: an overview. Oxford: NationalObesity Observatory; 2012.
32. Qian J, Cai M, Gao J, Tang S, Xu L, Critchley JA. Trends in smoking andquitting in China from 1993 to 2003: National Health Service Survey data.Bull World Health Organ. 2010;88(10):769–76.
33. Rani M, Bonu S, Jha P, Nguyen SN, Jamjoum L. Tobacco use in India:prevalence and predictors of smoking and chewing in a national crosssectional household survey. Tob Control. 2003;12(4):e4.
34. Giovino GA, Mirza SA, Samet JM, Gupta PC, Jarvis MJ, Bhala N, et al. Tobaccouse in 3 billion individuals from 16 countries: an analysis of nationallyrepresentative cross-sectional household surveys. Lancet.2012;380(9842):668–79.
35. Jemal A, Bray F, Center MM, Ferlay J, Ward E, Forman D. Global cancerstatistics. CA Cancer J Clin. 2011;61(2):69–90.
36. Boffetta P, Hecht S, Gray N, Gupta P, Straif K. Smokeless tobacco and cancer.Lancet Oncol. 2008;9(7):667–75.
37. World Health Organization. WHO Report on the global tobacco epidemic,2011. Warning about the dangers of tobacco. Geneva: World HealthOrganization; 2011.
38. Population Reference Bureau: Noncommunicable Diseases Among OlderAdults in Low and Middle-Income Countries. Today’s Research on Ageing.Population Reference Bureau; 2012;21.
39. Pomerleau J, Pederson LL, Ostbye T, Speechley M, Speechley KN. Healthbehaviours and socio-economic status in Ontario, Canada. Eur J Epidemiol.1997;13(6):613–22.
40. Lantz PM, House JS, Lepkowski JM, Williams DR, Mero RP, Chen J.Socioeconomic factors, health behaviors, and mortality: results from anationally representative prospective study of US adults. JAMA.1998;279(21):1703–8.
41. Laaksonen M, Prattala R, Helasoja V, Uutela A, Lahelma E. Income and healthbehaviours. Evidence from monitoring surveys among Finnish adults. JEpidemiol Community Health. 2003;57(9):711–7.
42. Huisman M, Kunst AE, Mackenbach JP. Inequalities in the prevalence ofsmoking in the European Union: comparing education and income. PrevMed. 2005;40(6):756–64.
43. McLaren L. Socioeconomic status and obesity. Epidemiol Rev. 2007;29:29–48.44. Monteiro CA, Conde WL, Popkin BM. Income-specific trends in obesity in
Brazil: 1975–2003. Am J Public Health. 2007;97(10):1808–12.45. Mayosi BM, Flisher AJ, Lalloo UG, Sitas F, Tollman SM, Bradshaw D. The
burden of non-communicable diseases in South Africa. Lancet.2009;374(9693):934–47.
46. de-Graft Aikins A, Addo J, Ofei F, Bosu W, Agyemang C. Ghana’s burden ofchronic non-communicable diseases: future directions in research, practiceand policy. Ghana Med J. 2012;46(2 Suppl):1–3.
47. Li Y, Zhang M, Jiang Y, Wu F. Co-variations and clustering of chronic diseasebehavioral risk factors in china: china chronic disease and risk factorsurveillance, 2007. PLoS One. 2012;7(3):e33881.
48. Hall KT, Chyun DA. General screening recommendations for chronic diseaseand risk factors in older adults. Medsurg Nurs. 2013;22(1):65–6.
49. Bowlin SJ, Morrill BD, Nafziger AN, Lewis C, Pearson TA. Reliability andchanges in validity of self-reported cardiovascular disease risk factors usingdual response: the behavioral risk factor survey. J Clin Epidemiol.1996;49(5):511–7.
50. Brener ND, Billy JO, Grady WR. Assessment of factors affecting the validity ofself-reported health-risk behavior among adolescents: evidence from thescientific literature. J Adolesc Health. 2003;33(6):436–57.
Submit your next manuscript to BioMed Centraland take full advantage of:
• Convenient online submission
• Thorough peer review
• No space constraints or color figure charges
• Immediate publication on acceptance
• Inclusion in PubMed, CAS, Scopus and Google Scholar
• Research which is freely available for redistribution
Submit your manuscript at www.biomedcentral.com/submit
Related Documents