News and Developments Global gold demand in Q1 2017 was 1,034.5t. The 18% year-on-year decline suffers from the comparison with Q1 2016, which was the strongest ever first quarter. Inflows into ETFs of 109.1t, although solid, were nonetheless a fraction of last year’s near-record inflows. Slower central bank demand also contributed to the weakness. Bar and coin investment, however, was healthy at 289.8t (+9% y-o-y), while demand firmed slightly in both the jewellery and technology sectors. Inflows into gold-backed ETFs of 109.1t were concentrated in Europe. Although inflows were just one-third of the extraordinary levels seen in Q1 2016, demand was firm. European-listed products were the most popular, due to continued political uncertainty in the region. Trump asked his now dismissed Federal Bureau of Investigation (FBI) Director James Comey to end a probe into ties between former national security adviser Michael Flynn and Russia, according to a source who has seen a memo written by Comey. The memo raises questions about whether Trump tried to interfere with a federal investigation. The White House denied the report. “The big signs for gold are going to be a combination of interest-rate movement and stock market fear as we enter the seasonally weak months of the year (May 1 through Halloween),” said Koos. “If stocks start to stumble toward the end of this month and interest rates revert to their mean, we could see some temporary upside pressure to the yellow metal.” Technical Outlook On a daily chart, the COMEX Gold prices have been trading in a “Rising Channel” formation from past few months and price has taken the support of its lower band of channel pattern at $1231 level. Moreover, COMEX Gold prices are trading above its 100 Days Simple Moving Average which suggests the medium term trend remains up. Furthermore, on a daily chart, MCX Gold price has taken the support of its horizontal trend line at 27890 level. In addition, momentum indicator MACD has given a positive crossover on COMEX Gold daily chart which indicates bullishness in the prices going forward. For short term perspective, one can initiate a long position in MCX Gold (June) at CMP Rs.28880 or on fall in the prices till Rs.28600 levels can be used as buying opportunity for the upside target of Rs.29800 levels. However, the bullish view can be reversed if gold prices close the below support of Rs.28100. Overall, we hold our bullish view in Gold (June) for the next one to two months. 18 th May, 2017 SEBI Registered - Research Analyst Equities I Commodities I Currencies I Mutual Funds GOLD Commodity Insight

Welcome message from author
This document is posted to help you gain knowledge. Please leave a comment to let me know what you think about it! Share it to your friends and learn new things together.
Transcript
News and Developments Global gold demand in Q1 2017 was 1,034.5t. The 18% year-on-year decline suffers from the comparison with Q1 2016,
which was the strongest ever first quarter. Inflows into ETFs of 109.1t, although solid, were nonetheless a fraction of last
year’s near-record inflows. Slower central bank demand also contributed to the weakness. Bar and coin investment,
however, was healthy at 289.8t (+9% y-o-y), while demand firmed slightly in both the jewellery and technology sectors.
Inflows into gold-backed ETFs of 109.1t were concentrated in Europe. Although inflows were just one-third of the
extraordinary levels seen in Q1 2016, demand was firm. European-listed products were the most popular, due to
continued political uncertainty in the region.
Trump asked his now dismissed Federal Bureau of Investigation (FBI) Director James Comey to end a probe into ties
between former national security adviser Michael Flynn and
Russia, according to a source who has seen a memo written by
Comey. The memo raises questions about whether Trump tried
to interfere with a federal investigation. The White House
denied the report. “The big signs for gold are going to be a
combination of interest-rate movement and stock market fear
as we enter the seasonally weak months of the year (May 1
through Halloween),” said Koos. “If stocks start to stumble
toward the end of this month and interest rates revert to their
mean, we could see some temporary upside pressure to the
yellow metal.”
Technical Outlook
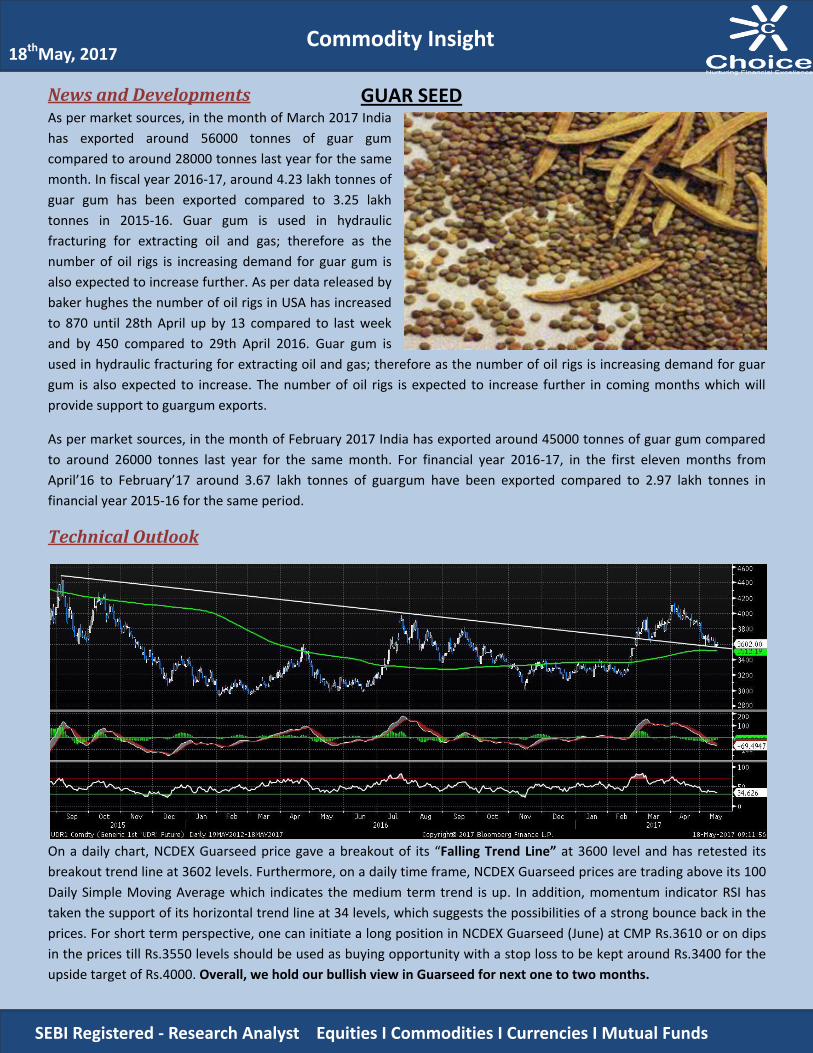
On a daily chart, the COMEX Gold prices have been trading in a “Rising Channel” formation from past few months and
price has taken the support of its lower band of channel pattern at $1231 level. Moreover, COMEX Gold prices are
trading above its 100 Days Simple Moving Average which suggests the medium term trend remains up. Furthermore, on
a daily chart, MCX Gold price has taken the support of its horizontal trend line at 27890 level.
In addition, momentum indicator MACD has given a positive crossover on COMEX Gold daily chart which indicates
bullishness in the prices going forward. For short term perspective, one can initiate a long position in MCX Gold (June) at
CMP Rs.28880 or on fall in the prices till Rs.28600 levels can be used as buying opportunity for the upside target of
Rs.29800 levels. However, the bullish view can be reversed if gold prices close the below support of Rs.28100. Overall,
we hold our bullish view in Gold (June) for the next one to two months.
18thMay, 2017
SEBI Registered - Research Analyst Equities I Commodities I Currencies I Mutual Funds
GOLD
Commodity Insight
News and Developments As per market sources, in the month of March 2017 India
has exported around 56000 tonnes of guar gum
compared to around 28000 tonnes last year for the same
month. In fiscal year 2016-17, around 4.23 lakh tonnes of
guar gum has been exported compared to 3.25 lakh
tonnes in 2015-16. Guar gum is used in hydraulic
fracturing for extracting oil and gas; therefore as the
number of oil rigs is increasing demand for guar gum is
also expected to increase further. As per data released by
baker hughes the number of oil rigs in USA has increased
to 870 until 28th April up by 13 compared to last week
and by 450 compared to 29th April 2016. Guar gum is
used in hydraulic fracturing for extracting oil and gas; therefore as the number of oil rigs is increasing demand for guar
gum is also expected to increase. The number of oil rigs is expected to increase further in coming months which will
provide support to guargum exports.
As per market sources, in the month of February 2017 India has exported around 45000 tonnes of guar gum compared
to around 26000 tonnes last year for the same month. For financial year 2016-17, in the first eleven months from
April’16 to February’17 around 3.67 lakh tonnes of guargum have been exported compared to 2.97 lakh tonnes in
financial year 2015-16 for the same period.
Technical Outlook
On a daily chart, NCDEX Guarseed price gave a breakout of its “Falling Trend Line” at 3600 level and has retested its
breakout trend line at 3602 levels. Furthermore, on a daily time frame, NCDEX Guarseed prices are trading above its 100
Daily Simple Moving Average which indicates the medium term trend is up. In addition, momentum indicator RSI has
taken the support of its horizontal trend line at 34 levels, which suggests the possibilities of a strong bounce back in the
prices. For short term perspective, one can initiate a long position in NCDEX Guarseed (June) at CMP Rs.3610 or on dips
in the prices till Rs.3550 levels should be used as buying opportunity with a stop loss to be kept around Rs.3400 for the
upside target of Rs.4000. Overall, we hold our bullish view in Guarseed for next one to two months.
GUAR SEED
18thMay, 2017
, 2017
SEBI Registered - Research Analyst Equities I Commodities I Currencies I Mutual Funds
Commodity Insight

SPDR Gold ETF Holdings
Crop Calendar
Commodity Country January February March April May June July August September October November December
Guarseed India
Sowing
Growth
Harvesting/Arrivals
Commodity LTP WoW (%) MoM (%) Open Interest (Weekly)
Spot Gold ($/oz) 1222.50 -1.25 -1.52 --
Spot Silver ($/oz) 16.34 -3.99 -5.75 --
MCX Gold (Rs./10 gms)
27986 -2.15 1.44 -1741
MCX Silver (Rs./kg) 38121 -4.33 -6.67 -10311
NCDEX Guarseed (Rs./quintal)
3705 -1.2 -3.11 -36350
SEBI Registered - Research Analyst Equities I Commodities I Currencies I Mutual Funds
Commodity Insight 18thMay, 2017
, 2017
Source: Bloomberg
This is solely for information of clients of Choice Broking and does not construe to be an investment advice. It is also not intended as an offer or solicitation for the purchase and sale of any financial instruments. Any action taken by you on the basis of the information contained herein is your responsibility alone and Choice Broking its subsidiaries or its employees or associates will not be liable in any manner for the consequences of such action taken by you. We have exercised due diligence in checking the correctness and authenticity of the information contained in this recommendation, but Choice Broking or any of its subsidiaries or associates or employees shall not be in any way responsible for any loss or damage that may arise to any person from any inadvertent error in the information contained in this recommendation or any action taken on basis of this information. Technical analysis studies market psychology, price patterns and volume levels. It is used to forecast future price and market movements. Technical analysis is complementary to fundamental analysis and news sources. The recommendations issued herewith might be contrary to recommendations issued by Choice Broking in the company research undertaken as the recommendations stated in this report is derived purely from technical analysis. Choice Broking has based this document on information obtained from sources it believes to be reliable but which it has not independently verified; Choice Broking makes no guarantee, representation or warranty and accepts no responsibility or liability as to its accuracy or completeness. The opinions contained within the report are based upon publicly available information at the time of publication and are subject to change without notice. The information and any disclosures provided herein are in summary form and have been prepared for informational purposes. The recommendations and suggested price levels are intended purely for trading purposes. The recommendations are valid for the day of the report however trading trends and volumes might vary substantially on an intraday basis and the recommendations may be subject to change. The information and any disclosures provided herein may be considered confidential. Any use, distribution, modification, copying, forwarding or disclosure by any person is strictly prohibited. The information and any disclosures provided herein do not constitute a solicitation or offer to purchase or sell any security or other financial product or instrument. The current performance may be unaudited. Past performance does not guarantee future returns. There can be no assurance that investments will achieve any targeted rates of return, and there is no guarantee against the loss of your entire investment. POTENTIAL CONFLICT OF INTEREST DISCLOSURE (as on date of report) Disclosure of interest statement – • Analyst interest of the stock /Instrument(s): - No. • Firm interest of the stock / Instrument (s): - No.
Disclaimer
Contact Us
www.choiceindia.com [email protected]
Commodity Insight 18thMay, 2017
, 2017
SEBI Registered - Research Analyst Equities I Commodities I Currencies I Mutual Funds
Related Documents