COMMITTEE ON FOREIGN INVESTMENT IN THE UNITED STATES ANNUAL REPORT TO CONGRESS Report Period: CY 2010 Issued: December 2011

Welcome message from author
This document is posted to help you gain knowledge. Please leave a comment to let me know what you think about it! Share it to your friends and learn new things together.
Transcript
COMMITTEE ON FOREIGN INVESTMENT IN THE UNITED STATES
ANNUAL REPORT
TO CONGRESS
Report Period: CY 2010 Issued: December 2011

CFIUS ANNUAL REPORT TO CONGRESS
Report Period: CY 2010 Issued: December 2011

This page intentionally left blank.
i
TABLE OF CONTENTS
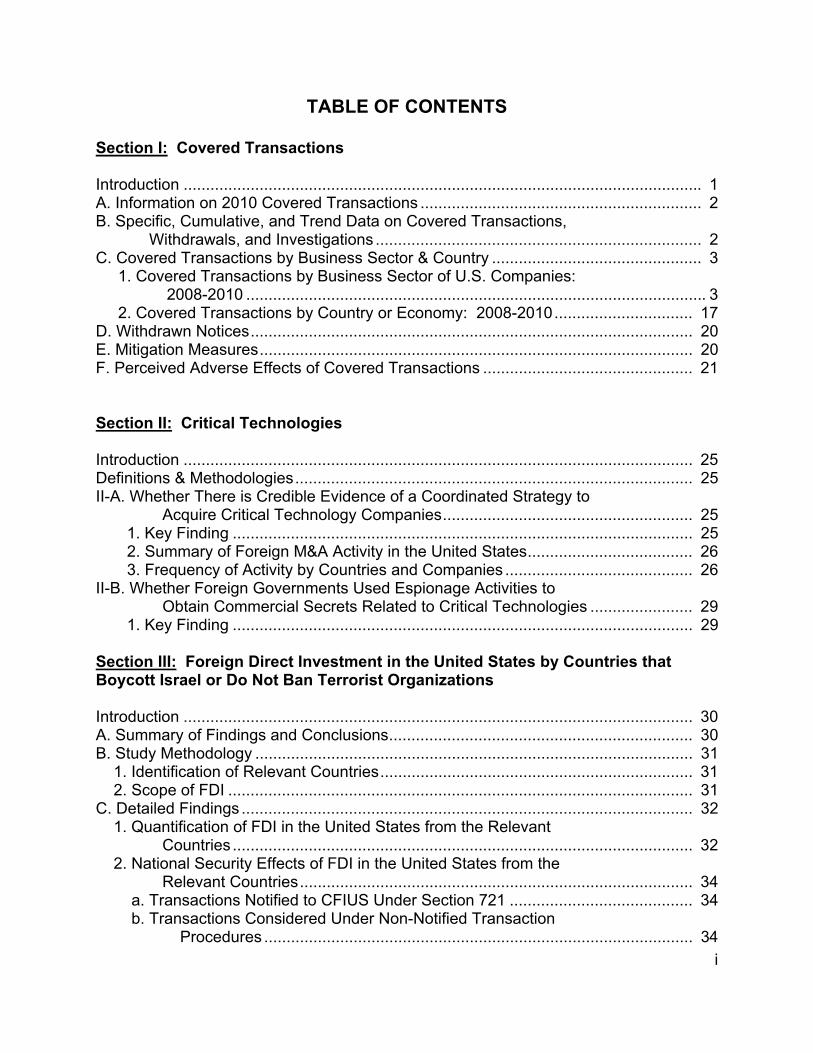
Section I: Covered Transactions Introduction .................................................................................................................... 1 A. Information on 2010 Covered Transactions ............................................................... 2 B. Specific, Cumulative, and Trend Data on Covered Transactions, Withdrawals, and Investigations ......................................................................... 2 C. Covered Transactions by Business Sector & Country ............................................... 3 1. Covered Transactions by Business Sector of U.S. Companies: 2008-2010 ....................................................................................................... 3 2. Covered Transactions by Country or Economy: 2008-2010............................... 17 D. Withdrawn Notices................................................................................................... 20 E. Mitigation Measures................................................................................................. 20 F. Perceived Adverse Effects of Covered Transactions ............................................... 21 Section II: Critical Technologies Introduction .................................................................................................................. 25 Definitions & Methodologies......................................................................................... 25 II-A. Whether There is Credible Evidence of a Coordinated Strategy to Acquire Critical Technology Companies........................................................ 25 1. Key Finding ....................................................................................................... 25 2. Summary of Foreign M&A Activity in the United States..................................... 26 3. Frequency of Activity by Countries and Companies .......................................... 26 II-B. Whether Foreign Governments Used Espionage Activities to Obtain Commercial Secrets Related to Critical Technologies ....................... 29 1. Key Finding ....................................................................................................... 29 Section III: Foreign Direct Investment in the United States by Countries that Boycott Israel or Do Not Ban Terrorist Organizations Introduction .................................................................................................................. 30 A. Summary of Findings and Conclusions.................................................................... 30 B. Study Methodology .................................................................................................. 31 1. Identification of Relevant Countries...................................................................... 31 2. Scope of FDI ........................................................................................................ 31 C. Detailed Findings ..................................................................................................... 32 1. Quantification of FDI in the United States from the Relevant Countries ....................................................................................................... 32 2. National Security Effects of FDI in the United States from the Relevant Countries........................................................................................ 34 a. Transactions Notified to CFIUS Under Section 721 ......................................... 34 b. Transactions Considered Under Non-Notified Transaction Procedures ................................................................................................ 34

ii
Appendix A. Definition of “Critical Technologies” .......................................................................... 36 B. Methodology and Data Sources Used to Identify U.S. Critical Technology Companies Acquired by Foreigners............................................... 36 C. Analyzing the Acquisitions of U.S. Critical Technology Companies......................... 38 D. Defining “Coordinated Strategy” for Purposes of this Report................................... 38 E. Participating Agencies and Entities – Critical Technologies Section........................ 39

1
SECTION I: COVERED TRANSACTIONS Introduction This section of the CFIUS Annual Report to Congress has been prepared in accordance with section 721(m) of the Defense Production Act of 1950 (50 U.S.C. App. 2170(m)(2)), as amended by the Foreign Investment and National Security Act of 2007, or “FINSA” (Pub. L. No. 110-49). Section 721(m)(2) requires the annual report on covered transactions to provide: “(A) A list of all notices filed and all reviews or investigations completed during the period, with basic information on each party to the transaction, the nature of the business activities or products of all pertinent persons, along with information about any withdrawal from the process, and any decision or action by the President under this section. (B) Specific, cumulative, and, as appropriate, trend information on the numbers of filings,1 investigations, withdrawals, and decisions or actions by the President under this section. (C) Cumulative and, as appropriate, trend information on the business sectors involved in the filings which have been made, and the countries from which the investments have originated. (D) Information on whether companies that withdrew notices to the Committee in accordance with subsection (b)(1)(C)(ii) have later re-filed such notices, or, alternatively, abandoned the transaction. (E) The types of security arrangements and conditions the Committee has used to mitigate national security concerns about a transaction, including a discussion of the methods that the Committee and any lead agency are using to determine compliance with such arrangements or conditions. (F) A detailed discussion of all perceived adverse effects of covered transactions on the national security or critical infrastructure of the United States that the Committee will take into account in its deliberations during the period before delivery of the next report, to the extent possible.”
1 For purposes of this report, “filings” means notices filed under section 721.

2
A. Information on 2010 Covered Transactions The classified version of this report contains a table listing all 93 notices of transactions that were filed with CFIUS in 2010, and that CFIUS determined to be covered transactions under section 721. That table sets forth information on the acquirer and the U.S. business acquired, including the nature of their business activities or products, and details on any withdrawal. That table is not included here because section 721 prohibits its public disclosure, but aggregate information regarding those 93 notices is presented below: • CFIUS conducted a “review” with respect to the 93 notices of covered
transactions filed with CFIUS. • CFIUS also conducted a subsequent “investigation” with respect to 35 of those
93 notices. • 12 of the notices were withdrawn. In five of these cases, the parties filed a new
notice. In five other cases, the parties abandoned their transactions. In two cases, the parties withdrew and re-filed in 2011.
• The President did not take action to block or prohibit any transactions in 2010. B. Specific, Cumulative, and Trend Data on Covered Transactions,
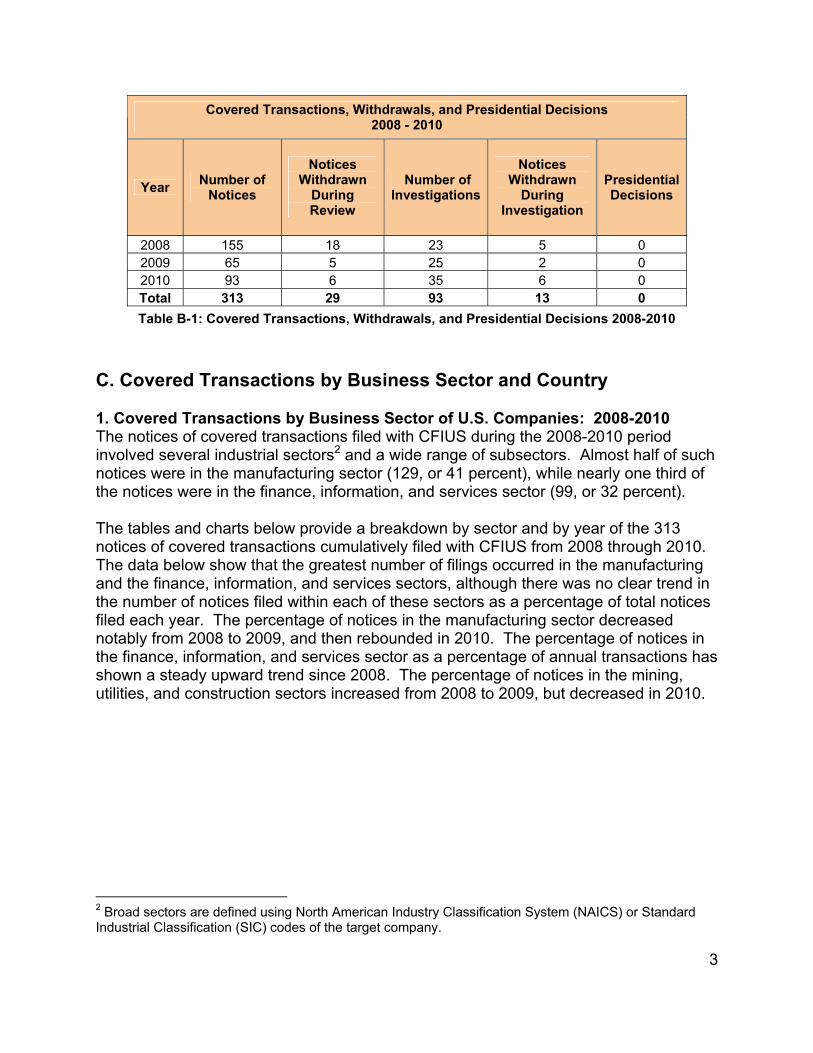
Withdrawals, and Investigations In the years 2008 through 2010, companies filed 313 notices of transactions that CFIUS determined to be covered transactions under section 721. Roughly nine percent (29 cases) of such notices were withdrawn during the review stage, four percent (13 cases) were withdrawn during the investigation stage, and 30 percent (93 cases) resulted in an investigation. There were no transactions that resulted in a Presidential decision. There was a significant decline in the number of notices from 2008 to 2009, coinciding with the global financial crisis, followed by an appreciable increase in 2010. As shown in Table B-1, the number of notices of covered transactions decreased from 155 in 2008 to 65 in 2009. In 2010, the number of notices increased to 93. The percentage of notices that were withdrawn from review fell in 2010 compared to 2009 and 2008. The percentage of investigations increased from 2008 to 2009, but steadied in 2010. While the percentage of notices withdrawn during the investigation stage in 2009 and 2008 were similar, there was an increase in 2010 compared to the previous year. In 2008, 12 percent (18 cases) were withdrawn during review, three percent (five cases) were withdrawn during investigation, and 15 percent (23 cases) resulted in investigation. In 2009, eight percent (five cases) were withdrawn during review, three percent (two cases) were withdrawn during investigation, and 38 percent (25 cases) resulted in investigation. In 2010, six percent (six cases) were withdrawn during review, six percent (six cases) were withdrawn during investigation, and 38 percent (35 cases) resulted in investigation.
3
Covered Transactions, Withdrawals, and Presidential Decisions 2008 - 2010
Year Number of Notices
Notices Withdrawn
During Review
Number of Investigations
Notices Withdrawn
During Investigation
Presidential Decisions
2008 155 18 23 5 0 2009 65 5 25 2 0 2010 93 6 35 6 0 Total 313 29 93 13 0
Table B-1: Covered Transactions, Withdrawals, and Presidential Decisions 2008-2010 C. Covered Transactions by Business Sector and Country 1. Covered Transactions by Business Sector of U.S. Companies: 2008-2010 The notices of covered transactions filed with CFIUS during the 2008-2010 period involved several industrial sectors2 and a wide range of subsectors. Almost half of such notices were in the manufacturing sector (129, or 41 percent), while nearly one third of the notices were in the finance, information, and services sector (99, or 32 percent). The tables and charts below provide a breakdown by sector and by year of the 313 notices of covered transactions cumulatively filed with CFIUS from 2008 through 2010. The data below show that the greatest number of filings occurred in the manufacturing and the finance, information, and services sectors, although there was no clear trend in the number of notices filed within each of these sectors as a percentage of total notices filed each year. The percentage of notices in the manufacturing sector decreased notably from 2008 to 2009, and then rebounded in 2010. The percentage of notices in the finance, information, and services sector as a percentage of annual transactions has shown a steady upward trend since 2008. The percentage of notices in the mining, utilities, and construction sectors increased from 2008 to 2009, but decreased in 2010.
2 Broad sectors are defined using North American Industry Classification System (NAICS) or Standard Industrial Classification (SIC) codes of the target company.

4
Covered Transaction by Sector and Year, 2008-2010
Year Manufacturing Finance,
Information, and Services
Mining, Utilities, and Construction
Wholesale and Retail
Trade Total
2008 72 (46%) 42 (27%) 25 (16%) 16 (10%) 155 2009 21 (32%) 22 (34%) 19 (29%) 3 (5%) 65 2010 36 (39%) 35 (38%) 13 (14%) 9 (10%) 93 Total 129 (41%) 99 (32%) 57 (18%) 28 (9%) 313
Table C-1: Covered Transactions by Sector and Year, 2008-2010
Covered Transactions by Sector (2008-2010)
01020304050607080
2008 2009 2010Year
# of
Cov
ered
Tra
nsac
tions
Manufacturing Finance, Information, and ServicesMining, Utilities, and Construction Wholesale and Retail Trade
Covered Transactions by Sector 2008-2010 Manufacturing accounted for 41 percent (129 notices) of all notices filed with CFIUS from 2008 through 2010. The computer and electronic products subsector comprised 48 percent (62 notices) of the 129 manufacturing sector notices during the period. The transportation equipment subsector accounted for 16 percent (21 notices) of the notices in the sector. The machinery subsector accounted for 12 percent (15 notices) of the notices in the sector.

5
Manufacturing, 2008-2010
NAICS Code Number of Transactions
% of Total Manufacturing
Computer and Electronic Products 334 62 48% Transportation Equipment 336 21 16% Machinery 333 15 12% Primary Metal 331 8 6% Chemical 325 7 5% Electrical Equip., Appl., & Comp. 335 5 4% Fabricated Metal Products 332 3 2% Textile Product Mills 314 2 2% Petroleum and Coal Products 324 2 2% Nonmetallic Mineral Products 327 2 2% Plastics and Rubber Products 326 1 1% Miscellaneous 339 1 1%
Table C-2: Covered Transactions from the Manufacturing Sector
Manufacturing 2008-2010
Electrical Equip., Appl., & Comp.
Fabricated Metal Products
Textile Product Mills
Petroleum and Coal Products
Nonmetallic Mineral Products
Plastics and Rubber Products
Miscellaneous
Chemical
Primary Metal 6%
Other 24%
Computer and Electronic Products 48%
Transportation Equipment 16% Machinery 12%
Covered Transactions from the Manufacturing Sector

6
Communications equipment manufacturing accounted for 32 percent (20 notices) of the 62 notices in the computer and electronic products subsector from 2008 through 2010. Navigational, measuring, electro-medical, and control instruments manufacturing accounted for an additional 32 percent (20 notices) of the notices in this subsector, with semiconductor and other electronic component manufacturing comprising 27 percent (17 notices) of the notices in this subsector.
Computer and Electronic Products, 2008-2010 NAICS Code Number of
Transactions
% of Total Computer and
Electronic Products
Communications Equipment Manufacturing 3342 20 32%
Navigational, Measuring, Electromedical, and Control Instruments Manufacturing 3345 20 32%
Semiconductor and Other Electronic Component Manufacturing 3344 17 27%
Computer and Peripheral Equipment Manufacturing 3341 5 8%
Table C-3: Covered Transactions from the Computer and Electronic Products Subsector
Computer and Electronic Products 2008-2010
Communications Equipment Manufacturing
32%
Navigational, Measuring, Electromedical, and Control Instruments Manufacturing 32%
Semiconductor and Other Electronic Component
Manufacturing 27%
Computer and Peripheral Equipment Manufacturing
8%
Covered Transactions from the Computer and Electronic Products Subsector

7
Aerospace products and parts manufacturing accounted for 67 percent (14 notices) of the 21 notices in the transportation equipment subsector from 2008 through 2010. Ship and boat building accounted for an additional 24 percent (five notices) of the notices in this subsector, with motor vehicle parts manufacturing comprising 10 percent (two notices).
Transportation Equipment 2008-2010 NAICS Code Number of
Transactions % of Total
Transportation Equipment
Aerospace Products and Parts Manufacturing 3364 14 67%
Ship and Boat Building 3366 5 24% Motor Vehicle Parts Manufacturing 3363 2 10%
Table C-4: Covered Transactions from the Transportation Equipment Subsector
Transportation Equipment2008-2010
Aerospace Products and Parts Manufacturing 67%
Ship and Boat Building 24%
Motor Vehicle Parts Manufacturing 10%
Covered Transactions from the Transportation Equipment Subsector

8
Commercial and service industry machinery manufacturing accounted for 33 percent (five notices) of the 15 notices in the machinery subsector from 2008 through 2010. Other general purpose machinery manufacturing accounted for 27 percent (four notices) of the notices in this subsector. Metalworking machinery manufacturing accounted for 20 percent (three notices) of the notices in this subsector. Engine, turbine, and power transmission equipment manufacturing accounted for 13 percent (two notices) of the notices in this subsector. Agriculture, construction, and mining machinery manufacturing accounted for the remaining seven percent (one notice) of the notices in this subsector.
Machinery 2008-2010 NAICS Code Number of
Transactions % of Total Machinery
Commercial and Service Industry Machinery Manufacturing 3333 5 33%
Other General Purpose Machinery Manufacturing 3339 4 27%
Metalworking Machinery Manufacturing 3335 3 20% Engine, Turbine, and Power Transmission Equipment Manufacturing 3336 2 13%
Agriculture, Construction, and Mining Machinery Manufacturing 3331 1 7%
Table C-5: Covered Transactions from the Machinery Subsector
Machinery2008-2010
Commercial and Service Industry Machinery Manufacturing 33%
Other General Purpose Machinery Manufacturing
27%
Metalworking Machinery Manufacturing 20%
Engine, Turbine, and Power Transmission
Equipment Manufacturing 13%
Agriculture, Construction, and Mining Machinery
Manufacturing 7%
Covered Transactions from the Machinery Subsector

9
The finance, information, and services sector accounted for 32 percent (99 notices) of all notices of covered transactions filed with CFIUS from 2008 through 2010. The services subsector accounted for 65 percent (64 notices). The information subsector accounted for 33 percent (33 notices). The finance subsector accounted for two percent (two notices).
Finance, Information, and Services, 2008-2010
NAICS Code(s)
Number of Transactions
% of Total F-I-S
Services 54, 56 64 65% Information 51 33 33% Finance 52 2 2%
Table C-6: Covered Transactions from the Finance, Information, and Services Sector
Finance, Information, and Services 2008-2010
Information 33%
Services 65%
Finance 2%
Covered Transactions from the Finance, Information, and Services Sector
Computer systems design and related services accounted for 36 percent (23 notices) of the 64 notices in the services subsector from 2008 through 2010. Architectural, engineering, and related services accounted for 28 percent (18 notices). Management, scientific and technical consulting services, and scientific research and development services accounted for 11 percent each (seven notices each) in this subsector. Investigation and security services accounted for six percent (four notices) in this

10
subsector. Other professional, scientific, and technical services and facilities support services accounted for three percent each (two notices each) in this subsector. Waste treatment and disposal services accounted for two percent (one notice) in this subsector.
Services, 2008-2010
NAICS Code
Number of Transactions
% of Total Services
Computer Systems Design and Related Services 5415 23 36% Architectural, Engineering, and Related Services 5413 18 28% Management, Scientific, and Technical Consulting Services 5416 7 11%
Scientific Research and Development Services 5417 7 11% Investigation and Security Services 5616 4 6% Other Professional, Scientific, and Technical Services 5419 2 3% Facilities Support Services 5612 2 3% Waste Treatment and Disposal Services 5622 1 2%
Table C-7: Covered Transactions from the Services Subsector
Services 2008-2010
Computer Systems Design and Related Services 36%
Architectural, Engineering, and Related Services 28%
Management, Scientific, and Technical Consulting
Services 11%
Scientific Research and Development Services
11%
Investigation and Security Services 6%
Other Professional, Scientific, and Technical
Services 3%Waste Treatment and Disposal Services 2%
Facilities Support Services 3%
Covered Transactions from the Services Subsector

11
Software publishers accounted for 42 percent (14 notices) of the 33 notices in the information subsector from 2008 through 2010. Wireless telecommunications carriers (except satellite) and satellite telecommunications accounted for 15 percent each (five notices each) in this subsector. Other telecommunications accounted for 12 percent (four notices) in this subsector. Other information services accounted for nine percent (three notices) in this subsector. Wired telecommunications carriers, internet service providers, and web search portals accounted for three percent each (one notice each) in this subsector.
Information 2008-2010 NAICS Code Number of
Transactions % of Total
Information Software Publishers 5112 14 42% Wireless Telecommunications Carriers (except Satellite) 5172 5 15%
Satellite Telecommunications 5174 5 15% Other Telecommunications 5179 4 12% Other Information Services 5191 3 9% Wired Telecommunications Carriers 5171 1 3% Internet Service Providers and Web Search Portals 5181 1 3%
Table C-8: Covered Transactions from the Information Subsector
Information 2008-2010
Software Publishers 42%
Other Telecommunications 12%
Satellite Telecommunications 15%
Wireless Telecommunications
Carriers (except Satellite) 15%
Other Information Services 9%
Wired Telecommunications
Carriers 3%
Other 15%
Internet Service Providers and Web Search Portals
3%
Covered Transactions from the Information Subsector

12
The mining, utilities, and construction sector accounted for 18 percent (57 notices) of the notices of covered transactions filed with CFIUS from 2008 through 2010. In this sector, the largest percentage of activity involved the utilities subsector, which accounted for 49 percent (28 notices) of the notices in this sector. Mining (except oil and gas) accounted for 19 percent (11 notices) of the notices in this sector. Support activities for mining accounted for 16 percent (nine notices) of the notices in this sector.
Mining, Utilities, and Construction, 2008-2010 NAICS Code Number of
Transactions % of Total
M-U-C
Utilities 221 28 49% Mining (except Oil and Gas) 212 11 19% Support Activities for Mining 213 9 16% Heavy and Civil Engineering Construction 237 3 5% Oil and Gas Extraction 211 2 4% Construction of Buildings 236 2 4% Specialty Trade Contractor 238 2 4%
Table C-9: Covered Transactions from the Mining, Utilities, & Construction Sector
Mining, Utilities, and Construction2008-2010
Mining (except Oil and Gas) 19%
Support Activities for Mining 16%
Construction of Buildings 4%
Specialty Trade Contractor 4%
Heavy and Civil Engineering Construction
5%
Oil and Gas Extraction 4%
Utilities 49%
Covered Transactions from the Mining, Utilities, & Construction Sector

13
Electric power generation, transmission, and distribution comprised 79 percent (22 notices) of the 28 notices in the utilities subsector from 2008 through 2010.
Utilities, 2008-2010 NAICS
Code Number of
Transactions % of Total
Utilities Electric Power Generation, Transmission and Distribution 2211 22 79% Natural Gas Distribution 2212 5 18% Water, Sewage, and Other Systems 2213 1 4%
Table C-10: Covered Transactions from the Utilities Subsector
Utilities 2008-2010
Electric Power Generation, Transmission and Distribution 79%
Natural Gas Distribution 18%
Water, Sewage, and Other Systems 4%
Covered Transactions from the Utilities Subsector

14
Metal ore mining comprised 29 percent (8 notices) of the 11 notices in the mining subsector from 2008 through 2010. Nonmetallic mineral mining and quarrying accounted for 11 percent (three notices) of the notices in this subsector.
Mining 2008-2010
NAICS Code
Number of Transactions
% of Total Mining
Metal Ore Mining 2122 8 73% Nonmetallic Mineral Mining and Quarrying 2121 3 27%
Table C-11: Covered Transactions from the Mining Subsector
Mining2008-2010
Metal Ore Mining 73%
Nonmetallic Mineral Mining and Quarrying 27%
Covered Transactions from the Mining Subsector
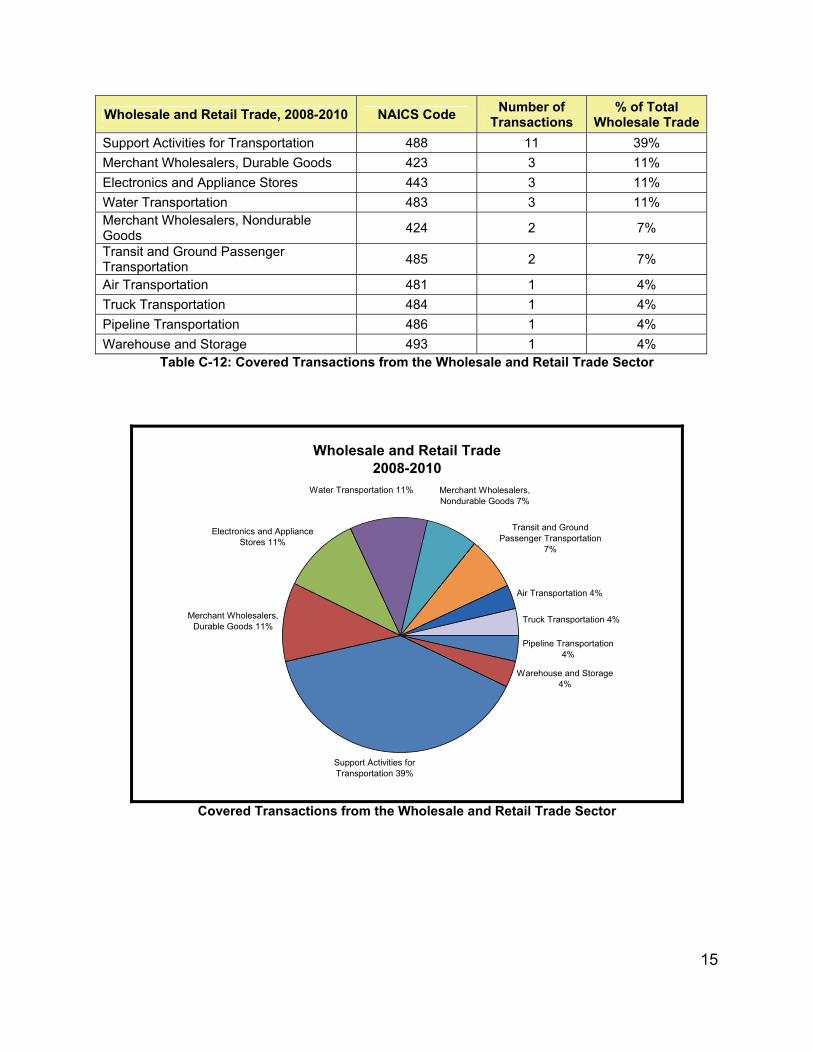
Wholesale and retail trade accounted for nine percent (28 notices) of the notices of covered transactions filed with CFIUS from 2008 through 2010. Support activities for transportation accounted for 39 percent (11 notices) of the wholesale and retail trade sector notices during the period. Merchant wholesalers of durable goods; electronics and appliance stores; and water transportation accounted for another 11 percent each (three notices each) of the notices in this subsector.
15
Wholesale and Retail Trade, 2008-2010 NAICS Code Number of Transactions
% of Total Wholesale Trade
Support Activities for Transportation 488 11 39% Merchant Wholesalers, Durable Goods 423 3 11% Electronics and Appliance Stores 443 3 11% Water Transportation 483 3 11% Merchant Wholesalers, Nondurable Goods 424 2 7%
Transit and Ground Passenger Transportation 485 2 7%
Air Transportation 481 1 4% Truck Transportation 484 1 4% Pipeline Transportation 486 1 4% Warehouse and Storage 493 1 4%
Table C-12: Covered Transactions from the Wholesale and Retail Trade Sector
Wholesale and Retail Trade 2008-2010
Support Activities for Transportation 39%
Merchant Wholesalers, Durable Goods 11%
Electronics and Appliance Stores 11%
Air Transportation 4%
Warehouse and Storage 4%
Pipeline Transportation 4%
Truck Transportation 4%
Transit and Ground Passenger Transportation
7%
Merchant Wholesalers, Nondurable Goods 7%
Water Transportation 11%
Covered Transactions from the Wholesale and Retail Trade Sector
16
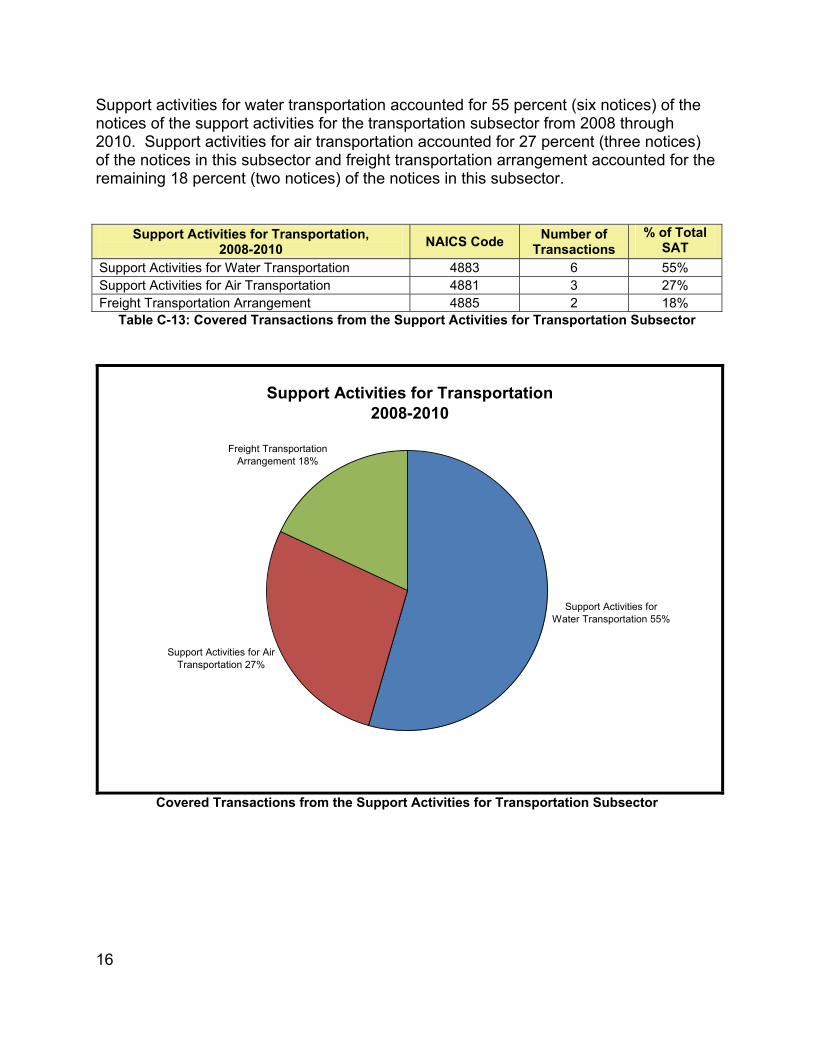
Support activities for water transportation accounted for 55 percent (six notices) of the notices of the support activities for the transportation subsector from 2008 through 2010. Support activities for air transportation accounted for 27 percent (three notices) of the notices in this subsector and freight transportation arrangement accounted for the remaining 18 percent (two notices) of the notices in this subsector.
Support Activities for Transportation, 2008-2010 NAICS Code Number of
Transactions % of Total
SAT Support Activities for Water Transportation 4883 6 55% Support Activities for Air Transportation 4881 3 27% Freight Transportation Arrangement 4885 2 18%
Table C-13: Covered Transactions from the Support Activities for Transportation Subsector
Support Activities for Transportation2008-2010
Support Activities for Water Transportation 55%
Support Activities for Air Transportation 27%
Freight Transportation Arrangement 18%
Covered Transactions from the Support Activities for Transportation Subsector

17
2. Covered Transactions by Country or Economy: 2008-2010 The first table (C-14) breaks down the notices of covered transactions from 2008 through 2010 by country and year.3 There is no clear trend in the breakdown of transactions by year. Acquisitions by investors from the United Kingdom accounted for 29 percent of the notices for the three-year period (91 notices), the largest by far, and also represented the largest number of notices each year. Canada, France and Israel, the next three leading countries, together accounted for an additional 23 percent of the total notices over the period (73 notices), and were among the leading countries each year (with the exception of Canada, which had only six transactions in 2008). The second table (C-15) shows that there is no clear tendency of investors in any one country to prefer transactions in a specific industry sector, although there are a few relative concentrations (e.g., 14 of the 25 investments from France were in manufacturing, with no other sector accounting for more than four transactions). Acquisitions by investors from countries that accounted for multiple notices typically also involved multiple sectors.
3 The figures in this table reflect the number of notices filed with CFIUS and are not adjusted to account for the fact that some transactions were the subject of more than one notice, where the original notice was withdrawn and then re-filed, as discussed in Section I.D of this report.

18
Covered Transactions by Acquirer’s Home Country/Economy, 2008-2010
Country/Economy 2008 2009 2010 Total Australia 11 1 3 15 Australia & United Kingdom 1 1 Austria 2 2 Belgium 1 1 Bermuda 1 1 Brazil 2 2 Canada 6 9 9 24 Canada & Singapore 1 1 Chile 1 1 China 6 4 6 16 Finland 1 1 France 12 7 6 25 Germany 3 1 2 6 Greece 1 1 Hong Kong 1 1 1 3 Hungary 1 1 Iceland 1 1 India 1 1 2 Ireland 2 2 Israel 12 5 7 24 Italy 5 2 3 10 Japan 8 4 7 19 Korea 2 2 Kuwait 2 2 Lebanon 4 4 Luxembourg 1 1 Malaysia 1 1 Netherlands 2 4 2 8 Netherlands & France 1 1 Norway 2 2 Qatar 1 1 Russian Federation 8 4 12 Saudi Arabia 1 1 Singapore 1 1 2 Spain 1 3 4 Sweden 3 5 8 Switzerland 4 2 6 Taiwan 1 1 Ukraine 2 2 United Arab Emirates 2 2 1 5 United Kingdom 48 17 26 91
Grand Total 155 65 93 313
Table C-14: Covered Transactions by Country or Economy: 2008-2010

19
Covered Transaction by Acquirer’s Home Country/Economy and Target's Sector, 2008-2010
Country/Economy Manufacturing Finance,
Information, and
Services
Mining, Utilities &
Construction
Wholesale & Retail Trade
Total
Australia 3 4 8 15 Australia & United Kingdom 1 1 Austria 2 2 Belgium 1 1 Bermuda 1 1 Brazil 1 1 2 Canada 3 9 10 2 24 Canada & Singapore 1 1 Chile 1 1 China 8 3 4 1 16 Finland 1 1 France 14 4 4 3 25 Germany 2 2 1 1 6 Greece 1 1 Hong Kong 3 3 Hungary 1 1 Iceland 1 1 India 2 2 Ireland 1 1 2 Israel 13 9 2 24 Italy 8 2 10 Japan 4 8 6 1 19 Korea 2 2 Kuwait 2 2 Lebanon 4 4 Luxembourg 1 1 Malaysia 1 1 Netherlands 2 4 1 1 8 Netherlands & France 1 1 Norway 2 2 Qatar 1 1 Russian Federation 6 3 2 1 12 Saudi Arabia 1 1 Singapore 1 1 2 Spain 2 2 4 Sweden 3 5 8 Switzerland 3 3 6 Taiwan 1 1 Ukraine 2 2 United Arab Emirates 5 5 United Kingdom 44 37 8 2 91 Grand Total 129 99 57 28 313
Table C-15: Covered Transactions by Country or Economy: 2008-2010

20
D. Withdrawn Notices Parties can withdraw an accepted notice of a transaction if the Committee approves a written request for withdrawal from the parties. Parties have requested withdrawals for a number of reasons over the years. For example, in some cases, parties are unable to address all of the Committee’s outstanding national security concerns within the initial 30-day review period or 45-day investigation period. The parties might then choose to submit a request for withdrawal, either to provide additional time to answer remaining questions or to resolve remaining national security concerns. In other cases, the parties may withdraw a notice because they are abandoning the transaction or because a material change in the terms of the transaction warrants the filing of a new notice. When appropriate, the Committee has established processes to track the status of a withdrawn transaction or interim protections to address specific national security concerns identified during the review or investigation of the withdrawn transaction.
In 2010, CFIUS approved the withdrawal of 12 notices. The parties withdrew six notices during the 30-day review period and six during the 45-day investigation period. Parties re-filed five of the notices after withdrawal, and CFIUS concluded action in those cases. In five cases, the parties abandoned the transactions that were the subject of the notices. In two cases, the notices were withdrawn but were re-filed in 2011. E. Mitigation Measures From 2008 through 2010, 16 cases resulted in the use of legally binding mitigation measures. In 2010, CFIUS agencies negotiated, and parties adopted, mitigation measures for nine different covered transactions. These measures involved acquisitions of U.S. companies in the computer software, telecommunications, and energy sectors. Four CFIUS agencies served as the USG signatories to these measures. The Committee has adopted procedures to evaluate and ensure that parties to a covered transaction remain in compliance with any risk mitigation measure entered into with CFIUS agencies under section 721. For all mitigation measures executed since FINSA became effective, Treasury, as Chair of CFIUS, has designated each U.S. Government (USG) signatory to a mitigation measure as a lead agency for monitoring compliance with that measure. Lead agencies carry out their monitoring responsibilities on behalf of the Committee and report back to the Committee on at least a quarterly basis. In addition, signatories to mitigation measures that were entered into before FINSA’s effective date report to CFIUS quarterly on compliance with those measures. As described below, all lead agencies for monitoring mitigation compliance have implemented processes to carry out their responsibilities. The measures required the businesses involved to take specific and verifiable actions, including, for example:
o ensuring compliance in establishing guidelines and terms for handling existing USG contracts and USG customer information.
21
o notifying relevant USG parties of any material introduction, modification, or discontinuation of a product or service, as well as any awareness of any vulnerability or security incidents.
o establishing a Corporate Security Committee, security officers, and other mechanisms to ensure compliance with all required actions.
CFIUS agencies use a variety of means to monitor and enforce compliance by the companies that are subject to the measures, including:
o periodic reporting to USG agencies by the companies; o on-site compliance reviews by USG agencies; o third-party audits when provided for by the terms of the mitigation measures; o investigations and remedial actions if anomalies or breaches are discovered
or suspected.
In light of the number and complexity of mitigation measures implemented to date, individual CFIUS agencies monitor compliance through a number of internal procedures, including:
o assigning staff responsibilities for the monitoring of compliance; o designing tracking systems to monitor required reports; o instituting internal instructions and procedures to ensure that in-house
expertise is drawn upon to analyze compliance with measures. F. Perceived Adverse Effects of Covered Transactions Section 721(m) requires that this report include a discussion of all perceived adverse effects of covered transactions on the national security or critical infrastructure of the United States that the Committee will take into account in its deliberations during the period before delivery of the next report, to the extent possible. In reviewing a covered transaction, CFIUS evaluates all relevant national security considerations identified by its members during the review and does not conclude action on a covered transaction if there are unresolved national security concerns. As discussed in the Guidance Concerning the National Security Review Conducted by CFIUS, which CFIUS published in the Federal Register on December 8, 2008, the transactions that CFIUS had thus far reviewed presented a broad range of national security considerations. CFIUS examines the national security considerations to determine whether, in light of the specific facts and circumstances related to the transaction, the transaction would adversely affect national security and pose a national security risk. Among the considerations presented by transactions reviewed by CFIUS are the following: • Foreign control of U.S. businesses that:
o Provide products and services to an agency or agencies of the U.S. Government, or state and local authorities, that have functions that are relevant to national security.
22
o Provide products or services that could expose national security vulnerabilities, including potential cyber security concerns, or create vulnerability to sabotage or espionage. This includes consideration of whether the covered transaction will increase the risk of exploitation of the particular U.S. business's position in the supply chain.
o Have operations, or produce or supply products or services, the security of which may have implications for U.S. national security, such as businesses that involve infrastructure that may constitute critical infrastructure, businesses in the energy sector, businesses that affect the national transportation system, and businesses that could significantly and directly affect the U.S. financial system.
o Have access to classified information. o Are in the defense, security, and national security-related law enforcement
sectors. o Are involved in activities related to weapons and munitions manufacturing,
aerospace, and radar systems. o Produce certain types of advanced technologies that may be useful in
defending, or in seeking to impair, U.S. national security, which may include businesses engaged in the design and production of semiconductors and other equipment or components that have both commercial and military applications, or the design, production, or provision of goods and services involving network and data security.
o Engage in the research and development, production, or sale of technology, goods, software, or services that are subject to U.S. export controls.
• Acquisition of control by foreign persons that: o Are controlled by a foreign government. o Are from a country with a record on nonproliferation and other national
security-related matters that raises concerns. o Have historical records of taking or intentions to take actions that could
impair U.S. national security. CFIUS reviews all relevant national security considerations and the particular facts and circumstances of transactions to determine whether the transaction will pose national security risk. Among the factors that CFIUS takes into account are the following, listed in section 721(f) of the Defense Production Act of 1950: (1) domestic production needed for projected national defense requirements; (2) the capability and capacity of domestic industries to meet national defense
requirements, including the availability of human resources, products, technology, materials, and other supplies and services;
(3) the control of domestic industries and commercial activity by foreign citizens as it affects the capability and capacity of the United States to meet the requirements of national security;
(4) the potential effects of the proposed or pending transaction on sales of military goods, equipment, or technology to any country –
23
(A) identified by the Secretary of State - (i) under section 6(j) of the Export Administration Act of 1979, as a
country that supports terrorism; (ii) under section 6(l) of the Export Administration Act of 1979, as a
country of concern regarding missile proliferation; or (iii) under section 6(m) of the Export Administration Act of 1979, as a
country of concern regarding the proliferation of chemical and biological weapons;
(B) identified by the Secretary of Defense as posing a potential regional military threat to the interests of the United States; or
(C) listed under section 309(c) of the Nuclear Non-Proliferation Act of 1978 on the “Nuclear Non-Proliferation-Special Country List” (15 C.F.R. Part 778, Supplement No. 4) or any successor list;
(5) the potential effects of the proposed or pending transaction on United States international technological leadership in areas affecting United States national security;
(6) the potential national security-related effects on United States critical infrastructure, including major energy assets;
(7) the potential national security-related effects on United States critical technologies;
(8) whether the covered transaction is a foreign government-controlled transaction, as determined under subsection (b)(1)(B) of Section 721;
(9) as appropriate, and particularly with respect to transactions requiring an investigation under subsection (b)(1)(B) of Section 721, a review of the current assessment of— (A) the adherence of the subject country to nonproliferation control regimes,
including treaties and multilateral supply guidelines, which shall draw on, but not be limited to, the annual report on “Adherence to and Compliance with Arms Control, Nonproliferation and Disarmament Agreements and Commitments,” required by section 403 of the Arms Control and Disarmament Act;
(B) the relationship of such country with the United States, specifically on its record on cooperating in counter-terrorism efforts, which shall draw on, but not be limited to, the report of the President to Congress under section 7120 of the Intelligence Reform and Terrorism Prevention Act of 2004; and
(C) the potential for transshipment or diversion of technologies with military applications, including an analysis of national export control laws and regulations;
(10) the long-term projection of United States requirements for sources of energy and other critical resources and materials; and
(11) such other factors as the President or the Committee may determine to be appropriate generally or in connection with a specific review or investigation.
In the transactions that CFIUS will review during the next reporting period, it will continue to take into account the national security considerations noted above. CFIUS

24
will consider whether the transactions may have the above-listed or any other adverse effects in determining whether the transactions pose national security risk.

25
SECTION II: CRITICAL TECHNOLOGIES Introduction This section of the Annual Report to Congress has been prepared in accordance with section 721(m)(3) of the Defense Production Act of 1950 (50 U.S.C. App. 2170(m)(3)), as amended. Section 721(m)(3) requires the annual report to include:
“(i) an evaluation of whether there is credible evidence of a coordinated strategy by 1 or more countries or companies to acquire United States companies involved in research, development, or production of critical technologies for which the United States is a leading producer; and “(ii) an evaluation of whether there are industrial espionage activities directed or directly assisted by foreign governments against private United States companies aimed at obtaining commercial secrets related to critical technologies.”
Subsection II-A addresses the requirement laid out in (i), and subsection II-B addresses the requirement laid out in (ii). Definitions & Methodologies The definition of “critical technologies,” which includes technologies subject to certain U.S. export controls, is set forth in 31 C.F.R. § 800.209, Regulations Pertaining to Mergers, Acquisitions, and Takeovers by Foreign Persons (the “CFIUS regulations”), published in the Federal Register on November 21, 2008. See the Appendix for this definition. “Critical technology companies” are U.S. companies that CFIUS identified for this report involved in research, development, or production of critical technologies. The Appendix also provides the definition of “coordinated strategy” for purposes of this report, describes the methodology and data sources used to identify transactions involving critical technology companies (“critical technology transactions”), and the approach used to conduct the analyses required by Section 721 related to critical technologies. Finally, it lists the agencies and other entities that participated in preparing this section of the report. II-A. Whether There Is Credible Evidence of a Coordinated Strategy to
Acquire Critical Technology Companies 1. Key Finding Based on our assessment of 2010 activity, the U.S. Intelligence Community (USIC) judges it unlikely that there is a coordinated strategy among one or more foreign governments or companies to acquire United States companies involved in research, development, or production of critical technologies for which the United States is a leading producer. Indications of a coordinated strategy may go unobserved due to

26
limitations on intelligence collection, or may be hidden or misconstrued because of foreign denial and deception activities. 2. Summary of Foreign M&A Activity in the United States Using the methodology described in the Appendix, CFIUS identified 79 completed foreign mergers with, or acquisitions of, U.S. critical technology companies involving acquirers from 25 countries and territories. The USIC evaluated all 79 transactions for indications of a coordinated strategy to acquire U.S. critical technologies. 3. Frequency of Activity by Countries and Companies Identifying acquirers’ home countries may provide some useful initial insights into the analysis of foreign acquisitions of U.S. critical technology companies. Table II-14 lists the originating countries for planned and completed acquisitions of U.S. critical technology companies in 2010:
Country/Economy Number of
Transactions United Kingdom 20 Canada 10 Israel 10 Japan 9 China 5 Germany 5 India 5 France 4 Italy 4 Netherlands 3 Sweden 3 Taiwan 3 Finland 2 Hong Kong 2 Ireland 2 Russia 2 Switzerland 2 Australia 1 Belgium 1 Cayman Islands 1 Norway 1 Singapore 1 South Korea 1 Thailand 1 United Arab Emirates 1
Table II-1: Home Country/Economy of Foreign Acquirers of Critical Technology Companies
4 The number of transactions based on country involvement exceeds the total number of transactions (79) due to some transactions involving more than one country.

27
There are two foreign companies that acquired three or more U.S. critical technology companies in 2010. One of those companies is based in the UK and the other is based in Italy. As shown in Figure II-1,5 the largest amount of M&A activity involving foreign acquisitions of U.S. critical technology companies involved targets whose primary activities are in the information technology, electronics, and aerospace & defense sectors. Sixty-four transactions (81 percent) involved one of these three sectors.
19
31
23
5
1
4
1
22
0
5
10
15
20
25
Aero
spac
e&
Def
ense
Che
mic
als
Ener
gy
Info
rmat
ion
Tech
nolo
gy
Mac
hine
ry &
Equi
p.
Met
als
&M
inin
g
Phar
ma
&Bi
otec
h
R&D
&Te
stin
g Sv
cs
Elec
troni
cs
# of
201
0 Tr
ansa
ctio
ns
Figure II-1. Completed Transactions by Sector of U.S. Target Company
The data in this report can also be analyzed by the home region of the foreign acquirers as displayed in Figure II-2.6 Forty-three transactions (52 percent) involved an investor in Western Europe, the largest regional origin of critical technology transactions.
5 The number of transactions based on country involvement exceeds the total number of transactions (79) due to some transactions involving more than one country. 6 The number of transactions based on country involvement exceeds the total number of transactions (79) due to some transactions involving more than one country.

28
43
15
9
16
0
5
10
15
20
25
30
35
40
45
50
Western Europe East Asia Canada, Australia &New Zealand
Other
# of
201
0 Tr
ansa
ctio
ns
Figure II-2. Completed transactions in critical technologies by regions
Figure II-37 shows the regional breakdown of activity by number of transactions in each sector. Western European investors were the most active acquirers of U.S. critical technology companies in seven out of nine of the identified sectors.
7 The number of transactions based on country involvement exceeds the total number of transactions (79) due to some transactions involving more than one country.

29
1 1
5
1 11
7
1
6
14
1
9
34
1
11
4
1
5
1
5
0
2
4
6
8
10
12
14
16
Aero
spac
e &
Def
ense
Che
mic
als
Ener
gy
Info
rmat
ion
Tech
nolo
gy
Mac
hine
ry &
Equi
p.
Met
als
& M
inin
g
Phar
ma
&Bi
otec
h
R&D
& T
estin
gSv
cs
Elec
troni
cs
# of
201
0 Tr
ansa
ctio
ns
Canada, Australia & New Zealand East Asia Western Europe Other
Figure II-3. Completed transactions by region within each sector
II-B. Whether Foreign Governments Used Espionage Activities to
Obtain Commercial Secrets Related to Critical Technologies 1. Key Finding The USIC judges that foreign governments are extremely likely to continue to use a range of collection methods to obtain critical U.S. technologies.
30
SECTION III: FOREIGN DIRECT INVESTMENT IN THE UNITED STATES BY COUNTRIES THAT BOYCOTT ISRAEL OR DO NOT BAN TERRORIST ORGANIZATIONS
Introduction This section of the CFIUS Annual Report to Congress has been prepared in accordance with section 7(c) of the Foreign Investment and National Security Act of 2007, or “FINSA” (Pub. L. No. 110-49). Section 7(c) of FINSA provides:
“(1) STUDY REQUIRED.—Before the end of the 120-day period beginning on the date of enactment of this Act and annually thereafter, the Secretary of the Treasury, in consultation with the Secretary of State and the Secretary of Commerce, shall conduct a study on foreign direct investments in the United States, especially investments in critical infrastructure and industries affecting national security, by—
(A) foreign governments, entities controlled by or acting on behalf of a foreign government, or persons of foreign countries which comply with any boycott of Israel; or (B) foreign governments, entities controlled by or acting on behalf of a foreign government, or persons of foreign countries which do not ban organizations designated by the Secretary of State as foreign terrorist organizations.
“(2) REPORT.—Before the end of the 30-day period beginning upon the date of completion of each study under paragraph (1) and thereafter in each annual report under section 721(m) of the Defense Production Act of 1950 (as added by this section), the Secretary of the Treasury shall submit a report to Congress, for transmittal to all appropriate committees of the Senate and the House of Representatives, containing the findings and conclusions of the Secretary with respect to the study described in paragraph (1), together with an analysis of the effects of such investment on the national security of the United States and on any efforts to address those effects.”
A. Summary of Findings and Conclusions • Mergers with and acquisitions of U.S. companies (M&A), the main form of foreign
direct investment (FDI) into the United States, by investors from the countries described in section 7(c)(1) of FINSA that were completed between January 1, 2010 and December 31, 2010 (CY10) (subject M&A transactions) represent a small percentage of the total of such FDI flows into the United States.
• The value of subject M&A transactions with publicly reported values was
$1.4 billion. (As described in subsection C, not all publicly announced transactions are reported with dollar values, so the actual value of subject M&A transactions is over $1.4 billion.) The total value of M&A transactions with
31
publicly reported values by all foreign investors during CY10 exceeded $124 billion.
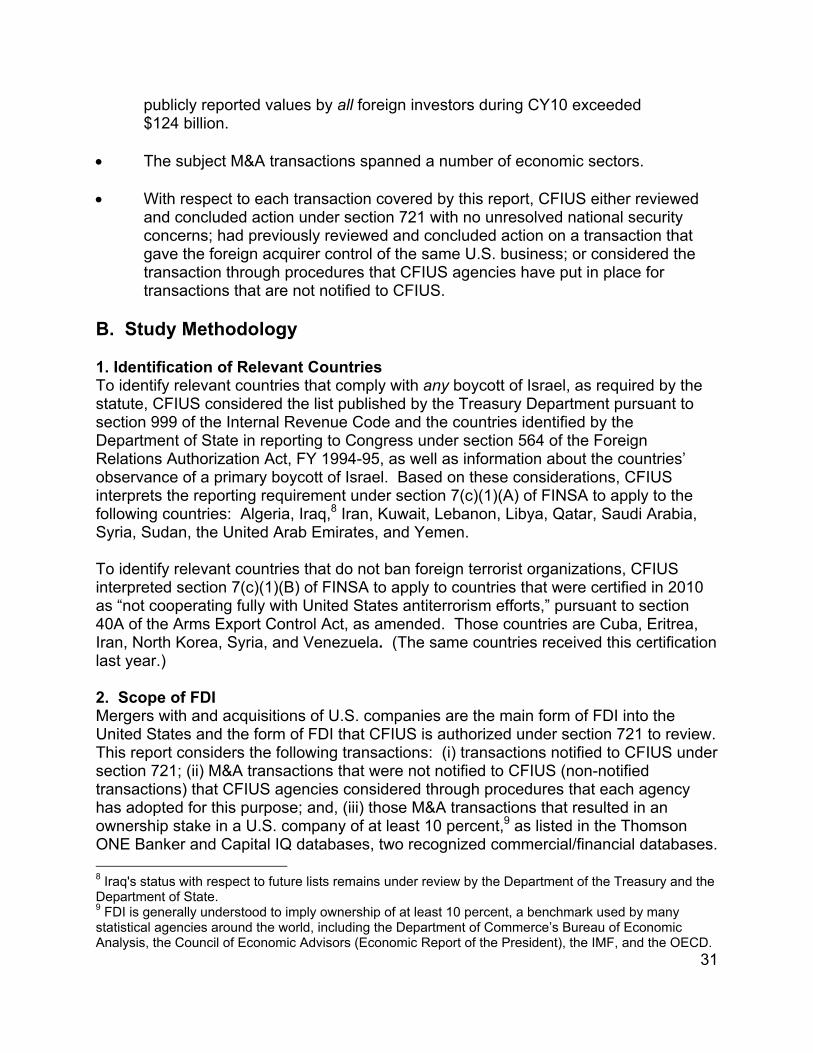
• The subject M&A transactions spanned a number of economic sectors. • With respect to each transaction covered by this report, CFIUS either reviewed
and concluded action under section 721 with no unresolved national security concerns; had previously reviewed and concluded action on a transaction that gave the foreign acquirer control of the same U.S. business; or considered the transaction through procedures that CFIUS agencies have put in place for transactions that are not notified to CFIUS.
B. Study Methodology 1. Identification of Relevant Countries To identify relevant countries that comply with any boycott of Israel, as required by the statute, CFIUS considered the list published by the Treasury Department pursuant to section 999 of the Internal Revenue Code and the countries identified by the Department of State in reporting to Congress under section 564 of the Foreign Relations Authorization Act, FY 1994-95, as well as information about the countries’ observance of a primary boycott of Israel. Based on these considerations, CFIUS interprets the reporting requirement under section 7(c)(1)(A) of FINSA to apply to the following countries: Algeria, Iraq,8 Iran, Kuwait, Lebanon, Libya, Qatar, Saudi Arabia, Syria, Sudan, the United Arab Emirates, and Yemen. To identify relevant countries that do not ban foreign terrorist organizations, CFIUS interpreted section 7(c)(1)(B) of FINSA to apply to countries that were certified in 2010 as “not cooperating fully with United States antiterrorism efforts,” pursuant to section 40A of the Arms Export Control Act, as amended. Those countries are Cuba, Eritrea, Iran, North Korea, Syria, and Venezuela. (The same countries received this certification last year.) 2. Scope of FDI Mergers with and acquisitions of U.S. companies are the main form of FDI into the United States and the form of FDI that CFIUS is authorized under section 721 to review. This report considers the following transactions: (i) transactions notified to CFIUS under section 721; (ii) M&A transactions that were not notified to CFIUS (non-notified transactions) that CFIUS agencies considered through procedures that each agency has adopted for this purpose; and, (iii) those M&A transactions that resulted in an ownership stake in a U.S. company of at least 10 percent,9 as listed in the Thomson ONE Banker and Capital IQ databases, two recognized commercial/financial databases. 8 Iraq's status with respect to future lists remains under review by the Department of the Treasury and the Department of State. 9 FDI is generally understood to imply ownership of at least 10 percent, a benchmark used by many statistical agencies around the world, including the Department of Commerce’s Bureau of Economic Analysis, the Council of Economic Advisors (Economic Report of the President), the IMF, and the OECD.

32
• Thomson ONE Banker database: This database is a product of the Thomson
Financial division of Thomson Corporation. The information on transactions provided in the database includes the date of the transaction, the respective countries of origin of the acquirer and the target company and the sector of the target company. In most cases, the database provides the transaction value and the percentage of ownership rights acquired through the transaction and, in some cases, the acquirer’s total ownership stake after the transaction. The transactions considered for this report excluded those that the Thomson ONE Banker database shows resulted in an ownership stake in a U.S. company of less than 10 percent.
• Capital IQ database:10 This database is a Standard and Poor’s business that
provides detailed profiles of M&A, private equity, venture capital, spin-offs, initial public offerings, bankruptcies, share buyback programs, and equity/debt public offering transactions. The information on transactions provided in the database includes the date of the transaction, the respective countries of origin of the acquirer, and the target company and the sector of the target company. The database provides, in most cases, the transaction value and the percentage of ownership rights acquired through the transaction and, in some cases, the acquirer’s total ownership stake after the transaction. The transactions considered for this report excluded those that the Capital IQ database shows resulted in an ownership stake in a U.S. company of less than 10 percent, where data on the interest acquired was available.
C. Detailed Findings 1. Quantification of FDI into the United States from the Relevant Countries The study identified seven completed M&A transactions in CY10 by investors from countries that comply with any boycott of Israel. These transactions involved investors from Kuwait, Lebanon, and the United Arab Emirates. The study did not find any subject M&A transactions by investors from Cuba, Iran, or Syria, which are countries that do not cooperate fully with U.S. antiterrorism efforts and which were subject to stringent economic sanctions during the relevant period. There also were no subject M&A transactions by investors from Eritrea, North Korea, or Venezuela – three countries that were also designated as not cooperating fully with U.S. antiterrorism efforts.
As noted in the descriptions of the Thomson ONE Banker and Capital IQ databases, these information sources did not always provide information regarding the acquirer’s total ownership stake in the U.S. company after the transaction. Therefore, some of the transactions covered by this review may be portfolio investments rather than FDI. 10 Although it was not cited, Capital IQ was also used in last year’s report as a secondary source of M&A transactions.
33
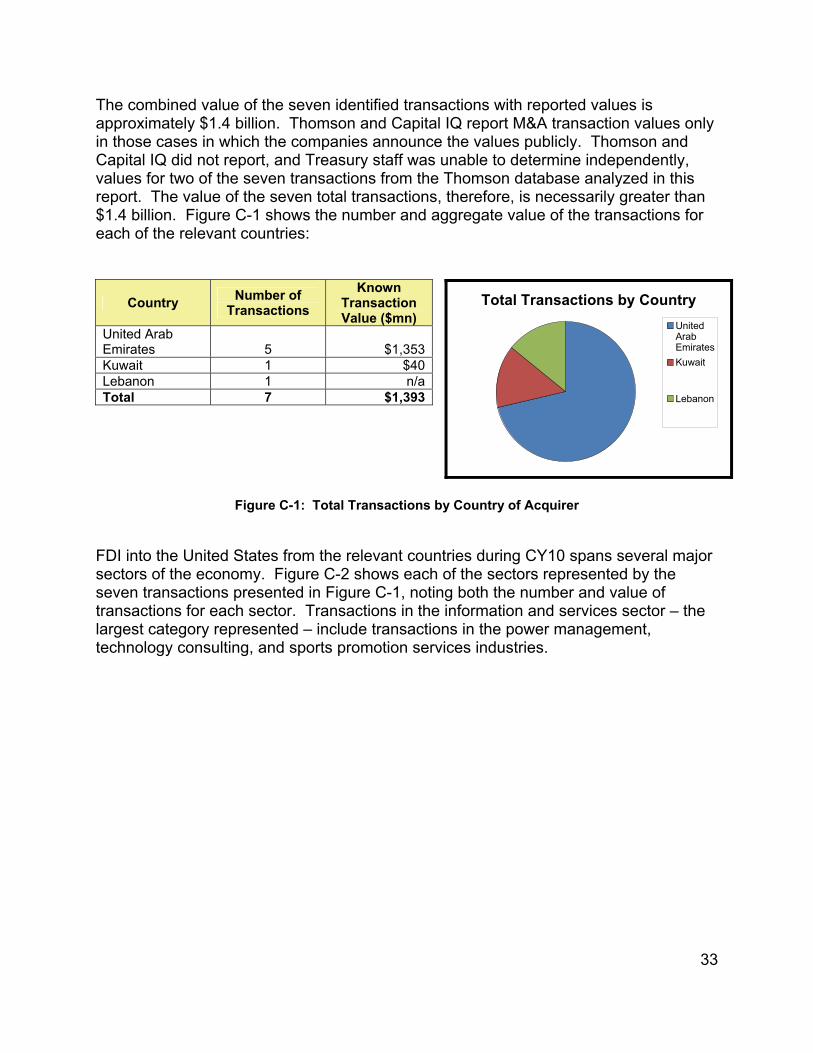
The combined value of the seven identified transactions with reported values is approximately $1.4 billion. Thomson and Capital IQ report M&A transaction values only in those cases in which the companies announce the values publicly. Thomson and Capital IQ did not report, and Treasury staff was unable to determine independently, values for two of the seven transactions from the Thomson database analyzed in this report. The value of the seven total transactions, therefore, is necessarily greater than $1.4 billion. Figure C-1 shows the number and aggregate value of the transactions for each of the relevant countries:
Total Transactions by CountryUnitedArabEmiratesKuwait
Lebanon
Figure C-1: Total Transactions by Country of Acquirer
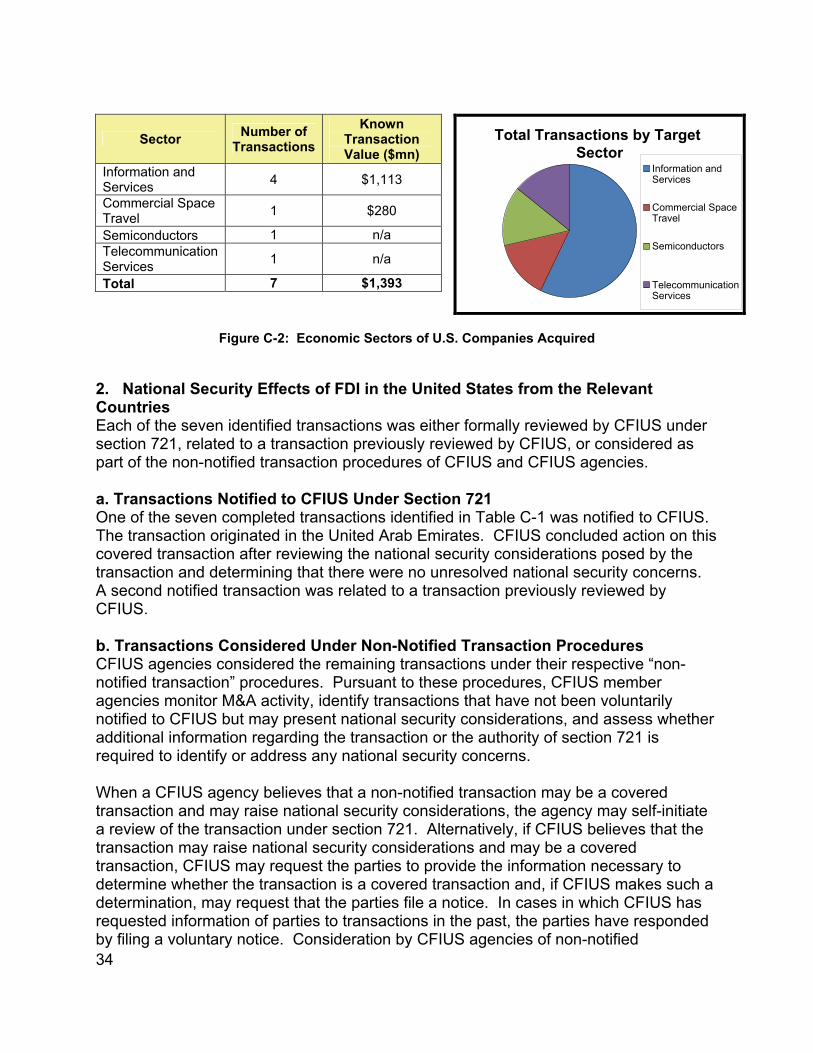
FDI into the United States from the relevant countries during CY10 spans several major sectors of the economy. Figure C-2 shows each of the sectors represented by the seven transactions presented in Figure C-1, noting both the number and value of transactions for each sector. Transactions in the information and services sector – the largest category represented – include transactions in the power management, technology consulting, and sports promotion services industries.
Country Number of Transactions
Known Transaction Value ($mn)
United Arab Emirates 5 $1,353 Kuwait 1 $40 Lebanon 1 n/aTotal 7 $1,393
34
Total Transactions by Target Sector
Information andServices
Commercial SpaceTravel
Semiconductors
TelecommunicationServices
Figure C-2: Economic Sectors of U.S. Companies Acquired
2. National Security Effects of FDI in the United States from the Relevant Countries Each of the seven identified transactions was either formally reviewed by CFIUS under section 721, related to a transaction previously reviewed by CFIUS, or considered as part of the non-notified transaction procedures of CFIUS and CFIUS agencies. a. Transactions Notified to CFIUS Under Section 721 One of the seven completed transactions identified in Table C-1 was notified to CFIUS. The transaction originated in the United Arab Emirates. CFIUS concluded action on this covered transaction after reviewing the national security considerations posed by the transaction and determining that there were no unresolved national security concerns. A second notified transaction was related to a transaction previously reviewed by CFIUS. b. Transactions Considered Under Non-Notified Transaction Procedures CFIUS agencies considered the remaining transactions under their respective “non-notified transaction” procedures. Pursuant to these procedures, CFIUS member agencies monitor M&A activity, identify transactions that have not been voluntarily notified to CFIUS but may present national security considerations, and assess whether additional information regarding the transaction or the authority of section 721 is required to identify or address any national security concerns. When a CFIUS agency believes that a non-notified transaction may be a covered transaction and may raise national security considerations, the agency may self-initiate a review of the transaction under section 721. Alternatively, if CFIUS believes that the transaction may raise national security considerations and may be a covered transaction, CFIUS may request the parties to provide the information necessary to determine whether the transaction is a covered transaction and, if CFIUS makes such a determination, may request that the parties file a notice. In cases in which CFIUS has requested information of parties to transactions in the past, the parties have responded by filing a voluntary notice. Consideration by CFIUS agencies of non-notified
Sector Number of Transactions
Known Transaction Value ($mn)
Information and Services 4 $1,113
Commercial Space Travel 1 $280
Semiconductors 1 n/a Telecommunication Services 1 n/a
Total 7 $1,393

35
transactions completed in CY2010 from investors in countries that boycott Israel or do not ban terrorist organizations so far have not resulted in requests for further information from or filings by the parties to the transaction.

36
APPENDIX
A. Definition of “Critical Technologies” The Regulations Pertaining to Mergers, Acquisitions, and Takeovers by Foreign Persons (the “CFIUS regulations”), published in the Federal Register on November 21, 2008, and codified at 31 C.F.R. part 800, defines “critical technologies” with reference to U.S. export control regulations, which were determined to be the most reliable and accurate means of identifying critical technologies: “§800.209 Critical technologies. The term critical technologies means: (a) Defense articles or defense services covered by the United States Munitions List
(USML), which is set forth in the International Traffic in Arms Regulations (ITAR) (22 C.F.R. parts 120-130);
(b) Those items specified on the Commerce Control List (CCL) set forth in Supplement No. 1 to part 774 of the Export Administration Regulations (EAR) (15 C.F.R. parts 730-774) that are controlled pursuant to multilateral regimes (i.e., for reasons of national security, chemical and biological weapons proliferation, nuclear nonproliferation, or missile technology), as well as those that are controlled for reasons of regional stability or surreptitious listening;
(c) Specially designed and prepared nuclear equipment, parts and components, materials, software, and technology specified in the Assistance to Foreign Atomic Energy Activities regulations (10 C.F.R. part 810), and nuclear facilities, equipment, and material specified in the Export and Import of Nuclear Equipment and Materials regulations (10 C.F.R. part 110); and
(d) Select agents and toxins specified in the Select Agents and Toxins regulations (7 C.F.R. part 331, 9 C.F.R. part 121, and 42 C.F.R. part 73).”
B. Methodology and Data Sources Used to Identify U.S. Critical Technology Companies Acquired by Foreigners The definition of critical technologies used in the CFIUS regulations is specific to those regulations. There is no single source that lists all U.S. critical technology companies acquired by foreign persons. Therefore, for purposes of this report, CFIUS agencies responsible for administering U.S. export control regulations used a combination of publicly available information, non-public data on M&A transactions that CFIUS reviewed, and their own internal records to identify the U.S. critical technology companies that were acquired by or received significant investments from foreign investors in 2010. The specific data sources and methodology used varied, depending on the records maintained pursuant to the particular export control regulations that pertain to the different critical technology categories. The dataset used for this report is therefore limited. The various methodologies are described below.
31 C.F.R. § 800.209(a): This paragraph pertains to defense articles or defense services covered by the United States Munitions List (USML), which is set forth in the International Traffic in Arms Regulations (ITAR) (22 C.F.R. parts 120-130).
37
Under the provisions of the ITAR, the Department of State maintains a robust registration, licensing, and compliance process for any person, whether U.S. or foreign, involved in the export or temporary import of a defense article or defense service controlled by the ITAR. This approach assists in the identification of foreign acquisitions of U.S. critical technology companies that produce defense articles or services covered under the ITAR.
31 C.F.R. § 800.209(b): This paragraph pertains to those items specified on the Department of Commerce’s Control List (CCL), which is set forth in Supplement No. 1 to part 774 of the Export Administration Regulations (EAR) (15 C.F.R. parts 730-774). The items on the CCL are controlled pursuant to multilateral regimes (i.e., for reasons of national security, chemical and biological weapons proliferation, nuclear nonproliferation, or missile technology) as well as for reasons of regional stability or surreptitious listening.
Firms producing items under the regulations specified in this paragraph of 31 C.F.R. § 800.209 are not required to register with the Department of Commerce (Commerce), but, in many cases, must obtain a license from Commerce in order to export those items (including “deemed exports” to foreign nationals in the United States). To identify acquisitions of companies producing items that fall under this part of the definition, Commerce used a combination of publicly available information on M&A transactions,11 information on non-publicly announced M&A transactions notified to CFIUS and its internal records of export license applications.
31 CFR § 800.209(c): This paragraph pertains to specially designed and prepared nuclear equipment, parts and components, materials, software, and technology specified in the Assistance to Foreign Atomic Energy Activities regulations (10 C.F.R. part 810), and nuclear facilities, equipment, and material specified in the Export and Import of Nuclear Equipment and Materials regulations (10 C.F.R. part 110);
The Department of Energy used a similar approach to that adopted by Commerce, which entailed checking a list of publicly announced M&A transactions12 against its records of export authorizations under 10 C.F.R. part 810 and the Nuclear Regulatory Commission’s records of export license requests under 10 C.F.R. part 110.
31 C.F.R. § 800.209(d): This paragraph pertains to select agents and toxins specified in the Select Agents and Toxins regulations (7 C.F.R. part 331, 9 CFR part 121, and 42 C.F.R. part 73).
The agents and toxins specified under these regulations are generally subject to export controls administered by Commerce. To this extent, the discussion above regarding 11 The M&A transactions were identified using the ThomsonONE database and Capital IQ’s database of M&A transactions. 12 The list of M&A transactions was drawn from the Capital IQ database.

38
Commerce’s methodology applies to transactions involving these critical technologies, as well. C. Analyzing the Acquisitions of U.S. Critical Technology Companies CFIUS agencies addressed parts (i) and (ii) of section 721(m)(3) of the Defense Production Act of 1950 (50 U.S.C. App. 2170(m)(3)), as amended, by doing the following: • Analyzing the pattern of M&A of U.S. critical technology companies during 2010,
while also considering transactions in prior years, as appropriate. o CFIUS agencies concentrated on foreign direct investment through M&A
of companies involved in all critical technologies, regardless of industry. o CFIUS agencies did not attempt to evaluate issues relating to other
avenues of foreign access to U.S. critical technologies, such as licensing, contracting, or other arrangements that are not mergers or acquisitions.
• Assessing illicit attempts by government intelligence services of major economic
competitors to obtain military and dual-use critical technologies. o CFIUS agencies did not attempt to evaluate foreign espionage in areas
other than dual-use, military, or other U.S. critical technologies, or against companies not headquartered in the United States.
o In addition, CFIUS agencies reviewed available information about other countries that have historically sought information on critical technologies through the use of those countries’ intelligence services.
D. Defining “Coordinated Strategy” for Purposes of this Report CFIUS agencies continue to use the following definition of “coordinated strategy”:
• A plan of action reflected in directed efforts developed and implemented by a
foreign government, in association with one or more foreign companies, to acquire U.S. companies with critical technologies. The efforts of a single company in pursuit of business goals, absent indications of specific government direction, were not considered to be a coordinated strategy. Individual company strategies encompass such business goals as: entry into the U.S. market; increased market share; increased sales; access to new technologies; and diversification out of mature industries. o Examples of suspect behaviors that could be evidence of a coordinated
strategy include: - A pattern of actual or attempted acquisitions of U.S. firms by foreign
entities; - Evidence that specific completed or attempted acquisitions of
companies with critical technologies had been ordered by foreign governments or foreign government-controlled firms; or
- The provision of narrowly targeted incentives by foreign governments or foreign-controlled firms (e.g., grants, concessionary loans, or tax breaks), especially those that appear to market
39
observers to be disproportionately generous, to acquire U.S. firms with critical technologies.
E. Participating Agencies & Entities -- Critical Technologies Section • Department of Commerce
o Bureau of Industry and Security o International Trade Administration o National Telecommunications and Information Administration
• Department of Defense – Defense Technology Security Administration • Department of Justice • Department of State
o Bureau of Economic, Energy, and Business Affairs o Bureau of Political-Military Affairs o Bureau of International Security and Nonproliferation
• Department of the Treasury • Intelligence Community Elements
o Office of the Director of National Intelligence, National Intelligence Council o Air Force Office of Special Investigations o Army Counterintelligence Center o Central Intelligence Agency o Defense Intelligence Agency o Federal Bureau of Investigation, National Security Branch o Department of Energy, Office of Intelligence and Counterintelligence o Department of Homeland Security, Office of Intelligence and Analysis o Department of State, Bureau of Intelligence and Research o Department of the Treasury, Office of Intelligence and Analysis o Marine Corps Intelligence Activity o Office of the National Counterintelligence Executive, Community
Acquisition Risk Section o National Counterterrorism Center o National Geospatial-Intelligence Agency o National Security Agency o Naval Intelligence (Office of Naval Intelligence and Naval Criminal
Investigative Service) • Executive Office of the President
o Council of Economic Advisors o National Security Council o Office of Science and Technology Policy

40
This page intentionally left blank.


Related Documents