Committee Meeting July 2018 MTA NYCT President Andy Byford greets the operator of the prototype MCI Express Bus during preview exhibition at MTA headquarters on June 18. F. Ferrer, Committee Chairman A. Albert R. Glucksman D. Jones S. Metzger C. Moerdler Committee Members S. Rechler J. Samuelsen P. Trottenberg V. Vanterpool J. Vitiello P. Ward C. Weisbrod

Welcome message from author
This document is posted to help you gain knowledge. Please leave a comment to let me know what you think about it! Share it to your friends and learn new things together.
Transcript
Committee Meeting July 2018
MTA NYCT President Andy Byford greets the operator of the prototype MCI Express Bus during preview exhibition at MTA headquarters on June 18.
F. Ferrer, Committee Chairman
A. Albert
R. Glucksman
D. Jones
S. Metzger
C. Moerdler
Committee Members
S. Rechler
J. Samuelsen
P. Trottenberg
V. Vanterpool
J. Vitiello
P. Ward C. Weisbrod
New York City Transit and Bus Committee Meeting 2 Broadway -20th Floor Conference Room
New York, NY 10004 Monday, 7/23/2018
10:30 AM - 12:00 PM ET
1. PUBLIC COMMENT PERIOD
2. APPROVAL OF MINUTES – JUNE 18, 2018June Committee Meeting Minutes - Page 4
3. COMMITTEE WORK PLANCommittee Work Plan - Page 12
4. PRESIDENT'S REPORTPresident's Commentary - Page 20
a. Customer Service Report
i. Subway ReportSubway Report - Page 22
ii. NYCT, MTA Bus Report NYCT, MTA Bus Report - Page 52
iii. Paratransit ReportParatransit Report - Page 77
iv. Accessibility UpdateAccessibility Update - Page 91
v. Strategy and Customer Experience ReportStrategy and Customer Experience Report - Page 93
b. Safety ReportSafety Report - Page 98
c. Crime ReportCrime Report - Page 102
d. NYCT, SIR, MTA Bus Financial & Ridership ReportsNYCT, SIR, MTA Bus Financial & Ridership Reports - Page 110
e. Capital Program Status ReportCapital Program Status Report - Page 162
5. MTACC REPORTMTACC Report - Page 172
6. PROCUREMENTSNYCT July Procurement Staff Summary and Resolution - Page 177
a. Non-CompetitiveNYCT Non-Competitive Actions - Page 182
b. Competitive NYCT Competitive Actions - Page 184
c. RatificationsNYCT, MTACC Ratifications - Page 192
7. SERVICE CHANGES
a. Implement Temporary M14 Select Bus Service Implement Temporary M14 Select Bus Service - Page 200
b. Implement B82 Select Bus Service Implement B82 Select Bus Service - Page 206
c. Off-Peak Frequency Enhancements for B17, B65, S93 and Articulated Bus Conversion for Bx6
Off-Peak Frequency Enhancements for B17, B65, S93 and Articulated Bus Conversion for Bx6 - Page 212
d. MTA Bus Service Revisions to the Q22 MTA Bus Service Revisions to the Q22 - Page 218
e. MTA Bus Service Revisions to the Q37 and QM18MTA Bus Service Revisions to the Q37 and QM18 - Page 226
f. MTA Bus Schedule Changes, Effective September 2018 MTA Bus Schedule Changes, Effective September 2018 - Page 232
8. SPECIAL REPORTS
a. Ridership Report (No Materials)
9. STANDARD FOLLOW UP REPORTS
a. MetroCard ReportMetroCard Report - Page 237
10. OUTSTANDING BUSINESS (No Materials)
11. EXECUTIVE OFFICE CONTACT INFORMATIONExecutive Office Contact Information - Page 242
Minutes of Regular Meeting Committee on Operations of the MTA New York City Transit Authority, Manhattan and
Bronx Surface Transit Operating Authority, Staten Island Rapid Transit Operating Authority,
Capital Construction Company and Bus Company June 18, 2018
Meeting Held at: Metropolitan Transportation Authority
Two Broadway New York, New York 10004
10:00 AM The following Members were present: Hon. Fernando Ferrer, Committee Chair Hon. Andrew Albert Hon. Ira Greenberg Hon. Randolph Glucksman Hon. David R. Jones Hon. Susan G. Metzger Hon. Charles G. Moerdler Hon. Scott Rechler Hon. Polly Trottenberg Hon. Veronica Vanterpool Hon. James E. Vitiello Hon. Peter Ward Hon. Carl Weisbrod Also present were: Hon. Carl Wortendyke, Board Member Andy Byford, President Joel Andrews, Vice President, EEO and Diversity Peter Cafiero, Chief, Operations Planning Craig Cipriano, Executive Vice President, MTA Bus Vincent Coogan, Assistant Chief, NYPD Transit Bureau Michael Cosgrove, Vice President, Paratransit Robert Diehl, Vice President, Department of Security Carl Hamann, Acting Vice President, System Safety James Henly, Vice President and General Counsel, Law Mark Holmes, Chief Officer, Operations Planning, MTA Bus Darryl Irick, President MTA Bus Company & Senior Vice President NYCT Buses Frank Jezycki, Chief Operating Officer, Subways Sally Librera, Senior Vice President, Subways Sarah Meyer, Chief Customer Officer Tim Mulligan, Executive Vice President John O’Grady, Senior Vice President, Capital Program Management
Master Page # 4 of 242 - New York City Transit and Bus Committee Meeting 7/23/2018________________________________________________________________________________
Jaibala Patel, Chief Financial Officer, Office of Management and Budget Stephen Plochochi, Senior Vice President, Operations Support, Materiel Janno Lieber, MTA Chief Development Officer, MTA Capital Construction I. Chairman Ferrer opened the meeting. II. Public Speakers Tabitha Decker from the Transit Center expressed support for the proposed redesign of the Staten Island Express Bus network and noted the redesigned routes better address riders’ needs. Howie Birnbaum from TWU Local 100 suggested that free rides be provided on the SBS Q53 on holidays and that smart cards replace the current fare system. Jason Pineiro expressed support for the proposed redesign of the Staten Island Express Bus network. He also recommended the expansion of the BX27 bus to Soundview Terminal. Pedro Valdez Rivera expressed support for the new double decker buses as well as the new MCI buses. Jean Ryan, from Disabled in Action, complained of inadequate wheelchair lift training for bus operators and noted boarding time takes too long. She stated she cannot take the bus in the mornings due to delays. She further stated an express bus redesign is necessary. Adina Gerber from Uptown Subway Advocates advocated for adequate alternatives when there
are planned closures; better communications on social media; and more frequent train service. Jim Wright of AIA New York stated he looks forward to hearing more details about the Fast Forward program. Ellyn Shannon of the Permanent Citizens Advisory Committee to the MTA expressed appreciation for recent improvements, and in particular, improvements with reporting delays. Murray Bodin opined that the NYC DOT does not correctly mark road lines. William Henderson of the New York City Transit Riders Council expressed support for the Staten Island Express Bus redesign project. Marcel Dejean suggested NYCT generate a complaint with the Taxi and Limousine Commission each time a cab or Uber blocks a bus lane. He also suggested that MTA police be dispatched to write tickets for delivery vehicles blocking the bus lanes.
Master Page # 5 of 242 - New York City Transit and Bus Committee Meeting 7/23/2018________________________________________________________________________________
Stephanie Burgos of the Riders’ Alliance expressed support for the Staten Island Express Bus redesign project. III. Minutes and Work Plan Upon motion duly made and seconded, the Committee approved the minutes of the May 21, 2018 meeting of the MTA New York City Transit Authority, Manhattan and Bronx Surface Transit Operating Authority, Staten Island Rapid Transit Operating Authority, Capital Construction Company and Bus Company. Tim Mulligan, EVP, noted one change to the Work Plan. Beginning in October, the Committee Book will include a new quarterly report presenting customer satisfaction ratings about bus, subway and paratransit service. Upon motion duly made and seconded, the change to the Work Plan was approved. IV. Agenda Items President Byford delivered the President’s Report and introduced Alex Elegudin, who is joining MTA New York City Transit Authority in the newly established position of Accessibility Advisor to the President.
A. Customer Service Operations Report
Sally Librera, SVP of Subways, delivered the Subway Report.
Member Weisbrod inquired whether the large number of major incidents reflected on the for the past month was accurate. SVP Librera responded in the affirmative. Member Weisbrod also inquired why the statistic reflecting mean distance between car failures (MDBF) is so varied from month to month. SVP Librera stated while the total revenue miles change from month to month, that number is relatively consistent. What affects MDBF is the smaller number of actual train troubles in a month. NYCT calculates MDBF by taking the total revenue mileage for a month and dividing it by the number of train troubles that caused a delay in service that month. The MDBF metric can fluctuate significantly from one month to another as the divisor, the number of car troubles in a given month (which is a much smaller number than the total revenue miles) fluctuates. SVP Librera advised that looking at the twelve month MDBF average gives the most accurate picture. Member Weisbrod, noting that subway track fires are down marginally this year but are up as compared to 2016, inquired why the subway action plan has not resulted in more of a decrease in fires. SVP Librera indicated she would need to review the 2016 data more closely to address that comparison. She reiterated that track fires have been reduced, noted that the Station Manager Program being implemented is aimed at attention to detail, litter and cleanliness in the system, and welcomed the advent of the new vacuum trains that will improve track cleanliness.
Master Page # 6 of 242 - New York City Transit and Bus Committee Meeting 7/23/2018________________________________________________________________________________
In response to an inquiry by Member Glucksman, SVP Librera stated the vacuum train travels at a speed of 5 MPH. Member Moerdler, citing to various delay statistics in the Committee Book, inquired about their accuracy in reflecting customer experience. SVP Librera responded that NYCT’s objective is to best understand what causes subway delays and to use that data to reduce the number of delays experienced by customers. SVP Librera proceeded with a presentation addressing the metrics being used in analyzing causes of subway delays. Ms. Librera noted that the metrics in use were part of an iterative process, with more detail to be added as it becomes available. President Byford added that the complexity of the subway system and the quantum of minutes can make it difficult to identify the root causes of delay. NYCT’s goal is to effectively capture the data, attribute and analyze it, and use that information to reduce delays. Member Moerdler stated that clarity and transparency regarding delay time is key and NYCT needs to address how to make things better. He further opined that the overcrowding category should be kept as a cause of delay in the data. President Byford agreed service must be improved. He noted the purpose of SVP Librera’s presentation was to make things more clear and transparent. Member Albert expressed appreciation for the new metrics and inquired whether planned work, such as diversions due to G.O.s, are taken into account when looking at the terminal on time performance. SVP Librera stated that G.O.s are taken into account when calculating terminal on time performance. Member Vanterpool expressed appreciation for the new metrics and inquired whether NYCT has given consideration to further breaking down the planned right of way work category and other categories. SVP Librera responded in the affirmative and stated NYCT will be adding to the categories in the future. Under the new system of reporting delays, a designated team will input the data as opposed to dispatchers. Member Vanterpool inquired whether social media will relay new data to customers. Sarah Meyer, Chief Customer Officer, responded that NYCT has increased its tweets relating to service and will be using new web applications that will better convey service changes and delays. Member Greenberg inquired why some legacy indicators were removed from the Book and noted data should be shared with the public in a more meaningful way. Peter Cafiero, Chief of Operations Planning, responded that the combination measure service KPI was removed but the three measures that are its component parts are still reported separately. Member Weisbrod expressed appreciation for the new metrics. SVP Librera noted a few years ago, delays were tracked with paper and pencil. NYCT continues to evolve.
Master Page # 7 of 242 - New York City Transit and Bus Committee Meeting 7/23/2018________________________________________________________________________________
Darryl Irick, President of MTA Bus and SVP of NYCT Buses, delivered the Bus Report and the Paratransit Report. Member Moerdler asked questions regarding enforcement of bus lanes and other rules of the road. To an inquiry whether MTA police could be used to enforce bus lane rules, Mr. Irick responded that all options are being considered. Mr. Irick also noted he would be meeting later in the week with Chief Chan of the NYPD regarding the bus lane issue and that NYCT may also be creating traffic teams in conjunction with DOT and NYPD. Member Moerdler asked whether NYCT can abolish the practice of allowing companies with delivery trucks that double park to negotiate paying off tickets in bulk. Mr. Irick stated it is a possibility but there is currently no effort to do so. Member Albert inquired whether notice is sent to management when there is a repeat problem on a particular route, such as an ongoing double parking issue. Mr. Irick responded in the affirmative and stated there is an ongoing process. Member Glucksman inquired about the status of his request for a report explaining why summonses have gone down. Assistant Chief Coogan responded that Mr. Irick will be meeting with the NYPD later this week regarding that issue. He stated he will relay the request to Chief Chan. Sarah Meyer, Chief Customer Officer, delivered the Strategy and Customer Experience Report. Member Weisbrod inquired about lengthy wait times for people calling in with complaints and whether they were calling during transit situations or generally seeking information. Ms. Meyer responded that hold times are longer than NYCT would like, although there has been a recent decrease. Noting a budgetary issue, Ms. Meyer advised that currently NYCT has approximately forty operators handling calls. Many people have been calling during transit situations using the Help Point System. People have also been calling seeking general information. Member Jones inquired whether people are informed at the outset how long they may have to wait. Ms. Meyer responded NYCT does not currently provide that information but the system is being upgraded and wait times will be provided in the future. Member Jones noted the option for a call back is also a good thing to have. Ms. Meyer added that NYCT’s social media response is currently faster than the call center response. Member Moerdler noted the customer service call center, which is separate from the paratransit call center, has been getting good reviews in his community. Member Weisbrod asked whether there is a way to track wifi performance on the subway. Ms. Meyer stated she would consult with the providers. Carl Hamann, Acting Vice President, System Safety, delivered the Safety Report.
Master Page # 8 of 242 - New York City Transit and Bus Committee Meeting 7/23/2018________________________________________________________________________________
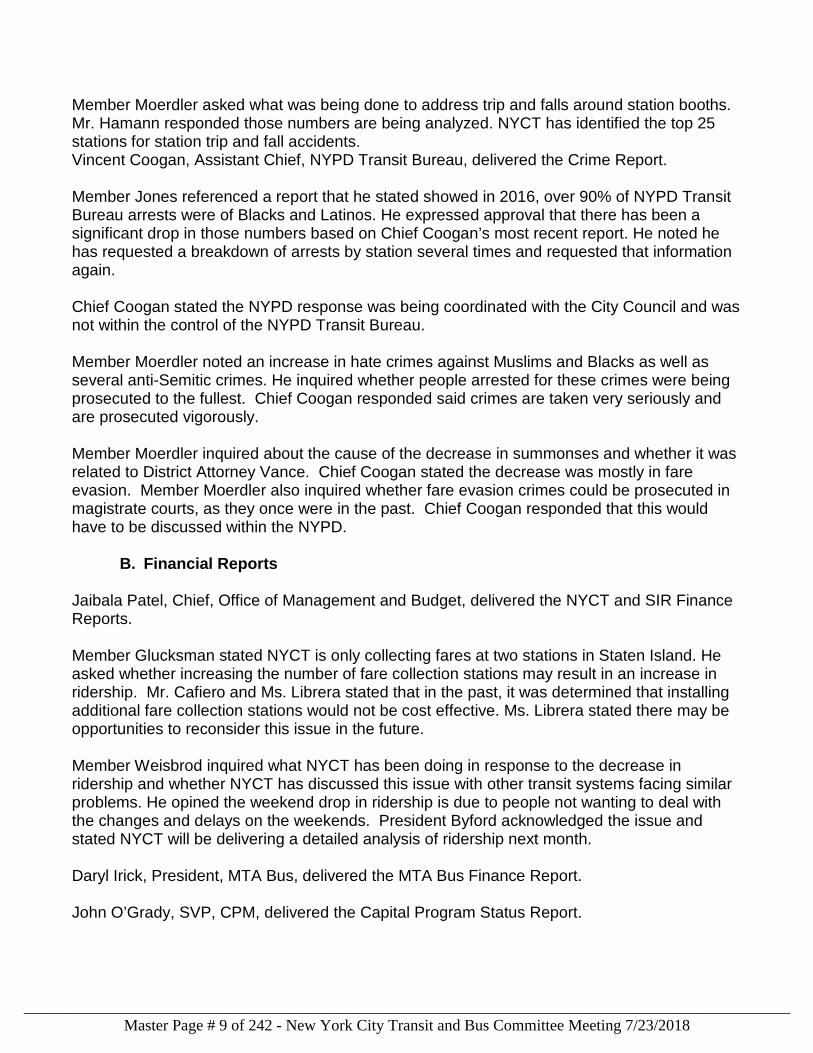
Member Moerdler asked what was being done to address trip and falls around station booths. Mr. Hamann responded those numbers are being analyzed. NYCT has identified the top 25 stations for station trip and fall accidents. Vincent Coogan, Assistant Chief, NYPD Transit Bureau, delivered the Crime Report. Member Jones referenced a report that he stated showed in 2016, over 90% of NYPD Transit Bureau arrests were of Blacks and Latinos. He expressed approval that there has been a significant drop in those numbers based on Chief Coogan’s most recent report. He noted he has requested a breakdown of arrests by station several times and requested that information again. Chief Coogan stated the NYPD response was being coordinated with the City Council and was not within the control of the NYPD Transit Bureau. Member Moerdler noted an increase in hate crimes against Muslims and Blacks as well as several anti-Semitic crimes. He inquired whether people arrested for these crimes were being prosecuted to the fullest. Chief Coogan responded said crimes are taken very seriously and are prosecuted vigorously. Member Moerdler inquired about the cause of the decrease in summonses and whether it was related to District Attorney Vance. Chief Coogan stated the decrease was mostly in fare evasion. Member Moerdler also inquired whether fare evasion crimes could be prosecuted in magistrate courts, as they once were in the past. Chief Coogan responded that this would have to be discussed within the NYPD.
B. Financial Reports Jaibala Patel, Chief, Office of Management and Budget, delivered the NYCT and SIR Finance Reports. Member Glucksman stated NYCT is only collecting fares at two stations in Staten Island. He asked whether increasing the number of fare collection stations may result in an increase in ridership. Mr. Cafiero and Ms. Librera stated that in the past, it was determined that installing additional fare collection stations would not be cost effective. Ms. Librera stated there may be opportunities to reconsider this issue in the future. Member Weisbrod inquired what NYCT has been doing in response to the decrease in ridership and whether NYCT has discussed this issue with other transit systems facing similar problems. He opined the weekend drop in ridership is due to people not wanting to deal with the changes and delays on the weekends. President Byford acknowledged the issue and stated NYCT will be delivering a detailed analysis of ridership next month. Daryl Irick, President, MTA Bus, delivered the MTA Bus Finance Report. John O’Grady, SVP, CPM, delivered the Capital Program Status Report.
Master Page # 9 of 242 - New York City Transit and Bus Committee Meeting 7/23/2018________________________________________________________________________________
C. Procurements
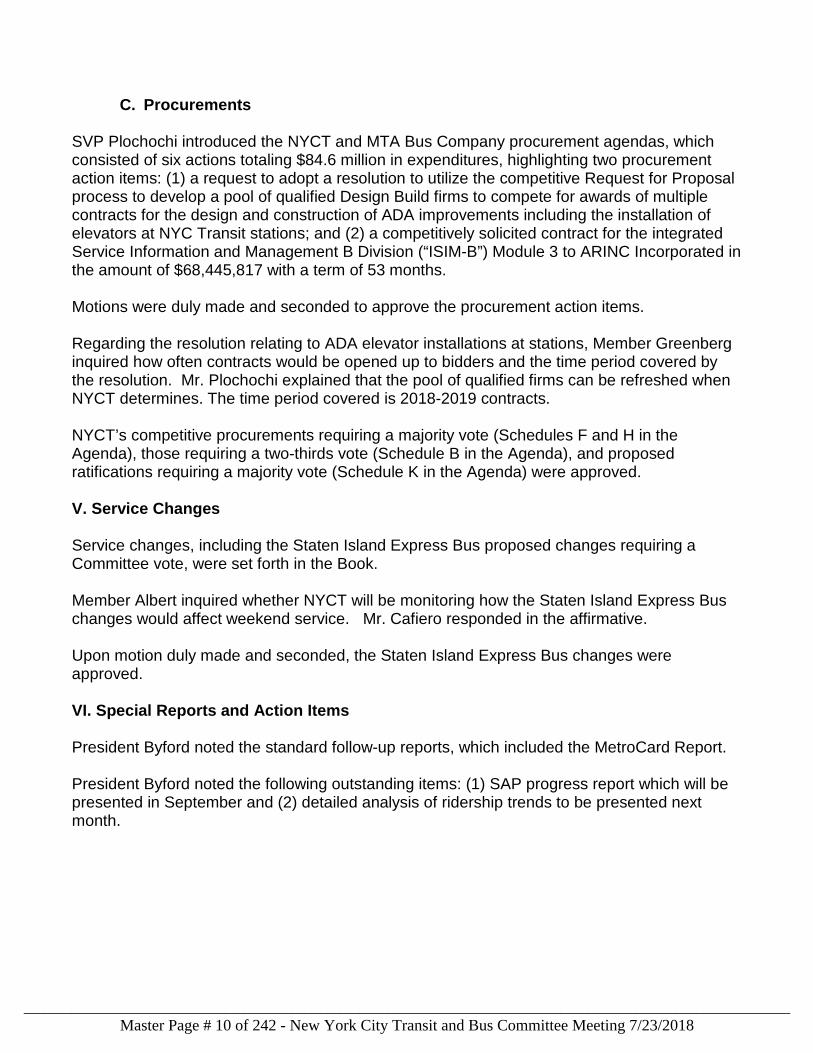
SVP Plochochi introduced the NYCT and MTA Bus Company procurement agendas, which consisted of six actions totaling $84.6 million in expenditures, highlighting two procurement action items: (1) a request to adopt a resolution to utilize the competitive Request for Proposal process to develop a pool of qualified Design Build firms to compete for awards of multiple contracts for the design and construction of ADA improvements including the installation of elevators at NYC Transit stations; and (2) a competitively solicited contract for the integrated Service Information and Management B Division (“ISIM-B”) Module 3 to ARINC Incorporated in the amount of $68,445,817 with a term of 53 months. Motions were duly made and seconded to approve the procurement action items. Regarding the resolution relating to ADA elevator installations at stations, Member Greenberg inquired how often contracts would be opened up to bidders and the time period covered by the resolution. Mr. Plochochi explained that the pool of qualified firms can be refreshed when NYCT determines. The time period covered is 2018-2019 contracts. NYCT’s competitive procurements requiring a majority vote (Schedules F and H in the Agenda), those requiring a two-thirds vote (Schedule B in the Agenda), and proposed ratifications requiring a majority vote (Schedule K in the Agenda) were approved. V. Service Changes Service changes, including the Staten Island Express Bus proposed changes requiring a Committee vote, were set forth in the Book. Member Albert inquired whether NYCT will be monitoring how the Staten Island Express Bus changes would affect weekend service. Mr. Cafiero responded in the affirmative. Upon motion duly made and seconded, the Staten Island Express Bus changes were approved. VI. Special Reports and Action Items President Byford noted the standard follow-up reports, which included the MetroCard Report. President Byford noted the following outstanding items: (1) SAP progress report which will be presented in September and (2) detailed analysis of ridership trends to be presented next month.
Master Page # 10 of 242 - New York City Transit and Bus Committee Meeting 7/23/2018________________________________________________________________________________
V¡I. Upon motion duly made and seconded, the meeting of the Committee was adjourned.
Respectfully submitted,
n M. Nolan
Master Page # 11 of 242 - New York City Transit and Bus Committee Meeting 7/23/2018________________________________________________________________________________
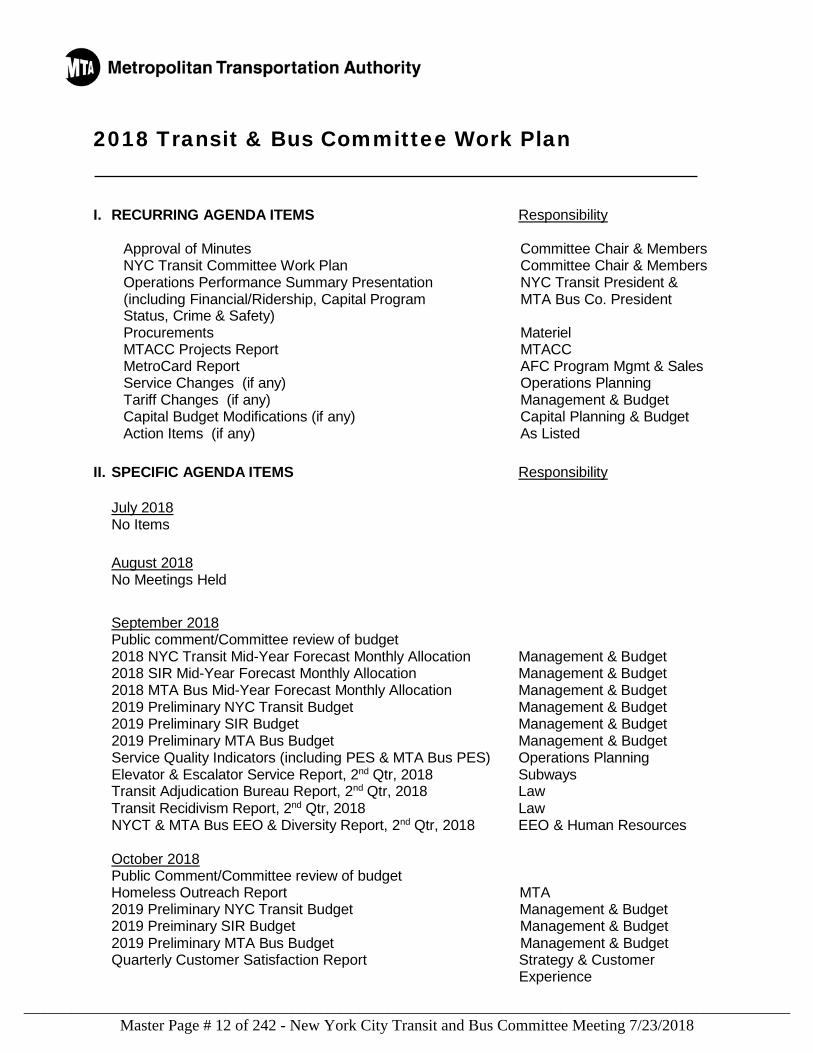
2018 Transit & Bus Committee Work Plan
I. RECURRING AGENDA ITEMS Responsibility
Approval of Minutes Committee Chair & Members NYC Transit Committee Work Plan Committee Chair & Members
Operations Performance Summary Presentation NYC Transit President & (including Financial/Ridership, Capital Program MTA Bus Co. President
Status, Crime & Safety) Procurements Materiel MTACC Projects Report MTACC MetroCard Report AFC Program Mgmt & Sales Service Changes (if any) Operations Planning Tariff Changes (if any) Management & Budget Capital Budget Modifications (if any) Capital Planning & Budget Action Items (if any) As Listed
II. SPECIFIC AGENDA ITEMS Responsibility
July 2018 No Items
August 2018 No Meetings Held
September 2018 Public comment/Committee review of budget 2018 NYC Transit Mid-Year Forecast Monthly Allocation Management & Budget 2018 SIR Mid-Year Forecast Monthly Allocation Management & Budget 2018 MTA Bus Mid-Year Forecast Monthly Allocation Management & Budget 2019 Preliminary NYC Transit Budget Management & Budget 2019 Preliminary SIR Budget Management & Budget 2019 Preliminary MTA Bus Budget Management & Budget Service Quality Indicators (including PES & MTA Bus PES) Operations Planning Elevator & Escalator Service Report, 2nd Qtr, 2018 Subways Transit Adjudication Bureau Report, 2nd Qtr, 2018 Law Transit Recidivism Report, 2nd Qtr, 2018 Law NYCT & MTA Bus EEO & Diversity Report, 2nd Qtr, 2018 EEO & Human Resources
October 2018 Public Comment/Committee review of budget Homeless Outreach Report MTA 2019 Preliminary NYC Transit Budget Management & Budget 2019 Preiminary SIR Budget Management & Budget 2019 Preliminary MTA Bus Budget Management & Budget Quarterly Customer Satisfaction Report Strategy & Customer
Experience
Master Page # 12 of 242 - New York City Transit and Bus Committee Meeting 7/23/2018
________________________________________________________________________________
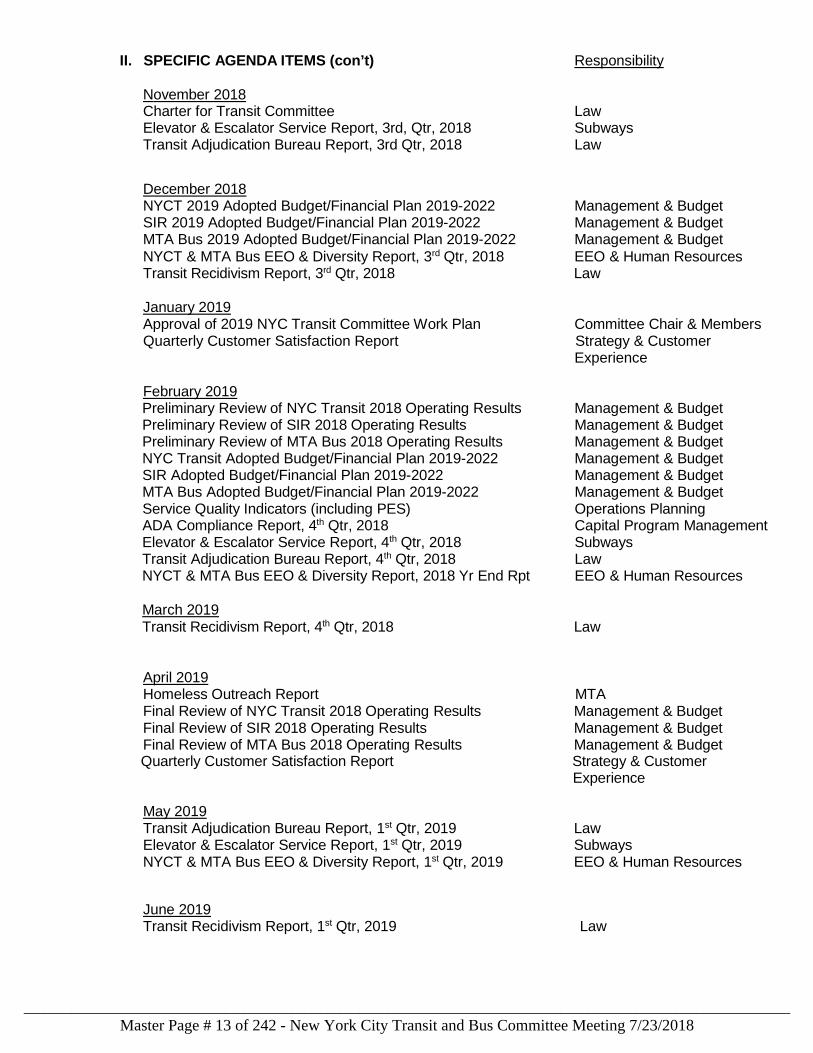
II. SPECIFIC AGENDA ITEMS (con’t) Responsibility November 2018 Charter for Transit Committee Law Elevator & Escalator Service Report, 3rd, Qtr, 2018 Subways Transit Adjudication Bureau Report, 3rd Qtr, 2018 Law
December 2018 NYCT 2019 Adopted Budget/Financial Plan 2019-2022 Management & Budget SIR 2019 Adopted Budget/Financial Plan 2019-2022 Management & Budget MTA Bus 2019 Adopted Budget/Financial Plan 2019-2022 Management & Budget
NYCT & MTA Bus EEO & Diversity Report, 3rd Qtr, 2018 EEO & Human Resources Transit Recidivism Report, 3rd Qtr, 2018 Law January 2019 Approval of 2019 NYC Transit Committee Work Plan Committee Chair & Members Quarterly Customer Satisfaction Report Strategy & Customer
Experience
February 2019 Preliminary Review of NYC Transit 2018 Operating Results Management & Budget Preliminary Review of SIR 2018 Operating Results Management & Budget Preliminary Review of MTA Bus 2018 Operating Results Management & Budget NYC Transit Adopted Budget/Financial Plan 2019-2022 Management & Budget SIR Adopted Budget/Financial Plan 2019-2022 Management & Budget MTA Bus Adopted Budget/Financial Plan 2019-2022 Management & Budget Service Quality Indicators (including PES) Operations Planning ADA Compliance Report, 4th Qtr, 2018 Capital Program Management Elevator & Escalator Service Report, 4th Qtr, 2018 Subways Transit Adjudication Bureau Report, 4th Qtr, 2018 Law NYCT & MTA Bus EEO & Diversity Report, 2018 Yr End Rpt EEO & Human Resources March 2019 Transit Recidivism Report, 4th Qtr, 2018 Law April 2019 Homeless Outreach Report MTA Final Review of NYC Transit 2018 Operating Results Management & Budget Final Review of SIR 2018 Operating Results Management & Budget Final Review of MTA Bus 2018 Operating Results Management & Budget
Quarterly Customer Satisfaction Report Strategy & Customer Experience
May 2019 Transit Adjudication Bureau Report, 1st Qtr, 2019 Law Elevator & Escalator Service Report, 1st Qtr, 2019 Subways NYCT & MTA Bus EEO & Diversity Report, 1st Qtr, 2019 EEO & Human Resources
June 2019 Transit Recidivism Report, 1st Qtr, 2019 Law
Master Page # 13 of 242 - New York City Transit and Bus Committee Meeting 7/23/2018________________________________________________________________________________
2018 Transit & Bus Committee Work Plan Detailed Summary
I. RECURRING
Approval of Minutes An official record of proceedings which occurred during the previous month’s Committee meeting.
NYC Transit Work Plan A monthly update of any edits and/or changes in the work plan.
Operations Performance Summary Summary presentation on the performance of Subway Service, including a discussion on Safety, Finance and Ridership and Capital Program Plan achievements. Information includes discussion on key indicators such as Subway MDBF, On-Time Performance, Subway accident rates; and Capital Plan awards, design starts and completions.
Procurements List of procurement action items requiring Board approval and items for Committee and Board information. The Non-Competitive items will be first, followed by the Competitive items and then the Ratifications. The list will include items that need a 2/3 vote of the Board for approval.
MTACC Projects Report Monthly Status Report on each construction project and contract managed by MTA Capital Construction.
MetroCard Report Status Report on progress related to the implementation of the MetroCard fare collection system. Report provides information on MetroCard market share, the Reduced Fare Program, MetroCard sales initiatives and the Balance Protection Program.
Service Changes Service proposals presented for Committee information and for Board approval, when required. Proposals outline various subway service initiatives.
Tariff Changes Proposals presented to the Board for approval of changes affecting NYC Transit fare policy structure.
Capital Budget Modifications Proposals presented to the Board for approval of changes to NYC Transit’s 5-Year Capital Program.
Action Items Staff summary documents presented to the Board for approval of items affecting business standards and practices.
Master Page # 14 of 242 - New York City Transit and Bus Committee Meeting 7/23/2018________________________________________________________________________________
II. SPECIFIC AGENDA ITEMS (con’t)
JULY 2018
No Agenda Items AUGUST 2018 No Meetings Held
SEPTEMBER 2018 2018 NYC Transit Mid-Year Forecast Monthly Allocation NYC Transit will present a monthly allocation of its 2018 Mid-Year Forecast including revenues/receipts, expenses/expenditures, ridership and positions to the Committee. 2018 SIR Mid-Year Forecast Monthly Allocation NYC Transit will present a monthly allocation of SIR’s 2018 Mid-Year Forecast including revenues/receipts, expenses/expenditures, ridership and positions to the Committee. 2018 MTA Bus Mid-Year Forecast Monthly Allocation MTA Bus will present its monthly allocation of MTA Bus’ 2018 Mid-Year Forecast including revenues/receipts, expenses/expenditures, ridership and positions to the Committee. 2019 NYC Transit Preliminary Budget Public comments will be accepted on the 2019 Preliminary Budget.
2019 SIR Preliminary Budget Public comments will be accepted on the 2019 Preliminary Budget. 2019 MTA Bus Preliminary Budget Public comments will be accepted on the 2019 Preliminary Budget.
Service Quality Indicators/PES Report Bi-annual report which presents subway and bus service indicators (Wait Assessment) and NYC Transit and MTA Bus Passenger Environment Survey results, which measures subway and bus cleanliness, customer information and operations. Elevator & Escalator Service Report, 2nd Qtr, 2018 Quarterly report to the Committee on system wide reliability and availability goal for elevators and escalators throughout the subway system. Transit Adjudication Bureau Report, 2nd Qtr, 2018 Quarterly report to the Committee on Transit Adjudication Bureau financial and operating indicators including collection activities and data on revenue and expenses. EEO & Diversity Report, 2nd Qtr, 2018 Quarterly report to the Committee providing data on key EEO and Human Resources indicators relating to NYCT’s and MTA Bus’ Equal Employment Opportunity and Diversity efforts.
Master Page # 15 of 242 - New York City Transit and Bus Committee Meeting 7/23/2018________________________________________________________________________________
II. SPECIFIC AGENDA ITEMS (con’t)
Transit Recidivism Report, 2nd Qtr, 2018 Quarterly report to the Committee which provides statistical information on recidivist arrest data and discusses NYC Transit’s efforts, working in conjunction with the various District Attorney Offices and the Courts, to address recidivist crime on the system.
OCTOBER 2018 Homeless Outreach Report MTA report on progress with homeless outreach efforts. 2019 NYC Transit Preliminary Budget Public comments will be accepted on the 2019 Preliminary Budget.
2019 SIR Preliminary Budget
Public comments will be accepted on the SIR 2019 Preliminary Budget.
2019 MTA Bus Preliminary Budget Public comments will be accepted on the MTA Bus 2019 Preliminary Budget. Quarterly Customer Satisfaction Report Quarterly presentation of customer satisfaction ratings about NYCT's bus, subway, and paratransit services. Report will identify trends from customer surveys results about key indicators and attributes that define the customer experience.
NOVEMBER 2018
Charter for Transit Committee Once annually, the NYC Transit Committee will be presented with the Committee Charter and will be asked to formally adopt it for use.
Elevator & Escalator Service Report, 3rd Qtr, 2018 Quarterly report to the Committee on system wide reliability and availability goal for elevators and escalators throughout the subway system.
Transit Adjudication Bureau Report, 3rd Qtr, 2018 Quarterly report to the Committee on Transit Adjudication Bureau financial and operating indicators including collection activities and data on revenue and expenses.
DECEMBER 2018
NYCT 2019 Adopted Budget/Financial Plan 2019-2022 NYC Transit will present its revised 2019-2022 Financial Plan. This plan will reflect the 2019 Adopted Budget and an updated Financial Plan for 2019-2022 reflecting the out- year impact of any changes incorporated into the 2019 Adopted Budget. The documents will also include a monthly allocation of planned expenditures for 2019 by category.
Master Page # 16 of 242 - New York City Transit and Bus Committee Meeting 7/23/2018________________________________________________________________________________
II. SPECIFIC AGENDA ITEMS (con’t)
SIR 2019 Adopted Budget/Financial Plan 2019-2022 NYC Transit will present SIR’s revised 2019-2022 Financial Plan. This plan will reflect the 2019 Adopted Budget and an updated Financial Plan for 2019-2022 reflecting the out-year impact of any changes incorporated into the 2019 Adopted Budget. The documents will also include a monthly allocation of planned expenditures for 2019 by category. MTA Bus 2019 Adopted Budget/Financial Plan 2019-2022 MTA Bus will present its revised 2019-2022 Financial Plan. This plan will reflect the 2019 Adopted Budget and an updated Financial Plan for 2019-2022 reflecting the out- year impact of any changes incorporated into the 2019 Adopted Budget. The documents will also include a monthly allocation of planned expenditures for 2019 by category.
EEO & Diversity Report, 3rd Qtr, 2018 Quarterly report to the Committee providing data on key EEO and Human Resources indicators relating to NYCT’s and MTA Bus’ Equal Employment Opportunity and Diversity efforts. Transit Recidivism Report, 3rd Qtr, 2018 Quarterly report to the Committee which provides statistical information on recidivist arrest data and discusses NYC Transit’s efforts, working in conjunction with the various District Attorney Offices and the Courts, to address recidivist crime on the system.
JANUARY 2019
Approval of Committee Work Plan The Committee will be provided with the work plan for 2019 and will be asked to approve its use for the year. Quarterly Customer Satisfaction Report Quarterly presentation of customer satisfaction ratings about NYCT's bus, subway, and paratransit services. Report will identify trends from customer surveys results about key indicators and attributes that define the customer experience. FEBRUARY 2019
Preliminary Review of NYC Transit’s 2018 Operating Results NYC Transit will present a brief review of its 2018 Budget results.
Preliminary Review of SIR 2018 Operating Results NYC Transit will present a brief review of SIR’s 2018 Budget results.
Preliminary Review of MTA Bus 2018 Operating Results MTA Bus will present a brief review of its 2018 Budget results.
Adopted Budget/Financial Plan 2019-2022 NYC Transit will present its revised 2019-2022 Financial Plan. This plan will reflect the 2019 Adopted Budget and an updated Financial Plan for 2019-2022 reflecting the out- year impact of any changes incorporated into the 2018 Adopted Budget. The documents will also include a monthly allocation of planned expenditures for 2019 by category.
Master Page # 17 of 242 - New York City Transit and Bus Committee Meeting 7/23/2018________________________________________________________________________________
II. SPECIFIC AGENDA ITEMS (con’t)
SIR Adopted Budget/Financial Plan 2019-2022 NYC Transit will present SIR’s revised 2019-2022 Financial Plan. This plan will reflect the 2019 Adopted Budget and an updated Financial Plan for 2019-2022 reflecting the out-year impact of any changes incorporated into the 2018 Adopted Budget. The documents will also include a monthly allocation of planned expenditures for 2019 by category.
TA Bus Adopted Budget/Financial Plan 2019-2022 MTA Bus will present its revised 2019-2022 Financial Plan. This plan will reflect the 2019 Adopted Budget and an updated Financial Plan for 2019-2022 reflecting the out-year impact of any changes incorporated into the 2018 Adopted Budget. The documents will also include a monthly allocation of planned expenditures for 2019 by category.
Service Quality Indicators/PES Report Bi-annual report which presents subway and bus service indicators (Wait Assessment) and NYC Transit and MTA Bus Passenger Environment Survey results, which measures subway and bus cleanliness, customer information and operations.
ADA Compliance Report, 4th Qtr, 2018 The annual update to the NYC Transit Committee on the status of compliance with the Americans with Disabilities Act (ADA) at New York City Transit. The report summarizes activities for compliance including, rehabilitation of key stations and ADA requirements in bus and subway transportation.
Elevator & Escalator Service Report, 4th Qtr, 2018 Quarterly report to the Committee on system wide reliability and availability goal for elevators and escalators throughout the subway system.
Transit Adjudication Bureau Report, 4th Qtr, 2018 Quarterly report to the Committee on Transit Adjudication Bureau financial and operating indicators including collection activities and data on revenue and expenses.
EEO & Diversity Report- 2018 Year-End Report A detailed year-end 2018 report to the committee providing data on key EEO and Human Resources indicators relating to NYCT’s and MTA Bus’ Equal Employment Opportunity and Diversity efforts.
MARCH 2019 Transit Recidivism Report, 4th Qtr, 2018 Quarterly report to the Committee which provides statistical information on recidivist arrest data and discusses NYC Transit’s efforts, working in conjunction with the various District Attorney Offices and the Courts, to address recidivist crime on the system.
APRIL 2019 Homeless Outreach Report MTA report on progress with homeless outreach efforts.
Master Page # 18 of 242 - New York City Transit and Bus Committee Meeting 7/23/2018
________________________________________________________________________________
II. SPECIFIC AGENDA ITEMS (con’t)
Final Review of NYC Transit 2018 Operating Results NYC Transit will review the prior year’s budget results and their implications for current and future budget performance will be presented to the Committee.
Final Review of SIR 2018 Operating Results NYC Transit will review SIR’s prior year’s budget results and their implications for current and future budget performance will be presented to the Committee.
Final Review of MTA Bus 2018 Operating Results MTA Bus will review its prior year’s budget results and their implications for current and future budget performance will be presented to the Committee. Quarterly Customer Satisfaction Report Quarterly presentation of customer satisfaction ratings about NYCT's bus, subway, and paratransit services. Report will identify trends from customer surveys results about key indicators and attributes that define the customer experience. MAY 2019
Transit Adjudication Bureau Report, 1st Qtr, 2019 Quarterly report to the Committee on Transit Adjudication Bureau financial and operating indicators including collection activities and data on revenue and expenses.
Elevator & Escalator Service Report, 1st Qtr, 2019 Quarterly report to the Committee on system wide reliability and availability goal for elevators and escalators throughout the subway system.
EEO & Diversity Report, 1st Qtr, 2019 Quarterly report to the Committee providing data on key EEO and Human Resources indicators relating to NYCT’s and MTA Bus’ Equal Employment Opportunity and Diversity efforts.
JUNE 2019 Transit Recidivism Report, 1st Qtr, 2019 Quarterly report to the Committee which provides statistical information on recidivist arrest data and discusses NYC Transit’s efforts, working in conjunction with the various District Attorney Offices and the Courts, to address recidivist crime on the system.
Master Page # 19 of 242 - New York City Transit and Bus Committee Meeting 7/23/2018________________________________________________________________________________
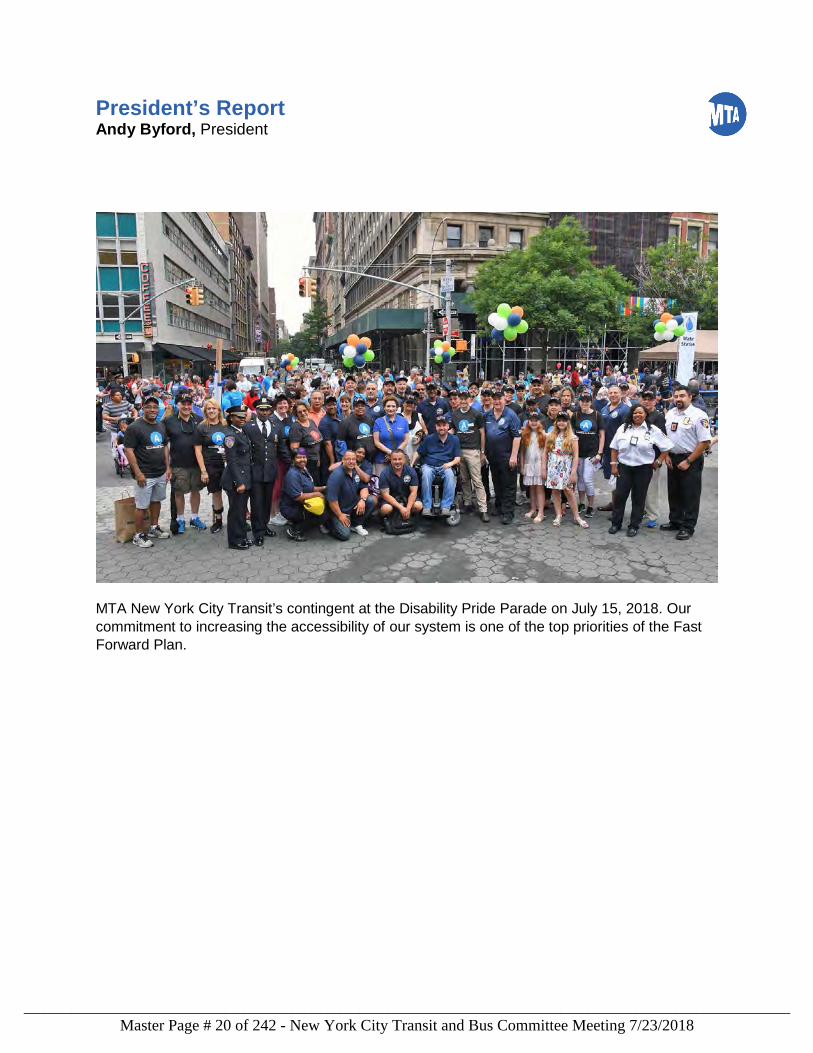
President’s Report Andy Byford, President
MTA New York City Transit’s contingent at the Disability Pride Parade on July 15, 2018. Our
commitment to increasing the accessibility of our system is one of the top priorities of the Fast
Forward Plan.
Master Page # 20 of 242 - New York City Transit and Bus Committee Meeting 7/23/2018________________________________________________________________________________
President’s Commentary
The last four weeks have seen further intense activity as we start delivery of our Fast Forward modernization plan.
While the big-ticket items such as resignalling the subway require substantial, additional investment, many improvements can be delivered starting immediately and at minimal cost. With that in mind, I have focused my team on delivery of tangible improvements that customers will notice between now and year-end.
This week, the Chief Customer Officer will launch Transit’s inaugural Customer Commitment, a suite of time-bound, tangible improvements that we will deliver over the next 12 weeks. Consistent with the foundation of accountability that runs through Fast Forward, we will publicly report progress against each and every one of the commitments at the end of the quarter, a pattern that will be repeated on a quarterly basis, going forward.
I felt that it was important for Transit to sign up to a public-facing commitment because it demonstrates that we are serious about improving service. By making such a public promise, we are also demonstrating confidence in our ability to deliver and a willingness to be held accountable.
Obviously, the most important thing to get right is delivery of safe, punctual and reliable transit and much effort is being put into achieving that, details of which follow in this customer service report.
Continuing on that same theme of better management and accountability, recruitment of the new Group Station Manager (GSM) team is progressing well, along with the Superintendents to support them in their respective groups. In parallel, we are finalizing arrangements for the customer service and maintenance arms of the GSM team that will transform the way we manage our stations.
Progress is also being made on other key elements of our plan. A supplier conference will take place later this month to engage signaling, rolling stock, new technology and finance houses in the upcoming mega-project of expedited resignalling of the subway. The conference will set out the opportunities available to prospective bidders, and we shall outline the fresh approach that has enabled us to cut the timeframe to resignalling the NYC Subway by 75%.
On the buses, everything is being finalized for the launch of the new Staten Island express bus network and work is under way to make further process improvements to Access-A-Ride services.
Meanwhile, work continues in partnership with NYC Department of Transportation colleagues to finalize the alternate service plan for next year’s reconstruction of the L line East River tunnel.
Finally, I was honored to join around 100 colleagues from Transit including Ronnie Hakim, our Managing Director and Alex Elegudin, Senior Adviser for Systemwide Accessibility, on this year’s Disability Pride march.
Andy Byford President, New York City Transit
Master Page # 21 of 242 - New York City Transit and Bus Committee Meeting 7/23/2018________________________________________________________________________________
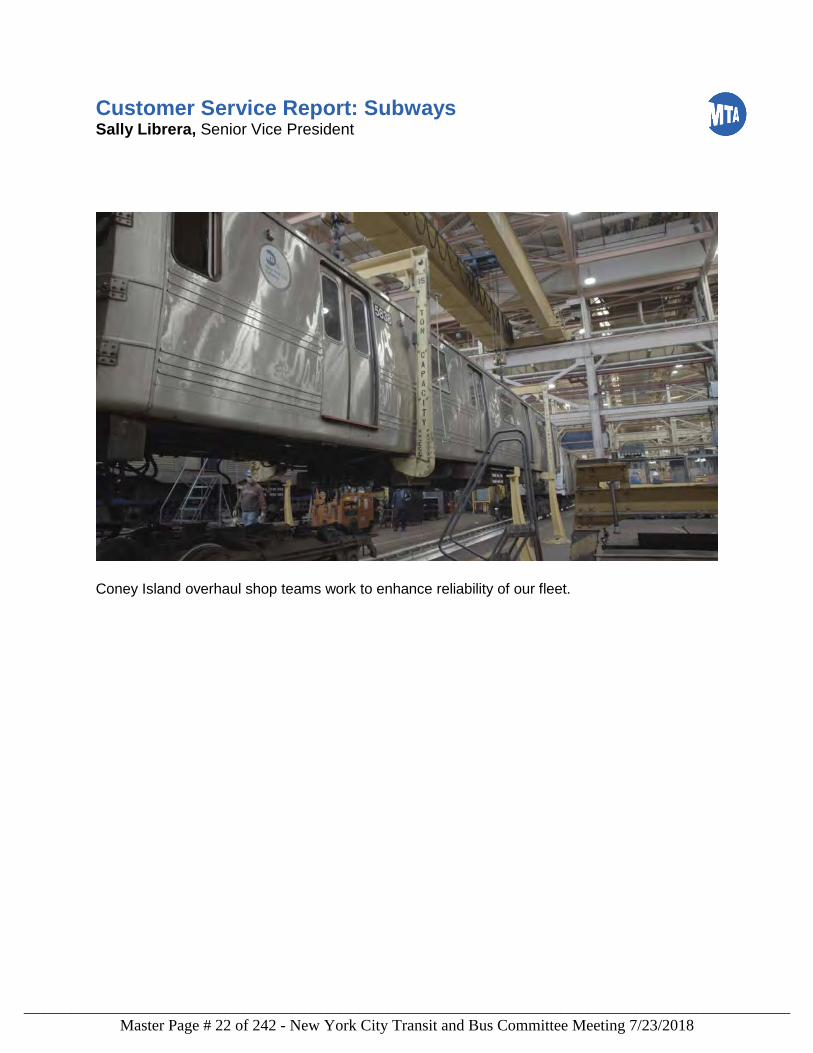
Customer Service Report: Subways Sally Librera, Senior Vice President
Coney Island overhaul shop teams work to enhance reliability of our fleet.
Master Page # 22 of 242 - New York City Transit and Bus Committee Meeting 7/23/2018________________________________________________________________________________
June 2018 Highlights: Department of Subways
In June, Subways completed repair and resiliency work in the Clark Street tunnel, on time and on budget, allowing 2 and 3 service to resume on weekends. In 2012, Superstorm Sandy flooded the tunnel with more than half a million gallons of corrosive salt water, damaging electrical conduit, pump rooms, communications systems, track, and signal equipment. As part of our recovery and resiliency project for this tunnel, damaged equipment was replaced, while new measures were added to protect systems from future flooding. The Clark Street tunnel was the seventh under-river tunnel to be repaired since Sandy, and planning is well underway for the largest Sandy project to date – the reconstruction of the L line tunnel to begin in 2019.
During the month of June, our customer-focused metrics showed positive results from the many efforts underway to improve subway service. Additional Platform Time and Additional Train Time, which measure the average additional time (compared to the schedule) that customers experience waiting for and riding trains have been steadily improving since the beginning of 2018. Both measures improved more than 20% compared to a year ago. Service Delivered – the percentage of scheduled rush hour trains that operate – has shown a similar positive trend, reaching the highest level since we began reporting the measure last year.
These performance improvements are the result of ongoing efforts to reduce the number of major incidents, improve the response time to the incidents that do occur, and implement more accurate schedules. This month, we experienced nine weekday major track incidents and 18 weekday major signal incidents, the lowest numbers we’ve seen in 2018. Partially offsetting this improvement, there were 17 major incidents requiring police or medical response, including persons on the right of way, an unusually high number for this category. Our response time to major incidents has improved, reducing the average number of trains delayed per major incident to 98 from 122 a year ago. At the same time, new schedules implemented on the 2, 3, 4, and 5 lines this spring are allowing trains to more reliably complete their scheduled trips.
As discussed at Committee last month, Subways has completed the integration of our delay databases, and this month’s report includes a new table with more accurate and descriptive categories. A key initiative of the Fast Forward plan is to better understand the root causes of delays, and we are working to further refine the delay categories. This initiative will include a particular focus on delays related to the operating environment and will allow Subways to analyze and address underlying issues in this area that have affected performance. This is similar to the analyses we have done for delays related to incidents.
Finally, we are excited about our new vacuum trains, the first of which arrived last month. The high-powered vacuums improve the appearance of the tracks, prevent flooding and track fires related to litter, and remove steel dust that can affect the signal system. We’ve made great strides improving track cleanliness through the Subway Action Plan, and the vacuum trains will allow us to further improve and maintain that standard going forward.
Sally Librera Senior Vice President, Department of Subways
Master Page # 23 of 242 - New York City Transit and Bus Committee Meeting 7/23/2018________________________________________________________________________________
Current Month: June 2018 12-Month Average
This Year Last Year % Diff This Year Last Year % Diff
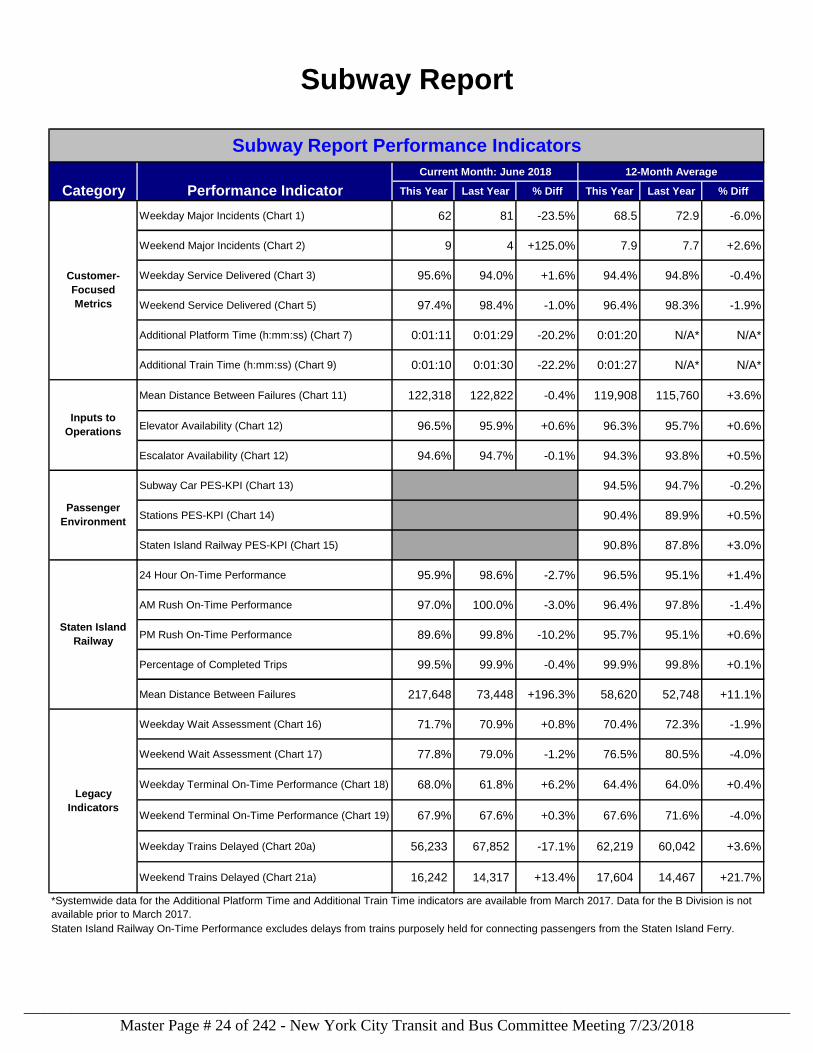
Weekday Major Incidents (Chart 1) 62 81 -23.5% 68.5 72.9 -6.0%
Weekend Major Incidents (Chart 2) 9 4 +125.0% 7.9 7.7 +2.6%
Weekday Service Delivered (Chart 3) 95.6% 94.0% +1.6% 94.4% 94.8% -0.4%
Weekend Service Delivered (Chart 5) 97.4% 98.4% -1.0% 96.4% 98.3% -1.9%
Additional Platform Time (h:mm:ss) (Chart 7) 0:01:11 0:01:29 -20.2% 0:01:20 N/A* N/A*
Additional Train Time (h:mm:ss) (Chart 9) 0:01:10 0:01:30 -22.2% 0:01:27 N/A* N/A*
Mean Distance Between Failures (Chart 11) 122,318 122,822 -0.4% 119,908 115,760 +3.6%
Elevator Availability (Chart 12) 96.5% 95.9% +0.6% 96.3% 95.7% +0.6%
Escalator Availability (Chart 12) 94.6% 94.7% -0.1% 94.3% 93.8% +0.5%
Subway Car PES-KPI (Chart 13) 94.5% 94.7% -0.2%
Stations PES-KPI (Chart 14) 90.4% 89.9% +0.5%
Staten Island Railway PES-KPI (Chart 15) 90.8% 87.8% +3.0%
24 Hour On-Time Performance 95.9% 98.6% -2.7% 96.5% 95.1% +1.4%
AM Rush On-Time Performance 97.0% 100.0% -3.0% 96.4% 97.8% -1.4%
PM Rush On-Time Performance 89.6% 99.8% -10.2% 95.7% 95.1% +0.6%
Percentage of Completed Trips 99.5% 99.9% -0.4% 99.9% 99.8% +0.1%
Mean Distance Between Failures 217,648 73,448 +196.3% 58,620 52,748 +11.1%
Weekday Wait Assessment (Chart 16) 71.7% 70.9% +0.8% 70.4% 72.3% -1.9%
Weekend Wait Assessment (Chart 17) 77.8% 79.0% -1.2% 76.5% 80.5% -4.0%
Weekday Terminal On-Time Performance (Chart 18) 68.0% 61.8% +6.2% 64.4% 64.0% +0.4%
Weekend Terminal On-Time Performance (Chart 19) 67.9% 67.6% +0.3% 67.6% 71.6% -4.0%
Weekday Trains Delayed (Chart 20a) 56,233 67,852 -17.1% 62,219 60,042 +3.6%
Weekend Trains Delayed (Chart 21a) 16,242 14,317 +13.4% 17,604 14,467 +21.7%
Legacy
Indicators
*Systemwide data for the Additional Platform Time and Additional Train Time indicators are available from March 2017. Data for the B Division is not
available prior to March 2017.
Staten Island Railway On-Time Performance excludes delays from trains purposely held for connecting passengers from the Staten Island Ferry.
Staten Island
Railway
Subway Report
Performance Indicator
Subway Report Performance Indicators
Category
Customer-
Focused
Metrics
Inputs to
Operations
Passenger
Environment
Master Page # 24 of 242 - New York City Transit and Bus Committee Meeting 7/23/2018________________________________________________________________________________
Performance Indicator Definitions
Major Incidents (Weekday and Weekend)
Service Delivered (Weekday and Weekend)
Additional Platform Time (APT)
Additional Train Time (ATT)
The average additional unanticipated time customers spend onboard the train due to various
service issues. Additional Train Time is measured using a combination of customers’
MetroCard entry data into their starting stations and customers’ arrival times at their
destination stations, using information from the real-time train tracking technologies that
provide train arrival information. Data for the B Division is not available prior to March 2017.
APT and ATT use ATS-A data (historical data available) for the A Division and beacon data
calibrated with other sources for the B Division. B Division data is not available prior to
March 2017. These are beta metrics and may change with further development.
Section 1: Customer-Focused Metrics
The metrics in this section measure subway performance as it affects our passengers. By
focusing on how many disruptive incidents have occurred in the subway, how closely actual
service matches schedules, and how much longer passengers must wait and ride compared
to schedules, these measures collectively reflect the customer experience.
An unplanned incident that delays 50 or more trains. Major incidents are separated into six
categories: Track, Signals, Persons on Trackbed/Police/Medical, Stations & Structures,
Subway Car and Other.
Measures NYCT’s ability to deliver the service that’s scheduled. Service Delivered is
measured along the busiest part of the line, which reflects service across the entire line, and
is reported as the percentage of scheduled trains that are provided during the following
times:
• Weekday Peak Hours – 7 a.m. to 10 a.m. and 4 p.m. to 7 p.m.
• Weekends - 10 a.m. to 6 p.m.
The average added time that customers spend waiting on the platform for a train, compared
with their scheduled wait time. Additional Platform Time is measured using a combination of
customers’ MetroCard entry data into stations and train departure times from those stations,
using information from the real-time train tracking technologies that provide train arrival
information. Data for the B Division is not available prior to March 2017.
Master Page # 25 of 242 - New York City Transit and Bus Committee Meeting 7/23/2018________________________________________________________________________________
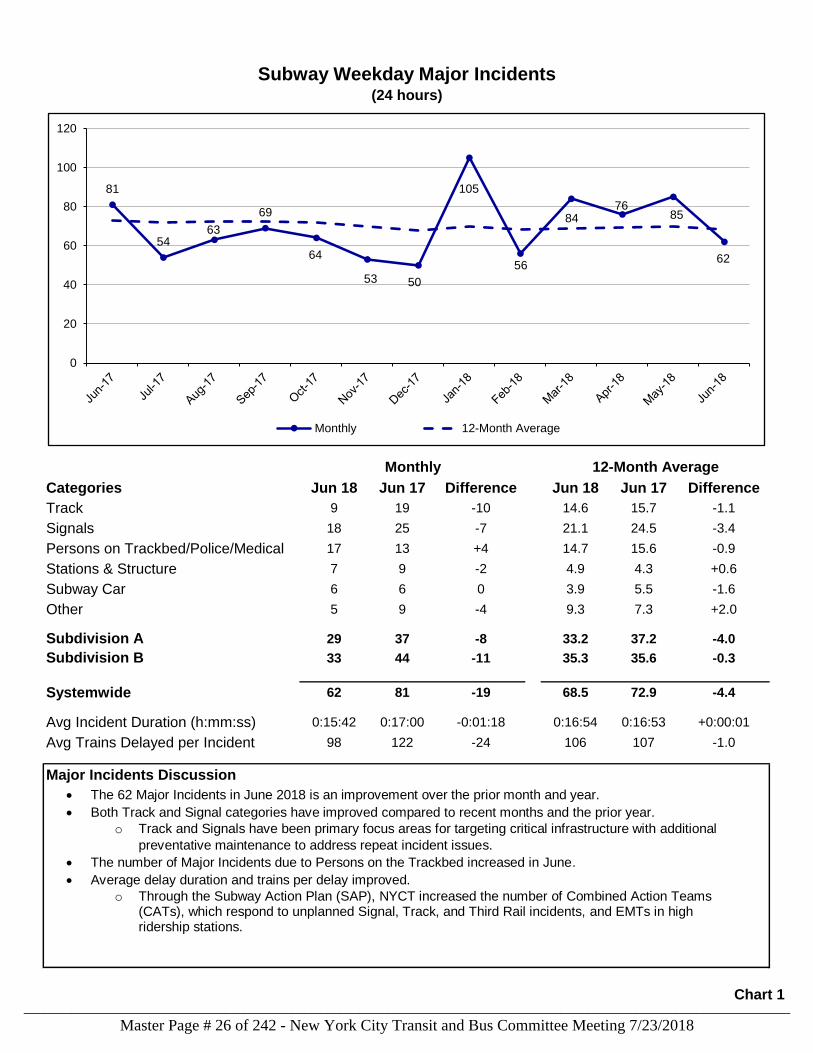
Categories Jun 18 Jun 17 Difference Jun 18 Jun 17 Difference
Track 9 19 -10 14.6 15.7 -1.1
Signals 18 25 -7 21.1 24.5 -3.4
Persons on Trackbed/Police/Medical 17 13 +4 14.7 15.6 -0.9
Stations & Structure 7 9 -2 4.9 4.3 +0.6
Subway Car 6 6 0 3.9 5.5 -1.6
Other 5 9 -4 9.3 7.3 +2.0
Subdivision A 29 37 -8 33.2 37.2 -4.0
Subdivision B 33 44 -11 35.3 35.6 -0.3
Systemwide 62 81 -19 68.5 72.9 -4.4
Avg Incident Duration (h:mm:ss) 0:15:42 0:17:00 -0:01:18 0:16:54 0:16:53 +0:00:01
Avg Trains Delayed per Incident 98 122 -24 106 107 -1.0
Major Incidents Discussion
Subway Weekday Major Incidents(24 hours)
12-Month AverageMonthly
81
5463
69
64
53 50
105
56
8476
85
62
0
20
40
60
80
100
120
Monthly 12-Month Average
The 62 Major Incidents in June 2018 is an improvement over the prior month and year.
Both Track and Signal categories have improved compared to recent months and the prior year.
o Track and Signals have been primary focus areas for targeting critical infrastructure with additional
preventative maintenance to address repeat incident issues.
The number of Major Incidents due to Persons on the Trackbed increased in June.
Average delay duration and trains per delay improved.
o Through the Subway Action Plan (SAP), NYCT increased the number of Combined Action Teams (CATs), which respond to unplanned Signal, Track, and Third Rail incidents, and EMTs in high ridership stations.
Chart 1
Master Page # 26 of 242 - New York City Transit and Bus Committee Meeting 7/23/2018________________________________________________________________________________
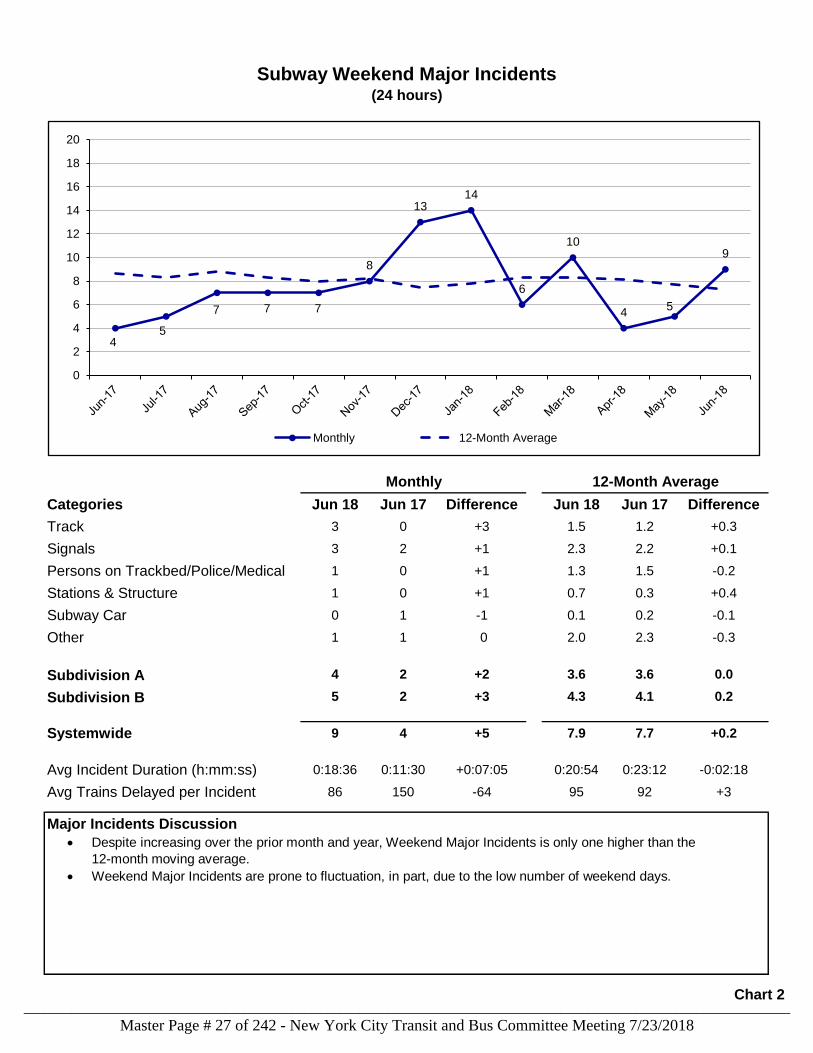
Categories Jun 18 Jun 17 Difference Jun 18 Jun 17 Difference
Track 3 0 +3 1.5 1.2 +0.3
Signals 3 2 +1 2.3 2.2 +0.1
Persons on Trackbed/Police/Medical 1 0 +1 1.3 1.5 -0.2
Stations & Structure 1 0 +1 0.7 0.3 +0.4
Subway Car 0 1 -1 0.1 0.2 -0.1
Other 1 1 0 2.0 2.3 -0.3
Subdivision A 4 2 +2 3.6 3.6 0.0
Subdivision B 5 2 +3 4.3 4.1 0.2
Systemwide 9 4 +5 7.9 7.7 +0.2
Avg Incident Duration (h:mm:ss) 0:18:36 0:11:30 +0:07:05 0:20:54 0:23:12 -0:02:18
Avg Trains Delayed per Incident 86 150 -64 95 92 +3
Major Incidents Discussion
Subway Weekend Major Incidents(24 hours)
Monthly 12-Month Average
45
7 7 7
8
1314
6
10
45
9
0
2
4
6
8
10
12
14
16
18
20
Monthly 12-Month Average
Despite increasing over the prior month and year, Weekend Major Incidents is only one higher than the
12-month moving average.
Weekend Major Incidents are prone to fluctuation, in part, due to the low number of weekend days.
Chart 2
Master Page # 27 of 242 - New York City Transit and Bus Committee Meeting 7/23/2018________________________________________________________________________________
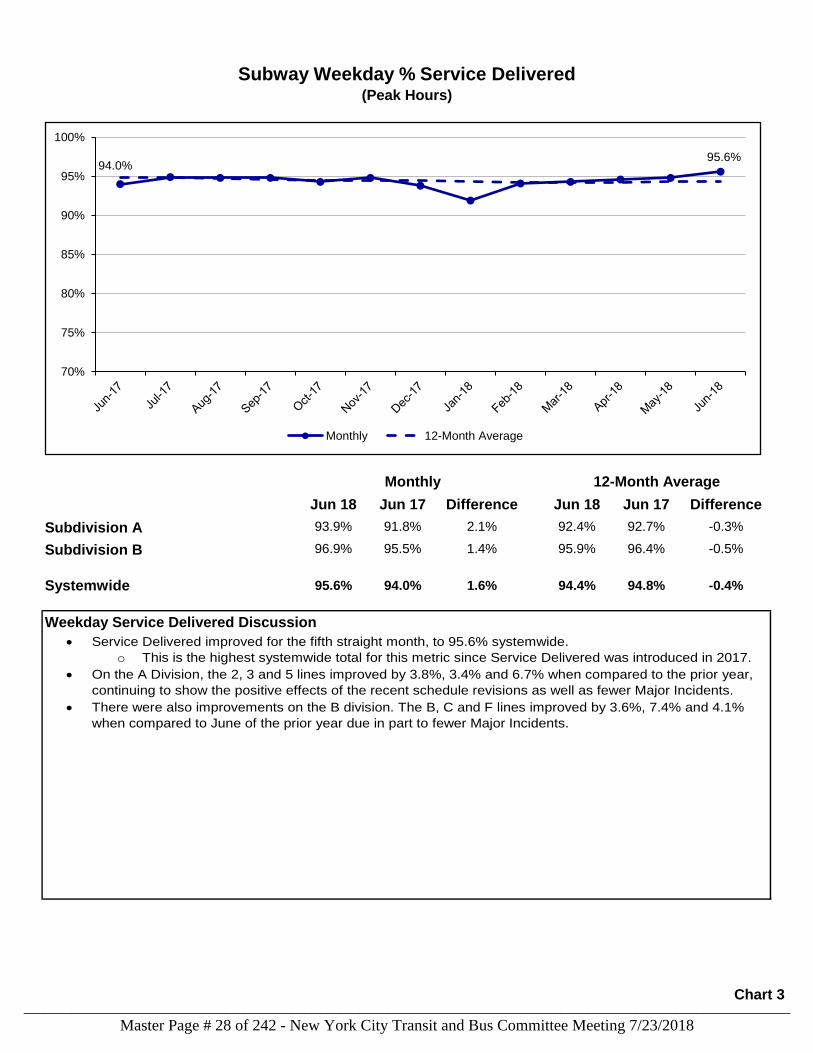
Jun 18 Jun 17 Difference Jun 18 Jun 17 Difference
Subdivision A 93.9% 91.8% 2.1% 92.4% 92.7% -0.3%
Subdivision B 96.9% 95.5% 1.4% 95.9% 96.4% -0.5%
Systemwide 95.6% 94.0% 1.6% 94.4% 94.8% -0.4%
Weekday Service Delivered Discussion
Subway Weekday % Service Delivered(Peak Hours)
Monthly 12-Month Average
94.0%95.6%
70%
75%
80%
85%
90%
95%
100%
Monthly 12-Month Average
Service Delivered improved for the fifth straight month, to 95.6% systemwide.
o This is the highest systemwide total for this metric since Service Delivered was introduced in 2017.
On the A Division, the 2, 3 and 5 lines improved by 3.8%, 3.4% and 6.7% when compared to the prior year,
continuing to show the positive effects of the recent schedule revisions as well as fewer Major Incidents.
There were also improvements on the B division. The B, C and F lines improved by 3.6%, 7.4% and 4.1%
when compared to June of the prior year due in part to fewer Major Incidents.
Chart 3
Master Page # 28 of 242 - New York City Transit and Bus Committee Meeting 7/23/2018________________________________________________________________________________
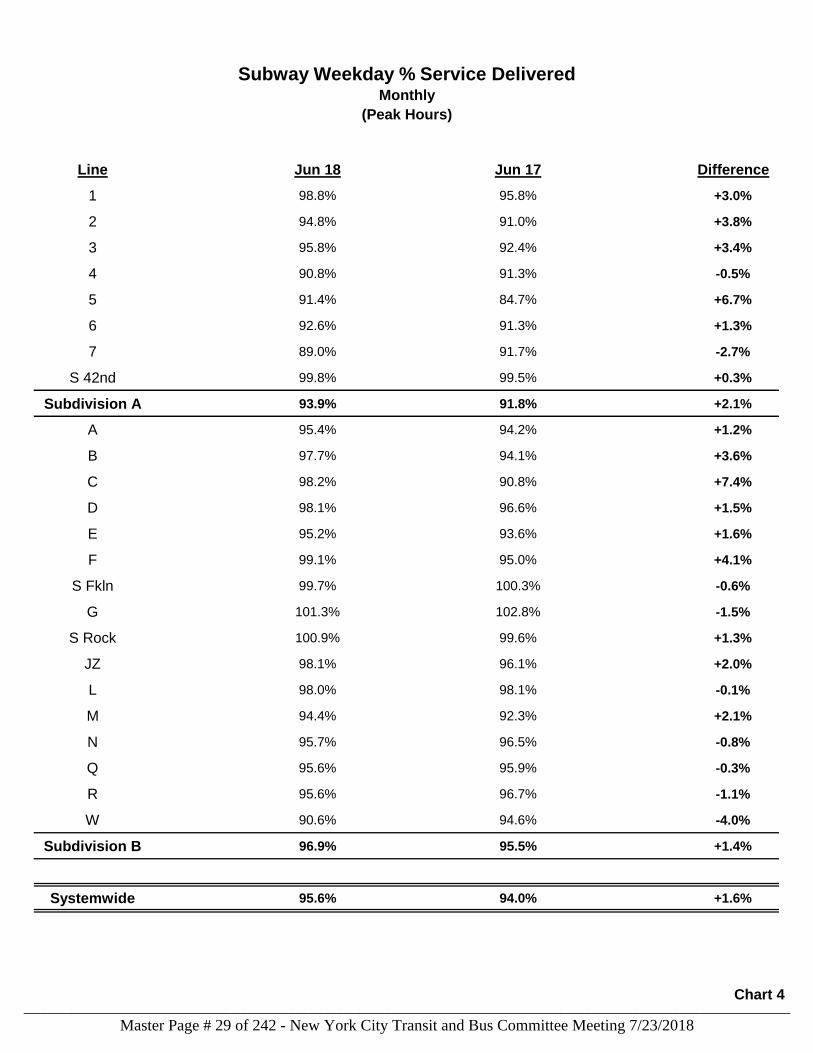
Line Jun 18 Jun 17 Difference
1 98.8% 95.8% +3.0%
2 94.8% 91.0% +3.8%
3 95.8% 92.4% +3.4%
4 90.8% 91.3% -0.5%
5 91.4% 84.7% +6.7%
6 92.6% 91.3% +1.3%
7 89.0% 91.7% -2.7%
S 42nd 99.8% 99.5% +0.3%
Subdivision A 93.9% 91.8% +2.1%
A 95.4% 94.2% +1.2%
B 97.7% 94.1% +3.6%
C 98.2% 90.8% +7.4%
D 98.1% 96.6% +1.5%
E 95.2% 93.6% +1.6%
F 99.1% 95.0% +4.1%
S Fkln 99.7% 100.3% -0.6%
G 101.3% 102.8% -1.5%
S Rock 100.9% 99.6% +1.3%
JZ 98.1% 96.1% +2.0%
L 98.0% 98.1% -0.1%
M 94.4% 92.3% +2.1%
N 95.7% 96.5% -0.8%
Q 95.6% 95.9% -0.3%
R 95.6% 96.7% -1.1%
W 90.6% 94.6% -4.0%
Subdivision B 96.9% 95.5% +1.4%
Systemwide 95.6% 94.0% +1.6%
Subway Weekday % Service DeliveredMonthly
(Peak Hours)
Chart 4
Master Page # 29 of 242 - New York City Transit and Bus Committee Meeting 7/23/2018________________________________________________________________________________
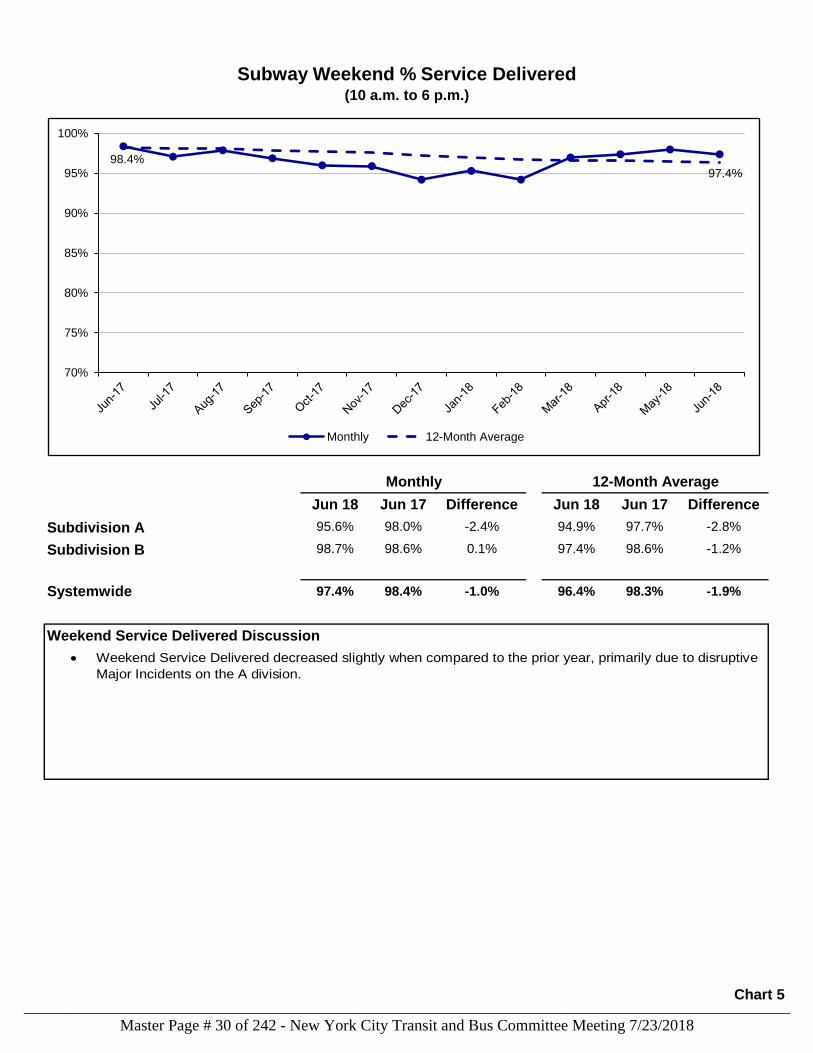
Jun 18 Jun 17 Difference Jun 18 Jun 17 Difference
Subdivision A 95.6% 98.0% -2.4% 94.9% 97.7% -2.8%
Subdivision B 98.7% 98.6% 0.1% 97.4% 98.6% -1.2%
Systemwide 97.4% 98.4% -1.0% 96.4% 98.3% -1.9%
Weekend Service Delivered Discussion
Subway Weekend % Service Delivered(10 a.m. to 6 p.m.)
Monthly 12-Month Average
Add 12 month rolling data
98.4%
97.4%
70%
75%
80%
85%
90%
95%
100%
Monthly 12-Month Average
Weekend Service Delivered decreased slightly when compared to the prior year, primarily due to disruptive
Major Incidents on the A division.
Chart 5
Master Page # 30 of 242 - New York City Transit and Bus Committee Meeting 7/23/2018________________________________________________________________________________
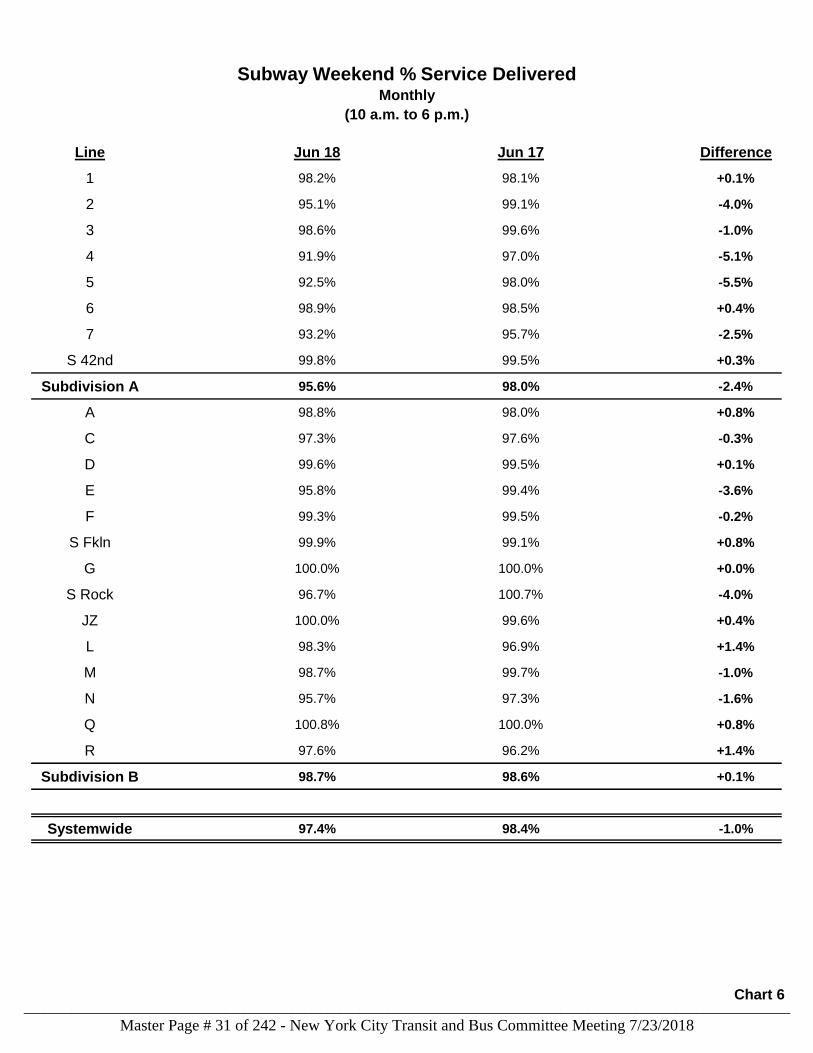
Line Jun 18 Jun 17 Difference
1 98.2% 98.1% +0.1%
2 95.1% 99.1% -4.0%
3 98.6% 99.6% -1.0%
4 91.9% 97.0% -5.1%
5 92.5% 98.0% -5.5%
6 98.9% 98.5% +0.4%
7 93.2% 95.7% -2.5%
S 42nd 99.8% 99.5% +0.3%
Subdivision A 95.6% 98.0% -2.4%
A 98.8% 98.0% +0.8%
C 97.3% 97.6% -0.3%
D 99.6% 99.5% +0.1%
E 95.8% 99.4% -3.6%
F 99.3% 99.5% -0.2%
S Fkln 99.9% 99.1% +0.8%
G 100.0% 100.0% +0.0%
S Rock 96.7% 100.7% -4.0%
JZ 100.0% 99.6% +0.4%
L 98.3% 96.9% +1.4%
M 98.7% 99.7% -1.0%
N 95.7% 97.3% -1.6%
Q 100.8% 100.0% +0.8%
R 97.6% 96.2% +1.4%
Subdivision B 98.7% 98.6% +0.1%
Systemwide 97.4% 98.4% -1.0%
Subway Weekend % Service DeliveredMonthly
(10 a.m. to 6 p.m.)
Chart 6
Master Page # 31 of 242 - New York City Transit and Bus Committee Meeting 7/23/2018________________________________________________________________________________
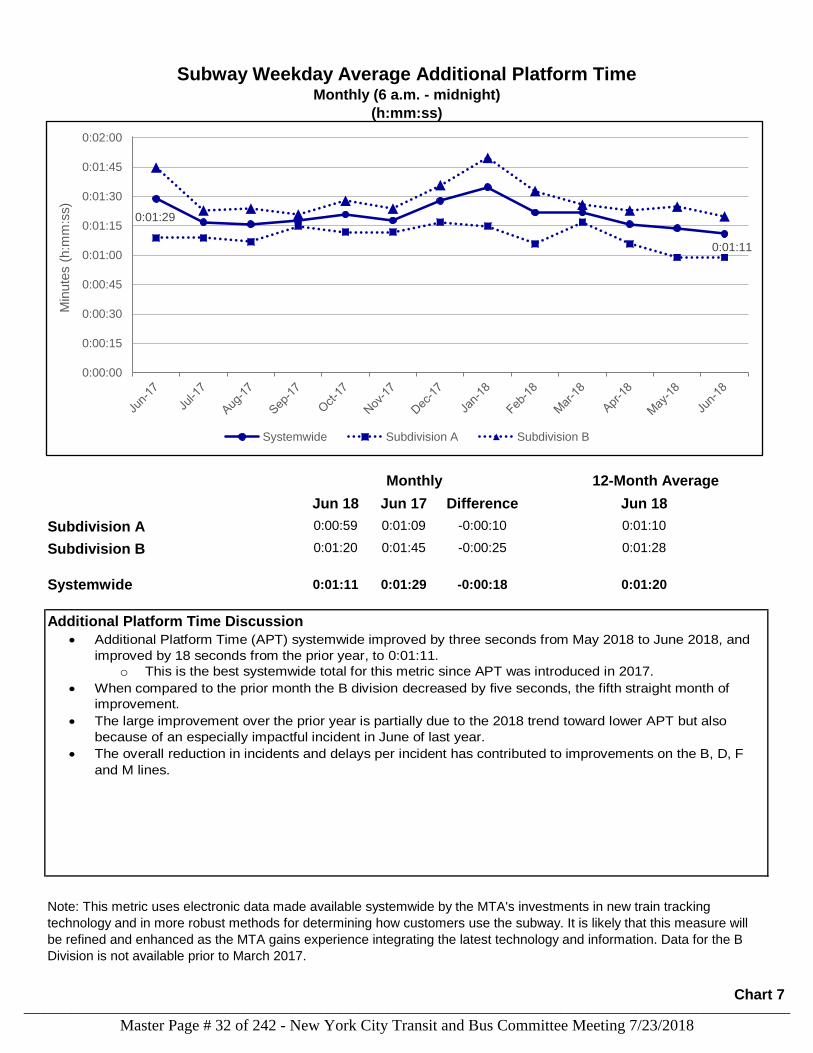
Jun 18 Jun 17 Difference Jun 18
Subdivision A 0:00:59 0:01:09 -0:00:10 0:01:10
Subdivision B 0:01:20 0:01:45 -0:00:25 0:01:28
Systemwide 0:01:11 0:01:29 -0:00:18 0:01:20
Additional Platform Time Discussion
Note: This metric uses electronic data made available systemwide by the MTA's investments in new train tracking
technology and in more robust methods for determining how customers use the subway. It is likely that this measure will
be refined and enhanced as the MTA gains experience integrating the latest technology and information. Data for the B
Division is not available prior to March 2017.
Subway Weekday Average Additional Platform Time
(h:mm:ss)
Monthly 12-Month Average
Monthly (6 a.m. - midnight)
0:01:29
0:01:11
0:00:00
0:00:15
0:00:30
0:00:45
0:01:00
0:01:15
0:01:30
0:01:45
0:02:00
Min
ute
s (
h:m
m:s
s)
Systemwide Subdivision A Subdivision B
Additional Platform Time (APT) systemwide improved by three seconds from May 2018 to June 2018, and
improved by 18 seconds from the prior year, to 0:01:11.
o This is the best systemwide total for this metric since APT was introduced in 2017.
When compared to the prior month the B division decreased by five seconds, the fifth straight month of
improvement.
The large improvement over the prior year is partially due to the 2018 trend toward lower APT but also
because of an especially impactful incident in June of last year.
The overall reduction in incidents and delays per incident has contributed to improvements on the B, D, F
and M lines.
Chart 7
Master Page # 32 of 242 - New York City Transit and Bus Committee Meeting 7/23/2018________________________________________________________________________________
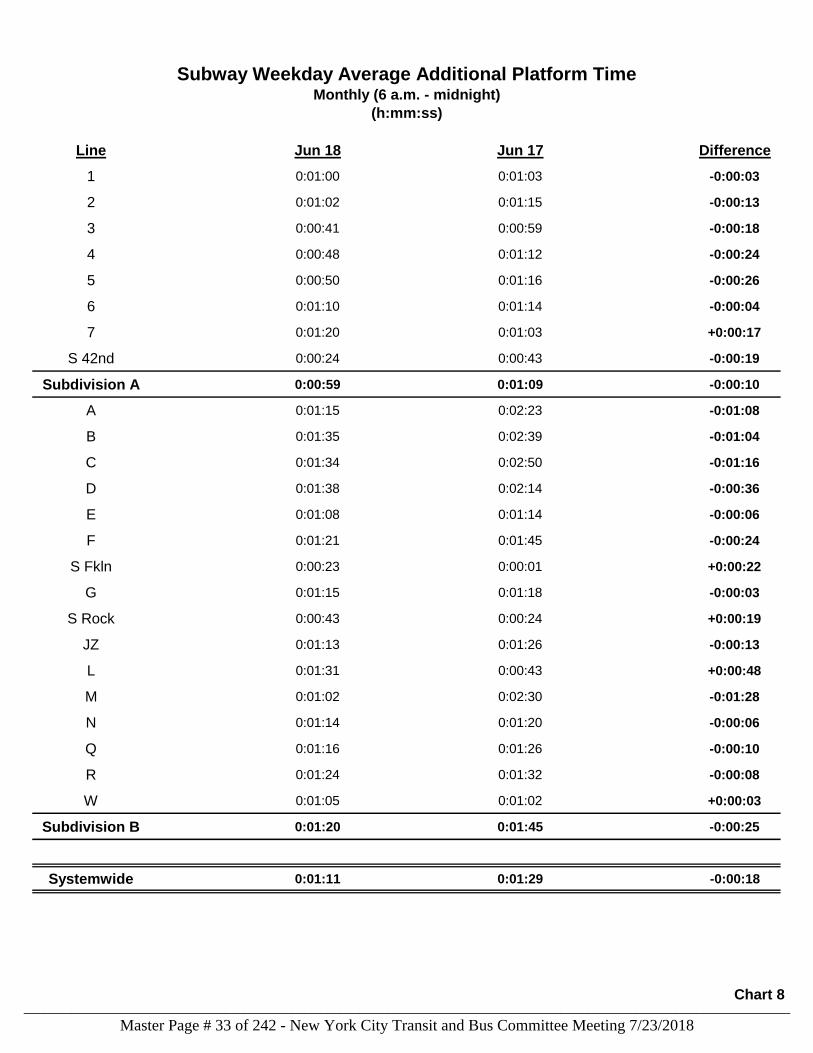
Line Jun 18 Jun 17 Difference
1 0:01:00 0:01:03 -0:00:03
2 0:01:02 0:01:15 -0:00:13
3 0:00:41 0:00:59 -0:00:18
4 0:00:48 0:01:12 -0:00:24
5 0:00:50 0:01:16 -0:00:26
6 0:01:10 0:01:14 -0:00:04
7 0:01:20 0:01:03 +0:00:17
S 42nd 0:00:24 0:00:43 -0:00:19
Subdivision A 0:00:59 0:01:09 -0:00:10
A 0:01:15 0:02:23 -0:01:08
B 0:01:35 0:02:39 -0:01:04
C 0:01:34 0:02:50 -0:01:16
D 0:01:38 0:02:14 -0:00:36
E 0:01:08 0:01:14 -0:00:06
F 0:01:21 0:01:45 -0:00:24
S Fkln 0:00:23 0:00:01 +0:00:22
G 0:01:15 0:01:18 -0:00:03
S Rock 0:00:43 0:00:24 +0:00:19
JZ 0:01:13 0:01:26 -0:00:13
L 0:01:31 0:00:43 +0:00:48
M 0:01:02 0:02:30 -0:01:28
N 0:01:14 0:01:20 -0:00:06
Q 0:01:16 0:01:26 -0:00:10
R 0:01:24 0:01:32 -0:00:08
W 0:01:05 0:01:02 +0:00:03
Subdivision B 0:01:20 0:01:45 -0:00:25
Systemwide 0:01:11 0:01:29 -0:00:18
Subway Weekday Average Additional Platform TimeMonthly (6 a.m. - midnight)
(h:mm:ss)
Chart 8
Master Page # 33 of 242 - New York City Transit and Bus Committee Meeting 7/23/2018________________________________________________________________________________
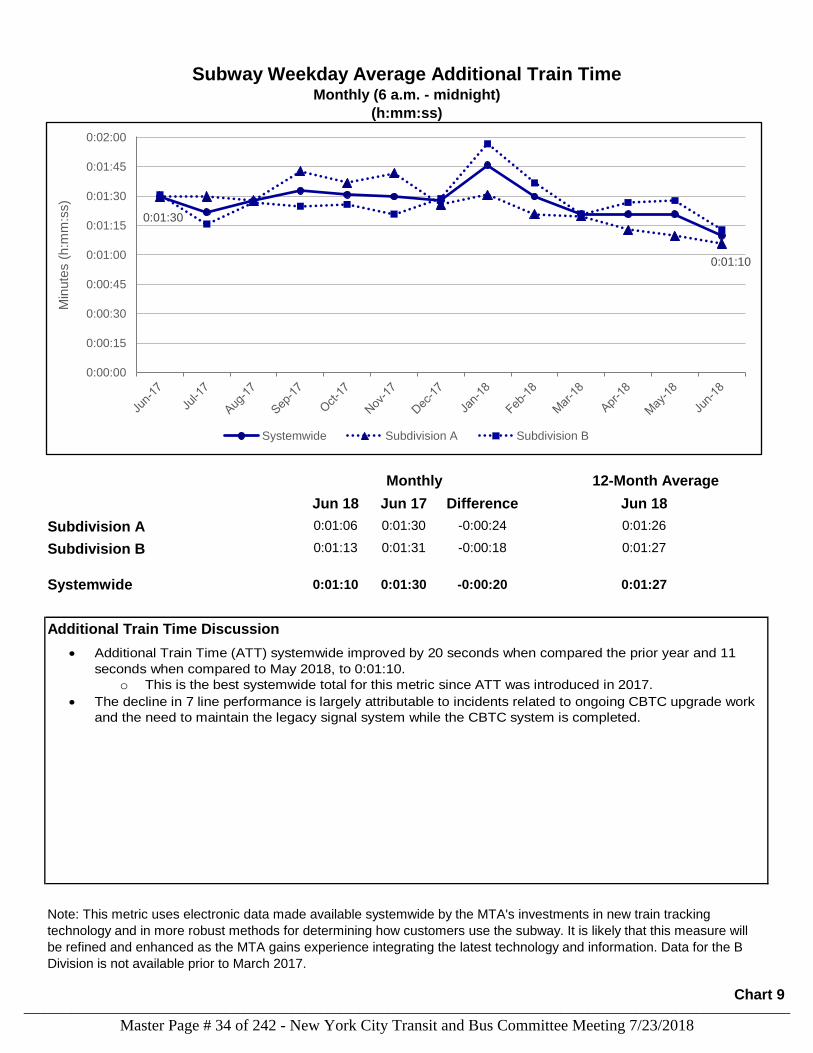
Jun 18 Jun 17 Difference Jun 18
Subdivision A 0:01:06 0:01:30 -0:00:24 0:01:26
Subdivision B 0:01:13 0:01:31 -0:00:18 0:01:27
Systemwide 0:01:10 0:01:30 -0:00:20 0:01:27
Additional Train Time Discussion
Monthly (6 a.m. - midnight)
Subway Weekday Average Additional Train Time
(h:mm:ss)
Monthly 12-Month Average
Note: This metric uses electronic data made available systemwide by the MTA's investments in new train tracking
technology and in more robust methods for determining how customers use the subway. It is likely that this measure will
be refined and enhanced as the MTA gains experience integrating the latest technology and information. Data for the B
Division is not available prior to March 2017.
0:01:30
0:01:10
0:00:00
0:00:15
0:00:30
0:00:45
0:01:00
0:01:15
0:01:30
0:01:45
0:02:00
Min
ute
s (
h:m
m:s
s)
Systemwide Subdivision A Subdivision B
Additional Train Time (ATT) systemwide improved by 20 seconds when compared the prior year and 11
seconds when compared to May 2018, to 0:01:10.
o This is the best systemwide total for this metric since ATT was introduced in 2017.
The decline in 7 line performance is largely attributable to incidents related to ongoing CBTC upgrade work
and the need to maintain the legacy signal system while the CBTC system is completed.
Chart 9
Master Page # 34 of 242 - New York City Transit and Bus Committee Meeting 7/23/2018________________________________________________________________________________
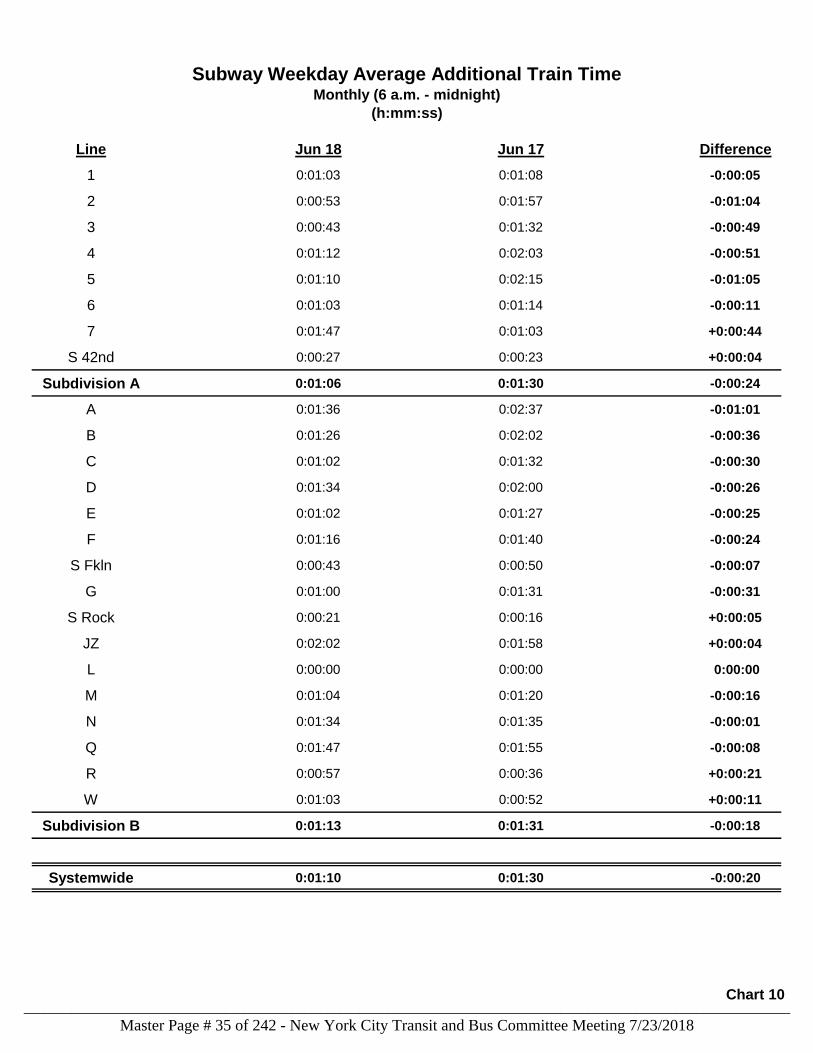
Line Jun 18 Jun 17 Difference
1 0:01:03 0:01:08 -0:00:05
2 0:00:53 0:01:57 -0:01:04
3 0:00:43 0:01:32 -0:00:49
4 0:01:12 0:02:03 -0:00:51
5 0:01:10 0:02:15 -0:01:05
6 0:01:03 0:01:14 -0:00:11
7 0:01:47 0:01:03 +0:00:44
S 42nd 0:00:27 0:00:23 +0:00:04
Subdivision A 0:01:06 0:01:30 -0:00:24
A 0:01:36 0:02:37 -0:01:01
B 0:01:26 0:02:02 -0:00:36
C 0:01:02 0:01:32 -0:00:30
D 0:01:34 0:02:00 -0:00:26
E 0:01:02 0:01:27 -0:00:25
F 0:01:16 0:01:40 -0:00:24
S Fkln 0:00:43 0:00:50 -0:00:07
G 0:01:00 0:01:31 -0:00:31
S Rock 0:00:21 0:00:16 +0:00:05
JZ 0:02:02 0:01:58 +0:00:04
L 0:00:00 0:00:00 0:00:00
M 0:01:04 0:01:20 -0:00:16
N 0:01:34 0:01:35 -0:00:01
Q 0:01:47 0:01:55 -0:00:08
R 0:00:57 0:00:36 +0:00:21
W 0:01:03 0:00:52 +0:00:11
Subdivision B 0:01:13 0:01:31 -0:00:18
Systemwide 0:01:10 0:01:30 -0:00:20
Subway Weekday Average Additional Train TimeMonthly (6 a.m. - midnight)
(h:mm:ss)
Chart 10
Master Page # 35 of 242 - New York City Transit and Bus Committee Meeting 7/23/2018________________________________________________________________________________
Performance Indicator Definitions
Mean Distance Between Failure (MDBF)
Elevator and Escalator Availability
The metrics in this section address how NYCT provides service to its customers, by
measuring the reliability of key assets, reflecting the effectiveness of maintenance practices,
as well as age and condition. Historically, the only such measures that NYCT has provided
to the Transit Committee and to the public are car fleet and elevator and escalator
measures, defined below. NYCT is examining additional such measures to bring forward in
coming months.
Subway MDBF is a measure of car fleet reliability. It is calculated as revenue car miles
divided by the number of delay incidents attributed to car-related causes.
The percent of time that elevators or escalators are operational system wide. Most elevators
and escalators in the subway are maintained by New York City Transit and are electronically
monitored 24-hours a day. Some elevators and escalators in the subway are owned and
maintained by outside parties; these are inspected by NYCT personnel multiple times daily.
Section 2: Inputs to Operations
Master Page # 36 of 242 - New York City Transit and Bus Committee Meeting 7/23/2018________________________________________________________________________________
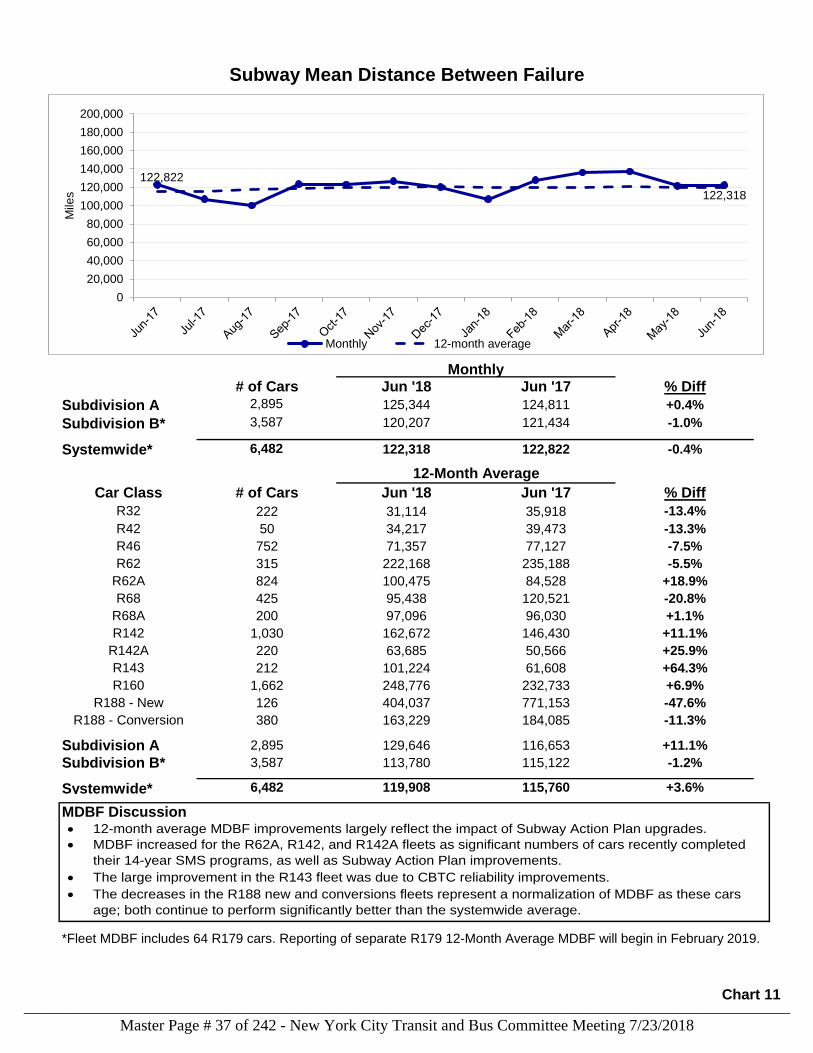
# of Cars Jun '18 Jun '17 % Diff
Subdivision A 2,895 125,344 124,811 +0.4%
Subdivision B* 3,587 120,207 121,434 -1.0%
Systemwide* 6,482 122,318 122,822 -0.4%
Car Class # of Cars Jun '18 Jun '17 % Diff
R32 222 31,114 35,918 -13.4%
R42 50 34,217 39,473 -13.3%
R46 752 71,357 77,127 -7.5%
R62 315 222,168 235,188 -5.5%
R62A 824 100,475 84,528 +18.9%
R68 425 95,438 120,521 -20.8%
R68A 200 97,096 96,030 +1.1%
R142 1,030 162,672 146,430 +11.1%
R142A 220 63,685 50,566 +25.9%
R143 212 101,224 61,608 +64.3%
R160 1,662 248,776 232,733 +6.9%
R188 - New 126 404,037 771,153 -47.6%
R188 - Conversion 380 163,229 184,085 -11.3%
Subdivision A 2,895 129,646 116,653 +11.1%
Subdivision B* 3,587 113,780 115,122 -1.2%
Systemwide* 6,482 119,908 115,760 +3.6%
MDBF Discussion
Subway Mean Distance Between Failure
Monthly
12-Month Average
*Fleet MDBF includes 64 R179 cars. Reporting of separate R179 12-Month Average MDBF will begin in February 2019.
122,822
122,318
0
20,000
40,000
60,000
80,000
100,000
120,000
140,000
160,000
180,000
200,000
Mile
s
Monthly 12-month average
12-month average MDBF improvements largely reflect the impact of Subway Action Plan upgrades.
MDBF increased for the R62A, R142, and R142A fleets as significant numbers of cars recently completed
their 14-year SMS programs, as well as Subway Action Plan improvements.
The large improvement in the R143 fleet was due to CBTC reliability improvements.
The decreases in the R188 new and conversions fleets represent a normalization of MDBF as these cars
age; both continue to perform significantly better than the systemwide average.
Chart 11
Master Page # 37 of 242 - New York City Transit and Bus Committee Meeting 7/23/2018________________________________________________________________________________
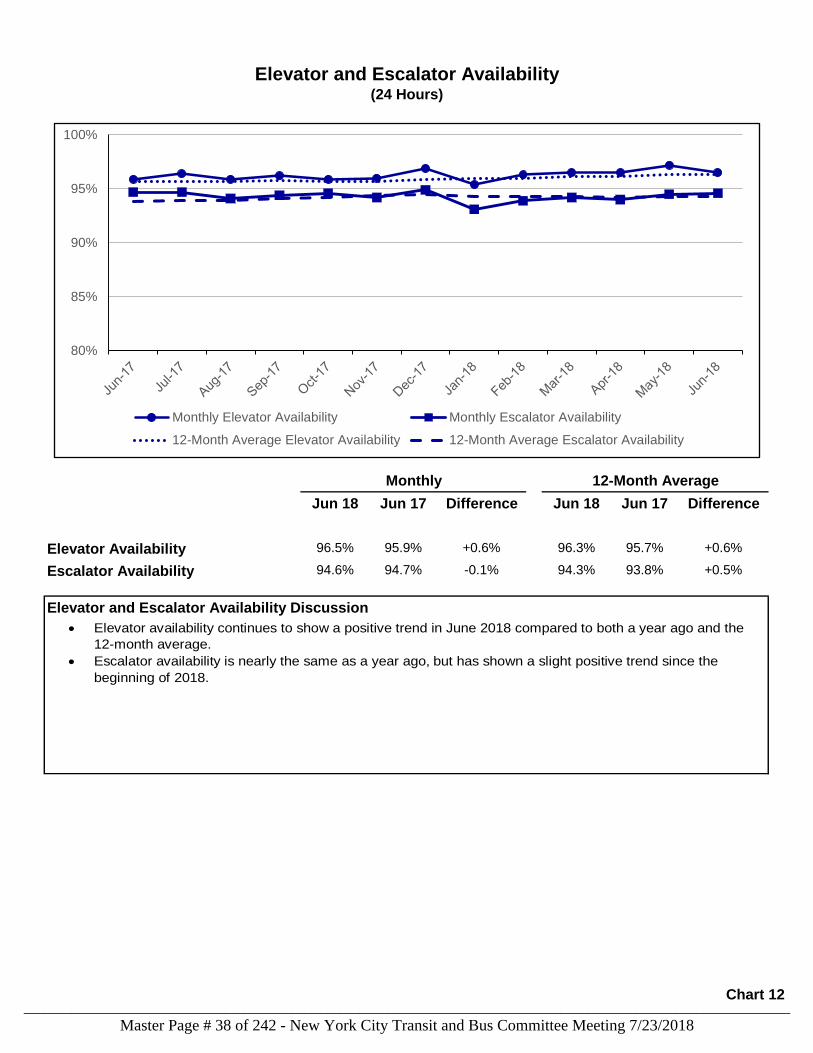
Jun 18 Jun 17 Difference Jun 18 Jun 17 Difference
Elevator Availability 96.5% 95.9% +0.6% 96.3% 95.7% +0.6%
Escalator Availability 94.6% 94.7% -0.1% 94.3% 93.8% +0.5%
Elevator and Escalator Availability Discussion
Elevator and Escalator Availability(24 Hours)
Monthly 12-Month Average
80%
85%
90%
95%
100%
Monthly Elevator Availability Monthly Escalator Availability
12-Month Average Elevator Availability 12-Month Average Escalator Availability
Elevator availability continues to show a positive trend in June 2018 compared to both a year ago and the
12-month average.
Escalator availability is nearly the same as a year ago, but has shown a slight positive trend since the
beginning of 2018.
Chart 12
Master Page # 38 of 242 - New York City Transit and Bus Committee Meeting 7/23/2018________________________________________________________________________________
Performance Indicator Definitions
Subway Car PES-KPI
Appearance: Includes cleanliness and graffiti ratings in subway cars.
Equipment: Includes the functionality of door panels, lighting, and climate control.
Information: Includes the subway car announcements and signage.
Station PES-KPI
Appearance: Includes cleanliness and graffiti ratings for station.
Does not currently include peeling paint or missing tiles for stations.
Equipment:
Information: Includes the ratings for maps, employees in proper uniforms and signage.
Staten Island Railway PES-KPI Definition
Appearance: Includes cleanliness, and graffiti ratings in cars and stations.
Equipment: Includes the functionality of door panels, lighting, and climate control in cars.
Information:
Includes the functionality of MetroCard Vending machines, turnstiles
and station attendant booths.
PES-KPI is a composite indicator for the Staten Island Railway car and station environments,
which consists of three indicators designed to reflect customer experiences.
Includes the ratings for maps, employees in proper uniforms, and subway
car announcements and signage.
Section 3: Passenger Environment
The metrics in this section affect the customer experience in terms of cleanliness and the
functionality of the equipment they encounter on their travels.
Subway Car PES-KPI is a composite indicator for subway car environments, which consists of
three categories designed to reflect customer experience. The Appearance category accounts
for 34% of the KPI calculation, and the Equipment and Information categories account for 33%
each.
Station PES-KPI is a composite indicator for station environments. It consists of three
categories designed to reflect customer experience. The Appearance category accounts for
37% of the KPI calculation, the Equipment category accounts for 31%, and the Information
category accounts for 32%.
Master Page # 39 of 242 - New York City Transit and Bus Committee Meeting 7/23/2018________________________________________________________________________________
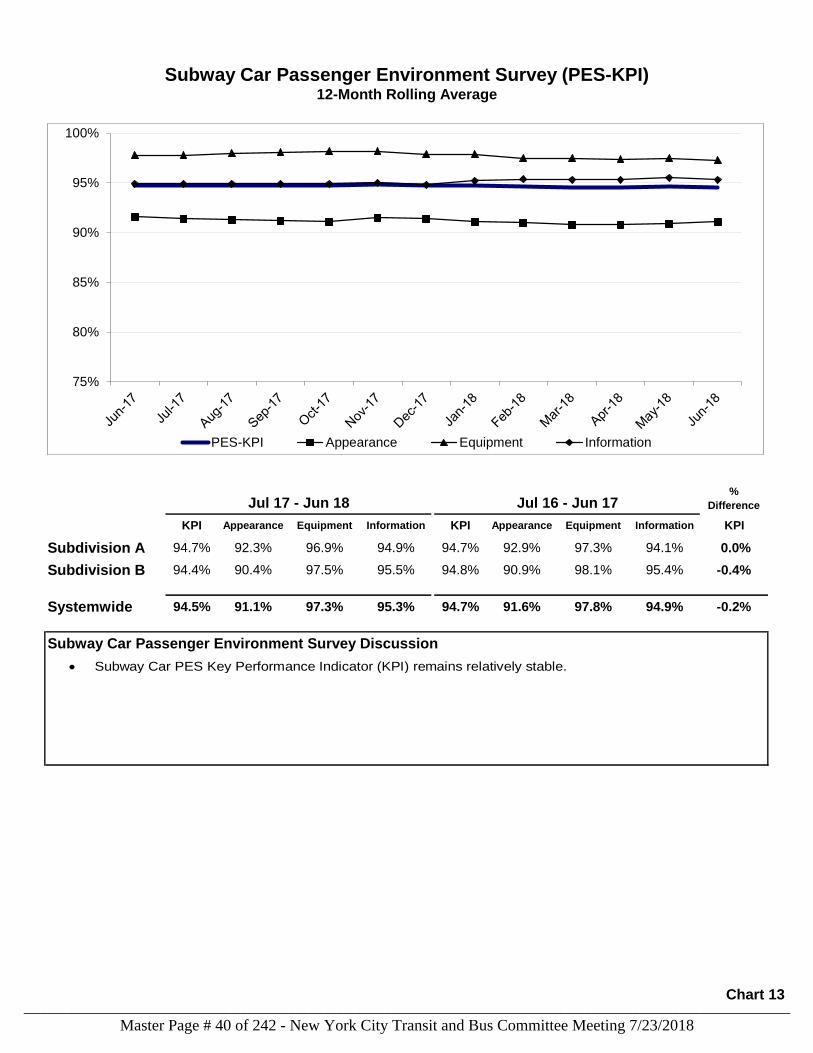
KPI Appearance Equipment Information KPI Appearance Equipment Information KPI
Subdivision A 94.7% 92.3% 96.9% 94.9% 94.7% 92.9% 97.3% 94.1% 0.0%
Subdivision B 94.4% 90.4% 97.5% 95.5% 94.8% 90.9% 98.1% 95.4% -0.4%
Systemwide 94.5% 91.1% 97.3% 95.3% 94.7% 91.6% 97.8% 94.9% -0.2%
Subway Car Passenger Environment Survey Discussion
Subway Car Passenger Environment Survey (PES-KPI)
Jul 16 - Jun 17Jul 17 - Jun 18
12-Month Rolling Average
%
Difference
75%
80%
85%
90%
95%
100%
PES-KPI Appearance Equipment Information
Subway Car PES Key Performance Indicator (KPI) remains relatively stable.
Chart 13
Master Page # 40 of 242 - New York City Transit and Bus Committee Meeting 7/23/2018________________________________________________________________________________
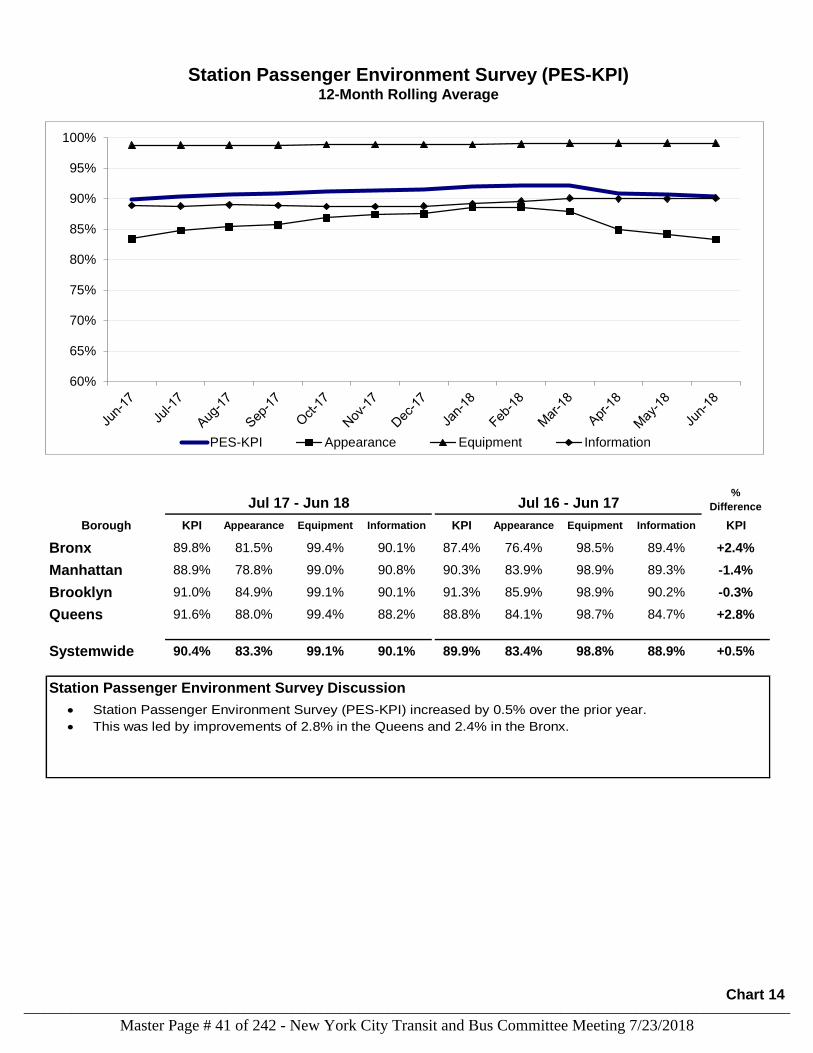
Borough KPI Appearance Equipment Information KPI Appearance Equipment Information KPI
Bronx 89.8% 81.5% 99.4% 90.1% 87.4% 76.4% 98.5% 89.4% +2.4%
Manhattan 88.9% 78.8% 99.0% 90.8% 90.3% 83.9% 98.9% 89.3% -1.4%
Brooklyn 91.0% 84.9% 99.1% 90.1% 91.3% 85.9% 98.9% 90.2% -0.3%
Queens 91.6% 88.0% 99.4% 88.2% 88.8% 84.1% 98.7% 84.7% +2.8%
Systemwide 90.4% 83.3% 99.1% 90.1% 89.9% 83.4% 98.8% 88.9% +0.5%
Station Passenger Environment Survey Discussion
Jul 17 - Jun 18 Jul 16 - Jun 17
Station Passenger Environment Survey (PES-KPI)12-Month Rolling Average
%
Difference
60%
65%
70%
75%
80%
85%
90%
95%
100%
PES-KPI Appearance Equipment Information
Station Passenger Environment Survey (PES-KPI) increased by 0.5% over the prior year.
This was led by improvements of 2.8% in the Queens and 2.4% in the Bronx.
Chart 14
Master Page # 41 of 242 - New York City Transit and Bus Committee Meeting 7/23/2018________________________________________________________________________________
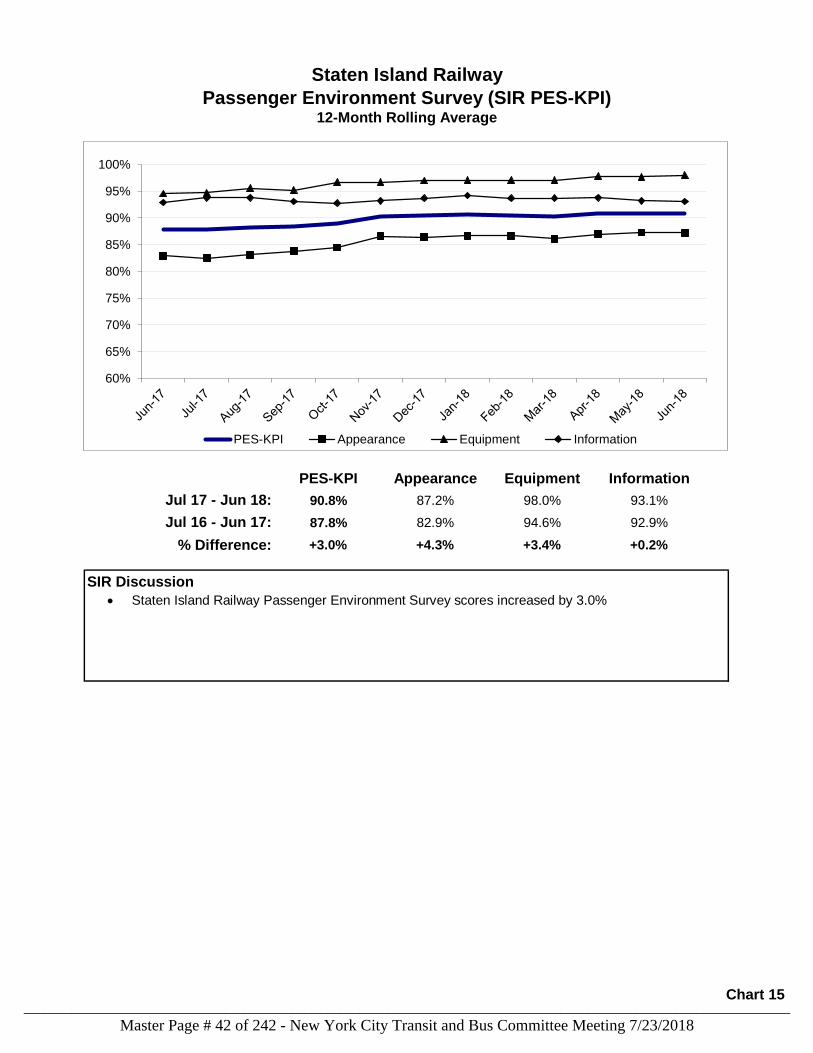
PES-KPI Appearance Equipment Information
90.8% 87.2% 98.0% 93.1%
87.8% 82.9% 94.6% 92.9%
% Difference: +3.0% +4.3% +3.4% +0.2%
SIR Discussion
Staten Island Railway
Passenger Environment Survey (SIR PES-KPI)12-Month Rolling Average
Jul 17 - Jun 18:
Jul 16 - Jun 17:
60%
65%
70%
75%
80%
85%
90%
95%
100%
PES-KPI Appearance Equipment Information
Staten Island Railway Passenger Environment Survey scores increased by 3.0%
Chart 15
Master Page # 42 of 242 - New York City Transit and Bus Committee Meeting 7/23/2018________________________________________________________________________________
Performance Indicator Definitions
Wait Assessment (Weekday and Weekend)
Terminal On-Time Performance (Weekday and Weekend)
Train Delays (Weekday and Weekend)
Section 4: Legacy Indicators
The metrics in this section have been shared with the public for many years. While less
reflective of the customer experience, they are included here for continuity purposes.
Wait Assessment is measured as the percentage of intervals between trains that are no
more than the scheduled interval plus 25%. Minor gaps are more than 25% to 50% over the
scheduled headway, medium gaps are more than 50% to 100% over the scheduled
headway, and major gaps are more than 100% over the scheduled headway, or missed
intervals. This is measured from 6am to midnight.
Terminal On-Time Performance is the percentage of scheduled trains arriving at the
terminal locations within five minutes of their scheduled arrival time during a 24-hour period.
An on-time train is defined as a train arriving at its destination terminal on-time, early, or no
more than five minutes late, and that has not skipped any planned station stops.
Train delays are the number of trains that arrived at terminal locations more than five
minutes late, or that has skipped any planned station stops during a 24-hour period.
Master Page # 43 of 242 - New York City Transit and Bus Committee Meeting 7/23/2018________________________________________________________________________________
Monthly 12 month Monthly 12 month Monthly
Meets Monthly GAP Meets Meets Monthly GAP Meets Standard
Line Standard Minor Medium Major Standard Standard Minor Medium Major Standard Difference
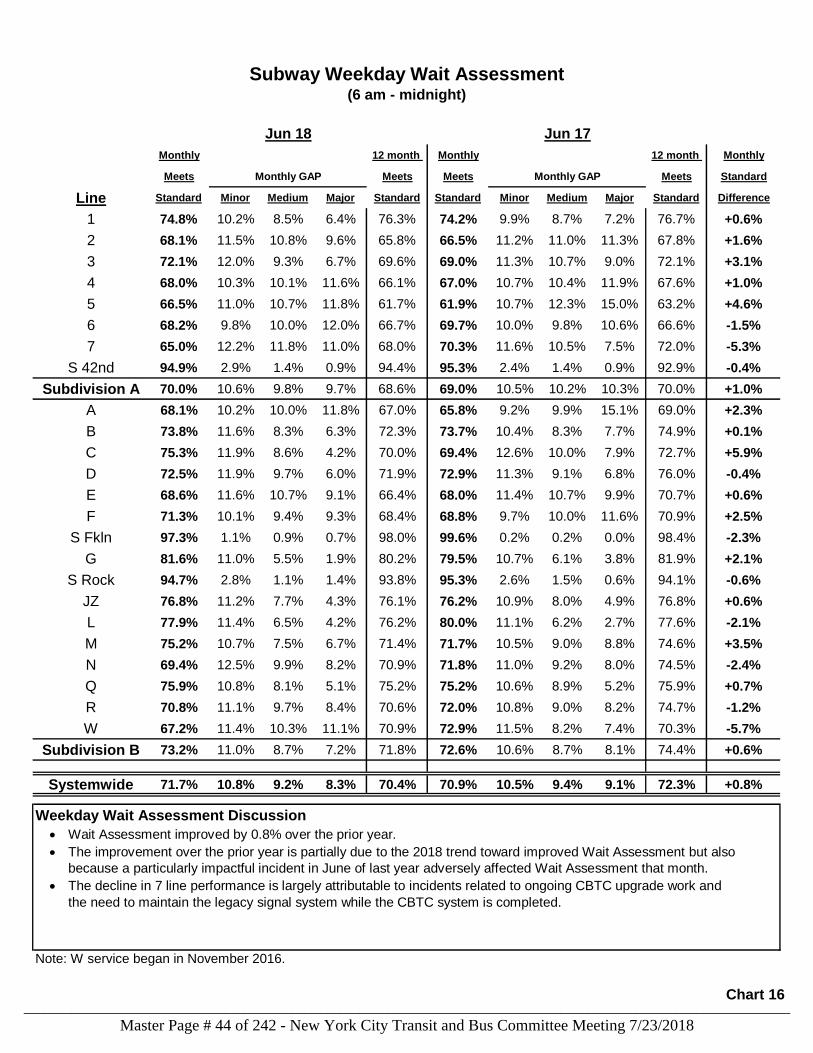
1 74.8% 10.2% 8.5% 6.4% 76.3% 74.2% 9.9% 8.7% 7.2% 76.7% +0.6%
2 68.1% 11.5% 10.8% 9.6% 65.8% 66.5% 11.2% 11.0% 11.3% 67.8% +1.6%
3 72.1% 12.0% 9.3% 6.7% 69.6% 69.0% 11.3% 10.7% 9.0% 72.1% +3.1%
4 68.0% 10.3% 10.1% 11.6% 66.1% 67.0% 10.7% 10.4% 11.9% 67.6% +1.0%
5 66.5% 11.0% 10.7% 11.8% 61.7% 61.9% 10.7% 12.3% 15.0% 63.2% +4.6%
6 68.2% 9.8% 10.0% 12.0% 66.7% 69.7% 10.0% 9.8% 10.6% 66.6% -1.5%
7 65.0% 12.2% 11.8% 11.0% 68.0% 70.3% 11.6% 10.5% 7.5% 72.0% -5.3%
S 42nd 94.9% 2.9% 1.4% 0.9% 94.4% 95.3% 2.4% 1.4% 0.9% 92.9% -0.4%
Subdivision A 70.0% 10.6% 9.8% 9.7% 68.6% 69.0% 10.5% 10.2% 10.3% 70.0% +1.0%
A 68.1% 10.2% 10.0% 11.8% 67.0% 65.8% 9.2% 9.9% 15.1% 69.0% +2.3%
B 73.8% 11.6% 8.3% 6.3% 72.3% 73.7% 10.4% 8.3% 7.7% 74.9% +0.1%
C 75.3% 11.9% 8.6% 4.2% 70.0% 69.4% 12.6% 10.0% 7.9% 72.7% +5.9%
D 72.5% 11.9% 9.7% 6.0% 71.9% 72.9% 11.3% 9.1% 6.8% 76.0% -0.4%
E 68.6% 11.6% 10.7% 9.1% 66.4% 68.0% 11.4% 10.7% 9.9% 70.7% +0.6%
F 71.3% 10.1% 9.4% 9.3% 68.4% 68.8% 9.7% 10.0% 11.6% 70.9% +2.5%
S Fkln 97.3% 1.1% 0.9% 0.7% 98.0% 99.6% 0.2% 0.2% 0.0% 98.4% -2.3%
G 81.6% 11.0% 5.5% 1.9% 80.2% 79.5% 10.7% 6.1% 3.8% 81.9% +2.1%
S Rock 94.7% 2.8% 1.1% 1.4% 93.8% 95.3% 2.6% 1.5% 0.6% 94.1% -0.6%
JZ 76.8% 11.2% 7.7% 4.3% 76.1% 76.2% 10.9% 8.0% 4.9% 76.8% +0.6%
L 77.9% 11.4% 6.5% 4.2% 76.2% 80.0% 11.1% 6.2% 2.7% 77.6% -2.1%
M 75.2% 10.7% 7.5% 6.7% 71.4% 71.7% 10.5% 9.0% 8.8% 74.6% +3.5%
N 69.4% 12.5% 9.9% 8.2% 70.9% 71.8% 11.0% 9.2% 8.0% 74.5% -2.4%
Q 75.9% 10.8% 8.1% 5.1% 75.2% 75.2% 10.6% 8.9% 5.2% 75.9% +0.7%
R 70.8% 11.1% 9.7% 8.4% 70.6% 72.0% 10.8% 9.0% 8.2% 74.7% -1.2%
W 67.2% 11.4% 10.3% 11.1% 70.9% 72.9% 11.5% 8.2% 7.4% 70.3% -5.7%
Subdivision B 73.2% 11.0% 8.7% 7.2% 71.8% 72.6% 10.6% 8.7% 8.1% 74.4% +0.6%
Systemwide 71.7% 10.8% 9.2% 8.3% 70.4% 70.9% 10.5% 9.4% 9.1% 72.3% +0.8%
Weekday Wait Assessment Discussion
Note: W service began in November 2016.
Subway Weekday Wait Assessment(6 am - midnight)
Jun 18 Jun 17
Wait Assessment improved by 0.8% over the prior year.
The improvement over the prior year is partially due to the 2018 trend toward improved Wait Assessment but also
because a particularly impactful incident in June of last year adversely affected Wait Assessment that month.
The decline in 7 line performance is largely attributable to incidents related to ongoing CBTC upgrade work and
the need to maintain the legacy signal system while the CBTC system is completed.
Chart 16
Master Page # 44 of 242 - New York City Transit and Bus Committee Meeting 7/23/2018________________________________________________________________________________
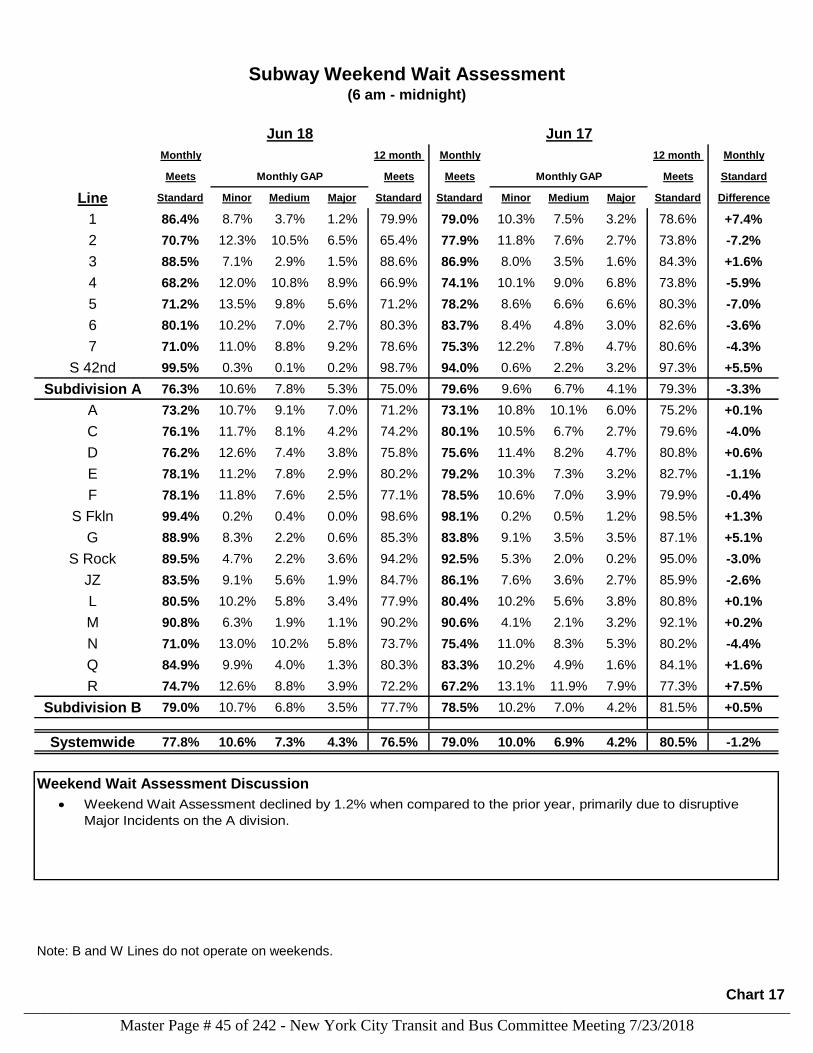
Monthly 12 month Monthly 12 month Monthly
Meets Monthly GAP Meets Meets Monthly GAP Meets Standard
Line Standard Minor Medium Major Standard Standard Minor Medium Major Standard Difference
1 86.4% 8.7% 3.7% 1.2% 79.9% 79.0% 10.3% 7.5% 3.2% 78.6% +7.4%
2 70.7% 12.3% 10.5% 6.5% 65.4% 77.9% 11.8% 7.6% 2.7% 73.8% -7.2%
3 88.5% 7.1% 2.9% 1.5% 88.6% 86.9% 8.0% 3.5% 1.6% 84.3% +1.6%
4 68.2% 12.0% 10.8% 8.9% 66.9% 74.1% 10.1% 9.0% 6.8% 73.8% -5.9%
5 71.2% 13.5% 9.8% 5.6% 71.2% 78.2% 8.6% 6.6% 6.6% 80.3% -7.0%
6 80.1% 10.2% 7.0% 2.7% 80.3% 83.7% 8.4% 4.8% 3.0% 82.6% -3.6%
7 71.0% 11.0% 8.8% 9.2% 78.6% 75.3% 12.2% 7.8% 4.7% 80.6% -4.3%
S 42nd 99.5% 0.3% 0.1% 0.2% 98.7% 94.0% 0.6% 2.2% 3.2% 97.3% +5.5%
Subdivision A 76.3% 10.6% 7.8% 5.3% 75.0% 79.6% 9.6% 6.7% 4.1% 79.3% -3.3%
A 73.2% 10.7% 9.1% 7.0% 71.2% 73.1% 10.8% 10.1% 6.0% 75.2% +0.1%
C 76.1% 11.7% 8.1% 4.2% 74.2% 80.1% 10.5% 6.7% 2.7% 79.6% -4.0%
D 76.2% 12.6% 7.4% 3.8% 75.8% 75.6% 11.4% 8.2% 4.7% 80.8% +0.6%
E 78.1% 11.2% 7.8% 2.9% 80.2% 79.2% 10.3% 7.3% 3.2% 82.7% -1.1%
F 78.1% 11.8% 7.6% 2.5% 77.1% 78.5% 10.6% 7.0% 3.9% 79.9% -0.4%
S Fkln 99.4% 0.2% 0.4% 0.0% 98.6% 98.1% 0.2% 0.5% 1.2% 98.5% +1.3%
G 88.9% 8.3% 2.2% 0.6% 85.3% 83.8% 9.1% 3.5% 3.5% 87.1% +5.1%
S Rock 89.5% 4.7% 2.2% 3.6% 94.2% 92.5% 5.3% 2.0% 0.2% 95.0% -3.0%
JZ 83.5% 9.1% 5.6% 1.9% 84.7% 86.1% 7.6% 3.6% 2.7% 85.9% -2.6%
L 80.5% 10.2% 5.8% 3.4% 77.9% 80.4% 10.2% 5.6% 3.8% 80.8% +0.1%
M 90.8% 6.3% 1.9% 1.1% 90.2% 90.6% 4.1% 2.1% 3.2% 92.1% +0.2%
N 71.0% 13.0% 10.2% 5.8% 73.7% 75.4% 11.0% 8.3% 5.3% 80.2% -4.4%
Q 84.9% 9.9% 4.0% 1.3% 80.3% 83.3% 10.2% 4.9% 1.6% 84.1% +1.6%
R 74.7% 12.6% 8.8% 3.9% 72.2% 67.2% 13.1% 11.9% 7.9% 77.3% +7.5%
Subdivision B 79.0% 10.7% 6.8% 3.5% 77.7% 78.5% 10.2% 7.0% 4.2% 81.5% +0.5%
Systemwide 77.8% 10.6% 7.3% 4.3% 76.5% 79.0% 10.0% 6.9% 4.2% 80.5% -1.2%
Weekend Wait Assessment Discussion
Subway Weekend Wait Assessment(6 am - midnight)
Jun 18 Jun 17
Note: B and W Lines do not operate on weekends.
Weekend Wait Assessment declined by 1.2% when compared to the prior year, primarily due to disruptive
Major Incidents on the A division.
Chart 17
Master Page # 45 of 242 - New York City Transit and Bus Committee Meeting 7/23/2018________________________________________________________________________________
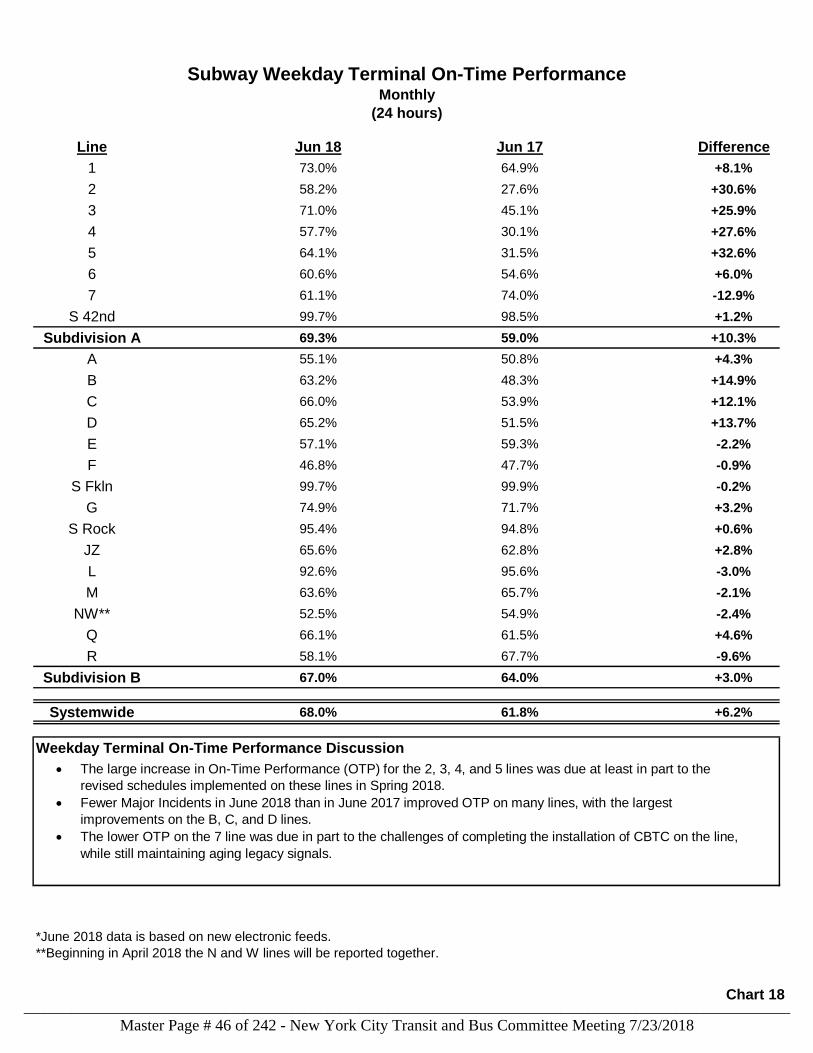
Line Jun 18 Jun 17 Difference
1 73.0% 64.9% +8.1%
2 58.2% 27.6% +30.6%
3 71.0% 45.1% +25.9%
4 57.7% 30.1% +27.6%
5 64.1% 31.5% +32.6%
6 60.6% 54.6% +6.0%
7 61.1% 74.0% -12.9%
S 42nd 99.7% 98.5% +1.2%
Subdivision A 69.3% 59.0% +10.3%
A 55.1% 50.8% +4.3%
B 63.2% 48.3% +14.9%
C 66.0% 53.9% +12.1%
D 65.2% 51.5% +13.7%
E 57.1% 59.3% -2.2%
F 46.8% 47.7% -0.9%
S Fkln 99.7% 99.9% -0.2%
G 74.9% 71.7% +3.2%
S Rock 95.4% 94.8% +0.6%
JZ 65.6% 62.8% +2.8%
L 92.6% 95.6% -3.0%
M 63.6% 65.7% -2.1%
NW** 52.5% 54.9% -2.4%
Q 66.1% 61.5% +4.6%
R 58.1% 67.7% -9.6%
Subdivision B 67.0% 64.0% +3.0%
Systemwide 68.0% 61.8% +6.2%
Weekday Terminal On-Time Performance Discussion
(24 hours)
Subway Weekday Terminal On-Time PerformanceMonthly
*June 2018 data is based on new electronic feeds.
**Beginning in April 2018 the N and W lines will be reported together.
The large increase in On-Time Performance (OTP) for the 2, 3, 4, and 5 lines was due at least in part to the
revised schedules implemented on these lines in Spring 2018.
Fewer Major Incidents in June 2018 than in June 2017 improved OTP on many lines, with the largest
improvements on the B, C, and D lines.
The lower OTP on the 7 line was due in part to the challenges of completing the installation of CBTC on the line,
while still maintaining aging legacy signals.
Chart 18
Master Page # 46 of 242 - New York City Transit and Bus Committee Meeting 7/23/2018________________________________________________________________________________
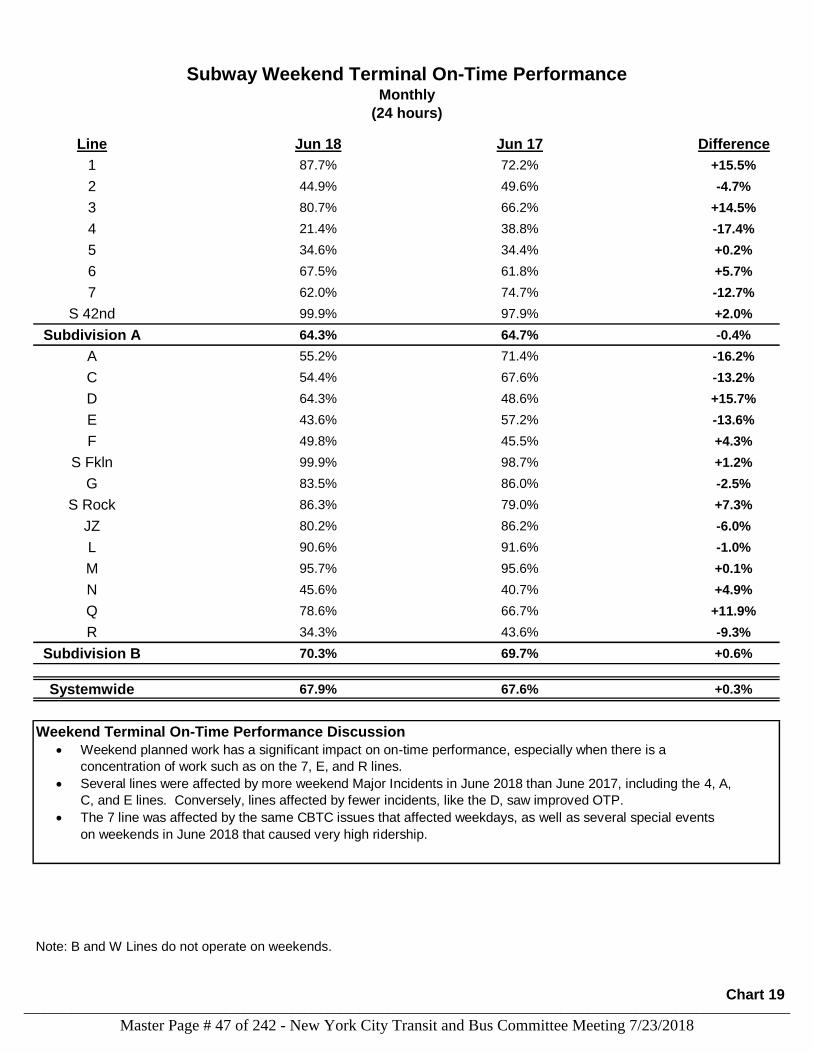
Line Jun 18 Jun 17 Difference
1 87.7% 72.2% +15.5%
2 44.9% 49.6% -4.7%
3 80.7% 66.2% +14.5%
4 21.4% 38.8% -17.4%
5 34.6% 34.4% +0.2%
6 67.5% 61.8% +5.7%
7 62.0% 74.7% -12.7%
S 42nd 99.9% 97.9% +2.0%
Subdivision A 64.3% 64.7% -0.4%
A 55.2% 71.4% -16.2%
C 54.4% 67.6% -13.2%
D 64.3% 48.6% +15.7%
E 43.6% 57.2% -13.6%
F 49.8% 45.5% +4.3%
S Fkln 99.9% 98.7% +1.2%
G 83.5% 86.0% -2.5%
S Rock 86.3% 79.0% +7.3%
JZ 80.2% 86.2% -6.0%
L 90.6% 91.6% -1.0%
M 95.7% 95.6% +0.1%
N 45.6% 40.7% +4.9%
Q 78.6% 66.7% +11.9%
R 34.3% 43.6% -9.3%
Subdivision B 70.3% 69.7% +0.6%
Systemwide 67.9% 67.6% +0.3%
Weekend Terminal On-Time Performance Discussion
Note: B and W Lines do not operate on weekends.
(24 hours)
Subway Weekend Terminal On-Time PerformanceMonthly
Weekend planned work has a significant impact on on-time performance, especially when there is a
concentration of work such as on the 7, E, and R lines.
Several lines were affected by more weekend Major Incidents in June 2018 than June 2017, including the 4, A,
C, and E lines. Conversely, lines affected by fewer incidents, like the D, saw improved OTP.
The 7 line was affected by the same CBTC issues that affected weekdays, as well as several special events
on weekends in June 2018 that caused very high ridership.
Chart 19
Master Page # 47 of 242 - New York City Transit and Bus Committee Meeting 7/23/2018________________________________________________________________________________

Delay Categories
Trains
Delayed
Delayed
Trains Per
Day (21)
% of
Delayed
Trains
Track Failures and Emergency Remediation 2,181 104 3.9%
Rail and Roadbed 1,896 90 3.4%
Fire, Smoke, Debris 285 14 0.5%
Signal Failures and Emergency Remediation 4,224 201 7.5%
Subway Car 1,743 83 3.1%
Door-Related 396 19 0.7%
Propulsion 214 10 0.4%
Braking 439 21 0.8%
Other 694 33 1.2%
Other Unplanned Disruptions (e.g. station defect) 1,197 57 2.1%
0
Train Brake Activation - cause unknown 509 24 0.9%
Service Delivery (e.g., crew performance) 1,178 56 2.1%
External 8,007 381 14.2%
Public Conduct, Crime, Police Response 2,777 132 4.9%
Sick/Injured Customer 1,841 88 3.3%
Persons on Roadbed (including persons struck by train) 1,318 63 2.4%
External Debris on Roadbed (e.g., trees, shopping cart) 188 9 0.3%
Other Passenger-Related (e.g., retrieval of property from track) 836 40 1.5%
Public Event (e.g., civil demonstration, parade) 487 23 0.9%
Inclement Weather 481 23 0.9%
Other External Disruptions 79 4 0.1%
Operating Environment 22,350 1,064 39.7%
Planned Right-of-Way Work 14,844 707 26.4%
Total Trains Delayed 56,233 2,678 100%
Note: Based on new electronic feeds. Root cause analysis and improved categorization of delays is
ongoing.
Subway Weekday Trains DelayedMonthly - June 2018
(24 hours)
Chart 20a
Master Page # 48 of 242 - New York City Transit and Bus Committee Meeting 7/23/2018________________________________________________________________________________
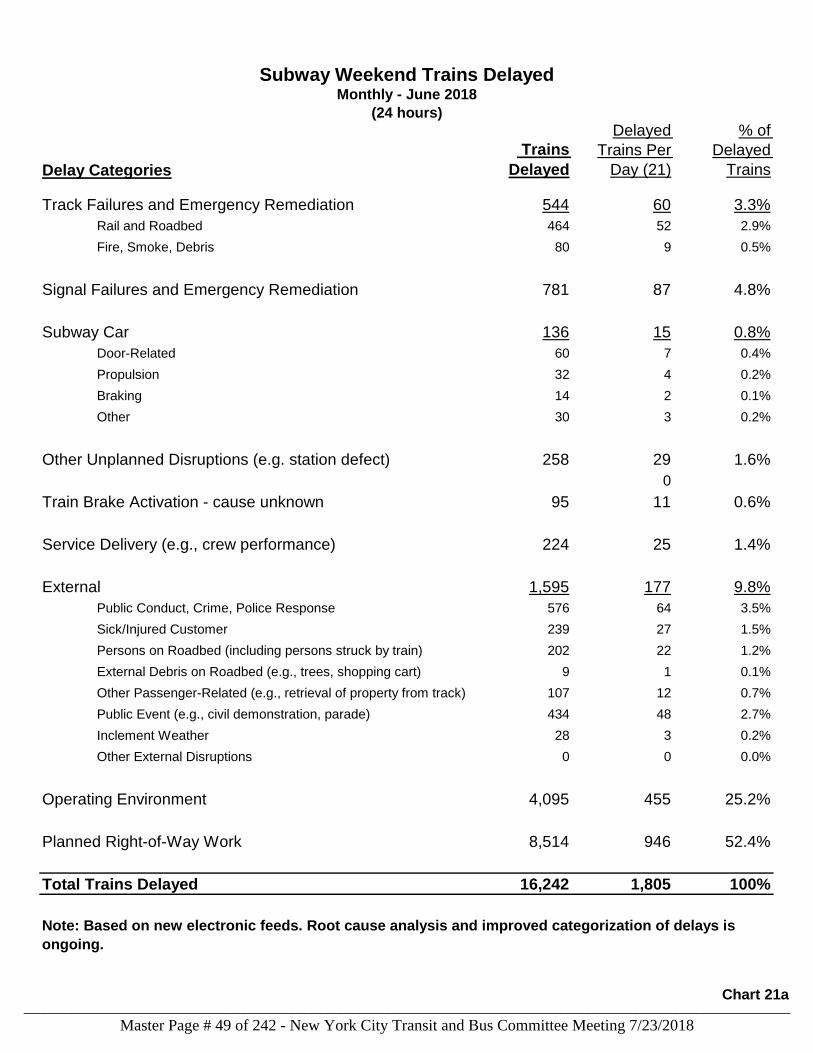
Delay Categories
Trains
Delayed
Delayed
Trains Per
Day (21)
% of
Delayed
Trains
Track Failures and Emergency Remediation 544 60 3.3%
Rail and Roadbed 464 52 2.9%
Fire, Smoke, Debris 80 9 0.5%
Signal Failures and Emergency Remediation 781 87 4.8%
Subway Car 136 15 0.8%
Door-Related 60 7 0.4%
Propulsion 32 4 0.2%
Braking 14 2 0.1%
Other 30 3 0.2%
Other Unplanned Disruptions (e.g. station defect) 258 29 1.6%
0
Train Brake Activation - cause unknown 95 11 0.6%
Service Delivery (e.g., crew performance) 224 25 1.4%
External 1,595 177 9.8%
Public Conduct, Crime, Police Response 576 64 3.5%
Sick/Injured Customer 239 27 1.5%
Persons on Roadbed (including persons struck by train) 202 22 1.2%
External Debris on Roadbed (e.g., trees, shopping cart) 9 1 0.1%
Other Passenger-Related (e.g., retrieval of property from track) 107 12 0.7%
Public Event (e.g., civil demonstration, parade) 434 48 2.7%
Inclement Weather 28 3 0.2%
Other External Disruptions 0 0 0.0%
Operating Environment 4,095 455 25.2%
Planned Right-of-Way Work 8,514 946 52.4%
Total Trains Delayed 16,242 1,805 100%
Subway Weekend Trains DelayedMonthly - June 2018
(24 hours)
Note: Based on new electronic feeds. Root cause analysis and improved categorization of delays is
ongoing.
Chart 21a
Master Page # 49 of 242 - New York City Transit and Bus Committee Meeting 7/23/2018________________________________________________________________________________
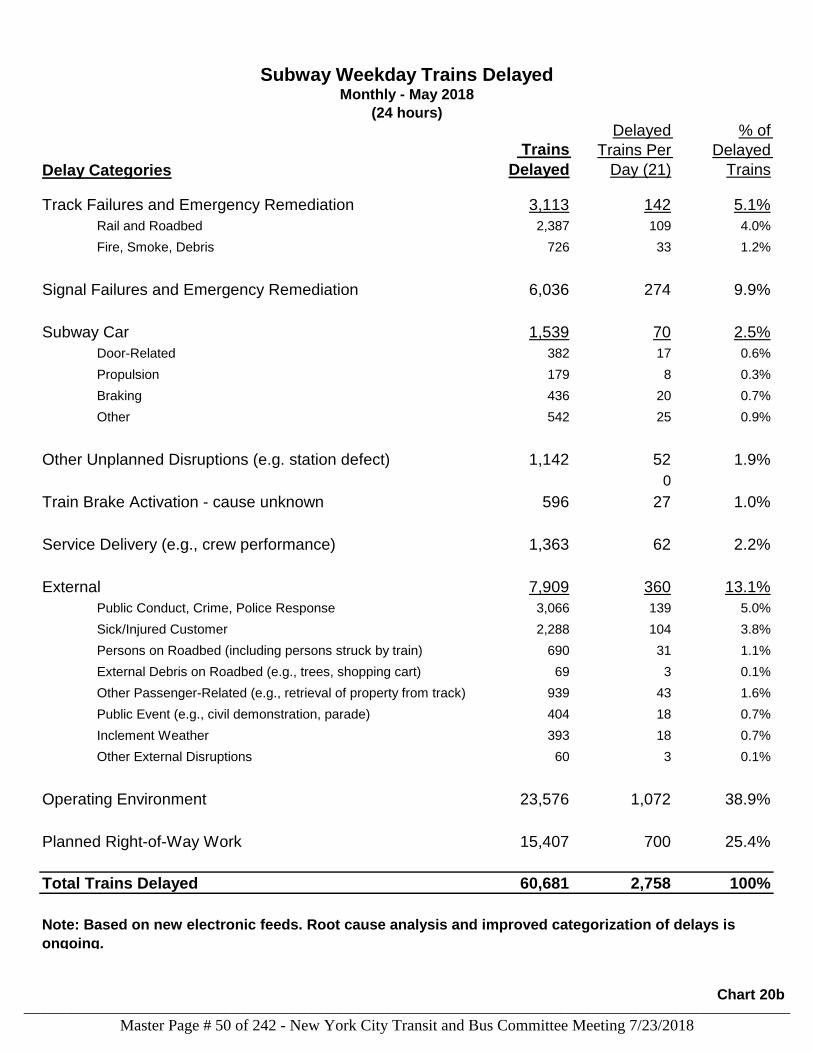
Delay Categories
Trains
Delayed
Delayed
Trains Per
Day (21)
% of
Delayed
Trains
Track Failures and Emergency Remediation 3,113 142 5.1%
Rail and Roadbed 2,387 109 4.0%
Fire, Smoke, Debris 726 33 1.2%
Signal Failures and Emergency Remediation 6,036 274 9.9%
Subway Car 1,539 70 2.5%
Door-Related 382 17 0.6%
Propulsion 179 8 0.3%
Braking 436 20 0.7%
Other 542 25 0.9%
Other Unplanned Disruptions (e.g. station defect) 1,142 52 1.9%
0
Train Brake Activation - cause unknown 596 27 1.0%
Service Delivery (e.g., crew performance) 1,363 62 2.2%
External 7,909 360 13.1%
Public Conduct, Crime, Police Response 3,066 139 5.0%
Sick/Injured Customer 2,288 104 3.8%
Persons on Roadbed (including persons struck by train) 690 31 1.1%
External Debris on Roadbed (e.g., trees, shopping cart) 69 3 0.1%
Other Passenger-Related (e.g., retrieval of property from track) 939 43 1.6%
Public Event (e.g., civil demonstration, parade) 404 18 0.7%
Inclement Weather 393 18 0.7%
Other External Disruptions 60 3 0.1%
Operating Environment 23,576 1,072 38.9%
Planned Right-of-Way Work 15,407 700 25.4%
Total Trains Delayed 60,681 2,758 100%
Subway Weekday Trains DelayedMonthly - May 2018
(24 hours)
Note: Based on new electronic feeds. Root cause analysis and improved categorization of delays is
ongoing.
Chart 20b
Master Page # 50 of 242 - New York City Transit and Bus Committee Meeting 7/23/2018________________________________________________________________________________

Delay Categories
Trains
Delayed
Delayed
Trains Per
Day (21)
% of
Delayed
Trains
Track Failures and Emergency Remediation 362 40 2.4%
Rail and Roadbed 345 38 2.3%
Fire, Smoke, Debris 17 2 0.1%
Signal Failures and Emergency Remediation 688 76 4.6%
Subway Car 163 18 1.1%
Door-Related 47 5 0.3%
Propulsion 4 0 0.0%
Braking 31 3 0.2%
Other 81 9 0.5%
Other Unplanned Disruptions (e.g. station defect) 23 3 0.2%
0
Train Brake Activation - cause unknown 33 4 0.2%
Service Delivery (e.g., crew performance) 228 25 1.5%
External 1,511 168 10.1%
Public Conduct, Crime, Police Response 554 62 3.7%
Sick/Injured Customer 398 44 2.6%
Persons on Roadbed (including persons struck by train) 152 17 1.0%
External Debris on Roadbed (e.g., trees, shopping cart) 19 2 0.1%
Other Passenger-Related (e.g., retrieval of property from track) 59 7 0.4%
Public Event (e.g., civil demonstration, parade) 111 12 0.7%
Inclement Weather 218 24 1.4%
Other External Disruptions 0 0 0.0%
Operating Environment 3,886 432 26.0%
Planned Right-of-Way Work 8,082 898 54.0%
Total Trains Delayed 14,976 1,664 100%
Subway Weekend Trains DelayedMonthly - May 2018
(24 hours)
Note: Based on new electronic feeds. Root cause analysis and improved categorization of delays is
ongoing.
Chart 21b
Master Page # 51 of 242 - New York City Transit and Bus Committee Meeting 7/23/2018________________________________________________________________________________
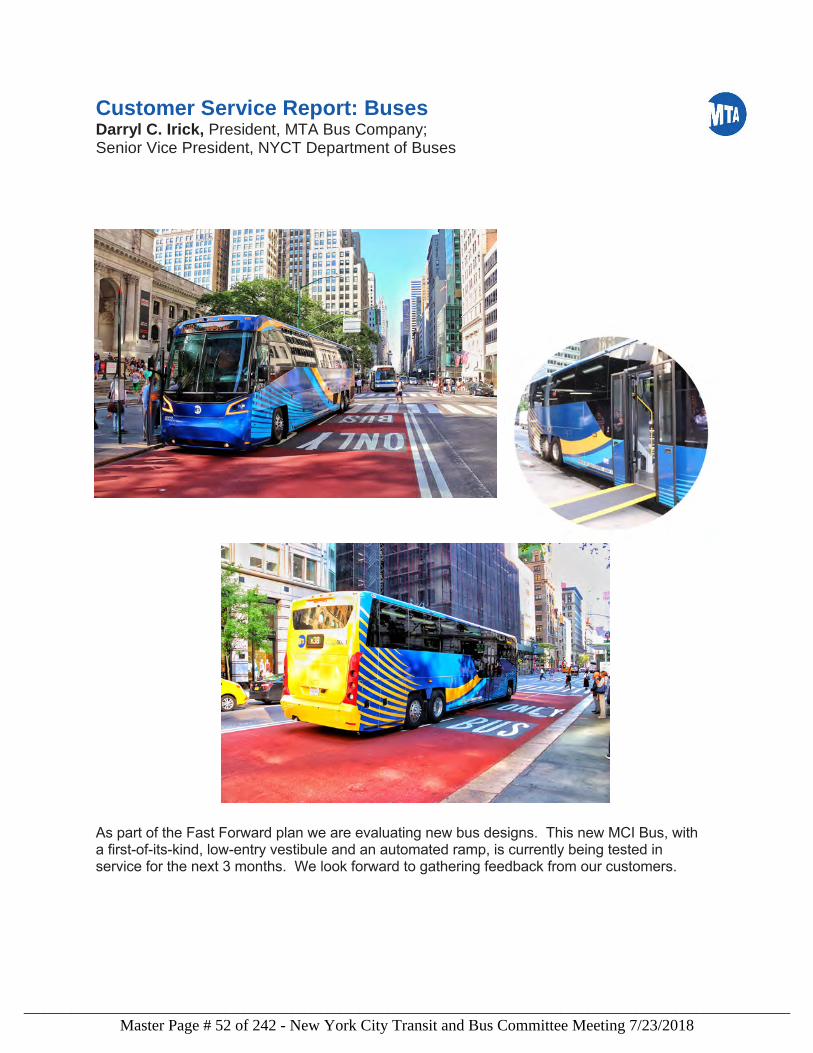
Customer Service Report: Buses Darryl C. Irick, President, MTA Bus Company;Senior Vice President, NYCT Department of Buses
As part of the Fast Forward plan we are evaluating new bus designs. This new MCI Bus, with a first-of-its-kind, low-entry vestibule and an automated ramp, is currently being tested in service for the next 3 months. We look forward to gathering feedback from our customers.
Master Page # 52 of 242 - New York City Transit and Bus Committee Meeting 7/23/2018________________________________________________________________________________
June 2018 Highlights: Buses
Bus performance in June was generally good. Mean Distance Between Failures (MDBF) - our primary maintenance metric - improved by 3.5% against last year on a 12-month average, and by 12.6% for the month of June as compared to last year.
Implementation of the Fast Forward plan remains a key priority. The Department of Buses (DOB) is preparing for the upcoming launch of the Staten Island express bus network redesign going into effect August 19th. A fleet of special mobile information centers has been deployed to various neighborhoods throughout the island and customer ambassadors will be staffing key locations to answer questions, distribute information and get feedback as we intensify outreach ahead of the launch. Meanwhile, we continue to work towards our next borough network redesign in the Bronx. This will also be a customer-driven process and initial public participation sessions begin this fall.
In parallel, we are working on several other short-term strategies to improve service. Last month we announced plans to increase off-peak frequency on the Q6 and Q69 routes in Queens to encourage new ridership. This month we are announcing plans to expand this initiative to three new routes: the B17, B65, and S93. Also, as part of the Q22 service change, we will increase off-peak frequency and improve service reliability by removing closely spaced and underutilized bus stops.
We have been working closely with our partners at the New York City Police Department (NYPD) regarding traffic enforcement issues and have held several meetings, advancing a close collaboration at a central and borough level to address traffic hotspots. So far this year, traffic violation summonses issued by NYPD have increased by over 13% as compared to the same period last year. We will work jointly with them to create dedicated transit-priority traffic teams to continue to clear the way for buses and facilitate traffic flow in congested hotspots.
In coordination with our partners at the NYC Department of Transportation (NYC DOT), we are working to implement traffic improvements to expand bus priority. As part of this process, I am pleased to report that Transit Signal Priority (TSP) was activated on the B35 bus route last month at 51 intersections along Church Avenue in Brooklyn. This will speed up buses for approximately 30,000 weekday customers on one of our busiest bus routes in Brooklyn. It is our 12th TSP enabled route. We plan to implement TSP on the Q52/Q53 and the Q5 later this year and continue to work with NYC DOT to identify additional routes for implementation. We are also continuing to work jointly on other bus priority and traffic improvement measures on high priority corridors and will continue to update you as we implement improvements in the coming months.
Finally, beginning July 1, bicycle racks became available on every bus on the Q50 and Bx23 routes, adding to the 36 buses already in operation on the S53 and S93. Bike racks are a great
Master Page # 53 of 242 - New York City Transit and Bus Committee Meeting 7/23/2018________________________________________________________________________________
amenity for customers who want to increase their mobility and take advantage of the city’s growing network of bike lanes and greenways. The racks help customers transport bikes over a long distance and our buses provide a vital connection for cyclists traversing major crossings such as the Whitestone Bridge.
Engaging all of our stakeholders is critical to the success of our Fast Forward initiatives and these quick wins depict our commitment to listening to what New Yorkers want. We look forward to hearing from our customers and incorporating their feedback in all our initiatives as we continue to move ahead.
Darryl C. Irick President, MTA Bus Company Senior Vice President, NYCT Department of Buses
Master Page # 54 of 242 - New York City Transit and Bus Committee Meeting 7/23/2018________________________________________________________________________________
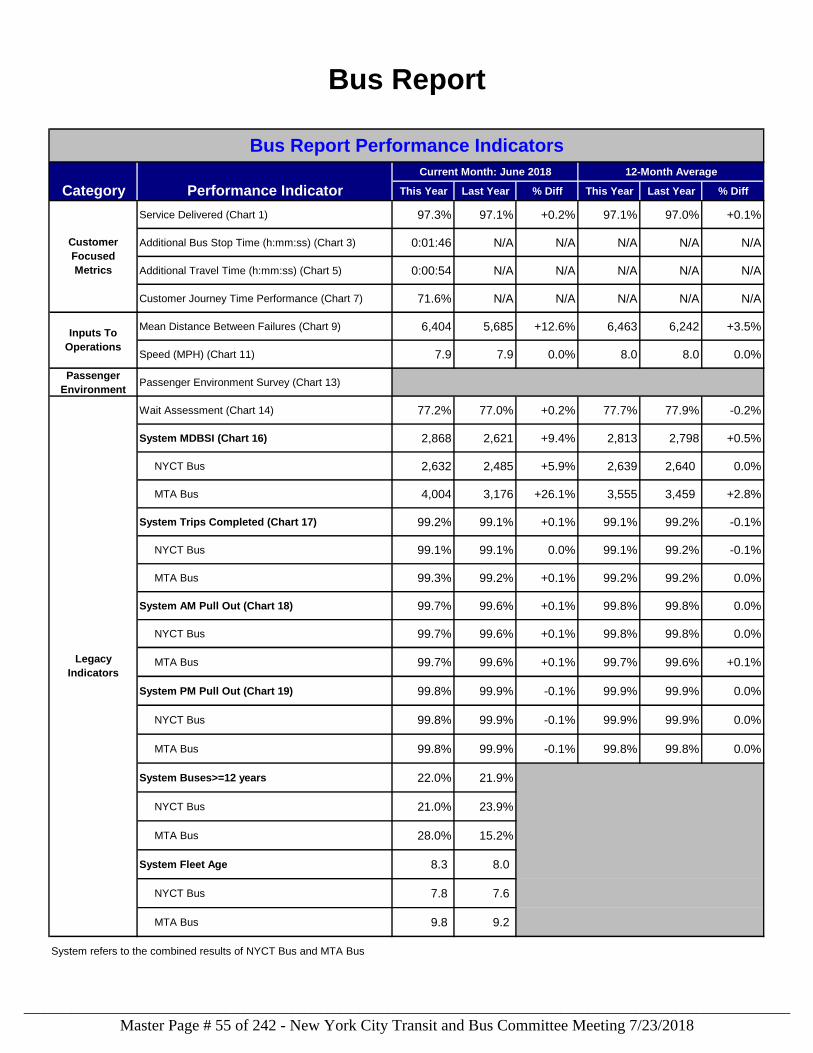
Current Month: June 2018 12-Month Average
This Year Last Year % Diff This Year Last Year % Diff
Service Delivered (Chart 1) 97.3% 97.1% +0.2% 97.1% 97.0% +0.1%
Additional Bus Stop Time (h:mm:ss) (Chart 3) 0:01:46 N/A N/A N/A N/A N/A
Additional Travel Time (h:mm:ss) (Chart 5) 0:00:54 N/A N/A N/A N/A N/A
Customer Journey Time Performance (Chart 7) 71.6% N/A N/A N/A N/A N/A
Mean Distance Between Failures (Chart 9) 6,404 5,685 +12.6% 6,463 6,242 +3.5%
Speed (MPH) (Chart 11) 7.9 7.9 0.0% 8.0 8.0 0.0%
Passenger
EnvironmentPassenger Environment Survey (Chart 13)
Wait Assessment (Chart 14) 77.2% 77.0% +0.2% 77.7% 77.9% -0.2%
System MDBSI (Chart 16) 2,868 2,621 +9.4% 2,813 2,798 +0.5%
NYCT Bus 2,632 2,485 +5.9% 2,639 2,640 0.0%
MTA Bus 4,004 3,176 +26.1% 3,555 3,459 +2.8%
System Trips Completed (Chart 17) 99.2% 99.1% +0.1% 99.1% 99.2% -0.1%
NYCT Bus 99.1% 99.1% 0.0% 99.1% 99.2% -0.1%
MTA Bus 99.3% 99.2% +0.1% 99.2% 99.2% 0.0%
System AM Pull Out (Chart 18) 99.7% 99.6% +0.1% 99.8% 99.8% 0.0%
NYCT Bus 99.7% 99.6% +0.1% 99.8% 99.8% 0.0%
MTA Bus 99.7% 99.6% +0.1% 99.7% 99.6% +0.1%
System PM Pull Out (Chart 19) 99.8% 99.9% -0.1% 99.9% 99.9% 0.0%
NYCT Bus 99.8% 99.9% -0.1% 99.9% 99.9% 0.0%
MTA Bus 99.8% 99.9% -0.1% 99.8% 99.8% 0.0%
System Buses>=12 years 22.0% 21.9%
NYCT Bus 21.0% 23.9%
MTA Bus 28.0% 15.2%
System Fleet Age 8.3 8.0
NYCT Bus 7.8 7.6
MTA Bus 9.8 9.2
System refers to the combined results of NYCT Bus and MTA Bus
Legacy
Indicators
Bus Report
Performance Indicator
Bus Report Performance Indicators
Category
Customer
Focused
Metrics
Inputs To
Operations
Master Page # 55 of 242 - New York City Transit and Bus Committee Meeting 7/23/2018________________________________________________________________________________
Performance Indicator Definitions
Service Delivered
Additional Bus Stop Time (ABST)
Additional Travel Time (ATT)
Customer Journey Time Performance (CJTP)
Section 1: Customer Focused Metrics
Customer Journey Time Performance (CJTP) measures the percentage of customers who
complete their journey (ABST + ATT) within 5 minutes of the scheduled time. This is a new
indicator for the MTA, but is used by other transit agencies to measure service. CJTP is
measured using customers’ MetroCard swipes on buses combined with GPS tracking data
from Bus Time. CJTP is measured from 4 a.m. to 11 p.m.
Additional Bus Stop Time (ABST) is the average added time that customers wait at a stop
for a bus, compared with their scheduled wait time. The measure assumes customers arrive
at the bus stop uniformly, except for routes with longer headways, where customers arrive
more closely aligned to the schedule. ABST (sometimes referred to as Excess Wait Time) is
a new indicator for the MTA, but is considered an industry best practice worldwide. ABST is
measured using customers’ MetroCard swipes on buses combined with GPS tracking data
from Bus Time. ABST is measured from 4 a.m. to 11 p.m.
The metrics in this section measure bus performance as it affects our passengers. By
focusing on how closely actual service matches schedules and how much longer
passengers must wait and ride compared to schedules, these measures collectively reflect
customer experience.
Service Delivered (sometimes referred to as throughput) measures our ability to deliver the
scheduled service. It is calculated as the percentage of scheduled bus trips that are actually
provided during peak hours. Service Delivered is measured at the peak load point, which is
the stop on the route where the bus is most crowded.
• Peak Hours – 7 a.m. to 9 a.m. and 4 p.m. to 7 p.m.
Additional Travel Time (ATT) is the average additional time customers are onboard the bus
compared to the scheduled time. ATT (sometimes referred to as Excess In-Vehicle Travel
Time) is a new indicator for the MTA, but is considered an industry best practice worldwide.
ATT is measured using customers’ MetroCard swipes on buses combined with GPS
tracking data from Bus Time. ATT is measured from 4 a.m. to 11 p.m.
Master Page # 56 of 242 - New York City Transit and Bus Committee Meeting 7/23/2018________________________________________________________________________________
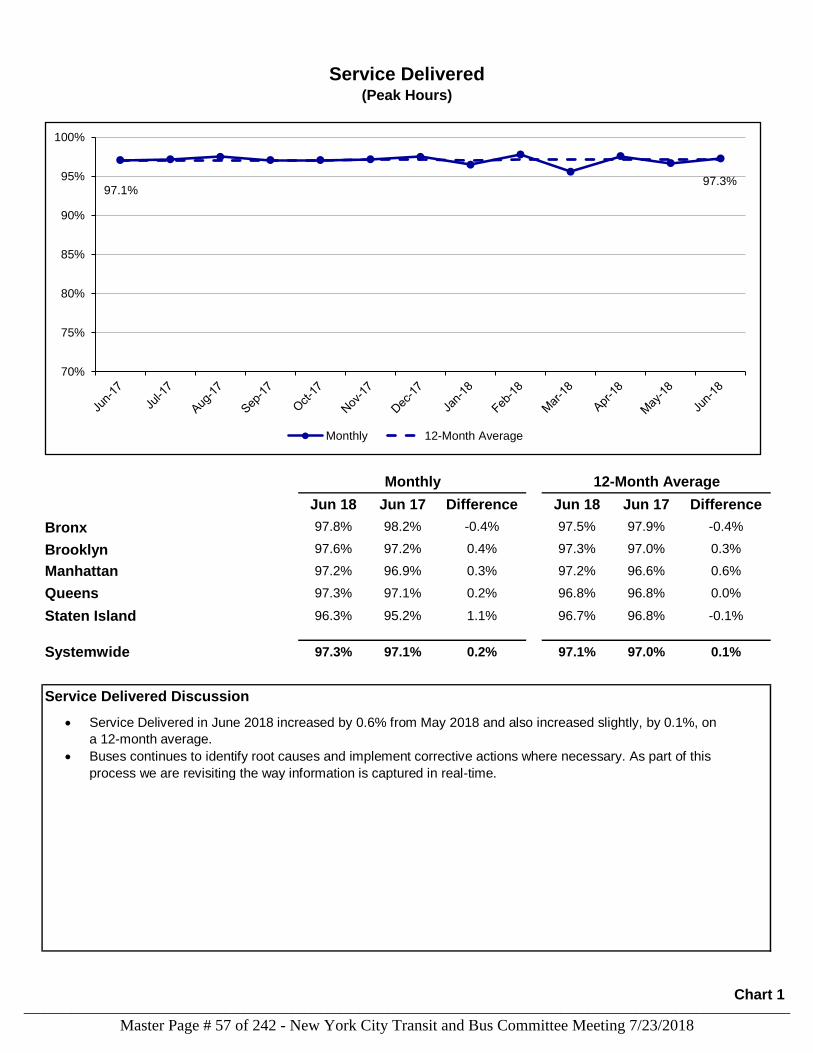
Jun 18 Jun 17 Difference Jun 18 Jun 17 Difference
Bronx 97.8% 98.2% -0.4% 97.5% 97.9% -0.4%
Brooklyn 97.6% 97.2% 0.4% 97.3% 97.0% 0.3%
Manhattan 97.2% 96.9% 0.3% 97.2% 96.6% 0.6%
Queens 97.3% 97.1% 0.2% 96.8% 96.8% 0.0%
Staten Island 96.3% 95.2% 1.1% 96.7% 96.8% -0.1%
Systemwide 97.3% 97.1% 0.2% 97.1% 97.0% 0.1%
Service Delivered Discussion
Monthly 12-Month Average
Service Delivered(Peak Hours)
97.1%97.3%
70%
75%
80%
85%
90%
95%
100%
Monthly 12-Month Average
Service Delivered in June 2018 increased by 0.6% from May 2018 and also increased slightly, by 0.1%, on
a 12-month average.
Buses continues to identify root causes and implement corrective actions where necessary. As part of this
process we are revisiting the way information is captured in real-time.
Chart 1
Master Page # 57 of 242 - New York City Transit and Bus Committee Meeting 7/23/2018________________________________________________________________________________

Borough Jun 18 Jun 17 Difference
Bronx 97.8% 98.2% -0.4%
Bronx Local/Limited 97.9% 98.0% -0.1%
Bronx Select Bus Service 97.6% 99.4% -1.8%
Bronx Express 97.6% 98.8% -1.2%
Brooklyn 97.6% 97.2% +0.4%
Brooklyn Local/Limited 97.7% 97.3% +0.4%
Brooklyn Select Bus Service 96.8% 98.1% -1.3%
Brooklyn Express 97.1% 95.5% +1.6%
Manhattan 97.2% 96.9% +0.3%
Manhattan Local/Limited 96.6% 96.7% -0.1%
Manhattan Select Bus Service 99.0% 97.4% +1.6%
Manhattan Express N/A N/A N/A
Queens 97.3% 97.1% +0.2%
Queens Local/Limited 97.2% 97.0% +0.2%
Queens Select Bus Service 100.7% 99.3% +1.4%
Queens Express 97.7% 97.0% +0.7%
Staten Island 96.3% 95.2% +1.1%
Staten Island Local/Limited 97.0% 95.5% +1.5%
Staten Island Select Bus Service 97.9% 96.9% +1.0%
Staten Island Express 95.5% 94.8% +0.7%
Systemwide 97.3% 97.1% +0.2%
Systemwide Local/Limited 97.3% 97.1% +0.2%
Systemwide Select Bus Service 98.6% 98.0% +0.6%
Systemwide Express 96.7% 96.2% +0.5%
Service DeliveredMonthly
(Peak Hours)
Chart 2
Master Page # 58 of 242 - New York City Transit and Bus Committee Meeting 7/23/2018________________________________________________________________________________
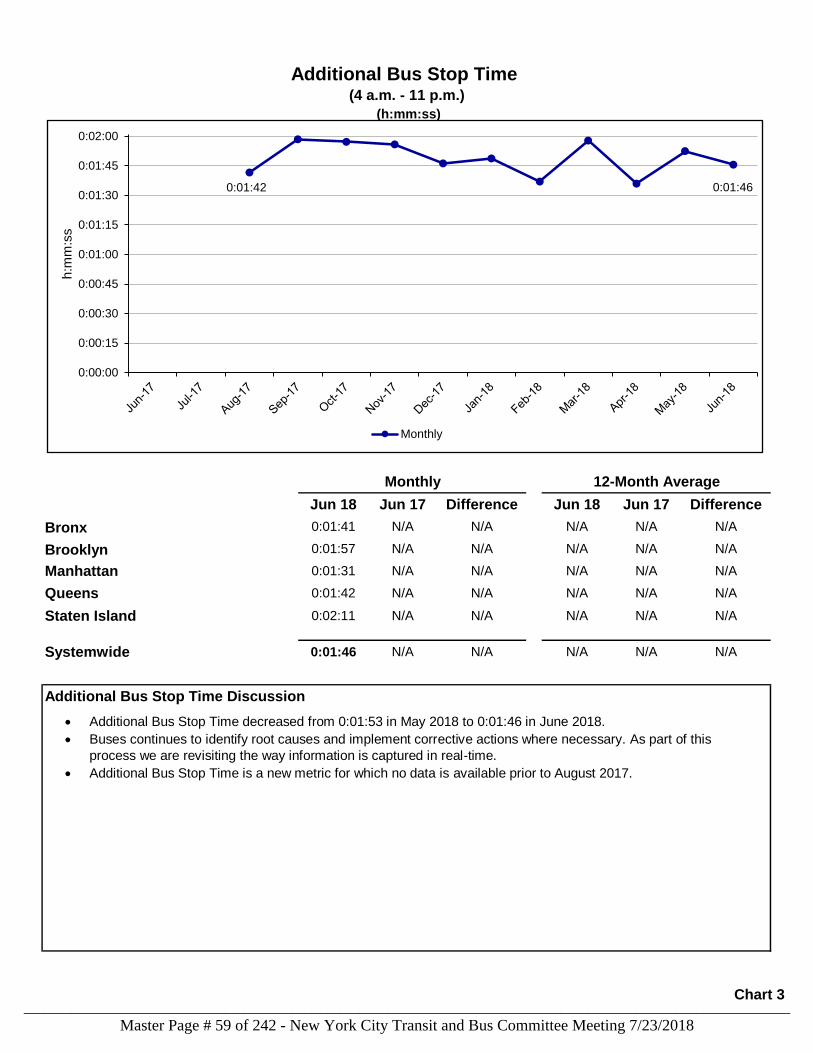
Jun 18 Jun 17 Difference Jun 18 Jun 17 Difference
Bronx 0:01:41 N/A N/A N/A N/A N/A
Brooklyn 0:01:57 N/A N/A N/A N/A N/A
Manhattan 0:01:31 N/A N/A N/A N/A N/A
Queens 0:01:42 N/A N/A N/A N/A N/A
Staten Island 0:02:11 N/A N/A N/A N/A N/A
Systemwide 0:01:46 N/A N/A N/A N/A N/A
Additional Bus Stop Time Discussion
Additional Bus Stop Time (4 a.m. - 11 p.m.)
(h:mm:ss)
Monthly 12-Month Average
0:01:42 0:01:46
0:00:00
0:00:15
0:00:30
0:00:45
0:01:00
0:01:15
0:01:30
0:01:45
0:02:00
h:m
m:s
s
Monthly
Additional Bus Stop Time decreased from 0:01:53 in May 2018 to 0:01:46 in June 2018.
Buses continues to identify root causes and implement corrective actions where necessary. As part of this
process we are revisiting the way information is captured in real-time.
Additional Bus Stop Time is a new metric for which no data is available prior to August 2017.
Chart 3
Master Page # 59 of 242 - New York City Transit and Bus Committee Meeting 7/23/2018________________________________________________________________________________
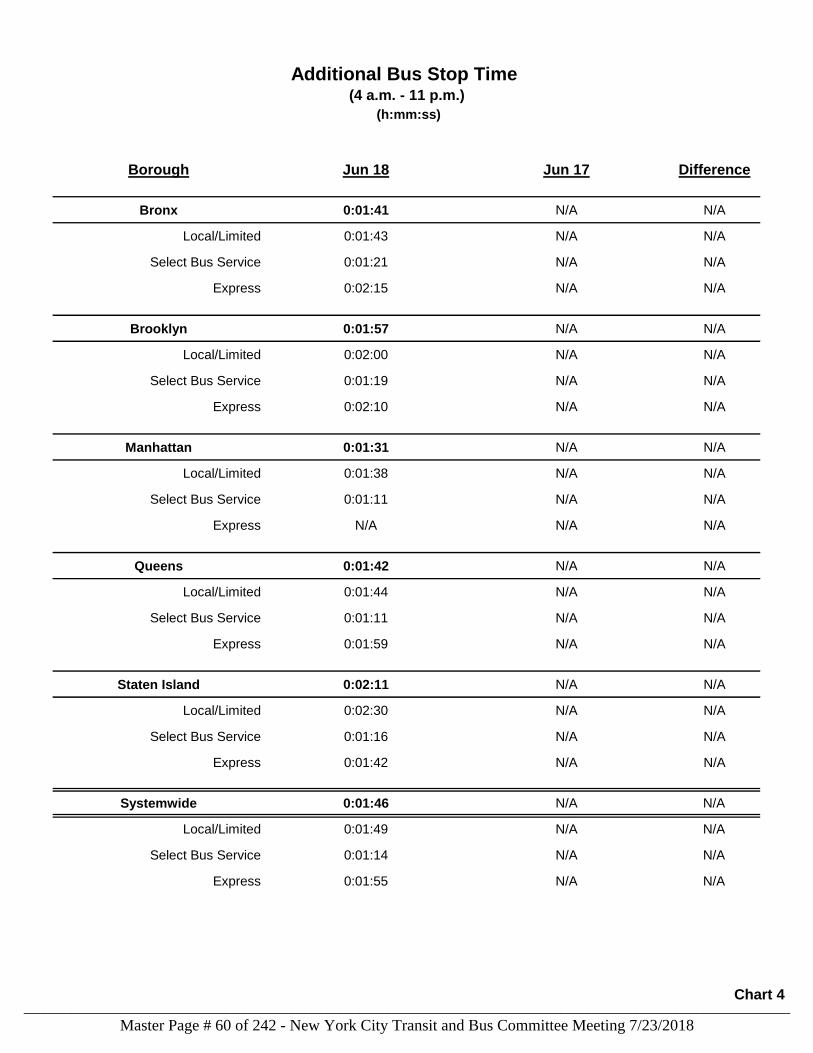
Borough Jun 18 Jun 17 Difference
Bronx 0:01:41 N/A N/A
Bronx Local/Limited 0:01:43 N/A N/A
Bronx Select Bus Service 0:01:21 N/A N/A
Bronx Express 0:02:15 N/A N/A
Brooklyn 0:01:57 N/A N/A
Brooklyn Local/Limited 0:02:00 N/A N/A
Brooklyn Select Bus Service 0:01:19 N/A N/A
Brooklyn Express 0:02:10 N/A N/A
Manhattan 0:01:31 N/A N/A
Manhattan Local/Limited 0:01:38 N/A N/A
Manhattan Select Bus Service 0:01:11 N/A N/A
Manhattan Express N/A N/A N/A
Queens 0:01:42 N/A N/A
Queens Local/Limited 0:01:44 N/A N/A
Queens Select Bus Service 0:01:11 N/A N/A
Queens Express 0:01:59 N/A N/A
Staten Island 0:02:11 N/A N/A
Staten Island Local/Limited 0:02:30 N/A N/A
Staten Island Select Bus Service 0:01:16 N/A N/A
Staten Island Express 0:01:42 N/A N/A
Systemwide 0:01:46 N/A N/A
Systemwide Local/Limited 0:01:49 N/A N/A
Systemwide Select Bus Service 0:01:14 N/A N/A
Systemwide Express 0:01:55 N/A N/A
Additional Bus Stop Time (4 a.m. - 11 p.m.)
(h:mm:ss)
Chart 4
Master Page # 60 of 242 - New York City Transit and Bus Committee Meeting 7/23/2018________________________________________________________________________________
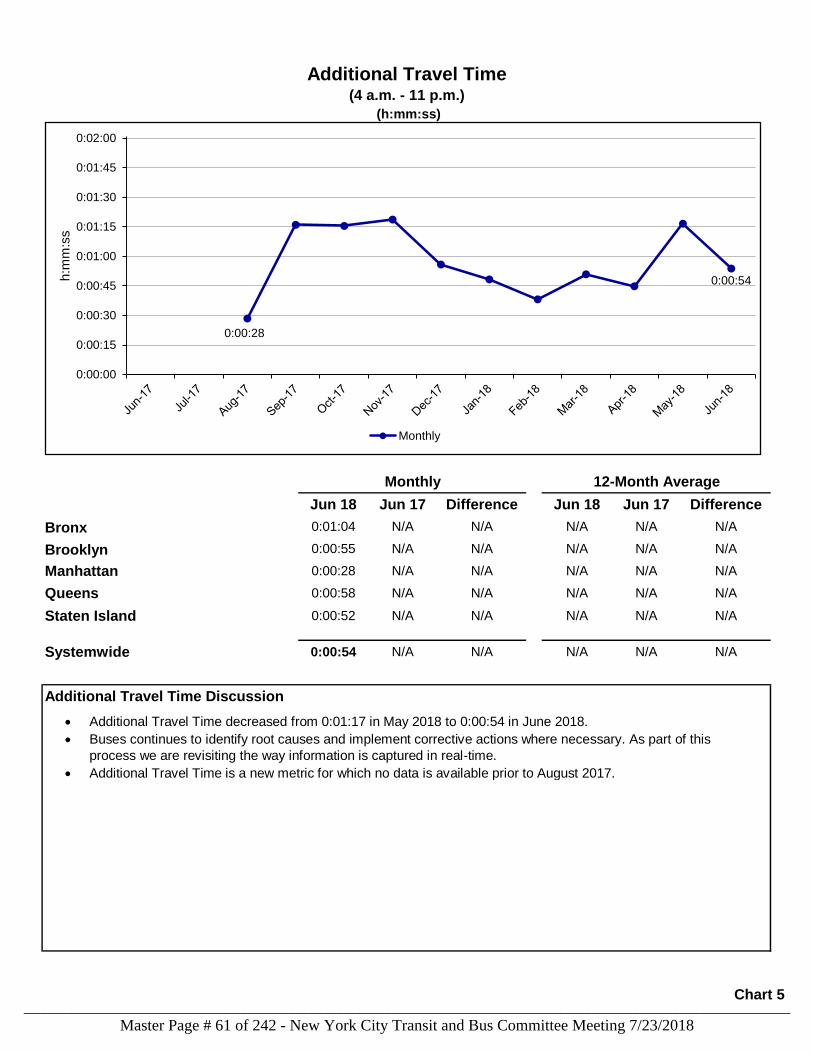
Jun 18 Jun 17 Difference Jun 18 Jun 17 Difference
Bronx 0:01:04 N/A N/A N/A N/A N/A
Brooklyn 0:00:55 N/A N/A N/A N/A N/A
Manhattan 0:00:28 N/A N/A N/A N/A N/A
Queens 0:00:58 N/A N/A N/A N/A N/A
Staten Island 0:00:52 N/A N/A N/A N/A N/A
Systemwide 0:00:54 N/A N/A N/A N/A N/A
Additional Travel Time Discussion
(h:mm:ss)
Monthly 12-Month Average
Additional Travel Time(4 a.m. - 11 p.m.)
0:00:28
0:00:54
0:00:00
0:00:15
0:00:30
0:00:45
0:01:00
0:01:15
0:01:30
0:01:45
0:02:00
h:m
m:s
s
Monthly
Additional Travel Time decreased from 0:01:17 in May 2018 to 0:00:54 in June 2018.
Buses continues to identify root causes and implement corrective actions where necessary. As part of this
process we are revisiting the way information is captured in real-time.
Additional Travel Time is a new metric for which no data is available prior to August 2017.
Chart 5
Master Page # 61 of 242 - New York City Transit and Bus Committee Meeting 7/23/2018________________________________________________________________________________
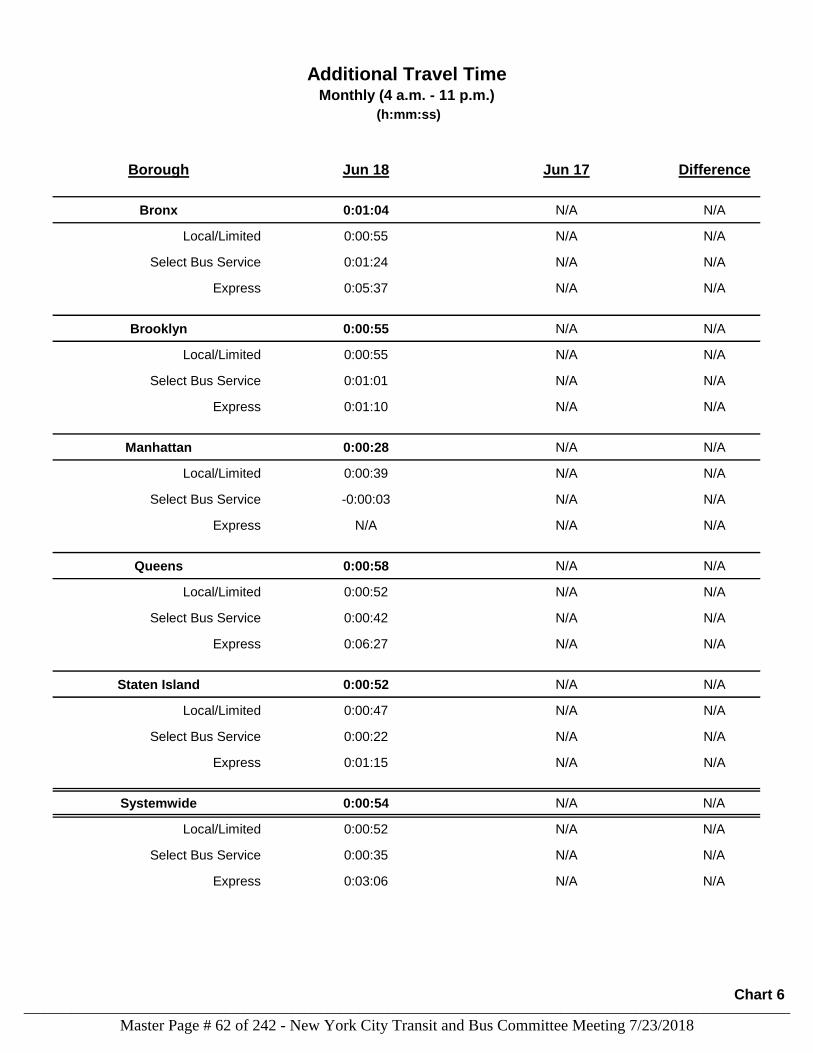
Borough Jun 18 Jun 17 Difference
Bronx 0:01:04 N/A N/A
Bronx Local/Limited 0:00:55 N/A N/A
Bronx Select Bus Service 0:01:24 N/A N/A
Bronx Express 0:05:37 N/A N/A
Brooklyn 0:00:55 N/A N/A
Brooklyn Local/Limited 0:00:55 N/A N/A
Brooklyn Select Bus Service 0:01:01 N/A N/A
Brooklyn Express 0:01:10 N/A N/A
Manhattan 0:00:28 N/A N/A
Manhattan Local/Limited 0:00:39 N/A N/A
Manhattan Select Bus Service -0:00:03 N/A N/A
Manhattan Express N/A N/A N/A
Queens 0:00:58 N/A N/A
Queens Local/Limited 0:00:52 N/A N/A
Queens Select Bus Service 0:00:42 N/A N/A
Queens Express 0:06:27 N/A N/A
Staten Island 0:00:52 N/A N/A
Staten Island Local/Limited 0:00:47 N/A N/A
Staten Island Select Bus Service 0:00:22 N/A N/A
Staten Island Express 0:01:15 N/A N/A
Systemwide 0:00:54 N/A N/A
Systemwide Local/Limited 0:00:52 N/A N/A
Systemwide Select Bus Service 0:00:35 N/A N/A
Systemwide Express 0:03:06 N/A N/A
Additional Travel TimeMonthly (4 a.m. - 11 p.m.)
(h:mm:ss)
Chart 6
Master Page # 62 of 242 - New York City Transit and Bus Committee Meeting 7/23/2018________________________________________________________________________________
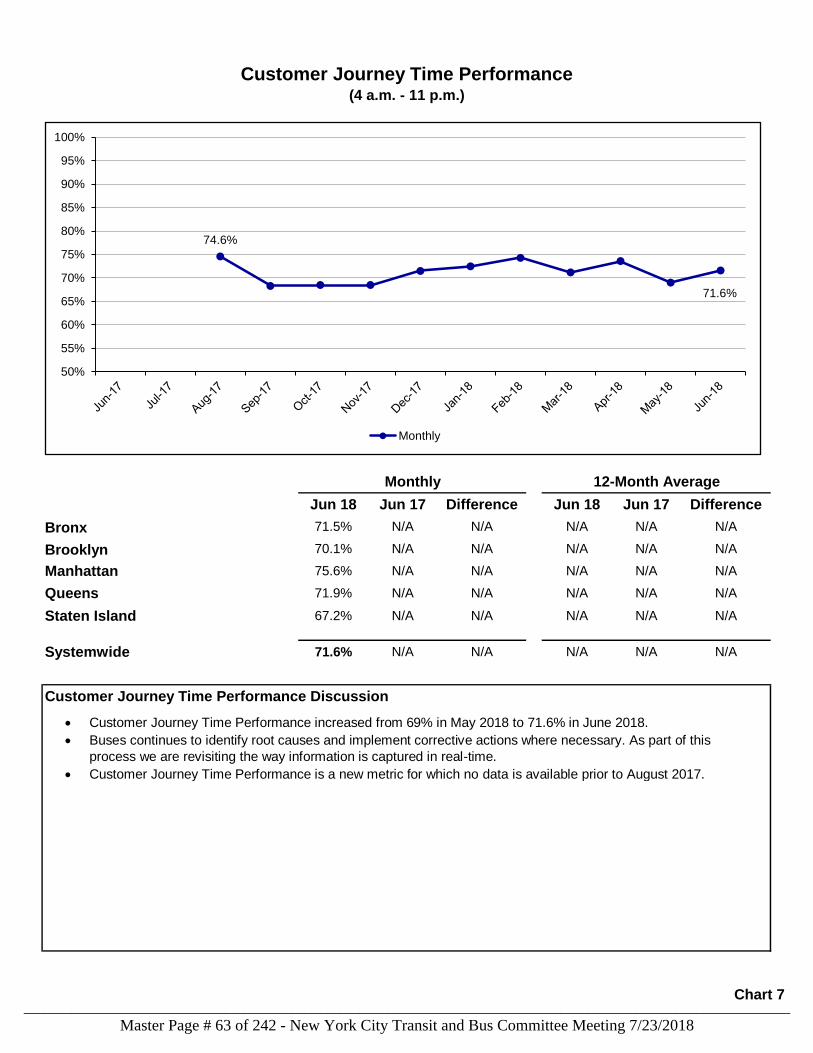
Jun 18 Jun 17 Difference Jun 18 Jun 17 Difference
Bronx 71.5% N/A N/A N/A N/A N/A
Brooklyn 70.1% N/A N/A N/A N/A N/A
Manhattan 75.6% N/A N/A N/A N/A N/A
Queens 71.9% N/A N/A N/A N/A N/A
Staten Island 67.2% N/A N/A N/A N/A N/A
Systemwide 71.6% N/A N/A N/A N/A N/A
Customer Journey Time Performance Discussion
Monthly 12-Month Average
Customer Journey Time Performance(4 a.m. - 11 p.m.)
74.6%
71.6%
50%
55%
60%
65%
70%
75%
80%
85%
90%
95%
100%
Monthly
Customer Journey Time Performance increased from 69% in May 2018 to 71.6% in June 2018.
Buses continues to identify root causes and implement corrective actions where necessary. As part of this
process we are revisiting the way information is captured in real-time.
Customer Journey Time Performance is a new metric for which no data is available prior to August 2017.
Chart 7
Master Page # 63 of 242 - New York City Transit and Bus Committee Meeting 7/23/2018________________________________________________________________________________
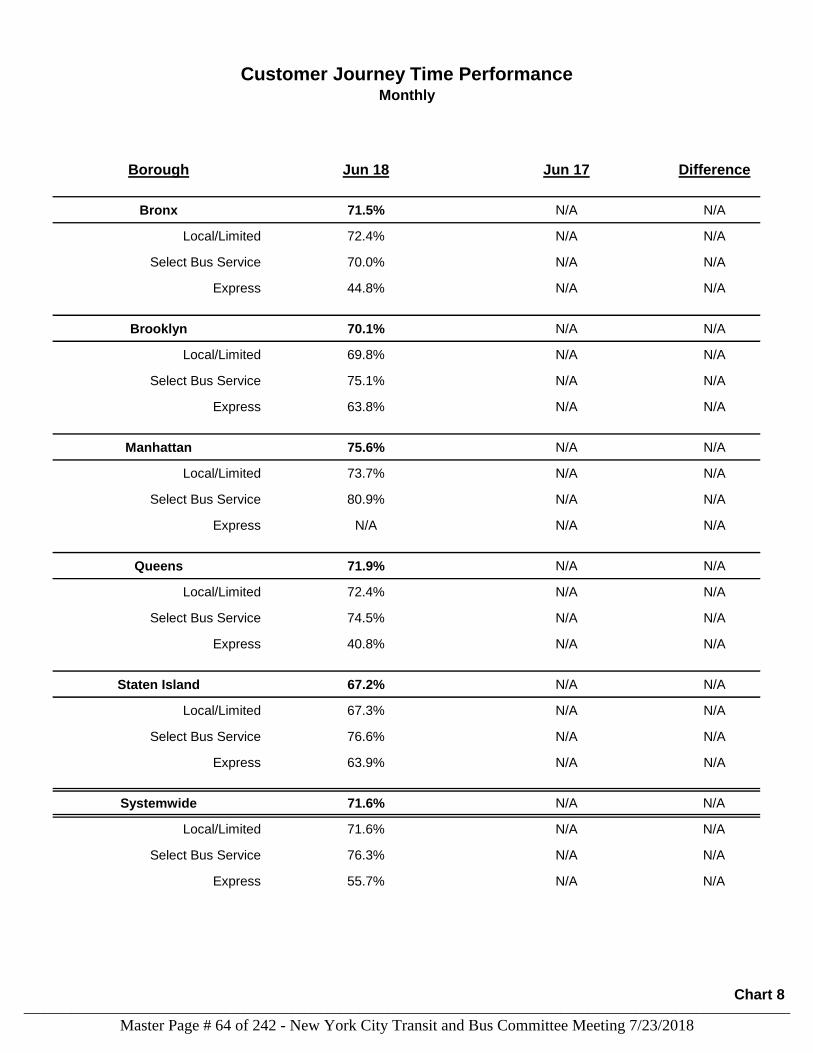
Borough Jun 18 Jun 17 Difference
Bronx 71.5% N/A N/A
Bronx Local/Limited 72.4% N/A N/A
Bronx Select Bus Service 70.0% N/A N/A
Bronx Express 44.8% N/A N/A
Brooklyn 70.1% N/A N/A
Brooklyn Local/Limited 69.8% N/A N/A
Brooklyn Select Bus Service 75.1% N/A N/A
Brooklyn Express 63.8% N/A N/A
Manhattan 75.6% N/A N/A
Manhattan Local/Limited 73.7% N/A N/A
Manhattan Select Bus Service 80.9% N/A N/A
Manhattan Express N/A N/A N/A
Queens 71.9% N/A N/A
Queens Local/Limited 72.4% N/A N/A
Queens Select Bus Service 74.5% N/A N/A
Queens Express 40.8% N/A N/A
Staten Island 67.2% N/A N/A
Staten Island Local/Limited 67.3% N/A N/A
Staten Island Select Bus Service 76.6% N/A N/A
Staten Island Express 63.9% N/A N/A
Systemwide 71.6% N/A N/A
Systemwide Local/Limited 71.6% N/A N/A
Systemwide Select Bus Service 76.3% N/A N/A
Systemwide Express 55.7% N/A N/A
Customer Journey Time PerformanceMonthly
Chart 8
Master Page # 64 of 242 - New York City Transit and Bus Committee Meeting 7/23/2018________________________________________________________________________________
Performance Indicator Definitions
Mean Distance Between Failures (MDBF)
Bus Speeds
Bus speeds measure how quickly buses travel along their routes. The average end-to-end
speed is the total distance traveled along a route divided by the total time, using Bus Time
data.
Mean Distance Between Failures (MDBF) reports how frequently mechanical problems such
as engine failures or electrical malfunctions cause delays. It is calculated by dividing the
number of miles buses run in service by the number of incidents due to mechanical
problems.
MDBF numbers include weekdays and weekends. This borough and trip-type combinations
(Chart 10) are reported as a 12-month average.
Section 2: Inputs to Operations
The metrics in this section address how NYCT provides service to its customers by
measuring the reliability of bus performance and the impact of bus speed on operations.
Master Page # 65 of 242 - New York City Transit and Bus Committee Meeting 7/23/2018________________________________________________________________________________
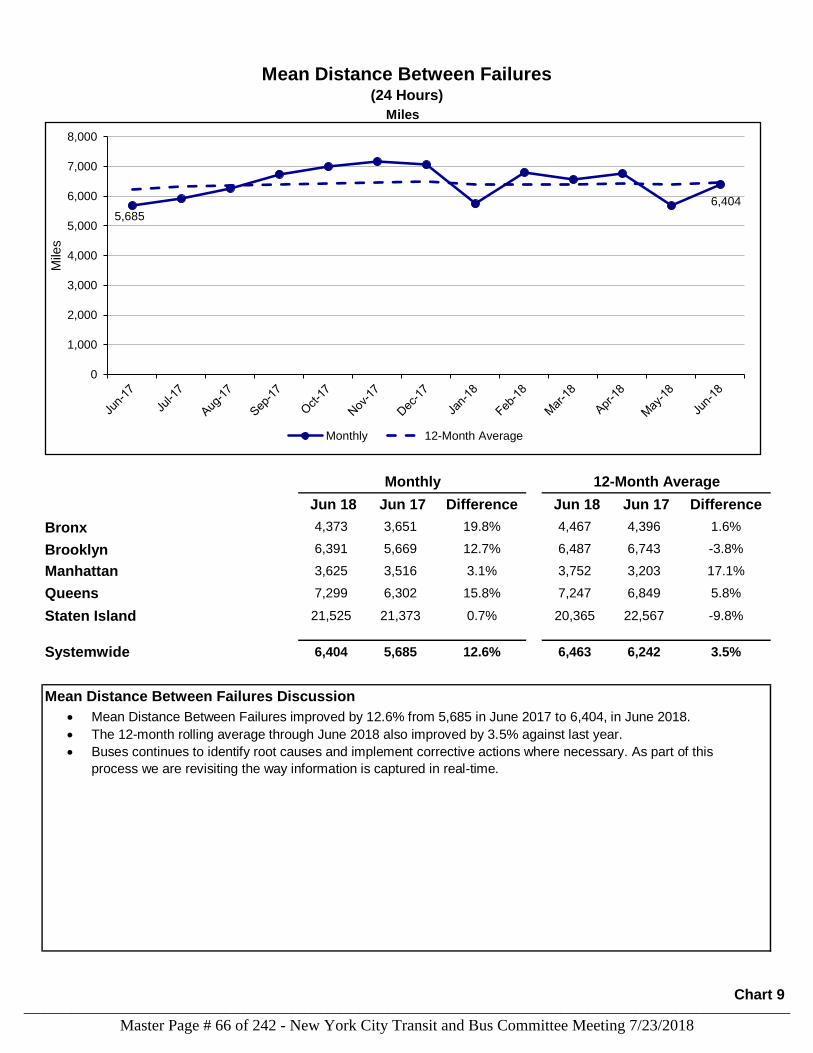
Miles
Jun 18 Jun 17 Difference Jun 18 Jun 17 Difference
Bronx 4,373 3,651 19.8% 4,467 4,396 1.6%
Brooklyn 6,391 5,669 12.7% 6,487 6,743 -3.8%
Manhattan 3,625 3,516 3.1% 3,752 3,203 17.1%
Queens 7,299 6,302 15.8% 7,247 6,849 5.8%
Staten Island 21,525 21,373 0.7% 20,365 22,567 -9.8%
Systemwide 6,404 5,685 12.6% 6,463 6,242 3.5%
Mean Distance Between Failures Discussion
Monthly 12-Month Average
Mean Distance Between Failures(24 Hours)
5,685
6,404
0
1,000
2,000
3,000
4,000
5,000
6,000
7,000
8,000
Mile
s
Monthly 12-Month Average
Mean Distance Between Failures improved by 12.6% from 5,685 in June 2017 to 6,404, in June 2018.
The 12-month rolling average through June 2018 also improved by 3.5% against last year.
Buses continues to identify root causes and implement corrective actions where necessary. As part of this
process we are revisiting the way information is captured in real-time.
Chart 9
Master Page # 66 of 242 - New York City Transit and Bus Committee Meeting 7/23/2018________________________________________________________________________________
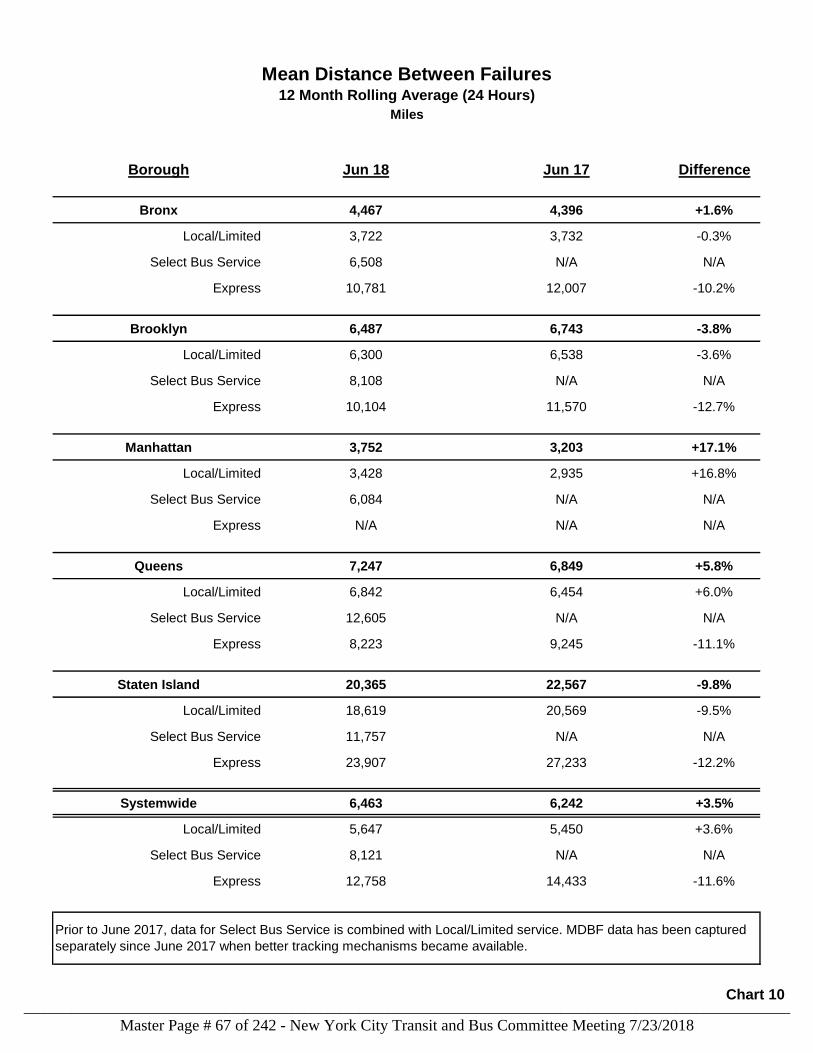
Borough Jun 18 Jun 17 Difference
Bronx 4,467 4,396 +1.6%
Bronx Local/Limited 3,722 3,732 -0.3%
Bronx Select Bus Service 6,508 N/A N/A
Bronx Express 10,781 12,007 -10.2%
Brooklyn 6,487 6,743 -3.8%
Brooklyn Local/Limited 6,300 6,538 -3.6%
Brooklyn Select Bus Service 8,108 N/A N/A
Brooklyn Express 10,104 11,570 -12.7%
Manhattan 3,752 3,203 +17.1%
Manhattan Local/Limited 3,428 2,935 +16.8%
Manhattan Select Bus Service 6,084 N/A N/A
Manhattan Express N/A N/A N/A
Queens 7,247 6,849 +5.8%
Queens Local/Limited 6,842 6,454 +6.0%
Queens Select Bus Service 12,605 N/A N/A
Queens Express 8,223 9,245 -11.1%
Staten Island 20,365 22,567 -9.8%
Staten Island Local/Limited 18,619 20,569 -9.5%
Staten Island Select Bus Service 11,757 N/A N/A
Staten Island Express 23,907 27,233 -12.2%
Systemwide 6,463 6,242 +3.5%
Systemwide Local/Limited 5,647 5,450 +3.6%
Systemwide Select Bus Service 8,121 N/A N/A
Systemwide Express 12,758 14,433 -11.6%
Mean Distance Between Failures12 Month Rolling Average (24 Hours)
Miles
Prior to June 2017, data for Select Bus Service is combined with Local/Limited service. MDBF data has been captured
separately since June 2017 when better tracking mechanisms became available.
Chart 10
Master Page # 67 of 242 - New York City Transit and Bus Committee Meeting 7/23/2018________________________________________________________________________________
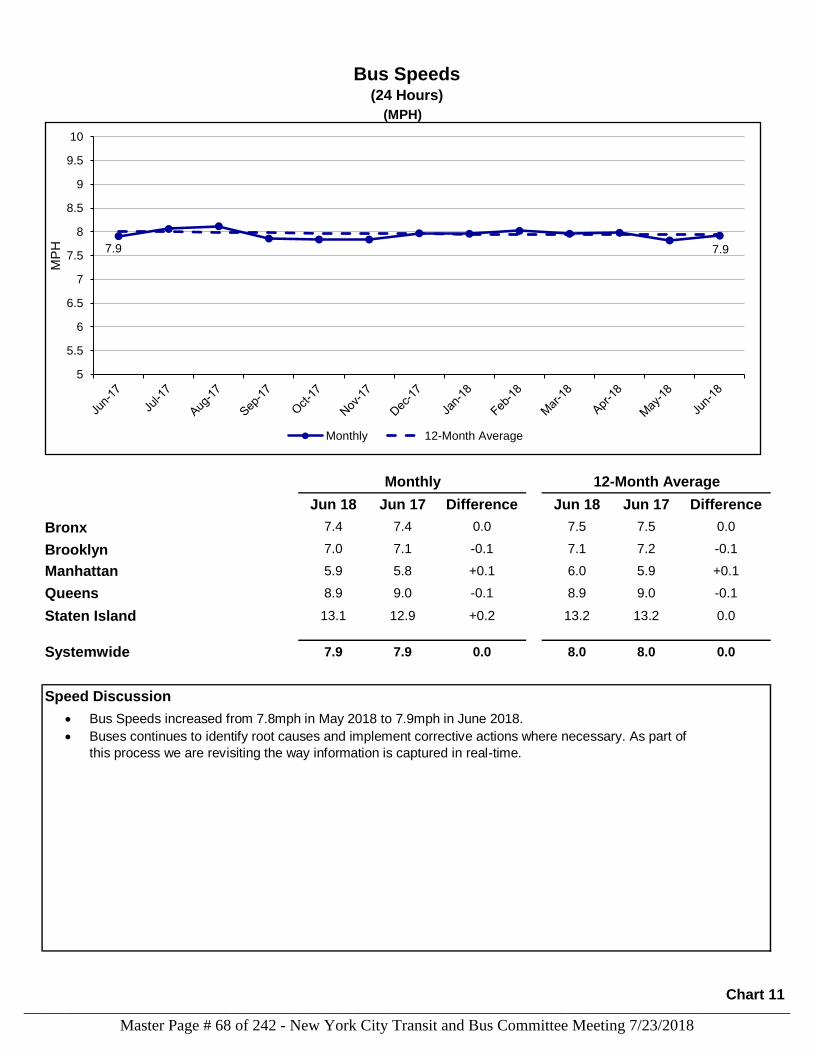
(MPH)
Jun 18 Jun 17 Difference Jun 18 Jun 17 Difference
Bronx 7.4 7.4 0.0 7.5 7.5 0.0
Brooklyn 7.0 7.1 -0.1 7.1 7.2 -0.1
Manhattan 5.9 5.8 +0.1 6.0 5.9 +0.1
Queens 8.9 9.0 -0.1 8.9 9.0 -0.1
Staten Island 13.1 12.9 +0.2 13.2 13.2 0.0
Systemwide 7.9 7.9 0.0 8.0 8.0 0.0
Speed Discussion
Monthly 12-Month Average
Bus Speeds(24 Hours)
7.9 7.9
5
5.5
6
6.5
7
7.5
8
8.5
9
9.5
10
MP
H
Monthly 12-Month Average
Bus Speeds increased from 7.8mph in May 2018 to 7.9mph in June 2018.
Buses continues to identify root causes and implement corrective actions where necessary. As part of
this process we are revisiting the way information is captured in real-time.
Chart 11
Master Page # 68 of 242 - New York City Transit and Bus Committee Meeting 7/23/2018________________________________________________________________________________
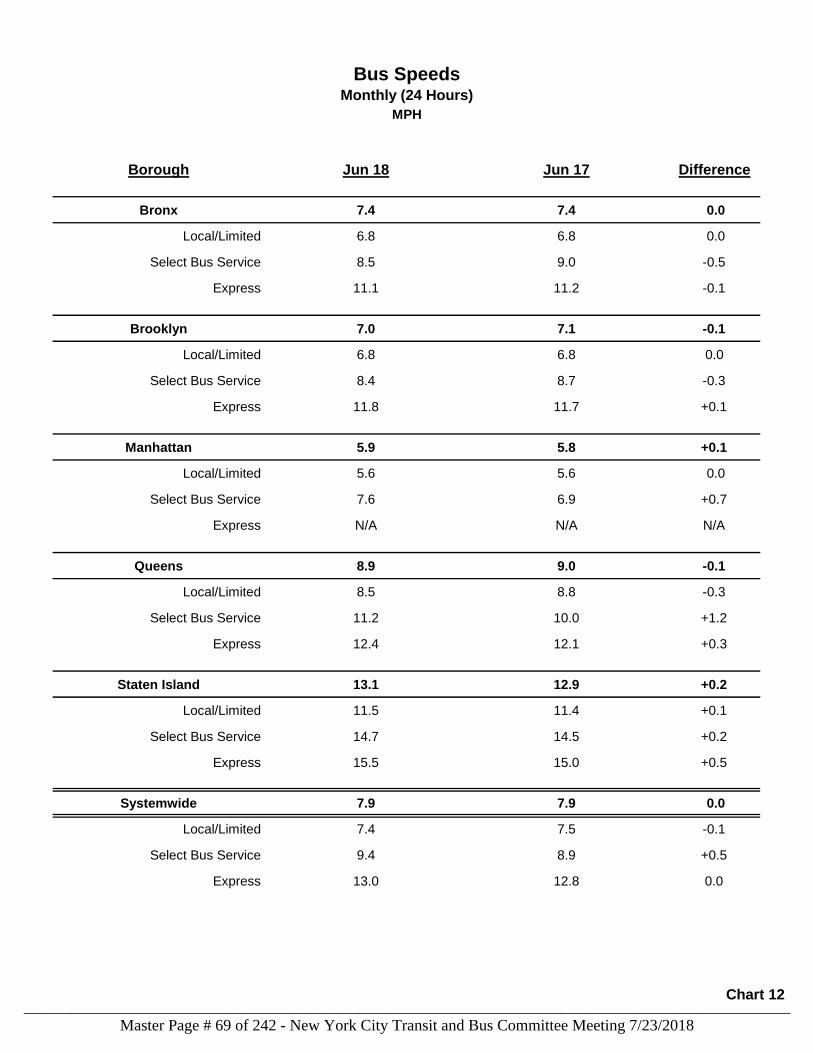
Borough Jun 18 Jun 17 Difference
Bronx 7.4 7.4 0.0
Bronx Local/Limited 6.8 6.8 0.0
Bronx Select Bus Service 8.5 9.0 -0.5
Bronx Express 11.1 11.2 -0.1
Brooklyn 7.0 7.1 -0.1
Brooklyn Local/Limited 6.8 6.8 0.0
Brooklyn Select Bus Service 8.4 8.7 -0.3
Brooklyn Express 11.8 11.7 +0.1
Manhattan 5.9 5.8 +0.1
Manhattan Local/Limited 5.6 5.6 0.0
Manhattan Select Bus Service 7.6 6.9 +0.7
Manhattan Express N/A N/A N/A
Queens 8.9 9.0 -0.1
Queens Local/Limited 8.5 8.8 -0.3
Queens Select Bus Service 11.2 10.0 +1.2
Queens Express 12.4 12.1 +0.3
Staten Island 13.1 12.9 +0.2
Staten Island Local/Limited 11.5 11.4 +0.1
Staten Island Select Bus Service 14.7 14.5 +0.2
Staten Island Express 15.5 15.0 +0.5
Systemwide 7.9 7.9 0.0
Systemwide Local/Limited 7.4 7.5 -0.1
Systemwide Select Bus Service 9.4 8.9 +0.5
Systemwide Express 13.0 12.8 0.0
Bus SpeedsMonthly (24 Hours)
MPH
Chart 12
Master Page # 69 of 242 - New York City Transit and Bus Committee Meeting 7/23/2018________________________________________________________________________________
Performance Indicator Definitions
Passenger Environment Survey
Appearance: For example, do the buses appear clean? Are they free of graffiti?
Equipment: For example, do the heat, air conditioning, and wheelchair lift work?
Information:
Section 3: Passenger Environment
The metrics in this section affect the customer experience in terms of cleanliness and the
functionality of the equipment they encounter on their travels.
Passenger Environment Survey (PES) indicators combine the results of surveys of a number
of different aspects of bus vehicle and operating conditions in three categories:
Separate surveys are conducted for local and express buses. Express buses are only
surveyed for appearance and equipment indicators.
Surveys are conducted between 4 a.m. and 11 p.m. on weekdays. This number is reported as
a 12-month average.
For example, is the information helpful and appropriate? Are the electronic signs
correct? Are the announcements clear?
Master Page # 70 of 242 - New York City Transit and Bus Committee Meeting 7/23/2018________________________________________________________________________________
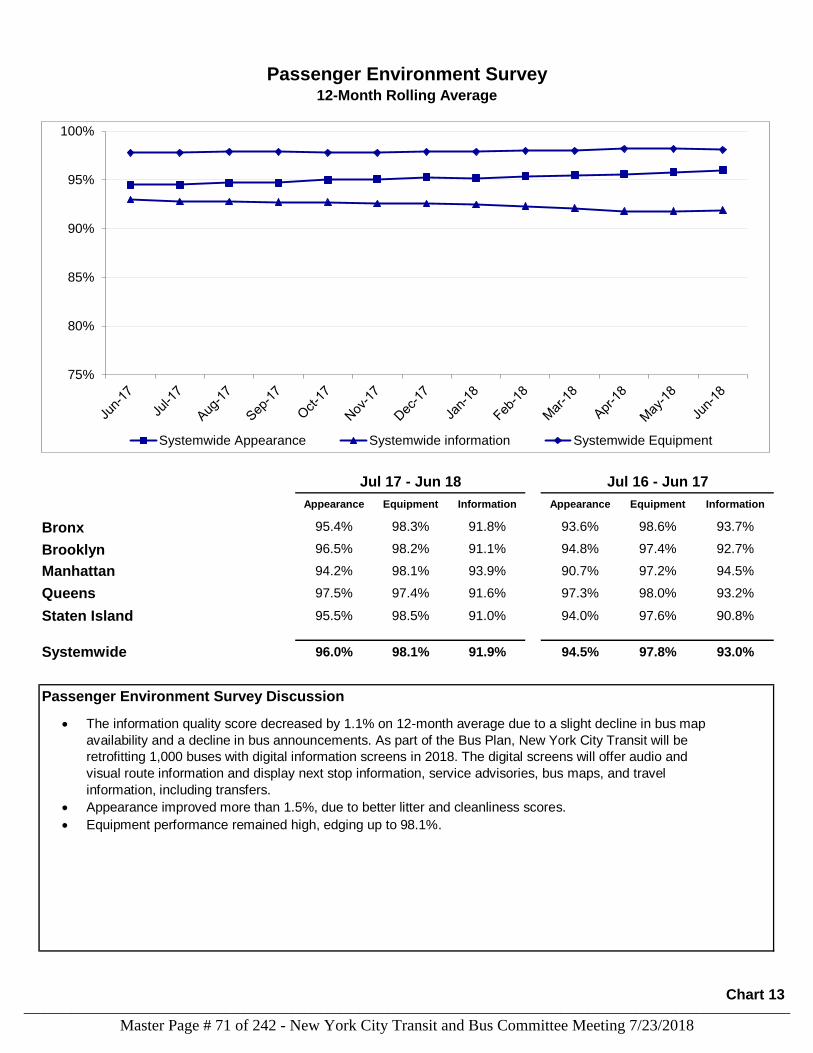
Appearance Equipment Information Appearance Equipment Information
Bronx 95.4% 98.3% 91.8% 93.6% 98.6% 93.7%
Brooklyn 96.5% 98.2% 91.1% 94.8% 97.4% 92.7%
Manhattan 94.2% 98.1% 93.9% 90.7% 97.2% 94.5%
Queens 97.5% 97.4% 91.6% 97.3% 98.0% 93.2%
Staten Island 95.5% 98.5% 91.0% 94.0% 97.6% 90.8%
Systemwide 96.0% 98.1% 91.9% 94.5% 97.8% 93.0%
Passenger Environment Survey Discussion
Passenger Environment Survey12-Month Rolling Average
Jul 17 - Jun 18 Jul 16 - Jun 17
The information quality score decreased by 1.1% on 12-month average due to a slight decline in bus map
availability and a decline in bus announcements. As part of the Bus Plan, New York City Transit will be
retrofitting 1,000 buses with digital information screens in 2018. The digital screens will offer audio and
visual route information and display next stop information, service advisories, bus maps, and travel
information, including transfers.
Appearance improved more than 1.5%, due to better litter and cleanliness scores.
Equipment performance remained high, edging up to 98.1%.
75%
80%
85%
90%
95%
100%
Systemwide Appearance Systemwide information Systemwide Equipment
Chart 13
Master Page # 71 of 242 - New York City Transit and Bus Committee Meeting 7/23/2018________________________________________________________________________________
Performance Indicator Definitions
Wait Assessment
Bus Mean Distance Between Service Interruptions
Bus Percentage of Completed Trips
Bus AM Weekday Pull Out Performance
Bus PM Weekday Pull Out Performance
Bus Percentage of Completed Trips is the percent of trips completed system wide for the 12-
month period. The sytemwide metrics is the combined results of NYCT Bus and MTA Bus.
Bus AM Weekday Pull Out Performance is the percent of required buses and operators
available in the AM peak period. The sytemwide metric is the combined results of NYCT Bus
and MTA Bus.
Bus PM Weekday Pull Out Performance is the percent of required buses and operators
available in the PM peak period. The sytemwide metric is the combined results of NYCT Bus
and MTA Bus.
Section 4: Legacy Indicators
Wait Assessment (WA) measures how evenly buses are spaced. It is defined as the
percentage of actual intervals between buses that are no more than three minutes over the
scheduled interval for the morning (7 a.m.-9 a.m.) and afternoon (4 p.m.-7 p.m.) peak
periods and no more than five minutes over the scheduled interval for the rest of the day.
This measure provides a percentage of buses passing the standard, but it does not account
for extra service operated, it is not weighted to how many customers are waiting for buses at
different stops, it does not distinguish between relatively minor gaps in service and major
delays, and it is not a true measurement of time customers spend waiting at stops.
Bus Mean Distance Between Service Interruptions is the average distance traveled by a bus
between all delays and/or inconveniences to customers within a 12-month period. All road
calls caused by both mechanical and non-mechanical failures are included.
The metrics in this section have been shared with the public for many years. While less
reflective of the customer experience, they are included here for continuity purposes.
Master Page # 72 of 242 - New York City Transit and Bus Committee Meeting 7/23/2018________________________________________________________________________________
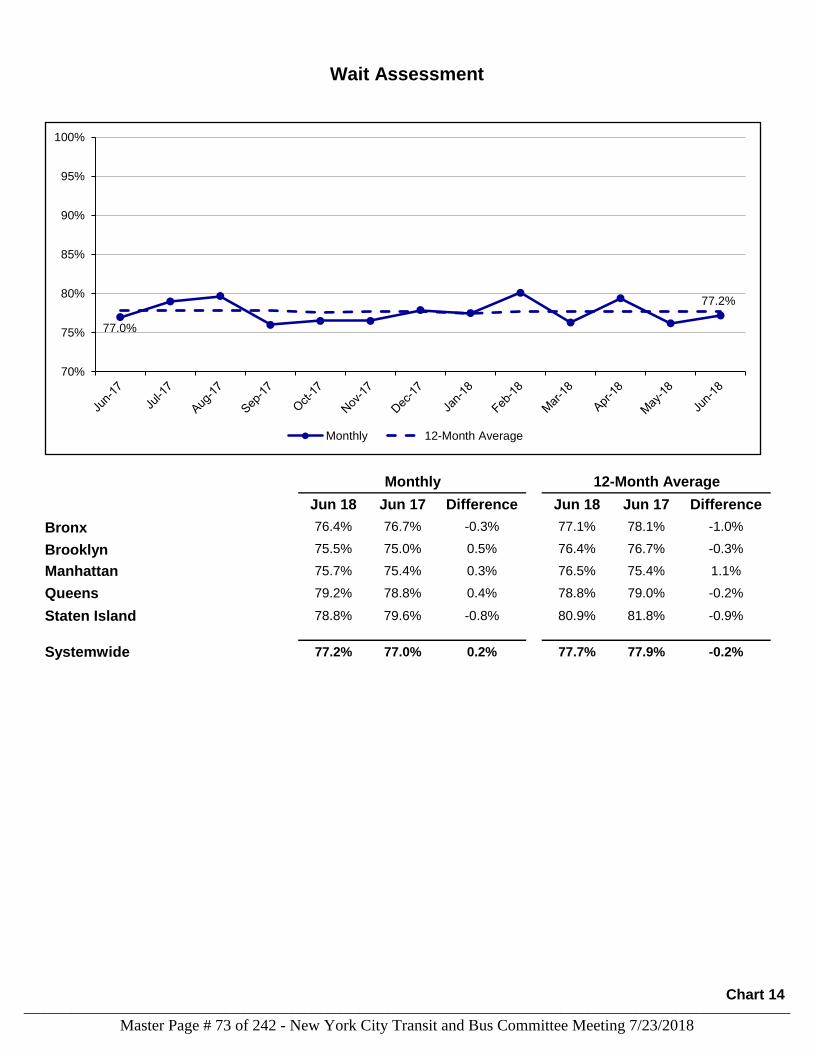
Jun 18 Jun 17 Difference Jun 18 Jun 17 Difference
Bronx 76.4% 76.7% -0.3% 77.1% 78.1% -1.0%
Brooklyn 75.5% 75.0% 0.5% 76.4% 76.7% -0.3%
Manhattan 75.7% 75.4% 0.3% 76.5% 75.4% 1.1%
Queens 79.2% 78.8% 0.4% 78.8% 79.0% -0.2%
Staten Island 78.8% 79.6% -0.8% 80.9% 81.8% -0.9%
Systemwide 77.2% 77.0% 0.2% 77.7% 77.9% -0.2%
Wait Assessment
Monthly 12-Month Average
77.0%
77.2%
70%
75%
80%
85%
90%
95%
100%
Monthly 12-Month Average
Chart 14
Master Page # 73 of 242 - New York City Transit and Bus Committee Meeting 7/23/2018________________________________________________________________________________
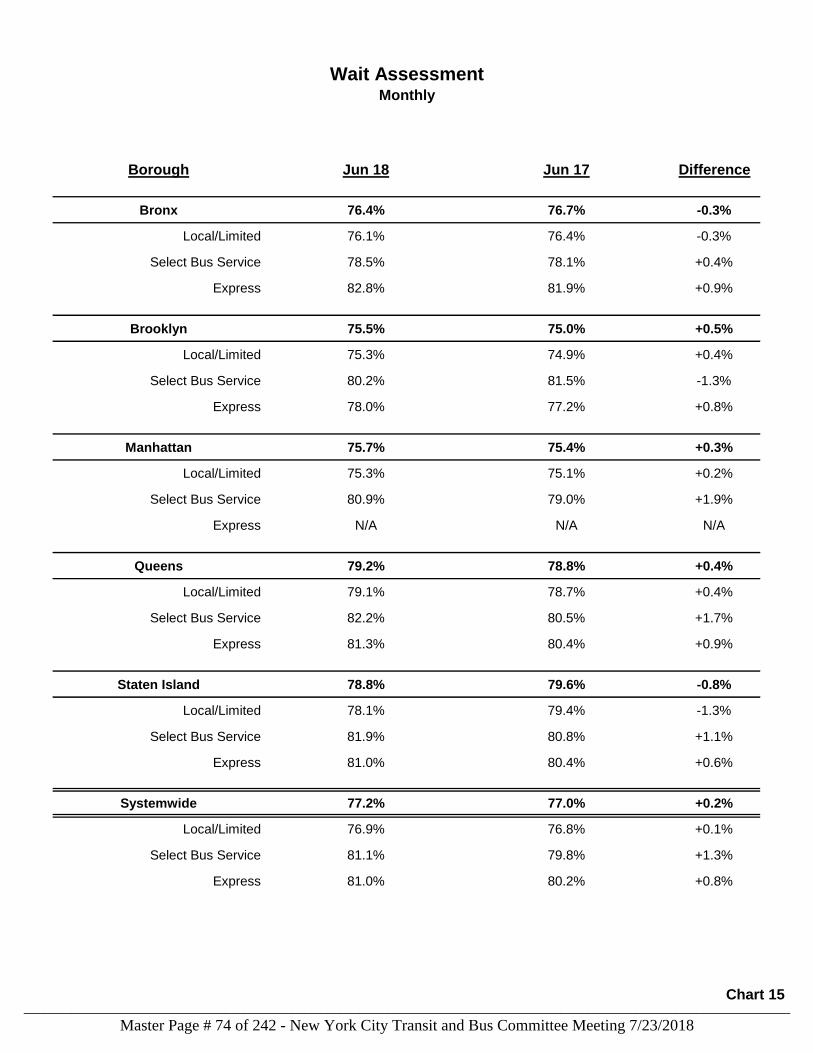
Borough Jun 18 Jun 17 Difference
Bronx 76.4% 76.7% -0.3%
Bronx Local/Limited 76.1% 76.4% -0.3%
Bronx Select Bus Service 78.5% 78.1% +0.4%
Bronx Express 82.8% 81.9% +0.9%
Brooklyn 75.5% 75.0% +0.5%
Brooklyn Local/Limited 75.3% 74.9% +0.4%
Brooklyn Select Bus Service 80.2% 81.5% -1.3%
Brooklyn Express 78.0% 77.2% +0.8%
Manhattan 75.7% 75.4% +0.3%
Manhattan Local/Limited 75.3% 75.1% +0.2%
Manhattan Select Bus Service 80.9% 79.0% +1.9%
Manhattan Express N/A N/A N/A
Queens 79.2% 78.8% +0.4%
Queens Local/Limited 79.1% 78.7% +0.4%
Queens Select Bus Service 82.2% 80.5% +1.7%
Queens Express 81.3% 80.4% +0.9%
Staten Island 78.8% 79.6% -0.8%
Staten Island Local/Limited 78.1% 79.4% -1.3%
Staten Island Select Bus Service 81.9% 80.8% +1.1%
Staten Island Express 81.0% 80.4% +0.6%
Systemwide 77.2% 77.0% +0.2%
Systemwide Local/Limited 76.9% 76.8% +0.1%
Systemwide Select Bus Service 81.1% 79.8% +1.3%
Systemwide Express 81.0% 80.2% +0.8%
Wait AssessmentMonthly
Chart 15
Master Page # 74 of 242 - New York City Transit and Bus Committee Meeting 7/23/2018________________________________________________________________________________
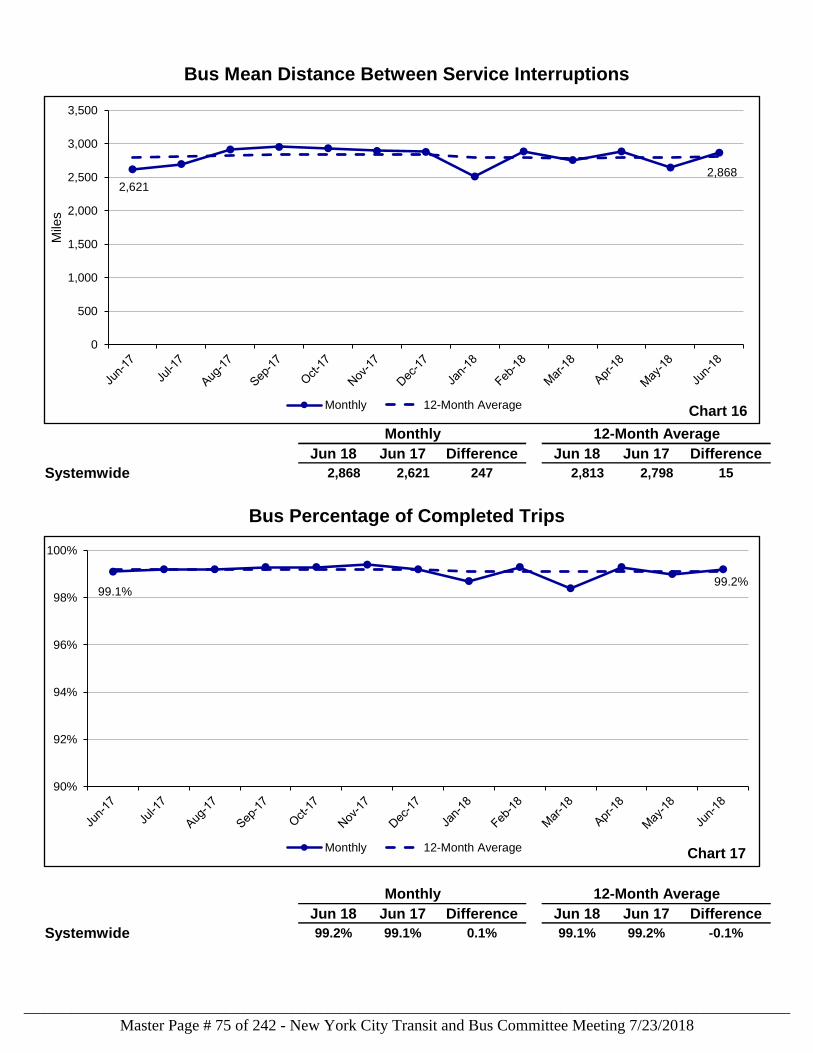
Jun 18 Jun 17 Difference Jun 18 Jun 17 Difference
Systemwide 2,868 2,621 247 2,813 2,798 15
Jun 18 Jun 17 Difference Jun 18 Jun 17 Difference
Systemwide 99.2% 99.1% 0.1% 99.1% 99.2% -0.1%
Monthly 12-Month Average
Bus Mean Distance Between Service Interruptions
Monthly 12-Month Average
Bus Percentage of Completed Trips
2,621
2,868
0
500
1,000
1,500
2,000
2,500
3,000
3,500
Mile
s
Chart 16Monthly 12-Month Average
99.1%99.2%
90%
92%
94%
96%
98%
100%
Chart 17Monthly 12-Month Average
Master Page # 75 of 242 - New York City Transit and Bus Committee Meeting 7/23/2018________________________________________________________________________________
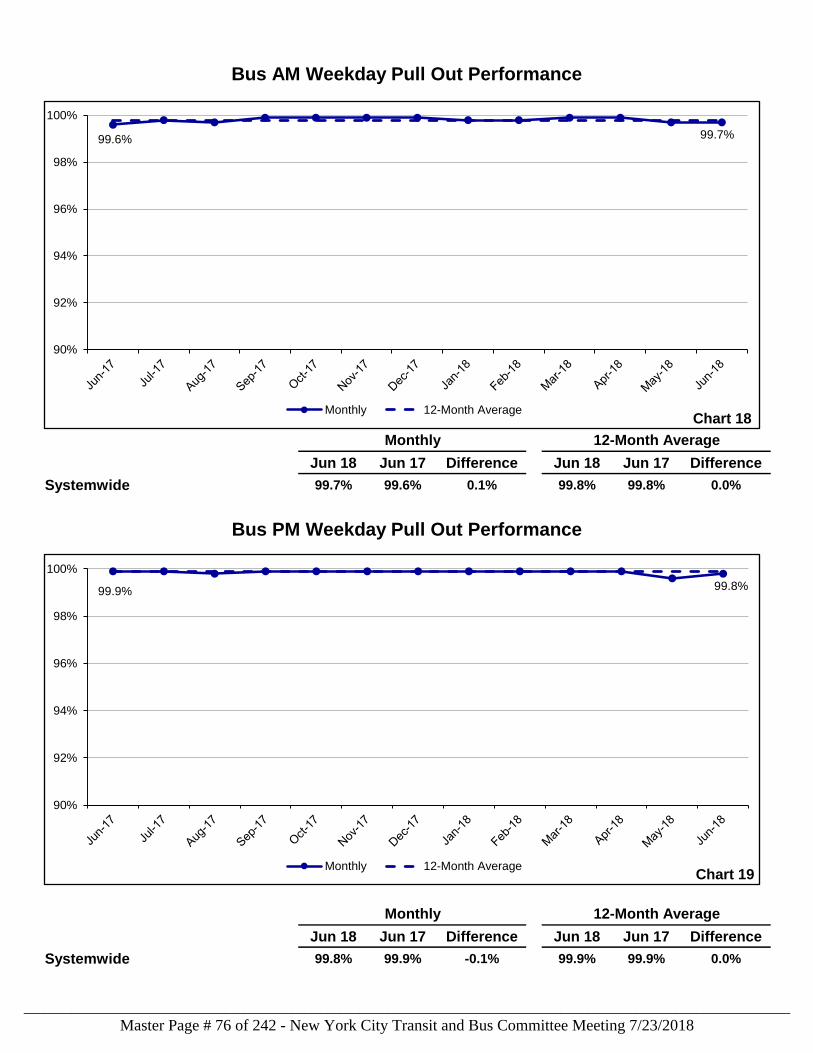
Jun 18 Jun 17 Difference Jun 18 Jun 17 Difference
Systemwide 99.7% 99.6% 0.1% 99.8% 99.8% 0.0%
Jun 18 Jun 17 Difference Jun 18 Jun 17 Difference
Systemwide 99.8% 99.9% -0.1% 99.9% 99.9% 0.0%
Bus AM Weekday Pull Out Performance
Monthly 12-Month Average
Bus PM Weekday Pull Out Performance
Monthly 12-Month Average
99.6% 99.7%
90%
92%
94%
96%
98%
100%
Chart 18Monthly 12-Month Average
99.9% 99.8%
90%
92%
94%
96%
98%
100%
Chart 19Monthly 12-Month Average
Master Page # 76 of 242 - New York City Transit and Bus Committee Meeting 7/23/2018________________________________________________________________________________
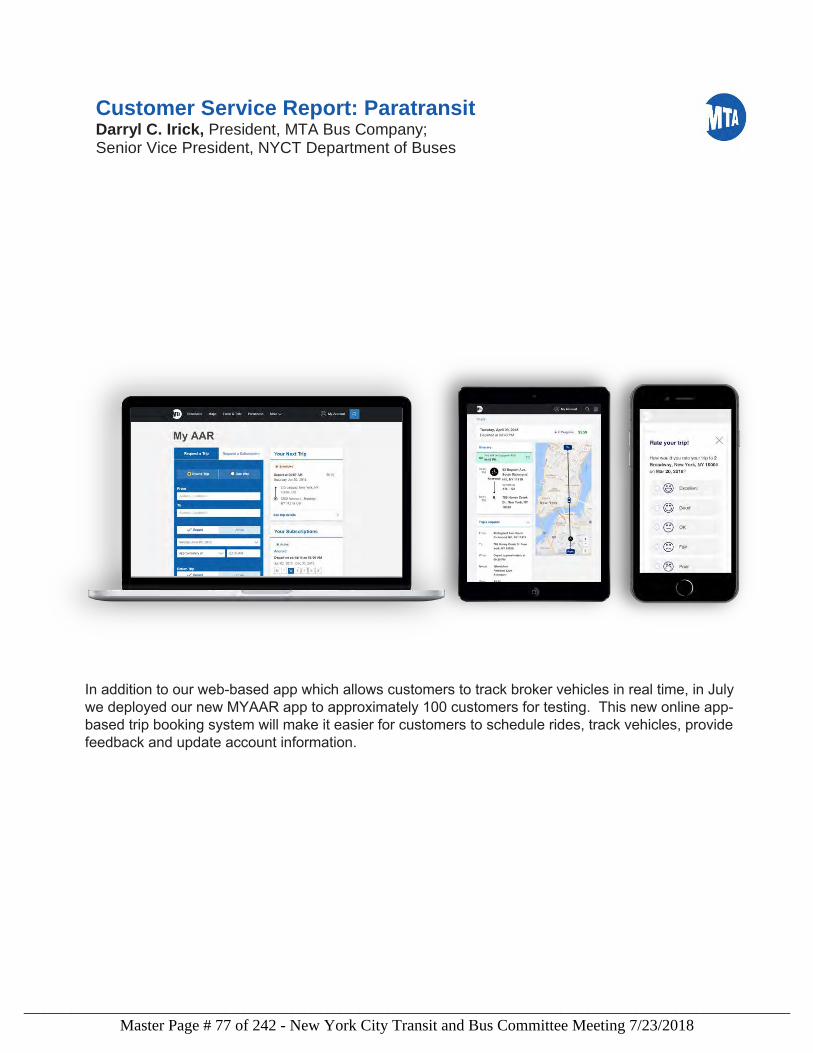
Customer Service Report: ParatransitDarryl C. Irick, President, MTA Bus Company;Senior Vice President, NYCT Department of Buses
In addition to our web-based app which allows customers to track broker vehicles in real time, in July we deployed our new MYAAR app to approximately 100 customers for testing. This new online app-based trip booking system will make it easier for customers to schedule rides, track vehicles, provide feedback and update account information.
Master Page # 77 of 242 - New York City Transit and Bus Committee Meeting 7/23/2018________________________________________________________________________________
June 2018 Highlights: Paratransit
Performance on a 12-month average remains stable even with a 15% growth in ridership as compared to last year. There was a slight decline in performance in May resulting primarily from several system outages of our automatic vehicle monitoring system. We are working to address this issue going forward.
Our e-hail pilot program continues to exceed expectations resulting in ridership growth. Approximately 1,200 customers enrolled in the on-demand portion of the pilot have taken around 62,000 on-demand trips since the end of last year. Our data shows that customers enrolled in this premium service on-demand pilot are taking almost twice as many trips than last year.
As I have noted over the last several Committee meetings, we recognize the new and unprecedented flexibility that on-demand e-hail offers our customers and are working to develop a second phase of the pilot, which will expand on-demand service to a larger customer base in a responsible and fiscally sustainable way. Lessons learned from the first phase of the pilot and from e-hail models used at other Paratransit agencies throughout the country will help inform the second phase of the pilot where we intend to gather additional data that will serve to shape the Paratransit program.
This month we also began testing of our new MyAAR app deploying it to up to 100 customers. The new app will make it easier for customers to schedule rides, track vehicles, provide feedback and update account information. We look forward to incorporating customer feedback and making improvements to the app as we begin the full rollout later this year.
Darryl C. Irick President, MTA Bus Company Senior Vice President, NYCT Department of Buses
Master Page # 78 of 242 - New York City Transit and Bus Committee Meeting 7/23/2018________________________________________________________________________________
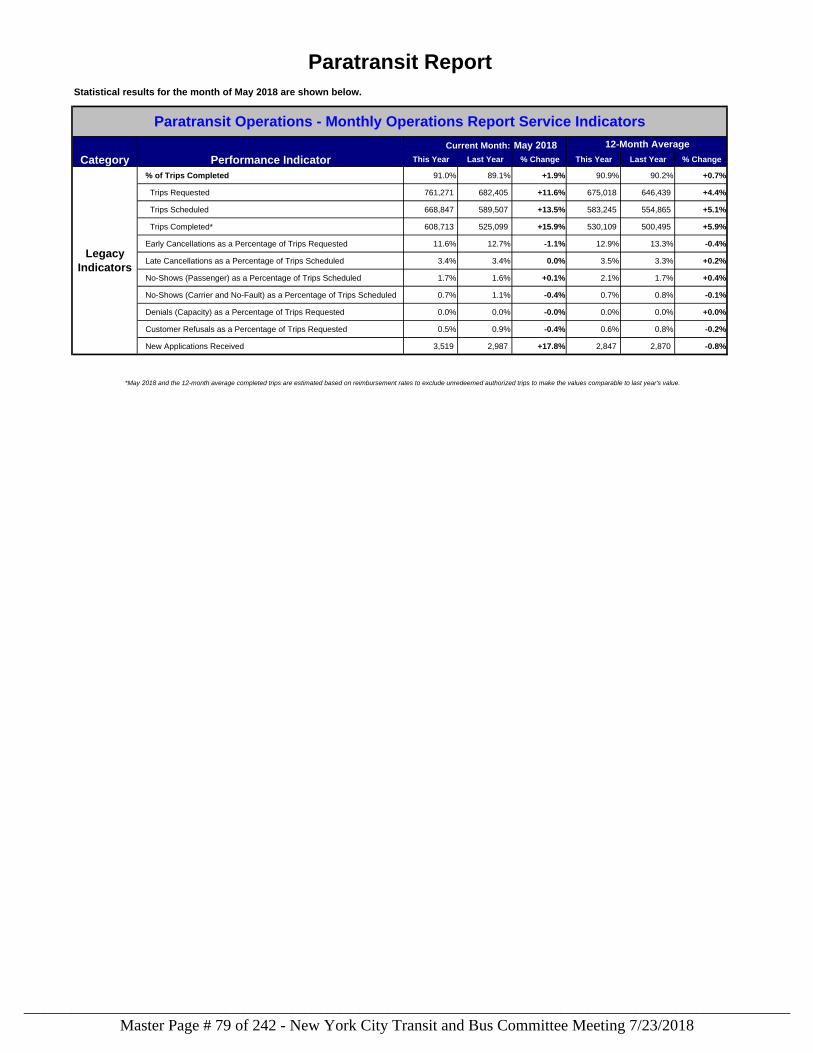
May 2018 12-Month Average
This Year Last Year % Change This Year Last Year % Change
% of Trips Completed 91.0% 89.1% +1.9% 90.9% 90.2% +0.7%
Trips Requested 761,271 682,405 +11.6% 675,018 646,439 +4.4%
Trips Scheduled 668,847 589,507 +13.5% 583,245 554,865 +5.1%
Trips Completed* 608,713 525,099 +15.9% 530,109 500,495 +5.9%
Early Cancellations as a Percentage of Trips Requested 11.6% 12.7% -1.1% 12.9% 13.3% -0.4%
Late Cancellations as a Percentage of Trips Scheduled 3.4% 3.4% 0.0% 3.5% 3.3% +0.2%
No-Shows (Passenger) as a Percentage of Trips Scheduled 1.7% 1.6% +0.1% 2.1% 1.7% +0.4%
No-Shows (Carrier and No-Fault) as a Percentage of Trips Scheduled 0.7% 1.1% -0.4% 0.7% 0.8% -0.1%
Denials (Capacity) as a Percentage of Trips Requested 0.0% 0.0% -0.0% 0.0% 0.0% +0.0%
Customer Refusals as a Percentage of Trips Requested 0.5% 0.9% -0.4% 0.6% 0.8% -0.2%
New Applications Received 3,519 2,987 +17.8% 2,847 2,870 -0.8%
Paratransit Report
Statistical results for the month of May 2018 are shown below.
Paratransit Operations - Monthly Operations Report Service Indicators
Category Performance Indicator
Current Month:
*May 2018 and the 12-month average completed trips are estimated based on reimbursement rates to exclude unredeemed authorized trips to make the values comparable to last year's value.
Legacy
Indicators
Master Page # 79 of 242 - New York City Transit and Bus Committee Meeting 7/23/2018________________________________________________________________________________
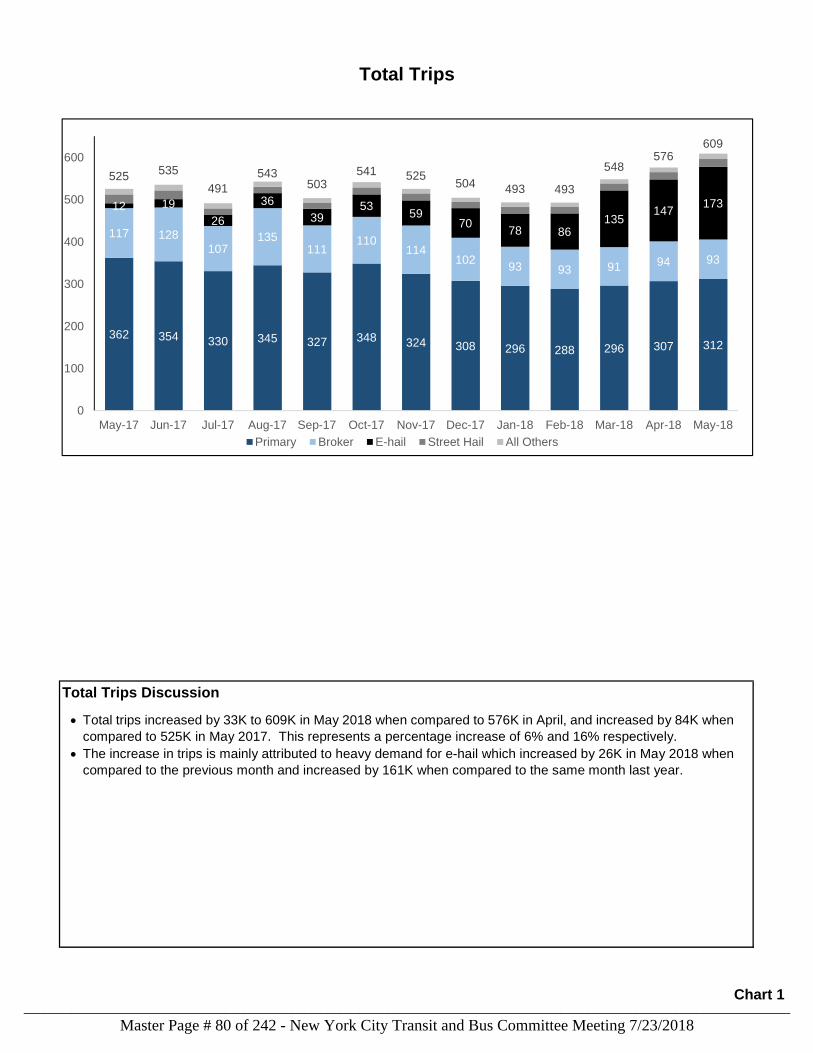
Total Trips Discussion
Total Trips
Total trips increased by 33K to 609K in May 2018 when compared to 576K in April, and increased by 84K when
compared to 525K in May 2017. This represents a percentage increase of 6% and 16% respectively.
The increase in trips is mainly attributed to heavy demand for e-hail which increased by 26K in May 2018 when
compared to the previous month and increased by 161K when compared to the same month last year.
362 354 330 345 327 348 324 308 296 288 296 307 312
117 128
107135
111110
114102
93 93 91 94 93
12 19
26
36
3953
5970
78 86135
147173
525535
491
543503
541 525504 493 493
548576
609
0
100
200
300
400
500
600
May-17 Jun-17 Jul-17 Aug-17 Sep-17 Oct-17 Nov-17 Dec-17 Jan-18 Feb-18 Mar-18 Apr-18 May-18
Primary Broker E-hail Street Hail All Others
Chart 1
Master Page # 80 of 242 - New York City Transit and Bus Committee Meeting 7/23/2018________________________________________________________________________________
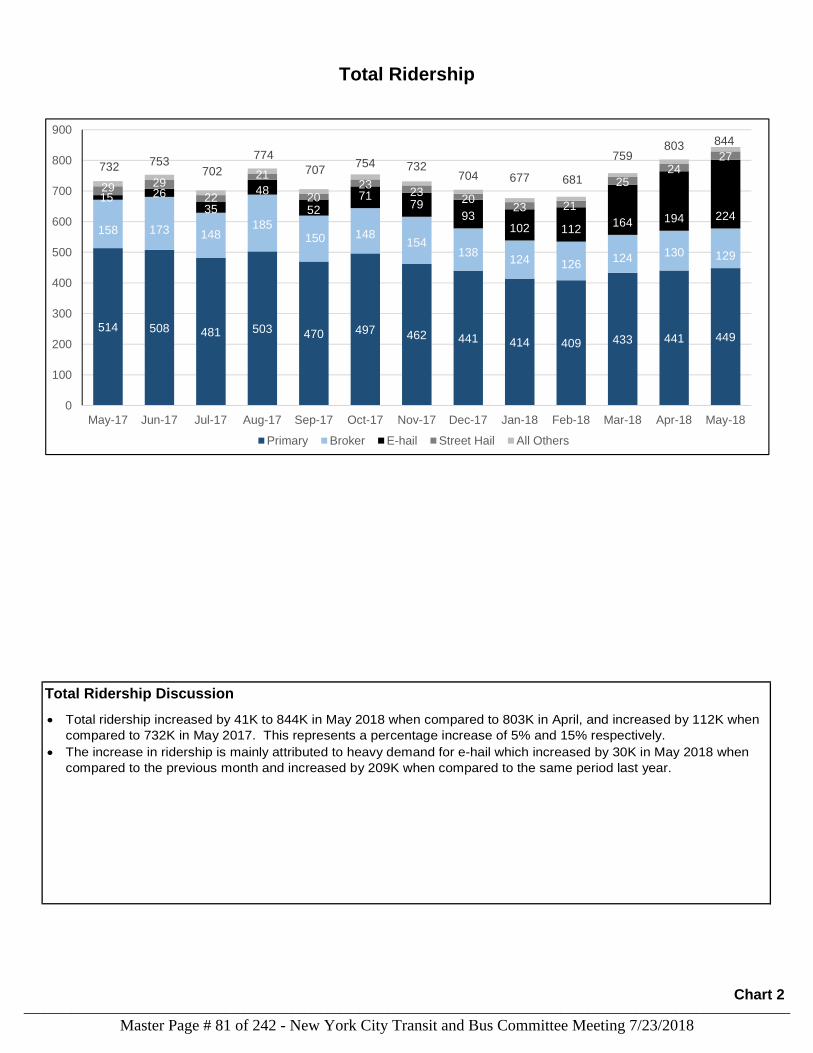
Total Ridership Discussion
Total Ridership
Total ridership increased by 41K to 844K in May 2018 when compared to 803K in April, and increased by 112K when
compared to 732K in May 2017. This represents a percentage increase of 5% and 15% respectively.
The increase in ridership is mainly attributed to heavy demand for e-hail which increased by 30K in May 2018 when
compared to the previous month and increased by 209K when compared to the same period last year.
514 508 481 503 470 497 462 441 414 409 433 441 449
158 173 148185
150 148154
138124 126
124 130 129
15 26
35
48
52
7179
93102 112
164 194 224
29 29
22
21
2023
2320
23 21
2524
27732 753
702
774
707754 732
704 677 681
759803 844
0
100
200
300
400
500
600
700
800
900
May-17 Jun-17 Jul-17 Aug-17 Sep-17 Oct-17 Nov-17 Dec-17 Jan-18 Feb-18 Mar-18 Apr-18 May-18
Primary Broker E-hail Street Hail All Others
Chart 2
Master Page # 81 of 242 - New York City Transit and Bus Committee Meeting 7/23/2018________________________________________________________________________________
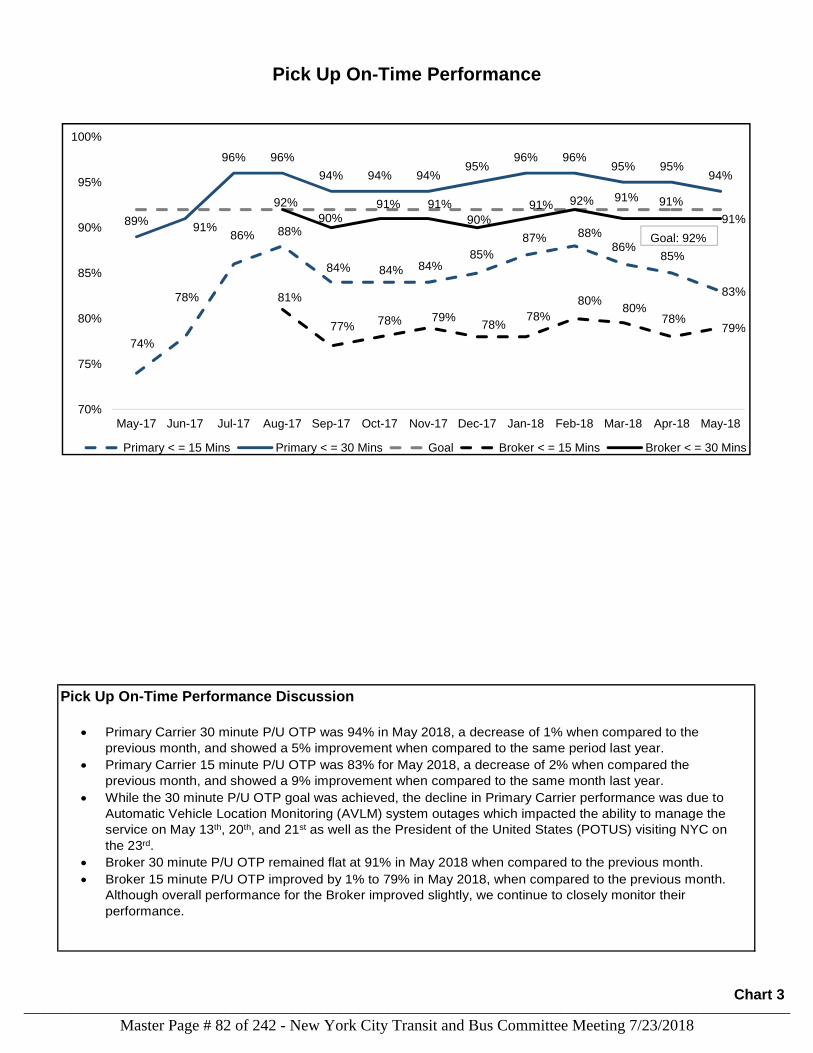
Pick Up On-Time Performance Discussion
Pick Up On-Time Performance
Primary Carrier 30 minute P/U OTP was 94% in May 2018, a decrease of 1% when compared to the
previous month, and showed a 5% improvement when compared to the same period last year.
Primary Carrier 15 minute P/U OTP was 83% for May 2018, a decrease of 2% when compared the
previous month, and showed a 9% improvement when compared to the same month last year.
While the 30 minute P/U OTP goal was achieved, the decline in Primary Carrier performance was due to
Automatic Vehicle Location Monitoring (AVLM) system outages which impacted the ability to manage the
service on May 13th, 20th, and 21st as well as the President of the United States (POTUS) visiting NYC on
the 23rd.
Broker 30 minute P/U OTP remained flat at 91% in May 2018 when compared to the previous month.
Broker 15 minute P/U OTP improved by 1% to 79% in May 2018, when compared to the previous month.
Although overall performance for the Broker improved slightly, we continue to closely monitor their
performance.
74%
78%
86% 88%
84% 84% 84%85%
87% 88%
86%85%
83%
89%91%
96% 96%
94% 94% 94%95%
96% 96%95% 95%
94%
81%
77%78% 79%
78%78%
80%80%
78%79%
92%
90%
91% 91%
90%
91% 92% 91% 91%
91%
70%
75%
80%
85%
90%
95%
100%
May-17 Jun-17 Jul-17 Aug-17 Sep-17 Oct-17 Nov-17 Dec-17 Jan-18 Feb-18 Mar-18 Apr-18 May-18
Primary < = 15 Mins Primary < = 30 Mins Goal Broker < = 15 Mins Broker < = 30 Mins
Goal: 92%
Chart 3
Master Page # 82 of 242 - New York City Transit and Bus Committee Meeting 7/23/2018________________________________________________________________________________
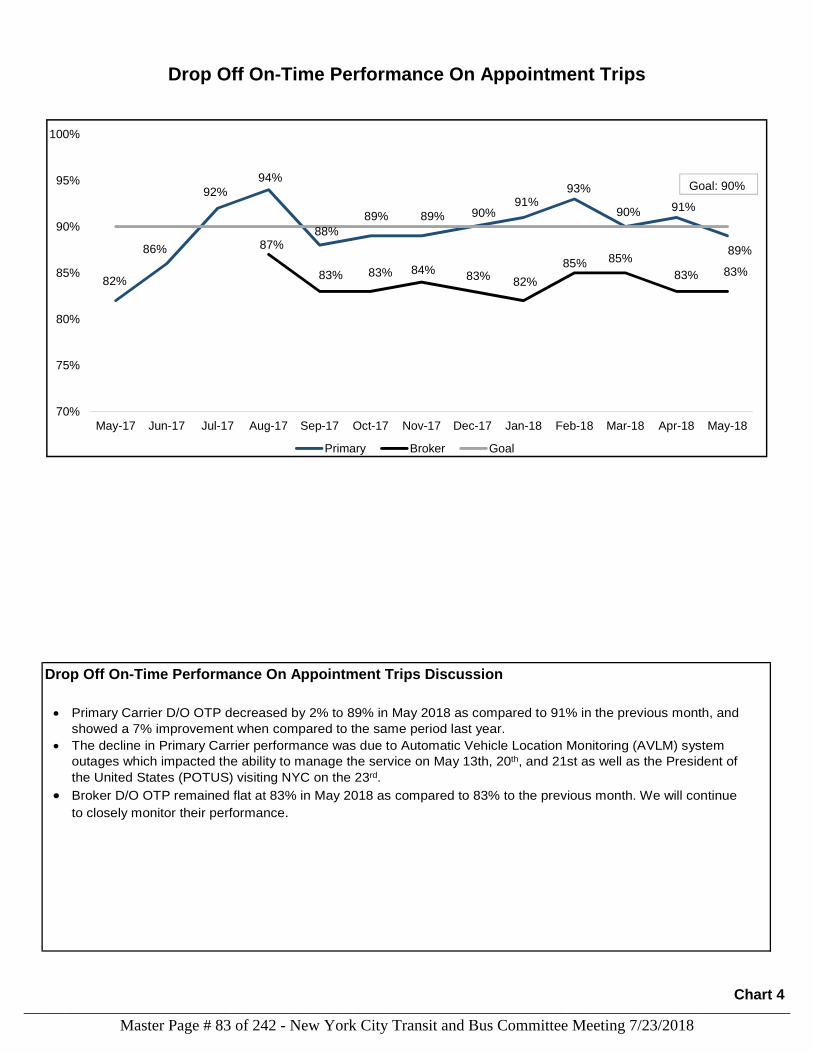
Drop Off On-Time Performance On Appointment Trips Discussion
Drop Off On-Time Performance On Appointment Trips
Primary Carrier D/O OTP decreased by 2% to 89% in May 2018 as compared to 91% in the previous month, and
showed a 7% improvement when compared to the same period last year.
The decline in Primary Carrier performance was due to Automatic Vehicle Location Monitoring (AVLM) system
outages which impacted the ability to manage the service on May 13th, 20th, and 21st as well as the President of
the United States (POTUS) visiting NYC on the 23rd.
Broker D/O OTP remained flat at 83% in May 2018 as compared to 83% to the previous month. We will continue
to closely monitor their performance.
82%
86%
92%
94%
88%
89% 89% 90%91%
93%
90% 91%
89%87%
83% 83% 84%83%
82%
85% 85%
83% 83%
70%
75%
80%
85%
90%
95%
100%
May-17 Jun-17 Jul-17 Aug-17 Sep-17 Oct-17 Nov-17 Dec-17 Jan-18 Feb-18 Mar-18 Apr-18 May-18
Primary Broker Goal
Goal: 90%
Chart 4
Master Page # 83 of 242 - New York City Transit and Bus Committee Meeting 7/23/2018________________________________________________________________________________
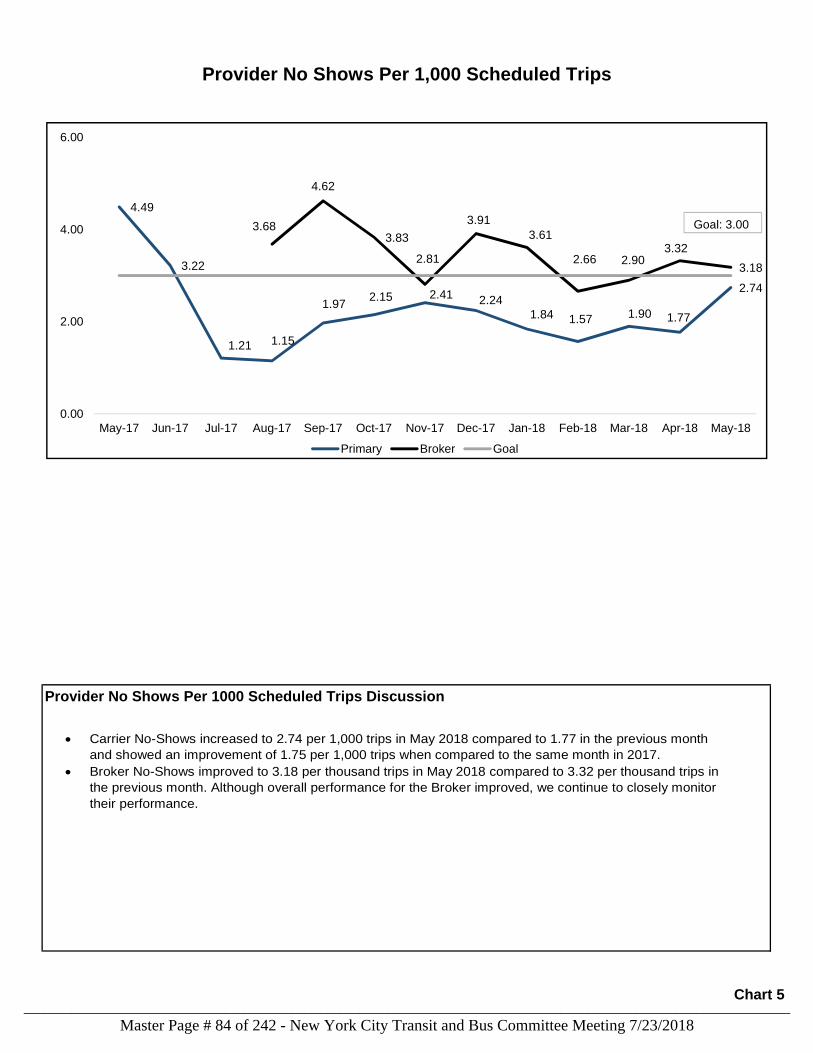
Provider No Shows Per 1000 Scheduled Trips Discussion
Provider No Shows Per 1,000 Scheduled Trips
Carrier No-Shows increased to 2.74 per 1,000 trips in May 2018 compared to 1.77 in the previous month
and showed an improvement of 1.75 per 1,000 trips when compared to the same month in 2017.
Broker No-Shows improved to 3.18 per thousand trips in May 2018 compared to 3.32 per thousand trips in
the previous month. Although overall performance for the Broker improved, we continue to closely monitor
their performance.
4.49
3.22
1.21 1.15
1.972.15 2.41 2.24
1.84 1.57 1.90 1.77
2.74
3.68
4.62
3.83
2.81
3.91
3.61
2.66 2.903.32
3.18
0.00
2.00
4.00
6.00
May-17 Jun-17 Jul-17 Aug-17 Sep-17 Oct-17 Nov-17 Dec-17 Jan-18 Feb-18 Mar-18 Apr-18 May-18
Primary Broker Goal
Goal: 3.00
Chart 5
Master Page # 84 of 242 - New York City Transit and Bus Committee Meeting 7/23/2018________________________________________________________________________________
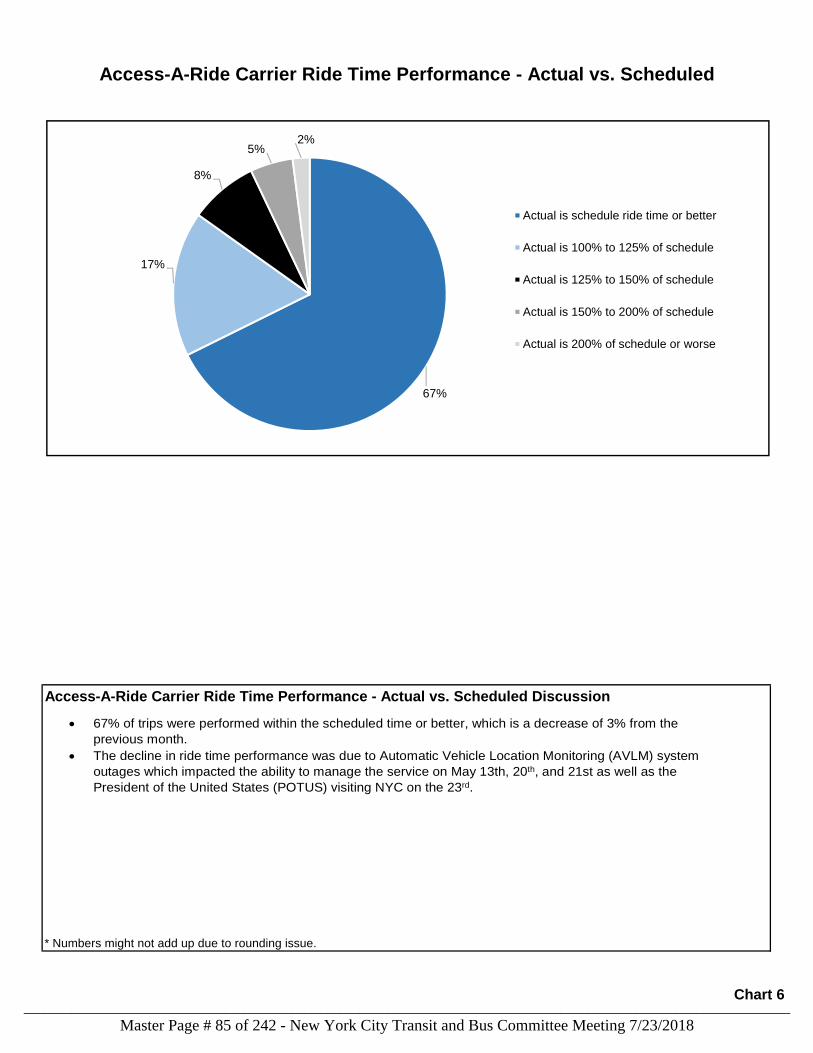
Access-A-Ride Carrier Ride Time Performance - Actual vs. Scheduled Discussion
* Numbers might not add up due to rounding issue.
Access-A-Ride Carrier Ride Time Performance - Actual vs. Scheduled
67% of trips were performed within the scheduled time or better, which is a decrease of 3% from the
previous month.
The decline in ride time performance was due to Automatic Vehicle Location Monitoring (AVLM) system
outages which impacted the ability to manage the service on May 13th, 20th, and 21st as well as the
President of the United States (POTUS) visiting NYC on the 23rd.
67%
17%
8%
5%2%
Actual is schedule ride time or better
Actual is 100% to 125% of schedule
Actual is 125% to 150% of schedule
Actual is 150% to 200% of schedule
Actual is 200% of schedule or worse
Chart 6
Master Page # 85 of 242 - New York City Transit and Bus Committee Meeting 7/23/2018________________________________________________________________________________
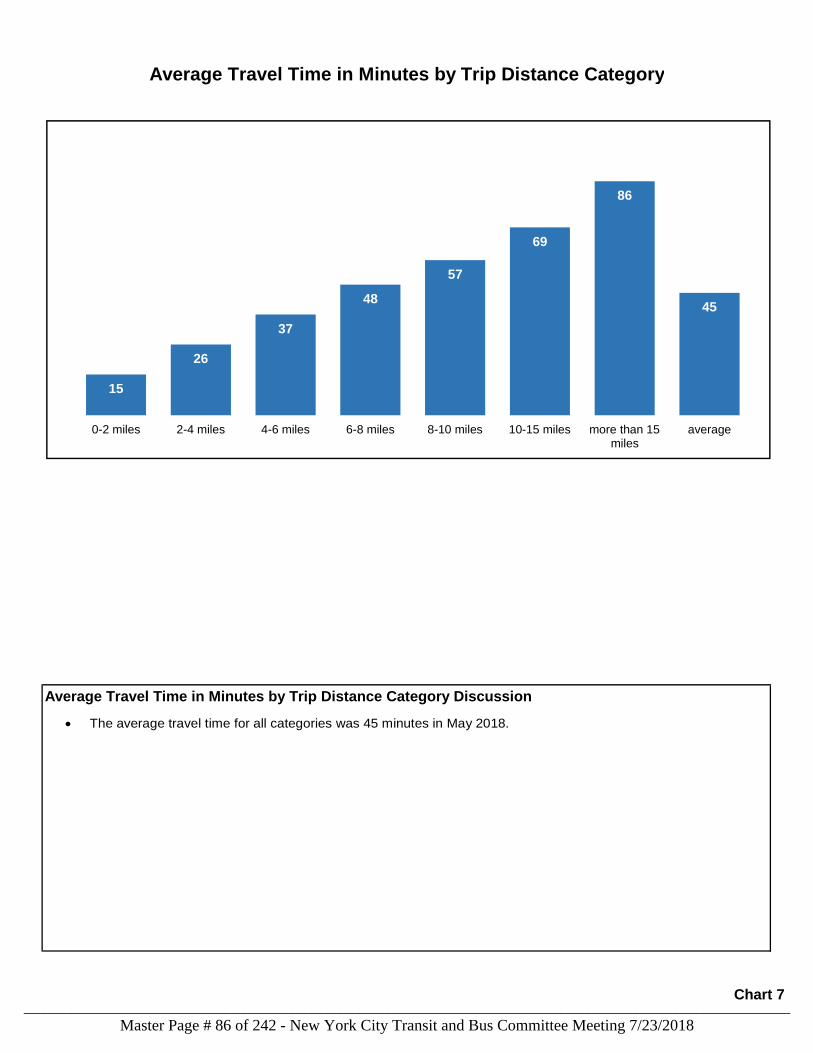
Average Travel Time in Minutes by Trip Distance Category Discussion
Average Travel Time in Minutes by Trip Distance Category
The average travel time for all categories was 45 minutes in May 2018.
15
26
37
48
57
69
86
45
0-2 miles 2-4 miles 4-6 miles 6-8 miles 8-10 miles 10-15 miles more than 15miles
average
Chart 7
Master Page # 86 of 242 - New York City Transit and Bus Committee Meeting 7/23/2018________________________________________________________________________________
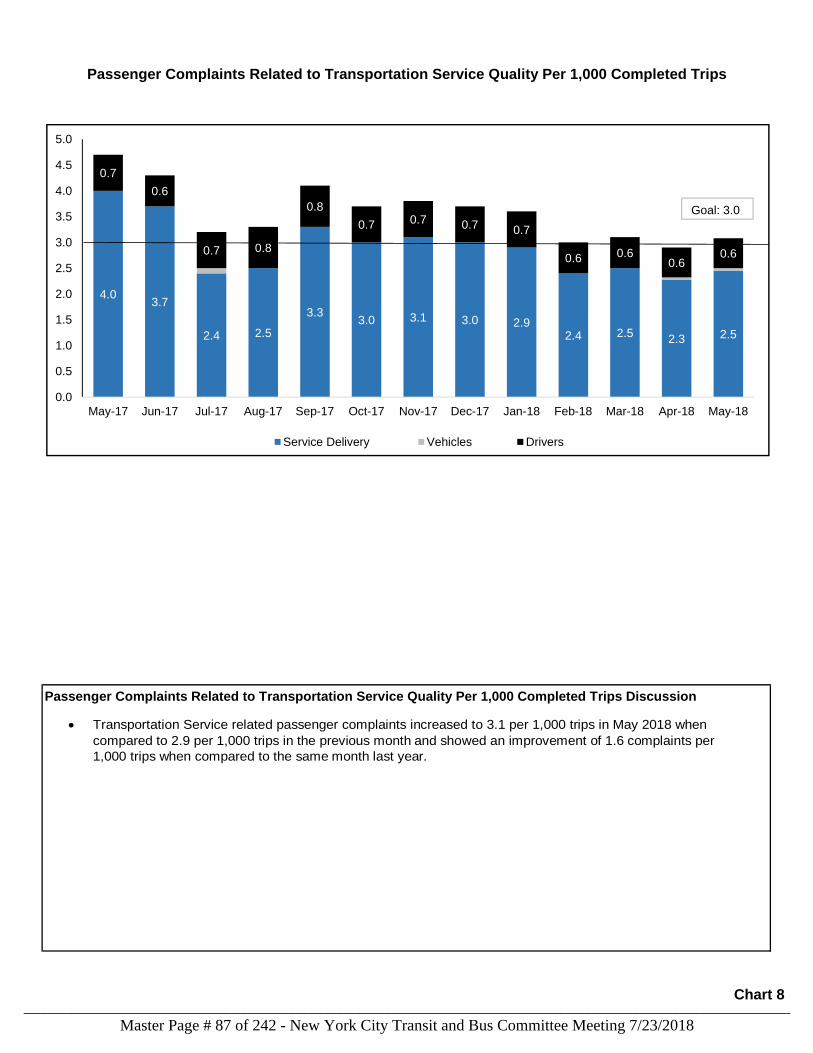
Passenger Complaints Related to Transportation Service Quality Per 1,000 Completed Trips Discussion
Passenger Complaints Related to Transportation Service Quality Per 1,000 Completed Trips
Transportation Service related passenger complaints increased to 3.1 per 1,000 trips in May 2018 when
compared to 2.9 per 1,000 trips in the previous month and showed an improvement of 1.6 complaints per
1,000 trips when compared to the same month last year.
4.03.7
2.4 2.5
3.33.0 3.1 3.0 2.9
2.4 2.52.3 2.5
0.7
0.6
0.7 0.8
0.8
0.7 0.7 0.7 0.7
0.6 0.60.6
0.6
0.0
0.5
1.0
1.5
2.0
2.5
3.0
3.5
4.0
4.5
5.0
May-17 Jun-17 Jul-17 Aug-17 Sep-17 Oct-17 Nov-17 Dec-17 Jan-18 Feb-18 Mar-18 Apr-18 May-18
Service Delivery Vehicles Drivers
Goal: 3.0
Chart 8
Master Page # 87 of 242 - New York City Transit and Bus Committee Meeting 7/23/2018________________________________________________________________________________
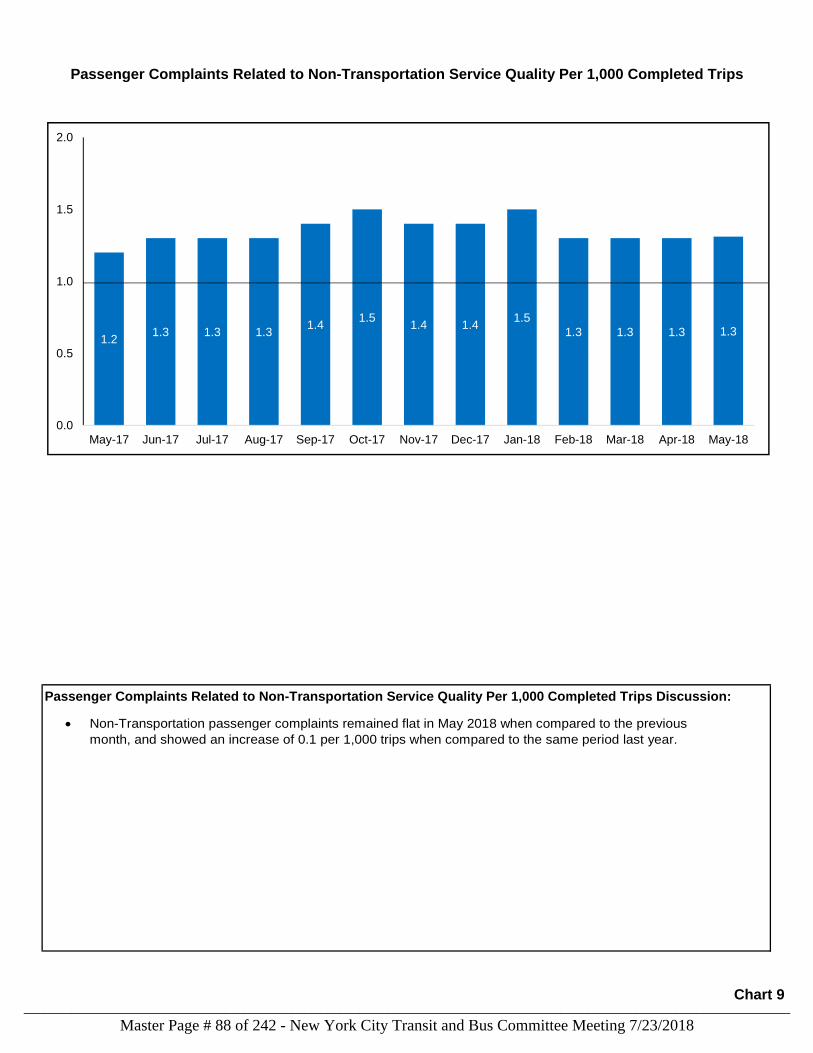
Passenger Complaints Related to Non-Transportation Service Quality Per 1,000 Completed Trips Discussion:
Passenger Complaints Related to Non-Transportation Service Quality Per 1,000 Completed Trips
Non-Transportation passenger complaints remained flat in May 2018 when compared to the previous
month, and showed an increase of 0.1 per 1,000 trips when compared to the same period last year.
Goal: 1.0
1.21.3 1.3 1.3
1.41.5
1.4 1.41.5
1.3 1.3 1.3 1.3
0.0
0.5
1.0
1.5
2.0
May-17 Jun-17 Jul-17 Aug-17 Sep-17 Oct-17 Nov-17 Dec-17 Jan-18 Feb-18 Mar-18 Apr-18 May-18
Chart 9
Master Page # 88 of 242 - New York City Transit and Bus Committee Meeting 7/23/2018________________________________________________________________________________
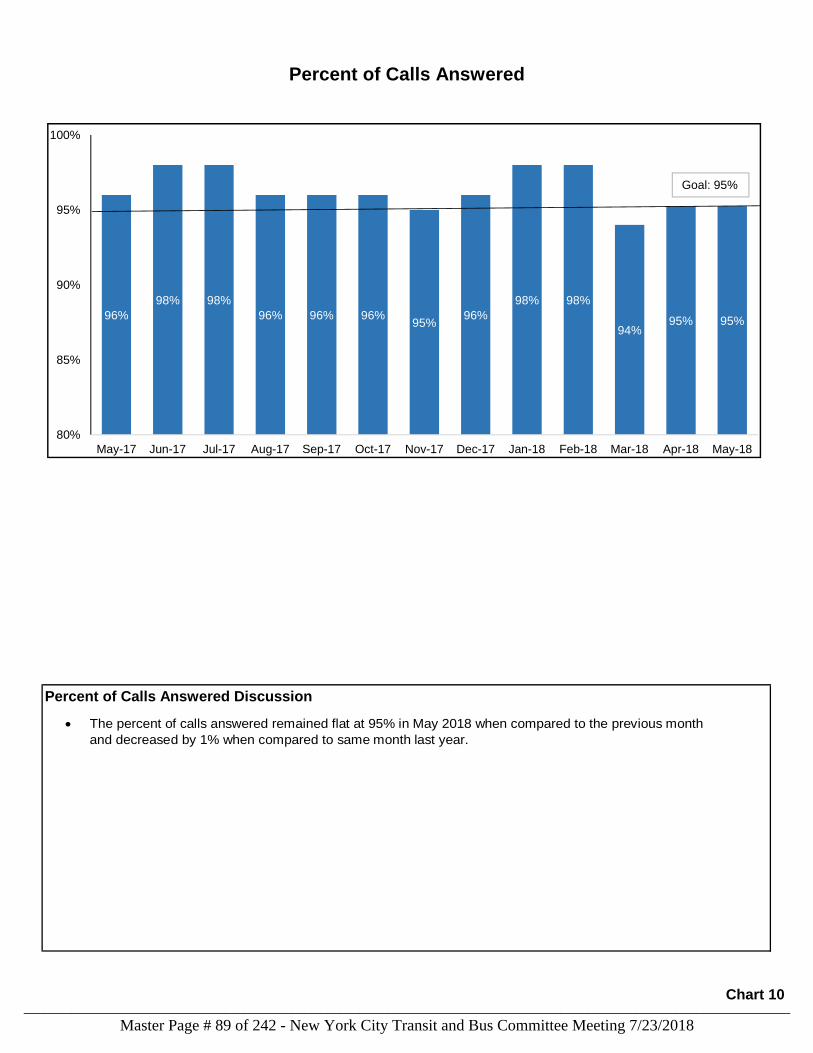
Percent of Calls Answered Discussion
Percent of Calls Answered
The percent of calls answered remained flat at 95% in May 2018 when compared to the previous month
and decreased by 1% when compared to same month last year.
96%
98% 98%
96% 96% 96%95%
96%
98% 98%
94%95% 95%
80%
85%
90%
95%
100%
May-17 Jun-17 Jul-17 Aug-17 Sep-17 Oct-17 Nov-17 Dec-17 Jan-18 Feb-18 Mar-18 Apr-18 May-18
Goal: 95%
Chart 10
Master Page # 89 of 242 - New York City Transit and Bus Committee Meeting 7/23/2018________________________________________________________________________________
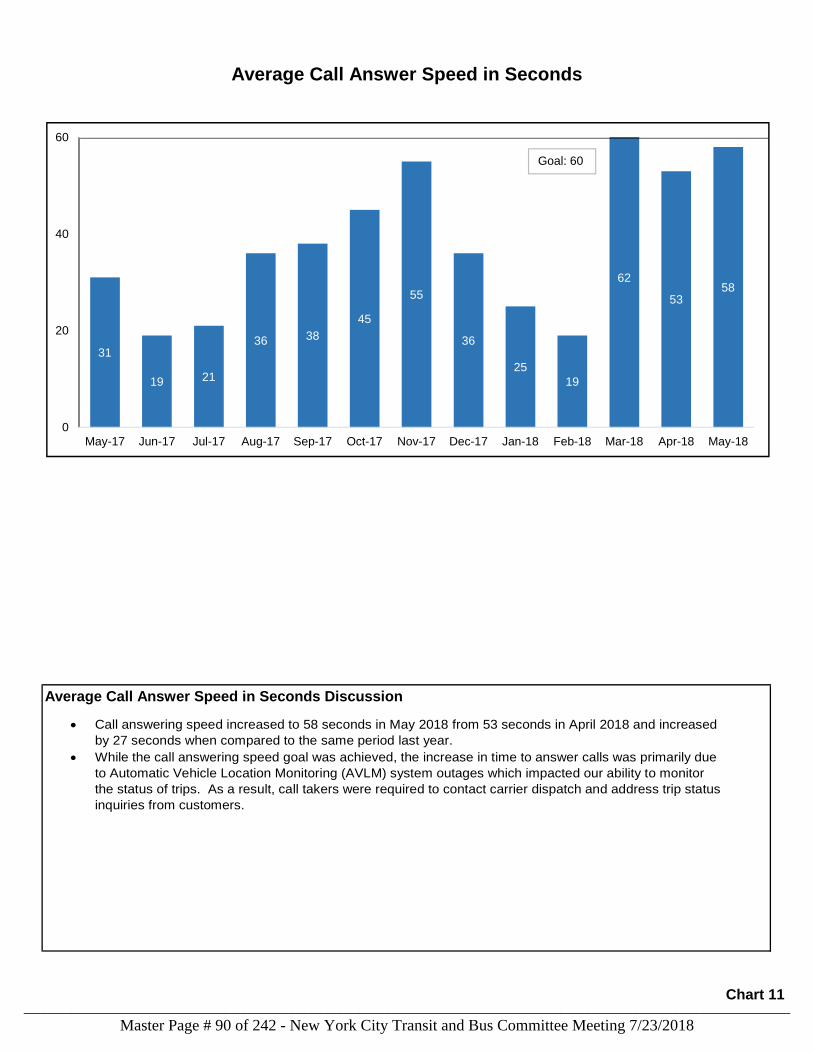
Average Call Answer Speed in Seconds Discussion
Average Call Answer Speed in Seconds
Call answering speed increased to 58 seconds in May 2018 from 53 seconds in April 2018 and increased
by 27 seconds when compared to the same period last year.
While the call answering speed goal was achieved, the increase in time to answer calls was primarily due
to Automatic Vehicle Location Monitoring (AVLM) system outages which impacted our ability to monitor
the status of trips. As a result, call takers were required to contact carrier dispatch and address trip status
inquiries from customers.
31
19 21
36 38
45
55
36
25
19
62
5358
0
20
40
60
May-17 Jun-17 Jul-17 Aug-17 Sep-17 Oct-17 Nov-17 Dec-17 Jan-18 Feb-18 Mar-18 Apr-18 May-18
Goal: 60
Chart 11
Master Page # 90 of 242 - New York City Transit and Bus Committee Meeting 7/23/2018________________________________________________________________________________
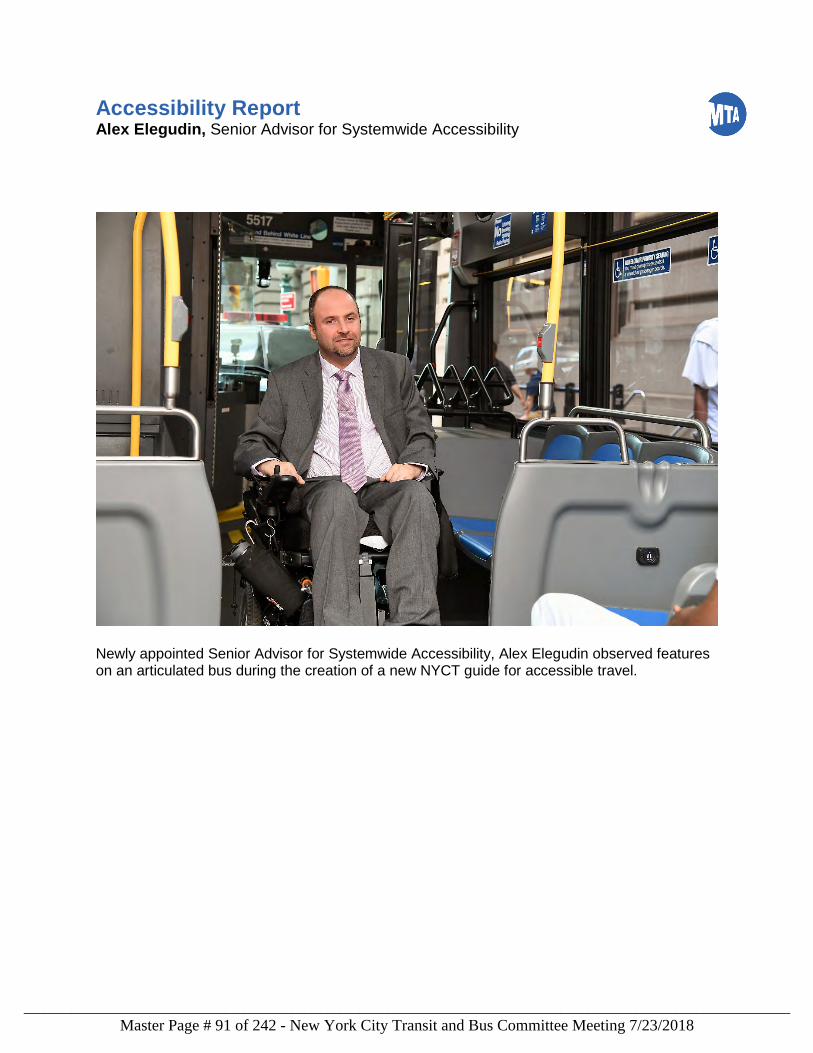
Accessibility Report Alex Elegudin, Senior Advisor for Systemwide Accessibility
Newly appointed Senior Advisor for Systemwide Accessibility, Alex Elegudin observed features on an articulated bus during the creation of a new NYCT guide for accessible travel.
Master Page # 91 of 242 - New York City Transit and Bus Committee Meeting 7/23/2018________________________________________________________________________________
June 2018 Highlights: Accessibility
I am so happy to have recently joined the NYCT team as the Senior Advisor for Systemwide
Accessibility. This first month has been a busy one as I have met with the different divisions to
get them on board with NYCT’s accelerated accessibility goals. I have led meetings with
numerous teams working on accessibility projects – directing them onto unified, comprehensive
work streams in order to best achieve the milestones needed as work toward achieving our
critical work ahead.
I know that we cannot do this alone. To that end, I will be working on putting together a robust
community engagement structure with customers who have disabilities so that we can regularly
receive their feedback and be sure to engage them on our decision making process.
I am currently doing a thorough review of bus operator and train conductor ADA trainings to see
what may need to be bolstered or changed. We are also preparing an ADA sensitivity and
disability etiquette training via an online module that will be mandated for all NYCT employees
and provide best practices for interacting with customers with disabilities.
As you all know, there is a study currently underway on all of the inaccessible stations to see
what it would take to make them accessible. We recently engaged the community to discuss the
factors being considered in the study (such as ridership and proximity to major activity centers,
for example) to make sure we are properly assessing and giving proper weight to the most
relevant factors.
NYCT is doing a thorough review of how elevator and escalator outages are communicated to
customers. We are mapping alternate route information for each elevator in order to post static
signs on elevators. We are also working to improve our online accessible routing options,
updated based on current status of each elevator and escalator.
As part of our Fast Forward commitment to evaluate new bus designs, we are testing a new
MCI express bus which was put in service this month. This bus provides improved accessibility,
with a first-of-its-kind, low entry vestibule and an automated ramp, allowing for ease of boarding
for customers with wheelchairs and other mobility devices. We look forward to getting customer
feedback during the three month test period.
We have a big job ahead of us but it is a challenge to which I am deeply dedicated. I hope you
will join me on this ride as we work toward greater accessibility in our transit system.
Alex Elegudin
Senior Advisor for Systemwide Accessibility
Master Page # 92 of 242 - New York City Transit and Bus Committee Meeting 7/23/2018________________________________________________________________________________
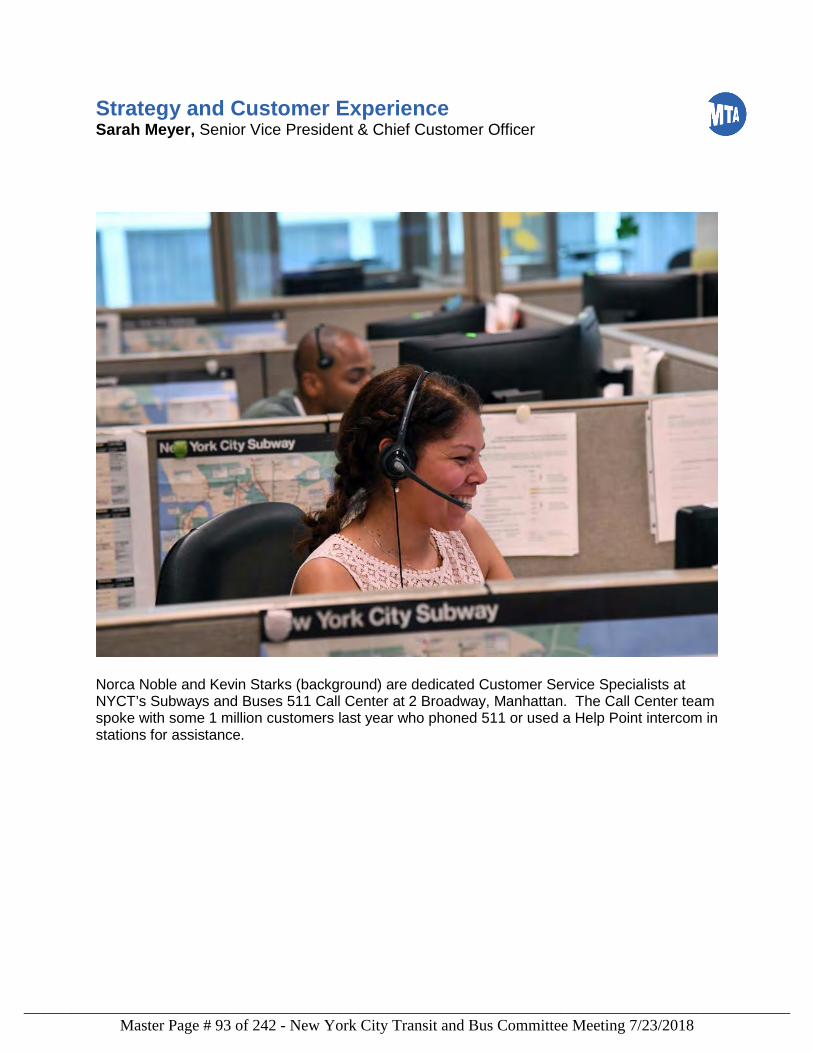
Strategy and Customer Experience Sarah Meyer, Senior Vice President & Chief Customer Officer
Norca Noble and Kevin Starks (background) are dedicated Customer Service Specialists at NYCT’s Subways and Buses 511 Call Center at 2 Broadway, Manhattan. The Call Center team spoke with some 1 million customers last year who phoned 511 or used a Help Point intercom in stations for assistance.
Master Page # 93 of 242 - New York City Transit and Bus Committee Meeting 7/23/2018________________________________________________________________________________
June 2018 Highlights:
Strategy and Customer Experience
It’s been a busy month for the team, as we continue to keep our attention on addressing
actionable issues that directly impact our customer’s immediate travel experience, optimizing
countdown clocks, putting up clearer signage, and staying laser focused on making
improvements for every customer interaction and activity.
Compared to May, the number of customer contacts we received at the Customer Call Center
and from email and social media decreased 7.5% while inquiries from Help Points increased by
8%.
We continue to make significant improvements when looking year over year. The number of
customer calls answered by agents increased by 14% and customer wait time decreased by
38%, or 169 seconds. During this same time period, Help Point calls decreased 27% and wait
time remained under ten seconds.
The most gain has been realized in social media engagement, with a huge 68% increase in
activity (mentions) and a 74% in responses. This growth is attributed to several factors,
including:
• A concentrated and dedicated effort to be more responsive and to streamline
information workflow and management;
• Added @MTA twitter, to our social monitoring platform (July 2017);
• Upgraded to a more enhanced social monitoring tool for better metrics, insights;
resource management.
We’ve partnered with MTAHQ and in June, supported the release of the new, easy-to-use
myMTA app that lets customers plan trips using our real-time service information, save their
frequent traveled routes, and see train arrival times. We are still in beta and making changes
everyday, so please send us your feedback.
Thank you.
Sarah Meyer
Senior Vice President and Chief Customer Officer
Strategy and Customer Experience
Master Page # 94 of 242 - New York City Transit and Bus Committee Meeting 7/23/2018________________________________________________________________________________
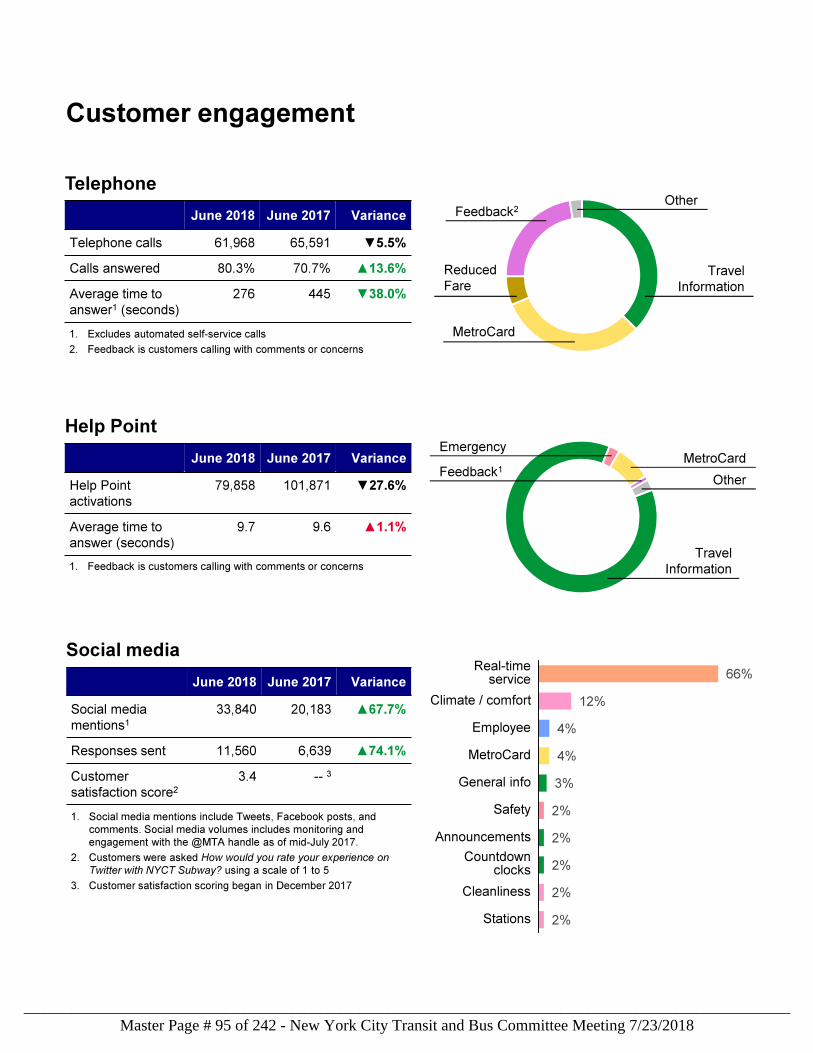
Customer engagement
1. Excludes automated self-service calls
2. Feedback is customers calling with comments or concerns
Telephone
June 2018 June 2017 Variance
Telephone calls 61,968 65,591 ▼5.5%
Calls answered 80.3% 70.7% ▲13.6%
Average time to
answer1 (seconds)
276 445 ▼38.0%
Help Point
June 2018 June 2017 Variance
Help Point
activations
79,858 101,871 ▼27.6%
Average time to
answer (seconds)
9.7 9.6 ▲1.1%
Feedback1MetroCard
Travel
Information
Other
Emergency
Feedback2Other
Travel
Information
MetroCard
Reduced
Fare
Social media
June 2018 June 2017 Variance
Social media
mentions133,840 20,183 ▲67.7%
Responses sent 11,560 6,639 ▲74.1%
Customer
satisfaction score23.4 -- 3
1. Social media mentions include Tweets, Facebook posts, and
comments. Social media volumes includes monitoring and
engagement with the @MTA handle as of mid-July 2017.
2. Customers were asked How would you rate your experience on
Twitter with NYCT Subway? using a scale of 1 to 5
3. Customer satisfaction scoring began in December 2017
66%
12%
4%
4%
3%
2%
2%
2%
2%
2%
Real-timeservice
Climate / comfort
Employee
MetroCard
General info
Safety
Announcements
Countdownclocks
Cleanliness
Stations
Countdownclocks
Real-timeservice
1. Feedback is customers calling with comments or concerns
Master Page # 95 of 242 - New York City Transit and Bus Committee Meeting 7/23/2018________________________________________________________________________________
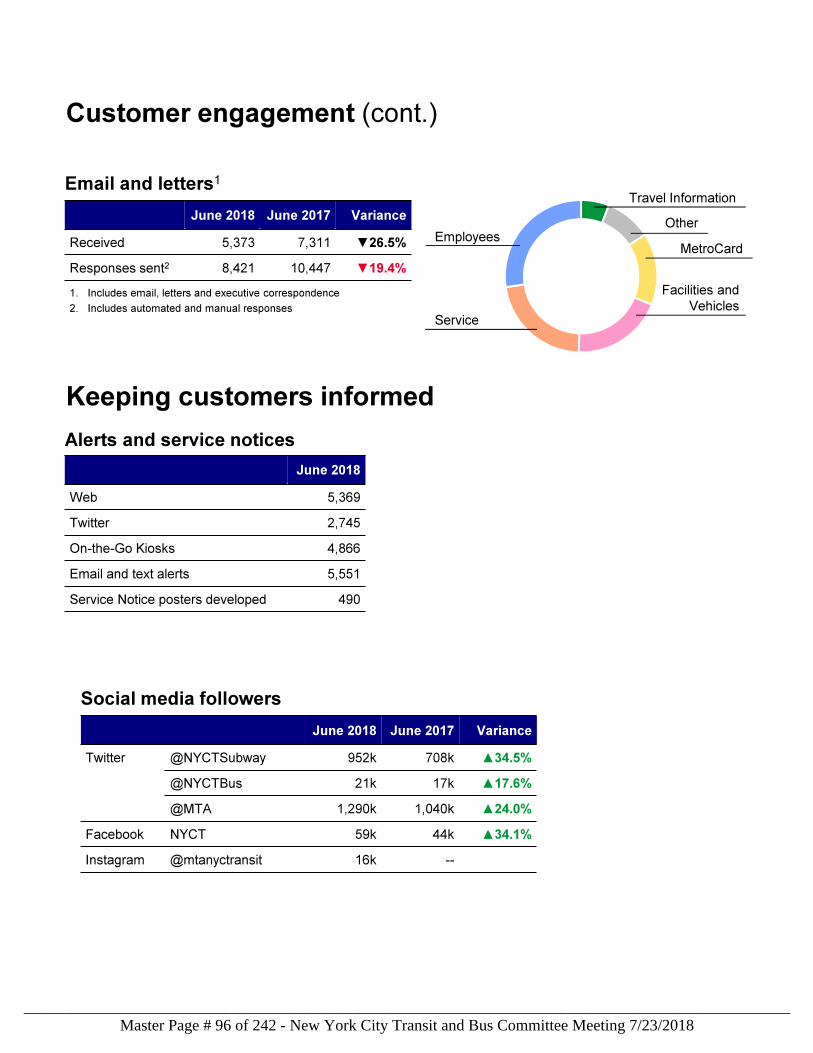
Customer engagement (cont.)
Keeping customers informed
Alerts and service notices
June 2018
Web 5,369
Twitter 2,745
On-the-Go Kiosks 4,866
Email and text alerts 5,551
Service Notice posters developed 490
Travel Information
Service
EmployeesOther
MetroCard
Facilities and
Vehicles
Email and letters1
June 2018 June 2017 Variance
Received 5,373 7,311 ▼26.5%
Responses sent2 8,421 10,447 ▼19.4%
Social media followers
June 2018 June 2017 Variance
Twitter @NYCTSubway 952k 708k ▲34.5%
@NYCTBus 21k 17k ▲17.6%
@MTA 1,290k 1,040k ▲24.0%
Facebook NYCT 59k 44k ▲34.1%
Instagram @mtanyctransit 16k --
1. Includes email, letters and executive correspondence
2. Includes automated and manual responses
Master Page # 96 of 242 - New York City Transit and Bus Committee Meeting 7/23/2018________________________________________________________________________________
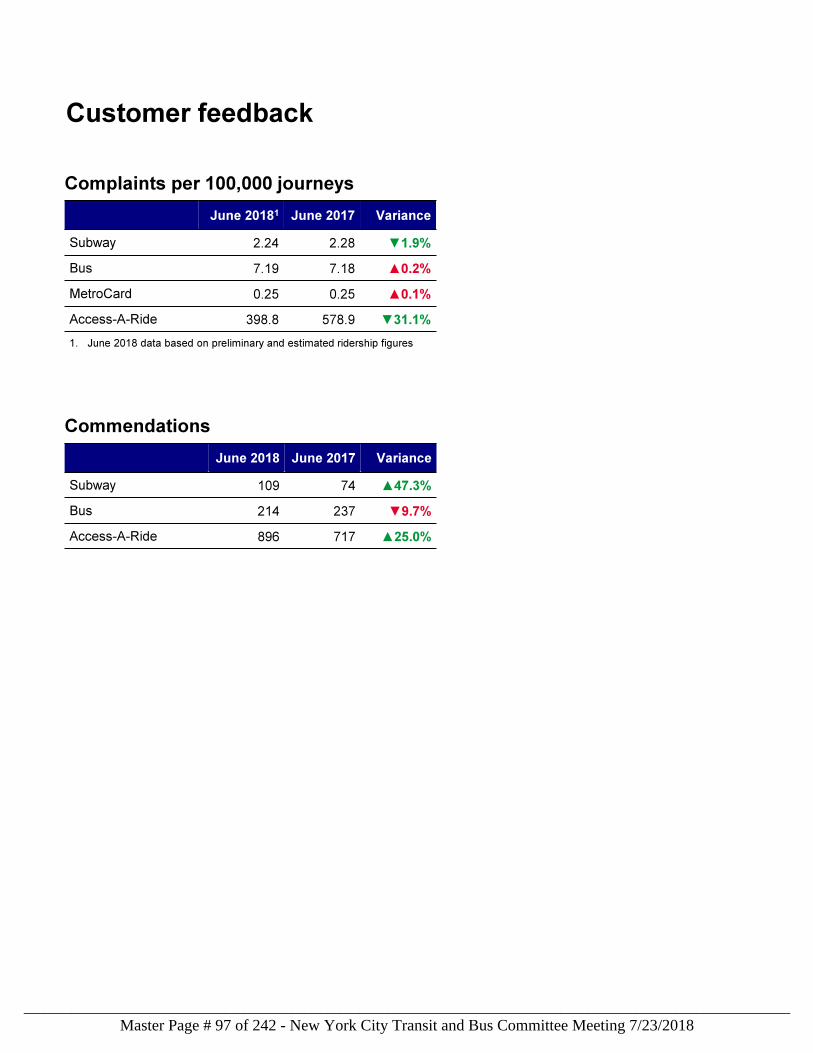
Customer feedback
Complaints per 100,000 journeys
June 20181 June 2017 Variance
Subway 2.24 2.28 ▼1.9%
Bus 7.19 7.18 ▲0.2%
MetroCard 0.25 0.25 ▲0.1%
Access-A-Ride 398.8 578.9 ▼31.1%
Commendations
June 2018 June 2017 Variance
Subway 109 74 ▲47.3%
Bus 214 237 ▼9.7%
Access-A-Ride 896 717 ▲25.0%
1. June 2018 data based on preliminary and estimated ridership figures
Master Page # 97 of 242 - New York City Transit and Bus Committee Meeting 7/23/2018________________________________________________________________________________
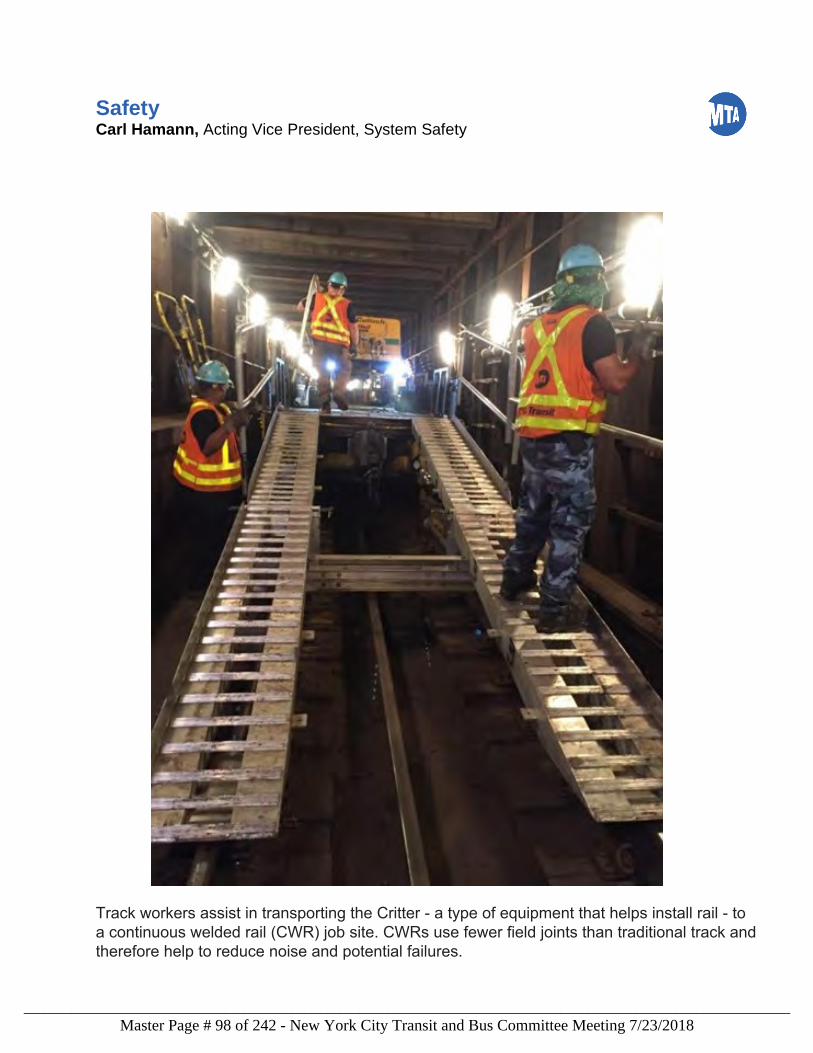
Safety Carl Hamann, Acting Vice President, System Safety
Track workers assist in transporting the Critter - a type of equipment that helps install rail - to a continuous welded rail (CWR) job site. CWRs use fewer field joints than traditional track and therefore help to reduce noise and potential failures.
Master Page # 98 of 242 - New York City Transit and Bus Committee Meeting 7/23/2018________________________________________________________________________________
Safety Report
Subway Fires were relatively flat when comparing July 2017 through June 2018 with the prior 12-month period. 99.1% of fires reported for the 12-month period were of low or average severity with most 69.7% occurring along the Right-of-Way and 61.1% attributed to debris. Bus Collisions and Collision Injures decreased when comparing July 2017 thru June 2018 with the prior 12 months. Bus Customer Accidents continued to decline when comparing June 2017 thru May 2018 with the prior 12 months. However, Subway Customer Accidents increased when comparing them within the same periods. It is worth noting that they decreased slightly on a monthly basis when comparing May 2017 to May 2018. Employee Lost Time Accidents continued a downward trend when comparing the most-recent 12 months with the previous 12 months. Lastly, NYCT continues to make steady progress against all of our Leading Indicator goals and have surpassed our annual goal for the installation of friction pads, thus potentially reducing the number of broken rail incidents and future rail defects. Carl Hamann Acting Vice President, Office of System Safety
Master Page # 99 of 242 - New York City Transit and Bus Committee Meeting 7/23/2018________________________________________________________________________________
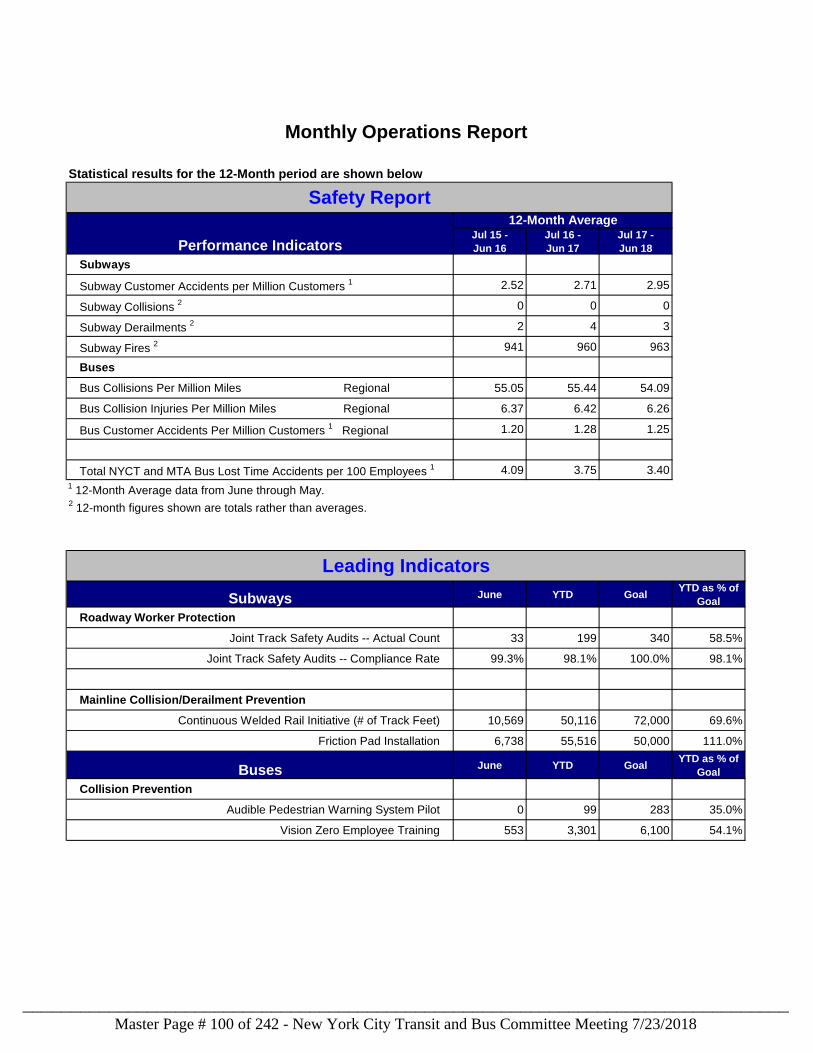
Statistical results for the 12-Month period are shown below
Jul 15 -
Jun 16
Jul 16 -
Jun 17
Jul 17 -
Jun 18
Subways
Subway Customer Accidents per Million Customers 1 2.52 2.71 2.95
Subway Collisions 2 0 0 0
Subway Derailments 2 2 4 3
Subway Fires 2 941 960 963
Buses
Bus Collisions Per Million Miles Regional 55.05 55.44 54.09
Bus Collision Injuries Per Million Miles Regional 6.37 6.42 6.26
Bus Customer Accidents Per Million Customers 1 Regional 1.20 1.28 1.25
Total NYCT and MTA Bus Lost Time Accidents per 100 Employees 1 4.09 3.75 3.40
1 12-Month Average data from June through May.
2 12-month figures shown are totals rather than averages.
Subways June YTD GoalYTD as % of
Goal
Roadway Worker Protection
Joint Track Safety Audits -- Actual Count 33 199 340 58.5%
Joint Track Safety Audits -- Compliance Rate 99.3% 98.1% 100.0% 98.1%
Mainline Collision/Derailment Prevention
Continuous Welded Rail Initiative (# of Track Feet) 10,569 50,116 72,000 69.6%
Friction Pad Installation 6,738 55,516 50,000 111.0%
Buses June YTD GoalYTD as % of
Goal
Collision Prevention
Audible Pedestrian Warning System Pilot 0 99 283 35.0%
Vision Zero Employee Training 553 3,301 6,100 54.1%
Monthly Operations Report
12-Month Average
Leading Indicators
Safety Report
Performance Indicators
Master Page # 100 of 242 - New York City Transit and Bus Committee Meeting 7/23/2018________________________________________________________________________________
Vision Zero Training provides focused Safety Awareness Training to all Bus Operators which
engages them on all aspects of Pedestrian Safety issues; emphasizing the current challenges of
managing their Buses in an environment with distracted Pedestrians, Motorists and Cyclists. The
program incorporates Testimonial videos from “Families for Safer Streets” along with a series of
videos of serious Bus and Pedestrian accidents secured from on-board bus cameras as well as
external traffic and security cameras. The Training which will be delivered over two years is in the
midst of a new cycle that began in April 2017 and will run for two years until March 2019.
Monthly Operations Report
Safety Report Definitions:
Joint Track Safety Audits are conducted by a joint team of personnel from the Office of System
Safety, the Transport Workers Union, and the Subway Surface Supervisors Association (SSSA). The
teams look at critical items for on-track safety such as flagging, third rail safety and lighting. These
reviews are conducted at various Department of Subways, Capital Program Management and MTA
Capital Construction work sites along the right of way to assess compliance with the rules and
procedures, identify deficiencies in training and equipment, and improve on-track safety.
Continuous Welded Rail (CWR) significantly reduces the number of rail joints, which lessens the
occurrence of broken rails while also providing a smoother ride. Track Engineering analyzed system-
wide broken rail data and set forth a CWR installation plan to help reduce broken rails and improve
track conditions. We anticipate expanded use of the Critter Rail Stringer and "E" Clip installer to help
us achieve this goal.
Friction Pad Installations will increase resiliency of the rail, resulting in reduced broken rail incidents
and, overall, will reduce the potential for development of rail defects.
Audible Pedestrian Warning System Pilot technology produces an audible voice alert to pedestrians
when a bus is making a left- or a right-hand turn. The system turns on automatically without a bus
operator’s intervention and alerts pedestrians with a street- and curb-side speaker. Volume
automatically adjusts based on outside ambient noise.
Master Page # 101 of 242 - New York City Transit and Bus Committee Meeting 7/23/2018________________________________________________________________________________
Crime Report The purpose of this report is to provide Committee Members with statistical information regarding the number of major felonies including: homicide, robbery, assault, rape in addition to hate crime incidents occurring on the NYC Transit Subway and Staten Island Railway systems. The report is submitted by NYPD’s Transit Division on a monthly basis.
Master Page # 102 of 242 - New York City Transit and Bus Committee Meeting 7/23/2018________________________________________________________________________________
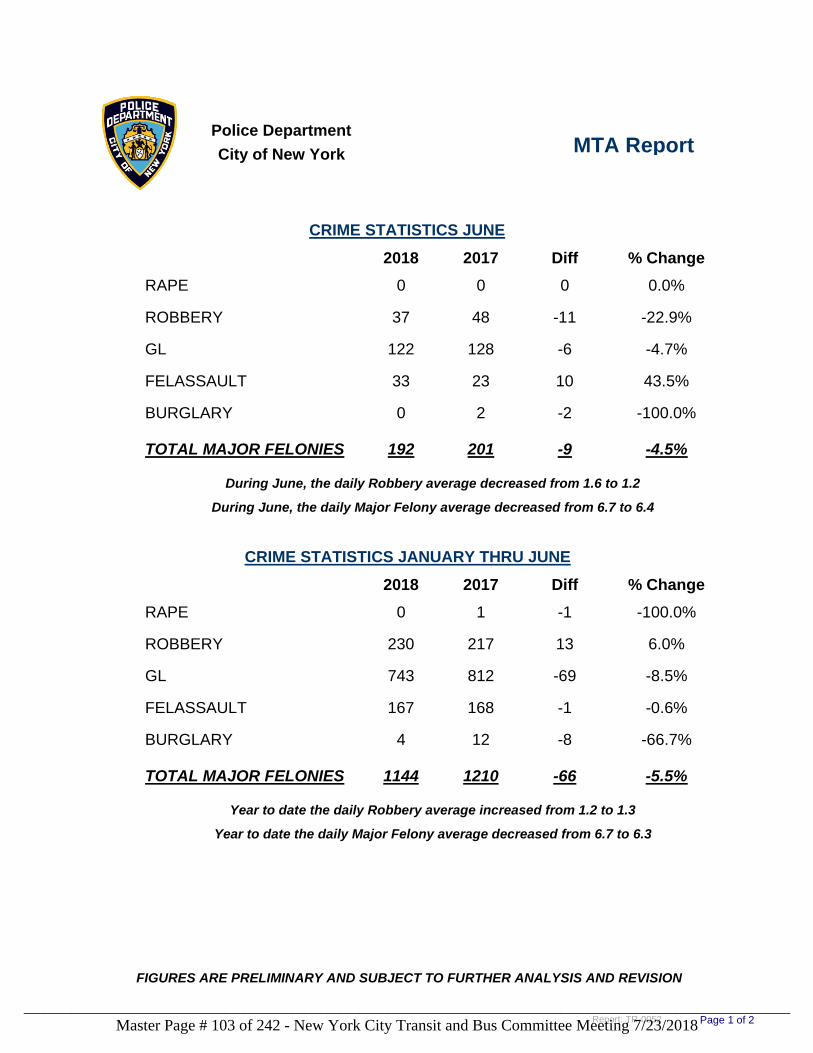
Police Department
City of New York MTA Report
CRIME STATISTICS JUNE
2018 2017 Diff % Change
RAPE 0 0 0 0.0%
ROBBERY 37 48 -11 -22.9%
GL 122 128 -6 -4.7%
FELASSAULT 33 23 10 43.5%
BURGLARY 0 2 -2 -100.0%
TOTAL MAJOR FELONIES 192 201 -9 -4.5%
During June, the daily Robbery average decreased from 1.6 to 1.2
During June, the daily Major Felony average decreased from 6.7 to 6.4
CRIME STATISTICS JANUARY THRU JUNE
2018 2017 Diff % Change
RAPE 0 1 -1 -100.0%
ROBBERY 230 217 13 6.0%
GL 743 812 -69 -8.5%
FELASSAULT 167 168 -1 -0.6%
BURGLARY 4 12 -8 -66.7%
TOTAL MAJOR FELONIES 1144 1210 -66 -5.5%
Year to date the daily Robbery average increased from 1.2 to 1.3
Year to date the daily Major Felony average decreased from 6.7 to 6.3
FIGURES ARE PRELIMINARY AND SUBJECT TO FURTHER ANALYSIS AND REVISION
Page 1 of 2Report: TR-0052Master Page # 103 of 242 - New York City Transit and Bus Committee Meeting 7/23/2018________________________________________________________________________________
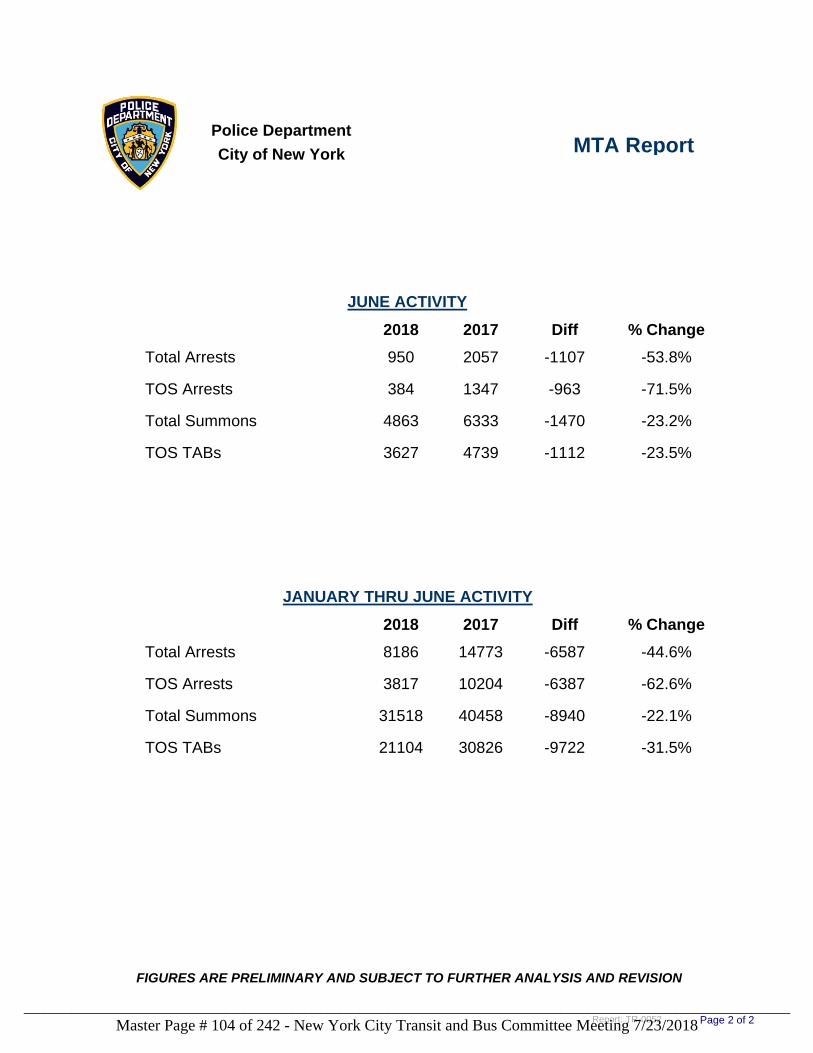
Police Department
City of New York MTA Report
JUNE ACTIVITY
2018 2017 Diff % Change
Total Arrests 950 2057 -1107 -53.8%
TOS Arrests 384 1347 -963 -71.5%
Total Summons 4863 6333 -1470 -23.2%
TOS TABs 3627 4739 -1112 -23.5%
JANUARY THRU JUNE ACTIVITY
2018 2017 Diff % Change
Total Arrests 8186 14773 -6587 -44.6%
TOS Arrests 3817 10204 -6387 -62.6%
Total Summons 31518 40458 -8940 -22.1%
TOS TABs 21104 30826 -9722 -31.5%
FIGURES ARE PRELIMINARY AND SUBJECT TO FURTHER ANALYSIS AND REVISION
Page 2 of 2Report: TR-0052Master Page # 104 of 242 - New York City Transit and Bus Committee Meeting 7/23/2018________________________________________________________________________________
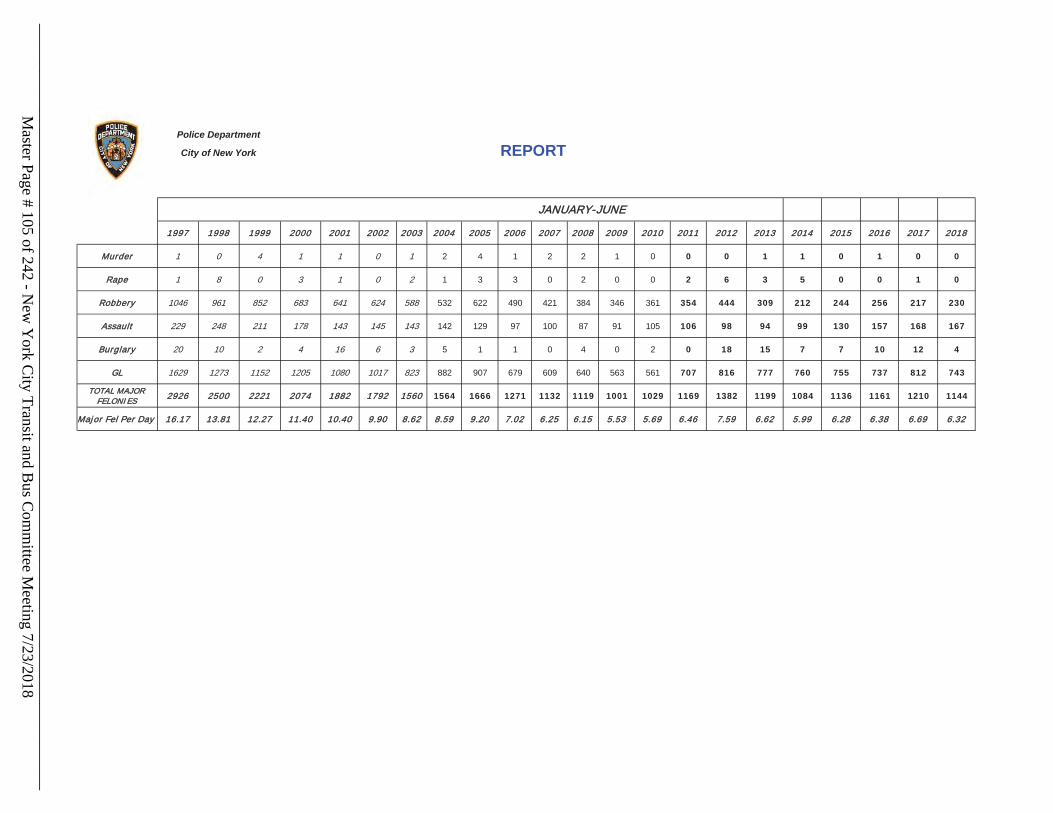
11997 1998 1999 2000 2001 2002 2003 2004 2005 2006 2007 2008 2009 2010 2011 2012 2013 2014 2015 2016 2017 2018
Murder 1 0 4 1 1 0 1 2 4 1 2 2 1 0 0 0 1 1 0 1 0 0
RRape 1 8 0 3 1 0 2 1 3 3 0 2 0 0 2 6 3 5 0 0 1 0
Robbery 1046 961 852 683 641 624 588 532 622 490 421 384 346 361 354 444 309 212 244 256 217 230
Assault 229 248 211 178 143 145 143 142 129 97 100 87 91 105 106 98 94 99 130 157 168 167
Burglary 20 10 2 4 16 6 3 5 1 1 0 4 0 2 0 18 15 7 7 10 12 4
GL 1629 1273 1152 1205 1080 1017 823 882 907 679 609 640 563 561 707 816 777 760 755 737 812 743
TOTAL MAJOR FELONIES 2926 2500 2221 2074 1882 1792 1560 1564 1666 1271 1132 1119 1001 1029 1169 1382 1199 1084 1136 1161 1210 1144
Major Fel Per Day 16.17 13.81 12.27 11.40 10.40 9.90 8.62 8.59 9.20 7.02 6.25 6.15 5.53 5.69 6.46 7.59 6.62 5.99 6.28 6.38 6.69 6.32
JANUARY-JUNE
REPORTPolice Department
City of New York
Master Page # 105 of 242 - N
ew Y
ork City Transit and B
us Com
mittee M
eeting 7/23/2018________________________________________________________________________________
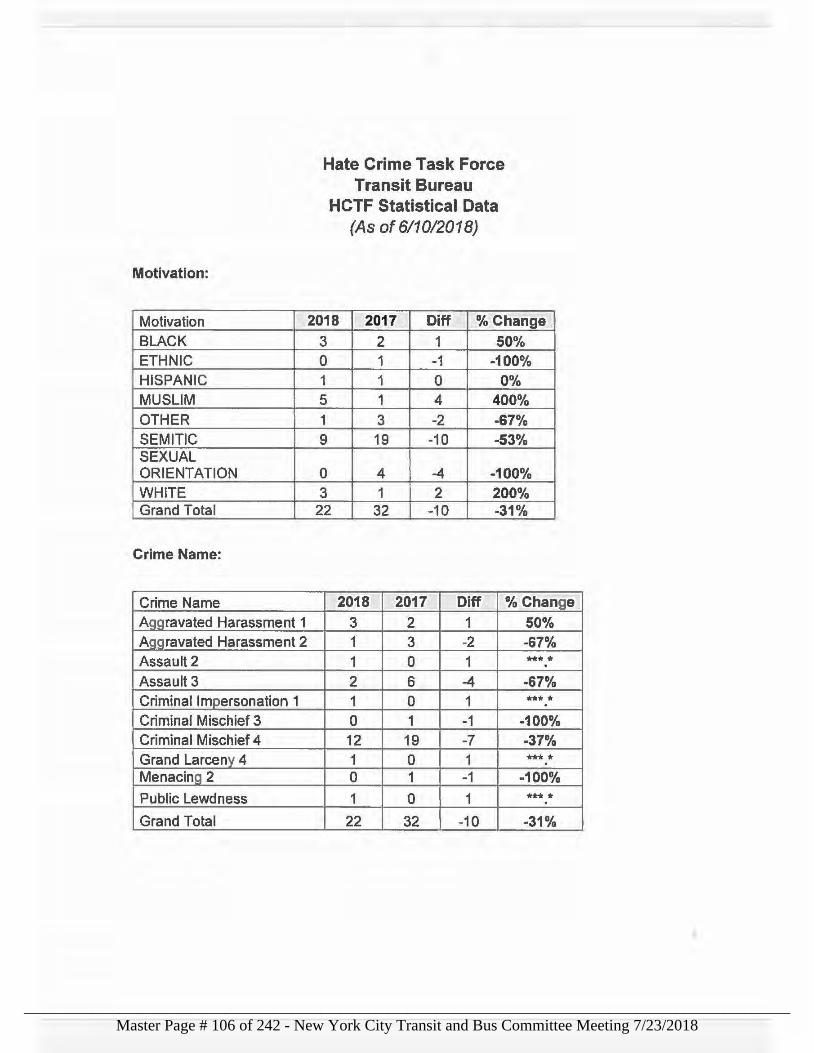
Motivation:
Motivation BLACK ETHNIC HISPANIC MUSLIM OTHER SEMITIC SEXUAL ORIENTATION WHITE Grand Total
Crime Name:
Crime Name AQQravated Harassment 1 Aaaravated Harassment 2 Assault2 Assault 3 Criminal Impersonation 1 Criminal Mischief 3 Criminal Mischief 4 Grand Larceny 4 Menacina 2
Public Lewdness
Grand Total
Hate Crime Task Force Transit Bureau
HCTF Statistical Data (As of 611012018)
2018 2017 Di ff % Change
3 2 1 50% 0 1 -1 -100% 1 1 0 0% 5 1 4 400%
1 3 -2 -67% 9 19 -10 -53%
0 4 -4 -100% 3 1 2 200%
22 32 -10 -31%
2018 2017 Diff % Change
3 2 1 50% 1 3 -2 -67% 1 0 1 *** * . 2 6 -4 -67% 1 0 1 *** * . 0 1 -1 -100% 12 19 -7 -37% 1 0 1 *** * 0 1 -1 -100%
1 0 1 *** * 22 32 -10 -31%
Master Page # 106 of 242 - New York City Transit and Bus Committee Meeting 7/23/2018________________________________________________________________________________
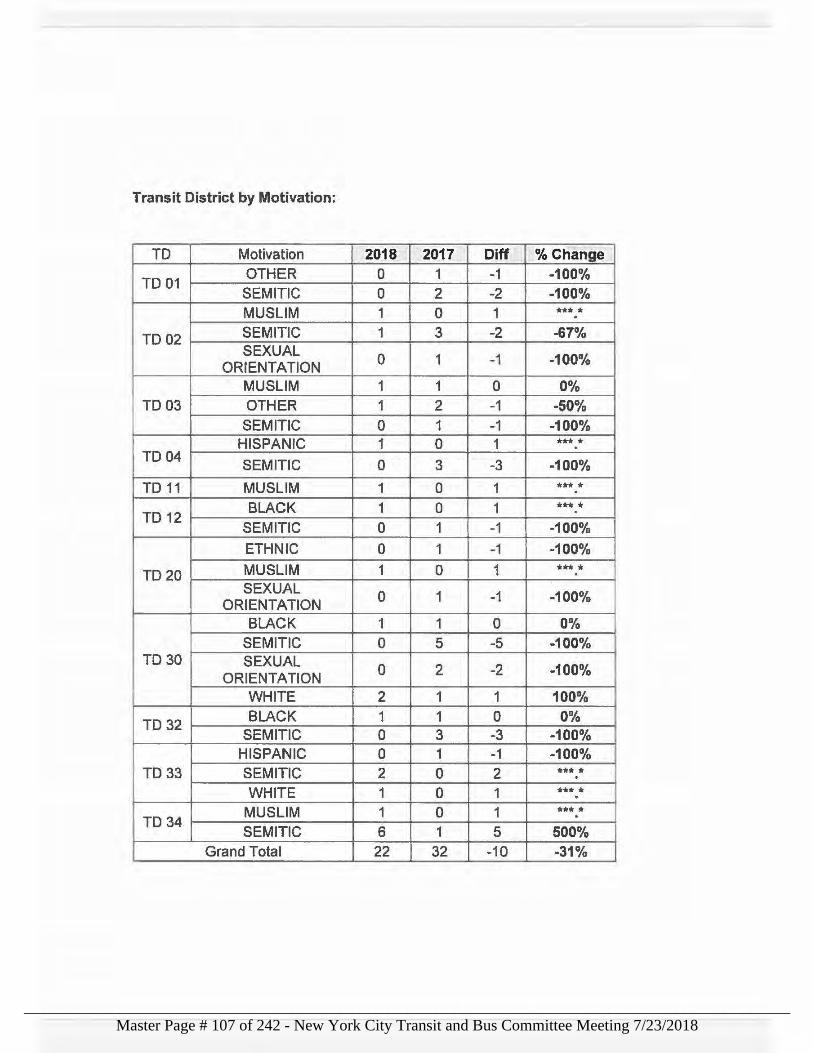
Transit District by Motivation:
TD Motivation 2018 2017 Diff % Change
TD01 OTHER 0 1 -1 -100% SEMITIC 0 2 -2 -100% MUSLIM 1 0 1 *** * .
TD02 SEMITIC 1 3 -2 -67% SEXUAL 0 1 -1 -100% ORIENTATION MUSLIM 1 1 0 0%
TD03 OTHER 1 2 -1 -50% SEMITIC 0 1 -1 -100%
HISPANIC 1 0 1 *** * TD04
SEMITIC 0 3 -3 -100%
TD 11 MUSLIM 1 0 1 *** * . BLACK 1 0 1 *** *
TD12 .
SEMITIC 0 1 -1 -100%
ETHNIC 0 1 -1 -100%
MUSLIM 1 0 1 *** * TD20 . SEXUAL 0 1 -1 -100%
ORIENTATION I BLACK 1 1 0 0%
SEMITIC 0 5 -5 -100% TD30 SEXUAL 0 2 -2 -100% ORIENTATION
WHITE 2 1 1 100%
TD32 BLACK 1 1 0 0%
SEMITIC 0 3 -3 -100% HISPANIC 0 1 -1 -100%
TD33 SEMITIC 2 0 2 *** * . WHITE 1 0 1 *** * .
MUSLIM 1 0 1 *** * TD 34
. SEMITIC 6 1 5 500%
Grand Total 22 32 -10 -31%
Master Page # 107 of 242 - New York City Transit and Bus Committee Meeting 7/23/2018________________________________________________________________________________
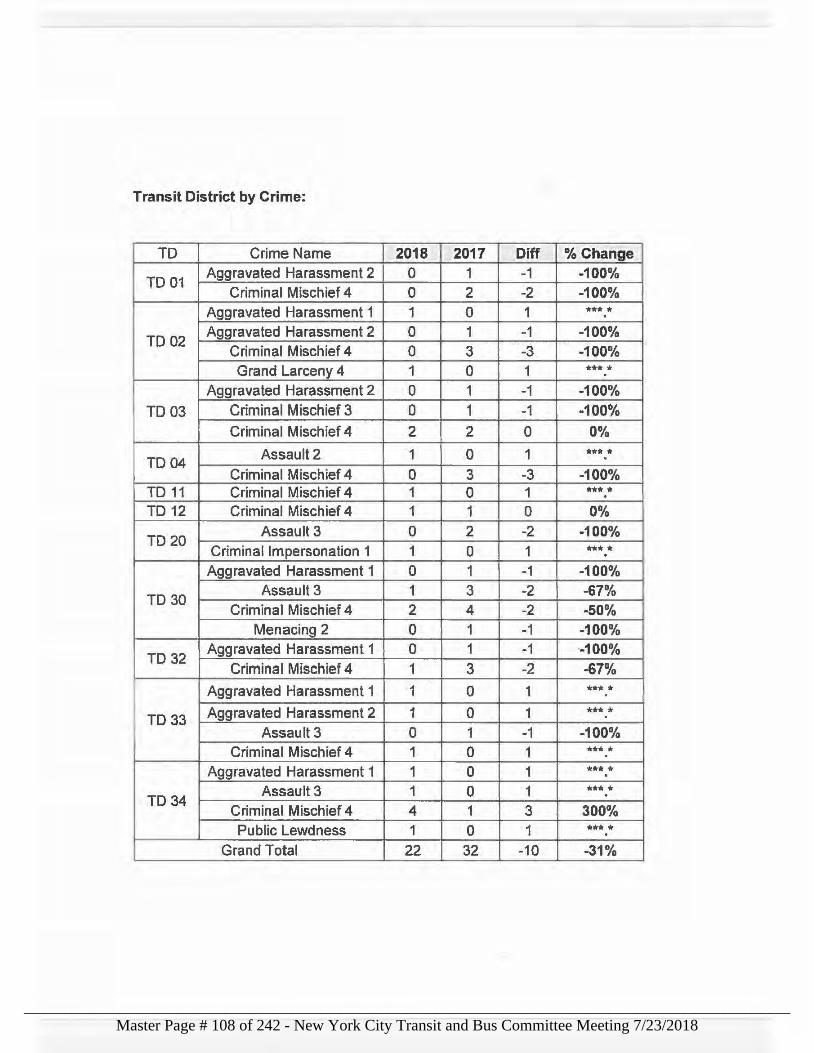
Transit District by Crime:
TD Crime Name 2018 2017 Diff % Change
TD01 Aggravated Harassment 2 0 1 -1 -100%
Criminal Mischief 4 0 2 -2 -100% Aggravated Harassment 1 1 0 1 *** * .
TD02 Aggravated Harassment 2 0 1 -1 -100%
Criminal Mischief 4 0 3 -3 -100% Grand Larceny 4 1 0 1 *** * .
Aggravated Harassment 2 0 1 -1 -100%
TD03 Criminal Mischief 3 0 1 -1 -100%
Criminal Mischief 4 2 2 0 0%
Assault2 1 0 1 *** * TD04 Criminal Mischief 4 0 3 -3 -100%
TD 11 Criminal Mischief 4 1 0 1 *** * TD 12 Criminal Mischief 4 1 1 0 0%
TD20 Assault 3 0 2 -2 -100%
Criminal Impersonation 1 1 0 1 *** * . Aggravated Harassment 1 0 1 -1 -100%
TD 30 Assault 3 1 3 -2 -67%
Criminal Mischief 4 2 4 -2 -50% Menacing 2 0 1 -1 -100%
TD32 Aggravated Harassment 1 0 1 -1 ·-100%
Criminal Mischief 4 1 3 -2 -67% Aggravated Harassment 1 1 0 1 *** * . Aggravated Harassment 2 1 0 1 *** * TD 33 .
Assault 3 0 1 -1 -100% Criminal Mischief 4 1 0 1 *** * .
Aggravated Harassment 1 1 0 1 *** * . Assault 3 1 0 1 *** *
TD 34 .
Criminal Mischief 4 4 1 3 300% Public Lewdness 1 0 1 *** * .
Grand Total 22 32 -10 -31%
Master Page # 108 of 242 - New York City Transit and Bus Committee Meeting 7/23/2018________________________________________________________________________________
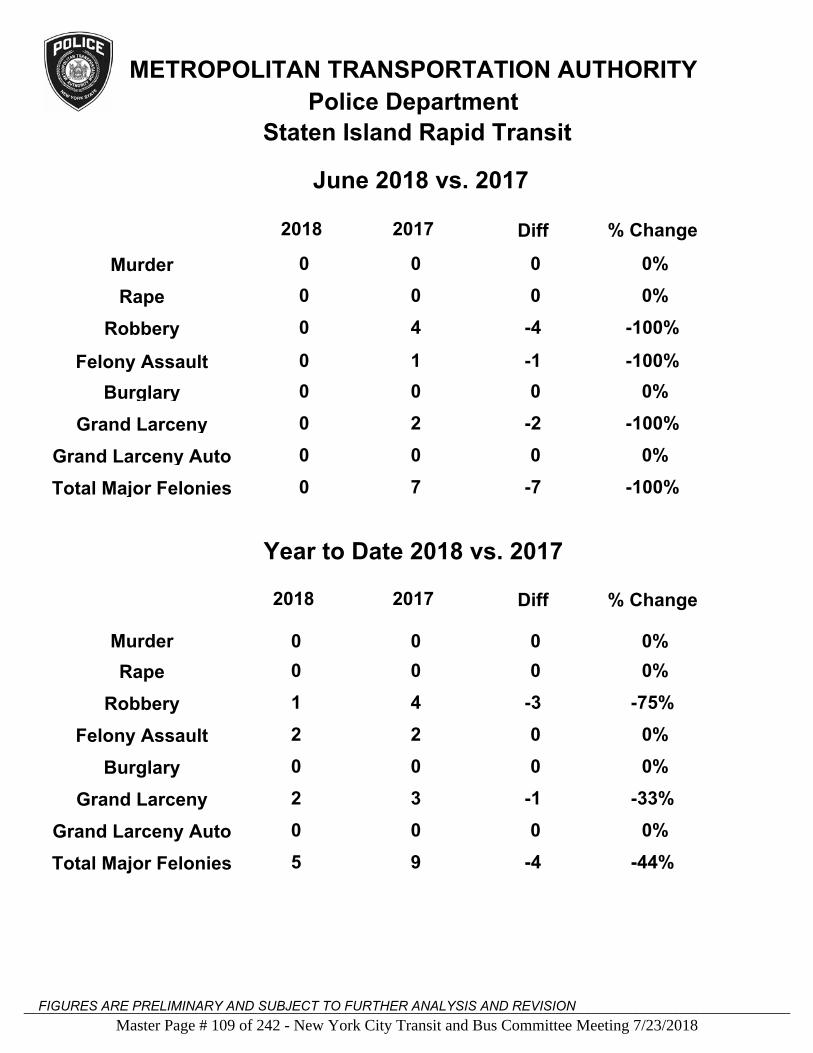
METROPOLITAN TRANSPORTATION AUTHORITY
Police Department
Murder
Rape
Robbery
Felony Assault
Burglary
Grand Larceny
Grand Larceny Auto
Total Major Felonies
0
0
0
0
0
0
0
0
0
0
4
1
0
0
2
7
-2
0
0
-4
-1
0
0
-7
-100%
Murder
Rape
Robbery
Felony Assault
Burglary
Grand Larceny
Grand Larceny Auto
Total Major Felonies
2 3
0
0
2
1
0
0
5 9
0
0
2
4
0
0
-1
0
0
0
-3
0
0
-4
0%
0%
-100%
-100%
0%
0%
-100%
0%
0%
-75%
0%
0%
-33%
0%
-44%
2018 2017 Diff % Change
June 2018 vs. 2017
Staten Island Rapid Transit
FIGURES ARE PRELIMINARY AND SUBJECT TO FURTHER ANALYSIS AND REVISION
2018 2017 Diff % Change
Year to Date 2018 vs. 2017
Master Page # 109 of 242 - New York City Transit and Bus Committee Meeting 7/23/2018________________________________________________________________________________
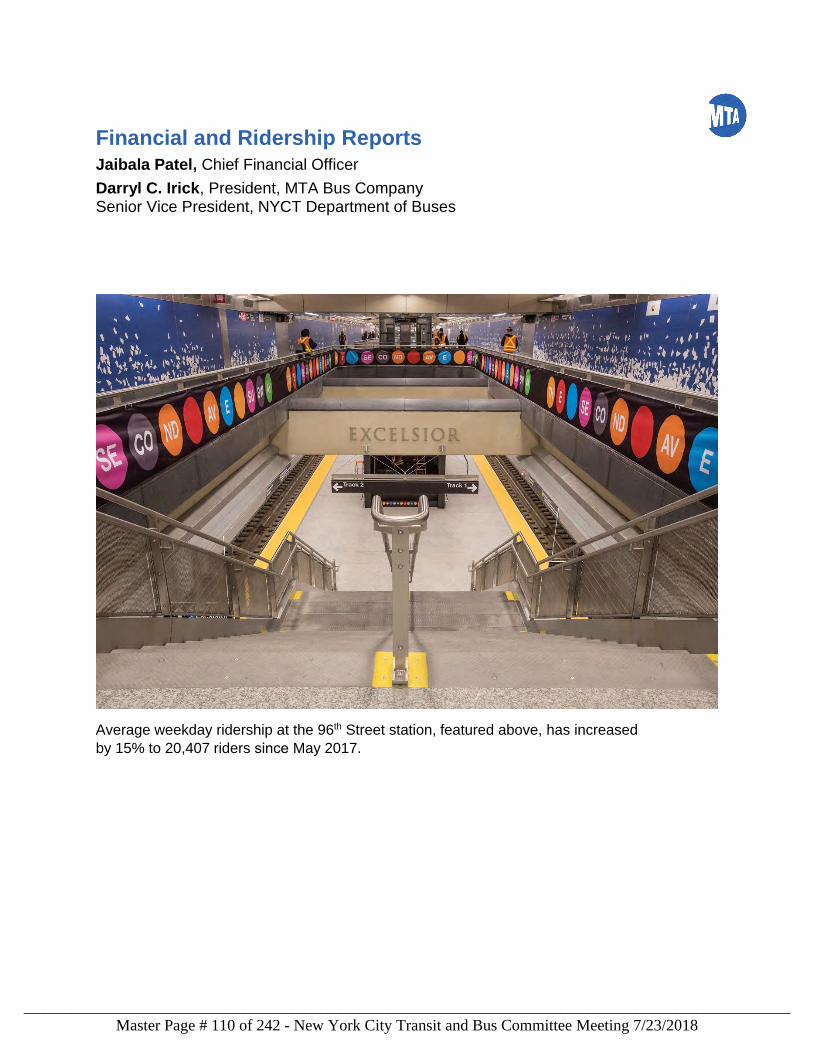
Financial and Ridership Reports
Jaibala Patel, Chief Financial Officer
Darryl C. Irick, President, MTA Bus Company Senior Vice President, NYCT Department of Buses
Average weekday ridership at the 96th Street station, featured above, has increased by 15% to 20,407 riders since May 2017.
Master Page # 110 of 242 - New York City Transit and Bus Committee Meeting 7/23/2018________________________________________________________________________________
Preliminary May 2018 Monthly Report: New York City Transit
The purpose of this report is to provide the preliminary May 2018 financial results, on an accrual basis. The accrual basis is presented on a non-reimbursable and reimbursable account basis. These results are compared to the Adopted Budget (budget).
Summary of Preliminary Financial Results
Preliminary ridership and accrual results, versus budget, are summarized as follows:
May 2018 New York City Transit ridership of 202.9 million was 7.7 million (3.6 percent)below budget, of which subway ridership of 150.3 million was 4.6 million (2.9 percent)below budget, and bus ridership of 51.8 million was 3.1 million (5.7 percent) belowbudget.
Farebox revenue of $385.8 million was $9.4 million (2.4 percent) below budget, mainlydue to the ongoing lower subway and bus ridership trends.
Operating expenses of $741.1 million exceeded budget by $31.1 million (4.4 percent). Labor expenses were higher by $11.4 million (2.0 percent), mainly due to higher overtime expenses of $25.6 million (64.7 percent), caused mostly by additional Subway Action Plan (SAP) project requirements, subway service delays, and vacancy/absentee coverage. Non-labor expenses were over budget by $19.7 million (12.8 percent), due mainly to additional requirements in several accounts, including maintenance contracts and the unfavorable timing of maintenance material requirements.
Master Page # 111 of 242 - New York City Transit and Bus Committee Meeting 7/23/2018________________________________________________________________________________
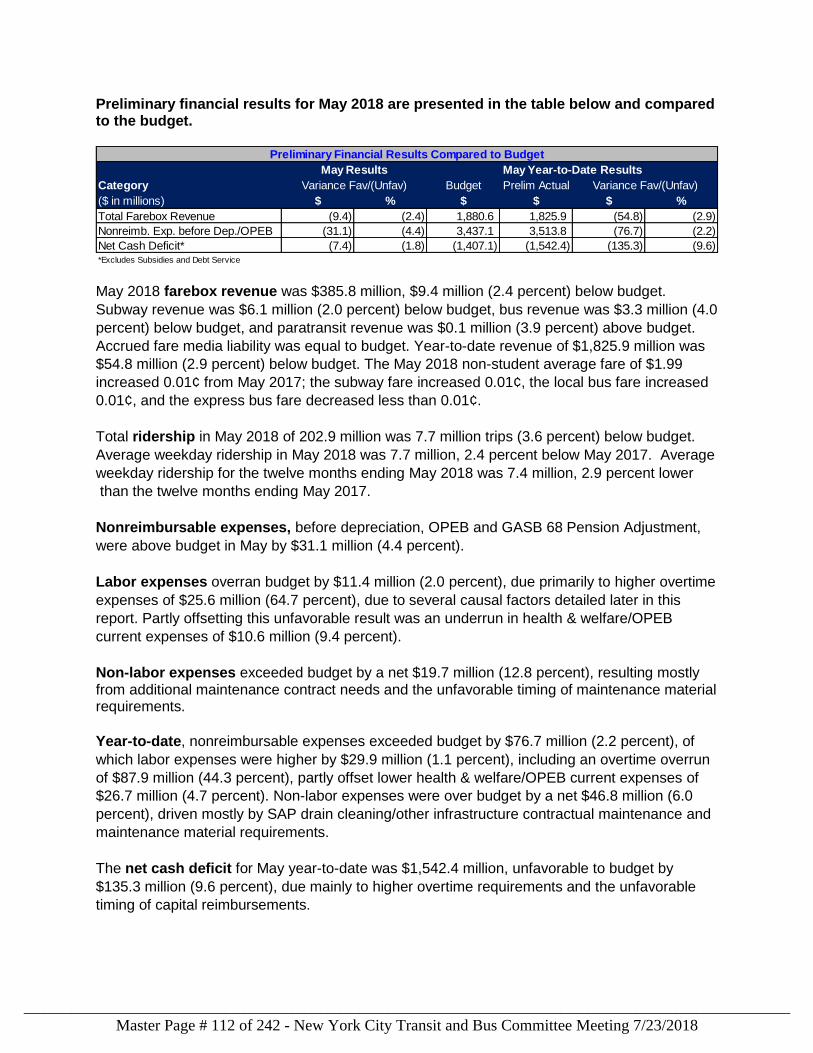
Preliminary financial results for May 2018 are presented in the table below and compared to the budget.
May 2018 farebox revenue was $385.8 million, $9.4 million (2.4 percent) below budget.
Subway revenue was $6.1 million (2.0 percent) below budget, bus revenue was $3.3 million (4.0
percent) below budget, and paratransit revenue was $0.1 million (3.9 percent) above budget.
Accrued fare media liability was equal to budget. Year-to-date revenue of $1,825.9 million was
$54.8 million (2.9 percent) below budget. The May 2018 non-student average fare of $1.99
increased 0.01¢ from May 2017; the subway fare increased 0.01¢, the local bus fare increased
0.01¢, and the express bus fare decreased less than 0.01¢.
Total ridership in May 2018 of 202.9 million was 7.7 million trips (3.6 percent) below budget.
Average weekday ridership in May 2018 was 7.7 million, 2.4 percent below May 2017. Average
weekday ridership for the twelve months ending May 2018 was 7.4 million, 2.9 percent lower
than the twelve months ending May 2017.
Nonreimbursable expenses, before depreciation, OPEB and GASB 68 Pension Adjustment,
were above budget in May by $31.1 million (4.4 percent).
Labor expenses overran budget by $11.4 million (2.0 percent), due primarily to higher overtime
expenses of $25.6 million (64.7 percent), due to several causal factors detailed later in this
report. Partly offsetting this unfavorable result was an underrun in health & welfare/OPEB
current expenses of $10.6 million (9.4 percent).
Non-labor expenses exceeded budget by a net $19.7 million (12.8 percent), resulting mostly from additional maintenance contract needs and the unfavorable timing of maintenance material requirements.
Year-to-date, nonreimbursable expenses exceeded budget by $76.7 million (2.2 percent), of
which labor expenses were higher by $29.9 million (1.1 percent), including an overtime overrun
of $87.9 million (44.3 percent), partly offset lower health & welfare/OPEB current expenses of
$26.7 million (4.7 percent). Non-labor expenses were over budget by a net $46.8 million (6.0
percent), driven mostly by SAP drain cleaning/other infrastructure contractual maintenance and
maintenance material requirements.
The net cash deficit for May year-to-date was $1,542.4 million, unfavorable to budget by
$135.3 million (9.6 percent), due mainly to higher overtime requirements and the unfavorable
timing of capital reimbursements.
Preliminary Financial Results Compared to Budget
May Results May Year-to-Date Results
Category Variance Fav/(Unfav) Budget Prelim Actual Variance Fav/(Unfav)
($ in millions) $ % $ $ $ %
Total Farebox Revenue (9.4) (2.4) 1,880.6 1,825.9 (54.8) (2.9)
Nonreimb. Exp. before Dep./OPEB (31.1) (4.4) 3,437.1 3,513.8 (76.7) (2.2)
Net Cash Deficit* (7.4) (1.8) (1,407.1) (1,542.4) (135.3) (9.6)*Excludes Subsidies and Debt Service
Master Page # 112 of 242 - New York City Transit and Bus Committee Meeting 7/23/2018________________________________________________________________________________
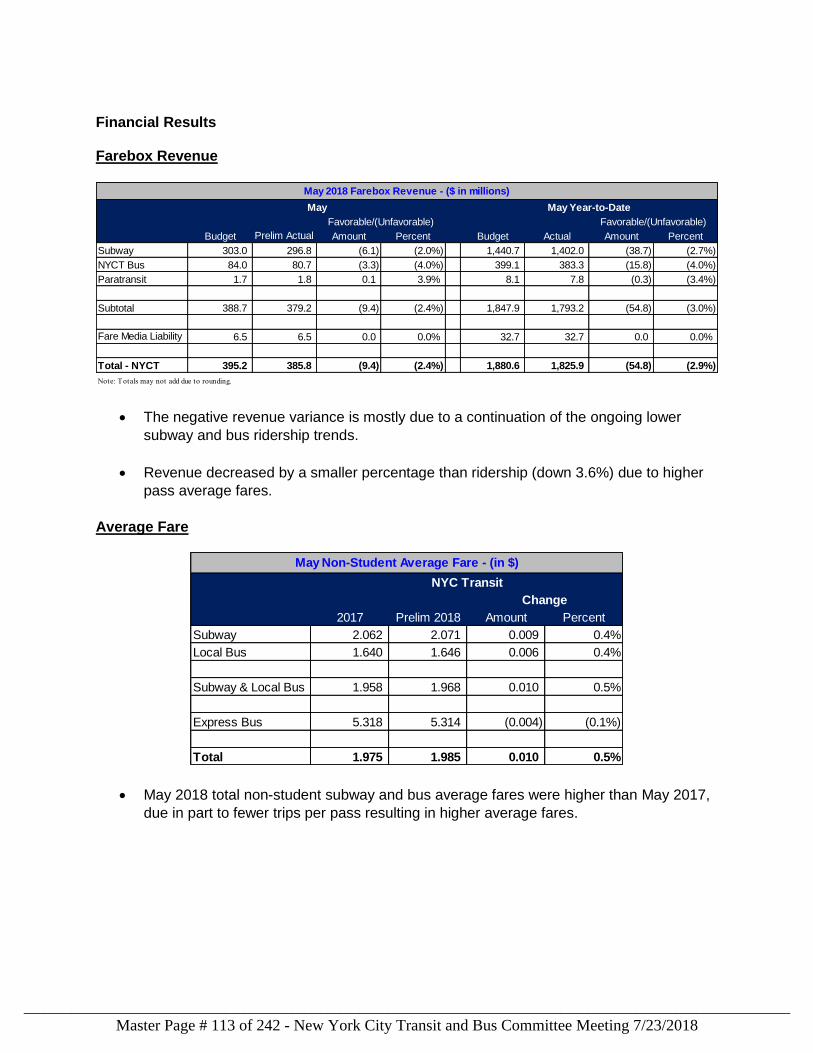
Financial Results Farebox Revenue
The negative revenue variance is mostly due to a continuation of the ongoing lower
subway and bus ridership trends.
Revenue decreased by a smaller percentage than ridership (down 3.6%) due to higher
pass average fares.
Average Fare
May 2018 total non-student subway and bus average fares were higher than May 2017,
due in part to fewer trips per pass resulting in higher average fares.
May May Year-to-Date NYC Transit
Budget Prelim Actual Amount Percent Budget Actual Amount Percent
Subway 303.0 296.8 (6.1) (2.0%) 1,440.7 1,402.0 (38.7) (2.7%)
NYCT Bus 84.0 80.7 (3.3) (4.0%) 399.1 383.3 (15.8) (4.0%)
Paratransit 1.7 1.8 0.1 3.9% 8.1 7.8 (0.3) (3.4%)
Subtotal 388.7 379.2 (9.4) (2.4%) 1,847.9 1,793.2 (54.8) (3.0%)
Fare Media Liability 6.5 6.5 0.0 0.0% 32.7 32.7 0.0 0.0%
Total - NYCT 395.2 385.8 (9.4) (2.4%) 1,880.6 1,825.9 (54.8) (2.9%)
Note: Totals may not add due to rounding.
Favorable/(Unfavorable)
May 2018 Farebox Revenue - ($ in millions)
Favorable/(Unfavorable)
NYC Transit May
Change
2017 Prelim 2018 Amount Percent
Subway 2.062 2.071 0.009 0.4%
Local Bus 1.640 1.646 0.006 0.4%
Subway & Local Bus 1.958 1.968 0.010 0.5%
Express Bus 5.318 5.314 (0.004) (0.1%)
Total 1.975 1.985 0.010 0.5%
May Non-Student Average Fare - (in $)
Master Page # 113 of 242 - New York City Transit and Bus Committee Meeting 7/23/2018________________________________________________________________________________
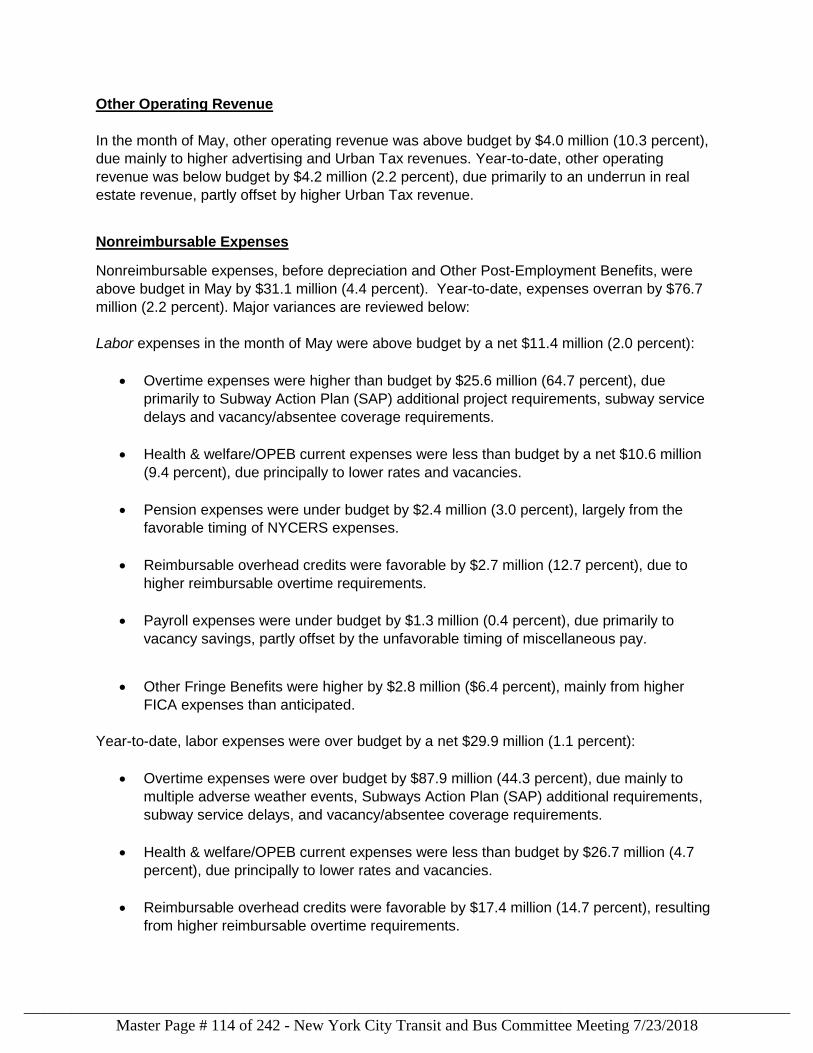
Other Operating Revenue
In the month of May, other operating revenue was above budget by $4.0 million (10.3 percent),
due mainly to higher advertising and Urban Tax revenues. Year-to-date, other operating
revenue was below budget by $4.2 million (2.2 percent), due primarily to an underrun in real
estate revenue, partly offset by higher Urban Tax revenue.
Nonreimbursable Expenses
Nonreimbursable expenses, before depreciation and Other Post-Employment Benefits, were
above budget in May by $31.1 million (4.4 percent). Year-to-date, expenses overran by $76.7
million (2.2 percent). Major variances are reviewed below:
Labor expenses in the month of May were above budget by a net $11.4 million (2.0 percent):
Overtime expenses were higher than budget by $25.6 million (64.7 percent), due
primarily to Subway Action Plan (SAP) additional project requirements, subway service
delays and vacancy/absentee coverage requirements.
Health & welfare/OPEB current expenses were less than budget by a net $10.6 million
(9.4 percent), due principally to lower rates and vacancies.
Pension expenses were under budget by $2.4 million (3.0 percent), largely from the
favorable timing of NYCERS expenses.
Reimbursable overhead credits were favorable by $2.7 million (12.7 percent), due to
higher reimbursable overtime requirements.
Payroll expenses were under budget by $1.3 million (0.4 percent), due primarily to
vacancy savings, partly offset by the unfavorable timing of miscellaneous pay.
Other Fringe Benefits were higher by $2.8 million ($6.4 percent), mainly from higher
FICA expenses than anticipated.
Year-to-date, labor expenses were over budget by a net $29.9 million (1.1 percent):
Overtime expenses were over budget by $87.9 million (44.3 percent), due mainly to
multiple adverse weather events, Subways Action Plan (SAP) additional requirements,
subway service delays, and vacancy/absentee coverage requirements.
Health & welfare/OPEB current expenses were less than budget by $26.7 million (4.7
percent), due principally to lower rates and vacancies.
Reimbursable overhead credits were favorable by $17.4 million (14.7 percent), resulting
from higher reimbursable overtime requirements.
Master Page # 114 of 242 - New York City Transit and Bus Committee Meeting 7/23/2018________________________________________________________________________________
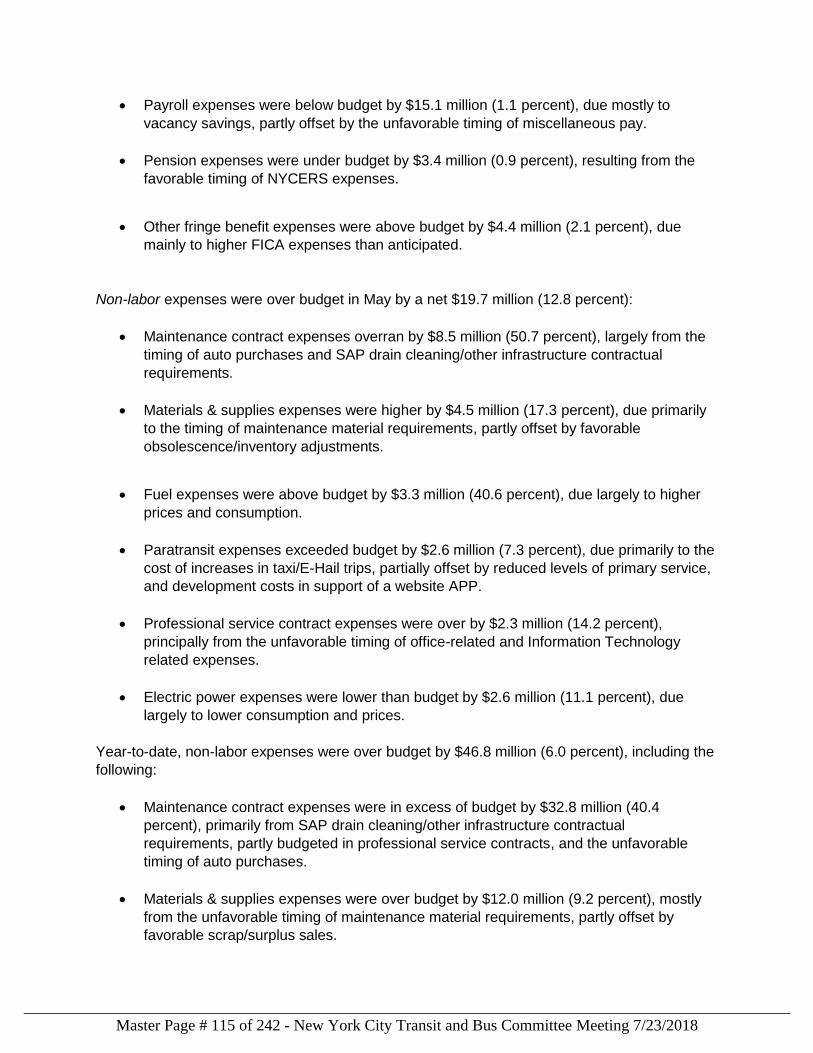
Payroll expenses were below budget by $15.1 million (1.1 percent), due mostly to
vacancy savings, partly offset by the unfavorable timing of miscellaneous pay.
Pension expenses were under budget by $3.4 million (0.9 percent), resulting from the
favorable timing of NYCERS expenses.
Other fringe benefit expenses were above budget by $4.4 million (2.1 percent), due
mainly to higher FICA expenses than anticipated.
Non-labor expenses were over budget in May by a net $19.7 million (12.8 percent):
Maintenance contract expenses overran by $8.5 million (50.7 percent), largely from the
timing of auto purchases and SAP drain cleaning/other infrastructure contractual
requirements.
Materials & supplies expenses were higher by $4.5 million (17.3 percent), due primarily
to the timing of maintenance material requirements, partly offset by favorable
obsolescence/inventory adjustments.
Fuel expenses were above budget by $3.3 million (40.6 percent), due largely to higher
prices and consumption.
Paratransit expenses exceeded budget by $2.6 million (7.3 percent), due primarily to the
cost of increases in taxi/E-Hail trips, partially offset by reduced levels of primary service,
and development costs in support of a website APP.
Professional service contract expenses were over by $2.3 million (14.2 percent),
principally from the unfavorable timing of office-related and Information Technology
related expenses.
Electric power expenses were lower than budget by $2.6 million (11.1 percent), due
largely to lower consumption and prices.
Year-to-date, non-labor expenses were over budget by $46.8 million (6.0 percent), including the
following:
Maintenance contract expenses were in excess of budget by $32.8 million (40.4
percent), primarily from SAP drain cleaning/other infrastructure contractual
requirements, partly budgeted in professional service contracts, and the unfavorable
timing of auto purchases.
Materials & supplies expenses were over budget by $12.0 million (9.2 percent), mostly
from the unfavorable timing of maintenance material requirements, partly offset by
favorable scrap/surplus sales.
Master Page # 115 of 242 - New York City Transit and Bus Committee Meeting 7/23/2018________________________________________________________________________________
Fuel expenses were over budget by $6.9 million (15.8 percent), mainly from higher
prices.
Other business expenses were higher by $3.5 million (10.4 percent), due to the
unfavorable timing of reimbursable job closing adjustments, Mobility taxes and various
miscellaneous purchases.
Electric power expenses underran budget by $4.3 million 3.3 percent, due largely to
lower consumption.
Paratransit service contract expenses were below budget by $1.2 million (0.7 percent),
due principally to lower completed trips.
Depreciation expenses were higher than budget year-to-date by $43.1 million (6.1 percent), due
mainly to a year-end update of system capital assets reaching beneficial use not anticipated in
the budget.
GASB #45 Other Post-Employment Benefits was adopted by the MTA in 2007. Accrued
expenses of $267.1 million were recorded through May, $70.5 million (20.9 percent) below
budget.
GASB #68 Pension Adjustment was adopted by the MTA in 2015. Accrued expenses of $0.3
million were recorded through May, unfavorable to budget by $76.7 million.
Net Cash Deficit
The net cash deficit for May year-to-date was $1,542.4 million, unfavorable to budget by $135.3
million (9.6 percent), due mostly to higher overtime expenditures and the unfavorable timing of
capital reimbursements.
Incumbents
There were 49,560 full-time paid incumbents at the end of May, an increase of 120 from April.
Master Page # 116 of 242 - New York City Transit and Bus Committee Meeting 7/23/2018________________________________________________________________________________
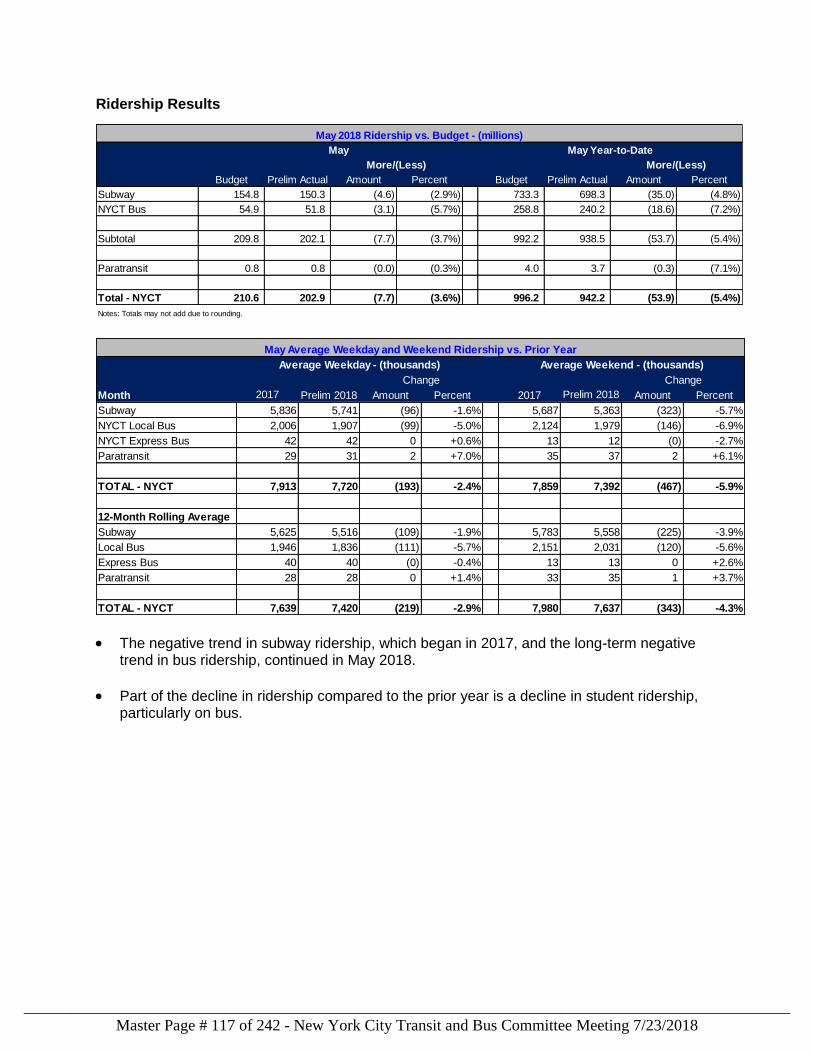
Ridership Results
The negative trend in subway ridership, which began in 2017, and the long-term negative trend in bus ridership, continued in May 2018.
Part of the decline in ridership compared to the prior year is a decline in student ridership, particularly on bus.
May May Year-to-Date
More/(Less) More/(Less)
Budget Prelim Actual Amount Percent Budget Prelim Actual Amount Percent
Subway 154.8 150.3 (4.6) (2.9%) 733.3 698.3 (35.0) (4.8%)
NYCT Bus 54.9 51.8 (3.1) (5.7%) 258.8 240.2 (18.6) (7.2%)
Subtotal 209.8 202.1 (7.7) (3.7%) 992.2 938.5 (53.7) (5.4%)
Paratransit 0.8 0.8 (0.0) (0.3%) 4.0 3.7 (0.3) (7.1%)
Total - NYCT 210.6 202.9 (7.7) (3.6%) 996.2 942.2 (53.9) (5.4%)
Notes: Totals may not add due to rounding.
May 2018 Ridership vs. Budget - (millions)
Average Weekday - (thousands) Average Weekend - (thousands)
Month 2017 Prelim 2018 Amount Percent 2017 Prelim 2018 Amount Percent
Subway 5,836 5,741 (96) -1.6% 5,687 5,363 (323) -5.7%
NYCT Local Bus 2,006 1,907 (99) -5.0% 2,124 1,979 (146) -6.9%
NYCT Express Bus 42 42 0 +0.6% 13 12 (0) -2.7%
Paratransit 29 31 2 +7.0% 35 37 2 +6.1%
TOTAL - NYCT 7,913 7,720 (193) -2.4% 7,859 7,392 (467) -5.9%
12-Month Rolling Average
Subway 5,625 5,516 (109) -1.9% 5,783 5,558 (225) -3.9%
Local Bus 1,946 1,836 (111) -5.7% 2,151 2,031 (120) -5.6%
Express Bus 40 40 (0) -0.4% 13 13 0 +2.6%
Paratransit 28 28 0 +1.4% 33 35 1 +3.7%
TOTAL - NYCT 7,639 7,420 (219) -2.9% 7,980 7,637 (343) -4.3%
ChangeChange
May Average Weekday and Weekend Ridership vs. Prior Year
Master Page # 117 of 242 - New York City Transit and Bus Committee Meeting 7/23/2018________________________________________________________________________________
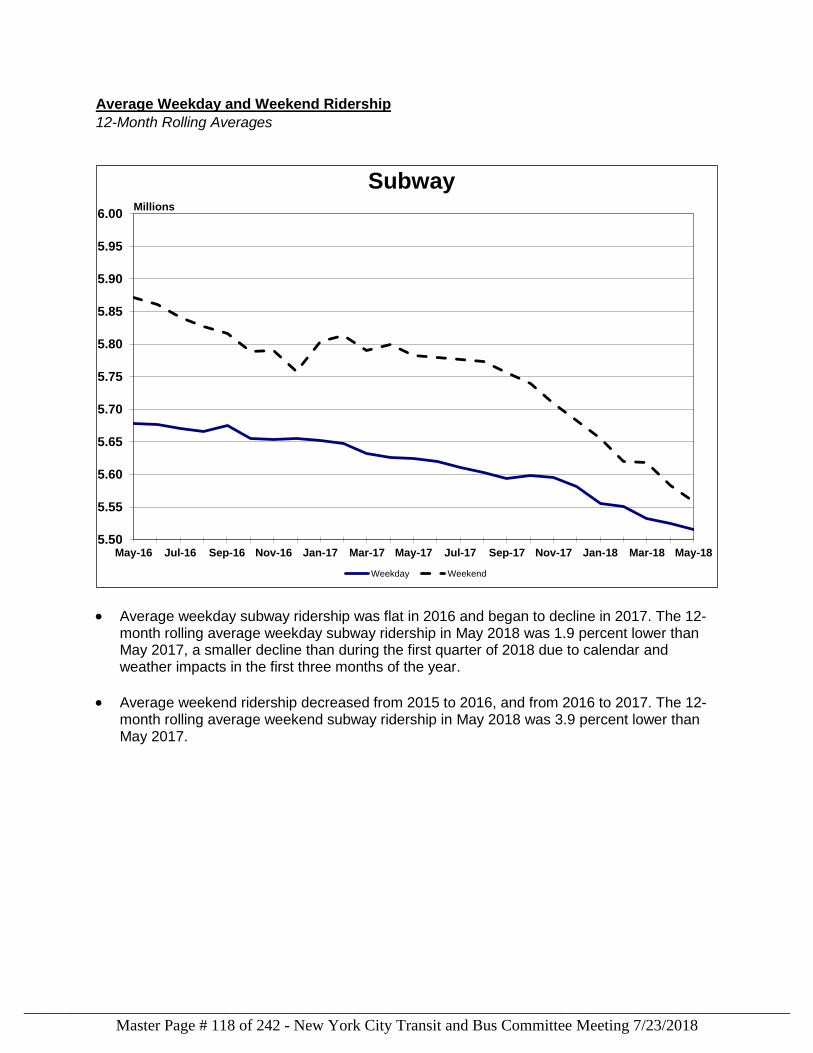
Average Weekday and Weekend Ridership
12-Month Rolling Averages
Average weekday subway ridership was flat in 2016 and began to decline in 2017. The 12-month rolling average weekday subway ridership in May 2018 was 1.9 percent lower than May 2017, a smaller decline than during the first quarter of 2018 due to calendar and weather impacts in the first three months of the year.
Average weekend ridership decreased from 2015 to 2016, and from 2016 to 2017. The 12-month rolling average weekend subway ridership in May 2018 was 3.9 percent lower than May 2017.
5.50
5.55
5.60
5.65
5.70
5.75
5.80
5.85
5.90
5.95
6.00
May-16 Jul-16 Sep-16 Nov-16 Jan-17 Mar-17 May-17 Jul-17 Sep-17 Nov-17 Jan-18 Mar-18 May-18
Subway
Weekday Weekend
Millions
Master Page # 118 of 242 - New York City Transit and Bus Committee Meeting 7/23/2018________________________________________________________________________________
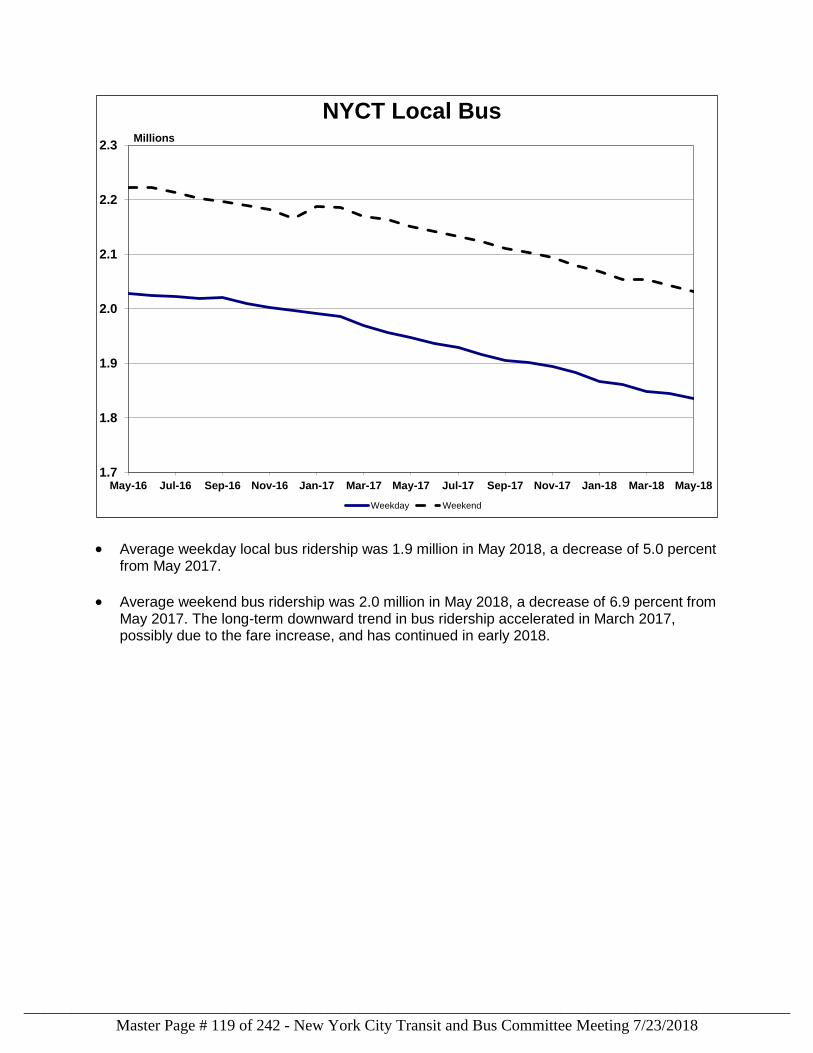
Average weekday local bus ridership was 1.9 million in May 2018, a decrease of 5.0 percent from May 2017.
Average weekend bus ridership was 2.0 million in May 2018, a decrease of 6.9 percent from May 2017. The long-term downward trend in bus ridership accelerated in March 2017, possibly due to the fare increase, and has continued in early 2018.
1.7
1.8
1.9
2.0
2.1
2.2
2.3
May-16 Jul-16 Sep-16 Nov-16 Jan-17 Mar-17 May-17 Jul-17 Sep-17 Nov-17 Jan-18 Mar-18 May-18
NYCT Local Bus
Weekday Weekend
Millions
Master Page # 119 of 242 - New York City Transit and Bus Committee Meeting 7/23/2018________________________________________________________________________________
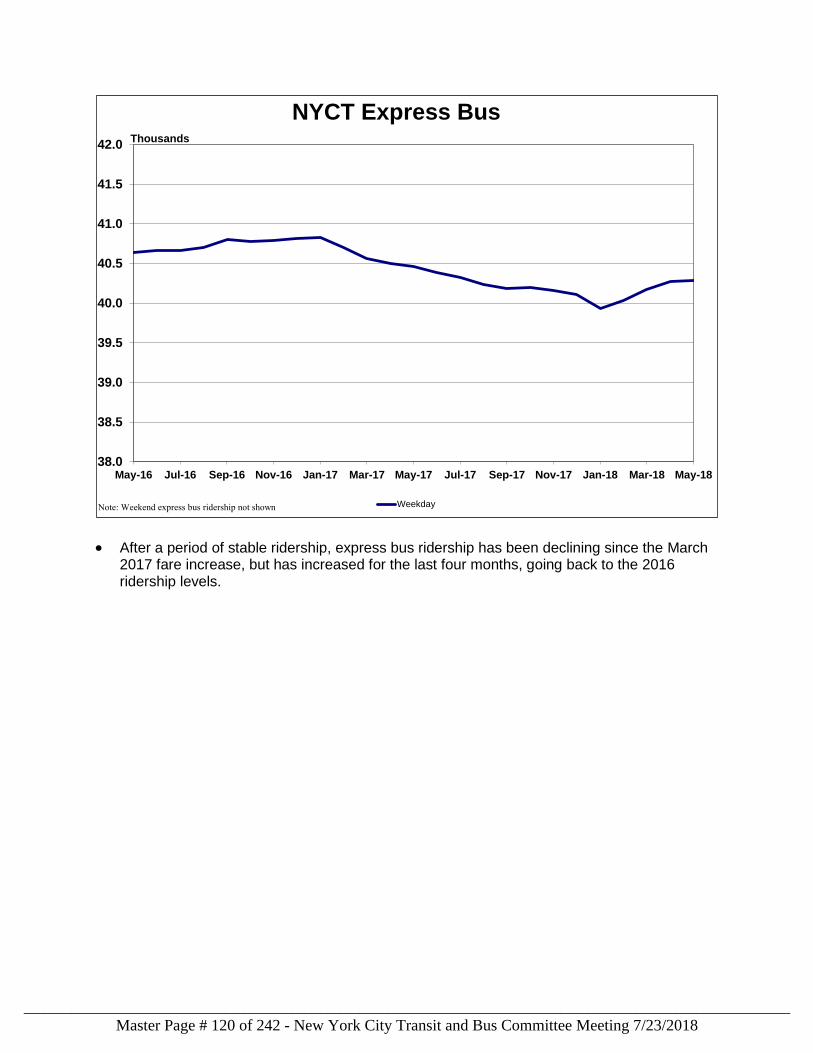
After a period of stable ridership, express bus ridership has been declining since the March 2017 fare increase, but has increased for the last four months, going back to the 2016 ridership levels.
38.0
38.5
39.0
39.5
40.0
40.5
41.0
41.5
42.0
May-16 Jul-16 Sep-16 Nov-16 Jan-17 Mar-17 May-17 Jul-17 Sep-17 Nov-17 Jan-18 Mar-18 May-18
NYCT Express Bus
Weekday
Thousands
Note: Weekend express bus ridership not shown
Master Page # 120 of 242 - New York City Transit and Bus Committee Meeting 7/23/2018________________________________________________________________________________
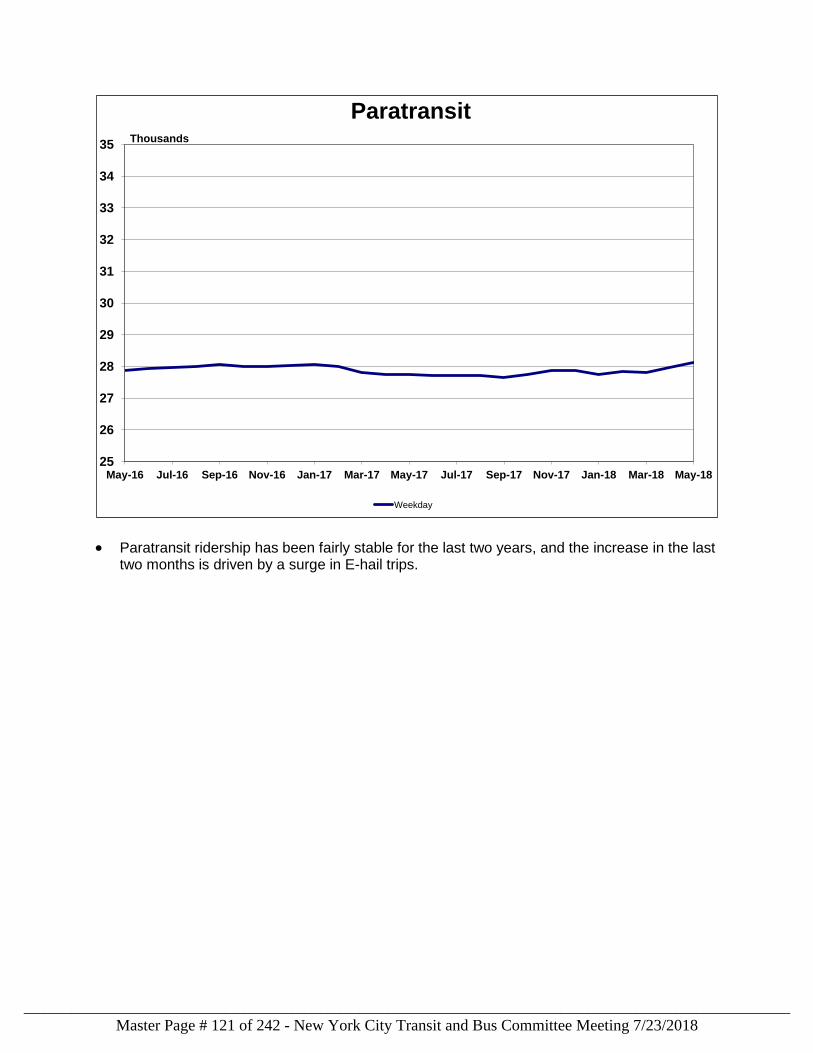
Paratransit ridership has been fairly stable for the last two years, and the increase in the last two months is driven by a surge in E-hail trips.
25
26
27
28
29
30
31
32
33
34
35
May-16 Jul-16 Sep-16 Nov-16 Jan-17 Mar-17 May-17 Jul-17 Sep-17 Nov-17 Jan-18 Mar-18 May-18
Paratransit
Weekday
Thousands
Master Page # 121 of 242 - New York City Transit and Bus Committee Meeting 7/23/2018________________________________________________________________________________
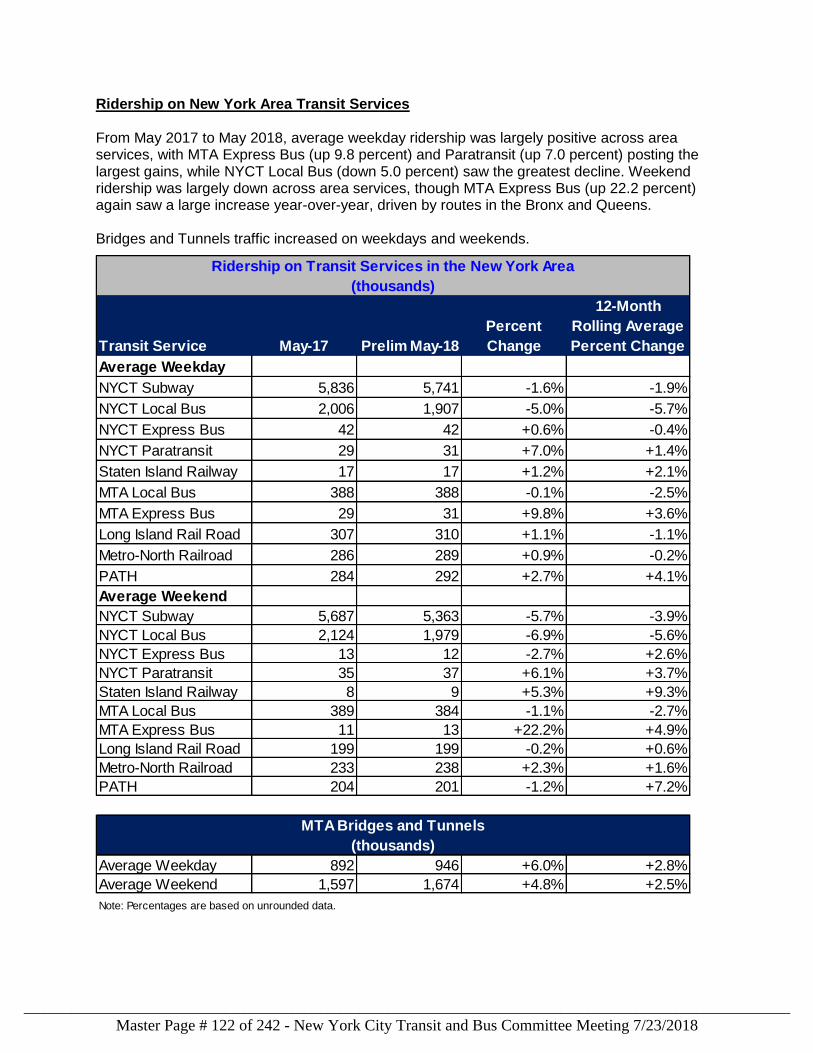
Ridership on New York Area Transit Services From May 2017 to May 2018, average weekday ridership was largely positive across area services, with MTA Express Bus (up 9.8 percent) and Paratransit (up 7.0 percent) posting the largest gains, while NYCT Local Bus (down 5.0 percent) saw the greatest decline. Weekend ridership was largely down across area services, though MTA Express Bus (up 22.2 percent) again saw a large increase year-over-year, driven by routes in the Bronx and Queens. Bridges and Tunnels traffic increased on weekdays and weekends.
Ridership on Transit Services in the New York Area
(thousands)
Transit Service May-17 Prelim May-18
Percent
Change
12-Month
Rolling Average
Percent Change
Average Weekday
NYCT Subway 5,836 5,741 -1.6% -1.9%
NYCT Local Bus 2,006 1,907 -5.0% -5.7%
NYCT Express Bus 42 42 +0.6% -0.4%
NYCT Paratransit 29 31 +7.0% +1.4%
Staten Island Railway 17 17 +1.2% +2.1%
MTA Local Bus 388 388 -0.1% -2.5%
MTA Express Bus 29 31 +9.8% +3.6%
Long Island Rail Road 307 310 +1.1% -1.1%
Metro-North Railroad 286 289 +0.9% -0.2%
PATH 284 292 +2.7% +4.1%
Average Weekend
NYCT Subway 5,687 5,363 -5.7% -3.9%
NYCT Local Bus 2,124 1,979 -6.9% -5.6%
NYCT Express Bus 13 12 -2.7% +2.6%
NYCT Paratransit 35 37 +6.1% +3.7%
Staten Island Railway 8 9 +5.3% +9.3%
MTA Local Bus 389 384 -1.1% -2.7%
MTA Express Bus 11 13 +22.2% +4.9%
Long Island Rail Road 199 199 -0.2% +0.6%
Metro-North Railroad 233 238 +2.3% +1.6%
PATH 204 201 -1.2% +7.2%
MTA Bridges and Tunnels
(thousands)
Average Weekday 892 946 +6.0% +2.8%
Average Weekend 1,597 1,674 +4.8% +2.5%
Note: Percentages are based on unrounded data.
Master Page # 122 of 242 - New York City Transit and Bus Committee Meeting 7/23/2018________________________________________________________________________________
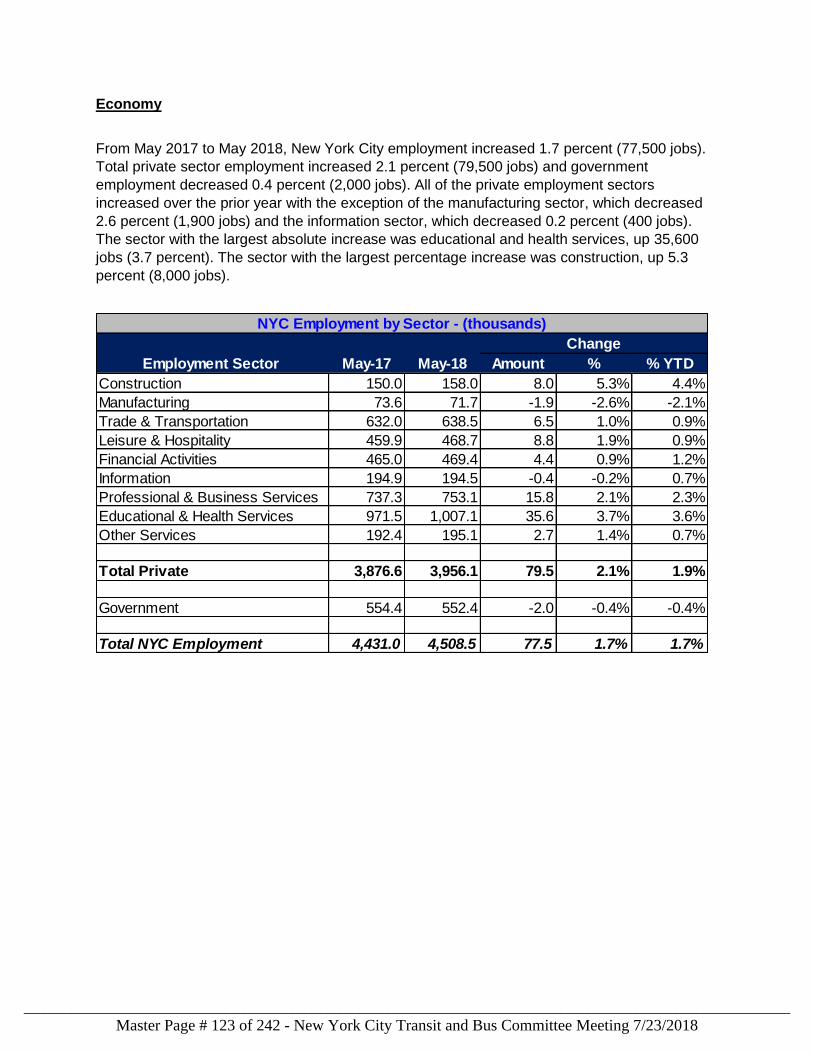
Economy
From May 2017 to May 2018, New York City employment increased 1.7 percent (77,500 jobs).
Total private sector employment increased 2.1 percent (79,500 jobs) and government
employment decreased 0.4 percent (2,000 jobs). All of the private employment sectors
increased over the prior year with the exception of the manufacturing sector, which decreased
2.6 percent (1,900 jobs) and the information sector, which decreased 0.2 percent (400 jobs).
The sector with the largest absolute increase was educational and health services, up 35,600
jobs (3.7 percent). The sector with the largest percentage increase was construction, up 5.3
percent (8,000 jobs).
NYC Employment by Sector - (thousands)
Change
Employment Sector May-17 May-18 Amount % % YTD
Construction 150.0 158.0 8.0 5.3% 4.4%
Manufacturing 73.6 71.7 -1.9 -2.6% -2.1%
Trade & Transportation 632.0 638.5 6.5 1.0% 0.9%
Leisure & Hospitality 459.9 468.7 8.8 1.9% 0.9%
Financial Activities 465.0 469.4 4.4 0.9% 1.2%
Information 194.9 194.5 -0.4 -0.2% 0.7%
Professional & Business Services 737.3 753.1 15.8 2.1% 2.3%
Educational & Health Services 971.5 1,007.1 35.6 3.7% 3.6%
Other Services 192.4 195.1 2.7 1.4% 0.7%
Total Private 3,876.6 3,956.1 79.5 2.1% 1.9%
Government 554.4 552.4 -2.0 -0.4% -0.4%
Total NYC Employment 4,431.0 4,508.5 77.5 1.7% 1.7%
Master Page # 123 of 242 - New York City Transit and Bus Committee Meeting 7/23/2018________________________________________________________________________________
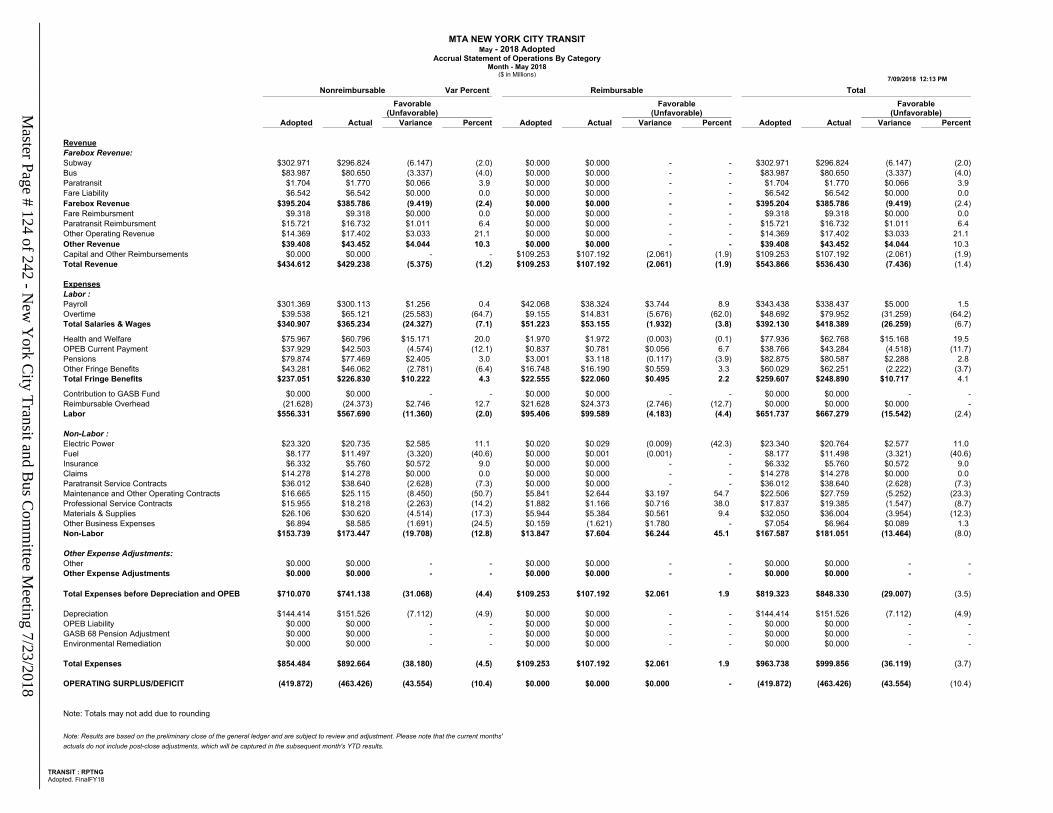
MTA NEW YORK CITY TRANSITMay - 2018 Adopted
Accrual Statement of Operations By CategoryMonth - May 2018
($ in Millions)7/09/2018 12:13 PM
TRANSIT : RPTNGAdopted. FinalFY18
Nonreimbursable Var Percent Reimbursable TotalFavorable
(Unfavorable)Favorable
(Unfavorable)Favorable
(Unfavorable)Adopted Actual Variance Percent Adopted Actual Variance Percent Adopted Actual Variance Percent
RevenueFarebox Revenue:Subway $302.971 $296.824 (6.147) (2.0) $0.000 $0.000 - - $302.971 $296.824 (6.147) (2.0)Bus $83.987 $80.650 (3.337) (4.0) $0.000 $0.000 - - $83.987 $80.650 (3.337) (4.0)Paratransit $1.704 $1.770 $0.066 3.9 $0.000 $0.000 - - $1.704 $1.770 $0.066 3.9 Fare Liability $6.542 $6.542 $0.000 0.0 $0.000 $0.000 - - $6.542 $6.542 $0.000 0.0 Farebox Revenue $395.204 $385.786 (9.419) (2.4) $0.000 $0.000 - - $395.204 $385.786 (9.419) (2.4)Fare Reimbursment $9.318 $9.318 $0.000 0.0 $0.000 $0.000 - - $9.318 $9.318 $0.000 0.0 Paratransit Reimbursment $15.721 $16.732 $1.011 6.4 $0.000 $0.000 - - $15.721 $16.732 $1.011 6.4 Other Operating Revenue $14.369 $17.402 $3.033 21.1 $0.000 $0.000 - - $14.369 $17.402 $3.033 21.1 Other Revenue $39.408 $43.452 $4.044 10.3 $0.000 $0.000 - - $39.408 $43.452 $4.044 10.3 Capital and Other Reimbursements $0.000 $0.000 - - $109.253 $107.192 (2.061) (1.9) $109.253 $107.192 (2.061) (1.9)Total Revenue $434.612 $429.238 (5.375) (1.2) $109.253 $107.192 (2.061) (1.9) $543.866 $536.430 (7.436) (1.4)
ExpensesLabor :Payroll $301.369 $300.113 $1.256 0.4 $42.068 $38.324 $3.744 8.9 $343.438 $338.437 $5.000 1.5 Overtime $39.538 $65.121 (25.583) (64.7) $9.155 $14.831 (5.676) (62.0) $48.692 $79.952 (31.259) (64.2)Total Salaries & Wages $340.907 $365.234 (24.327) (7.1) $51.223 $53.155 (1.932) (3.8) $392.130 $418.389 (26.259) (6.7)
Health and Welfare $75.967 $60.796 $15.171 20.0 $1.970 $1.972 (0.003) (0.1) $77.936 $62.768 $15.168 19.5 OPEB Current Payment $37.929 $42.503 (4.574) (12.1) $0.837 $0.781 $0.056 6.7 $38.766 $43.284 (4.518) (11.7)Pensions $79.874 $77.469 $2.405 3.0 $3.001 $3.118 (0.117) (3.9) $82.875 $80.587 $2.288 2.8 Other Fringe Benefits $43.281 $46.062 (2.781) (6.4) $16.748 $16.190 $0.559 3.3 $60.029 $62.251 (2.222) (3.7)Total Fringe Benefits $237.051 $226.830 $10.222 4.3 $22.555 $22.060 $0.495 2.2 $259.607 $248.890 $10.717 4.1
Contribution to GASB Fund $0.000 $0.000 - - $0.000 $0.000 - - $0.000 $0.000 - -Reimbursable Overhead (21.628) (24.373) $2.746 12.7 $21.628 $24.373 (2.746) (12.7) $0.000 $0.000 $0.000 -Labor $556.331 $567.690 (11.360) (2.0) $95.406 $99.589 (4.183) (4.4) $651.737 $667.279 (15.542) (2.4)
Non-Labor :Electric Power $23.320 $20.735 $2.585 11.1 $0.020 $0.029 (0.009) (42.3) $23.340 $20.764 $2.577 11.0 Fuel $8.177 $11.497 (3.320) (40.6) $0.000 $0.001 (0.001) - $8.177 $11.498 (3.321) (40.6)Insurance $6.332 $5.760 $0.572 9.0 $0.000 $0.000 - - $6.332 $5.760 $0.572 9.0 Claims $14.278 $14.278 $0.000 0.0 $0.000 $0.000 - - $14.278 $14.278 $0.000 0.0 Paratransit Service Contracts $36.012 $38.640 (2.628) (7.3) $0.000 $0.000 - - $36.012 $38.640 (2.628) (7.3)Maintenance and Other Operating Contracts $16.665 $25.115 (8.450) (50.7) $5.841 $2.644 $3.197 54.7 $22.506 $27.759 (5.252) (23.3)Professional Service Contracts $15.955 $18.218 (2.263) (14.2) $1.882 $1.166 $0.716 38.0 $17.837 $19.385 (1.547) (8.7)Materials & Supplies $26.106 $30.620 (4.514) (17.3) $5.944 $5.384 $0.561 9.4 $32.050 $36.004 (3.954) (12.3)Other Business Expenses $6.894 $8.585 (1.691) (24.5) $0.159 (1.621) $1.780 - $7.054 $6.964 $0.089 1.3 Non-Labor $153.739 $173.447 (19.708) (12.8) $13.847 $7.604 $6.244 45.1 $167.587 $181.051 (13.464) (8.0)
Other Expense Adjustments:Other $0.000 $0.000 - - $0.000 $0.000 - - $0.000 $0.000 - -Other Expense Adjustments $0.000 $0.000 - - $0.000 $0.000 - - $0.000 $0.000 - -
Total Expenses before Depreciation and OPEB $710.070 $741.138 (31.068) (4.4) $109.253 $107.192 $2.061 1.9 $819.323 $848.330 (29.007) (3.5)
Depreciation $144.414 $151.526 (7.112) (4.9) $0.000 $0.000 - - $144.414 $151.526 (7.112) (4.9)OPEB Liability $0.000 $0.000 - - $0.000 $0.000 - - $0.000 $0.000 - -GASB 68 Pension Adjustment $0.000 $0.000 - - $0.000 $0.000 - - $0.000 $0.000 - -Environmental Remediation $0.000 $0.000 - - $0.000 $0.000 - - $0.000 $0.000 - -
Total Expenses $854.484 $892.664 (38.180) (4.5) $109.253 $107.192 $2.061 1.9 $963.738 $999.856 (36.119) (3.7)
OPERATING SURPLUS/DEFICIT (419.872) (463.426) (43.554) (10.4) $0.000 $0.000 $0.000 - (419.872) (463.426) (43.554) (10.4)
Note: Totals may not add due to rounding
Note: Results are based on the preliminary close of the general ledger and are subject to review and adjustment. Please note that the current months'actuals do not include post-close adjustments, which will be captured in the subsequent month's YTD results.
Master Page # 124 of 242 - N
ew Y
ork City Transit and B
us Com
mittee M
eeting 7/23/2018________________________________________________________________________________
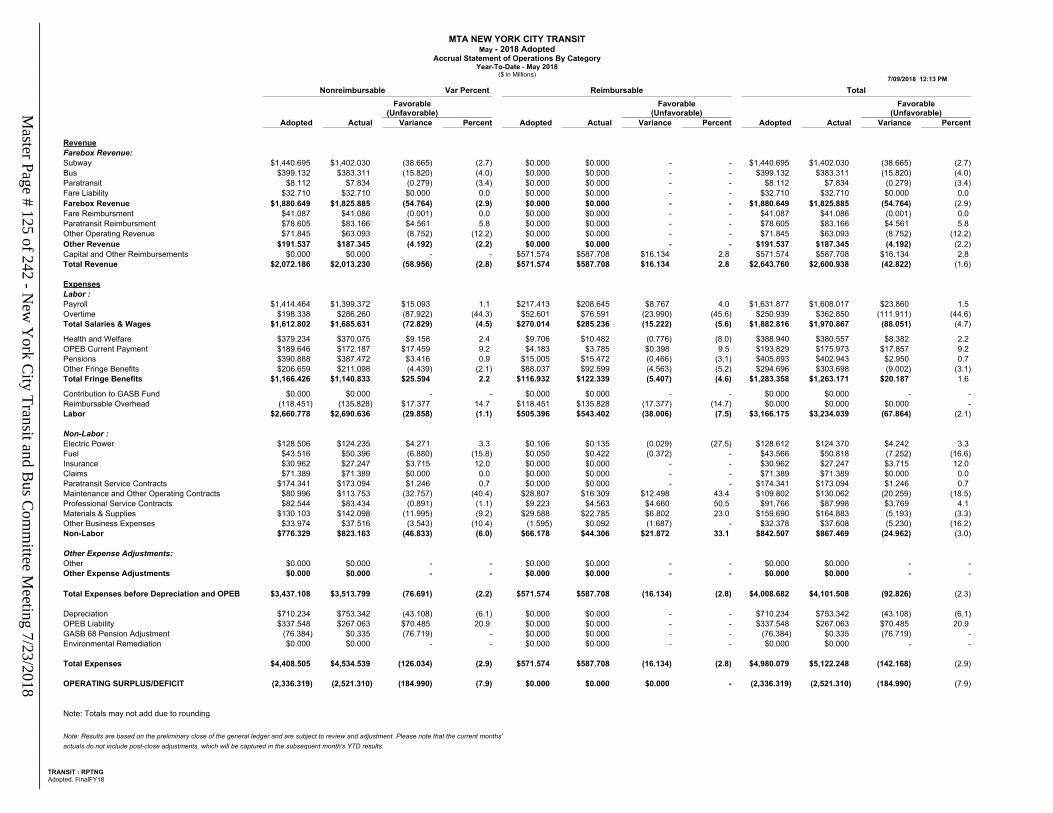
MTA NEW YORK CITY TRANSITMay - 2018 Adopted
Accrual Statement of Operations By CategoryYear-To-Date - May 2018
($ in Millions)7/09/2018 12:13 PM
TRANSIT : RPTNGAdopted. FinalFY18
Nonreimbursable Var Percent Reimbursable TotalFavorable
(Unfavorable)Favorable
(Unfavorable)Favorable
(Unfavorable)Adopted Actual Variance Percent Adopted Actual Variance Percent Adopted Actual Variance Percent
RevenueFarebox Revenue:Subway $1,440.695 $1,402.030 (38.665) (2.7) $0.000 $0.000 - - $1,440.695 $1,402.030 (38.665) (2.7)Bus $399.132 $383.311 (15.820) (4.0) $0.000 $0.000 - - $399.132 $383.311 (15.820) (4.0)Paratransit $8.112 $7.834 (0.279) (3.4) $0.000 $0.000 - - $8.112 $7.834 (0.279) (3.4)Fare Liability $32.710 $32.710 $0.000 0.0 $0.000 $0.000 - - $32.710 $32.710 $0.000 0.0 Farebox Revenue $1,880.649 $1,825.885 (54.764) (2.9) $0.000 $0.000 - - $1,880.649 $1,825.885 (54.764) (2.9)Fare Reimbursment $41.087 $41.086 (0.001) 0.0 $0.000 $0.000 - - $41.087 $41.086 (0.001) 0.0 Paratransit Reimbursment $78.605 $83.166 $4.561 5.8 $0.000 $0.000 - - $78.605 $83.166 $4.561 5.8 Other Operating Revenue $71.845 $63.093 (8.752) (12.2) $0.000 $0.000 - - $71.845 $63.093 (8.752) (12.2)Other Revenue $191.537 $187.345 (4.192) (2.2) $0.000 $0.000 - - $191.537 $187.345 (4.192) (2.2)Capital and Other Reimbursements $0.000 $0.000 - - $571.574 $587.708 $16.134 2.8 $571.574 $587.708 $16.134 2.8 Total Revenue $2,072.186 $2,013.230 (58.956) (2.8) $571.574 $587.708 $16.134 2.8 $2,643.760 $2,600.938 (42.822) (1.6)
ExpensesLabor :Payroll $1,414.464 $1,399.372 $15.093 1.1 $217.413 $208.645 $8.767 4.0 $1,631.877 $1,608.017 $23.860 1.5 Overtime $198.338 $286.260 (87.922) (44.3) $52.601 $76.591 (23.990) (45.6) $250.939 $362.850 (111.911) (44.6)Total Salaries & Wages $1,612.802 $1,685.631 (72.829) (4.5) $270.014 $285.236 (15.222) (5.6) $1,882.816 $1,970.867 (88.051) (4.7)
Health and Welfare $379.234 $370.075 $9.158 2.4 $9.706 $10.482 (0.776) (8.0) $388.940 $380.557 $8.382 2.2 OPEB Current Payment $189.646 $172.187 $17.459 9.2 $4.183 $3.785 $0.398 9.5 $193.829 $175.973 $17.857 9.2 Pensions $390.888 $387.472 $3.416 0.9 $15.005 $15.472 (0.466) (3.1) $405.893 $402.943 $2.950 0.7 Other Fringe Benefits $206.659 $211.098 (4.439) (2.1) $88.037 $92.599 (4.563) (5.2) $294.696 $303.698 (9.002) (3.1)Total Fringe Benefits $1,166.426 $1,140.833 $25.594 2.2 $116.932 $122.339 (5.407) (4.6) $1,283.358 $1,263.171 $20.187 1.6
Contribution to GASB Fund $0.000 $0.000 - - $0.000 $0.000 - - $0.000 $0.000 - -Reimbursable Overhead (118.451) (135.828) $17.377 14.7 $118.451 $135.828 (17.377) (14.7) $0.000 $0.000 $0.000 -Labor $2,660.778 $2,690.636 (29.858) (1.1) $505.396 $543.402 (38.006) (7.5) $3,166.175 $3,234.039 (67.864) (2.1)
Non-Labor :Electric Power $128.506 $124.235 $4.271 3.3 $0.106 $0.135 (0.029) (27.5) $128.612 $124.370 $4.242 3.3 Fuel $43.516 $50.396 (6.880) (15.8) $0.050 $0.422 (0.372) - $43.566 $50.818 (7.252) (16.6)Insurance $30.962 $27.247 $3.715 12.0 $0.000 $0.000 - - $30.962 $27.247 $3.715 12.0 Claims $71.389 $71.389 $0.000 0.0 $0.000 $0.000 - - $71.389 $71.389 $0.000 0.0 Paratransit Service Contracts $174.341 $173.094 $1.246 0.7 $0.000 $0.000 - - $174.341 $173.094 $1.246 0.7 Maintenance and Other Operating Contracts $80.996 $113.753 (32.757) (40.4) $28.807 $16.309 $12.498 43.4 $109.802 $130.062 (20.259) (18.5)Professional Service Contracts $82.544 $83.434 (0.891) (1.1) $9.223 $4.563 $4.660 50.5 $91.766 $87.998 $3.769 4.1 Materials & Supplies $130.103 $142.098 (11.995) (9.2) $29.588 $22.785 $6.802 23.0 $159.690 $164.883 (5.193) (3.3)Other Business Expenses $33.974 $37.516 (3.543) (10.4) (1.595) $0.092 (1.687) - $32.378 $37.608 (5.230) (16.2)Non-Labor $776.329 $823.163 (46.833) (6.0) $66.178 $44.306 $21.872 33.1 $842.507 $867.469 (24.962) (3.0)
Other Expense Adjustments:Other $0.000 $0.000 - - $0.000 $0.000 - - $0.000 $0.000 - -Other Expense Adjustments $0.000 $0.000 - - $0.000 $0.000 - - $0.000 $0.000 - -
Total Expenses before Depreciation and OPEB $3,437.108 $3,513.799 (76.691) (2.2) $571.574 $587.708 (16.134) (2.8) $4,008.682 $4,101.508 (92.826) (2.3)
Depreciation $710.234 $753.342 (43.108) (6.1) $0.000 $0.000 - - $710.234 $753.342 (43.108) (6.1)OPEB Liability $337.548 $267.063 $70.485 20.9 $0.000 $0.000 - - $337.548 $267.063 $70.485 20.9 GASB 68 Pension Adjustment (76.384) $0.335 (76.719) - $0.000 $0.000 - - (76.384) $0.335 (76.719) -Environmental Remediation $0.000 $0.000 - - $0.000 $0.000 - - $0.000 $0.000 - -
Total Expenses $4,408.505 $4,534.539 (126.034) (2.9) $571.574 $587.708 (16.134) (2.8) $4,980.079 $5,122.248 (142.168) (2.9)
OPERATING SURPLUS/DEFICIT (2,336.319) (2,521.310) (184.990) (7.9) $0.000 $0.000 $0.000 - (2,336.319) (2,521.310) (184.990) (7.9)
Note: Totals may not add due to rounding
Note: Results are based on the preliminary close of the general ledger and are subject to review and adjustment. Please note that the current months'actuals do not include post-close adjustments, which will be captured in the subsequent month's YTD results.
Master Page # 125 of 242 - N
ew Y
ork City Transit and B
us Com
mittee M
eeting 7/23/2018________________________________________________________________________________
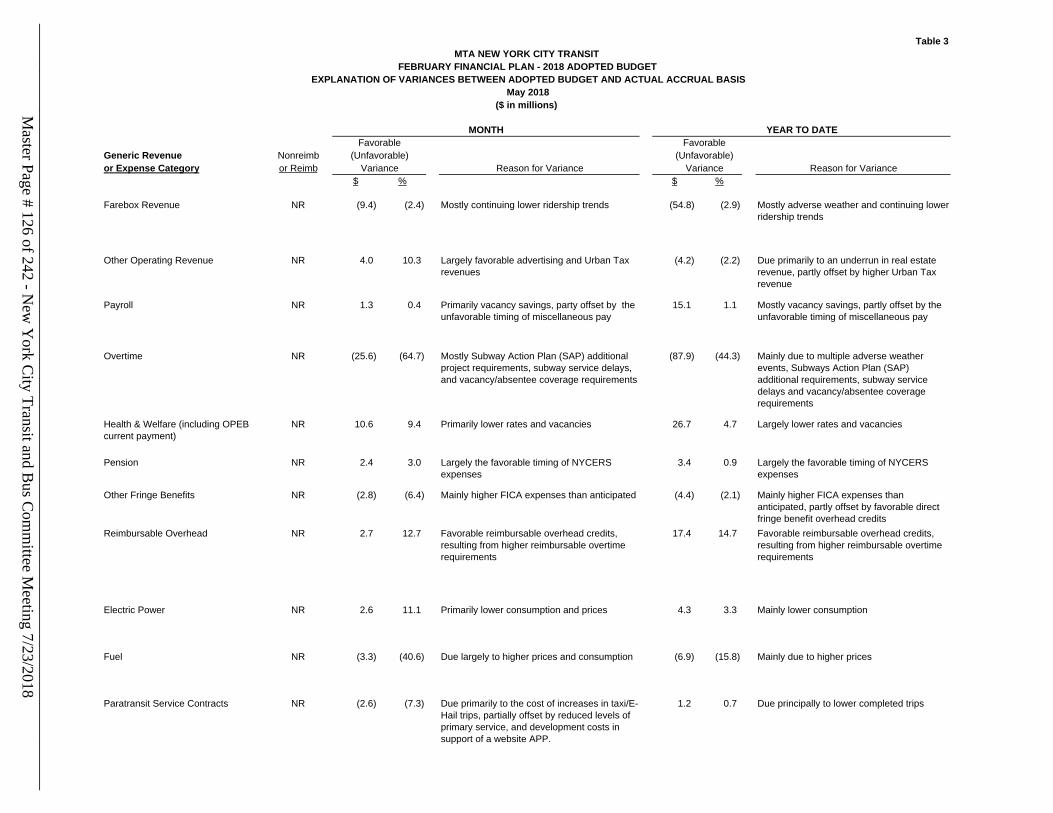
Table 3
MTA NEW YORK CITY TRANSIT
FEBRUARY FINANCIAL PLAN - 2018 ADOPTED BUDGET
EXPLANATION OF VARIANCES BETWEEN ADOPTED BUDGET AND ACTUAL ACCRUAL BASIS
May 2018
($ in millions)
MONTH YEAR TO DATE
Favorable Favorable
Generic Revenue Nonreimb (Unfavorable) (Unfavorable)
or Expense Category or Reimb Variance Reason for Variance Variance Reason for Variance
$ % $ %
Farebox Revenue NR (9.4) (2.4) Mostly continuing lower ridership trends (54.8) (2.9) Mostly adverse weather and continuing lower
ridership trends
Other Operating Revenue NR 4.0 10.3 Largely favorable advertising and Urban Tax
revenues
(4.2) (2.2) Due primarily to an underrun in real estate
revenue, partly offset by higher Urban Tax
revenue
Payroll NR 1.3 0.4 Primarily vacancy savings, party offset by the
unfavorable timing of miscellaneous pay
15.1 1.1 Mostly vacancy savings, partly offset by the
unfavorable timing of miscellaneous pay
Overtime NR (25.6) (64.7) Mostly Subway Action Plan (SAP) additional
project requirements, subway service delays,
and vacancy/absentee coverage requirements
(87.9) (44.3) Mainly due to multiple adverse weather
events, Subways Action Plan (SAP)
additional requirements, subway service
delays and vacancy/absentee coverage
requirements
Health & Welfare (including OPEB
current payment)
NR 10.6 9.4 Primarily lower rates and vacancies 26.7 4.7 Largely lower rates and vacancies
Pension NR 2.4 3.0 Largely the favorable timing of NYCERS
expenses
3.4 0.9 Largely the favorable timing of NYCERS
expenses
Other Fringe Benefits NR (2.8) (6.4) Mainly higher FICA expenses than anticipated (4.4) (2.1) Mainly higher FICA expenses than
anticipated, partly offset by favorable direct
fringe benefit overhead credits
Reimbursable Overhead NR 2.7 12.7 Favorable reimbursable overhead credits,
resulting from higher reimbursable overtime
requirements
17.4 14.7 Favorable reimbursable overhead credits,
resulting from higher reimbursable overtime
requirements
Electric Power NR 2.6 11.1 Primarily lower consumption and prices 4.3 3.3 Mainly lower consumption
Fuel NR (3.3) (40.6) Due largely to higher prices and consumption (6.9) (15.8) Mainly due to higher prices
Paratransit Service Contracts NR (2.6) (7.3) Due primarily to the cost of increases in taxi/E-
Hail trips, partially offset by reduced levels of
primary service, and development costs in
support of a website APP.
1.2 0.7 Due principally to lower completed trips
Master Page # 126 of 242 - N
ew Y
ork City Transit and B
us Com
mittee M
eeting 7/23/2018________________________________________________________________________________
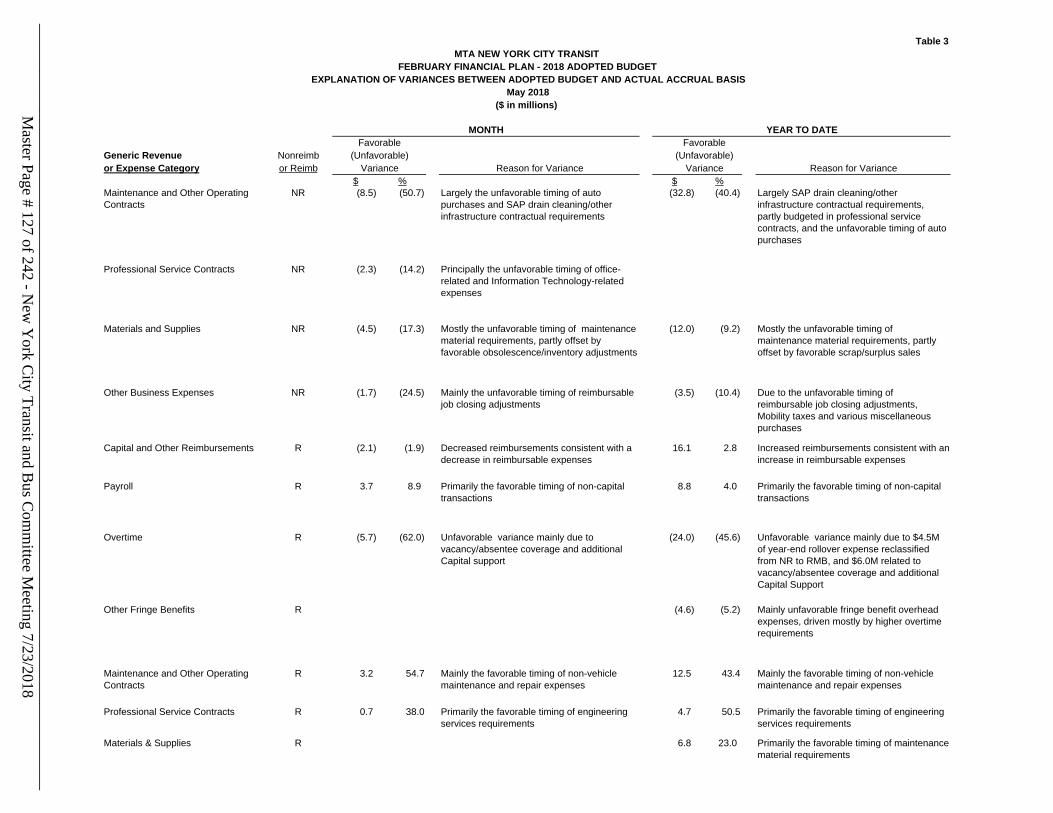
Table 3
MTA NEW YORK CITY TRANSIT
FEBRUARY FINANCIAL PLAN - 2018 ADOPTED BUDGET
EXPLANATION OF VARIANCES BETWEEN ADOPTED BUDGET AND ACTUAL ACCRUAL BASIS
May 2018
($ in millions)
MONTH YEAR TO DATE
Favorable Favorable
Generic Revenue Nonreimb (Unfavorable) (Unfavorable)
or Expense Category or Reimb Variance Reason for Variance Variance Reason for Variance
$ % $ %
Maintenance and Other Operating
Contracts
NR (8.5) (50.7) Largely the unfavorable timing of auto
purchases and SAP drain cleaning/other
infrastructure contractual requirements
(32.8) (40.4) Largely SAP drain cleaning/other
infrastructure contractual requirements,
partly budgeted in professional service
contracts, and the unfavorable timing of auto
purchases
Professional Service Contracts NR (2.3) (14.2) Principally the unfavorable timing of office-
related and Information Technology-related
expenses
Materials and Supplies NR (4.5) (17.3) Mostly the unfavorable timing of maintenance
material requirements, partly offset by
favorable obsolescence/inventory adjustments
(12.0) (9.2) Mostly the unfavorable timing of
maintenance material requirements, partly
offset by favorable scrap/surplus sales
Other Business Expenses NR (1.7) (24.5) Mainly the unfavorable timing of reimbursable
job closing adjustments
(3.5) (10.4) Due to the unfavorable timing of
reimbursable job closing adjustments,
Mobility taxes and various miscellaneous
purchases
Capital and Other Reimbursements R (2.1) (1.9) Decreased reimbursements consistent with a
decrease in reimbursable expenses
16.1 2.8 Increased reimbursements consistent with an
increase in reimbursable expenses
Payroll R 3.7 8.9 Primarily the favorable timing of non-capital
transactions
8.8 4.0 Primarily the favorable timing of non-capital
transactions
Overtime R (5.7) (62.0) Unfavorable variance mainly due to
vacancy/absentee coverage and additional
Capital support
(24.0) (45.6) Unfavorable variance mainly due to $4.5M
of year-end rollover expense reclassified
from NR to RMB, and $6.0M related to
vacancy/absentee coverage and additional
Capital Support
Other Fringe Benefits R (4.6) (5.2) Mainly unfavorable fringe benefit overhead
expenses, driven mostly by higher overtime
requirements
Maintenance and Other Operating
Contracts
R 3.2 54.7 Mainly the favorable timing of non-vehicle
maintenance and repair expenses
12.5 43.4 Mainly the favorable timing of non-vehicle
maintenance and repair expenses
Professional Service Contracts R 0.7 38.0 Primarily the favorable timing of engineering
services requirements
4.7 50.5 Primarily the favorable timing of engineering
services requirements
Materials & Supplies R 6.8 23.0 Primarily the favorable timing of maintenance
material requirements
Master Page # 127 of 242 - N
ew Y
ork City Transit and B
us Com
mittee M
eeting 7/23/2018________________________________________________________________________________
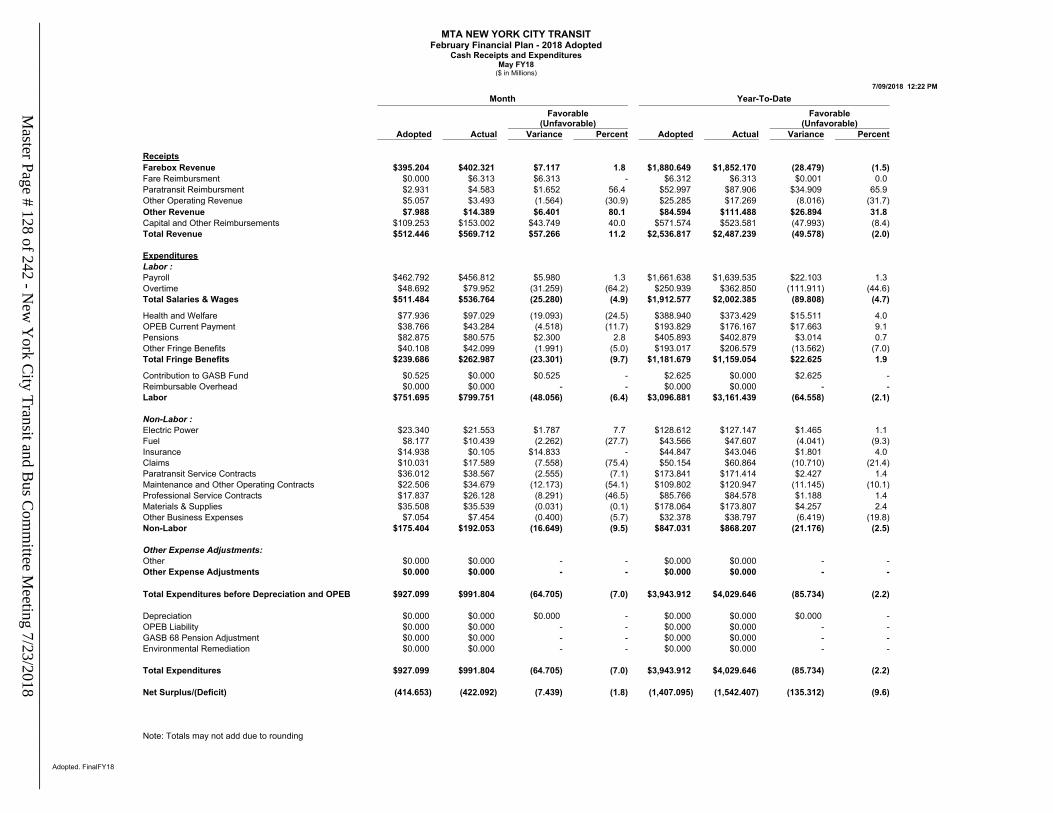
MTA NEW YORK CITY TRANSITFebruary Financial Plan - 2018 Adopted
Cash Receipts and ExpendituresMay FY18
($ in Millions)
7/09/2018 12:22 PM
Adopted. FinalFY18
Month Year-To-DateFavorable
(Unfavorable)Favorable
(Unfavorable)Adopted Actual Variance Percent Adopted Actual Variance Percent
ReceiptsFarebox Revenue $395.204 $402.321 $7.117 1.8 $1,880.649 $1,852.170 (28.479) (1.5)Fare Reimbursment $0.000 $6.313 $6.313 - $6.312 $6.313 $0.001 0.0 Paratransit Reimbursment $2.931 $4.583 $1.652 56.4 $52.997 $87.906 $34.909 65.9 Other Operating Revenue $5.057 $3.493 (1.564) (30.9) $25.285 $17.269 (8.016) (31.7)Other Revenue $7.988 $14.389 $6.401 80.1 $84.594 $111.488 $26.894 31.8 Capital and Other Reimbursements $109.253 $153.002 $43.749 40.0 $571.574 $523.581 (47.993) (8.4)Total Revenue $512.446 $569.712 $57.266 11.2 $2,536.817 $2,487.239 (49.578) (2.0)
ExpendituresLabor :Payroll $462.792 $456.812 $5.980 1.3 $1,661.638 $1,639.535 $22.103 1.3 Overtime $48.692 $79.952 (31.259) (64.2) $250.939 $362.850 (111.911) (44.6)Total Salaries & Wages $511.484 $536.764 (25.280) (4.9) $1,912.577 $2,002.385 (89.808) (4.7)
Health and Welfare $77.936 $97.029 (19.093) (24.5) $388.940 $373.429 $15.511 4.0 OPEB Current Payment $38.766 $43.284 (4.518) (11.7) $193.829 $176.167 $17.663 9.1 Pensions $82.875 $80.575 $2.300 2.8 $405.893 $402.879 $3.014 0.7 Other Fringe Benefits $40.108 $42.099 (1.991) (5.0) $193.017 $206.579 (13.562) (7.0)Total Fringe Benefits $239.686 $262.987 (23.301) (9.7) $1,181.679 $1,159.054 $22.625 1.9
Contribution to GASB Fund $0.525 $0.000 $0.525 - $2.625 $0.000 $2.625 -Reimbursable Overhead $0.000 $0.000 - - $0.000 $0.000 - -Labor $751.695 $799.751 (48.056) (6.4) $3,096.881 $3,161.439 (64.558) (2.1)
Non-Labor :Electric Power $23.340 $21.553 $1.787 7.7 $128.612 $127.147 $1.465 1.1 Fuel $8.177 $10.439 (2.262) (27.7) $43.566 $47.607 (4.041) (9.3)Insurance $14.938 $0.105 $14.833 - $44.847 $43.046 $1.801 4.0 Claims $10.031 $17.589 (7.558) (75.4) $50.154 $60.864 (10.710) (21.4)Paratransit Service Contracts $36.012 $38.567 (2.555) (7.1) $173.841 $171.414 $2.427 1.4 Maintenance and Other Operating Contracts $22.506 $34.679 (12.173) (54.1) $109.802 $120.947 (11.145) (10.1)Professional Service Contracts $17.837 $26.128 (8.291) (46.5) $85.766 $84.578 $1.188 1.4 Materials & Supplies $35.508 $35.539 (0.031) (0.1) $178.064 $173.807 $4.257 2.4 Other Business Expenses $7.054 $7.454 (0.400) (5.7) $32.378 $38.797 (6.419) (19.8)Non-Labor $175.404 $192.053 (16.649) (9.5) $847.031 $868.207 (21.176) (2.5)
Other Expense Adjustments:Other $0.000 $0.000 - - $0.000 $0.000 - -Other Expense Adjustments $0.000 $0.000 - - $0.000 $0.000 - -
Total Expenditures before Depreciation and OPEB $927.099 $991.804 (64.705) (7.0) $3,943.912 $4,029.646 (85.734) (2.2)
Depreciation $0.000 $0.000 $0.000 - $0.000 $0.000 $0.000 -OPEB Liability $0.000 $0.000 - - $0.000 $0.000 - -GASB 68 Pension Adjustment $0.000 $0.000 - - $0.000 $0.000 - -Environmental Remediation $0.000 $0.000 - - $0.000 $0.000 - -
Total Expenditures $927.099 $991.804 (64.705) (7.0) $3,943.912 $4,029.646 (85.734) (2.2)
Net Surplus/(Deficit) (414.653) (422.092) (7.439) (1.8) (1,407.095) (1,542.407) (135.312) (9.6)
Note: Totals may not add due to rounding
Master Page # 128 of 242 - N
ew Y
ork City Transit and B
us Com
mittee M
eeting 7/23/2018________________________________________________________________________________
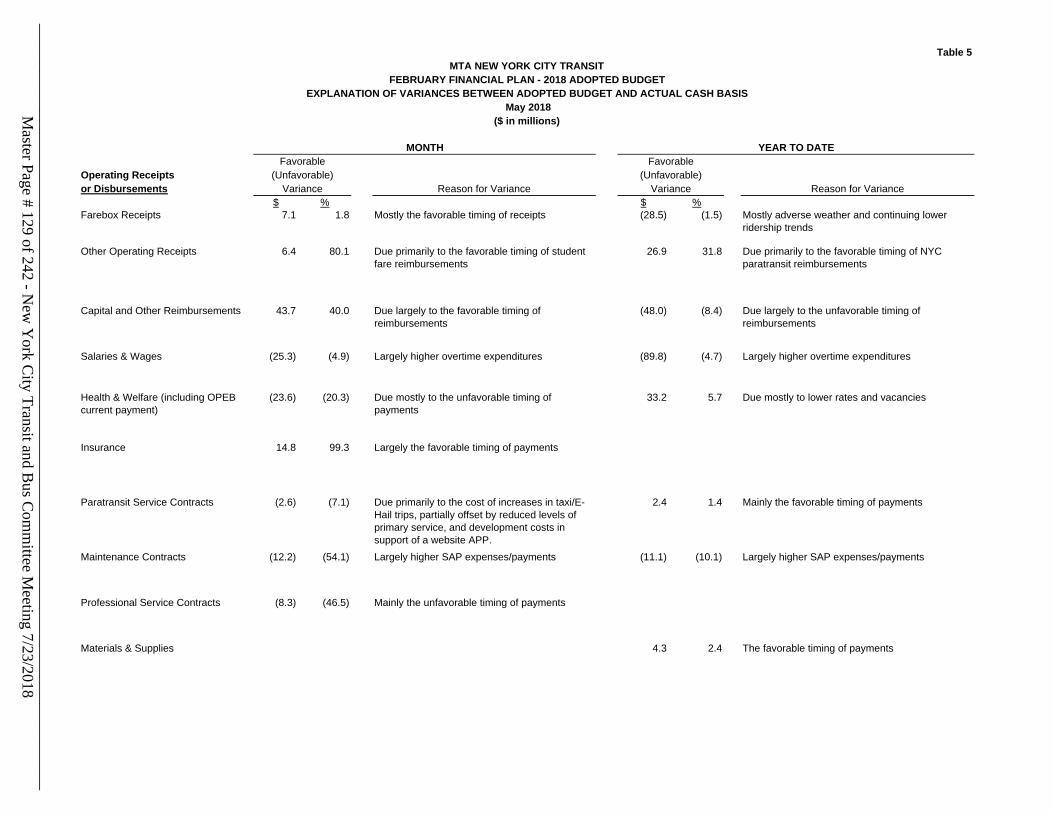
Table 5
MTA NEW YORK CITY TRANSIT
FEBRUARY FINANCIAL PLAN - 2018 ADOPTED BUDGET
EXPLANATION OF VARIANCES BETWEEN ADOPTED BUDGET AND ACTUAL CASH BASIS
May 2018
($ in millions)
MONTH YEAR TO DATE
Favorable Favorable
Operating Receipts (Unfavorable) (Unfavorable)
or Disbursements Variance Reason for Variance Variance Reason for Variance
$ % $ %
Farebox Receipts 7.1 1.8 Mostly the favorable timing of receipts (28.5) (1.5) Mostly adverse weather and continuing lower
ridership trends
Other Operating Receipts 6.4 80.1 Due primarily to the favorable timing of student
fare reimbursements
26.9 31.8 Due primarily to the favorable timing of NYC
paratransit reimbursements
Capital and Other Reimbursements 43.7 40.0 Due largely to the favorable timing of
reimbursements
(48.0) (8.4) Due largely to the unfavorable timing of
reimbursements
Salaries & Wages (25.3) (4.9) Largely higher overtime expenditures (89.8) (4.7) Largely higher overtime expenditures
Health & Welfare (including OPEB
current payment)
(23.6) (20.3) Due mostly to the unfavorable timing of
payments
33.2 5.7 Due mostly to lower rates and vacancies
Insurance 14.8 99.3 Largely the favorable timing of payments
Paratransit Service Contracts (2.6) (7.1) Due primarily to the cost of increases in taxi/E-
Hail trips, partially offset by reduced levels of
primary service, and development costs in
support of a website APP.
2.4 1.4 Mainly the favorable timing of payments
Maintenance Contracts (12.2) (54.1) Largely higher SAP expenses/payments (11.1) (10.1) Largely higher SAP expenses/payments
Professional Service Contracts (8.3) (46.5) Mainly the unfavorable timing of payments
Materials & Supplies 4.3 2.4 The favorable timing of payments
Master Page # 129 of 242 - N
ew Y
ork City Transit and B
us Com
mittee M
eeting 7/23/2018________________________________________________________________________________
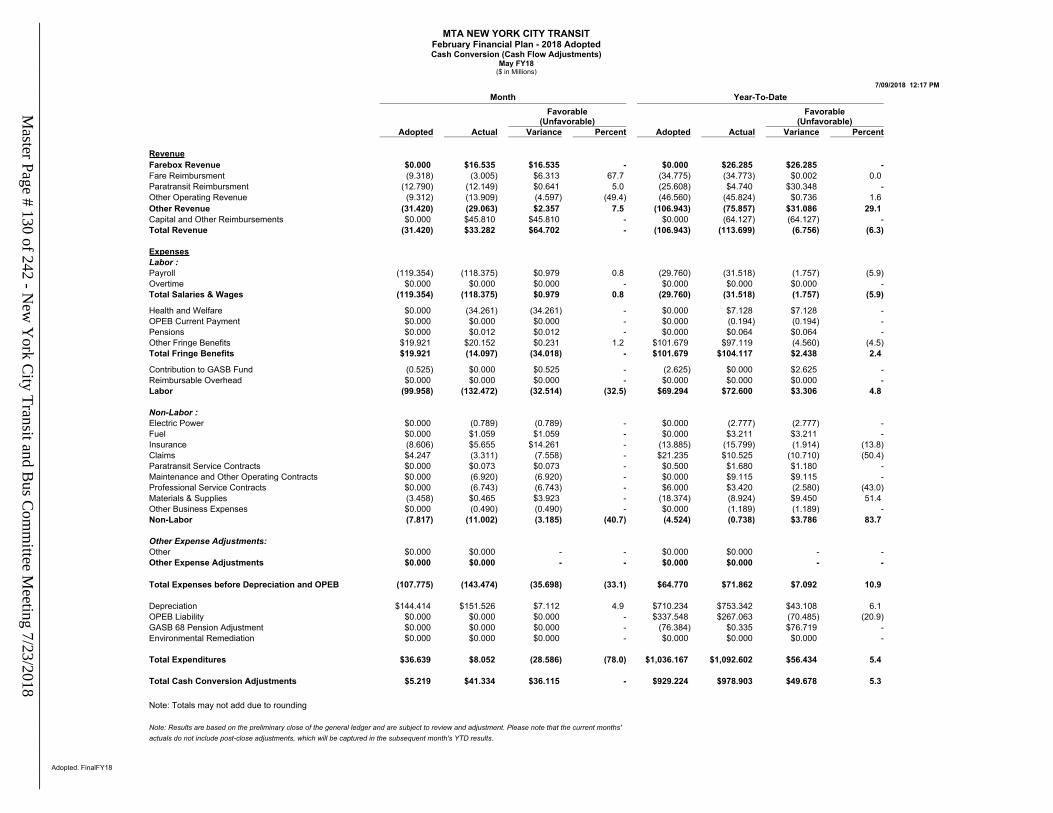
MTA NEW YORK CITY TRANSITFebruary Financial Plan - 2018 AdoptedCash Conversion (Cash Flow Adjustments)
May FY18($ in Millions)
7/09/2018 12:17 PM
Adopted. FinalFY18
Month Year-To-DateFavorable
(Unfavorable)Favorable
(Unfavorable)Adopted Actual Variance Percent Adopted Actual Variance Percent
RevenueFarebox Revenue $0.000 $16.535 $16.535 - $0.000 $26.285 $26.285 -Fare Reimbursment (9.318) (3.005) $6.313 67.7 (34.775) (34.773) $0.002 0.0 Paratransit Reimbursment (12.790) (12.149) $0.641 5.0 (25.608) $4.740 $30.348 -Other Operating Revenue (9.312) (13.909) (4.597) (49.4) (46.560) (45.824) $0.736 1.6 Other Revenue (31.420) (29.063) $2.357 7.5 (106.943) (75.857) $31.086 29.1 Capital and Other Reimbursements $0.000 $45.810 $45.810 - $0.000 (64.127) (64.127) -Total Revenue (31.420) $33.282 $64.702 - (106.943) (113.699) (6.756) (6.3)
ExpensesLabor :Payroll (119.354) (118.375) $0.979 0.8 (29.760) (31.518) (1.757) (5.9)Overtime $0.000 $0.000 $0.000 - $0.000 $0.000 $0.000 -Total Salaries & Wages (119.354) (118.375) $0.979 0.8 (29.760) (31.518) (1.757) (5.9)
Health and Welfare $0.000 (34.261) (34.261) - $0.000 $7.128 $7.128 -OPEB Current Payment $0.000 $0.000 $0.000 - $0.000 (0.194) (0.194) -Pensions $0.000 $0.012 $0.012 - $0.000 $0.064 $0.064 -Other Fringe Benefits $19.921 $20.152 $0.231 1.2 $101.679 $97.119 (4.560) (4.5)Total Fringe Benefits $19.921 (14.097) (34.018) - $101.679 $104.117 $2.438 2.4
Contribution to GASB Fund (0.525) $0.000 $0.525 - (2.625) $0.000 $2.625 -Reimbursable Overhead $0.000 $0.000 $0.000 - $0.000 $0.000 $0.000 -Labor (99.958) (132.472) (32.514) (32.5) $69.294 $72.600 $3.306 4.8
Non-Labor :Electric Power $0.000 (0.789) (0.789) - $0.000 (2.777) (2.777) -Fuel $0.000 $1.059 $1.059 - $0.000 $3.211 $3.211 -Insurance (8.606) $5.655 $14.261 - (13.885) (15.799) (1.914) (13.8)Claims $4.247 (3.311) (7.558) - $21.235 $10.525 (10.710) (50.4)Paratransit Service Contracts $0.000 $0.073 $0.073 - $0.500 $1.680 $1.180 -Maintenance and Other Operating Contracts $0.000 (6.920) (6.920) - $0.000 $9.115 $9.115 -Professional Service Contracts $0.000 (6.743) (6.743) - $6.000 $3.420 (2.580) (43.0)Materials & Supplies (3.458) $0.465 $3.923 - (18.374) (8.924) $9.450 51.4 Other Business Expenses $0.000 (0.490) (0.490) - $0.000 (1.189) (1.189) -Non-Labor (7.817) (11.002) (3.185) (40.7) (4.524) (0.738) $3.786 83.7
Other Expense Adjustments:Other $0.000 $0.000 - - $0.000 $0.000 - -Other Expense Adjustments $0.000 $0.000 - - $0.000 $0.000 - -
Total Expenses before Depreciation and OPEB (107.775) (143.474) (35.698) (33.1) $64.770 $71.862 $7.092 10.9
Depreciation $144.414 $151.526 $7.112 4.9 $710.234 $753.342 $43.108 6.1 OPEB Liability $0.000 $0.000 $0.000 - $337.548 $267.063 (70.485) (20.9)GASB 68 Pension Adjustment $0.000 $0.000 $0.000 - (76.384) $0.335 $76.719 -Environmental Remediation $0.000 $0.000 $0.000 - $0.000 $0.000 $0.000 -
Total Expenditures $36.639 $8.052 (28.586) (78.0) $1,036.167 $1,092.602 $56.434 5.4
Total Cash Conversion Adjustments $5.219 $41.334 $36.115 - $929.224 $978.903 $49.678 5.3
Note: Totals may not add due to rounding
Note: Results are based on the preliminary close of the general ledger and are subject to review and adjustment. Please note that the current months'actuals do not include post-close adjustments, which will be captured in the subsequent month's YTD results.
Master Page # 130 of 242 - N
ew Y
ork City Transit and B
us Com
mittee M
eeting 7/23/2018________________________________________________________________________________
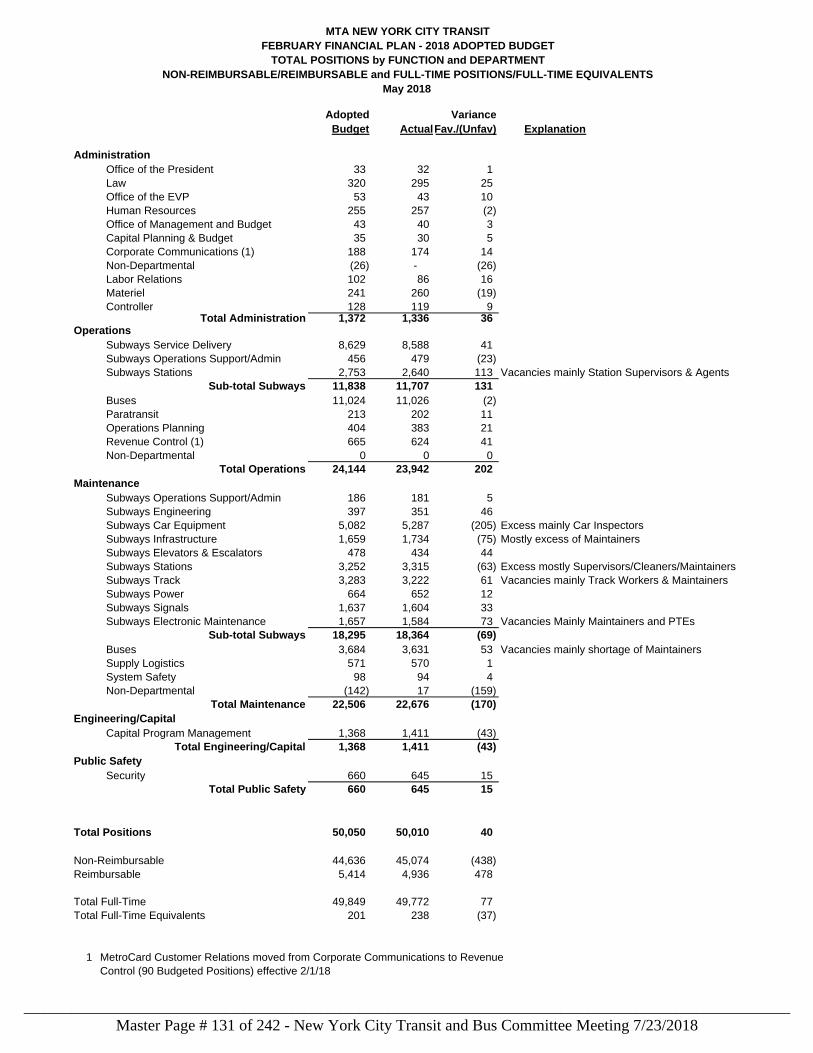
Adopted Variance
Budget ActualFav./(Unfav) Explanation
Administration
Office of the President 33 32 1
Law 320 295 25
Office of the EVP 53 43 10
Human Resources 255 257 (2)
Office of Management and Budget 43 40 3
Capital Planning & Budget 35 30 5
Corporate Communications (1) 188 174 14
Non-Departmental (26) - (26)
Labor Relations 102 86 16
Materiel 241 260 (19)
Controller 128 119 9 Total Administration 1,372 1,336 36
Operations
Subways Service Delivery 8,629 8,588 41
Subways Operations Support/Admin 456 479 (23)
Subways Stations 2,753 2,640 113 Vacancies mainly Station Supervisors & Agents
Sub-total Subways 11,838 11,707 131
Buses 11,024 11,026 (2)
Paratransit 213 202 11
Operations Planning 404 383 21
Revenue Control (1) 665 624 41
Non-Departmental 0 0 0
Total Operations 24,144 23,942 202
Maintenance
Subways Operations Support/Admin 186 181 5
Subways Engineering 397 351 46
Subways Car Equipment 5,082 5,287 (205) Excess mainly Car Inspectors
Subways Infrastructure 1,659 1,734 (75) Mostly excess of Maintainers
Subways Elevators & Escalators 478 434 44
Subways Stations 3,252 3,315 (63) Excess mostly Supervisors/Cleaners/Maintainers
Subways Track 3,283 3,222 61 Vacancies mainly Track Workers & Maintainers
Subways Power 664 652 12
Subways Signals 1,637 1,604 33
Subways Electronic Maintenance 1,657 1,584 73 Vacancies Mainly Maintainers and PTEs
Sub-total Subways 18,295 18,364 (69)
Buses 3,684 3,631 53 Vacancies mainly shortage of Maintainers
Supply Logistics 571 570 1
System Safety 98 94 4
Non-Departmental (142) 17 (159)
Total Maintenance 22,506 22,676 (170)
Engineering/Capital
Capital Program Management 1,368 1,411 (43)
Total Engineering/Capital 1,368 1,411 (43)
Public Safety
Security 660 645 15
Total Public Safety 660 645 15
Total Positions 50,050 50,010 40
Non-Reimbursable 44,636 45,074 (438)
Reimbursable 5,414 4,936 478
Total Full-Time 49,849 49,772 77
Total Full-Time Equivalents 201 238 (37)
1 MetroCard Customer Relations moved from Corporate Communications to Revenue
Control (90 Budgeted Positions) effective 2/1/18
May 2018
MTA NEW YORK CITY TRANSIT
FEBRUARY FINANCIAL PLAN - 2018 ADOPTED BUDGET
TOTAL POSITIONS by FUNCTION and DEPARTMENT
NON-REIMBURSABLE/REIMBURSABLE and FULL-TIME POSITIONS/FULL-TIME EQUIVALENTS
Master Page # 131 of 242 - New York City Transit and Bus Committee Meeting 7/23/2018________________________________________________________________________________
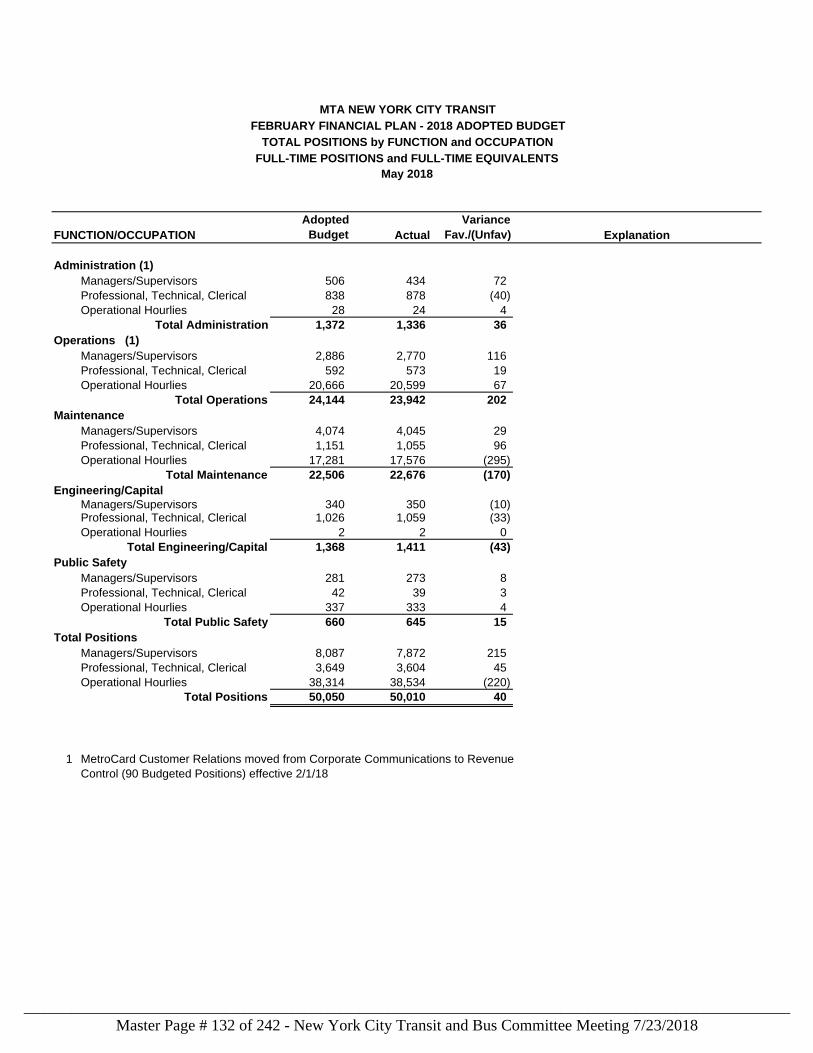
FUNCTION/OCCUPATION
Adopted
Budget Actual
Variance
Fav./(Unfav)
Administration (1)
Managers/Supervisors 506 434 72
Professional, Technical, Clerical 838 878 (40)
Operational Hourlies 28 24 4
Total Administration 1,372 1,336 36
Operations (1)
Managers/Supervisors 2,886 2,770 116
Professional, Technical, Clerical 592 573 19
Operational Hourlies 20,666 20,599 67
Total Operations 24,144 23,942 202
Maintenance
Managers/Supervisors 4,074 4,045 29
Professional, Technical, Clerical 1,151 1,055 96
Operational Hourlies 17,281 17,576 (295)
Total Maintenance 22,506 22,676 (170)
Engineering/Capital
Managers/Supervisors 340 350 (10)Professional, Technical, Clerical 1,026 1,059 (33)
Operational Hourlies 2 2 0
Total Engineering/Capital 1,368 1,411 (43)
Public Safety
Managers/Supervisors 281 273 8
Professional, Technical, Clerical 42 39 3
Operational Hourlies 337 333 4
Total Public Safety 660 645 15
Total Positions
Managers/Supervisors 8,087 7,872 215
Professional, Technical, Clerical 3,649 3,604 45
Operational Hourlies 38,314 38,534 (220)
Total Positions 50,050 50,010 40
1 MetroCard Customer Relations moved from Corporate Communications to Revenue
Control (90 Budgeted Positions) effective 2/1/18
Explanation
MTA NEW YORK CITY TRANSIT
TOTAL POSITIONS by FUNCTION and OCCUPATION
FULL-TIME POSITIONS and FULL-TIME EQUIVALENTS
May 2018
FEBRUARY FINANCIAL PLAN - 2018 ADOPTED BUDGET
Master Page # 132 of 242 - New York City Transit and Bus Committee Meeting 7/23/2018________________________________________________________________________________
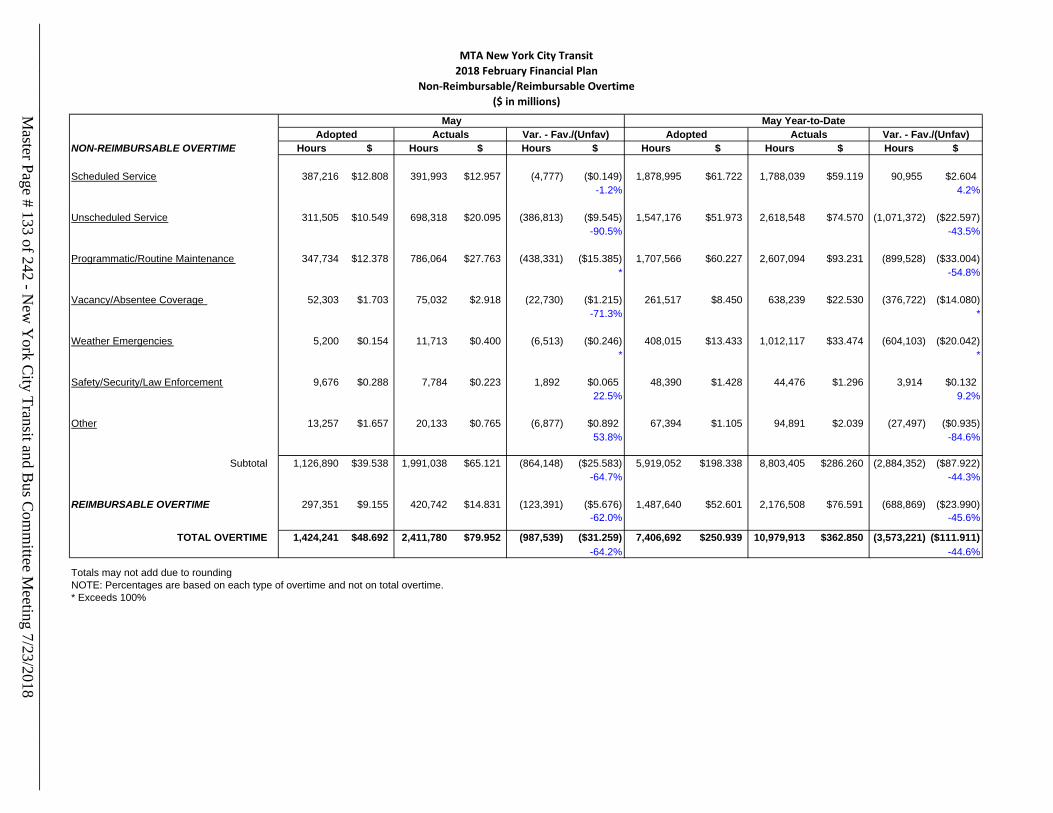
MTA New York City Transit2018 February Financial Plan
Non‐Reimbursable/Reimbursable Overtime ($ in millions)
NON-REIMBURSABLE OVERTIME Hours $ Hours $ Hours $ Hours $ Hours $ Hours $
Scheduled Service 387,216 $12.808 391,993 $12.957 (4,777) ($0.149) 1,878,995 $61.722 1,788,039 $59.119 90,955 $2.604
-1.2% 4.2%
Unscheduled Service 311,505 $10.549 698,318 $20.095 (386,813) ($9.545) 1,547,176 $51.973 2,618,548 $74.570 (1,071,372) ($22.597)
-90.5% -43.5%
Programmatic/Routine Maintenance 347,734 $12.378 786,064 $27.763 (438,331) ($15.385) 1,707,566 $60.227 2,607,094 $93.231 (899,528) ($33.004)
* -54.8%
Vacancy/Absentee Coverage 52,303 $1.703 75,032 $2.918 (22,730) ($1.215) 261,517 $8.450 638,239 $22.530 (376,722) ($14.080)
-71.3% *
Weather Emergencies 5,200 $0.154 11,713 $0.400 (6,513) ($0.246) 408,015 $13.433 1,012,117 $33.474 (604,103) ($20.042)
* *
Safety/Security/Law Enforcement 9,676 $0.288 7,784 $0.223 1,892 $0.065 48,390 $1.428 44,476 $1.296 3,914 $0.132
22.5% 9.2%
Other 13,257 $1.657 20,133 $0.765 (6,877) $0.892 67,394 $1.105 94,891 $2.039 (27,497) ($0.935)
53.8% -84.6%
Subtotal 1,126,890 $39.538 1,991,038 $65.121 (864,148) ($25.583) 5,919,052 $198.338 8,803,405 $286.260 (2,884,352) ($87.922)
-64.7% -44.3%
REIMBURSABLE OVERTIME 297,351 $9.155 420,742 $14.831 (123,391) ($5.676) 1,487,640 $52.601 2,176,508 $76.591 (688,869) ($23.990)
-62.0% -45.6%
TOTAL OVERTIME 1,424,241 $48.692 2,411,780 $79.952 (987,539) ($31.259) 7,406,692 $250.939 10,979,913 $362.850 (3,573,221) ($111.911)
-64.2% -44.6%
Totals may not add due to rounding
NOTE: Percentages are based on each type of overtime and not on total overtime.
* Exceeds 100%
May May Year-to-Date
Adopted Actuals Var. - Fav./(Unfav) Adopted Actuals Var. - Fav./(Unfav)
Master Page # 133 of 242 - N
ew Y
ork City Transit and B
us Com
mittee M
eeting 7/23/2018________________________________________________________________________________
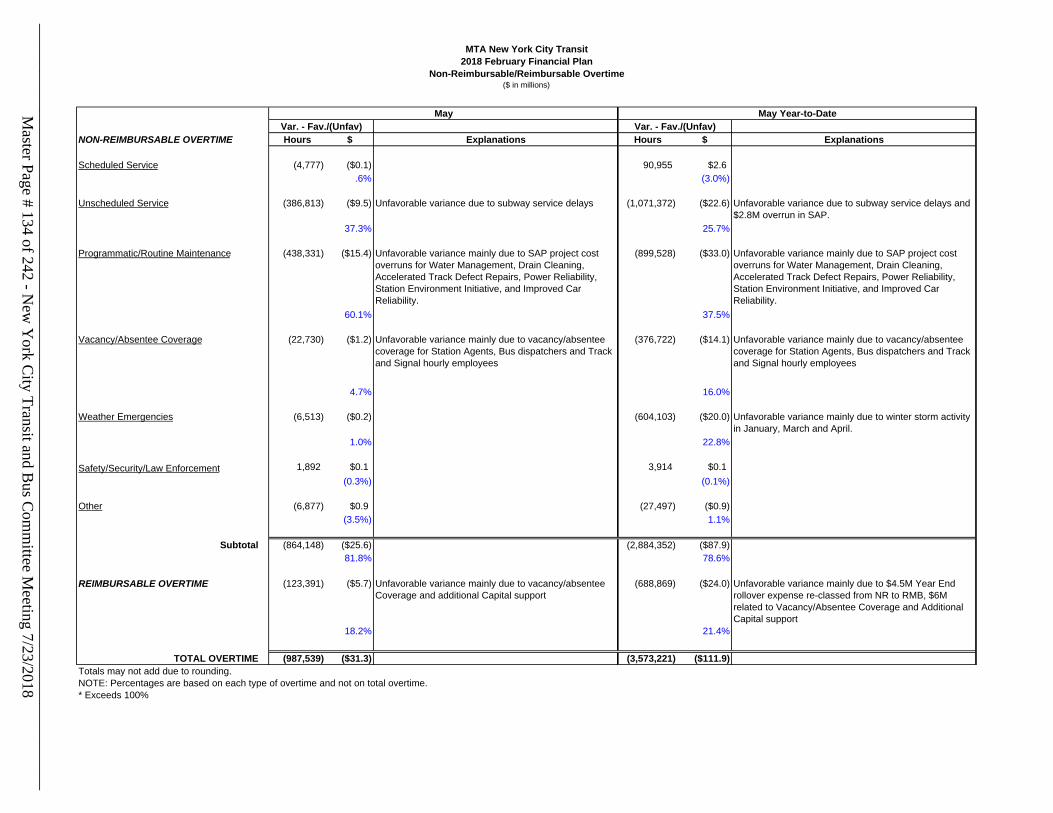
MTA New York City Transit
2018 February Financial Plan
Non-Reimbursable/Reimbursable Overtime ($ in millions)
NON-REIMBURSABLE OVERTIME Hours $ Explanations Hours $ Explanations
Scheduled Service (4,777) ($0.1) 90,955 $2.6
.6% (3.0%)
Unscheduled Service (386,813) ($9.5) Unfavorable variance due to subway service delays (1,071,372) ($22.6) Unfavorable variance due to subway service delays and
$2.8M overrun in SAP.
37.3% 25.7%
Programmatic/Routine Maintenance (438,331) ($15.4) Unfavorable variance mainly due to SAP project cost
overruns for Water Management, Drain Cleaning,
Accelerated Track Defect Repairs, Power Reliability,
Station Environment Initiative, and Improved Car
Reliability.
(899,528) ($33.0) Unfavorable variance mainly due to SAP project cost
overruns for Water Management, Drain Cleaning,
Accelerated Track Defect Repairs, Power Reliability,
Station Environment Initiative, and Improved Car
Reliability.
60.1% 37.5%
Vacancy/Absentee Coverage (22,730) ($1.2) Unfavorable variance mainly due to vacancy/absentee
coverage for Station Agents, Bus dispatchers and Track
and Signal hourly employees
(376,722) ($14.1) Unfavorable variance mainly due to vacancy/absentee
coverage for Station Agents, Bus dispatchers and Track
and Signal hourly employees
4.7% 16.0%
Weather Emergencies (6,513) ($0.2) (604,103) ($20.0) Unfavorable variance mainly due to winter storm activity
in January, March and April.
1.0% 22.8%
Safety/Security/Law Enforcement 1,892 $0.1 3,914 $0.1
(0.3%) (0.1%)
Other (6,877) $0.9 (27,497) ($0.9)
(3.5%) 1.1%
Subtotal (864,148) ($25.6) (2,884,352) ($87.9)
81.8% 78.6%
REIMBURSABLE OVERTIME (123,391) ($5.7) Unfavorable variance mainly due to vacancy/absentee
Coverage and additional Capital support
(688,869) ($24.0) Unfavorable variance mainly due to $4.5M Year End
rollover expense re-classed from NR to RMB, $6M
related to Vacancy/Absentee Coverage and Additional
Capital support
18.2% 21.4%
TOTAL OVERTIME (987,539) ($31.3) (3,573,221) ($111.9)
Totals may not add due to rounding.
NOTE: Percentages are based on each type of overtime and not on total overtime.
* Exceeds 100%
May May Year-to-Date
Var. - Fav./(Unfav) Var. - Fav./(Unfav)
Master Page # 134 of 242 - N
ew Y
ork City Transit and B
us Com
mittee M
eeting 7/23/2018________________________________________________________________________________
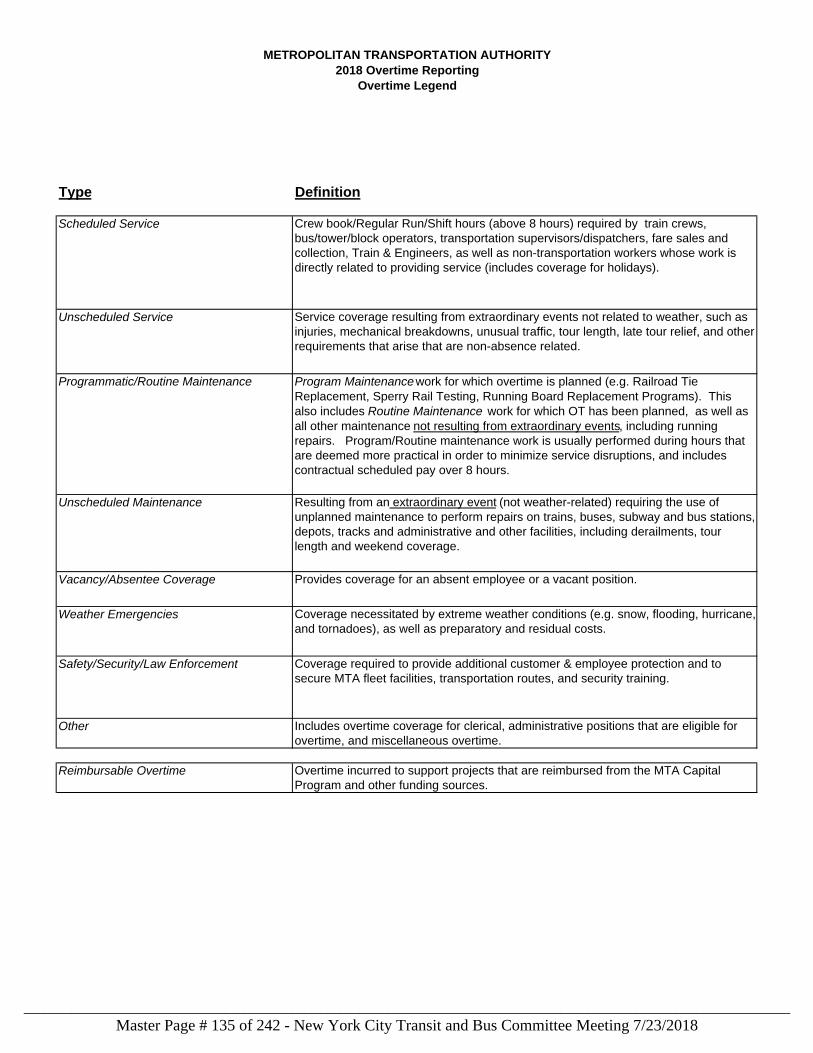
METROPOLITAN TRANSPORTATION AUTHORITY
2018 Overtime Reporting
Overtime Legend
Type Definition
Scheduled Service Crew book/Regular Run/Shift hours (above 8 hours) required by train crews,
bus/tower/block operators, transportation supervisors/dispatchers, fare sales and
collection, Train & Engineers, as well as non-transportation workers whose work is
directly related to providing service (includes coverage for holidays).
Unscheduled Service Service coverage resulting from extraordinary events not related to weather, such as
injuries, mechanical breakdowns, unusual traffic, tour length, late tour relief, and other
requirements that arise that are non-absence related.
Programmatic/Routine Maintenance Program Maintenancework for which overtime is planned (e.g. Railroad Tie
Replacement, Sperry Rail Testing, Running Board Replacement Programs). This
also includes Routine Maintenance work for which OT has been planned, as well as
all other maintenance not resulting from extraordinary events, including running
repairs. Program/Routine maintenance work is usually performed during hours that
are deemed more practical in order to minimize service disruptions, and includes
contractual scheduled pay over 8 hours.
Unscheduled Maintenance Resulting from an extraordinary event (not weather-related) requiring the use of
unplanned maintenance to perform repairs on trains, buses, subway and bus stations,
depots, tracks and administrative and other facilities, including derailments, tour
length and weekend coverage.
Vacancy/Absentee Coverage Provides coverage for an absent employee or a vacant position.
Weather Emergencies Coverage necessitated by extreme weather conditions (e.g. snow, flooding, hurricane,
and tornadoes), as well as preparatory and residual costs.
Safety/Security/Law Enforcement Coverage required to provide additional customer & employee protection and to
secure MTA fleet facilities, transportation routes, and security training.
Other Includes overtime coverage for clerical, administrative positions that are eligible for
overtime, and miscellaneous overtime.
Reimbursable Overtime Overtime incurred to support projects that are reimbursed from the MTA Capital
Program and other funding sources.
Master Page # 135 of 242 - New York City Transit and Bus Committee Meeting 7/23/2018________________________________________________________________________________
Preliminary May 2018 Report: Staten Island Railway
The purpose of this report is to provide the preliminary May 2018 financial results on an accrual basis. The accrual basis is presented on both a non-reimbursable and reimbursable account basis. These results are compared to the Adopted Budget (budget).
Summary of Preliminary Financial Results
Preliminary ridership and accrual results, versus budget, are summarized as follows:
May 2018 Staten Island Railway ridership of 420,157 riders was 3,160 riders (0.8percent) above budget. Average weekday ridership of 17,398 riders was 92 riders (0.5percent) above May 2017.
Farebox revenue of $0.6 million was essentially equal to budget.
Operating expenses of $4.4 million were below budget by $0.6 million (12.0 percent).
o Labor expenses were below budget by $0.5 million (11.6 percent).
o Non-labor expenses were under budget by $0.1 million (14.1%).
Master Page # 136 of 242 - New York City Transit and Bus Committee Meeting 7/23/2018________________________________________________________________________________
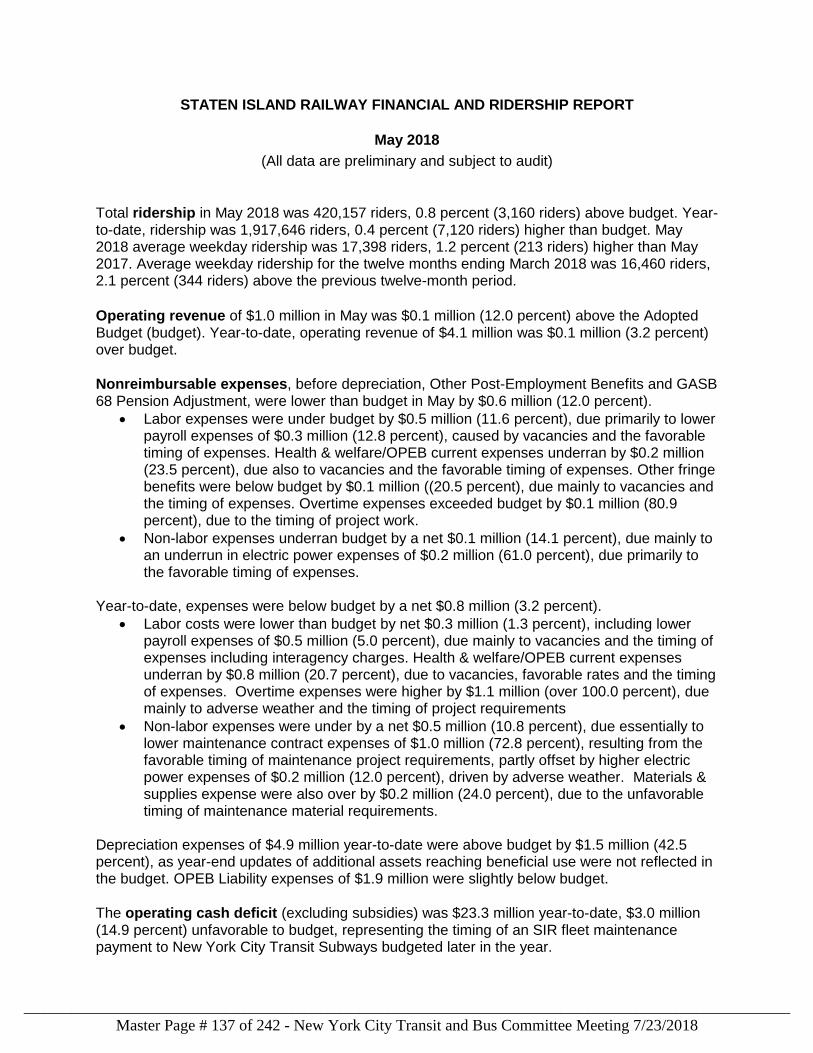
STATEN ISLAND RAILWAY FINANCIAL AND RIDERSHIP REPORT
May 2018
(All data are preliminary and subject to audit)
Total ridership in May 2018 was 420,157 riders, 0.8 percent (3,160 riders) above budget. Year-to-date, ridership was 1,917,646 riders, 0.4 percent (7,120 riders) higher than budget. May 2018 average weekday ridership was 17,398 riders, 1.2 percent (213 riders) higher than May 2017. Average weekday ridership for the twelve months ending March 2018 was 16,460 riders, 2.1 percent (344 riders) above the previous twelve-month period.
Operating revenue of $1.0 million in May was $0.1 million (12.0 percent) above the Adopted Budget (budget). Year-to-date, operating revenue of $4.1 million was $0.1 million (3.2 percent) over budget.
Nonreimbursable expenses, before depreciation, Other Post-Employment Benefits and GASB 68 Pension Adjustment, were lower than budget in May by $0.6 million (12.0 percent).
Labor expenses were under budget by $0.5 million (11.6 percent), due primarily to lower payroll expenses of $0.3 million (12.8 percent), caused by vacancies and the favorable timing of expenses. Health & welfare/OPEB current expenses underran by $0.2 million (23.5 percent), due also to vacancies and the favorable timing of expenses. Other fringe benefits were below budget by $0.1 million ((20.5 percent), due mainly to vacancies and the timing of expenses. Overtime expenses exceeded budget by $0.1 million (80.9 percent), due to the timing of project work.
Non-labor expenses underran budget by a net $0.1 million (14.1 percent), due mainly to an underrun in electric power expenses of $0.2 million (61.0 percent), due primarily to the favorable timing of expenses.
Year-to-date, expenses were below budget by a net $0.8 million (3.2 percent).
Labor costs were lower than budget by net $0.3 million (1.3 percent), including lower payroll expenses of $0.5 million (5.0 percent), due mainly to vacancies and the timing of expenses including interagency charges. Health & welfare/OPEB current expenses underran by $0.8 million (20.7 percent), due to vacancies, favorable rates and the timing of expenses. Overtime expenses were higher by $1.1 million (over 100.0 percent), due mainly to adverse weather and the timing of project requirements
Non-labor expenses were under by a net $0.5 million (10.8 percent), due essentially to lower maintenance contract expenses of $1.0 million (72.8 percent), resulting from the favorable timing of maintenance project requirements, partly offset by higher electric power expenses of $0.2 million (12.0 percent), driven by adverse weather. Materials & supplies expense were also over by $0.2 million (24.0 percent), due to the unfavorable timing of maintenance material requirements.
Depreciation expenses of $4.9 million year-to-date were above budget by $1.5 million (42.5 percent), as year-end updates of additional assets reaching beneficial use were not reflected in the budget. OPEB Liability expenses of $1.9 million were slightly below budget.
The operating cash deficit (excluding subsidies) was $23.3 million year-to-date, $3.0 million (14.9 percent) unfavorable to budget, representing the timing of an SIR fleet maintenance payment to New York City Transit Subways budgeted later in the year.
Master Page # 137 of 242 - New York City Transit and Bus Committee Meeting 7/23/2018________________________________________________________________________________
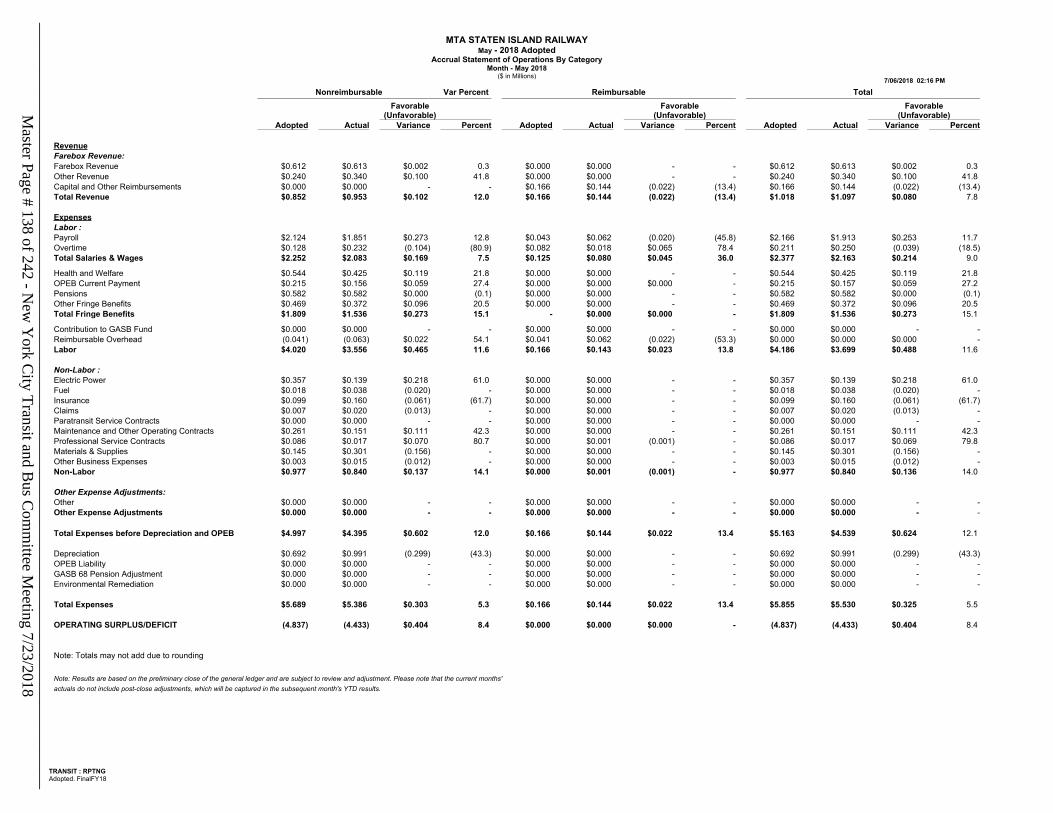
MTA STATEN ISLAND RAILWAYMay - 2018 Adopted
Accrual Statement of Operations By CategoryMonth - May 2018
($ in Millions)7/06/2018 02:16 PM
TRANSIT : RPTNGAdopted. FinalFY18
Nonreimbursable Var Percent Reimbursable TotalFavorable
(Unfavorable)Favorable
(Unfavorable)Favorable
(Unfavorable)Adopted Actual Variance Percent Adopted Actual Variance Percent Adopted Actual Variance Percent
RevenueFarebox Revenue:Farebox Revenue $0.612 $0.613 $0.002 0.3 $0.000 $0.000 - - $0.612 $0.613 $0.002 0.3 Other Revenue $0.240 $0.340 $0.100 41.8 $0.000 $0.000 - - $0.240 $0.340 $0.100 41.8 Capital and Other Reimbursements $0.000 $0.000 - - $0.166 $0.144 (0.022) (13.4) $0.166 $0.144 (0.022) (13.4)Total Revenue $0.852 $0.953 $0.102 12.0 $0.166 $0.144 (0.022) (13.4) $1.018 $1.097 $0.080 7.8
ExpensesLabor :Payroll $2.124 $1.851 $0.273 12.8 $0.043 $0.062 (0.020) (45.8) $2.166 $1.913 $0.253 11.7 Overtime $0.128 $0.232 (0.104) (80.9) $0.082 $0.018 $0.065 78.4 $0.211 $0.250 (0.039) (18.5)Total Salaries & Wages $2.252 $2.083 $0.169 7.5 $0.125 $0.080 $0.045 36.0 $2.377 $2.163 $0.214 9.0
Health and Welfare $0.544 $0.425 $0.119 21.8 $0.000 $0.000 - - $0.544 $0.425 $0.119 21.8 OPEB Current Payment $0.215 $0.156 $0.059 27.4 $0.000 $0.000 $0.000 - $0.215 $0.157 $0.059 27.2 Pensions $0.582 $0.582 $0.000 (0.1) $0.000 $0.000 - - $0.582 $0.582 $0.000 (0.1)Other Fringe Benefits $0.469 $0.372 $0.096 20.5 $0.000 $0.000 - - $0.469 $0.372 $0.096 20.5 Total Fringe Benefits $1.809 $1.536 $0.273 15.1 - $0.000 $0.000 - $1.809 $1.536 $0.273 15.1
Contribution to GASB Fund $0.000 $0.000 - - $0.000 $0.000 - - $0.000 $0.000 - -Reimbursable Overhead (0.041) (0.063) $0.022 54.1 $0.041 $0.062 (0.022) (53.3) $0.000 $0.000 $0.000 -Labor $4.020 $3.556 $0.465 11.6 $0.166 $0.143 $0.023 13.8 $4.186 $3.699 $0.488 11.6
Non-Labor :Electric Power $0.357 $0.139 $0.218 61.0 $0.000 $0.000 - - $0.357 $0.139 $0.218 61.0 Fuel $0.018 $0.038 (0.020) - $0.000 $0.000 - - $0.018 $0.038 (0.020) -Insurance $0.099 $0.160 (0.061) (61.7) $0.000 $0.000 - - $0.099 $0.160 (0.061) (61.7)Claims $0.007 $0.020 (0.013) - $0.000 $0.000 - - $0.007 $0.020 (0.013) -Paratransit Service Contracts $0.000 $0.000 - - $0.000 $0.000 - - $0.000 $0.000 - -Maintenance and Other Operating Contracts $0.261 $0.151 $0.111 42.3 $0.000 $0.000 - - $0.261 $0.151 $0.111 42.3 Professional Service Contracts $0.086 $0.017 $0.070 80.7 $0.000 $0.001 (0.001) - $0.086 $0.017 $0.069 79.8 Materials & Supplies $0.145 $0.301 (0.156) - $0.000 $0.000 - - $0.145 $0.301 (0.156) -Other Business Expenses $0.003 $0.015 (0.012) - $0.000 $0.000 - - $0.003 $0.015 (0.012) -Non-Labor $0.977 $0.840 $0.137 14.1 $0.000 $0.001 (0.001) - $0.977 $0.840 $0.136 14.0
Other Expense Adjustments:Other $0.000 $0.000 - - $0.000 $0.000 - - $0.000 $0.000 - -Other Expense Adjustments $0.000 $0.000 - - $0.000 $0.000 - - $0.000 $0.000 - -
Total Expenses before Depreciation and OPEB $4.997 $4.395 $0.602 12.0 $0.166 $0.144 $0.022 13.4 $5.163 $4.539 $0.624 12.1
Depreciation $0.692 $0.991 (0.299) (43.3) $0.000 $0.000 - - $0.692 $0.991 (0.299) (43.3)OPEB Liability $0.000 $0.000 - - $0.000 $0.000 - - $0.000 $0.000 - -GASB 68 Pension Adjustment $0.000 $0.000 - - $0.000 $0.000 - - $0.000 $0.000 - -Environmental Remediation $0.000 $0.000 - - $0.000 $0.000 - - $0.000 $0.000 - -
Total Expenses $5.689 $5.386 $0.303 5.3 $0.166 $0.144 $0.022 13.4 $5.855 $5.530 $0.325 5.5
OPERATING SURPLUS/DEFICIT (4.837) (4.433) $0.404 8.4 $0.000 $0.000 $0.000 - (4.837) (4.433) $0.404 8.4
Note: Totals may not add due to rounding
Note: Results are based on the preliminary close of the general ledger and are subject to review and adjustment. Please note that the current months'actuals do not include post-close adjustments, which will be captured in the subsequent month's YTD results.
Master Page # 138 of 242 - N
ew Y
ork City Transit and B
us Com
mittee M
eeting 7/23/2018________________________________________________________________________________
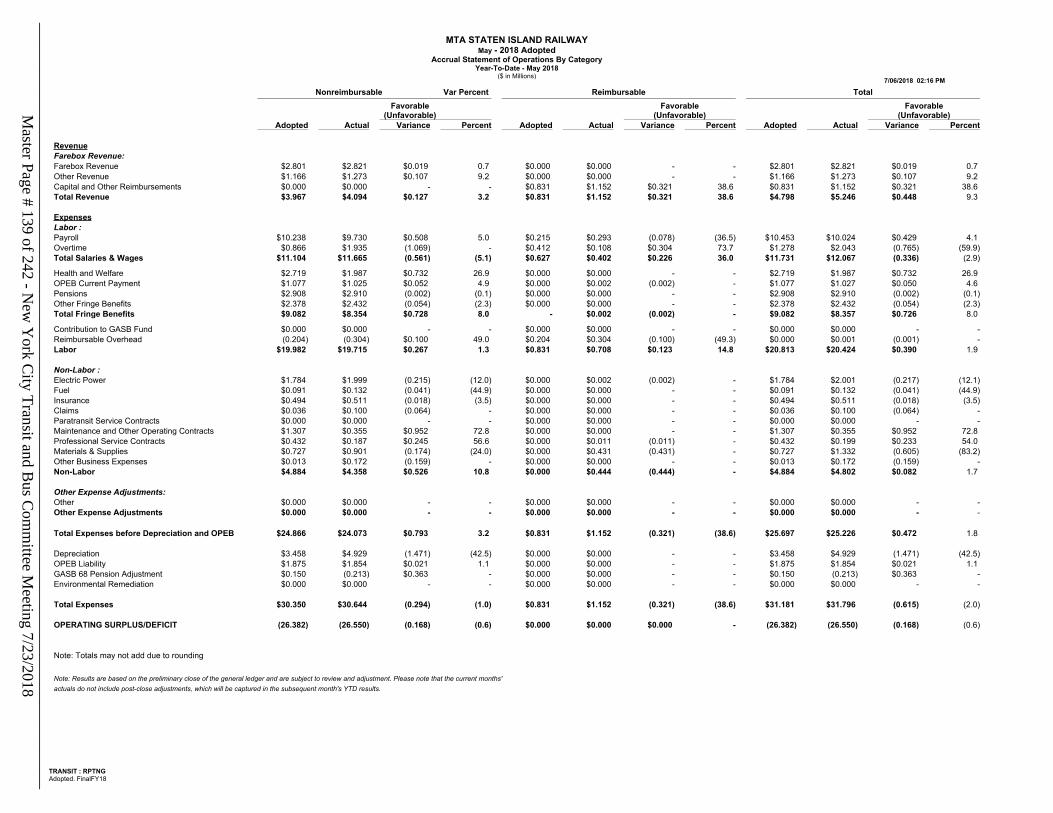
MTA STATEN ISLAND RAILWAYMay - 2018 Adopted
Accrual Statement of Operations By CategoryYear-To-Date - May 2018
($ in Millions)7/06/2018 02:16 PM
TRANSIT : RPTNGAdopted. FinalFY18
Nonreimbursable Var Percent Reimbursable TotalFavorable
(Unfavorable)Favorable
(Unfavorable)Favorable
(Unfavorable)Adopted Actual Variance Percent Adopted Actual Variance Percent Adopted Actual Variance Percent
RevenueFarebox Revenue:Farebox Revenue $2.801 $2.821 $0.019 0.7 $0.000 $0.000 - - $2.801 $2.821 $0.019 0.7 Other Revenue $1.166 $1.273 $0.107 9.2 $0.000 $0.000 - - $1.166 $1.273 $0.107 9.2 Capital and Other Reimbursements $0.000 $0.000 - - $0.831 $1.152 $0.321 38.6 $0.831 $1.152 $0.321 38.6 Total Revenue $3.967 $4.094 $0.127 3.2 $0.831 $1.152 $0.321 38.6 $4.798 $5.246 $0.448 9.3
ExpensesLabor :Payroll $10.238 $9.730 $0.508 5.0 $0.215 $0.293 (0.078) (36.5) $10.453 $10.024 $0.429 4.1 Overtime $0.866 $1.935 (1.069) - $0.412 $0.108 $0.304 73.7 $1.278 $2.043 (0.765) (59.9)Total Salaries & Wages $11.104 $11.665 (0.561) (5.1) $0.627 $0.402 $0.226 36.0 $11.731 $12.067 (0.336) (2.9)
Health and Welfare $2.719 $1.987 $0.732 26.9 $0.000 $0.000 - - $2.719 $1.987 $0.732 26.9 OPEB Current Payment $1.077 $1.025 $0.052 4.9 $0.000 $0.002 (0.002) - $1.077 $1.027 $0.050 4.6 Pensions $2.908 $2.910 (0.002) (0.1) $0.000 $0.000 - - $2.908 $2.910 (0.002) (0.1)Other Fringe Benefits $2.378 $2.432 (0.054) (2.3) $0.000 $0.000 - - $2.378 $2.432 (0.054) (2.3)Total Fringe Benefits $9.082 $8.354 $0.728 8.0 - $0.002 (0.002) - $9.082 $8.357 $0.726 8.0
Contribution to GASB Fund $0.000 $0.000 - - $0.000 $0.000 - - $0.000 $0.000 - -Reimbursable Overhead (0.204) (0.304) $0.100 49.0 $0.204 $0.304 (0.100) (49.3) $0.000 $0.001 (0.001) -Labor $19.982 $19.715 $0.267 1.3 $0.831 $0.708 $0.123 14.8 $20.813 $20.424 $0.390 1.9
Non-Labor :Electric Power $1.784 $1.999 (0.215) (12.0) $0.000 $0.002 (0.002) - $1.784 $2.001 (0.217) (12.1)Fuel $0.091 $0.132 (0.041) (44.9) $0.000 $0.000 - - $0.091 $0.132 (0.041) (44.9)Insurance $0.494 $0.511 (0.018) (3.5) $0.000 $0.000 - - $0.494 $0.511 (0.018) (3.5)Claims $0.036 $0.100 (0.064) - $0.000 $0.000 - - $0.036 $0.100 (0.064) -Paratransit Service Contracts $0.000 $0.000 - - $0.000 $0.000 - - $0.000 $0.000 - -Maintenance and Other Operating Contracts $1.307 $0.355 $0.952 72.8 $0.000 $0.000 - - $1.307 $0.355 $0.952 72.8 Professional Service Contracts $0.432 $0.187 $0.245 56.6 $0.000 $0.011 (0.011) - $0.432 $0.199 $0.233 54.0 Materials & Supplies $0.727 $0.901 (0.174) (24.0) $0.000 $0.431 (0.431) - $0.727 $1.332 (0.605) (83.2)Other Business Expenses $0.013 $0.172 (0.159) - $0.000 $0.000 - - $0.013 $0.172 (0.159) -Non-Labor $4.884 $4.358 $0.526 10.8 $0.000 $0.444 (0.444) - $4.884 $4.802 $0.082 1.7
Other Expense Adjustments:Other $0.000 $0.000 - - $0.000 $0.000 - - $0.000 $0.000 - -Other Expense Adjustments $0.000 $0.000 - - $0.000 $0.000 - - $0.000 $0.000 - -
Total Expenses before Depreciation and OPEB $24.866 $24.073 $0.793 3.2 $0.831 $1.152 (0.321) (38.6) $25.697 $25.226 $0.472 1.8
Depreciation $3.458 $4.929 (1.471) (42.5) $0.000 $0.000 - - $3.458 $4.929 (1.471) (42.5)OPEB Liability $1.875 $1.854 $0.021 1.1 $0.000 $0.000 - - $1.875 $1.854 $0.021 1.1 GASB 68 Pension Adjustment $0.150 (0.213) $0.363 - $0.000 $0.000 - - $0.150 (0.213) $0.363 -Environmental Remediation $0.000 $0.000 - - $0.000 $0.000 - - $0.000 $0.000 - -
Total Expenses $30.350 $30.644 (0.294) (1.0) $0.831 $1.152 (0.321) (38.6) $31.181 $31.796 (0.615) (2.0)
OPERATING SURPLUS/DEFICIT (26.382) (26.550) (0.168) (0.6) $0.000 $0.000 $0.000 - (26.382) (26.550) (0.168) (0.6)
Note: Totals may not add due to rounding
Note: Results are based on the preliminary close of the general ledger and are subject to review and adjustment. Please note that the current months'actuals do not include post-close adjustments, which will be captured in the subsequent month's YTD results.
Master Page # 139 of 242 - N
ew Y
ork City Transit and B
us Com
mittee M
eeting 7/23/2018________________________________________________________________________________
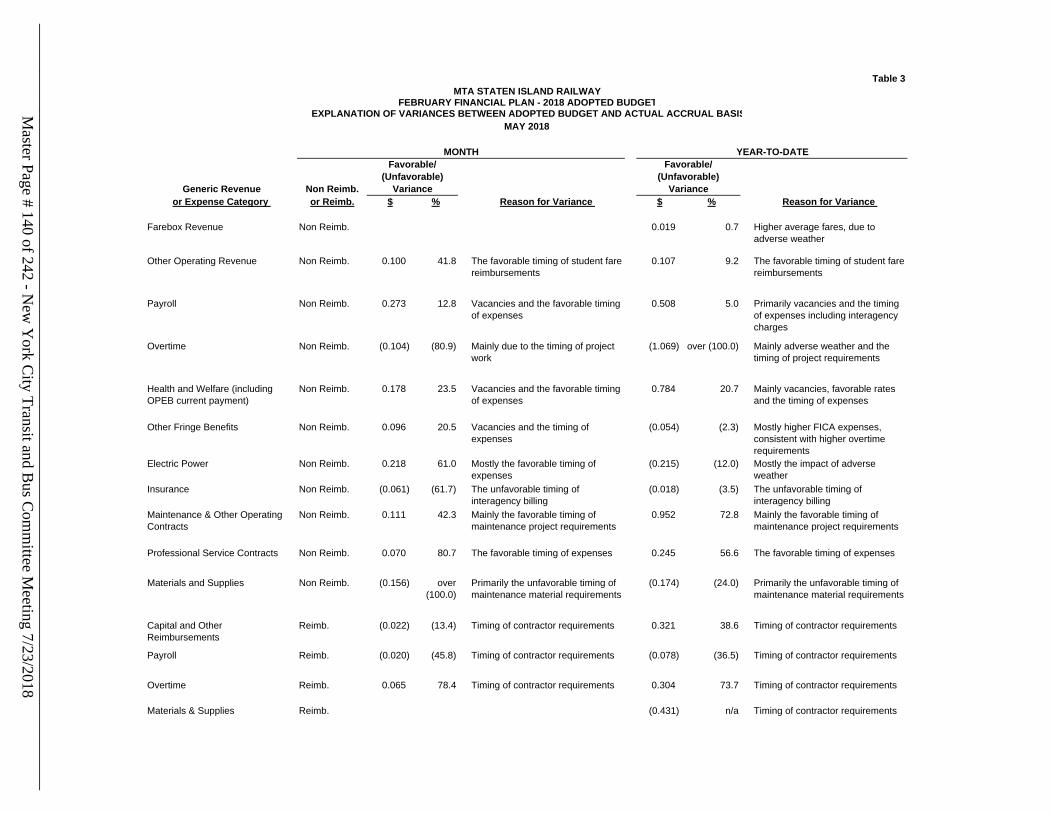
Table 3
Generic Revenue Non Reimb.
or Expense Category or Reimb. $ % Reason for Variance $ % Reason for Variance
Farebox Revenue Non Reimb. 0.019 0.7 Higher average fares, due to
adverse weather
Other Operating Revenue Non Reimb. 0.100 41.8 The favorable timing of student fare
reimbursements
0.107 9.2 The favorable timing of student fare
reimbursements
Payroll Non Reimb. 0.273 12.8 Vacancies and the favorable timing
of expenses
0.508 5.0 Primarily vacancies and the timing
of expenses including interagency
charges
Overtime Non Reimb. (0.104) (80.9) Mainly due to the timing of project
work
(1.069) over (100.0) Mainly adverse weather and the
timing of project requirements
Health and Welfare (including
OPEB current payment)
Non Reimb. 0.178 23.5 Vacancies and the favorable timing
of expenses
0.784 20.7 Mainly vacancies, favorable rates
and the timing of expenses
Other Fringe Benefits Non Reimb. 0.096 20.5 Vacancies and the timing of
expenses
(0.054) (2.3) Mostly higher FICA expenses,
consistent with higher overtime
requirements
Electric Power Non Reimb. 0.218 61.0 Mostly the favorable timing of
expenses
(0.215) (12.0) Mostly the impact of adverse
weather
Insurance Non Reimb. (0.061) (61.7) The unfavorable timing of
interagency billing
(0.018) (3.5) The unfavorable timing of
interagency billing
Maintenance & Other Operating
Contracts
Non Reimb. 0.111 42.3 Mainly the favorable timing of
maintenance project requirements
0.952 72.8 Mainly the favorable timing of
maintenance project requirements
Professional Service Contracts Non Reimb. 0.070 80.7 The favorable timing of expenses 0.245 56.6 The favorable timing of expenses
Materials and Supplies Non Reimb. (0.156) over
(100.0)
Primarily the unfavorable timing of
maintenance material requirements
(0.174) (24.0) Primarily the unfavorable timing of
maintenance material requirements
Capital and Other
Reimbursements
Reimb. (0.022) (13.4) Timing of contractor requirements 0.321 38.6 Timing of contractor requirements
Payroll Reimb. (0.020) (45.8) Timing of contractor requirements (0.078) (36.5) Timing of contractor requirements
Overtime Reimb. 0.065 78.4 Timing of contractor requirements 0.304 73.7 Timing of contractor requirements
Materials & Supplies Reimb. (0.431) n/a Timing of contractor requirements
Favorable/
(Unfavorable)
Variance
Favorable/
(Unfavorable)
Variance
MTA STATEN ISLAND RAILWAY
MAY 2018
MONTH YEAR-TO-DATE
EXPLANATION OF VARIANCES BETWEEN ADOPTED BUDGET AND ACTUAL ACCRUAL BASISFEBRUARY FINANCIAL PLAN - 2018 ADOPTED BUDGETM
aster Page # 140 of 242 - New
York C
ity Transit and Bus C
omm
ittee Meeting 7/23/2018
________________________________________________________________________________
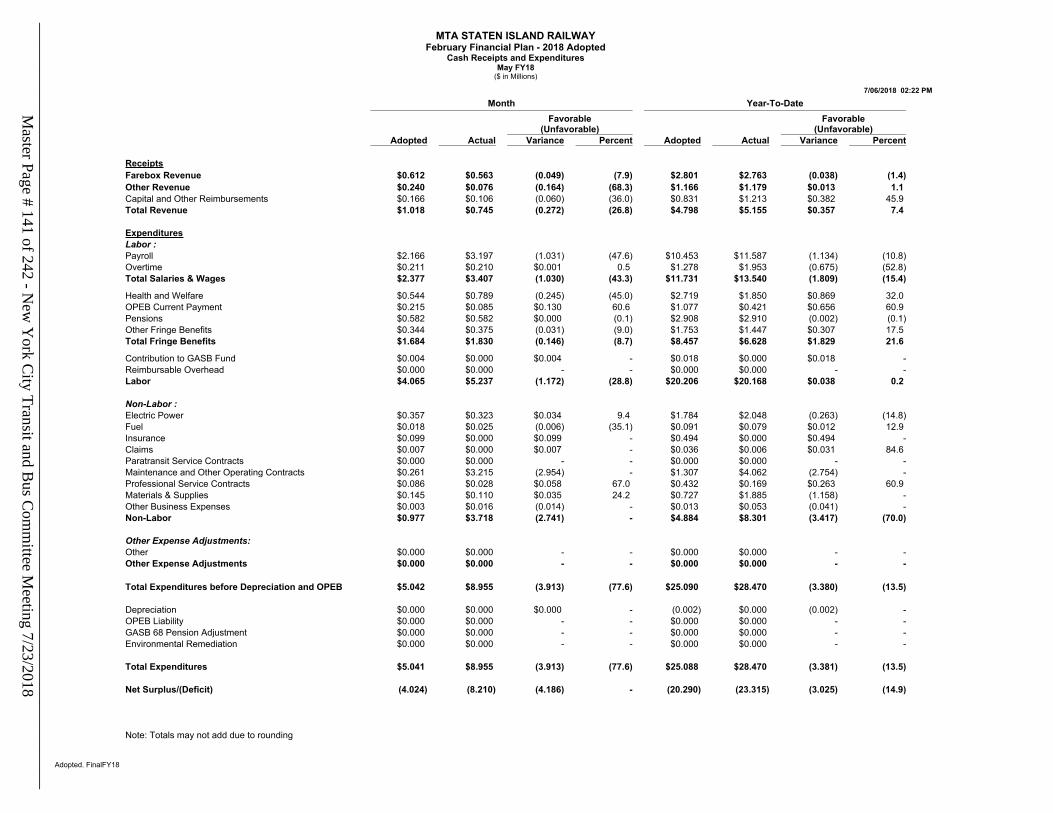
MTA STATEN ISLAND RAILWAYFebruary Financial Plan - 2018 Adopted
Cash Receipts and ExpendituresMay FY18
($ in Millions)
7/06/2018 02:22 PM
Adopted. FinalFY18
Month Year-To-DateFavorable
(Unfavorable)Favorable
(Unfavorable)Adopted Actual Variance Percent Adopted Actual Variance Percent
ReceiptsFarebox Revenue $0.612 $0.563 (0.049) (7.9) $2.801 $2.763 (0.038) (1.4)Other Revenue $0.240 $0.076 (0.164) (68.3) $1.166 $1.179 $0.013 1.1 Capital and Other Reimbursements $0.166 $0.106 (0.060) (36.0) $0.831 $1.213 $0.382 45.9 Total Revenue $1.018 $0.745 (0.272) (26.8) $4.798 $5.155 $0.357 7.4
ExpendituresLabor :Payroll $2.166 $3.197 (1.031) (47.6) $10.453 $11.587 (1.134) (10.8)Overtime $0.211 $0.210 $0.001 0.5 $1.278 $1.953 (0.675) (52.8)Total Salaries & Wages $2.377 $3.407 (1.030) (43.3) $11.731 $13.540 (1.809) (15.4)
Health and Welfare $0.544 $0.789 (0.245) (45.0) $2.719 $1.850 $0.869 32.0 OPEB Current Payment $0.215 $0.085 $0.130 60.6 $1.077 $0.421 $0.656 60.9 Pensions $0.582 $0.582 $0.000 (0.1) $2.908 $2.910 (0.002) (0.1)Other Fringe Benefits $0.344 $0.375 (0.031) (9.0) $1.753 $1.447 $0.307 17.5 Total Fringe Benefits $1.684 $1.830 (0.146) (8.7) $8.457 $6.628 $1.829 21.6
Contribution to GASB Fund $0.004 $0.000 $0.004 - $0.018 $0.000 $0.018 -Reimbursable Overhead $0.000 $0.000 - - $0.000 $0.000 - -Labor $4.065 $5.237 (1.172) (28.8) $20.206 $20.168 $0.038 0.2
Non-Labor :Electric Power $0.357 $0.323 $0.034 9.4 $1.784 $2.048 (0.263) (14.8)Fuel $0.018 $0.025 (0.006) (35.1) $0.091 $0.079 $0.012 12.9 Insurance $0.099 $0.000 $0.099 - $0.494 $0.000 $0.494 -Claims $0.007 $0.000 $0.007 - $0.036 $0.006 $0.031 84.6 Paratransit Service Contracts $0.000 $0.000 - - $0.000 $0.000 - -Maintenance and Other Operating Contracts $0.261 $3.215 (2.954) - $1.307 $4.062 (2.754) -Professional Service Contracts $0.086 $0.028 $0.058 67.0 $0.432 $0.169 $0.263 60.9 Materials & Supplies $0.145 $0.110 $0.035 24.2 $0.727 $1.885 (1.158) -Other Business Expenses $0.003 $0.016 (0.014) - $0.013 $0.053 (0.041) -Non-Labor $0.977 $3.718 (2.741) - $4.884 $8.301 (3.417) (70.0)
Other Expense Adjustments:Other $0.000 $0.000 - - $0.000 $0.000 - -Other Expense Adjustments $0.000 $0.000 - - $0.000 $0.000 - -
Total Expenditures before Depreciation and OPEB $5.042 $8.955 (3.913) (77.6) $25.090 $28.470 (3.380) (13.5)
Depreciation $0.000 $0.000 $0.000 - (0.002) $0.000 (0.002) -OPEB Liability $0.000 $0.000 - - $0.000 $0.000 - -GASB 68 Pension Adjustment $0.000 $0.000 - - $0.000 $0.000 - -Environmental Remediation $0.000 $0.000 - - $0.000 $0.000 - -
Total Expenditures $5.041 $8.955 (3.913) (77.6) $25.088 $28.470 (3.381) (13.5)
Net Surplus/(Deficit) (4.024) (8.210) (4.186) - (20.290) (23.315) (3.025) (14.9)
Note: Totals may not add due to rounding
Master Page # 141 of 242 - N
ew Y
ork City Transit and B
us Com
mittee M
eeting 7/23/2018________________________________________________________________________________
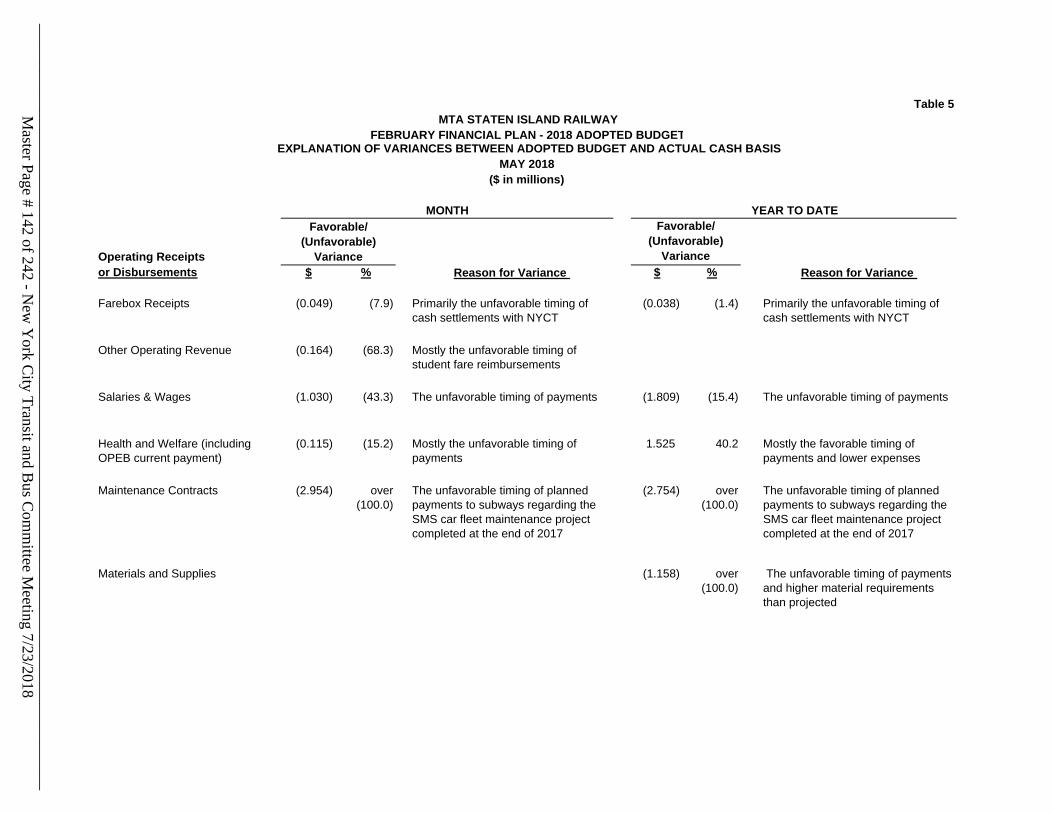
Table 5
MONTH
Operating Receipts
Favorable/
(Unfavorable)
Variance
or Disbursements $ % Reason for Variance $ % Reason for Variance
Farebox Receipts (0.049) (7.9) Primarily the unfavorable timing of
cash settlements with NYCT
(0.038) (1.4) Primarily the unfavorable timing of
cash settlements with NYCT
Other Operating Revenue (0.164) (68.3) Mostly the unfavorable timing of
student fare reimbursements
Salaries & Wages (1.030) (43.3) The unfavorable timing of payments (1.809) (15.4) The unfavorable timing of payments
Health and Welfare (including
OPEB current payment)
(0.115) (15.2) Mostly the unfavorable timing of
payments
1.525 40.2 Mostly the favorable timing of
payments and lower expenses
Maintenance Contracts (2.954) over
(100.0)
The unfavorable timing of planned
payments to subways regarding the
SMS car fleet maintenance project
completed at the end of 2017
(2.754) over
(100.0)
The unfavorable timing of planned
payments to subways regarding the
SMS car fleet maintenance project
completed at the end of 2017
Materials and Supplies (1.158) over
(100.0)
The unfavorable timing of payments
and higher material requirements
than projected
Favorable/
(Unfavorable)
Variance
MTA STATEN ISLAND RAILWAY
FEBRUARY FINANCIAL PLAN - 2018 ADOPTED BUDGETEXPLANATION OF VARIANCES BETWEEN ADOPTED BUDGET AND ACTUAL CASH BASIS
MAY 2018
($ in millions)
YEAR TO DATE
Master Page # 142 of 242 - N
ew Y
ork City Transit and B
us Com
mittee M
eeting 7/23/2018________________________________________________________________________________
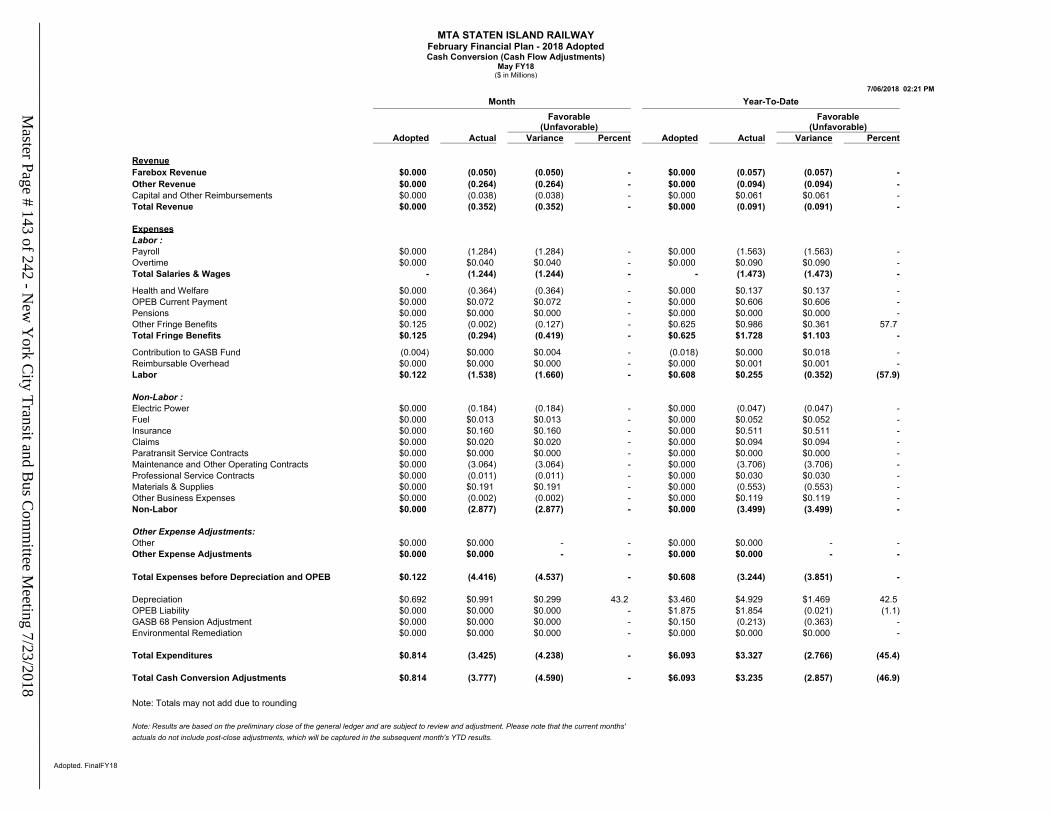
MTA STATEN ISLAND RAILWAYFebruary Financial Plan - 2018 AdoptedCash Conversion (Cash Flow Adjustments)
May FY18($ in Millions)
7/06/2018 02:21 PM
Adopted. FinalFY18
Month Year-To-DateFavorable
(Unfavorable)Favorable
(Unfavorable)Adopted Actual Variance Percent Adopted Actual Variance Percent
RevenueFarebox Revenue $0.000 (0.050) (0.050) - $0.000 (0.057) (0.057) -Other Revenue $0.000 (0.264) (0.264) - $0.000 (0.094) (0.094) -Capital and Other Reimbursements $0.000 (0.038) (0.038) - $0.000 $0.061 $0.061 -Total Revenue $0.000 (0.352) (0.352) - $0.000 (0.091) (0.091) -
ExpensesLabor :Payroll $0.000 (1.284) (1.284) - $0.000 (1.563) (1.563) -Overtime $0.000 $0.040 $0.040 - $0.000 $0.090 $0.090 -Total Salaries & Wages - (1.244) (1.244) - - (1.473) (1.473) -
Health and Welfare $0.000 (0.364) (0.364) - $0.000 $0.137 $0.137 -OPEB Current Payment $0.000 $0.072 $0.072 - $0.000 $0.606 $0.606 -Pensions $0.000 $0.000 $0.000 - $0.000 $0.000 $0.000 -Other Fringe Benefits $0.125 (0.002) (0.127) - $0.625 $0.986 $0.361 57.7 Total Fringe Benefits $0.125 (0.294) (0.419) - $0.625 $1.728 $1.103 -
Contribution to GASB Fund (0.004) $0.000 $0.004 - (0.018) $0.000 $0.018 -Reimbursable Overhead $0.000 $0.000 $0.000 - $0.000 $0.001 $0.001 -Labor $0.122 (1.538) (1.660) - $0.608 $0.255 (0.352) (57.9)
Non-Labor :Electric Power $0.000 (0.184) (0.184) - $0.000 (0.047) (0.047) -Fuel $0.000 $0.013 $0.013 - $0.000 $0.052 $0.052 -Insurance $0.000 $0.160 $0.160 - $0.000 $0.511 $0.511 -Claims $0.000 $0.020 $0.020 - $0.000 $0.094 $0.094 -Paratransit Service Contracts $0.000 $0.000 $0.000 - $0.000 $0.000 $0.000 -Maintenance and Other Operating Contracts $0.000 (3.064) (3.064) - $0.000 (3.706) (3.706) -Professional Service Contracts $0.000 (0.011) (0.011) - $0.000 $0.030 $0.030 -Materials & Supplies $0.000 $0.191 $0.191 - $0.000 (0.553) (0.553) -Other Business Expenses $0.000 (0.002) (0.002) - $0.000 $0.119 $0.119 -Non-Labor $0.000 (2.877) (2.877) - $0.000 (3.499) (3.499) -
Other Expense Adjustments:Other $0.000 $0.000 - - $0.000 $0.000 - -Other Expense Adjustments $0.000 $0.000 - - $0.000 $0.000 - -
Total Expenses before Depreciation and OPEB $0.122 (4.416) (4.537) - $0.608 (3.244) (3.851) -
Depreciation $0.692 $0.991 $0.299 43.2 $3.460 $4.929 $1.469 42.5 OPEB Liability $0.000 $0.000 $0.000 - $1.875 $1.854 (0.021) (1.1)GASB 68 Pension Adjustment $0.000 $0.000 $0.000 - $0.150 (0.213) (0.363) -Environmental Remediation $0.000 $0.000 $0.000 - $0.000 $0.000 $0.000 -
Total Expenditures $0.814 (3.425) (4.238) - $6.093 $3.327 (2.766) (45.4)
Total Cash Conversion Adjustments $0.814 (3.777) (4.590) - $6.093 $3.235 (2.857) (46.9)
Note: Totals may not add due to rounding
Note: Results are based on the preliminary close of the general ledger and are subject to review and adjustment. Please note that the current months'actuals do not include post-close adjustments, which will be captured in the subsequent month's YTD results.
Master Page # 143 of 242 - N
ew Y
ork City Transit and B
us Com
mittee M
eeting 7/23/2018________________________________________________________________________________
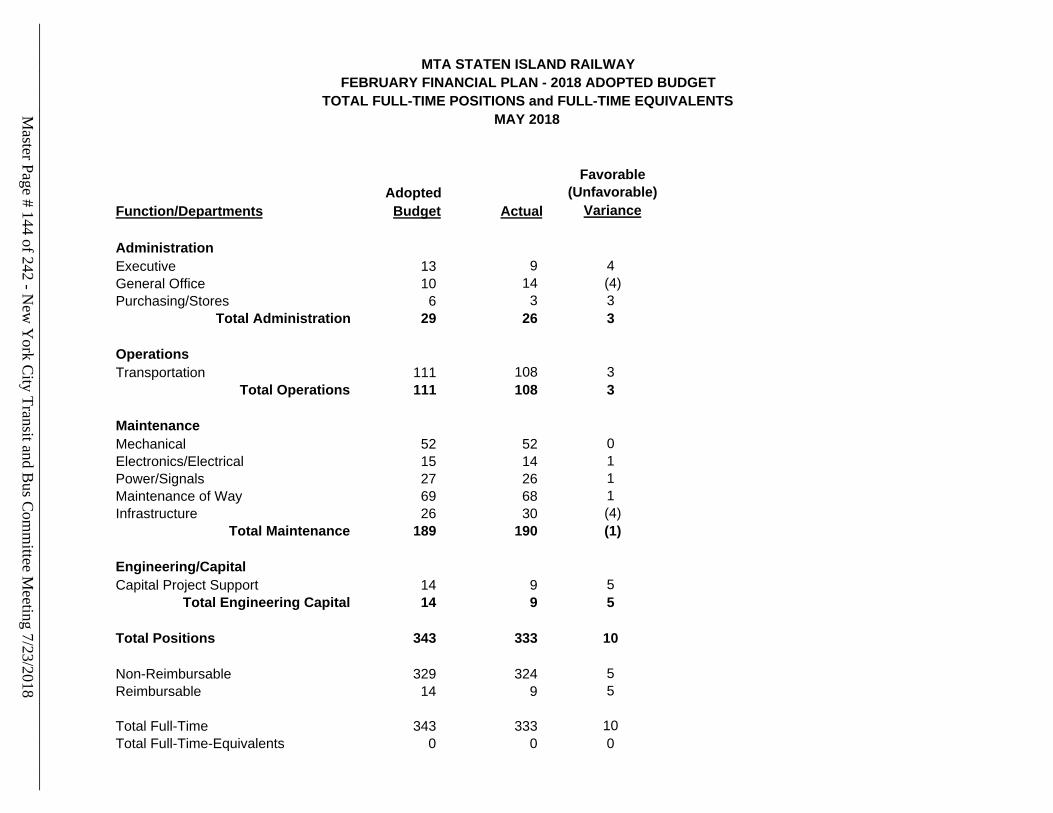
Adopted
Favorable
(Unfavorable)
Function/Departments Budget Actual Variance
Administration
Executive 13 9 4
General Office 10 14 (4)
Purchasing/Stores 6 3 3
Total Administration 29 26 3
Operations
Transportation 111 108 3
Total Operations 111 108 3
Maintenance
Mechanical 52 52 0
Electronics/Electrical 15 14 1
Power/Signals 27 26 1
Maintenance of Way 69 68 1
Infrastructure 26 30 (4)
Total Maintenance 189 190 (1)
Engineering/Capital
Capital Project Support 14 9 5
Total Engineering Capital 14 9 5
Total Positions 343 333 10
Non-Reimbursable 329 324 5
Reimbursable 14 9 5
Total Full-Time 343 333 10
Total Full-Time-Equivalents 0 0 0
MTA STATEN ISLAND RAILWAY
TOTAL FULL-TIME POSITIONS and FULL-TIME EQUIVALENTS
MAY 2018
FEBRUARY FINANCIAL PLAN - 2018 ADOPTED BUDGET
Master Page # 144 of 242 - N
ew Y
ork City Transit and B
us Com
mittee M
eeting 7/23/2018________________________________________________________________________________
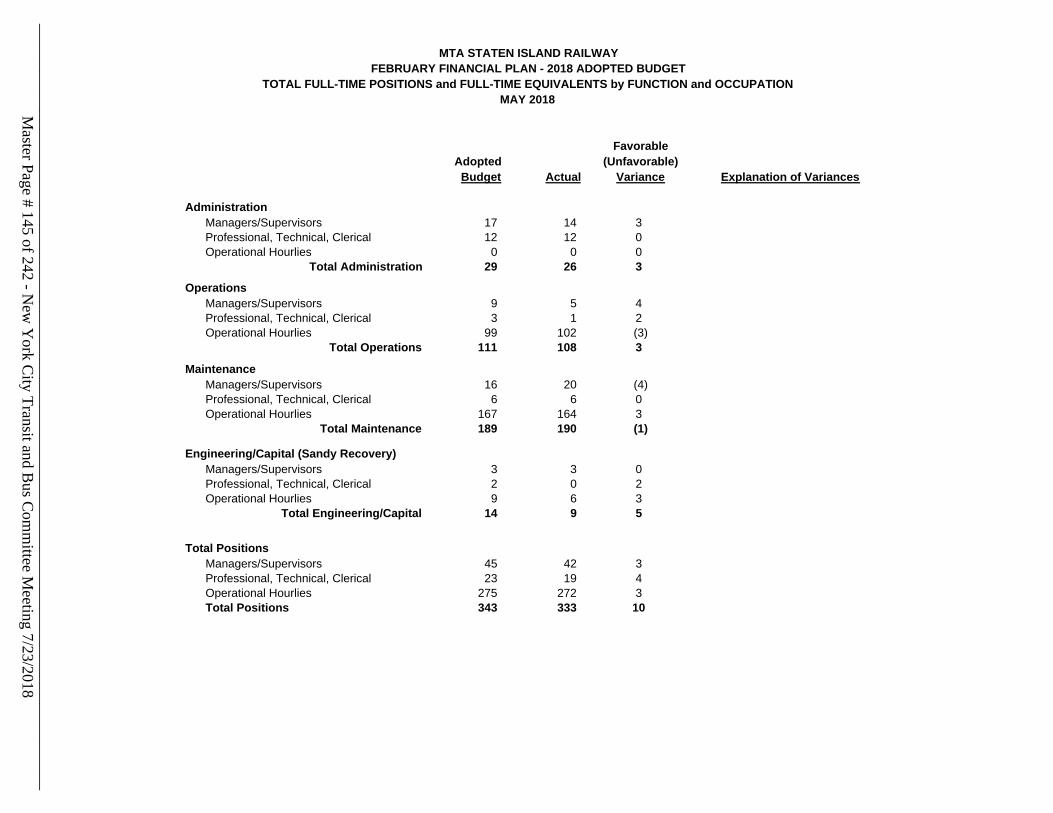
MTA STATEN ISLAND RAILWAY
TOTAL FULL-TIME POSITIONS and FULL-TIME EQUIVALENTS by FUNCTION and OCCUPATION
Favorable
Adopted (Unfavorable)
Budget Actual Variance Explanation of Variances
Administration
Managers/Supervisors 17 14 3
Professional, Technical, Clerical 12 12 0
Operational Hourlies 0 0 0
Total Administration 29 26 3
Operations
Managers/Supervisors 9 5 4
Professional, Technical, Clerical 3 1 2
Operational Hourlies 99 102 (3)
Total Operations 111 108 3
Maintenance
Managers/Supervisors 16 20 (4)
Professional, Technical, Clerical 6 6 0
Operational Hourlies 167 164 3
Total Maintenance 189 190 (1)
Engineering/Capital (Sandy Recovery)
Managers/Supervisors 3 3 0
Professional, Technical, Clerical 2 0 2
Operational Hourlies 9 6 3
Total Engineering/Capital 14 9 5
Total Positions
Managers/Supervisors 45 42 3
Professional, Technical, Clerical 23 19 4
Operational Hourlies 275 272 3
Total Positions 343 333 10
FEBRUARY FINANCIAL PLAN - 2018 ADOPTED BUDGET
MAY 2018
Master Page # 145 of 242 - N
ew Y
ork City Transit and B
us Com
mittee M
eeting 7/23/2018________________________________________________________________________________
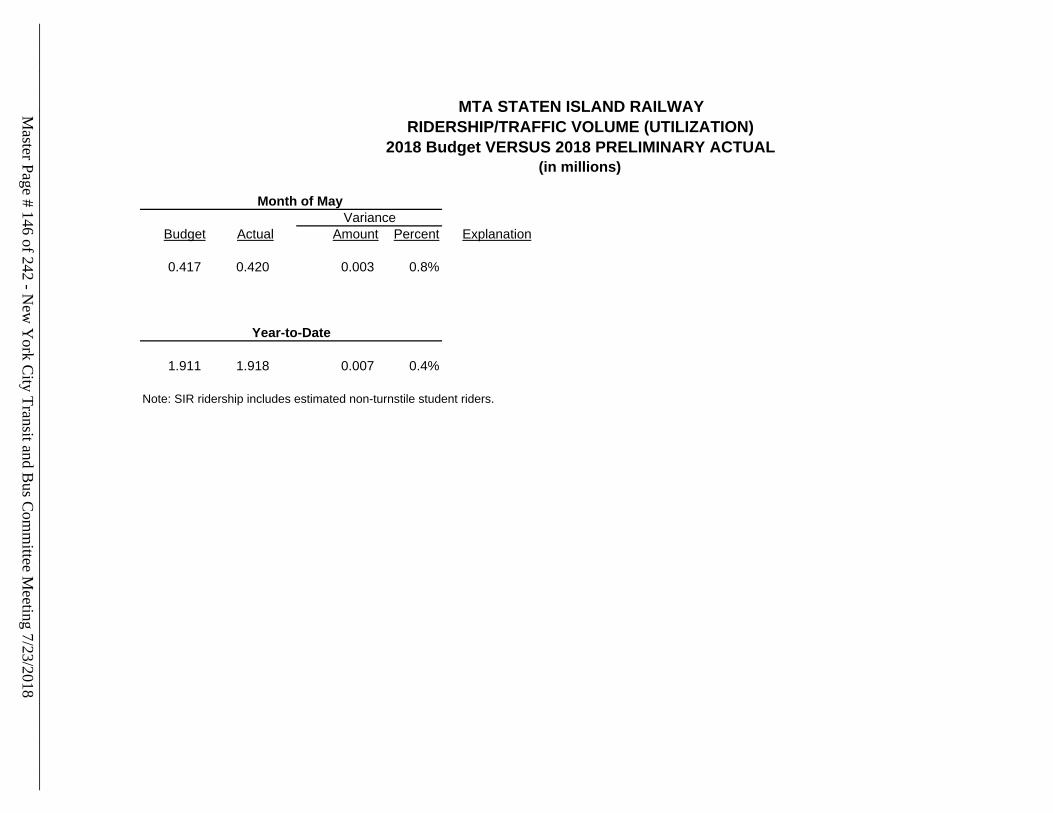
MTA STATEN ISLAND RAILWAY
RIDERSHIP/TRAFFIC VOLUME (UTILIZATION)
2018 Budget VERSUS 2018 PRELIMINARY ACTUAL
(in millions)
Month of May
Budget Actual Amount Percent Explanation
0.417 0.420 0.003 0.8%
Year-to-Date
1.911 1.918 0.007 0.4%
Note: SIR ridership includes estimated non-turnstile student riders.
Variance
Master Page # 146 of 242 - N
ew Y
ork City Transit and B
us Com
mittee M
eeting 7/23/2018________________________________________________________________________________
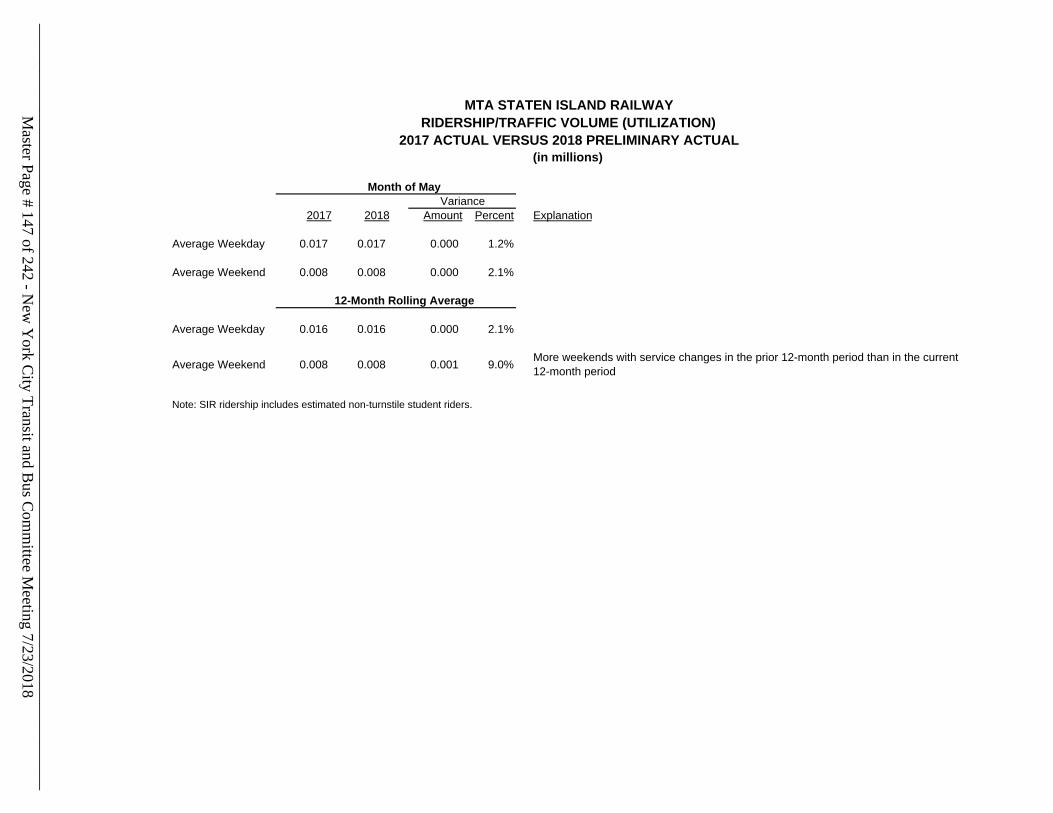
MTA STATEN ISLAND RAILWAY
RIDERSHIP/TRAFFIC VOLUME (UTILIZATION)
2017 ACTUAL VERSUS 2018 PRELIMINARY ACTUAL
(in millions)
Month of May
2017 2018 Amount Percent Explanation
Average Weekday 0.017 0.017 0.000 1.2%
Average Weekend 0.008 0.008 0.000 2.1%
12-Month Rolling Average
Average Weekday 0.016 0.016 0.000 2.1%
Average Weekend 0.008 0.008 0.001 9.0%More weekends with service changes in the prior 12-month period than in the current
12-month period
Note: SIR ridership includes estimated non-turnstile student riders.
Variance
Master Page # 147 of 242 - N
ew Y
ork City Transit and B
us Com
mittee M
eeting 7/23/2018________________________________________________________________________________
Preliminary May 2018 Report: Bus Company The purpose of this report is to provide the preliminary May 2018 financial results on an accrual basis. The accrual basis is presented on both a non-reimbursable and reimbursable account basis. These results are compared to the Adopted Budget (budget). Summary of Preliminary Financial Results Preliminary ridership and accrual results, versus budget, are summarized as follows:
May 2018 Bus Company ridership of 11.0 million was 0.2 million (1.9 percent) below budget.
Farebox revenue of $19.2 million was $0.1 million (0.4 percent) under budget.
Operating expenses of $67.9 million were $0.5 million (0.8 percent) over budget.
o Labor expenses exceeded budget by a net $0.8 million (1.6 percent), including
higher health & welfare/OPEB current expenses of $1.9 million (22.5 percent), partly offset by underruns in other fringe benefits of $0.6 million (10.3 percent) and payroll of $0.469 million (1.9 percent).
o Non-labor expenses underran by a net $0.3 million (1.6 percent), including
favorable results in maintenance contracts of $2.2 million (58.2 percent), and materials & supplies of $1.5 million (27.7 percent), essentially offset by higher public liability claims reserve adjustments of $2.4 million (92.3 percent) and higher fuel expenses of $1.0 million (54.2 percent).
Master Page # 148 of 242 - New York City Transit and Bus Committee Meeting 7/23/2018________________________________________________________________________________
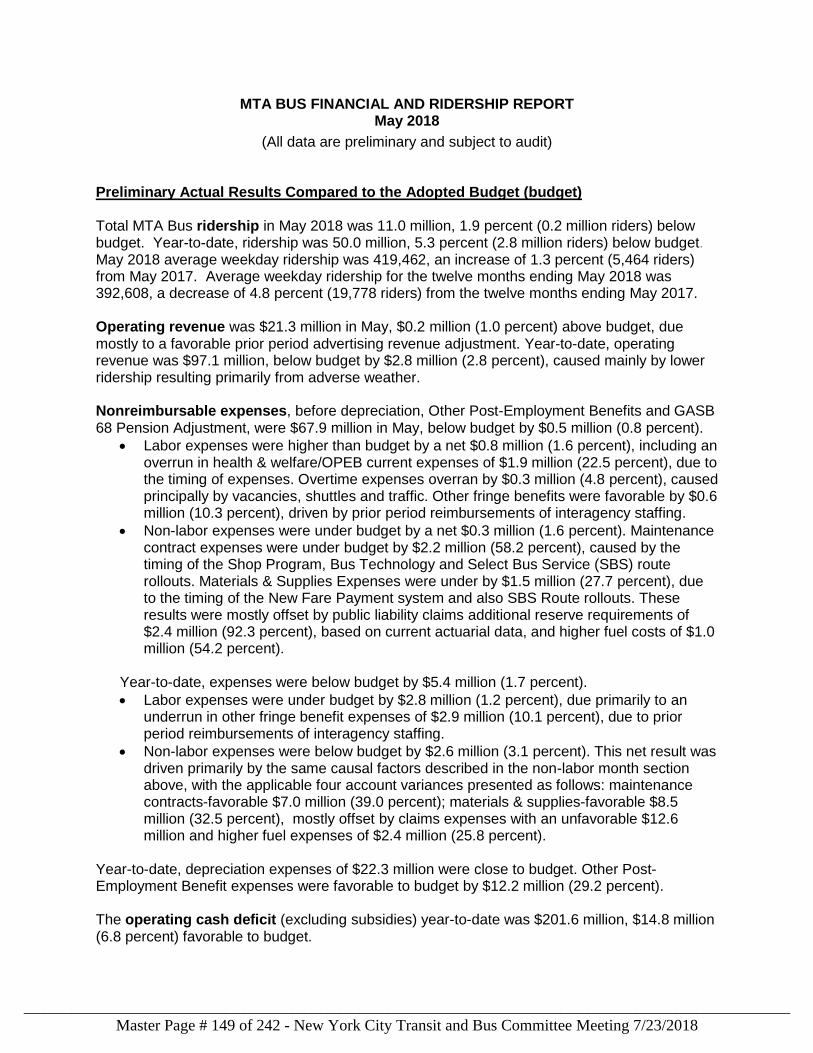
MTA BUS FINANCIAL AND RIDERSHIP REPORT May 2018
(All data are preliminary and subject to audit)
Preliminary Actual Results Compared to the Adopted Budget (budget) Total MTA Bus ridership in May 2018 was 11.0 million, 1.9 percent (0.2 million riders) below budget. Year-to-date, ridership was 50.0 million, 5.3 percent (2.8 million riders) below budget. May 2018 average weekday ridership was 419,462, an increase of 1.3 percent (5,464 riders) from May 2017. Average weekday ridership for the twelve months ending May 2018 was 392,608, a decrease of 4.8 percent (19,778 riders) from the twelve months ending May 2017. Operating revenue was $21.3 million in May, $0.2 million (1.0 percent) above budget, due mostly to a favorable prior period advertising revenue adjustment. Year-to-date, operating revenue was $97.1 million, below budget by $2.8 million (2.8 percent), caused mainly by lower ridership resulting primarily from adverse weather. Nonreimbursable expenses, before depreciation, Other Post-Employment Benefits and GASB 68 Pension Adjustment, were $67.9 million in May, below budget by $0.5 million (0.8 percent).
Labor expenses were higher than budget by a net $0.8 million (1.6 percent), including an overrun in health & welfare/OPEB current expenses of $1.9 million (22.5 percent), due to the timing of expenses. Overtime expenses overran by $0.3 million (4.8 percent), caused principally by vacancies, shuttles and traffic. Other fringe benefits were favorable by $0.6 million (10.3 percent), driven by prior period reimbursements of interagency staffing.
Non-labor expenses were under budget by a net $0.3 million (1.6 percent). Maintenance contract expenses were under budget by $2.2 million (58.2 percent), caused by the timing of the Shop Program, Bus Technology and Select Bus Service (SBS) route rollouts. Materials & Supplies Expenses were under by $1.5 million (27.7 percent), due to the timing of the New Fare Payment system and also SBS Route rollouts. These results were mostly offset by public liability claims additional reserve requirements of $2.4 million (92.3 percent), based on current actuarial data, and higher fuel costs of $1.0 million (54.2 percent).
Year-to-date, expenses were below budget by $5.4 million (1.7 percent).
Labor expenses were under budget by $2.8 million (1.2 percent), due primarily to an underrun in other fringe benefit expenses of $2.9 million (10.1 percent), due to prior period reimbursements of interagency staffing.
Non-labor expenses were below budget by $2.6 million (3.1 percent). This net result was driven primarily by the same causal factors described in the non-labor month section above, with the applicable four account variances presented as follows: maintenance contracts-favorable $7.0 million (39.0 percent); materials & supplies-favorable $8.5 million (32.5 percent), mostly offset by claims expenses with an unfavorable $12.6 million and higher fuel expenses of $2.4 million (25.8 percent).
Year-to-date, depreciation expenses of $22.3 million were close to budget. Other Post-Employment Benefit expenses were favorable to budget by $12.2 million (29.2 percent). The operating cash deficit (excluding subsidies) year-to-date was $201.6 million, $14.8 million (6.8 percent) favorable to budget.
Master Page # 149 of 242 - New York City Transit and Bus Committee Meeting 7/23/2018________________________________________________________________________________
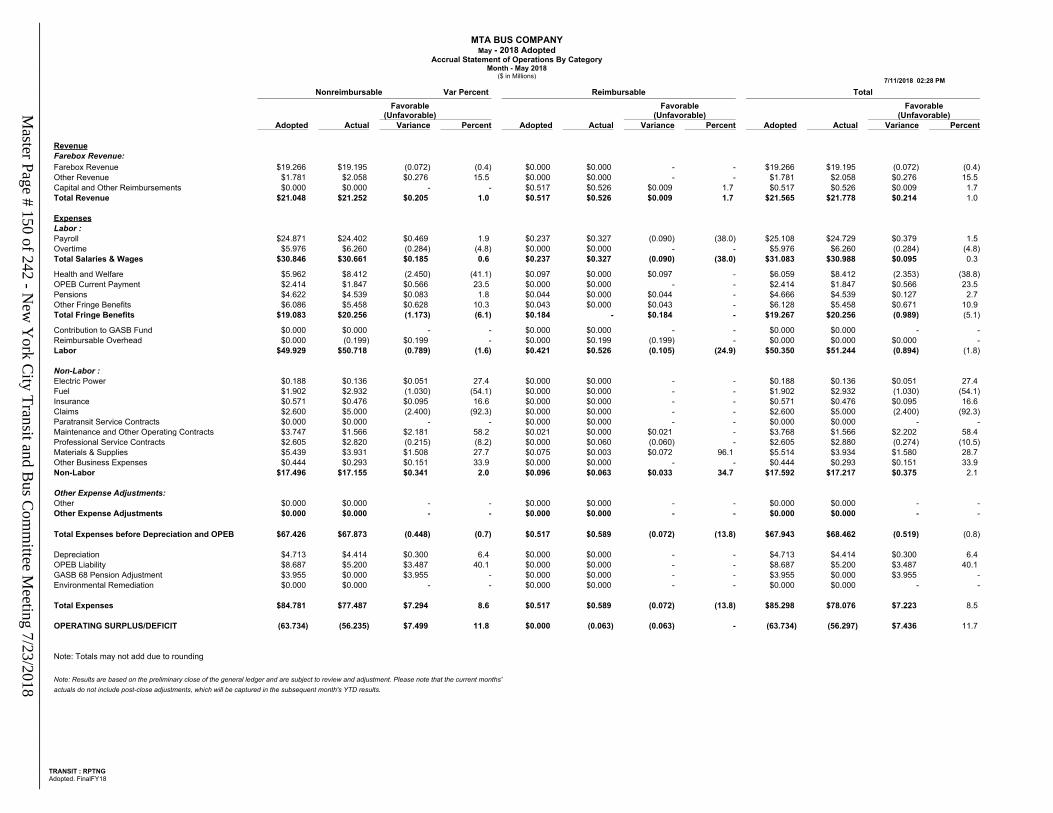
MTA BUS COMPANYMay - 2018 Adopted
Accrual Statement of Operations By CategoryMonth - May 2018
($ in Millions)7/11/2018 02:28 PM
TRANSIT : RPTNGAdopted. FinalFY18
Nonreimbursable Var Percent Reimbursable TotalFavorable
(Unfavorable)Favorable
(Unfavorable)Favorable
(Unfavorable)Adopted Actual Variance Percent Adopted Actual Variance Percent Adopted Actual Variance Percent
RevenueFarebox Revenue:Farebox Revenue $19.266 $19.195 (0.072) (0.4) $0.000 $0.000 - - $19.266 $19.195 (0.072) (0.4)Other Revenue $1.781 $2.058 $0.276 15.5 $0.000 $0.000 - - $1.781 $2.058 $0.276 15.5 Capital and Other Reimbursements $0.000 $0.000 - - $0.517 $0.526 $0.009 1.7 $0.517 $0.526 $0.009 1.7 Total Revenue $21.048 $21.252 $0.205 1.0 $0.517 $0.526 $0.009 1.7 $21.565 $21.778 $0.214 1.0
ExpensesLabor :Payroll $24.871 $24.402 $0.469 1.9 $0.237 $0.327 (0.090) (38.0) $25.108 $24.729 $0.379 1.5 Overtime $5.976 $6.260 (0.284) (4.8) $0.000 $0.000 - - $5.976 $6.260 (0.284) (4.8)Total Salaries & Wages $30.846 $30.661 $0.185 0.6 $0.237 $0.327 (0.090) (38.0) $31.083 $30.988 $0.095 0.3
Health and Welfare $5.962 $8.412 (2.450) (41.1) $0.097 $0.000 $0.097 - $6.059 $8.412 (2.353) (38.8)OPEB Current Payment $2.414 $1.847 $0.566 23.5 $0.000 $0.000 - - $2.414 $1.847 $0.566 23.5 Pensions $4.622 $4.539 $0.083 1.8 $0.044 $0.000 $0.044 - $4.666 $4.539 $0.127 2.7 Other Fringe Benefits $6.086 $5.458 $0.628 10.3 $0.043 $0.000 $0.043 - $6.128 $5.458 $0.671 10.9 Total Fringe Benefits $19.083 $20.256 (1.173) (6.1) $0.184 - $0.184 - $19.267 $20.256 (0.989) (5.1)
Contribution to GASB Fund $0.000 $0.000 - - $0.000 $0.000 - - $0.000 $0.000 - -Reimbursable Overhead $0.000 (0.199) $0.199 - $0.000 $0.199 (0.199) - $0.000 $0.000 $0.000 -Labor $49.929 $50.718 (0.789) (1.6) $0.421 $0.526 (0.105) (24.9) $50.350 $51.244 (0.894) (1.8)
Non-Labor :Electric Power $0.188 $0.136 $0.051 27.4 $0.000 $0.000 - - $0.188 $0.136 $0.051 27.4 Fuel $1.902 $2.932 (1.030) (54.1) $0.000 $0.000 - - $1.902 $2.932 (1.030) (54.1)Insurance $0.571 $0.476 $0.095 16.6 $0.000 $0.000 - - $0.571 $0.476 $0.095 16.6 Claims $2.600 $5.000 (2.400) (92.3) $0.000 $0.000 - - $2.600 $5.000 (2.400) (92.3)Paratransit Service Contracts $0.000 $0.000 - - $0.000 $0.000 - - $0.000 $0.000 - -Maintenance and Other Operating Contracts $3.747 $1.566 $2.181 58.2 $0.021 $0.000 $0.021 - $3.768 $1.566 $2.202 58.4 Professional Service Contracts $2.605 $2.820 (0.215) (8.2) $0.000 $0.060 (0.060) - $2.605 $2.880 (0.274) (10.5)Materials & Supplies $5.439 $3.931 $1.508 27.7 $0.075 $0.003 $0.072 96.1 $5.514 $3.934 $1.580 28.7 Other Business Expenses $0.444 $0.293 $0.151 33.9 $0.000 $0.000 - - $0.444 $0.293 $0.151 33.9 Non-Labor $17.496 $17.155 $0.341 2.0 $0.096 $0.063 $0.033 34.7 $17.592 $17.217 $0.375 2.1
Other Expense Adjustments:Other $0.000 $0.000 - - $0.000 $0.000 - - $0.000 $0.000 - -Other Expense Adjustments $0.000 $0.000 - - $0.000 $0.000 - - $0.000 $0.000 - -
Total Expenses before Depreciation and OPEB $67.426 $67.873 (0.448) (0.7) $0.517 $0.589 (0.072) (13.8) $67.943 $68.462 (0.519) (0.8)
Depreciation $4.713 $4.414 $0.300 6.4 $0.000 $0.000 - - $4.713 $4.414 $0.300 6.4 OPEB Liability $8.687 $5.200 $3.487 40.1 $0.000 $0.000 - - $8.687 $5.200 $3.487 40.1 GASB 68 Pension Adjustment $3.955 $0.000 $3.955 - $0.000 $0.000 - - $3.955 $0.000 $3.955 -Environmental Remediation $0.000 $0.000 - - $0.000 $0.000 - - $0.000 $0.000 - -
Total Expenses $84.781 $77.487 $7.294 8.6 $0.517 $0.589 (0.072) (13.8) $85.298 $78.076 $7.223 8.5
OPERATING SURPLUS/DEFICIT (63.734) (56.235) $7.499 11.8 $0.000 (0.063) (0.063) - (63.734) (56.297) $7.436 11.7
Note: Totals may not add due to rounding
Note: Results are based on the preliminary close of the general ledger and are subject to review and adjustment. Please note that the current months'actuals do not include post-close adjustments, which will be captured in the subsequent month's YTD results.
Master Page # 150 of 242 - N
ew Y
ork City Transit and B
us Com
mittee M
eeting 7/23/2018________________________________________________________________________________
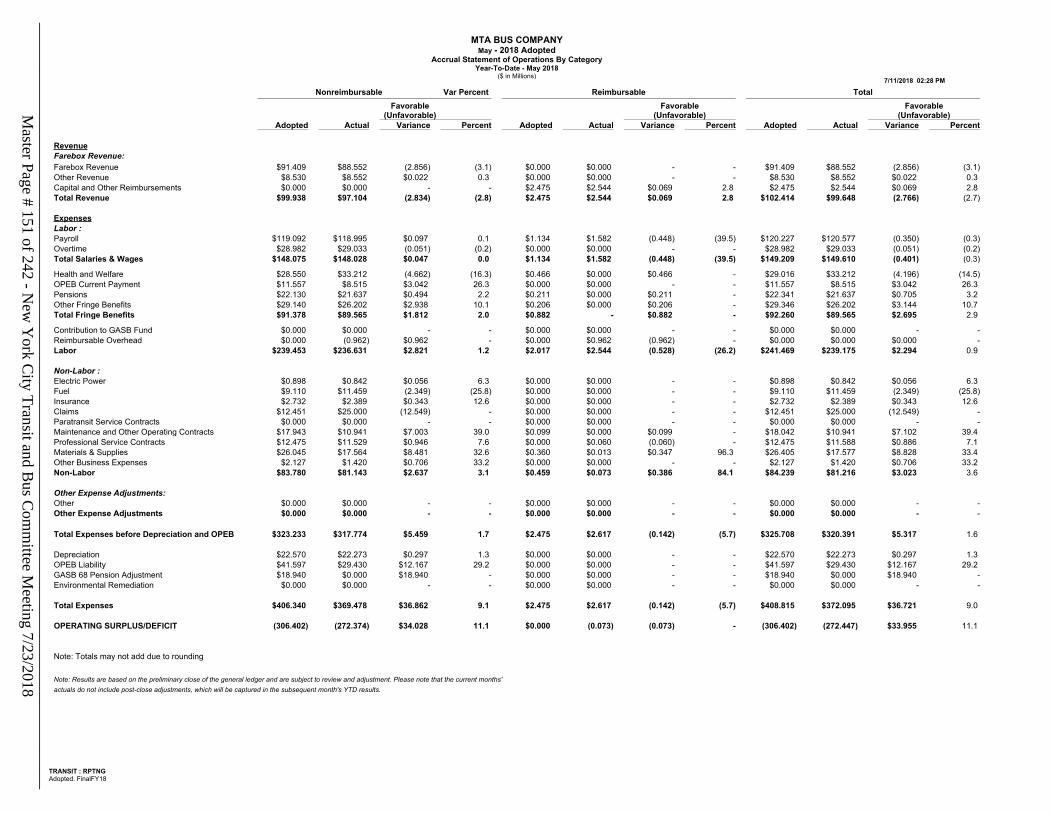
MTA BUS COMPANYMay - 2018 Adopted
Accrual Statement of Operations By CategoryYear-To-Date - May 2018
($ in Millions)7/11/2018 02:28 PM
TRANSIT : RPTNGAdopted. FinalFY18
Nonreimbursable Var Percent Reimbursable TotalFavorable
(Unfavorable)Favorable
(Unfavorable)Favorable
(Unfavorable)Adopted Actual Variance Percent Adopted Actual Variance Percent Adopted Actual Variance Percent
RevenueFarebox Revenue:Farebox Revenue $91.409 $88.552 (2.856) (3.1) $0.000 $0.000 - - $91.409 $88.552 (2.856) (3.1)Other Revenue $8.530 $8.552 $0.022 0.3 $0.000 $0.000 - - $8.530 $8.552 $0.022 0.3 Capital and Other Reimbursements $0.000 $0.000 - - $2.475 $2.544 $0.069 2.8 $2.475 $2.544 $0.069 2.8 Total Revenue $99.938 $97.104 (2.834) (2.8) $2.475 $2.544 $0.069 2.8 $102.414 $99.648 (2.766) (2.7)
ExpensesLabor :Payroll $119.092 $118.995 $0.097 0.1 $1.134 $1.582 (0.448) (39.5) $120.227 $120.577 (0.350) (0.3)Overtime $28.982 $29.033 (0.051) (0.2) $0.000 $0.000 - - $28.982 $29.033 (0.051) (0.2)Total Salaries & Wages $148.075 $148.028 $0.047 0.0 $1.134 $1.582 (0.448) (39.5) $149.209 $149.610 (0.401) (0.3)
Health and Welfare $28.550 $33.212 (4.662) (16.3) $0.466 $0.000 $0.466 - $29.016 $33.212 (4.196) (14.5)OPEB Current Payment $11.557 $8.515 $3.042 26.3 $0.000 $0.000 - - $11.557 $8.515 $3.042 26.3 Pensions $22.130 $21.637 $0.494 2.2 $0.211 $0.000 $0.211 - $22.341 $21.637 $0.705 3.2 Other Fringe Benefits $29.140 $26.202 $2.938 10.1 $0.206 $0.000 $0.206 - $29.346 $26.202 $3.144 10.7 Total Fringe Benefits $91.378 $89.565 $1.812 2.0 $0.882 - $0.882 - $92.260 $89.565 $2.695 2.9
Contribution to GASB Fund $0.000 $0.000 - - $0.000 $0.000 - - $0.000 $0.000 - -Reimbursable Overhead $0.000 (0.962) $0.962 - $0.000 $0.962 (0.962) - $0.000 $0.000 $0.000 -Labor $239.453 $236.631 $2.821 1.2 $2.017 $2.544 (0.528) (26.2) $241.469 $239.175 $2.294 0.9
Non-Labor :Electric Power $0.898 $0.842 $0.056 6.3 $0.000 $0.000 - - $0.898 $0.842 $0.056 6.3 Fuel $9.110 $11.459 (2.349) (25.8) $0.000 $0.000 - - $9.110 $11.459 (2.349) (25.8)Insurance $2.732 $2.389 $0.343 12.6 $0.000 $0.000 - - $2.732 $2.389 $0.343 12.6 Claims $12.451 $25.000 (12.549) - $0.000 $0.000 - - $12.451 $25.000 (12.549) -Paratransit Service Contracts $0.000 $0.000 - - $0.000 $0.000 - - $0.000 $0.000 - -Maintenance and Other Operating Contracts $17.943 $10.941 $7.003 39.0 $0.099 $0.000 $0.099 - $18.042 $10.941 $7.102 39.4 Professional Service Contracts $12.475 $11.529 $0.946 7.6 $0.000 $0.060 (0.060) - $12.475 $11.588 $0.886 7.1 Materials & Supplies $26.045 $17.564 $8.481 32.6 $0.360 $0.013 $0.347 96.3 $26.405 $17.577 $8.828 33.4 Other Business Expenses $2.127 $1.420 $0.706 33.2 $0.000 $0.000 - - $2.127 $1.420 $0.706 33.2 Non-Labor $83.780 $81.143 $2.637 3.1 $0.459 $0.073 $0.386 84.1 $84.239 $81.216 $3.023 3.6
Other Expense Adjustments:Other $0.000 $0.000 - - $0.000 $0.000 - - $0.000 $0.000 - -Other Expense Adjustments $0.000 $0.000 - - $0.000 $0.000 - - $0.000 $0.000 - -
Total Expenses before Depreciation and OPEB $323.233 $317.774 $5.459 1.7 $2.475 $2.617 (0.142) (5.7) $325.708 $320.391 $5.317 1.6
Depreciation $22.570 $22.273 $0.297 1.3 $0.000 $0.000 - - $22.570 $22.273 $0.297 1.3 OPEB Liability $41.597 $29.430 $12.167 29.2 $0.000 $0.000 - - $41.597 $29.430 $12.167 29.2 GASB 68 Pension Adjustment $18.940 $0.000 $18.940 - $0.000 $0.000 - - $18.940 $0.000 $18.940 -Environmental Remediation $0.000 $0.000 - - $0.000 $0.000 - - $0.000 $0.000 - -
Total Expenses $406.340 $369.478 $36.862 9.1 $2.475 $2.617 (0.142) (5.7) $408.815 $372.095 $36.721 9.0
OPERATING SURPLUS/DEFICIT (306.402) (272.374) $34.028 11.1 $0.000 (0.073) (0.073) - (306.402) (272.447) $33.955 11.1
Note: Totals may not add due to rounding
Note: Results are based on the preliminary close of the general ledger and are subject to review and adjustment. Please note that the current months'actuals do not include post-close adjustments, which will be captured in the subsequent month's YTD results.
Master Page # 151 of 242 - N
ew Y
ork City Transit and B
us Com
mittee M
eeting 7/23/2018________________________________________________________________________________
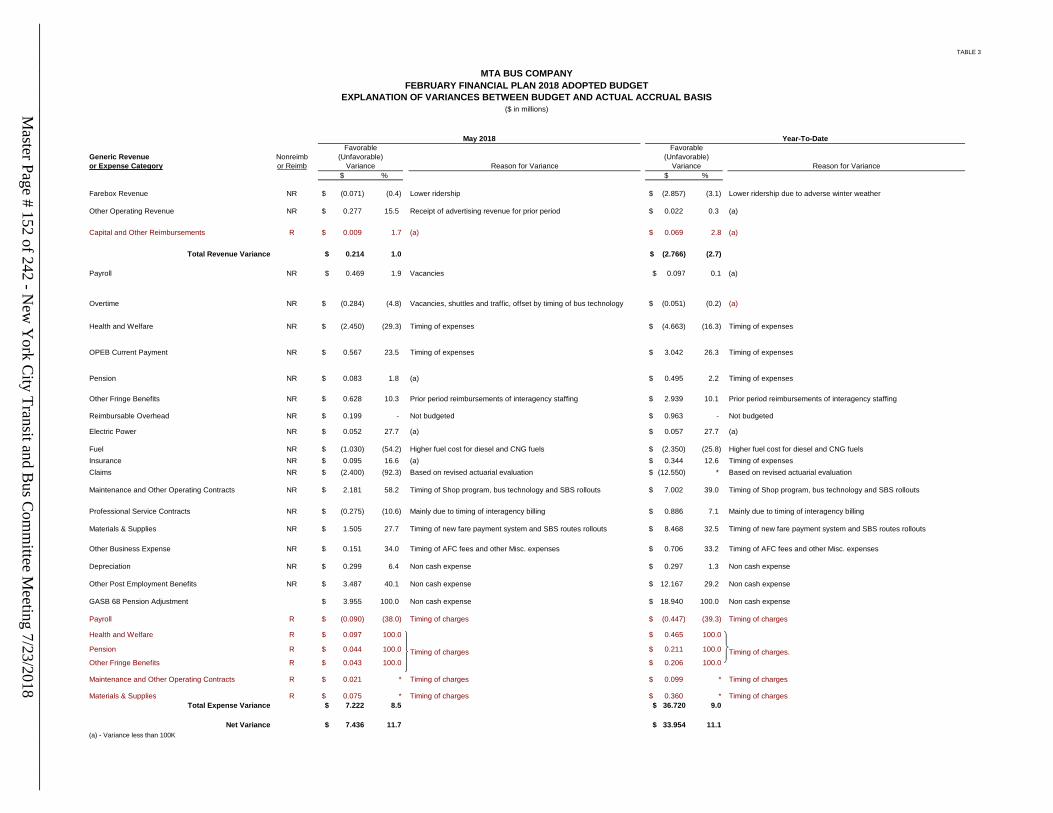
TABLE 3
Favorable Favorable
Generic Revenue Nonreimb (Unfavorable) (Unfavorable)
or Expense Category or Reimb Variance Reason for Variance Variance Reason for Variance
$ % $ %
Farebox Revenue NR (0.071)$ (0.4) Lower ridership (2.857)$ (3.1) Lower ridership due to adverse winter weather
Other Operating Revenue NR 0.277$ 15.5 Receipt of advertising revenue for prior period 0.022$ 0.3 (a)
Capital and Other Reimbursements R 0.009$ 1.7 (a) 0.069$ 2.8 (a)
Total Revenue Variance $ 0.214 1.0 $ (2.766) (2.7)
Payroll NR $ 0.469 1.9 Vacancies $ 0.097 0.1 (a)
Overtime NR (0.284)$ (4.8) Vacancies, shuttles and traffic, offset by timing of bus technology (0.051)$ (0.2) (a)
Health and Welfare NR (2.450)$ (29.3) Timing of expenses (4.663)$ (16.3) Timing of expenses
OPEB Current Payment NR 0.567$ 23.5 Timing of expenses 3.042$ 26.3 Timing of expenses
Pension NR 0.083$ 1.8 (a) 0.495$ 2.2 Timing of expenses
Other Fringe Benefits NR 0.628$ 10.3 Prior period reimbursements of interagency staffing 2.939$ 10.1 Prior period reimbursements of interagency staffing
Reimbursable Overhead NR 0.199$ - Not budgeted 0.963$ - Not budgeted
Electric Power NR 0.052$ 27.7 (a) 0.057$ 27.7 (a)
Fuel NR (1.030)$ (54.2) Higher fuel cost for diesel and CNG fuels (2.350)$ (25.8) Higher fuel cost for diesel and CNG fuels
Insurance NR 0.095$ 16.6 (a) 0.344$ 12.6 Timing of expenses
Claims NR (2.400)$ (92.3) Based on revised actuarial evaluation (12.550)$ * Based on revised actuarial evaluation
Maintenance and Other Operating Contracts NR 2.181$ 58.2 Timing of Shop program, bus technology and SBS rollouts 7.002$ 39.0 Timing of Shop program, bus technology and SBS rollouts
Professional Service Contracts NR (0.275)$ (10.6) Mainly due to timing of interagency billing 0.886$ 7.1 Mainly due to timing of interagency billing
Materials & Supplies NR 1.505$ 27.7 Timing of new fare payment system and SBS routes rollouts 8.468$ 32.5 Timing of new fare payment system and SBS routes rollouts
Other Business Expense NR 0.151$ 34.0 Timing of AFC fees and other Misc. expenses 0.706$ 33.2 Timing of AFC fees and other Misc. expenses
Depreciation NR 0.299$ 6.4 Non cash expense 0.297$ 1.3 Non cash expense
Other Post Employment Benefits NR 3.487$ 40.1 Non cash expense 12.167$ 29.2 Non cash expense
GASB 68 Pension Adjustment 3.955$ 100.0 Non cash expense 18.940$ 100.0 Non cash expense
Payroll R (0.090)$ (38.0) Timing of charges (0.447)$ (39.3) Timing of charges
Health and Welfare R 0.097$ 100.0 0.465$ 100.0
Pension R 0.044$ 100.0 0.211$ 100.0
Other Fringe Benefits R 0.043$ 100.0 0.206$ 100.0
Maintenance and Other Operating Contracts R 0.021$ * Timing of charges 0.099$ * Timing of charges
Materials & Supplies R 0.075$ * Timing of charges 0.360$ * Timing of charges
Total Expense Variance $ 7.222 8.5 $ 36.720 9.0
Net Variance $ 7.436 11.7 $ 33.954 11.1
(a) - Variance less than 100K
MTA BUS COMPANY
($ in millions)
EXPLANATION OF VARIANCES BETWEEN BUDGET AND ACTUAL ACCRUAL BASIS
FEBRUARY FINANCIAL PLAN 2018 ADOPTED BUDGET
Timing of charges.Timing of charges
May 2018 Year-To-Date
Master Page # 152 of 242 - N
ew Y
ork City Transit and B
us Com
mittee M
eeting 7/23/2018________________________________________________________________________________
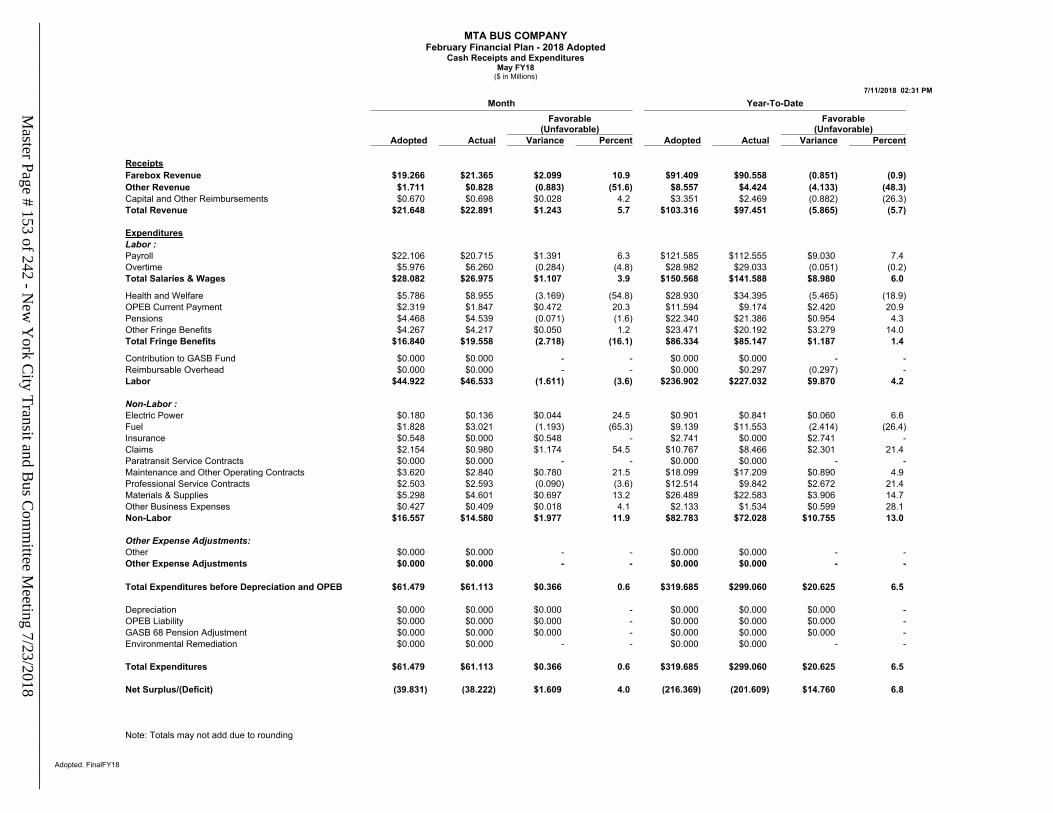
MTA BUS COMPANYFebruary Financial Plan - 2018 Adopted
Cash Receipts and ExpendituresMay FY18
($ in Millions)
7/11/2018 02:31 PM
Adopted. FinalFY18
Month Year-To-DateFavorable
(Unfavorable)Favorable
(Unfavorable)Adopted Actual Variance Percent Adopted Actual Variance Percent
ReceiptsFarebox Revenue $19.266 $21.365 $2.099 10.9 $91.409 $90.558 (0.851) (0.9)Other Revenue $1.711 $0.828 (0.883) (51.6) $8.557 $4.424 (4.133) (48.3)Capital and Other Reimbursements $0.670 $0.698 $0.028 4.2 $3.351 $2.469 (0.882) (26.3)Total Revenue $21.648 $22.891 $1.243 5.7 $103.316 $97.451 (5.865) (5.7)
ExpendituresLabor :Payroll $22.106 $20.715 $1.391 6.3 $121.585 $112.555 $9.030 7.4 Overtime $5.976 $6.260 (0.284) (4.8) $28.982 $29.033 (0.051) (0.2)Total Salaries & Wages $28.082 $26.975 $1.107 3.9 $150.568 $141.588 $8.980 6.0
Health and Welfare $5.786 $8.955 (3.169) (54.8) $28.930 $34.395 (5.465) (18.9)OPEB Current Payment $2.319 $1.847 $0.472 20.3 $11.594 $9.174 $2.420 20.9 Pensions $4.468 $4.539 (0.071) (1.6) $22.340 $21.386 $0.954 4.3 Other Fringe Benefits $4.267 $4.217 $0.050 1.2 $23.471 $20.192 $3.279 14.0 Total Fringe Benefits $16.840 $19.558 (2.718) (16.1) $86.334 $85.147 $1.187 1.4
Contribution to GASB Fund $0.000 $0.000 - - $0.000 $0.000 - -Reimbursable Overhead $0.000 $0.000 - - $0.000 $0.297 (0.297) -Labor $44.922 $46.533 (1.611) (3.6) $236.902 $227.032 $9.870 4.2
Non-Labor :Electric Power $0.180 $0.136 $0.044 24.5 $0.901 $0.841 $0.060 6.6 Fuel $1.828 $3.021 (1.193) (65.3) $9.139 $11.553 (2.414) (26.4)Insurance $0.548 $0.000 $0.548 - $2.741 $0.000 $2.741 -Claims $2.154 $0.980 $1.174 54.5 $10.767 $8.466 $2.301 21.4 Paratransit Service Contracts $0.000 $0.000 - - $0.000 $0.000 - -Maintenance and Other Operating Contracts $3.620 $2.840 $0.780 21.5 $18.099 $17.209 $0.890 4.9 Professional Service Contracts $2.503 $2.593 (0.090) (3.6) $12.514 $9.842 $2.672 21.4 Materials & Supplies $5.298 $4.601 $0.697 13.2 $26.489 $22.583 $3.906 14.7 Other Business Expenses $0.427 $0.409 $0.018 4.1 $2.133 $1.534 $0.599 28.1 Non-Labor $16.557 $14.580 $1.977 11.9 $82.783 $72.028 $10.755 13.0
Other Expense Adjustments:Other $0.000 $0.000 - - $0.000 $0.000 - -Other Expense Adjustments $0.000 $0.000 - - $0.000 $0.000 - -
Total Expenditures before Depreciation and OPEB $61.479 $61.113 $0.366 0.6 $319.685 $299.060 $20.625 6.5
Depreciation $0.000 $0.000 $0.000 - $0.000 $0.000 $0.000 -OPEB Liability $0.000 $0.000 $0.000 - $0.000 $0.000 $0.000 -GASB 68 Pension Adjustment $0.000 $0.000 $0.000 - $0.000 $0.000 $0.000 -Environmental Remediation $0.000 $0.000 - - $0.000 $0.000 - -
Total Expenditures $61.479 $61.113 $0.366 0.6 $319.685 $299.060 $20.625 6.5
Net Surplus/(Deficit) (39.831) (38.222) $1.609 4.0 (216.369) (201.609) $14.760 6.8
Note: Totals may not add due to rounding
Master Page # 153 of 242 - N
ew Y
ork City Transit and B
us Com
mittee M
eeting 7/23/2018________________________________________________________________________________
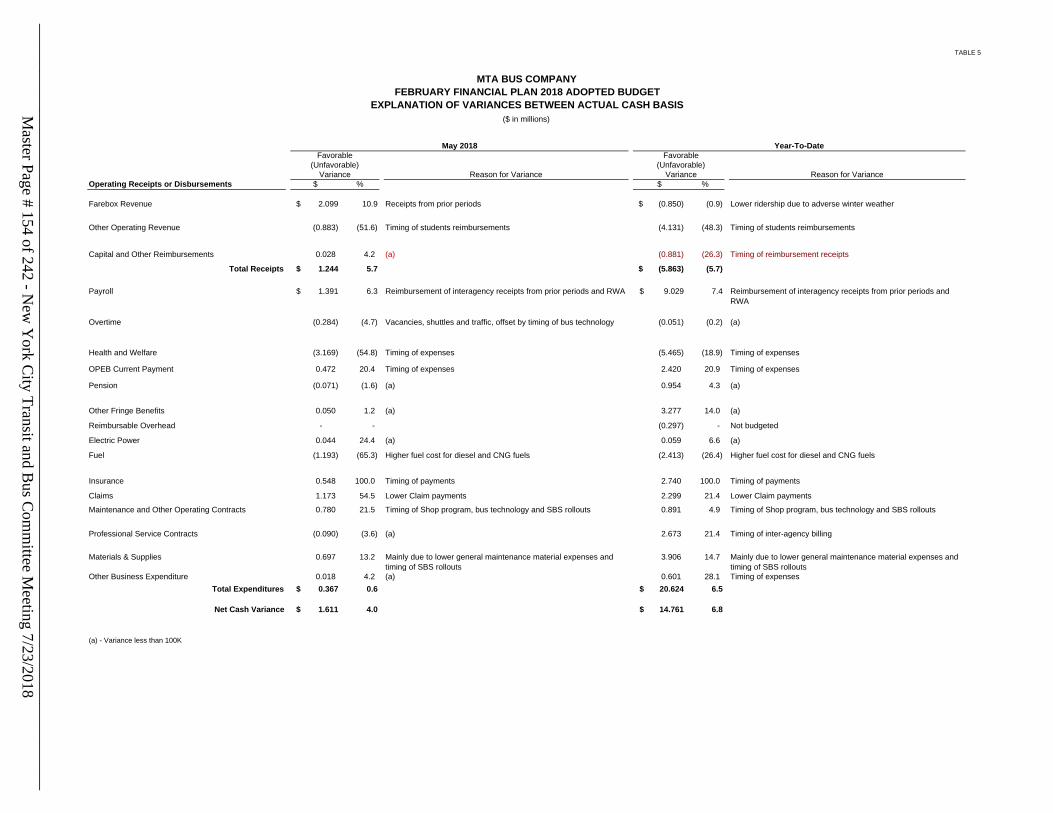
TABLE 5
Favorable Favorable
(Unfavorable) (Unfavorable)
Variance Reason for Variance Variance Reason for Variance
Operating Receipts or Disbursements $ % $ %
Farebox Revenue $ 2.099 10.9 Receipts from prior periods $ (0.850) (0.9) Lower ridership due to adverse winter weather
Other Operating Revenue (0.883) (51.6) Timing of students reimbursements (4.131) (48.3) Timing of students reimbursements
Capital and Other Reimbursements 0.028 4.2 (a) (0.881) (26.3) Timing of reimbursement receipts
Total Receipts $ 1.244 5.7 $ (5.863) (5.7)
Payroll $ 1.391 6.3 Reimbursement of interagency receipts from prior periods and RWA $ 9.029 7.4 Reimbursement of interagency receipts from prior periods and
RWA
Overtime (0.284) (4.7) Vacancies, shuttles and traffic, offset by timing of bus technology (0.051) (0.2) (a)
Health and Welfare (3.169) (54.8) Timing of expenses (5.465) (18.9) Timing of expenses
OPEB Current Payment 0.472 20.4 Timing of expenses 2.420 20.9 Timing of expenses
Pension (0.071) (1.6) (a) 0.954 4.3 (a)
Other Fringe Benefits 0.050 1.2 (a) 3.277 14.0 (a)
Reimbursable Overhead - - (0.297) - Not budgeted
Electric Power 0.044 24.4 (a) 0.059 6.6 (a)
Fuel (1.193) (65.3) Higher fuel cost for diesel and CNG fuels (2.413) (26.4) Higher fuel cost for diesel and CNG fuels
Insurance 0.548 100.0 Timing of payments 2.740 100.0 Timing of payments
Claims 1.173 54.5 Lower Claim payments 2.299 21.4 Lower Claim payments
Maintenance and Other Operating Contracts 0.780 21.5 Timing of Shop program, bus technology and SBS rollouts 0.891 4.9 Timing of Shop program, bus technology and SBS rollouts
Professional Service Contracts (0.090) (3.6) (a) 2.673 21.4 Timing of inter-agency billing
Materials & Supplies 0.697 13.2 Mainly due to lower general maintenance material expenses and
timing of SBS rollouts
3.906 14.7 Mainly due to lower general maintenance material expenses and
timing of SBS rollouts
Other Business Expenditure 0.018 4.2 (a) 0.601 28.1 Timing of expenses
Total Expenditures $ 0.367 0.6 $ 20.624 6.5
Net Cash Variance $ 1.611 4.0 $ 14.761 6.8
(a) - Variance less than 100K
May 2018 Year-To-Date
EXPLANATION OF VARIANCES BETWEEN ACTUAL CASH BASIS
MTA BUS COMPANY
FEBRUARY FINANCIAL PLAN 2018 ADOPTED BUDGET
($ in millions)
Master Page # 154 of 242 - N
ew Y
ork City Transit and B
us Com
mittee M
eeting 7/23/2018________________________________________________________________________________
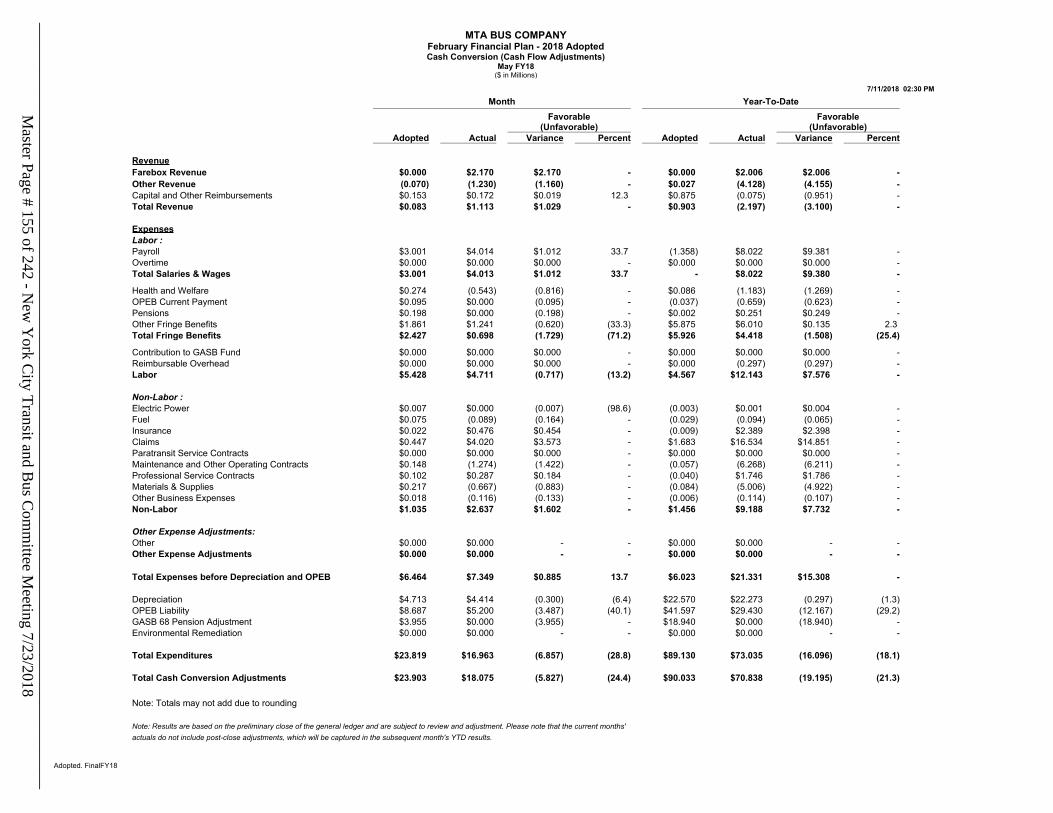
MTA BUS COMPANYFebruary Financial Plan - 2018 AdoptedCash Conversion (Cash Flow Adjustments)
May FY18($ in Millions)
7/11/2018 02:30 PM
Adopted. FinalFY18
Month Year-To-DateFavorable
(Unfavorable)Favorable
(Unfavorable)Adopted Actual Variance Percent Adopted Actual Variance Percent
RevenueFarebox Revenue $0.000 $2.170 $2.170 - $0.000 $2.006 $2.006 -Other Revenue (0.070) (1.230) (1.160) - $0.027 (4.128) (4.155) -Capital and Other Reimbursements $0.153 $0.172 $0.019 12.3 $0.875 (0.075) (0.951) -Total Revenue $0.083 $1.113 $1.029 - $0.903 (2.197) (3.100) -
ExpensesLabor :Payroll $3.001 $4.014 $1.012 33.7 (1.358) $8.022 $9.381 -Overtime $0.000 $0.000 $0.000 - $0.000 $0.000 $0.000 -Total Salaries & Wages $3.001 $4.013 $1.012 33.7 - $8.022 $9.380 -
Health and Welfare $0.274 (0.543) (0.816) - $0.086 (1.183) (1.269) -OPEB Current Payment $0.095 $0.000 (0.095) - (0.037) (0.659) (0.623) -Pensions $0.198 $0.000 (0.198) - $0.002 $0.251 $0.249 -Other Fringe Benefits $1.861 $1.241 (0.620) (33.3) $5.875 $6.010 $0.135 2.3 Total Fringe Benefits $2.427 $0.698 (1.729) (71.2) $5.926 $4.418 (1.508) (25.4)
Contribution to GASB Fund $0.000 $0.000 $0.000 - $0.000 $0.000 $0.000 -Reimbursable Overhead $0.000 $0.000 $0.000 - $0.000 (0.297) (0.297) -Labor $5.428 $4.711 (0.717) (13.2) $4.567 $12.143 $7.576 -
Non-Labor :Electric Power $0.007 $0.000 (0.007) (98.6) (0.003) $0.001 $0.004 -Fuel $0.075 (0.089) (0.164) - (0.029) (0.094) (0.065) -Insurance $0.022 $0.476 $0.454 - (0.009) $2.389 $2.398 -Claims $0.447 $4.020 $3.573 - $1.683 $16.534 $14.851 -Paratransit Service Contracts $0.000 $0.000 $0.000 - $0.000 $0.000 $0.000 -Maintenance and Other Operating Contracts $0.148 (1.274) (1.422) - (0.057) (6.268) (6.211) -Professional Service Contracts $0.102 $0.287 $0.184 - (0.040) $1.746 $1.786 -Materials & Supplies $0.217 (0.667) (0.883) - (0.084) (5.006) (4.922) -Other Business Expenses $0.018 (0.116) (0.133) - (0.006) (0.114) (0.107) -Non-Labor $1.035 $2.637 $1.602 - $1.456 $9.188 $7.732 -
Other Expense Adjustments:Other $0.000 $0.000 - - $0.000 $0.000 - -Other Expense Adjustments $0.000 $0.000 - - $0.000 $0.000 - -
Total Expenses before Depreciation and OPEB $6.464 $7.349 $0.885 13.7 $6.023 $21.331 $15.308 -
Depreciation $4.713 $4.414 (0.300) (6.4) $22.570 $22.273 (0.297) (1.3)OPEB Liability $8.687 $5.200 (3.487) (40.1) $41.597 $29.430 (12.167) (29.2)GASB 68 Pension Adjustment $3.955 $0.000 (3.955) - $18.940 $0.000 (18.940) -Environmental Remediation $0.000 $0.000 - - $0.000 $0.000 - -
Total Expenditures $23.819 $16.963 (6.857) (28.8) $89.130 $73.035 (16.096) (18.1)
Total Cash Conversion Adjustments $23.903 $18.075 (5.827) (24.4) $90.033 $70.838 (19.195) (21.3)
Note: Totals may not add due to rounding
Note: Results are based on the preliminary close of the general ledger and are subject to review and adjustment. Please note that the current months'actuals do not include post-close adjustments, which will be captured in the subsequent month's YTD results.
Master Page # 155 of 242 - N
ew Y
ork City Transit and B
us Com
mittee M
eeting 7/23/2018________________________________________________________________________________
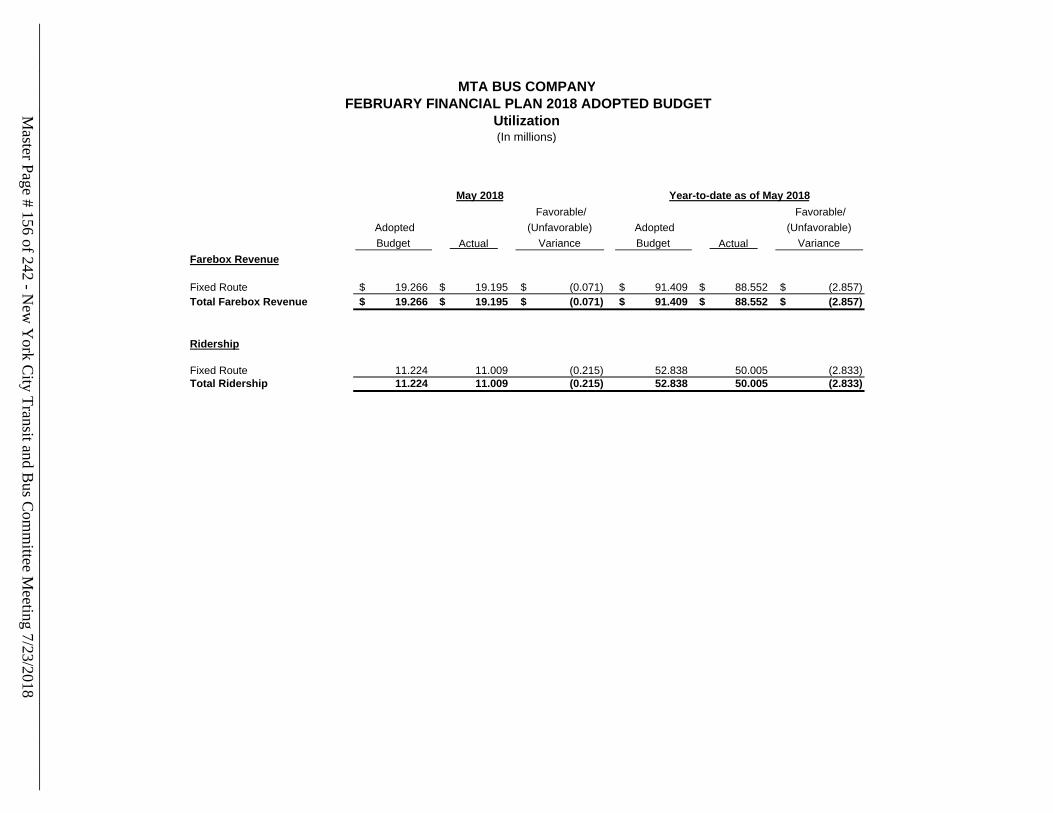
Adopted
Budget Actual
Favorable/
(Unfavorable)
Variance
Adopted
Budget Actual
Favorable/
(Unfavorable)
Variance
Farebox Revenue
Fixed Route 19.266$ 19.195$ (0.071)$ 91.409$ 88.552$ (2.857)$
Total Farebox Revenue 19.266$ 19.195$ (0.071)$ 91.409$ 88.552$ (2.857)$
Ridership
Fixed Route 11.224 11.009 (0.215) 52.838 50.005 (2.833)
Total Ridership 11.224 11.009 (0.215) 52.838 50.005 (2.833)
May 2018 Year-to-date as of May 2018
MTA BUS COMPANY
FEBRUARY FINANCIAL PLAN 2018 ADOPTED BUDGET
Utilization(In millions)
Master Page # 156 of 242 - N
ew Y
ork City Transit and B
us Com
mittee M
eeting 7/23/2018________________________________________________________________________________
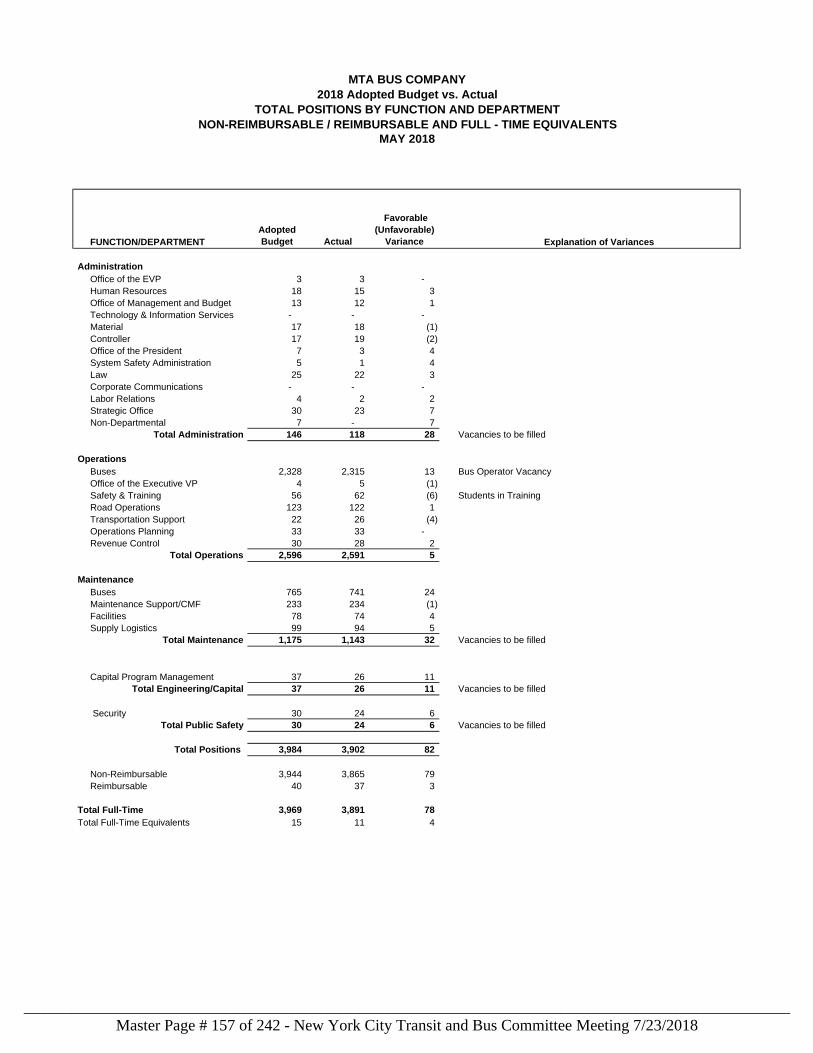
FUNCTION/DEPARTMENT
Adopted
Budget Actual
Favorable
(Unfavorable)
Variance Explanation of Variances
Administration
Office of the EVP 3 3 -
Human Resources 18 15 3
Office of Management and Budget 13 12 1
Technology & Information Services - - -
Material 17 18 (1)
Controller 17 19 (2)
Office of the President 7 3 4
System Safety Administration 5 1 4
Law 25 22 3
Corporate Communications - - -
Labor Relations 4 2 2
Strategic Office 30 23 7
Non-Departmental 7 - 7
Total Administration 146 118 28 Vacancies to be filled
Operations
Buses 2,328 2,315 13 Bus Operator Vacancy
Office of the Executive VP 4 5 (1)
Safety & Training 56 62 (6) Students in Training
Road Operations 123 122 1
Transportation Support 22 26 (4)
Operations Planning 33 33 -
Revenue Control 30 28 2
Total Operations 2,596 2,591 5
Maintenance
Buses 765 741 24
Maintenance Support/CMF 233 234 (1)
Facilities 78 74 4
Supply Logistics 99 94 5
Total Maintenance 1,175 1,143 32 Vacancies to be filled
Capital Program Management 37 26 11
Total Engineering/Capital 37 26 11 Vacancies to be filled
Security 30 24 6
Total Public Safety 30 24 6 Vacancies to be filled
Total Positions 3,984 3,902 82
Non-Reimbursable 3,944 3,865 79
Reimbursable 40 37 3
Total Full-Time 3,969 3,891 78
Total Full-Time Equivalents 15 11 4
MTA BUS COMPANY
2018 Adopted Budget vs. Actual
TOTAL POSITIONS BY FUNCTION AND DEPARTMENT
NON-REIMBURSABLE / REIMBURSABLE AND FULL - TIME EQUIVALENTS
MAY 2018
Master Page # 157 of 242 - New York City Transit and Bus Committee Meeting 7/23/2018________________________________________________________________________________
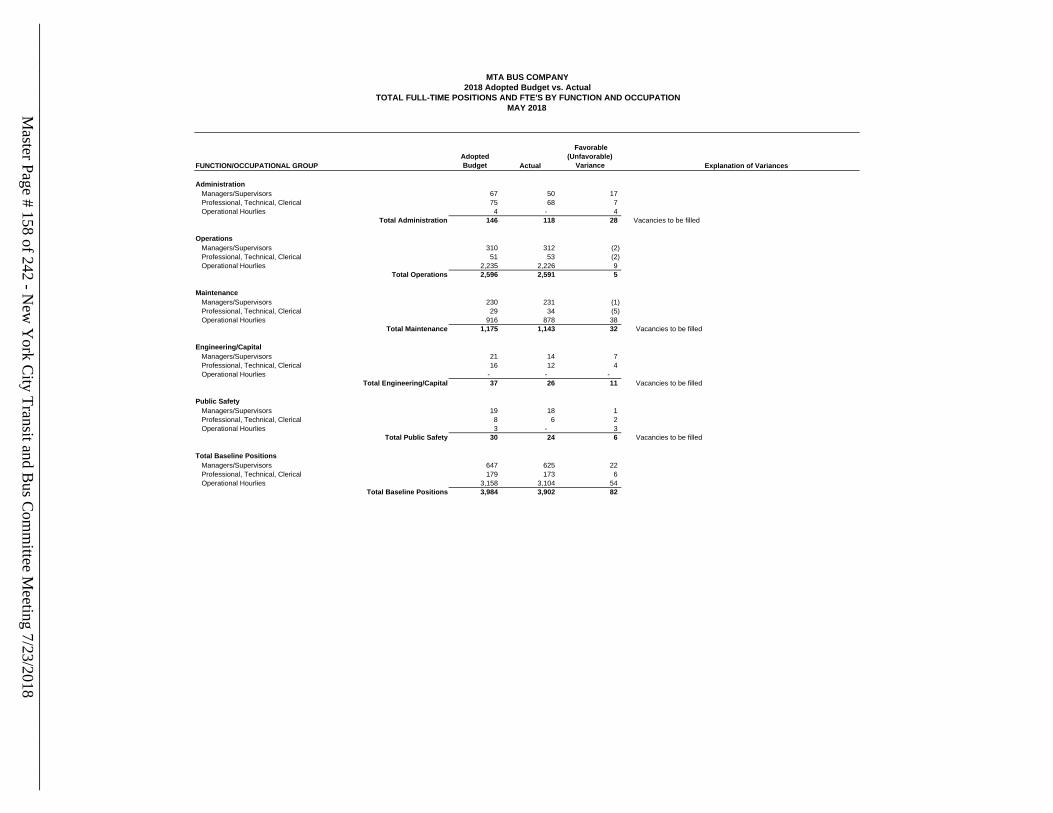
FUNCTION/OCCUPATIONAL GROUP
Adopted
Budget Actual
Favorable
(Unfavorable)
Variance Explanation of Variances
Administration
Managers/Supervisors 67 50 17
Professional, Technical, Clerical 75 68 7
Operational Hourlies 4 - 4
Total Administration 146 118 28 Vacancies to be filled
Operations
Managers/Supervisors 310 312 (2)
Professional, Technical, Clerical 51 53 (2)
Operational Hourlies 2,235 2,226 9
Total Operations 2,596 2,591 5
Maintenance
Managers/Supervisors 230 231 (1)
Professional, Technical, Clerical 29 34 (5)
Operational Hourlies 916 878 38
Total Maintenance 1,175 1,143 32 Vacancies to be filled
Engineering/Capital
Managers/Supervisors 21 14 7
Professional, Technical, Clerical 16 12 4
Operational Hourlies - - -
Total Engineering/Capital 37 26 11 Vacancies to be filled
Public Safety
Managers/Supervisors 19 18 1
Professional, Technical, Clerical 8 6 2
Operational Hourlies 3 - 3
Total Public Safety 30 24 6 Vacancies to be filled
Total Baseline Positions
Managers/Supervisors 647 625 22
Professional, Technical, Clerical 179 173 6
Operational Hourlies 3,158 3,104 54
Total Baseline Positions 3,984 3,902 82
MTA BUS COMPANY
2018 Adopted Budget vs. Actual
TOTAL FULL-TIME POSITIONS AND FTE'S BY FUNCTION AND OCCUPATION
MAY 2018Master Page # 158 of 242 - N
ew Y
ork City Transit and B
us Com
mittee M
eeting 7/23/2018________________________________________________________________________________
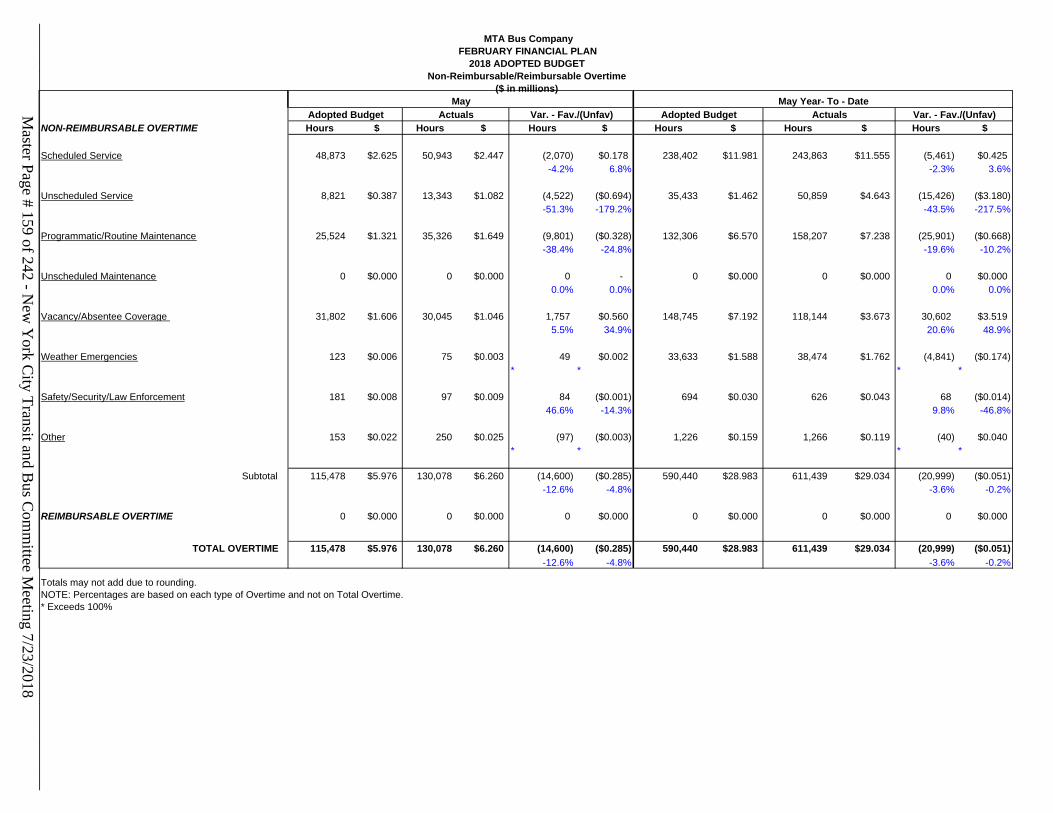
MTA Bus Company
FEBRUARY FINANCIAL PLAN
2018 ADOPTED BUDGET
Non-Reimbursable/Reimbursable Overtime
($ in millions)
NON-REIMBURSABLE OVERTIME Hours $ Hours $ Hours $ Hours $ Hours $ Hours $
Scheduled Service 48,873 $2.625 50,943 $2.447 (2,070) $0.178 238,402 $11.981 243,863 $11.555 (5,461) $0.425
-4.2% 6.8% -2.3% 3.6%
Unscheduled Service 8,821 $0.387 13,343 $1.082 (4,522) ($0.694) 35,433 $1.462 50,859 $4.643 (15,426) ($3.180)
-51.3% -179.2% -43.5% -217.5%
Programmatic/Routine Maintenance 25,524 $1.321 35,326 $1.649 (9,801) ($0.328) 132,306 $6.570 158,207 $7.238 (25,901) ($0.668)
-38.4% -24.8% -19.6% -10.2%
Unscheduled Maintenance 0 $0.000 0 $0.000 0 - 0 $0.000 0 $0.000 0 $0.000
0.0% 0.0% 0.0% 0.0%
Vacancy/Absentee Coverage 31,802 $1.606 30,045 $1.046 1,757 $0.560 148,745 $7.192 118,144 $3.673 30,602 $3.519
5.5% 34.9% 20.6% 48.9%
Weather Emergencies 123 $0.006 75 $0.003 49 $0.002 33,633 $1.588 38,474 $1.762 (4,841) ($0.174)
* * * *
Safety/Security/Law Enforcement 181 $0.008 97 $0.009 84 ($0.001) 694 $0.030 626 $0.043 68 ($0.014)
46.6% -14.3% 9.8% -46.8%
Other 153 $0.022 250 $0.025 (97) ($0.003) 1,226 $0.159 1,266 $0.119 (40) $0.040
$0.035 $0.037 * * $1.777 $1.925 * *
Subtotal 115,478 $5.976 130,078 $6.260 (14,600) ($0.285) 590,440 $28.983 611,439 $29.034 (20,999) ($0.051)
-12.6% -4.8% -3.6% -0.2%
REIMBURSABLE OVERTIME 0 $0.000 0 $0.000 0 $0.000 0 $0.000 0 $0.000 0 $0.000
TOTAL OVERTIME 115,478 $5.976 130,078 $6.260 (14,600) ($0.285) 590,440 $28.983 611,439 $29.034 (20,999) ($0.051)
-12.6% -4.8% -3.6% -0.2%
Totals may not add due to rounding.
NOTE: Percentages are based on each type of Overtime and not on Total Overtime.
* Exceeds 100%
May May Year- To - Date
Adopted Budget Actuals Var. - Fav./(Unfav) Adopted Budget Actuals Var. - Fav./(Unfav)Master Page # 159 of 242 - N
ew Y
ork City Transit and B
us Com
mittee M
eeting 7/23/2018________________________________________________________________________________
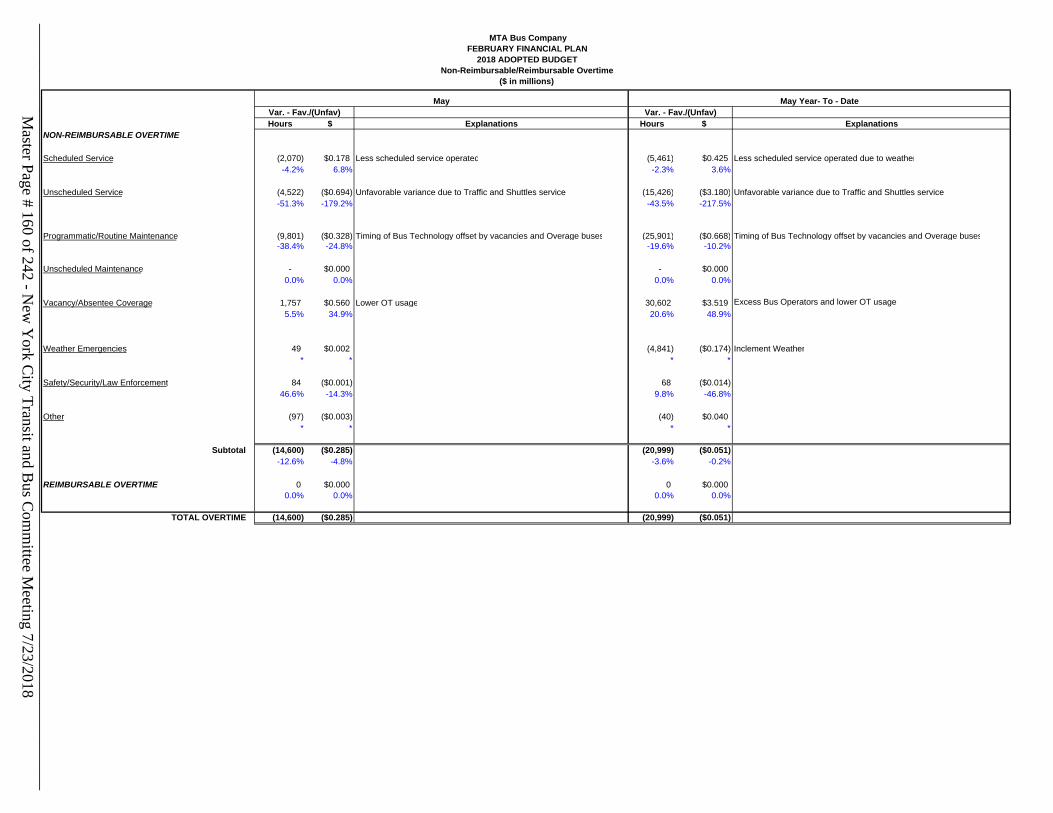
MTA Bus Company
FEBRUARY FINANCIAL PLAN
2018 ADOPTED BUDGET
Non-Reimbursable/Reimbursable Overtime
($ in millions)
Hours $ Explanations Hours $ Explanations
NON-REIMBURSABLE OVERTIME
Scheduled Service (2,070) $0.178 Less scheduled service operated (5,461) $0.425 Less scheduled service operated due to weather
-4.2% 6.8% -2.3% 3.6%
Unscheduled Service (4,522) ($0.694) Unfavorable variance due to Traffic and Shuttles service (15,426) ($3.180) Unfavorable variance due to Traffic and Shuttles service
-51.3% -179.2% -43.5% -217.5%
Programmatic/Routine Maintenance (9,801) ($0.328) Timing of Bus Technology offset by vacancies and Overage buses (25,901) ($0.668) Timing of Bus Technology offset by vacancies and Overage buses
-38.4% -24.8% -19.6% -10.2%
Unscheduled Maintenance - $0.000 - $0.000
0.0% 0.0% 0.0% 0.0%
Vacancy/Absentee Coverage 1,757 $0.560 Lower OT usage 30,602 $3.519 Excess Bus Operators and lower OT usage
5.5% 34.9% 20.6% 48.9%
Weather Emergencies 49 $0.002 (4,841) ($0.174) Inclement Weather
* * * *
Safety/Security/Law Enforcement 84 ($0.001) 68 ($0.014)
46.6% -14.3% 9.8% -46.8%
Other (97) ($0.003) (40) $0.040
* * * *
Subtotal (14,600) ($0.285) (20,999) ($0.051)
-12.6% -4.8% -3.6% -0.2%
REIMBURSABLE OVERTIME 0 $0.000 0 $0.000
0.0% 0.0% 0.0% 0.0%
TOTAL OVERTIME (14,600) ($0.285) (20,999) ($0.051)
May May Year- To - Date
Var. - Fav./(Unfav) Var. - Fav./(Unfav)Master Page # 160 of 242 - N
ew Y
ork City Transit and B
us Com
mittee M
eeting 7/23/2018________________________________________________________________________________
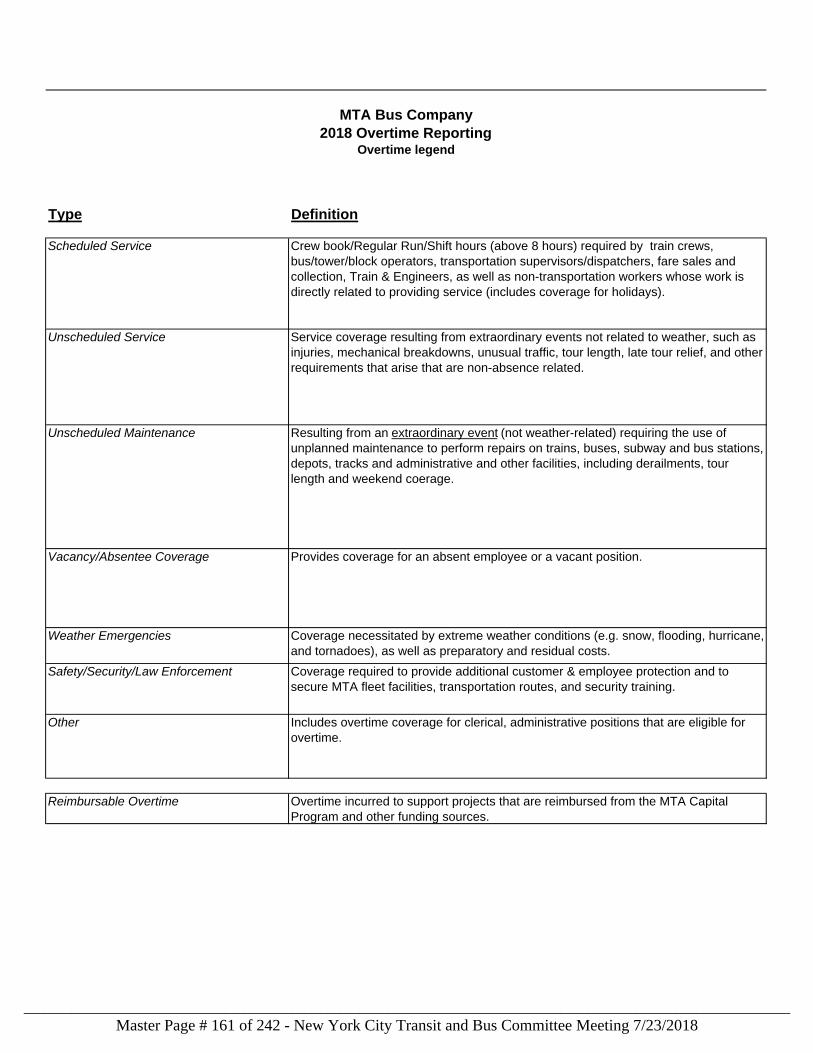
Type Definition
Scheduled Service Crew book/Regular Run/Shift hours (above 8 hours) required by train crews,
bus/tower/block operators, transportation supervisors/dispatchers, fare sales and
collection, Train & Engineers, as well as non-transportation workers whose work is
directly related to providing service (includes coverage for holidays).
Unscheduled Service Service coverage resulting from extraordinary events not related to weather, such as
injuries, mechanical breakdowns, unusual traffic, tour length, late tour relief, and other
requirements that arise that are non-absence related.
Unscheduled Maintenance Resulting from an extraordinary event (not weather-related) requiring the use of
unplanned maintenance to perform repairs on trains, buses, subway and bus stations,
depots, tracks and administrative and other facilities, including derailments, tour
length and weekend coerage.
Vacancy/Absentee Coverage Provides coverage for an absent employee or a vacant position.
Weather Emergencies Coverage necessitated by extreme weather conditions (e.g. snow, flooding, hurricane,
and tornadoes), as well as preparatory and residual costs.
Safety/Security/Law Enforcement Coverage required to provide additional customer & employee protection and to
secure MTA fleet facilities, transportation routes, and security training.
Other Includes overtime coverage for clerical, administrative positions that are eligible for
overtime.
Reimbursable Overtime Overtime incurred to support projects that are reimbursed from the MTA Capital
Program and other funding sources.
MTA Bus Company
2018 Overtime ReportingOvertime legend
Master Page # 161 of 242 - New York City Transit and Bus Committee Meeting 7/23/2018________________________________________________________________________________
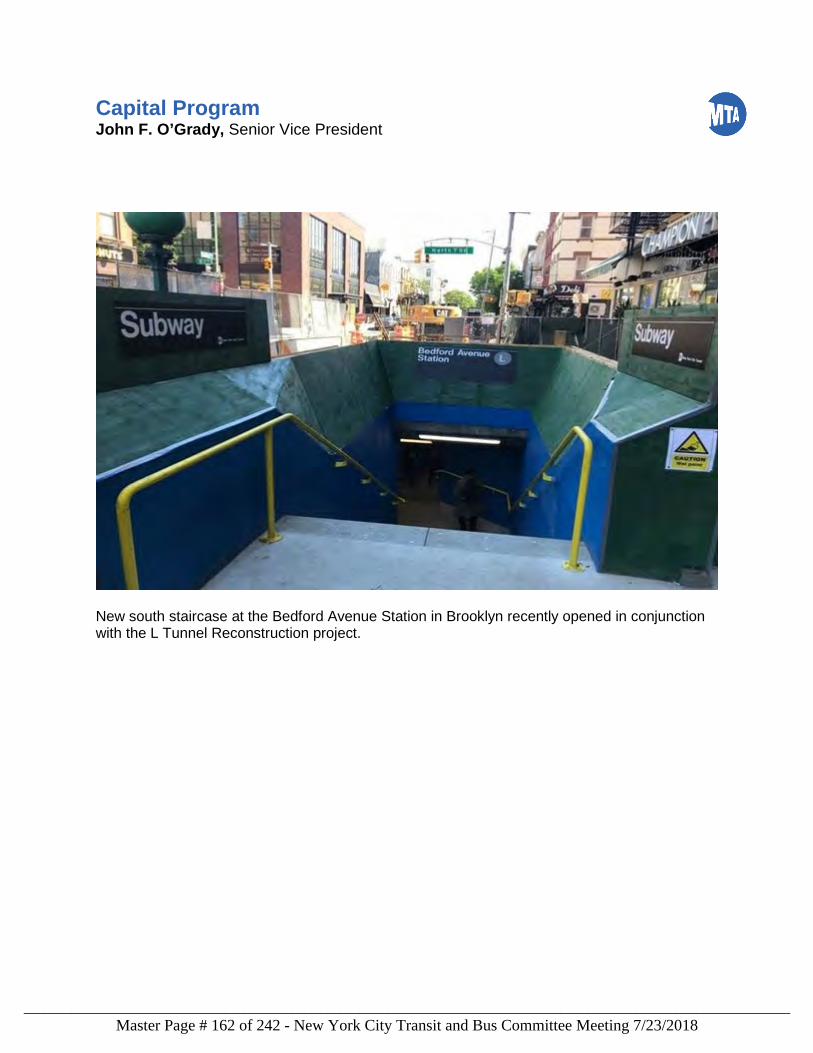
Capital Program John F. O’Grady, Senior Vice President
New south staircase at the Bedford Avenue Station in Brooklyn recently opened in conjunction with the L Tunnel Reconstruction project.
Master Page # 162 of 242 - New York City Transit and Bus Committee Meeting 7/23/2018________________________________________________________________________________
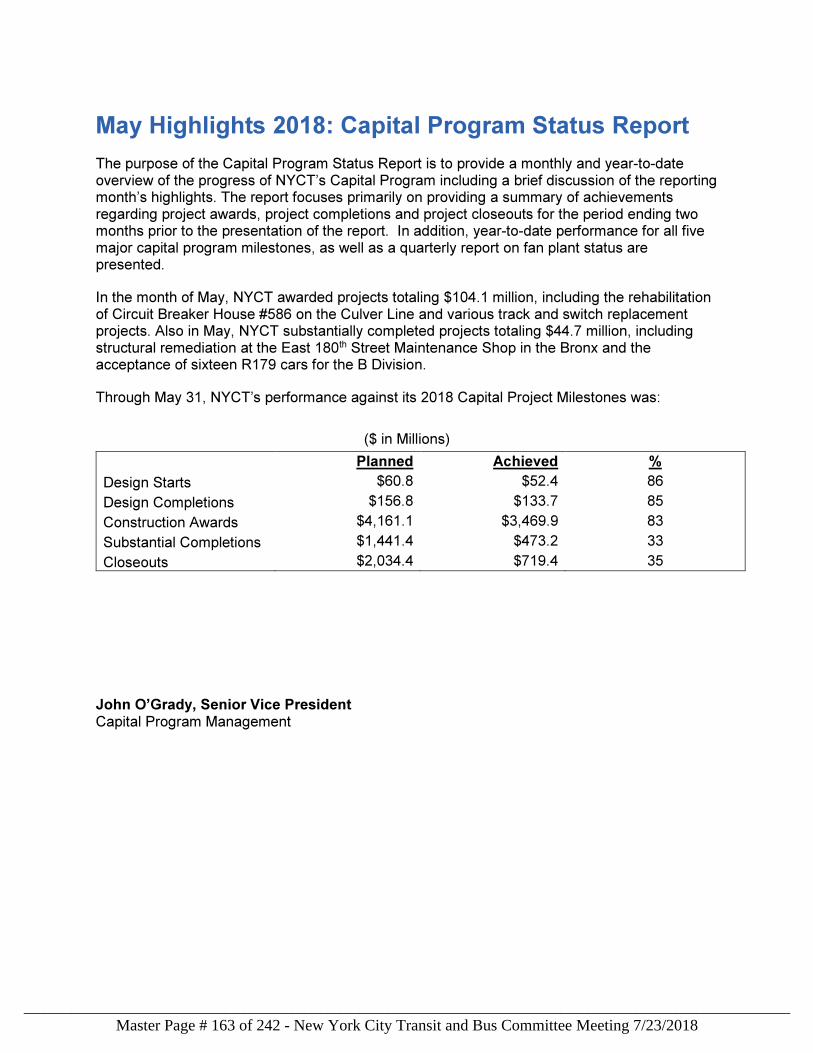
May Highlights 2018: Capital Program Status Report
The purpose of the Capital Program Status Report is to provide a monthly and year-to-date overview of the progress of NYCT’s Capital Program including a brief discussion of the reporting month’s highlights. The report focuses primarily on providing a summary of achievements regarding project awards, project completions and project closeouts for the period ending two months prior to the presentation of the report. In addition, year-to-date performance for all five major capital program milestones, as well as a quarterly report on fan plant status are presented.
In the month of May, NYCT awarded projects totaling $104.1 million, including the rehabilitation of Circuit Breaker House #586 on the Culver Line and various track and switch replacement projects. Also in May, NYCT substantially completed projects totaling $44.7 million, including structural remediation at the East 180th Street Maintenance Shop in the Bronx and the acceptance of sixteen R179 cars for the B Division.
Through May 31, NYCT’s performance against its 2018 Capital Project Milestones was:
($ in Millions)
Planned Achieved %
Design Starts $60.8 $52.4 86
Design Completions $156.8 $133.7 85
Construction Awards $4,161.1 $3,469.9 83
Substantial Completions $1,441.4 $473.2 33
Closeouts $2,034.4 $719.4 35
John O’Grady, Senior Vice President Capital Program Management
Master Page # 163 of 242 - New York City Transit and Bus Committee Meeting 7/23/2018________________________________________________________________________________
Capital Program Status July 2018
As of May 2018:
NYCT awarded $104.1 million in projects, including the rehabilitation of Circuit Breaker House (CBH) #586 on the Culver Line for $12.7 million. The existing CBH will be demolished and a new CBH will be built with all associated equipment, including circuit breakers, lighting, communications equipment, battery cable and control cable. Rehabilitating the CBH will help maintain power equalization on the line and will allow for the isolation of power in sections of track during emergency and maintenance situations. Also, NYCT awarded several track and switch replacement projects for $47.5 million. Construction has begun for the replacement of mainline track on the 6th Avenue-Culver Line, the West End Line and the Lenox-White Plains Road Line and for the replacement of mainline switches on the White Plains Road Line. NYCT substantially completed projects totaling $44.7 million, including structural remediation at the East 180th Street Maintenance Shop in the Bronx for $4.5 million. The project made structural repairs to various building elements, including the retaining wall/corridor and the walkway. These repairs will ensure that the existing facility can continue to provide the services needed to maintain and prolong the useful life of the subway car fleet. NYCT also completed the acceptance of sixteen R179 cars for the B Division for $39.5 million. Through the end of May, 48 cars have been accepted, 76 have been delivered out of a total of 300 cars in the contract. The procurement of these cars will allow for the retirement of 272 R32 and R42 cars, and provide a modern fleet with improved customer amenities and operational and performance efficiencies to the B Division.
In addition, NYCT started 8 design projects for $5.4 million, completed 10 design projects for $13.4 million and closed out 16 projects for $194.6 million.
Master Page # 164 of 242 - New York City Transit and Bus Committee Meeting 7/23/2018________________________________________________________________________________
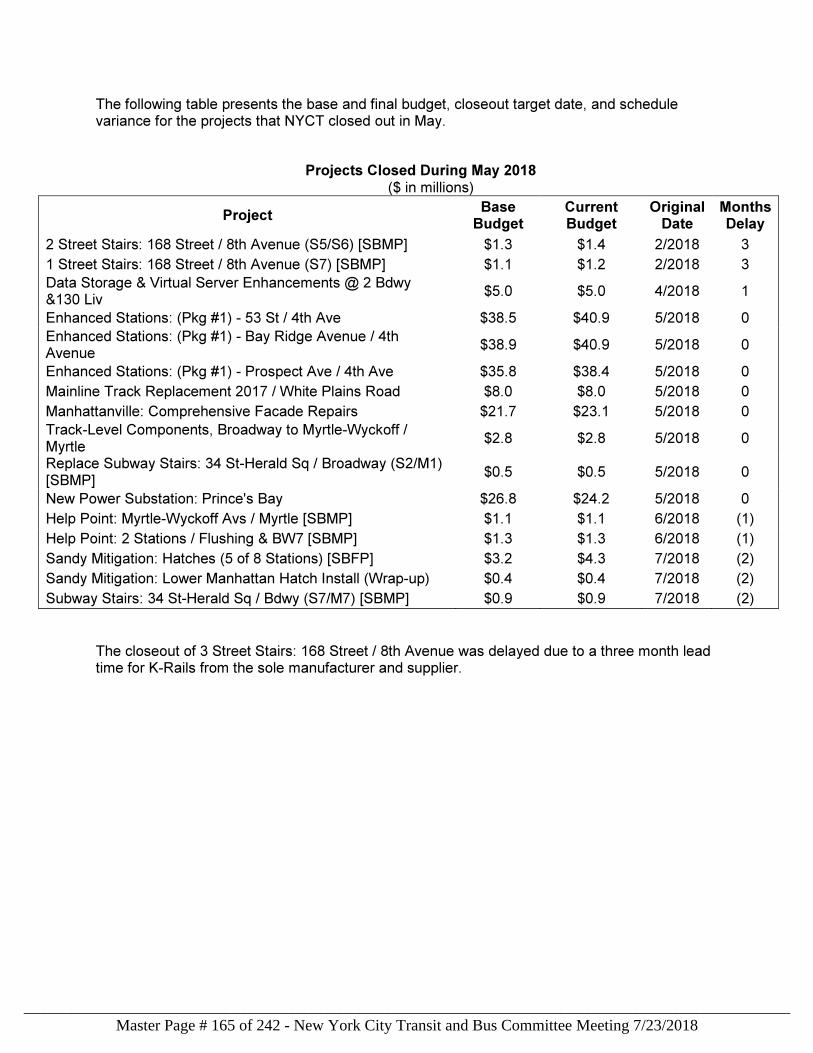
The following table presents the base and final budget, closeout target date, and schedule variance for the projects that NYCT closed out in May.
Projects Closed During May 2018 ($ in millions)
Project Base Budget
Current Budget
Original Date
Months Delay
2 Street Stairs: 168 Street / 8th Avenue (S5/S6) [SBMP] $1.3 $1.4 2/2018 3
1 Street Stairs: 168 Street / 8th Avenue (S7) [SBMP] $1.1 $1.2 2/2018 3
Data Storage & Virtual Server Enhancements @ 2 Bdwy &130 Liv
$5.0 $5.0 4/2018 1
Enhanced Stations: (Pkg #1) - 53 St / 4th Ave $38.5 $40.9 5/2018 0
Enhanced Stations: (Pkg #1) - Bay Ridge Avenue / 4th Avenue
$38.9 $40.9 5/2018 0
Enhanced Stations: (Pkg #1) - Prospect Ave / 4th Ave $35.8 $38.4 5/2018 0
Mainline Track Replacement 2017 / White Plains Road $8.0 $8.0 5/2018 0
Manhattanville: Comprehensive Facade Repairs $21.7 $23.1 5/2018 0
Track-Level Components, Broadway to Myrtle-Wyckoff / Myrtle
$2.8 $2.8 5/2018 0
Replace Subway Stairs: 34 St-Herald Sq / Broadway (S2/M1) [SBMP]
$0.5 $0.5 5/2018 0
New Power Substation: Prince's Bay $26.8 $24.2 5/2018 0
Help Point: Myrtle-Wyckoff Avs / Myrtle [SBMP] $1.1 $1.1 6/2018 (1)
Help Point: 2 Stations / Flushing & BW7 [SBMP] $1.3 $1.3 6/2018 (1)
Sandy Mitigation: Hatches (5 of 8 Stations) [SBFP] $3.2 $4.3 7/2018 (2)
Sandy Mitigation: Lower Manhattan Hatch Install (Wrap-up) $0.4 $0.4 7/2018 (2)
Subway Stairs: 34 St-Herald Sq / Bdwy (S7/M7) [SBMP] $0.9 $0.9 7/2018 (2)
The closeout of 3 Street Stairs: 168 Street / 8th Avenue was delayed due to a three month lead time for K-Rails from the sole manufacturer and supplier.
Master Page # 165 of 242 - New York City Transit and Bus Committee Meeting 7/23/2018________________________________________________________________________________
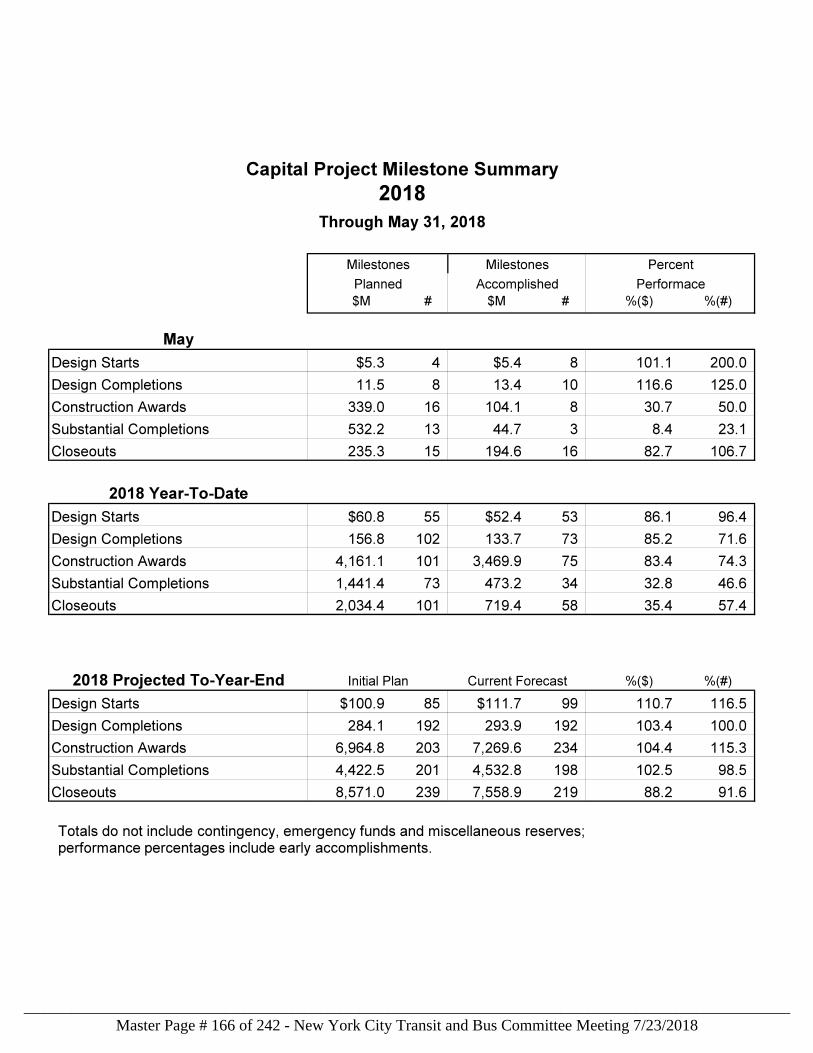
Capital Project Milestone Summary
2018
Through May 31, 2018
Milestones Milestones Percent
Planned Accomplished Performace
$M # $M # %($) %(#)
May
Design Starts $5.3 4 $5.4 8 101.1 200.0
Design Completions 11.5 8 13.4 10 116.6 125.0
Construction Awards 339.0 16 104.1 8 30.7 50.0
Substantial Completions 532.2 13 44.7 3 8.4 23.1
Closeouts 235.3 15 194.6 16 82.7 106.7
2018 Year-To-Date
Design Starts $60.8 55 $52.4 53 86.1 96.4
Design Completions 156.8 102 133.7 73 85.2 71.6
Construction Awards 4,161.1 101 3,469.9 75 83.4 74.3
Substantial Completions 1,441.4 73 473.2 34 32.8 46.6
Closeouts 2,034.4 101 719.4 58 35.4 57.4
2018 Projected To-Year-End Initial Plan Current Forecast %($) %(#)
Design Starts $100.9 85 $111.7 99 110.7 116.5
Design Completions 284.1 192 293.9 192 103.4 100.0
Construction Awards 6,964.8 203 7,269.6 234 104.4 115.3
Substantial Completions 4,422.5 201 4,532.8 198 102.5 98.5
Closeouts 8,571.0 239 7,558.9 219 88.2 91.6
Totals do not include contingency, emergency funds and miscellaneous reserves;performance percentages include early accomplishments.
Master Page # 166 of 242 - New York City Transit and Bus Committee Meeting 7/23/2018________________________________________________________________________________
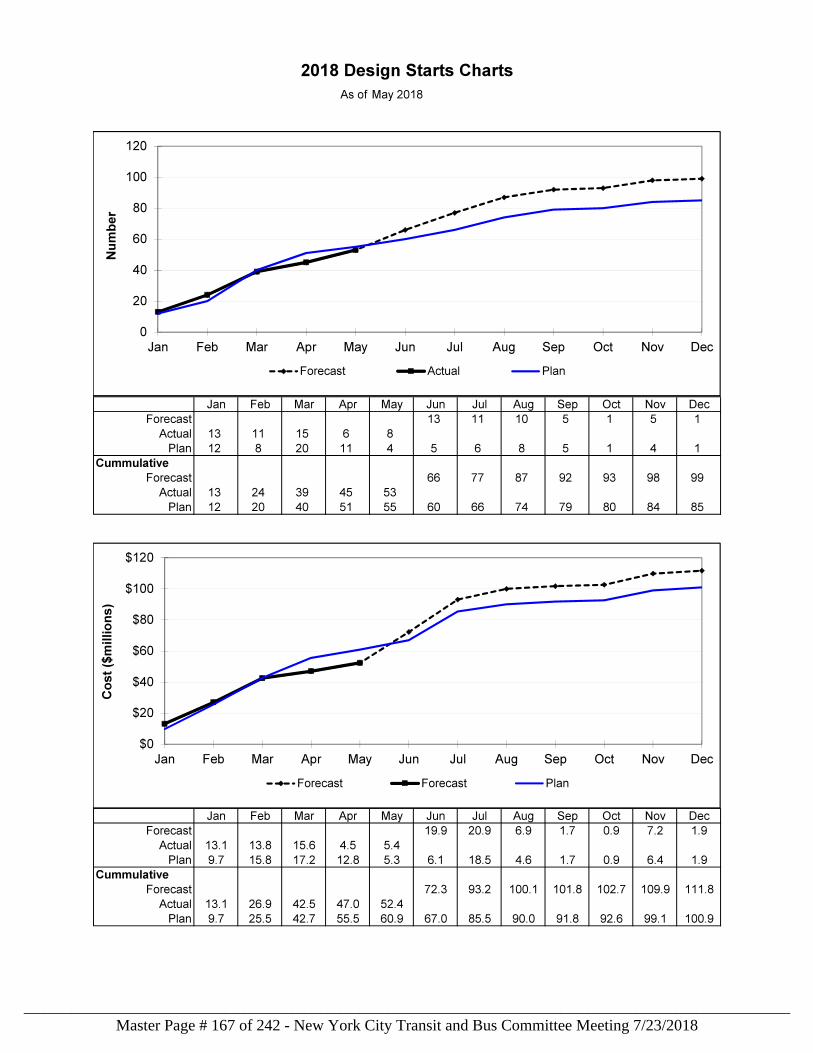
2018 Design Starts Charts
As of
Jan Feb Mar Apr May Jun Jul Aug Sep Oct Nov Dec
Forecast 0 0 0 0 0 13 11 10 5 1 5 1
Actual 13 11 15 6 8 0 0 0 0 0 0 0
Plan 12 8 20 11 4 5 6 8 5 1 4 1
Cummulative
Forecast 13 24 39 45 53 66 77 87 92 93 98 99
Actual 13 24 39 45 53
Plan 12 20 40 51 55 60 66 74 79 80 84 85
Jan Feb Mar Apr May Jun Jul Aug Sep Oct Nov Dec
Forecast 0.0 0.0 0.0 0.0 0.0 19.9 20.9 6.9 1.7 0.9 7.2 1.9
Actual 13.1 13.8 15.6 4.5 5.4 0.0 0.0 0.0 0.0 0.0 0.0 0.0
Plan 9.7 15.8 17.2 12.8 5.3 6.1 18.5 4.6 1.7 0.9 6.4 1.9
Cummulative
Forecast 13.1 26.9 42.5 47.0 52.4 72.3 93.2 100.1 101.8 102.7 109.9 111.8
Actual 13.1 26.9 42.5 47.0 52.4
Plan 9.7 25.5 42.7 55.5 60.9 67.0 85.5 90.0 91.8 92.6 99.1 100.9
May 2018
$0
$20
$40
$60
$80
$100
$120
Jan Feb Mar Apr May Jun Jul Aug Sep Oct Nov Dec
Co
st
($m
illi
on
s)
Forecast Forecast Plan
0
20
40
60
80
100
120
Jan Feb Mar Apr May Jun Jul Aug Sep Oct Nov Dec
Nu
mb
er
Forecast Actual Plan
Master Page # 167 of 242 - New York City Transit and Bus Committee Meeting 7/23/2018________________________________________________________________________________
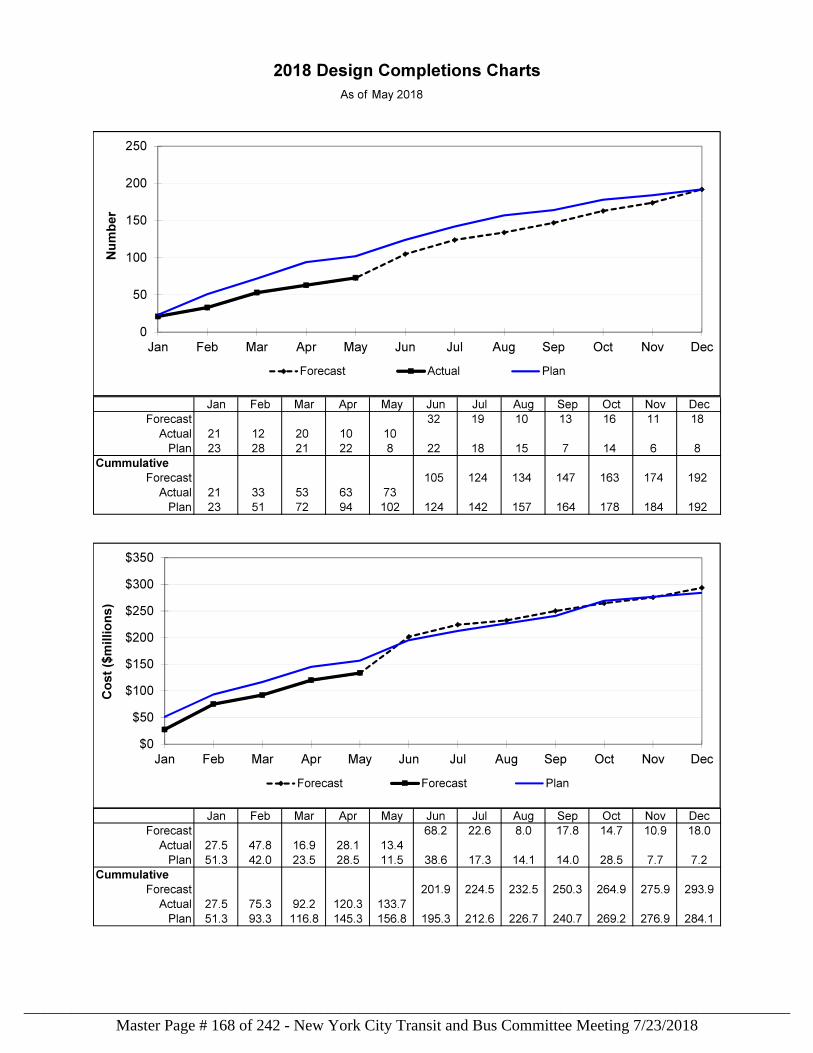
2018 Design Completions Charts
As of
Jan Feb Mar Apr May Jun Jul Aug Sep Oct Nov Dec
Forecast 0 0 0 0 0 32 19 10 13 16 11 18
Actual 21 12 20 10 10 0 0 0 0 0 0 0
Plan 23 28 21 22 8 22 18 15 7 14 6 8
Cummulative
Forecast 21 33 53 63 73 105 124 134 147 163 174 192
Actual 21 33 53 63 73
Plan 23 51 72 94 102 124 142 157 164 178 184 192
Jan Feb Mar Apr May Jun Jul Aug Sep Oct Nov Dec
Forecast 0.0 0.0 0.0 0.0 0.0 68.2 22.6 8.0 17.8 14.7 10.9 18.0
Actual 27.5 47.8 16.9 28.1 13.4 0.0 0.0 0.0 0.0 0.0 0.0 0.0
Plan 51.3 42.0 23.5 28.5 11.5 38.6 17.3 14.1 14.0 28.5 7.7 7.2
Cummulative
Forecast 27.5 75.3 92.2 120.3 133.7 201.9 224.5 232.5 250.3 264.9 275.9 293.9
Actual 27.5 75.3 92.2 120.3 133.7
Plan 51.3 93.3 116.8 145.3 156.8 195.3 212.6 226.7 240.7 269.2 276.9 284.1
May 2018
$0
$50
$100
$150
$200
$250
$300
$350
Jan Feb Mar Apr May Jun Jul Aug Sep Oct Nov Dec
Co
st
($m
illi
on
s)
Forecast Forecast Plan
0
50
100
150
200
250
Jan Feb Mar Apr May Jun Jul Aug Sep Oct Nov Dec
Nu
mb
er
Forecast Actual Plan
Master Page # 168 of 242 - New York City Transit and Bus Committee Meeting 7/23/2018________________________________________________________________________________
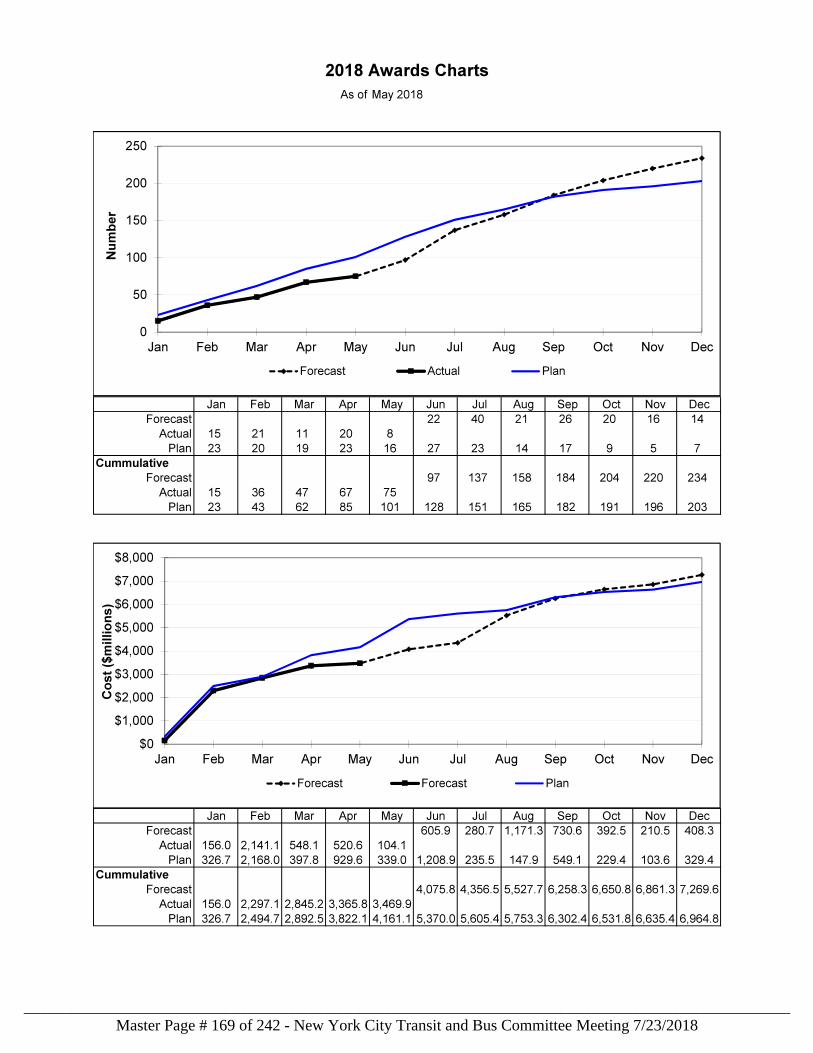
2018 Awards Charts
As of
Jan Feb Mar Apr May Jun Jul Aug Sep Oct Nov Dec
Forecast 0 0 0 0 0 22 40 21 26 20 16 14
Actual 15 21 11 20 8 0 0 0 0 0 0 0
Plan 23 20 19 23 16 27 23 14 17 9 5 7
Cummulative
Forecast 15 36 47 67 75 97 137 158 184 204 220 234
Actual 15 36 47 67 75
Plan 23 43 62 85 101 128 151 165 182 191 196 203
Jan Feb Mar Apr May Jun Jul Aug Sep Oct Nov Dec
Forecast 0.0 0.0 0.0 0.0 0.0 605.9 280.7 1,171.3 730.6 392.5 210.5 408.3
Actual 156.0 2,141.1 548.1 520.6 104.1 0.0 0.0 0.0 0.0 0.0 0.0 0.0
Plan 326.7 2,168.0 397.8 929.6 339.0 1,208.9 235.5 147.9 549.1 229.4 103.6 329.4
Cummulative
Forecast 156.0 2,297.1 2,845.2 3,365.8 3,469.9 4,075.8 4,356.5 5,527.7 6,258.3 6,650.8 6,861.3 7,269.6
Actual 156.0 2,297.1 2,845.2 3,365.8 3,469.9
Plan 326.7 2,494.7 2,892.5 3,822.1 4,161.1 5,370.0 5,605.4 5,753.3 6,302.4 6,531.8 6,635.4 6,964.8
May 2018
$0
$1,000
$2,000
$3,000
$4,000
$5,000
$6,000
$7,000
$8,000
Jan Feb Mar Apr May Jun Jul Aug Sep Oct Nov Dec
Co
st
($m
illi
on
s)
Forecast Forecast Plan
0
50
100
150
200
250
Jan Feb Mar Apr May Jun Jul Aug Sep Oct Nov Dec
Nu
mb
er
Forecast Actual Plan
Master Page # 169 of 242 - New York City Transit and Bus Committee Meeting 7/23/2018________________________________________________________________________________
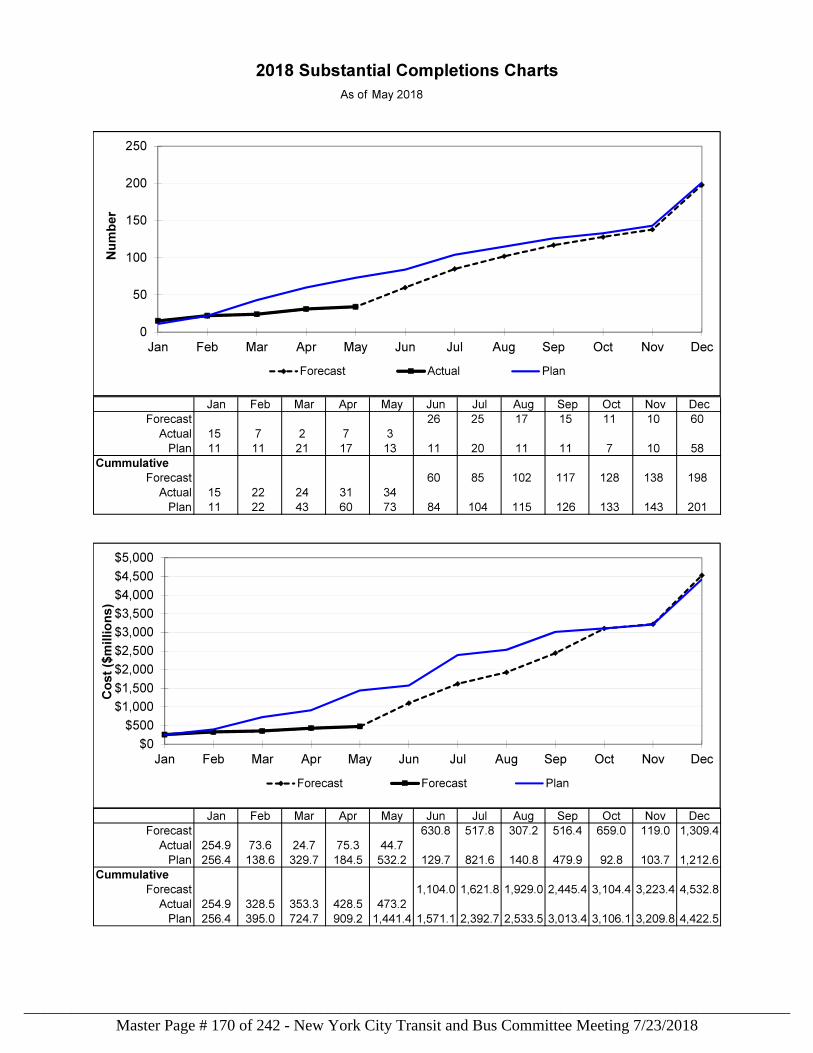
2018 Substantial Completions Charts
As of
Jan Feb Mar Apr May Jun Jul Aug Sep Oct Nov Dec
Forecast 0 0 0 0 0 26 25 17 15 11 10 60
Actual 15 7 2 7 3 0 0 0 0 0 0 0
Plan 11 11 21 17 13 11 20 11 11 7 10 58
Cummulative
Forecast 15 22 24 31 34 60 85 102 117 128 138 198
Actual 15 22 24 31 34
Plan 11 22 43 60 73 84 104 115 126 133 143 201
Jan Feb Mar Apr May Jun Jul Aug Sep Oct Nov Dec
Forecast 0.0 0.0 0.0 0.0 0.0 630.8 517.8 307.2 516.4 659.0 119.0 1,309.4
Actual 254.9 73.6 24.7 75.3 44.7 0.0 0.0 0.0 0.0 0.0 0.0 0.0
Plan 256.4 138.6 329.7 184.5 532.2 129.7 821.6 140.8 479.9 92.8 103.7 1,212.6
Cummulative
Forecast 254.9 328.5 353.3 428.5 473.2 1,104.0 1,621.8 1,929.0 2,445.4 3,104.4 3,223.4 4,532.8
Actual 254.9 328.5 353.3 428.5 473.2
Plan 256.4 395.0 724.7 909.2 1,441.4 1,571.1 2,392.7 2,533.5 3,013.4 3,106.1 3,209.8 4,422.5
May 2018
$0
$500
$1,000
$1,500
$2,000
$2,500
$3,000
$3,500
$4,000
$4,500
$5,000
Jan Feb Mar Apr May Jun Jul Aug Sep Oct Nov Dec
Co
st
($m
illi
on
s)
Forecast Forecast Plan
0
50
100
150
200
250
Jan Feb Mar Apr May Jun Jul Aug Sep Oct Nov Dec
Nu
mb
er
Forecast Actual Plan
Master Page # 170 of 242 - New York City Transit and Bus Committee Meeting 7/23/2018________________________________________________________________________________
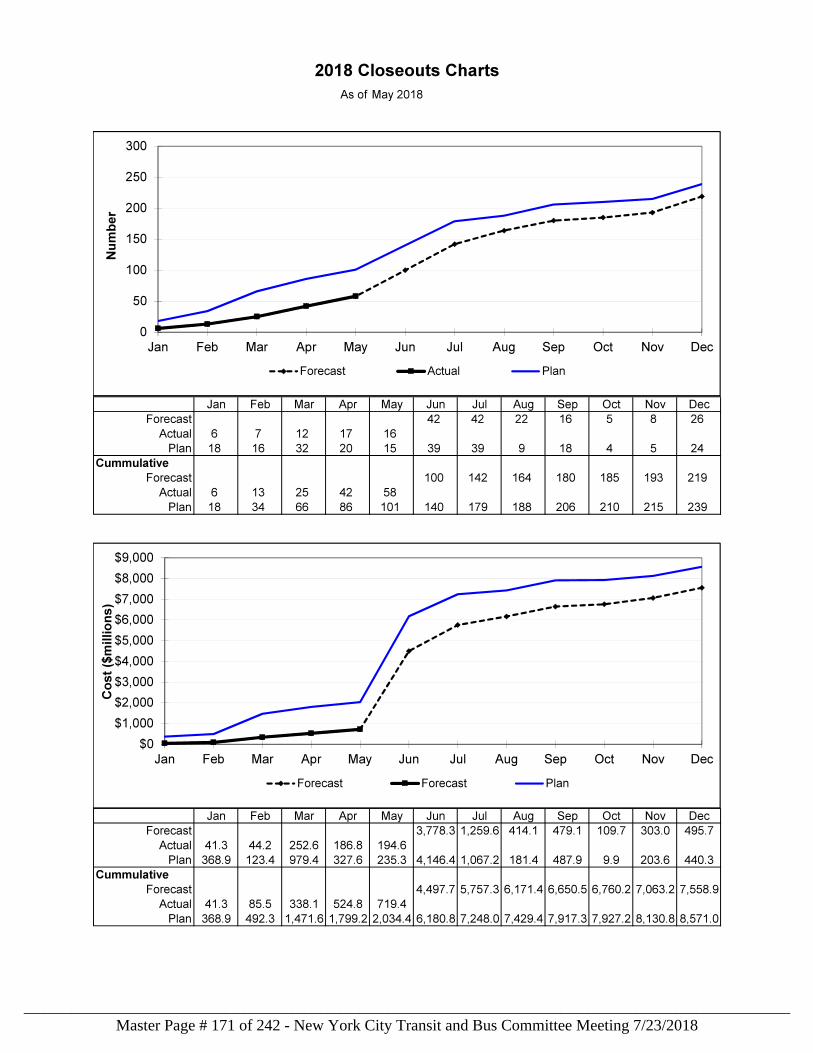
2018 Closeouts Charts
As of
Jan Feb Mar Apr May Jun Jul Aug Sep Oct Nov Dec
Forecast 0 0 0 0 0 42 42 22 16 5 8 26
Actual 6 7 12 17 16 0 0 0 0 0 0 0
Plan 18 16 32 20 15 39 39 9 18 4 5 24
Cummulative
Forecast 6 13 25 42 58 100 142 164 180 185 193 219
Actual 6 13 25 42 58
Plan 18 34 66 86 101 140 179 188 206 210 215 239
Jan Feb Mar Apr May Jun Jul Aug Sep Oct Nov Dec
Forecast 0.0 0.0 0.0 0.0 0.0 3,778.3 1,259.6 414.1 479.1 109.7 303.0 495.7
Actual 41.3 44.2 252.6 186.8 194.6 0.0 0.0 0.0 0.0 0.0 0.0 0.0
Plan 368.9 123.4 979.4 327.6 235.3 4,146.4 1,067.2 181.4 487.9 9.9 203.6 440.3
Cummulative
Forecast 41.3 85.5 338.1 524.8 719.4 4,497.7 5,757.3 6,171.4 6,650.5 6,760.2 7,063.2 7,558.9
Actual 41.3 85.5 338.1 524.8 719.4
Plan 368.9 492.3 1,471.6 1,799.2 2,034.4 6,180.8 7,248.0 7,429.4 7,917.3 7,927.2 8,130.8 8,571.0
May 2018
$0
$1,000
$2,000
$3,000
$4,000
$5,000
$6,000
$7,000
$8,000
$9,000
Jan Feb Mar Apr May Jun Jul Aug Sep Oct Nov Dec
Co
st
($m
illi
on
s)
Forecast Forecast Plan
0
50
100
150
200
250
300
Jan Feb Mar Apr May Jun Jul Aug Sep Oct Nov Dec
Nu
mb
er
Forecast Actual Plan
Master Page # 171 of 242 - New York City Transit and Bus Committee Meeting 7/23/2018________________________________________________________________________________
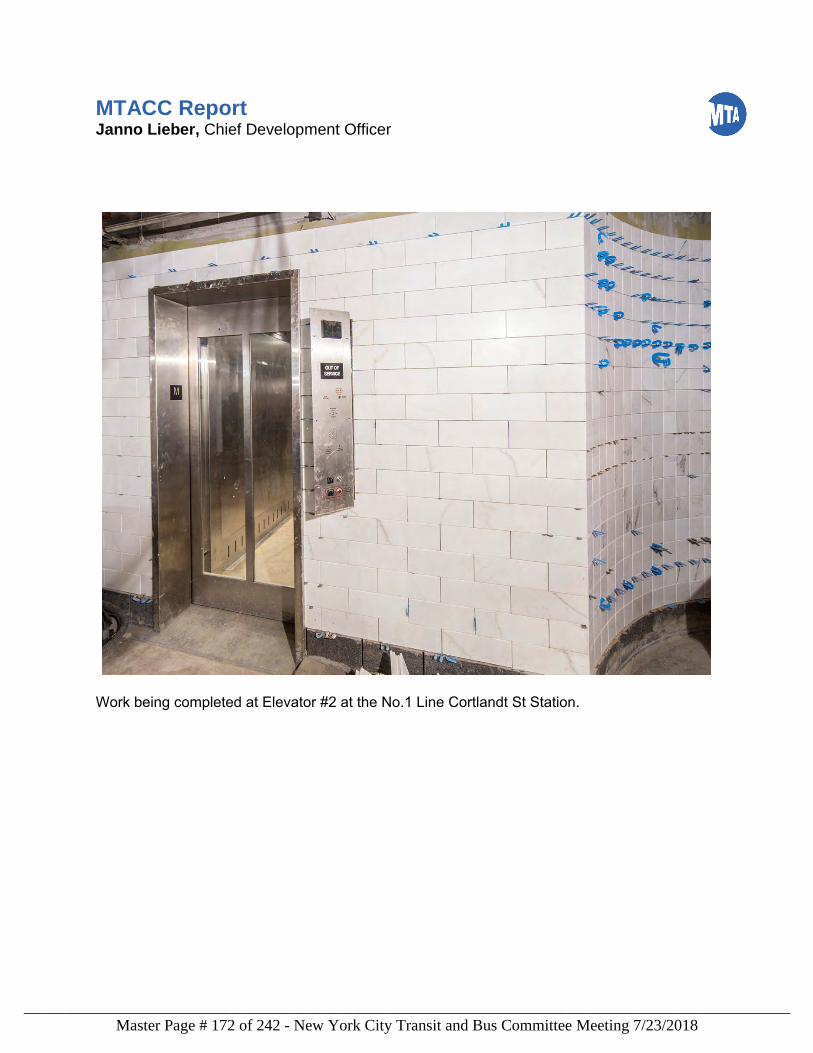
MTACC Report Janno Lieber, Chief Development Officer
Work being completed at Elevator #2 at the No.1 Line Cortlandt St Station.
Master Page # 172 of 242 - New York City Transit and Bus Committee Meeting 7/23/2018________________________________________________________________________________
July 2018 MTACC Monthly Project Status Report The purpose of this report is to give a status update on active MTACC projects involving future Transit assets. This report reviews budget, contract status, funding, and safety on a monthly basis.
Janno Lieber Chief Development Officer, MTA
Master Page # 173 of 242 - New York City Transit and Bus Committee Meeting 7/23/2018________________________________________________________________________________
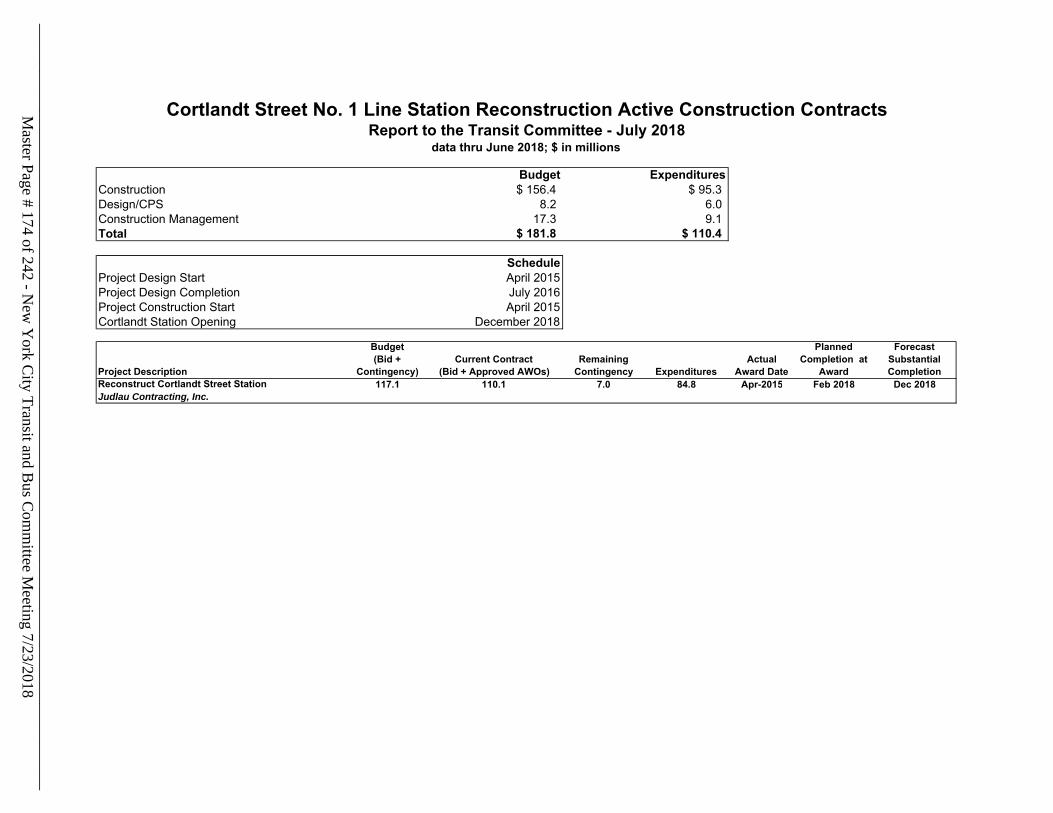
ConstructionDesign/CPSConstruction ManagementTotal
Project Design StartProject Design CompletionProject Construction StartCortlandt Station Opening
Project Description
Budget(Bid +
Contingency)Current Contract
(Bid + Approved AWOs)Remaining
Contingency Expenditures Actual
Award Date
Planned Completion at
Award
Forecast Substantial Completion
Reconstruct Cortlandt Street Station 117.1 110.1 7.0 84.8 Apr-2015 Feb 2018 Dec 2018Judlau Contracting, Inc.
$ 156.4 $ 95.38.2 6.0
December 2018
$ 181.8 $ 110.4
Schedule
17.3 9.1
Cortlandt Street No. 1 Line Station Reconstruction Active Construction ContractsReport to the Transit Committee - July 2018
data thru June 2018; $ in millions
Budget Expenditures
April 2015July 2016April 2015
Master Page # 174 of 242 - N
ew Y
ork City Transit and B
us Com
mittee M
eeting 7/23/2018________________________________________________________________________________
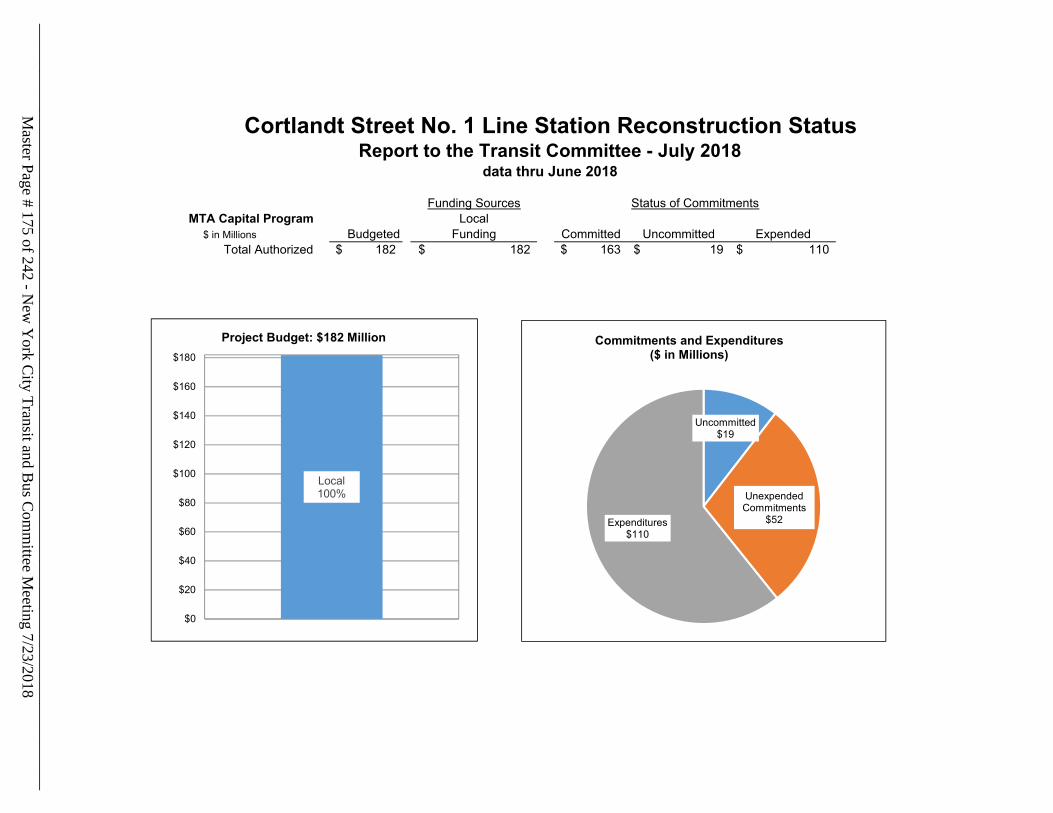
MTA Capital Program$ in Millions Budgeted Committed Uncommitted Expended
Total Authorized 182$ 163$ 19$ 110$ Funding
182$
Cortlandt Street No. 1 Line Station Reconstruction StatusReport to the Transit Committee - July 2018
data thru June 2018
Funding Sources Status of CommitmentsLocal
Local100%
Local100%
$0
$20
$40
$60
$80
$100
$120
$140
$160
$180
Project Budget: $182 Million
Uncommitted$19
Unexpended Commitments
$52Expenditures$110
Commitments and Expenditures ($ in Millions)
Master Page # 175 of 242 - N
ew Y
ork City Transit and B
us Com
mittee M
eeting 7/23/2018________________________________________________________________________________
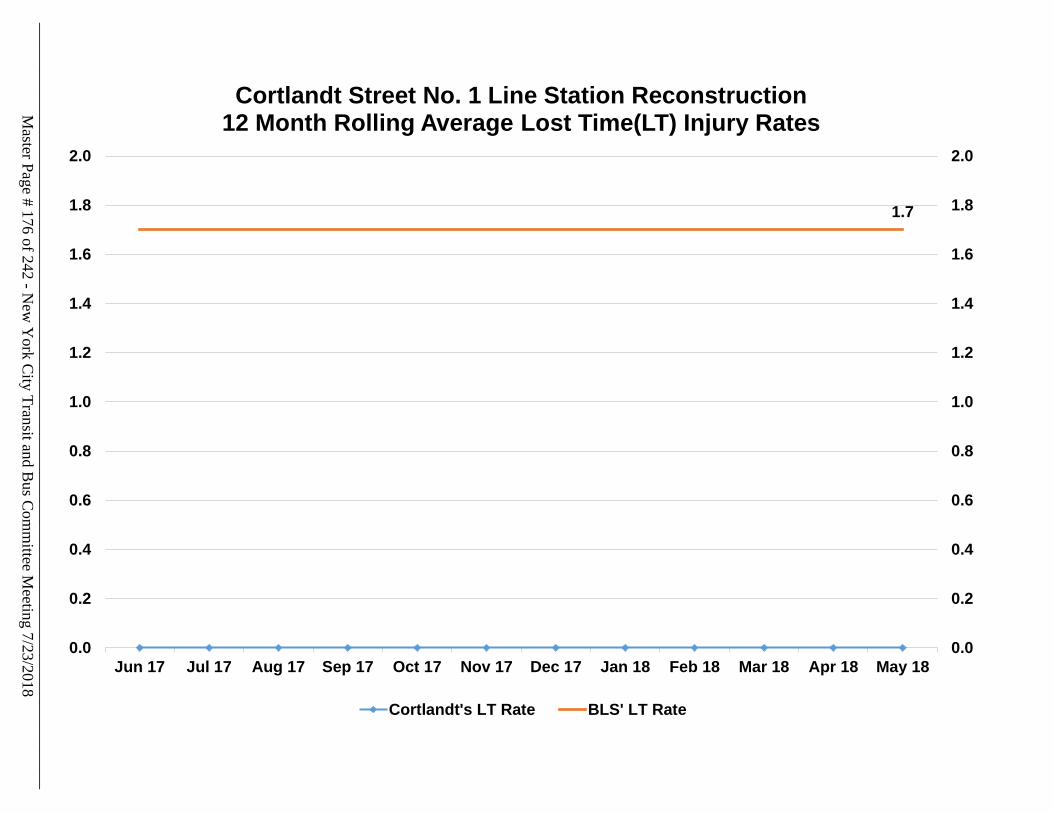
1.7
0.0
0.2
0.4
0.6
0.8
1.0
1.2
1.4
1.6
1.8
2.0
0.0
0.2
0.4
0.6
0.8
1.0
1.2
1.4
1.6
1.8
2.0
Jun 17 Jul 17 Aug 17 Sep 17 Oct 17 Nov 17 Dec 17 Jan 18 Feb 18 Mar 18 Apr 18 May 18
Cortlandt Street No. 1 Line Station Reconstruction12 Month Rolling Average Lost Time(LT) Injury Rates
Cortlandt's LT Rate BLS' LT Rate
Master Page # 176 of 242 - N
ew Y
ork City Transit and B
us Com
mittee M
eeting 7/23/2018________________________________________________________________________________
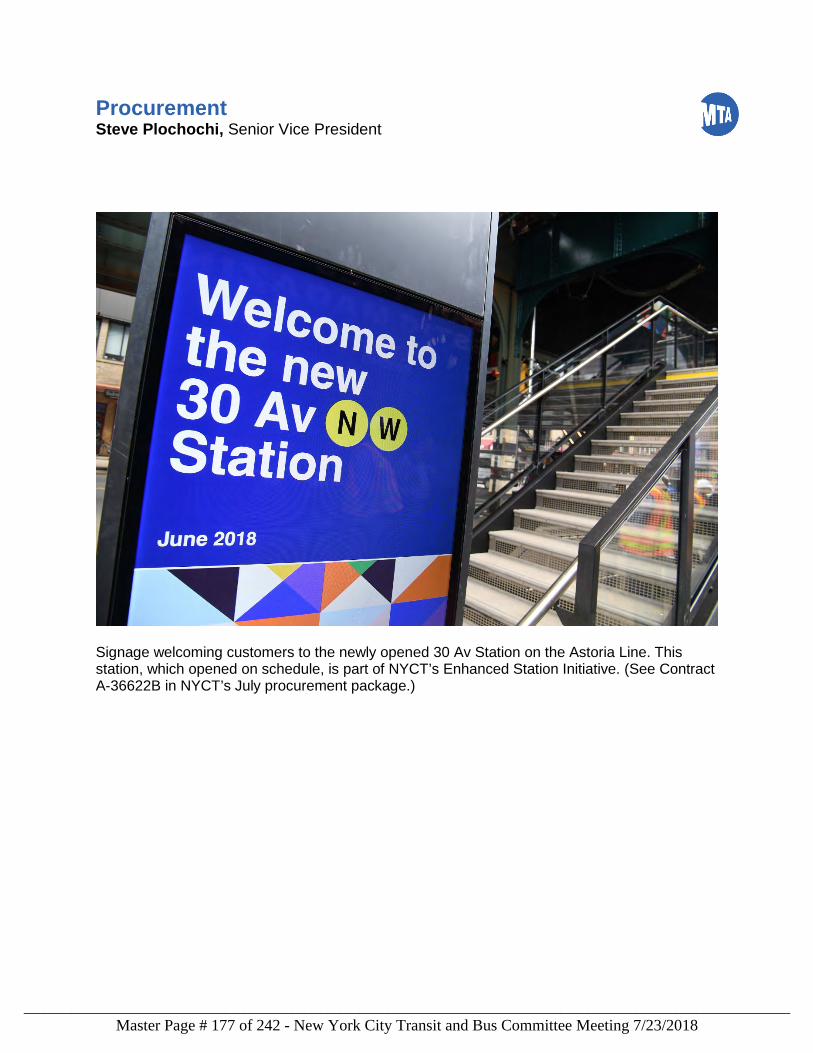
Procurement Steve Plochochi, Senior Vice President
Signage welcoming customers to the newly opened 30 Av Station on the Astoria Line. This station, which opened on schedule, is part of NYCT’s Enhanced Station Initiative. (See Contract A-36622B in NYCT’s July procurement package.)
Master Page # 177 of 242 - New York City Transit and Bus Committee Meeting 7/23/2018________________________________________________________________________________
PROCUREMENTS
The Procurement Agenda this month includes 35 actions for a proposed expenditure of $282.4M.
Master Page # 178 of 242 - New York City Transit and Bus Committee Meeting 7/23/2018________________________________________________________________________________
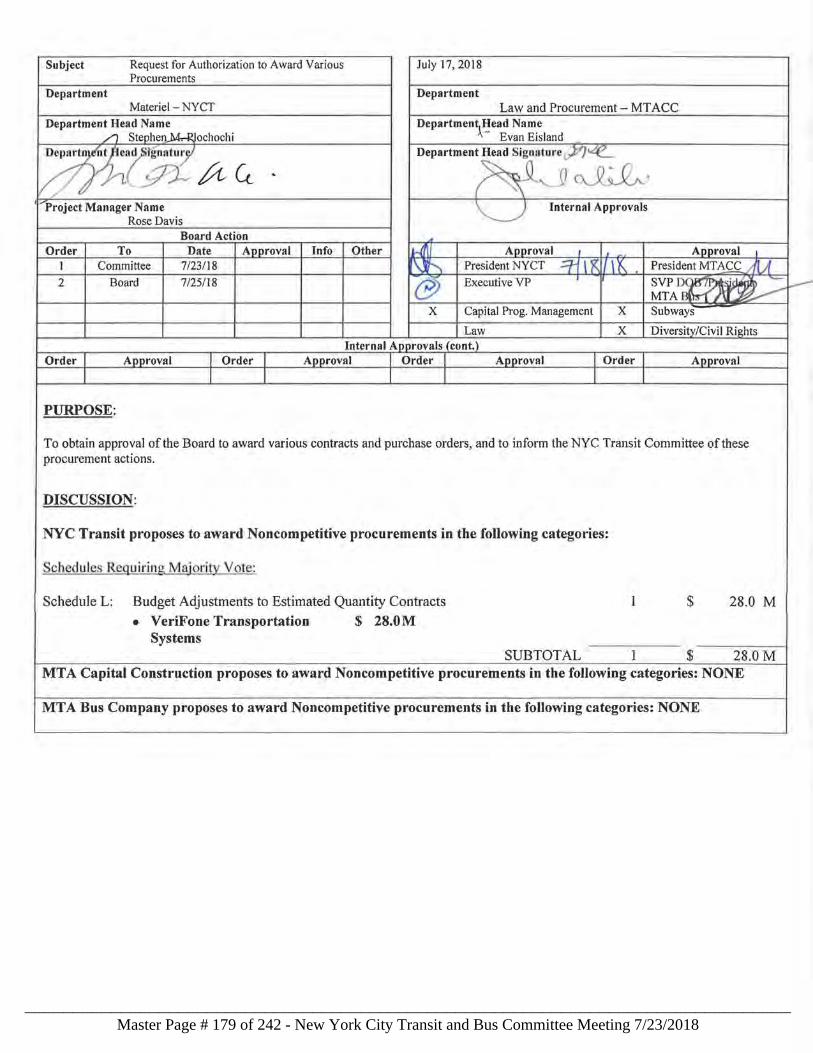
Subject Request for Authorization to Award Various July 17, 2018 Procurements
Department Department Materiel - NYCT Law and Procurement - MT ACC
Department Head Name Department~ead Name /'1 Stephen.M,-Rlochochi · -- Evan Eisland
~~µ~ Department Head Sign11ture t;P"J~
. ~~· ., ,...Project Manager Name "-J Internal Approvals
Rose Davis Board Action ~
Order To Date Aooroval Info Other wrtl Approval I . Aooroval I
I Committee 7/23/ 18 l\J'.,. President NYCT .:rt I K I\ K President MT Ag AlA 2 Board 7/25/18 e Executive VP I
SVPD~ . ' - ---MTA ·~ l--x Capital Prog. Management x Subways
Law x Diversity/Civil Rights Internal Annrovals 'cont.)
Order Aooroval I Order I Aooroval Order Approval I Order Approval
I I I
PURPOSE:
To obtain approval of the Board to award various contracts and purchase orders, and to inform the NYC Transit Committee of these procurement actions.
DISCUSSION:
NYC Transit proposes to award Noncompetitive procurements in the following categories:
Schedu les Requiring Majority V o te:
Schedule L: Budget Adjustments to Estimated Quantity Contracts 1 $ 28.0 M
• VeriFone Transportation $ 28.0M Systems
SUBTOTAL 1 $ 28.0M MTA Capital Construction proposes to award Noncompetitive procurements in the following categories: NONE
MTA Bus Company proposes to award Noncompetitive procurements in the following categories: NONE
Master Page # 179 of 242 - New York City Transit and Bus Committee Meeting 7/23/2018________________________________________________________________________________
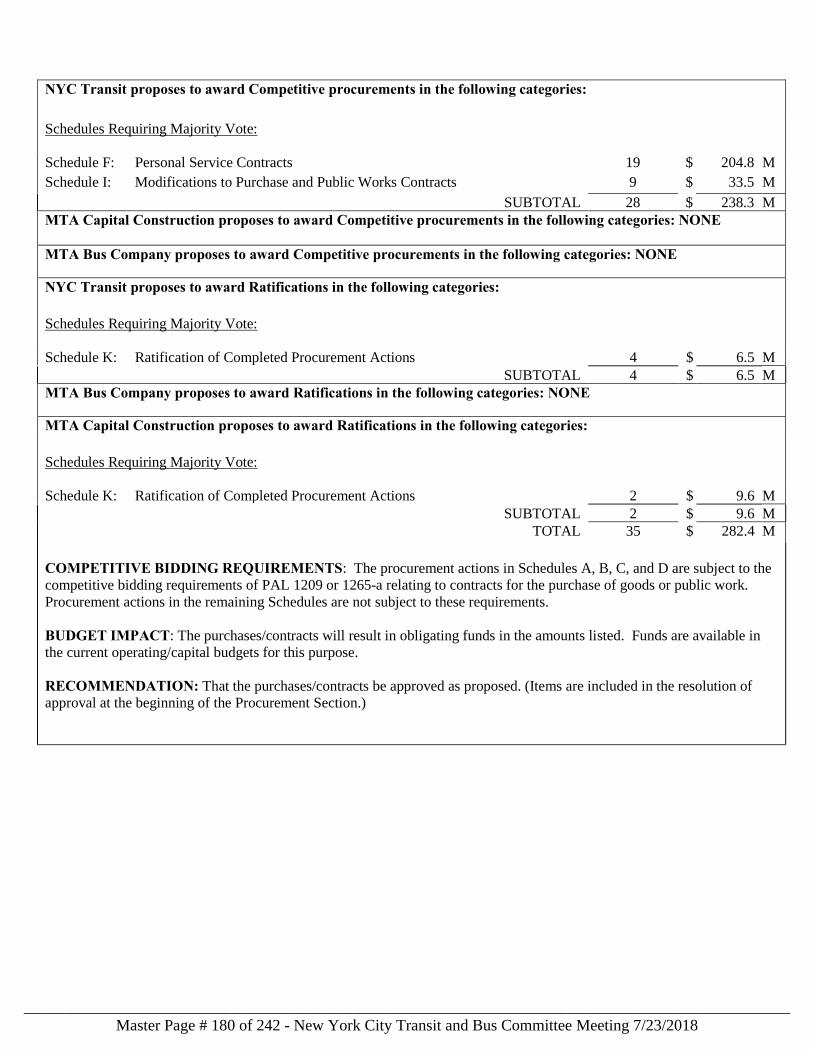
NYC Transit proposes to award Competitive procurements in the following categories: Schedules Requiring Majority Vote:
Schedule F: Personal Service Contracts 19 $ 204.8 M
Schedule I: Modifications to Purchase and Public Works Contracts 9 $ 33.5 M
SUBTOTAL 28 $ 238.3 M
MTA Capital Construction proposes to award Competitive procurements in the following categories: NONE MTA Bus Company proposes to award Competitive procurements in the following categories: NONE
NYC Transit proposes to award Ratifications in the following categories:
Schedules Requiring Majority Vote:
Schedule K: Ratification of Completed Procurement Actions 4 $ 6.5 M
SUBTOTAL 4 $ 6.5 M
MTA Bus Company proposes to award Ratifications in the following categories: NONE
MTA Capital Construction proposes to award Ratifications in the following categories:
Schedules Requiring Majority Vote:
Schedule K: Ratification of Completed Procurement Actions 2 $ 9.6 M
SUBTOTAL 2 $ 9.6 M
TOTAL 35 $ 282.4 M
COMPETITIVE BIDDING REQUIREMENTS: The procurement actions in Schedules A, B, C, and D are subject to the
competitive bidding requirements of PAL 1209 or 1265-a relating to contracts for the purchase of goods or public work.
Procurement actions in the remaining Schedules are not subject to these requirements.
BUDGET IMPACT: The purchases/contracts will result in obligating funds in the amounts listed. Funds are available in
the current operating/capital budgets for this purpose.
RECOMMENDATION: That the purchases/contracts be approved as proposed. (Items are included in the resolution of
approval at the beginning of the Procurement Section.)
Master Page # 180 of 242 - New York City Transit and Bus Committee Meeting 7/23/2018________________________________________________________________________________
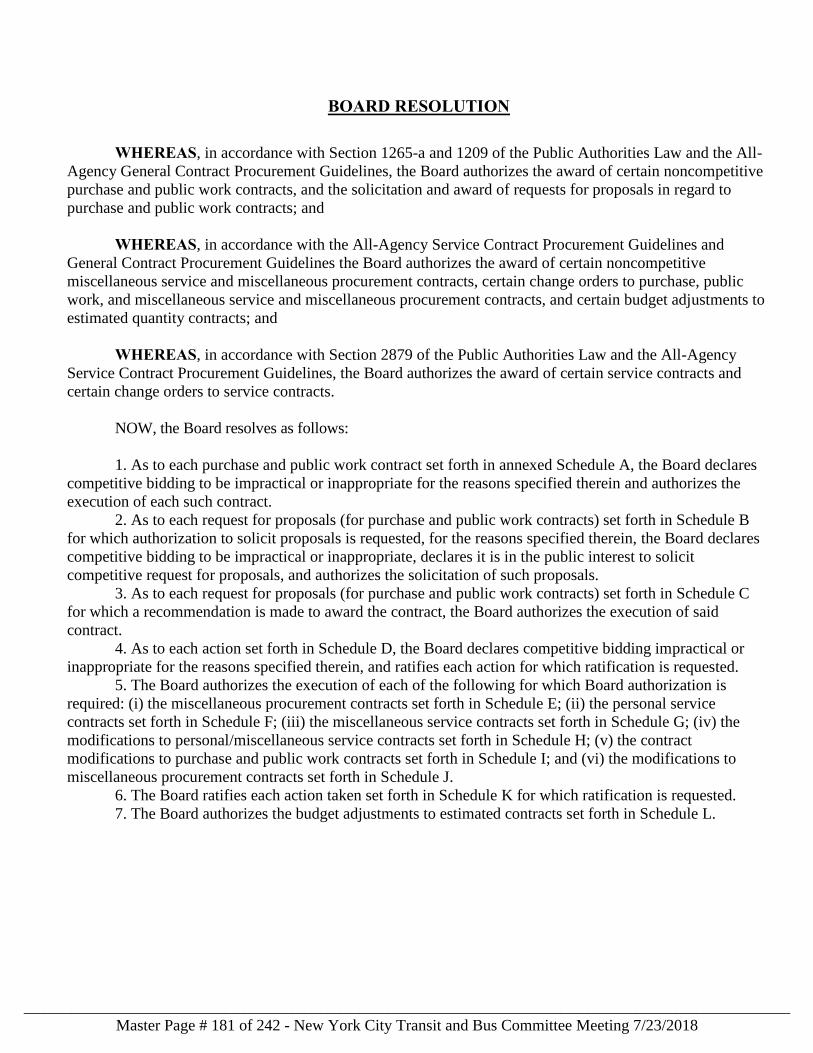
BOARD RESOLUTION
WHEREAS, in accordance with Section 1265-a and 1209 of the Public Authorities Law and the All-
Agency General Contract Procurement Guidelines, the Board authorizes the award of certain noncompetitive
purchase and public work contracts, and the solicitation and award of requests for proposals in regard to
purchase and public work contracts; and
WHEREAS, in accordance with the All-Agency Service Contract Procurement Guidelines and
General Contract Procurement Guidelines the Board authorizes the award of certain noncompetitive
miscellaneous service and miscellaneous procurement contracts, certain change orders to purchase, public
work, and miscellaneous service and miscellaneous procurement contracts, and certain budget adjustments to
estimated quantity contracts; and
WHEREAS, in accordance with Section 2879 of the Public Authorities Law and the All-Agency
Service Contract Procurement Guidelines, the Board authorizes the award of certain service contracts and
certain change orders to service contracts.
NOW, the Board resolves as follows:
1. As to each purchase and public work contract set forth in annexed Schedule A, the Board declares
competitive bidding to be impractical or inappropriate for the reasons specified therein and authorizes the
execution of each such contract.
2. As to each request for proposals (for purchase and public work contracts) set forth in Schedule B
for which authorization to solicit proposals is requested, for the reasons specified therein, the Board declares
competitive bidding to be impractical or inappropriate, declares it is in the public interest to solicit
competitive request for proposals, and authorizes the solicitation of such proposals.
3. As to each request for proposals (for purchase and public work contracts) set forth in Schedule C
for which a recommendation is made to award the contract, the Board authorizes the execution of said
contract.
4. As to each action set forth in Schedule D, the Board declares competitive bidding impractical or
inappropriate for the reasons specified therein, and ratifies each action for which ratification is requested.
5. The Board authorizes the execution of each of the following for which Board authorization is
required: (i) the miscellaneous procurement contracts set forth in Schedule E; (ii) the personal service
contracts set forth in Schedule F; (iii) the miscellaneous service contracts set forth in Schedule G; (iv) the
modifications to personal/miscellaneous service contracts set forth in Schedule H; (v) the contract
modifications to purchase and public work contracts set forth in Schedule I; and (vi) the modifications to
miscellaneous procurement contracts set forth in Schedule J.
6. The Board ratifies each action taken set forth in Schedule K for which ratification is requested.
7. The Board authorizes the budget adjustments to estimated contracts set forth in Schedule L.
Master Page # 181 of 242 - New York City Transit and Bus Committee Meeting 7/23/2018________________________________________________________________________________
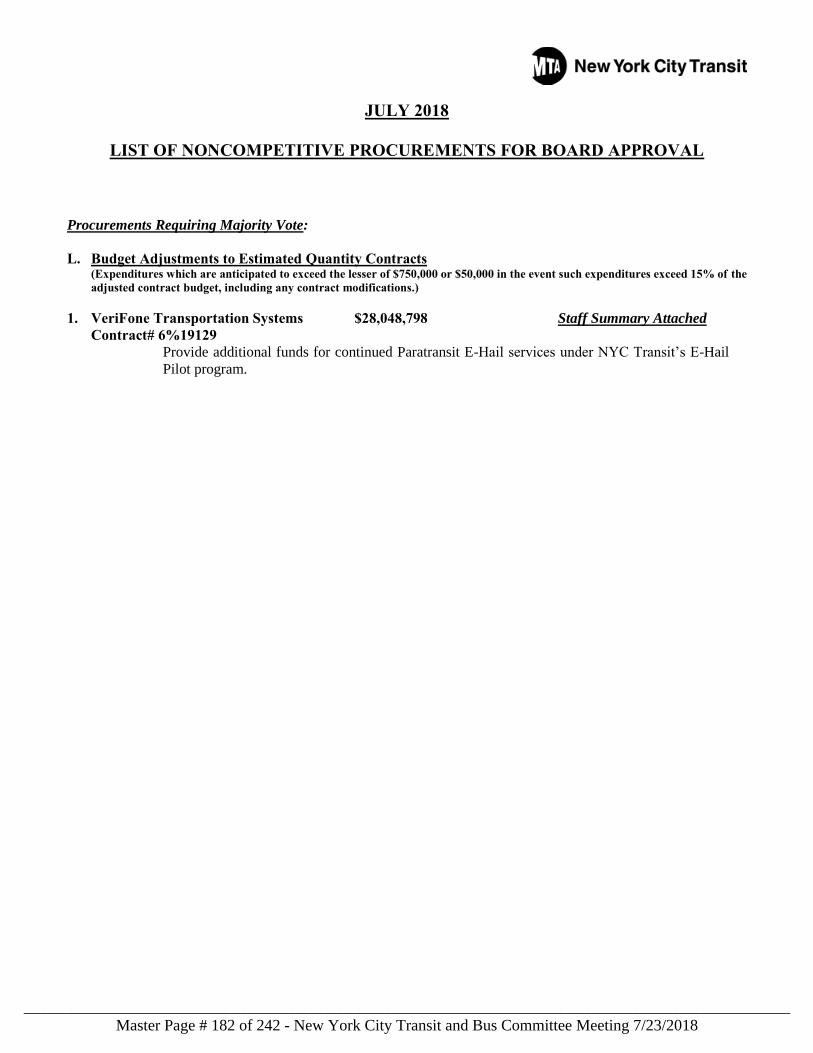
JULY 2018
LIST OF NONCOMPETITIVE PROCUREMENTS FOR BOARD APPROVAL
Procurements Requiring Majority Vote:
L. Budget Adjustments to Estimated Quantity Contracts (Expenditures which are anticipated to exceed the lesser of $750,000 or $50,000 in the event such expenditures exceed 15% of the adjusted contract budget, including any contract modifications.)
1. VeriFone Transportation Systems $28,048,798 Staff Summary Attached Contract# 6%19129
Provide additional funds for continued Paratransit E-Hail services under NYC Transit’s E-Hail
Pilot program.
Master Page # 182 of 242 - New York City Transit and Bus Committee Meeting 7/23/2018________________________________________________________________________________
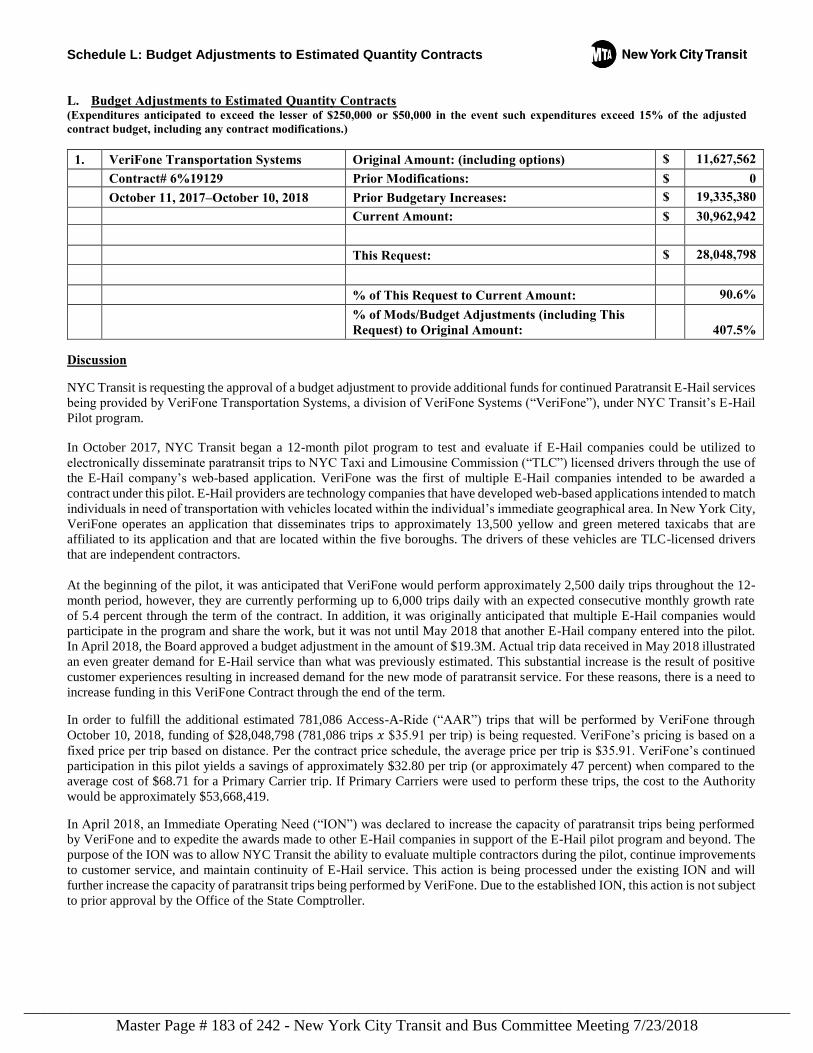
Schedule L: Budget Adjustments to Estimated Quantity Contracts
L. Budget Adjustments to Estimated Quantity Contracts (Expenditures anticipated to exceed the lesser of $250,000 or $50,000 in the event such expenditures exceed 15% of the adjusted contract budget, including any contract modifications.)
1. VeriFone Transportation Systems Original Amount: (including options) $ 11,627,562 Contract# 6%19129 Prior Modifications: $ 0 October 11, 2017–October 10, 2018 Prior Budgetary Increases: $ 19,335,380 Current Amount: $ 30,962,942
This Request: $ 28,048,798
% of This Request to Current Amount: 90.6%
% of Mods/Budget Adjustments (including This Request) to Original Amount:
407.5%
Discussion
NYC Transit is requesting the approval of a budget adjustment to provide additional funds for continued Paratransit E-Hail services
being provided by VeriFone Transportation Systems, a division of VeriFone Systems (“VeriFone”), under NYC Transit’s E-Hail
Pilot program.
In October 2017, NYC Transit began a 12-month pilot program to test and evaluate if E-Hail companies could be utilized to
electronically disseminate paratransit trips to NYC Taxi and Limousine Commission (“TLC”) licensed drivers through the use of
the E-Hail company’s web-based application. VeriFone was the first of multiple E-Hail companies intended to be awarded a
contract under this pilot. E-Hail providers are technology companies that have developed web-based applications intended to match
individuals in need of transportation with vehicles located within the individual’s immediate geographical area. In New York City,
VeriFone operates an application that disseminates trips to approximately 13,500 yellow and green metered taxicabs that are
affiliated to its application and that are located within the five boroughs. The drivers of these vehicles are TLC-licensed drivers
that are independent contractors.
At the beginning of the pilot, it was anticipated that VeriFone would perform approximately 2,500 daily trips throughout the 12-
month period, however, they are currently performing up to 6,000 trips daily with an expected consecutive monthly growth rate
of 5.4 percent through the term of the contract. In addition, it was originally anticipated that multiple E-Hail companies would
participate in the program and share the work, but it was not until May 2018 that another E-Hail company entered into the pilot.
In April 2018, the Board approved a budget adjustment in the amount of $19.3M. Actual trip data received in May 2018 illustrated an even greater demand for E-Hail service than what was previously estimated. This substantial increase is the result of positive
customer experiences resulting in increased demand for the new mode of paratransit service. For these reasons, there is a need to
increase funding in this VeriFone Contract through the end of the term.
In order to fulfill the additional estimated 781,086 Access-A-Ride (“AAR”) trips that will be performed by VeriFone through
October 10, 2018, funding of $28,048,798 (781,086 trips 𝑥 $35.91 per trip) is being requested. VeriFone’s pricing is based on a
fixed price per trip based on distance. Per the contract price schedule, the average price per trip is $35.91. VeriFone’s continued
participation in this pilot yields a savings of approximately $32.80 per trip (or approximately 47 percent) when compared to the
average cost of $68.71 for a Primary Carrier trip. If Primary Carriers were used to perform these trips, the cost to the Authority
would be approximately $53,668,419.
In April 2018, an Immediate Operating Need (“ION”) was declared to increase the capacity of paratransit trips being performed
by VeriFone and to expedite the awards made to other E-Hail companies in support of the E-Hail pilot program and beyond. The
purpose of the ION was to allow NYC Transit the ability to evaluate multiple contractors during the pilot, continue improvements
to customer service, and maintain continuity of E-Hail service. This action is being processed under the existing ION and will
further increase the capacity of paratransit trips being performed by VeriFone. Due to the established ION, this action is not subject
to prior approval by the Office of the State Comptroller.
Master Page # 183 of 242 - New York City Transit and Bus Committee Meeting 7/23/2018________________________________________________________________________________
JULY 2018
LIST OF COMPETITIVE PROCUREMENTS FOR BOARD APPROVAL
Procurements Requiring Majority Vote: F. Personal Service Contracts
(Staff Summaries required for all items greater than: $100K Sole Source; $750K Other Noncompetitive; $1M Competitive.)
1. VHB/STV North Shore Joint Venture $4,805,376 Staff Summary Attached Four Proposals – 24-month contract Contract # CM-0143
Provide Environmental and Engineering services for the Staten Island North Shore Bus Rapid
Transit System.
Various Contractors $200,000,000 (Est. Aggregate) Staff Summary Attached Twenty-Two Proposals – 60-month contract
2–19. Contract #s CM-1576/77/78/79/80, CM-1618/19/20/21 (Federally Funded) Contract #s CM-1581/82/83/84/85, CM-1622/23/24/25 (State Funded)
Provide Indefinite Quantity Staffing Services for Miscellaneous Projects.
I. Modifications to Purchase and Public Work Contracts
(Staff Summaries required for individual change orders greater than $750K. Approval without Staff Summary required for change orders greater than 15% of the adjusted contract amount which are also at least $250K.)
Various Contractors $33,500,000 (Est. Aggregate) Staff Summary Attached Seventeen Proposals – 60-month contract
20–28. SSE# 147199 Provide independent medical examinations and related services for NYC Transit’s Law Department
and MTA Headquarters’ Human Resources Department.
Master Page # 184 of 242 - New York City Transit and Bus Committee Meeting 7/23/2018________________________________________________________________________________
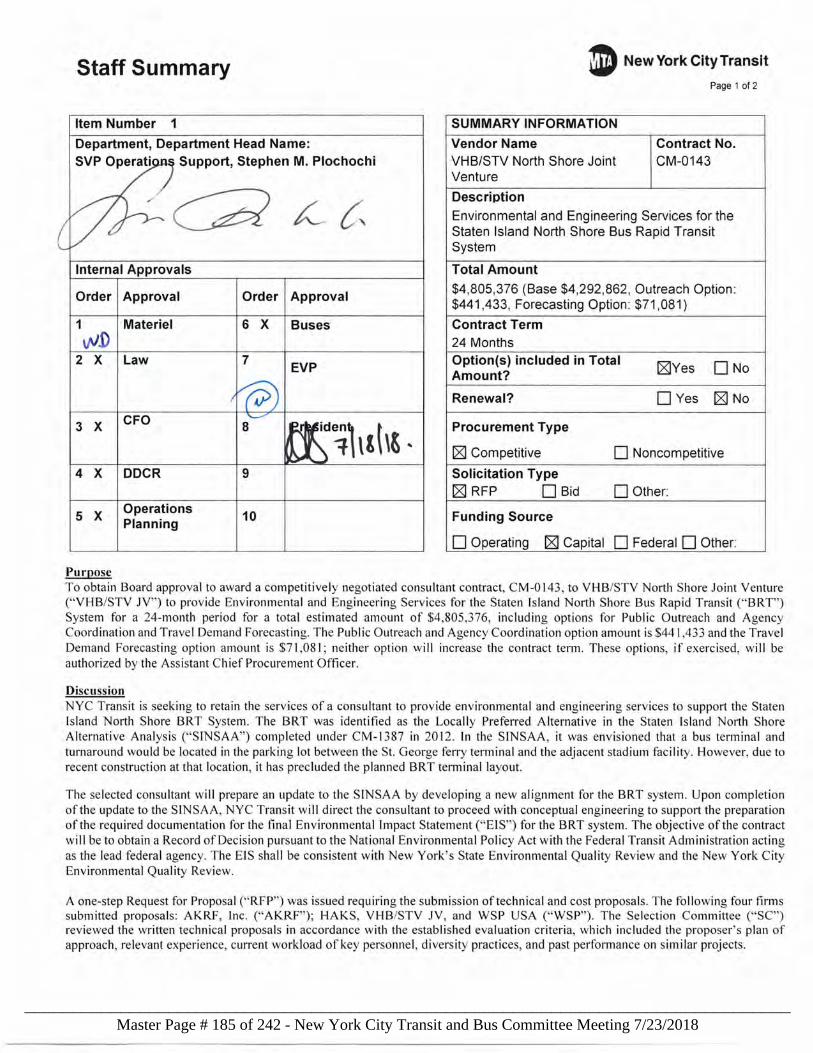
Staff Summary
Item Number 1
Department, Department Head Name: SVP Operati Support, Stephen M. Plochochi
Internal Approvals
Order Approval Order Approval
1 Materiel 6 x Buses
w.O 2 x Law 7
EVP
3 x CFO
id~'\&\ ,g ' 4 x DDCR 9
5 x Operations 10 Planning
Purpose
D New York City Transit
Page 1 of 2
SUMMARY INFORMATION
Vendor Name Contract No. VHB/STV North Shore Joint CM-0143 Venture
Description
Environmental and Engineering Services for the Staten Island North Shore Bus Rapid Transit System
Total Amount
$4,805,376 (Base $4,292,862, Outreach Option: $441,433, Forecasting Option: $71 ,081)
Contract Term 24 Months Option(s) included in Total
1:8:1Yes 0No Amount?
Renewal? 0Yes i:8J No
Procurement Type
1:8:1 Competitive D Noncompetitive
Solicitation Type i:8J RFP 0Bid D Other:
Funding Source
D Operating 1:8:1 Capital D Federal D Other:
To obtain Board approva l to award a competitive ly negotiated consultant contract, CM -0 143 , to VHB/STV North Shore Joint Venture ("VHB/STV JV") to provide Environmental and Engineering Services for the Staten Is land North Shore Bus Rapid Transit (" BRT") System for a 24-month period for a total estimated amount of $4,805,376, including options for Pub lic Outreach and Agency Coordi nat ion and Travel Demand Forecasting. The Public Outreach and Agency Coordination option amou nt is $441 ,433 and the Travel Demand Forecasti ng option amo unt is $7 1,081 ; neither option wi ll increase the contract term. These opt ions, if exercised, will be authorized by the Assistant Chief Procurement Officer.
Discussion NYC Transit is seek ing to retain the services of a consu ltant to provide environmenta l and engineering services to support the Staten Is land North Shore BRT System. The BRT was identified as the Locally Preferred A lternative in the Staten Is land North Shore Alternative Ana lysis ("SlNSAA") completed under CM-1 387 in 20 12. In the S IN SAA, it was envis ioned that a bus terminal and turnaround wou ld be located in the park ing lot between the St. George ferry terminal and the adjacent stadium fac il ity. However, due to recent construction at that location, it has prec luded the planned BRT terminal layout.
The se lected consultant will prepare an update to the S INSAA by deve loping a new alignment for the BRT system. Upon completion of the update to the SINSAA, NYC Transit will direct the consultant to proceed with conceptual engineering to support the preparation of the required documentation for the final Environmenta l Impact Statement (" EIS") for the BRT system. The objective of the contract will be to obtain a Record of Decision pursuant to the Nationa l Environmenta l Policy Act w ith the Federal Transit Admi ni stration acting as the lead federa l agency. The EIS sha ll be cons istent with New York ' s State Environmenta l Quality Review and the New York City Environmental Q uali ty Review.
A one-step Request fo r Proposal (" RFP") was issued req uiring the submission of technical and cost proposals. The fol lowing fo ur firms submitted proposals: AKRF, Inc. (" AKRF"); HAKS, VHB/STV JV, and WSP USA (" WSP"). The Selection Committee ("SC" ) reviewed the written technica l proposa ls in accordance with the established evaluation criteria, which included the proposer' s plan of approach, relevant experience, current workload of key personne l, diversity practices, and past performance on s im ilar projects.
Master Page # 185 of 242 - New York City Transit and Bus Committee Meeting 7/23/2018________________________________________________________________________________

Staff Summary a New York City Transit Page 2 of 2
Oral presentations were also conducted with three respondents to the RFP: AKRF, VHB/STV JV, and WSP. HAKS was not invited to provide an oral presentation as its proposal did not demonstrate sufficient relevant experience with projects related to environmental review.
After oral presentations, all three consultants were selected for negotiations based on the demonstrated knowledge and experience of the teams proposed. All firms were considered qualified to perform the work when evaluated in accordance with the established evaluation criteria, based primarily on their experience with projects that required environmental review and EIS. VHB/STV JV was rated technically highest by the majority of the SC due to the emphasis on creating a comprehensive public outreach plan to address the concerns of the community and other stakeholders in the North Shore of Staten Island and their enhanced knowledge of the environmental concerns of the project area.
The RFP provided proposers specific titles to facilitate price comparisons and evaluation among the proposals. The initial cost proposals from the three selected firms were as follows: AKRF - $6,356,343 ($5,043,492 base/$633,026 options); VHB/STV JV - $5,471,920 ($4,949,915 base/$522,005 options); and WSP - $5,057,607 ($4,576,259 base/$481,348 options). The in-house estimate was $4,753,820 ($4,250,000 base/$503,820 options). Price negotiations were conducted with all firms, which focused on work scope, direct labor rates, proposed hours, overhead, and fixed fee and out-of-pocket expense. Prices were negotiated to levels consistent with the cost/price objective and competitive price range for the project. In addition, the overhead rates were negotiated in accordance with MT A Audit recommendations.
Best and Final Offers ("BAFOs") were received as follows: AKRF- $5,729,604 ($5,064,724 base/$664,880 options); VHB/STV JV -$4,805,376 ($4,292,862 base/$512,514 options); and WSP USA - $4,670,108 ($4,188,760 base/$481,348 options). The in-house estimate remained at $4,753,820 ($4,250,000 base/$503,820 options). The price difference of $135,268 between VHB/STV JV's BAFO pricing and WSP's BAFO pricing reflects the difference of the Out-of-Pocket Cost. The SC voted to recommend award of the contract to VHB/STV JV due to it being the most technically preferred firm. Technical factors were the most important criteria and the SC determined that VHB/STV JV's knowledge, experience, and the technical approach to the scope of work was preferable as described above. VHB/STV JV's BAFO of $4,805,376 is $51,556 or I. I percent higher than the in-house estimate. VHB/STV JV's BAFO was determined to be fair and reasonable based on the competitive RFP process.
Background investigations and materials submitted by VHB and STY, individually and as a joint venture, disclosed no significant adverse information within the meaning of the All-Agency Responsibility Guidelines.
M/W/DBE Information The MT A Department of Diversity and Civil Rights has assigned goals of 15 percent MBE, 15 percent WBE, and 6 percent ServiceDisabled Veteran-Owned Businesses ("SDVOB"). VHB/STV JV has submitted a utilization plan to address the assigned M/WBE and SDVOB goals. VHB/STV JV has committed to an overall 35 percent participation ofMBE/WBE and SDVOB goals. VHB/STV North Shore Joint Venture has not completed any MTA contracts with goals; therefore, no assessment of the firm's M/W/DBE performance can be determined at this time.
Alternatives None. NYC Transit Operations Planning lacks the in-house technical personnel to perform the specific tasks required under the scope of work for this contract.
Impact on Funding This contract will be funded with I 00 percent MT A funds. A WAR ce1tificate will be requested, and no award will be made until a WAR ce1tificate is received.
Capital Program Reporting This contract has been reviewed for compliance with the requirements of the 1986 legislation applicable to Capital Contract Awards and the necessary inputs have been secured from the responsible functional departments.
Recommendation That the Board approve to award of a competitively negotiated consultant contract, CM-0143, to VHB/STV JV to provide Environmental and Engineering Services for the Staten Island North Shore BRT System for a 24-month period for a total estimated amount of$4,805,376.
Master Page # 186 of 242 - New York City Transit and Bus Committee Meeting 7/23/2018________________________________________________________________________________
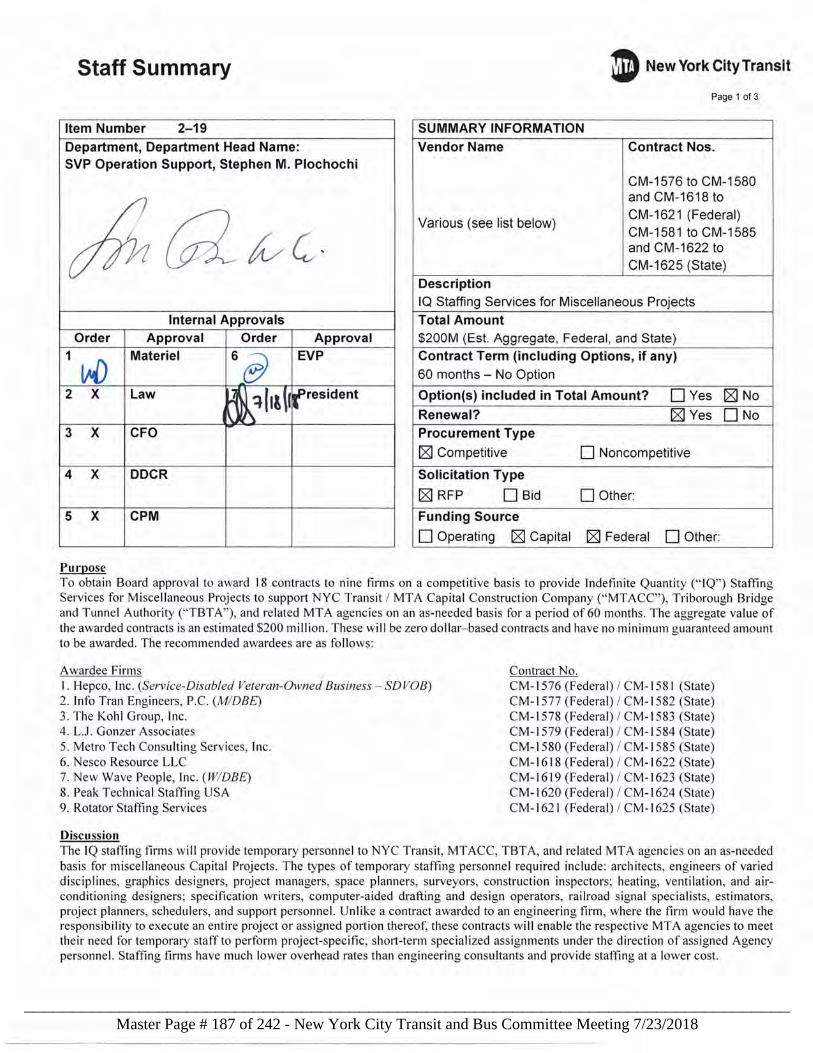
Staff Summary I) New York City Transit
Page 1 of 3
Item Number 2-19 SUMMARY INFORMATION Department, Department Head Name: Vendor Name Contract Nos. SVP Operation Support, Stephen M. Plochochi
CM-1576 to CM-1580
c#n Gl kc-and CM-1618 to
Various (see list below) CM-1621 (Federal) CM-1581 to CM-1585 and CM-1622 to CM-1625 (State)
Description IQ Staffing Services for Miscellaneous Projects
Internal Approvals Total Amount Order Approval Order Approval $200M (Est. Aggregate, Federal , and State)
1
v.D Materiel 6 ~ EVP Contract Term (including Options, if any)
60 months - No Option
2 x Law ~ ~~(ig\1 (resident
\
Option(s) included in Total Amount? 0Yes [8J No
Renewal? [8J Yes 0No 3 x CFO - Procurement Type
[8J Competitive D Noncompetitive
4 x DDCR Solicitation Type
[8J RFP 0Bid D Other:
5 x CPM Funding Source
D Operating [8J Capital [8J Federal D Other:
Purpose To obtain Board approva l to award 18 contracts to nine firms on a competi tive bas is to prov ide Indefin ite Quantity (" IQ") Staffing Services fo r Misce ll aneous Projects to support NYC Transit I MTA Capital Construction Company ("MTACC"), T riborough Bridge and Tunnel Authority ("TBT A"), and related MT A agencies on an as-needed bas is for a period of 60 months. The aggregate value of the awarded contracts is an estimated $200 mi llion. These will be zero do ll ar- based contracts and have no min imum g uaranteed amount to be awarded. The recommended awardees are as fo llows:
A wardee Firms I . Hepco, Inc. (Service-Disabled Veteran-Owned Business - SD VOB) 2. In fo Tran Engineers, P.C. (MIDBE) 3. The Kohl Group, Inc. 4. L.J . Gonzer Assoc iates 5. Metro Tech Consulting Services, Inc. 6. Nesco Resource LLC 7. New Wave People, Inc. (WIDBE) 8. Peak Technica l Staffing USA 9. Rotator Staffi ng Services
Discussion
Contract No. CM-1 576 (Federal) I CM -1 581 (State) CM- 1577 (Federa l) I CM -1 582 (State) CM-1 578 (Federa l) I CM-1 583 (State) CM-1 579 (Federal) I CM-1 584 (State) CM-15 80 (Federa l) I CM-1 585 (State) CM-161 8 (Federal) I CM-1622 (State) CM-161 9 (Federal) I CM-1 623 (State) CM-1 620 (Federa l) I CM-1 624 (State) CM -1 62 1 (Federa l) I CM-1 625 (State)
The IQ staffin g firms wi ll prov ide temporary personne l to NYC Transit, MTACC, TBTA, and re lated MTA agencies on an as-needed basis fo r misce llaneous Capital Projects. The types of temporary staffi ng personnel required inc lude: architects, engineers of varied di sc iplines, graphics designers, project managers, space planners, surveyors, construction inspectors; heating, ventilati on, and aircond itioning des igners; spec ification writers, computer-aided draft ing and des ign operators, railroad signal spec ia lists, esti mators, proj ect planners, schedu lers, and support personne l. Unlike a contract awarded to an engineering fi rm, where the fi rm wo uld have the responsibility to execute an enti re proj ect or ass igned portion thereof, these contracts will enable the respecti ve MTA agenc ies to meet the ir need for temporary staff to perfonn proj ect-spec ific, short-term spec ialized assignments under the di rection of ass igned Agency personnel. Staffi ng firm s have much lower overhead rates than engi neering consultants and provide staffi ng at a lower cost.
Master Page # 187 of 242 - New York City Transit and Bus Committee Meeting 7/23/2018________________________________________________________________________________
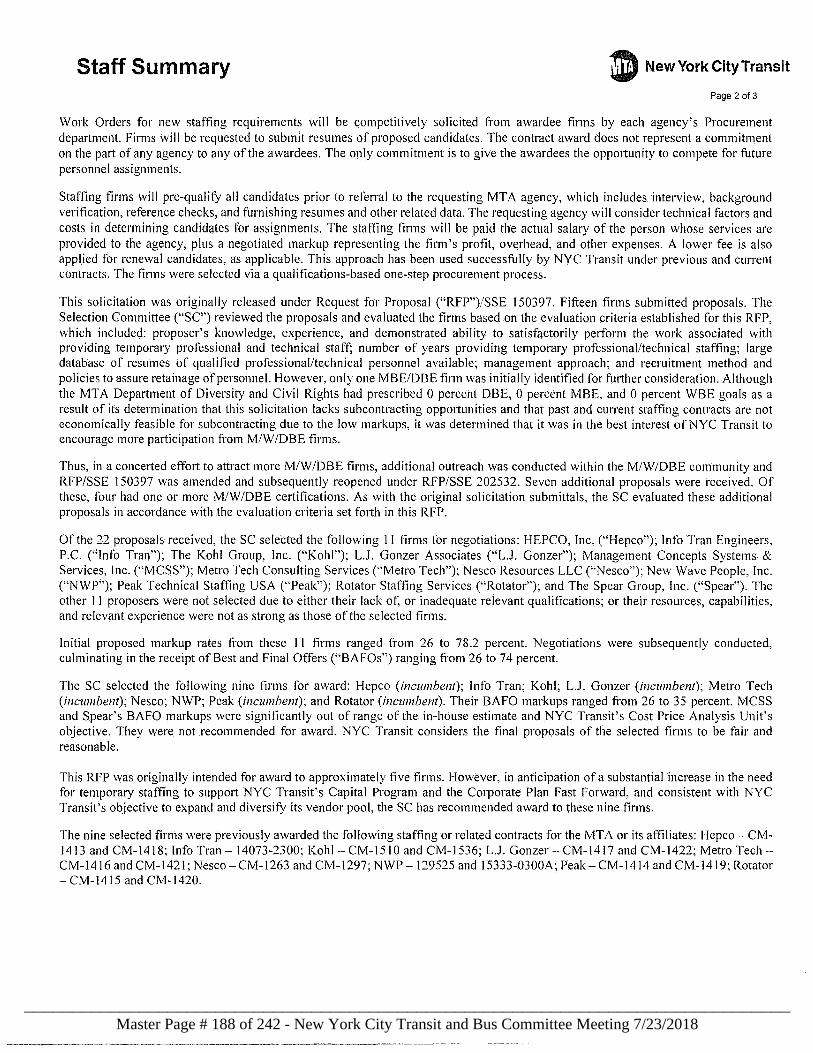
Staff Summary D New York City Transit
Page 2 of 3
Work Orders for new staffing requirements will be competitively solicited from awardee firms by each agency's Procurement department. Finns will be requested to submit resumes of proposed candidates. The contract award does not represent a commitment on the part of any agency to any of the awardees. The only commitment is to give the awardees the opportunity to compete for future personnel assignments.
Staffing firms will pre-qualify all candidates prior to referral to the requesting MTA agency, which includes interview, background verification, reference checks, and furnishing resumes and other related data. The requesting agency will consider technical factors and costs in determining candidates for assignments. The staffing firms will be paid the actual salary of the person whose services are provided to the agency, plus a negotiated markup representing the firm's profit, overhead, and other expenses. A lower fee is also applied for renewal candidates, as applicable. This approach has been used successfully by NYC Transit under previous and current contracts. The finns were selected via a qualifications-based one-step procurement process.
This solicitation was originally released under Request for Proposal ("RFP")/SSE 150397. Fifteen firms submitted proposals. The Selection Committee ("SC") reviewed the proposals and evaluated the firms based on the evaluation criteria established for this RFP, which included: proposer's knowledge, experience, and demonstrated ability to satisfactorily perform the work associated with providing temporary professional and technical staff; number of years providing temporary professional/technical staffing; large database of resumes of qualified professional/technical personnel available; management approach; and recruitment method and policies to assure retainage of personnel. However, only one MBE/DBE firm was initially identified for further consideration. Although the MTA Department of Diversity and Civil Rights had prescribed 0 percent DBE, 0 percent MBE, and 0 percent WBE goals as a result of its determination that this solicitation lacks subcontracting opportunities and that past and current staffing contracts are not economically feasible for subcontracting due to the low markups, it was determined that it was in the best interest of NYC Transit to encourage more participation from M/W/DBE firms.
Thus, in a concerted effort to attract more M/W/DBE firms, additional outreach was conducted within the M/W/DBE community and RFP/SSE 150397 was amended and subsequently reopened under RFP/SSE 202532. Seven additional proposals were received. Of these, four had one or more M/W/DBE certifications. As with the original solicitation submittals, the SC evaluated these additional proposals in accordance with the evaluation criteria set forth in this RFP.
Of the 22 proposals received, the SC selected the following 11 firms for negotiations: HEPCO, Inc. ("Hepco"); Info Tran Engineers, P.C. ("Info Tran"); The Kohl Group, Inc. ("Kohl"); L.J. Gonzer Associates ("L.J. Gonzer"); Management Concepts Systems & Services, Inc. ("MCSS"); Metro Tech Consulting Services ("Metro Tech"); Nesco Resources LLC ("Nesco"); New Wave People, Inc. ("NWP"); Peak Technical Staffing USA ("Peak"); Rotator Staffing Services ("Rotator"); and The Spear Group, Inc. ("Spear"). The other 11 proposers were not selected due to either their lack of, or inadequate relevant qualifications; or their resources, capabilities, and relevant experience were not as strong as those of the selected firms.
Initial proposed markup rates from these 11 firms ranged from 26 to 78.2 percent. Negotiations were subsequently conducted, culminating in the receipt of Best and Final Offers ("BAFOs") ranging from 26 to 74 percent.
The SC selected the following nine firms for award: Hepco (incumbent); Info Tran; Kohl; L.J. Gonzer (incumbent); Metro Tech (incumbent); Nesco; NWP; Peak (incumbent); and Rotator (incumbent). Their BAFO markups ranged from 26 to 35 percent. MCSS and Spear's BAFO markups were significantly out of range of the in-house estimate and NYC Transit's Cost Price Analysis Unit's objective. They were not recommended for award. NYC Transit considers the final proposals of the selected firms to be fair and reasonable.
This RFP was originally intended for award to approximately five firms. However, in anticipation of a substantial increase in the need for temporary staffing to support NYC Transit's Capital Program and the Corporate Plan Fast Forward, and consistent with NYC Transit's objective to expand and diversify its vendor pool, the SC has recommended award to these nine firms.
The nine selected firms were previously awarded the following staffing or related contracts for the MT A or its affiliates: Hepco - CM-1413 and CM-1418; Info Tran- 14073-2300; Kohl -CM-1510 and CM-1536; L.J. Gonzer-CM-1417 and CM-1422; Metro TechCM-1416 and CM-1421; Nesco-CM-1263 and CM-1297; NWP- 129525 and 15333-0300A; Peak-CM-1414 and CM-1419; Rotator -CM-1415 and CM-1420.
Master Page # 188 of 242 - New York City Transit and Bus Committee Meeting 7/23/2018________________________________________________________________________________
Staff Summary D New York City Transit
Page 3 of 3
M/W/DBE Information The MTA Department of Diversity and Civil Rights has established a 0 percent M/WBE and 0 percent DBE goals on this procurement due to the single-trade and lack of subcontracting opportunities. Of the nine pre-qualified firms, the following three firms will be solicited from the pool of pre-qualified firms to maximize the M/WBE/DBE/SDVOB prime contracting participation: Hepco (SDVOB), Info Tran (M/DBE), and NWP (W/DBE).
Alternatives Perform the work using in-house personnel. At this time, CPM lacks available staff with the expertise necessary to perform the specific tasks required under the scope of work for these projects.
Capital Program Reporting These contracts have been reviewed for compliance with the requirements of the 1986 legislation application to Capital Contract Awards and the necessary inputs have been secured from the responsible functional departments.
Impact on Funding These contracts will be funded with federal/MT A funds provided on a work-order basis by the individual capital project requiring these services. Work Orders will not be issued until approved WAR certificates are received.
Recommendation That the Board approve the award of 18 contracts to nine firms on a competitive basis to provide IQ Staffing Services for Miscellaneous Projects to support NYC Transit/MT ACC, TBT A, and related MT A agencies on an as-needed basis for a period of 60 months with an estimated aggregate value of$200 million with 110 rninimum guaranteed amount to be awarded.
Master Page # 189 of 242 - New York City Transit and Bus Committee Meeting 7/23/2018________________________________________________________________________________
Staff Summary a New York City Transit
Page 1 of 2
Item Number 20-28 SUMMARY INFORMATION
Department, Department Head Name: Vendor Name Contract No.
~S=e~~-Plochochi Various (See "Purpose" section) SSE 147199
Description Independent Medical Examinations
Internal Aoorovals Total Amount Order Approval Approval $33,500,000 (estimated aggregate value) 1 Materiel 6 President Contract Term (including Options, if any)
S\P August 1, 2018-July 31, 2023
2 x Law 7
~~ =f [ t ~ I 1 t . Option(s) included in Total
DYes ~No Amount? Renewal? DYes ~No
CFO 3 x 8 Procurement Type
~Competitive D Noncompetitive
4 x MTAHQ Human 9 Resources Solicitation Type
- ~RFP D Bid D Other:
(~Q) EVP 10 Funding Source ~ Operating D Capital D Federal D Other:
Purpose To obtain approval from the Board to award nine competitively negotiated personal service contracts to provide independent medical examinations and related services for NYC Transit's Law Department and MTA Headquarters' ("MTA-HQ") Human Resources Department for a period of five years, with an estimated aggregate value of$33 ,500,000 ($32,550,000 for NYC Transit and $950,000 for MT A-HQ) to the firms listed below. These will be zero dollar-based contracts and have no minimum guarantee of any assignments. One firm, Utopia Claims Concepts, Inc., is a certified MBE and one firm, Juris Solutions, Inc., is a certified WBE.
I. Dane Street, LLC ("Dane Street") 6. Psychiatric Solutions of Westchester, PC (" Dr. Raff') 2. D&D Medical Associates, PC ("D&D") 7. Peter Sass, MD ("Dr. Peter Sass") 3. Juris Solutions, Inc. ("Juris") - WBE 8. Support Claim Services, Inc. ("SCS") 4. Optimum Consulting Associates, LLC ("Optimum") 9. Utopia Claims Concepts, Inc. ("Utopia") - MBE 5. Professional Evaluation Group, Inc. ("PEG")
Discussion Under these five-year contracts, the firms will provide medical subject matter experts to conduct independent medical examinations and medical record reviews as well as provide court testimony and related services on an as-needed basis. These services are required in connection with four different categories of claims: workers' compensation claims, personal injury lawsuits (tort litigation), claims for medical costs of injuries covered under New York's automobile No-Fault Law ("No-Fault Claims"), and disability retirement applications. These indefinite quantity contracts are proposed to be awarded to the independent medical examination ("JME") firms identified above, to provide physicians in various specialties, as requested by NYC Transit and MT A-HQ for particular assignments. Fees will be paid to the firms on a per-assignment basis in accordance with the negotiated contractual price schedules. There is no minimum number of examinations guaranteed to any firm.
Award of these contracts will provide access to a wide array of medical experts provided by the pool of nine contractors. It will ensure the availability of doctors with subject matter expertise in 39 distinct specialties (such as orthopedics, neurology, and radiology) to perform necessary assignments in particular matters as determined by in-house counsel , claim examiners, and others. The contractors will provide medical examinations and other related services such as follow-up exams, reporting, medical record reviews, peer reviews, and court testimony.
Procurement conducted an extensive outreach to enhance competition, which resulted in receipt of 17 proposals in response to the publicly advertised Request for Proposals (" RFP"). All 17 proposals were evaluated by the Selection Committee ("SC") in accordance with the evaluation criteria in the RFP, which included such technical criteria as (I) proposer' s demonstrated knowledge and relevant experience
Master Page # 190 of 242 - New York City Transit and Bus Committee Meeting 7/23/2018________________________________________________________________________________
New York City Transit Staff Summary Page 2 of 2
including quality of assigned personnel, and experience and stability of proposer's organization, (2) proposer's plan for managing the work in accordance with the contract requirements including the plan for timely examinations and reports, and (3) proposer's diversity practices. The evaluation criteria also included overall project cost and other relevant matters.
Based upon the technical evaluations, the SC voted to invite 11 firms to give oral presentations: Dane Street; D&D; Industrial Medicine Associates, PC; Juris; Optimum; PEG; Patient Focus Medical Association of NY, PC; Dr. Raff; Dr. Peter Sass; SCS; and Utopia. The firms not selected to give oral presentations did not demonstrate sufficient experience to meet the requirements of the scope of work in the RFP.
Following oral presentations, pricing, which had been analyzed by NYC Transit's Cost Price Analysis Unit ("Cost Price Analysis"), was presented to the SC. Subsequently, the SC unanimously voted to invite nine firms for negotiations: Dane Street, D&D, Juris, Optimum, PEG, Dr. Raff, Dr. Peter Sass, SCS, and Utopia. Two firms that were eliminated from further consideration did not demonstrate the level of experience and technical skills necessary to meet the business needs required under this RFP, such as scheduling, reporting, and availability of experts to provide testimony. In addition, the unit prices of these two firms were the highest compared to the remaining proposers.
Negotiations with the remammg nine proposers focused on pncmg and contractual terms and conditions. Upon completion of negotiations, Best and Final Offers ("BAFOs") were requested, and were received on April 18, 2018. Proposers were requested to provide pricing for services by physicians in 39 distinct specialties, with variations in the specific nature of services to be provided for the four different categories of claims (workers' compensation, tort litigation, No-Fault, and disability retirement applications). However, the RFP did not require proposers to provide pricing for all specialties.
The SC reviewed the BAFOs in accordance with the evaluation criteria in the RFP and unanimously recommended all nine finalists for award. The SC determined that each of the firms were technically qualified to perfonn the contract work based on their experience in the industry and past performance providing independent medical examination services to various government and private clients. All reference checks were positive. Cost Price Analysis developed a range of acceptable prices for individual specialties which are deemed fair and reasonable based on market pricing and the in-house estimate. Specialties for which a proposer's BAFO prices were above this range were not recommended for award to that proposer. While no awardee will receive an award for all specialties, the aggregate awards to the nine finalists were detennined by the SC to provide sufficient coverage for all specialties. Most specialties have coverage of three to six firms per specialty and only four seldom-used specialties have coverage by fewer than two finns per specialty. As noted previously, the contracts do not guarantee a minimum quantity of assignments to a firm. The prices have been found to be fair and reasonable based on the competitive nature of the RFP and in comparison to the in-house estimate.
M/W/DBE Information The MT A Department of Diversity and Civil Rights established goals of 0 percent MBE and 0 percent WBE for this contract due to insufficient availability ofM/WBE firms in the marketplace.
Impact on Funding Approved funding is available in Law Department's Operating Budget under Account No. 712701, Responsibility Center No. 6314 and Function No. 930 and in the MTA-HQ's Human Resources Department budget.
Alternatives None recommended. NYC Transit cannot meet these needs through direct employment of physicians as it requires access to independent medical experts in a variety of specialties to provide these claim-related medical examination services.
Recommendations It is recommended that the Board approve the award as described in the "Purpose" section.
Master Page # 191 of 242 - New York City Transit and Bus Committee Meeting 7/23/2018________________________________________________________________________________
JULY 2018
LIST OF RATIFICATIONS FOR BOARD APPROVAL
Procurements Requiring Majority Vote: K. Ratification of Completed Procurement Actions (Involving Schedule E–J)
(Staff Summaries required for items requiring Board approval.)
1. E.E. Cruz & Company, Inc. $982,500 Staff Summary Attached Contract# A-36865.19
Modification to the contract for station renewal and component repairs of three stations in Queens:
121st Street, 111th Street, and 104th Street; in order to fabricate and deliver 34 trackside platform
steel girders for platforms at all three stations.
Skanska USA Civil Northeast, Inc. $5,545,000 (Aggregate) Staff Summary Attached
2. Contract# A-36622B.21 $2,750,000 ↓ 3. Contract# A-36622B.26 $1,800,000 ↓ 4. Contract# A-36622B.28 $995,000 ↓
Modifications to the contract for Enhanced Station Initiative–Package 2: Improvements at the 30th
Avenue, Broadway, 36th Avenue, and 39th Avenue stations along the Astoria Line in Queens, in
order to provide for steel repairs to the platform/span girders at the 30th and 36th Avenue stations
and additional repairs to platform pipe supports as well as the repair of platform precast haunch
support beams at the 30th, 36th, 39th Avenue, and Broadway stations.
Master Page # 192 of 242 - New York City Transit and Bus Committee Meeting 7/23/2018________________________________________________________________________________
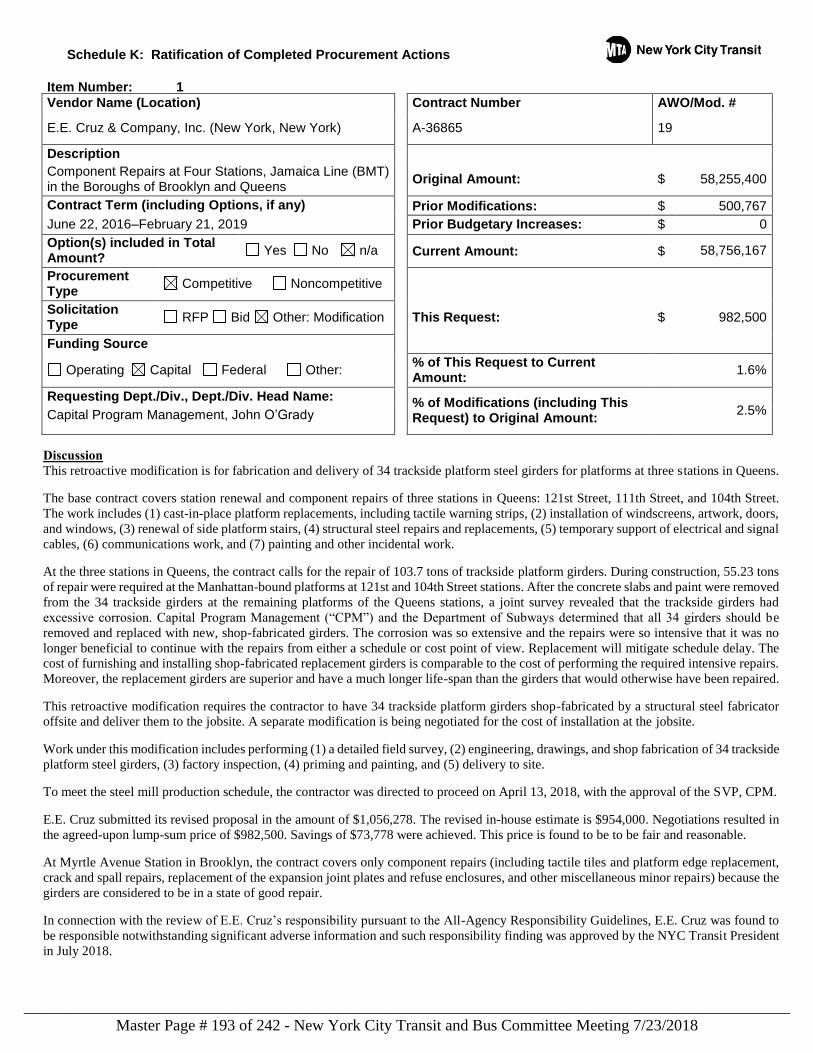
Schedule K: Ratification of Completed Procurement Actions
Item Number: 1
Vendor Name (Location) Contract Number AWO/Mod. #
E.E. Cruz & Company, Inc. (New York, New York) A-36865 19
Description
Component Repairs at Four Stations, Jamaica Line (BMT) in the Boroughs of Brooklyn and Queens
Original Amount: $ 58,255,400
Contract Term (including Options, if any) Prior Modifications: $ 500,767
June 22, 2016–February 21, 2019 Prior Budgetary Increases: $ 0
Option(s) included in Total Amount?
Yes No n/a Current Amount: $ 58,756,167
Procurement Type
Competitive Noncompetitive
Solicitation Type
RFP Bid Other: Modification This Request: $ 982,500
Funding Source
Operating Capital Federal Other: % of This Request to Current Amount:
1.6%
Requesting Dept./Div., Dept./Div. Head Name: % of Modifications (including This Request) to Original Amount:
2.5% Capital Program Management, John O’Grady
Discussion This retroactive modification is for fabrication and delivery of 34 trackside platform steel girders for platforms at three stations in Queens.
The base contract covers station renewal and component repairs of three stations in Queens: 121st Street, 111th Street, and 104th Street.
The work includes (1) cast-in-place platform replacements, including tactile warning strips, (2) installation of windscreens, artwork, doors,
and windows, (3) renewal of side platform stairs, (4) structural steel repairs and replacements, (5) temporary support of electrical and signal
cables, (6) communications work, and (7) painting and other incidental work.
At the three stations in Queens, the contract calls for the repair of 103.7 tons of trackside platform girders. During construction, 55.23 tons
of repair were required at the Manhattan-bound platforms at 121st and 104th Street stations. After the concrete slabs and paint were removed
from the 34 trackside girders at the remaining platforms of the Queens stations, a joint survey revealed that the trackside girders had
excessive corrosion. Capital Program Management (“CPM”) and the Department of Subways determined that all 34 girders should be
removed and replaced with new, shop-fabricated girders. The corrosion was so extensive and the repairs were so intensive that it was no
longer beneficial to continue with the repairs from either a schedule or cost point of view. Replacement will mitigate schedule delay. The
cost of furnishing and installing shop-fabricated replacement girders is comparable to the cost of performing the required intensive repairs.
Moreover, the replacement girders are superior and have a much longer life-span than the girders that would otherwise have been repaired.
This retroactive modification requires the contractor to have 34 trackside platform girders shop-fabricated by a structural steel fabricator
offsite and deliver them to the jobsite. A separate modification is being negotiated for the cost of installation at the jobsite.
Work under this modification includes performing (1) a detailed field survey, (2) engineering, drawings, and shop fabrication of 34 trackside
platform steel girders, (3) factory inspection, (4) priming and painting, and (5) delivery to site.
To meet the steel mill production schedule, the contractor was directed to proceed on April 13, 2018, with the approval of the SVP, CPM.
E.E. Cruz submitted its revised proposal in the amount of $1,056,278. The revised in-house estimate is $954,000. Negotiations resulted in
the agreed-upon lump-sum price of $982,500. Savings of $73,778 were achieved. This price is found to be to be fair and reasonable.
At Myrtle Avenue Station in Brooklyn, the contract covers only component repairs (including tactile tiles and platform edge replacement,
crack and spall repairs, replacement of the expansion joint plates and refuse enclosures, and other miscellaneous minor repairs) because the
girders are considered to be in a state of good repair.
In connection with the review of E.E. Cruz’s responsibility pursuant to the All-Agency Responsibility Guidelines, E.E. Cruz was found to
be responsible notwithstanding significant adverse information and such responsibility finding was approved by the NYC Transit President
in July 2018.
Master Page # 193 of 242 - New York City Transit and Bus Committee Meeting 7/23/2018________________________________________________________________________________
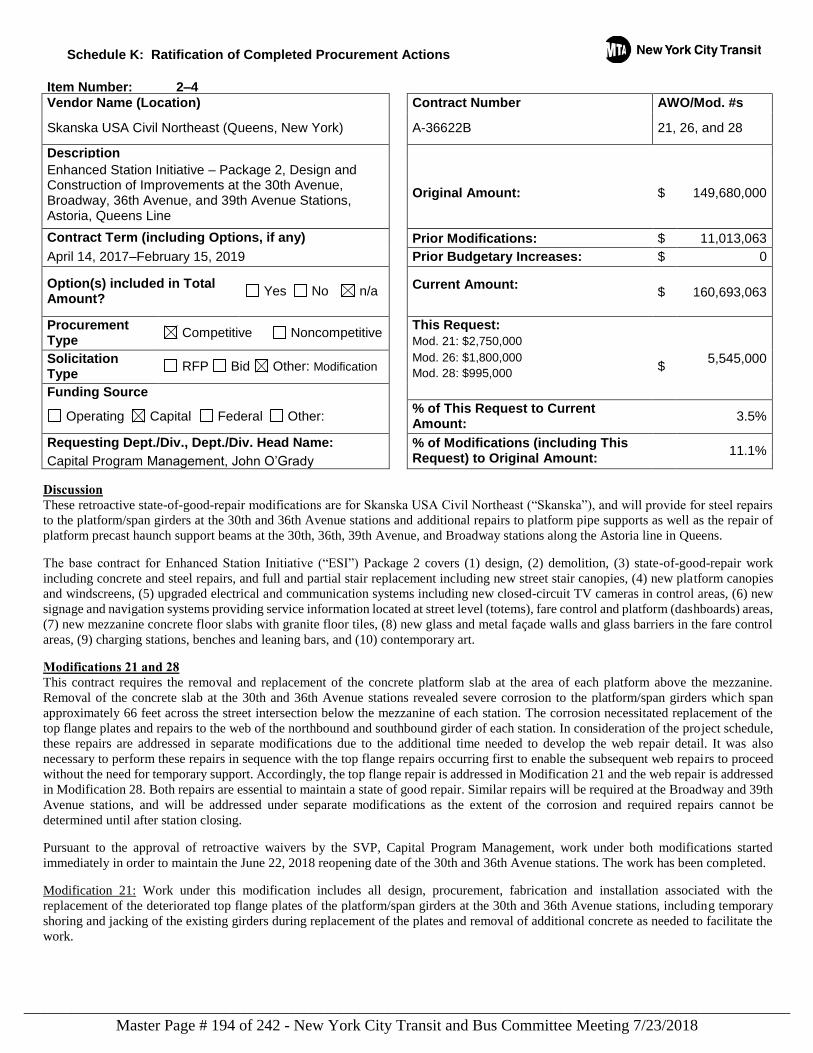
Schedule K: Ratification of Completed Procurement Actions
Item Number: 2–4
Vendor Name (Location) Contract Number AWO/Mod. #s
Skanska USA Civil Northeast (Queens, New York) A-36622B 21, 26, and 28
Description
Enhanced Station Initiative – Package 2, Design and Construction of Improvements at the 30th Avenue, Broadway, 36th Avenue, and 39th Avenue Stations, Astoria, Queens Line
Original Amount: $ 149,680,000
Contract Term (including Options, if any) Prior Modifications: $ 11,013,063
April 14, 2017–February 15, 2019 Prior Budgetary Increases: $ 0
Option(s) included in Total Amount?
Yes No n/a Current Amount:
$
160,693,063
Procurement Type
Competitive Noncompetitive This Request:
Mod. 21: $2,750,000
Solicitation Type
RFP Bid Other: Modification Mod. 26: $1,800,000
Mod. 28: $995,000
$ 5,545,000
Funding Source
Operating Capital Federal Other: % of This Request to Current Amount:
3.5%
Requesting Dept./Div., Dept./Div. Head Name: % of Modifications (including This Request) to Original Amount:
11.1% Capital Program Management, John O’Grady
Discussion These retroactive state-of-good-repair modifications are for Skanska USA Civil Northeast (“Skanska”), and will provide for steel repairs
to the platform/span girders at the 30th and 36th Avenue stations and additional repairs to platform pipe supports as well as the repair of
platform precast haunch support beams at the 30th, 36th, 39th Avenue, and Broadway stations along the Astoria line in Queens.
The base contract for Enhanced Station Initiative (“ESI”) Package 2 covers (1) design, (2) demolition, (3) state-of-good-repair work
including concrete and steel repairs, and full and partial stair replacement including new street stair canopies, (4) new platform canopies
and windscreens, (5) upgraded electrical and communication systems including new closed-circuit TV cameras in control areas, (6) new
signage and navigation systems providing service information located at street level (totems), fare control and platform (dashboards) areas,
(7) new mezzanine concrete floor slabs with granite floor tiles, (8) new glass and metal façade walls and glass barriers in the fare control
areas, (9) charging stations, benches and leaning bars, and (10) contemporary art.
Modifications 21 and 28 This contract requires the removal and replacement of the concrete platform slab at the area of each platform above the mezzanine.
Removal of the concrete slab at the 30th and 36th Avenue stations revealed severe corrosion to the platform/span girders which span
approximately 66 feet across the street intersection below the mezzanine of each station. The corrosion necessitated replacement of the
top flange plates and repairs to the web of the northbound and southbound girder of each station. In consideration of the project schedule,
these repairs are addressed in separate modifications due to the additional time needed to develop the web repair detail. It was also
necessary to perform these repairs in sequence with the top flange repairs occurring first to enable the subsequent web repairs to proceed
without the need for temporary support. Accordingly, the top flange repair is addressed in Modification 21 and the web repair is addressed
in Modification 28. Both repairs are essential to maintain a state of good repair. Similar repairs will be required at the Broadway and 39th
Avenue stations, and will be addressed under separate modifications as the extent of the corrosion and required repairs cannot be
determined until after station closing.
Pursuant to the approval of retroactive waivers by the SVP, Capital Program Management, work under both modifications started
immediately in order to maintain the June 22, 2018 reopening date of the 30th and 36th Avenue stations. The work has been completed.
Modification 21: Work under this modification includes all design, procurement, fabrication and installation associated with the
replacement of the deteriorated top flange plates of the platform/span girders at the 30th and 36th Avenue stations, including temporary
shoring and jacking of the existing girders during replacement of the plates and removal of additional concrete as needed to facilitate the
work.
Master Page # 194 of 242 - New York City Transit and Bus Committee Meeting 7/23/2018________________________________________________________________________________
Schedule K: Ratification of Completed Procurement Actions
Skanska submitted its proposal in the amount of $3,360,938. The revised in-house estimate is $2,549,893. Negotiations resulted in the
agreed-upon lump-sum price of $2,750,000. Savings of $610,938 were achieved. Procurement finds this price to be fair and reasonable.
Approval was also obtained from the SVP, Operations Support authorizing payment up to the agreed amount of this modification prior
to its approval.
Modification 28: Work under this modification includes all design, procurement, fabrication, and installation of steel plates to repair
the web of the platform/span girders at the 30th and 36th Avenue stations, including removal of the existing concrete track slab adjacent
to the girder, removal of rivets and existing angles, cleaning the steel to accept the new steel plates, installation of the steel plates and
restoration of the track slab including rebar, structural concrete, waterproofing, and topping slab.
Skanska submitted its proposal in the amount of $1,260,210. The in-house estimate is $989,852. Negotiations resulted in the agreed-
upon lump-sum price of $995,000. Savings of $265,210 were achieved. Procurement finds this price to be fair and reasonable.
Modification 26 This contract includes a unit price item for the repair (in all four stations) of 240 platform pipe supports under existing precast concrete
platform panels. Skanska’s Field Condition Surveys revealed that the damage to the platform pipe supports was more numerous (973
supports) and more severe than anticipated in the unit price item. In addition, the Field Condition Surveys identified significant
deterioration to the concrete haunches of the precast platform panels at 54 locations, the repairs for which were not considered in this
contract, and include the installation of steel haunch support beams. The Design/Builder determined that the additional repairs were
necessary to bring the platform into a state of good repair and presented its findings and proposed repair details, which were accepted
by NYC Transit.
The scope of work under this modification, at all four stations, includes (1) the repair of 973 precast concrete platform pipe supports
based on a more robust repair detail, (2) repair of the concrete haunches of the precast platform panels at 54 locations, and (3) a credit
for the contract unit price item.
Pursuant to the approval of a retroactive waiver by the SVP, Capital Program Management, work at the 30th and 36th Avenue stations
was started immediately in order to maintain their June 22, 2018 reopening date. The work at these stations has been completed.
Skanska submitted its proposal in the net amount of $2,063,363. The in-house estimate is in the net amount of $1,706,391. Negotiations
resulted in the agreed-upon net lump-sum price of $1,800,000. Savings of $263,363 were achieved. Procurement finds this price to be
fair and reasonable.
In connection with a previous contract awarded to Skanska, Skanska was found to be responsible notwithstanding significant adverse
information (“SAI”) pursuant to the All-Agency Responsibility Guidelines and such responsibility finding was approved by the MTA
Chairman and Chief Executive Officer in November 2014. No new SAI has been found relating to Skanska and Skanska has been
found to be responsible.
Master Page # 195 of 242 - New York City Transit and Bus Committee Meeting 7/23/2018________________________________________________________________________________
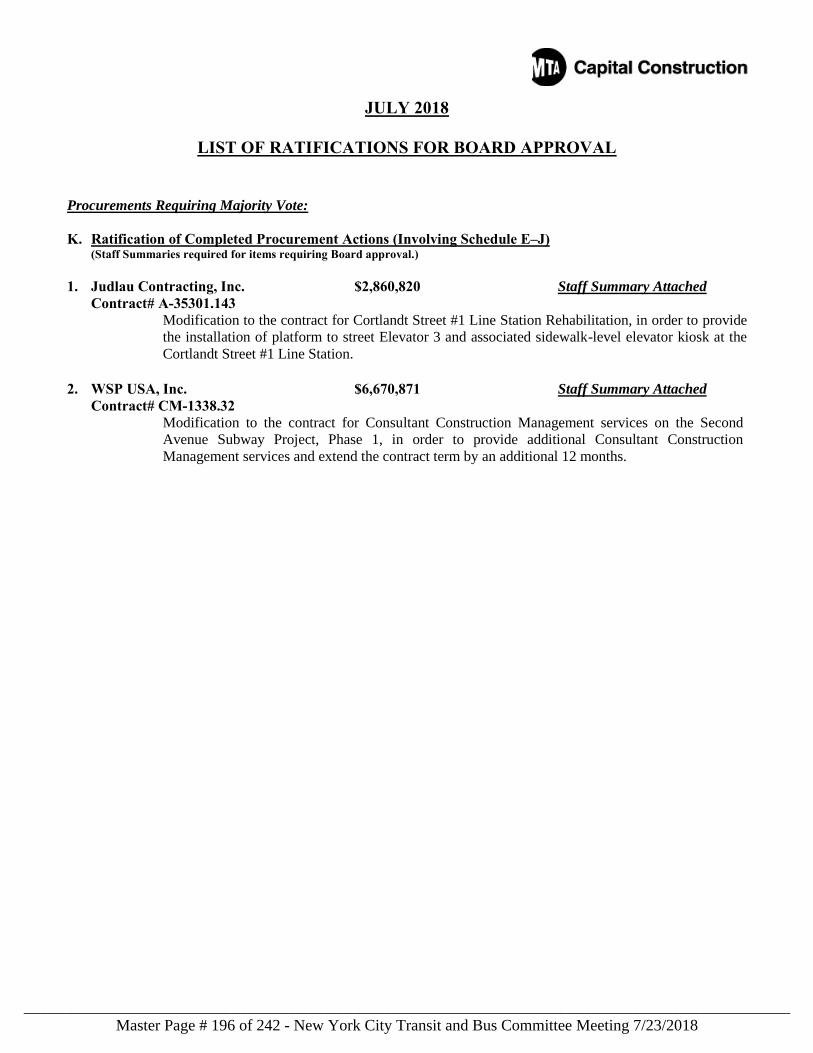
JULY 2018
LIST OF RATIFICATIONS FOR BOARD APPROVAL
Procurements Requiring Majority Vote: K. Ratification of Completed Procurement Actions (Involving Schedule E–J)
(Staff Summaries required for items requiring Board approval.)
1. Judlau Contracting, Inc. $2,860,820 Staff Summary Attached Contract# A-35301.143
Modification to the contract for Cortlandt Street #1 Line Station Rehabilitation, in order to provide
the installation of platform to street Elevator 3 and associated sidewalk-level elevator kiosk at the
Cortlandt Street #1 Line Station.
2. WSP USA, Inc. $6,670,871 Staff Summary Attached
Contract# CM-1338.32 Modification to the contract for Consultant Construction Management services on the Second
Avenue Subway Project, Phase 1, in order to provide additional Consultant Construction
Management services and extend the contract term by an additional 12 months.
Master Page # 196 of 242 - New York City Transit and Bus Committee Meeting 7/23/2018________________________________________________________________________________
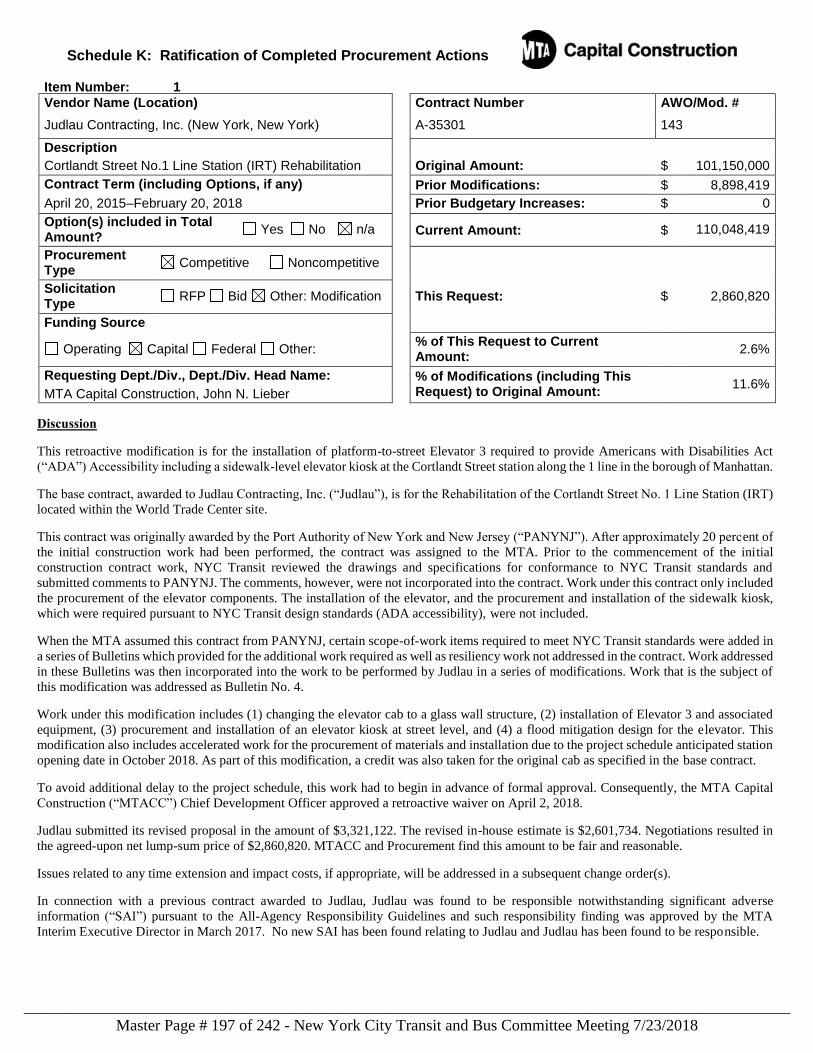
Schedule K: Ratification of Completed Procurement Actions
Item Number: 1
Vendor Name (Location) Contract Number AWO/Mod. #
Judlau Contracting, Inc. (New York, New York) A-35301 143
Description
Cortlandt Street No.1 Line Station (IRT) Rehabilitation Original Amount: $ 101,150,000
Contract Term (including Options, if any) Prior Modifications: $ 8,898,419
April 20, 2015–February 20, 2018 Prior Budgetary Increases: $ 0
Option(s) included in Total Amount?
Yes No n/a Current Amount: $ 110,048,419
Procurement Type
Competitive Noncompetitive
Solicitation Type
RFP Bid Other: Modification This Request: $ 2,860,820
Funding Source
Operating Capital Federal Other: % of This Request to Current Amount:
2.6%
Requesting Dept./Div., Dept./Div. Head Name: % of Modifications (including This Request) to Original Amount:
11.6% MTA Capital Construction, John N. Lieber
Discussion
This retroactive modification is for the installation of platform-to-street Elevator 3 required to provide Americans with Disabilities Act
(“ADA”) Accessibility including a sidewalk-level elevator kiosk at the Cortlandt Street station along the 1 line in the borough of Manhattan.
The base contract, awarded to Judlau Contracting, Inc. (“Judlau”), is for the Rehabilitation of the Cortlandt Street No. 1 Line Station (IRT)
located within the World Trade Center site.
This contract was originally awarded by the Port Authority of New York and New Jersey (“PANYNJ”). After approximately 20 percent of
the initial construction work had been performed, the contract was assigned to the MTA. Prior to the commencement of the initial
construction contract work, NYC Transit reviewed the drawings and specifications for conformance to NYC Transit standards and
submitted comments to PANYNJ. The comments, however, were not incorporated into the contract. Work under this contract only included
the procurement of the elevator components. The installation of the elevator, and the procurement and installation of the sidewalk kiosk,
which were required pursuant to NYC Transit design standards (ADA accessibility), were not included.
When the MTA assumed this contract from PANYNJ, certain scope-of-work items required to meet NYC Transit standards were added in
a series of Bulletins which provided for the additional work required as well as resiliency work not addressed in the contract. Work addressed
in these Bulletins was then incorporated into the work to be performed by Judlau in a series of modifications. Work that is the subject of
this modification was addressed as Bulletin No. 4.
Work under this modification includes (1) changing the elevator cab to a glass wall structure, (2) installation of Elevator 3 and associated
equipment, (3) procurement and installation of an elevator kiosk at street level, and (4) a flood mitigation design for the elevator. This
modification also includes accelerated work for the procurement of materials and installation due to the project schedule anticipated station
opening date in October 2018. As part of this modification, a credit was also taken for the original cab as specified in the base contract.
To avoid additional delay to the project schedule, this work had to begin in advance of formal approval. Consequently, the MTA Capital
Construction (“MTACC”) Chief Development Officer approved a retroactive waiver on April 2, 2018.
Judlau submitted its revised proposal in the amount of $3,321,122. The revised in-house estimate is $2,601,734. Negotiations resulted in
the agreed-upon net lump-sum price of $2,860,820. MTACC and Procurement find this amount to be fair and reasonable.
Issues related to any time extension and impact costs, if appropriate, will be addressed in a subsequent change order(s).
In connection with a previous contract awarded to Judlau, Judlau was found to be responsible notwithstanding significant adverse
information (“SAI”) pursuant to the All-Agency Responsibility Guidelines and such responsibility finding was approved by the MTA
Interim Executive Director in March 2017. No new SAI has been found relating to Judlau and Judlau has been found to be responsible.
Master Page # 197 of 242 - New York City Transit and Bus Committee Meeting 7/23/2018________________________________________________________________________________
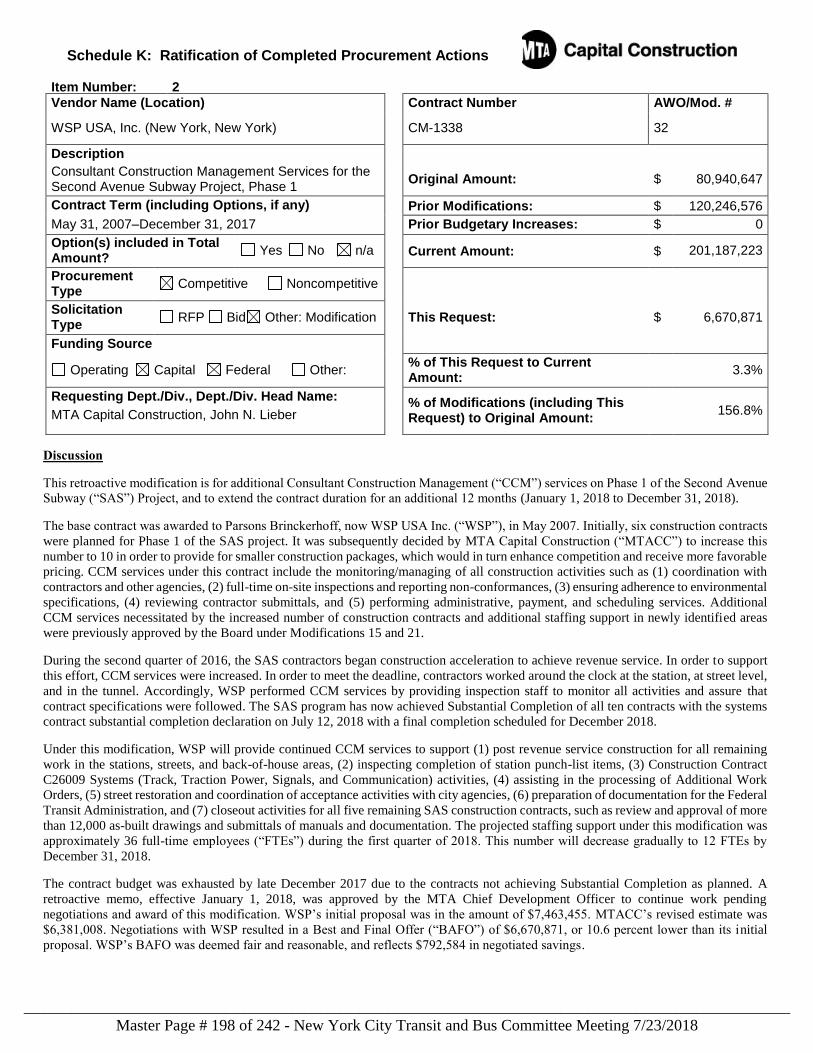
Schedule K: Ratification of Completed Procurement Actions
Item Number: 2
Vendor Name (Location) Contract Number AWO/Mod. #
WSP USA, Inc. (New York, New York) CM-1338 32
Description
Consultant Construction Management Services for the Second Avenue Subway Project, Phase 1
Original Amount: $ 80,940,647
Contract Term (including Options, if any) Prior Modifications: $ 120,246,576
May 31, 2007–December 31, 2017 Prior Budgetary Increases: $ 0
Option(s) included in Total Amount?
Yes No n/a Current Amount: $ 201,187,223
Procurement Type
Competitive Noncompetitive
Solicitation Type
RFP Bid Other: Modification This Request: $ 6,670,871
Funding Source
Operating Capital Federal Other: % of This Request to Current Amount:
3.3%
Requesting Dept./Div., Dept./Div. Head Name: % of Modifications (including This Request) to Original Amount:
156.8% MTA Capital Construction, John N. Lieber
Discussion
This retroactive modification is for additional Consultant Construction Management (“CCM”) services on Phase 1 of the Second Avenue
Subway (“SAS”) Project, and to extend the contract duration for an additional 12 months (January 1, 2018 to December 31, 2018).
The base contract was awarded to Parsons Brinckerhoff, now WSP USA Inc. (“WSP”), in May 2007. Initially, six construction contracts
were planned for Phase 1 of the SAS project. It was subsequently decided by MTA Capital Construction (“MTACC”) to increase this
number to 10 in order to provide for smaller construction packages, which would in turn enhance competition and receive more favorable
pricing. CCM services under this contract include the monitoring/managing of all construction activities such as (1) coordination with
contractors and other agencies, (2) full-time on-site inspections and reporting non-conformances, (3) ensuring adherence to environmental
specifications, (4) reviewing contractor submittals, and (5) performing administrative, payment, and scheduling services. Additional
CCM services necessitated by the increased number of construction contracts and additional staffing support in newly identified areas
were previously approved by the Board under Modifications 15 and 21.
During the second quarter of 2016, the SAS contractors began construction acceleration to achieve revenue service. In order to support
this effort, CCM services were increased. In order to meet the deadline, contractors worked around the clock at the station, at street level,
and in the tunnel. Accordingly, WSP performed CCM services by providing inspection staff to monitor all activities and assure that
contract specifications were followed. The SAS program has now achieved Substantial Completion of all ten contracts with the systems
contract substantial completion declaration on July 12, 2018 with a final completion scheduled for December 2018.
Under this modification, WSP will provide continued CCM services to support (1) post revenue service construction for all remaining
work in the stations, streets, and back-of-house areas, (2) inspecting completion of station punch-list items, (3) Construction Contract
C26009 Systems (Track, Traction Power, Signals, and Communication) activities, (4) assisting in the processing of Additional Work
Orders, (5) street restoration and coordination of acceptance activities with city agencies, (6) preparation of documentation for the Federal
Transit Administration, and (7) closeout activities for all five remaining SAS construction contracts, such as review and approval of more
than 12,000 as-built drawings and submittals of manuals and documentation. The projected staffing support under this modification was
approximately 36 full-time employees (“FTEs”) during the first quarter of 2018. This number will decrease gradually to 12 FTEs by
December 31, 2018.
The contract budget was exhausted by late December 2017 due to the contracts not achieving Substantial Completion as planned. A
retroactive memo, effective January 1, 2018, was approved by the MTA Chief Development Officer to continue work pending
negotiations and award of this modification. WSP’s initial proposal was in the amount of $7,463,455. MTACC’s revised estimate was
$6,381,008. Negotiations with WSP resulted in a Best and Final Offer (“BAFO”) of $6,670,871, or 10.6 percent lower than its initial
proposal. WSP’s BAFO was deemed fair and reasonable, and reflects $792,584 in negotiated savings.
Master Page # 198 of 242 - New York City Transit and Bus Committee Meeting 7/23/2018________________________________________________________________________________
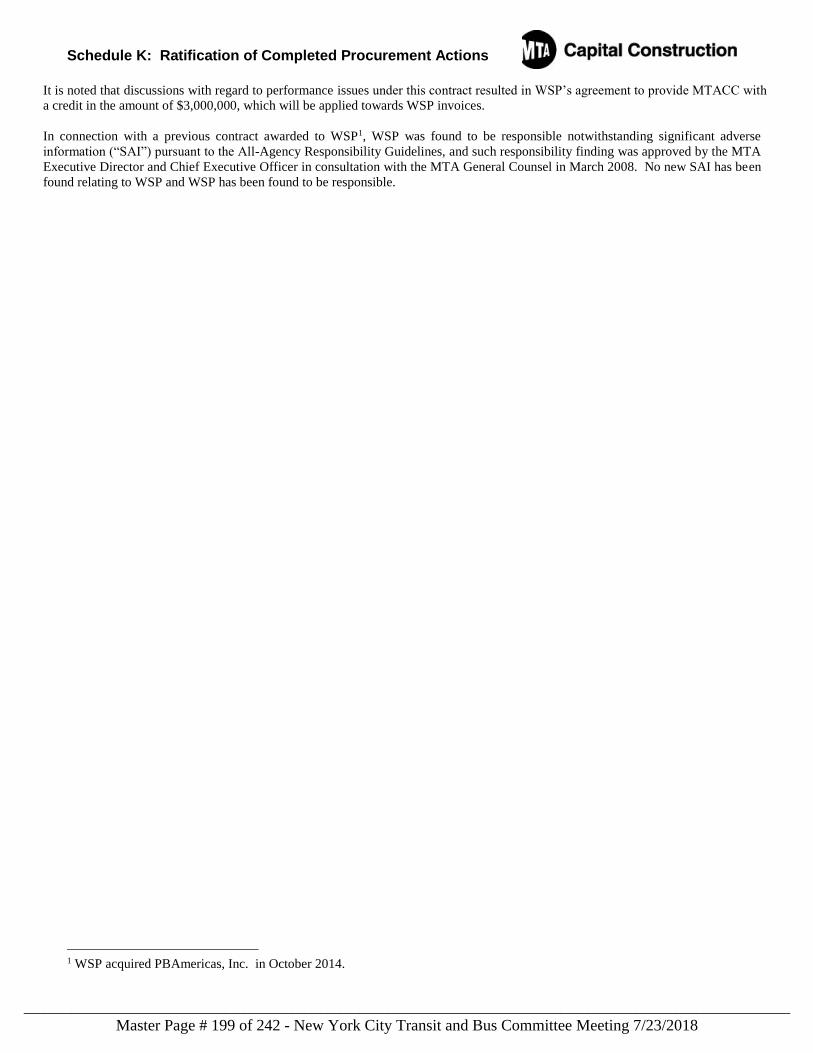
Schedule K: Ratification of Completed Procurement Actions
It is noted that discussions with regard to performance issues under this contract resulted in WSP’s agreement to provide MTACC with
a credit in the amount of $3,000,000, which will be applied towards WSP invoices.
In connection with a previous contract awarded to WSP1, WSP was found to be responsible notwithstanding significant adverse
information (“SAI”) pursuant to the All-Agency Responsibility Guidelines, and such responsibility finding was approved by the MTA
Executive Director and Chief Executive Officer in consultation with the MTA General Counsel in March 2008. No new SAI has been
found relating to WSP and WSP has been found to be responsible.
1 WSP acquired PBAmericas, Inc. in October 2014.
Master Page # 199 of 242 - New York City Transit and Bus Committee Meeting 7/23/2018________________________________________________________________________________
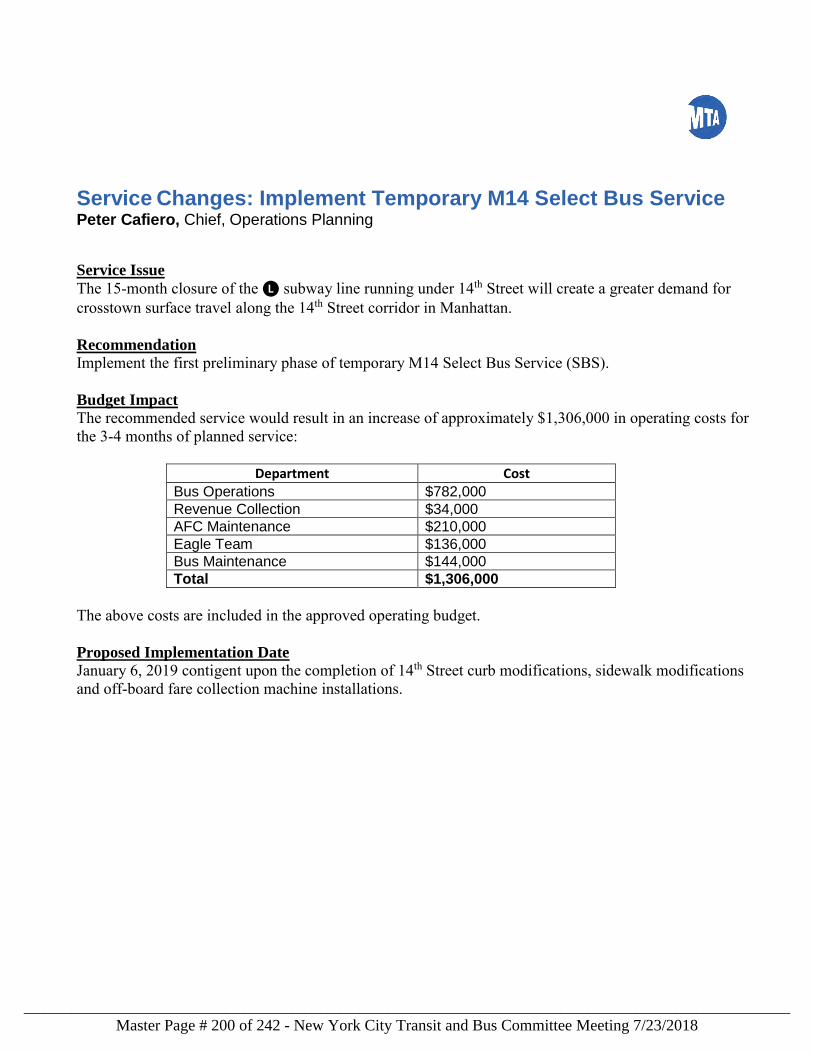
Service Changes: Implement Temporary M14 Select Bus Service Peter Cafiero, Chief, Operations Planning
Service Issue
The 15-month closure of the L subway line running under 14th Street will create a greater demand for crosstown surface travel along the 14th Street corridor in Manhattan.
Recommendation
Implement the first preliminary phase of temporary M14 Select Bus Service (SBS).
Budget Impact The recommended service would result in an increase of approximately $1,306,000 in operating costs for the 3-4 months of planned service:
Department Cost Bus Operations $782,000
Revenue Collection $34,000
AFC Maintenance $210,000
Eagle Team $136,000
Bus Maintenance $144,000
Total $1,306,000
The above costs are included in the approved operating budget.
Proposed Implementation Date January 6, 2019 contigent upon the completion of 14th Street curb modifications, sidewalk modifications and off-board fare collection machine installations.
Master Page # 200 of 242 - New York City Transit and Bus Committee Meeting 7/23/2018________________________________________________________________________________
Staff Summary
Subject Implement Temporary M14 Select Bus Service in Manhattan
Department Operations Planning
Department Head Name Peter G. Cafiero
Department Head Signature
Project Manager Name ·
Order To
1 President
Board Action
Date Approval
x 2 NYCTComm
3 Board
Purpose
Info
x
8 New York City Transit
Date July 11, 2018
Vendor Name N/A
Contract Number NIA
Contract Manager Name NIA
Table of Contents Ref# N/A
Internal Approvals
Other
8 Preside
7
6
5
To obtain Presidential approval to implement the first phase of the temporary M14 Select Bus Service (SBS) in Manhattan. This staff summary also addresses the required schedule and fare collection changes.
Discussion In 2012, the Canarsie Tunnel was seriously damaged by Superstorm Sandy. To repair the damage, the tunnel must be temporarily closed for 15 months. There will be no G service operating in Manhattan or between Brooklyn and Manhattan for the duration of the closure. The 15-month closure of the G running under 14th Street will create a greater demand for crosstown surface travel along the 14th Street corridor in Manhattan. There will be ridership disruption to the approximately 50,000 G riders who stay within 1
Manhattan (including transfers from north-south subway lines) and a portion of the 225,000 riders who typically use the G for travel between Manhattan and Brooklyn. These riders will need to be accommodated in addition to the 30,000 customers per day currently using the existing M14A and M14D buses.
Recommendation The first phase, a preliminary temporary M14 SBS route, will be implemented before the tunnel closure, when NYC DOT modifies 14th Street curbs and sidewalks, and NYCT installs SBS off-board fare collection machines at M14 SBS stops. The service will operate across 14th Street between First Avenue and Tenth Avenue and will operate in addition to the existing M14A and M14D, seven days per week from 6 a.m. to 10 p.m. approximately every eight minutes. Starting this SBS service in January 2019, three months before the expected subway closure, will allow NYCT and NYC DOT to make any necessary adjustments to the bus service and street design before they become critical for diverted G customers. Although this service is planned to start in January 2019, implementation is contigent upon the completion of 14th Street curb modifications, sidewalk modifications and off-board fare collection machine installations.
Starting a week or two prior to the start of the tunnel closure, and continuing throughout the 15-month construction period, the Ml 4 SBS will be extended east to a temporary bus terminal adjacent to the planned
Master Page # 201 of 242 - New York City Transit and Bus Committee Meeting 7/23/2018________________________________________________________________________________
Staff Summary D New York City Transit Stuyvesant Cove ferry terminal on the East River. This main phase of the temporary M14 SBS will operate in addition to the M14A and M14D, daily with a headway of under two minutes during peak hours.
The main phase of the temporary service will focus M14 SBS stops to match current subway transfer locations, with the exception of Third A venue, and will provide temporary passenger facilities and enhanced pedestrian areas. All local M14A/D stops will remain where they are today, with the exception of three stops near Union Square. To allow for needed pedestrian space, the westbound M14A/D local bus stop at the far side of Union Square West will be temporarily removed. The eastbound M14A/D local bus stops at the far side of 5th A venue and the far side of University Place will be combined as one new, improved bus stop on the near side of University Place. A route map and list of stops are included at the end of this document (Attachments 1 and 2).
In order for NYCT to provide adequate capacity and competitive travel times for the temporary increase in bus service along 14th Street, bus priority lanes and operational restrictions for cars and trucks will be required. The street design for the temporary busway on 14th Street will consist of elements that provide priority for buses and pedestrians along 14th Street between First A venue and Ninth A venue.
Alternatives 1. Do nothing. If no action is taken, the existing M14A and M14D bus routes serving the 14th Street
corridor will be overwhelmed by diverted G riders traveling across 14th Street. Additionally, without a competitive travel option many diverted G riders will shift to other modes of travel including for-hire vehicles (FHV), creating significant traffic congestion in the vicinity of 14th Street.
2. Wait to implement Ml 4 SBS until the tJ shuts down
Budget Impact The recommended service would result in an increase of approximately $1,306,000 in operating costs for the 3-4 months of planned service:
Department Cost Bus Operations $782,000 Revenue Collection $34,000 AFC Maintenance $210,000 Eagle Team $136,000 Bus Maintenance $144,000 Total $1,306,000
The above costs are included in the approved operating budget.
Master Page # 202 of 242 - New York City Transit and Bus Committee Meeting 7/23/2018________________________________________________________________________________
Staff Summary 8 New York City Transit
Implementation Date January 6, 2019 contingent upon the completion of 14th Street curb modifications, and sidewalk modifications and off-board fare collection machine installations.
J
Master Page # 203 of 242 - New York City Transit and Bus Committee Meeting 7/23/2018________________________________________________________________________________
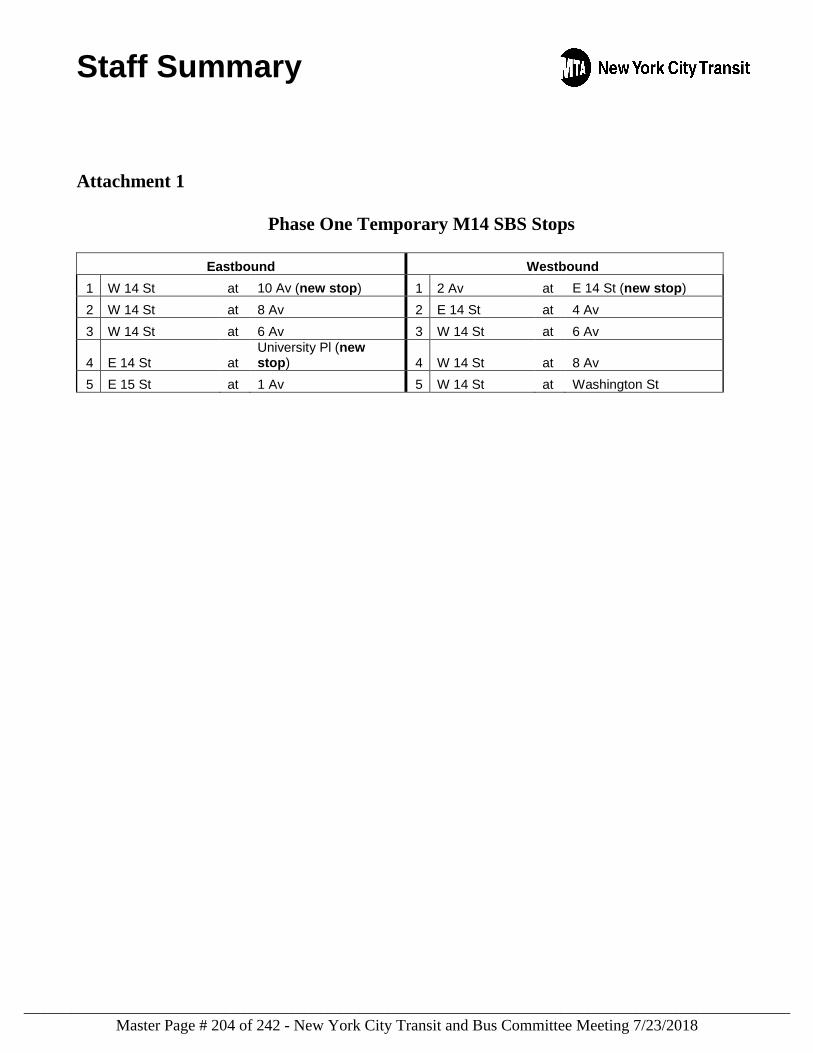
Staff Summary
Attachment 1
Phase One Temporary M14 SBS Stops
Eastbound Westbound
1 W 14 St at 10 Av (new stop) 1 2 Av at E 14 St (new stop)
2 W 14 St at 8 Av 2 E 14 St at 4 Av
3 W 14 St at 6 Av 3 W 14 St at 6 Av
4 E 14 St at University Pl (new stop) 4 W 14 St at 8 Av
5 E 15 St at 1 Av 5 W 14 St at Washington St
Master Page # 204 of 242 - New York City Transit and Bus Committee Meeting 7/23/2018________________________________________________________________________________
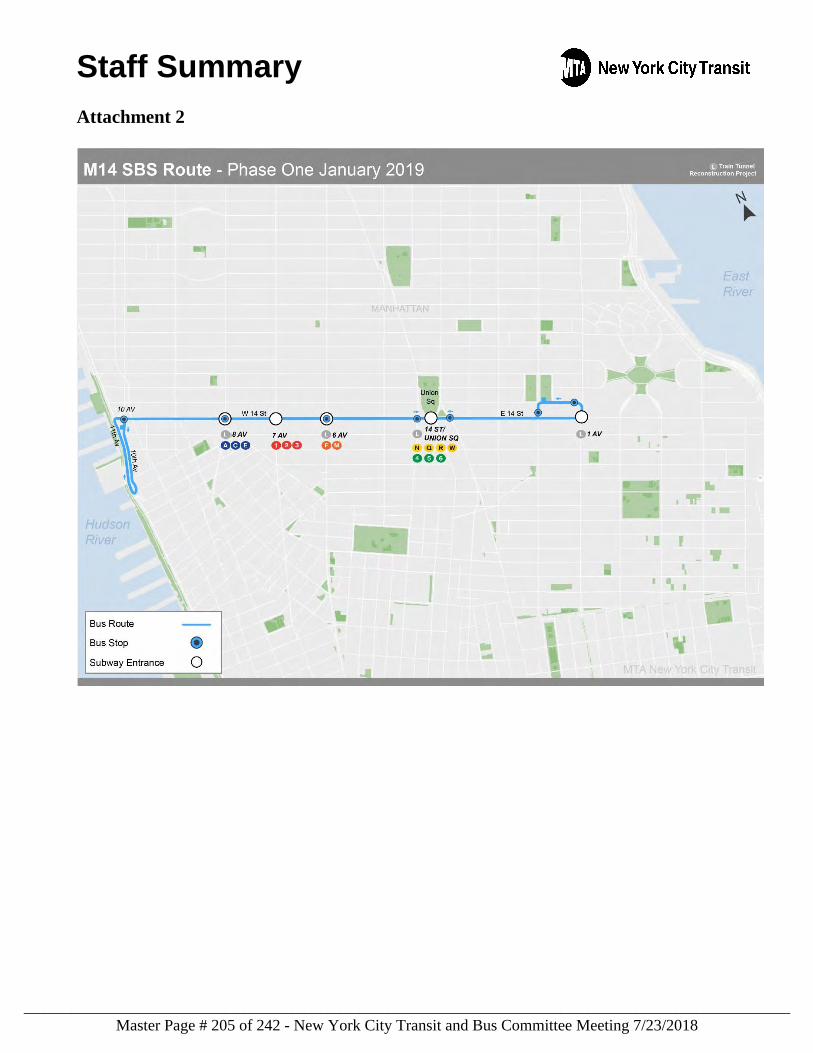
Staff Summary
Attachment 2
Master Page # 205 of 242 - New York City Transit and Bus Committee Meeting 7/23/2018________________________________________________________________________________
Service Changes: Implement B82 Select Bus Service Peter Cafiero, Chief, Operations Planning
Service Issue The B82 Local/Limited service corridor serves nearly 28,000 average weekday riders. The current B82 route provides crosstown service in southern Brooklyn, traveling through dense residential and retail neighborhoods between Coney Island and Spring Creek. The route serves the busy Kings Highway retail corridor, as well as providing connections to multiple subway stations for residents who live far from the subway. Improvements along this route will better and more quickly connect residents to jobs and shopping across southern Brooklyn.
Recommendation Implement B82 Select Bus Service (SBS) in southern Brooklyn, replacing B82 Limited service.
Budget Impact The recommended service revision would result in an increase of approximately $2,900,450 in annual operating costs as follows:
Department Cost Bus Operations $1,823,000
Revenue Collection $70,450
AFC Maintenance $280,000 *
Eagle Team $727,000
Total $2,900,450
*AFC Maintenance will also incur a first year cost of $35,000 for one vehicle
The above costs are included in the approved operating budget.
Ridership is estimated to increase by approximately 2,700 trips per weekday, increasing revenue by approximately $1,170,000 per year. This assumes ridership growth comparable to the Bx12 SBS, a cross-borough route with similar land use patterns.
Proposed Implementation Date Fall 2018
Master Page # 206 of 242 - New York City Transit and Bus Committee Meeting 7/23/2018________________________________________________________________________________
Staff Summary
Subject Implement B82 Select Bus Service in Southern Brooklyn
Department
Department Head Name
Department Head Signature
Project Manager Name
Order To
1 President
Operations Planning
Board Action
Date Approval
x
2 NYCT Comm
3 Board
Purpose
Info
x
8 New York City Transit
Date July 10, 2018
Vendor Name N/A
Contract Number N/A
Contract Manager Name N/A
Table of Contents Ref# N/A
Internal Approvals
Other Order Appr Approval
8 President 4
7 3
6 2
5 Chief Cu Chief 0
To obtain Presidential approval to implement B82 Select Bus Service in southern Brooklyn. This staff summary also addresses the required schedule and fare collection changes.
Discussion MT A New York City Transit (NYCT) has been closely working with the New York City Department of Transportation (NYC DOT) to implement Bus Rapid Transit in New York City. Bus Rapid Transit is a high-performance surface transportation system that incorporates elements such as bus lanes and proof-ofpayment fare collection to bring a noteworthy improvement in speed and service reliability. In New York City, Bus Rapid Transit is branded Select Bus Service (SBS). These features, which are currently in place on 17 routes throughout New York City, have typically improved bus speeds by up to 20% and increased ridership by 10%.
Both data analysis and public input have identified the B82 as a major bus route in need of service improvements, due to its high ridership with 28,000 weekday riders, slow speeds, and its key role in the transit network. The B82 provides a link through dense residential neighborhoods to shopping and jobs. It also connects to the -G>CDG00G subway lines, and 21 bus routes including the B44 SBS and B46 SBS. The B82 SBS will include off-board fare collection, dedicated bus lanes, enhanced and safer bus stops, specially branded low-floor buses, and real-time bus arrival information at many stops.
Service Plan
There will be three routing changes when the B82 SBS starts service:
1. The service will operate in both directions on Glenwood Rd from Rockaway Pkwy to E 103 St. A westbound bus lane will be installed on Glenwood Rd, allowing the streamlining of the circuitous route the westbound B82 uses to access the Rockaway Parkway G train station, and saving several minutes in travel time. The B82 Local and the B6 will also operate via Glenwood Rd on the new bus lane.
Master Page # 207 of 242 - New York City Transit and Bus Committee Meeting 7/23/2018________________________________________________________________________________
Staff Summary 2. The SBS service will operate via Avenue K, between Kings
Highway and Flatlands Ave. This will allow the B82 SBS to avoid the turns on the current “dog-leg” routing via the congested intersections of Flatbush Ave with Flatlands Ave and Kings Highway. The B82 Local service will continue to operate on the existing route via Flatlands Ave and Flatbush Ave to maintain service at existing stops.
3. The western terminal of SBS service will be at Cropsey Ave and Bay 37-38 Streets, at a new boarding island to be built by NYC DOT. All B82 Local trips will serve the Stillwell Avenue terminal in Coney Island. Few riders take the B82 to Coney Island. These changes will reduce overall SBS trip mileage and help to improve service reliability. This will also create a clearer service pattern, compared to now when a complicated mix of Limited and Local service terminates at either Bay 37 St or Stillwell Ave. Riders wishing to go to or from Coney Island will still be able to take the B82 Local service which will have additional trips added, or take the DFNQ subway routes that intersect the B82 and serve Stillwell Ave.
B82 SBS Span a nd F requency The B82 SBS will have an expanded schedule with service throughout the day, replacing current Limited service that only operates in peak periods. SBS service will operate weekdays only, like the current Limited. Service will operate every 8 to 9 minutes during the morning and evening peaks, and every 10 to 12 minutes at off-peak times. An initial 8-10% reduction in running time during peak and off-peak periods respectively will be factored into the schedule as service speed is expected to increase in line with other SBS routes. Additionally, some time points will be eliminated to have service operate as fast as possible.
The B82 SBS will include the stop locations listed in Attachment 1 and mapped in Attachment 2. B82 SBS Features The B82 SBS will include several features found on other SBS routes, including off-board fare collection, bus lanes, specially branded buses, and enhancements to pedestrian safety and bus stops. NYC DOT will install wayfinding signs with real-time bus arrival information at many SBS stops.
As on the other established SBS routes in New York City, NYC DOT is evaluating bus priority measures and is making significant improvements for safety and bus operations, including widened median bus stops along Kings Highway and a new boarding island at the western SBS terminal at Bay 37th St. NYCT and NYC DOT staff have attended over 84 outreach meetings on the B82 SBS project. Every affected Community Board has had at least one presentation, and elected officials and other stakeholders have been briefed. There has been thorough discussion of all the issues, and many points of concern have been addressed through changes to the project. As the implementation process for the B82 SBS moves forward, NYCT and NYCDOT will continue to work with businesses, community groups and elected representatives affected by the proposed bus priority treatments to refine the plans and ensure that our customers can get through congested streets while best accommodating other users of the streets. In particular, NYCT and NYCDOT presented alternatives to the originally proposed bus priority treatments along Kings Highway between Bay Pkwy and Ocean Ave.
Master Page # 208 of 242 - New York City Transit and Bus Committee Meeting 7/23/2018________________________________________________________________________________
Staff Summary 8 New York City Transit
A service equity analysis, conducted in accordance with Title VI of the Civil Rights Act of 1964 and related Federal Transit Administration guidance materials, found that the B82 Select Bus Conversion would not result in a disproportionate impact on either minority or below-poverty populations. The President has considered the analysis of this service change prepared in accordance with Title VI requirements, and has considered the impacts of this proposed change upon riders of mass transportation services, including minority and low-income users of such services.
Recommendation Implement Select Bus Service (SBS) service on the B82, replacing the B82 Limited service.
Alternatives I. Do nothing. If no action is taken, B82 bus service will continue to be slow and unreliable, discouraging
ridership growth.
Budget Impact Approximately $2,900,450. This is included in the approved operating budget.
Implementation Date Fall 2018
Master Page # 209 of 242 - New York City Transit and Bus Committee Meeting 7/23/2018________________________________________________________________________________
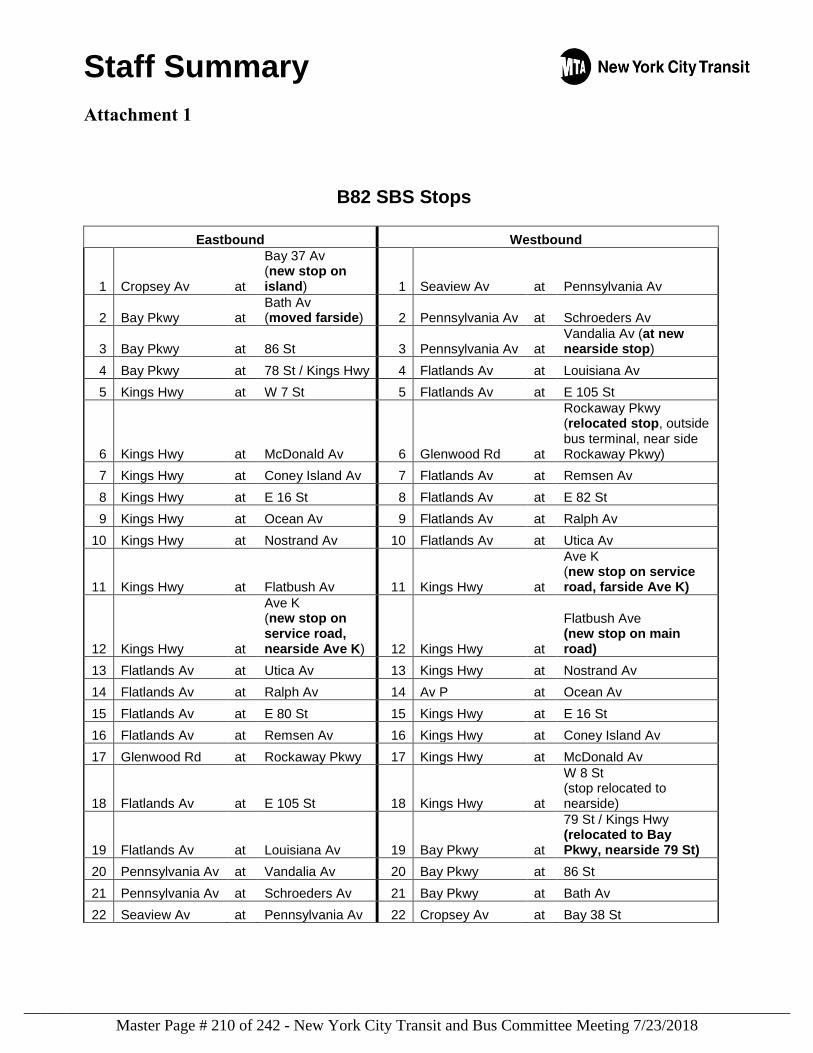
Staff Summary
Attachment 1
B82 SBS Stops
Eastbound Westbound
1 Cropsey Av at
Bay 37 Av (new stop on island) 1 Seaview Av at Pennsylvania Av
2 Bay Pkwy at Bath Av (moved farside) 2 Pennsylvania Av at Schroeders Av
3 Bay Pkwy at 86 St 3 Pennsylvania Av at Vandalia Av (at new nearside stop)
4 Bay Pkwy at 78 St / Kings Hwy 4 Flatlands Av at Louisiana Av
5 Kings Hwy at W 7 St 5 Flatlands Av at E 105 St
6 Kings Hwy at McDonald Av 6 Glenwood Rd at
Rockaway Pkwy (relocated stop, outside bus terminal, near side Rockaway Pkwy)
7 Kings Hwy at Coney Island Av 7 Flatlands Av at Remsen Av
8 Kings Hwy at E 16 St 8 Flatlands Av at E 82 St
9 Kings Hwy at Ocean Av 9 Flatlands Av at Ralph Av
10 Kings Hwy at Nostrand Av 10 Flatlands Av at Utica Av
11 Kings Hwy at Flatbush Av 11 Kings Hwy at
Ave K (new stop on service road, farside Ave K)
12 Kings Hwy at
Ave K (new stop on service road, nearside Ave K) 12 Kings Hwy at
Flatbush Ave (new stop on main road)
13 Flatlands Av at Utica Av 13 Kings Hwy at Nostrand Av
14 Flatlands Av at Ralph Av 14 Av P at Ocean Av
15 Flatlands Av at E 80 St 15 Kings Hwy at E 16 St
16 Flatlands Av at Remsen Av 16 Kings Hwy at Coney Island Av
17 Glenwood Rd at Rockaway Pkwy 17 Kings Hwy at McDonald Av
18 Flatlands Av at E 105 St 18 Kings Hwy at
W 8 St (stop relocated to nearside)
19 Flatlands Av at Louisiana Av 19 Bay Pkwy at
79 St / Kings Hwy (relocated to Bay Pkwy, nearside 79 St)
20 Pennsylvania Av at Vandalia Av 20 Bay Pkwy at 86 St
21 Pennsylvania Av at Schroeders Av 21 Bay Pkwy at Bath Av
22 Seaview Av at Pennsylvania Av 22 Cropsey Av at Bay 38 St
Master Page # 210 of 242 - New York City Transit and Bus Committee Meeting 7/23/2018________________________________________________________________________________
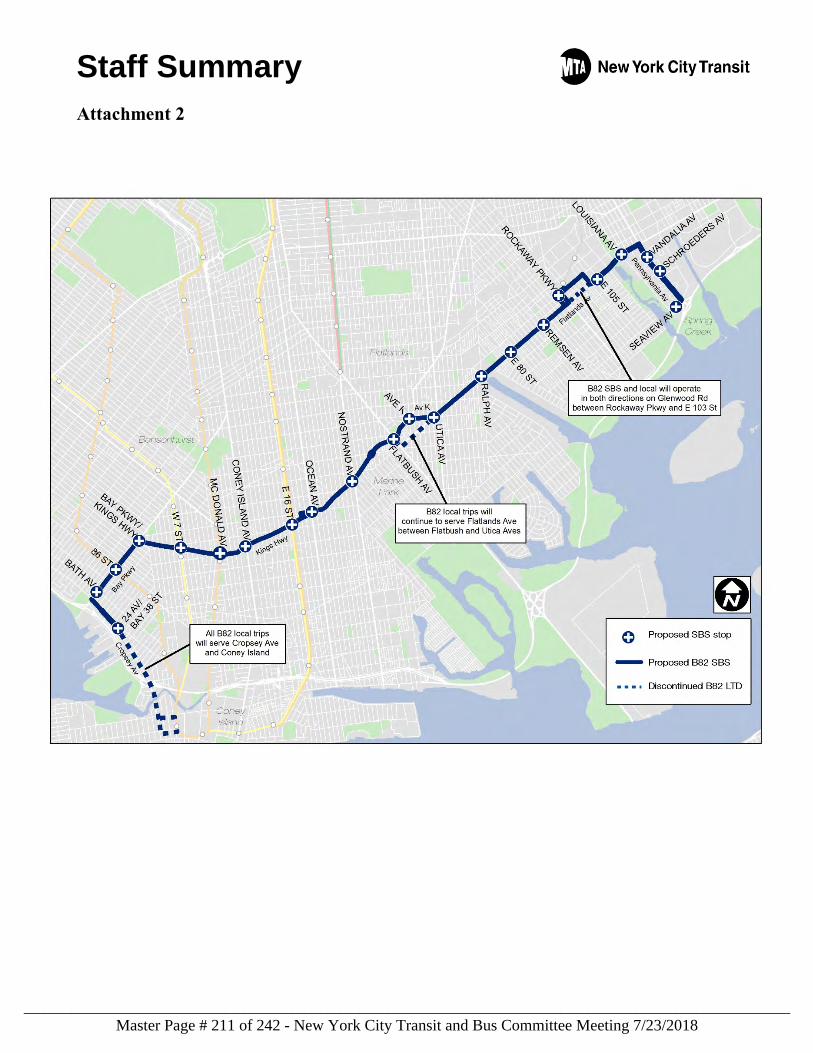
Staff Summary
Attachment 2
Master Page # 211 of 242 - New York City Transit and Bus Committee Meeting 7/23/2018________________________________________________________________________________
Service Changes: Off-Peak Frequency Enhancements for the B17, B65, S93 and Articulated Bus Conversion for the Bx6, Effective October 2018 and January 2019. Peter Cafiero, Chief, Operations Planning
Service Issue
Fast Forward is the joint NYC Transit and MTA bus plan to modernize NYC’s transit system. Included in the plan is a pilot initiative to strategically expand off-peak periods at levels that are above those specified in the loading guidelines. Ridership levels would be evaluated to assess the effects of the added service. The candidate routes are those that are expected to benefit from more frequent off-peak service, such as those that would attract off-peak commuters and have trip generators along the route. The B17, B65, and S93 are the NYCT operated bus routes that would receive off-peak frequency enhancements under this pilot. The B17 and B65 are proposed for October 2018. The S93 is proposed for January 2019 along with the Bx6 local articulated bus conversion. Recommendation
Pilot off-peak service enhancements on seven bus schedules on the B17, B65 and S93 as part of the Fast Forward plan initiative. These service increases should attract ridership. Also, implement the Bx6 articulated bus conversion as this will yield more revenue seat miles at a reduced cost.
Budget Impact The frequency enhancements represent an estimated cost of approximately $2,827,000 annually. These cost factors are incorporated in the budget as a Fast Forward plan initiative. The Bx6 local articulated bus conversion will yield an approximate annual cost savings of $430,000.
Proposed Implementation Date B17 and B65 off-peak service enhancements October 2018. S93 off-peak service enhancements and Bx6 local articulated bus conversion January 2019.
Master Page # 212 of 242 - New York City Transit and Bus Committee Meeting 7/23/2018________________________________________________________________________________
Staff Summary
Subject Off-Peak Frequency Enhancements for the 817, and 865 effective October 2018; Off-Peak Frequency Enhancement for, S93 effective January 2019; and Articulated Bus Conversion for the Bx6 local effective January 2019.
Department
Department Head Name
Department Head Signature
Project Manager Namei
Order To
1 President
Operations Planning
Board Action
Date Approval
x
2 NYCTComm
3 Board
Purpose
Info Other
x
8 New York City Transit
Date June 26, 2018
Vendor Name N/A
Contract Number N/A
Contract Manager Name N/A
Table of Contents Ref# N/A
Internal Approvals
1--0_r_:e_r--t-__ A_,__p~pr----1;;a:;:1tt---+-+--4--+-__ A""""pp'"""r_ov_a_I ---t ? · \ \. \q
7 3
6
5
To obtain presidential approval for and to inform the New York City Transit and MTA Bus Committee of bus schedule changes to increase off-peak scheduled service levels in compliance with the Fast Forward Bus Plan on the Bl 7, B65, and S93 bus routes along with converting the Bx6 local from standard to articulated buses.
Discussion Fast Forward is the joint NYC Transit and MTA bus plan to modernize NYC's transit system. Included in the plan is a pilot initiative to strategically expand off-peak periods at levels that are above those specified in the loading guidelines. Ridership levels would be evaluated to assess the effects of the added service. The candidate routes are those that are expected to benefit from more frequent off-peak service, such as those that would attract off-peak commuters and have trip generators along the route.
The B 17, B65, and S93 are the NYCT operated bus routes that would receive off-peak frequency enhancements under this pilot. The B 17 and B65 are proposed for October 2018. The S93 is proposed for January 2019 along with the Bx6 local articulated bus conversion.
The B 17 route mainly operates between the Crown Heights/Utica A venue 3 4 subway station and Seaview A venue/East 1081h Street all day with a peak service branch to Canarsie Beach Park at East 801
h Street/Seaview A venue. The B 17 transports on average approximately 10,000 customers per weekday, 5,000 customers per Saturday, and 4,000 customers per Sunday. The Bl 7 travels primarily on Remsen A venue which consists of a mix of residential and commercial properties and serves two major subway stations along the route. This route is of particular interest in this pilot because during the first 6 months of implementation, we will see if the enhancement draws new riders prior to the L tunnel reconstruction. After April of 2019 we may see another increase in ridership on the route as it serves a neighborhood that would be impacted by the L tunnel reconstruction.
Master Page # 213 of 242 - New York City Transit and Bus Committee Meeting 7/23/2018________________________________________________________________________________
Staff Summary a New York City Transit
The B65 operates between Ralph Avenue/St. John's Place and Fulton Street/Smith Street daily. The B65 transports on average approximately 3,000 weekday customers, 2,000 Saturday customers, and 1,500 Sunday customers. The route primarily travels in a residential area terminating at downtown Brooklyn's Fulton Shopping Mall. This destination may draw more riders with a more attractive frequency especially on weekends when shoppers are out. There are also dining options, bars, cafos and the Barclays Center in close proximity to the route.
The S93 operates with limited stop service between the South Administration Building in the College of Staten Island and 86th Street R subway station in Brooklyn on weekdays only. The S93 transports on average approximately 4,000 weekday customers. The route operates mainly on the Victory Boulevard/Clove Road corridor. With classes in session throughout the day at the college, the S93 is a good candidate for this pilot. Students and faculty may be inclined to rely on the S93 instead of other means of transportation if the frequency is increased to better meet their schedule.
After 12 months new passenger data on these routes will be gathered and reviewed for increased ridership in the off-peak where service was increased. An increase in passengers of 50% or more of the percentage of added off-peak trips would be encouraging. If the results fall short of expectations, we will propose to restore service according to loading guidelines.
The Bx6 local has been chosen for articulated bus conversion for end of year 2018. These higher capacity buses are needed on this growing route. Normally we would decrease weekday peak service when providing buses with greater capacity. However, this route shows signs of ridership growth and would benefit from maintaining existing peak weekday service levels. Only midday and evening frequencies were decreased.
The proposed increases in service levels for October 2018 are shown in attachment 1 and January 2019 are shown in attachment 2. There are eight bus schedule changes on the B 17, B65, S93 and Bx6 local.
Recommendation Pilot off-peak service enhancements on seven bus schedules on the Bl 7, B65 and S93 as part of the Fast Forward plan initiative. These service increases should attract ridership. Also, implement the Bx6 local articulated bus conversion as was planned for end of year 2018. These higher capacity buses are needed on this growing route and will yield more revenue seat miles at a reduced cost.
Alternatives Do nothing. NYCT would not make service level adjustments to pilot improved off-peak service, which is one of the Fast Forward plan initiatives. NYCT would not convert the Bx6 local route to articulated bus service which would yield lower revenue seat miles at a higher cost.
Budget Impact The frequency enhancements represent an estimated cost of approximately $2,827,000 annually. These cost factors are incorporated in the budget as a Fast Forward plan initiative. The Bx6 local articulated bus conversion will yield an approximate annual cost savings of $430,000. This savings will not be reinvested in the Fast Forward plan initiative.
Master Page # 214 of 242 - New York City Transit and Bus Committee Meeting 7/23/2018________________________________________________________________________________
Staff Summary • New York City Transit
Implementation Date B 17 and B65 off-peak service enhancements October 2018. S93 off-peak service enhancements and Bx6 local articulated bus conversion January 2019.
/
Master Page # 215 of 242 - New York City Transit and Bus Committee Meeting 7/23/2018________________________________________________________________________________
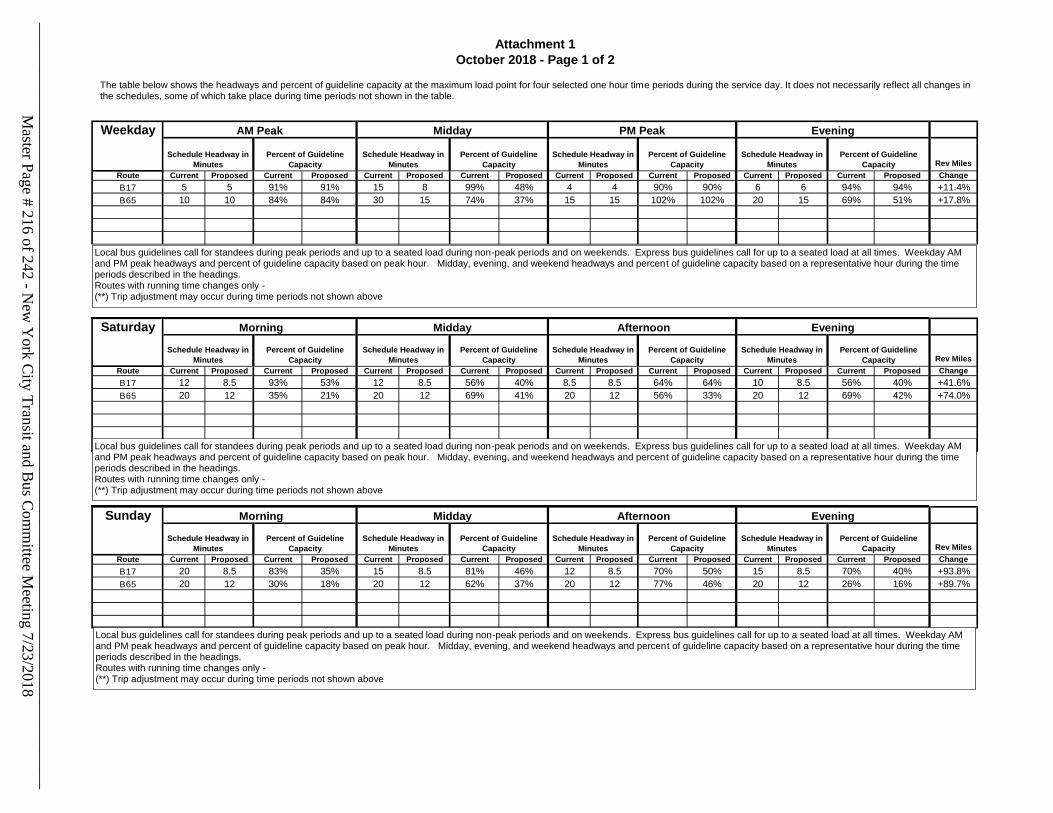
Weekday
Rev Miles
Route Current Proposed Current Proposed Current Proposed Current Proposed Current Proposed Current Proposed Current Proposed Current Proposed Change
B17 5 5 91% 91% 15 8 99% 48% 4 4 90% 90% 6 6 94% 94% +11.4%
B65 10 10 84% 84% 30 15 74% 37% 15 15 102% 102% 20 15 69% 51% +17.8%
Saturday
Rev Miles
Route Current Proposed Current Proposed Current Proposed Current Proposed Current Proposed Current Proposed Current Proposed Current Proposed Change
B17 12 8.5 93% 53% 12 8.5 56% 40% 8.5 8.5 64% 64% 10 8.5 56% 40% +41.6%
B65 20 12 35% 21% 20 12 69% 41% 20 12 56% 33% 20 12 69% 42% +74.0%
Sunday
Rev Miles
Route Current Proposed Current Proposed Current Proposed Current Proposed Current Proposed Current Proposed Current Proposed Current Proposed Change
B17 20 8.5 83% 35% 15 8.5 81% 46% 12 8.5 70% 50% 15 8.5 70% 40% +93.8%
B65 20 12 30% 18% 20 12 62% 37% 20 12 77% 46% 20 12 26% 16% +89.7%
Attachment 1
October 2018 - Page 1 of 2
AM Peak Midday PM Peak Evening
Schedule Headway in
Minutes
Percent of Guideline
Capacity
Morning Midday Afternoon Evening
Schedule Headway in
Minutes
Percent of Guideline
Capacity
Schedule Headway in
Minutes
Percent of Guideline
Capacity
Schedule Headway in
Minutes
Percent of Guideline
Capacity
Schedule Headway in
Minutes
Percent of Guideline
Capacity
Morning Midday Afternoon Evening
Schedule Headway in
Minutes
Percent of Guideline
Capacity
Schedule Headway in
Minutes
Percent of Guideline
Capacity
Schedule Headway in
Minutes
Percent of Guideline
Capacity
Schedule Headway in
Minutes
Percent of Guideline
Capacity
Schedule Headway in
Minutes
Percent of Guideline
Capacity
Schedule Headway in
Minutes
Percent of Guideline
Capacity
Schedule Headway in
Minutes
Percent of Guideline
Capacity
The table below shows the headways and percent of guideline capacity at the maximum load point for four selected one hour time periods during the service day. It does not necessarily reflect all changes in the schedules, some of which take place during time periods not shown in the table.
(*) AM and PM headways based on peak hour service.) AM and PM headways based on peak hour service.The table below shows the headways for three selected peak time periods of limited duration during the day.It does not necessarily reflect all changes in the schedules, many of which take place during time periods not shown in the (*) Weekday AM and PM headways based on peak hour. The percentage change in revenue seat miles is based on the percentage change in revenue trips from the present The table below shows the headways for three selected peak time periods of limited duration during the day.It does not necessarily reflect all changes in the schedules, many of which take place during time periods not shown in the (*) AM and PM headways based on peak hour service.) AM and PM headways based on peak hour service.(*) Weekday AM and PM headways based on peak hour. The percentage change in revenue seat miles is based on the percentage change in revenue trips from the present The table below shows the headways for three selected peak time periods of limited duration during the day.It does not necessarily reflect all changes in the schedules, many of which take place during time periods not shown in the (*) AM and PM headways based on peak hour service.) AM and PM headways based on peak hour service.(*) Weekday AM and PM headways based on peak hour. The percentage change in revenue seat miles is based on the percentage change in revenue trips from the present The table below shows the headways for three selected peak time periods of limited duration during the day.It does not necessarily reflect all changes in the schedules, many of which take place during time periods not shown in the (*) AM and PM headways based on peak hour service.) AM and PM headways based on peak hour service.(*) The percentage change in revenue seat miles is based on the percentage change in revenue trips from the present The table below shows the headways for three selected peak time periods of limited duration during the day.It does not necessarily reflect all changes in the schedules, many of which take place during time periods not shown in the (*) AM and PM headways based on peak hour service.) AM and PM headways based on peak hour service.(*) The percentage change in revenue seat miles is based on the percentage change in revenue trips from the present The table below shows the headways for three selected peak time periods of limited duration during the day.It does not necessarily reflect all changes in the schedules, many of which take place during time periods not shown in the (*) AM and PM headways based on peak hour service.) AM and PM headways based on peak hour service.(*) The percentage change in revenue seat miles is based on the percentage change in revenue trips from the present The table below shows the headways for three selected peak time periods of limited duration during the day.It does not necessarily reflect all changes in the schedules, many of which take place during time periods not shown in the (*) AM and PM headways based on peak hour service.) AM and PM headways based on peak hour service.(*) The percentage change in revenue seat miles is based on the percentage change in revenue trips from the present The table below shows the headways for three selected peak time periods of limited duration during the day.It does not necessarily reflect all changes in the schedules, many of which take place during time periods not shown in the (*) AM and PM headways based on peak hour service.) AM and PM headways based on peak hour service.(*) The percentage change in revenue seat miles is based on the percentage change in revenue trips from the present The table below shows the headways for three selected peak time periods of limited duration during the day.It does not necessarily reflect all changes in the schedules, many of which take place during time periods not shown in the (*) AM and PM headways based on peak hour service.) AM and PM headways based on peak hour service.(*) The percentage change in revenue seat miles is based on the percentage change in revenue trips from the present The table below shows the headways for three selected peak time periods of limited duration during the day.It does not necessarily reflect all changes in the schedules, many of which take place during time periods not shown in the (*) AM and PM headways based on peak hour service.) AM and PM headways based on peak hour service.(*) The percentage change in revenue seat miles is based on the percentage change in revenue trips from the present The table below shows the headways for three selected peak time periods of limited duration during the day.It does not necessarily reflect all changes in the schedules, many of which take place during time periods not shown in the (*) AM and PM headways based on peak hour service.) AM and PM headways based on peak hour service.(*) The percentage change in revenue seat miles is based on the percentage change in revenue trips from the present The table below shows the headways for three selected peak time periods of limited duration during the day.It does not necessarily reflect all changes in the schedules, many of which take place during time periods not shown in the (*) AM and PM headways based on peak hour service.) AM and PM headways based on peak hour service.(*) Weekday AM and PM headways based on peak hour service; Weekday midday headways based on 11AM-1PM; Weekend AM , midday, and PM headways based on 6AM-10AM , The table below shows the headways for three selected peak time periods of limited duration during the day.It does not necessarily reflect all changes in the schedules, many of which take place during time periods not shown in the (*) AM and PM headways based on peak hour service.) AM and PM headways based on peak hour service.(*) Weekday AM and PM headways based on peak hour service; Weekday midday headways based on 11AM-1PM; Weekend AM , midday, and PM headways based on 6AM-10AM , The table below shows the headways for three selected peak time periods of limited duration during the day.It does not necessarily reflect all changes in the schedules, many of which take place during time periods not shown in the (*) AM and PM headways based on peak hour service.) AM and PM headways based on peak hour service.(*) Weekday AM and PM headways based on peak hour service; Weekend AM and PM headways based on 6AM-10AM and 3PM-7PM.The table below shows the headways for three selected peak time periods of limited duration during the day.It does not necessarily reflect all changes in the schedules, many of which take place during time periods not shown in the (*) AM and PM headways based on peak hour service.) AM and PM headways based on peak hour service.(*) Weekday AM and PM headways based on peak hour service; Weekday midday headways based on 11AM-1PM; Weekend AM , midday, and PM headways based on 6AM-10AM , The table below shows the headways for three selected peak time periods of limited duration during the day.It does not necessarily reflect all changes in the schedules, many of which take place during time periods not shown in the (*) AM and PM headways based on peak hour service.) AM and PM headways based on peak hour service.(*) Weekday AM and PM headways based on peak hour service; Weekend AM and PM headways based on 6AM-10AM and 3PM-7PM.The table below shows the headways for three selected peak time periods of limited duration during the day.It does not necessarily reflect all changes in the schedules, many of which take place during time periods not shown in the (*) AM and PM headways based on peak hour service.) AM and PM headways based on peak hour service.(*) Weekday AM and PM headways based on peak hour service; Weekend AM and PM headways based on 6AM-10AM and 3PM-7PM.The table below shows the headways for three selected peak time periods of limited duration during the day.It does not necessarily reflect all changes in the schedules, many of which take place during time periods not shown in the (*) AM and PM headways based on peak hour service.) AM and PM headways based on peak hour service.The table below shows the headways for three selected peak time periods of limited duration during the day.It does not necessarily reflect all changes in the schedules, many of which take place during time periods not shown in the (*) Weekday AM and PM headways based on peak hour service; Weekend AM and PM headways based on 6AM-10AM and 3PM-7PM.The table below shows the headways for three selected peak time periods of limited duration during the day.It does not necessarily reflect all changes in the schedules, many of which take place during time periods not shown in the (*) AM and PM headways based on peak hour service.) AM and PM headways based on peak hour service.(*) Weekday AM and PM headways based on peak hour service; Weekend AM and PM headways based on 6AM-10AM and 3PM-7PM.The table below shows the headways for three selected peak time periods of limited duration during the day.It does not necessarily reflect all changes in the schedules, many of which take place during time periods not shown in the (*) AM and PM headways based on peak hour service.) AM and PM headways based on peak hour service.(*) Weekday AM and PM headways based on peak hour service; Weekend AM and PM headways based on 6AM-10AM and 3PM-7PM.The table below shows the headways for three selected peak time periods of limited duration during the day.It does not necessarily reflect all changes in the schedules, many of which take place during time periods not shown in the (*) AM and PM headways based on peak hour service.) AM and PM headways based on peak hour service.The table below shows the headways for three selected peak time periods of limited duration during the day.It does not necessarily reflect all changes in the schedules, many of which take place during time periods not shown in the The table below shows the headways for three selected peak time periods of limited duration during the day.It does not necessarily reflect all changes in the schedules, many of which take place during time periods not shown in the The table below shows the headways for three selected peak time periods of limited duration during the day.It does not necessarily reflect all changes in the schedules, many of which take place during time periods not shown in the The table below shows the headways for three selected peak time periods of limited duration during the day.It does not necessarily reflect all changes in the schedules, many of which take place during time periods not shown in the The table below shows the headways for three selected peak time periods of limited duration during the day.It does not necessarily reflect all changes in the schedules, many of which take place during time periods not shown in the The table below shows the headways for three selected peak time periods of limited duration during the day.It does not necessarily reflect all changes in the schedules, many of which take place during time periods not shown in the (*) Weekday AM and PM headways based on peak hour service; Weekend AM and PM headways based on 6AM-10AM and 3PM-7PM.The table below shows the headways for three selected peak time periods of limited duration during the day.It does not necessarily reflect all changes in the schedules, many of which take place during time periods not shown in the (*) AM and PM headways based on peak hour service.) AM and PM headways based on peak hour service.(*) Weekday AM and PM headways based on peak hour service; Weekend AM and PM headways based on 6AM-10AM and 3PM-7PM.The table below shows the headways for three selected peak time periods of limited duration during the day.It does not necessarily reflect all changes in the schedules, many of which take place during time periods not shown in the ( The table below shows the headways for three selected peak time periods of limited duration during the day.It does not necessarily reflect all changes in the schedules, many of which take place during time periods not shown in the The table below shows the headways for three selected peak time periods of limited duration during the day.It does not necessarily reflect all changes in the schedules, many of which take place during time periods not shown in the The table below shows the headways for three selected peak time periods of limited duration during the day.It does not necessarily reflect all changes in the schedules, many of which take place during time periods not shown in the The table below shows the headways for three selected peak time periods of limited duration during the day.It does not necessarily reflect all changes in the schedules, many of which take place during time periods not shown in the The table below shows the headways for three selected peak time periods of limited duration during the day.It does not necessarily reflect all changes in the schedules, many of which take place during time periods not shown in the The table below shows the headways for three selected peak time periods of limited duration during the day.It does not necessarily reflect all changes in the schedules, many of which take place during time periods not shown in the The table below shows the headways for three selected peak time periods of limited duration during the day.It does not necessarily reflect all changes in the schedules, many of which take place during time periods not shown in the The table below shows the headways for three selected peak time periods of limited duration during the day.It does not necessarily reflect all changes in the schedules, many of which take place during time periods not shown in the The table below shows the headways for three selected peak time periods of limited duration during the day.It does not necessarily reflect all changes in the schedules, many of which take place during time periods not shown in the
(*) Weekday AM and PM headways based on peak hour. Weekend AM headways based on 8 AM - 9 AM; Weekend PM headways base on 5 PM -6 PM; Evening express Local bus guidelines call for standees during peak periods and up to a seated load during non-peak periods and on weekends. Express bus guidelines call for up to a seated load at all times. Weekday AM
The tables below show the headways and percent of guideline capacity at the maximum load point for four selected one hour time periods during the service day. It does not necessarily reflect all
(*) AM and PM headways based on peak hour service.) AM and PM headways based on peak hour service.The table below shows the headways for three selected peak time periods of limited duration during the day.It does not necessarily reflect all changes in the schedules, many of which take place during time periods not shown in the (*) Weekday AM and PM headways based on peak hour. The percentage change in revenue seat miles is based on the percentage change in revenue trips from the present The table below shows the headways for three selected peak time periods of limited duration during the day.It does not necessarily reflect all changes in the schedules, many of which take place during time periods not shown in the (*) AM and PM headways based on peak hour service.) AM and PM headways based on peak hour service.(*) Weekday AM and PM headways based on peak hour. The percentage change in revenue seat miles is based on the percentage change in revenue trips from the present The table below shows the headways for three selected peak time periods of limited duration during the day.It does not necessarily reflect all changes in the schedules, many of which take place during time periods not shown in the (*) AM and PM headways based on peak hour service.) AM and PM headways based on peak hour service.(*) Weekday AM and PM headways based on peak hour. The percentage change in revenue seat miles is based on the percentage change in revenue trips from the present The table below shows the headways for three selected peak time periods of limited duration during the day.It does not necessarily reflect all changes in the schedules, many of which take place during time periods not shown in the (*) AM and PM headways based on peak hour service.) AM and PM headways based on peak hour service.(*) The percentage change in revenue seat miles is based on the percentage change in revenue trips from the present The table below shows the headways for three selected peak time periods of limited duration during the day.It does not necessarily reflect all changes in the schedules, many of which take place during time periods not shown in the (*) AM and PM headways based on peak hour service.) AM and PM headways based on peak hour service.(*) The percentage change in revenue seat miles is based on the percentage change in revenue trips from the present The table below shows the headways for three selected peak time periods of limited duration during the day.It does not necessarily reflect all changes in the schedules, many of which take place during time periods not shown in the (*) AM and PM headways based on peak hour service.) AM and PM headways based on peak hour service.(*) The percentage change in revenue seat miles is based on the percentage change in revenue trips from the present The table below shows the headways for three selected peak time periods of limited duration during the day.It does not necessarily reflect all changes in the schedules, many of which take place during time periods not shown in the (*) AM and PM headways based on peak hour service.) AM and PM headways based on peak hour service.(*) The percentage change in revenue seat miles is based on the percentage change in revenue trips from the present The table below shows the headways for three selected peak time periods of limited duration during the day.It does not necessarily reflect all changes in the schedules, many of which take place during time periods not shown in the (*) AM and PM headways based on peak hour service.) AM and PM headways based on peak hour service.(*) The percentage change in revenue seat miles is based on the percentage change in revenue trips from the present The table below shows the headways for three selected peak time periods of limited duration during the day.It does not necessarily reflect all changes in the schedules, many of which take place during time periods not shown in the (*) AM and PM headways based on peak hour service.) AM and PM headways based on peak hour service.(*) The percentage change in revenue seat miles is based on the percentage change in revenue trips from the present The table below shows the headways for three selected peak time periods of limited duration during the day.It does not necessarily reflect all changes in the schedules, many of which take place during time periods not shown in the (*) AM and PM headways based on peak hour service.) AM and PM headways based on peak hour service.(*) The percentage change in revenue seat miles is based on the percentage change in revenue trips from the present The table below shows the headways for three selected peak time periods of limited duration during the day.It does not necessarily reflect all changes in the schedules, many of which take place during time periods not shown in the (*) AM and PM headways based on peak hour service.) AM and PM headways based on peak hour service.(*) The percentage change in revenue seat miles is based on the percentage change in revenue trips from the present The table below shows the headways for three selected peak time periods of limited duration during the day.It does not necessarily reflect all changes in the schedules, many of which take place during time periods not shown in the (*) AM and PM headways based on peak hour service.) AM and PM headways based on peak hour service.(*) Weekday AM and PM headways based on peak hour service; Weekday midday headways based on 11AM-1PM; Weekend AM , midday, and PM headways based on 6AM-10AM , The table below shows the headways for three selected peak time periods of limited duration during the day.It does not necessarily reflect all changes in the schedules, many of which take place during time periods not shown in the (*) AM and PM headways based on peak hour service.) AM and PM headways based on peak hour service.(*) Weekday AM and PM headways based on peak hour service; Weekday midday headways based on 11AM-1PM; Weekend AM , midday, and PM headways based on 6AM-10AM , The table below shows the headways for three selected peak time periods of limited duration during the day.It does not necessarily reflect all changes in the schedules, many of which take place during time periods not shown in the (*) AM and PM headways based on peak hour service.) AM and PM headways based on peak hour service.(*) Weekday AM and PM headways based on peak hour service; Weekend AM and PM headways based on 6AM-10AM and 3PM-7PM.The table below shows the headways for three selected peak time periods of limited duration during the day.It does not necessarily reflect all changes in the schedules, many of which take place during time periods not shown in the (*) AM and PM headways based on peak hour service.) AM and PM headways based on peak hour service.(*) Weekday AM and PM headways based on peak hour service; Weekday midday headways based on 11AM-1PM; Weekend AM , midday, and PM headways based on 6AM-10AM , The table below shows the headways for three selected peak time periods of limited duration during the day.It does not necessarily reflect all changes in the schedules, many of which take place during time periods not shown in the (*) AM and PM headways based on peak hour service.) AM and PM headways based on peak hour service.(*) Weekday AM and PM headways based on peak hour service; Weekend AM and PM headways based on 6AM-10AM and 3PM-7PM.The table below shows the headways for three selected peak time periods of limited duration during the day.It does not necessarily reflect all changes in the schedules, many of which take place during time periods not shown in the (*) AM and PM headways based on peak hour service.) AM and PM headways based on peak hour service.(*) Weekday AM and PM headways based on peak hour service; Weekend AM and PM headways based on 6AM-10AM and 3PM-7PM.The table below shows the headways for three selected peak time periods of limited duration during the day.It does not necessarily reflect all changes in the schedules, many of which take place during time periods not shown in the (*) AM and PM headways based on peak hour service.) AM and PM headways based on peak hour service.The table below shows the headways for three selected peak time periods of limited duration during the day.It does not necessarily reflect all changes in the schedules, many of which take place during time periods not shown in the (*) Weekday AM and PM headways based on peak hour service; Weekend AM and PM headways based on 6AM-10AM and 3PM-7PM.The table below shows the headways for three selected peak time periods of limited duration during the day.It does not necessarily reflect all changes in the schedules, many of which take place during time periods not shown in the (*) AM and PM headways based on peak hour service.) AM and PM headways based on peak hour service.(*) Weekday AM and PM headways based on peak hour service; Weekend AM and PM headways based on 6AM-10AM and 3PM-7PM.The table below shows the headways for three selected peak time periods of limited duration during the day.It does not necessarily reflect all changes in the schedules, many of which take place during time periods not shown in the (*) AM and PM headways based on peak hour service.) AM and PM headways based on peak hour service.(*) Weekday AM and PM headways based on peak hour service; Weekend AM and PM headways based on 6AM-10AM and 3PM-7PM.The table below shows the headways for three selected peak time periods of limited duration during the day.It does not necessarily reflect all changes in the schedules, many of which take place during time periods not shown in the (*) AM and PM headways based on peak hour service.) AM and PM headways based on peak hour service.The table below shows the headways for three selected peak time periods of limited duration during the day.It does not necessarily reflect all changes in the schedules, many of which take place during time periods not shown in the The table below shows the headways for three selected peak time periods of limited duration during the day.It does not necessarily reflect all changes in the schedules, many of which take place during time periods not shown in the The table below shows the headways for three selected peak time periods of limited duration during the day.It does not necessarily reflect all changes in the schedules, many of which take place during time periods not shown in the The table below shows the headways for three selected peak time periods of limited duration during the day.It does not necessarily reflect all changes in the schedules, many of which take place during time periods not shown in the The table below shows the headways for three selected peak time periods of limited duration during the day.It does not necessarily reflect all changes in the schedules, many of which take place during time periods not shown in the The table below shows the headways for three selected peak time periods of limited duration during the day.It does not necessarily reflect all changes in the schedules, many of which take place during time periods not shown in the (*) Weekday AM and PM headways based on peak hour service; Weekend AM and PM headways based on 6AM-10AM and 3PM-7PM.The table below shows the headways for three selected peak time periods of limited duration during the day.It does not necessarily reflect all changes in the schedules, many of which take place during time periods not shown in the (*) AM and PM headways based on peak hour service.) AM and PM headways based on peak hour service.(*) Weekday AM and PM headways based on peak hour service; Weekend AM and PM headways based on 6AM-10AM and 3PM-7PM.The table below shows the headways for three selected peak time periods of limited duration during the day.It does not necessarily reflect all changes in the schedules, many of which take place during time periods not shown in the ( The table below shows the headways for three selected peak time periods of limited duration during the day.It does not necessarily reflect all changes in the schedules, many of which take place during time periods not shown in the The table below shows the headways for three selected peak time periods of limited duration during the day.It does not necessarily reflect all changes in the schedules, many of which take place during time periods not shown in the The table below shows the headways for three selected peak time periods of limited duration during the day.It does not necessarily reflect all changes in the schedules, many of which take place during time periods not shown in the The table below shows the headways for three selected peak time periods of limited duration during the day.It does not necessarily reflect all changes in the schedules, many of which take place during time periods not shown in the The table below shows the headways for three selected peak time periods of limited duration during the day.It does not necessarily reflect all changes in the schedules, many of which take place during time periods not shown in the The table below shows the headways for three selected peak time periods of limited duration during the day.It does not necessarily reflect all changes in the schedules, many of which take place during time periods not shown in the The table below shows the headways for three selected peak time periods of limited duration during the day.It does not necessarily reflect all changes in the schedules, many of which take place during time periods not shown in the The table below shows the headways for three selected peak time periods of limited duration during the day.It does not necessarily reflect all changes in the schedules, many of which take place during time periods not shown in the The table below shows the headways for three selected peak time periods of limited duration during the day.It does not necessarily reflect all changes in the schedules, many of which take place during time periods not shown in the The table below shows the headways and percent of guideline capacity at the maximum load point for four selected one hour time periods during the service day. It does not necessarily reflect all Local bus guidelines call for standees during peak periods and up to a seated load during non-peak periods and on weekends. Express bus guidelines call for up to a seated load at all times. Weekday AM The table below shows the headways and percent of guideline capacity at the maximum load point for four selected one hour time periods during the service day. It does not necessarily reflect all The table below shows the headways and percent of guideline capacity at the maximum load point for four selected one hour time periods during the service day. It does not necessarily reflect all (*) Local bus guidelines call for standees during peak periods and up to a seated load during non-peak periods. Express bus guidelines call for up to a seated load at all times. Weekday AM and PM peak The tables below show the headways and percent of guideline capacity at the maximum load point for four selected one hour time periods during the service day. It does not necessarily reflect all The tables below show the headways and percent of guideline capacity at the maximum load point for four selected one hour time periods during the service day. It does not necessarily reflect all
(*) AM and PM headways based on peak hour service.) AM and PM headways based on peak hour service.The table below shows the headways for three selected peak time periods of limited duration during the day.It does not necessarily reflect all changes in the schedules, many of which take place during time periods not shown in the (*) Weekday AM and PM headways based on peak hour. The percentage change in revenue seat miles is based on the percentage change in revenue trips from the present The table below shows the headways for three selected peak time periods of limited duration during the day.It does not necessarily reflect all changes in the schedules, many of which take place during time periods not shown in the (*) AM and PM headways based on peak hour service.) AM and PM headways based on peak hour service.(*) Weekday AM and PM headways based on peak hour. The percentage change in revenue seat miles is based on the percentage change in revenue trips from the present The table below shows the headways for three selected peak time periods of limited duration during the day.It does not necessarily reflect all changes in the schedules, many of which take place during time periods not shown in the (*) AM and PM headways based on peak hour service.) AM and PM headways based on peak hour service.(*) Weekday AM and PM headways based on peak hour. The percentage change in revenue seat miles is based on the percentage change in revenue trips from the present The table below shows the headways for three selected peak time periods of limited duration during the day.It does not necessarily reflect all changes in the schedules, many of which take place during time periods not shown in the (*) AM and PM headways based on peak hour service.) AM and PM headways based on peak hour service.(*) The percentage change in revenue seat miles is based on the percentage change in revenue trips from the present The table below shows the headways for three selected peak time periods of limited duration during the day.It does not necessarily reflect all changes in the schedules, many of which take place during time periods not shown in the (*) AM and PM headways based on peak hour service.) AM and PM headways based on peak hour service.(*) The percentage change in revenue seat miles is based on the percentage change in revenue trips from the present The table below shows the headways for three selected peak time periods of limited duration during the day.It does not necessarily reflect all changes in the schedules, many of which take place during time periods not shown in the (*) AM and PM headways based on peak hour service.) AM and PM headways based on peak hour service.(*) The percentage change in revenue seat miles is based on the percentage change in revenue trips from the present The table below shows the headways for three selected peak time periods of limited duration during the day.It does not necessarily reflect all changes in the schedules, many of which take place during time periods not shown in the (*) AM and PM headways based on peak hour service.) AM and PM headways based on peak hour service.(*) The percentage change in revenue seat miles is based on the percentage change in revenue trips from the present The table below shows the headways for three selected peak time periods of limited duration during the day.It does not necessarily reflect all changes in the schedules, many of which take place during time periods not shown in the (*) AM and PM headways based on peak hour service.) AM and PM headways based on peak hour service.(*) The percentage change in revenue seat miles is based on the percentage change in revenue trips from the present The table below shows the headways for three selected peak time periods of limited duration during the day.It does not necessarily reflect all changes in the schedules, many of which take place during time periods not shown in the (*) AM and PM headways based on peak hour service.) AM and PM headways based on peak hour service.(*) The percentage change in revenue seat miles is based on the percentage change in revenue trips from the present The table below shows the headways for three selected peak time periods of limited duration during the day.It does not necessarily reflect all changes in the schedules, many of which take place during time periods not shown in the (*) AM and PM headways based on peak hour service.) AM and PM headways based on peak hour service.(*) The percentage change in revenue seat miles is based on the percentage change in revenue trips from the present The table below shows the headways for three selected peak time periods of limited duration during the day.It does not necessarily reflect all changes in the schedules, many of which take place during time periods not shown in the (*) AM and PM headways based on peak hour service.) AM and PM headways based on peak hour service.(*) The percentage change in revenue seat miles is based on the percentage change in revenue trips from the present The table below shows the headways for three selected peak time periods of limited duration during the day.It does not necessarily reflect all changes in the schedules, many of which take place during time periods not shown in the (*) AM and PM headways based on peak hour service.) AM and PM headways based on peak hour service.(*) Weekday AM and PM headways based on peak hour service; Weekday midday headways based on 11AM-1PM; Weekend AM , midday, and PM headways based on 6AM-10AM , The table below shows the headways for three selected peak time periods of limited duration during the day.It does not necessarily reflect all changes in the schedules, many of which take place during time periods not shown in the (*) AM and PM headways based on peak hour service.) AM and PM headways based on peak hour service.(*) Weekday AM and PM headways based on peak hour service; Weekday midday headways based on 11AM-1PM; Weekend AM , midday, and PM headways based on 6AM-10AM , The table below shows the headways for three selected peak time periods of limited duration during the day.It does not necessarily reflect all changes in the schedules, many of which take place during time periods not shown in the (*) AM and PM headways based on peak hour service.) AM and PM headways based on peak hour service.(*) Weekday AM and PM headways based on peak hour service; Weekend AM and PM headways based on 6AM-10AM and 3PM-7PM.The table below shows the headways for three selected peak time periods of limited duration during the day.It does not necessarily reflect all changes in the schedules, many of which take place during time periods not shown in the (*) AM and PM headways based on peak hour service.) AM and PM headways based on peak hour service.(*) Weekday AM and PM headways based on peak hour service; Weekday midday headways based on 11AM-1PM; Weekend AM , midday, and PM headways based on 6AM-10AM , The table below shows the headways for three selected peak time periods of limited duration during the day.It does not necessarily reflect all changes in the schedules, many of which take place during time periods not shown in the (*) AM and PM headways based on peak hour service.) AM and PM headways based on peak hour service.(*) Weekday AM and PM headways based on peak hour service; Weekend AM and PM headways based on 6AM-10AM and 3PM-7PM.The table below shows the headways for three selected peak time periods of limited duration during the day.It does not necessarily reflect all changes in the schedules, many of which take place during time periods not shown in the (*) AM and PM headways based on peak hour service.) AM and PM headways based on peak hour service.(*) Weekday AM and PM headways based on peak hour service; Weekend AM and PM headways based on 6AM-10AM and 3PM-7PM.The table below shows the headways for three selected peak time periods of limited duration during the day.It does not necessarily reflect all changes in the schedules, many of which take place during time periods not shown in the (*) AM and PM headways based on peak hour service.) AM and PM headways based on peak hour service.The table below shows the headways for three selected peak time periods of limited duration during the day.It does not necessarily reflect all changes in the schedules, many of which take place during time periods not shown in the (*) Weekday AM and PM headways based on peak hour service; Weekend AM and PM headways based on 6AM-10AM and 3PM-7PM.The table below shows the headways for three selected peak time periods of limited duration during the day.It does not necessarily reflect all changes in the schedules, many of which take place during time periods not shown in the (*) AM and PM headways based on peak hour service.) AM and PM headways based on peak hour service.(*) Weekday AM and PM headways based on peak hour service; Weekend AM and PM headways based on 6AM-10AM and 3PM-7PM.The table below shows the headways for three selected peak time periods of limited duration during the day.It does not necessarily reflect all changes in the schedules, many of which take place during time periods not shown in the (*) AM and PM headways based on peak hour service.) AM and PM headways based on peak hour service.(*) Weekday AM and PM headways based on peak hour service; Weekend AM and PM headways based on 6AM-10AM and 3PM-7PM.The table below shows the headways for three selected peak time periods of limited duration during the day.It does not necessarily reflect all changes in the schedules, many of which take place during time periods not shown in the (*) AM and PM headways based on peak hour service.) AM and PM headways based on peak hour service.The table below shows the headways for three selected peak time periods of limited duration during the day.It does not necessarily reflect all changes in the schedules, many of which take place during time periods not shown in the The table below shows the headways for three selected peak time periods of limited duration during the day.It does not necessarily reflect all changes in the schedules, many of which take place during time periods not shown in the The table below shows the headways for three selected peak time periods of limited duration during the day.It does not necessarily reflect all changes in the schedules, many of which take place during time periods not shown in the The table below shows the headways for three selected peak time periods of limited duration during the day.It does not necessarily reflect all changes in the schedules, many of which take place during time periods not shown in the The table below shows the headways for three selected peak time periods of limited duration during the day.It does not necessarily reflect all changes in the schedules, many of which take place during time periods not shown in the The table below shows the headways for three selected peak time periods of limited duration during the day.It does not necessarily reflect all changes in the schedules, many of which take place during time periods not shown in the (*) Weekday AM and PM headways based on peak hour service; Weekend AM and PM headways based on 6AM-10AM and 3PM-7PM.The table below shows the headways for three selected peak time periods of limited duration during the day.It does not necessarily reflect all changes in the schedules, many of which take place during time periods not shown in the (*) AM and PM headways based on peak hour service.) AM and PM headways based on peak hour service.(*) Weekday AM and PM headways based on peak hour service; Weekend AM and PM headways based on 6AM-10AM and 3PM-7PM.The table below shows the headways for three selected peak time periods of limited duration during the day.It does not necessarily reflect all changes in the schedules, many of which take place during time periods not shown in the ( The table below shows the headways for three selected peak time periods of limited duration during the day.It does not necessarily reflect all changes in the schedules, many of which take place during time periods not shown in the The table below shows the headways for three selected peak time periods of limited duration during the day.It does not necessarily reflect all changes in the schedules, many of which take place during time periods not shown in the The table below shows the headways for three selected peak time periods of limited duration during the day.It does not necessarily reflect all changes in the schedules, many of which take place during time periods not shown in the The table below shows the headways for three selected peak time periods of limited duration during the day.It does not necessarily reflect all changes in the schedules, many of which take place during time periods not shown in the The table below shows the headways for three selected peak time periods of limited duration during the day.It does not necessarily reflect all changes in the schedules, many of which take place during time periods not shown in the The table below shows the headways for three selected peak time periods of limited duration during the day.It does not necessarily reflect all changes in the schedules, many of which take place during time periods not shown in the The table below shows the headways for three selected peak time periods of limited duration during the day.It does not necessarily reflect all changes in the schedules, many of which take place during time periods not shown in the The table below shows the headways for three selected peak time periods of limited duration during the day.It does not necessarily reflect all changes in the schedules, many of which take place during time periods not shown in the The table below shows the headways for three selected peak time periods of limited duration during the day.It does not necessarily reflect all changes in the schedules, many of which take place during time periods not shown in the The table below shows the headways and percent of guideline capacity at the maximum load point for four selected one hour time periods during the service day. It does not necessarily reflect all The tables below show the headways and percent of guideline capacity at the maximum load point for four selected one hour time periods during the service day. It does not necessarily reflect all The table below shows the headways and percent of guideline capacity at the maximum load point for four selected one hour time periods during the service day. It does not necessarily reflect all
(*) AM and PM headways based on peak hour service.) AM and PM headways based on peak hour service.The table below shows the headways for three selected peak time periods of limited duration during the day.It does not necessarily reflect all changes in the schedules, many of which take place during time periods not shown in the (*) Weekday AM and PM headways based on peak hour. The percentage change in revenue seat miles is based on the percentage change in revenue trips from the present The table below shows the headways for three selected peak time periods of limited duration during the day.It does not necessarily reflect all changes in the schedules, many of which take place during time periods not shown in the (*) AM and PM headways based on peak hour service.) AM and PM headways based on peak hour service.(*) Weekday AM and PM headways based on peak hour. The percentage change in revenue seat miles is based on the percentage change in revenue trips from the present The table below shows the headways for three selected peak time periods of limited duration during the day.It does not necessarily reflect all changes in the schedules, many of which take place during time periods not shown in the (*) AM and PM headways based on peak hour service.) AM and PM headways based on peak hour service.(*) Weekday AM and PM headways based on peak hour. The percentage change in revenue seat miles is based on the percentage change in revenue trips from the present The table below shows the headways for three selected peak time periods of limited duration during the day.It does not necessarily reflect all changes in the schedules, many of which take place during time periods not shown in the (*) AM and PM headways based on peak hour service.) AM and PM headways based on peak hour service.(*) The percentage change in revenue seat miles is based on the percentage change in revenue trips from the present The table below shows the headways for three selected peak time periods of limited duration during the day.It does not necessarily reflect all changes in the schedules, many of which take place during time periods not shown in the (*) AM and PM headways based on peak hour service.) AM and PM headways based on peak hour service.(*) The percentage change in revenue seat miles is based on the percentage change in revenue trips from the present The table below shows the headways for three selected peak time periods of limited duration during the day.It does not necessarily reflect all changes in the schedules, many of which take place during time periods not shown in the (*) AM and PM headways based on peak hour service.) AM and PM headways based on peak hour service.(*) The percentage change in revenue seat miles is based on the percentage change in revenue trips from the present The table below shows the headways for three selected peak time periods of limited duration during the day.It does not necessarily reflect all changes in the schedules, many of which take place during time periods not shown in the (*) AM and PM headways based on peak hour service.) AM and PM headways based on peak hour service.(*) The percentage change in revenue seat miles is based on the percentage change in revenue trips from the present The table below shows the headways for three selected peak time periods of limited duration during the day.It does not necessarily reflect all changes in the schedules, many of which take place during time periods not shown in the (*) AM and PM headways based on peak hour service.) AM and PM headways based on peak hour service.(*) The percentage change in revenue seat miles is based on the percentage change in revenue trips from the present The table below shows the headways for three selected peak time periods of limited duration during the day.It does not necessarily reflect all changes in the schedules, many of which take place during time periods not shown in the (*) AM and PM headways based on peak hour service.) AM and PM headways based on peak hour service.(*) The percentage change in revenue seat miles is based on the percentage change in revenue trips from the present The table below shows the headways for three selected peak time periods of limited duration during the day.It does not necessarily reflect all changes in the schedules, many of which take place during time periods not shown in the (*) AM and PM headways based on peak hour service.) AM and PM headways based on peak hour service.(*) The percentage change in revenue seat miles is based on the percentage change in revenue trips from the present The table below shows the headways for three selected peak time periods of limited duration during the day.It does not necessarily reflect all changes in the schedules, many of which take place during time periods not shown in the (*) AM and PM headways based on peak hour service.) AM and PM headways based on peak hour service.(*) The percentage change in revenue seat miles is based on the percentage change in revenue trips from the present The table below shows the headways for three selected peak time periods of limited duration during the day.It does not necessarily reflect all changes in the schedules, many of which take place during time periods not shown in the (*) AM and PM headways based on peak hour service.) AM and PM headways based on peak hour service.(*) Weekday AM and PM headways based on peak hour service; Weekday midday headways based on 11AM-1PM; Weekend AM , midday, and PM headways based on 6AM-10AM , The table below shows the headways for three selected peak time periods of limited duration during the day.It does not necessarily reflect all changes in the schedules, many of which take place during time periods not shown in the (*) AM and PM headways based on peak hour service.) AM and PM headways based on peak hour service.(*) Weekday AM and PM headways based on peak hour service; Weekday midday headways based on 11AM-1PM; Weekend AM , midday, and PM headways based on 6AM-10AM , The table below shows the headways for three selected peak time periods of limited duration during the day.It does not necessarily reflect all changes in the schedules, many of which take place during time periods not shown in the (*) AM and PM headways based on peak hour service.) AM and PM headways based on peak hour service.(*) Weekday AM and PM headways based on peak hour service; Weekend AM and PM headways based on 6AM-10AM and 3PM-7PM.The table below shows the headways for three selected peak time periods of limited duration during the day.It does not necessarily reflect all changes in the schedules, many of which take place during time periods not shown in the (*) AM and PM headways based on peak hour service.) AM and PM headways based on peak hour service.(*) Weekday AM and PM headways based on peak hour service; Weekday midday headways based on 11AM-1PM; Weekend AM , midday, and PM headways based on 6AM-10AM , The table below shows the headways for three selected peak time periods of limited duration during the day.It does not necessarily reflect all changes in the schedules, many of which take place during time periods not shown in the (*) AM and PM headways based on peak hour service.) AM and PM headways based on peak hour service.(*) Weekday AM and PM headways based on peak hour service; Weekend AM and PM headways based on 6AM-10AM and 3PM-7PM.The table below shows the headways for three selected peak time periods of limited duration during the day.It does not necessarily reflect all changes in the schedules, many of which take place during time periods not shown in the (*) AM and PM headways based on peak hour service.) AM and PM headways based on peak hour service.(*) Weekday AM and PM headways based on peak hour service; Weekend AM and PM headways based on 6AM-10AM and 3PM-7PM.The table below shows the headways for three selected peak time periods of limited duration during the day.It does not necessarily reflect all changes in the schedules, many of which take place during time periods not shown in the (*) AM and PM headways based on peak hour service.) AM and PM headways based on peak hour service.The table below shows the headways for three selected peak time periods of limited duration during the day.It does not necessarily reflect all changes in the schedules, many of which take place during time periods not shown in the (*) Weekday AM and PM headways based on peak hour service; Weekend AM and PM headways based on 6AM-10AM and 3PM-7PM.The table below shows the headways for three selected peak time periods of limited duration during the day.It does not necessarily reflect all changes in the schedules, many of which take place during time periods not shown in the (*) AM and PM headways based on peak hour service.) AM and PM headways based on peak hour service.(*) Weekday AM and PM headways based on peak hour service; Weekend AM and PM headways based on 6AM-10AM and 3PM-7PM.The table below shows the headways for three selected peak time periods of limited duration during the day.It does not necessarily reflect all changes in the schedules, many of which take place during time periods not shown in the (*) AM and PM headways based on peak hour service.) AM and PM headways based on peak hour service.(*) Weekday AM and PM headways based on peak hour service; Weekend AM and PM headways based on 6AM-10AM and 3PM-7PM.The table below shows the headways for three selected peak time periods of limited duration during the day.It does not necessarily reflect all changes in the schedules, many of which take place during time periods not shown in the (*) AM and PM headways based on peak hour service.) AM and PM headways based on peak hour service.The table below shows the headways for three selected peak time periods of limited duration during the day.It does not necessarily reflect all changes in the schedules, many of which take place during time periods not shown in the The table below shows the headways for three selected peak time periods of limited duration during the day.It does not necessarily reflect all changes in the schedules, many of which take place during time periods not shown in the The table below shows the headways for three selected peak time periods of limited duration during the day.It does not necessarily reflect all changes in the schedules, many of which take place during time periods not shown in the The table below shows the headways for three selected peak time periods of limited duration during the day.It does not necessarily reflect all changes in the schedules, many of which take place during time periods not shown in the The table below shows the headways for three selected peak time periods of limited duration during the day.It does not necessarily reflect all changes in the schedules, many of which take place during time periods not shown in the The table below shows the headways for three selected peak time periods of limited duration during the day.It does not necessarily reflect all changes in the schedules, many of which take place during time periods not shown in the (*) Weekday AM and PM headways based on peak hour service; Weekend AM and PM headways based on 6AM-10AM and 3PM-7PM.The table below shows the headways for three selected peak time periods of limited duration during the day.It does not necessarily reflect all changes in the schedules, many of which take place during time periods not shown in the (*) AM and PM headways based on peak hour service.) AM and PM headways based on peak hour service.(*) Weekday AM and PM headways based on peak hour service; Weekend AM and PM headways based on 6AM-10AM and 3PM-7PM.The table below shows the headways for three selected peak time periods of limited duration during the day.It does not necessarily reflect all changes in the schedules, many of which take place during time periods not shown in the ( The table below shows the headways for three selected peak time periods of limited duration during the day.It does not necessarily reflect all changes in the schedules, many of which take place during time periods not shown in the The table below shows the headways for three selected peak time periods of limited duration during the day.It does not necessarily reflect all changes in the schedules, many of which take place during time periods not shown in the The table below shows the headways for three selected peak time periods of limited duration during the day.It does not necessarily reflect all changes in the schedules, many of which take place during time periods not shown in the The table below shows the headways for three selected peak time periods of limited duration during the day.It does not necessarily reflect all changes in the schedules, many of which take place during time periods not shown in the The table below shows the headways for three selected peak time periods of limited duration during the day.It does not necessarily reflect all changes in the schedules, many of which take place during time periods not shown in the The table below shows the headways for three selected peak time periods of limited duration during the day.It does not necessarily reflect all changes in the schedules, many of which take place during time periods not shown in the The table below shows the headways for three selected peak time periods of limited duration during the day.It does not necessarily reflect all changes in the schedules, many of which take place during time periods not shown in the The table below shows the headways for three selected peak time periods of limited duration during the day.It does not necessarily reflect all changes in the schedules, many of which take place during time periods not shown in the The table below shows the headways for three selected peak time periods of limited duration during the day.It does not necessarily reflect all changes in the schedules, many of which take place during time periods not shown in the
(*) Weekday AM and PM headways based on peak hour. Weekend AM headways based on 8 AM - 9 AM; Weekend PM headways base on 5 PM -6 PM; Evening express
The table below shows the headways and percent of guideline capacity at the maximum load point for four selected one hour time periods during the service day. It does not necessarily reflect all Local bus guidelines call for standees during peak periods and up to a seated load during non-peak periods and on weekends. Express bus guidelines call for up to a seated load at all times. Weekday AM The tables below show the headways and percent of guideline capacity at the maximum load point for four selected one hour time periods during the service day. It does not necessarily reflect all (*) AM and PM headways based on peak hour service.) AM and PM headways based on peak hour service.The table below shows the headways for three selected peak time periods of limited duration during the day.It does not necessarily reflect all changes in the schedules, many of which take place during time periods not shown in the (*) Weekday AM and PM headways based on peak hour. The percentage change in revenue seat miles is based on the percentage change in revenue trips from the present The table below shows the headways for three selected peak time periods of limited duration during the day.It does not necessarily reflect all changes in the schedules, many of which take place during time periods not shown in the (*) AM and PM headways based on peak hour service.) AM and PM headways based on peak hour service.(*) Weekday AM and PM headways based on peak hour. The percentage change in revenue seat miles is based on the percentage change in revenue trips from the present The table below shows the headways for three selected peak time periods of limited duration during the day.It does not necessarily reflect all changes in the schedules, many of which take place during time periods not shown in the (*) AM and PM headways based on peak hour service.) AM and PM headways based on peak hour service.(*) Weekday AM and PM headways based on peak hour. The percentage change in revenue seat miles is based on the percentage change in revenue trips from the present The table below shows the headways for three selected peak time periods of limited duration during the day.It does not necessarily reflect all changes in the schedules, many of which take place during time periods not shown in the (*) AM and PM headways based on peak hour service.) AM and PM headways based on peak hour service.(*) The percentage change in revenue seat miles is based on the percentage change in revenue trips from the present The table below shows the headways for three selected peak time periods of limited duration during the day.It does not necessarily reflect all changes in the schedules, many of which take place during time periods not shown in the (*) AM and PM headways based on peak hour service.) AM and PM headways based on peak hour service.(*) The percentage change in revenue seat miles is based on the percentage change in revenue trips from the present The table below shows the headways for three selected peak time periods of limited duration during the day.It does not necessarily reflect all changes in the schedules, many of which take place during time periods not shown in the (*) AM and PM headways based on peak hour service.) AM and PM headways based on peak hour service.(*) The percentage change in revenue seat miles is based on the percentage change in revenue trips from the present The table below shows the headways for three selected peak time periods of limited duration during the day.It does not necessarily reflect all changes in the schedules, many of which take place during time periods not shown in the (*) AM and PM headways based on peak hour service.) AM and PM headways based on peak hour service.(*) The percentage change in revenue seat miles is based on the percentage change in revenue trips from the present The table below shows the headways for three selected peak time periods of limited duration during the day.It does not necessarily reflect all changes in the schedules, many of which take place during time periods not shown in the (*) AM and PM headways based on peak hour service.) AM and PM headways based on peak hour service.(*) The percentage change in revenue seat miles is based on the percentage change in revenue trips from the present The table below shows the headways for three selected peak time periods of limited duration during the day.It does not necessarily reflect all changes in the schedules, many of which take place during time periods not shown in the (*) AM and PM headways based on peak hour service.) AM and PM headways based on peak hour service.(*) The percentage change in revenue seat miles is based on the percentage change in revenue trips from the present The table below shows the headways for three selected peak time periods of limited duration during the day.It does not necessarily reflect all changes in the schedules, many of which take place during time periods not shown in the (*) AM and PM headways based on peak hour service.) AM and PM headways based on peak hour service.(*) The percentage change in revenue seat miles is based on the percentage change in revenue trips from the present The table below shows the headways for three selected peak time periods of limited duration during the day.It does not necessarily reflect all changes in the schedules, many of which take place during time periods not shown in the (*) AM and PM headways based on peak hour service.) AM and PM headways based on peak hour service.(*) The percentage change in revenue seat miles is based on the percentage change in revenue trips from the present The table below shows the headways for three selected peak time periods of limited duration during the day.It does not necessarily reflect all changes in the schedules, many of which take place during time periods not shown in the (*) AM and PM headways based on peak hour service.) AM and PM headways based on peak hour service.(*) Weekday AM and PM headways based on peak hour service; Weekday midday headways based on 11AM-1PM; Weekend AM , midday, and PM headways based on 6AM-10AM , The table below shows the headways for three selected peak time periods of limited duration during the day.It does not necessarily reflect all changes in the schedules, many of which take place during time periods not shown in the (*) AM and PM headways based on peak hour service.) AM and PM headways based on peak hour service.(*) Weekday AM and PM headways based on peak hour service; Weekday midday headways based on 11AM-1PM; Weekend AM , midday, and PM headways based on 6AM-10AM , The table below shows the headways for three selected peak time periods of limited duration during the day.It does not necessarily reflect all changes in the schedules, many of which take place during time periods not shown in the (*) AM and PM headways based on peak hour service.) AM and PM headways based on peak hour service.(*) Weekday AM and PM headways based on peak hour service; Weekend AM and PM headways based on 6AM-10AM and 3PM-7PM.The table below shows the headways for three selected peak time periods of limited duration during the day.It does not necessarily reflect all changes in the schedules, many of which take place during time periods not shown in the (*) AM and PM headways based on peak hour service.) AM and PM headways based on peak hour service.(*) Weekday AM and PM headways based on peak hour service; Weekday midday headways based on 11AM-1PM; Weekend AM , midday, and PM headways based on 6AM-10AM , The table below shows the headways for three selected peak time periods of limited duration during the day.It does not necessarily reflect all changes in the schedules, many of which take place during time periods not shown in the (*) AM and PM headways based on peak hour service.) AM and PM headways based on peak hour service.(*) Weekday AM and PM headways based on peak hour service; Weekend AM and PM headways based on 6AM-10AM and 3PM-7PM.The table below shows the headways for three selected peak time periods of limited duration during the day.It does not necessarily reflect all changes in the schedules, many of which take place during time periods not shown in the (*) AM and PM headways based on peak hour service.) AM and PM headways based on peak hour service.(*) Weekday AM and PM headways based on peak hour service; Weekend AM and PM headways based on 6AM-10AM and 3PM-7PM.The table below shows the headways for three selected peak time periods of limited duration during the day.It does not necessarily reflect all changes in the schedules, many of which take place during time periods not shown in the (*) AM and PM headways based on peak hour service.) AM and PM headways based on peak hour service.The table below shows the headways for three selected peak time periods of limited duration during the day.It does not necessarily reflect all changes in the schedules, many of which take place during time periods not shown in the (*) Weekday AM and PM headways based on peak hour service; Weekend AM and PM headways based on 6AM-10AM and 3PM-7PM.The table below shows the headways for three selected peak time periods of limited duration during the day.It does not necessarily reflect all changes in the schedules, many of which take place during time periods not shown in the (*) AM and PM headways based on peak hour service.) AM and PM headways based on peak hour service.(*) Weekday AM and PM headways based on peak hour service; Weekend AM and PM headways based on 6AM-10AM and 3PM-7PM.The table below shows the headways for three selected peak time periods of limited duration during the day.It does not necessarily reflect all changes in the schedules, many of which take place during time periods not shown in the (*) AM and PM headways based on peak hour service.) AM and PM headways based on peak hour service.(*) Weekday AM and PM headways based on peak hour service; Weekend AM and PM headways based on 6AM-10AM and 3PM-7PM.The table below shows the headways for three selected peak time periods of limited duration during the day.It does not necessarily reflect all changes in the schedules, many of which take place during time periods not shown in the (*) AM and PM headways based on peak hour service.) AM and PM headways based on peak hour service.The table below shows the headways for three selected peak time periods of limited duration during the day.It does not necessarily reflect all changes in the schedules, many of which take place during time periods not shown in the The table below shows the headways for three selected peak time periods of limited duration during the day.It does not necessarily reflect all changes in the schedules, many of which take place during time periods not shown in the The table below shows the headways for three selected peak time periods of limited duration during the day.It does not necessarily reflect all changes in the schedules, many of which take place during time periods not shown in the The table below shows the headways for three selected peak time periods of limited duration during the day.It does not necessarily reflect all changes in the schedules, many of which take place during time periods not shown in the The table below shows the headways for three selected peak time periods of limited duration during the day.It does not necessarily reflect all changes in the schedules, many of which take place during time periods not shown in the The table below shows the headways for three selected peak time periods of limited duration during the day.It does not necessarily reflect all changes in the schedules, many of which take place during time periods not shown in the (*) Weekday AM and PM headways based on peak hour service; Weekend AM and PM headways based on 6AM-10AM and 3PM-7PM.The table below shows the headways for three selected peak time periods of limited duration during the day.It does not necessarily reflect all changes in the schedules, many of which take place during time periods not shown in the (*) AM and PM headways based on peak hour service.) AM and PM headways based on peak hour service.(*) Weekday AM and PM headways based on peak hour service; Weekend AM and PM headways based on 6AM-10AM and 3PM-7PM.The table below shows the headways for three selected peak time periods of limited duration during the day.It does not necessarily reflect all changes in the schedules, many of which take place during time periods not shown in the ( The table below shows the headways for three selected peak time periods of limited duration during the day.It does not necessarily reflect all changes in the schedules, many of which take place during time periods not shown in the The table below shows the headways for three selected peak time periods of limited duration during the day.It does not necessarily reflect all changes in the schedules, many of which take place during time periods not shown in the The table below shows the headways for three selected peak time periods of limited duration during the day.It does not necessarily reflect all changes in the schedules, many of which take place during time periods not shown in the The table below shows the headways for three selected peak time periods of limited duration during the day.It does not necessarily reflect all changes in the schedules, many of which take place during time periods not shown in the The table below shows the headways for three selected peak time periods of limited duration during the day.It does not necessarily reflect all changes in the schedules, many of which take place during time periods not shown in the The table below shows the headways for three selected peak time periods of limited duration during the day.It does not necessarily reflect all changes in the schedules, many of which take place during time periods not shown in the The table below shows the headways for three selected peak time periods of limited duration during the day.It does not necessarily reflect all changes in the schedules, many of which take place during time periods not shown in the The table below shows the headways for three selected peak time periods of limited duration during the day.It does not necessarily reflect all changes in the schedules, many of which take place during time periods not shown in the The table below shows the headways for three selected peak time periods of limited duration during the day.It does not necessarily reflect all changes in the schedules, many of which take place during time periods not shown in the The table below shows the headways and percent of guideline capacity at the maximum load point for four selected one hour time periods during the service day. It does not necessarily reflect all
Local bus guidelines call for standees during peak periods and up to a seated load during non-peak periods and on weekends. Express bus guidelines call for up to a seated load at all times. Weekday AM and PM peak headways and percent of guideline capacity based on peak hour. Midday, evening, and weekend headways and percent of guideline capacity based on a representative hour during the time periods described in the headings.Routes with running time changes only -(**) Trip adjustment may occur during time periods not shown above
The table below shows the headways and percent of guideline capacity at the maximum load point for four selected one hour time periods during the service day. It does not necessarily reflect all The table below shows the headways and percent of guideline capacity at the maximum load point for four selected one hour time periods during the service day. It does not necessarily reflect all (*) Local bus guidelines call for standees during peak periods and up to a seated load during non-peak periods. Express bus guidelines call for up to a seated load at all times. Weekday AM and PM peak The tables below show the headways and percent of guideline capacity at the maximum load point for four selected one hour time periods during the service day. It does not necessarily reflect all The tables below show the headways and percent of guideline capacity at the maximum load point for four selected one hour time periods during the service day. It does not necessarily reflect all (*) Weekday AM and PM headways based on peak hour. Weekend AM headways based on 8 AM - 9 AM; Weekend PM headways base on 5 PM -6 PM; Evening express
Local bus guidelines call for standees during peak periods and up to a seated load during non-peak periods and on weekends. Express bus guidelines call for up to a seated load at all times. Weekday AM and PM peak headways and percent of guideline capacity based on peak hour. Midday, evening, and weekend headways and percent of guideline capacity based on a representative hour during the time periods described in the headings.Routes with running time changes only -(**) Trip adjustment may occur during time periods not shown above
Local bus guidelines call for standees during peak periods and up to a seated load during non-peak periods and on weekends. Express bus guidelines call for up to a seated load at all times. Weekday AM and PM peak headways and percent of guideline capacity based on peak hour. Midday, evening, and weekend headways and percent of guideline capacity based on a representative hour during the time periods described in the headings.Routes with running time changes only -(**) Trip adjustment may occur during time periods not shown above
(*) AM and PM headways based on peak hour service.) AM and PM headways based on peak hour service.The table below shows the headways for three selected peak time periods of limited duration during the day.It does not necessarily reflect all changes in the schedules, many of which take place during time periods not shown in the (*) Weekday AM and PM headways based on peak hour. The percentage change in revenue seat miles is based on the percentage change in revenue trips from the present The table below shows the headways for three selected peak time periods of limited duration during the day.It does not necessarily reflect all changes in the schedules, many of which take place during time periods not shown in the (*) AM and PM headways based on peak hour service.) AM and PM headways based on peak hour service.(*) Weekday AM and PM headways based on peak hour. The percentage change in revenue seat miles is based on the percentage change in revenue trips from the present The table below shows the headways for three selected peak time periods of limited duration during the day.It does not necessarily reflect all changes in the schedules, many of which take place during time periods not shown in the (*) AM and PM headways based on peak hour service.) AM and PM headways based on peak hour service.(*) Weekday AM and PM headways based on peak hour. The percentage change in revenue seat miles is based on the percentage change in revenue trips from the present The table below shows the headways for three selected peak time periods of limited duration during the day.It does not necessarily reflect all changes in the schedules, many of which take place during time periods not shown in the (*) AM and PM headways based on peak hour service.) AM and PM headways based on peak hour service.(*) The percentage change in revenue seat miles is based on the percentage change in revenue trips from the present The table below shows the headways for three selected peak time periods of limited duration during the day.It does not necessarily reflect all changes in the schedules, many of which take place during time periods not shown in the (*) AM and PM headways based on peak hour service.) AM and PM headways based on peak hour service.(*) The percentage change in revenue seat miles is based on the percentage change in revenue trips from the present The table below shows the headways for three selected peak time periods of limited duration during the day.It does not necessarily reflect all changes in the schedules, many of which take place during time periods not shown in the (*) AM and PM headways based on peak hour service.) AM and PM headways based on peak hour service.(*) The percentage change in revenue seat miles is based on the percentage change in revenue trips from the present The table below shows the headways for three selected peak time periods of limited duration during the day.It does not necessarily reflect all changes in the schedules, many of which take place during time periods not shown in the (*) AM and PM headways based on peak hour service.) AM and PM headways based on peak hour service.(*) The percentage change in revenue seat miles is based on the percentage change in revenue trips from the present The table below shows the headways for three selected peak time periods of limited duration during the day.It does not necessarily reflect all changes in the schedules, many of which take place during time periods not shown in the (*) AM and PM headways based on peak hour service.) AM and PM headways based on peak hour service.(*) The percentage change in revenue seat miles is based on the percentage change in revenue trips from the present The table below shows the headways for three selected peak time periods of limited duration during the day.It does not necessarily reflect all changes in the schedules, many of which take place during time periods not shown in the (*) AM and PM headways based on peak hour service.) AM and PM headways based on peak hour service.(*) The percentage change in revenue seat miles is based on the percentage change in revenue trips from the present The table below shows the headways for three selected peak time periods of limited duration during the day.It does not necessarily reflect all changes in the schedules, many of which take place during time periods not shown in the (*) AM and PM headways based on peak hour service.) AM and PM headways based on peak hour service.(*) The percentage change in revenue seat miles is based on the percentage change in revenue trips from the present The table below shows the headways for three selected peak time periods of limited duration during the day.It does not necessarily reflect all changes in the schedules, many of which take place during time periods not shown in the (*) AM and PM headways based on peak hour service.) AM and PM headways based on peak hour service.(*) The percentage change in revenue seat miles is based on the percentage change in revenue trips from the present The table below shows the headways for three selected peak time periods of limited duration during the day.It does not necessarily reflect all changes in the schedules, many of which take place during time periods not shown in the (*) AM and PM headways based on peak hour service.) AM and PM headways based on peak hour service.(*) Weekday AM and PM headways based on peak hour service; Weekday midday headways based on 11AM-1PM; Weekend AM , midday, and PM headways based on 6AM-10AM , The table below shows the headways for three selected peak time periods of limited duration during the day.It does not necessarily reflect all changes in the schedules, many of which take place during time periods not shown in the (*) AM and PM headways based on peak hour service.) AM and PM headways based on peak hour service.(*) Weekday AM and PM headways based on peak hour service; Weekday midday headways based on 11AM-1PM; Weekend AM , midday, and PM headways based on 6AM-10AM , The table below shows the headways for three selected peak time periods of limited duration during the day.It does not necessarily reflect all changes in the schedules, many of which take place during time periods not shown in the (*) AM and PM headways based on peak hour service.) AM and PM headways based on peak hour service.(*) Weekday AM and PM headways based on peak hour service; Weekend AM and PM headways based on 6AM-10AM and 3PM-7PM.The table below shows the headways for three selected peak time periods of limited duration during the day.It does not necessarily reflect all changes in the schedules, many of which take place during time periods not shown in the (*) AM and PM headways based on peak hour service.) AM and PM headways based on peak hour service.(*) Weekday AM and PM headways based on peak hour service; Weekday midday headways based on 11AM-1PM; Weekend AM , midday, and PM headways based on 6AM-10AM , The table below shows the headways for three selected peak time periods of limited duration during the day.It does not necessarily reflect all changes in the schedules, many of which take place during time periods not shown in the (*) AM and PM headways based on peak hour service.) AM and PM headways based on peak hour service.(*) Weekday AM and PM headways based on peak hour service; Weekend AM and PM headways based on 6AM-10AM and 3PM-7PM.The table below shows the headways for three selected peak time periods of limited duration during the day.It does not necessarily reflect all changes in the schedules, many of which take place during time periods not shown in the (*) AM and PM headways based on peak hour service.) AM and PM headways based on peak hour service.(*) Weekday AM and PM headways based on peak hour service; Weekend AM and PM headways based on 6AM-10AM and 3PM-7PM.The table below shows the headways for three selected peak time periods of limited duration during the day.It does not necessarily reflect all changes in the schedules, many of which take place during time periods not shown in the (*) AM and PM headways based on peak hour service.) AM and PM headways based on peak hour service.The table below shows the headways for three selected peak time periods of limited duration during the day.It does not necessarily reflect all changes in the schedules, many of which take place during time periods not shown in the (*) Weekday AM and PM headways based on peak hour service; Weekend AM and PM headways based on 6AM-10AM and 3PM-7PM.The table below shows the headways for three selected peak time periods of limited duration during the day.It does not necessarily reflect all changes in the schedules, many of which take place during time periods not shown in the (*) AM and PM headways based on peak hour service.) AM and PM headways based on peak hour service.(*) Weekday AM and PM headways based on peak hour service; Weekend AM and PM headways based on 6AM-10AM and 3PM-7PM.The table below shows the headways for three selected peak time periods of limited duration during the day.It does not necessarily reflect all changes in the schedules, many of which take place during time periods not shown in the (*) AM and PM headways based on peak hour service.) AM and PM headways based on peak hour service.(*) Weekday AM and PM headways based on peak hour service; Weekend AM and PM headways based on 6AM-10AM and 3PM-7PM.The table below shows the headways for three selected peak time periods of limited duration during the day.It does not necessarily reflect all changes in the schedules, many of which take place during time periods not shown in the (*) AM and PM headways based on peak hour service.) AM and PM headways based on peak hour service.The table below shows the headways for three selected peak time periods of limited duration during the day.It does not necessarily reflect all changes in the schedules, many of which take place during time periods not shown in the The table below shows the headways for three selected peak time periods of limited duration during the day.It does not necessarily reflect all changes in the schedules, many of which take place during time periods not shown in the The table below shows the headways for three selected peak time periods of limited duration during the day.It does not necessarily reflect all changes in the schedules, many of which take place during time periods not shown in the The table below shows the headways for three selected peak time periods of limited duration during the day.It does not necessarily reflect all changes in the schedules, many of which take place during time periods not shown in the The table below shows the headways for three selected peak time periods of limited duration during the day.It does not necessarily reflect all changes in the schedules, many of which take place during time periods not shown in the The table below shows the headways for three selected peak time periods of limited duration during the day.It does not necessarily reflect all changes in the schedules, many of which take place during time periods not shown in the (*) Weekday AM and PM headways based on peak hour service; Weekend AM and PM headways based on 6AM-10AM and 3PM-7PM.The table below shows the headways for three selected peak time periods of limited duration during the day.It does not necessarily reflect all changes in the schedules, many of which take place during time periods not shown in the (*) AM and PM headways based on peak hour service.) AM and PM headways based on peak hour service.(*) Weekday AM and PM headways based on peak hour service; Weekend AM and PM headways based on 6AM-10AM and 3PM-7PM.The table below shows the headways for three selected peak time periods of limited duration during the day.It does not necessarily reflect all changes in the schedules, many of which take place during time periods not shown in the ( The table below shows the headways for three selected peak time periods of limited duration during the day.It does not necessarily reflect all changes in the schedules, many of which take place during time periods not shown in the The table below shows the headways for three selected peak time periods of limited duration during the day.It does not necessarily reflect all changes in the schedules, many of which take place during time periods not shown in the The table below shows the headways for three selected peak time periods of limited duration during the day.It does not necessarily reflect all changes in the schedules, many of which take place during time periods not shown in the The table below shows the headways for three selected peak time periods of limited duration during the day.It does not necessarily reflect all changes in the schedules, many of which take place during time periods not shown in the The table below shows the headways for three selected peak time periods of limited duration during the day.It does not necessarily reflect all changes in the schedules, many of which take place during time periods not shown in the The table below shows the headways for three selected peak time periods of limited duration during the day.It does not necessarily reflect all changes in the schedules, many of which take place during time periods not shown in the The table below shows the headways for three selected peak time periods of limited duration during the day.It does not necessarily reflect all changes in the schedules, many of which take place during time periods not shown in the The table below shows the headways for three selected peak time periods of limited duration during the day.It does not necessarily reflect all changes in the schedules, many of which take place during time periods not shown in the The table below shows the headways for three selected peak time periods of limited duration during the day.It does not necessarily reflect all changes in the schedules, many of which take place during time periods not shown in the The table below shows the headways and percent of guideline capacity at the maximum load point for four selected one hour time periods during the service day. It does not necessarily reflect all The tables below show the headways and percent of guideline capacity at the maximum load point for four selected one hour time periods during the service day. It does not necessarily reflect all
Master Page # 216 of 242 - N
ew Y
ork City Transit and B
us Com
mittee M
eeting 7/23/2018________________________________________________________________________________
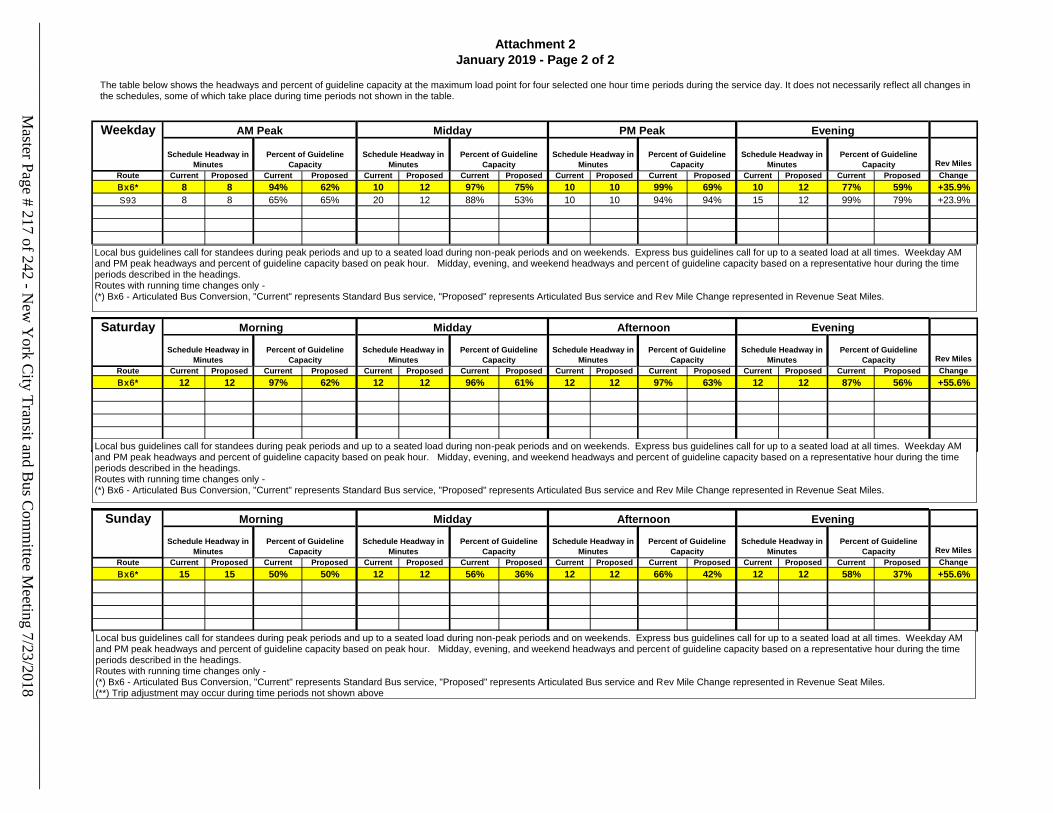
Weekday
Rev Miles
Route Current Proposed Current Proposed Current Proposed Current Proposed Current Proposed Current Proposed Current Proposed Current Proposed Change
Bx6* 8 8 94% 62% 10 12 97% 75% 10 10 99% 69% 10 12 77% 59% +35.9%
S93 8 8 65% 65% 20 12 88% 53% 10 10 94% 94% 15 12 99% 79% +23.9%
Saturday
Rev Miles
Route Current Proposed Current Proposed Current Proposed Current Proposed Current Proposed Current Proposed Current Proposed Current Proposed Change
Bx6* 12 12 97% 62% 12 12 96% 61% 12 12 97% 63% 12 12 87% 56% +55.6%
Sunday
Rev Miles
Route Current Proposed Current Proposed Current Proposed Current Proposed Current Proposed Current Proposed Current Proposed Current Proposed Change
Bx6* 15 15 50% 50% 12 12 56% 36% 12 12 66% 42% 12 12 58% 37% +55.6%
AM Peak Midday PM Peak Evening
Attachment 2
January 2019 - Page 2 of 2
Schedule Headway in
Minutes
Percent of Guideline
Capacity
Morning Midday Afternoon Evening
Schedule Headway in
Minutes
Percent of Guideline
Capacity
Schedule Headway in
Minutes
Percent of Guideline
Capacity
Schedule Headway in
Minutes
Percent of Guideline
Capacity
Schedule Headway in
Minutes
Percent of Guideline
Capacity
Morning Midday Afternoon Evening
Schedule Headway in
Minutes
Percent of Guideline
Capacity
Schedule Headway in
Minutes
Percent of Guideline
Capacity
Schedule Headway in
Minutes
Percent of Guideline
Capacity
Schedule Headway in
Minutes
Percent of Guideline
Capacity
Schedule Headway in
Minutes
Percent of Guideline
Capacity
Schedule Headway in
Minutes
Percent of Guideline
Capacity
Schedule Headway in
Minutes
Percent of Guideline
Capacity
The table below shows the headways and percent of guideline capacity at the maximum load point for four selected one hour time periods during the service day. It does not necessarily reflect all changes in the schedules, some of which take place during time periods not shown in the table.
(*) AM and PM headways based on peak hour service.) AM and PM headways based on peak hour service.The table below shows the headways for three selected peak time periods of limited duration during the day.It does not necessarily reflect all changes in the schedules, many of which take place during time periods not shown in the (*) Weekday AM and PM headways based on peak hour. The percentage change in revenue seat miles is based on the percentage change in revenue trips from the present The table below shows the headways for three selected peak time periods of limited duration during the day.It does not necessarily reflect all changes in the schedules, many of which take place during time periods not shown in the (*) AM and PM headways based on peak hour service.) AM and PM headways based on peak hour service.(*) Weekday AM and PM headways based on peak hour. The percentage change in revenue seat miles is based on the percentage change in revenue trips from the present The table below shows the headways for three selected peak time periods of limited duration during the day.It does not necessarily reflect all changes in the schedules, many of which take place during time periods not shown in the (*) AM and PM headways based on peak hour service.) AM and PM headways based on peak hour service.(*) Weekday AM and PM headways based on peak hour. The percentage change in revenue seat miles is based on the percentage change in revenue trips from the present The table below shows the headways for three selected peak time periods of limited duration during the day.It does not necessarily reflect all changes in the schedules, many of which take place during time periods not shown in the (*) AM and PM headways based on peak hour service.) AM and PM headways based on peak hour service.(*) The percentage change in revenue seat miles is based on the percentage change in revenue trips from the present The table below shows the headways for three selected peak time periods of limited duration during the day.It does not necessarily reflect all changes in the schedules, many of which take place during time periods not shown in the (*) AM and PM headways based on peak hour service.) AM and PM headways based on peak hour service.(*) The percentage change in revenue seat miles is based on the percentage change in revenue trips from the present The table below shows the headways for three selected peak time periods of limited duration during the day.It does not necessarily reflect all changes in the schedules, many of which take place during time periods not shown in the (*) AM and PM headways based on peak hour service.) AM and PM headways based on peak hour service.(*) The percentage change in revenue seat miles is based on the percentage change in revenue trips from the present The table below shows the headways for three selected peak time periods of limited duration during the day.It does not necessarily reflect all changes in the schedules, many of which take place during time periods not shown in the (*) AM and PM headways based on peak hour service.) AM and PM headways based on peak hour service.(*) The percentage change in revenue seat miles is based on the percentage change in revenue trips from the present The table below shows the headways for three selected peak time periods of limited duration during the day.It does not necessarily reflect all changes in the schedules, many of which take place during time periods not shown in the (*) AM and PM headways based on peak hour service.) AM and PM headways based on peak hour service.(*) The percentage change in revenue seat miles is based on the percentage change in revenue trips from the present The table below shows the headways for three selected peak time periods of limited duration during the day.It does not necessarily reflect all changes in the schedules, many of which take place during time periods not shown in the (*) AM and PM headways based on peak hour service.) AM and PM headways based on peak hour service.(*) The percentage change in revenue seat miles is based on the percentage change in revenue trips from the present The table below shows the headways for three selected peak time periods of limited duration during the day.It does not necessarily reflect all changes in the schedules, many of which take place during time periods not shown in the (*) AM and PM headways based on peak hour service.) AM and PM headways based on peak hour service.(*) The percentage change in revenue seat miles is based on the percentage change in revenue trips from the present The table below shows the headways for three selected peak time periods of limited duration during the day.It does not necessarily reflect all changes in the schedules, many of which take place during time periods not shown in the (*) AM and PM headways based on peak hour service.) AM and PM headways based on peak hour service.(*) The percentage change in revenue seat miles is based on the percentage change in revenue trips from the present The table below shows the headways for three selected peak time periods of limited duration during the day.It does not necessarily reflect all changes in the schedules, many of which take place during time periods not shown in the (*) AM and PM headways based on peak hour service.) AM and PM headways based on peak hour service.(*) Weekday AM and PM headways based on peak hour service; Weekday midday headways based on 11AM-1PM; Weekend AM , midday, and PM headways based on 6AM-10AM , The table below shows the headways for three selected peak time periods of limited duration during the day.It does not necessarily reflect all changes in the schedules, many of which take place during time periods not shown in the (*) AM and PM headways based on peak hour service.) AM and PM headways based on peak hour service.(*) Weekday AM and PM headways based on peak hour service; Weekday midday headways based on 11AM-1PM; Weekend AM , midday, and PM headways based on 6AM-10AM , The table below shows the headways for three selected peak time periods of limited duration during the day.It does not necessarily reflect all changes in the schedules, many of which take place during time periods not shown in the (*) AM and PM headways based on peak hour service.) AM and PM headways based on peak hour service.(*) Weekday AM and PM headways based on peak hour service; Weekend AM and PM headways based on 6AM-10AM and 3PM-7PM.The table below shows the headways for three selected peak time periods of limited duration during the day.It does not necessarily reflect all changes in the schedules, many of which take place during time periods not shown in the (*) AM and PM headways based on peak hour service.) AM and PM headways based on peak hour service.(*) Weekday AM and PM headways based on peak hour service; Weekday midday headways based on 11AM-1PM; Weekend AM , midday, and PM headways based on 6AM-10AM , The table below shows the headways for three selected peak time periods of limited duration during the day.It does not necessarily reflect all changes in the schedules, many of which take place during time periods not shown in the (*) AM and PM headways based on peak hour service.) AM and PM headways based on peak hour service.(*) Weekday AM and PM headways based on peak hour service; Weekend AM and PM headways based on 6AM-10AM and 3PM-7PM.The table below shows the headways for three selected peak time periods of limited duration during the day.It does not necessarily reflect all changes in the schedules, many of which take place during time periods not shown in the (*) AM and PM headways based on peak hour service.) AM and PM headways based on peak hour service.(*) Weekday AM and PM headways based on peak hour service; Weekend AM and PM headways based on 6AM-10AM and 3PM-7PM.The table below shows the headways for three selected peak time periods of limited duration during the day.It does not necessarily reflect all changes in the schedules, many of which take place during time periods not shown in the (*) AM and PM headways based on peak hour service.) AM and PM headways based on peak hour service.The table below shows the headways for three selected peak time periods of limited duration during the day.It does not necessarily reflect all changes in the schedules, many of which take place during time periods not shown in the (*) Weekday AM and PM headways based on peak hour service; Weekend AM and PM headways based on 6AM-10AM and 3PM-7PM.The table below shows the headways for three selected peak time periods of limited duration during the day.It does not necessarily reflect all changes in the schedules, many of which take place during time periods not shown in the (*) AM and PM headways based on peak hour service.) AM and PM headways based on peak hour service.(*) Weekday AM and PM headways based on peak hour service; Weekend AM and PM headways based on 6AM-10AM and 3PM-7PM.The table below shows the headways for three selected peak time periods of limited duration during the day.It does not necessarily reflect all changes in the schedules, many of which take place during time periods not shown in the (*) AM and PM headways based on peak hour service.) AM and PM headways based on peak hour service.(*) Weekday AM and PM headways based on peak hour service; Weekend AM and PM headways based on 6AM-10AM and 3PM-7PM.The table below shows the headways for three selected peak time periods of limited duration during the day.It does not necessarily reflect all changes in the schedules, many of which take place during time periods not shown in the (*) AM and PM headways based on peak hour service.) AM and PM headways based on peak hour service.The table below shows the headways for three selected peak time periods of limited duration during the day.It does not necessarily reflect all changes in the schedules, many of which take place during time periods not shown in the The table below shows the headways for three selected peak time periods of limited duration during the day.It does not necessarily reflect all changes in the schedules, many of which take place during time periods not shown in the The table below shows the headways for three selected peak time periods of limited duration during the day.It does not necessarily reflect all changes in the schedules, many of which take place during time periods not shown in the The table below shows the headways for three selected peak time periods of limited duration during the day.It does not necessarily reflect all changes in the schedules, many of which take place during time periods not shown in the The table below shows the headways for three selected peak time periods of limited duration during the day.It does not necessarily reflect all changes in the schedules, many of which take place during time periods not shown in the The table below shows the headways for three selected peak time periods of limited duration during the day.It does not necessarily reflect all changes in the schedules, many of which take place during time periods not shown in the (*) Weekday AM and PM headways based on peak hour service; Weekend AM and PM headways based on 6AM-10AM and 3PM-7PM.The table below shows the headways for three selected peak time periods of limited duration during the day.It does not necessarily reflect all changes in the schedules, many of which take place during time periods not shown in the (*) AM and PM headways based on peak hour service.) AM and PM headways based on peak hour service.(*) Weekday AM and PM headways based on peak hour service; Weekend AM and PM headways based on 6AM-10AM and 3PM-7PM.The table below shows the headways for three selected peak time periods of limited duration during the day.It does not necessarily reflect all changes in the schedules, many of which take place during time periods not shown in the ( The table below shows the headways for three selected peak time periods of limited duration during the day.It does not necessarily reflect all changes in the schedules, many of which take place during time periods not shown in the The table below shows the headways for three selected peak time periods of limited duration during the day.It does not necessarily reflect all changes in the schedules, many of which take place during time periods not shown in the The table below shows the headways for three selected peak time periods of limited duration during the day.It does not necessarily reflect all changes in the schedules, many of which take place during time periods not shown in the The table below shows the headways for three selected peak time periods of limited duration during the day.It does not necessarily reflect all changes in the schedules, many of which take place during time periods not shown in the The table below shows the headways for three selected peak time periods of limited duration during the day.It does not necessarily reflect all changes in the schedules, many of which take place during time periods not shown in the The table below shows the headways for three selected peak time periods of limited duration during the day.It does not necessarily reflect all changes in the schedules, many of which take place during time periods not shown in the The table below shows the headways for three selected peak time periods of limited duration during the day.It does not necessarily reflect all changes in the schedules, many of which take place during time periods not shown in the The table below shows the headways for three selected peak time periods of limited duration during the day.It does not necessarily reflect all changes in the schedules, many of which take place during time periods not shown in the The table below shows the headways for three selected peak time periods of limited duration during the day.It does not necessarily reflect all changes in the schedules, many of which take place during time periods not shown in the
(*) Weekday AM and PM headways based on peak hour. Weekend AM headways based on 8 AM - 9 AM; Weekend PM headways base on 5 PM -6 PM; Evening express Local bus guidelines call for standees during peak periods and up to a seated load during non-peak periods and on weekends. Express bus guidelines call for up to a seated load at all times. Weekday AM
The tables below show the headways and percent of guideline capacity at the maximum load point for four selected one hour time periods during the service day. It does not necessarily reflect all
(*) AM and PM headways based on peak hour service.) AM and PM headways based on peak hour service.The table below shows the headways for three selected peak time periods of limited duration during the day.It does not necessarily reflect all changes in the schedules, many of which take place during time periods not shown in the (*) Weekday AM and PM headways based on peak hour. The percentage change in revenue seat miles is based on the percentage change in revenue trips from the present The table below shows the headways for three selected peak time periods of limited duration during the day.It does not necessarily reflect all changes in the schedules, many of which take place during time periods not shown in the (*) AM and PM headways based on peak hour service.) AM and PM headways based on peak hour service.(*) Weekday AM and PM headways based on peak hour. The percentage change in revenue seat miles is based on the percentage change in revenue trips from the present The table below shows the headways for three selected peak time periods of limited duration during the day.It does not necessarily reflect all changes in the schedules, many of which take place during time periods not shown in the (*) AM and PM headways based on peak hour service.) AM and PM headways based on peak hour service.(*) Weekday AM and PM headways based on peak hour. The percentage change in revenue seat miles is based on the percentage change in revenue trips from the present The table below shows the headways for three selected peak time periods of limited duration during the day.It does not necessarily reflect all changes in the schedules, many of which take place during time periods not shown in the (*) AM and PM headways based on peak hour service.) AM and PM headways based on peak hour service.(*) The percentage change in revenue seat miles is based on the percentage change in revenue trips from the present The table below shows the headways for three selected peak time periods of limited duration during the day.It does not necessarily reflect all changes in the schedules, many of which take place during time periods not shown in the (*) AM and PM headways based on peak hour service.) AM and PM headways based on peak hour service.(*) The percentage change in revenue seat miles is based on the percentage change in revenue trips from the present The table below shows the headways for three selected peak time periods of limited duration during the day.It does not necessarily reflect all changes in the schedules, many of which take place during time periods not shown in the (*) AM and PM headways based on peak hour service.) AM and PM headways based on peak hour service.(*) The percentage change in revenue seat miles is based on the percentage change in revenue trips from the present The table below shows the headways for three selected peak time periods of limited duration during the day.It does not necessarily reflect all changes in the schedules, many of which take place during time periods not shown in the (*) AM and PM headways based on peak hour service.) AM and PM headways based on peak hour service.(*) The percentage change in revenue seat miles is based on the percentage change in revenue trips from the present The table below shows the headways for three selected peak time periods of limited duration during the day.It does not necessarily reflect all changes in the schedules, many of which take place during time periods not shown in the (*) AM and PM headways based on peak hour service.) AM and PM headways based on peak hour service.(*) The percentage change in revenue seat miles is based on the percentage change in revenue trips from the present The table below shows the headways for three selected peak time periods of limited duration during the day.It does not necessarily reflect all changes in the schedules, many of which take place during time periods not shown in the (*) AM and PM headways based on peak hour service.) AM and PM headways based on peak hour service.(*) The percentage change in revenue seat miles is based on the percentage change in revenue trips from the present The table below shows the headways for three selected peak time periods of limited duration during the day.It does not necessarily reflect all changes in the schedules, many of which take place during time periods not shown in the (*) AM and PM headways based on peak hour service.) AM and PM headways based on peak hour service.(*) The percentage change in revenue seat miles is based on the percentage change in revenue trips from the present The table below shows the headways for three selected peak time periods of limited duration during the day.It does not necessarily reflect all changes in the schedules, many of which take place during time periods not shown in the (*) AM and PM headways based on peak hour service.) AM and PM headways based on peak hour service.(*) The percentage change in revenue seat miles is based on the percentage change in revenue trips from the present The table below shows the headways for three selected peak time periods of limited duration during the day.It does not necessarily reflect all changes in the schedules, many of which take place during time periods not shown in the (*) AM and PM headways based on peak hour service.) AM and PM headways based on peak hour service.(*) Weekday AM and PM headways based on peak hour service; Weekday midday headways based on 11AM-1PM; Weekend AM , midday, and PM headways based on 6AM-10AM , The table below shows the headways for three selected peak time periods of limited duration during the day.It does not necessarily reflect all changes in the schedules, many of which take place during time periods not shown in the (*) AM and PM headways based on peak hour service.) AM and PM headways based on peak hour service.(*) Weekday AM and PM headways based on peak hour service; Weekday midday headways based on 11AM-1PM; Weekend AM , midday, and PM headways based on 6AM-10AM , The table below shows the headways for three selected peak time periods of limited duration during the day.It does not necessarily reflect all changes in the schedules, many of which take place during time periods not shown in the (*) AM and PM headways based on peak hour service.) AM and PM headways based on peak hour service.(*) Weekday AM and PM headways based on peak hour service; Weekend AM and PM headways based on 6AM-10AM and 3PM-7PM.The table below shows the headways for three selected peak time periods of limited duration during the day.It does not necessarily reflect all changes in the schedules, many of which take place during time periods not shown in the (*) AM and PM headways based on peak hour service.) AM and PM headways based on peak hour service.(*) Weekday AM and PM headways based on peak hour service; Weekday midday headways based on 11AM-1PM; Weekend AM , midday, and PM headways based on 6AM-10AM , The table below shows the headways for three selected peak time periods of limited duration during the day.It does not necessarily reflect all changes in the schedules, many of which take place during time periods not shown in the (*) AM and PM headways based on peak hour service.) AM and PM headways based on peak hour service.(*) Weekday AM and PM headways based on peak hour service; Weekend AM and PM headways based on 6AM-10AM and 3PM-7PM.The table below shows the headways for three selected peak time periods of limited duration during the day.It does not necessarily reflect all changes in the schedules, many of which take place during time periods not shown in the (*) AM and PM headways based on peak hour service.) AM and PM headways based on peak hour service.(*) Weekday AM and PM headways based on peak hour service; Weekend AM and PM headways based on 6AM-10AM and 3PM-7PM.The table below shows the headways for three selected peak time periods of limited duration during the day.It does not necessarily reflect all changes in the schedules, many of which take place during time periods not shown in the (*) AM and PM headways based on peak hour service.) AM and PM headways based on peak hour service.The table below shows the headways for three selected peak time periods of limited duration during the day.It does not necessarily reflect all changes in the schedules, many of which take place during time periods not shown in the (*) Weekday AM and PM headways based on peak hour service; Weekend AM and PM headways based on 6AM-10AM and 3PM-7PM.The table below shows the headways for three selected peak time periods of limited duration during the day.It does not necessarily reflect all changes in the schedules, many of which take place during time periods not shown in the (*) AM and PM headways based on peak hour service.) AM and PM headways based on peak hour service.(*) Weekday AM and PM headways based on peak hour service; Weekend AM and PM headways based on 6AM-10AM and 3PM-7PM.The table below shows the headways for three selected peak time periods of limited duration during the day.It does not necessarily reflect all changes in the schedules, many of which take place during time periods not shown in the (*) AM and PM headways based on peak hour service.) AM and PM headways based on peak hour service.(*) Weekday AM and PM headways based on peak hour service; Weekend AM and PM headways based on 6AM-10AM and 3PM-7PM.The table below shows the headways for three selected peak time periods of limited duration during the day.It does not necessarily reflect all changes in the schedules, many of which take place during time periods not shown in the (*) AM and PM headways based on peak hour service.) AM and PM headways based on peak hour service.The table below shows the headways for three selected peak time periods of limited duration during the day.It does not necessarily reflect all changes in the schedules, many of which take place during time periods not shown in the The table below shows the headways for three selected peak time periods of limited duration during the day.It does not necessarily reflect all changes in the schedules, many of which take place during time periods not shown in the The table below shows the headways for three selected peak time periods of limited duration during the day.It does not necessarily reflect all changes in the schedules, many of which take place during time periods not shown in the The table below shows the headways for three selected peak time periods of limited duration during the day.It does not necessarily reflect all changes in the schedules, many of which take place during time periods not shown in the The table below shows the headways for three selected peak time periods of limited duration during the day.It does not necessarily reflect all changes in the schedules, many of which take place during time periods not shown in the The table below shows the headways for three selected peak time periods of limited duration during the day.It does not necessarily reflect all changes in the schedules, many of which take place during time periods not shown in the (*) Weekday AM and PM headways based on peak hour service; Weekend AM and PM headways based on 6AM-10AM and 3PM-7PM.The table below shows the headways for three selected peak time periods of limited duration during the day.It does not necessarily reflect all changes in the schedules, many of which take place during time periods not shown in the (*) AM and PM headways based on peak hour service.) AM and PM headways based on peak hour service.(*) Weekday AM and PM headways based on peak hour service; Weekend AM and PM headways based on 6AM-10AM and 3PM-7PM.The table below shows the headways for three selected peak time periods of limited duration during the day.It does not necessarily reflect all changes in the schedules, many of which take place during time periods not shown in the ( The table below shows the headways for three selected peak time periods of limited duration during the day.It does not necessarily reflect all changes in the schedules, many of which take place during time periods not shown in the The table below shows the headways for three selected peak time periods of limited duration during the day.It does not necessarily reflect all changes in the schedules, many of which take place during time periods not shown in the The table below shows the headways for three selected peak time periods of limited duration during the day.It does not necessarily reflect all changes in the schedules, many of which take place during time periods not shown in the The table below shows the headways for three selected peak time periods of limited duration during the day.It does not necessarily reflect all changes in the schedules, many of which take place during time periods not shown in the The table below shows the headways for three selected peak time periods of limited duration during the day.It does not necessarily reflect all changes in the schedules, many of which take place during time periods not shown in the The table below shows the headways for three selected peak time periods of limited duration during the day.It does not necessarily reflect all changes in the schedules, many of which take place during time periods not shown in the The table below shows the headways for three selected peak time periods of limited duration during the day.It does not necessarily reflect all changes in the schedules, many of which take place during time periods not shown in the The table below shows the headways for three selected peak time periods of limited duration during the day.It does not necessarily reflect all changes in the schedules, many of which take place during time periods not shown in the The table below shows the headways for three selected peak time periods of limited duration during the day.It does not necessarily reflect all changes in the schedules, many of which take place during time periods not shown in the The table below shows the headways and percent of guideline capacity at the maximum load point for four selected one hour time periods during the service day. It does not necessarily reflect all Local bus guidelines call for standees during peak periods and up to a seated load during non-peak periods and on weekends. Express bus guidelines call for up to a seated load at all times. Weekday AM The table below shows the headways and percent of guideline capacity at the maximum load point for four selected one hour time periods during the service day. It does not necessarily reflect all The table below shows the headways and percent of guideline capacity at the maximum load point for four selected one hour time periods during the service day. It does not necessarily reflect all (*) Local bus guidelines call for standees during peak periods and up to a seated load during non-peak periods. Express bus guidelines call for up to a seated load at all times. Weekday AM and PM peak The tables below show the headways and percent of guideline capacity at the maximum load point for four selected one hour time periods during the service day. It does not necessarily reflect all The tables below show the headways and percent of guideline capacity at the maximum load point for four selected one hour time periods during the service day. It does not necessarily reflect all
(*) AM and PM headways based on peak hour service.) AM and PM headways based on peak hour service.The table below shows the headways for three selected peak time periods of limited duration during the day.It does not necessarily reflect all changes in the schedules, many of which take place during time periods not shown in the (*) Weekday AM and PM headways based on peak hour. The percentage change in revenue seat miles is based on the percentage change in revenue trips from the present The table below shows the headways for three selected peak time periods of limited duration during the day.It does not necessarily reflect all changes in the schedules, many of which take place during time periods not shown in the (*) AM and PM headways based on peak hour service.) AM and PM headways based on peak hour service.(*) Weekday AM and PM headways based on peak hour. The percentage change in revenue seat miles is based on the percentage change in revenue trips from the present The table below shows the headways for three selected peak time periods of limited duration during the day.It does not necessarily reflect all changes in the schedules, many of which take place during time periods not shown in the (*) AM and PM headways based on peak hour service.) AM and PM headways based on peak hour service.(*) Weekday AM and PM headways based on peak hour. The percentage change in revenue seat miles is based on the percentage change in revenue trips from the present The table below shows the headways for three selected peak time periods of limited duration during the day.It does not necessarily reflect all changes in the schedules, many of which take place during time periods not shown in the (*) AM and PM headways based on peak hour service.) AM and PM headways based on peak hour service.(*) The percentage change in revenue seat miles is based on the percentage change in revenue trips from the present The table below shows the headways for three selected peak time periods of limited duration during the day.It does not necessarily reflect all changes in the schedules, many of which take place during time periods not shown in the (*) AM and PM headways based on peak hour service.) AM and PM headways based on peak hour service.(*) The percentage change in revenue seat miles is based on the percentage change in revenue trips from the present The table below shows the headways for three selected peak time periods of limited duration during the day.It does not necessarily reflect all changes in the schedules, many of which take place during time periods not shown in the (*) AM and PM headways based on peak hour service.) AM and PM headways based on peak hour service.(*) The percentage change in revenue seat miles is based on the percentage change in revenue trips from the present The table below shows the headways for three selected peak time periods of limited duration during the day.It does not necessarily reflect all changes in the schedules, many of which take place during time periods not shown in the (*) AM and PM headways based on peak hour service.) AM and PM headways based on peak hour service.(*) The percentage change in revenue seat miles is based on the percentage change in revenue trips from the present The table below shows the headways for three selected peak time periods of limited duration during the day.It does not necessarily reflect all changes in the schedules, many of which take place during time periods not shown in the (*) AM and PM headways based on peak hour service.) AM and PM headways based on peak hour service.(*) The percentage change in revenue seat miles is based on the percentage change in revenue trips from the present The table below shows the headways for three selected peak time periods of limited duration during the day.It does not necessarily reflect all changes in the schedules, many of which take place during time periods not shown in the (*) AM and PM headways based on peak hour service.) AM and PM headways based on peak hour service.(*) The percentage change in revenue seat miles is based on the percentage change in revenue trips from the present The table below shows the headways for three selected peak time periods of limited duration during the day.It does not necessarily reflect all changes in the schedules, many of which take place during time periods not shown in the (*) AM and PM headways based on peak hour service.) AM and PM headways based on peak hour service.(*) The percentage change in revenue seat miles is based on the percentage change in revenue trips from the present The table below shows the headways for three selected peak time periods of limited duration during the day.It does not necessarily reflect all changes in the schedules, many of which take place during time periods not shown in the (*) AM and PM headways based on peak hour service.) AM and PM headways based on peak hour service.(*) The percentage change in revenue seat miles is based on the percentage change in revenue trips from the present The table below shows the headways for three selected peak time periods of limited duration during the day.It does not necessarily reflect all changes in the schedules, many of which take place during time periods not shown in the (*) AM and PM headways based on peak hour service.) AM and PM headways based on peak hour service.(*) Weekday AM and PM headways based on peak hour service; Weekday midday headways based on 11AM-1PM; Weekend AM , midday, and PM headways based on 6AM-10AM , The table below shows the headways for three selected peak time periods of limited duration during the day.It does not necessarily reflect all changes in the schedules, many of which take place during time periods not shown in the (*) AM and PM headways based on peak hour service.) AM and PM headways based on peak hour service.(*) Weekday AM and PM headways based on peak hour service; Weekday midday headways based on 11AM-1PM; Weekend AM , midday, and PM headways based on 6AM-10AM , The table below shows the headways for three selected peak time periods of limited duration during the day.It does not necessarily reflect all changes in the schedules, many of which take place during time periods not shown in the (*) AM and PM headways based on peak hour service.) AM and PM headways based on peak hour service.(*) Weekday AM and PM headways based on peak hour service; Weekend AM and PM headways based on 6AM-10AM and 3PM-7PM.The table below shows the headways for three selected peak time periods of limited duration during the day.It does not necessarily reflect all changes in the schedules, many of which take place during time periods not shown in the (*) AM and PM headways based on peak hour service.) AM and PM headways based on peak hour service.(*) Weekday AM and PM headways based on peak hour service; Weekday midday headways based on 11AM-1PM; Weekend AM , midday, and PM headways based on 6AM-10AM , The table below shows the headways for three selected peak time periods of limited duration during the day.It does not necessarily reflect all changes in the schedules, many of which take place during time periods not shown in the (*) AM and PM headways based on peak hour service.) AM and PM headways based on peak hour service.(*) Weekday AM and PM headways based on peak hour service; Weekend AM and PM headways based on 6AM-10AM and 3PM-7PM.The table below shows the headways for three selected peak time periods of limited duration during the day.It does not necessarily reflect all changes in the schedules, many of which take place during time periods not shown in the (*) AM and PM headways based on peak hour service.) AM and PM headways based on peak hour service.(*) Weekday AM and PM headways based on peak hour service; Weekend AM and PM headways based on 6AM-10AM and 3PM-7PM.The table below shows the headways for three selected peak time periods of limited duration during the day.It does not necessarily reflect all changes in the schedules, many of which take place during time periods not shown in the (*) AM and PM headways based on peak hour service.) AM and PM headways based on peak hour service.The table below shows the headways for three selected peak time periods of limited duration during the day.It does not necessarily reflect all changes in the schedules, many of which take place during time periods not shown in the (*) Weekday AM and PM headways based on peak hour service; Weekend AM and PM headways based on 6AM-10AM and 3PM-7PM.The table below shows the headways for three selected peak time periods of limited duration during the day.It does not necessarily reflect all changes in the schedules, many of which take place during time periods not shown in the (*) AM and PM headways based on peak hour service.) AM and PM headways based on peak hour service.(*) Weekday AM and PM headways based on peak hour service; Weekend AM and PM headways based on 6AM-10AM and 3PM-7PM.The table below shows the headways for three selected peak time periods of limited duration during the day.It does not necessarily reflect all changes in the schedules, many of which take place during time periods not shown in the (*) AM and PM headways based on peak hour service.) AM and PM headways based on peak hour service.(*) Weekday AM and PM headways based on peak hour service; Weekend AM and PM headways based on 6AM-10AM and 3PM-7PM.The table below shows the headways for three selected peak time periods of limited duration during the day.It does not necessarily reflect all changes in the schedules, many of which take place during time periods not shown in the (*) AM and PM headways based on peak hour service.) AM and PM headways based on peak hour service.The table below shows the headways for three selected peak time periods of limited duration during the day.It does not necessarily reflect all changes in the schedules, many of which take place during time periods not shown in the The table below shows the headways for three selected peak time periods of limited duration during the day.It does not necessarily reflect all changes in the schedules, many of which take place during time periods not shown in the The table below shows the headways for three selected peak time periods of limited duration during the day.It does not necessarily reflect all changes in the schedules, many of which take place during time periods not shown in the The table below shows the headways for three selected peak time periods of limited duration during the day.It does not necessarily reflect all changes in the schedules, many of which take place during time periods not shown in the The table below shows the headways for three selected peak time periods of limited duration during the day.It does not necessarily reflect all changes in the schedules, many of which take place during time periods not shown in the The table below shows the headways for three selected peak time periods of limited duration during the day.It does not necessarily reflect all changes in the schedules, many of which take place during time periods not shown in the (*) Weekday AM and PM headways based on peak hour service; Weekend AM and PM headways based on 6AM-10AM and 3PM-7PM.The table below shows the headways for three selected peak time periods of limited duration during the day.It does not necessarily reflect all changes in the schedules, many of which take place during time periods not shown in the (*) AM and PM headways based on peak hour service.) AM and PM headways based on peak hour service.(*) Weekday AM and PM headways based on peak hour service; Weekend AM and PM headways based on 6AM-10AM and 3PM-7PM.The table below shows the headways for three selected peak time periods of limited duration during the day.It does not necessarily reflect all changes in the schedules, many of which take place during time periods not shown in the ( The table below shows the headways for three selected peak time periods of limited duration during the day.It does not necessarily reflect all changes in the schedules, many of which take place during time periods not shown in the The table below shows the headways for three selected peak time periods of limited duration during the day.It does not necessarily reflect all changes in the schedules, many of which take place during time periods not shown in the The table below shows the headways for three selected peak time periods of limited duration during the day.It does not necessarily reflect all changes in the schedules, many of which take place during time periods not shown in the The table below shows the headways for three selected peak time periods of limited duration during the day.It does not necessarily reflect all changes in the schedules, many of which take place during time periods not shown in the The table below shows the headways for three selected peak time periods of limited duration during the day.It does not necessarily reflect all changes in the schedules, many of which take place during time periods not shown in the The table below shows the headways for three selected peak time periods of limited duration during the day.It does not necessarily reflect all changes in the schedules, many of which take place during time periods not shown in the The table below shows the headways for three selected peak time periods of limited duration during the day.It does not necessarily reflect all changes in the schedules, many of which take place during time periods not shown in the The table below shows the headways for three selected peak time periods of limited duration during the day.It does not necessarily reflect all changes in the schedules, many of which take place during time periods not shown in the The table below shows the headways for three selected peak time periods of limited duration during the day.It does not necessarily reflect all changes in the schedules, many of which take place during time periods not shown in the The table below shows the headways and percent of guideline capacity at the maximum load point for four selected one hour time periods during the service day. It does not necessarily reflect all The tables below show the headways and percent of guideline capacity at the maximum load point for four selected one hour time periods during the service day. It does not necessarily reflect all The table below shows the headways and percent of guideline capacity at the maximum load point for four selected one hour time periods during the service day. It does not necessarily reflect all
(*) AM and PM headways based on peak hour service.) AM and PM headways based on peak hour service.The table below shows the headways for three selected peak time periods of limited duration during the day.It does not necessarily reflect all changes in the schedules, many of which take place during time periods not shown in the (*) Weekday AM and PM headways based on peak hour. The percentage change in revenue seat miles is based on the percentage change in revenue trips from the present The table below shows the headways for three selected peak time periods of limited duration during the day.It does not necessarily reflect all changes in the schedules, many of which take place during time periods not shown in the (*) AM and PM headways based on peak hour service.) AM and PM headways based on peak hour service.(*) Weekday AM and PM headways based on peak hour. The percentage change in revenue seat miles is based on the percentage change in revenue trips from the present The table below shows the headways for three selected peak time periods of limited duration during the day.It does not necessarily reflect all changes in the schedules, many of which take place during time periods not shown in the (*) AM and PM headways based on peak hour service.) AM and PM headways based on peak hour service.(*) Weekday AM and PM headways based on peak hour. The percentage change in revenue seat miles is based on the percentage change in revenue trips from the present The table below shows the headways for three selected peak time periods of limited duration during the day.It does not necessarily reflect all changes in the schedules, many of which take place during time periods not shown in the (*) AM and PM headways based on peak hour service.) AM and PM headways based on peak hour service.(*) The percentage change in revenue seat miles is based on the percentage change in revenue trips from the present The table below shows the headways for three selected peak time periods of limited duration during the day.It does not necessarily reflect all changes in the schedules, many of which take place during time periods not shown in the (*) AM and PM headways based on peak hour service.) AM and PM headways based on peak hour service.(*) The percentage change in revenue seat miles is based on the percentage change in revenue trips from the present The table below shows the headways for three selected peak time periods of limited duration during the day.It does not necessarily reflect all changes in the schedules, many of which take place during time periods not shown in the (*) AM and PM headways based on peak hour service.) AM and PM headways based on peak hour service.(*) The percentage change in revenue seat miles is based on the percentage change in revenue trips from the present The table below shows the headways for three selected peak time periods of limited duration during the day.It does not necessarily reflect all changes in the schedules, many of which take place during time periods not shown in the (*) AM and PM headways based on peak hour service.) AM and PM headways based on peak hour service.(*) The percentage change in revenue seat miles is based on the percentage change in revenue trips from the present The table below shows the headways for three selected peak time periods of limited duration during the day.It does not necessarily reflect all changes in the schedules, many of which take place during time periods not shown in the (*) AM and PM headways based on peak hour service.) AM and PM headways based on peak hour service.(*) The percentage change in revenue seat miles is based on the percentage change in revenue trips from the present The table below shows the headways for three selected peak time periods of limited duration during the day.It does not necessarily reflect all changes in the schedules, many of which take place during time periods not shown in the (*) AM and PM headways based on peak hour service.) AM and PM headways based on peak hour service.(*) The percentage change in revenue seat miles is based on the percentage change in revenue trips from the present The table below shows the headways for three selected peak time periods of limited duration during the day.It does not necessarily reflect all changes in the schedules, many of which take place during time periods not shown in the (*) AM and PM headways based on peak hour service.) AM and PM headways based on peak hour service.(*) The percentage change in revenue seat miles is based on the percentage change in revenue trips from the present The table below shows the headways for three selected peak time periods of limited duration during the day.It does not necessarily reflect all changes in the schedules, many of which take place during time periods not shown in the (*) AM and PM headways based on peak hour service.) AM and PM headways based on peak hour service.(*) The percentage change in revenue seat miles is based on the percentage change in revenue trips from the present The table below shows the headways for three selected peak time periods of limited duration during the day.It does not necessarily reflect all changes in the schedules, many of which take place during time periods not shown in the (*) AM and PM headways based on peak hour service.) AM and PM headways based on peak hour service.(*) Weekday AM and PM headways based on peak hour service; Weekday midday headways based on 11AM-1PM; Weekend AM , midday, and PM headways based on 6AM-10AM , The table below shows the headways for three selected peak time periods of limited duration during the day.It does not necessarily reflect all changes in the schedules, many of which take place during time periods not shown in the (*) AM and PM headways based on peak hour service.) AM and PM headways based on peak hour service.(*) Weekday AM and PM headways based on peak hour service; Weekday midday headways based on 11AM-1PM; Weekend AM , midday, and PM headways based on 6AM-10AM , The table below shows the headways for three selected peak time periods of limited duration during the day.It does not necessarily reflect all changes in the schedules, many of which take place during time periods not shown in the (*) AM and PM headways based on peak hour service.) AM and PM headways based on peak hour service.(*) Weekday AM and PM headways based on peak hour service; Weekend AM and PM headways based on 6AM-10AM and 3PM-7PM.The table below shows the headways for three selected peak time periods of limited duration during the day.It does not necessarily reflect all changes in the schedules, many of which take place during time periods not shown in the (*) AM and PM headways based on peak hour service.) AM and PM headways based on peak hour service.(*) Weekday AM and PM headways based on peak hour service; Weekday midday headways based on 11AM-1PM; Weekend AM , midday, and PM headways based on 6AM-10AM , The table below shows the headways for three selected peak time periods of limited duration during the day.It does not necessarily reflect all changes in the schedules, many of which take place during time periods not shown in the (*) AM and PM headways based on peak hour service.) AM and PM headways based on peak hour service.(*) Weekday AM and PM headways based on peak hour service; Weekend AM and PM headways based on 6AM-10AM and 3PM-7PM.The table below shows the headways for three selected peak time periods of limited duration during the day.It does not necessarily reflect all changes in the schedules, many of which take place during time periods not shown in the (*) AM and PM headways based on peak hour service.) AM and PM headways based on peak hour service.(*) Weekday AM and PM headways based on peak hour service; Weekend AM and PM headways based on 6AM-10AM and 3PM-7PM.The table below shows the headways for three selected peak time periods of limited duration during the day.It does not necessarily reflect all changes in the schedules, many of which take place during time periods not shown in the (*) AM and PM headways based on peak hour service.) AM and PM headways based on peak hour service.The table below shows the headways for three selected peak time periods of limited duration during the day.It does not necessarily reflect all changes in the schedules, many of which take place during time periods not shown in the (*) Weekday AM and PM headways based on peak hour service; Weekend AM and PM headways based on 6AM-10AM and 3PM-7PM.The table below shows the headways for three selected peak time periods of limited duration during the day.It does not necessarily reflect all changes in the schedules, many of which take place during time periods not shown in the (*) AM and PM headways based on peak hour service.) AM and PM headways based on peak hour service.(*) Weekday AM and PM headways based on peak hour service; Weekend AM and PM headways based on 6AM-10AM and 3PM-7PM.The table below shows the headways for three selected peak time periods of limited duration during the day.It does not necessarily reflect all changes in the schedules, many of which take place during time periods not shown in the (*) AM and PM headways based on peak hour service.) AM and PM headways based on peak hour service.(*) Weekday AM and PM headways based on peak hour service; Weekend AM and PM headways based on 6AM-10AM and 3PM-7PM.The table below shows the headways for three selected peak time periods of limited duration during the day.It does not necessarily reflect all changes in the schedules, many of which take place during time periods not shown in the (*) AM and PM headways based on peak hour service.) AM and PM headways based on peak hour service.The table below shows the headways for three selected peak time periods of limited duration during the day.It does not necessarily reflect all changes in the schedules, many of which take place during time periods not shown in the The table below shows the headways for three selected peak time periods of limited duration during the day.It does not necessarily reflect all changes in the schedules, many of which take place during time periods not shown in the The table below shows the headways for three selected peak time periods of limited duration during the day.It does not necessarily reflect all changes in the schedules, many of which take place during time periods not shown in the The table below shows the headways for three selected peak time periods of limited duration during the day.It does not necessarily reflect all changes in the schedules, many of which take place during time periods not shown in the The table below shows the headways for three selected peak time periods of limited duration during the day.It does not necessarily reflect all changes in the schedules, many of which take place during time periods not shown in the The table below shows the headways for three selected peak time periods of limited duration during the day.It does not necessarily reflect all changes in the schedules, many of which take place during time periods not shown in the (*) Weekday AM and PM headways based on peak hour service; Weekend AM and PM headways based on 6AM-10AM and 3PM-7PM.The table below shows the headways for three selected peak time periods of limited duration during the day.It does not necessarily reflect all changes in the schedules, many of which take place during time periods not shown in the (*) AM and PM headways based on peak hour service.) AM and PM headways based on peak hour service.(*) Weekday AM and PM headways based on peak hour service; Weekend AM and PM headways based on 6AM-10AM and 3PM-7PM.The table below shows the headways for three selected peak time periods of limited duration during the day.It does not necessarily reflect all changes in the schedules, many of which take place during time periods not shown in the ( The table below shows the headways for three selected peak time periods of limited duration during the day.It does not necessarily reflect all changes in the schedules, many of which take place during time periods not shown in the The table below shows the headways for three selected peak time periods of limited duration during the day.It does not necessarily reflect all changes in the schedules, many of which take place during time periods not shown in the The table below shows the headways for three selected peak time periods of limited duration during the day.It does not necessarily reflect all changes in the schedules, many of which take place during time periods not shown in the The table below shows the headways for three selected peak time periods of limited duration during the day.It does not necessarily reflect all changes in the schedules, many of which take place during time periods not shown in the The table below shows the headways for three selected peak time periods of limited duration during the day.It does not necessarily reflect all changes in the schedules, many of which take place during time periods not shown in the The table below shows the headways for three selected peak time periods of limited duration during the day.It does not necessarily reflect all changes in the schedules, many of which take place during time periods not shown in the The table below shows the headways for three selected peak time periods of limited duration during the day.It does not necessarily reflect all changes in the schedules, many of which take place during time periods not shown in the The table below shows the headways for three selected peak time periods of limited duration during the day.It does not necessarily reflect all changes in the schedules, many of which take place during time periods not shown in the The table below shows the headways for three selected peak time periods of limited duration during the day.It does not necessarily reflect all changes in the schedules, many of which take place during time periods not shown in the
(*) Weekday AM and PM headways based on peak hour. Weekend AM headways based on 8 AM - 9 AM; Weekend PM headways base on 5 PM -6 PM; Evening express
The table below shows the headways and percent of guideline capacity at the maximum load point for four selected one hour time periods during the service day. It does not necessarily reflect all Local bus guidelines call for standees during peak periods and up to a seated load during non-peak periods and on weekends. Express bus guidelines call for up to a seated load at all times. Weekday AM The tables below show the headways and percent of guideline capacity at the maximum load point for four selected one hour time periods during the service day. It does not necessarily reflect all (*) AM and PM headways based on peak hour service.) AM and PM headways based on peak hour service.The table below shows the headways for three selected peak time periods of limited duration during the day.It does not necessarily reflect all changes in the schedules, many of which take place during time periods not shown in the (*) Weekday AM and PM headways based on peak hour. The percentage change in revenue seat miles is based on the percentage change in revenue trips from the present The table below shows the headways for three selected peak time periods of limited duration during the day.It does not necessarily reflect all changes in the schedules, many of which take place during time periods not shown in the (*) AM and PM headways based on peak hour service.) AM and PM headways based on peak hour service.(*) Weekday AM and PM headways based on peak hour. The percentage change in revenue seat miles is based on the percentage change in revenue trips from the present The table below shows the headways for three selected peak time periods of limited duration during the day.It does not necessarily reflect all changes in the schedules, many of which take place during time periods not shown in the (*) AM and PM headways based on peak hour service.) AM and PM headways based on peak hour service.(*) Weekday AM and PM headways based on peak hour. The percentage change in revenue seat miles is based on the percentage change in revenue trips from the present The table below shows the headways for three selected peak time periods of limited duration during the day.It does not necessarily reflect all changes in the schedules, many of which take place during time periods not shown in the (*) AM and PM headways based on peak hour service.) AM and PM headways based on peak hour service.(*) The percentage change in revenue seat miles is based on the percentage change in revenue trips from the present The table below shows the headways for three selected peak time periods of limited duration during the day.It does not necessarily reflect all changes in the schedules, many of which take place during time periods not shown in the (*) AM and PM headways based on peak hour service.) AM and PM headways based on peak hour service.(*) The percentage change in revenue seat miles is based on the percentage change in revenue trips from the present The table below shows the headways for three selected peak time periods of limited duration during the day.It does not necessarily reflect all changes in the schedules, many of which take place during time periods not shown in the (*) AM and PM headways based on peak hour service.) AM and PM headways based on peak hour service.(*) The percentage change in revenue seat miles is based on the percentage change in revenue trips from the present The table below shows the headways for three selected peak time periods of limited duration during the day.It does not necessarily reflect all changes in the schedules, many of which take place during time periods not shown in the (*) AM and PM headways based on peak hour service.) AM and PM headways based on peak hour service.(*) The percentage change in revenue seat miles is based on the percentage change in revenue trips from the present The table below shows the headways for three selected peak time periods of limited duration during the day.It does not necessarily reflect all changes in the schedules, many of which take place during time periods not shown in the (*) AM and PM headways based on peak hour service.) AM and PM headways based on peak hour service.(*) The percentage change in revenue seat miles is based on the percentage change in revenue trips from the present The table below shows the headways for three selected peak time periods of limited duration during the day.It does not necessarily reflect all changes in the schedules, many of which take place during time periods not shown in the (*) AM and PM headways based on peak hour service.) AM and PM headways based on peak hour service.(*) The percentage change in revenue seat miles is based on the percentage change in revenue trips from the present The table below shows the headways for three selected peak time periods of limited duration during the day.It does not necessarily reflect all changes in the schedules, many of which take place during time periods not shown in the (*) AM and PM headways based on peak hour service.) AM and PM headways based on peak hour service.(*) The percentage change in revenue seat miles is based on the percentage change in revenue trips from the present The table below shows the headways for three selected peak time periods of limited duration during the day.It does not necessarily reflect all changes in the schedules, many of which take place during time periods not shown in the (*) AM and PM headways based on peak hour service.) AM and PM headways based on peak hour service.(*) The percentage change in revenue seat miles is based on the percentage change in revenue trips from the present The table below shows the headways for three selected peak time periods of limited duration during the day.It does not necessarily reflect all changes in the schedules, many of which take place during time periods not shown in the (*) AM and PM headways based on peak hour service.) AM and PM headways based on peak hour service.(*) Weekday AM and PM headways based on peak hour service; Weekday midday headways based on 11AM-1PM; Weekend AM , midday, and PM headways based on 6AM-10AM , The table below shows the headways for three selected peak time periods of limited duration during the day.It does not necessarily reflect all changes in the schedules, many of which take place during time periods not shown in the (*) AM and PM headways based on peak hour service.) AM and PM headways based on peak hour service.(*) Weekday AM and PM headways based on peak hour service; Weekday midday headways based on 11AM-1PM; Weekend AM , midday, and PM headways based on 6AM-10AM , The table below shows the headways for three selected peak time periods of limited duration during the day.It does not necessarily reflect all changes in the schedules, many of which take place during time periods not shown in the (*) AM and PM headways based on peak hour service.) AM and PM headways based on peak hour service.(*) Weekday AM and PM headways based on peak hour service; Weekend AM and PM headways based on 6AM-10AM and 3PM-7PM.The table below shows the headways for three selected peak time periods of limited duration during the day.It does not necessarily reflect all changes in the schedules, many of which take place during time periods not shown in the (*) AM and PM headways based on peak hour service.) AM and PM headways based on peak hour service.(*) Weekday AM and PM headways based on peak hour service; Weekday midday headways based on 11AM-1PM; Weekend AM , midday, and PM headways based on 6AM-10AM , The table below shows the headways for three selected peak time periods of limited duration during the day.It does not necessarily reflect all changes in the schedules, many of which take place during time periods not shown in the (*) AM and PM headways based on peak hour service.) AM and PM headways based on peak hour service.(*) Weekday AM and PM headways based on peak hour service; Weekend AM and PM headways based on 6AM-10AM and 3PM-7PM.The table below shows the headways for three selected peak time periods of limited duration during the day.It does not necessarily reflect all changes in the schedules, many of which take place during time periods not shown in the (*) AM and PM headways based on peak hour service.) AM and PM headways based on peak hour service.(*) Weekday AM and PM headways based on peak hour service; Weekend AM and PM headways based on 6AM-10AM and 3PM-7PM.The table below shows the headways for three selected peak time periods of limited duration during the day.It does not necessarily reflect all changes in the schedules, many of which take place during time periods not shown in the (*) AM and PM headways based on peak hour service.) AM and PM headways based on peak hour service.The table below shows the headways for three selected peak time periods of limited duration during the day.It does not necessarily reflect all changes in the schedules, many of which take place during time periods not shown in the (*) Weekday AM and PM headways based on peak hour service; Weekend AM and PM headways based on 6AM-10AM and 3PM-7PM.The table below shows the headways for three selected peak time periods of limited duration during the day.It does not necessarily reflect all changes in the schedules, many of which take place during time periods not shown in the (*) AM and PM headways based on peak hour service.) AM and PM headways based on peak hour service.(*) Weekday AM and PM headways based on peak hour service; Weekend AM and PM headways based on 6AM-10AM and 3PM-7PM.The table below shows the headways for three selected peak time periods of limited duration during the day.It does not necessarily reflect all changes in the schedules, many of which take place during time periods not shown in the (*) AM and PM headways based on peak hour service.) AM and PM headways based on peak hour service.(*) Weekday AM and PM headways based on peak hour service; Weekend AM and PM headways based on 6AM-10AM and 3PM-7PM.The table below shows the headways for three selected peak time periods of limited duration during the day.It does not necessarily reflect all changes in the schedules, many of which take place during time periods not shown in the (*) AM and PM headways based on peak hour service.) AM and PM headways based on peak hour service.The table below shows the headways for three selected peak time periods of limited duration during the day.It does not necessarily reflect all changes in the schedules, many of which take place during time periods not shown in the The table below shows the headways for three selected peak time periods of limited duration during the day.It does not necessarily reflect all changes in the schedules, many of which take place during time periods not shown in the The table below shows the headways for three selected peak time periods of limited duration during the day.It does not necessarily reflect all changes in the schedules, many of which take place during time periods not shown in the The table below shows the headways for three selected peak time periods of limited duration during the day.It does not necessarily reflect all changes in the schedules, many of which take place during time periods not shown in the The table below shows the headways for three selected peak time periods of limited duration during the day.It does not necessarily reflect all changes in the schedules, many of which take place during time periods not shown in the The table below shows the headways for three selected peak time periods of limited duration during the day.It does not necessarily reflect all changes in the schedules, many of which take place during time periods not shown in the (*) Weekday AM and PM headways based on peak hour service; Weekend AM and PM headways based on 6AM-10AM and 3PM-7PM.The table below shows the headways for three selected peak time periods of limited duration during the day.It does not necessarily reflect all changes in the schedules, many of which take place during time periods not shown in the (*) AM and PM headways based on peak hour service.) AM and PM headways based on peak hour service.(*) Weekday AM and PM headways based on peak hour service; Weekend AM and PM headways based on 6AM-10AM and 3PM-7PM.The table below shows the headways for three selected peak time periods of limited duration during the day.It does not necessarily reflect all changes in the schedules, many of which take place during time periods not shown in the ( The table below shows the headways for three selected peak time periods of limited duration during the day.It does not necessarily reflect all changes in the schedules, many of which take place during time periods not shown in the The table below shows the headways for three selected peak time periods of limited duration during the day.It does not necessarily reflect all changes in the schedules, many of which take place during time periods not shown in the The table below shows the headways for three selected peak time periods of limited duration during the day.It does not necessarily reflect all changes in the schedules, many of which take place during time periods not shown in the The table below shows the headways for three selected peak time periods of limited duration during the day.It does not necessarily reflect all changes in the schedules, many of which take place during time periods not shown in the The table below shows the headways for three selected peak time periods of limited duration during the day.It does not necessarily reflect all changes in the schedules, many of which take place during time periods not shown in the The table below shows the headways for three selected peak time periods of limited duration during the day.It does not necessarily reflect all changes in the schedules, many of which take place during time periods not shown in the The table below shows the headways for three selected peak time periods of limited duration during the day.It does not necessarily reflect all changes in the schedules, many of which take place during time periods not shown in the The table below shows the headways for three selected peak time periods of limited duration during the day.It does not necessarily reflect all changes in the schedules, many of which take place during time periods not shown in the The table below shows the headways for three selected peak time periods of limited duration during the day.It does not necessarily reflect all changes in the schedules, many of which take place during time periods not shown in the The table below shows the headways and percent of guideline capacity at the maximum load point for four selected one hour time periods during the service day. It does not necessarily reflect all
Local bus guidelines call for standees during peak periods and up to a seated load during non-peak periods and on weekends. Express bus guidelines call for up to a seated load at all times. Weekday AM and PM peak headways and percent of guideline capacity based on peak hour. Midday, evening, and weekend headways and percent of guideline capacity based on a representative hour during the time periods described in the headings.Routes with running time changes only -(*) Bx6 - Articulated Bus Conversion, "Current" represents Standard Bus service, "Proposed" represents Articulated Bus service and Rev Mile Change represented in Revenue Seat Miles.(**) Trip adjustment may occur during time periods not shown above
The table below shows the headways and percent of guideline capacity at the maximum load point for four selected one hour time periods during the service day. It does not necessarily reflect all The table below shows the headways and percent of guideline capacity at the maximum load point for four selected one hour time periods during the service day. It does not necessarily reflect all (*) Local bus guidelines call for standees during peak periods and up to a seated load during non-peak periods. Express bus guidelines call for up to a seated load at all times. Weekday AM and PM peak The tables below show the headways and percent of guideline capacity at the maximum load point for four selected one hour time periods during the service day. It does not necessarily reflect all The tables below show the headways and percent of guideline capacity at the maximum load point for four selected one hour time periods during the service day. It does not necessarily reflect all (*) Weekday AM and PM headways based on peak hour. Weekend AM headways based on 8 AM - 9 AM; Weekend PM headways base on 5 PM -6 PM; Evening express
Local bus guidelines call for standees during peak periods and up to a seated load during non-peak periods and on weekends. Express bus guidelines call for up to a seated load at all times. Weekday AM and PM peak headways and percent of guideline capacity based on peak hour. Midday, evening, and weekend headways and percent of guideline capacity based on a representative hour during the time periods described in the headings.Routes with running time changes only -(*) Bx6 - Articulated Bus Conversion, "Current" represents Standard Bus service, "Proposed" represents Articulated Bus service and Rev Mile Change represented in Revenue Seat Miles.
Local bus guidelines call for standees during peak periods and up to a seated load during non-peak periods and on weekends. Express bus guidelines call for up to a seated load at all times. Weekday AM and PM peak headways and percent of guideline capacity based on peak hour. Midday, evening, and weekend headways and percent of guideline capacity based on a representative hour during the time periods described in the headings.Routes with running time changes only -(*) Bx6 - Articulated Bus Conversion, "Current" represents Standard Bus service, "Proposed" represents Articulated Bus service and Rev Mile Change represented in Revenue Seat Miles.
(*) AM and PM headways based on peak hour service.) AM and PM headways based on peak hour service.The table below shows the headways for three selected peak time periods of limited duration during the day.It does not necessarily reflect all changes in the schedules, many of which take place during time periods not shown in the (*) Weekday AM and PM headways based on peak hour. The percentage change in revenue seat miles is based on the percentage change in revenue trips from the present The table below shows the headways for three selected peak time periods of limited duration during the day.It does not necessarily reflect all changes in the schedules, many of which take place during time periods not shown in the (*) AM and PM headways based on peak hour service.) AM and PM headways based on peak hour service.(*) Weekday AM and PM headways based on peak hour. The percentage change in revenue seat miles is based on the percentage change in revenue trips from the present The table below shows the headways for three selected peak time periods of limited duration during the day.It does not necessarily reflect all changes in the schedules, many of which take place during time periods not shown in the (*) AM and PM headways based on peak hour service.) AM and PM headways based on peak hour service.(*) Weekday AM and PM headways based on peak hour. The percentage change in revenue seat miles is based on the percentage change in revenue trips from the present The table below shows the headways for three selected peak time periods of limited duration during the day.It does not necessarily reflect all changes in the schedules, many of which take place during time periods not shown in the (*) AM and PM headways based on peak hour service.) AM and PM headways based on peak hour service.(*) The percentage change in revenue seat miles is based on the percentage change in revenue trips from the present The table below shows the headways for three selected peak time periods of limited duration during the day.It does not necessarily reflect all changes in the schedules, many of which take place during time periods not shown in the (*) AM and PM headways based on peak hour service.) AM and PM headways based on peak hour service.(*) The percentage change in revenue seat miles is based on the percentage change in revenue trips from the present The table below shows the headways for three selected peak time periods of limited duration during the day.It does not necessarily reflect all changes in the schedules, many of which take place during time periods not shown in the (*) AM and PM headways based on peak hour service.) AM and PM headways based on peak hour service.(*) The percentage change in revenue seat miles is based on the percentage change in revenue trips from the present The table below shows the headways for three selected peak time periods of limited duration during the day.It does not necessarily reflect all changes in the schedules, many of which take place during time periods not shown in the (*) AM and PM headways based on peak hour service.) AM and PM headways based on peak hour service.(*) The percentage change in revenue seat miles is based on the percentage change in revenue trips from the present The table below shows the headways for three selected peak time periods of limited duration during the day.It does not necessarily reflect all changes in the schedules, many of which take place during time periods not shown in the (*) AM and PM headways based on peak hour service.) AM and PM headways based on peak hour service.(*) The percentage change in revenue seat miles is based on the percentage change in revenue trips from the present The table below shows the headways for three selected peak time periods of limited duration during the day.It does not necessarily reflect all changes in the schedules, many of which take place during time periods not shown in the (*) AM and PM headways based on peak hour service.) AM and PM headways based on peak hour service.(*) The percentage change in revenue seat miles is based on the percentage change in revenue trips from the present The table below shows the headways for three selected peak time periods of limited duration during the day.It does not necessarily reflect all changes in the schedules, many of which take place during time periods not shown in the (*) AM and PM headways based on peak hour service.) AM and PM headways based on peak hour service.(*) The percentage change in revenue seat miles is based on the percentage change in revenue trips from the present The table below shows the headways for three selected peak time periods of limited duration during the day.It does not necessarily reflect all changes in the schedules, many of which take place during time periods not shown in the (*) AM and PM headways based on peak hour service.) AM and PM headways based on peak hour service.(*) The percentage change in revenue seat miles is based on the percentage change in revenue trips from the present The table below shows the headways for three selected peak time periods of limited duration during the day.It does not necessarily reflect all changes in the schedules, many of which take place during time periods not shown in the (*) AM and PM headways based on peak hour service.) AM and PM headways based on peak hour service.(*) Weekday AM and PM headways based on peak hour service; Weekday midday headways based on 11AM-1PM; Weekend AM , midday, and PM headways based on 6AM-10AM , The table below shows the headways for three selected peak time periods of limited duration during the day.It does not necessarily reflect all changes in the schedules, many of which take place during time periods not shown in the (*) AM and PM headways based on peak hour service.) AM and PM headways based on peak hour service.(*) Weekday AM and PM headways based on peak hour service; Weekday midday headways based on 11AM-1PM; Weekend AM , midday, and PM headways based on 6AM-10AM , The table below shows the headways for three selected peak time periods of limited duration during the day.It does not necessarily reflect all changes in the schedules, many of which take place during time periods not shown in the (*) AM and PM headways based on peak hour service.) AM and PM headways based on peak hour service.(*) Weekday AM and PM headways based on peak hour service; Weekend AM and PM headways based on 6AM-10AM and 3PM-7PM.The table below shows the headways for three selected peak time periods of limited duration during the day.It does not necessarily reflect all changes in the schedules, many of which take place during time periods not shown in the (*) AM and PM headways based on peak hour service.) AM and PM headways based on peak hour service.(*) Weekday AM and PM headways based on peak hour service; Weekday midday headways based on 11AM-1PM; Weekend AM , midday, and PM headways based on 6AM-10AM , The table below shows the headways for three selected peak time periods of limited duration during the day.It does not necessarily reflect all changes in the schedules, many of which take place during time periods not shown in the (*) AM and PM headways based on peak hour service.) AM and PM headways based on peak hour service.(*) Weekday AM and PM headways based on peak hour service; Weekend AM and PM headways based on 6AM-10AM and 3PM-7PM.The table below shows the headways for three selected peak time periods of limited duration during the day.It does not necessarily reflect all changes in the schedules, many of which take place during time periods not shown in the (*) AM and PM headways based on peak hour service.) AM and PM headways based on peak hour service.(*) Weekday AM and PM headways based on peak hour service; Weekend AM and PM headways based on 6AM-10AM and 3PM-7PM.The table below shows the headways for three selected peak time periods of limited duration during the day.It does not necessarily reflect all changes in the schedules, many of which take place during time periods not shown in the (*) AM and PM headways based on peak hour service.) AM and PM headways based on peak hour service.The table below shows the headways for three selected peak time periods of limited duration during the day.It does not necessarily reflect all changes in the schedules, many of which take place during time periods not shown in the (*) Weekday AM and PM headways based on peak hour service; Weekend AM and PM headways based on 6AM-10AM and 3PM-7PM.The table below shows the headways for three selected peak time periods of limited duration during the day.It does not necessarily reflect all changes in the schedules, many of which take place during time periods not shown in the (*) AM and PM headways based on peak hour service.) AM and PM headways based on peak hour service.(*) Weekday AM and PM headways based on peak hour service; Weekend AM and PM headways based on 6AM-10AM and 3PM-7PM.The table below shows the headways for three selected peak time periods of limited duration during the day.It does not necessarily reflect all changes in the schedules, many of which take place during time periods not shown in the (*) AM and PM headways based on peak hour service.) AM and PM headways based on peak hour service.(*) Weekday AM and PM headways based on peak hour service; Weekend AM and PM headways based on 6AM-10AM and 3PM-7PM.The table below shows the headways for three selected peak time periods of limited duration during the day.It does not necessarily reflect all changes in the schedules, many of which take place during time periods not shown in the (*) AM and PM headways based on peak hour service.) AM and PM headways based on peak hour service.The table below shows the headways for three selected peak time periods of limited duration during the day.It does not necessarily reflect all changes in the schedules, many of which take place during time periods not shown in the The table below shows the headways for three selected peak time periods of limited duration during the day.It does not necessarily reflect all changes in the schedules, many of which take place during time periods not shown in the The table below shows the headways for three selected peak time periods of limited duration during the day.It does not necessarily reflect all changes in the schedules, many of which take place during time periods not shown in the The table below shows the headways for three selected peak time periods of limited duration during the day.It does not necessarily reflect all changes in the schedules, many of which take place during time periods not shown in the The table below shows the headways for three selected peak time periods of limited duration during the day.It does not necessarily reflect all changes in the schedules, many of which take place during time periods not shown in the The table below shows the headways for three selected peak time periods of limited duration during the day.It does not necessarily reflect all changes in the schedules, many of which take place during time periods not shown in the (*) Weekday AM and PM headways based on peak hour service; Weekend AM and PM headways based on 6AM-10AM and 3PM-7PM.The table below shows the headways for three selected peak time periods of limited duration during the day.It does not necessarily reflect all changes in the schedules, many of which take place during time periods not shown in the (*) AM and PM headways based on peak hour service.) AM and PM headways based on peak hour service.(*) Weekday AM and PM headways based on peak hour service; Weekend AM and PM headways based on 6AM-10AM and 3PM-7PM.The table below shows the headways for three selected peak time periods of limited duration during the day.It does not necessarily reflect all changes in the schedules, many of which take place during time periods not shown in the ( The table below shows the headways for three selected peak time periods of limited duration during the day.It does not necessarily reflect all changes in the schedules, many of which take place during time periods not shown in the The table below shows the headways for three selected peak time periods of limited duration during the day.It does not necessarily reflect all changes in the schedules, many of which take place during time periods not shown in the The table below shows the headways for three selected peak time periods of limited duration during the day.It does not necessarily reflect all changes in the schedules, many of which take place during time periods not shown in the The table below shows the headways for three selected peak time periods of limited duration during the day.It does not necessarily reflect all changes in the schedules, many of which take place during time periods not shown in the The table below shows the headways for three selected peak time periods of limited duration during the day.It does not necessarily reflect all changes in the schedules, many of which take place during time periods not shown in the The table below shows the headways for three selected peak time periods of limited duration during the day.It does not necessarily reflect all changes in the schedules, many of which take place during time periods not shown in the The table below shows the headways for three selected peak time periods of limited duration during the day.It does not necessarily reflect all changes in the schedules, many of which take place during time periods not shown in the The table below shows the headways for three selected peak time periods of limited duration during the day.It does not necessarily reflect all changes in the schedules, many of which take place during time periods not shown in the The table below shows the headways for three selected peak time periods of limited duration during the day.It does not necessarily reflect all changes in the schedules, many of which take place during time periods not shown in the The table below shows the headways and percent of guideline capacity at the maximum load point for four selected one hour time periods during the service day. It does not necessarily reflect all The tables below show the headways and percent of guideline capacity at the maximum load point for four selected one hour time periods during the service day. It does not necessarily reflect all
Master Page # 217 of 242 - N
ew Y
ork City Transit and B
us Com
mittee M
eeting 7/23/2018________________________________________________________________________________
Service Changes: Q22 Service Revisions on the Rockaway Peninsula in Queens Darryl C. Irick, President, MTA Bus Company
Service Issue The Q22 is the Rockaway peninsula’s main local bus route, providing daily service, except overnight hours, over most of the length of the peninsula between Roxbury and Far Rockaway. The Q22 has been experiencing service and reliability issues resulting in on-going customer and community complaints. Recommendation To improve Q22 service, and respond to customer and community complaints about service, it is recommended to implement schedule adjustments (focusing service on the portion of the route where ridership is highest and enhancing off-peak frequencies), and rationalize bus stops. These changes would provide additional service, and faster, more reliable service. These changes incorporate elements of the Fast Forward plan, and rebalances service where ridership levels are strongest. Budget Impact The net result of the recommended revision would be an increase in operating cost of approximately $569,175 a year due to the added service. This cost will be included in the November Plan Update. Proposed Implementation Date
September 2018.
Master Page # 218 of 242 - New York City Transit and Bus Committee Meeting 7/23/2018________________________________________________________________________________
Staff Summary Subject Q22 Service Revisions on the Rockaway
Peninsula in Queens
Department Operations Planning
Department Head Name Mark A. Holmes
Department Head Signature P<I L/- n 1hlhfe'.s.-Project Manager Name Robert Lai
Board Action
Order To Date Approval Info Other
1 President x
2 NYCT/MTA x Bus Comm
PURPOSE:
Page 1of4
Date July 10, 2018
Vendor Name N/A
Contract Number N/A
Contract Manager Name N/A
Table of Contents Ref# N/A
Internal Approvals
Order Approval
4 President
3 Executive Vice President
2 Acting VP, Govt. and Community Relations
Chief Officer, Operations Planning
The purpose of this staff summary is to gain presidential approval for, and to inform the NYCT /MT A Bus Committee of, a recommendation to revise Q22 local bus service.
DISCUSSION:
The Q22 is the Rockaway peninsula's main local bus route, which provides daily service, except overnight hours, over most of the length of the peninsula between Roxbury and Far Rockaway, a one-way distance of approximately 8.5 miles. The Q22 transports an average of approximately 6,600 passengers per weekday, approximately 4,250 passengers per Saturday, and approximately 3,650 passengers respectively.
As the only bus route that operates over most of the length of the relatively narrow Rockaway peninsula (generally 0.3-0.8 miles in width for most of the peninsula), the Q22 is the primary mode of transit travel within the peninsula. The 0 and 8 (Rockaway Park Shuttle) trains also serve the Rockaway peninsula, but the train service patterns are ill-suited to intra-peninsula travel. There isn't a regular train route that travels directly between the east and west sides of the peninsula. Train passengers must divert 1.25 miles north (3.5 miles round-trip north and south) and transfer between trains at Broad Channel, adding an extra 15-20 minutes. Train service on the peninsula is also relatively infrequent, running generally every 15 minutes during the weekday peak periods (every 6-10 minutes during short periods in the peak of the peaks), and every 20 minutes during the weekday and weekend off peak periods (every 15 minutes during the day on Saturdays).
The legal name ofMTA Bus is MTA Bus Company.
Master Page # 219 of 242 - New York City Transit and Bus Committee Meeting 7/23/2018________________________________________________________________________________
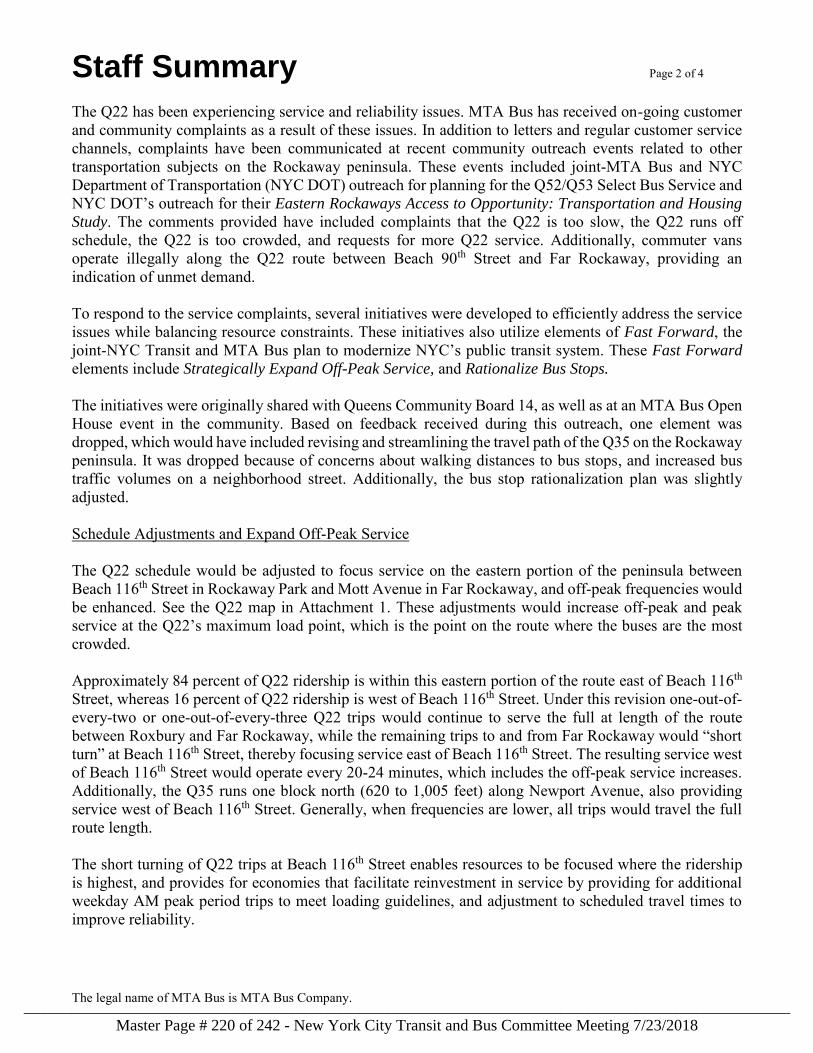
Staff Summary Page 2 of 4
The legal name of MTA Bus is MTA Bus Company.
The Q22 has been experiencing service and reliability issues. MTA Bus has received on-going customer and community complaints as a result of these issues. In addition to letters and regular customer service channels, complaints have been communicated at recent community outreach events related to other transportation subjects on the Rockaway peninsula. These events included joint-MTA Bus and NYC Department of Transportation (NYC DOT) outreach for planning for the Q52/Q53 Select Bus Service and NYC DOT’s outreach for their Eastern Rockaways Access to Opportunity: Transportation and Housing
Study. The comments provided have included complaints that the Q22 is too slow, the Q22 runs off schedule, the Q22 is too crowded, and requests for more Q22 service. Additionally, commuter vans operate illegally along the Q22 route between Beach 90th Street and Far Rockaway, providing an indication of unmet demand. To respond to the service complaints, several initiatives were developed to efficiently address the service issues while balancing resource constraints. These initiatives also utilize elements of Fast Forward, the joint-NYC Transit and MTA Bus plan to modernize NYC’s public transit system. These Fast Forward
elements include Strategically Expand Off-Peak Service, and Rationalize Bus Stops. The initiatives were originally shared with Queens Community Board 14, as well as at an MTA Bus Open House event in the community. Based on feedback received during this outreach, one element was dropped, which would have included revising and streamlining the travel path of the Q35 on the Rockaway peninsula. It was dropped because of concerns about walking distances to bus stops, and increased bus traffic volumes on a neighborhood street. Additionally, the bus stop rationalization plan was slightly adjusted. Schedule Adjustments and Expand Off-Peak Service The Q22 schedule would be adjusted to focus service on the eastern portion of the peninsula between Beach 116th Street in Rockaway Park and Mott Avenue in Far Rockaway, and off-peak frequencies would be enhanced. See the Q22 map in Attachment 1. These adjustments would increase off-peak and peak service at the Q22’s maximum load point, which is the point on the route where the buses are the most crowded. Approximately 84 percent of Q22 ridership is within this eastern portion of the route east of Beach 116th Street, whereas 16 percent of Q22 ridership is west of Beach 116th Street. Under this revision one-out-of-every-two or one-out-of-every-three Q22 trips would continue to serve the full at length of the route between Roxbury and Far Rockaway, while the remaining trips to and from Far Rockaway would “short turn” at Beach 116th Street, thereby focusing service east of Beach 116th Street. The resulting service west of Beach 116th Street would operate every 20-24 minutes, which includes the off-peak service increases. Additionally, the Q35 runs one block north (620 to 1,005 feet) along Newport Avenue, also providing service west of Beach 116th Street. Generally, when frequencies are lower, all trips would travel the full route length. The short turning of Q22 trips at Beach 116th Street enables resources to be focused where the ridership is highest, and provides for economies that facilitate reinvestment in service by providing for additional weekday AM peak period trips to meet loading guidelines, and adjustment to scheduled travel times to improve reliability.
Master Page # 220 of 242 - New York City Transit and Bus Committee Meeting 7/23/2018________________________________________________________________________________
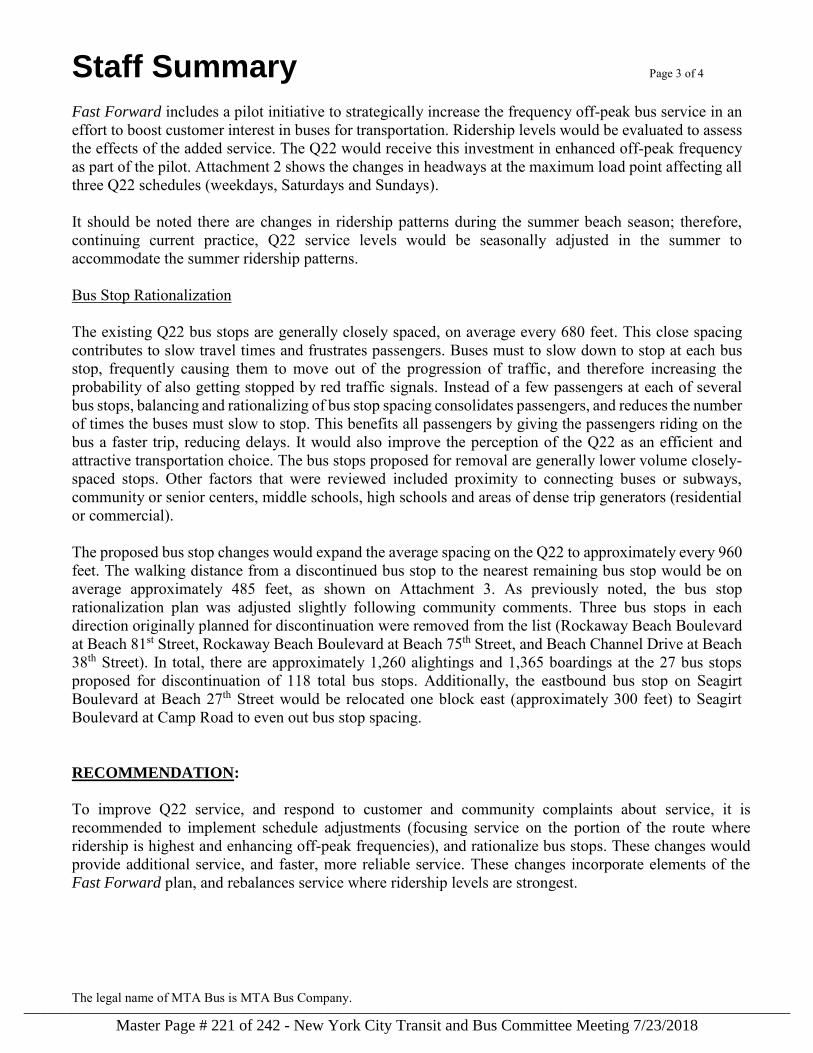
Staff Summary Page 3 of 4
The legal name of MTA Bus is MTA Bus Company.
Fast Forward includes a pilot initiative to strategically increase the frequency off-peak bus service in an effort to boost customer interest in buses for transportation. Ridership levels would be evaluated to assess the effects of the added service. The Q22 would receive this investment in enhanced off-peak frequency as part of the pilot. Attachment 2 shows the changes in headways at the maximum load point affecting all three Q22 schedules (weekdays, Saturdays and Sundays). It should be noted there are changes in ridership patterns during the summer beach season; therefore, continuing current practice, Q22 service levels would be seasonally adjusted in the summer to accommodate the summer ridership patterns. Bus Stop Rationalization The existing Q22 bus stops are generally closely spaced, on average every 680 feet. This close spacing contributes to slow travel times and frustrates passengers. Buses must to slow down to stop at each bus stop, frequently causing them to move out of the progression of traffic, and therefore increasing the probability of also getting stopped by red traffic signals. Instead of a few passengers at each of several bus stops, balancing and rationalizing of bus stop spacing consolidates passengers, and reduces the number of times the buses must slow to stop. This benefits all passengers by giving the passengers riding on the bus a faster trip, reducing delays. It would also improve the perception of the Q22 as an efficient and attractive transportation choice. The bus stops proposed for removal are generally lower volume closely-spaced stops. Other factors that were reviewed included proximity to connecting buses or subways, community or senior centers, middle schools, high schools and areas of dense trip generators (residential or commercial). The proposed bus stop changes would expand the average spacing on the Q22 to approximately every 960 feet. The walking distance from a discontinued bus stop to the nearest remaining bus stop would be on average approximately 485 feet, as shown on Attachment 3. As previously noted, the bus stop rationalization plan was adjusted slightly following community comments. Three bus stops in each direction originally planned for discontinuation were removed from the list (Rockaway Beach Boulevard at Beach 81st Street, Rockaway Beach Boulevard at Beach 75th Street, and Beach Channel Drive at Beach 38th Street). In total, there are approximately 1,260 alightings and 1,365 boardings at the 27 bus stops proposed for discontinuation of 118 total bus stops. Additionally, the eastbound bus stop on Seagirt Boulevard at Beach 27th Street would be relocated one block east (approximately 300 feet) to Seagirt Boulevard at Camp Road to even out bus stop spacing. RECOMMENDATION:
To improve Q22 service, and respond to customer and community complaints about service, it is recommended to implement schedule adjustments (focusing service on the portion of the route where ridership is highest and enhancing off-peak frequencies), and rationalize bus stops. These changes would provide additional service, and faster, more reliable service. These changes incorporate elements of the Fast Forward plan, and rebalances service where ridership levels are strongest.
Master Page # 221 of 242 - New York City Transit and Bus Committee Meeting 7/23/2018________________________________________________________________________________
Staff Summary Page 4 of 4
ALTERNATIVES TO THE PROPOSED SERVICE CHANGE:
One alternative would be to leave the current Q22 service unchanged. This would forgo the opportunity to address service issues and complaints.
A second alternative would be to implement some elements of the plan but not others. The short turns help to minimize the additional cost of the added service and scheduled travel time adjusments, and help to keep the resource requirements within the available limits. The bus stop balancing improves service quality for the majority of customers.
A third alternative would be to concurrently streamline and revise the travel path of the Q35 one to two blocks south (approximatley 620 to 1,005 feet) from Newport Avenue to Rockaway Beach Boulevard between Beach 116th Street and Beach 14 7th Street to provide customers traveling between Beach 169th Street and Beach 116th Street (transfer to the subway) with greater alternatives to take the first bus that comes. However, this alternative received strong opposition from the community about the additional walking distances, and traffic issues on Beach 116th Street.
BUDGET IMPACT:
The net result of the recommended revision would be an increase in operating cost of approximately $569,175 a year due to the added service. This cost will be included in the November Plan Update.
PROPOSED IMPLEMENTATION DATE:
September 2018
Approved: _ ({}, __ Jf-+-~-_____,,~,__· -~---------~ VUarryl C. Irick President
The legal name ofMTA Bus is MTA Bus Company.
Master Page # 222 of 242 - New York City Transit and Bus Committee Meeting 7/23/2018________________________________________________________________________________
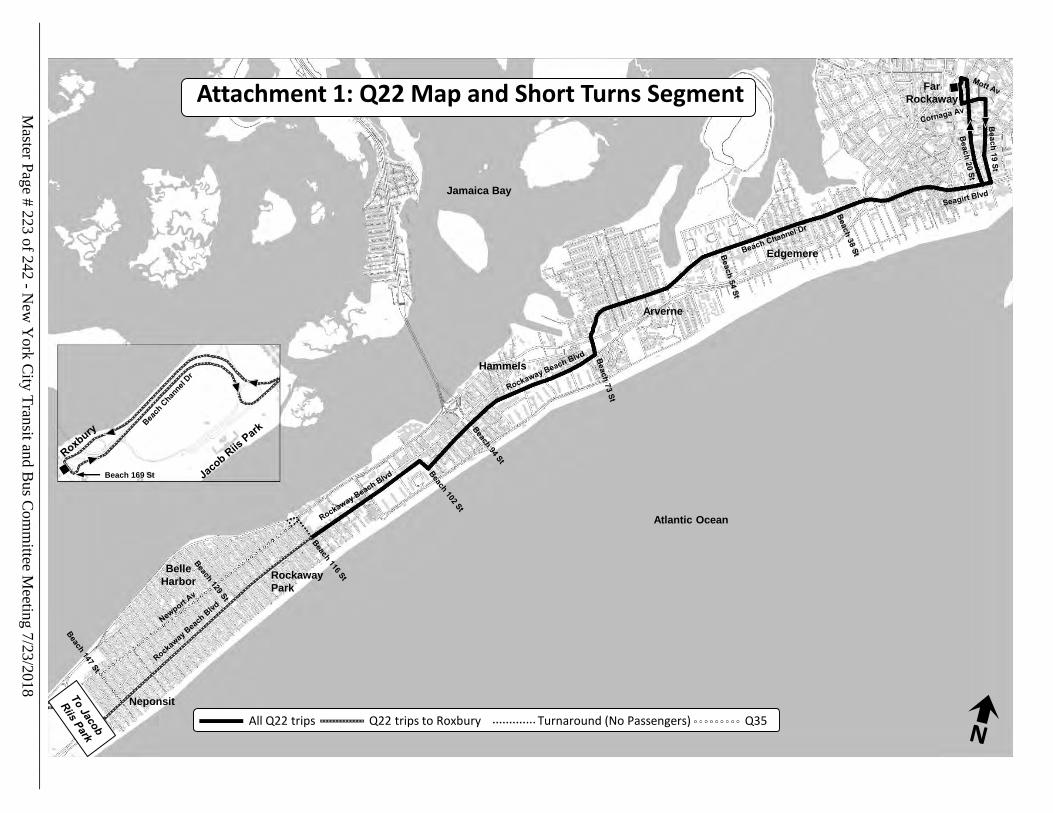
Attachment 1: Q22 Map and Short Turns Segment
All Q22 trips Q22 trips to Roxbury Turnaround (No Passengers) Q35
Far
Rockaway
Edgemere
Arverne
Rockaway
Park
Hammels
Belle
Harbor
Neponsit
Atlantic Ocean
Jamaica Bay
Beach 169 St
Master Page # 223 of 242 - N
ew Y
ork City Transit and B
us Com
mittee M
eeting 7/23/2018________________________________________________________________________________
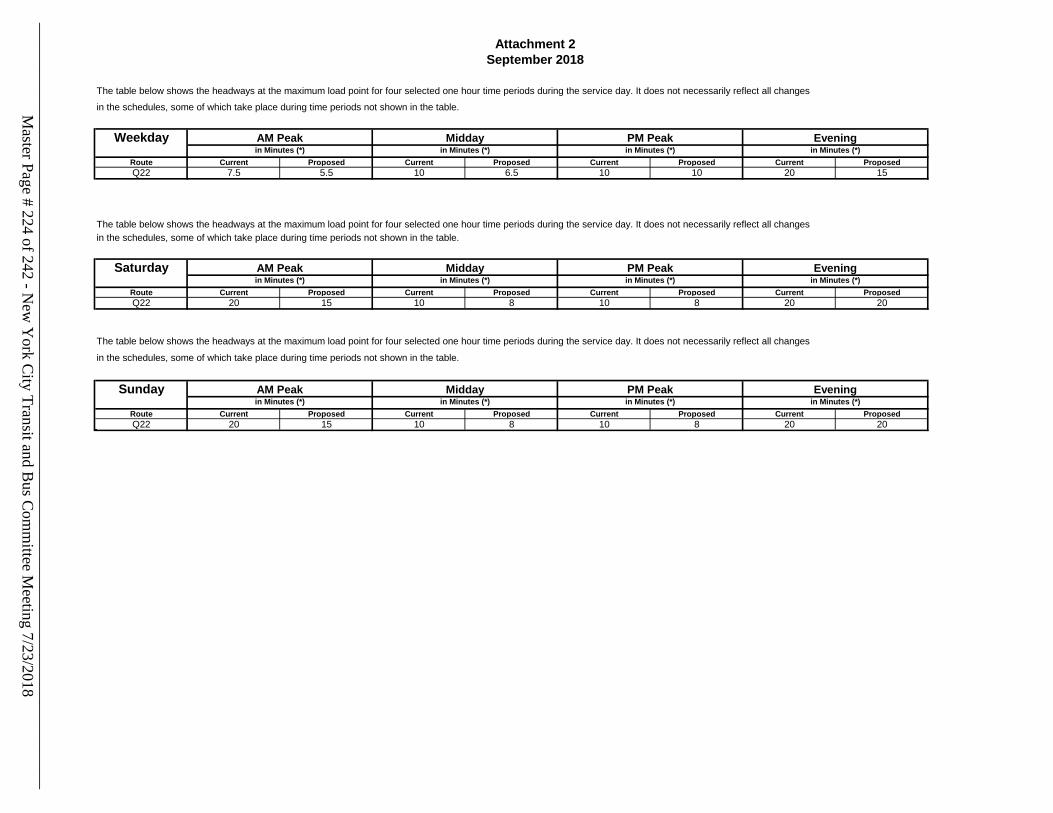
The table below shows the headways at the maximum load point for four selected one hour time periods during the service day. It does not necessarily reflect all changes
in the schedules, some of which take place during time periods not shown in the table.
Weekday
Route Current Proposed Current Proposed Current Proposed Current Proposed
Q22 7.5 5.5 10 6.5 10 10 20 15
The table below shows the headways at the maximum load point for four selected one hour time periods during the service day. It does not necessarily reflect all changes
in the schedules, some of which take place during time periods not shown in the table.
Saturday
Route Current Proposed Current Proposed Current Proposed Current Proposed
Q22 20 15 10 8 10 8 20 20
The table below shows the headways at the maximum load point for four selected one hour time periods during the service day. It does not necessarily reflect all changes
in the schedules, some of which take place during time periods not shown in the table.
Sunday
Route Current Proposed Current Proposed Current Proposed Current Proposed
Q22 20 15 10 8 10 8 20 20
Scheduled Headway
in Minutes (*)
Scheduled Headway
in Minutes (*)
Scheduled Headway
in Minutes (*)
Scheduled Headway
in Minutes (*)
Scheduled Headway
in Minutes (*)
Scheduled Headway
in Minutes (*)
Scheduled Headway
in Minutes (*)
Scheduled Headway
in Minutes (*)
AM Peak Midday PM Peak Evening
Scheduled Headway
in Minutes (*)
Scheduled Headway
in Minutes (*)
Scheduled Headway
in Minutes (*)
Scheduled Headway
in Minutes (*)
AM Peak Midday PM Peak Evening
Attachment 2
September 2018
AM Peak Midday PM Peak Evening
((((((
Master Page # 224 of 242 - N
ew Y
ork City Transit and B
us Com
mittee M
eeting 7/23/2018________________________________________________________________________________
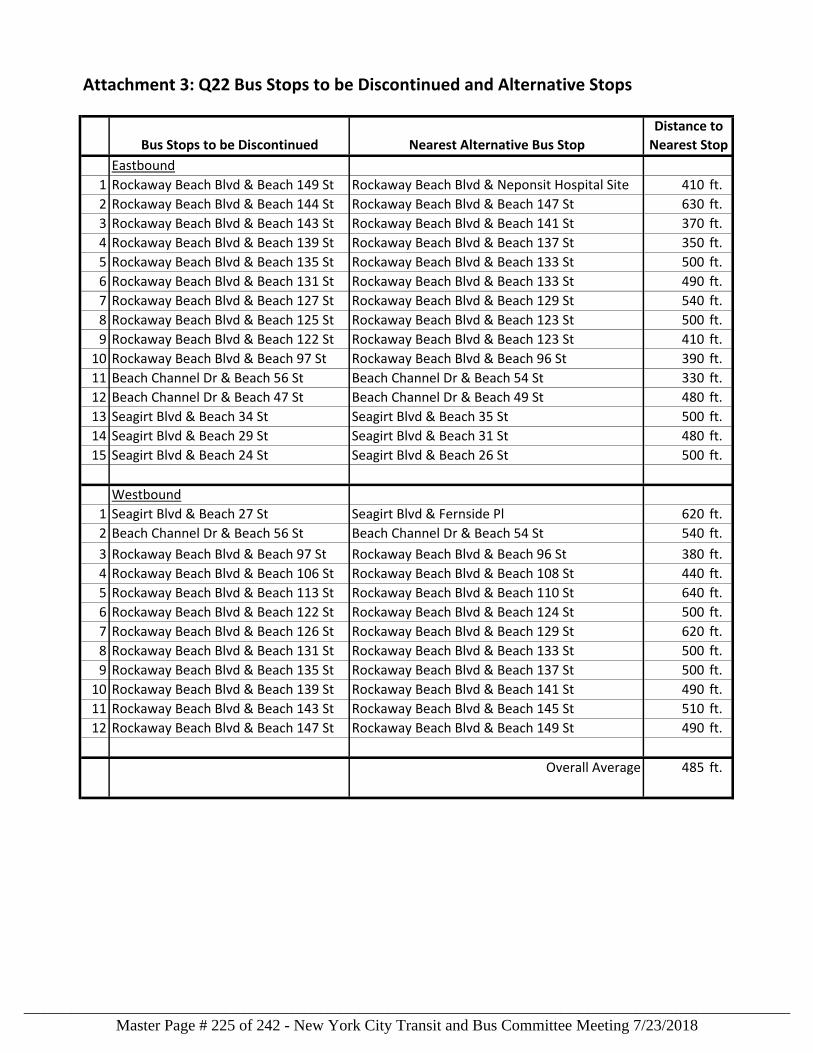
Attachment 3: Q22 Bus Stops to be Discontinued and Alternative Stops
Distance to
Bus Stops to be Discontinued Nearest Alternative Bus Stop Nearest Stop
Eastbound
1 Rockaway Beach Blvd & Beach 149 St Rockaway Beach Blvd & Neponsit Hospital Site 410 ft.
2 Rockaway Beach Blvd & Beach 144 St Rockaway Beach Blvd & Beach 147 St 630 ft.
3 Rockaway Beach Blvd & Beach 143 St Rockaway Beach Blvd & Beach 141 St 370 ft.
4 Rockaway Beach Blvd & Beach 139 St Rockaway Beach Blvd & Beach 137 St 350 ft.
5 Rockaway Beach Blvd & Beach 135 St Rockaway Beach Blvd & Beach 133 St 500 ft.
6 Rockaway Beach Blvd & Beach 131 St Rockaway Beach Blvd & Beach 133 St 490 ft.
7 Rockaway Beach Blvd & Beach 127 St Rockaway Beach Blvd & Beach 129 St 540 ft.
8 Rockaway Beach Blvd & Beach 125 St Rockaway Beach Blvd & Beach 123 St 500 ft.
9 Rockaway Beach Blvd & Beach 122 St Rockaway Beach Blvd & Beach 123 St 410 ft.
10 Rockaway Beach Blvd & Beach 97 St Rockaway Beach Blvd & Beach 96 St 390 ft.
11 Beach Channel Dr & Beach 56 St Beach Channel Dr & Beach 54 St 330 ft.
12 Beach Channel Dr & Beach 47 St Beach Channel Dr & Beach 49 St 480 ft.
13 Seagirt Blvd & Beach 34 St Seagirt Blvd & Beach 35 St 500 ft.
14 Seagirt Blvd & Beach 29 St Seagirt Blvd & Beach 31 St 480 ft.
15 Seagirt Blvd & Beach 24 St Seagirt Blvd & Beach 26 St 500 ft.
Westbound
1 Seagirt Blvd & Beach 27 St Seagirt Blvd & Fernside Pl 620 ft.
2 Beach Channel Dr & Beach 56 St Beach Channel Dr & Beach 54 St 540 ft.
3 Rockaway Beach Blvd & Beach 97 St Rockaway Beach Blvd & Beach 96 St 380 ft.
4 Rockaway Beach Blvd & Beach 106 St Rockaway Beach Blvd & Beach 108 St 440 ft.
5 Rockaway Beach Blvd & Beach 113 St Rockaway Beach Blvd & Beach 110 St 640 ft.
6 Rockaway Beach Blvd & Beach 122 St Rockaway Beach Blvd & Beach 124 St 500 ft.
7 Rockaway Beach Blvd & Beach 126 St Rockaway Beach Blvd & Beach 129 St 620 ft.
8 Rockaway Beach Blvd & Beach 131 St Rockaway Beach Blvd & Beach 133 St 500 ft.
9 Rockaway Beach Blvd & Beach 135 St Rockaway Beach Blvd & Beach 137 St 500 ft.
10 Rockaway Beach Blvd & Beach 139 St Rockaway Beach Blvd & Beach 141 St 490 ft.
11 Rockaway Beach Blvd & Beach 143 St Rockaway Beach Blvd & Beach 145 St 510 ft.
12 Rockaway Beach Blvd & Beach 147 St Rockaway Beach Blvd & Beach 149 St 490 ft.
Overall Average 485 ft.
Master Page # 225 of 242 - New York City Transit and Bus Committee Meeting 7/23/2018________________________________________________________________________________
Service Changes: Q37 and QM18 Service Revisions in South Ozone Park, Queens Darryl C. Irick, President, MTA Bus Company
Service Issue There are issues with traffic congestion at the southern terminuses of the Q37 and QM18, particularly near Public School/Middle School 124 (P.S./M.S. 124) during the rush periods. 130th Street is consistently blocked with school traffic, parents dropping off students, and sanitation vehicles. These delays result in reliability issues on the remainder of the Q37 and QM18. Recommendation Because of traffic congestion on 130th Street near P.S./M.S. 124 and the New York City Department of Sanitation facility at the Q37 and QM18 southern terminuses, it is recommended to revise the Q37 turnaround path and terminus to 135th Road. The Q10 provides alternative service for passengers south of the Belt Parkway. It is also recommended to revise the travel path and terminus of the QM18, which operates along a similar path as the Q37 in South Ozone Park, to terminate on 130th Street at 135th Avenue to avoid the same traffic congestion near P.S./M.S. 124. Budget Impact The net result of the recommended revision would be a small savings of approximately $42,000 per year due to the slight reduction in travel distance. Proposed Implementation Date
September 2018.
Master Page # 226 of 242 - New York City Transit and Bus Committee Meeting 7/23/2018________________________________________________________________________________
Staff Summary Page I of3
Subject Q37 and QM18 Service Revisions in South Date July 10, 2018 Ozone Park, Queens
Department Operations Planning Vendor Name NIA
Department Head Name Mark A. Holmes Contract Number NIA
Department Head Signature ~d ;:;, ' l l 1 r f'1 #fl.l..e>-
Contract Manager Name NIA
Project Manager Name Warren Berry Table of Contents Ref# NIA
Board Action Internal Approvals
Order To Date Approval Info Other Order Approval Date
1 President x 4 President
2 NYCT/MTA x 3 Executive Vice Bus Comm President
2 Acting VP, Govt. and Community Relations
Chief Officer, 7/1z/1g Operations Planning
PURPOSE:
The purpose of this staff summary is to gain presidential approval for, and to inform the NYCT/MTA Bus Committee of, a recommendation to revise the travel path and terminuses of Q3 7 local bus route and QM18 express bus route in South Ozone Park, Queens.
DISCUSSION:
The Q37 provides local bus service on weekdays, Saturdays, and Sundays, all times except overnight hours, between Kew Gardens and South Ozone Park via the intermediate neighborhoods of Richmond Hill and Ozone Park. The Q37 travels a one-way distance of approximately 4.8 miles, transporting approximately 7,600 passengers per weekday, approximately 4,000 passengers per Saturday, and approximately 2,800 passengers per Sunday. It connects with several subway lines and Resorts World Casino New York City.
The QMl 8 provides weekday peak period, peak direction, premium fare express bus service between South Ozone Park, Queens and Midtown, Manhattan via the intermediate neighborhoods of Richmond Hill, Kew Gardens, Forest Hills and Rego Park. The QMl 8 travels a one-way distance of approximately 14.5 miles, transporting approximately 250 passengers per weekday.
The Q37 has been experiencing service and reliability issues due to traffic congestion surrounding Public School/Middle School 124 (P.S./M.S. 124) and the NYC Department of Sanitation facility on 150th A venue near its southern terminus. During the weekday AM peak periods, vehicles dropping off students
The legal name ofMTA Bus is MTA Bus Company.
Master Page # 227 of 242 - New York City Transit and Bus Committee Meeting 7/23/2018________________________________________________________________________________
Staff Summary Page 2 of 3
The legal name of MTA Bus is MTA Bus Company.
at P.S./M.S. 124 are double parked all over the area. Additionally, sanitation vehicles are often parked in the street on 150th Avenue and 130th Street. The delays in this small portion of the route south of the Belt Parkway, which is used by approximately 300 passengers per weekday, or approximately 4 percent of the route’s ridership, impacts Q37 service reliability on the entire route. The 130th Street branch of the Q10 also travels through this area via 130th Street, 150th Avenue and 134th Street to and from nearby JFK Airport. The Q10 also travels to Kew Gardens at the northern end of the route, which is proximate to the Q37’s northern terminus. The Q10 and Q37 travel on parallel streets roughly 2,000 feet apart (Q10 via Lefferts Boulevard and the Q37 via 111th Street). It is recommended to revise the travel path and southern terminus of the Q37 to 135th Road between 130th Place and 131st Street, reducing travel distance by approximately 0.35 miles each way. The southbound Q37 would continue east on 135th Avenue and turn south on 130th Place to 135th Road to its terminus (last stop/layover/first stop). The northbound Q37 would turn north on 131st Street and west on 135th Avenue and resume its regular route. See Map 1. The scheduled travel time would remain unchanged, as any small time savings would be used to help improve reliability. This revision returns the Q37 terminus to the location it used prior to 2011, but was changed because of a safety issue, which has since been resolved. Additionally, traffic congestion south of the Belt Parkway has increased, where in 2011 traffic congestion was less of a concern. As seen in Map 1, a total of five Q37 bus stops will be discontinued due to this travel path revision. The three bus stops most impacted south of the Belt Parkway are used by approximately 300 passengers per weekday, and a lesser number on weekends. The distances between the three bus stops south of the Belt Parkway to the Q37 would be approximately 1,400 to 2,300 feet. However, the Q10 provides alternative service to customers at all of these stops. The Q10 provides transfers to the same subway and bus routes as the Q37, including the EF at Kew Gardens-Union Turnpike, the J at Jamaica Avenue, and the A at Ozone Park/Lefferts Boulevard. Passengers may also transfer between the Q10 and Q37, if they choose not to walk. QM18 The QM18 operates on a similar travel path in South Ozone Park as the Q37, and is also affected by the traffic congestion south of the Belt Parkway, where it serves one bus stop in each direction used by a total of approximately 6 passengers per day. To avoid the congestion around P.S./M.S. 124 and the Sanitation facility, revise the first and last stops of the QM18 to 130th Street at 135th Avenue, the current second stop and next-to-last stop, respectively. See Map 2. These passengers may walk approximately 800-1,300 feet or take the Q10 bus and transfer (the transfer is available at no additional charge over an express bus fare when using a MetroCard) as alternatives. There would be a very small decrease in travel distance of 0.1 miles. The scheduled travel time would remain unchanged, as any small time savings would be used to help improve reliability. The Q37 and QM18 revisions are consistent with elements of the Fast Forward plan to modernize transit in New York City. These changes would avoid delays, and improve reliability for the vast majority of Q37 and QM18 passengers along the route by avoiding a small traffic problem area.
Master Page # 228 of 242 - New York City Transit and Bus Committee Meeting 7/23/2018________________________________________________________________________________
Staff Summary Page 3 of3
RECOMMENDATION:
Because of traffic congestion on 1301h Street near P.S./M.S. 124 and the New York City Department of Sanitation facility at the Q37 and QM18 southern terminuses, it is recommended to revise the Q37 turnaround path and terminus to 135th Road. The QlO provides alternative service for passengers south of the Belt Parkway.
It is also recommended to revise the travel path and terminus of the QMl 8, which operates along a similar path as the Q37 in South Ozone Park, to terminate on 1301h Street at 135th Avenue to avoid the same traffic congestion near P.S./M.S. 124.
ALTERNATIVES TO THE PROPOSED SERVICE CHANGE:
The only alternative for the Q37 in South Ozone Park would be to leave the travel path unchanged. This would forgo the opportunity to properly address traffic issues and delays at on 1301h Street. Given the geography of the area, there are few other suitable areas to turnaround for the Q3 7.
The only alternative for the QMl 8 in South Ozone Park would be to leave the current travel path and layover unchanged. Given the low ridership at these stops, this would forgo the opportunity to address delays on the QM18 and increase service reliability.
BUDGET IMPACT:
The net result of the recommended revision would be a small savings of approximately $42,000 per year due to the slight reduction in travel distance.
PROPOSED IMPLEMENTATION DATE:
September 2018
The legal name of MT A Bus is MTA Bus Company.
Master Page # 229 of 242 - New York City Transit and Bus Committee Meeting 7/23/2018________________________________________________________________________________
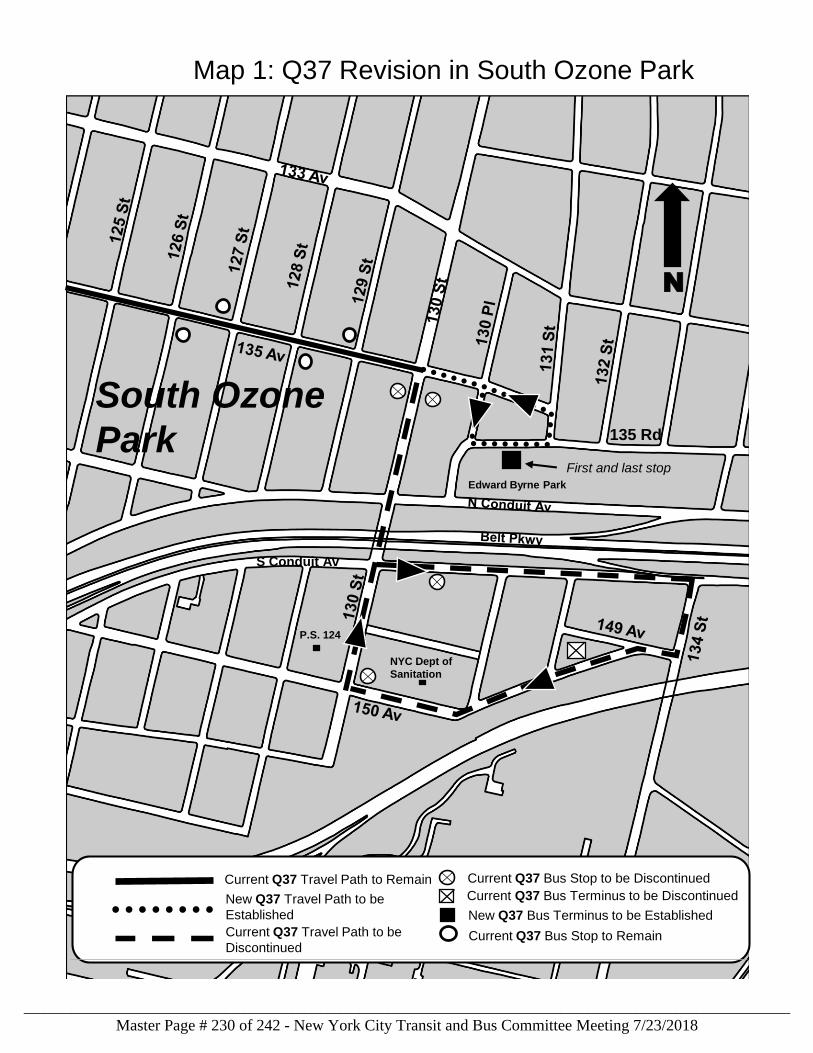
S Conduit Av
South Ozone
Park
Map 1: Q37 Revision in South Ozone Park
New Q37 Travel Path to be
Established
Current Q37 Travel Path to Remain
Current Q37 Travel Path to be
Discontinued
Current Q37 Bus Stop to be Discontinued
N
Edward Byrne Park
Current Q37 Bus Stop to Remain
New Q37 Bus Terminus to be Established
Current Q37 Bus Terminus to be Discontinued
First and last stop
135 Rd
P.S. 124
NYC Dept of
Sanitation
Master Page # 230 of 242 - New York City Transit and Bus Committee Meeting 7/23/2018________________________________________________________________________________
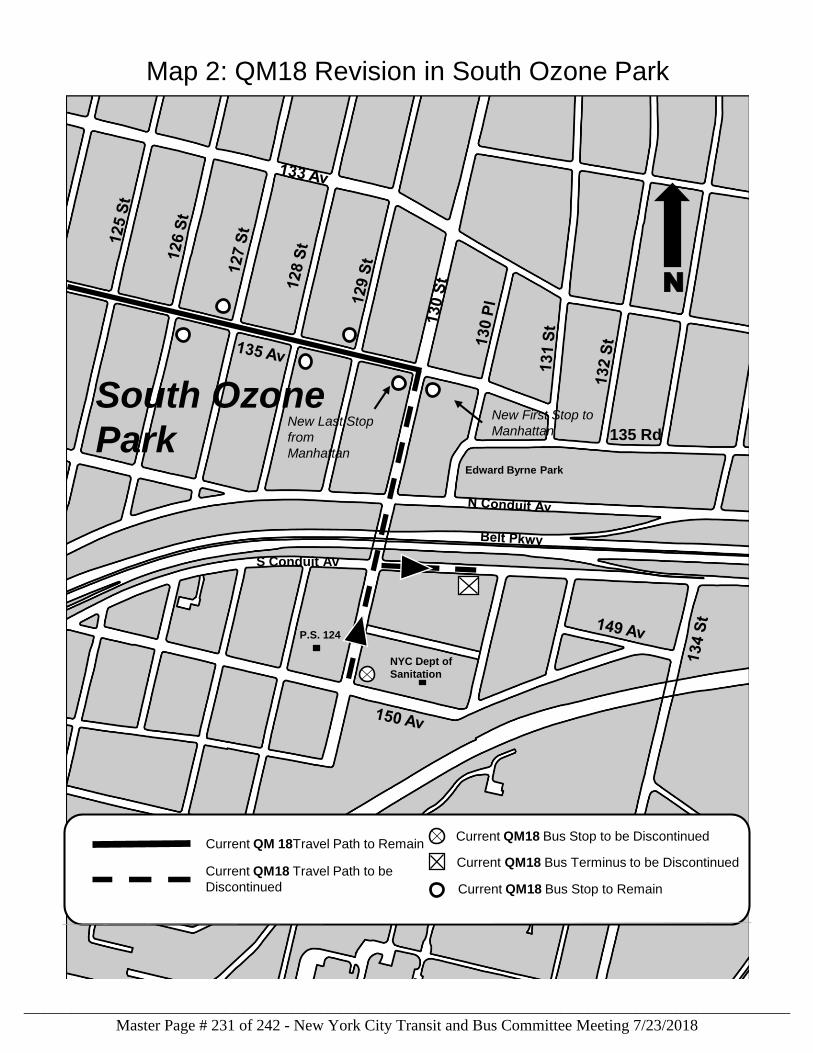
S Conduit Av
Map 2: QM18 Revision in South Ozone Park
N
Edward Byrne Park
Current QM 18Travel Path to Remain
Current QM18 Travel Path to be
Discontinued
Current QM18 Bus Stop to be Discontinued
Current QM18 Bus Stop to Remain
Current QM18 Bus Terminus to be Discontinued
New First Stop to
ManhattanNew Last Stop
from
Manhattan
South Ozone
Park 135 Rd
P.S. 124
NYC Dept of
Sanitation
Master Page # 231 of 242 - New York City Transit and Bus Committee Meeting 7/23/2018________________________________________________________________________________
Service Changes: Bus Schedule Changes, Effective September 2018 Darryl C. Irick, President, MTA Bus Company Service Issue:
To ensure that bus schedules accurately match current rider demand and operating conditions as well as to ensure MTA Bus has resources available where needed, schedules are regularly reviewed, evaluated and revised in order to provide passengers with the most efficient and effective service possible. MTA Bus routinely changes service to reflect changes in demand in compliance with MTA Board-adopted bus loading guidelines. These changes also address the need for running time adjustments to more accurately reflect observed traffic conditions. Traffic speeds, including bus speeds, have slowed in recent years and scheduled bus service must reflect the changing conditions.
Under the MTA Bus schedule review program, all MTA Bus routes are evaluated each year. Bus routes which have shown a change in ridership or running time are selected for review. Where feasible, these routes are modified to reflect changes in operating conditions and ridership demand in compliance with MTA Board adopted loading guidelines. In addition, schedules on routes where destinations have changed or route paths have been significantly modified are reviewed as soon as practicable after the service change to determine if follow up adjustments are required. Recommendation:
One bus schedule change is proposed for implementation in September 2018.
Budget Impact:
The September 2018 schedule changes represent an estimated cost of approximately $50,000 annually. These costs are incorporated in the 2018 Platform Budget.
Proposed Implementation Date:
September 2018
Master Page # 232 of 242 - New York City Transit and Bus Committee Meeting 7/23/2018________________________________________________________________________________
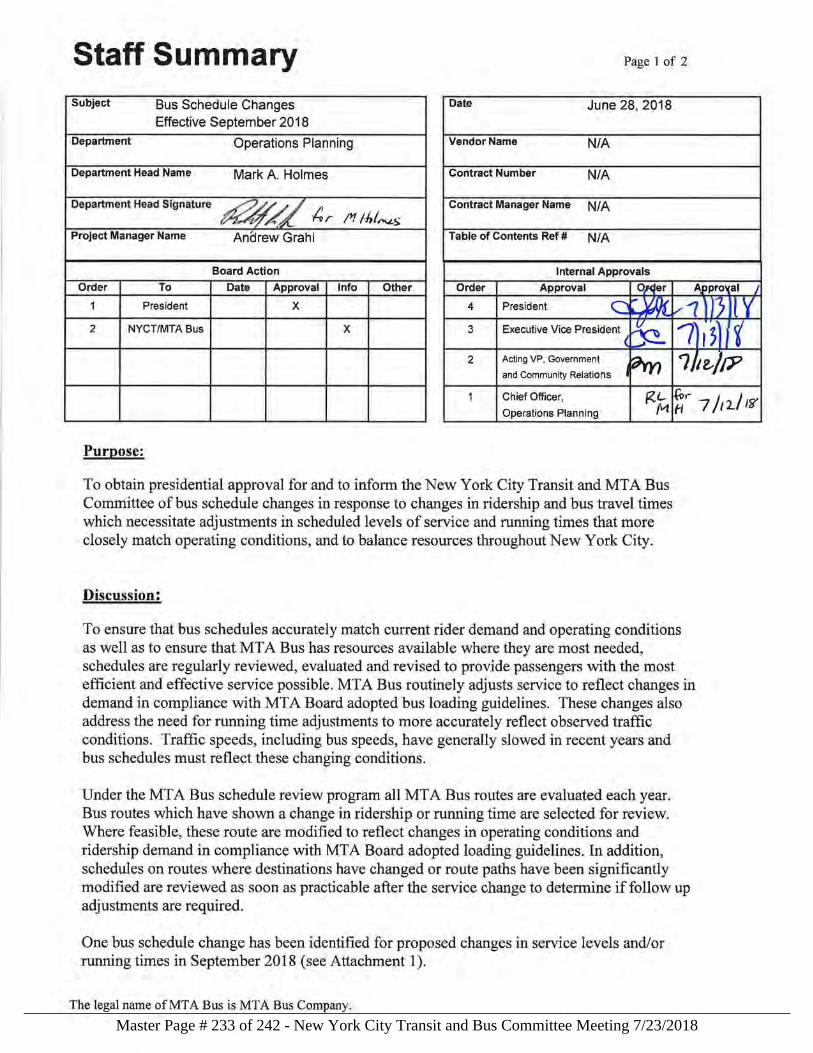
Staff Summary Page 1of2
Subject Bus Schedule Changes Effective September 2018
Department Operations Planning
Department Head Name Mark A. Holmes
Dep;\\rtment Head Signature ~// ,4,r v .,,.. -.,/ ,,, \.,,..... !'1 lhl~s
Project Manager Name Anarew Grahl
Board Action
Order To Date Approval Info Other
1 President x 2 NYCT/MTA Bus x
Purpose:
Date June 28, 2018
Vendor Name N/A
Contract Number N/A
Contract Manager Name N/A
Table of Contents Ref# N/ A
Internal Approvals
Order Approval
4 President
3
2 Acting VP, Government
and Community Relations
Chief Officer,
Operations Planning
fZ.L. ~... . I Mfl 7/12 i8'
To obtain presidential approval for and to inform the New York City Transit and MTA Bus Committee of bus schedule changes in response to changes in ridership and bus travel times which necessitate adjustments in scheduled levels of service and running times that more closely match operating conditions, and to balance resources throughout New York City.
Discussion:
To ensure that bus schedules accurately match current rider demand and operating conditions as well as to ensure that MT A Bus has resources available where they are most needed, schedules are regularly reviewed, evaluated and revised to provide passengers with the most efficient and effective service possible. MTA Bus routinely adjusts service to reflect changes in demand in compliance with MTA Board adopted bus loading guidelines. These changes also address the need for running time adjustments to more accurately reflect observed traffic conditions. Traffic speeds, including bus speeds, have generally slowed in recent years and bus schedules must reflect these changing conditions.
Under the MTA Bus schedule review program all MTA Bus routes are evaluated each year. Bus routes which have shown a change in ridership or running time are selected for review. Where feasible, these route are modified to reflect changes in operating conditions and ridership demand in compliance with MT A Board adopted loading guidelines. In addition, schedules on routes where destinations have changed or route paths have been significantly modified are reviewed as soon as practicable after the service change to determine if follow up adjustments are required.
One bus schedule change has been identified for proposed changes in service levels and/or running times in September 2018 (see Attachment 1).
The legal name of MT A Bus is MTA Bus Company.
Master Page # 233 of 242 - New York City Transit and Bus Committee Meeting 7/23/2018________________________________________________________________________________
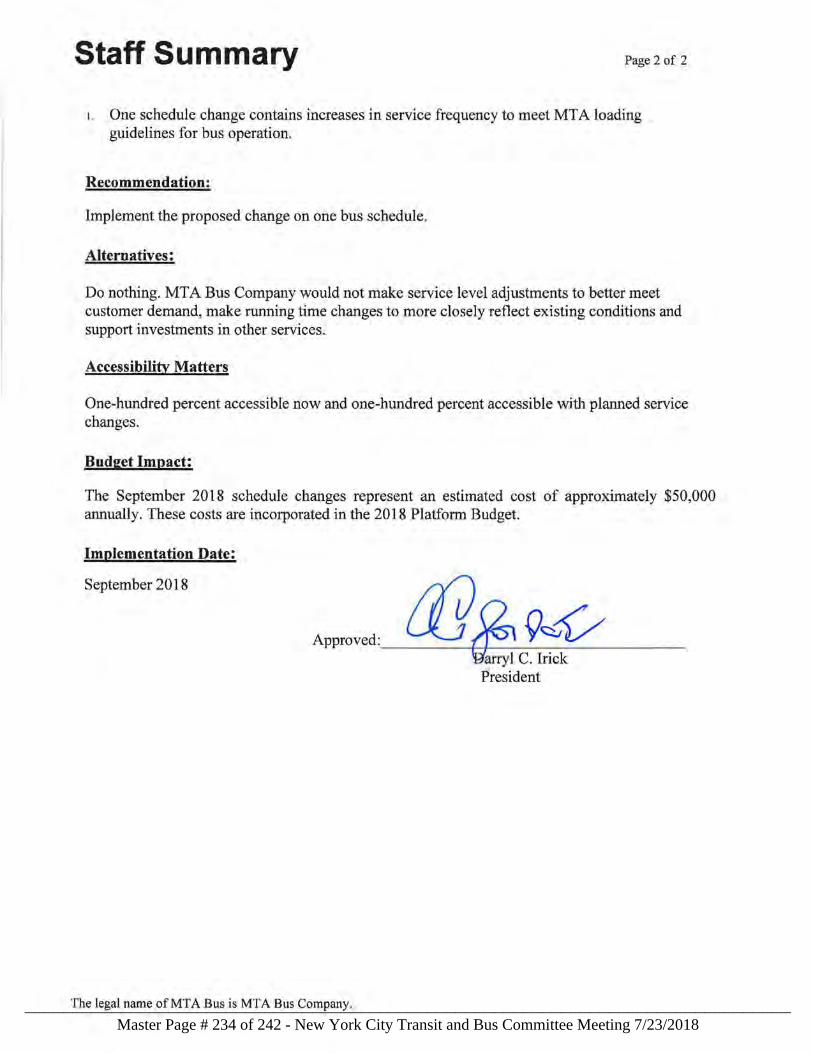
Staff Summary Page 2 of 2
1. One schedule change contains increases in service frequency to meet MT A loading guidelines for bus operation.
Recommendation:
Implement the proposed change on one bus schedule.
Alternatives:
Do nothing. MT A Bus Company would not make service level adjustments to better meet customer demand, make running time changes to more closely reflect existing conditions and support investments in other services.
Accessibility Matters
One-hundred percent accessible now and one-hundred percent accessible with planned service changes.
Budget Impact:
The September 2018 schedule changes represent an estimated cost of approximately $50,000 annually. These costs are incorporated in the 2018 Platform Budget.
Implementation Date:
September 2018
Approved: {f] (2 9~V - --+-+-a:Y:-ryl C.-Irick--
President
The legal name of MT A Bus is MTA Bus Company.
Master Page # 234 of 242 - New York City Transit and Bus Committee Meeting 7/23/2018________________________________________________________________________________
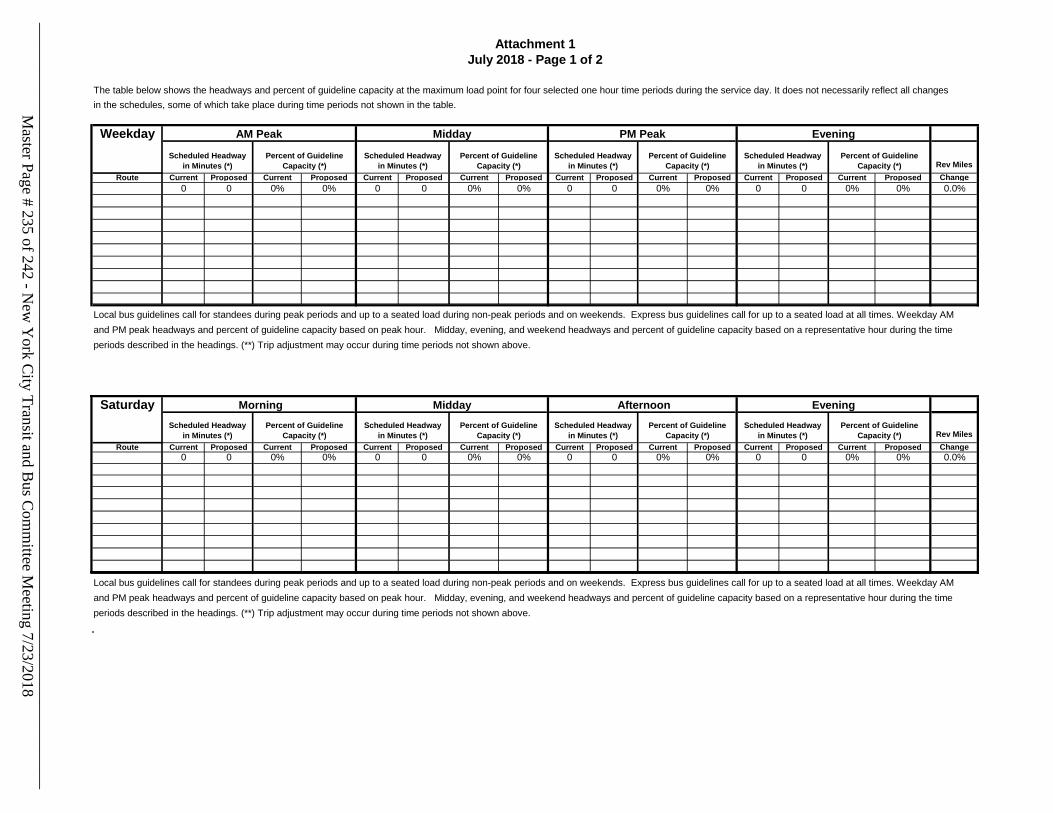
The table below shows the headways and percent of guideline capacity at the maximum load point for four selected one hour time periods during the service day. It does not necessarily reflect all changes
in the schedules, some of which take place during time periods not shown in the table.
Weekday
Rev Miles
Route Current Proposed Current Proposed Current Proposed Current Proposed Current Proposed Current Proposed Current Proposed Current Proposed Change
0 0 0% 0% 0 0 0% 0% 0 0 0% 0% 0 0 0% 0% 0.0%
Local bus guidelines call for standees during peak periods and up to a seated load during non-peak periods and on weekends. Express bus guidelines call for up to a seated load at all times. Weekday AM
and PM peak headways and percent of guideline capacity based on peak hour. Midday, evening, and weekend headways and percent of guideline capacity based on a representative hour during the time
periods described in the headings. (**) Trip adjustment may occur during time periods not shown above.
Saturday
Rev Miles
Route Current Proposed Current Proposed Current Proposed Current Proposed Current Proposed Current Proposed Current Proposed Current Proposed Change
0 0 0% 0% 0 0 0% 0% 0 0 0% 0% 0 0 0% 0% 0.0%
Local bus guidelines call for standees during peak periods and up to a seated load during non-peak periods and on weekends. Express bus guidelines call for up to a seated load at all times. Weekday AM
and PM peak headways and percent of guideline capacity based on peak hour. Midday, evening, and weekend headways and percent of guideline capacity based on a representative hour during the time
periods described in the headings. (**) Trip adjustment may occur during time periods not shown above.
Scheduled Headway
in Minutes (*)
Percent of Guideline
Capacity (*)
Scheduled Headway
in Minutes (*)
Percent of Guideline
Capacity (*)
Scheduled Headway
in Minutes (*)
Percent of Guideline
Capacity (*)
Scheduled Headway
in Minutes (*)
Percent of Guideline
Capacity (*)
Morning Midday Afternoon Evening
Scheduled Headway
in Minutes (*)
Percent of Guideline
Capacity (*)
Scheduled Headway
in Minutes (*)
Percent of Guideline
Capacity (*)
Scheduled Headway
in Minutes (*)
Percent of Guideline
Capacity (*)
Scheduled Headway
in Minutes (*)
Percent of Guideline
Capacity (*)
Attachment 1
July 2018 - Page 1 of 2
AM Peak Midday PM Peak Evening
(*) AM and PM headways based on peak hour service.) AM and PM headways based on peak hour service.The table below shows the headways for three selected peak time periods of limited duration during the day.It does not necessarily reflect all changes in the schedules, many of which take place during time periods not shown in the (*) Weekday AM and PM headways based on peak hour. The percentage change in revenue seat miles is based on the percentage change in revenue trips from the present The table below shows the headways for three selected peak time periods of limited duration during the day.It does not necessarily reflect all changes in the schedules, many of which take place during time periods not shown in the (*) AM and PM headways based on peak hour service.) AM and PM headways based on peak hour service.(*) Weekday AM and PM headways based on peak hour. The percentage change in revenue seat miles is based on the percentage change in revenue trips from the present The table below shows the headways for three selected peak time periods of limited duration during the day.It does not necessarily reflect all changes in the schedules, many of which take place during time periods not shown in the (*) AM and PM headways based on peak hour service.) AM and PM headways based on peak hour service.(*) Weekday AM and PM headways based on peak hour. The percentage change in revenue seat miles is based on the percentage change in revenue trips from the present The table below shows the headways for three selected peak time periods of limited duration during the day.It does not necessarily reflect all changes in the schedules, many of which take place during time periods not shown in the (*) AM and PM headways based on peak hour service.) AM and PM headways based on peak hour service.(*) The percentage change in revenue seat miles is based on the percentage change in revenue trips from the present The table below shows the headways for three selected peak time periods of limited duration during the day.It does not necessarily reflect all changes in the schedules, many of which take place during time periods not shown in the (*) AM and PM headways based on peak hour service.) AM and PM headways based on peak hour service.(*) The percentage change in revenue seat miles is based on the percentage change in revenue trips from the present The table below shows the headways for three selected peak time periods of limited duration during the day.It does not necessarily reflect all changes in the schedules, many of which take place during time periods not shown in the (*) AM and PM headways based on peak hour service.) AM and PM headways based on peak hour service.(*) The percentage change in revenue seat miles is based on the percentage change in revenue trips from the present The table below shows the headways for three selected peak time periods of limited duration during the day.It does not necessarily reflect all changes in the schedules, many of which take place during time periods not shown in the (*) AM and PM headways based on peak hour service.) AM and PM headways based on peak hour service.(*) The percentage change in revenue seat miles is based on the percentage change in revenue trips from the present The table below shows the headways for three selected peak time periods of limited duration during the day.It does not necessarily reflect all changes in the schedules, many of which take place during time periods not shown in the (*) AM and PM headways based on peak hour service.) AM and PM headways based on peak hour service.(*) The percentage change in revenue seat miles is based on the percentage change in revenue trips from the present The table below shows the headways for three selected peak time periods of limited duration during the day.It does not necessarily reflect all changes in the schedules, many of which take place during time periods not shown in the (*) AM and PM headways based on peak hour service.) AM and PM headways based on peak hour service.(*) The percentage change in revenue seat miles is based on the percentage change in revenue trips from the present The table below shows the headways for three selected peak time periods of limited duration during the day.It does not necessarily reflect all changes in the schedules, many of which take place during time periods not shown in the (*) AM and PM headways based on peak hour service.) AM and PM headways based on peak hour service.(*) The percentage change in revenue seat miles is based on the percentage change in revenue trips from the present The table below shows the headways for three selected peak time periods of limited duration during the day.It does not necessarily reflect all changes in the schedules, many of which take place during time periods not shown in the (*) AM and PM headways based on peak hour service.) AM and PM headways based on peak hour service.(*) The percentage change in revenue seat miles is based on the percentage change in revenue trips from the present The table below shows the headways for three selected peak time periods of limited duration during the day.It does not necessarily reflect all changes in the schedules, many of which take place during time periods not shown in the (*) AM and PM headways based on peak hour service.) AM and PM headways based on peak hour service.(*) Weekday AM and PM headways based on peak hour service; Weekday midday headways based on 11AM-1PM; Weekend AM , midday, and PM headways based on 6AM-10AM , The table below shows the headways for three selected peak time periods of limited duration during the day.It does not necessarily reflect all changes in the schedules, many of which take place during time periods not shown in the (*) AM and PM headways based on peak hour service.) AM and PM headways based on peak hour service.(*) Weekday AM and PM headways based on peak hour service; Weekday midday headways based on 11AM-1PM; Weekend AM , midday, and PM headways based on 6AM-10AM , The table below shows the headways for three selected peak time periods of limited duration during the day.It does not necessarily reflect all changes in the schedules, many of which take place during time periods not shown in the (*) AM and PM headways based on peak hour service.) AM and PM headways based on peak hour service.(*) Weekday AM and PM headways based on peak hour service; Weekend AM and PM headways based on 6AM-10AM and 3PM-7PM.The table below shows the headways for three selected peak time periods of limited duration during the day.It does not necessarily reflect all changes in the schedules, many of which take place during time periods not shown in the (*) AM and PM headways based on peak hour service.) AM and PM headways based on peak hour service.(*) Weekday AM and PM headways based on peak hour service; Weekday midday headways based on 11AM-1PM; Weekend AM , midday, and PM headways based on 6AM-10AM , The table below shows the headways for three selected peak time periods of limited duration during the day.It does not necessarily reflect all changes in the schedules, many of which take place during time periods not shown in the (*) AM and PM headways based on peak hour service.) AM and PM headways based on peak hour service.(*) Weekday AM and PM headways based on peak hour service; Weekend AM and PM headways based on 6AM-10AM and 3PM-7PM.The table below shows the headways for three selected peak time periods of limited duration during the day.It does not necessarily reflect all changes in the schedules, many of which take place during time periods not shown in the (*) AM and PM headways based on peak hour service.) AM and PM headways based on peak hour service.(*) Weekday AM and PM headways based on peak hour service; Weekend AM and PM headways based on 6AM-10AM and 3PM-7PM.The table below shows the headways for three selected peak time periods of limited duration during the day.It does not necessarily reflect all changes in the schedules, many of which take place during time periods not shown in the (*) AM and PM headways based on peak hour service.) AM and PM headways based on peak hour service.The table below shows the headways for three selected peak time periods of limited duration during the day.It does not necessarily reflect all changes in the schedules, many of which take place during time periods not shown in the (*) Weekday AM and PM headways based on peak hour service; Weekend AM and PM headways based on 6AM-10AM and 3PM-7PM.The table below shows the headways for three selected peak time periods of limited duration during the day.It does not necessarily reflect all changes in the schedules, many of which take place during time periods not shown in the (*) AM and PM headways based on peak hour service.) AM and PM headways based on peak hour service.(*) Weekday AM and PM headways based on peak hour service; Weekend AM and PM headways based on 6AM-10AM and 3PM-7PM.The table below shows the headways for three selected peak time periods of limited duration during the day.It does not necessarily reflect all changes in the schedules, many of which take place during time periods not shown in the (*) AM and PM headways based on peak hour service.) AM and PM headways based on peak hour service.(*) Weekday AM and PM headways based on peak hour service; Weekend AM and PM headways based on 6AM-10AM and 3PM-7PM.The table below shows the headways for three selected peak time periods of limited duration during the day.It does not necessarily reflect all changes in the schedules, many of which take place during time periods not shown in the (*) AM and PM headways based on peak hour service.) AM and PM headways based on peak hour service.The table below shows the headways for three selected peak time periods of limited duration during the day.It does not necessarily reflect all changes in the schedules, many of which take place during time periods not shown in the The table below shows the headways for three selected peak time periods of limited duration during the day.It does not necessarily reflect all changes in the schedules, many of which take place during time periods not shown in the The table below shows the headways for three selected peak time periods of limited duration during the day.It does not necessarily reflect all changes in the schedules, many of which take place during time periods not shown in the The table below shows the headways for three selected peak time periods of limited duration during the day.It does not necessarily reflect all changes in the schedules, many of which take place during time periods not shown in the The table below shows the headways for three selected peak time periods of limited duration during the day.It does not necessarily reflect all changes in the schedules, many of which take place during time periods not shown in the The table below shows the headways for three selected peak time periods of limited duration during the day.It does not necessarily reflect all changes in the schedules, many of which take place during time periods not shown in the (*) Weekday AM and PM headways based on peak hour service; Weekend AM and PM headways based on 6AM-10AM and 3PM-7PM.The table below shows the headways for three selected peak time periods of limited duration during the day.It does not necessarily reflect all changes in the schedules, many of which take place during time periods not shown in the (*) AM and PM headways based on peak hour service.) AM and PM headways based on peak hour service.(*) Weekday AM and PM headways based on peak hour service; Weekend AM and PM headways based on 6AM-10AM and 3PM-7PM.The table below shows the headways for three selected peak time periods of limited duration during the day.It does not necessarily reflect all changes in the schedules, many of which take place during time periods not shown in the ( The table below shows the headways for three selected peak time periods of limited duration during the day.It does not necessarily reflect all changes in the schedules, many of which take place during time periods not shown in the The table below shows the headways for three selected peak time periods of limited duration during the day.It does not necessarily reflect all changes in the schedules, many of which take place during time periods not shown in the The table below shows the headways for three selected peak time periods of limited duration during the day.It does not necessarily reflect all changes in the schedules, many of which take place during time periods not shown in the The table below shows the headways for three selected peak time periods of limited duration during the day.It does not necessarily reflect all changes in the schedules, many of which take place during time periods not shown in the The table below shows the headways for three selected peak time periods of limited duration during the day.It does not necessarily reflect all changes in the schedules, many of which take place during time periods not shown in the The table below shows the headways for three selected peak time periods of limited duration during the day.It does not necessarily reflect all changes in the schedules, many of which take place during time periods not shown in the The table below shows the headways for three selected peak time periods of limited duration during the day.It does not necessarily reflect all changes in the schedules, many of which take place during time periods not shown in the The table below shows the headways for three selected peak time periods of limited duration during the day.It does not necessarily reflect all changes in the schedules, many of which take place during time periods not shown in the The table below shows the headways for three selected peak time periods of limited duration during the day.It does not necessarily reflect all changes in the schedules, many of which take place during time periods not shown in the
(*) Weekday AM and PM headways based on peak hour. Weekend AM headways based on 8 AM - 9 AM; Weekend PM headways base on 5 PM -6 PM; Evening express Local bus guidelines call for standees during peak periods and up to a seated load during non-peak periods and on weekends. Express bus guidelines call for up to a seated load at all times. Weekday AM
r four selected one hour time periods during the service day. It does not necessarily reflect all changes in the schedules, some of which take place during time periods not shown in the table. The tables below show the headways and percent of guideline capacity at the maximum load point for four selected one hour time periods during the service day. It does not necessarily reflect all
(*) AM and PM headways based on peak hour service.) AM and PM headways based on peak hour service.The table below shows the headways for three selected peak time periods of limited duration during the day.It does not necessarily reflect all changes in the schedules, many of which take place during time periods not shown in the (*) Weekday AM and PM headways based on peak hour. The percentage change in revenue seat miles is based on the percentage change in revenue trips from the present The table below shows the headways for three selected peak time periods of limited duration during the day.It does not necessarily reflect all changes in the schedules, many of which take place during time periods not shown in the (*) AM and PM headways based on peak hour service.) AM and PM headways based on peak hour service.(*) Weekday AM and PM headways based on peak hour. The percentage change in revenue seat miles is based on the percentage change in revenue trips from the present The table below shows the headways for three selected peak time periods of limited duration during the day.It does not necessarily reflect all changes in the schedules, many of which take place during time periods not shown in the (*) AM and PM headways based on peak hour service.) AM and PM headways based on peak hour service.(*) Weekday AM and PM headways based on peak hour. The percentage change in revenue seat miles is based on the percentage change in revenue trips from the present The table below shows the headways for three selected peak time periods of limited duration during the day.It does not necessarily reflect all changes in the schedules, many of which take place during time periods not shown in the (*) AM and PM headways based on peak hour service.) AM and PM headways based on peak hour service.(*) The percentage change in revenue seat miles is based on the percentage change in revenue trips from the present The table below shows the headways for three selected peak time periods of limited duration during the day.It does not necessarily reflect all changes in the schedules, many of which take place during time periods not shown in the (*) AM and PM headways based on peak hour service.) AM and PM headways based on peak hour service.(*) The percentage change in revenue seat miles is based on the percentage change in revenue trips from the present The table below shows the headways for three selected peak time periods of limited duration during the day.It does not necessarily reflect all changes in the schedules, many of which take place during time periods not shown in the (*) AM and PM headways based on peak hour service.) AM and PM headways based on peak hour service.(*) The percentage change in revenue seat miles is based on the percentage change in revenue trips from the present The table below shows the headways for three selected peak time periods of limited duration during the day.It does not necessarily reflect all changes in the schedules, many of which take place during time periods not shown in the (*) AM and PM headways based on peak hour service.) AM and PM headways based on peak hour service.(*) The percentage change in revenue seat miles is based on the percentage change in revenue trips from the present The table below shows the headways for three selected peak time periods of limited duration during the day.It does not necessarily reflect all changes in the schedules, many of which take place during time periods not shown in the (*) AM and PM headways based on peak hour service.) AM and PM headways based on peak hour service.(*) The percentage change in revenue seat miles is based on the percentage change in revenue trips from the present The table below shows the headways for three selected peak time periods of limited duration during the day.It does not necessarily reflect all changes in the schedules, many of which take place during time periods not shown in the (*) AM and PM headways based on peak hour service.) AM and PM headways based on peak hour service.(*) The percentage change in revenue seat miles is based on the percentage change in revenue trips from the present The table below shows the headways for three selected peak time periods of limited duration during the day.It does not necessarily reflect all changes in the schedules, many of which take place during time periods not shown in the (*) AM and PM headways based on peak hour service.) AM and PM headways based on peak hour service.(*) The percentage change in revenue seat miles is based on the percentage change in revenue trips from the present The table below shows the headways for three selected peak time periods of limited duration during the day.It does not necessarily reflect all changes in the schedules, many of which take place during time periods not shown in the (*) AM and PM headways based on peak hour service.) AM and PM headways based on peak hour service.(*) The percentage change in revenue seat miles is based on the percentage change in revenue trips from the present The table below shows the headways for three selected peak time periods of limited duration during the day.It does not necessarily reflect all changes in the schedules, many of which take place during time periods not shown in the (*) AM and PM headways based on peak hour service.) AM and PM headways based on peak hour service.(*) Weekday AM and PM headways based on peak hour service; Weekday midday headways based on 11AM-1PM; Weekend AM , midday, and PM headways based on 6AM-10AM , The table below shows the headways for three selected peak time periods of limited duration during the day.It does not necessarily reflect all changes in the schedules, many of which take place during time periods not shown in the (*) AM and PM headways based on peak hour service.) AM and PM headways based on peak hour service.(*) Weekday AM and PM headways based on peak hour service; Weekday midday headways based on 11AM-1PM; Weekend AM , midday, and PM headways based on 6AM-10AM , The table below shows the headways for three selected peak time periods of limited duration during the day.It does not necessarily reflect all changes in the schedules, many of which take place during time periods not shown in the (*) AM and PM headways based on peak hour service.) AM and PM headways based on peak hour service.(*) Weekday AM and PM headways based on peak hour service; Weekend AM and PM headways based on 6AM-10AM and 3PM-7PM.The table below shows the headways for three selected peak time periods of limited duration during the day.It does not necessarily reflect all changes in the schedules, many of which take place during time periods not shown in the (*) AM and PM headways based on peak hour service.) AM and PM headways based on peak hour service.(*) Weekday AM and PM headways based on peak hour service; Weekday midday headways based on 11AM-1PM; Weekend AM , midday, and PM headways based on 6AM-10AM , The table below shows the headways for three selected peak time periods of limited duration during the day.It does not necessarily reflect all changes in the schedules, many of which take place during time periods not shown in the (*) AM and PM headways based on peak hour service.) AM and PM headways based on peak hour service.(*) Weekday AM and PM headways based on peak hour service; Weekend AM and PM headways based on 6AM-10AM and 3PM-7PM.The table below shows the headways for three selected peak time periods of limited duration during the day.It does not necessarily reflect all changes in the schedules, many of which take place during time periods not shown in the (*) AM and PM headways based on peak hour service.) AM and PM headways based on peak hour service.(*) Weekday AM and PM headways based on peak hour service; Weekend AM and PM headways based on 6AM-10AM and 3PM-7PM.The table below shows the headways for three selected peak time periods of limited duration during the day.It does not necessarily reflect all changes in the schedules, many of which take place during time periods not shown in the (*) AM and PM headways based on peak hour service.) AM and PM headways based on peak hour service.The table below shows the headways for three selected peak time periods of limited duration during the day.It does not necessarily reflect all changes in the schedules, many of which take place during time periods not shown in the (*) Weekday AM and PM headways based on peak hour service; Weekend AM and PM headways based on 6AM-10AM and 3PM-7PM.The table below shows the headways for three selected peak time periods of limited duration during the day.It does not necessarily reflect all changes in the schedules, many of which take place during time periods not shown in the (*) AM and PM headways based on peak hour service.) AM and PM headways based on peak hour service.(*) Weekday AM and PM headways based on peak hour service; Weekend AM and PM headways based on 6AM-10AM and 3PM-7PM.The table below shows the headways for three selected peak time periods of limited duration during the day.It does not necessarily reflect all changes in the schedules, many of which take place during time periods not shown in the (*) AM and PM headways based on peak hour service.) AM and PM headways based on peak hour service.(*) Weekday AM and PM headways based on peak hour service; Weekend AM and PM headways based on 6AM-10AM and 3PM-7PM.The table below shows the headways for three selected peak time periods of limited duration during the day.It does not necessarily reflect all changes in the schedules, many of which take place during time periods not shown in the (*) AM and PM headways based on peak hour service.) AM and PM headways based on peak hour service.The table below shows the headways for three selected peak time periods of limited duration during the day.It does not necessarily reflect all changes in the schedules, many of which take place during time periods not shown in the The table below shows the headways for three selected peak time periods of limited duration during the day.It does not necessarily reflect all changes in the schedules, many of which take place during time periods not shown in the The table below shows the headways for three selected peak time periods of limited duration during the day.It does not necessarily reflect all changes in the schedules, many of which take place during time periods not shown in the The table below shows the headways for three selected peak time periods of limited duration during the day.It does not necessarily reflect all changes in the schedules, many of which take place during time periods not shown in the The table below shows the headways for three selected peak time periods of limited duration during the day.It does not necessarily reflect all changes in the schedules, many of which take place during time periods not shown in the The table below shows the headways for three selected peak time periods of limited duration during the day.It does not necessarily reflect all changes in the schedules, many of which take place during time periods not shown in the (*) Weekday AM and PM headways based on peak hour service; Weekend AM and PM headways based on 6AM-10AM and 3PM-7PM.The table below shows the headways for three selected peak time periods of limited duration during the day.It does not necessarily reflect all changes in the schedules, many of which take place during time periods not shown in the (*) AM and PM headways based on peak hour service.) AM and PM headways based on peak hour service.(*) Weekday AM and PM headways based on peak hour service; Weekend AM and PM headways based on 6AM-10AM and 3PM-7PM.The table below shows the headways for three selected peak time periods of limited duration during the day.It does not necessarily reflect all changes in the schedules, many of which take place during time periods not shown in the ( The table below shows the headways for three selected peak time periods of limited duration during the day.It does not necessarily reflect all changes in the schedules, many of which take place during time periods not shown in the The table below shows the headways for three selected peak time periods of limited duration during the day.It does not necessarily reflect all changes in the schedules, many of which take place during time periods not shown in the The table below shows the headways for three selected peak time periods of limited duration during the day.It does not necessarily reflect all changes in the schedules, many of which take place during time periods not shown in the The table below shows the headways for three selected peak time periods of limited duration during the day.It does not necessarily reflect all changes in the schedules, many of which take place during time periods not shown in the The table below shows the headways for three selected peak time periods of limited duration during the day.It does not necessarily reflect all changes in the schedules, many of which take place during time periods not shown in the The table below shows the headways for three selected peak time periods of limited duration during the day.It does not necessarily reflect all changes in the schedules, many of which take place during time periods not shown in the The table below shows the headways for three selected peak time periods of limited duration during the day.It does not necessarily reflect all changes in the schedules, many of which take place during time periods not shown in the The table below shows the headways for three selected peak time periods of limited duration during the day.It does not necessarily reflect all changes in the schedules, many of which take place during time periods not shown in the The table below shows the headways for three selected peak time periods of limited duration during the day.It does not necessarily reflect all changes in the schedules, many of which take place during time periods not shown in the The table below shows the headways and percent of guideline capacity at the maximum load point for four selected one hour time periods during the service day. It does not necessarily reflect all Local bus guidelines call for standees during peak periods and up to a seated load during non-peak periods and on weekends. Express bus guidelines call for up to a seated load at all times. Weekday AM The table below shows the headways and percent of guideline capacity at the maximum load point for four selected one hour time periods during the service day. It does not necessarily reflect all The table below shows the headways and percent of guideline capacity at the maximum load point for four selected one hour time periods during the service day. It does not necessarily reflect all (*) Local bus guidelines call for standees during peak periods and up to a seated load during non-peak periods. Express bus guidelines call for up to a seated load at all times. Weekday AM and PM peak The tables below show the headways and percent of guideline capacity at the maximum load point for four selected one hour time periods during the service day. It does not necessarily reflect all The tables below show the headways and percent of guideline capacity at the maximum load point for four selected one hour time periods during the service day. It does not necessarily reflect all
(*) AM and PM headways based on peak hour service.) AM and PM headways based on peak hour service.The table below shows the headways for three selected peak time periods of limited duration during the day.It does not necessarily reflect all changes in the schedules, many of which take place during time periods not shown in the (*) Weekday AM and PM headways based on peak hour. The percentage change in revenue seat miles is based on the percentage change in revenue trips from the present The table below shows the headways for three selected peak time periods of limited duration during the day.It does not necessarily reflect all changes in the schedules, many of which take place during time periods not shown in the (*) AM and PM headways based on peak hour service.) AM and PM headways based on peak hour service.(*) Weekday AM and PM headways based on peak hour. The percentage change in revenue seat miles is based on the percentage change in revenue trips from the present The table below shows the headways for three selected peak time periods of limited duration during the day.It does not necessarily reflect all changes in the schedules, many of which take place during time periods not shown in the (*) AM and PM headways based on peak hour service.) AM and PM headways based on peak hour service.(*) Weekday AM and PM headways based on peak hour. The percentage change in revenue seat miles is based on the percentage change in revenue trips from the present The table below shows the headways for three selected peak time periods of limited duration during the day.It does not necessarily reflect all changes in the schedules, many of which take place during time periods not shown in the (*) AM and PM headways based on peak hour service.) AM and PM headways based on peak hour service.(*) The percentage change in revenue seat miles is based on the percentage change in revenue trips from the present The table below shows the headways for three selected peak time periods of limited duration during the day.It does not necessarily reflect all changes in the schedules, many of which take place during time periods not shown in the (*) AM and PM headways based on peak hour service.) AM and PM headways based on peak hour service.(*) The percentage change in revenue seat miles is based on the percentage change in revenue trips from the present The table below shows the headways for three selected peak time periods of limited duration during the day.It does not necessarily reflect all changes in the schedules, many of which take place during time periods not shown in the (*) AM and PM headways based on peak hour service.) AM and PM headways based on peak hour service.(*) The percentage change in revenue seat miles is based on the percentage change in revenue trips from the present The table below shows the headways for three selected peak time periods of limited duration during the day.It does not necessarily reflect all changes in the schedules, many of which take place during time periods not shown in the (*) AM and PM headways based on peak hour service.) AM and PM headways based on peak hour service.(*) The percentage change in revenue seat miles is based on the percentage change in revenue trips from the present The table below shows the headways for three selected peak time periods of limited duration during the day.It does not necessarily reflect all changes in the schedules, many of which take place during time periods not shown in the (*) AM and PM headways based on peak hour service.) AM and PM headways based on peak hour service.(*) The percentage change in revenue seat miles is based on the percentage change in revenue trips from the present The table below shows the headways for three selected peak time periods of limited duration during the day.It does not necessarily reflect all changes in the schedules, many of which take place during time periods not shown in the (*) AM and PM headways based on peak hour service.) AM and PM headways based on peak hour service.(*) The percentage change in revenue seat miles is based on the percentage change in revenue trips from the present The table below shows the headways for three selected peak time periods of limited duration during the day.It does not necessarily reflect all changes in the schedules, many of which take place during time periods not shown in the (*) AM and PM headways based on peak hour service.) AM and PM headways based on peak hour service.(*) The percentage change in revenue seat miles is based on the percentage change in revenue trips from the present The table below shows the headways for three selected peak time periods of limited duration during the day.It does not necessarily reflect all changes in the schedules, many of which take place during time periods not shown in the (*) AM and PM headways based on peak hour service.) AM and PM headways based on peak hour service.(*) The percentage change in revenue seat miles is based on the percentage change in revenue trips from the present The table below shows the headways for three selected peak time periods of limited duration during the day.It does not necessarily reflect all changes in the schedules, many of which take place during time periods not shown in the (*) AM and PM headways based on peak hour service.) AM and PM headways based on peak hour service.(*) Weekday AM and PM headways based on peak hour service; Weekday midday headways based on 11AM-1PM; Weekend AM , midday, and PM headways based on 6AM-10AM , The table below shows the headways for three selected peak time periods of limited duration during the day.It does not necessarily reflect all changes in the schedules, many of which take place during time periods not shown in the (*) AM and PM headways based on peak hour service.) AM and PM headways based on peak hour service.(*) Weekday AM and PM headways based on peak hour service; Weekday midday headways based on 11AM-1PM; Weekend AM , midday, and PM headways based on 6AM-10AM , The table below shows the headways for three selected peak time periods of limited duration during the day.It does not necessarily reflect all changes in the schedules, many of which take place during time periods not shown in the (*) AM and PM headways based on peak hour service.) AM and PM headways based on peak hour service.(*) Weekday AM and PM headways based on peak hour service; Weekend AM and PM headways based on 6AM-10AM and 3PM-7PM.The table below shows the headways for three selected peak time periods of limited duration during the day.It does not necessarily reflect all changes in the schedules, many of which take place during time periods not shown in the (*) AM and PM headways based on peak hour service.) AM and PM headways based on peak hour service.(*) Weekday AM and PM headways based on peak hour service; Weekday midday headways based on 11AM-1PM; Weekend AM , midday, and PM headways based on 6AM-10AM , The table below shows the headways for three selected peak time periods of limited duration during the day.It does not necessarily reflect all changes in the schedules, many of which take place during time periods not shown in the (*) AM and PM headways based on peak hour service.) AM and PM headways based on peak hour service.(*) Weekday AM and PM headways based on peak hour service; Weekend AM and PM headways based on 6AM-10AM and 3PM-7PM.The table below shows the headways for three selected peak time periods of limited duration during the day.It does not necessarily reflect all changes in the schedules, many of which take place during time periods not shown in the (*) AM and PM headways based on peak hour service.) AM and PM headways based on peak hour service.(*) Weekday AM and PM headways based on peak hour service; Weekend AM and PM headways based on 6AM-10AM and 3PM-7PM.The table below shows the headways for three selected peak time periods of limited duration during the day.It does not necessarily reflect all changes in the schedules, many of which take place during time periods not shown in the (*) AM and PM headways based on peak hour service.) AM and PM headways based on peak hour service.The table below shows the headways for three selected peak time periods of limited duration during the day.It does not necessarily reflect all changes in the schedules, many of which take place during time periods not shown in the (*) Weekday AM and PM headways based on peak hour service; Weekend AM and PM headways based on 6AM-10AM and 3PM-7PM.The table below shows the headways for three selected peak time periods of limited duration during the day.It does not necessarily reflect all changes in the schedules, many of which take place during time periods not shown in the (*) AM and PM headways based on peak hour service.) AM and PM headways based on peak hour service.(*) Weekday AM and PM headways based on peak hour service; Weekend AM and PM headways based on 6AM-10AM and 3PM-7PM.The table below shows the headways for three selected peak time periods of limited duration during the day.It does not necessarily reflect all changes in the schedules, many of which take place during time periods not shown in the (*) AM and PM headways based on peak hour service.) AM and PM headways based on peak hour service.(*) Weekday AM and PM headways based on peak hour service; Weekend AM and PM headways based on 6AM-10AM and 3PM-7PM.The table below shows the headways for three selected peak time periods of limited duration during the day.It does not necessarily reflect all changes in the schedules, many of which take place during time periods not shown in the (*) AM and PM headways based on peak hour service.) AM and PM headways based on peak hour service.The table below shows the headways for three selected peak time periods of limited duration during the day.It does not necessarily reflect all changes in the schedules, many of which take place during time periods not shown in the The table below shows the headways for three selected peak time periods of limited duration during the day.It does not necessarily reflect all changes in the schedules, many of which take place during time periods not shown in the The table below shows the headways for three selected peak time periods of limited duration during the day.It does not necessarily reflect all changes in the schedules, many of which take place during time periods not shown in the The table below shows the headways for three selected peak time periods of limited duration during the day.It does not necessarily reflect all changes in the schedules, many of which take place during time periods not shown in the The table below shows the headways for three selected peak time periods of limited duration during the day.It does not necessarily reflect all changes in the schedules, many of which take place during time periods not shown in the The table below shows the headways for three selected peak time periods of limited duration during the day.It does not necessarily reflect all changes in the schedules, many of which take place during time periods not shown in the (*) Weekday AM and PM headways based on peak hour service; Weekend AM and PM headways based on 6AM-10AM and 3PM-7PM.The table below shows the headways for three selected peak time periods of limited duration during the day.It does not necessarily reflect all changes in the schedules, many of which take place during time periods not shown in the ( .
Local bus guidelines call for standees during peak periods and up to a seated load during non-peak periods and on weekends. Express bus guidelines call for up to a seated load at all times. Weekday AM .
(*) AM and PM headways based on peak hour service.) AM and PM headways based on peak hour service.The table below shows the headways for three selected peak time periods of limited duration during the day.It does not necessarily reflect all changes in the schedules, many of which take place during time periods not shown in the (*) Weekday AM and PM headways based on peak hour. The percentage change in revenue seat miles is based on the percentage change in revenue trips from the present The table below shows the headways for three selected peak time periods of limited duration during the day.It does not necessarily reflect all changes in the schedules, many of which take place during time periods not shown in the (*) AM and PM headways based on peak hour service.) AM and PM headways based on peak hour service.(*) Weekday AM and PM headways based on peak hour. The percentage change in revenue seat miles is based on the percentage change in revenue trips from the present The table below shows the headways for three selected peak time periods of limited duration during the day.It does not necessarily reflect all changes in the schedules, many of which take place during time periods not shown in the (*) AM and PM headways based on peak hour service.) AM and PM headways based on peak hour service.(*) Weekday AM and PM headways based on peak hour. The percentage change in revenue seat miles is based on the percentage change in revenue trips from the present The table below shows the headways for three selected peak time periods of limited duration during the day.It does not necessarily reflect all changes in the schedules, many of which take place during time periods not shown in the (*) AM and PM headways based on peak hour service.) AM and PM headways based on peak hour service.(*) The percentage change in revenue seat miles is based on the percentage change in revenue trips from the present The table below shows the headways for three selected peak time periods of limited duration during the day.It does not necessarily reflect all changes in the schedules, many of which take place during time periods not shown in the (*) AM and PM headways based on peak hour service.) AM and PM headways based on peak hour service.(*) The percentage change in revenue seat miles is based on the percentage change in revenue trips from the present The table below shows the headways for three selected peak time periods of limited duration during the day.It does not necessarily reflect all changes in the schedules, many of which take place during time periods not shown in the (*) AM and PM headways based on peak hour service.) AM and PM headways based on peak hour service.(*) The percentage change in revenue seat miles is based on the percentage change in revenue trips from the present The table below shows the headways for three selected peak time periods of limited duration during the day.It does not necessarily reflect all changes in the schedules, many of which take place during time periods not shown in the (*) AM and PM headways based on peak hour service.) AM and PM headways based on peak hour service.(*) The percentage change in revenue seat miles is based on the percentage change in revenue trips from the present The table below shows the headways for three selected peak time periods of limited duration during the day.It does not necessarily reflect all changes in the schedules, many of which take place during time periods not shown in the (*) AM and PM headways based on peak hour service.) AM and PM headways based on peak hour service.(*) The percentage change in revenue seat miles is based on the percentage change in revenue trips from the present The table below shows the headways for three selected peak time periods of limited duration during the day.It does not necessarily reflect all changes in the schedules, many of which take place during time periods not shown in the (*) AM and PM headways based on peak hour service.) AM and PM headways based on peak hour service.(*) The percentage change in revenue seat miles is based on the percentage change in revenue trips from the present The table below shows the headways for three selected peak time periods of limited duration during the day.It does not necessarily reflect all changes in the schedules, many of which take place during time periods not shown in the (*) AM and PM headways based on peak hour service.) AM and PM headways based on peak hour service.(*) The percentage change in revenue seat miles is based on the percentage change in revenue trips from the present The table below shows the headways for three selected peak time periods of limited duration during the day.It does not necessarily reflect all changes in the schedules, many of which take place during time periods not shown in the (*) AM and PM headways based on peak hour service.) AM and PM headways based on peak hour service.(*) The percentage change in revenue seat miles is based on the percentage change in revenue trips from the present The table below shows the headways for three selected peak time periods of limited duration during the day.It does not necessarily reflect all changes in the schedules, many of which take place during time periods not shown in the (*) AM and PM headways based on peak hour service.) AM and PM headways based on peak hour service.(*) Weekday AM and PM headways based on peak hour service; Weekday midday headways based on 11AM-1PM; Weekend AM , midday, and PM headways based on 6AM-10AM , The table below shows the headways for three selected peak time periods of limited duration during the day.It does not necessarily reflect all changes in the schedules, many of which take place during time periods not shown in the (*) AM and PM headways based on peak hour service.) AM and PM headways based on peak hour service.(*) Weekday AM and PM headways based on peak hour service; Weekday midday headways based on 11AM-1PM; Weekend AM , midday, and PM headways based on 6AM-10AM , The table below shows the headways for three selected peak time periods of limited duration during the day.It does not necessarily reflect all changes in the schedules, many of which take place during time periods not shown in the (*) AM and PM headways based on peak hour service.) AM and PM headways based on peak hour service.(*) Weekday AM and PM headways based on peak hour service; Weekend AM and PM headways based on 6AM-10AM and 3PM-7PM.The table below shows the headways for three selected peak time periods of limited duration during the day.It does not necessarily reflect all changes in the schedules, many of which take place during time periods not shown in the (*) AM and PM headways based on peak hour service.) AM and PM headways based on peak hour service.(*) Weekday AM and PM headways based on peak hour service; Weekday midday headways based on 11AM-1PM; Weekend AM , midday, and PM headways based on 6AM-10AM , The table below shows the headways for three selected peak time periods of limited duration during the day.It does not necessarily reflect all changes in the schedules, many of which take place during time periods not shown in the (*) AM and PM headways based on peak hour service.) AM and PM headways based on peak hour service.(*) Weekday AM and PM headways based on peak hour service; Weekend AM and PM headways based on 6AM-10AM and 3PM-7PM.The table below shows the headways for three selected peak time periods of limited duration during the day.It does not necessarily reflect all changes in the schedules, many of which take place during time periods not shown in the (*) AM and PM headways based on peak hour service.) AM and PM headways based on peak hour service.(*) Weekday AM and PM headways based on peak hour service; Weekend AM and PM headways based on 6AM-10AM and 3PM-7PM.The table below shows the headways for three selected peak time periods of limited duration during the day.It does not necessarily reflect all changes in the schedules, many of which take place during time periods not shown in the (*) AM and PM headways based on peak hour service.) AM and PM headways based on peak hour service.The table below shows the headways for three selected peak time periods of limited duration during the day.It does not necessarily reflect all changes in the schedules, many of which take place during time periods not shown in the (*) Weekday AM and PM headways based on peak hour service; Weekend AM and PM headways based on 6AM-10AM and 3PM-7PM.The table below shows the headways for three selected peak time periods of limited duration during the day.It does not necessarily reflect all changes in the schedules, many of which take place during time periods not shown in the (*) AM and PM headways based on peak hour service.) AM and PM headways based on peak hour service.(*) Weekday AM and PM headways based on peak hour service; Weekend AM and PM headways based on 6AM-10AM and 3PM-7PM.The table below shows the headways for three selected peak time periods of limited duration during the day.It does not necessarily reflect all changes in the schedules, many of which take place during time periods not shown in the (*) AM and PM headways based on peak hour service.) AM and PM headways based on peak hour service.(*) Weekday AM and PM headways based on peak hour service; Weekend AM and PM headways based on 6AM-10AM and 3PM-7PM.The table below shows the headways for three selected peak time periods of limited duration during the day.It does not necessarily reflect all changes in the schedules, many of which take place during time periods not shown in the (*) AM and PM headways based on peak hour service.) AM and PM headways based on peak hour service.The table below shows the headways for three selected peak time periods of limited duration during the day.It does not necessarily reflect all changes in the schedules, many of which take place during time periods not shown in the The table below shows the headways for three selected peak time periods of limited duration during the day.It does not necessarily reflect all changes in the schedules, many of which take place during time periods not shown in the The table below shows the headways for three selected peak time periods of limited duration during the day.It does not necessarily reflect all changes in the schedules, many of which take place during time periods not shown in the The table below shows the headways for three selected peak time periods of limited duration during the day.It does not necessarily reflect all changes in the schedules, many of which take place during time periods not shown in the The table below shows the headways for three selected peak time periods of limited duration during the day.It does not necessarily reflect all changes in the schedules, many of which take place during time periods not shown in the The table below shows the headways for three selected peak time periods of limited duration during the day.It does not necessarily reflect all changes in the schedules, many of which take place during time periods not shown in the (*) Weekday AM and PM headways based on peak hour service; Weekend AM and PM headways based on 6AM-10AM and 3PM-7PM.The table below shows the headways for three selected peak time periods of limited duration during the day.It does not necessarily reflect all changes in the schedules, many of which take place during time periods not shown in the (*) AM and PM headways based on peak hour service.) AM and PM headways based on peak hour service.(*) Weekday AM and PM headways based on peak hour service; Weekend AM and PM headways based on 6AM-10AM and 3PM-7PM.The table below shows the headways for three selected peak time periods of limited duration during the day.It does not necessarily reflect all changes in the schedules, many of which take place during time periods not shown in the ( The table below shows the headways for three selected peak time periods of limited duration during the day.It does not necessarily reflect all changes in the schedules, many of which take place during time periods not shown in the The table below shows the headways for three selected peak time periods of limited duration during the day.It does not necessarily reflect all changes in the schedules, many of which take place during time periods not shown in the The table below shows the headways for three selected peak time periods of limited duration during the day.It does not necessarily reflect all changes in the schedules, many of which take place during time periods not shown in the The table below shows the headways for three selected peak time periods of limited duration during the day.It does not necessarily reflect all changes in the schedules, many of which take place during time periods not shown in the The table below shows the headways for three selected peak time periods of limited duration during the day.It does not necessarily reflect all changes in the schedules, many of which take place during time periods not shown in the The table below shows the headways for three selected peak time periods of limited duration during the day.It does not necessarily reflect all changes in the schedules, many of which take place during time periods not shown in the The table below shows the headways for three selected peak time periods of limited duration during the day.It does not necessarily reflect all changes in the schedules, many of which take place during time periods not shown in the The table below shows the headways for three selected peak time periods of limited duration during the day.It does not necessarily reflect all changes in the schedules, many of which take place during time periods not shown in the The table below shows the headways for three selected peak time periods of limited duration during the day.It does not necessarily reflect all changes in the schedules, many of which take place during time periods not shown in the The table below shows the headways and percent of guideline capacity at the maximum load point for four selected one hour time periods during the service day. It does not necessarily reflect all Local bus guidelines call for standees during peak periods and up to a seated load during non-peak periods and on weekends. Express bus guidelines call for up to a seated load at all times. Weekday AM The tables below show the headways and percent of guideline capacity at the maximum load point for four selected one hour time periods during the service day. It does not necessarily reflect all (*) AM and PM headways based on peak hour service.) AM and PM headways based on peak hour service.The table below shows the headways for three selected peak time periods of limited duration during the day.It does not necessarily reflect all changes in the schedules, many of which take place during time periods not shown in the (*) Weekday AM and PM headways based on peak hour. The percentage change in revenue seat miles is based on the percentage change in revenue trips from the present The table below shows the headways for three selected peak time periods of limited duration during the day.It does not necessarily reflect all changes in the schedules, many of which take place during time periods not shown in the (*) AM and PM headways based on peak hour service.) AM and PM headways based on peak hour service.(*) Weekday AM and PM headways based on peak hour. The percentage change in revenue seat miles is based on the percentage change in revenue trips from the present The table below shows the headways for three selected peak time periods of limited duration during the day.It does not necessarily reflect all changes in the schedules, many of which take place during time periods not shown in the (*) AM and PM headways based on peak hour service.) AM and PM headways based on peak hour service.(*) Weekday AM and PM headways based on peak hour. The percentage change in revenue seat miles is based on the percentage change in revenue trips from the present The table below shows the headways for three selected peak time periods of limited duration during the day.It does not necessarily reflect all changes in the schedules, many of which take place during time periods not shown in the (*) AM and PM headways based on peak hour service.) AM and PM headways based on peak hour service.(*) The percentage change in revenue seat miles is based on the percentage change in revenue trips from the present The table below shows the headways for three selected peak time periods of limited duration during the day.It does not necessarily reflect all changes in the schedules, many of which take place during time periods not shown in the (*) AM and PM headways based on peak hour service.) AM and PM headways based on peak hour service.(*) The percentage change in revenue seat miles is based on the percentage change in revenue trips from the present The table below shows the headways for three selected peak time periods of limited duration during the day.It does not necessarily reflect all changes in the schedules, many of which take place during time periods not shown in the (*) AM and PM headways based on peak hour service.) AM and PM headways based on peak hour service.(*) The percentage change in revenue seat miles is based on the percentage change in revenue trips from the present The table below shows the headways for three selected peak time periods of limited duration during the day.It does not necessarily reflect all changes in the schedules, many of which take place during time periods not shown in the (*) AM and PM headways based on peak hour service.) AM and PM headways based on peak hour service.(*) The percentage change in revenue seat miles is based on the percentage change in revenue trips from the present The table below shows the headways for three selected peak time periods of limited duration during the day.It does not necessarily reflect all changes in the schedules, many of which take place during time periods not shown in the (*) AM and PM headways based on peak hour service.) AM and PM headways based on peak hour service.(*) The percentage change in revenue seat miles is based on the percentage change in revenue trips from the present The table below shows the headways for three selected peak time periods of limited duration during the day.It does not necessarily reflect all changes in the schedules, many of which take place during time periods not shown in the (*) AM and PM headways based on peak hour service.) AM and PM headways based on peak hour service.(*) The percentage change in revenue seat miles is based on the percentage change in revenue trips from the present The table below shows the headways for three selected peak time periods of limited duration during the day.It does not necessarily reflect all changes in the schedules, many of which take place during time periods not shown in the (*) AM and PM headways based on peak hour service.) AM and PM headways based on peak hour service.(*) The percentage change in revenue seat miles is based on the percentage change in revenue trips from the present The table below shows the headways for three selected peak time periods of limited duration during the day.It does not necessarily reflect all changes in the schedules, many of which take place during time periods not shown in the (*) AM and PM headways based on peak hour service.) AM and PM headways based on peak hour service.(*) The percentage change in revenue seat miles is based on the percentage change in revenue trips from the present The table below shows the headways for three selected peak time periods of limited duration during the day.It does not necessarily reflect all changes in the schedules, many of which take place during time periods not shown in the (*) AM and PM headways based on peak hour service.) AM and PM headways based on peak hour service.(*) Weekday AM and PM headways based on peak hour service; Weekday midday headways based on 11AM-1PM; Weekend AM , midday, and PM headways based on 6AM-10AM , The table below shows the headways for three selected peak time periods of limited duration during the day.It does not necessarily reflect all changes in the schedules, many of which take place during time periods not shown in the (*) AM and PM headways based on peak hour service.) AM and PM headways based on peak hour service.(*) Weekday AM and PM headways based on peak hour service; Weekday midday headways based on 11AM-1PM; Weekend AM , midday, and PM headways based on 6AM-10AM , The table below shows the headways for three selected peak time periods of limited duration during the day.It does not necessarily reflect all changes in the schedules, many of which take place during time periods not shown in the (*) AM and PM headways based on peak hour service.) AM and PM headways based on peak hour service.(*) Weekday AM and PM headways based on peak hour service; Weekend AM and PM headways based on 6AM-10AM and 3PM-7PM.The table below shows the headways for three selected peak time periods of limited duration during the day.It does not necessarily reflect all changes in the schedules, many of which take place during time periods not shown in the (*) AM and PM headways based on peak hour service.) AM and PM headways based on peak hour service.(*) Weekday AM and PM headways based on peak hour service; Weekday midday headways based on 11AM-1PM; Weekend AM , midday, and PM headways based on 6AM-10AM , The table below shows the headways for three selected peak time periods of limited duration during the day.It does not necessarily reflect all changes in the schedules, many of which take place during time periods not shown in the (*) AM and PM headways based on peak hour service.) AM and PM headways based on peak hour service.(*) Weekday AM and PM headways based on peak hour service; Weekend AM and PM headways based on 6AM-10AM and 3PM-7PM.The table below shows the headways for three selected peak time periods of limited duration during the day.It does not necessarily reflect all changes in the schedules, many of which take place during time periods not shown in the (*) AM and PM headways based on peak hour service.) AM and PM headways based on peak hour service.(*) Weekday AM and PM headways based on peak hour service; Weekend AM and PM headways based on 6AM-10AM and 3PM-7PM.The table below shows the headways for three selected peak time periods of limited duration during the day.It does not necessarily reflect all changes in the schedules, many of which take place during time periods not shown in the (*) AM and PM headways based on peak hour service.) AM and PM headways based on peak hour service.The table below shows the headways for three selected peak time periods of limited duration during the day.It does not necessarily reflect all changes in the schedules, many of which take place during time periods not shown in the (*) Weekday AM and PM headways based on peak hour service; Weekend AM and PM headways based on 6AM-10AM and 3PM-7PM.The table below shows the headways for three selected peak time periods of limited duration during the day.It does not necessarily reflect all changes in the schedules, many of which take place during time periods not shown in the (*) AM and PM headways based on peak hour service.) AM and PM headways based on peak hour service.(*) Weekday AM and PM headways based on peak hour service; Weekend AM and PM headways based on 6AM-10AM and 3PM-7PM.The table below shows the headways for three selected peak time periods of limited duration during the day.It does not necessarily reflect all changes in the schedules, many of which take place during time periods not shown in the (*) AM and PM headways based on peak hour service.) AM and PM headways based on peak hour service.(*) Weekday AM and PM headways based on peak hour service; Weekend AM and PM headways based on 6AM-10AM and 3PM-7PM.The table below shows the headways for three selected peak time periods of limited duration during the day.It does not necessarily reflect all changes in the schedules, many of which take place during time periods not shown in the (*) AM and PM headways based on peak hour service.) AM and PM headways based on peak hour service.The table below shows the headways for three selected peak time periods of limited duration during the day.It does not necessarily reflect all changes in the schedules, many of which take place during time periods not shown in the The table below shows the headways for three selected peak time periods of limited duration during the day.It does not necessarily reflect all changes in the schedules, many of which take place during time periods not shown in the The table below shows the headways for three selected peak time periods of limited duration during the day.It does not necessarily reflect all changes in the schedules, many of which take place during time periods not shown in the The table below shows the headways for three selected peak time periods of limited duration during the day.It does not necessarily reflect all changes in the schedules, many of which take place during time periods not shown in the The table below shows the headways for three selected peak time periods of limited duration during the day.It does not necessarily reflect all changes in the schedules, many of which take place during time periods not shown in the The table below shows the headways for three selected peak time periods of limited duration during the day.It does not necessarily reflect all changes in the schedules, many of which take place during time periods not shown in the (*) Weekday AM and PM headways based on peak hour service; Weekend AM and PM headways based on 6AM-10AM and 3PM-7PM.The table below shows the headways for three selected peak time periods of limited duration during the day.It does not necessarily reflect all changes in the schedules, many of which take place during time periods not shown in the (*) AM and PM headways based on peak hour service.) AM and PM headways based on peak hour service.(*) Weekday AM and PM headways based on peak hour service; Weekend AM and PM headways based on 6AM-10AM and 3PM-7PM.The table below shows the headways for three selected peak time periods of limited duration during the day.It does not necessarily reflect all changes in the schedules, many of which take place during time periods not shown in the ( The table below shows the headways for three selected peak time periods of limited duration during the day.It does not necessarily reflect all changes in the schedules, many of which take place during time periods not shown in the The table below shows the headways for three selected peak time periods of limited duration during the day.It does not necessarily reflect all changes in the schedules, many of which take place during time periods not shown in the The table below shows the headways for three selected peak time periods of limited duration during the day.It does not necessarily reflect all changes in the schedules, many of which take place during time periods not shown in the The table below shows the headways for three selected peak time periods of limited duration during the day.It does not necessarily reflect all changes in the schedules, many of which take place during time periods not shown in the The table below shows the headways for three selected peak time periods of limited duration during the day.It does not necessarily reflect all changes in the schedules, many of which take place during time periods not shown in the The table below shows the headways for three selected peak time periods of limited duration during the day.It does not necessarily reflect all changes in the schedules, many of which take place during time periods not shown in the The table below shows the headways for three selected peak time periods of limited duration during the day.It does not necessarily reflect all changes in the schedules, many of which take place during time periods not shown in the The table below shows the headways for three selected peak time periods of limited duration during the day.It does not necessarily reflect all changes in the schedules, many of which take place during time periods not shown in the The table below shows the headways for three selected peak time periods of limited duration during the day.It does not necessarily reflect all changes in the schedules, many of which take place during time periods not shown in the The table below shows the headways and percent of guideline capacity at the maximum load point for four selected one hour time periods during the service day. It does not necessarily reflect all The table below shows the headways and percent of guideline capacity at the maximum load point for four selected one hour time periods during the service day. It does not necessarily reflect all The table below shows the headways and percent of guideline capacity at the maximum load point for four selected one hour time periods during the service day. It does not necessarily reflect all (*) Local bus guidelines call for standees during peak periods and up to a seated load during non-peak periods. Express bus guidelines call for up to a seated load at all times. Weekday AM and PM peak The tables below show the headways and percent of guideline capacity at the maximum load point for four selected one hour time periods during the service day. It does not necessarily reflect all The tables below show the headways and percent of guideline capacity at the maximum load point for four selected one hour time periods during the service day. It does not necessarily reflect all (*)
(
Master Page # 235 of 242 - N
ew Y
ork City Transit and B
us Com
mittee M
eeting 7/23/2018________________________________________________________________________________
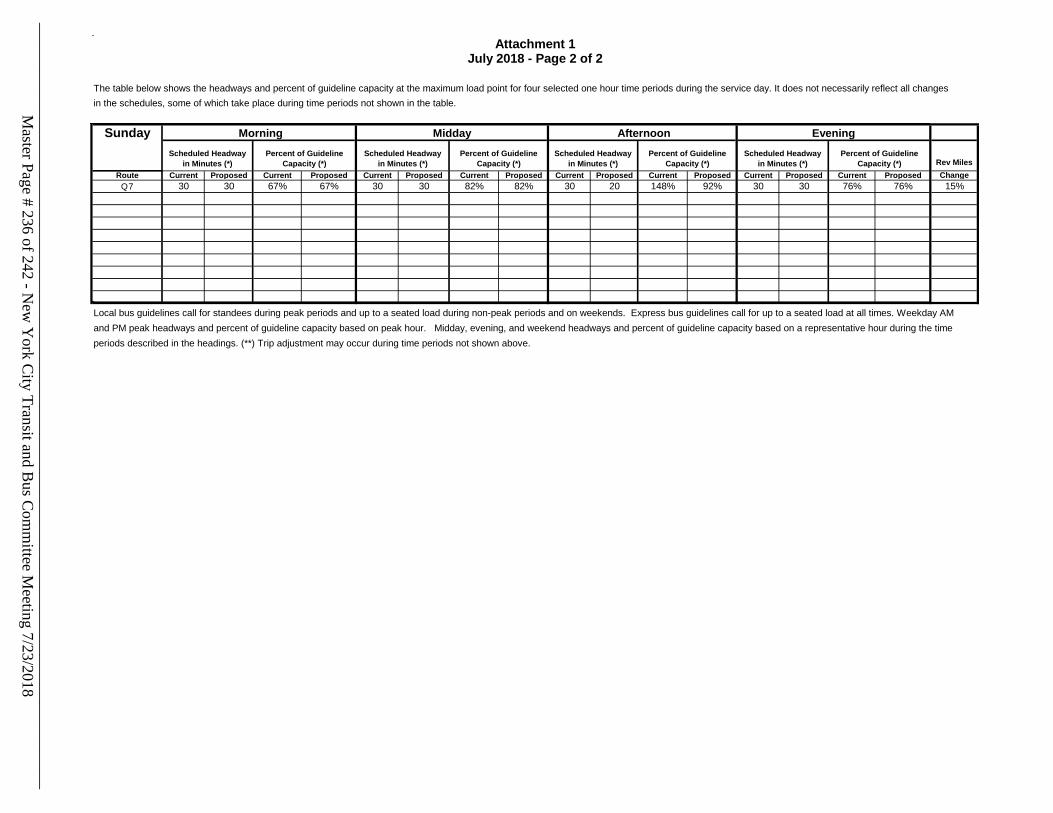
The table below shows the headways and percent of guideline capacity at the maximum load point for four selected one hour time periods during the service day. It does not necessarily reflect all changes
in the schedules, some of which take place during time periods not shown in the table.
Sunday
Rev Miles
Route Current Proposed Current Proposed Current Proposed Current Proposed Current Proposed Current Proposed Current Proposed Current Proposed Change
Q7 30 30 67% 67% 30 30 82% 82% 30 20 148% 92% 30 30 76% 76% 15%
Local bus guidelines call for standees during peak periods and up to a seated load during non-peak periods and on weekends. Express bus guidelines call for up to a seated load at all times. Weekday AM
and PM peak headways and percent of guideline capacity based on peak hour. Midday, evening, and weekend headways and percent of guideline capacity based on a representative hour during the time
periods described in the headings. (**) Trip adjustment may occur during time periods not shown above.
Scheduled Headway
in Minutes (*)
Percent of Guideline
Capacity (*)
Scheduled Headway
in Minutes (*)
Percent of Guideline
Capacity (*)
Scheduled Headway
in Minutes (*)
Percent of Guideline
Capacity (*)
Scheduled Headway
in Minutes (*)
Percent of Guideline
Capacity (*)
Morning Midday Afternoon Evening
July 2018 - Page 2 of 2Attachment 1
(*) Weekday AM and PM headways based on peak hour. Weekend AM headways based on 8 AM - 9 AM; Weekend PM headways base on 5 PM -6 PM; Evening express
(*) AM and PM headways based on peak hour service.) AM and PM headways based on peak hour service.The table below shows the headways for three selected peak time periods of limited duration during the day.It does not necessarily reflect all changes in the schedules, many of which take place during time periods not shown in the (*) Weekday AM and PM headways based on peak hour. The percentage change in revenue seat miles is based on the percentage change in revenue trips from the present The table below shows the headways for three selected peak time periods of limited duration during the day.It does not necessarily reflect all changes in the schedules, many of which take place during time periods not shown in the (*) AM and PM headways based on peak hour service.) AM and PM headways based on peak hour service.(*) Weekday AM and PM headways based on peak hour. The percentage change in revenue seat miles is based on the percentage change in revenue trips from the present The table below shows the headways for three selected peak time periods of limited duration during the day.It does not necessarily reflect all changes in the schedules, many of which take place during time periods not shown in the (*) AM and PM headways based on peak hour service.) AM and PM headways based on peak hour service.(*) Weekday AM and PM headways based on peak hour. The percentage change in revenue seat miles is based on the percentage change in revenue trips from the present The table below shows the headways for three selected peak time periods of limited duration during the day.It does not necessarily reflect all changes in the schedules, many of which take place during time periods not shown in the (*) AM and PM headways based on peak hour service.) AM and PM headways based on peak hour service.(*) The percentage change in revenue seat miles is based on the percentage change in revenue trips from the present The table below shows the headways for three selected peak time periods of limited duration during the day.It does not necessarily reflect all changes in the schedules, many of which take place during time periods not shown in the (*) AM and PM headways based on peak hour service.) AM and PM headways based on peak hour service.(*) The percentage change in revenue seat miles is based on the percentage change in revenue trips from the present The table below shows the headways for three selected peak time periods of limited duration during the day.It does not necessarily reflect all changes in the schedules, many of which take place during time periods not shown in the (*) AM and PM headways based on peak hour service.) AM and PM headways based on peak hour service.(*) The percentage change in revenue seat miles is based on the percentage change in revenue trips from the present The table below shows the headways for three selected peak time periods of limited duration during the day.It does not necessarily reflect all changes in the schedules, many of which take place during time periods not shown in the (*) AM and PM headways based on peak hour service.) AM and PM headways based on peak hour service.(*) The percentage change in revenue seat miles is based on the percentage change in revenue trips from the present The table below shows the headways for three selected peak time periods of limited duration during the day.It does not necessarily reflect all changes in the schedules, many of which take place during time periods not shown in the (*) AM and PM headways based on peak hour service.) AM and PM headways based on peak hour service.(*) The percentage change in revenue seat miles is based on the percentage change in revenue trips from the present The table below shows the headways for three selected peak time periods of limited duration during the day.It does not necessarily reflect all changes in the schedules, many of which take place during time periods not shown in the (*) AM and PM headways based on peak hour service.) AM and PM headways based on peak hour service.(*) The percentage change in revenue seat miles is based on the percentage change in revenue trips from the present The table below shows the headways for three selected peak time periods of limited duration during the day.It does not necessarily reflect all changes in the schedules, many of which take place during time periods not shown in the (*) AM and PM headways based on peak hour service.) AM and PM headways based on peak hour service.(*) The percentage change in revenue seat miles is based on the percentage change in revenue trips from the present The table below shows the headways for three selected peak time periods of limited duration during the day.It does not necessarily reflect all changes in the schedules, many of which take place during time periods not shown in the (*) AM and PM headways based on peak hour service.) AM and PM headways based on peak hour service.(*) The percentage change in revenue seat miles is based on the percentage change in revenue trips from the present The table below shows the headways for three selected peak time periods of limited duration during the day.It does not necessarily reflect all changes in the schedules, many of which take place during time periods not shown in the (*) AM and PM headways based on peak hour service.) AM and PM headways based on peak hour service.(*) Weekday AM and PM headways based on peak hour service; Weekday midday headways based on 11AM-1PM; Weekend AM , midday, and PM headways based on 6AM-10AM , The table below shows the headways for three selected peak time periods of limited duration during the day.It does not necessarily reflect all changes in the schedules, many of which take place during time periods not shown in the (*) AM and PM headways based on peak hour service.) AM and PM headways based on peak hour service.(*) Weekday AM and PM headways based on peak hour service; Weekday midday headways based on 11AM-1PM; Weekend AM , midday, and PM headways based on 6AM-10AM , The table below shows the headways for three selected peak time periods of limited duration during the day.It does not necessarily reflect all changes in the schedules, many of which take place during time periods not shown in the (*) AM and PM headways based on peak hour service.) AM and PM headways based on peak hour service.(*) Weekday AM and PM headways based on peak hour service; Weekend AM and PM headways based on 6AM-10AM and 3PM-7PM.The table below shows the headways for three selected peak time periods of limited duration during the day.It does not necessarily reflect all changes in the schedules, many of which take place during time periods not shown in the (*) AM and PM headways based on peak hour service.) AM and PM headways based on peak hour service.(*) Weekday AM and PM headways based on peak hour service; Weekday midday headways based on 11AM-1PM; Weekend AM , midday, and PM headways based on 6AM-10AM , The table below shows the headways for three selected peak time periods of limited duration during the day.It does not necessarily reflect all changes in the schedules, many of which take place during time periods not shown in the (*) AM and PM headways based on peak hour service.) AM and PM headways based on peak hour service.(*) Weekday AM and PM headways based on peak hour service; Weekend AM and PM headways based on 6AM-10AM and 3PM-7PM.The table below shows the headways for three selected peak time periods of limited duration during the day.It does not necessarily reflect all changes in the schedules, many of which take place during time periods not shown in the (*) AM and PM headways based on peak hour service.) AM and PM headways based on peak hour service.(*) Weekday AM and PM headways based on peak hour service; Weekend AM and PM headways based on 6AM-10AM and 3PM-7PM.The table below shows the headways for three selected peak time periods of limited duration during the day.It does not necessarily reflect all changes in the schedules, many of which take place during time periods not shown in the (*) AM and PM headways based on peak hour service.) AM and PM headways based on peak hour service.The table below shows the headways for three selected peak time periods of limited duration during the day.It does not necessarily reflect all changes in the schedules, many of which take place during time periods not shown in the (*) Weekday AM and PM headways based on peak hour service; Weekend AM and PM headways based on 6AM-10AM and 3PM-7PM.The table below shows the headways for three selected peak time periods of limited duration during the day.It does not necessarily reflect all changes in the schedules, many of which take place during time periods not shown in the (*) AM and PM headways based on peak hour service.) AM and PM headways based on peak hour service.(*) Weekday AM and PM headways based on peak hour service; Weekend AM and PM headways based on 6AM-10AM and 3PM-7PM.The table below shows the headways for three selected peak time periods of limited duration during the day.It does not necessarily reflect all changes in the schedules, many of which take place during time periods not shown in the (*) AM and PM headways based on peak hour service.) AM and PM headways based on peak hour service.(*) Weekday AM and PM headways based on peak hour service; Weekend AM and PM headways based on 6AM-10AM and 3PM-7PM.The table below shows the headways for three selected peak time periods of limited duration during the day.It does not necessarily reflect all changes in the schedules, many of which take place during time periods not shown in the (*) AM and PM headways based on peak hour service.) AM and PM headways based on peak hour service.The table below shows the headways for three selected peak time periods of limited duration during the day.It does not necessarily reflect all changes in the schedules, many of which take place during time periods not shown in the The table below shows the headways for three selected peak time periods of limited duration during the day.It does not necessarily reflect all changes in the schedules, many of which take place during time periods not shown in the The table below shows the headways for three selected peak time periods of limited duration during the day.It does not necessarily reflect all changes in the schedules, many of which take place during time periods not shown in the The table below shows the headways for three selected peak time periods of limited duration during the day.It does not necessarily reflect all changes in the schedules, many of which take place during time periods not shown in the The table below shows the headways for three selected peak time periods of limited duration during the day.It does not necessarily reflect all changes in the schedules, many of which take place during time periods not shown in the The table below shows the headways for three selected peak time periods of limited duration during the day.It does not necessarily reflect all changes in the schedules, many of which take place during time periods not shown in the (*) Weekday AM and PM headways based on peak hour service; Weekend AM and PM headways based on 6AM-10AM and 3PM-7PM.The table below shows the headways for three selected peak time periods of limited duration during the day.It does not necessarily reflect all changes in the schedules, many of which take place during time periods not shown in the (*) AM and PM headways based on peak hour service.) AM and PM headways based on peak hour service.. The table below shows the headways for three selected peak time periods of limited duration during the day.It does not necessarily reflect all changes in the schedules, many of which take place during time periods not shown in the ( The table below shows the headways for three selected peak time periods of limited duration during the day.It does not necessarily reflect all changes in the schedules, many of which take place during time periods not shown in the The table below shows the headways for three selected peak time periods of limited duration during the day.It does not necessarily reflect all changes in the schedules, many of which take place during time periods not shown in the The table below shows the headways for three selected peak time periods of limited duration during the day.It does not necessarily reflect all changes in the schedules, many of which take place during time periods not shown in the The table below shows the headways for three selected peak time periods of limited duration during the day.It does not necessarily reflect all changes in the schedules, many of which take place during time periods not shown in the The table below shows the headways for three selected peak time periods of limited duration during the day.It does not necessarily reflect all changes in the schedules, many of which take place during time periods not shown in the The table below shows the headways for three selected peak time periods of limited duration during the day.It does not necessarily reflect all changes in the schedules, many of which take place during time periods not shown in the The table below shows the headways for three selected peak time periods of limited duration during the day.It does not necessarily reflect all changes in the schedules, many of which take place during time periods not shown in the The table below shows the headways for three selected peak time periods of limited duration during the day.It does not necessarily reflect all changes in the schedules, many of which take place during time periods not shown in the The table below shows the headways for three selected peak time periods of limited duration during the day.It does not necessarily reflect all changes in the schedules, many of which take place during time periods not shown in the The table below shows the headways and percent of guideline capacity at the maximum load point for four selected one hour time periods during the service day. It does not necessarily reflect all The tables below show the headways and percent of guideline capacity at the maximum load point for four selected one hour time periods during the service day. It does not necessarily reflect all
((((((
Master Page # 236 of 242 - N
ew Y
ork City Transit and B
us Com
mittee M
eeting 7/23/2018________________________________________________________________________________
Standard Follow-Up Reports: May 2018 MetroCard Report
This report was created to document monthly trends of Automated Fare Collection (AFC) payments from various sources offering internal or external MetroCard sales. Payment mechanisms are reported for revenue received from debit/credit, electronic settlements and cash transactions from automated sales.
Alan F. Putre New Fare Payment Program Executive Director (MTA) and VP & Chief Revenue Officer (NYCT)
Master Page # 237 of 242 - New York City Transit and Bus Committee Meeting 7/23/2018________________________________________________________________________________
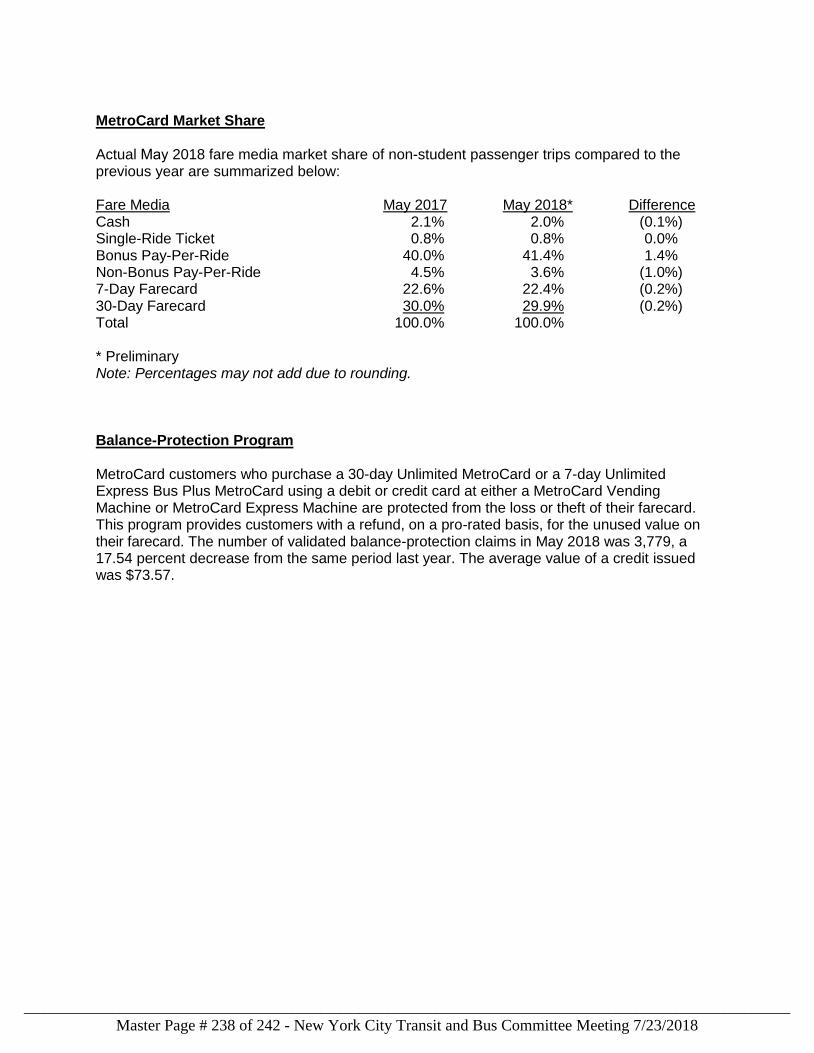
MetroCard Market Share
Actual May 2018 fare media market share of non-student passenger trips compared to the previous year are summarized below:
Fare Media May 2017 May 2018* Difference Cash 2.1% 2.0% (0.1%) Single-Ride Ticket 0.8% 0.8% 0.0% Bonus Pay-Per-Ride 40.0% 41.4% 1.4% Non-Bonus Pay-Per-Ride 4.5% 3.6% (1.0%) 7-Day Farecard 22.6% 22.4% (0.2%) 30-Day Farecard 30.0% 29.9% (0.2%) Total 100.0% 100.0%
* PreliminaryNote: Percentages may not add due to rounding.
Balance-Protection Program
MetroCard customers who purchase a 30-day Unlimited MetroCard or a 7-day Unlimited Express Bus Plus MetroCard using a debit or credit card at either a MetroCard Vending Machine or MetroCard Express Machine are protected from the loss or theft of their farecard. This program provides customers with a refund, on a pro-rated basis, for the unused value on their farecard. The number of validated balance-protection claims in May 2018 was 3,779, a 17.54 percent decrease from the same period last year. The average value of a credit issued was $73.57.
Master Page # 238 of 242 - New York City Transit and Bus Committee Meeting 7/23/2018________________________________________________________________________________
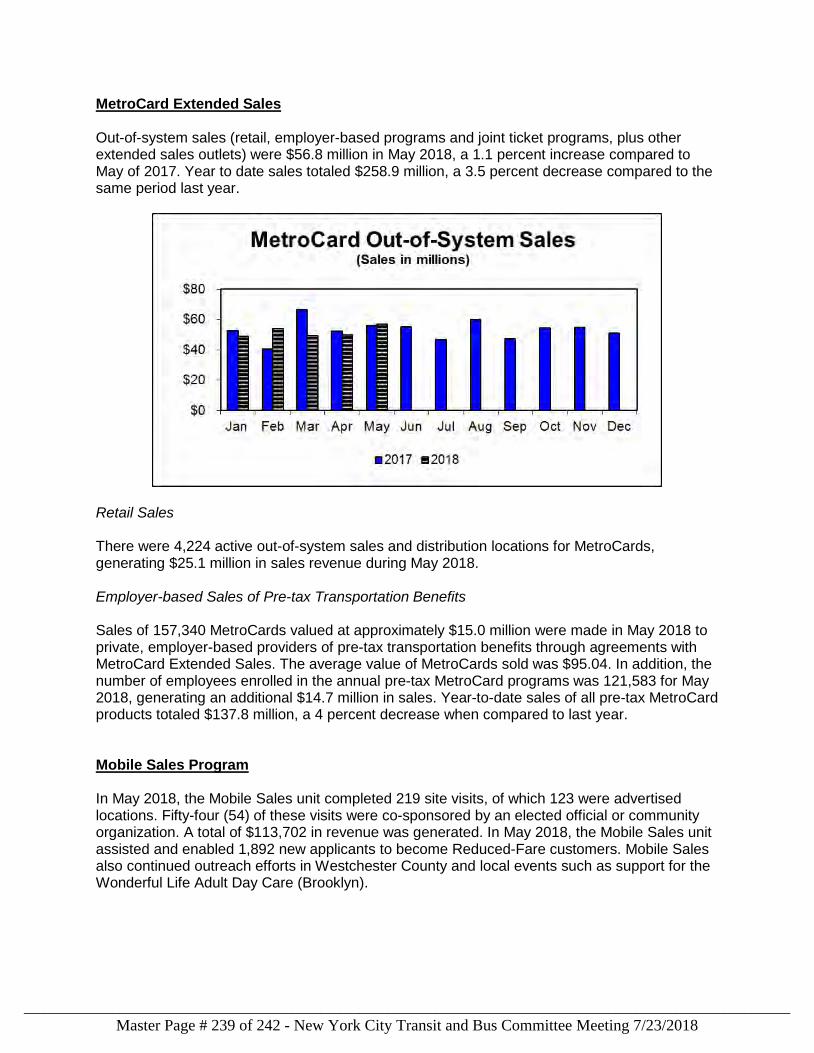
MetroCard Extended Sales Out-of-system sales (retail, employer-based programs and joint ticket programs, plus other extended sales outlets) were $56.8 million in May 2018, a 1.1 percent increase compared to May of 2017. Year to date sales totaled $258.9 million, a 3.5 percent decrease compared to the same period last year.
Retail Sales There were 4,224 active out-of-system sales and distribution locations for MetroCards, generating $25.1 million in sales revenue during May 2018. Employer-based Sales of Pre-tax Transportation Benefits Sales of 157,340 MetroCards valued at approximately $15.0 million were made in May 2018 to private, employer-based providers of pre-tax transportation benefits through agreements with MetroCard Extended Sales. The average value of MetroCards sold was $95.04. In addition, the number of employees enrolled in the annual pre-tax MetroCard programs was 121,583 for May 2018, generating an additional $14.7 million in sales. Year-to-date sales of all pre-tax MetroCard products totaled $137.8 million, a 4 percent decrease when compared to last year. Mobile Sales Program In May 2018, the Mobile Sales unit completed 219 site visits, of which 123 were advertised locations. Fifty-four (54) of these visits were co-sponsored by an elected official or community organization. A total of $113,702 in revenue was generated. In May 2018, the Mobile Sales unit assisted and enabled 1,892 new applicants to become Reduced-Fare customers. Mobile Sales also continued outreach efforts in Westchester County and local events such as support for the Wonderful Life Adult Day Care (Brooklyn).
Master Page # 239 of 242 - New York City Transit and Bus Committee Meeting 7/23/2018________________________________________________________________________________
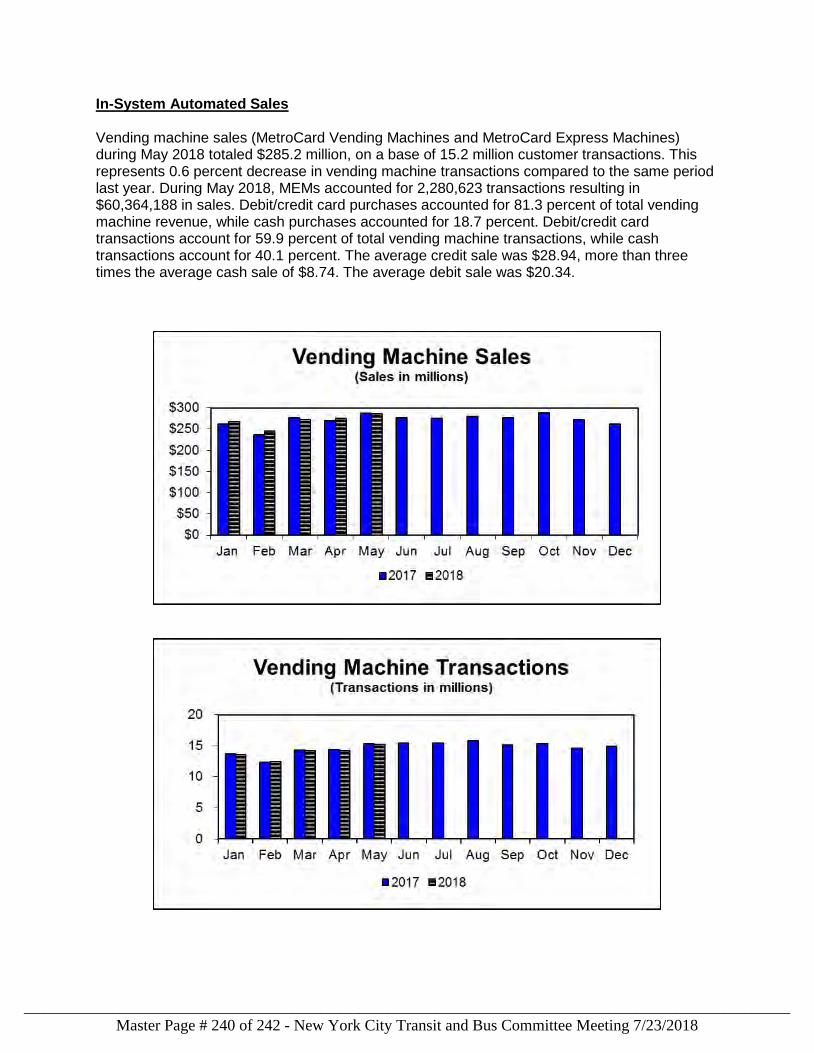
In-System Automated Sales Vending machine sales (MetroCard Vending Machines and MetroCard Express Machines) during May 2018 totaled $285.2 million, on a base of 15.2 million customer transactions. This represents 0.6 percent decrease in vending machine transactions compared to the same period last year. During May 2018, MEMs accounted for 2,280,623 transactions resulting in $60,364,188 in sales. Debit/credit card purchases accounted for 81.3 percent of total vending machine revenue, while cash purchases accounted for 18.7 percent. Debit/credit card transactions account for 59.9 percent of total vending machine transactions, while cash transactions account for 40.1 percent. The average credit sale was $28.94, more than three times the average cash sale of $8.74. The average debit sale was $20.34.
Master Page # 240 of 242 - New York City Transit and Bus Committee Meeting 7/23/2018________________________________________________________________________________
Reduced-Fare Program During May 2018, enrollment in the Reduced-Fare Program increased by 6,207 new customers. The total number of customers in the program is 1,147,214. Seniors account for 954,229 or 83 percent of the total Reduced-Fare customer base. Persons with disabilities comprise the remaining 17 percent or 192,985 customers. Of those, a total of 40,470 customers were enrolled in the program under the criterion of persons diagnosed with serious mental illness who receive Supplemental Security Income (SSI) benefits. Active Reduced-Fare customers added approximately $9.1 million in value to their farecards during the month. EasyPay Reduced Fare Program In May 2018, the EasyPay Reduced Fare program enrollment totaled 177,469 accounts. During the month, active EasyPay customers accounted for approximately 2.6 million subway and bus rides with $2.7 million charged to their accounts. Each active account averaged 29 trips per month, with an average monthly bill of $15. EasyPay Xpress Pay-Per-Ride Program In May 2018, enrollment in the EasyPay Xpress PPR program totaled 117,036 accounts. During that month, active Xpress PPR customers accounted for approximately 2.1 million subway, express bus and local bus rides with $5.7 million charged to their accounts. Each active account averaged 23 trips per month, with an average monthly bill of $62. EasyPay Xpress Unlimited Program In May 2018, enrollment in the EasyPay Xpress Unlimited program totaled 24,072 accounts. During that month, active Xpress Unlimited customers accounted for approximately 1.1 million subway and local bus rides with $2.4 million charged to their accounts. Each active account averaged 51 trips per month with a fixed monthly bill of $121.00.
Master Page # 241 of 242 - New York City Transit and Bus Committee Meeting 7/23/2018________________________________________________________________________________
MN
Andy ByfordPresident
New York City Transit2 Broadway
New York, NY 10004-2207
Master Page # 242 of 242 - New York City Transit and Bus Committee Meeting 7/23/2018________________________________________________________________________________
Related Documents