Commitment and Lapse Behavior in Long-Term Insurance: A Case Study Jean Pinquet, Montserrat Guill´ en, Mercedes Ayuso To cite this version: Jean Pinquet, Montserrat Guill´ en, Mercedes Ayuso. Commitment and Lapse Behavior in Long- Term Insurance: A Case Study. The Journal of Risk and Insurance, 2011, 78 (4), pp.983-1002. <10.1111/j.1539-6975.2011.01420.x>. <hal-00374303v2> HAL Id: hal-00374303 https://hal.archives-ouvertes.fr/hal-00374303v2 Submitted on 1 Dec 2010 HAL is a multi-disciplinary open access archive for the deposit and dissemination of sci- entific research documents, whether they are pub- lished or not. The documents may come from teaching and research institutions in France or abroad, or from public or private research centers. L’archive ouverte pluridisciplinaire HAL, est destin´ ee au d´ epˆ ot et ` a la diffusion de documents scientifiques de niveau recherche, publi´ es ou non, ´ emanant des ´ etablissements d’enseignement et de recherche fran¸cais ou ´ etrangers, des laboratoires publics ou priv´ es.

Welcome message from author
This document is posted to help you gain knowledge. Please leave a comment to let me know what you think about it! Share it to your friends and learn new things together.
Transcript

Commitment and Lapse Behavior in Long-Term
Insurance: A Case Study
Jean Pinquet, Montserrat Guillen, Mercedes Ayuso
To cite this version:
Jean Pinquet, Montserrat Guillen, Mercedes Ayuso. Commitment and Lapse Behavior in Long-Term Insurance: A Case Study. The Journal of Risk and Insurance, 2011, 78 (4), pp.983-1002.<10.1111/j.1539-6975.2011.01420.x>. <hal-00374303v2>
HAL Id: hal-00374303
https://hal.archives-ouvertes.fr/hal-00374303v2
Submitted on 1 Dec 2010
HAL is a multi-disciplinary open accessarchive for the deposit and dissemination of sci-entific research documents, whether they are pub-lished or not. The documents may come fromteaching and research institutions in France orabroad, or from public or private research centers.
L’archive ouverte pluridisciplinaire HAL, estdestinee au depot et a la diffusion de documentsscientifiques de niveau recherche, publies ou non,emanant des etablissements d’enseignement et derecherche francais ou etrangers, des laboratoirespublics ou prives.

COMMITMENT AND LAPSE BEHAVIOR IN LONG-TERM
INSURANCE: A CASE STUDY
Jean PINQUET Montserrat GUILLEN
Mercedes AYUSO
First version dated April, 2009
The present version is of November, 2010
Cahier n° 2010-30
ECOLE POLYTECHNIQUE CENTRE NATIONAL DE LA RECHERCHE SCIENTIFIQUE
DEPARTEMENT D'ECONOMIE Route de Saclay
91128 PALAISEAU CEDEX (33) 1 69333033
http://www.enseignement.polytechnique.fr/economie/ mailto:[email protected]

COMMITMENT AND LAPSE BEHAVIOR IN LONG-TERM
INSURANCE: A CASE STUDY
Jean PINQUET1
Montserrat GUILLEN2 Mercedes AYUSO3
November, 2010
Cahier n° 2010-30
Résumé: Cet article présente une étude de cas sur un portefeuille de contrats d'assurance de long terme vendus par une mutuelle d'assurance. Nous décrivons les niveaux de risque, la structure de tarification et les subventions croisées induites sur un portefeuille de contrats incluant trois garanties santé, dépendance et vie entière. Nous mettons en évidence le risque de reclassification à partir de l'historique des épisodes de maladie. Nous analysons le comportement de résiliation et tentons d'expliquer la dynamique observée sur le portefeuille. Enfin, nous tirons des conclusions sur la conception des contrats.
Abstract: This paper presents a case study of a portfolio of individual long-term insurance contracts
sold by a Spanish mutual company. We describe the risk levels, the rating structure and the implied cross-subsidies on a portfolio of policies providing health, life and long-term care insurance. We show evidence of reclassification risk through the history of disability spells. We also analyze the lapse behavior and seek to provide a rationale for the portfolio's dynamics. Lastly, we draw conclusions regarding the design of such contracts.
Classification :. C01, C23, D12. Mots clés : Engagement, risque de reclassification, assurance à long terme.
Key Words : Commitment, reclassification risk, long-term insurance
1 Université Paris 10 et Département d'Economie, Ecole Polytechnique ([email protected]). Jean Pinquet acknowledges financial support from the AXA "Large Risks in Insurance" Chair (France), part of the AXA Research Fund. 2 Universitat Barcelona ([email protected]). Montserrat Guillen acknowledges support from the Spanish Ministry of Science/FEDER grants ECO2010-21787 and ECO2008-01223. 3 Universitat Barcelona ([email protected]). Mercedex Ayuso acknowledges support from the Spanish Ministry of Science/FEDER grants ECO2010-21787 and ECO2008-01223.
1 Introduction
This paper presents a case study of a portfolio of individual long-term insurance
contracts, sold by a Spanish mutual company. The portfolio has been set in a
run-off position - i.e. has been closed to new business - since 1997. Our reasons
for undertaking such an analysis are threefold: a) empirical studies of complex
contracts such as the one studied here are extremely rare; b) commitment and
lapse behavior can be studied here using a data set that includes information
on a portfolio for a period extending over more than two decades; and, c) con-
clusions can be drawn regarding the consequences of closing a portfolio to new
business, while keeping the existing contracts in that portfolio. The contract
comprises a bundle of three coverages for health, long-term care (hereinafter
LTC) and life insurance. The life coverage combines term and whole life insur-
ance. The health coverage is unfunded (i.e., current premiums finance current
benefits, and reserves are set only for claims incurred in the current period).
By contrast, the life and LTC policies exhibit a more complex funding scheme,
which is discussed in more detail below (see Section 4). As is usual with long-
term contracts, there is a one-sided commitment in terms of loyalty. So while
the policyholders can leave the mutual company, the company cannot cancel the
contract. Consequently, the policyholder is insured against reclassification risk,
given that experience rating is also forbidden. However, the insurer is not com-
mitted to a long-term premium scheme, and the average premium level follows
the average loss trend in an unfunded setting. If the premium-benefit ratio only
depends on calendar time, the insurance company follows a "community rating"
strategy.
Risks related to disability and death increase with age, but are also subject
to marked cohort effects. Due to mortality improvements, insurance companies
benefit from these effects as regards death benefit insurance (whether term life or
whole life insurance). However, as a result of aging, long-term care risk increases
with calendar time. An insurance company’s natural hedge against uncertainty
in the Knightian sense is not to commit itself to a long-term premium scheme.
In our study, short-term risks increase with age much more rapidly than do
the corresponding premiums. Besides, gender is not taken into account. These
characteristics entail strong cross-subsidies between genders and generations.
The difference between the insurance premium and the corresponding risk level
is a subsidy in an unfunded setting, and a savings in a funded scheme. For
sake of simplicity, we will use the first terminology in this paper, although two
of the three components in the bundle do incorporate some funding. Finally,
2
there is a surrender value associated with the death benefit component, but none
associated with the LTC coverage.
The article is organized as follows. Section 2 reviews the literature on long-
term insurance. Section 3 describes the insurance contract, and the portfolio
analyzed in the empirical study. The database contains 150,000 individual in-
surance contracts with a history of up to thirty years. Related variables include
the purchase date, the history of disability spells (with their respective initiation
and termination dates), and the date of entry in an LTC spell for permanently
disabled policyholders. We have the cancellation date of closed contracts and
the related cause (death or lapse at the initiative of the policyholder). This sec-
tion also provides an outline of the economic framework, and more specifically
the evolution in public and private health insurance in Spain. The three risks
covered by the insurance bundle are described in Section 4. Our study focuses
on health risk, given that life risk is well known and LTC risk for this portfolio
is analyzed in a previous paper (Guillén and Pinquet, 2008). A further reason
is that the history of disability spells is key in the learning on a policyholder’s
health status, and hence may help explain lapsation behavior. We show evi-
dence of reclassification risk through the history of disability spells. We link the
rating structure of life and health policies, depending on the nature of funding
(fully funded, unfunded with or without cross-subsidies between age classes) to
three variables (calendar time, seniority in the portfolio, age at inception of the
contract). We then analyze the rating structure of the mutual company. We
find that the company follows a strict "community rating" strategy for its health
coverage, and that young policyholders heavily subsidize the older policyholders
for all the guarantees.
Losses incurred by lapses can be high for front-loaded contracts without
surrender value. This is the case for most LTC policies, andmotivates an analysis
of lapse behavior.1 The average lapse rate of LTC contracts stands at 7% in the
US (Society of Actuaries, 2002). Lapse rates can be even higher if policyholders
are enrolled in the contract, as in the "ElderShield" program in Singapore.2 In
a given cohort of LTC insurance purchasers, a majority will thus end their life
cycle without coverage, while the probability of entering an LTC spell before
dying increases with age. We provide empirical evidence on the lapse behavior
1For instance, fewer than 3% of the US policies analyzed by Brown and Finkelstein (2007)
provide any benefits once a policy lapses.2In 2002, a mandatory LTC coverage was introduced for Singaporeans aged between 40
and 70. The opt-out option was retained by just 15% of this population. However, the lapse
rate stood at 38% during the first year. It subsequently fell, but remained at 14% in 2006.
3
in Section 5, and seek to provide a rationale for the results. We find that
policyholders who cancel their contract have good health histories compared to
those of their peers, and that the lapse rate decreases with age, with a local
peak at 65 years. We argue that lapsation of young policyholders as well as
that of elderly policyholders at retirement is partly due to a misunderstanding
of the contract. We also discuss the fact that the portfolio avoids the "death
spiral" that might have been expected after the run-off decision taken in 1997,
caused by the continuous departure of the youngest policyholders. In Section 6,
we summarize our results and discuss the design of long-term contracts.
2 A review of the literature on long-term in-
surance
Issues related to commitment, cross-subsidies between periods and lapse behav-
ior in long-term insurance contracts have already been addressed extensively
in the economic literature. Cross-subsidies between the periods of a contract
are termed as either "lowballing" or "highballing", depending on whether the
first periods are subsidized by the following ones, or the contrary. Some studies
adopt alternative terminology and speak of "back-loading" and "front-loading"
respectively. The contracts analyzed in this article are of the "front-loading"
type. Young policyholders, although they pay less than the older ones, heavily
subsidize them as will be shown in Section 4. "Lowballing" in insurance con-
tracts may occur when the insurer extracts a rent from the policyholder based
on its use of private information (Kunreuther and Pauly, 1985).3 In our data-
base, such information can be obtained from the history of disability spells, but
experience rating is forbidden in the long-term contract analyzed here. Fluet,
Schlesinger and Fei (2009) discuss multiperiod contracts with an opting-out or
opting-in opportunity, the price of which must be paid in advance. These con-
tracts include front-loading and are of interest when the motivation to insure
varies over time. As argued by Pauly, Kunreuther and Hirth (1995), risks that
evolve unpredictably (such as those related to health and life) are more likely to
be subject to "highballing" and to guaranteed renewability of contracts. Dionne
and Doherty (1994) present a "highballing" two-period model with adverse se-
lection, unilateral switching (i.e. one-sided commitment), and renegotiation. If
3The model is derived in a no-commitment setting, with myopic consumers (i.e. those who
take decisions based on the current contract).
4

the insurer commits to a premium scheme in the second period with experience
rating, low risks can choose this type of contract rather than a short-term one.
Closer to our setting is the study undertaken by Hendel and Lizzeri (2003) who
empirically analyze term life insurance linked to a model with symmetric learn-
ing, one-sided commitment and buyer heterogeneity in the cost of front-loading.
Their model predicts that lapse rates decrease with the level of front-loading, as
does the average risk in the second period, because lapses affect the lowest risk
levels reached after reclassification.4 This result is confirmed empirically by the
average premiums observed in the USA for three types of term life insurance
contracts (either with yearly updated premiums, or with levels in premiums and
front-loading, or with state contingent prices).
Lapses in long-term insurance contracts strongly influence the ex post balance
of the coverage, as the surrender value, if it exists at all, is often very low
compared to a retrospective actuarial value.5 Based on a statistical study of
American long-term care contracts, Brown and Finkelstein (2007, 2009) derive
a virtual loading factor equal to 0.18 when the policies are held until death,
whereas the actual loading factor (i.e. when lapses are accounted for) is equal to
0.516. Besides, the losses incurred by lapsing deter policyholders from switching
to another contract, and a locked-in customer faces higher intermediation costs.
Loading factors also reflect increasing returns to scale with respect to the size
of the insured groups. As for health insurance, Diamond (1992) mentions a 40
percent loading factor for groups of five or fewer, and a 5.5 percent loading factor
for groups of 10,000 or more. In our portfolio of individual policies, the loading
factor is, unsurprisingly, closer to the first figure quoted by Diamond.
Policyholders may lapse for reasons related to risk: Finkelstein, McGarry
and Sufi (2005) estimate that the participants on the Health and Retirement
Survey who allowed their LTC policy to lapse are later 35 percent less risky
than their peers with respect to LTC risk at a five-year horizon.7 This dynamic
4In a two-period model, the surplus generated by front-loading in optimal contracts sub-
sidizes the policyholders that reach high risk levels after reclassification. Policyholders in the
lowest risk levels after reclassification are rated at the spot price so as to deter them from
lapsing.5An exception is the whole life insurance coverage. Besides, these contracts are assignable,
which allows secondary markets to be created. The associated arrangements are termed "life
settlements" and "viatical settlements". See Doherty, Singer (2002), and Daily, Hendel and
Lizzeri (2008) for the pros and cons of secondary life insurance markets.6Derivations are performed at the horizon of the life cycle and in a funded setting.7This difference could also be explained by a moral hazard effect. However, a comparison
of LTC risk for those who lapse to a new contract versus those who lapse to no contract leads
5
risk-based selection effect lowers the efficiency of insurance against reclassifica-
tion risk. Finkelstein, McGarry and Sufi (2005) also report that individuals who
lapse are substantially poorer and less educated than individuals who do not
lapse. This evidence on wealth suggests that liquidity constraints are another
factor contributing to lapsation. Moreover, this cause of lapsation has unpleas-
ant redistribution effects, as poor policyholders subsidize richer ones. To the best
of our knowledge, comprehensive empirical analyses of the causes of lapsation
in long-term insurance contracts remain unavailable.
Long-term care insurance can also be sold in tandem with an annuity prod-
uct. In a recent special issue of this journal, Webb (2009) analyzes a bundle of
LTC and deferred annuity coverages. In a model with two risk aversion levels
and a link between risk aversion and health status, an equilibrium is possible in
a single market for bundled contracts. The condition is that selection effects for
the two types of risk averse individuals work in opposite directions in the mar-
kets for stand-alone contracts. Murtaugh et al. (2001) examine the implications
of the positive correlation of mortality and disability for the benefits of com-
bining an immediate income annuity with long-term care disability coverage at
retirement ages. They show that combining the two products could reduce the
cost of both coverages and make them available to a greater number of people
by reducing adverse selection in the income annuity and minimizing the need
for medical underwriting for disability coverage. The complementarity between
LTC insurance and annuities also depends on the other assets of the household.
Davidoff (2009) shows that if consumers typically liquidate home equity only in
the event of illness or very old age, then LTC insurance and annuities become
less attractive and may become substitutes rather than complements.8
Finally, let us mention other studies of long-term insurance recently pub-
lished in this journal. McShane and Cox (2009) analyze the participation of
US insurers in the LTC market. They find that participation and volume deci-
sions are made independently. Smoluk (2009) examines the relationship between
long-term disability claim rates and the consumption-to-wealth ratio. Using
cointegration analysis, he finds a decreasing link between these two variables in
a long-run equilibrium setting.
the authors to reject this effect.8The reason is that the marginal utility of wealth drops when an otherwise illiquid home
is sold, an event correlated with the payouts of both annuities and LTC insurance.
6

3 A Spanish portfolio of long-term insurance
contracts
We analyze a sample of 150,000 individual insurance contracts drawn at random
at a fifty percent rate from a mutual insurance company in July 2007. The con-
tracts comprise a bundle of three policies: death benefit insurance, health cover-
age and a long-term care component. The products could be bought separately,
but the bundle was promoted by the company so as to minimize underwrit-
ing costs. No age constraint is applied to the benefits, and all coverages extend
into the policyholders’ whole lifespan regardless of their employment status (em-
ployed, retired or other non-active status). As is typical for long-term contracts,
there is a one-sided commitment in terms of loyalty. The policyholders can leave
the mutual company, but the company cannot cancel the contract. Hence, at-
trition is attributable solely to cancellation at the initiative of the policyholder,
or to death. Due to modifications in the computing environment in 1992, the
contracts that were closed before that date were removed from the database.
Although data are available from 1975, we have restricted our analysis from
1993 to 2006 to contracts that are either working or cancelled after 1992. The
variables related to the history are the purchase date, the start and end dates
of disability spells, and the date of entry in an LTC spell for permanently dis-
abled policyholders. We also record the cancellation date of closed contracts and
the cause (death or lapse at the initiative of the policyholder). Other available
variables include gender, date of birth, and the values for the last premiums
and benefits on each policy. We have no information regarding reserves, which
leads us to question the nature of the funding. In the time dimension, these
data are richer than panel databases such as HRS and SHARE obtained from
successive surveys, but we have far fewer variables.9 Premiums are paid on a
monthly basis, and their average values are 5 Euros for the death benefit, 6.5 for
health coverage and 2.3 for the long-term care component. Disability benefits
are paid daily, whereas benefits related to LTC spells are paid monthly. The
average death benefit for working contracts is equal to 1,600 Euros, and average
monthly benefits for disability and LTC are 75 and 115 Euros respectively. These
9For instance, we do not have any financial data for the household. Besides, we cannot
address issues related to insurance demand from a database of policyholders. We do not know
either whether lapses are followed or not by switching to another contract. HRS and SHARE
are the acronyms for the Health and Retirement Survey, and the Survey of Health, Ageing
and Retirement in Europe, respectively.
7

low premium and benefit levels indicate that the product is merely additional
to the public coverage. They also adapt to the financial means of policyholders
who are young at the inception of the contract (see Table 1). Benefits are in-
dexed to an inflation rate. The ratio premium-benefit varies over time without
precommitment (see Section 4 for results). Benefits and premiums cannot be
modified on an individual basis. This applies to both reasons of risk (experience
rating) and modifications of the coverage level. The insurance package can only
be cancelled completely, and only the death benefit component has a surrender
value. The LTC coverage does not include any nonforfeiture clause (i.e. a right
to receive reduced benefits if the policyholder lapses the contract beyond a given
seniority threshold).
Health coverage works when the policyholder temporarily requires medical
treatment and cannot perform any daily activities. The state of disability is as-
sessed by doctors appointed by the insurance company on the basis of standard
medical and physical tests. There is no connection between the compensation
decision made by the company and those taken by the Public Health and So-
cial Security agencies, concerning workers compensation subsidies or disability
pension. Long-term care covers individuals with a severe dependence level and
who are not able to perform daily life activities without the assistance of an-
other person. Eligibility conditions are particularly strict. The contract defines
eligibility for such coverage as a permanent and irreversible loss of the capacity
to function autonomously due to: irreversible psychotic disorder, hemiplegia,
paraplegia, severe Parkinson disorder, aphasia or Wenicke disorder, or dementia
due to cerebral malfunction. In addition, following the company’s traditional
practices, blindness or loss of two arms or legs are sufficient conditions to grant
compensation. Finally, death benefit is not restricted in any way by the cause
or place of death.
Let us give some details on the origins of this insurance contract. At the
inception of the product, a group of insurance agents decided to set up a fund
that could compensate women facing the untimely death of their husband. Later,
death benefit coverage was extended in order to meet the needs of a policyholder
throughout the life cycle, as seen by the company agents. People underwriting
the product were not called "insured" but "affiliated", a term usually retained
for those enrolled on a social security scheme. This product became popular
among exclusively male workers. Women did not become affiliated until the
70s, given that in Spain they did not participate in the job market before that
date. In this decade, the Spanish government instituted the so-called "Devel-
opment Plans" (Planes de Desarrollo) that fostered social and economic change
8

and allowed women to enter the job market for the first time. A proper public
health and welfare system was also created in the late 70s. Initially, this system
offered health coverage, but later it included disability pensions, unemployment
subsidies and more recently long-term care. Before the creation of the pub-
lic welfare system, mutual companies offered a form of private insurance to a
growing working class. As an example, the mutual company analyzed in this
article had roughly 60,000 affiliates in 1960. This number rose to 170,000 in
1975 and to 250,000 in 1984. The product was originally distributed in Cat-
alonia by the mutual company’s agents. During the 80s, the product was also
sold in other Spanish regions as the company expanded. However, the company
stopped selling the product in 1997, and from that time on, the coverages were
sold separately.
Table 1 shows basic statistics regarding the portfolio dynamics for each cal-
endar year: the average age of policyholders () the average age at entry, at
cancellation and at death ( and ), as well as the corresponding rates
( and as a percentage of the portfolio size).
We observe a steady aging of the portfolio, but the rate and causes of this
aging vary with time. If the variables included in the table were defined in
continuous time, the time derivative of the average age would be equal to
0= 1 + ( − )− ( − )− ( − )
During the first ten years, the age at cancellation is lower on average than the
age of policyholders, which contributes to the aging of the portfolio. The lapse
rate increases when the portfolio is set in a run-off position, and falls thereafter.
The most striking feature of Table 1 is the evolution of age at cancellation once
the portfolio is closed to new business. The average first increases steadily,
then dramatically at the end of the period, which suggests a modification in the
motivations for lapsation.
9

Table 1
Descriptive statistics for the portfolio
Year 1993 45.4 30.2 37.3 68.7 3 4.5 0.6
1994 46 30.9 38.6 69.4 5.4 5.4 0.8
1995 46.4 33.7 37.2 70.4 5.4 6.4 0.8
1996 47.2 37.2 38.8 71.3 7.3 6.7 0.8
1997 48.2 35.7 39.1 71.9 2.3 10.4 0.9
1998 49.9 40.8 72.9 10.1 0.9
1999 51.6 42.7 73.8 8.9 1.1
2000 53.1 46.2 74.5 8.0 1.1
2001 54.2 47.4 74.7 7.3 1.2
2002 55.4 48.4 76.3 7.4 1.4
2003 56.6 51.7 76.9 5.9 1.5
2004 57.2 67.3 77.2 2.4 1.6
2005 57.6 66.3 78.3 2.4 1.7
2006 58.1 64.8 79.1 2.5 1.6
Average age of policyholders, average age at en-
try, at cancellation and at death: ( and
). Entry, cancellation and death rates:
and (expressed as percentage of the portfolio
size)
4 The three coverages: their rating structure,
risk levels, and implied cross-subsidies
4.1 The rating structure
The rating structure of the three components of the insurance package is de-
scribed in Table 2, based on an analysis of the premium-benefit ratio. We
estimate a linear model where the dependent variable is the logarithm of the
premium-benefit ratio and where the covariates are gender, age at the inception
of the contract, the seniority of the policyholder and binary variables related to
the year with available premiums. The first objective is to question the nature
of funding from these ratios, as we do not have any information regarding the
reserves. Life and health risks increase with age, with a stronger age effect for
10

life and LTC risks than for health risk. In this setting, three covariates retained
in the regression (age at the inception of the contract, seniority in the portfolio,
and calendar time) have expected effects on the rating structure which depend
on the type of funding.
• For a fully funded coverage, the main effect is expected from the age at
the inception of the contract. Indeed, the premium-benefit ratio is derived
from an expected balance between discounted premiums and benefits on
the life cycle. Most LTC coverages today are fully funded, and the age at
the inception of the contract is closely related to the expected duration in
good health which is a key factor for the premium-benefit ratio. Calendar
time reflects cohort effects in the risk distributions. In a fully funded
setting, the age distribution of the portfolio does not influence the rating
structure. Hence a run-off decision should not have a specific effect on the
rating structure.
• The age of the policyholder (sum of the seniority and of the age at the
inception of the contract) is a key factor for the premium-benefit ratio of
an unfunded coverage without cross-subsidies between age classes, such
as an annual renewable term life insurance. Calendar time is related to
cohort effects. As death rates increase by 8-9 percent each year in middle
age, similar values would be expected in the regression for seniority and
for the age at the inception of the contract, if the coverage was rated in
this context. Figures of eight or nine percent are well above the 1.5 and
0.5% values obtained for the death benefit coverage. Hence strong cross-
subsidies are expected between age classes for the life insurance component.
• Unfunded financing with cross-subsidies between age classes is usual inhealth insurance. In an unfunded setting, calendar time is important
because the premium-benefit ratio reflects the current age distribution.
Calendar time is the only variable that matters if the coverage is rated
according to a "community rating" principle.
11

Table 2
Rating structure of the three coverages
Death benefit Health Long-term care
2 0.585 0.927 0.861
Intercept -6.013 (**) -2.498 (**) -4.394 (**)
Female gender 0.015 (**) 0.001 (**) 0.006 (**)
Age at inception 0.015 (**) 10−4 (**) 0.018 (**)
Seniority 0.005 (**) 10−4 (**) 0.008 (**)
Cancellation year
1993 -1.037 (**) -0.482 (**) -0.793 (**)
1994 -1.014 (**) -0.385 (**) -0.778 (**)
1995 -1.007 (**) -0.290 (**) -0.769 (**)
1996 -1.008 (**) -0.225 (**) -0.772 (**)
1997 -1.016 (**) -0.138 (**) -0.768 (**)
1998 -0.932 (**) -0.091 (**) -0.723 (**)
1999 -0.807 (**) -0.051 (**) -0.616 (**)
2000 -0.676 (**) -0.052 (**) -0.511 (**)
2001 -0.524 (**) -0.052 (**) -0.370 (**)
2002 -0.389 (**) -0.052 (**) -0.237 (**)
2003 -0.252 (**) -0.054 (**) -0.114 (**)
2004 -0.105 (**) -0.058 (**) -0.015 (**)
2005 -0.088 (**) -0.058 (**) -0.012 (**)
2006 -0.059 (**) -0.026 (**) 0.005
Note: Logarithm of the premium-benefit ratio, explained by a linear model
including gender, the age at the inception of the contract, the seniority of the pol-
icyholder and binary variables related to the year with available premiums (2007
for a working contract, or the cancellation year). The sample contains 150,123
contracts working or cancelled between 1993 and 2006. Reference levels: gen-
der=male; cancellation year=2007 or working contract. Significance level for the
nullity test: Two stars indicates a p-value less than 0.01; One star corresponds
to a p-value comprised between 0.01 and 0.05.
12
There is almost no gender effect in the rating structure of the death benefit
coverage. The calendar effect is very important, which suggests that the cov-
erage is not fully funded.10 A Lee-Carter (1992) analysis shows that we have
mortality improvements, as is the case in the whole of the Spanish population.
We would observe a decreasing calendar effect in a fully funded setting. In-
stead, the calendar effect remains almost constant between 1993 and 1997, and
then increases sharply once the portfolio is set in a run-off position (the ratio is
multiplied by exp(1016) = 276 from 1997 to 2007). This result can be partly
explained by the presence of term life insurance. Between 1993 and 1997, poli-
cyholders could age with very low increases in the death benefit premium, due
to the continuous arrival of new, young policyholders. This was stopped by
the run-off decision, which reflects the insurance company’s lack of commitment
with respect to portfolio renewal. On the other hand, there is partial funding
because of the surrender value, and there is a significant effect of the age at the
inception of the contract, as for fully funded schemes.
As indicated in Table 2, the premium-benefit ratio of the health coverage
depends only on calendar time. When controlling for this variable, there is no
residual effect of gender, age at inception or seniority in the portfolio. The
mutual company follows a "community rating" strategy for health coverage.
The calendar effect is different here from the effect observed in the death benefit
coverage. The rating level significantly increases before the run-off decision, but
afterwards it becomes more stable. As can be seen in Table 5, there is a cohort
risk improvement which explains the stability of the calendar effect in a context
of continuous aging.
Results for long-term care are close to those obtained for death benefit in-
surance, with the same conjecture of partial funding due to the importance of
calendar effects after the run-off decision. However, these calendar effects could
be partly explained in a funded setting by an increase in future LTC risks due
to mortality improvements.
The following sections analyze the cross-subsidies between age classes for
each of the coverages, which determine the magnitude of front-loading and are
of interest in the analysis of lapse behavior. Health risk is analyzed in greater
depth in order to estimate reclassification risk through the history of disability
spells.
10As we do not know the reserves, the results that follow for the type of funding are merely
conjectural.
13

4.2 Death benefit coverage
For each coverage, we derived a benefit-premium ratio in the portfolio for the
period 1993 to 2006, from the rating structure estimated in Table 2.11 Due to
the low level of premiums and the individual nature of the policies, there is a
high ratio between management costs and premiums. Therefore, the loading
factor (equal to one, minus the benefit-premium ratio) is high. Death benefit
insurance is more heavily loaded than the two other coverages because there is
a surrender value, which was not available to us and could not be taken into
account in our benefit-premium derivations. The benefit-premium ratios given
in the following tables are expressed with respect to an undisclosed average.
There is no gender effect in the rating structure, and women are younger than
men on average (44 years vs. 56 years, partly due to the absence of women
before the 70s). Hence women strongly subsidize men, as regards the death
benefit coverage. The benefit-premium ratios with respect to the global average
are equal to 1.27 and 0.21 respectively for men and women.
A comparison of the age effect on risks and premiums clearly indicates
that young policyholders subsidize older policyholder’s death benefits. Table
3 presents the benefit-premium ratios compared to the global average, when
policyholders are grouped by decades.
Table 3
Benefit-premium ratios compared to the global average
Age class (years) 30 [30,40[ [40,50[ [50,60[ [60,70[ [70,80[ ≥80Benefit-premium ratio 10% 11% 24% 39% 91% 222% 598%
(w.r.t. average)
4.3 Health coverage
Disability risk includes both a frequency and a duration component, and a com-
prehensive statistical approach assesses the two aspects separately. We restrict
ourselves here to a semiparametric analysis of the prevalence in the disability
state, which should suffice to estimate the risk borne by the insurance com-
pany. Then we assess the predictive ability of the disability history on different
11Benefits and premiums are updated each year according to an inflation index. We extended
the last available premium to the preceding years on the basis of this index.
14

components of health risks.
First, we present some global statistics regarding the frequency of disability
spells, disability prevalence and the benefit-premium ratio expressed with re-
spect to the global average. These statistics are presented according to the age
classes used in Table 3.
Table 4
Global statistics on health risks
Age class (years) Frequency of Disability Benefit-premium ratio
disability spells prevalence (w.r.t. average)
30 0.105 1.09% 45.1%
[30, 40[ 0.140 1.75% 57.8%
[40, 50[ 0.185 3.00% 70.7%
[50, 60[ 0.213 4.80% 93.3%
[60, 70[ 0.214 7.18% 132.1%
[70, 80[ 0.207 9.36% 175.6%
≥ 80 0.166 10.87% 224.0%
whole population 0.180 4.65% 100%
The first two global results suggest an average duration of three months for
a disability spell. The annual frequency of disability spells increases with age
up to 60-70 years, and then decreases. However, disability prevalence increases
during the whole life cycle, and the duration of disability spells increases steadily
with age. Young policyholders subsidize older ones, as shown in the last column.
This result is typical for individual health insurance.12 Disability prevalence is
multiplied by ten when comparing the oldest policyholders with the youngest
ones. By contrast, the benefit-premium ratio is multiplied by five for the same
age classes although this ratio depends solely on calendar time. The link between
the benefit level and disability prevalence, explained as a function of age, is im-
portant for understanding this discrepancy. A more detailed analysis shows that
this link is strong and positive for young policyholders (i.e. young policyholders
entitled to large benefits have a higher disability prevalence), but weakens with
12Pauly and Herring (1999) estimate an elasticity of premiums with respect to changes in
expected expenses due to age in a sample of American contracts. They report results that
range from 0.2 to 0.45.
15
age. A positive link is expected because policyholders might forget to use their
coverage in the case of disability, especially if the benefit level is low. As for the
gender effect, the benefit-premium ratios with respect to the global average are
0.88 for women and 1.04 for men, which is a more equitable result than in the
case of death benefits.
We estimate disability prevalence with a logit link in a generalized linear
model. This approach needs to be justified, as the dependent variable belongs
to the interval [0 1], but is not binary. Suppose that the transition intensity
from good health to disability is equal to , and that the duration of a disability
spell is a random variable . The stationary disability prevalence is equal to
=()
() + 1
=1
1 + 1()
=1
1 + exp(−) = Φ() = log()+log() (1)
The limit rate given in equation (1) is a logistic function of a score which
can be expressed as a linear form of regression components. This is the usual
specification for log(), and is also the case for log() if the distribution family
for the duration is of the "accelerated life models" type. A random variable
ranging in [0 1] has a variance inferior to that of a binary variable with the
same expectation. However, we use the link between variance and expectation of
binary variables in our generalized linear model estimation. The estimators are
more accurate than what the regression would indicate, but they are consistent
if the expectation is well specified. Table 5 summarizes the regression results.
The statistical units are contract-years, and the dependent variable is the
disability duration. Table 5 can be interpreted as follows. The disability rates
are much less than one, and the corresponding scores are negative. As we have
Φ() ' exp() at the neighborhood of −∞, a small absolute variation in thescore is related to a similar relative variation in the corresponding expectation
Φ(). For instance, women are roughly 20% riskier than men ceteris paribus,
contrary to the gender averages. This discrepancy is not surprising given that,
on average, women are much younger than men. The cohort effect is clearly
decreasing. Disability prevalence risk increases with age, with a slight downturn
at the end of the life cycle when the other variables are controlled. The link
between the benefit level and disability prevalence is positive but decreases with
age, as discussed earlier.
16
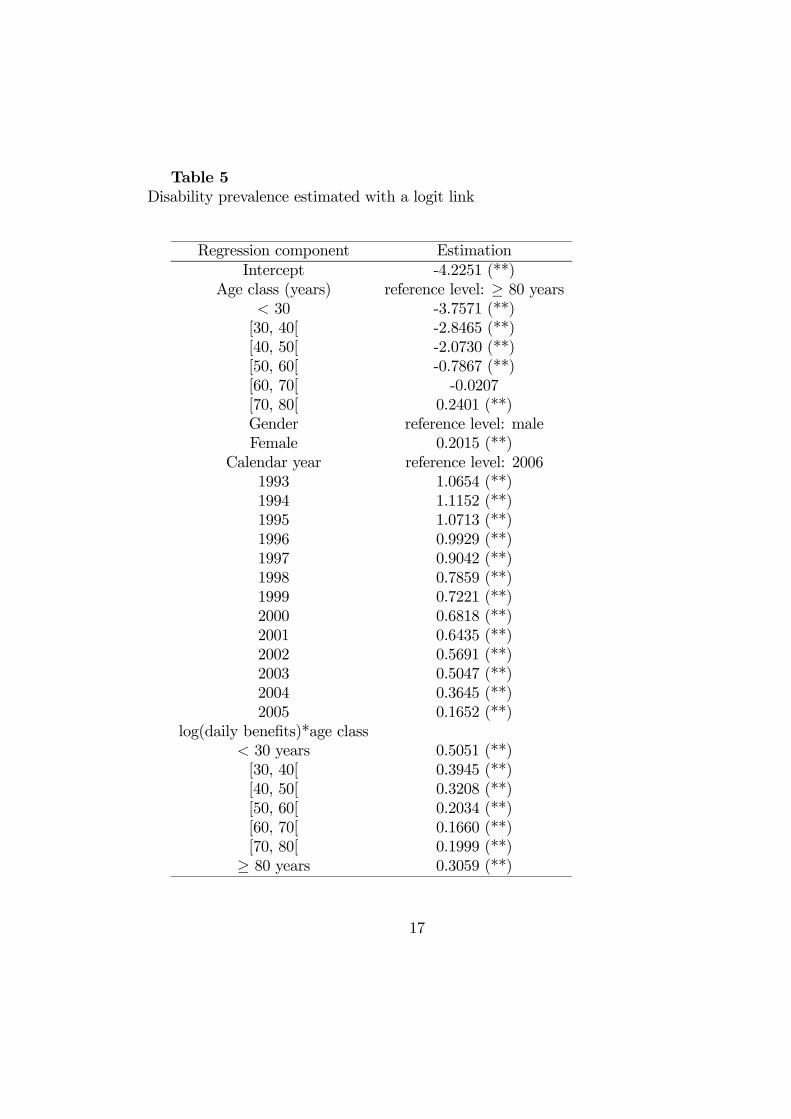
Table 5
Disability prevalence estimated with a logit link
Regression component Estimation
Intercept -4.2251 (**)
Age class (years) reference level: ≥ 80 years 30 -3.7571 (**)
[30, 40[ -2.8465 (**)
[40, 50[ -2.0730 (**)
[50, 60[ -0.7867 (**)
[60, 70[ -0.0207
[70, 80[ 0.2401 (**)
Gender reference level: male
Female 0.2015 (**)
Calendar year reference level: 2006
1993 1.0654 (**)
1994 1.1152 (**)
1995 1.0713 (**)
1996 0.9929 (**)
1997 0.9042 (**)
1998 0.7859 (**)
1999 0.7221 (**)
2000 0.6818 (**)
2001 0.6435 (**)
2002 0.5691 (**)
2003 0.5047 (**)
2004 0.3645 (**)
2005 0.1652 (**)
log(daily benefits)*age class
30 years 0.5051 (**)
[30, 40[ 0.3945 (**)
[40, 50[ 0.3208 (**)
[50, 60[ 0.2034 (**)
[60, 70[ 0.1660 (**)
[70, 80[ 0.1999 (**)
≥ 80 years 0.3059 (**)
17
Note: disability duration for a contract-year (1,182,662 individuals), ex-
plained by a logit model where covariates are age classes, gender, calendar year
and the logarithm of daily benefits crossed with age classes. The p-values are
represented as in Table 2.
The history of disability spells is a key variable for understanding health
status. The disability history allows symmetric learning, but the insurance com-
pany is committed not to use this information in its rating structure. We now
assess the predictive ability of the disability history on different components of
health risks. Experience rating models use distribution mixing13, but such an
approach is not straightforward for transition models between different health
states. Rather, we integrate an offset variable based on a "bonus-malus" coeffi-
cient in the regression of Table 5.14 We retain a coefficient of the type
=+
+ b() (2)
where is the cumulated past duration in the disability state, and where b()is its estimated expectation from the regression detailed in Table 5. This bonus-
malus coefficient is similar to that usually found in frequency risk models (with
number of claims instead of durations), and the weight given to the individual
health history decreases with the parameter . The logarithm of the bonus-
malus coefficient is the offset variable, and the estimated prevalence is almost
proportional to for the average individual, because Φ() ' exp(). If a
policyholder has a better health history than her peers (i.e. if b() withthe covariates used in Table 5), the offset variable is negative, and there is a
health "bonus". We estimate with likelihood maximization.15 The likelihood
increases dramatically when the offset variable is included in the regression of
Table 5. We obtain b = 00984. To illustrate, we assess the influence of a
supplementary year on an average individual. The corresponding values are
equal to
= b() = 024; = Φ−1(00465) = −302The average disability prevalence is equal to 4.65%, and the average disability
duration corresponds roughly to a five year risk exposure. Suppose that there
13See Pinquet (2000) for a survey.14In a regression, the parameter related to an offset variable is set equal to one.15The log-likelihood is derived from the logit model on binary variables. Applied on preva-
lence rates, it can be seen as a dissimilarity index of the Kullback-Leibler type between ob-
served and estimated values.
18
is a disability spell with an average duration (i.e. three months) during the
following year. The bonus-malus coefficient varies from one to
(00984 + 024 + 025)(00984 + 024 + 00465) = 153
The score increases by 042 if we leave the regressors unchanged, and the cor-
responding estimated disability prevalence increases by 49%. If the policyholder
remains healthy during the whole year, the estimated disability risk decreases
by 11%. These two values should be corrected by the consequences of the poli-
cyholder aging and by calendar effects.
Disability history also helps predict LTC and death risks. The following
results reinforce the reasons to lapse the contract because of a good health
history. We estimate proportional hazards models on the age at entry into an
LTC spell and on the age at death, with gender and log() as covariates.
The estimated elasticities of the death rate and of the entry rate into LTC with
respect to the bonus-malus disability coefficient are equal to 0477 and 0622
respectively. Using the average disability history, a supplementary year with a
three month disability spell entails a 22% increase in risk of death and a 30%
increase in risk of entry into LTC. These results should also be corrected for
aging and cohort effects.
4.4 LTC coverage
The LTC risk in this portfolio has been analyzed in an earlier article (Guillén and
Pinquet, 2008). Table 6 presents statistics for prevalence and benefit-premium
ratios.
Cross-subsidies between age classes are very strong (i.e. young policyholders
subsidize older ones), in a similar way to the death benefit coverage. Buying
LTC coverage in one’s 30s (which is the average age at purchase: See Table
1) is very uncommon, and can only be explained by the bundled nature of the
product.
19

Table 6
Statistics for LTC coverage
Age class LTC Benefit-premium ratio
(years) prevalence (w.r.t. average)
30 0.10% 4.1%
[30, 40[ 0.22% 19.4%
[40, 50[ 0.31% 33.5%
[50, 60[ 0.64% 51.5%
[60,70[ 1.43% 99.8%
[70, 80[ 3.22% 230.0%
≥ 80 7.83% 576.2%
whole population 1.09% 100.0%
5 Empirical results on lapses
In the introduction and Section 2 of this paper, we stressed the important re-
distribution effect of lapses, which motivates an empirical analysis of lapsation
behavior in the portfolio. Let us detail first the different variables of interest
in this analysis. We assessed the magnitude of front-loading in Section 4, and
front-loading deters lapses if surrender benefits are low. Lapse rates increase
with the magnitude of reclassification risk, which is represented by the health
"bonus-malus" coefficient in the following derivations. The evolution of the
age structure of the portfolio influences lapse behavior in an unfunded setting.
Thus, an increase in lapse rate is expected after the run-off decision taken in
1997. Lapse decisions may also be related to wealth (either liquidity constraints
or loss of interest in the contract on the part of affluent policyholders). Finally,
the policyholder’s understanding of the contract at the date of purchase may
influence lapse behavior, as we discuss below.
The average health bonus-malus coefficient derived previously is presented in
Table 7 for lapsing policyholders, who are grouped by decade. Unsurprisingly,
policyholders who cancel their contract have good health histories compared
those of to their peers, and this difference is found to increase with age. Re-
classification risk increases with seniority, and seniority also increases with age.
Hence lapsation for reasons of risk is less likely for young policyholders. Poli-
cyholders who lapse below the age of 40 are only a few percentage points less
20
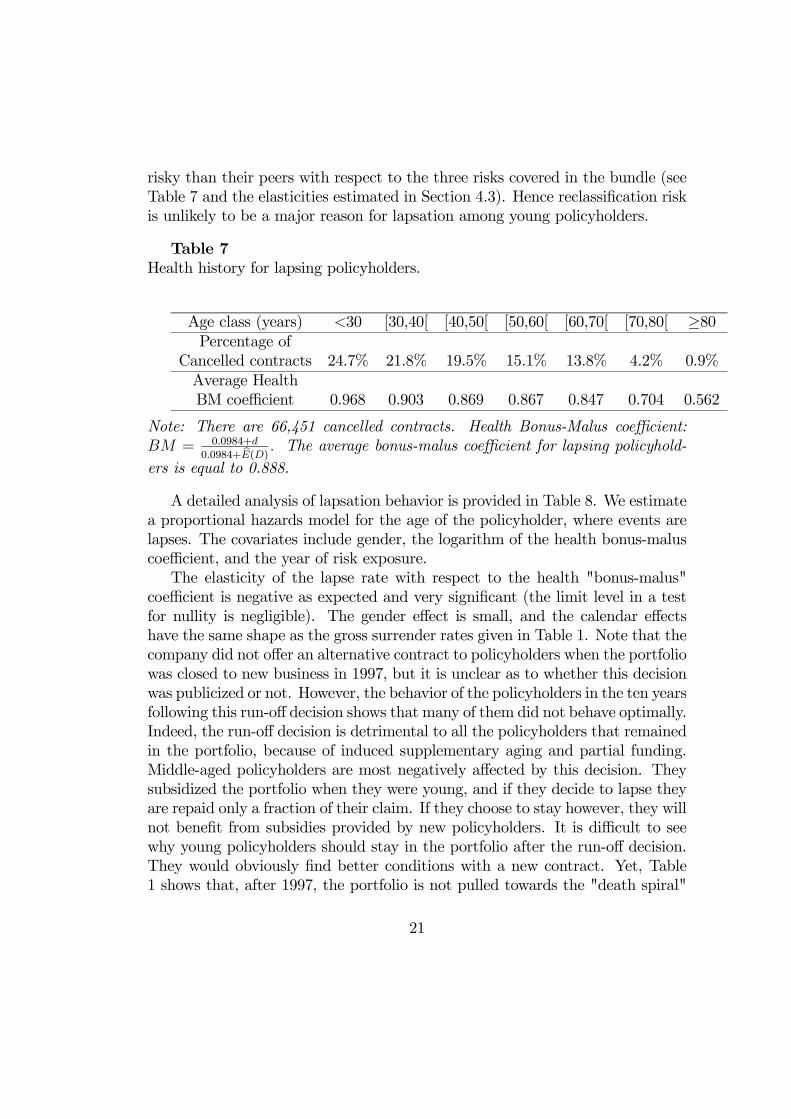
risky than their peers with respect to the three risks covered in the bundle (see
Table 7 and the elasticities estimated in Section 4.3). Hence reclassification risk
is unlikely to be a major reason for lapsation among young policyholders.
Table 7
Health history for lapsing policyholders.
Age class (years) 30 [30,40[ [40,50[ [50,60[ [60,70[ [70,80[ ≥80Percentage of
Cancelled contracts 24.7% 21.8% 19.5% 15.1% 13.8% 4.2% 0.9%
Average Health
BM coefficient 0.968 0.903 0.869 0.867 0.847 0.704 0.562
Note: There are 66,451 cancelled contracts. Health Bonus-Malus coefficient:
= 00984+
00984+ () The average bonus-malus coefficient for lapsing policyhold-ers is equal to 0.888.
A detailed analysis of lapsation behavior is provided in Table 8. We estimate
a proportional hazards model for the age of the policyholder, where events are
lapses. The covariates include gender, the logarithm of the health bonus-malus
coefficient, and the year of risk exposure.
The elasticity of the lapse rate with respect to the health "bonus-malus"
coefficient is negative as expected and very significant (the limit level in a test
for nullity is negligible). The gender effect is small, and the calendar effects
have the same shape as the gross surrender rates given in Table 1. Note that the
company did not offer an alternative contract to policyholders when the portfolio
was closed to new business in 1997, but it is unclear as to whether this decision
was publicized or not. However, the behavior of the policyholders in the ten years
following this run-off decision shows that many of them did not behave optimally.
Indeed, the run-off decision is detrimental to all the policyholders that remained
in the portfolio, because of induced supplementary aging and partial funding.
Middle-aged policyholders are most negatively affected by this decision. They
subsidized the portfolio when they were young, and if they decide to lapse they
are repaid only a fraction of their claim. If they choose to stay however, they will
not benefit from subsidies provided by new policyholders. It is difficult to see
why young policyholders should stay in the portfolio after the run-off decision.
They would obviously find better conditions with a new contract. Yet, Table
1 shows that, after 1997, the portfolio is not pulled towards the "death spiral"
21

that could have been expected after a continuous departure of the youngest
policyholders.16 This did not occur, and we believe that the portfolio reaches
an equilibrium thanks to a mistaken perception of the situation by the youngest
policyholders. As discussed previously, they are probably unaware of the run-off
decision, nor of their position in the age distribution of the portfolio.
Table 8
Proportional hazards model for lapsation
Covariate Parameter estimate Hazard ratio
log() -0.091
Gender Reference level: male
Female -0.020 (*) 0.980
Year of risk exposure Reference level: 1993
1994 0.173 (**) 1.189
1995 0.343 (**) 1.409
1996 0.327 (**) 1.386
1997 0.618 (**) 1.855
1998 0.707 (**) 2.028
1999 0.679 (**) 1.972
2000 0.667 (**) 1.949
2001 0.656 (**) 1.926
2002 0.691 (**) 1.995
2003 0.490 (**) 1.632
2004 -0.373 (**) 0.689
2005 -0.386 (**) 0.680
2006 -0.326 (**) 0.722
Note: proportional hazards estimation of cancellation risk. Number of ob-
servations: 1,163,645 duration-event indicator pairs. The basic observation is
a contract-year, because the health "bonus-malus" coefficient is updated every
year. Durations are left truncated by the age at the beginning of the year. The
covariates include gender, the logarithm of the health bonus-malus coefficient,
and year of risk exposure. The p-values are represented as in Table 2.
16See Pauly, Mitchell and Zeng (2007) for an analysis of "death spirals" in health insurance.
22
Continuous lapse rate (six month centered moving average) as a function of age for a policyholder with average covariates
0
0.02
0.04
0.06
0.08
0.1
0.12
0.14
10 20 30 40 50 60 70 80
Age (years)
lapse rate
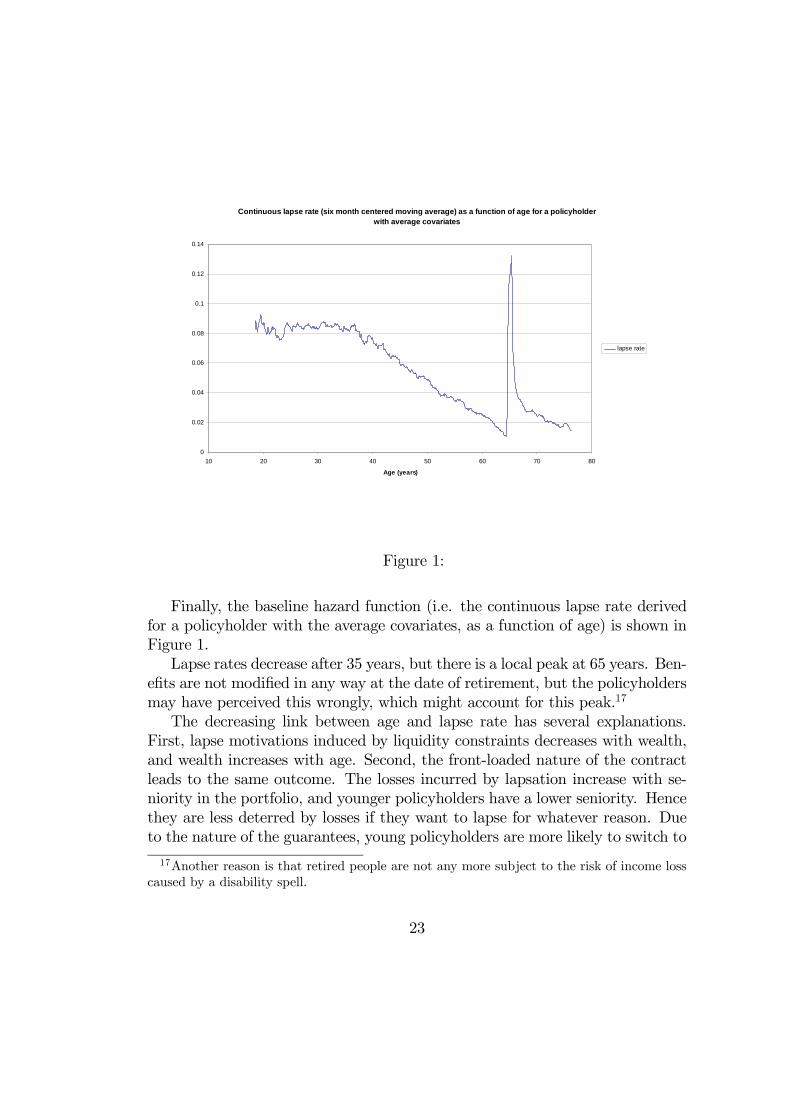
Figure 1:
Finally, the baseline hazard function (i.e. the continuous lapse rate derived
for a policyholder with the average covariates, as a function of age) is shown in
Figure 1.
Lapse rates decrease after 35 years, but there is a local peak at 65 years. Ben-
efits are not modified in any way at the date of retirement, but the policyholders
may have perceived this wrongly, which might account for this peak.17
The decreasing link between age and lapse rate has several explanations.
First, lapse motivations induced by liquidity constraints decreases with wealth,
and wealth increases with age. Second, the front-loaded nature of the contract
leads to the same outcome. The losses incurred by lapsation increase with se-
niority in the portfolio, and younger policyholders have a lower seniority. Hence
they are less deterred by losses if they want to lapse for whatever reason. Due
to the nature of the guarantees, young policyholders are more likely to switch to
17Another reason is that retired people are not any more subject to the risk of income loss
caused by a disability spell.
23
another contract. A sum of 1,600 Euros (the average death benefit) is scarcely
enough to cover the costs of a funeral, and young policyholders may cancel their
policy as they redefine their insurance needs. For instance, they might switch
to term life insurance if their need for family protection increases. This would
be more rational than combining a whole life insurance, a health insurance and
an LTC coverage, as the latter is usually bought by much older people. Let us
recall that once this portfolio was closed to new business, the mutual company
no longer sold this type of bundled product. Hence a misunderstanding of the
product or changes in insurance motives can also explain the high lapse rate of
young policyholders. From Figure 1, these arguments supporting higher lapse
rates among younger policyholders outweigh the reclassification risk argument
which works at the opposite, as discussed after Table 7.
These results show that a knowledge of the structure of the portfolio or of the
guarantees influences lapse rates. Long-term insurance purchasing is also par-
ticularly sensitive to an awareness of the environment, as discussed by Browne,
Gründl and Zhou-Richter (2010). On the basis of a survey performed in Ger-
many, they show that demand for LTC insurance is low due to an underestima-
tion of the risks and costs related to LTC. The more aware adult children are of
the risks and costs, the more likely LTC insurance is to be purchased, either by
the children themselves on behalf of their parents or by the parents under the
influence of their children.18
Other causes of lapsation should also be borne in mind. Table 1 shows
evidence of aging in the population that lapses after the run-off decision, with
a sharp increase between 2003 and 2004. This aging goes in tandem with a
decrease in the lapse rate. Elderly people may lapse for reasons of health or
wealth. A good state of health is more and more informative as age increases,
and this is expressed in the health bonus-malus coefficient (the denominator
increases with time, as it is related to risk exposure). The results in Table 7
suggest that lapse motivations for reasons of health increase with age. However,
wealth arguments may also explain this trend since some policyholders may be
affluent enough to lose interest in the low benefits associated with the policy.
Most Spanish households own their home, and older homeowners are quite likely
to have repaid their home mortgages. Thus, they are in a position to convert
home equity into annuities that pay for medical expenses. Davidoff (2009) shows
that if consumers can liquidate home equity in the event of severe illness, LTC
18In their sample, the willingness to buy LTC insurance increases from 1.8% to 30.7% after
an information update on the risks and costs of LTC.
24

insurance as well as annuities become less attractive.
6 Conclusions
Based on this case study, we believe that insufficient knowledge of insurance
products can cause lapsation which is detrimental to policyholders if triggered
by information available at the date of purchase. Enhancing knowledge of the
environment in terms of risk and of insurance solutions would be welfare improv-
ing. It would also increase insurance demand, as argued by Browne, Gründl and
Zhou-Richter (2010).
In this case study, LTC coverage was not fully funded. Otherwise the rating
structure would not depend on the age structure of the portfolio and would not
have been influenced by the run-off decision. Nowadays, LTC coverages are fully
funded and this is beneficial to policyholders in open portfolios.
A run-off decision is detrimental to policyholders in an unfunded setting
if cross-subsidies are substantial, especially if the insurance company follows
a "community rating" policy. This issue concerns health insurance first and
foremost. In such a context, regulating authorities should prevent the splitting
of portfolios, so that the insurance company is committed to keeping its portfolio
open.
References
[1] Brown, J., and A. Finkelstein, 2007, Why is the Market for Long-Term Care
Insurance so Small?, Journal of Public Economics 91 (10): 1967-1991.
[2] Brown, J., and A. Finkelstein, 2009, The Private Market for Long-Term
Care Insurance in the United States: A Review of the Evidence, The Jour-
nal of Risk and Insurance 76 (1): 5—29.
[3] Browne, M., H. Gründl and T. Zhou-Richter, 2010, Don’t they Care? Or,
are they just Unaware? Risk Perception and the Demand for Long-Term
Care Insurance, forthcoming in The Journal of Risk and Insurance.
[4] Daily, G., I. Hendel, and A. Lizzeri, 2008, Does the Secondary Life Insurance
Market Threaten Dynamic Insurance?, American Economic Review, Papers
& Proceedings 98: 151-156.
25
[5] Davidoff, T., 2009, Housing, Wealth, and Annuities, The Journal of Risk
and Insurance 76 (1): 31—52.
[6] Diamond P., 1992, Organizing the Health Insurance Market, Econometrica
40: 1233-1254.
[7] Dionne, G., and N. Doherty, 1994, Adverse Selection, Commitment, and
Renegotiation; Extension to and Evidence from Insurance Markets, Journal
of Political Economy 102: 209-235.
[8] Doherty, N., and H. Singer, 2002, The Benefits of a Secondary Market for
Life Insurance Policies, Wharton School working paper.
[9] Finkelstein, A., K. McGarry and A. Sufi, 2005, Dynamic Inefficiencies in
Insurance Markets: Evidence from Long-Term Care Insurance, The Amer-
ican Economic Review Papers and Proceedings 95 (2): 224-228. A more
comprehensive version is the NBER working paper No. 11039.
[10] Fluet, C., H. Schlesinger, and W. Fei, 2009, Uncertain Bequest Needs and
Long-Term Insurance Contracts, working paper.
[11] Guillén, M., and J. Pinquet, 2008, Long-Term Care: Risk Description of
a Spanish Portfolio and Economic Analysis of the Timing of Insurance
Purchase, The Geneva Papers on Risk and Insurance - Issues and Practice
33: 659-672.
[12] Hendel, I., and A. Lizzeri, 2003, The Role of Commitment in Dynamic Con-
tracts: Evidence from Life Insurance, The Quarterly Journal of Economics
118(1): 299-327.
[13] Kunreuther, H., and M. Pauly, 1985, Market Equilibrium with Private
Knowledge: An Insurance Example. Journal of Public Economics 26: 269-
288.
[14] Lee, R.D., and L. Carter, 1992, Modelling and Forecasting the Time Series
of US Mortality, Journal of the American Statistical Association 87: 659-
671.
[15] McShane, M.K., and L.A. Cox, 2009, Issuance Decisions and Strategic Fo-
cus: The Case of Long-Term Care Insurance, The Journal of Risk and
Insurance 76 (1): 87—108.
26

[16] Murtaugh, C.M., B.C. Spillman and M.J. Warchawsky, 2001, In Sickness
and in Health: An Annuity Approach to Financing Long-Term Care and
Retirement Income, The Journal of Risk and Insurance 68 (2): 225—254.
[17] Pauly, M., and B. Herring, 1999, Pooling Health Insurance Risks. The AEI
Press.
[18] Pauly, M., H. Kunreuther, and R. Hirth, 1995, Guaranteed Renewability in
Insurance, Journal of Risk and Uncertainty 10(2): 143-156.
[19] Pauly, M., O. Mitchell, and P. Zeng, 2007, Death Spiral or Euthanasia?
The Demise of Generous Group Health Insurance Coverage, Inquiry 44(4):
412-427.
[20] Pinquet, J., 2000, Experience rating through heterogeneous models, in: G.
Dionne, Ed., Handbook of Insurance 459-500. Kluwer Academic Publishers,
Boston.
[21] Society of Actuaries, 2002, Long-Term Care Experiment Committee Inter-
company Study 1984-1999. Schaumburg, IL.
[22] Smoluk, H.J., 2009, Long-Term Disability Claims Rates and the
Consumption-to-Wealth Ratio, The Journal of Risk and Insurance 76 (1):
109—131.
[23] Webb, D.C., 2009, Asymmetric Information, Long-Term Care Insurance,
and Annuities: The Case for Bundled Contracts, The Journal of Risk and
Insurance 76 (1): 53—85.
27
Related Documents


![Cohort effects in mortality modelling: a Bayesian state-space ...arXiv:1703.08282v1 [q-fin.ST] 24 Mar 2017 Cohort effects in mortality modelling: a Bayesian state-space approach](https://static.cupdf.com/doc/110x72/5f988e53411920762a4f435a/cohort-eiects-in-mortality-modelling-a-bayesian-state-space-arxiv170308282v1.jpg)


