October 1996 Commercial Exploitation of Nanophase Powder Formed with Exploding Wire Technology Final report Agreement 4852 VOO15-35 Task 3.5 le 9% V. S. Sedoi HCEI Technical Representative #tt MSTRIBUVON OF THIS DOCUMENT IS UNLIMVEE] High Current Electronics Institute Tomsk PROCESSED FROM BEST AVAILABLE COPY

Welcome message from author
This document is posted to help you gain knowledge. Please leave a comment to let me know what you think about it! Share it to your friends and learn new things together.
Transcript
October 1996
Commercial Exploitation of Nanophase Powder Formed with Exploding Wire Technology
Final report
Agreement 4852 VOO15-35
Task 3.5
le 9% V. S. Sedoi
HCEI Technical Representative
#tt MSTRIBUVON OF THIS DOCUMENT IS UNLIMVEE]
High Current Electronics Institute
Tomsk
PROCESSED FROM BEST AVAILABLE COPY

DISCLAIMER
This report was prepared as a n account of work sponsored by a n agency of the United States Government. Neither the United States Government nor any agency thereof, nor any of their employees, make any warranty, expm or implied, or assumes any legal liabili- ty or responsibility for the accuracy, completeness, or usefulness of any information, appa- ratus, product, or process disclosed, or represents that its use would not infringe privately owned rights. Reference herein to any specific commercial product, p r o c s , or service by trade name, trademark, manufacturer, or otherwise does not n e c m i y constitute or imply its endorsement, recommendation, or favoring by the United States Government or any agency thereof. The views and opinions of authors expressed herein do not necessar- ily state or reflect those of the United States Government or any agency thereof.
.

DISCLAIMER
Portions of this document be iuegiile in eieztmnic image products. are pmduced fmm the best available original document.

List of participants
I . Valentin S. Sedoi 2. Vladimir I. Oreshkin 3. Vitaliy P. Volkov 4. Lyudmila I. Chernezova

Abstract
In this report, the region of the energy density under the uniform heating conditions, of the lower pressures of the gas environment and of the smaller wire diameters have been studied.
Here, the theoretical investigations of exploding wire and powder formation processes are presented, the results of experimental investigations are discussed. It is demonstrated that exploding wire technique is able to produce nanophase powders of aluminum and iron oxide with the mean surface size of 30 nm or less at commercial quantities per hour and the cost of no more than $1000 per kilogram.
Here too, decisions for theoretical and technical activity during bture program are rec- ommended.
3
Contents . I -1
i
!
!
-1 .
. .
. r
List of participants ............................................................................................................................................ 2 Abstract ............................................................................................................................................................ 3 Contents ........................................................................................................................................................... 4 Introduction ...................................................................................................................................................... 5 1 . MHD simulation of the electric explosion of conductors ............................................................................... 5
1.1. The MHD model ................................................................................................................................... 5 1.2. Results of the MHD calculations ........................................................................................................... 8
of the electrical explosion of the aluminum wire in the oxygen-containing medium .................................... 11
2.1.2. The set of simultaneous equations .............................................................................................. 12 2.2. Calculation results and their analysis ................................................................................................... 14
rounding medium ..................................................................................................................... 16
3 . Experimental investigation .......................................................................................................................... 20
3.2. Methods of analysis of nitrogen in aluminum nitride ............................................................................ 22 3.3. Determination of specific surface of the samples .................................................................................. 24
4 . Results of the experimental research ............................................................................................................ 25 4.1 Specific surface of the samples .............................................................................................................. 25 4.2 Synthesis of aluminum nitride ............................................................................................................... 27
Summary ......................................................................................................................................................... 28 References ....................................................................................................................................................... 29
2 . Mathematical model and investigation of the processes that occur in the products
2.1. Model . Problem statement . Equations ................................................................................................... 11 2.1.1. Physical model and problem statement ....................................................................................... 11
2.2.1. The results of the calculation for the wire of a smaller diameter and reduced pressure of the sur-
2.2.2. Summary ................................................................................................................................... 19
3.1. Experimental setups ............................................................................................................................. 21
. . .. -3- . ....- , . ‘ ;> , . - I . , . , ., 7 7: ..... ......... __. ._C_-. . . . . . I7 ... < . . . .
4
. . . . . . . . . -. .. -..-. . . . . . . ’ , , ‘ . . . . ~. . . . . 1 . .
INTRODUCTION
The purpose of our work was prepare powders of Al and Fe oxides and Al nitride with the size of particles 30 nm and less. Here, the methods and results of the experimental research are pre- sented; the results of the theoretical treatment and computing are presented too. The methods of study have been chosen in accordance with the purpose in hand and the research has been performed according to the research plan taken previously
In this report, also the technical and theoretical problems required a decision within the next year of the work, are considered. Moreover, the advices for commercial production of nanophase powder have been given.
1. MHD simulation of the electric explosion of conductors
1 .I. The MHD model
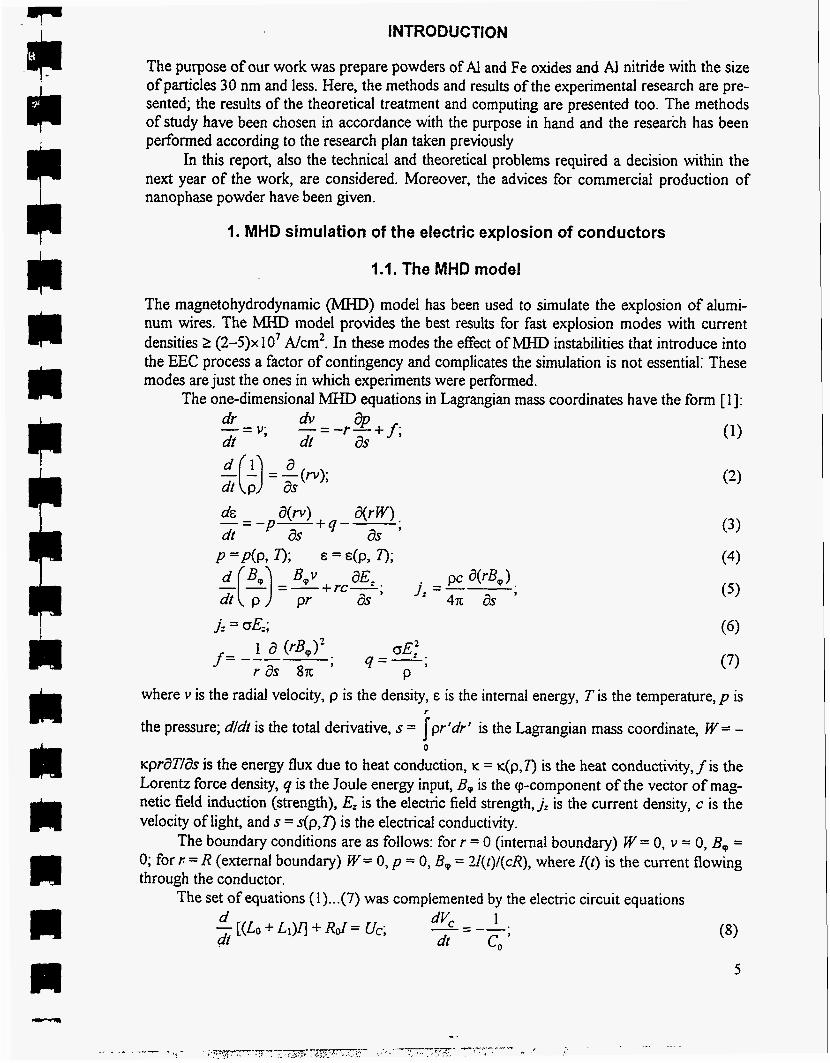
The magnetohydrodynamic (MHD) model has been used to simulate the explosion of alumi- nurn wires. The MHD model provides the best results for fast explosion modes with current densities 2 (2-5)x 10’ A/cm2. In these modes the effect of MHD instabilities that introduce into the EEC process a factor of contingency and complicates the simulation is not essential: These modes are just the ones in which experiments were performed.
The one-dimensional MHD equations in Lagrangian mass coordinates have the form [ 11:
(1) dr -=-r-+ * ? P f; dt dS
v; -= dt
L(1) = a(w); dt p as
where v is the radial velocity, p is the density, E is the internal energy, Tis the temperature, p is
the pressure; dldt is the total derivative, s = 1 pr ‘dr is the Lagrangian mass coordinate, W = -
~ p d T / a s is the energy flux due to heat conduction, K = K(P,T) is the heat conductivity, f is the Lorentz force density, q is the Joule energy input, B, is the cp-component of the vector of mag- netic field induction (strength), E, is the electric field strength, j z is the current density, c is the velocity of light, and s = s(p,T) is the electrical conductivity.
The boundary conditions are as follows: for r = 0 (internal boundary) W = 0, v = 0, B, = 0; for I: = R (external boundary) W = 0, p = 0, B, = Z(t)/(cR), where 1(f) is the current flowing through the conductor.
0
The set of equations (1) ...( 7) was complemented by the electric circuit equations
5

with the.Vddial conditions I(t = 0) = 0; Vc(t = 0) = ”, where & and & are, respectively, the self inductance and the self resistance of the circuit; CO and YO are, respectively, the capacitance and the charge voltage of the capacitor bank; YC is the actual voltage across the capacitor bank; L1 is the inductance of the conductor - return- conductor system, and VI is the voltage across the exploded conductor.
Equations (4) are equations of state. Since in the relevant experiments conductors were exploded in a gaseous medium, two different equations of state - for the gas and for the metal - were used in the MHD calculations.
Used for the gas was the Redlich-Kwong two-parameter equation [2]:
where
R is the gas constant and p is the atomic weight of the gas. The subscript “cr” refers here and below to the parameter values at the critical (triple) point.
Used for the metal was a wide-range equation of state [3 J allowing one to determine the characteristics of the material state in the liquid, gaseous, plasma, and double-phase regions of the phase diagram. For single-phase regions, the expressions for energy and pressure were written as the respective sum of the elastic, thermal, electronic, and ionization components. For the reduced internal energy < = &/(3RTJ2m), the equation has the form
where
C = 0.4278R2TC, B = 0.26/p,,
1; =&I + C;, + TC + <i, (10)
<[ = d,, a = (1N,&)/(3RTcr/2p). Here, 2, is the ionization degree that was determined from the Saha-Boltzmann relations; 1 is the ionization potential, and N A is the Avogadro number. For the reduced pressure x = p/p,, there is no ionization component, and the equation has the form
(1 1) where
x = xcl + 7th + x,,
y + Z / 3 nu = KK, , 1 + 2 / 2 x, = 2KcpiJ3.
states (binodal) was written as follows: x, = exp[(l - T-’)(c~ + C ~ T + C~T*)I.
With that, the values of the reduced density cp were found as the roots of the equation
7c(cp, T) - x,(r) = 0.
The equation of the boundary curve separating the single-phase and the double-phase
(12)
The liquid and the vapor densities in the binodal were approximated as follows:
6

R il R
(pi = 1 - l(l-T)+b,(l-T)”2 t k f iquid density; { [ thevapordensity. cp;= y e x p -(cpi - 1)’ a2 +b2 1 0,
In the double-phase region, the pressure is a finction of temperature only (K = X*(T)) and equals its value in the binodal. To find the energy in the double-phase state, the material pa- rameters in the binodal were calculated for a given reduced temperature T and the vapor dry- rless was found as follows:
After that, the reduced energy in the liquid-vapor system was calculated by the formula 5 = <:(1 -x) + <:x.
The values of the constants appearing in Eqs. (10) ...( 13) for AI are as follows: pcr = 4470x 10’ Pa, T, = 8000 K, pa = 0.64 g/cm3, r = 4.2, A = 2.5, K = 5.3, pw = 1.5, m = 6, n = 4, y=2.1,L=21,k=2.4,a=2.4,C0=4.4,C1=-0.7,C~=--0.7,p0=2.71g/cm~,a~=0.7,b~= 2.4, a2 = 0.5, bZ = 730.
In the MHD simulation of EEC, it is also important to choose adequate expressions for the dependencies of the coefficients of dissipative processes (0, K) on density and temperature. The calculation of the electrical conductivity involves the most substantial difficulties. There is no generally accepted in the solid-to-plasma transitory region, and the reliability of one or another technique can be judged only by comparing theoretical and experimental results [MI. To calculate the electrical conductivity, we used the calculation and experimental technique proposed by Bakulin and co-workers [5] where the dependence of the conductivity on the density and on the energy introduced into the conductor was chosen such that all “key” ex- periments could be described adequately with the use of the calculations. The dependence of the electrical conductivity on the thermodynamical parameters has the form
where 6 = p/po is the relative density, Q, is a fbnction of the order of unity, o c r is the conductiv- ity at the critical point, and 01 is the conductivity at normal density (6 = 1). The fimction o1 is given in a reference book [2]. The conductivity at the critical point oa was selected by compar- ing experimental and calculated data. So, its value depends on the form of the equation of state used, and in our calculations it was equal to 1.3~ 10” s-l (1.44~ 103/R.cm).
For the region 6 I lo5 (plasma region), the conductivity was calculated using expres- sions derived in terms of a semiclassical theory [7]. For weakly ionized plasmas, where electron scattering on neutral atoms plays an important part in transport processes, the Kauling formulas were also used.
For heat conductivity coefficient K was determined from the Wiedemann-Franz law that relates the heat conductivity and the electrical conductivity of a metal:
(15) where A is the Wiedemann-Franz constant.
Since the equations of state and transport equations are rather cumbersome expressions and, for the double-phase region, allow only numerical solutions, we used in the MHD calcu- lations tabulated values ofp(p, E), T(p, E), o(p, E), ~ ( p , E), and c@, E) (sound velocity) ob- tained using Eqs. (9) ...( 15).
ob, r ) = A W P , 0,
7
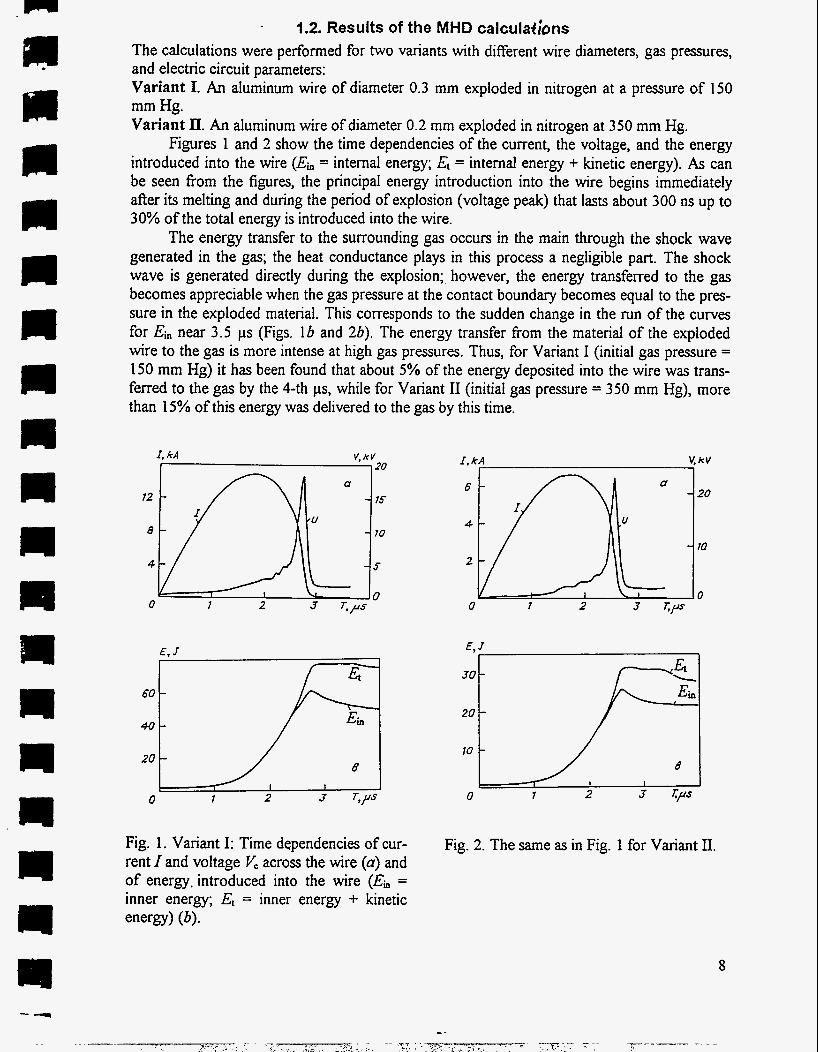
1.2. Results of the MHD calculations The calculations were performed for two variants with different wire diameters, gas pressures, and electric circuit parameters: Variant I. An aluminum wire of diameter 0.3 mm exploded in nitrogen at a pressure of 150 mm Hg. Variant II. An aluminum wire of diameter 0.2 mm exploded in nitrogen at 350 mm Hg.
Figures 1 and 2 show the time dependencies of the current, the voltage, and the energy introduced into the wire (E;I = internal energy; Et = internal energy + kinetic energy). As can be seen from the figures, the principal energy introduction into the wire begins immediately after its melting and during the period of explosion (voltage peak) that lasts about 300 ns up to 30% of the total energy is introduced into the wire.
The energy transfer to the surrounding gas occurs in the main through the shock wave generated in the gas; the heat conductance plays in this process a negligible part. The shock wave is generated directly during the explosion; however, the energy transferred to the gas becomes appreciable when the gas pressure at the contact boundary becomes equal to the pres- sure in the exploded material. This corresponds to the sudden change in the run of the curves for Ei" near 3.5 ps (Figs. lb and 26). The energy transfer from the material of the exploded wire to the gas is more intense at high gas pressures. Thus, for Variant I (initial gas pressure = 150 mm Hg) it has been found that about 5% of the energy deposited into the wire was trans- ferred to the gas by the 4-th ps, while for Variant I1 (initial gas pressure = 350 mm Hg), more than 15% of this energy was delivered to the gas by this time.
P I
!- I
i I
I. kA V, kV 20
- rs
- 70
- 5
0 0 1 2 3 ?-*/us
1. kA V, kV I 1
E. J
Fig. 1. Variant I: Time dependencies of cur- rent I and voltage V, across the wire (a) and of energy. introduced into the wire (E;I = inner energy; E, = inner energy + kinetic energy) (b).
Fig. 2. The Same as in Fig. 1 for Variant II.
8

0,161 Density. q/cmJ e. kS/y. Pro= I
n
n R
I m U L% 381 U
Fig. 3. Variant I: Spatial distribution of wire thermodynamic parameters at the instant of explosion: p = density; E = internal energy, and 2 = ionization degree.
Density . q / C d E , kJ/g, *IOJ
- 8
- 4
0,04 - I I I 0
o qor 402 403 404 o,ar r.cm
Fig. 4. The same as in Fig. 3 for Variant 11.
Figures 3 and 4 present the radial distributions of the thermodynamical parameters at the instant the energy input to the wire has stopped. As can be seen from these figures, the distri- butions of density p and energy E at this instant are rather uniform. The density drop is no more than a factor of 2.5-3 and the internal energy drop is no more than twofold.
Density, g/Cm3
Fig. 5. Variant I: Phase trajectory of the wire material.
Let us now analyze the phase trajectories that are given for both explosion regimes in Figs. 5 and 6. The heavy line represents the binodal, the double-phase region boundary, in which the critical point is denoted. The metal states near the wire boundary and in its center are shown, respectively, by squares and asterisks. The state variations in time are indicated by ar- rows; the points that refer to states corresponding to one and the same point in time are con- nected by dashed lines. From these figures it can be seen that the phase trajectories of the wire
9
Density. y /cd
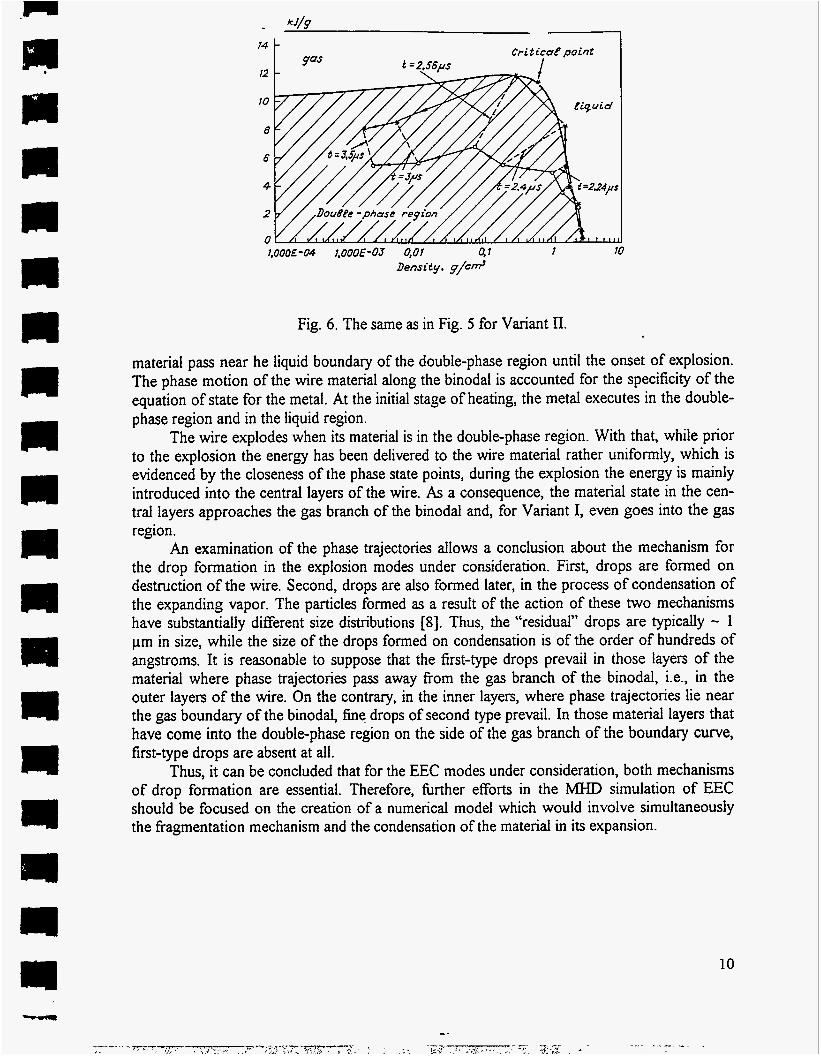
Fig. 6. The same as in Fig. 5 for Variant 11.
material pass near he liquid boundary of the double-phase region until the onset of explosion. The phase motion of the wire material along the binodal is accounted for the specificity of the equation of state for the metal. At the initial stage of heating, the metal executes in the double- phase region and in the liquid region.
The wire explodes when its material is in the double-phase region. With that, while prior to the explosion the energy has been delivered to the wire material rather uniformly, which is evidenced by the closeness of the phase state points, during the explosion the energy is mainly introduced into the central layers of the wire. As a consequence, the material state in the cen- tral layers approaches the gas branch of the binodal and, for Variant I, even goes into the gas region.
An examination of the phase trajectories allows a conclusion about the mechanism for the drop formation in the explosion modes under consideration. First, drops are formed on destruction of the wire. Second, drops are also formed later, in the process of condensation of the expanding vapor. The particles formed as a result of the action of these two mechanisms have substantially different size distributions [8]. Thus, the "residual" drops are typically - 1 pm in size, while the size of the drops formed on condensation is of the order of hundreds of angstroms. It is reasonable to suppose that the first-type drops prevail in those layers of the material where phase trajectories pass away from the gas branch of the binodal, Le., in the outer layers of the wire. On the contrary, in the inner layers, where phase trajectories lie near the gas boundaq of the binodal, fine drops of second type prevail. In those material layers that have come into the double-phase region on the side of the gas branch of the boundary curve, first-type drops are absent at all.
Thus, it can be concluded that for the EEC modes under consideration, both mechanisms of drop formation are essential. Therefore, firther efforts in the MHD simulation of EEC should be focused on the creation of a numerical model which would involve simultaneously the fragmentation mechanism and the condensation of the material in its expansion.
10

rc
2. MATHEM&flCAL MODEL AND INVESTIGATIO~ OF THE PROCESSES THAT OCCUR IN THE PRODUCTS OF THE ELECTRICAL EXPLOSION
OF THE ALUMINUM WIRE IN THE OXYGEN-CONTAINING MEDIUM
2.1. Model. Problem statement. Equations
In this chapter, the process of expansion of the EEC products is simulated in the multiphase approximation with consideration for the condensation both on the particles formed from the liquid phase of the wire and on the newly developed centers of condensation. The model of several interpenetrating media was used. The following media were considered: metal vapors; ultra-fine particles inside the exploded conductor that reached the plasma state; ultra-fine par- ticles in the sheath of the conductor, which were formed due to evaporation from the surface of the conductor; oxygen-containing medium. Characteristic size of the drops inside the con- ductor and their number density were chosen on the basis of present experimental knowledge in accordance with the energy input into the conductor. The model makes it possible to calcu- late the temperature, gas (vapor) and particle velocity, particle number density, and particle size at any moment and in any place inside the explosion chamber after the beginning of the expansion.
2.1.1. Physical model and problem statement
The model does not take into account the processes in the material of the conductor during the current flow. The initial moment is the moment when a conductor cross-section has increased 10 times, and the current through the conductor has been interrupted. The surrounding me- dium is the mixture of oxygen and nitrogen in the ratio which is close to that in the air. The ionization of vapors of the exploded material was taken into account, but drops were consid- ered neutral.
Viscosity of the plasma and the surrounding gas was not taken into account. The explo- sion of the conductor is a critically nonequilibrium process, and the quantitative proportion between the phases and the size distribution of the drops are unknown. Therefore, only the qualitative data of the parameters mentioned above were used; namely, the less was energy input in the conductor, the less was the characteristic size of the metallic particles in it, and the less was the fiaction of the condensed phase.
It was supposed that at the initial moment of the product expansion there were two kinds of drops: the big ones, with the size of (0.1-5)x10d m, at the decrease of the input energy fiom the W 2 1.3WS to W - O.SW, (W' is the sublimation energy), which were located in the region occupied by the conductor before the scattering of the explosion products begins; and very small ones, with the size of 1 x 1 O-' m, which were developed as a result of chemical con- densation and simple condensation in the vapor sheath around the conductor. The number density of the small drops was supposed to be equal to n4 - 10" m-3. The number density of the drops of the first kind was chosen depending on the input energy, e.g. for the input energy W- 1.3W,, n2 - 10" m-3, for the input energy W - 0.8Ws, nz - 1014 m-3.
Furthermore, it was thought that the energy liberation occurred uniformly in the bulk of the conductor (the drop of the internal energy along the radius was small).
It was taken into consideration that there was velocity distribution of the conductor and sheath material at the initial moment. The distribution was taken linear, and for the gaseous phase it was written as follows:
(16) The change of temperature of the saturated vapor of aluminum (at the existing pressure,
at the given point of the chamber, at the moment under consideration) was taken into account. 11
U1 = (r - 0. 1R,,.)0.4ao/Rw.

R R R
rn m a PI
n
When the calculatedtemperature of the vapor became lower t h q the saturation temperature, it was thought that metal vapor condensed and formed the nuclei with the size of r4 - lo-' nm. The temperature dependence of saturation pressure was taken from [3], and it was approxi- mated by the formula:
3.46 x 10,
The rate of nuclei formation was taken from [2, 51 as I , = K,m~,n,n,ee
(17)
where 0 = (T, - TJT, is the degree of supersaturation; T, is the temperature of saturated vapor at the pressurep,; ni is the ion number density, which is determined by the approximate formula based on the data from [2]; mN is the atomic mass of aluminum; K is the proportion coefficient, K = 2 . 2 1 ~ 1 0 ~ ' m"/(kg2s) for aluminum [9].
The lower index at the nucleus radius (r4) and at the rate of nucleus formation (I4) indi- cates that the newly formed centers of condensation belong to the particles of second kind, that is, the particles are located only in the sheath at the initial moment.
2.1.2. The set of simultaneous equations
The set of simultaneous equations of hydrodynamics in the cylindrical coordinate set was writ- ten in the divergent form [ 11, 123. The equations for the gaseous phase:
j =2 .4 j=2.4
tiv = a, pi 4wJ2 11, /(mi I Yti I) is the number of vapor molecules (i = 1) condensing on the par- ticles o f j kind in a unit of volume in a unit of time (j = 3, 4; i = 1, 3); it is necessary to note that before the contact discontinuity a3 = 0, therefore ri, = n3, = 0 (index ' 1 ' refers to the vapor, index '3' refers to the surrounding medium). Once the contact discontinuity has oc- curred:
wherep, is the vapor (i = 1) or gas (i = 3) pressure; tijl = 4xr; nJpl* / (m, ly, I) is the number of molecules evaporating from the drops of t h e j kind (j = 2,4);
I y;l I = d K E T / ( x m l ) + ( l l , -I'J)' ; mi is the atomic or molecular mass of the metallic vapor (i = 1) or the surrounding gas (i = 3);
12

n
m I,: I
u I ‘ I
n I I
n
L I
Ks is Boltzmann’s dbtant; ai is the accommodation coefficient (0 < a1 < 1 and a3 = 0 before the contact discontinuity; 0 < a3 <1 in the region of the metal vapor and oxygen-containing medium mixture);
4 = zcy = K m, ni (1 -a j ) cr:(ul - u I ) lyj I n, is the resisting force of the moving parti- j=2,4 j=2.4
cles of the vapor or the surrounding medium;
nl is the atomic number density of the metal vapor; n3 is the molecular number density of the surrounding medium; indexesj = 2, 4 refer to the drops of metal or aluminum trioxide.
The equation for the drops were taken as:
i=l ,3 i=1.3
4 3
mj = --n: r;pJ is the mass of the metal liquid drop of thej kind;
is the specific heat of the drop material; Pi” is the density of the drop material. In order to reduce the number of parameters governing the problem solution and obtain
similarity criteria, the set of equations together with the initial and boundary conditions was written in the dimensionless form. The values of the vapor parameters at the initial moment and the size of the conductor at the beginning of the explosion product extension were taken as scale quantities:
R M =Rdo,nM =t110, T M = q o , p M =nM K , T M ,
t , = R v O / a l O o , ‘M = = d x . where a10 is the sound velocity in the vapor cylinder (conductor) at the initial moment; y1 = C,,/C, is the adiabatic index for the aluminum vapor.
The values of the scale quantities for the case of the energy input W = 1.3 W, at the initial radius of the solid conductor R& = (0.1-0.15)~ m were taken as follows:
nhf = (3 .7-4 .35)~lO~~ m”; T M = lo4 K;
RM = (2.5-5)x IO4 m;
uM = 2153 mls; fA{=2.3221~10-~
In this case, dimensionless variables would be written as: 13
- F = r / R M , t :. I, , 5 = ni / t i M , = TITw , p = p / p M s , = u, lu, , i = 1,2,3,4. (26)
The set of equations (19)-(21), the initial conditions, and boundary conditions were rewritten in the dimensionless form; in doing so the following similarity criteria were formed: 1) geometrical: EcT = <o = r20/Rwo; Fa = ra/Rwo;
4 3 2) hydrodynamic: analog to Mach number ii = A4 = u, /a ,o; Yo = --x R , 12, . 3
2.2. Calculation results and their analysis
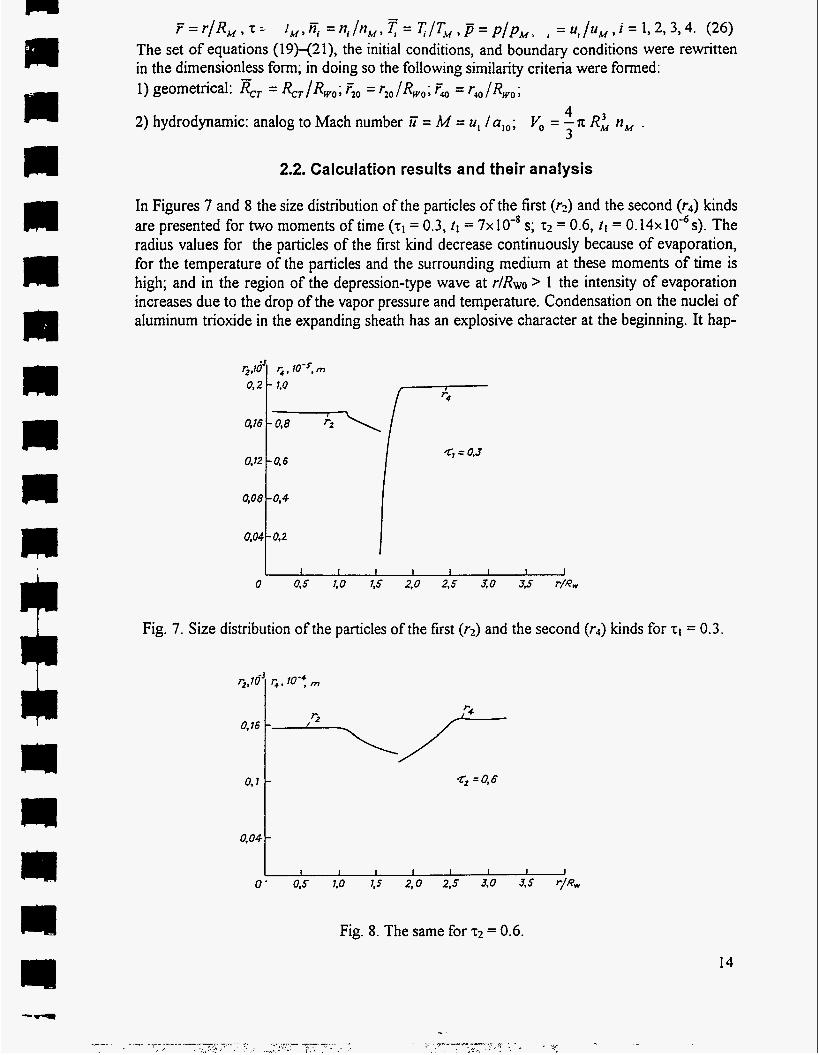
In Figures 7 and 8 the size distribution of the particles of the first (rz) and the second (r4) kinds are presented for two moments of time (xl = 0.3, t l = 7x lo-* s; s2 = 0.6, t1 = 0.14~10"s). The radius values for the particles of the first kind decrease continuously because of evaporation, for the temperature of the particles and the surrounding medium at these moments of time is high; and in the region of the depression-type wave at r/Rwo > 1 the intensity of evaporation increases due to the drop of the vapor pressure and temperature. Condensation on the nuclei of aluminum trioxide in the expanding sheath has an explosive character at the beginning. It hap-
C, = 0.3 0.72 0.6 t O ' 0 8 r 0,04 0.2 1 0 0.5 1.0 7.5 2,O 2.5 $0 33 r/R,
Fig. 7. Size distribution of the particles of the first (r2) and the second (r4) kinds for TI = 0.3.
1 I I I I I I I 0,s 1.0 1.5 2.0 2.5 3.0 3.5 r/Rw
Fig. 8. The same for t2 = 0.6.
14
pens because: fir$ cxluminum vapor is highly supersaturat.4 second, condensation in the sheath is chemical, and it goes at the highest speed [IO], then the speed decreases. That ex- plains the behavior of the curve corresponding to the particles of the second kind (r4) in Fig. 7. It is necessary to note that the rapid growth of the particle size takes place in the narrow inter- val 1.60 I ~ R W O I 1.80; in this interval the size changes from 1 to 5 nm (RM = RWO = 5x10⁴ m). In Fig. 8, 1.75 < r/Rwo < 2.1.
0.8
0.6
0,4
0.2
0
0.6
44
0
the particle radius (r4) changes from 6 to 8 nm on the interval
I I I I 1 I 0.5 10 7,s 2.0 25 JO 3~
Fig. 9.
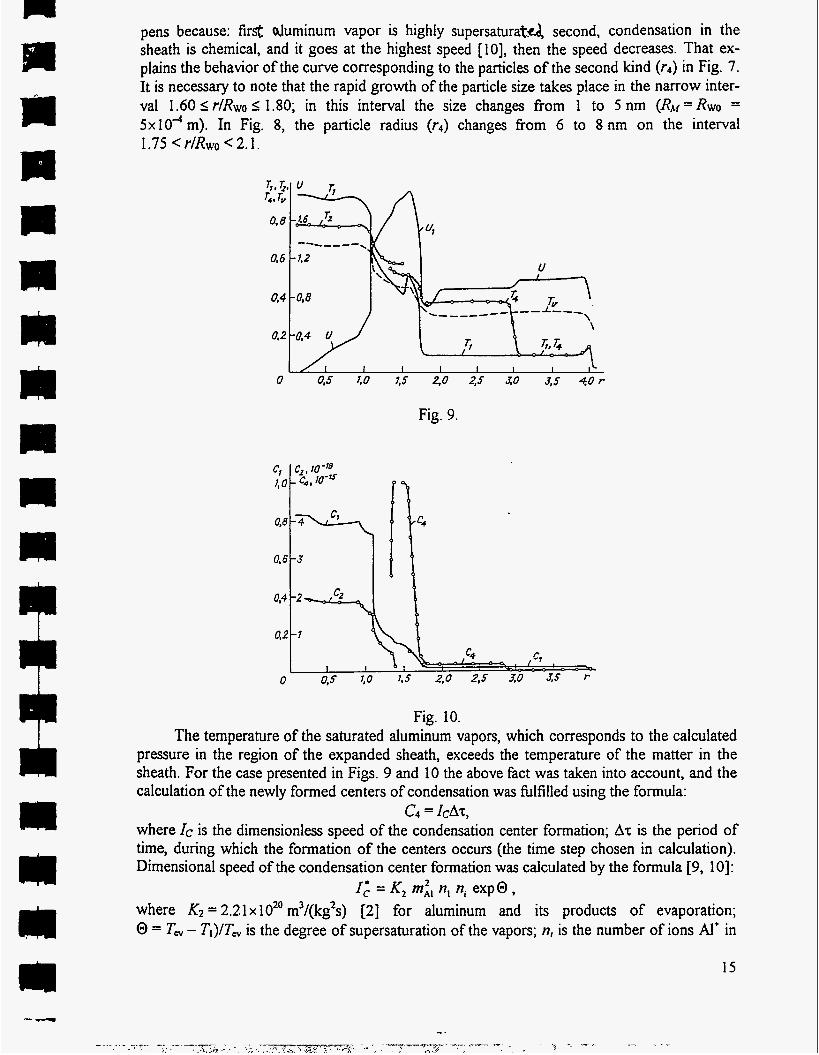
Fig. 10. The temperature of the saturated aluminum vapors, which corresponds to the calculated
pressure in the region of the expanded sheath, exceeds the temperature of the matter in the sheath. For the case presented in Figs. 9 and 10 the above fact was taken into account, and the calculation of the newly formed centers of condensation was fblfilled using the formula:
where IC is the dimensionless speed of the condensation center formation; AT is the period of time, during which the formation of the centers occurs (the time step chosen in calculation). Dimensional speed of the condensation center formation was calculated by the formula [9, 101:
I: = K, mi, n, ni expa , where K2 = 2 . 2 1 ~ 10'' m3/(kg2s) [Z] for aluminum and its products of evaporation; @ = T, - T,)/T, is the degree of supersaturation of the vapors; n, is the number of ions Al' in
C4 = IcAT,
15

r - I
I - I
I
the region under comderation. Then, the dimensionless speed OF condensation and C4, accord- ingly, were calculated by the formulae:
(27) I , = C, -C, -expO,
where C is the coefficient of similarity that appeared after the transition to the dimensionless variables.
It was supposed that: first, formation of the new condensation centers occurred in places where there were no drops formed at the initial moment in the vapor sheath; in those places where the drops were formed at the initial moment, the new centers of condensation did not develop, and condensation occurred only on these particles; second, the heat during the new condensation center formation was neglected; the radius of the centers was taken to be equal to 1 mm, and T' = TI.
2.2.1. The results of the calculation for the wire of a smaller diameter and reduced pressure of the surrounding medium
The variant was calculated under the following initial conditions (using results of MHD simu- lation):
W = 1.3W;, R , = O.IX~O-~ m, (R, = 0 .25~10-~ m),p,d = 0 . 2 ~ 1 0 ~ Pa (1: 150 mm Hg). In this case, the scale quantity values are equal to: T ~ = 8 x l O ~ K ; n ~ ~ = 3 . 7 x l O ' ~ m ~ ~ ; p , = 108Pa(103 atm); RM=R~o=2.5x10⁴m;
uM=ao ~ 2 1 5 3 . 2 5 mls; fM= 1 .6~10-~s .
The distribution of the gas temperatures, the particles of the second kind, the temperature of the saturation, T,, and the gas velocity, u1, along the coordinate r/Rwo are presented in Fig. 1 1 for the moment t = 2.1 (t = 0 . 2 7 3 ~ lod s). By this moment the weak shock wave from the sheath has reached a wall (in order to reduce the time of calculation a small distance between the conductor and the wall was chosen, &rlRwo = 20), and the increase of all the temperatures
0 2 4 6 8 10 12 74 76 18 20 r/rv
Fig. 11.
16

U
8 -
7 -
6
SI M
I L. I I I I I I I
mentioned above at t h e drop of the gas velocity to zero are observed on the wall. The vapor temperature on the axis of the chamber decreases noticeably, because the depression-type wave has reached the axis, reflected, and gone to the right side again. Now the temperature of satu- rated aluminum vapors throughout the chamber exceeds the temperature of vapor and evapo- ration products contained in the sheath; the oxygen-containing medium is removed to the wall of the explosion chamber by the contact discontinuity, which follows the weak depression-type wave; in the whole region shown in Fig. 1 1 the condensation of the metal vapor takes place, and the most intensively it occurs in the interval of 0 I rlRW0 I 6.5, where the concentration of vapor is high, the temperature is still high enough, and therefore, the ion concentration is suf- ficiently high as well. The heat liberated during the condensation leads to an increase in the particle temperature, which is noticeably, sometimes significantly, higher than the temperature of the gas-vapor mixture. A strong shock wave still continues movincto the wall and its front is at rlRW0 = 6.0.
Fig. 12. Figure 12 presents the evolution of both the number of metal (AI) particles condensing in
the region behind the strong shock wave and the number of particles forming as a result of chemical condensation on the existing centers of condensation in the extended vapor sheath (condensation of AI20 and Al on reaction with oxygen) yielding A203 drops. The number of particles is in a dimensional form. The distribution by the radius of the chamber are shown for four different moments: q = 0.9 (tl = 1.04~10-~ s), T~ = 2.1 (f2 = 2.44~10-~ s), T~ = 2.7 (f3 = 3.135~ lo-' s), 5 = 4.1 (r4 = 4.76~ lo-' s). In this distribution there is a tendency for reduc- ing of the number of the condensing particles in the center of the chamber and shifting of the maximum of the distribution from the center of the chamber to its walls. Equalization of the number of particles in the chamber is also observed. In Fig. 12, the values of lg n4 are plotted along the axis of ordinates, so the real values of the number of particles should be recalculated. For example, the maximum number of particles at ~4 = 4.1 and r/Rwo = 4.0 is equal to 5x10" m-3 (lg n 4 = 11.7).
Figure 13 shows the distributions of the condensing particle size along the radius of the chamber that correspond to the distributions of the number of particles in the previous figure,
17

Fig. 13.
that is, the distributions are shown for the same moments. Particle radii plotted along the axis of ordinates are given in the dimensional form, in nanometers. The behavior of the particle size distributions is similar to that of the distributions of the number of particles; namely, the broad- ening of the distributions with time takes place through the volume of the explosion chamber, but due to the continuing condensation this broadening is accompanied by the growth of the particle size along the whole range of the chamber radius. The maximum value of the particle radius r4nwx at T = 4.1 and r/Rwo = 8.8 is equal to 20.2 nm (4 = 40.4 nm), and the growth of the particle size continues with time, though the growth rate decreases. At the moments under consideration the growth rate of the maximum particle size increases almost linearly with time, then it slows down because the degree of supersaturation decreases during the condensation of the metal vapors and the concentration of the products of evaporation fiom the surface of the conductor decreases also. The formation of such compounds as Al20 is impossible because of the contact discontinuities following both weak and strong shock waves. The contact disconti- nuities make it difficult for the metal vapor to mix with the gas of the surrounding medium, which is removed to the walls of the chamber. Hydrodynamic flow through the contact dis- continuities does not occur, and diffusion at t c 10" s takes place only in a very narrow layer near the contact discontinuities.
The calculation was done for the case when the energy Wdelivered into the conductor is equal to 0.8K. The other initial parameters remain the same as for the case described above. In doing so, the scale quantities changes as well as the initial conditions for the number density of the particles inside the conductor (in this case, the number density was chosen under the con- dition that more than half of the conductor mass remained in these particles and only 40% of the matter transformed into vapor). The scale quantity values are taken as follows: TM = 5x10³ K, p~ = 1O8Pa (lo3 atm), uM = 1550 m/s, R M = 2 . 5 ~ 1 0 ~ m, nM = 2 . 2 ~ 1 0 ~ ' m-3, t M = 1.613xlO-'m.
18

96
80
70
60
50
40
30
2C
10
G
5.10 - 9 ~
Fig. 14.
For the particles of the first kind the radius r;O is taken to be equal to 5x10⁴ m, and their number density ni0 = 1014 m-3. For the particles of the second kind the initial values are taken the same as for the case described above. In Fig. 14 the size distributions of the condensing particles are shown for the moments: rl = 0.3 (z1 = 0 . 4 8 ~ s),
As cam be seen, the condensation on the particles in the sheath has an explosive charac- ter and the size of the particles increases up to r4, > 100 nm in a very short time TI = 0.3 (11 = 0.48xlO-’s). Besides, the calculation data shows that by this time the temperature of the saturated metal vapor exceeds the temperature of the vapor itself at the calculated pressure distribution along the radius of the chamber wherever there are the vapor and the products of evaporation fiom the sheath. In other words, the condensation starts both on the axis of the conductor and in the region of the sheath at the initial stage of the explosion product expan- sion. As this takes place, the temperature of the particles rises up and, at a later time, the evaporation of the newly formed particles occurs in parallel with the condensation. As a result, the maximum radius decreases to the value r4- = 88 nm at r2 = 0.6 (f2 = 0 .97~10-~ s); the temperature of the particles reduces and hrther condensation goes slower.
s), rz = 0.6 (12 = 0 . 9 7 ~ and~3 = 0.9 (f3 = 1 . 4 5 ~ 1 0 - ~ ~ ) .
2.2.2. Summary
The analysis of the results of the numerical calculations of the hydrodynamics of the ex- pansion of both of the vapor sheath and the products of the conductor explosion shows that: 1. Vapor sheath, on expansion, gives rise to the weak shock wave with the following contact
discontinuity, which separates the oxygen-containing medium fiom the products of evapo- ration fiom the conductor surface formed at the initial stage.
19

13' n
I I U
m I - . _ I
I - _ I
I I
5. I a w -1
a L r- i
2. During expansion of vapor-plasma cylinder, which develop g the place of the conductor and contains a number of metal particles formed from the liquid phase of the conductor, gives rise to the second, strong shock wave (at JC-W') which is followed by the second contact discontinuity separating aluminum vapors from the products contained in the sheath.
3. From the very beginning the temperature of the saturated aluminum vapors, which corre- sponds to the calculated real pressure, exceeds the temperature of the products in the sheath allowing the condensation of the metal vapor on the already existing nuclei, and there, the formation of the new centers of condensation takes place mainly on the ions AI', because oxygen has practically been used up at the initial stage and additional oxygen does not arrive at the first moments due to the contact discontinuity.
s) the temperature of the saturated aluminum va- pors exceeds the temperature of the vapor everywhere where this products are present, in- cluding the sheath; and condensation center formation and condensation of the metal vapors on these centers begin everywhere. At the initial stage, 'c - 0.3-0.6 ( t = (3.5-7)x lo-* s), condensation has an explosive character.
5. As a result of condensation, the distribution of the number of the condensate drops along the chamber radius forms, and this distribution develops in a particular way: with time the number of particles decreases near the axis and in the region with a large radius.
6 . The similar distribution occurs for the size of the condensing metal particles. This distribu- tion changes with time as well, broadening along the radius; and the maximum particle size t-4- increases up to 60-100 ns. The range of particle'sizes in such distribution is character- ized byr4=2-20.2nmat W = 1.3W,, R ~ = 0 . 1 ~ l O - ~ m , p , , , ~ = 0 . 2 x l O ' P a a n d t = 0.5~10-
s; for the moment t - 1 ps, r4 = 24.0 nm; the lower limit does not change because the va- por concentration at the periphery becomes small due to the expansion and condensation stops.
7. With a decrease in the input energy, W, to the value W = 0.8Wc, the excess of the saturation temperature over the vapor temperature corresponding to the calculated pressure (density) takes place everywhere from the very beginning of expansion. Condensation at t = 0.3 (t = 4.8x10-* s) starts on the particles (nuclei) in the sheath; it has an explosive character and it forms particles with the size more than 100 nm. Then the condensation centers are formed in the whole region of metal vapor and sheath expansion. As this takes place, parti- cles, condensed in the sheath, start evaporating as the vapor temperature increases; their maximum size decreases by the moment t = 1.0 ( t = 1 . 6 1 ~ s) to the value r4- = 95 nm, while in the rest of the region the condensate size grows continuously. The range of the size at 'I: - 4.0 (t = 0.65~10" s) is r4 = 10-100 nm.
8. Particles, formed fiom the liquid phase of the conductor at the number densities that were taken in the calculation as: n20 = 10" m-3 for W= 1.3W, and nm = 1014 m-3 for W = 0.8Ws, evaporate fiom the very beginning and then, captured by the vapor flow, disperse in the chamber and their number density sharply decreases to zero.
9. Formation of the aluminum oxides on the particles with the size of r2 = 0.1-5 pm, C = 2- 100 nm ( as it was taken in the calculation) occurs fiom the surface of the particles after some destruction of the contact discontinuities and diffision fiom them. As this takes place, additional particles are not formed and distribution of the produced oxide powder has the same character as the distribution of the condensed metal drops.
4. M e r a lapse of time t. = 1.5 ( t , = 2x
6
3. EXPERIMENTAL INVESTIGATION
The experimental equipment includes, on the one hand, three setups, following the plan, for powder production under various condition in sufficient amounts to analyze and, on the other hand, equipment for an express analysis of the powder samples.
20

i
1
3.1. Experimental setup.
In our research three experimental setups were used to produce under various conditions the powder samples of AI oxide, AI nitride, and Fe oxide. Every setup (Fig. 15) includes cylindrical hermetic chamber I with electrodes 2 and 3; conductor 4 is delivered into the gap between the electrodes along the axis using a feeder with rollers 5. As shown in Fig. 15, the conductor is delivered through the hole in top elec- trode 3 from the top down. Electrode 3 is grounded and connected to cone I of the chamber. Bottom electrode 2 is insulated fiom the frame by dielectric 6 and connected to triggered gap 7. There is the obser- vation window in each of the chambers equipped with pressure gages and may be connected to vac- uum or gas systems.
The setup operates as follows: the capacitor CO is charged by the dc power source up to the voltage YO. Simultaneously, rollers 5 deliver conductor 4 in the gap between electrodes 2 and 3. As soon as the exploded conductor EC (the exploding part of con- ductor 4) reaches to the opposite electrode, a trigger- ing circuit comes into action. The triggering circuit
Fig. 15. Setup electric circuit: I - germetic chamber; 2, 3 - electrodes; 4 - conductor; 5 - rollers; 6 - high volt- age insulator; 7 - interelectrode gap; 8 - high voltage electrode.
. pulse is applied to triggering electrode 8 of triggered gap 7. Gap 7 operates and capacitor CO is discharged into the EC. Here, no-electric contact between the EC and electrode 3 is quite im- portant. Otherwise, the EC may be melted on the electrode and a continuity of a delivery of the conductor is broken.
All setups have the elements and signs described above in common. However, they also have a number of distinctions. Basically, the distinctions are due to features in exploded metals. Various conditions are required to explode Al or Fe conductor. We dwell on the distinctions in more detail.
Setup 1. This setup has been designed to ex- plode the Al conductors in environment contained nitrogen. In Fig. 16 the electric circuit is shown. Here, the vacuum triggered gap R W - 7 (All-Russian Electrotechnical Institute, Moscow) [ 131 is used. Initially, the capacitor CO of the main source and the capacitor of the triggering one are charged to volt- ages YO and Yt, respectively. The conductor EC is delivered in spacing between the electrodes and shorts out that. The triggering capacitor Ct is dis- charged through the primary winding of the step-up transformer T and EC. The triggering pulse is formed across the secondary winding of the transformer the pulse is applied to spacing between the triggered gap cathode (K) and triggering electrode and initiates a breakdown of the triggered gap (K-A). The gap comes into action and the main capacitor CO is discharged through the EC. The capacitors Ck and CO may be close in magni- tude but voltages Vt and CO are differed more than ten times. The conductor “feels not” the discharge of the triggering capacitor.
21
%
u,
Fig. 16. Electric circuit of Setup 1 for Powder Production-
U
a'
e m +2208
.--c1
2
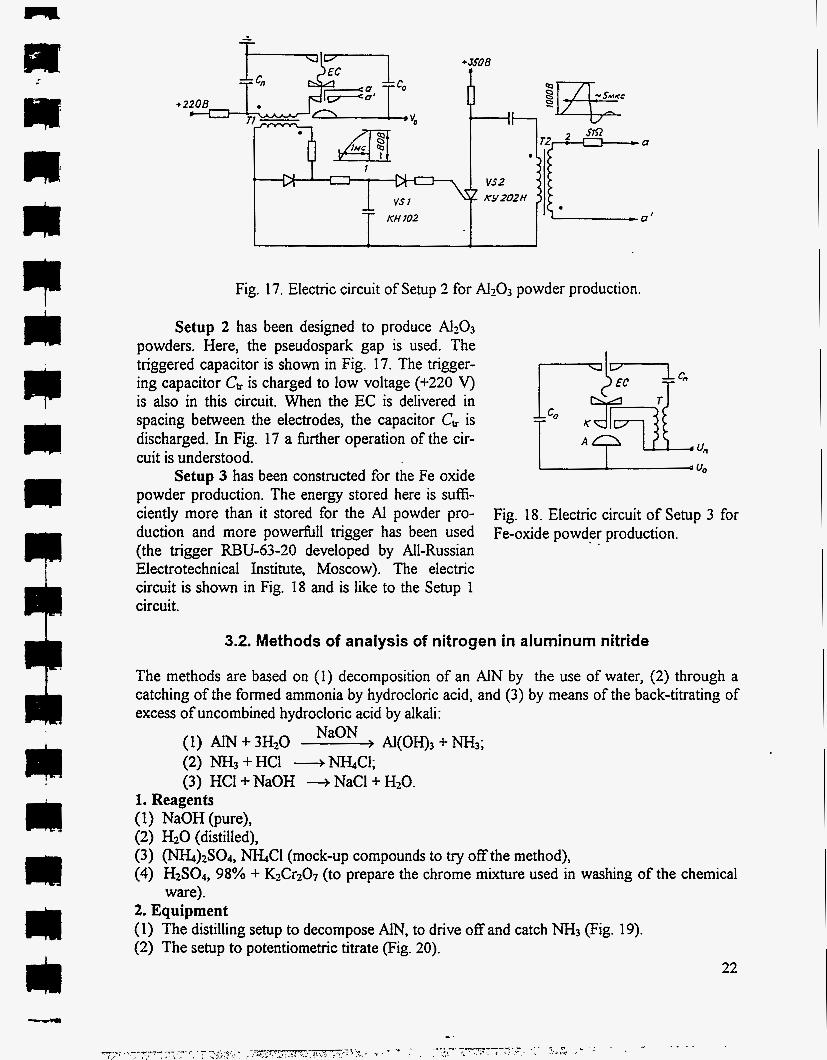
Fig. 17. Electric circuit of Setup 2 for N203 powder production.
Setup 2 has been designed to produce A 1 2 0 3
powders. Here, the pseudospark gap is used. The triggered capacitor is shown in Fig. 17. The trigger- ing capacitor Ct, is charged to low voltage (+220 V) is also in this circuit. When the EC is delivered in spacing between the electrodes, the capacitor Ct, is discharged. In Fig. 17 a hrther operation of the cir- cuit is understood.
Setup 3 has been constructed for the Fe oxide powder production. The energy stored here is suffi- ciently more than it stored for the AI powder pro- duction and more powefill trigger has been used (the trigger MU-63-20 developed by All-Russian Electrotechnical Institute, Moscow). The electric circuit is shown in Fig. 18 and is like to the Setup 1 circuit.
un
UO
Fig. 18. Electric circuit of Setup 3 for Fe-oxide powder production.
3.2. Methods of analysis of nitrogen in aluminum nitride
The methods are based on (1) decomposition of an AIN by the use of water, (2) through a catching of the formed ammonia by hydrocloric acid, and (3) by means of the back-titrating of excess of uncombined hydrocloric acid by alkali:
NaON (1) AIN + 3H2O - A(oH)3 + N H 3 ;
(2) N H 3 + HCI + W C I ; (3) HCI + NaOH + NaCl + HzO.
1. Reagents (1) NaOH (pure), (2) H20 (distilled), (3) (NH4)2S04, W C I (mock-up compounds to try off the method), (4) H2S04, 98% + K2Cr207 (to prepare the chrome mixture used in washing of the chemical
ware). 2. Equipment (1) The distilling setup to decompose AN, to drive off and catch N H 3 (Fig. 19). (2) The setup to potentiometric titrate (Fig. 20).
22
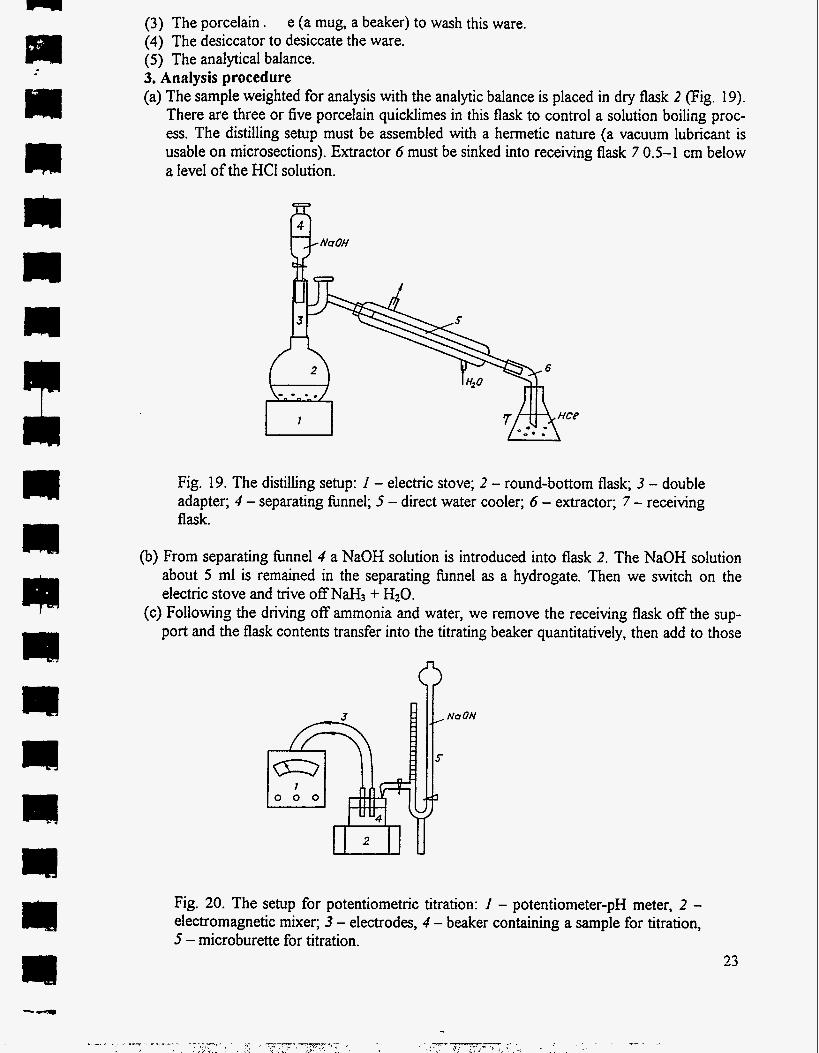
(3) The porcelain . (4) The desiccator to desiccate the ware. (5) The analytical balance. 3. Analysis procedure (a) The sample weighted for analysis with the analytic balance is placed in dry flask 2 (Fig. 19).
There are three or five porcelain quicklimes in this flask to control a solution boiling proc- ess. The distilling setup must be assembled with a hermetic nature (a vacuum lubricant is usable on microsections). Extractor 6 must be sinked into receiving flask 7 0.5-1 cm below a level of the HCI solution.
e (a mug, a beaker) to wash this ware.
Fig. 19. The distilling setup: I - electric stove; 2 - round-bottom flask; 3 - double adapter; 4 - separating funnel; 5 - direct water cooler; 6 - extractor; 7 - receiving flask.
(b) From separating fhnel 4 a NaOH solution is introduced into flask 2. The NaOH solution about 5 ml is remained in the separating funnel as a hydrogate. Then we switch on the electric stove and trive off NaH3 + HzO.
(c) Following the driving off ammonia and water, we remove the receiving flask off the sup- port and the flask contents transfer into the titrating beaker quantitatively, then add to those
Fig. 20. The setup for potentiometric titration: I - potentiometer-pH meter, 2 - electromagnetic mixer; 3 - electrodes, 4 - beaker containing a sample for titration, 5 - microburette for titration.
23

I
I i
I I T tl L I I -r ri I- I L I
r i
an indicator for M additional visual checking. The beaker r.5 rigged on the table of mixer 2 (Fig. 20) and mixing turns on. Titrometry of HCI excess is carried out using the solution NaOH that dispenses from the burette into the beaker and reading the pH-meter indication. Following the titration, the electrodes are taken out of the beaker and washed with H20. Every element of the distilling setup and the titrating beaker are washed with a chrome mixture and H20, then these are dried in the desiccator.
(d) Further, we carry out an idle experiment under (a) and (b) items, in so doing all operations, except the sampling, are repeated. The idle experiment, as well as analysis of the samples, is performed two-three times.
(e) The calculation is performed by the formula:
3 8 ( J ' , , -J',f;z) h
N, % =
Here, V F is the NaOH solution amount (from the burette) spended on titration of the HCl solution which is taken fiom receiving flask (7) in the idle experiment.
(ml) is the NaOH solution amount (from the burette) spended on titration of the HCI solution which is taken fiom the receiving flask and is not reacted with N H 3 in the sample. h (mg) is the sample mass.
Aliquot of the HCI solution for the sample should be equal in value to that for the idle ex- periment in the receiving flask. This method has been tested by the ammonia salts:
N percentage is 21.2 %, N percentage is 26.2 %.
m ) 2 s o 4 , W C I ,
3.3. Determination of specific surface of the samples
The specific surface of the .samples (surface per unit mass) was been determined by the Kly- achko-Gurvich method 1. 133
By this method, the surface of the sample is determined fiom adsorption of air at the temperature of liquid nitrogen. The schematic diagram of the ex- perimental setup is presented in Fig. 2 1.
To determine the specific surface, the weighted sample of mass 100 mg was placed in ampoule 2 which was connected to manometer I . Then the am- poule containing the activated carbon was dipped in liquid nitrogen. Following adsorption by the acti- vated carbon, the liquid nitrogen was removed. As a Fig. 1. The schematic diagram of the pressure in volume reached 100-250 rnm, the am- setup for determination of a surface
per unit m a s of adsorbents. I - ma- poule with a carbon was disconnected and communi- cated with atmosphere. After that the ampoule with nometer to 80 cm, - am- the sample was dipped in the liquid nitrogen. The poule with the - vacuum adsorption value was determined according to the jacket, pressure changing on cooling. The value of specific activated surface of the sample was calculated by the equation
- T-cock - ampoule
24

P I
Material
y, dcm3
n
Al MN A203 Fe FeO Fe304 Fe03
2.7 3.05 3.5-3.9 7.9 5.70 5.18 5.24
I I
U
I I F - IJ n I . I .--
I,,I i ri T
r - 1
Here Ap is the value of the pressure change on cooling of the ampoule with the sample, A p 0 is the value of the pressure change on cooling of the empty ampoule, A and B are the meter's constants, m is the weighted sample, and p I is an end temperature on cooling of the sample.
An error in determination of the specific surface value of the adsorbents is k1 m2/g.
4. RESULTS OF THE EXPERIMENTAL RESEARCH
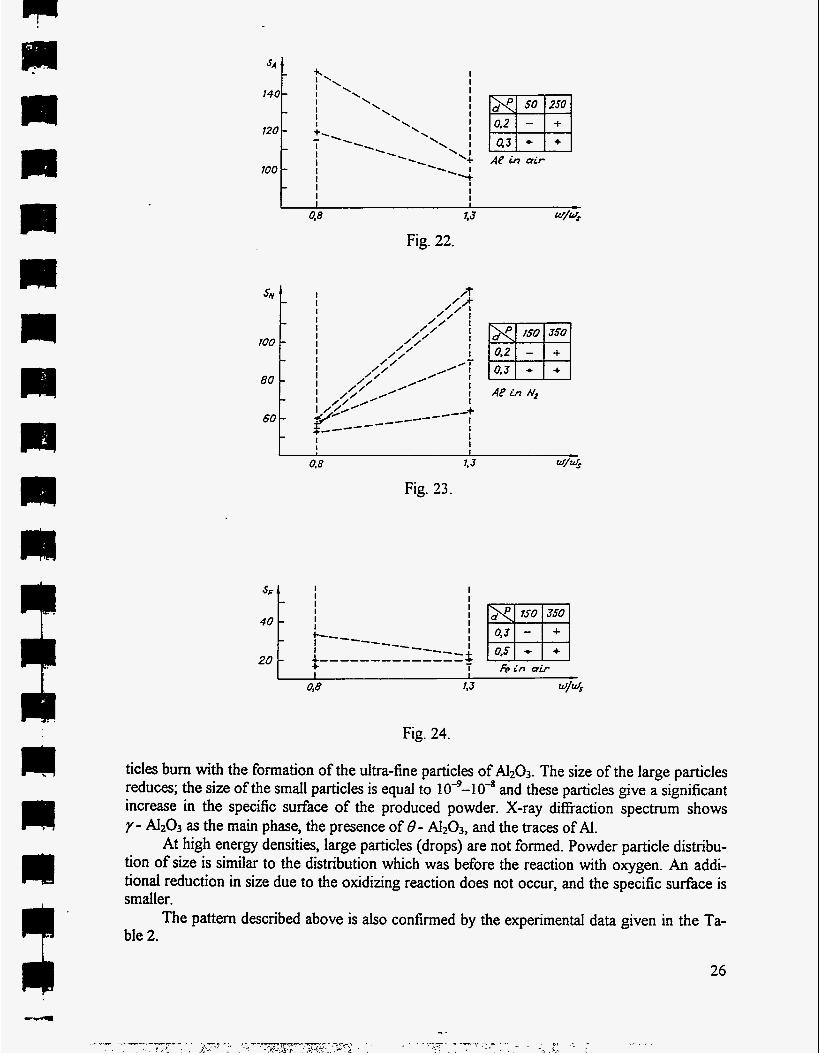
The conducted research represents a three-factor experiment in the coordinates p , d, w h l . The variation range of the coordinates p , d, w h 1 defined previously (see Overview and Research Plan) are shown in Figs. 22-24. The quantity under investigation is the specific surface S (m2/g) of the powder: SA for the aluminum oxides; SN for the samples obtained in the nitrogen medium; SF for iron oxides. Knowing the specific surface of the samples, it is possible to evaluate the mean surface diameter of the particles ds :
6 sv d s = - ,
where y is the material density. The density values of the materials we are interested in are given in Table 1.
Table 1
For some samples the content of nitrogen and phase composition were determined. Phase composition was determined by the x-ray diffraction spectrum in the research laboratory of Tomsk State University. The measurements of the specific surface of the samples were fbl- filled there as well. Determination of the nitrogen content was carried out in the Institute of Petroleum Chemistry.
4.1. Specific surface of the samples
Figures 22-24 show the data on the variation of the specific surface of the powder samples at two value levels of the factorsp, d, w h , . It can be seen that the specific surface varies in the range of SN = 50-130 m2/g when the aluminum based powder is produced in nitrogen. If the powder production takes place in the air, the specific surface varies in the range of SA = 100- 150 m2/g. The specific surface of the iron oxide powder is equal to SF = 34-58 m?g depending on conditions.
The common tendencies formulated previously in Overview are confirmed in case of the aluminum explosion in the nitrogen medium (Fig. 23): the specific surface SN increases as the energy w h ~ increases. It is neceSSary to note that the content of nitrogen in the samples does not exceeds a few percent. The mean surface diameter of the powder particles calculated under the consumption that y= y~ = 2.7 g/cm3 is equal to ds = 18-40 nm.
When the conductor explosion takes place in the oxygen-containing medium, a different pattern is observed (Fig. 22). In this case, an exothermic chemical reaction occurs. At low en- ergy densities w < ws, large metal particles with the size of 104-10-' m a e formed; these par-
I I 25
- - 1 ., . - . -- :- -* .
. . . '. , . I . .
SA
140
120
700
d 50 2so Fl - - - - - - AP in uir
BO
60
0.8 4 4 Fig. 23.
A P i n N,
I
40 t i
Fig. 24.
ticles bum with the formation of the ultra-fine particles of A l 2 0 3 . The size of the large particles reduces; the size of the small particles is equal to 10-9-10-8 and these particles give a significant increase in the specific surface of the produced powder. X-ray difiaction spectrum shows y - A I 2 0 3 as the main phase, the presence of 8 - A l 2 O 3 , and the traces of Al.
At high energy densities, large particles (drops) are not formed. Powder particle distribu- tion of size is similar to the distribution which was before the reaction with oxygen. An addi- tional reduction in size due to the oxidizing reaction does not occur, and the specific surface is smaller.
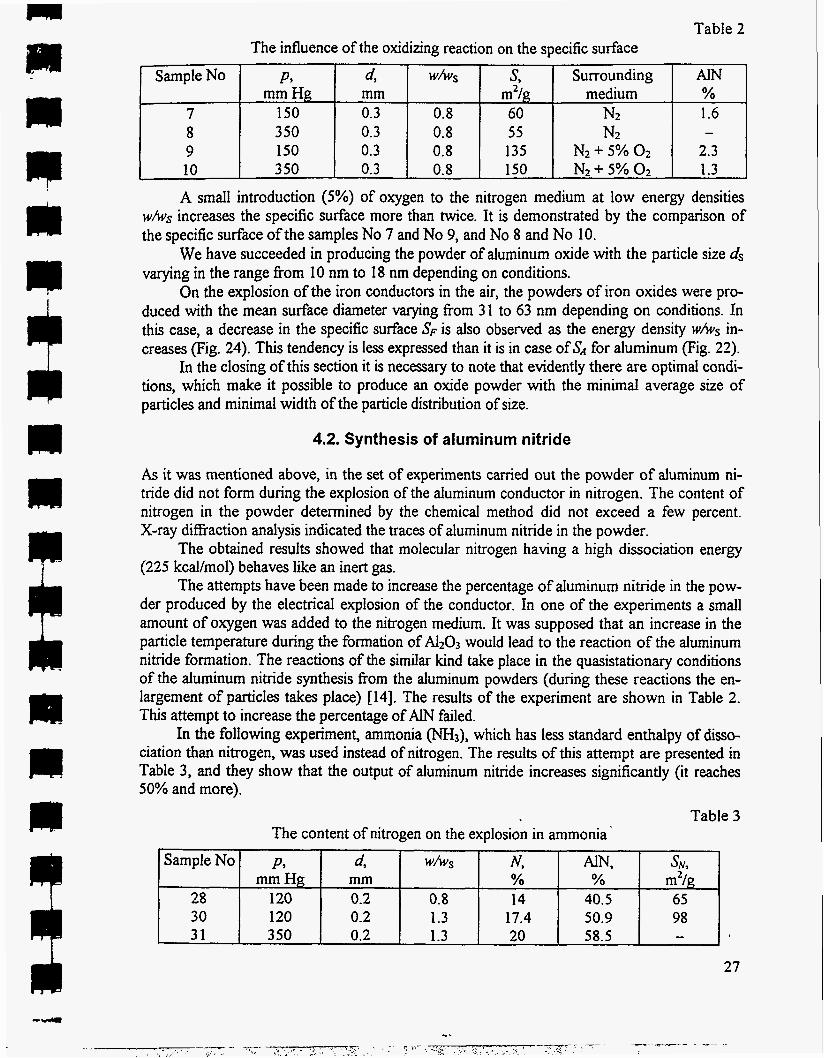
The pattern described above is also confirmed by the experimental data given in the Ta- ble 2.
26
Sample No P,
7 150 8 3 50 9 150 10 350
mm Hg
4.2. Synthesis of aluminum nitride
d, WhS s, Surrounding A N mm m2/g medium % 0.3 0.8 60 N2 1.6 0.3 0.8 55 N2 0.3 0.8 135 N2 + 5% 0 2 2.3 0.3 0.8 150 N2 5% 0 2 1.3
-
As it was mentioned above, in the set of experiments carried out the powder of aluminum ni- tride did not form during the explosion of the aluminum conductor in nitrogen. The content of nitrogen in the powder determined by the chemical method did not exceed a few percent. X-ray difiaction analysis indicated the traces of aluminum nitride in the powder.
The obtained results showed that molecular nitrogen having a high dissociation energy (225 kcal/mol) behaves like an inert gas.
The attempts have been made to increase the percentage of aluminum nitride in the pow- der produced by the electrical explosion of the conductor. In one of the experiments a small amount of oxygen was added to the nitrogen medium. It was supposed that an increase in the particle temperature during the formation of A I 2 0 3 would lead to the reaction of the aluminum nitride formation. The reactions of the similar kind take place in the quasistationary conditions of the aluminum nitride synthesis from the aluminum powders (during these reactions the en- largement of particles takes place) [14]. The results of the experiment are shown in Table 2. This attempt to increase the percentage of AIN failed.
In the following experiment, ammonia ( M I 3 ) , which has less standard enthalpy of disso- ciation than nitrogen, was used instead of nitrogen. The results of this attempt are presented in Table 3, and they show that the output of aluminum nitride increases significantly (it reaches 50% and more).
Table 3 The content of nitrogen on the explosion in ammonia '
SampleNo
28 30 31
p , d, W h S N, AN, SN, mm Hg mm % % m2/g
120 0.2 0.8 14 40.5 65 120 0.2 1.3 17.4 50.9 98 350 0.2 1.3 20 58.5 -
27

n I - I - n
n I I
n
L J i-Ti
I : I
L 4 I. r -1 T i I-. . - I
I I
In this case the value of the specific surface S,V remains high. Therefore, the attempt to use the reaction
2 AI + 2 NH, = 2 AlN + 3 Hz could be considered successful. It seems reasonable to conduct further experiments aimed to increase the output of the AN powder produced in the electrical explosion of a conductor and having a large specific surface.
Summary
1. The line of investigation we chose has led to the following positive results: 0 we have found the conditions of the production of the ultra-fine powders based on alu-
minum and iron with the size of the particles up to 30 nm and less; 0 the installations allow the production of more than 20 @our of the ultra-fine powders
based on aluminum (oxides, nitrides) and more than 50 @our of the iron oxide powder; 0 the cost of one kilogram of the ultra-fine powders does not exceed $1000.
2. The mathematical model has been developed and the processes of the electrical explosion and particle formation have been numerically simulated. The results of the simulation are in good agreement with the experimental results.
3. The conducted investigations allow us to determine a number of technical and theoretical questions, which should be solved in the future.
4. In the course of the investigation new technological regimes and technical approaches have been found that have to be patented. The patent search has been done.
5 . The main task remains to search for commercial applications of the ultra-fine powders. These commercial applications will determine the requirements to the properties of the ul- tra-fine particles, the conditions of their production, and installations.
The installation for the commercial production of the ultra-fine powders should include the following units: 1. A power supply. 2. A capacitive energy storage and a switch. 3. A hermetically sealed explosion chamber with a high voltage and grounded electrodes. 4. A mechanism of wire feed into the interelectrode gap. 5. A chamber for powder collecting. 6 . Vacuum and gas supply systems. 7. A control system.
A more detailed project could be presented if the requirements to the ultra-he powders and the conditions of their production are known. It is neceSSary to note that there are some additional problems to be solved: the weak points are a wire feed system and a system of pow- der collecting.
As a rule, a wire feed system works perfectly if a wire has a relatively large diameter (2 0.5 mm) and is sufficiently strong. If it is necessary to explode a wire with a smaller diame- ter (in our case d 5 0.3 mrn for A), there are difficulties with a continuous feed of a wire into the interelectrode gap. This problem has to be solved.
There is another problem that requires consideration. This is a problem of capturing and collecting of the powder. In the commercial production the ultra-fine powder should be evacuated from the explosion chamber, captured, and precipitated in the other chamber - a powder collecting chamber, which is for avoiding the disruption of the operating regime of the
28

CCI
I ' I
n I I
I-I
nr i I I
- I-
-
explosion chamber, fhe pressure in the chamber is low,,and +he size of the particles is very small. Powder collecting in such conditions is very difficult.
The program of work for the next year Practical questions: 1. Search for and development of applications. Production of the required quantity of the ul-
2. Development of a large-scale production. Designing and testing in the laboratory conditions
3. Investigation and search for the conditions of producting the ultra-fine powders of alumi-
It is also necessary to continue the numerical simulation using available experimental data. The numerical simulation scheme of the processes of the particle formation should include besides MHD-model the following: 1. Nonstationary model of the kinetics of the charge content, because the condensation takes
place mainly on the ions. 2. A model of the drop formation and growth. 3. A model of fiagmentation of the remaining drops. 4. A model of ultra-fine phase formation as a result of chemical condensation of the metal par-
tra-fine powders to obtain samples and their verification.
a wire feed system and a system of powder capturing and collecting.
num nitride.
ticle evaporation products.
References
1. V.I. Oreshkin. - Im. Vyssh. Uchebn. Zaved.: Fizika, 1995, v. 38, pp. 6-15. 2. PhysicaLQuantities. Reference Book. Ed. by I.S. Grigoriev and E.Z. Melnikova. Moscow:
Energoatomizdat, 199 1. 3. S.N. Kolgatin and A.V. Khachaturiants, Interpolation equations of states for metals. -
Teplofizika Vysokikh Temperatur, 1982, v. 20, pp. 447-45 1. 4. S.V. Lebedev and A.I. Sawatimsky, Metals in the process of fast heating by a high-density
electric current. - Usp. Fiz. Nauk, 1984, v. 144, pp. 215-250. 5. Yu.D. Bakulin, V.F. Kuropatenko, and A.V. Luchinsky, Magnetohydrodynamic calcula-
tions of exploding conductors. - Zh. Tekh. Fiz., 1976, v. 46, pp. 1963-1967. 6. A.V. Bushman, G.S. Romanov, and A.S. Smetannikov, Theoretical simulation of the initial
stage of a stratified pulsed discharge, taking into account a realistic equation of state of the conductor. - Teplofizika Vysokikh Temperatur, 1984, v. 22, pp. 849-856.
7. N.N. Kalitin, Properties of Matter and MRHD Codes. Preprint No. 85, Inst. of Applied Mechanics, Moscow, 1978.
8. Yu.A. Kotov and N.A. Yavorslq, Investigation of the particle formed on electrical explo- sion of a conductor. - Fizika i Khimia Obrabotki Materialov, 1978, No. 4, pp. 24-29.
9. V.M. Gremyachkin, A.G. Istratov, and O.J. Leipunsky, On the theory of burning metallic particles. - In: Physical Processes in Combustion and Explosion. Moscow: Atomizdat, 1980, pp. 4-68.
10. Ya.B. Zeldovich and Yu. Raizer, Physics of Shock Waves and High-Temperature Hydro- dynamics Phenomena. Moscow: Nauka, 1966.
11. V.P. Volkov and V.N. Gavrilov, Some aspects of the modeling of the electrical explosion of conductors. 1. Hydrodynamical modeling of the expanding electrical explosion products. Preprint, USSR AS, Urd Division, Sverdlovsk, 199 1.
12. V.P. Volkov, V.N. Gavrilov, and E.A. Litvinov, Hydrodynamics of dispersion of EEC products. Production of thin films and ultra-fine powders. - Teplofizika Vysokikh Tem- peratur, 1992, V. 30, pp. 1203-1208.
29

13. A.L. Klyashko- mination using air adsorption.
14. N. A. Yavorovsky, Producing ultra-dispersed powders by electrical exploding wire. - Izv.
vich, Simple method of surface area dt - Isv. AN SSSR. Otdelenie Khimicheskikh Nauk, 1961, p. 1881.
Vyssh. Uchebn. Zaved.: Fizika, 1996, No 4, pp. 114-136.
30
Related Documents