Miami Valley Commercial Development Assessment Board of Directors September 4, 2008 Martin Kim, Director of Regional Planning

Commercial Development Assessment
Aug 20, 2015
Welcome message from author
This document is posted to help you gain knowledge. Please leave a comment to let me know what you think about it! Share it to your friends and learn new things together.
Transcript

Miami Valley Commercial Development Assessment
Board of DirectorsSeptember 4, 2008
Martin Kim, Director of Regional Planning

Purpose
To examine the Region’s commercial development status as part of “Going Places: An Integrated Land Use Vision for the Miami Valley Region” Provide a comprehensive overview of the current commercial
development conditions in the Region Estimate future commercial development requirements for the
Region
Study Area Greene, Miami and Montgomery counties and cities of
Carlisle, Franklin, and Springboro in Warren County

Report Structure
Introduction Regional Overview Land-Based Analysis Building-Based Analysis Office Market Assessment Retail Market Assessment Vacancy Employment Conclusion

Definition and Data Sources
Commercial land use is defined as “the land and improvements to land which are owned or occupied for general commercial and income producing purposes and where production of income is a factor to be considered in arriving at true value.” (State of Ohio Classification of Real Property)
Office Vacant – Unbuilt Unclassified Commercial Land
Lodging Healthcare
Data Sources Greene, Miami, Montgomery, and Warren Counties Cities of Carlisle, Franklin, and Springboro HUD Gem Real Estate Group OKI and MVRPC
Restaurants Retail

Regional Overview – Historic Trends
The Region gained over 10,000 acres of commercial land between 1975 and 2000
Commercial land has been developed at a much greater rate (148.1%) than non-commercial land (53.2%)
Commercial Land Non-Commercial Land
1975 2000 % Change 1975 2000 % Change
Region 9,310.6 23,099.3 148.1% 101,474.8 155,436.6 53.2%
Greene 1,883.5 3,502.0 85.9% 26,648.6 52,092.5 95.5%
Miami 930.5 2,636.4 183.3% 10,374.6 22,622.5 118.1%
Montgomery 6,496.5 16,960.9 161.1% 64,451.6 80,721.6 25.2%Source: ODNR, 2008; MVRPC, 2008
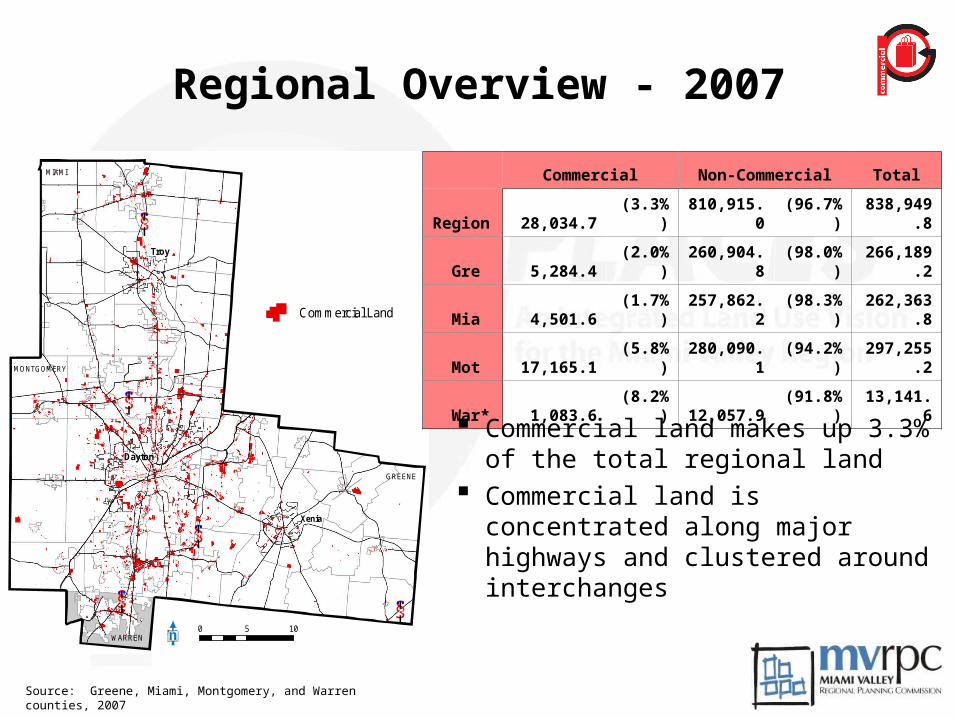
Regional Overview - 2007
Source: Census 1950, 2000* The concept of "Urban Clusters" began in theU.S. Census from the year 2000. The UrbanizedArea shown here for the year 2000 also includesUrban Clusters.
MIAMI
MONTGOMERY
GREENE
WARREN
§̈¦75
§̈¦675
§̈¦70
§̈¦71§̈¦75
Dayton
Troy
Xenia
Commercial Land
0 5 10
Commercial Non-Commercial Total
Region 28,034.7 (3.3%) 810,915.0 (96.7%)838,949.
8
Gre 5,284.4 (2.0%) 260,904.8 (98.0%)266,189.
2
Mia 4,501.6 (1.7%) 257,862.2 (98.3%)262,363.
8
Mot 17,165.1 (5.8%) 280,090.1 (94.2%)297,255.
2
War* 1,083.6 (8.2%) 12,057.9 (91.8%) 13,141.6
Source: Greene, Miami, Montgomery, and Warren counties, 2007
Commercial land makes up 3.3% of the total regional land
Commercial land is concentrated along major highways and clustered around interchanges

Regional Overview
Vacant Land 6,735
(24.0%)
Restaurant 830 (3.0%)
Healthcare 1,544 (5.5%)
Lodging 664 (2.4%)
Retail 5,582
(19.9%)
Office 1,934 (6.9%)
Unclassified10,746 (38.3%)
Source: Greene, Miami, Montgomery, and Warren counties, 2007
Unclassified 35,304,846
(28.0%)
Lodging, 4,612,108
(3.7%)
Healthcare 7,373,876
(5.8%)Restaurant 4,424,119
(3.5%)
Retail 50,901,680
(40.3%)
Office 23,694,569
(18.8%)
Land Based (in acres) Building Based (in sq ft)

Land-Based Analysis
Highlighted areas represent the most concentrated areas of commercial land in the Region
Areas with high concentration of commercial land are found along major roads such as I-75, I-70, I-675 and US 35
The City of Dayton has few significant concentrations of commercial land

Building-Based Analysis
Areas with high concentration of commercial GLA are found along major roadways
Areas with high concentrations of commercial space (Gross Leasable Area) are less spread out than the areas with high concentrations of land
Downtown Dayton does contain a high concentration of commercial space

Market Assessment
Source: Census 1950, 2000* The concept of "Urban Clusters" began in theU.S. Census from the year 2000. The UrbanizedArea shown here for the year 2000 also includesUrban Clusters.
MIAMI
MONTGOMERY
GREENE
WARREN
§̈¦75
§̈¦675
§̈¦70
§̈¦71§̈¦75
Dayton
Troy
Xenia
EAST
NORTH
WEST CENTRAL
SOUTH
0 5 102.5Miles
Office Market Boundaries
O
Source: Greene, Miami, Montgomery, and Warren counties, 2007
Retail MarketsOffice Markets
Source: Census 1950, 2000* The concept of "Urban Clusters" began in theU.S. Census from the year 2000. The UrbanizedArea shown here for the year 2000 also includesUrban Clusters.
MIAMI
MONTGOMERY
GREENE
WARREN
§̈¦75
§̈¦675
§̈¦70
§̈¦71
§̈¦75
Dayton
Troy
Xenia
NORTH
WEST
SOUTH
EAST
CENTRAL
Shopping Center Saturation
3 or more shopping centers
0 shopping centers
Retail Market Boundaries
0 5 10

Office Market Analysis
South market has the most office land per 1,000 employees (17.8 acres) while north (7.8 acres) and east (7.7 acres) markets have the least amount of office land per 1,000 employees
Central (146.3 sq ft) and south (143.1 sq ft) markets have the most office GLA per employee
North East South West Central Region
Market Land Area (Acres) 152,098.0 148,038.0 84,782.4 121,449.0 117,970.0 624,337.4
Office Employees 16,926 14,285 34,675 7,274 111,088 184,248
Finance, Insurance, Real Estate Employees 1,636 976 6,556 765 12,634 22,567Service Employees 15,290 13,309 28,119 6,509 98,454 161,681
Office Land (Acres) 131.9 110.4 615.6 84.6 990.7 1,933.3
% Share of Office Land 6.8% 5.7% 31.8% 4.4% 51.3% 100.0%Office Land per 1,000 Employees (Acres) 7.8 7.7 17.8 11.6 8.9 10.5
Office GLA (Square Feet) 862,745 960,400 4,963,710 652,831 16,254,900 23,694,586
% Share of Office GLA 3.6% 4.1% 20.9% 2.8% 68.6% 100.0%
Office GLA per Employee (Square Feet) 51.0 67.2 143.1 89.7 146.3 128.6
Floor-Area Ratio (FAR) 0.196 0.203 0.222 0.195 0.436 0.328

Retail Market Analysis
North market has the most retail land (10 acres) per capita while East (5.9 acres) and South (5.9 acres) markets have the least
North market has the most retail GLA (75.7 sq ft) per capita while West market (38.1 sq ft) has the least
North East South West Central Region
Market Land Area (Acres) 127,517.1 87,146.8 109,719.3 104,670.6 131,403.0 560,456.7
Population 72,143 162,472 286,763 31,204 258,579 811,161
Population per Square Mile 362 1,193 1,673 191 1,259 926
Retail Employees 8,218 16,339 33,508 1,425 23,193 82,683
Retail Land Area (Acres) 719.7 964.9 1,704.7 255.0 1,794.9 5,439.3
% Share of Retail Land 13.2% 17.7% 31.3% 4.7% 33.0% 100.0%Retail Land per 1,000 Employees (Acres) 87.6 59.1 50.9 179.0 77.4 65.8Retail Land per 1,000 Persons (Acres) 10.0 5.9 5.9 8.2 6.9 6.7
Retail GLA (Square Feet) 5,459,667 9,260,481 19,167,299 1,190,428 16,388,532 51,466,407
% Share of Retail GLA 10.6% 18.0% 37.2% 2.3% 31.8% 100.0%Retail GLA per Employee (Square Feet) 664.4 566.8 572.0 835.4 706.6 622.5
Retail GLA per Person (Square Feet) 75.7 57.0 66.8 38.1 63.4 63.4
Floor-Area Ratio (FAR) 0.198 0.233 0.274 0.110 0.237 0.238

Gem Survey MVRPC Estimate
Retail GLA 21,532,864 55,325,799
Retail Vacant 2,744,533 7,026,376
Vacancy % 12.7% 12.7%
Office GLA 15,033,463 23,694,569
Office Vacant 2,736,411 4,312,412
Vacancy % 18.2% 18.2%
Other GLA - 47,290,830
Other Vacant 7,093,625
Vacancy % - 15.0%Total Vacant 5,480,944 18,432,413
Vacancy
Source: Gem Real Estate Group, 2007Source: Department of Housing and Urban Development, 2008;
United States Postal Service, 2008
MIAMI
MONTGOME RY
GREENE
WARREN
§̈¦75
§̈¦70
§̈¦675
§̈¦75
§̈¦71
Dayton
Troy
Xenia
0 4 82Miles
Business Vacancy Rate
by Census Tract - 2008
Tracts with Regionally andLocally Significant
Business Vacancy Commercial Vacancy Estimates (GLA)

Employment
Source: MVRPC, 2008; Ohio-Kentucky-Indiana Council of Governments, 2008
§̈¦75
§̈¦71
§̈¦70
§̈¦675
§̈¦75
Xenia
Troy
Dayton
MIAMI
MONTGOMERY
GREENE
WARREN0 5 102.5
Miles
Commercial Employment as a Percentageof Total Employment by TAZ in 2005
No Commercial Employment
< 50%
51% - 77%
78% - 92%
Employment is concentrated along major highways and arterial roads
Largest clusters of employment are in eastern Montgomery County, western Greene County, and along I-75 in Miami County
There are few places in the Region that have no commercial employment
Commercial Employment Concentration: 2005

Employment
2010 2020 2030 2040
Greene 49,737 62,054 71,269 84,427
Miami 30,709 35,458 38,805 43,099
Montgomery 204,819 222,399 234,444 243,531
Warren* 8,823 9,958 10,672 11,667
Regional Total 294,088 329,870 355,190 382,724
2010 2020 2030 2040
Greene 53,099 60,566 65,421 74,540
Miami 32,786 34,607 35,620 38,052
Montgomery 218,666 217,065 215,204 215,013
Warren* 8,823 9,958 10,672 11,667
Regional Total 313,374 322,197 326,917 339,272
Historic Commercial Employment
Upper Level Projection
Lower Level Projection
1980 1990 2000 2005
Greene 18,581 29,302 41,890 46,740
Miami 15,254 20,059 27,727 29,021
Montgomery 135,722 172,138 203,542 209,607
Warren* 6,856 8,126
Regional Total** 169,558 221,498 273,159 285,368
Source: MVRPC, 2008; Ohio-Kentucky-Indiana Council of Governments, 2008
Note: *Warren County includes only the cities of Carlisle, Franklin, and Springboro
Regional employment to increase between 8.4% and 30.1%
Growth rates will vary by county: Greene growth rate is expected to be the highest
Summary and Conclusion While population has decreased since 1970, commercial
development in the Region increased 148.1% between 1975 and 2000, while non-commercial development increased only 53.2%
Much of the Region’s commercial land is concentrated adjacent to major highways and arterial roads - The Region’s commercial development is very automobile-dependent
Commercial employment is expected to continue to grow However, it is estimated that there are over 18 million square
feet of vacant commercial space in the Region The Region must re-evaluate the viability of existing
infrastructure so that the Region can continue to offer quality places in which we live, work and do business

Related Documents