Expert and Government Review Comments on the IPCC WGI AR5 Second Order Draft – Chapter 14 Do not Cite, Quote or Distribute Page 1 of 118 Comment No Chapter From Page From Line To Page To Line Comment Response 14-1 14 0 0 0 0 Chapter 14 on the whole is too technical and full of jargon. It uses acronyms throughout - including in the executive summary and without explaining what technical terms mean. [Government of United Kingdom of Great Britain & Northern Ireland] The chapter has undergone major revisions aiming at becoming more compliant with the style of other IPCC reports. We believe that most jargon and technical parts have been revised to be readable to the less technically minded reader. 14-2 14 0 0 0 0 The chapter separates out global climate phenomena from regional climate change. However, there is no adequate 'global picture' to frame discussion of regional impacts and thus it doesn't adequately link global to regional changes and impacts; and is quite repetitive. Would it be possible to merge global with regional somehow - or at least get some cross over to give a better picture of how global processes influence regional changes? Perhaps this could be achieved with a global map which indicates where the different global processes have an effect. [Government of United Kingdom of Great Britain & Northern Ireland] Overall revisions hopefully have eased the linkage between phenomena and regions as well as providing a better global view. Box 14.1 and two new tables introduced as an entry to the regional section has been developed to address the issue put forward in this comment. 14-3 14 0 0 0 0 It is suggested that the Chapter focuses more on projections and deletes observational results. Observational results can be referred from previous chapters, such as Chapters 2 and 10, if they are needed. [Dabang Jiang, China] Much of the observational material has been defered to Supplementary material and a better cross referencing to other chapters is reflecting this comment 14-4 14 0 1 Treatment of Uncertainty - General: please follow the IPCC guidance note carefully; use italics to highlight formal uncertainty assessments; use likelihood in conjunction with high/very high confidence only (except in exceptional cases); if likelihood is given for situations where confidence is less than 'high', we recommend to put confidence in brackets at the end of the sentence rather than combining both confidence and likelihood in text. Please note - usage of the formal terms from the uncertainty guidance note, (egg. "likely", "confidence" etc) should be restricted to the use within statements which report assessment findings. The use of the formal uncertainty language in the ES, and across the chapter in general, needs attention. We have tried to identify a number of problematic statements throughout the text, but ask that the authors careful check all summary statements throughout the chapter and ensure consistency with the IPCC guidance note on the treatment of uncertainty. Ensure any revisions are carried into the ES. Please see further specific problems below. [Thomas Stocker/ WGI TSU, Switzerland] A major effort has gone into this. We now believe that we are basically IPCC uncertainty language compliant 14-5 14 0 2 Treatment of Uncertainty - Specific 1: likelihood statements should be made generally only when there is sufficiently high confidence to support such a statement. There are numerous instances in chapter 14 where the assessment indicates low, or low-medium confidence, yet goes on to provide a likely, or very likely statement. The value of such statements is questionable. [Thomas Stocker/ WGI TSU, Switzerland] A major effort has gone into this. We now believe that we are basically IPCC uncertainty language compliant 14-6 14 0 3 Treatment of Uncertainty - Specific 2: 'as likely as not' is a quantified likelihood statement, and as such, should not be used to express a lack of knowledge. [Thomas Stocker/ WGI TSU, Switzerland] A major effort has gone into this. We now believe that we are basically IPCC uncertainty language compliant 14-7 14 0 4 Treatment of Uncertainty - Specific 3: In general it is preferable to assign a definitive confidence level, rather than providing, egg, medium to high confidence. This gives the impression that either the chapter assessment was unable to reach a consensus on the confidence level, and is unclear - does this imply an in between category of medium/high, or does it mean confidence might range anywhere from medium, up to high?. [Thomas Stocker/ WGI TSU, Switzerland] A major effort has gone into this. We now believe that we are basically IPCC uncertainty language compliant 14-8 14 0 5 Format of Executive Summary (ES): As agreed at the third lead author meeting, we would ask that all chapters follow a consistent style for the ES. 1) The first sentence (or two) of each paragraph should be bolded to highlight the key message, with the subsequent sentences providing the detailed quantitative assessment. 2) Statements should incorporate the IPCC Uncertainty Language 3) Each paragraph must include a traceability to the underlying sections/subsections where the key message was drawn from (to the second level section heading), indicated using square brackets at the end of each paragraph. 3) Paragraphs should be grouped together under subtitles. The use of bullets should be avoided. 4) Finally, because the ES should be short and concise, lengthy textbook or chapeau type introductory text should be avoided. [Thomas Stocker/ WGI TSU, Switzerland] A major effort has gone into this. We now believe that we are basically IPCC uncertainty language compliant 14-9 14 0 6 Section 14.7 - Regional changes: Further homogenisation across the various regional subsections of Section 14.7 should be achieved. Ideally, the same subsection headings should be used across all regions, and a uniform set of temperature and precipitation related quantities (Obs, D&A and Projections) should be A common overall form has been agreed to and is implemented throughout, albeit with certain characteristics reflecting needsidenfified by the

Welcome message from author
This document is posted to help you gain knowledge. Please leave a comment to let me know what you think about it! Share it to your friends and learn new things together.
Transcript
Expert and Government Review Comments on the IPCC WGI AR5 Second Order Draft – Chapter 14
Do not Cite, Quote or Distribute Page 1 of 118
Comment No
Chapter
FromPage
FromLine
To Page
To Line Comment Response
14-1 14 0 0 0 0 Chapter 14 on the whole is too technical and full of jargon. It uses acronyms throughout - including in the executive summary and without explaining what technical terms mean. [Government of United Kingdom of Great Britain & Northern Ireland]
The chapter has undergone major revisions aiming at becoming more compliant with the style of other IPCC reports. We believe that most jargon and technical parts have been revised to be readable to the less technically minded reader.
14-2 14 0 0 0 0 The chapter separates out global climate phenomena from regional climate change. However, there is no adequate 'global picture' to frame discussion of regional impacts and thus it doesn't adequately link global to regional changes and impacts; and is quite repetitive. Would it be possible to merge global with regional somehow - or at least get some cross over to give a better picture of how global processes influence regional changes? Perhaps this could be achieved with a global map which indicates where the different global processes have an effect. [Government of United Kingdom of Great Britain & Northern Ireland]
Overall revisions hopefully have eased the linkage between phenomena and regions as well as providing a better global view. Box 14.1 and two new tables introduced as an entry to the regional section has been developed to address the issue put forward in this comment.
14-3 14 0 0 0 0 It is suggested that the Chapter focuses more on projections and deletes observational results. Observational results can be referred from previous chapters, such as Chapters 2 and 10, if they are needed. [Dabang Jiang, China]
Much of the observational material has been defered to Supplementary material and a better cross referencing to other chapters is reflecting this comment
14-4 14 0 1 Treatment of Uncertainty - General: please follow the IPCC guidance note carefully; use italics to highlight formal uncertainty assessments; use likelihood in conjunction with high/very high confidence only (except in exceptional cases); if likelihood is given for situations where confidence is less than 'high', we recommend to put confidence in brackets at the end of the sentence rather than combining both confidence and likelihood in text. Please note - usage of the formal terms from the uncertainty guidance note, (egg. "likely", "confidence" etc) should be restricted to the use within statements which report assessment findings. The use of the formal uncertainty language in the ES, and across the chapter in general, needs attention. We have tried to identify a number of problematic statements throughout the text, but ask that the authors careful check all summary statements throughout the chapter and ensure consistency with the IPCC guidance note on the treatment of uncertainty. Ensure any revisions are carried into the ES. Please see further specific problems below. [Thomas Stocker/ WGI TSU, Switzerland]
A major effort has gone into this. We now believe that we are basically IPCC uncertainty language compliant
14-5 14 0 2 Treatment of Uncertainty - Specific 1: likelihood statements should be made generally only when there is sufficiently high confidence to support such a statement. There are numerous instances in chapter 14 where the assessment indicates low, or low-medium confidence, yet goes on to provide a likely, or very likely statement. The value of such statements is questionable. [Thomas Stocker/ WGI TSU, Switzerland]
A major effort has gone into this. We now believe that we are basically IPCC uncertainty language compliant
14-6 14 0 3 Treatment of Uncertainty - Specific 2: 'as likely as not' is a quantified likelihood statement, and as such, should not be used to express a lack of knowledge. [Thomas Stocker/ WGI TSU, Switzerland]
A major effort has gone into this. We now believe that we are basically IPCC uncertainty language compliant
14-7 14 0 4 Treatment of Uncertainty - Specific 3: In general it is preferable to assign a definitive confidence level, rather than providing, egg, medium to high confidence. This gives the impression that either the chapter assessment was unable to reach a consensus on the confidence level, and is unclear - does this imply an in between category of medium/high, or does it mean confidence might range anywhere from medium, up to high?. [Thomas Stocker/ WGI TSU, Switzerland]
A major effort has gone into this. We now believe that we are basically IPCC uncertainty language compliant
14-8 14 0 5 Format of Executive Summary (ES): As agreed at the third lead author meeting, we would ask that all chapters follow a consistent style for the ES. 1) The first sentence (or two) of each paragraph should be bolded to highlight the key message, with the subsequent sentences providing the detailed quantitative assessment. 2) Statements should incorporate the IPCC Uncertainty Language 3) Each paragraph must include a traceability to the underlying sections/subsections where the key message was drawn from (to the second level section heading), indicated using square brackets at the end of each paragraph. 3) Paragraphs should be grouped together under subtitles. The use of bullets should be avoided. 4) Finally, because the ES should be short and concise, lengthy textbook or chapeau type introductory text should be avoided. [Thomas Stocker/ WGI TSU, Switzerland]
A major effort has gone into this. We now believe that we are basically IPCC uncertainty language compliant
14-9 14 0 6 Section 14.7 - Regional changes: Further homogenisation across the various regional subsections of Section 14.7 should be achieved. Ideally, the same subsection headings should be used across all regions, and a uniform set of temperature and precipitation related quantities (Obs, D&A and Projections) should be
A common overall form has been agreed to and is implemented throughout, albeit with certain characteristics reflecting needsidenfified by the
Expert and Government Review Comments on the IPCC WGI AR5 Second Order Draft – Chapter 14
Do not Cite, Quote or Distribute Page 2 of 118
Comment No
Chapter
FromPage
FromLine
To Page
To Line Comment Response
assessed across all regions. Currently some sections go into considerable detail repeating projected values that are also available from Table 14.2. To reduce overlap, we suggest that the chapter text is condensed wherever possible, and the reader is simply referred to the Atlas, and Table 14.2 for these values. [Thomas Stocker/ WGI TSU, Switzerland]
relevant authors to handle the regions in concern
14-10 14 0 7 Section 14.7: avoid repeating the assessment of regional observations from Ch2 and global projections from Ch12. In order to reduce the overall overlength of the Chapter we strongly encourage the authors to base their assessment on the, e.g., Ch2/12 assessments and rather than repeat conclusions to simply refer to these Chapters. [Thomas Stocker/ WGI TSU, Switzerland]
We have tried as much as possibly to avoid overlap and some material has been moved to Suppl. Mat.
14-11 14 0 8 Section 14.7: The robustness of the assessment in some cases seems questionable to us, particularly where findings seem to be based on only single studies. [Thomas Stocker/ WGI TSU, Switzerland]
A better and more robust treatment has been agreed to and attempted implemented
14-12 14 0 9 Section 14.7 - figures: Currently this section has 6 figures only which have very different scopes. In order to further homogenise the appearance of this section and to provide the important information from RCMs consistently across the regions, we suggest that you provide figures comparing RCMs to CMIP5 GCMs side by side, for all regions (or continents) where multi-model RCM results are available. Figure 14.33 and 14.37 already go into this direction. On the other hand, the other figures in this section could be replaced. [Thomas Stocker/ WGI TSU, Switzerland]
An attempt to do yhis has been made by using a high resolution GCM ensemble throughout the regional sections and one RCM ensemble for South America
14-13 14 0 10 Vague terminology: The term 'global warming' is used frequently throughout the chapter, particularly in relation to attribution statements. It is not always clear if you mean literally the global increase in temperature (in which case the term is correct), or if you are rather meaning anthropogenic forcing or warming resulting from anthropogenic forcing. Please be explicit in these instances. [Thomas Stocker/ WGI TSU, Switzerland]
The use of this term has been minimized and should now only appear when it is clear from the context how it should be interpreted
14-14 14 0 11 Balance with regard to figures between individual sections needs to be reconsidered. For example, Section 14.6.2 on Additional Phenomena of Relevance: PSA has 3 figures whereas the Box 14.3 on Tropical Cyclones has not a single figure embedded. [Thomas Stocker/ WGI TSU, Switzerland]
An effort to inprove this has been made
14-15 14 0 12 We note an inconsistent application of reference time period throughout the chapter, e.g., sometimes even 1961-1990. Please ensure consistency to the extent possible. [Thomas Stocker/ WGI TSU, Switzerland]
This has been traced and we think we have overcome this issue and hope to be consistent now
14-16 14 0 13 Consistency in assessment numbers: Because chapter assessments continue to be refined, please check carefully all values (and the uncertainty ranges) carefully between tables, figures, main text, and summary text within your chapter. If numbers are taken from other chapters, please also ensure the latest results are used. Specific examples will be highlighted in our chapter comments. [Thomas Stocker/ WGI TSU, Switzerland]
We have tried as much as possibly to make proper cross referencing.
14-17 14 0 14 Cross-chapter references AR5: suggest to update cross-chapter references to not just refer to Chapter number but to refer to specific section if appropriate. [Thomas Stocker/ WGI TSU, Switzerland]
This has been done as far as we have been able to according to the availability of chapters in the final phase of edits
14-18 14 0 15 References to AR4 and earlier IPCC assessments: be as specific as possible. Writing just AR4 without any reference is not useful to the reader. Please refer to specific chapter where possible. [Thomas Stocker/ WGI TSU, Switzerland]
An effort has been made to be more specific, when refering to AR4.
14-19 14 0 16 Use of acronyms: In order to improve overall readability of the report, we would like to suggest that you please avoid acronyms that are not needed and/or are not used in more than one section of your chapter. [Thomas Stocker/ WGI TSU, Switzerland]
Considerable effort has gone into this
14-20 14 0 17 Personal pronouns: our strong preference is to minimize the usage of personal pronouns, e.g., we/us/our to the extent possible. Exceptions to this would be when the Chapter's assessments conclusions are presented as clear summary statements. [Thomas Stocker/ WGI TSU, Switzerland]
AN effort to avoid this language has been made
14-21 14 0 18 Please make sure to provide updates of relevant data from your chapter that will be collected in Annex II - Climate System Scenario Tables, to the Annex II Chair. Also, please take the time to critically check all the entries in Annex II that are based on your Chapter assessment or that you are using in your chapter assessment. [Thomas Stocker/ WGI TSU, Switzerland]
This should now have been handled
14-22 14 0 Some consistency needs to be applied across Ch 2, 9,10,11,12,14 to the index names used for the extremes Need to liaise with Ch2, 9, 12.
Expert and Government Review Comments on the IPCC WGI AR5 Second Order Draft – Chapter 14
Do not Cite, Quote or Distribute Page 3 of 118
Comment No
Chapter
FromPage
FromLine
To Page
To Line Comment Response
indices. For instance, annual maximum 5-day rainfall is referred to as R5dmax in Ch 12, RX5day in Ch 9, and R5d in Ch 14, and the warmest 10% of nights as TN90 in Ch10 and TN90p in Ch 2. This should be coordinated amongst all relevant chapters. [Lisa Alexander, Australia]
14-23 14 0 Some extremes indices are introduced in the text e.g. CWD, R95 without explanation. In some cases these could be cross-referenced with Box 2.4 but otherwise explanation of what these indices are is required in the text. [Lisa Alexander, Australia]
Need to liaise with Ch2, 9, 12.
14-24 14 0 Here’s an excerpt from the spreadsheet: MODTRAN tropical atmosphere, clear sky Temp offset from 299.7K @ Iout=287.655 CO2 (ppm) description const H2O pressure const rel hum 0 no CO2 -7.47 -12.40 19.6 half of current warming -3.74 -6.12 285 est. pre-industrial -0.40 -0.66 300 est. 1900 -0.34 -0.56 305 est. 1930 -0.32 -0.53 310 est. 1950 -0.30 -0.49 315 1958, first Mauna Loa meas. -0.28 -0.46 392 current (Mauna Loa) 0 0 570 est. doubling vs. pre-indust. 0.48 0.79 Note the 2nd line in the table, for just 19.6 ppm CO2. MODTRAN calculates that that’s all the CO2 that would be needed to generate fully half of the warming which our current 392 ppm gives us. The diminishing effect of additional CO2 is because there’s already more than enough CO2 in the atmosphere to make it almost completely opaque in CO2′s main absorption bands. [David Burton, United States of America]
The CO2 issue is discussed elsewhere in this report
14-25 14 0 The uncertainty language used throughout the Executive Summary is confusing, mixing likelihood with confidence statements. For example, I'm not sure how to interpret high confidence in something being very likely or medium confidence in something being likely. There are many other examples like this or even more difficult to interpret. [Timothy Carter, Finland]
As per TSU comments
14-26 14 0 REFERENCES [Jhan Carlo Espinoza, Peru] Some of these References were included in the main text or in the supplementary Information.
14-27 14 0 -Chen, J. L., Wilson, CR., Tapley, DB. 2010. The 2009 exceptional Amazon flood and interannual terrestrial water storage change observed by GRACE, Water Resources, 46, 1-10, doi:10.1029/2010WR009383. [Jhan Carlo Espinoza, Peru]
Some of these References were included in the main text or in the supplementary Information.
14-28 14 0 -Cox PM, Harris PP, Huntingford C, Betts RA, Collins M, Jones CD, Jupp TE, Marengo JA, Nobre CA. 2008. Increasing risk of Amazonian drought due to decreasing aerosol pollution. Nature 453:U212–U217. [Jhan Carlo Espinoza, Peru]
Some of these References were included in the main text or in the supplementary Information.
14-29 14 0 -Espinoza, JC., Guyot, J-L., Ronchail, J. Cochonneau, G., Filizola, N., Fraizy, P., de Oliveira, E., Ordoñez, J.J., Vauchel, P. 2009b. Contrasting regional discharge evolutions in the Amazon basin (1974-2004). Journal of Hydrology 375: 297–311. [Jhan Carlo Espinoza, Peru]
Some of these References were included in the main text or in the supplementary Information.
14-30 14 0 -Espinoza, JC., J. Ronchail, J. L. Guyot, C. Junquas, P. Vauchel, W. Lavado, G. Drapeau, R. Pombosa. 2011a. Climate variability and extreme drought in the upper Solimões River (western Amazon Basin): Understanding the exceptional 2010 drought, Geophysical Research Letters, 38(13), 1-6, doi:10.1029/2011GL047862. [Jhan Carlo Espinoza, Peru]
Some of these References were included in the main text or in the supplementary Information.
14-31 14 0 -Lewis SL., Brando PM., Phillips OL., van der Heijden GMF., Nepstad D. 2011. The 2010 Amazon drought. Sience. 311, 554. DOI. 10.1126/science.1200807. [Jhan Carlo Espinoza, Peru]
Some of these References were included in the main text or in the supplementary Information.
14-32 14 0 -Marengo, J., Nobre, C., Tomasella, J., Oyama, M., de Oliveira, G., de Oliveira, R., Camargo, H., Alves, L. 2008. The drought in Amazonia in 2005. Journal of Climate, 21:495–516. [Jhan Carlo Espinoza, Peru]
Some of these References were included in the main text or in the supplementary Information.
Expert and Government Review Comments on the IPCC WGI AR5 Second Order Draft – Chapter 14
Do not Cite, Quote or Distribute Page 4 of 118
Comment No
Chapter
FromPage
FromLine
To Page
To Line Comment Response
14-33 14 0 -Marengo, J. A., Tomasella, J., Soares, WR., Alves, LM., Nobre C. 2011a. Extreme climatic events in the Amazon basin, Theoretical and Applied Climatology, doi:10.1007/s00704-011-0465-1. [Jhan Carlo Espinoza, Peru]
Some of these References were included in the main text or in the supplementary Information.
14-34 14 0 -Marengo, J. A., Tomasella, J., Alves, LM., Soares, WR., Rodriguez, DA. 2011b. The drought of 2010 in the context of historical droughts in the Amazon region. Geophysical Research Letters, 38(13), doi:10.1029/2011GL047436. [Jhan Carlo Espinoza, Peru]
Some of these References were included in the main text or in the supplementary Information.
14-35 14 0 -Zeng, N., Yoon, J., Marengo, J., Subramaniam, A., Nobre, C., Mariotti, A., and Neelin, J. 2008. Causes and impact of the 2005 Amazon drought. Environmental Research Letters, 3: 99pp. [Jhan Carlo Espinoza, Peru]
Some of these References were included in the main text or in the supplementary Information.
14-36 14 0 Espinoza JC., J. Ronchail, J.L. Guyot, Cocheneau G., N Filizola, W. Lavado, E. de Oliveira, R. Pombosa and P. Vauchel. 2009a. Spatio – Temporal rainfall variability in the Amazon Basin Countries (Brazil, Peru, Bolivia, Colombia and Ecuador). International Journal of Climatology, 29, 1574-1594 [Jhan Carlo Espinoza, Peru]
Some of these References were included in the main text or in the supplementary Information.
14-37 14 0 Ken Takahashi, 2004: The atmospheric circulation associated with extreme rainfall events in Piura, Peru, during the 1997-98 and 2002 El Niño events. Annales Geophysicae 22, 3917-26. [Jhan Carlo Espinoza, Peru]
Some of these References were included in the main text or in the supplementary Information.
14-38 14 0 Aceituno P. 1988. On the functioning of the Southern Oscillation in the South American sector. Part 1: surface climate. Monthly Weather Review 116: 505–524 [Jhan Carlo Espinoza, Peru]
Some of these References were included in the main text or in the supplementary Information.
14-39 14 0 Lagos P, Silva Y, Nickl E, Mosquera K. 2008. El Niño-related precipitation variability in Peru. Advances in Geosciences 14: 231–237. [Jhan Carlo Espinoza, Peru]
Some of these References were included in the main text or in the supplementary Information.
14-40 14 0 Espinoza JC., Ronchail J., Guyot JL., Junquas C., Drapeau G., Martinez JM., Santini W., Vauchel P., Lavado W., Ordoñez J., Espinoza R. 2012. From drought to flooding: understanding the abrupt 2010-2011 hydrological annual cycle in the Amazonas River and tributaries. Environmental Research Letters 7 024008. doi:10.1088/1748-9326/7/2/024008 [Jhan Carlo Espinoza, Peru]
Some of these References were included in the main text or in the supplementary Information.
14-41 14 0 Yoon JH, Zeng H. 2010. An Atlantic influence on Amazon rainfall. Climate Dynamics 34: 249–264. [Jhan Carlo Espinoza, Peru]
Some of these References were included in the main text or in the supplementary Information.
14-42 14 0 This chapter is unevenly written from an English language perspective; some sentences throughout are awkward and a few do not make sense. I have only drawn attention to a few. English speaking Review Editors need to go through the revised chapter in detail to bring it up to standard. [Christopher Folland, United Kingdom of Great Britain & Northern Ireland]
Much more proof-reading needed this time around
14-43 14 0 This chapter deals with Europe and Mediterranean area. Numerous papers have been published in international journals (Clim Dyn, Global and Planetary Change,, GRL, J. Climate) and should be cited . [Government of France]
An effort to reflect this will be made, but maintaining the balance between phenomena and the regions is needed.
14-44 14 0 There are plenty of abreviations that are not explained. Please do this in this chapter, in the Glossary and also in the annex on abreviations, that is not yet existing, but has been agreed by the Plenary. [Government of Germany]
An effort to improve this has been made
14-45 14 0 The Likelihood Table (Table 1.1) and Confidence figure (1.12) should be repeated in the SPM, TS and each Chapter and the terminology should be applied consistently. As an alternative to repeating the complete table/figure the material should be restated briefly in the SPM, TS, and each chapter. [Government of United States of America]
An effort to improve this has been made
14-46 14 0 Many acronyms are undefined before used in this chapter. Include brief parenthetical definitions of, e.g. ITCZ, SPCZ, SAM, ENSO, NAO,PSA, …, and others, or else add these to the glossary. [Government of United States of America]
The Definition of ITCS, SPCZ, SAM, ENSO, NAO and PSA will be added to glossary. AN effort was made to introduce or cross reference to definitions, when introduced.
14-47 14 0 The word "substantially" is used for emphasis repeatedly in this chapter, however, I do not know what it actually means in its useage. Suggest deleting throughout (or replacing with a provable/disprovable word) as it is not apparent to me how scientifically one would either prove or disprove whether each of these statements deserve to be considered substantial or not, and it is not a term used commonly in the rest of the assessment.
The usage of this word has been revisited and avoided if not needed
Expert and Government Review Comments on the IPCC WGI AR5 Second Order Draft – Chapter 14
Do not Cite, Quote or Distribute Page 5 of 118
Comment No
Chapter
FromPage
FromLine
To Page
To Line Comment Response
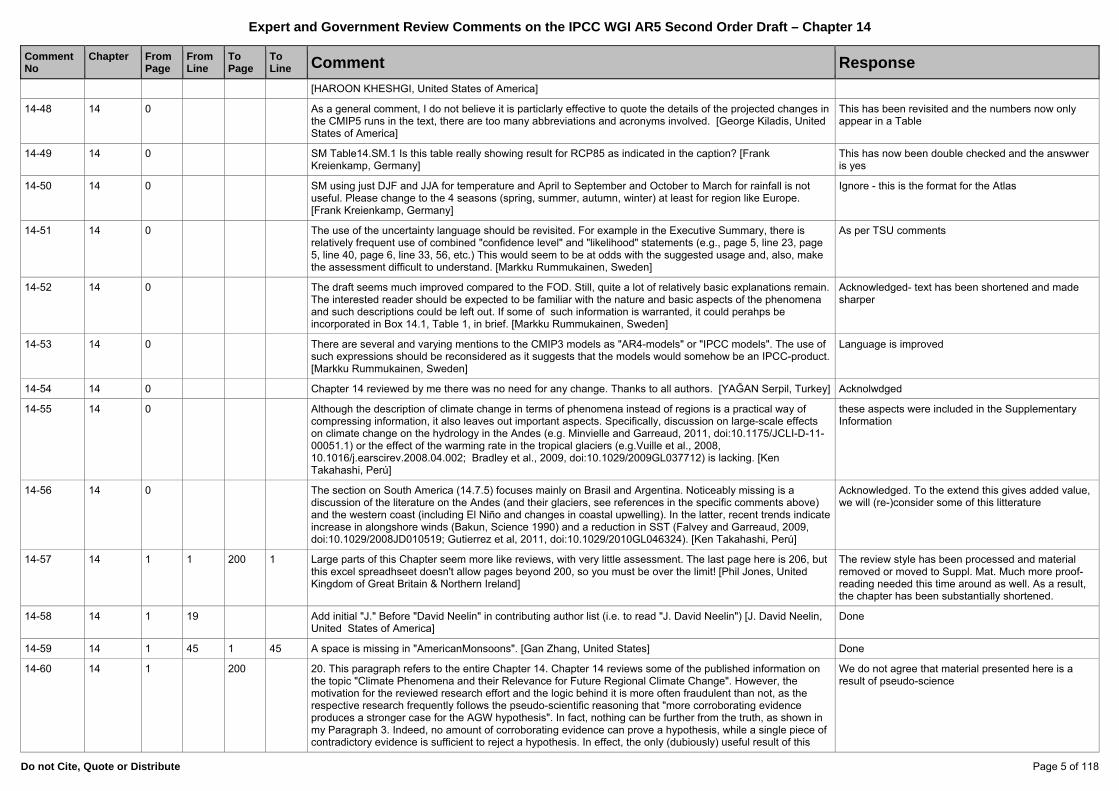
[HAROON KHESHGI, United States of America]
14-48 14 0 As a general comment, I do not believe it is particlarly effective to quote the details of the projected changes in the CMIP5 runs in the text, there are too many abbreviations and acronyms involved. [George Kiladis, United States of America]
This has been revisited and the numbers now only appear in a Table
14-49 14 0 SM Table14.SM.1 Is this table really showing result for RCP85 as indicated in the caption? [Frank Kreienkamp, Germany]
This has now been double checked and the answwer is yes
14-50 14 0 SM using just DJF and JJA for temperature and April to September and October to March for rainfall is not useful. Please change to the 4 seasons (spring, summer, autumn, winter) at least for region like Europe. [Frank Kreienkamp, Germany]
Ignore - this is the format for the Atlas
14-51 14 0 The use of the uncertainty language should be revisited. For example in the Executive Summary, there is relatively frequent use of combined "confidence level" and "likelihood" statements (e.g., page 5, line 23, page 5, line 40, page 6, line 33, 56, etc.) This would seem to be at odds with the suggested usage and, also, make the assessment difficult to understand. [Markku Rummukainen, Sweden]
As per TSU comments
14-52 14 0 The draft seems much improved compared to the FOD. Still, quite a lot of relatively basic explanations remain. The interested reader should be expected to be familiar with the nature and basic aspects of the phenomena and such descriptions could be left out. If some of such information is warranted, it could perahps be incorporated in Box 14.1, Table 1, in brief. [Markku Rummukainen, Sweden]
Acknowledged- text has been shortened and made sharper
14-53 14 0 There are several and varying mentions to the CMIP3 models as "AR4-models" or "IPCC models". The use of such expressions should be reconsidered as it suggests that the models would somehow be an IPCC-product. [Markku Rummukainen, Sweden]
Language is improved
14-54 14 0 Chapter 14 reviewed by me there was no need for any change. Thanks to all authors. [YAĞAN Serpil, Turkey] Acknolwdged
14-55 14 0 Although the description of climate change in terms of phenomena instead of regions is a practical way of compressing information, it also leaves out important aspects. Specifically, discussion on large-scale effects on climate change on the hydrology in the Andes (e.g. Minvielle and Garreaud, 2011, doi:10.1175/JCLI-D-11-00051.1) or the effect of the warming rate in the tropical glaciers (e.g.Vuille et al., 2008, 10.1016/j.earscirev.2008.04.002; Bradley et al., 2009, doi:10.1029/2009GL037712) is lacking. [Ken Takahashi, Perú]
these aspects were included in the Supplementary Information
14-56 14 0 The section on South America (14.7.5) focuses mainly on Brasil and Argentina. Noticeably missing is a discussion of the literature on the Andes (and their glaciers, see references in the specific comments above) and the western coast (including El Niño and changes in coastal upwelling). In the latter, recent trends indicate increase in alongshore winds (Bakun, Science 1990) and a reduction in SST (Falvey and Garreaud, 2009, doi:10.1029/2008JD010519; Gutierrez et al, 2011, doi:10.1029/2010GL046324). [Ken Takahashi, Perú]
Acknowledged. To the extend this gives added value, we will (re-)consider some of this litterature
14-57 14 1 1 200 1 Large parts of this Chapter seem more like reviews, with very little assessment. The last page here is 206, but this excel spreadhseet doesn't allow pages beyond 200, so you must be over the limit! [Phil Jones, United Kingdom of Great Britain & Northern Ireland]
The review style has been processed and material removed or moved to Suppl. Mat. Much more proof-reading needed this time around as well. As a result, the chapter has been substantially shortened.
14-58 14 1 19 Add initial "J." Before "David Neelin" in contributing author list (i.e. to read "J. David Neelin") [J. David Neelin, United States of America]
Done
14-59 14 1 45 1 45 A space is missing in "AmericanMonsoons". [Gan Zhang, United States] Done
14-60 14 1 200 20. This paragraph refers to the entire Chapter 14. Chapter 14 reviews some of the published information on the topic "Climate Phenomena and their Relevance for Future Regional Climate Change". However, the motivation for the reviewed research effort and the logic behind it is more often fraudulent than not, as the respective research frequently follows the pseudo-scientific reasoning that "more corroborating evidence produces a stronger case for the AGW hypothesis". In fact, nothing can be further from the truth, as shown in my Paragraph 3. Indeed, no amount of corroborating evidence can prove a hypothesis, while a single piece of contradictory evidence is sufficient to reject a hypothesis. In effect, the only (dubiously) useful result of this
We do not agree that material presented here is a result of pseudo-science
Expert and Government Review Comments on the IPCC WGI AR5 Second Order Draft – Chapter 14
Do not Cite, Quote or Distribute Page 6 of 118
Comment No
Chapter
FromPage
FromLine
To Page
To Line Comment Response
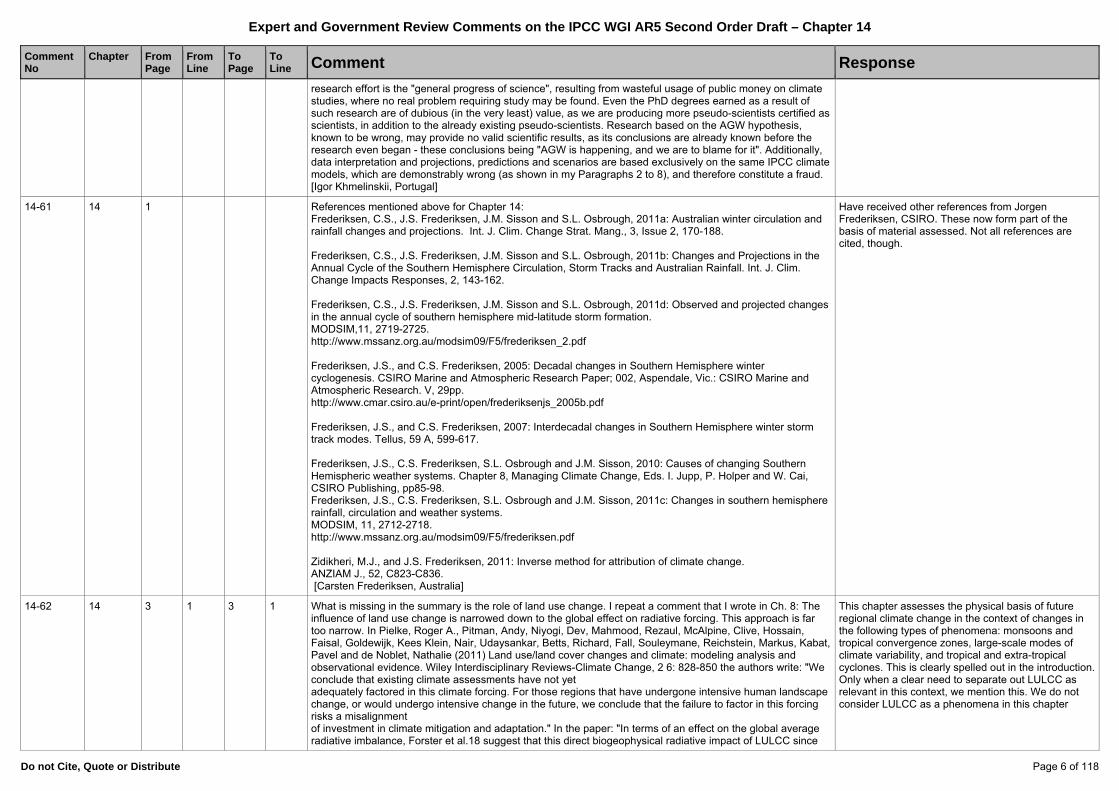
research effort is the "general progress of science", resulting from wasteful usage of public money on climate studies, where no real problem requiring study may be found. Even the PhD degrees earned as a result of such research are of dubious (in the very least) value, as we are producing more pseudo-scientists certified as scientists, in addition to the already existing pseudo-scientists. Research based on the AGW hypothesis, known to be wrong, may provide no valid scientific results, as its conclusions are already known before the research even began - these conclusions being "AGW is happening, and we are to blame for it". Additionally, data interpretation and projections, predictions and scenarios are based exclusively on the same IPCC climate models, which are demonstrably wrong (as shown in my Paragraphs 2 to 8), and therefore constitute a fraud. [Igor Khmelinskii, Portugal]
14-61 14 1 References mentioned above for Chapter 14: Frederiksen, C.S., J.S. Frederiksen, J.M. Sisson and S.L. Osbrough, 2011a: Australian winter circulation and rainfall changes and projections. Int. J. Clim. Change Strat. Mang., 3, Issue 2, 170-188. Frederiksen, C.S., J.S. Frederiksen, J.M. Sisson and S.L. Osbrough, 2011b: Changes and Projections in the Annual Cycle of the Southern Hemisphere Circulation, Storm Tracks and Australian Rainfall. Int. J. Clim. Change Impacts Responses, 2, 143-162. Frederiksen, C.S., J.S. Frederiksen, J.M. Sisson and S.L. Osbrough, 2011d: Observed and projected changes in the annual cycle of southern hemisphere mid-latitude storm formation. MODSIM,11, 2719-2725. http://www.mssanz.org.au/modsim09/F5/frederiksen_2.pdf Frederiksen, J.S., and C.S. Frederiksen, 2005: Decadal changes in Southern Hemisphere winter cyclogenesis. CSIRO Marine and Atmospheric Research Paper; 002, Aspendale, Vic.: CSIRO Marine and Atmospheric Research. V, 29pp. http://www.cmar.csiro.au/e-print/open/frederiksenjs_2005b.pdf Frederiksen, J.S., and C.S. Frederiksen, 2007: Interdecadal changes in Southern Hemisphere winter storm track modes. Tellus, 59 A, 599-617. Frederiksen, J.S., C.S. Frederiksen, S.L. Osbrough and J.M. Sisson, 2010: Causes of changing Southern Hemispheric weather systems. Chapter 8, Managing Climate Change, Eds. I. Jupp, P. Holper and W. Cai, CSIRO Publishing, pp85-98. Frederiksen, J.S., C.S. Frederiksen, S.L. Osbrough and J.M. Sisson, 2011c: Changes in southern hemisphere rainfall, circulation and weather systems. MODSIM, 11, 2712-2718. http://www.mssanz.org.au/modsim09/F5/frederiksen.pdf Zidikheri, M.J., and J.S. Frederiksen, 2011: Inverse method for attribution of climate change. ANZIAM J., 52, C823-C836. [Carsten Frederiksen, Australia]
Have received other references from Jorgen Frederiksen, CSIRO. These now form part of the basis of material assessed. Not all references are cited, though.
14-62 14 3 1 3 1 What is missing in the summary is the role of land use change. I repeat a comment that I wrote in Ch. 8: The influence of land use change is narrowed down to the global effect on radiative forcing. This approach is far too narrow. In Pielke, Roger A., Pitman, Andy, Niyogi, Dev, Mahmood, Rezaul, McAlpine, Clive, Hossain, Faisal, Goldewijk, Kees Klein, Nair, Udaysankar, Betts, Richard, Fall, Souleymane, Reichstein, Markus, Kabat, Pavel and de Noblet, Nathalie (2011) Land use/land cover changes and climate: modeling analysis and observational evidence. Wiley Interdisciplinary Reviews-Climate Change, 2 6: 828-850 the authors write: "We conclude that existing climate assessments have not yet adequately factored in this climate forcing. For those regions that have undergone intensive human landscape change, or would undergo intensive change in the future, we conclude that the failure to factor in this forcing risks a misalignment of investment in climate mitigation and adaptation." In the paper: "In terms of an effect on the global average radiative imbalance, Forster et al.18 suggest that this direct biogeophysical radiative impact of LULCC since
This chapter assesses the physical basis of future regional climate change in the context of changes in the following types of phenomena: monsoons and tropical convergence zones, large-scale modes of climate variability, and tropical and extra-tropical cyclones. This is clearly spelled out in the introduction. Only when a clear need to separate out LULCC as relevant in this context, we mention this. We do not consider LULCC as a phenomena in this chapter
Expert and Government Review Comments on the IPCC WGI AR5 Second Order Draft – Chapter 14
Do not Cite, Quote or Distribute Page 7 of 118
Comment No
Chapter
FromPage
FromLine
To Page
To Line Comment Response
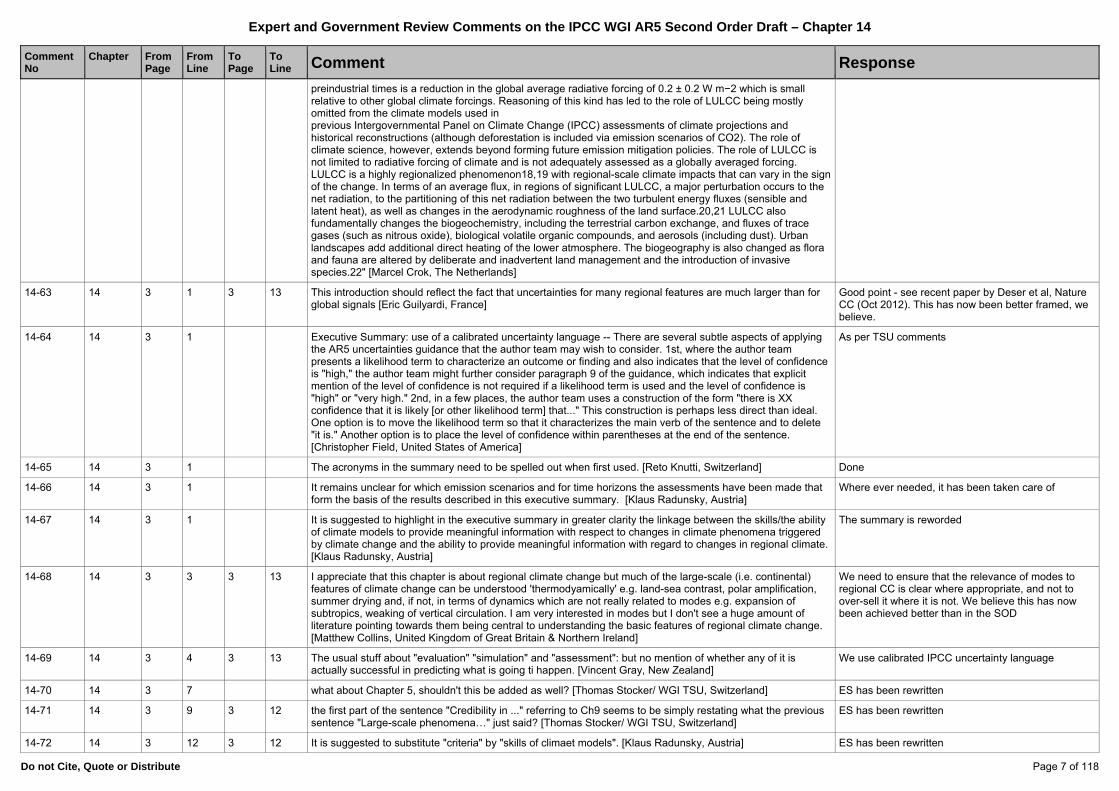
preindustrial times is a reduction in the global average radiative forcing of 0.2 ± 0.2 W m−2 which is small relative to other global climate forcings. Reasoning of this kind has led to the role of LULCC being mostly omitted from the climate models used in previous Intergovernmental Panel on Climate Change (IPCC) assessments of climate projections and historical reconstructions (although deforestation is included via emission scenarios of CO2). The role of climate science, however, extends beyond forming future emission mitigation policies. The role of LULCC is not limited to radiative forcing of climate and is not adequately assessed as a globally averaged forcing. LULCC is a highly regionalized phenomenon18,19 with regional-scale climate impacts that can vary in the sign of the change. In terms of an average flux, in regions of significant LULCC, a major perturbation occurs to the net radiation, to the partitioning of this net radiation between the two turbulent energy fluxes (sensible and latent heat), as well as changes in the aerodynamic roughness of the land surface.20,21 LULCC also fundamentally changes the biogeochemistry, including the terrestrial carbon exchange, and fluxes of trace gases (such as nitrous oxide), biological volatile organic compounds, and aerosols (including dust). Urban landscapes add additional direct heating of the lower atmosphere. The biogeography is also changed as flora and fauna are altered by deliberate and inadvertent land management and the introduction of invasive species.22" [Marcel Crok, The Netherlands]
14-63 14 3 1 3 13 This introduction should reflect the fact that uncertainties for many regional features are much larger than for global signals [Eric Guilyardi, France]
Good point - see recent paper by Deser et al, Nature CC (Oct 2012). This has now been better framed, we believe.
14-64 14 3 1 Executive Summary: use of a calibrated uncertainty language -- There are several subtle aspects of applying the AR5 uncertainties guidance that the author team may wish to consider. 1st, where the author team presents a likelihood term to characterize an outcome or finding and also indicates that the level of confidence is "high," the author team might further consider paragraph 9 of the guidance, which indicates that explicit mention of the level of confidence is not required if a likelihood term is used and the level of confidence is "high" or "very high." 2nd, in a few places, the author team uses a construction of the form "there is XX confidence that it is likely [or other likelihood term] that..." This construction is perhaps less direct than ideal. One option is to move the likelihood term so that it characterizes the main verb of the sentence and to delete "it is." Another option is to place the level of confidence within parentheses at the end of the sentence. [Christopher Field, United States of America]
As per TSU comments
14-65 14 3 1 The acronyms in the summary need to be spelled out when first used. [Reto Knutti, Switzerland] Done
14-66 14 3 1 It remains unclear for which emission scenarios and for time horizons the assessments have been made that form the basis of the results described in this executive summary. [Klaus Radunsky, Austria]
Where ever needed, it has been taken care of
14-67 14 3 1 It is suggested to highlight in the executive summary in greater clarity the linkage between the skills/the ability of climate models to provide meaningful information with respect to changes in climate phenomena triggered by climate change and the ability to provide meaningful information with regard to changes in regional climate. [Klaus Radunsky, Austria]
The summary is reworded
14-68 14 3 3 3 13 I appreciate that this chapter is about regional climate change but much of the large-scale (i.e. continental) features of climate change can be understood 'thermodyamically' e.g. land-sea contrast, polar amplification, summer drying and, if not, in terms of dynamics which are not really related to modes e.g. expansion of subtropics, weaking of vertical circulation. I am very interested in modes but I don't see a huge amount of literature pointing towards them being central to understanding the basic features of regional climate change. [Matthew Collins, United Kingdom of Great Britain & Northern Ireland]
We need to ensure that the relevance of modes to regional CC is clear where appropriate, and not to over-sell it where it is not. We believe this has now been achieved better than in the SOD
14-69 14 3 4 3 13 The usual stuff about "evaluation" "simulation" and "assessment": but no mention of whether any of it is actually successful in predicting what is going ti happen. [Vincent Gray, New Zealand]
We use calibrated IPCC uncertainty language
14-70 14 3 7 what about Chapter 5, shouldn't this be added as well? [Thomas Stocker/ WGI TSU, Switzerland] ES has been rewritten
14-71 14 3 9 3 12 the first part of the sentence "Credibility in ..." referring to Ch9 seems to be simply restating what the previous sentence "Large-scale phenomena…" just said? [Thomas Stocker/ WGI TSU, Switzerland]
ES has been rewritten
14-72 14 3 12 3 12 It is suggested to substitute "criteria" by "skills of climaet models". [Klaus Radunsky, Austria] ES has been rewritten
Expert and Government Review Comments on the IPCC WGI AR5 Second Order Draft – Chapter 14
Do not Cite, Quote or Distribute Page 8 of 118
Comment No
Chapter
FromPage
FromLine
To Page
To Line Comment Response
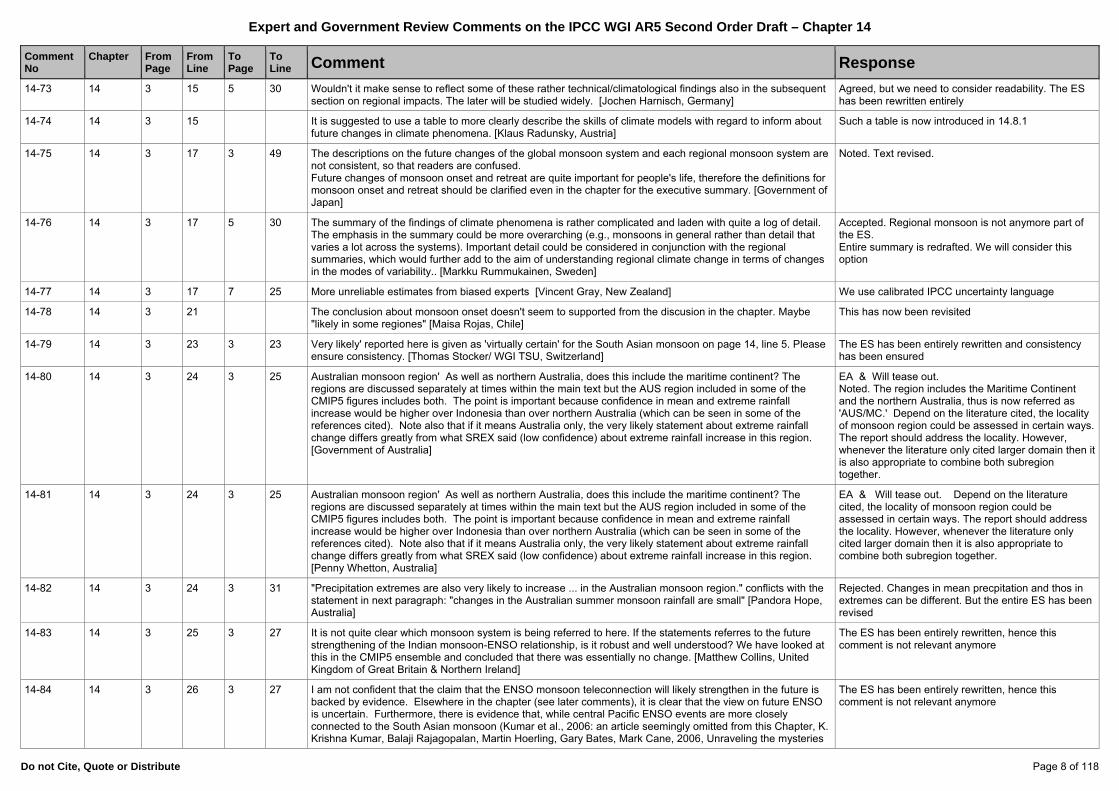
14-73 14 3 15 5 30 Wouldn't it make sense to reflect some of these rather technical/climatological findings also in the subsequent section on regional impacts. The later will be studied widely. [Jochen Harnisch, Germany]
Agreed, but we need to consider readability. The ES has been rewritten entirely
14-74 14 3 15 It is suggested to use a table to more clearly describe the skills of climate models with regard to inform about future changes in climate phenomena. [Klaus Radunsky, Austria]
Such a table is now introduced in 14.8.1
14-75 14 3 17 3 49 The descriptions on the future changes of the global monsoon system and each regional monsoon system are not consistent, so that readers are confused. Future changes of monsoon onset and retreat are quite important for people's life, therefore the definitions for monsoon onset and retreat should be clarified even in the chapter for the executive summary. [Government of Japan]
Noted. Text revised.
14-76 14 3 17 5 30 The summary of the findings of climate phenomena is rather complicated and laden with quite a log of detail. The emphasis in the summary could be more overarching (e.g., monsoons in general rather than detail that varies a lot across the systems). Important detail could be considered in conjunction with the regional summaries, which would further add to the aim of understanding regional climate change in terms of changes in the modes of variability.. [Markku Rummukainen, Sweden]
Accepted. Regional monsoon is not anymore part of the ES. Entire summary is redrafted. We will consider this option
14-77 14 3 17 7 25 More unreliable estimates from biased experts [Vincent Gray, New Zealand] We use calibrated IPCC uncertainty language
14-78 14 3 21 The conclusion about monsoon onset doesn't seem to supported from the discusion in the chapter. Maybe "likely in some regiones" [Maisa Rojas, Chile]
This has now been revisited
14-79 14 3 23 3 23 Very likely' reported here is given as 'virtually certain' for the South Asian monsoon on page 14, line 5. Please ensure consistency. [Thomas Stocker/ WGI TSU, Switzerland]
The ES has been entirely rewritten and consistency has been ensured
14-80 14 3 24 3 25 Australian monsoon region' As well as northern Australia, does this include the maritime continent? The regions are discussed separately at times within the main text but the AUS region included in some of the CMIP5 figures includes both. The point is important because confidence in mean and extreme rainfall increase would be higher over Indonesia than over northern Australia (which can be seen in some of the references cited). Note also that if it means Australia only, the very likely statement about extreme rainfall change differs greatly from what SREX said (low confidence) about extreme rainfall increase in this region. [Government of Australia]
EA & Will tease out. Noted. The region includes the Maritime Continent and the northern Australia, thus is now referred as 'AUS/MC.' Depend on the literature cited, the locality of monsoon region could be assessed in certain ways. The report should address the locality. However, whenever the literature only cited larger domain then it is also appropriate to combine both subregion together.
14-81 14 3 24 3 25 Australian monsoon region' As well as northern Australia, does this include the maritime continent? The regions are discussed separately at times within the main text but the AUS region included in some of the CMIP5 figures includes both. The point is important because confidence in mean and extreme rainfall increase would be higher over Indonesia than over northern Australia (which can be seen in some of the references cited). Note also that if it means Australia only, the very likely statement about extreme rainfall change differs greatly from what SREX said (low confidence) about extreme rainfall increase in this region. [Penny Whetton, Australia]
EA & Will tease out. Depend on the literature cited, the locality of monsoon region could be assessed in certain ways. The report should address the locality. However, whenever the literature only cited larger domain then it is also appropriate to combine both subregion together.
14-82 14 3 24 3 31 "Precipitation extremes are also very likely to increase ... in the Australian monsoon region." conflicts with the statement in next paragraph: "changes in the Australian summer monsoon rainfall are small" [Pandora Hope, Australia]
Rejected. Changes in mean precpitation and thos in extremes can be different. But the entire ES has been revised
14-83 14 3 25 3 27 It is not quite clear which monsoon system is being referred to here. If the statements referres to the future strengthening of the Indian monsoon-ENSO relationship, is it robust and well understood? We have looked at this in the CMIP5 ensemble and concluded that there was essentially no change. [Matthew Collins, United Kingdom of Great Britain & Northern Ireland]
The ES has been entirely rewritten, hence this comment is not relevant anymore
14-84 14 3 26 3 27 I am not confident that the claim that the ENSO monsoon teleconnection will likely strengthen in the future is backed by evidence. Elsewhere in the chapter (see later comments), it is clear that the view on future ENSO is uncertain. Furthermore, there is evidence that, while central Pacific ENSO events are more closely connected to the South Asian monsoon (Kumar et al., 2006: an article seemingly omitted from this Chapter, K. Krishna Kumar, Balaji Rajagopalan, Martin Hoerling, Gary Bates, Mark Cane, 2006, Unraveling the mysteries
The ES has been entirely rewritten, hence this comment is not relevant anymore
Expert and Government Review Comments on the IPCC WGI AR5 Second Order Draft – Chapter 14
Do not Cite, Quote or Distribute Page 9 of 118
Comment No
Chapter
FromPage
FromLine
To Page
To Line Comment Response
of Indian monsoon failure during El Nino, Science 314: 115-119, DOI: 10.1126/science.1131152). Yet the mean state changes in the tropical Pacific suggested later in the chapter portray an eastward bias in warming ("El Nino-like") and associated teleconnection patterns (see, for example, page 14-41, lines 23-24). Surely, if anything, such factors would conspire to weaken the teleconnection (if at all). [Andrew Turner, United Kingdom of Great Britain & Northern Ireland]
14-85 14 3 31 3 31 Add after 'small', the words 'with considerable uncertainty'. This is said in the corresponding text in the chapter. Some readers will be taking a risk perspective. [Government of Australia]
The ES has been rewritten entirely, so not relevant anymore
14-86 14 3 31 3 31 Seems to be a contradiction here that requires clarification. Above, on line 24 you state that there will 'very likely' be increases in precipitation extremes in the Australian monsoon region, but now you state here that changes in the Australian summer monsoon rainfalls will only be small. [Thomas Stocker/ WGI TSU, Switzerland]
The ES has been entirely rewritten, hence this comment is not relevant anymore
14-87 14 3 31 3 40 The construction of the findings on lines 31-32 and 39-40 could be further clarified. [Christopher Field, United States of America]
ES has been rewritten
14-88 14 3 31 Add after 'small', the words 'with considerable uncertainty'. This is said in the corresponding text in the chapter. Some readers will be taking a risk perspective. [Penny Whetton, Australia]
ES has been rewritten
14-89 14 3 32 For most of these statements I do not agree with the confidence and likelihood with which those are stated. Some statements say virtually certain (page 5 line 46, page 6 line 3), which fundamentally is impossible. We don't have enough models or ensembles to estimate a 99% percentile, and even if we did we would not be confident in those tails due to model limitations. The question is whether we are talking about the underlying forced trend, i.e. the probability of a trend being positive from an average with many realizations, or the probability of a single realization (which is what reality is doing). I assume it is the latter, i.e. we make a prediction about the real world, in which case the natural variability needs to be factored in. There are several issues. First, I doubt that the necessary statistical analysis has been made and published. Simply looking at histograms of CMIP5 is not sufficient. The fact that all models have structural limitations needs to be considered. They may be biased in their mean, but also in their variability. Second, only very few models have done large ensembles to quantify variability. The ones that have indicate that variability is large, even for temperature (e.g. Deser et al. Nature Climate Change 2012, Mahlstein 2011 ERL). For precipitation the variability is so large that on a grid point basis we are unable to indicate trends before 2100 for allmost all grid points (see Mahlstein 2012 GRL), so I don't understand how any of the regional precipitation statements can be defended. Table 14.2 for example shows that for most regions in North America, Central America, Mexico and South America even the 25-75% range in precipitation goes from negative to positive, which is only 50% and not likely. So where do the likely statements come from? To me it is impossible to say anything about local precipitation change. Third, the statements neither indicate a time nor a scenario, but fundamentally the significance of local changes depends on the signal strength. Unless we are talking about the underlying anthropogenic trend and the likelihood of that beeing positive or negative, in which case that needs to be stated clearly. That would also be different from chapters 11/12 where the projections do include natural variability in their likelihood assessments. In any case I think the point needs to be strenghtened that as we go to smaller scales, variability gets much more important, so confidence decreases. That has nothing to do with model biases, it's just a question of signal to noise. But it's often misunderstood. [Reto Knutti, Switzerland]
Agreed - a better use of the calibrated IPCC language has been enforced
14-90 14 3 36 3 36 The word "monsoon" could be removed. [Government of Australia] Accepted. The word removed.
14-91 14 3 37 3 38 High confidence that Australian monsoon delayed and shortened is based on 80% of CMIP3 model agreement (Zhang et al. 2012). However, CMIP models have relatively low skill in simulating the observed monsoon onset and duration (Zhang et al. 2010; Zhang et al. 2012), so this projection should not be given high confidence but moderate confidence. [Josephine Brown, Australia]
As the ES has been rewritten, this statement has also been revisited and overall, we have made an effort to ensure tracebility of assessment statements
14-92 14 3 39 3 40 It is not clear from this sentence whether Western North Pacific monsoon precipitation increases overall, or whether there are simply competing tendencies for increased/decreased rainfall. [Josephine Brown, Australia]
Should now be clarified
14-93 14 3 42 3 45 Low confidence in projections is indicated in the 1st sentence of this paragraph, and likelihood terms are used to characterize the findings presented subsequently in the paragraph. Does this mean that the author team
Should now be clarified
Expert and Government Review Comments on the IPCC WGI AR5 Second Order Draft – Chapter 14
Do not Cite, Quote or Distribute Page 10 of 118
Comment No
Chapter
FromPage
FromLine
To Page
To Line Comment Response
has low confidence in the "likely" outcomes? If so, the author team might consider using only confidence, and not likelihood. [Christopher Field, United States of America]
14-94 14 3 42 45 later start of NAMS is inconsistent with "likely earlier onset" statement in line 21. [Maisa Rojas, Chile] It is taken care of
14-95 14 3 43 3 43 Suggest identifying what NAMS stands for. [Government of Canada] Acronyms are being reconsidered
14-96 14 3 47 3 49 again, statment about delay in West African rainy season is contradictory with "earlier onset" statement. [Maisa Rojas, Chile]
revised text has taken care of this
14-97 14 3 52 3 52 "low to medium confidence": This statement is not very useful for the reader. Please decide, if there is low or medium confidence. [Government of Germany]
ES has been rewritten
14-98 14 3 52 missing italic in "medium confidence". This happends in other parts as well. [Maisa Rojas, Chile] Acknowledged
14-99 14 3 53 suggest to delete "in assessing" -- might be ambiguous as could be read that the medium confidence is in the process of assessing rather than the assessed result. [Thomas Stocker/ WGI TSU, Switzerland]
has been taken care of
14-100 14 3 54 3 54 The acronym SPCZ probably needs to be given in full at its first mention in the ES. [Timothy Carter, Finland] Should now be clarified
14-101 14 3 54 3 55 The sentence "the frequency of zonally-oriented SPCZ events is likely to increase, the SPCZ lying well to the northeast of its average position" could be misread as making two separate statements, while the original text finishes this sentence with "..during these events" , which unambiguously indicates a single statement (page 29, lines 52-53). This latter version should be used. [Ken Takahashi, Perú]
The text has been revised and any ambiguity is removed
14-102 14 3 55 3 55 insert "during these events" after "its average position". [Josephine Brown, Australia] Thanks - but the ES has been rewritten
14-103 14 3 57 4 2 Indicates increase in rainfall in "southeastern South America" and a reduction "associated with the SACZ". This is too vague, considering that the SACZ is in southeastern South America. and could be made more precise... [Ken Takahashi, Perú]
ES has been rewritten
14-104 14 3 The executive summary opens with a statement on global monsoons but the chapter has no statements on the potential linkages between the different regional monsoons, especially in the context of the impact of differing levels of confidence in future projections of these regional systems. A statement is essential to orient the reader about the models' abilities to capture these links. Maybe there is no literature on this but if that is the case then this shoudl be stated. [Government of United States of America]
ES has been rewritten
14-105 14 4 4 put "low confidence" in italic [Maisa Rojas, Chile] Has been fixed
14-106 14 4 8 4 10 I think the wording could be improved in this sentence. The use of the concept of "reduced...warming" may confuse some readers into thinking there is cooling in parts of the Indian Ocean. I suggest a better wording may be, "...to feature a zonal pattern with enhanced warming and precipitation in the east while precipitation declines in the west". [Andrew Turner, United Kingdom of Great Britain & Northern Ireland]
Thank you. It is taken care of
14-107 14 4 10 4 12 I believe "high confidence" is an over statement here as it is based on only one study (Zheng et al. 2010) [Eric Guilyardi, France]
The suggestion has been considered and the ES statement is revised to reflect this
14-108 14 4 23 4 25 I find it difficult to un-pick this sentence. Is it saying that it is uncertain how, if at all, ENSO will change under global warming? The use of the word attribution perhaps confuses matters as that usually refers to past changes. [Matthew Collins, United Kingdom of Great Britain & Northern Ireland]
Sentence is reworked
14-109 14 4 23 4 25 Given that here it is stated that, "natural modulations of the variance and spatial patterns of ENSO are so large", why is it so certain the monsoon-ENSO teleconnection will strengthen in the future as stated in my first comment? [Andrew Turner, United Kingdom of Great Britain & Northern Ireland]
All statements are reformulated to agree with IPCC language
14-110 14 4 24 3 24 Does this mean that no clear change (that would stand out from variability) is projected? What does "any projected change" refer to? The nature of the finding is not very clearly formulated. [Markku Rummukainen, Sweden]
All statements are reformulated to agree with IPCC language
14-111 14 4 24 What does "projected change" refer to in this context? Is it amplitude? Spatial pattern? ENSO? Stg else? [Erik All statements are reformulated to agree with IPCC
Expert and Government Review Comments on the IPCC WGI AR5 Second Order Draft – Chapter 14
Do not Cite, Quote or Distribute Page 11 of 118
Comment No
Chapter
FromPage
FromLine
To Page
To Line Comment Response
Kjellström, Sweden] language
14-112 14 4 25 4 27 Based on the material assessed in 14/4/3, the "high confidence" statement on an eastward shift of ENSO teleconnections is too strong. Medium confidence would be more appropriate. [Eric Guilyardi, France]
All statements are reformulated to agree with IPCC language
14-113 14 4 25 4 27 I'm not convinced by the claim of this assessment: "There is high confidence that both El Niño and La Niña-induced teleconnection patterns over the extra-tropical Northern Hemisphere are likely to move eastwards in the future." I did a quick check on some of the underlying literature. Stevenson (2012, GRL) CMIP5 study concludes: "Atmospheric teleconnections also show differences between models where ENSO amplitude does and does not respond to climate change; in the former case El Nino/La Nina related sea level pressure anomalies strengthen with CO2 and in the latter they weaken and shift polewar and eastward." In any case, this assessment needs to be carefully scrutinized. [Thomas Knutson, United States of America]
ES has been rewritten
14-114 14 4 27 4 29 The possibility of CP ENSO trends is speculative - there is no consensus of the dynamics (as clearly described in section 14.4.4) and therefore it is difficult to believe there is medium confidence of the phenomenon. [Government of United States of America]
ES has been rewritten
14-115 14 4 27 4 29 Given the debate that exists on the very distinction of CP/EP (14.4.4) and the low confidence in ENSO projections, I would either remove that statement from the executive summary or state there is such a debate. [Eric Guilyardi, France]
ES has been rewritten
14-116 14 4 27 4 29 Since the confidence is low, the word "will" is too strong. A more appropriate wording could be: "There are indications that the central Pacific type of El Niño could become more frequent..." [Ken Takahashi, Perú]
ES has been rewritten
14-117 14 4 32 4 35 Awkwardly written sentence with two semi colons. I draw attention to this particular poorly written sentence as it’s a key conclusion. [Christopher Folland, United Kingdom of Great Britain & Northern Ireland]
Agreed, will be improved
14-118 14 4 33 4 34 The second part of the sentence, "it is very likely to be differ quantitatively from individual climate model projections", would seem superfluous and could be omitted. [Markku Rummukainen, Sweden]
Agreed
14-119 14 4 33 34 Language? "is very likely to be differ" [Erik Kjellström, Sweden] Revised
14-120 14 4 35 4 35 Meant to refer to temperature, not GHGs? [Government of United Kingdom of Great Britain & Northern Ireland] Revised
14-121 14 4 35 4 36 I am strongly concerned about the statement that 'There is high confidence that the austral summer/autumn positive trend in SAM is very likely to continue'. Figure 14.26 shows that there is NO TREND in the simulated SAM index after about 2000/2010 for RCP45 scenario. The index remains positive, but a positive index should not be confused with a positive trend! A positive SAM trend is only implied by SLP change pattern corresponding to RCP85 scenario (Figure 12.28). Perhaps the SAM index for RCP85 should be demonstrated in this chapter. In summary: the statement in the executive summary is not supported by evidences of this chapter. [Alexey Karpechko, Finland]
This statement has been revised.
14-122 14 4 42 5 9 Consider removing this section from the ES, or only include those statements supported by a robust assessment which are worth elevating to this level. Certainly the first statement (line 43) on PNA must be removed, and many of the subsequent statements combine low, or medium confidence with likelihood indications which provides an unclear message. [Thomas Stocker/ WGI TSU, Switzerland]
ES has been rewritten
14-123 14 4 49 4 50 I'd prefer it if the SREX chapter 3 decision was followed to only provide likeilhoods when confidence is high. [Peter Stott, United Kingdom of Great Britain & Northern Ireland]
Good suggestion. Is followed.
14-124 14 4 50 4 50 Is it possible to indicate more precisely what is meant by "uncertain"? [Christopher Field, United States of America]
ES has been rewritten
14-125 14 5 1 5 1 may weaken -> will weaken presumably given there is a confidence attached [Peter Stott, United Kingdom of Great Britain & Northern Ireland]
Agreed
14-126 14 5 1 5 2 Since many models cannot reasonably simulate QBO, it is difficult to project QBO changes at this stage. It is better to remove the statement in the executive summary. [Dabang Jiang, China]
ES has been rewritten
14-127 14 5 1 7 26 How can the same range of probabilistic terminologies that are used for the average global assessment be the Considerable effort has gone into this and we hope to
Expert and Government Review Comments on the IPCC WGI AR5 Second Order Draft – Chapter 14
Do not Cite, Quote or Distribute Page 12 of 118
Comment No
Chapter
FromPage
FromLine
To Page
To Line Comment Response
same as those used here for regional assessments? This is a particularly serious problem for precipitation. At the very least there should be a explanation of the extreme difficulty for making regional assesments with more than low to medium confidence compared to global averages. It may raise eyebrows to suggest here that there could be 'virtual certainty' or 'high confidence' for regional projections of precipitation (see the Carribbean for example.). See Deser et al., Nature Climate Change vol 2, November 2012 p. 775. [Government of United States of America]
be more clear on this point now
14-128 14 5 1 suggest to delete "On the basis of the recent literature" -- this could be said for most if not all statements [Thomas Stocker/ WGI TSU, Switzerland]
Agree
14-129 14 5 4 5 5 If changes in IPO and PDO have not been studied, wouldn't it be more appropriate to say "future changes are not known" rather than "as likely as not that PDO/IPO will change…" as the latter implies knowledge about the likelihood of particular future states. In fact, some other change may be more likely, but this is not known. [Josephine Brown, Australia]
Agree - The ES has been rewritten and this statement is not part of it anymore
14-130 14 5 4 5 5 These two sentences on the IPO/PDO sound like the contradict each other. "We haven't investgated this but it is 50/50 whether something could change." It is perhaps a consequence of using the calibrated language but it does sound a bit odd to me. [Matthew Collins, United Kingdom of Great Britain & Northern Ireland]
Agree - The ES has been rewritten and this statement is not part of it anymore
14-131 14 5 4 5 5 Given the 1st sentence of this paragraph, the author team might consider the usage of likelihood language in the 2nd sentence. Please see paragraph 11 of the uncertainties guidance for authors. [Christopher Field, United States of America]
Agree - The ES has been rewritten and this statement is not part of it anymore
14-132 14 5 4 5 5 "Future changes in the PDO/IPO are uncertain and have not been investigated in any depth. It is presently as likely as not that the PDO/IPO will change its form or temporal behaviour in future" If there is no known mechanism for change, is it not more likely that there will be no change? You appear to assume change will occur unless it can be shown that it won't, in violation of Newtonian logic. [Richard Keen, United States of America]
Agree - The ES has been rewritten and this statement is not part of it anymore
14-133 14 5 4 5 5 This is a classic example where 'as likely as not' seems to have been applied incorrectly. If future changes in PDO/IPO are uncertain, and have not been investigated in any depth, then you have absolutely no basis to assign a quantified likelihood level of 'as likely as not' [Thomas Stocker/ WGI TSU, Switzerland]
Agree - The ES has been rewritten and this statement is not part of it anymore
14-134 14 5 7 5 9 "at least as strongly as will human-induced changes" -- is this supported by the AMO assessment in 14.6.7? [Thomas Stocker/ WGI TSU, Switzerland]
This statement has been revised as the ES has been rewritten
14-135 14 5 8 5 8 Please define or express more specifically what "over the coming few decades" refers to. [Markku Rummukainen, Sweden]
ES rewritten
14-136 14 5 8 5 8 some regional climates rather than all ? [Peter Stott, United Kingdom of Great Britain & Northern Ireland] ES rewritten
14-137 14 5 8 Specify "few decades" [Erik Kjellström, Sweden] ES rewritten
14-138 14 5 13 5 16 Talks about attribution of future changes in cyclones to CO2 vs. aerosols. Leaves the reader wondering about the effects of other forcers (methane?) - and needs to explain what effect aerosols will have. Needs better explanation. [Government of United Kingdom of Great Britain & Northern Ireland]
ES rewritten and this statement has gone
14-139 14 5 16 5 16 For the described "measurable effect on tropical cyclone activity," is it possible to be more specific in indicating the direction of change or aspects of activity affected? [Christopher Field, United States of America]
ES has been rewritten and the section on TC is as comprehensive as we believe it can be
14-140 14 5 19 5 19 In place of "lower confidence," it would be preferable to use the language from the uncertainties guidance to indicate the level of confidence intended. [Christopher Field, United States of America]
Reformulated
14-141 14 5 20 5 20 Is it possible to say which basins? [Matthew Collins, United Kingdom of Great Britain & Northern Ireland] We believe not
14-142 14 5 23 5 23 Does this imply a finding of decrease in the global number of extra-tropical cyclones? If yes, please amend. If no, the sentence should be revised. [Markku Rummukainen, Sweden]
The ES has been rewritten entirely, and this statement is modified.
14-143 14 5 23 5 25 This sentence could be misleading because while it may be true that the total number of ETCs do not increase globally, this may not be the case regionally – for example, Southwest WA is likely to sustain a continuing
ES has been rewritten
Expert and Government Review Comments on the IPCC WGI AR5 Second Order Draft – Chapter 14
Do not Cite, Quote or Distribute Page 13 of 118
Comment No
Chapter
FromPage
FromLine
To Page
To Line Comment Response
decrease in rainfall due to decrease in ETCs. We suggest that this paragraph be replaced with: While there is high confidence that the total global number of extra-tropical cyclones is unlikely to decrease by more than a few percent due to global warming, regionally there may be large changes. There is high confidence that there will be a reduction in the peak strength of the Southern Hemisphere subtropical winter jet stream and in the associated mechanism for storm formation. There is high confidence that a small poleward shift is likely in the Southern Hemisphere storm track, but the magnitude is model-dependent. There is medium confidence that a poleward shift in the N. Pacific storm track is more likely than not and that it is unlikely that the response of the N. Atlantic storm track is a simple poleward shift. There is low confidence in the impact of storm track changes on regional climate at the surface especially for extreme events. [Jorgen Frederiksen, Australia]
14-144 14 5 23 5 25 This sentence could be misleading because while it may be true that the total number of ETCs do not increase globally, this may not be the case regionally – for example, Southwest WA is likely to sustain a continuing decrease in rainfall due to decrease in ETCs. We suggest that this paragraph be replaced with: While there is high confidence that the total global number of extra-tropical cyclones is unlikely to decrease by more than a few percent due to global warming, regionally there may be large changes. There is high confidence that there will be a reduction in the peak strength of the Southern Hemisphere subtropical winter jet stream and in the associated mechanism for storm formation. There is high confidence that a small poleward shift is likely in the Southern Hemisphere storm track, but the magnitude is model-dependent. There is medium confidence that a poleward shift in the N. Pacific storm track is more likely than not and that it is unlikely that the response of the N. Atlantic storm track is a simple poleward shift. There is low confidence in the impact of storm track changes on regional climate at the surface especially for extreme events. [Government of Australia]
ES has been rewritten
14-145 14 5 23 5 25 We find the formulation of this statement very strange and cryptic. Why not turn this statement around state what the likely decrease will be? This would also ensure wording which is more similar to that used for tropical cyclones above. In addition, do you literally mean the general term of 'global warming' here (i.e., global increase in average temperature), or do you rather mean anthropogenic warming of the climate? [Thomas Stocker/ WGI TSU, Switzerland]
ES has been rewritten
14-146 14 5 23 25 This sentence could be misleading because while it may be true that the total number of ETCs do not increase globally, this may not be the case regionally – for example, Southwest WA is likely to sustain a continuing decrease in rainfall due to decrease in ETCs. We suggest that this paragraph be replace with: "While there is high confidence that the total global number of extra-tropical cyclones is unlikely to decrease by more than a few percent due to global warming, regionally there may be large changes. There is high confidence that there will be a reduction in the peak strength of the Southern Hemisphere subtropical winter jet stream and in the associated mechanism for storm formation. There is high confidence that a small poleward shift is likely in the Southern Hemisphere storm track, but the magnitude is model-dependent. There is medium confidence that a poleward shift in the N. Pacific storm track is more likely than not and that it is unlikely that the response of the N. Atlantic storm track is a simple poleward shift. There is low confidence in the impact of storm track changes on regional climate at the surface especially for extreme events." [Carsten Frederiksen, Australia]
ES has been rewritten
14-147 14 5 24 5 24 Given that "a few" assumes different meanings in different languages, it would be preferable to use a more specific term. [Christopher Field, United States of America]
We think a few is accurate enough
14-148 14 5 26 5 26 How small is small? A few degrees of latitude? [Matthew Collins, United Kingdom of Great Britain & Northern Ireland]
The text has been reworded
14-149 14 5 32 5 32 I think it would be useful to have some pre-amble here to say that all the changes listed are contingent on global mean temperatures continuing to rise and that impacts are large in higher scenarios (if this indeed is the case), [Matthew Collins, United Kingdom of Great Britain & Northern Ireland]
ES has been rewritten and reflects this
14-150 14 5 32 6 57 The text of this part of the Executive Summary is in surprisingly poor shape. More so because the underlying text in the body of the chapter is well written. Several specific comments are given below. [Adrian Simmons, United Kingdom]
ES has been rewritten
Expert and Government Review Comments on the IPCC WGI AR5 Second Order Draft – Chapter 14
Do not Cite, Quote or Distribute Page 14 of 118
Comment No
Chapter
FromPage
FromLine
To Page
To Line Comment Response
14-151 14 5 32 7 24 Why are the probabilistic descriptors (e.g., high confidence, virtually certain… will likely etc.) not in italics for this section as they are for phenomena? [Government of United States of America]
An effort to ensure proper use of italic throughout the chapter has been made
14-152 14 5 32 7 24 The paragraphs on the Americas are very short in comparison to the other sub-regions. I think the style and volume given for the different regions should be as consistent as possible. Otherwise readers may interpret all kinds of things into this extremely important section, which at least for me is among the most relevant of the entire WG I report. [Jochen Harnisch, Germany]
ES has been rewritten
14-153 14 5 32 7 24 "IPCC-type" probabilities ("very likely", "virtually certain") should be in italics. [Martin Stendel, Denmark] An effort to ensure proper use of italic throughout the chapter has been made
14-154 14 5 32 7 24 There needs to be consistency in the regional details that are reported in this section of the ES. This is currently a confusing mixture of different quantities for different regions. For some regions, you give detection and attribution statements, others you do not, for some you give only precipitation projections, for some you give extreme related projections while for others you do not. Please decide upon a uniform set of quantities that you want to report across all regions for this ES. For example, the paragraph on South America reads very well, and might be used as a template for the other paragraphs in this section. [Thomas Stocker/ WGI TSU, Switzerland]
ES has been entirely restructured to handle this better
14-155 14 5 32 When reading this part of the summary it is difficult to see the rationale for why different aspects are or are not discussed for the different regions. A short paragraph outlining thoughts behind this would be helpful. [Erik Kjellström, Sweden]
ES has been rewritten
14-156 14 5 32 It is suggested to use a table to more clearly describe the skills of climate models with regard to inform about future changes in regional climate. [Klaus Radunsky, Austria]
Such a table has been introduced in section 14.8.1
14-157 14 5 35 7 24 It would be helpful to have numbers for the projected temperature changes referred to for those regions [Government of United Kingdom of Great Britain & Northern Ireland]
ES is rewritten
14-158 14 5 36 5 37 The authors should reconsider the assigment of 'likely' confidence here. From what is said in section 14.7.2 it appears that this is based on a high degree of model consensus; however, the inter-model spread in theprojected precipitation increase is generally as large as the ensemble-mean signal itself. Hence confidence in this projection may be lower than "likely.". [Government of United States of America]
ES is rewritten
14-159 14 5 40 5 40 This is bad English. There is high confidence that the anthropogenic signal will be large… OR The anthropogenic signal will very likely be large… [Martin Stendel, Denmark]
ES is redrafted and such usage of language is corrected.
14-160 14 5 40 5 41 This sentence would be improved by moving 'by mid-century' towards the front and being more clear about what can be expected: "There is high confidence that by the mid 21st century the anthropogenic signal will be discernable from internal variability". It is critical to be absolutely clear that there is less confidence that it will be discernable in the next 2 to 3 decades. [Government of United States of America]
ES has been rewritten
14-161 14 5 40 "There is high confidence that very likely the …" may be formally OK in current IPCC parlance, but it reads clumsily. Most other statements made in this WG1 draft do not mix up confidence and liklihood statements in such an awkward way. Is it not sufficient to write "It is very likely that the …"? [Adrian Simmons, United Kingdom]
ES is rewritten also to improve the use of calibrated IPCC language
14-162 14 5 46 5 46 This mixes two likelihood statements - I don't think it can be correct. [Timothy Carter, Finland] ES has been rewritten
14-163 14 5 46 5 46 It is not clear how the 2 likelihood terms in succession should be interpreted; this construction should be avoided. [Christopher Field, United States of America]
ES has been rewritten
14-164 14 5 46 5 46 This is bad English. It cannot be virtually certain that somethings is very likely. [Martin Stendel, Denmark] ES has been rewritten
14-165 14 5 46 5 47 Please consult the uncertainty guidance document. 'Virtually certain' can not be combined with 'very likely' in a single statement. [Thomas Stocker/ WGI TSU, Switzerland]
This has been carefully addressed in the new ES
14-166 14 5 46 It's either virtually certain or very likely, but it can't be both. [Reto Knutti, Switzerland] ES has been rewritten
14-167 14 5 46 To write "It is virtually certain that temperatures are very likely to increase …" mixes up two different ES has been rewritten
Expert and Government Review Comments on the IPCC WGI AR5 Second Order Draft – Chapter 14
Do not Cite, Quote or Distribute Page 15 of 118
Comment No
Chapter
FromPage
FromLine
To Page
To Line Comment Response
probabilistic statements "virtually certain" and "very likely". See Table 1.1 on page 1-16. This should be avoided. Write simply "Temperatures are very likely to increase ...". There is of course a degree of probability that an assessment such as "very likely" is wrong, but this applies to every conclusion in the WG1 draft, and if comment is needed on this, it should be placed in Chapter 1. [Adrian Simmons, United Kingdom]
14-168 14 5 50 5 56 No mention is made about climate change in the Andes [Ken Takahashi, Perú] Regional statements are all reconsidered
14-169 14 5 50 Delete "the". [Adrian Simmons, United Kingdom] Done
14-170 14 5 51 5 53 This sentence could be reworded for greater clarity about which geographic regions it is referring to - "There is medium confidence in extreme precipitation trends in Northeast, northern sector of Southeast and west coast of tropical South America." [Government of Australia]
Regional statements are all reconsidered
14-171 14 5 51 5 53 Says "medium confidence in extreme precipitation trends". What trends? Are they positive or negative? [Ken Takahashi, Perú]
Regional statements are all reconsidered
14-172 14 5 51 5 53 Says "medium confidence in extreme precipitation trends in [...] west coast of tropical South America" but does not distinguish between the arid coasts of Peru and Chile from the tropical coasts of Ecuador and Colombia. Since climate models still have a positive warm coastal bias in the former, they depict present-day wet tropical conditions instead of arid. Model estimations of future trends are probably positively biased by this, as the sensitivity of rainfall to SST changes depends on the base state temperature (e.g. Takahashi 2004, doi:10.5194/angeo-22-3917-2004). [Ken Takahashi, Perú]
The text was changed to show differences in these regions.
14-173 14 5 51 more specific: central-Southen Chile (in "Tierra del Fuego" the projections are for more precipitation!) [Maisa Rojas, Chile]
OK. It was changed to clarify difference between the two regions in Chile.
14-174 14 5 52 5 52 Is it possible to specify the direction of the mentioned trends? [Christopher Field, United States of America] ES has been rewritten
14-175 14 5 53 Replace "in" by "over" [Adrian Simmons, United Kingdom] Acknowledged
14-176 14 5 54 Replace "in" by "for" and "is an increase" should be "will be an increase". [Adrian Simmons, United Kingdom] Acknowledged
14-177 14 5 55 5 56 "that the heat waves become" should be "that heat waves will become". [Adrian Simmons, United Kingdom] Acknowledged
14-178 14 6 2 6 2 Include an apostrophe after "models" so that it reads as models'. [Government of Australia] Acknowledged
14-179 14 6 2 6 3 To me, the linking of the two first sentences could be better formulated. I the first sentence you speak of "medium confidence" and in the second sentence of "therefore virtually certain". I think the word "therefore" could be removed. [Andreas Fischer, Switzerland]
ES has been rewritten
14-180 14 6 2 6 3 The "medium confidence" and "virtually certain" would not seem to convey different levels of uncertainty and the "therefore" may be out of place. [Markku Rummukainen, Sweden]
ES has been rewritten
14-181 14 6 2 6 3 Medium confidence in projections yet virtually certain that temperatures will warm ? Presumably the medium confidence is in more than just whether projections get the sign right ? [Peter Stott, United Kingdom of Great Britain & Northern Ireland]
ES has been rewritten
14-182 14 6 2 6 3 If you only have medium confidence in the model ability, how can you then express a 'virtually certain' likelihood of changes. Please clarify. [Thomas Stocker/ WGI TSU, Switzerland]
The usage of calibrated IPCC language has been improved
14-183 14 6 3 6 3 The logic implied by "therefore" on this line is not clear. [Christopher Field, United States of America] ES rewritten
14-184 14 6 3 6 3 Is the term "climate scenario" used troughout the report? Otherwise I would use a term like "emission scenario" [Andreas Fischer, Switzerland]
We do not mention climate scenaro anyore.
14-185 14 6 5 6 9 There is inconsistent information between the sentences located from line 5 to line 9. While 1st and 2nd sentences saying "...in summer warming will be more intense in MD and CE than in NE. The length, frequency and/or intensity of warm spells or heat waves are assessed to be very likely to increase throughout the region." 3rd sentence says "There is medium confidence in an annual increase in NE and CE, while a decrease is likely in MD during the summer half year." 3rd sentence should be removed or re-assessed.
ES has been rewritten
Expert and Government Review Comments on the IPCC WGI AR5 Second Order Draft – Chapter 14
Do not Cite, Quote or Distribute Page 16 of 118
Comment No
Chapter
FromPage
FromLine
To Page
To Line Comment Response
[SERHAT SENSOY , Turkey]
14-186 14 6 6 6 11 Acronyms CE, MD and NE should be defined here (or not used in the executive summary). They are defined only much later in the chapter. [Adrian Simmons, United Kingdom]
ES has been rewritten
14-187 14 6 8 6 8 It would be helpful to clarify what is meant by "annual increase" here--increase in which aspects of heatwave occurrence? [Christopher Field, United States of America]
ES has been rewritten
14-188 14 6 8 6 9 Please, make explicit that "increase• and "decrease" refer to precipitation. The text is not enough clear [Government of Spain]
ES has been rewritten
14-189 14 6 8 6 9 Still talking about temperature here? If so, say so. [Government of United Kingdom of Great Britain & Northern Ireland]
ES has been rewritten
14-190 14 6 8 6 9 In the sentence “There is medium …”, the mention of precipitation is missing. [Serge PLANTON, France] The ES has been rewritten entirely
14-191 14 6 8 9 It is not explicitly stated that this sentence is about precipitation, should be written out as you talk about heat waves etc in the preceeding sentence. [Erik Kjellström, Sweden]
The ES has been rewritten entirely
14-192 14 6 10 6 10 "... a notably inconsistency..." The adjective form of "notably" probably should be used here. [Gan Zhang, United States]
ES has been rewritten
14-193 14 6 13 6 22 Could Africa which is potentially the region of largest concern in respect to climate change be disintegrated into 2-3 sub-regions like it has been done for Asia? [Jochen Harnisch, Germany]
The regions will remain more or less as defined for now, but within the Africa section, sub-regions are discussed
14-194 14 6 14 6 14 "high confidence that it is virtually certain" --> isn't that a doubling of the certainty. It makes it hard for the reader to go through such sentences. [Andreas Fischer, Switzerland]
ES has been rewritten entirely
14-195 14 6 15 6 15 Suggest rewording this sentence "Sahara already very dry is very likely to remain dry." perhaps to read "The regions of the Sahara that are already very dry are very likely to remain dry" [Government of Australia]
ES rewritten
14-196 14 6 15 6 15 Replace first sentence with "The Sahara, extremely dry already at present, is very likely to remain dry." Can also say "very" instead of "extremely". [Martin Stendel, Denmark]
ES rewritten
14-197 14 6 15 "Sahara already very dry", needs language editing [Erik Kjellström, Sweden] ES rewritten
14-198 14 6 25 2 25 stronger' than what? [Government of United Kingdom of Great Britain & Northern Ireland] Noted. 'stronger than global mean.'
14-199 14 6 25 6 25 The comparison implied by "stronger" here is not clear--stronger than which other trend? [Christopher Field, United States of America]
Noted. 'stronger than global mean.'
14-200 14 6 25 6 26 A stronger warming trend' -> Stronger relative to what? Other seasons? Global mean? Please clarify. [Thomas Stocker/ WGI TSU, Switzerland]
Noted. 'stronger than global mean.'
14-201 14 6 27 6 27 It would be preferable to use calibrated uncertainty language from the guidance for authors in place of "less certain." [Christopher Field, United States of America]
ES has been rewritten and calibrated language better used throughout
14-202 14 6 31 6 40 This paragraph needs a complete rewrite. It is very confusing, and apparently inconsistent as it stands. See the two separate comments immediately below. [Adrian Simmons, United Kingdom]
Acknowleded. Paragraph is reformulated
14-203 14 6 31 6 40 The first and last sentences of the paragaph are repetitive, but inconsistent. The first sentence says warming is "very likely" whereas the last sentence says there is high confidence that warming is "virtually certain". [Adrian Simmons, United Kingdom]
Acknowleded. Paragraph is reformulated
14-204 14 6 31 6 40 There is likewise confusion over precipitation. The first sentence states that it is "very likely" that precipitation will decrease, mainly in winter, and that there is "very little precipitation in summer under present conditions" in the region. The latter remark is simply wrong (see page 14-17, line 59, for example), and the first part of the statement is undermined later in the paragraph where it is stated that there is medium confidence that an increase in summer precipitation over the whole of East Asia is likely. [Adrian Simmons, United Kingdom]
Acknowleded. Paragraph is reformulated
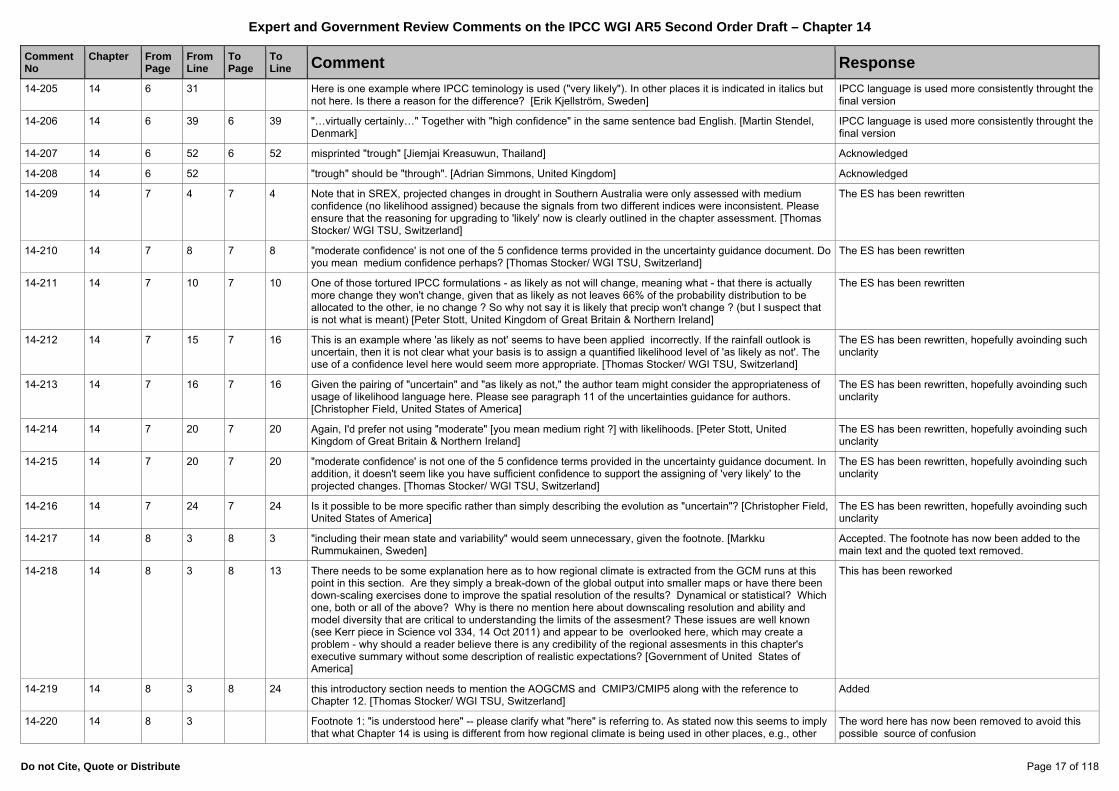
Expert and Government Review Comments on the IPCC WGI AR5 Second Order Draft – Chapter 14
Do not Cite, Quote or Distribute Page 17 of 118
Comment No
Chapter
FromPage
FromLine
To Page
To Line Comment Response
14-205 14 6 31 Here is one example where IPCC teminology is used ("very likely"). In other places it is indicated in italics but not here. Is there a reason for the difference? [Erik Kjellström, Sweden]
IPCC language is used more consistently throught the final version
14-206 14 6 39 6 39 "…virtually certainly…" Together with "high confidence" in the same sentence bad English. [Martin Stendel, Denmark]
IPCC language is used more consistently throught the final version
14-207 14 6 52 6 52 misprinted "trough" [Jiemjai Kreasuwun, Thailand] Acknowledged
14-208 14 6 52 "trough" should be "through". [Adrian Simmons, United Kingdom] Acknowledged
14-209 14 7 4 7 4 Note that in SREX, projected changes in drought in Southern Australia were only assessed with medium confidence (no likelihood assigned) because the signals from two different indices were inconsistent. Please ensure that the reasoning for upgrading to 'likely' now is clearly outlined in the chapter assessment. [Thomas Stocker/ WGI TSU, Switzerland]
The ES has been rewritten
14-210 14 7 8 7 8 "moderate confidence' is not one of the 5 confidence terms provided in the uncertainty guidance document. Do you mean medium confidence perhaps? [Thomas Stocker/ WGI TSU, Switzerland]
The ES has been rewritten
14-211 14 7 10 7 10 One of those tortured IPCC formulations - as likely as not will change, meaning what - that there is actually more change they won't change, given that as likely as not leaves 66% of the probability distribution to be allocated to the other, ie no change ? So why not say it is likely that precip won't change ? (but I suspect that is not what is meant) [Peter Stott, United Kingdom of Great Britain & Northern Ireland]
The ES has been rewritten
14-212 14 7 15 7 16 This is an example where 'as likely as not' seems to have been applied incorrectly. If the rainfall outlook is uncertain, then it is not clear what your basis is to assign a quantified likelihood level of 'as likely as not'. The use of a confidence level here would seem more appropriate. [Thomas Stocker/ WGI TSU, Switzerland]
The ES has been rewritten, hopefully avoinding such unclarity
14-213 14 7 16 7 16 Given the pairing of "uncertain" and "as likely as not," the author team might consider the appropriateness of usage of likelihood language here. Please see paragraph 11 of the uncertainties guidance for authors. [Christopher Field, United States of America]
The ES has been rewritten, hopefully avoinding such unclarity
14-214 14 7 20 7 20 Again, I'd prefer not using "moderate" [you mean medium right ?] with likelihoods. [Peter Stott, United Kingdom of Great Britain & Northern Ireland]
The ES has been rewritten, hopefully avoinding such unclarity
14-215 14 7 20 7 20 "moderate confidence' is not one of the 5 confidence terms provided in the uncertainty guidance document. In addition, it doesn't seem like you have sufficient confidence to support the assigning of 'very likely' to the projected changes. [Thomas Stocker/ WGI TSU, Switzerland]
The ES has been rewritten, hopefully avoinding such unclarity
14-216 14 7 24 7 24 Is it possible to be more specific rather than simply describing the evolution as "uncertain"? [Christopher Field, United States of America]
The ES has been rewritten, hopefully avoinding such unclarity
14-217 14 8 3 8 3 "including their mean state and variability" would seem unnecessary, given the footnote. [Markku Rummukainen, Sweden]
Accepted. The footnote has now been added to the main text and the quoted text removed.
14-218 14 8 3 8 13 There needs to be some explanation here as to how regional climate is extracted from the GCM runs at this point in this section. Are they simply a break-down of the global output into smaller maps or have there been down-scaling exercises done to improve the spatial resolution of the results? Dynamical or statistical? Which one, both or all of the above? Why is there no mention here about downscaling resolution and ability and model diversity that are critical to understanding the limits of the assesment? These issues are well known (see Kerr piece in Science vol 334, 14 Oct 2011) and appear to be overlooked here, which may create a problem - why should a reader believe there is any credibility of the regional assesments in this chapter's executive summary without some description of realistic expectations? [Government of United States of America]
This has been reworked
14-219 14 8 3 8 24 this introductory section needs to mention the AOGCMS and CMIP3/CMIP5 along with the reference to Chapter 12. [Thomas Stocker/ WGI TSU, Switzerland]
Added
14-220 14 8 3 Footnote 1: "is understood here" -- please clarify what "here" is referring to. As stated now this seems to imply that what Chapter 14 is using is different from how regional climate is being used in other places, e.g., other
The word here has now been removed to avoid this possible source of confusion
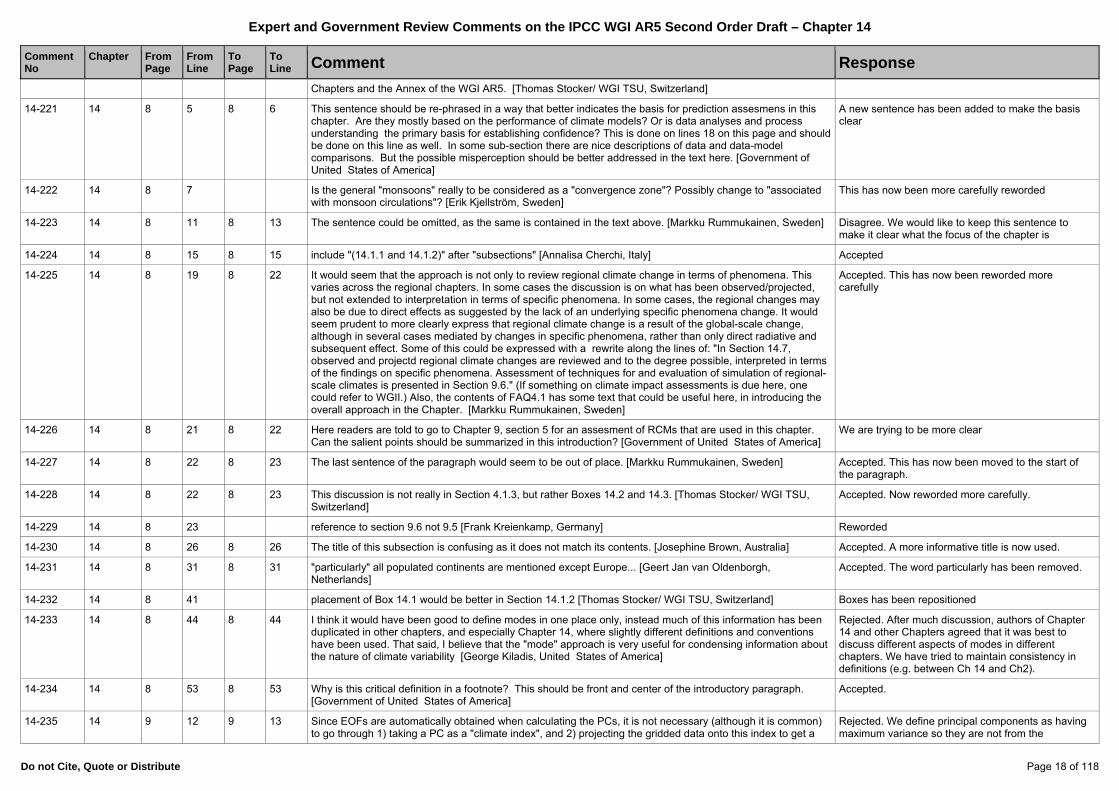
Expert and Government Review Comments on the IPCC WGI AR5 Second Order Draft – Chapter 14
Do not Cite, Quote or Distribute Page 18 of 118
Comment No
Chapter
FromPage
FromLine
To Page
To Line Comment Response
Chapters and the Annex of the WGI AR5. [Thomas Stocker/ WGI TSU, Switzerland]
14-221 14 8 5 8 6 This sentence should be re-phrased in a way that better indicates the basis for prediction assesmens in this chapter. Are they mostly based on the performance of climate models? Or is data analyses and process understanding the primary basis for establishing confidence? This is done on lines 18 on this page and should be done on this line as well. In some sub-section there are nice descriptions of data and data-model comparisons. But the possible misperception should be better addressed in the text here. [Government of United States of America]
A new sentence has been added to make the basis clear
14-222 14 8 7 Is the general "monsoons" really to be considered as a "convergence zone"? Possibly change to "associated with monsoon circulations"? [Erik Kjellström, Sweden]
This has now been more carefully reworded
14-223 14 8 11 8 13 The sentence could be omitted, as the same is contained in the text above. [Markku Rummukainen, Sweden] Disagree. We would like to keep this sentence to make it clear what the focus of the chapter is
14-224 14 8 15 8 15 include "(14.1.1 and 14.1.2)" after "subsections" [Annalisa Cherchi, Italy] Accepted
14-225 14 8 19 8 22 It would seem that the approach is not only to review regional climate change in terms of phenomena. This varies across the regional chapters. In some cases the discussion is on what has been observed/projected, but not extended to interpretation in terms of specific phenomena. In some cases, the regional changes may also be due to direct effects as suggested by the lack of an underlying specific phenomena change. It would seem prudent to more clearly express that regional climate change is a result of the global-scale change, although in several cases mediated by changes in specific phenomena, rather than only direct radiative and subsequent effect. Some of this could be expressed with a rewrite along the lines of: "In Section 14.7, observed and projectd regional climate changes are reviewed and to the degree possible, interpreted in terms of the findings on specific phenomena. Assessment of techniques for and evaluation of simulation of regional-scale climates is presented in Section 9.6." (If something on climate impact assessments is due here, one could refer to WGII.) Also, the contents of FAQ4.1 has some text that could be useful here, in introducing the overall approach in the Chapter. [Markku Rummukainen, Sweden]
Accepted. This has now been reworded more carefully
14-226 14 8 21 8 22 Here readers are told to go to Chapter 9, section 5 for an assesment of RCMs that are used in this chapter. Can the salient points should be summarized in this introduction? [Government of United States of America]
We are trying to be more clear
14-227 14 8 22 8 23 The last sentence of the paragraph would seem to be out of place. [Markku Rummukainen, Sweden] Accepted. This has now been moved to the start of the paragraph.
14-228 14 8 22 8 23 This discussion is not really in Section 4.1.3, but rather Boxes 14.2 and 14.3. [Thomas Stocker/ WGI TSU, Switzerland]
Accepted. Now reworded more carefully.
14-229 14 8 23 reference to section 9.6 not 9.5 [Frank Kreienkamp, Germany] Reworded
14-230 14 8 26 8 26 The title of this subsection is confusing as it does not match its contents. [Josephine Brown, Australia] Accepted. A more informative title is now used.
14-231 14 8 31 8 31 "particularly" all populated continents are mentioned except Europe... [Geert Jan van Oldenborgh, Netherlands]
Accepted. The word particularly has been removed.
14-232 14 8 41 placement of Box 14.1 would be better in Section 14.1.2 [Thomas Stocker/ WGI TSU, Switzerland] Boxes has been repositioned
14-233 14 8 44 8 44 I think it would have been good to define modes in one place only, instead much of this information has been duplicated in other chapters, and especially Chapter 14, where slightly different definitions and conventions have been used. That said, I believe that the "mode" approach is very useful for condensing information about the nature of climate variability [George Kiladis, United States of America]
Rejected. After much discussion, authors of Chapter 14 and other Chapters agreed that it was best to discuss different aspects of modes in different chapters. We have tried to maintain consistency in definitions (e.g. between Ch 14 and Ch2).
14-234 14 8 53 8 53 Why is this critical definition in a footnote? This should be front and center of the introductory paragraph. [Government of United States of America]
Accepted.
14-235 14 9 12 9 13 Since EOFs are automatically obtained when calculating the PCs, it is not necessary (although it is common) to go through 1) taking a PC as a "climate index", and 2) projecting the gridded data onto this index to get a
Rejected. We define principal components as having maximum variance so they are not from the
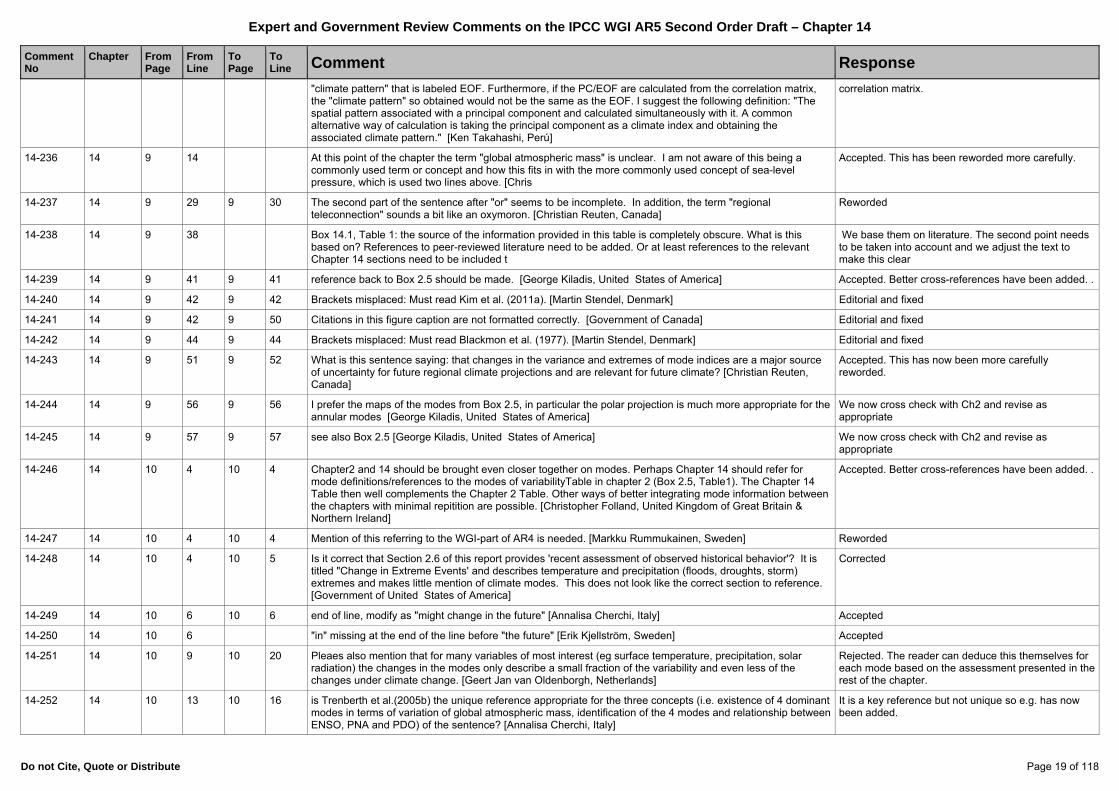
Expert and Government Review Comments on the IPCC WGI AR5 Second Order Draft – Chapter 14
Do not Cite, Quote or Distribute Page 19 of 118
Comment No
Chapter
FromPage
FromLine
To Page
To Line Comment Response
"climate pattern" that is labeled EOF. Furthermore, if the PC/EOF are calculated from the correlation matrix, the "climate pattern" so obtained would not be the same as the EOF. I suggest the following definition: "The spatial pattern associated with a principal component and calculated simultaneously with it. A common alternative way of calculation is taking the principal component as a climate index and obtaining the associated climate pattern." [Ken Takahashi, Perú]
correlation matrix.
14-236 14 9 14 At this point of the chapter the term "global atmospheric mass" is unclear. I am not aware of this being a commonly used term or concept and how this fits in with the more commonly used concept of sea-level pressure, which is used two lines above. [Chris
Accepted. This has been reworded more carefully.
14-237 14 9 29 9 30 The second part of the sentence after "or" seems to be incomplete. In addition, the term "regional teleconnection" sounds a bit like an oxymoron. [Christian Reuten, Canada]
Reworded
14-238 14 9 38 Box 14.1, Table 1: the source of the information provided in this table is completely obscure. What is this based on? References to peer-reviewed literature need to be added. Or at least references to the relevant Chapter 14 sections need to be included t
We base them on literature. The second point needs to be taken into account and we adjust the text to make this clear
14-239 14 9 41 9 41 reference back to Box 2.5 should be made. [George Kiladis, United States of America] Accepted. Better cross-references have been added. .
14-240 14 9 42 9 42 Brackets misplaced: Must read Kim et al. (2011a). [Martin Stendel, Denmark] Editorial and fixed
14-241 14 9 42 9 50 Citations in this figure caption are not formatted correctly. [Government of Canada] Editorial and fixed
14-242 14 9 44 9 44 Brackets misplaced: Must read Blackmon et al. (1977). [Martin Stendel, Denmark] Editorial and fixed
14-243 14 9 51 9 52 What is this sentence saying: that changes in the variance and extremes of mode indices are a major source of uncertainty for future regional climate projections and are relevant for future climate? [Christian Reuten, Canada]
Accepted. This has now been more carefully reworded.
14-244 14 9 56 9 56 I prefer the maps of the modes from Box 2.5, in particular the polar projection is much more appropriate for the annular modes [George Kiladis, United States of America]
We now cross check with Ch2 and revise as appropriate
14-245 14 9 57 9 57 see also Box 2.5 [George Kiladis, United States of America] We now cross check with Ch2 and revise as appropriate
14-246 14 10 4 10 4 Chapter2 and 14 should be brought even closer together on modes. Perhaps Chapter 14 should refer for mode definitions/references to the modes of variabilityTable in chapter 2 (Box 2.5, Table1). The Chapter 14 Table then well complements the Chapter 2 Table. Other ways of better integrating mode information between the chapters with minimal repitition are possible. [Christopher Folland, United Kingdom of Great Britain & Northern Ireland]
Accepted. Better cross-references have been added. .
14-247 14 10 4 10 4 Mention of this referring to the WGI-part of AR4 is needed. [Markku Rummukainen, Sweden] Reworded
14-248 14 10 4 10 5 Is it correct that Section 2.6 of this report provides 'recent assessment of observed historical behavior'? It is titled "Change in Extreme Events' and describes temperature and precipitation (floods, droughts, storm) extremes and makes little mention of climate modes. This does not look like the correct section to reference. [Government of United States of America]
Corrected
14-249 14 10 6 10 6 end of line, modify as "might change in the future" [Annalisa Cherchi, Italy] Accepted
14-250 14 10 6 "in" missing at the end of the line before "the future" [Erik Kjellström, Sweden] Accepted
14-251 14 10 9 10 20 Pleaes also mention that for many variables of most interest (eg surface temperature, precipitation, solar radiation) the changes in the modes only describe a small fraction of the variability and even less of the changes under climate change. [Geert Jan van Oldenborgh, Netherlands]
Rejected. The reader can deduce this themselves for each mode based on the assessment presented in the rest of the chapter.
14-252 14 10 13 10 16 is Trenberth et al.(2005b) the unique reference appropriate for the three concepts (i.e. existence of 4 dominant modes in terms of variation of global atmospheric mass, identification of the 4 modes and relationship between ENSO, PNA and PDO) of the sentence? [Annalisa Cherchi, Italy]
It is a key reference but not unique so e.g. has now been added.
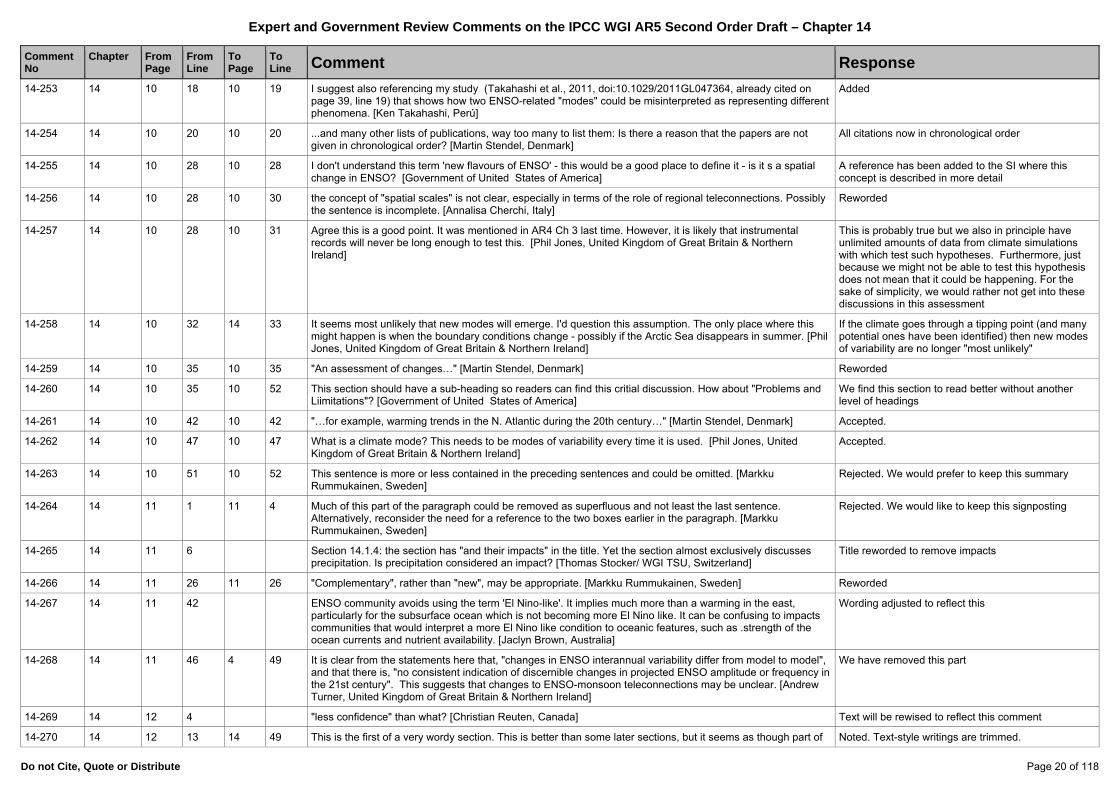
Expert and Government Review Comments on the IPCC WGI AR5 Second Order Draft – Chapter 14
Do not Cite, Quote or Distribute Page 20 of 118
Comment No
Chapter
FromPage
FromLine
To Page
To Line Comment Response
14-253 14 10 18 10 19 I suggest also referencing my study (Takahashi et al., 2011, doi:10.1029/2011GL047364, already cited on page 39, line 19) that shows how two ENSO-related "modes" could be misinterpreted as representing different phenomena. [Ken Takahashi, Perú]
Added
14-254 14 10 20 10 20 ...and many other lists of publications, way too many to list them: Is there a reason that the papers are not given in chronological order? [Martin Stendel, Denmark]
All citations now in chronological order
14-255 14 10 28 10 28 I don't understand this term 'new flavours of ENSO' - this would be a good place to define it - is it s a spatial change in ENSO? [Government of United States of America]
A reference has been added to the SI where this concept is described in more detail
14-256 14 10 28 10 30 the concept of "spatial scales" is not clear, especially in terms of the role of regional teleconnections. Possibly the sentence is incomplete. [Annalisa Cherchi, Italy]
Reworded
14-257 14 10 28 10 31 Agree this is a good point. It was mentioned in AR4 Ch 3 last time. However, it is likely that instrumental records will never be long enough to test this. [Phil Jones, United Kingdom of Great Britain & Northern Ireland]
This is probably true but we also in principle have unlimited amounts of data from climate simulations with which test such hypotheses. Furthermore, just because we might not be able to test this hypothesis does not mean that it could be happening. For the sake of simplicity, we would rather not get into these discussions in this assessment
14-258 14 10 32 14 33 It seems most unlikely that new modes will emerge. I'd question this assumption. The only place where this might happen is when the boundary conditions change - possibly if the Arctic Sea disappears in summer. [Phil Jones, United Kingdom of Great Britain & Northern Ireland]
If the climate goes through a tipping point (and many potential ones have been identified) then new modes of variability are no longer "most unlikely"
14-259 14 10 35 10 35 "An assessment of changes…" [Martin Stendel, Denmark] Reworded
14-260 14 10 35 10 52 This section should have a sub-heading so readers can find this critial discussion. How about "Problems and Liimitations"? [Government of United States of America]
We find this section to read better without another level of headings
14-261 14 10 42 10 42 "…for example, warming trends in the N. Atlantic during the 20th century…" [Martin Stendel, Denmark] Accepted.
14-262 14 10 47 10 47 What is a climate mode? This needs to be modes of variability every time it is used. [Phil Jones, United Kingdom of Great Britain & Northern Ireland]
Accepted.
14-263 14 10 51 10 52 This sentence is more or less contained in the preceding sentences and could be omitted. [Markku Rummukainen, Sweden]
Rejected. We would prefer to keep this summary
14-264 14 11 1 11 4 Much of this part of the paragraph could be removed as superfluous and not least the last sentence. Alternatively, reconsider the need for a reference to the two boxes earlier in the paragraph. [Markku Rummukainen, Sweden]
Rejected. We would like to keep this signposting
14-265 14 11 6 Section 14.1.4: the section has "and their impacts" in the title. Yet the section almost exclusively discusses precipitation. Is precipitation considered an impact? [Thomas Stocker/ WGI TSU, Switzerland]
Title reworded to remove impacts
14-266 14 11 26 11 26 "Complementary", rather than "new", may be appropriate. [Markku Rummukainen, Sweden] Reworded
14-267 14 11 42 ENSO community avoids using the term 'El Nino-like'. It implies much more than a warming in the east, particularly for the subsurface ocean which is not becoming more El Nino like. It can be confusing to impacts communities that would interpret a more El Nino like condition to oceanic features, such as .strength of the ocean currents and nutrient availability. [Jaclyn Brown, Australia]
Wording adjusted to reflect this
14-268 14 11 46 4 49 It is clear from the statements here that, "changes in ENSO interannual variability differ from model to model", and that there is, "no consistent indication of discernible changes in projected ENSO amplitude or frequency in the 21st century". This suggests that changes to ENSO-monsoon teleconnections may be unclear. [Andrew Turner, United Kingdom of Great Britain & Northern Ireland]
We have removed this part
14-269 14 12 4 "less confidence" than what? [Christian Reuten, Canada] Text will be rewised to reflect this comment
14-270 14 12 13 14 49 This is the first of a very wordy section. This is better than some later sections, but it seems as though part of Noted. Text-style writings are trimmed.
Expert and Government Review Comments on the IPCC WGI AR5 Second Order Draft – Chapter 14
Do not Cite, Quote or Distribute Page 21 of 118
Comment No
Chapter
FromPage
FromLine
To Page
To Line Comment Response
this could have been written for a textbook. [Phil Jones, United Kingdom of Great Britain & Northern Ireland]
14-271 14 12 15 Section 14.2.1 All models are weighed equally here. Earlier you state that hte realism of the monsoon in GCMs ranges from fairly realsitic to very poor. Would it not make sense to exclude the models with a very poor representation of the monsoon system from the analyses here? [Geert Jan van Oldenborgh, Netherlands]
Rejected. There is no universal way to select good/poor models.
14-272 14 12 17 85 18 Compared to the First Order Draft, the SOD on the Indian monsoon sections are well focussed - there are some repetitions between pages 15-17 (Section 14.2.2.1) and pages 81-84 (Section 14.7.10). In addition, Section 14.7.10 needs some shortening. As before, i will be happy to work with the authors in revising the SOD. The revised version on the Indian Ocean Modes of variability is appreciated [H Annamalai, United States of America]
Noted. Repetition removed.
14-273 14 12 17 need to provide a brief definition of Monsoon here at the onset of the Monsoon Sections; reference to the Glossary would also be useful [Thomas Stocker/ WGI TSU, Switzerland]
Accepted. Definitions are given in Supplementary Information.
14-274 14 12 25 12 25 The reference Wu et al.(2012) is not appropriate, at least not as unique. Orography and associated thermal forcing, and influence on monsoon seasonality is known since Yanai et al.(1992). The details of the references are: "Yanai M, Li C, Song Z (1992) Seasonal heating of the Tibetan Plateau and its effects on the evolution of the Asian summer monsoon. J Meteor Soc Jpn 70: 319-351". [Annalisa Cherchi, Italy]
Accepted. Wu et al reference is dropped.
14-275 14 12 27 12 28 "However, this does not lead to a generally stronger monsoon circulation in the future, since changes in regional monsoon characteristics are rather complex." [Martin Stendel, Denmark]
Noted. Text removed.
14-276 14 12 27 28 It needs some explanation here as why "this does not lead to generally stronger monsoon in the future". Also, the final sentence of this section does not really add that much information. Either expand it and explain what is making it so difficult or remove it. [Erik Kjellström, Sweden]
Noted. Text removed.
14-277 14 12 30 12 38 The rationale behind the choice of this figure should be explained [Annalisa Cherchi, Italy] This paragraph and SOD Fig.14.1 were deleted.
14-278 14 12 30 12 38 it seems unsatisfactory to pick only the 300hPa level in performing the analysis and assessment of Figure 14.1. This is sufficiently close to the tropopause that there may be large discrepancies in model simulations that may be cast in an unfair light. Furthermore, reanalysis products used in comparison may have difficulty at this level. Making the calculation averaged over a range of pressure heights would be more appropriate. [Andrew Turner, United Kingdom of Great Britain & Northern Ireland]
This paragraph and SOD Fig.14.1 were deleted.
14-279 14 12 30 12 46 We were a bit confused as to the relevance of this paragraph on the south Asian monsoon (and figure 14.1) located within this section providing a global overview. If this paragraph is to remain here, please try to better highlight the globally relevant message you are trying to make with this example. [Thomas Stocker/ WGI TSU, Switzerland]
This paragraph and SOD Fig.14.1 were deleted.
14-280 14 12 34 12 34 Not clear what the reanalysis trends are different to. [John Caesar, United Kingdom of Great Britain & Northern Ireland]
This paragraph and SOD Fig.14.1 were deleted.
14-281 14 12 34 12 34 Reanalysis data show different trends to what? Or are not consistent between reanalyses? What is the range from reanalysis? Where does this deficiency come from? [European Union]
This paragraph and SOD Fig.14.1 were deleted.
14-282 14 12 34 12 34 The reanalyses cover a relatively short period, which in itself may preclude evaluation of the simulated results, rather than the point being that the reanalyses do not show the same trend. [Markku Rummukainen, Sweden]
This paragraph and SOD Fig.14.1 were deleted.
14-283 14 12 34 12 38 it would be worth citing Krishnan et al. (2012, Climate Dynamics, Krishnan, R., T. P. Sabin, D. C. Ayantika, A. Kitoh, M. Sugi, H. Murakami, A. G. Turner, J. M. Slingo and K. Rajendran, published online 29 February 2012, Will the South Asian monsoon overturning circulation stabilize any further? DOI: 10.1007/s00382-012-1317-0) who examine evidence of observed weakening of the South Asian monsoon circulation in observations and the projected future trend in a high resolution AGCM simulation. [Andrew Turner, United Kingdom of Great Britain & Northern Ireland]
This paragraph and SOD Fig.14.1 were deleted.
14-284 14 12 34 I disagree with that statement on the basis of Fig. 14.1: The reanalysis data either agree with the longer observational trends or they are too short to draw any conclusions. [Christian Reuten, Canada]
This paragraph and SOD Fig.14.1 were deleted.
Expert and Government Review Comments on the IPCC WGI AR5 Second Order Draft – Chapter 14
Do not Cite, Quote or Distribute Page 22 of 118
Comment No
Chapter
FromPage
FromLine
To Page
To Line Comment Response
14-285 14 12 36 12 38 The decrease of the upper-tropospheric temperature can also be the result of decreased heating by reduced precipitation, not only of a weakening of monsoon circulation. Please clarify. [Massimo Bollasina, Italy]
This paragraph and SOD Fig.14.1 were deleted.
14-286 14 12 40 12 46 The three reanalysis curves for NRA1, JRA25 and ERA-Interim should be extended to the present day in this figure, and they should be extended back to the proper start times of the reanalysis. All are run in close to real time, so have completed much of 2012, and they cover the periods from 1979 onwards in the case of JRA-25 and ERA-Interim and (I believe) from 1948 onwards for NRA1. Later start times and earlier finish times are shown in the figure. Also, ERA-40 ran from 1958 to 2001, and again this whole period is not spanned by the curve for this reanalysis. Have the reanalysis data simply been wrongly plotted in the figure? This would be the simplest explanation. [Adrian Simmons, United Kingdom]
SOD Fig.14.1 were deleted. In the SOD Fig.14.1, all data are plotted with 20-year running means.
14-287 14 12 45 12 46 "oragne (ERA-Int)" should be "orange (ERA-Interim)". [Adrian Simmons, United Kingdom] SOD Fig.14.1 were deleted.
14-288 14 12 48 12 48 modify "the precipitation characteristics" [Annalisa Cherchi, Italy] Accepted. But text modified.
14-289 14 12 48 12 48 Typo: "t" in front of precipitation [Government of Canada] Accepted. But text modified.
14-290 14 12 48 12 48 the precipitation characteristics? [George Kiladis, United States of America] Accepted. But text modified.
14-291 14 12 48 12 48 What is “t precipitation”. Please check. [Sai Ming Lee, Hong Kong, China] Accepted. But text modified.
14-292 14 12 48 12 48 Remove "t" before precipitation [Madhavan Nair RAJEEVAN, India] Accepted. But text modified.
14-293 14 12 48 12 48 Remove "t" between "view" and "precipitation": [Martin Stendel, Denmark] Accepted. But text modified.
14-294 14 12 48 12 53 The first part of this paragraph would fit better into the introductory discussion above (page 12, lines 17-28). [Josephine Brown, Australia]
Accepted. Text modified.
14-295 14 12 48 12 58 Issue: Our group's relevant work could be cited to strengthen the discussion here. Suggested Changes: add a sentence after "..(Trenberth et al., 2000)." on line 50 of p. 14-12:"Zeng and Lu (2004) proposed an objective criterion to define, for the first time, globally unified summer monsoon onset (or retreat) dates using the global gridded normalized precipitable water data, and demonstrated the nearly simultaneous monsoon onset and retreat over various monsoon regions in the same hemisphere." Reference: Zeng, X., and E. Lu, 2004: Globally unified monsoon onset and retreat indexes. J. Climate, 17, 2241-2248. [Xubin Zeng, United States of America]
Noted. Text modified.
14-296 14 12 48 Typo error - an extra letter "t" [H Annamalai, United States of America] Accepted. But text modified.
14-297 14 12 48 Typo: delete the lone "t". [Adrian Simmons, United Kingdom] Accepted. But text modified.
14-298 14 12 58 Probably better to emphasize "summer OCEANIC monsoon". [Christian Reuten, Canada] Accepted. Text modified.
14-299 14 12 26 Section 14.2: Statements about 'generally monsoon onset dates will come earlier or not change much and monsoon retreat dates will become delayed...' must be reconciled with regional specificities already manifest. For example, Sabeerali, Rao, Ajayamohan, Murtugudde, On the relationship between Indian Summer Monsoon Withdrawal and Indo-Pacific Sea Surface Temperature Anomalies before and after 1976/77 Climate Shift. Clim. Dyn., (accessed online in 2010) have argued that withdrawal has occurred earlier since the mid-1970s and thus compressing the Indian monsoon season. This seems to be consistent with the increasing extreme events reported by Goswami et al. (2006). Can there be a consistency in longer monsoon seasons and increasing extremes? Some consistency check may be necessary. [Government of United States of America]
Noted. Regional monsoon changes are dealt with separately in later sections.
14-300 14 12 Section 14.2.2: The text on monsoon regions/systems has considerably improved from the FOD. There is, however, still quite a lot of general description of monsoon systems, which may not be needed in the present extent, compared to new information on observed trends, when they exist, models' performance and projections. Cross-referencing to relevant other chapters could also be implemented more. [Markku Rummukainen, Sweden]
Noted. Text-book style descriptions removed.
Expert and Government Review Comments on the IPCC WGI AR5 Second Order Draft – Chapter 14
Do not Cite, Quote or Distribute Page 23 of 118
Comment No
Chapter
FromPage
FromLine
To Page
To Line Comment Response
14-301 14 13 4 13 4 "multi-model ensembles generally reproduce" [George Kiladis, United States of America] Accepted. But text modified.
14-302 14 13 4 13 5 in mentioning that the disparity between monsoon simulations in the best and poorest models is very large, it would be worth citing Sperber et al. (2012), already listed in the references. [Andrew Turner, United Kingdom of Great Britain & Northern Ireland]
Accepted. But this reference is added in Section 14.2.2.2.
14-303 14 13 4 6 Here, at two occasions (l4 and l6) "observed global monsoon" is mentioned? What is this?? Should it rather be the "monsoon circulations observed in different parts of the world"? Or, is it referring to the GMA/GMP/GMI defined in the next section? [Erik Kjellström, Sweden]
Noted. But text is deleted.
14-304 14 13 5 13 6 This sentence is refers section 10.3.3.7. However, section 10.3.3.7 covering monsoons has been removed in the SOD and the discussion of monsoon uncertainty in Ch10 is now referring back to Ch14. [Thomas Stocker/ WGI TSU, Switzerland]
Noted. This sentence was deleted.
14-305 14 13 5 13 8 not clear what does this sentence mean [European Union] Noted. This sentence was deleted.
14-306 14 13 5 consider changing "best and poorest models" to "realistic and unrealistic models" [H Annamalai, United States of America]
Noted. This sentence was deleted.
14-307 14 13 6 13 7 Can a statement be made regarding performance of models with higher horizontal resolution than the Kim et al. 2008 study (e.g. 10 km or 36 km), which looked at nothing finer than ~100 km? [Government of United States of America]
Noted. This sentence was deleted.
14-308 14 13 6 13 7 Fix the grammar and commas. [Christian Reuten, Canada] Noted. This sentence was deleted.
14-309 14 13 12 13 13 The monsoon domain definition needs rewriting. How can the annual range be defined in the summer season? [Josephine Brown, Australia]
Agreed. Definitions are given in Supplementary Information..
14-310 14 13 12 13 13 The "annual range…. in summer season" is unclear. [Markku Rummukainen, Sweden] Agreed. Definitions are given in Supplementary Information..
14-311 14 13 12 "where the monsoon precipitation domain is defined": The word "where" is confusing here since the term was not mentioned in the main clause; is this a new term or the same as the GMA? [Christian Reuten, Canada]
Agreed. Definitions are given in Supplementary Information..
14-312 14 13 13 5 8 What does this sentence mean? [European Union] Noted. This sentence was deleted.
14-313 14 13 15 13 15 Typo: "," is missing between 0 and +9 [Government of Canada] Accepted. Word corrected.
14-314 14 13 15 13 16 Add percent signs: "The rates of change of GMP are large, with 0%, +9% and +13% (+5%, +17% and +27%) change…" [Martin Stendel, Denmark]
Accepted. Word corrected.
14-315 14 13 15 Awkward to call the rates of change "large" and then list as the first value a "0". [Christian Reuten, Canada] Rejected. Median change (+9%) is large.
14-316 14 13 19 13 27 You could cross reference Box 2.4 here which describes these types of extremes indices. [Lisa Alexander, Australia]
Rejected. Definitions are given in Supplementary Information..
14-317 14 13 20 13 21 Dry days (DD) -> is this a different index from CDD? Also not clear how this index would indicate that intense precipitation will increase, because this is a drought related index. [Thomas Stocker/ WGI TSU, Switzerland]
Noted. Now CDD is used.
14-318 14 13 21 13 21 Other chapters I've looked at (Ch 2, 9, 12) have provided assessments for "Consecutive Dry Days (CDD)" rather than "Dry Days (DD)". I that CDD is used later in the chapter for some figures. This just brings in some inconsistencies within and between the chapters and makes it harder to provide a consistent end to end assessment. [Lisa Alexander, Australia]
Noted. Now CDD is used.
14-319 14 13 21 22 Is the statement about increasing intensity referring to GMI or R5d? [Erik Kjellström, Sweden] Noted. Refers R5d.
14-320 14 13 22 13 23 "It is apparent… those for mean precipitation." - A careful look at GMP in Figure 14.2.c reveals that GMP actually depends as much on the strength of the anthropogenic forcing as R5d and even more strongly than SDII and DD, in conterast to the statement made here. [Wilhelm May, Denmark]
Noted. Sentence modified.
14-321 14 13 24 27 A suggestion would be to add information about these correlations to Figure 14.2. For instance by adding the Noted. This sentence is deleted.
Expert and Government Review Comments on the IPCC WGI AR5 Second Order Draft – Chapter 14
Do not Cite, Quote or Distribute Page 24 of 118
Comment No
Chapter
FromPage
FromLine
To Page
To Line Comment Response
correlation coefficients for PD, RCP4.5 and 8.5 respectively. [Erik Kjellström, Sweden]
14-322 14 13 26 13 27 the statement is again made that the, "relationship between the monsoons and ENSO is projected to strengthen". I think there should be a more specific statement as to the findings of the Hsu et al. study given the other evidence presented elsewhere in this Chapter as to the future uncertainty of change in ENSO. [Andrew Turner, United Kingdom of Great Britain & Northern Ireland]
Noted. This sentence is deleted.
14-323 14 13 40 13 42 Krishnan et al. (2012, Climate Dynamics, see comment 6) would be a good citation here given its examination of weakening monsoon circulation over South Asia. [Andrew Turner, United Kingdom of Great Britain & Northern Ireland]
Rejected. Here the global monsoon is assessed.
14-324 14 13 46 Is it always "the increased aerosol forcing"? Or, are there regions where it is projected to decrease? [Erik Kjellström, Sweden]
Noted. Yes.
14-325 14 13 47 Add the following citation which has recently discussed and attributed the recent change of the South Asian monsoon to aerosol forcing: Bollasina, M., Y. Ming, and V. Ramaswamy, 2011: Anthropogenic aerosols and the weakening of the South Asian summer monsoon. Science, 334, 502-505. [Massimo Bollasina, Italy]
Rejected. Here the global monsoon is assessed.
14-326 14 13 47 Please indicate how horizontal pressure gradients develop from changes to the stability profile. Is the cause nonuniform underlying surface characteristics? [Government of United States of America]
Rejected. See reference.
14-327 14 13 50 13 51 If the reference is to the specification of (aerosol) forcing in climate change simulations, rather that the representation of aerosols as such, reference to Chapter 12 could be considered instead. [Markku Rummukainen, Sweden]
Accepted. Chapter 12 is referenced.
14-328 14 13 53 14 7 expand the acronyms EAS, SAS [Annalisa Cherchi, Italy] Accepted.
14-329 14 13 53 14 20 The authors related to Fig. 14.3 should comment on the distinctly different trends of precipitation between the recent decades and the future model projections for almost all the monsoon regions (except NAM and SAM), since the recent change of precipitation may already be affectd by anthropogenic forcing (for example, see chap. 10). Otherwise, many non-expert people doubt why the trends change so distinctly before and after the present era. If the models are not well reproduced regional monsoon features including precipitation, we should not use those models for predicting the future. [Tetsuzo Yasunari, Japan]
Noted. Much of this paragraph is moved to later sections and rewritten.
14-330 14 13 54 13 54 Can you conclude from the NAF and to a lesser extent SAM plots in which the model ensemble does not encompass the observations that the climate models underestimate either the variability or the trends diue to aerosols and/or GHGs in these regions? What does this imply for our trust in the projections? [Geert Jan van Oldenborgh, Netherlands]
Noted. Confidence is low for these regions.
14-331 14 13 54 14 7 Acronym SAS should be defined here, not much later in the chapter. Likewise EAS, SDII and R5d later in the paragraph. The whole chapter probably should be checked for this sort of thing. It would have been good policy to do this before releasing this draft, as it makes reviewing more awkward and time-consuming when non-standard acronyms such as R5D are used but defined later. [Adrian Simmons, United Kingdom]
Accepted. Acronyms defined where first appears.
14-332 14 13 58 Says "90th percentile". Should be "10th percentile"? [Erik Kjellström, Sweden] Agreed. Corrected.
14-333 14 14 1 3 Here, words like "larger" and "much more" are used. Is there any measure of the significance of these statements? There are also other areas as AUS showing relatively large increases. [Erik Kjellström, Sweden]
Noted. Much of this paragraph is moved to later sections and rewritten.
14-334 14 14 5 14 5 Virtually certain' reported here is given as 'very likely' for the South Asian monsoon in the executive summary. Please ensure consistency. [Thomas Stocker/ WGI TSU, Switzerland]
Noted. ES modified.
14-335 14 14 7 14 7 Australian monsoon region'. Does this statement apply to just the Australian portion of this domain (which is how many readers may read it)? [Government of Australia]
Noted. Australian and Maritime continent region.
14-336 14 14 7 Australian monsoon region'. Does this statement apply to just the Australian portion of this domain (which is how many readers may read it)? [Penny Whetton, Australia]
Noted. Australian and Maritime continent region.
14-337 14 14 14 14 14 14 [Christian Reuten, Canada] Rejected. Comment incomplete.
Expert and Government Review Comments on the IPCC WGI AR5 Second Order Draft – Chapter 14
Do not Cite, Quote or Distribute Page 25 of 118
Comment No
Chapter
FromPage
FromLine
To Page
To Line Comment Response
14-338 14 14 17 14 17 CRU TS 3.1 has been revised to CRU TS 3.2. Make sure you recompute values for this dataset. Precipitation had a problem for some datasets. There is a reference for this dataset (Harris et al., 2012 - Ref in Ch 2). [Phil Jones, United Kingdom of Great Britain & Northern Ireland]
Accepted. New data set is now used.
14-339 14 14 23 Figure 14.4: a number of indices are presented in this figure. However, it's not explained how these indices are calculated. Suggest to add this specific information to either the text or probably better (given the substantial over length of the Chapter) to the Supplementary Material. [Thomas Stocker/ WGI TSU, Switzerland]
Accepted. Definitions are in the Supplementary Materials.
14-340 14 14 30 14 31 "Timings of monsoon… (Figure 14.5)." - It is important to note that here the onset and retreat date of the different monsoon systems are defined via precipitation, neglecting the characteristics of the monsoon circulations, which actually set up the regional monsoons. In the case of the Indian summer monsoon, the importance of the transition of the large-scale flow for the timing of the monsoon is well documented in the paper by Xavier et al. (2007). In the light of the projected weakening of the monsoon circulation, hence, considering the transition of the large-scale flow instead of precipitation when defining the onset and retreat dates of the regional monsoons may lead to different results. This issue needs to be adressed. (Xavier, P., C. Marzin, and B. N. Goswami, 2007: An objective definition of the Indian summer monsoon season and a new perspective on the ENSO-monsoon relationship. Q. J. R. Met. Soc., 133, 749-764) [Wilhelm May, Denmark]
Noted. Here, global precipitation monsoons are defined and used.
14-341 14 14 30 14 37 Is an assessment of monsoon season onset/retreat and length under RCP2.6 not available? This would be useful from a policy perspective. [European Union]
Accepted. RCP2.6 and RP6.0 are included.
14-342 14 14 30 14 37 This analysis seems to depend critically on the definition of onset and retreat times. Other definitions give different conclusions, eg Shongwe et al (2009) doi:10.1175/2009JCLI2317.1 for CMIP3 models show a delay of the onset date for SAF. Can the results be compared to other definitions? [Geert Jan van Oldenborgh, Netherlands]
Noted. Works with different definitions added.
14-343 14 14 30 14 49 Has the monsoon season been assessed using RCP2.6? [John Caesar, United Kingdom of Great Britain & Northern Ireland]
Accepted. RCP2.6 and RP6.0 are included.
14-344 14 14 34 14 34 "…retreat date will very likely be delayed…" [Martin Stendel, Denmark] Noted. Text modified.
14-345 14 14 34 14 35 "…and duration will therefore likely be longer…" [Martin Stendel, Denmark] Noted. Text modified.
14-346 14 14 35 14 36 Statement that AUS monsoon onset will be earlier and duration longer contradicts the results given on page 3 and in Section 14.2.2.4. [Josephine Brown, Australia]
Noted. Different definition of monsoon onset/retreat and different data sets caused this problem. Will be treated carefully.
14-347 14 14 36 14 36 "…with resulting likely longer monsoon duration." [Martin Stendel, Denmark] Noted. Text modified.
14-348 14 14 45 14 49 The summer monsoon onset dates in the broad Asia-Pacific region in the recent decades (1979-2008) have become earlier with overall weakening of mid-monsoon months (Kajikawa et al., 2011), which should be quoted here on in the Asia-Australia monsoon section or in 14.2.2.1 (Indan Monsoon). Kajikawa, Y., T. Yasunari, S. Yoshida and H. Fujinami (2012): Advancec Asian summer monsoon onset in recent decades. Geophys. Res. Lett., 39, [Tetsuzo Yasunari, Japan]
Rejected. Not a review of observations.
14-349 14 14 53 14 57 Explain that the Indo-Australian monsoon is divided into Maritime Continent and Australian monsoons in the following discussion. [Josephine Brown, Australia]
The text has been revised taking into consideration of the suggestion
14-350 14 14 53 14 57 In the introductory paragraph of this section and similarly in some of the other sections, it would be very helpful to provide a map delineating the areas that are introduced. [Christian Reuten, Canada]
Figure 14.3 shows different monsoon systems
14-351 14 14 53 14 57 Can you please either harmonise the different monsoon areas and abbreviations with the previous section or explain why they are different? [Geert Jan van Oldenborgh, Netherlands]
Is taken care of
14-352 14 14 Figures 14.4-14.5: specify over which period the changes are computed. [Massimo Bollasina, Italy] Most of the monsoon related figures are either redrawn or regrouped and the captions are adequately modified
14-353 14 15 2 What is "reforecast"? Should it rather be "reanalysis"? [Erik Kjellström, Sweden] Text is corrected
Expert and Government Review Comments on the IPCC WGI AR5 Second Order Draft – Chapter 14
Do not Cite, Quote or Distribute Page 26 of 118
Comment No
Chapter
FromPage
FromLine
To Page
To Line Comment Response
14-354 14 15 5 15 7 The suggestion that the Indian monsoon-ENSO teleconnection, “appears to have weakened” in this sentence is poor based on the available evidence and without additional qualification. Since the cited Kumar et al. (1999) paper, Kumar et al. (2006; see comment 1) demonstrated variations in the strength of the Indian monsoon-ENSO teleconnection based on the flavour (position) of ENSO, with central Pacific El Nino events being much better teleconnected to monsoon drought (recent observed examples in 2002, 2004, 2009). Furthermore, if one computes the monsoon-ENSO teleconnection using all-India rainfall and Nino-3 through a 21-year moving window, merely replacing the large 1997 El Nino with climatological SST removes much of the reported decline. In addition, papers such as Turner et al. (2007; already cited), and Annamalai, Hamilton & Sperber (2007; already cited), show that it is possible for there to be very large decadal-time scale variations in the strength of the monsoon-ENSO teleconnection in model integrations with fixed climate forcing. [Andrew Turner, United Kingdom of Great Britain & Northern Ireland]
The revised text takes care of this suggestion
14-355 14 15 6 15 6 Gershunov (2001) showed that the observed variability in the ENSO-monsoon connectiln fits well within the random variability expected from a stochastic process like the weather.Has it been shown that changes in the strength are significant using eg his test? [Geert Jan van Oldenborgh, Netherlands]
The text related to Monsoon-ENSO teleconnection is revised and the issues raised here are addressed
14-356 14 15 7 15 7 References like Xavier et al.(2007) and van Oldenborgh and Burgers (2005) questioning the relevance of the ENSO-monsoon connection weakening, the first pointing out the shortcoming of considering fixed season and the second mentioning the possibility of random fluctuations, should be mentioned. The references are: "Xavier PK,Marzin C, Goswami BN (2007) An objective definition of the Indian summer monsoon season and a new perspective on the ENSOmonsoon relationship. Quart J Roy Meteor Soc 133: 749–764" and "van Oldenborgh GJ, Burgers G (2005) Searching for decadal variations in ENSO precipitation teleconnections. Geophys Res Lett 32 L15701". [Annalisa Cherchi, Italy]
The text related to Monsoon-ENSO teleconnection is revised and the issues raised here are addressed
14-357 14 15 9 15 25 Studies (e.g. Jiang et al. 2007) have shown the long-range transport of of Asian anthropogenic pollutants to the pacific and North America continent is closely related to both the Asian emission strength and monsoon convection intensity, thus the regional climate and air quality could be influenced by future changes in Asian monsoon. Jiang, J.H., N.J. Livesey, H. Su, L. Neary, J.C. McConnell, and N.A. Richards, "Connecting surface emissions, convective uplifting, and long-range transport of carbon monoxide in the upper-troposphere: New observations from the Aura Microwave Limb Sounder," Geophys. Res. Lett. 34, L18812, doi:10.1029/2007GL030638, 2007. [Government of United States of America]
This part of the text is completely rewritten and the uncertainties in the future projections due to aerosols are highlighted
14-358 14 15 15 15 20 At least some of the references listed in the middle of the sentence should be at the end as references for the latter statement in the sentence. [Christian Reuten, Canada]
Is taken care of
14-359 14 15 19 15 19 Add space before "is shown to increase". [Martin Stendel, Denmark] Is taken care of
14-360 14 15 19 15 19 Are there no direct effects of aerosols on precipitation as described in eg Li et al, NGS, doi:10.1038/ngeo1313 ? [Geert Jan van Oldenborgh, Netherlands]
Aerosol-Precipitation linkages are still not fully resolved. Will consider this aspect while revising the text
14-361 14 15 21 Add also the following citation: Bollasina, M., S. Nigam, and K.-M. Lau, 2008: Absorbing aerosols and summer monsoon evolution over South Asia: An Observational Portrayal. J. Climate, 21, 3221-3239. [Massimo Bollasina, Italy]
This part of the text is completely rewrittend and hence this could not be cited.
14-362 14 15 27 15 32 These results do not state if they are associated with a particular emissions scenario. [John Caesar, United Kingdom of Great Britain & Northern Ireland]
Emission scenario will be stated
14-363 14 15 27 15 32 Which emissions scenario do these results apply to? [European Union] Emission scenario will be stated
14-364 14 15 27 15 32 This paragraph repeats and partially contradicts findings already discussed in 14.2.1, eg Fig.14.3h shows no change in AUS precipitation. [Geert Jan van Oldenborgh, Netherlands]
This contradiction is taken care of
14-365 14 15 30 15 31 Why is there a bias to increases in the northern hemisphere? Does this relate to the NH bias in land and therefore a northward shift of the thermal equator with global warming? [Andrew Turner, United Kingdom of Great Britain & Northern Ireland]
No clear mechanism available through the literature
Expert and Government Review Comments on the IPCC WGI AR5 Second Order Draft – Chapter 14
Do not Cite, Quote or Distribute Page 27 of 118
Comment No
Chapter
FromPage
FromLine
To Page
To Line Comment Response
14-366 14 15 34 15 39 this para is not well placed here and should come earlier -- suggest to move the entire paragraph to page 14-12, line 48 [Thomas Stocker/ WGI TSU, Switzerland]
The current text has been revised and this is resolved
14-367 14 15 34 39 This paragraph is of more general nature and should be moved earlier (to the end of 14.2.1)! [Erik Kjellström, Sweden]
The current text has been revised and this is resolved
14-368 14 15 41 17 51 Section 14.2.2.1: The strong north-south asymmetry and increasing Indian monsoon does not appear to be consistent with statements about a weaker monsoon in recent decades that is mentioned later especially in terms of whether the models that project an increase in the future capture the past trends. [Government of United States of America]
The basis for assuming "increasing indian monsoon" by the reviewer is not clear. Besides the section 14.2.2.1 is about indian monsoon
14-369 14 15 45 15 47 It is not true that monsoon rainfall is maximum along the monsoon trough region. In fact the monsoon trough is known for the rainfall minima. On the western side of monsoon trough very small amount of rainfall is observed. This sentence needs a change. [Madhavan Nair RAJEEVAN, India]
The text has been edited
14-370 14 15 47 15 47 change "Changes in forcings, such as" with "A" [Annalisa Cherchi, Italy] The text has been edited
14-371 14 15 47 15 49 This sentence seems confusing and I suggest removing its last clause. Why may the large-scale monsoon not change when earlier descriptions in this Chapter suggest a weakening of the monsoon circulation? [Andrew Turner, United Kingdom of Great Britain & Northern Ireland]
The text has been edited
14-372 14 15 47 55 Figure 14.6 is not relevant here. It is hard to understand the cause and effect with respect land-sea contrast between Indian landmass and Arabian Sea or Bay of Bengal. In additon, the interpretation .."can lead to reduction of the Indian monsoon, even though the large-scale monsoon may not change" is confusing and not convining. What is the "large-scale" monsoon referrred to here? Note that in the first paragraph of Page 14-12 and section 14.2.1 - the different role of land-sea contrast vs diabatic heating is nicely presented. In other words, land-sea contrast may provide the necessary seeding for the initiation of the monsoon flow and is not a forcing to sustain the monsoon circulation. I suggest removing this figure. [H Annamalai, United States of America]
This figure is not included in the revised version. There have been many scenarios's and interpretations of role of land ocean thermal contrast, and they are just scenarios. Not unique. These have been avoided in the current version.
14-373 14 15 51 Figure 14.6: please specify if the data plotted are monthly or annual averages. [Massimo Bollasina, Italy] This figure is not included in the revised version
14-374 14 16 1 16 3 What distance into the past is being referred to? [John Caesar, United Kingdom of Great Britain & Northern Ireland]
The text has been edited
14-375 14 16 1 16 3 How long in the past is this referring to? [European Union] The text has been edited
14-376 14 16 3 There is a reference to Chapter 9 here. Is this correct (or should it rather be Chapter 2)? Could you also be more specific pointing to the section of relevance? [Erik Kjellström, Sweden]
Refered to Ch 2 as per the suggestion
14-377 14 16 10 Add also the following citation after “misrepresentation of processes”: Bollasina, M., and Y. Ming, 2012: The general circulation model precipitation bias over the southwestern equatorial Indian Ocean and its implications for simulating the South Asian monsoon. Climate Dynamics, 10.1007/s00382-012-1347-7 [Massimo Bollasina, Italy]
This section has undergone major revisions in the latest version
14-378 14 16 14 16 23 What is the significance of teh changes using atest like the one proposed by Gershunov (2001) [as eg implelemnted at climexp.knmi.nl]? [Geert Jan van Oldenborgh, Netherlands]
This statement is based on a number of sources in the literature; significance based on proposed tests is not available
14-379 14 16 16 30 41 There are some more potential references to the impact of: (a) aerosols on the Indian monsoon - e.g. Gautam et al (2009), and (B) land cover e.g. Saeed et al (2009) and Lee et al (2009). [European Union]
This section has undergone major revisions and most relevant references have been added
14-380 14 16 17 28 It is not clear whether this paragraph relates to observations or to climate model results or to both. [Erik Kjellström, Sweden]
This refers to observation; edited.
14-381 14 16 18 16 21 the statement here is poor and I refer to my earlier comments on the issue of declines in the monsoon-ENSO teleconnection. In addition, work by Xavier et al. (2007, Prince K. Xavier, Charline Marzin and B. N. Goswami, QJRMS, 133: 749-764, DOI: 10.1002/qj.45) suggest that the monsoon-ENSO teleconnection may not have changed if one considers the total rainfall within the monsoon rainy season rather than fixed June to
Statements related to monoon-ENSO have been majorly revised and the issues are adequately addressed
Expert and Government Review Comments on the IPCC WGI AR5 Second Order Draft – Chapter 14
Do not Cite, Quote or Distribute Page 28 of 118
Comment No
Chapter
FromPage
FromLine
To Page
To Line Comment Response
September dates. In discussing the variation of the teleconnection on decadal time scales, the works of Turner et al. (2007) and Annamalai et al. (2007) should also be mentioned (already in reference list). [Andrew Turner, United Kingdom of Great Britain & Northern Ireland]
14-382 14 16 18 The correct reference is Pillai and Annamalai (2012). Moist Dynamics of Severe Monsoons over South Asia: Role of the Tropical SST. J. Atmos. Sci., 69, 97-115, doi:10.1175/JAS-D-11-056.1. [H Annamalai, United States of America]
This section has been revised.
14-383 14 16 21 16 23 The recent study by Rajeevan et al. 2012 (Northeast monsoon over India: variability and prediction, 2012, M. Rajeevan, C. K. Unnikrishnan, Jyoti Bhate, K. Niranjan Kumar and P. P. Sreekala, Meteorol. Appl. 19: 226–236) showed that when NE monsoon rainfall during the recent years are considered, there is a further weakening of the relationship. There is a oscillatory kind of relationship (weakening and strengthening) of NE monsoon rainfall with ENSO. The said paper is worth quoting. [Madhavan Nair RAJEEVAN, India]
This section has been revised
14-384 14 16 24 16 27 Krishnamurthy & Shukla (2007, Journal of Climate, Krishnamurthy, V. and J. Shukla, Intraseasonal and Seasonally Persisting Patterns of Indian Monsoon Rainfall, Journal of Climate 20: 3-20) should also be mentioned here for its examination of the combination of slowly varying components with the statistics of intraseasonal events in making up the seasonal rainfall total. [Andrew Turner, United Kingdom of Great Britain & Northern Ireland]
The text has been edited. A reference to intraseasonal and low-frequency variability has been made.
14-385 14 16 30 16 31 Where is the evidence of weakening of the Indian monsoon? I think the IPCC report should be bring out statistically significant evidence to show that the Indian monsoon is weakening. Indian monsoon exhibits significant mulit-decadal variability. The recent decrease of monsoon rainfall could be part of the multi-decadal variation and may not be long term trend. The papers by Bollasina and Chung and Ramanathan used a time period such that the beginning coincides "High"and the end coincides "Low"" of the multi-decadal phase. Obviously there will be a trend. Is that trend statistically significant. [Madhavan Nair RAJEEVAN, India]
It is true that multi-decadal variability can be the cause of the recent decrease of the Indian monsoon; however, that does not negate the fact that there is a trend in the current epoch. It is not argued as a "long term" trend.
14-386 14 16 30 16 33 Is it possible to briefly state the mechanisms of how land-use change is resulting in reduced monsoon rainfall. [European Union]
Given the constraint of space, it would be difficult to discuss such mechanisms; if done, it should for other effects as well.
14-387 14 16 30 16 33 this passage should refer to the weakening tendency in Figure 14.3e. There is also no mention here of the possible role of decadal variability (e.g., Turner & Annamalai, 2012, already in reference list) on these trends. [Andrew Turner, United Kingdom of Great Britain & Northern Ireland]
The text has been edited
14-388 14 16 30 16 41 There are some more potential references to the impact of: (a) aerosols on the Indian monsoon - e.g. Gautam et al (2009), and (B) land cover e.g. Saeed et al (2009) and Lee et al (2009). [European Union]
The text is revised majorly and relevant references are cited
14-389 14 16 32 Typo error - should read as "SST rise" and not "SST rises" [H Annamalai, United States of America] Edited
14-390 14 16 35 16 35 Again, could the decline of weak precipitation events and incease in strong ones be directly related to aerosols interacting with clouds as described for another regiopn by Li et al, NGS, doi:10.1038/ngeo1313 ? [Geert Jan van Oldenborgh, Netherlands]
There is no acceptable evidence of such an assocuition
14-391 14 16 45 16 46 I suggest further clarification is made for “suppressed rainfall over the ocean” as it is rather vague. [Andrew Turner, United Kingdom of Great Britain & Northern Ireland]
This section has been revised
14-392 14 16 46 Add also the following citation: Bollasina M, Nigam S (2009) Indian Ocean SST, evaporation, and precipitation during the South Asian summer monsoon in IPCC-AR4 coupled simulations. Clim Dyn 33:1017–1032. doi:10.1007/s00382-008-0477-4 [Massimo Bollasina, Italy]
This section has been revised and relevant references are cited
14-393 14 16 50 16 51 "While intensity changes… scenario-dependent (Annamalai et al., 2007, Kumar et al., 2011a)" - The paper by May (2011) actually investigates the dependency of the projcted changes in the Indian monsoon rainfall on the strength of the anthropogenic forcing associated with different scenarios and, hence, would be a very suitable reference here. [Wilhelm May, Denmark]
The treference has bee added
14-394 14 16 50 16 53 ”agreements in the ‘sign’ are consistent with the expected changes due to thermodynamic effects in a warmer climate" We showed increases in mean precipitation were mainly attributed to thermodynamic change. But enhanced
The assessment of the possible mechanisms for future precipitation increase are provided by considering the latest available literature
Expert and Government Review Comments on the IPCC WGI AR5 Second Order Draft – Chapter 14
Do not Cite, Quote or Distribute Page 29 of 118
Comment No
Chapter
FromPage
FromLine
To Page
To Line Comment Response
extreme precipitation over land in South Asia mainly arose from dynamic changes and much less atributed to thermodynamic changes. K. Dairaku and S. Emori(2006): Dynamic and Thermodynamic Influences on Intensified Daily Rainfall during the Asian Summer Monsoon under Doubled Atmospheric CO2,Geophysical Research Letters, 33, L01704, doi:10.1029/2005GL024754 Results from time-slice ensemble experiments using a T106 AGCM revealed changes in the South Asian summer monsoon resulting from climate change. Model results under global warming conditions suggested more warming over land than over the ocean, a northward shift of lower tropospheric monsoon circulation, and an increase in mean precipitation during the Asian summer monsoon. The number of extreme daily precipitation events increased significantly. Increases in mean and extreme precipitation were attributed to greater atmospheric moisture content (a thermodynamic change). In contrast, dynamic changes limited the intensification of mean precipitation. Enhanced extreme precipitation over land in South Asia arose from dynamic changes rather than thermodynamic changes. [Koji Dairaku, Japan]
14-395 14 16 50 16 53 Please specify the 'sign' or direction of the change. [Christian Reuten, Canada] The text has been edited
14-396 14 16 53 16 53 the reference Cherchi et al.(2011) could be included [Annalisa Cherchi, Italy] The text has been edited
14-397 14 16 53 Add the following sentence: “Anthropogenic forcing on the Indian summer monsoon might also be associated with regional land-use change (Bollasina and Nigam 2011)”. Bollasina, M., and S. Nigam, 2011: Regional Hydroclimate Change over the Indian Subcontinent: Impact of the Expanding Thar Desert on the Summer Monsoon. J. Climate, 24, 3089–3106. [Massimo Bollasina, Italy]
This point is considered. Sentences can not be added as suggested by reviewres.
14-398 14 16 The phrase 'time-mean' rainfall on page 14-16 is not defined and may confuse the reader. Is that supposed to represent a seasonal-mean or some other time-mean? [Government of United States of America]
Noted and suitably edited.
14-399 14 17 1 17 7 It is better to quote the paper by Chaturvedi et al. (2012), Current science and discuss the salient features. They used CMIP5 models for examining the future projections. This paper is now published and the reference is CURRENT SCIENCE, VOL. 103, NO. 7, 10 OCTOBER 2012 791-802. [Madhavan Nair RAJEEVAN, India]
The paper is quoted.
14-400 14 17 2 17 7 A useful additional reference would be that of Krishnan et al. (2012, Climate Dynamics, see comment 6) who used a very high resolution GCM to show the regional effects of reductions in the monsoon circulation, including weakened precipitation over the Western Ghats of India. [Andrew Turner, United Kingdom of Great Britain & Northern Ireland]
This section has been revised majorly and papers are cited as per the revised text
14-401 14 17 4 17 4 the west coast of Kerala.--> the west coast of Kerala. Projection over Bangladesh by the MRI/JMA 20-km mesh AGCM shows no change in summer monsoon prrcipitation, but shows increase in winter monsoon prrcipitation (Rahman et al. 2012). Reference: Rahman, Md. M., N. Ferdousi, T. Sato, S. Kusunoki and Kitoh, A., 2012. Rainfall and temperature scenario for Bangladesh using 20km mesh AGCM. International Journal of Climate Change Strategies and Management, 4(1): 66-80. doi: 10.1108/17568691211200227. ftp://mri-2.mri-jma.go.jp/skusunok/Rahman_2012_Strategies&Management.pdf [Shoji Kusunoki, Japan]
Is it summer monsoon precipitation over Bangladesh? It has been emphasized that assessment over small geographical regions is still a challenge. Besides, robust assessment can not be based on a single modelling study.
14-402 14 17 7 17 7 Please incert the following scentence at end of the paragraph. "Endo et al. (2012) point outs large uncertainty in future change of ISM precipitation arising from choice of cumulus convection scheme, based on multi-physics and multi-SST ensemble projections with MRI/JMA 60-km mesh AGCM." Reference: Endo, H., A. Kitoh, T. Ose, R. Mizuta, and S. Kusunoki, 2012: Future changes and uncertainties in Asian precipitation simulated by multiphysics and multi-sea surface temperature ensemble experiments with high-resolution Meteorological Research Institute atmospheric general circulation models (MRI-AGCMs). J. Geophys. Res., doi:10.1029/2012JD017874. http://www.mri-jma.go.jp/Dep/cl/endo/paper/paper_12.pdf [Shoji Kusunoki, Japan]
The text has undergone major revision
Expert and Government Review Comments on the IPCC WGI AR5 Second Order Draft – Chapter 14
Do not Cite, Quote or Distribute Page 30 of 118
Comment No
Chapter
FromPage
FromLine
To Page
To Line Comment Response
14-403 14 17 9 14 9 "Despite current uncertainty ..." Which uncertainty? Both Gershunov (2009) and Meehl et al have shown that the observed fluctuations are within the range expected from stochastic nise in a fairly weak teleconnection. Or has it been shown that ghe observed variability is outisde this range? [Geert Jan van Oldenborgh, Netherlands]
Uncertainty in terms of spread in the model simulations. The text has been edited.
14-404 14 17 9 17 11 I accept the arguments here that the teleconnection remains intact in a warmer world. How then do the earlier statements (see other comments) that the Indian monsoon-ENSO teleconnection has weakened fit in with this? [Andrew Turner, United Kingdom of Great Britain & Northern Ireland]
as stated earlier, the monsoon-ENSO relation is assessed based on the literature and the level of confidence in the future projections in the revised text
14-405 14 17 13 17 14 "enhanced evaporation variability resulting from the warmer mean state could enhance monsoon interannual variability. " I do not understand this sentence. [Geert Jan van Oldenborgh, Netherlands]
The text has been edited
14-406 14 17 13 Type error - remove ";" after Collins et al [H Annamalai, United States of America] The text has been edited
14-407 14 17 14 17 17 "reasonable ENSO-monsoon relationships" -- please clarify what "reasonable" is referring to; suggest to refer to the relevant Sections in Ch9 that can help support this statement. [Thomas Stocker/ WGI TSU, Switzerland]
The text has been edited
14-408 14 17 18 45 Figures 14.7 and 14.8 should be interchanged to agree with the text. To have a smooth flow between the two figures, consider re-writing the sentences 27-32. For example, localized high rainfall events are not solely determined by orography, particularly along the monsoon trough. Apart from the orography, localized heavy rainfall events are associated with synoptic systems that models have difficulty in simulating, perhaps due to coarse-resolution and/or convective schemes. [H Annamalai, United States of America]
These two figures are not used in the revised version
14-409 14 17 19 17 34 note that Figures 14.7 and 14.8 (together with their captions) have been placed the wrong way round in the text. [Andrew Turner, United Kingdom of Great Britain & Northern Ireland]
These two figures are not used in the revised version
14-410 14 17 20 17 20 ERE is undefined, what does it mean? [Geert Jan van Oldenborgh, Netherlands] The text has been edited
14-411 14 17 20 17 25 Expand the acronym ERE. Further, the figure is not clear: what is it showing?How is it related with probability distribution of drought and flood years? [Annalisa Cherchi, Italy]
The text has been edited
14-412 14 17 20 17 25 Define ERE and WRE in the caption; overuse of acronyms in this chapter causes it to be difficult to read at times [Christopher Folland, United Kingdom of Great Britain & Northern Ireland]
The text has been edited
14-413 14 17 20 Define ERE and WRE. [Massimo Bollasina, Italy] The text has been edited
14-414 14 17 20 What is "ERE"? [Erik Kjellström, Sweden] The text has been edited
14-415 14 17 20 Figure 14.7: please clarify what "ERE" is referring to? [Thomas Stocker/ WGI TSU, Switzerland] This figure is not used in the revised version
14-416 14 17 21 17 21 "along the flanks of the monsoon trough is prominent" I am afraid I do not see a prominent pattern other than along the west coast. And the Himalaya (it is a pity that the time series oscures the region with highest seasonal precipitation totals). [Geert Jan van Oldenborgh, Netherlands]
Fig 14.7 is deleted in the final revised version
14-417 14 17 22 17 22 WRE is undefined and could not be found with Google. [Geert Jan van Oldenborgh, Netherlands] The text has been edited
14-418 14 17 24 17 24 "+0.042% yr–1" please quote an uncertainty range. [Geert Jan van Oldenborgh, Netherlands] The text has been edited
14-419 14 17 28 17 28 "quite likely due to the relatively low horizontal resolution" this seems to contradict the statement on p.13 l.7-8: "the models with finer resolution does not seem to produce trends that better match observed trends in tropical monsoon circulation" [Geert Jan van Oldenborgh, Netherlands]
The effect of resolution in producing extreme events is not necessarily the same as that on simulating monsoon circulation!
14-420 14 17 28 From where does "quite likely" come? Is it based on studies with models at different resolutions? Or, is it a mere speculation? [Erik Kjellström, Sweden]
The text has been edited
14-421 14 17 31 17 32 are there any particular locations dominating the statement that 35% of interannual variability of the Indian monsoon comes from heavy rainfall events? [Andrew Turner, United Kingdom of Great Britain & Northern Ireland]
No, the result is for all-India rainfall. However, the text has been now edited.
14-422 14 17 32 17 32 Is fig14.8 crucial for the section? It is quickly mentioned and not really explained. [Annalisa Cherchi, Italy] Fig 14.8 is not used in the final revision
Expert and Government Review Comments on the IPCC WGI AR5 Second Order Draft – Chapter 14
Do not Cite, Quote or Distribute Page 31 of 118
Comment No
Chapter
FromPage
FromLine
To Page
To Line Comment Response
14-423 14 17 34 Fig. 14.8 It would be much more useful to have CMIP5 results with aerosol effects included, as these probably influence the baseline period (see sections above). [Geert Jan van Oldenborgh, Netherlands]
Fig 14.8 is not used in the final revision
14-424 14 17 47 17 51 Not clear if this paragraph on aerosol effects is specific for the Indian monsoon or more general. If general, please move to the 'global overview' section. [Thomas Stocker/ WGI TSU, Switzerland]
It holds for Asian-Australian monsoon as a whole; moved to the introduction of AAM .
14-425 14 17 50 Add also the following citation after “model biases”: Bollasina, M., and Y. Ming, 2012: The general circulation model precipitation bias over the southwestern equatorial Indian Ocean and its implications for simulating the South Asian monsoon. Climate Dynamics, 10.1007/s00382-012-1347-7 [Massimo Bollasina, Italy]
Edited
14-426 14 17 53 20 9 14.2.2.2 East Asian Monsoon. Description particularly on prediction parts are confusing since the authors mixed up unreliable simulated results from CMIP-3 and those from CMIP-5. If we compare Fig. 14.11 with Fig. 14.3, for example, we cannot deduce any significant or meaningful conclusion particularly for EASM prediction. The authors should focus more on what are challenges in prediction of EASM, and their implication to the recent trends in the past several decades when the GHGs forcing and probably the aerosol forcings are very likely to be realized in this region (see Chap.10). my personal view is that the models which cannot well reproduce the Meiyu-Baiu front structure and its activiy, we should not discuss the EAMS variability in the models. [Tetsuzo Yasunari, Japan]
this section has been revised and some new figures are used
14-427 14 17 53 20 10 Summer monsoon is important for precipitation, but winter monsoon is still important for temperature (or warm & cold in winter). The strengthen winter monsoon may cause by the inactive solar activity, and the reduction of see ice in North Pole in summer half year. Another session is needed to discuss the East Asia winter monsoon. Wu B Y, Su J Z, Zhang R H. Effects of autumn-winter Arctic sea ice on winter Siberian High. Chinese Sci Bull, 2011, 56, doi: 10.1007/s11434-011-4696-4. LIN WANG, RONGHUI HUANG, LEI GU, Interdecadal Variations of the East Asian Winter Monsoon and Their Association with Quasi-Stationary Planetary Wave Activity. JOURNAL OF CLIMATE, 2009,22,DOI: 10.1175/2009JCLI2973.1. Wang H J, He S P. Weakening relationship between East Asian Winter Monsoon and ENSO after mid-1970s. Chin Sci Bull, 2012, 57, doi:10.1007/s11434-012-5285-x. [Yongguang WANG, China]
Accepted and changes in winter monsoon are included
14-428 14 17 53 26 42 All these sections on monsoons read like a text book. Why is all this background needed. Parts get very repetitive. This section and others review an awful lot of literature, much from before AR4. Is this all necessary? What is wanted is how the system is simulated and what happens in CMIP3 and CMIP5 archives. The English in many of the sections is not that good. This chapter reads as though it has been written by individuals and just been pieced together. [Phil Jones, United Kingdom of Great Britain & Northern Ireland]
The observation is well received. The text has been modified accordingly and the descriptive part is now moved to supplementary materials section.
14-429 14 17 55 19 51 The numerical results about the EASM change are mainly based on global model with relatively coarse resolution. The uncertainty related to the resolution should be discussed; high-resolution simulations may change the conclusion obtained from low-resolution simulations. [Government of United States of America]
Accepted and a statement on resolution is now added.
14-430 14 18 2 18 2 "mostly related to ENSO" According to Box 14.1, Fig.1 the correlations are very small, the correlation of local rainfall with ENSO indices is at most 0.3, explaining 10% of variance, which is less than the 50% required for "mostly". [Geert Jan van Oldenborgh, Netherlands]
the significant impatc of El Nino on EASM is only evident in El Nino-decaying summer. add one new citation from Wang B, Wu B et al.
14-431 14 18 3 18 19 Inconsistencies in this paragraph - is the EASM weakening. [European Union] Has been clarified in the revised text.
14-432 14 18 4 18 4 "the East Asian summer monsoon (EASM) has been weakening" could easily be interpreted to mean that precipitation in the whole monsoon area was decreasing. Please make into "EASM circulation index" or something that cannot be as easily misunderstood to be an index of the area-wide precipitation. [Geert Jan van Oldenborgh, Netherlands]
The revised text takes care of this concern
14-433 14 18 4 18 7 is the "weakening of the monsoon" referring to a reduction in seasonality of winds, strength in winds, changes in precip, changes in SLP, or combinations thereof? Please specify. [Thomas Stocker/ WGI TSU, Switzerland]
The suggestion has been taken care of in the revised text.
14-434 14 18 4 18 8 Since the East Asian summer monsoon (EASM) has been weakening for the past 60 years, what is the implication to that the EASM was subject to no substantial trends during the 20th Century. [Yueqing Li, China]
The revised text takes care of this concern
Expert and Government Review Comments on the IPCC WGI AR5 Second Order Draft – Chapter 14
Do not Cite, Quote or Distribute Page 32 of 118
Comment No
Chapter
FromPage
FromLine
To Page
To Line Comment Response
14-435 14 18 4 18 19 This paragraph needs cleanup and organization of thoughts. Each sentence appears disconnected from the previous sentences. There seems no clear train of thoughts, and it is not clear what these changes mean for the EASM. The sentence in lines 6-7 contradicts the first sentence. [Christian Reuten, Canada]
The section has been revised and such problems are addressed.
14-436 14 18 4 8 First it is stated that "(EASM) has been weakening" then that "the EASM was subject to no substantial trends". It appears to be refering to different time periods but it is not evident what is really meant here. [Erik Kjellström, Sweden]
The revised text in this section addressed these concerns
14-437 14 18 5 18 5 this "term" is called wetter south/drier north below and should be consistent [George Kiladis, United States of America]
accepted
14-438 14 18 7 18 8 It is written here that there have not been substantial trends. The rest of the paragraph would seem to suggest the contrary. [Markku Rummukainen, Sweden]
The revised text in this section addressed these concerns
14-439 14 18 8 18 8 trends in what direction (s)? [Christopher Folland, United Kingdom of Great Britain & Northern Ireland] The revised text in this section addressed these concerns
14-440 14 18 8 18 8 The word "no" here does not make sense. [Christopher Folland, United Kingdom of Great Britain & Northern Ireland]
revised
14-441 14 18 17 18 It is not evident from Figure 14.9 that there has been a recover since the early 1990s. [Erik Kjellström, Sweden]
The revised text in this section addressed these concerns
14-442 14 18 18 3 19 Inconsistencies in this paragraph - is the EASM weakening. [European Union] The revised text in this section addressed these concerns
14-443 14 18 21 18 27 Are panels c and d referenced anywhere in the text? What is the relevance of panel d? [Christian Reuten, Canada]
The figure has been omitted in the final version
14-444 14 18 24 18 25 The definition of the EASM index given here disagrees with the one on the LASG web site http://ljp.lasg.ac.cn/dct/page/65591 [Geert Jan van Oldenborgh, Netherlands]
There are more than 40 definitions of monsoon index. The one chosen here is explained.
14-445 14 18 29 18 42 This paragraph also needs some clarifications. The two figure cross references should be to Fig. 14.10, not 14.9. Furthermore, the spatial patterns are much more subtle than "wetter South-drier North". Finally, the second half of the paragraph is not convincing: why is the north drier if it is dominated by increased rainfall intensity and long-duration rainfall events? [Christian Reuten, Canada]
Is taken care of
14-446 14 18 29 30 Says Fig 14.9, should be 14.10 [Erik Kjellström, Sweden] Most of the figures have been reordered and figure numbers are taken care of in the final version
14-447 14 18 30 18 32 the text should refer to Figure 14.10, not 14.9. [Andrew Turner, United Kingdom of Great Britain & Northern Ireland]
corrected
14-448 14 18 31 18 32 Figure 14.10? [Markku Rummukainen, Sweden] corrected
14-449 14 18 39 18 42 This sentence does not make sense to me. If north China is becoming drier are longer duration overnight events more or less frequent than before? [George Kiladis, United States of America]
corrected
14-450 14 18 39 40 Here it is talked about "long duration (lasting longer than 12-hour)" and then "between midnight and morning". Events could not both last more than 12 hours and occur between midnight and morning. [Erik Kjellström, Sweden]
The revised text in this section addressed these concerns
14-451 14 18 44 18 44 "East Asia" needs to be defined, this general statement contradicts what is said below [George Kiladis, United States of America]
Suggestion is take care of
14-452 14 18 47 18 47 In contradiction to the preceding sentence, we now see that precipitation is trending upward in some places, needs to be reconciled [George Kiladis, United States of America]
Regional difference of rainfall changes are mentioned
14-453 14 18 49 18 49 Fujibe et al. (no capital letters) [Martin Stendel, Denmark] corrected
14-454 14 18 49 18 49 Lenderink et al (2011, doi:10.5194/hess-15-3033-2011) shows that hourly precipitation extremes in Hong reject. we do not do attribution here.
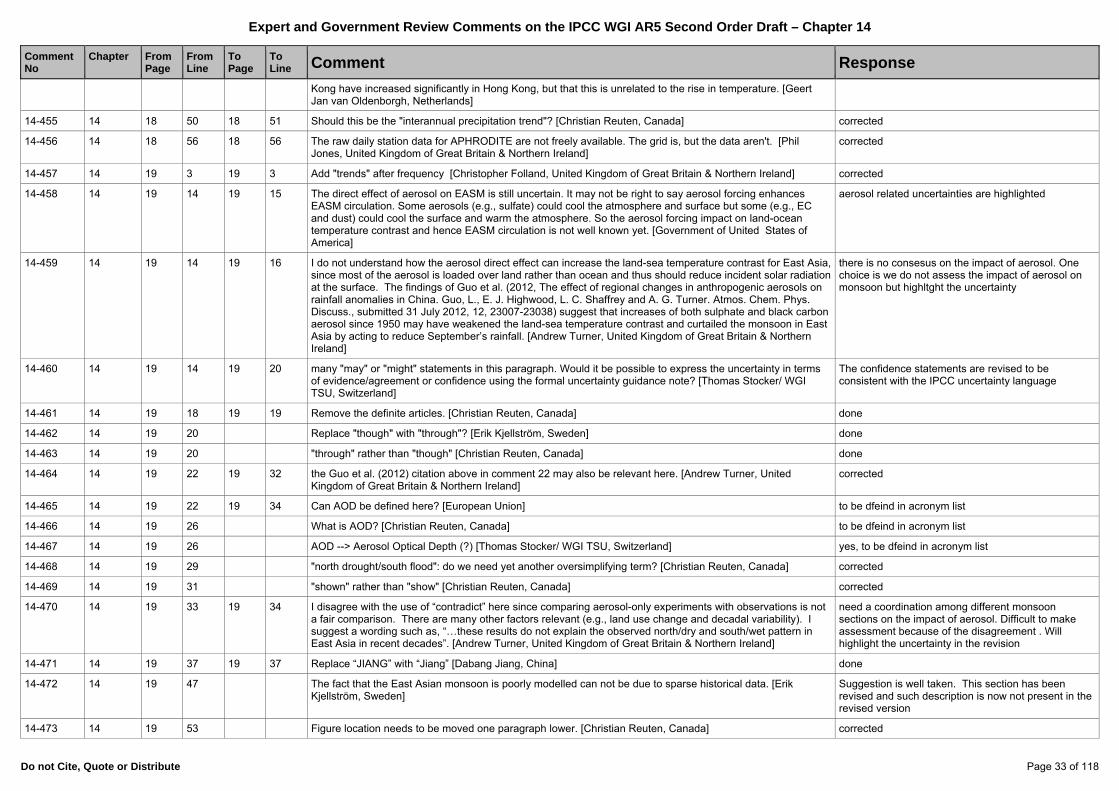
Expert and Government Review Comments on the IPCC WGI AR5 Second Order Draft – Chapter 14
Do not Cite, Quote or Distribute Page 33 of 118
Comment No
Chapter
FromPage
FromLine
To Page
To Line Comment Response
Kong have increased significantly in Hong Kong, but that this is unrelated to the rise in temperature. [Geert Jan van Oldenborgh, Netherlands]
14-455 14 18 50 18 51 Should this be the "interannual precipitation trend"? [Christian Reuten, Canada] corrected
14-456 14 18 56 18 56 The raw daily station data for APHRODITE are not freely available. The grid is, but the data aren't. [Phil Jones, United Kingdom of Great Britain & Northern Ireland]
corrected
14-457 14 19 3 19 3 Add "trends" after frequency [Christopher Folland, United Kingdom of Great Britain & Northern Ireland] corrected
14-458 14 19 14 19 15 The direct effect of aerosol on EASM is still uncertain. It may not be right to say aerosol forcing enhances EASM circulation. Some aerosols (e.g., sulfate) could cool the atmosphere and surface but some (e.g., EC and dust) could cool the surface and warm the atmosphere. So the aerosol forcing impact on land-ocean temperature contrast and hence EASM circulation is not well known yet. [Government of United States of America]
aerosol related uncertainties are highlighted
14-459 14 19 14 19 16 I do not understand how the aerosol direct effect can increase the land-sea temperature contrast for East Asia, since most of the aerosol is loaded over land rather than ocean and thus should reduce incident solar radiation at the surface. The findings of Guo et al. (2012, The effect of regional changes in anthropogenic aerosols on rainfall anomalies in China. Guo, L., E. J. Highwood, L. C. Shaffrey and A. G. Turner. Atmos. Chem. Phys. Discuss., submitted 31 July 2012, 12, 23007-23038) suggest that increases of both sulphate and black carbon aerosol since 1950 may have weakened the land-sea temperature contrast and curtailed the monsoon in East Asia by acting to reduce September’s rainfall. [Andrew Turner, United Kingdom of Great Britain & Northern Ireland]
there is no consesus on the impact of aerosol. One choice is we do not assess the impact of aerosol on monsoon but highltght the uncertainty
14-460 14 19 14 19 20 many "may" or "might" statements in this paragraph. Would it be possible to express the uncertainty in terms of evidence/agreement or confidence using the formal uncertainty guidance note? [Thomas Stocker/ WGI TSU, Switzerland]
The confidence statements are revised to be consistent with the IPCC uncertainty language
14-461 14 19 18 19 19 Remove the definite articles. [Christian Reuten, Canada] done
14-462 14 19 20 Replace "though" with "through"? [Erik Kjellström, Sweden] done
14-463 14 19 20 "through" rather than "though" [Christian Reuten, Canada] done
14-464 14 19 22 19 32 the Guo et al. (2012) citation above in comment 22 may also be relevant here. [Andrew Turner, United Kingdom of Great Britain & Northern Ireland]
corrected
14-465 14 19 22 19 34 Can AOD be defined here? [European Union] to be dfeind in acronym list
14-466 14 19 26 What is AOD? [Christian Reuten, Canada] to be dfeind in acronym list
14-467 14 19 26 AOD --> Aerosol Optical Depth (?) [Thomas Stocker/ WGI TSU, Switzerland] yes, to be dfeind in acronym list
14-468 14 19 29 "north drought/south flood": do we need yet another oversimplifying term? [Christian Reuten, Canada] corrected
14-469 14 19 31 "shown" rather than "show" [Christian Reuten, Canada] corrected
14-470 14 19 33 19 34 I disagree with the use of “contradict” here since comparing aerosol-only experiments with observations is not a fair comparison. There are many other factors relevant (e.g., land use change and decadal variability). I suggest a wording such as, “…these results do not explain the observed north/dry and south/wet pattern in East Asia in recent decades”. [Andrew Turner, United Kingdom of Great Britain & Northern Ireland]
need a coordination among different monsoon sections on the impact of aerosol. Difficult to make assessment because of the disagreement . Will highlight the uncertainty in the revision
14-471 14 19 37 19 37 Replace “JIANG” with “Jiang” [Dabang Jiang, China] done
14-472 14 19 47 The fact that the East Asian monsoon is poorly modelled can not be due to sparse historical data. [Erik Kjellström, Sweden]
Suggestion is well taken. This section has been revised and such description is now not present in the revised version
14-473 14 19 53 Figure location needs to be moved one paragraph lower. [Christian Reuten, Canada] corrected
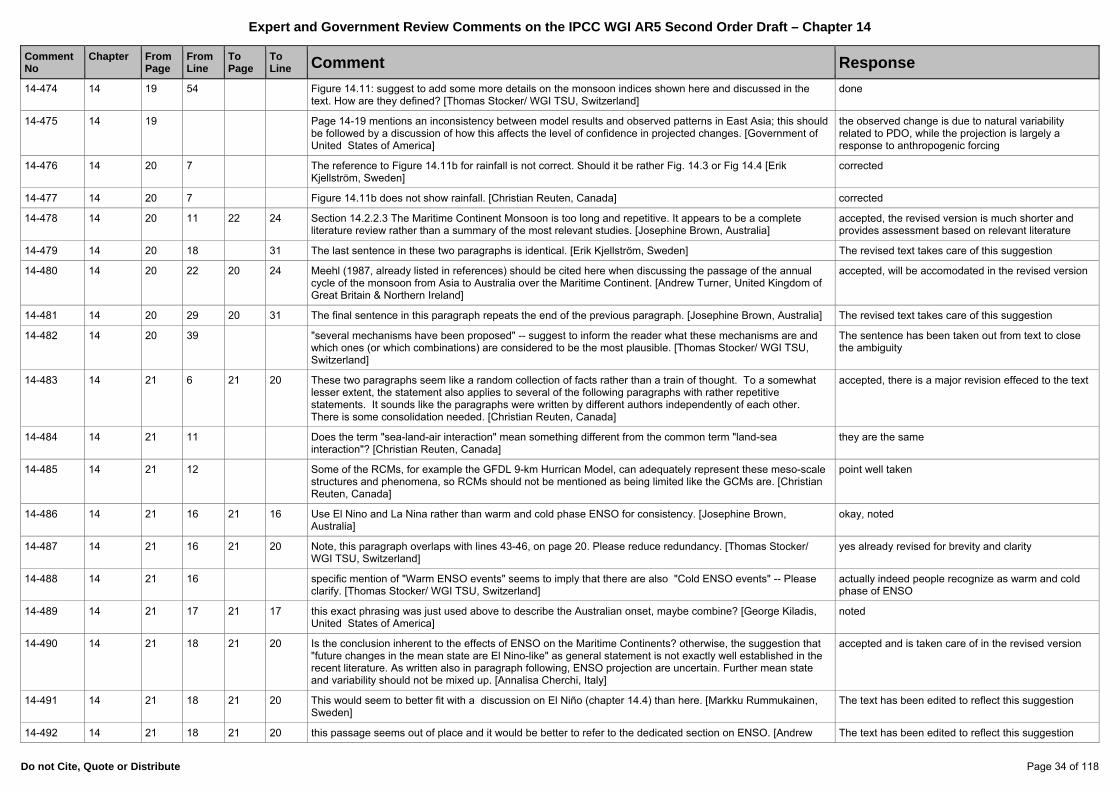
Expert and Government Review Comments on the IPCC WGI AR5 Second Order Draft – Chapter 14
Do not Cite, Quote or Distribute Page 34 of 118
Comment No
Chapter
FromPage
FromLine
To Page
To Line Comment Response
14-474 14 19 54 Figure 14.11: suggest to add some more details on the monsoon indices shown here and discussed in the text. How are they defined? [Thomas Stocker/ WGI TSU, Switzerland]
done
14-475 14 19 Page 14-19 mentions an inconsistency between model results and observed patterns in East Asia; this should be followed by a discussion of how this affects the level of confidence in projected changes. [Government of United States of America]
the observed change is due to natural variability related to PDO, while the projection is largely a response to anthropogenic forcing
14-476 14 20 7 The reference to Figure 14.11b for rainfall is not correct. Should it be rather Fig. 14.3 or Fig 14.4 [Erik Kjellström, Sweden]
corrected
14-477 14 20 7 Figure 14.11b does not show rainfall. [Christian Reuten, Canada] corrected
14-478 14 20 11 22 24 Section 14.2.2.3 The Maritime Continent Monsoon is too long and repetitive. It appears to be a complete literature review rather than a summary of the most relevant studies. [Josephine Brown, Australia]
accepted, the revised version is much shorter and provides assessment based on relevant literature
14-479 14 20 18 31 The last sentence in these two paragraphs is identical. [Erik Kjellström, Sweden] The revised text takes care of this suggestion
14-480 14 20 22 20 24 Meehl (1987, already listed in references) should be cited here when discussing the passage of the annual cycle of the monsoon from Asia to Australia over the Maritime Continent. [Andrew Turner, United Kingdom of Great Britain & Northern Ireland]
accepted, will be accomodated in the revised version
14-481 14 20 29 20 31 The final sentence in this paragraph repeats the end of the previous paragraph. [Josephine Brown, Australia] The revised text takes care of this suggestion
14-482 14 20 39 "several mechanisms have been proposed" -- suggest to inform the reader what these mechanisms are and which ones (or which combinations) are considered to be the most plausible. [Thomas Stocker/ WGI TSU, Switzerland]
The sentence has been taken out from text to close the ambiguity
14-483 14 21 6 21 20 These two paragraphs seem like a random collection of facts rather than a train of thought. To a somewhat lesser extent, the statement also applies to several of the following paragraphs with rather repetitive statements. It sounds like the paragraphs were written by different authors independently of each other. There is some consolidation needed. [Christian Reuten, Canada]
accepted, there is a major revision effeced to the text
14-484 14 21 11 Does the term "sea-land-air interaction" mean something different from the common term "land-sea interaction"? [Christian Reuten, Canada]
they are the same
14-485 14 21 12 Some of the RCMs, for example the GFDL 9-km Hurrican Model, can adequately represent these meso-scale structures and phenomena, so RCMs should not be mentioned as being limited like the GCMs are. [Christian Reuten, Canada]
point well taken
14-486 14 21 16 21 16 Use El Nino and La Nina rather than warm and cold phase ENSO for consistency. [Josephine Brown, Australia]
okay, noted
14-487 14 21 16 21 20 Note, this paragraph overlaps with lines 43-46, on page 20. Please reduce redundancy. [Thomas Stocker/ WGI TSU, Switzerland]
yes already revised for brevity and clarity
14-488 14 21 16 specific mention of "Warm ENSO events" seems to imply that there are also "Cold ENSO events" -- Please clarify. [Thomas Stocker/ WGI TSU, Switzerland]
actually indeed people recognize as warm and cold phase of ENSO
14-489 14 21 17 21 17 this exact phrasing was just used above to describe the Australian onset, maybe combine? [George Kiladis, United States of America]
noted
14-490 14 21 18 21 20 Is the conclusion inherent to the effects of ENSO on the Maritime Continents? otherwise, the suggestion that "future changes in the mean state are El Nino-like" as general statement is not exactly well established in the recent literature. As written also in paragraph following, ENSO projection are uncertain. Further mean state and variability should not be mixed up. [Annalisa Cherchi, Italy]
accepted and is taken care of in the revised version
14-491 14 21 18 21 20 This would seem to better fit with a discussion on El Niño (chapter 14.4) than here. [Markku Rummukainen, Sweden]
The text has been edited to reflect this suggestion
14-492 14 21 18 21 20 this passage seems out of place and it would be better to refer to the dedicated section on ENSO. [Andrew The text has been edited to reflect this suggestion
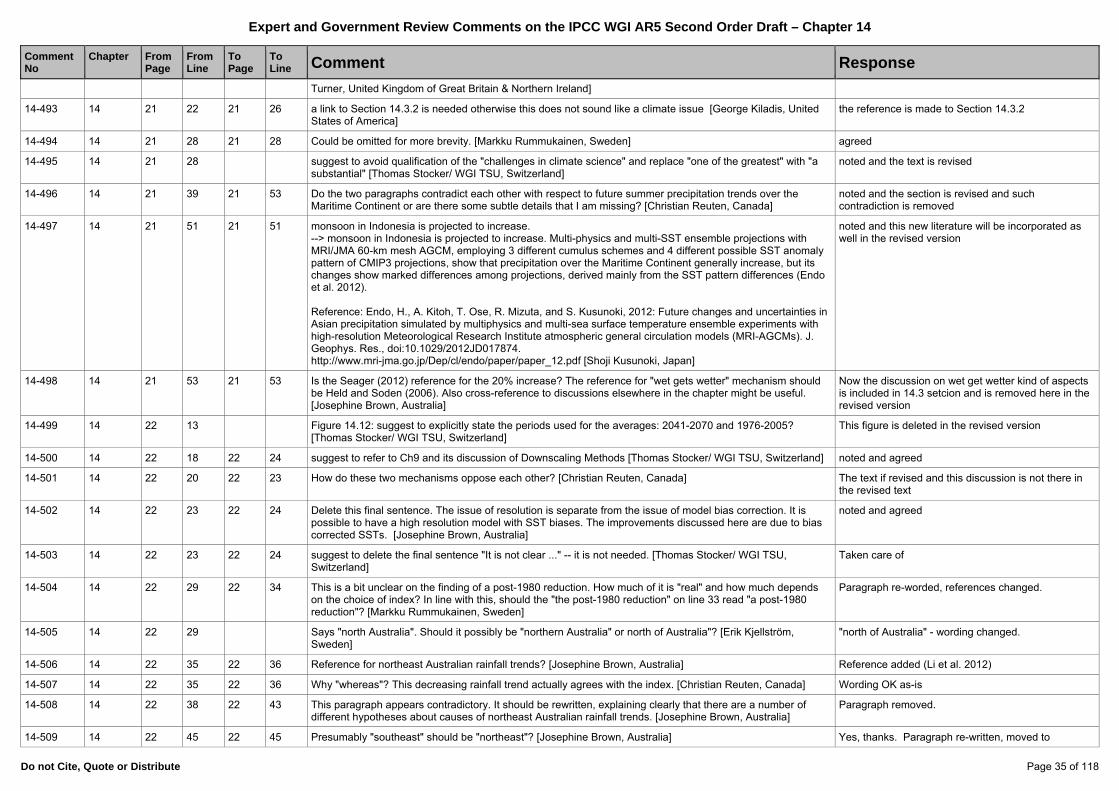
Expert and Government Review Comments on the IPCC WGI AR5 Second Order Draft – Chapter 14
Do not Cite, Quote or Distribute Page 35 of 118
Comment No
Chapter
FromPage
FromLine
To Page
To Line Comment Response
Turner, United Kingdom of Great Britain & Northern Ireland]
14-493 14 21 22 21 26 a link to Section 14.3.2 is needed otherwise this does not sound like a climate issue [George Kiladis, United States of America]
the reference is made to Section 14.3.2
14-494 14 21 28 21 28 Could be omitted for more brevity. [Markku Rummukainen, Sweden] agreed
14-495 14 21 28 suggest to avoid qualification of the "challenges in climate science" and replace "one of the greatest" with "a substantial" [Thomas Stocker/ WGI TSU, Switzerland]
noted and the text is revised
14-496 14 21 39 21 53 Do the two paragraphs contradict each other with respect to future summer precipitation trends over the Maritime Continent or are there some subtle details that I am missing? [Christian Reuten, Canada]
noted and the section is revised and such contradiction is removed
14-497 14 21 51 21 51 monsoon in Indonesia is projected to increase. --> monsoon in Indonesia is projected to increase. Multi-physics and multi-SST ensemble projections with MRI/JMA 60-km mesh AGCM, employing 3 different cumulus schemes and 4 different possible SST anomaly pattern of CMIP3 projections, show that precipitation over the Maritime Continent generally increase, but its changes show marked differences among projections, derived mainly from the SST pattern differences (Endo et al. 2012). Reference: Endo, H., A. Kitoh, T. Ose, R. Mizuta, and S. Kusunoki, 2012: Future changes and uncertainties in Asian precipitation simulated by multiphysics and multi-sea surface temperature ensemble experiments with high-resolution Meteorological Research Institute atmospheric general circulation models (MRI-AGCMs). J. Geophys. Res., doi:10.1029/2012JD017874. http://www.mri-jma.go.jp/Dep/cl/endo/paper/paper_12.pdf [Shoji Kusunoki, Japan]
noted and this new literature will be incorporated as well in the revised version
14-498 14 21 53 21 53 Is the Seager (2012) reference for the 20% increase? The reference for "wet gets wetter" mechanism should be Held and Soden (2006). Also cross-reference to discussions elsewhere in the chapter might be useful. [Josephine Brown, Australia]
Now the discussion on wet get wetter kind of aspects is included in 14.3 setcion and is removed here in the revised version
14-499 14 22 13 Figure 14.12: suggest to explicitly state the periods used for the averages: 2041-2070 and 1976-2005? [Thomas Stocker/ WGI TSU, Switzerland]
This figure is deleted in the revised version
14-500 14 22 18 22 24 suggest to refer to Ch9 and its discussion of Downscaling Methods [Thomas Stocker/ WGI TSU, Switzerland] noted and agreed
14-501 14 22 20 22 23 How do these two mechanisms oppose each other? [Christian Reuten, Canada] The text if revised and this discussion is not there in the revised text
14-502 14 22 23 22 24 Delete this final sentence. The issue of resolution is separate from the issue of model bias correction. It is possible to have a high resolution model with SST biases. The improvements discussed here are due to bias corrected SSTs. [Josephine Brown, Australia]
noted and agreed
14-503 14 22 23 22 24 suggest to delete the final sentence "It is not clear ..." -- it is not needed. [Thomas Stocker/ WGI TSU, Switzerland]
Taken care of
14-504 14 22 29 22 34 This is a bit unclear on the finding of a post-1980 reduction. How much of it is "real" and how much depends on the choice of index? In line with this, should the "the post-1980 reduction" on line 33 read "a post-1980 reduction"? [Markku Rummukainen, Sweden]
Paragraph re-worded, references changed.
14-505 14 22 29 Says "north Australia". Should it possibly be "northern Australia" or north of Australia"? [Erik Kjellström, Sweden]
"north of Australia" - wording changed.
14-506 14 22 35 22 36 Reference for northeast Australian rainfall trends? [Josephine Brown, Australia] Reference added (Li et al. 2012)
14-507 14 22 35 22 36 Why "whereas"? This decreasing rainfall trend actually agrees with the index. [Christian Reuten, Canada] Wording OK as-is
14-508 14 22 38 22 43 This paragraph appears contradictory. It should be rewritten, explaining clearly that there are a number of different hypotheses about causes of northeast Australian rainfall trends. [Josephine Brown, Australia]
Paragraph removed.
14-509 14 22 45 22 45 Presumably "southeast" should be "northeast"? [Josephine Brown, Australia] Yes, thanks. Paragraph re-written, moved to
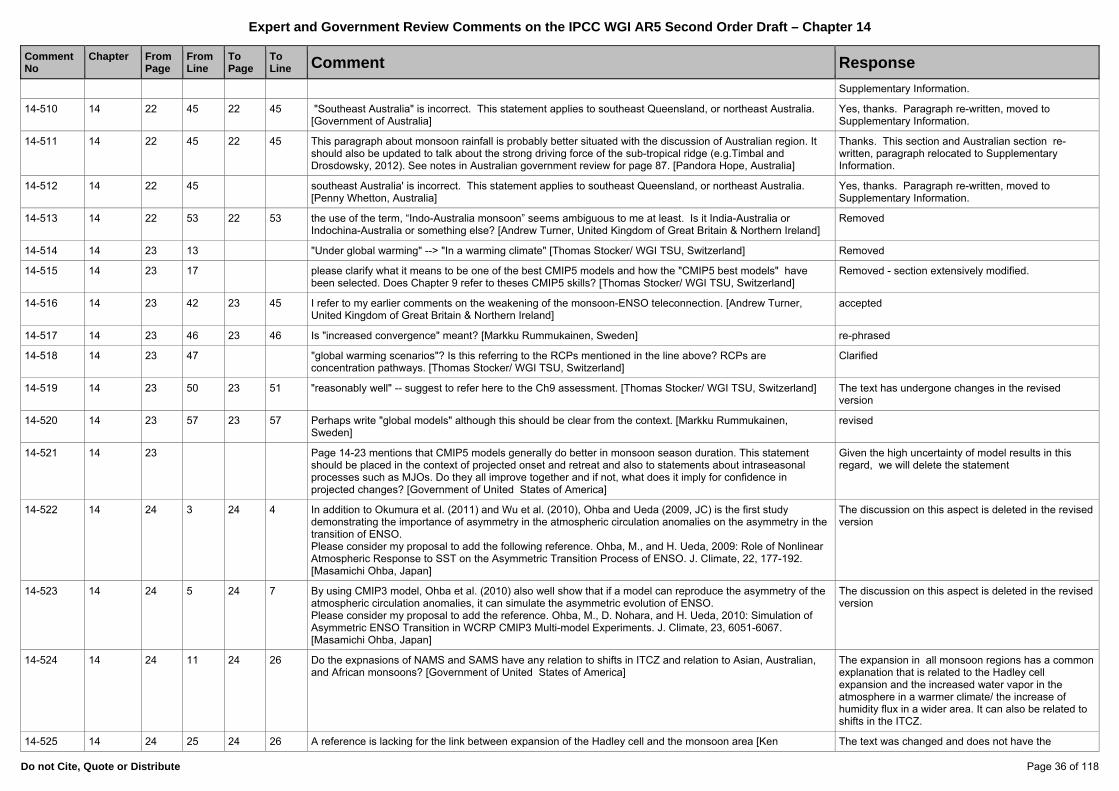
Expert and Government Review Comments on the IPCC WGI AR5 Second Order Draft – Chapter 14
Do not Cite, Quote or Distribute Page 36 of 118
Comment No
Chapter
FromPage
FromLine
To Page
To Line Comment Response
Supplementary Information.
14-510 14 22 45 22 45 "Southeast Australia" is incorrect. This statement applies to southeast Queensland, or northeast Australia. [Government of Australia]
Yes, thanks. Paragraph re-written, moved to Supplementary Information.
14-511 14 22 45 22 45 This paragraph about monsoon rainfall is probably better situated with the discussion of Australian region. It should also be updated to talk about the strong driving force of the sub-tropical ridge (e.g.Timbal and Drosdowsky, 2012). See notes in Australian government review for page 87. [Pandora Hope, Australia]
Thanks. This section and Australian section re-written, paragraph relocated to Supplementary Information.
14-512 14 22 45 southeast Australia' is incorrect. This statement applies to southeast Queensland, or northeast Australia. [Penny Whetton, Australia]
Yes, thanks. Paragraph re-written, moved to Supplementary Information.
14-513 14 22 53 22 53 the use of the term, “Indo-Australia monsoon” seems ambiguous to me at least. Is it India-Australia or Indochina-Australia or something else? [Andrew Turner, United Kingdom of Great Britain & Northern Ireland]
Removed
14-514 14 23 13 "Under global warming" --> "In a warming climate" [Thomas Stocker/ WGI TSU, Switzerland] Removed
14-515 14 23 17 please clarify what it means to be one of the best CMIP5 models and how the "CMIP5 best models" have been selected. Does Chapter 9 refer to theses CMIP5 skills? [Thomas Stocker/ WGI TSU, Switzerland]
Removed - section extensively modified.
14-516 14 23 42 23 45 I refer to my earlier comments on the weakening of the monsoon-ENSO teleconnection. [Andrew Turner, United Kingdom of Great Britain & Northern Ireland]
accepted
14-517 14 23 46 23 46 Is "increased convergence" meant? [Markku Rummukainen, Sweden] re-phrased
14-518 14 23 47 "global warming scenarios"? Is this referring to the RCPs mentioned in the line above? RCPs are concentration pathways. [Thomas Stocker/ WGI TSU, Switzerland]
Clarified
14-519 14 23 50 23 51 "reasonably well" -- suggest to refer here to the Ch9 assessment. [Thomas Stocker/ WGI TSU, Switzerland] The text has undergone changes in the revised version
14-520 14 23 57 23 57 Perhaps write "global models" although this should be clear from the context. [Markku Rummukainen, Sweden]
revised
14-521 14 23 Page 14-23 mentions that CMIP5 models generally do better in monsoon season duration. This statement should be placed in the context of projected onset and retreat and also to statements about intraseasonal processes such as MJOs. Do they all improve together and if not, what does it imply for confidence in projected changes? [Government of United States of America]
Given the high uncertainty of model results in this regard, we will delete the statement
14-522 14 24 3 24 4 In addition to Okumura et al. (2011) and Wu et al. (2010), Ohba and Ueda (2009, JC) is the first study demonstrating the importance of asymmetry in the atmospheric circulation anomalies on the asymmetry in the transition of ENSO. Please consider my proposal to add the following reference. Ohba, M., and H. Ueda, 2009: Role of Nonlinear Atmospheric Response to SST on the Asymmetric Transition Process of ENSO. J. Climate, 22, 177-192. [Masamichi Ohba, Japan]
The discussion on this aspect is deleted in the revised version
14-523 14 24 5 24 7 By using CMIP3 model, Ohba et al. (2010) also well show that if a model can reproduce the asymmetry of the atmospheric circulation anomalies, it can simulate the asymmetric evolution of ENSO. Please consider my proposal to add the reference. Ohba, M., D. Nohara, and H. Ueda, 2010: Simulation of Asymmetric ENSO Transition in WCRP CMIP3 Multi-model Experiments. J. Climate, 23, 6051-6067. [Masamichi Ohba, Japan]
The discussion on this aspect is deleted in the revised version
14-524 14 24 11 24 26 Do the expnasions of NAMS and SAMS have any relation to shifts in ITCZ and relation to Asian, Australian, and African monsoons? [Government of United States of America]
The expansion in all monsoon regions has a common explanation that is related to the Hadley cell expansion and the increased water vapor in the atmosphere in a warmer climate/ the increase of humidity flux in a wider area. It can also be related to shifts in the ITCZ.
14-525 14 24 25 24 26 A reference is lacking for the link between expansion of the Hadley cell and the monsoon area [Ken The text was changed and does not have the
Expert and Government Review Comments on the IPCC WGI AR5 Second Order Draft – Chapter 14
Do not Cite, Quote or Distribute Page 37 of 118
Comment No
Chapter
FromPage
FromLine
To Page
To Line Comment Response
Takahashi, Perú] sentence.
14-526 14 24 28 25 15 The potential impact of dust aerosol on North American summer monsoon is recently highlighted by Zhao et al. [2012] and should be mentioned in this secion. Zhao et al. [2012] highlights the interaction between dust and the NAM system and motivates further investigation of possible dust feedback on monsoon precipitation under climate change and the megadrought conditions projected for the future [Seager et al., 2007]. Reference: C. Zhao, X. Liu, and L. R. Leung:Impact of the Desert dust on the summer monsoon system over Southwestern North America,Atmos. Chem. Phys., 12, 3717–3731, 2012. Seager, R., Ting, M., Held, I., Kushnir, Y., Lu, J., Vecchi, G., Huang, H., Harnik, N., Leetmaa, A., Lau, N., Li, C., Velez, J., and Naik, N.: Model Projections of an Imminent Transition to a More Arid Climate in Southwestern North America, Science, 316, 1181–1184, doi:10.1126/science.1139601, 2007. [Government of United States of America]
All of the material related to NAMS dynamics will either moved to the supplemental material or deleted altogether. If there is information on the NAMS presented in the supplemental material, these references on the dust interaction with the monsoon will be incorporated.
14-527 14 24 40 24 42 "...in which these phenomena develop are modified by slowly evolving coupled climate features associated with the PDO, the AMO, and solar activity (Arias et al., 2012; Feng and Hu, 2008; Metcalfe et al., 2010; Seager et al., 2009; van Loon et al., 2004)." One recent study found that the AAO has also impact on NAMS circulation and precipitation, which should included here. Thus above sentence is changed to "...in which these phenomena develop are modified by slowly evolving coupled climate features associated with the PDO, the AMO, the AAO, and solar activity (Arias et al., 2012; Feng and Hu, 2008; Metcalfe et al., 2010; Seager et al., 2009; van Loon et al., 2004; Sun, 2010)." Reference: Sun, J. Q., 2010:, Possible impact of the boreal spring Antarctic Oscillation on the North American summer monsoon, Atmos. Oceanic Sci. Lett., 3, 232–236. [Jianqi Sun, China]
This material has been deleted from the chapter main text.
14-528 14 24 50 closing and opening paragraph symbols not needed before and after the semi-colon. [Government of United States of America]
This has been fixed.
14-529 14 24 The mention of WNP and its impact on ENSO and model performance of WNP and ENSO leaves much unsaid about models' performance of other monsoons and their impact on ENSO. Is his because of lack of literature, or lack of authors to cite relevant works? Cross check with Chapter 9. [Government of United States of America]
This comment pertains to section 14.2.2.5 and so is misplaced in the spreadsheet
14-530 14 25 7 is "reproducible" the right word here? Would "robust" be better? [Thomas Stocker/ WGI TSU, Switzerland] The phrasing was changed to "consistent across models"
14-531 14 25 9 25 11 what are the reasons and mechanisms for the later arrival and persistence of the NAMS? [Andrew Turner, United Kingdom of Great Britain & Northern Ireland]
This section has undergone major revisions in the latest version and this is taken care of
14-532 14 25 12 is "reproducible" the right word here? Would "robust" be better? [Thomas Stocker/ WGI TSU, Switzerland] The phrasing was changed to "consistent across models"
14-533 14 25 28 "reasonably well" -- suggest to refer here to the Ch9 assessment. [Thomas Stocker/ WGI TSU, Switzerland] the text was chenged based on bew results of CMIP5.
14-534 14 25 42 25 42 out of how many total models, otherwise this number is meaningless [George Kiladis, United States of America]
The text was changed
14-535 14 25 50 25 51 Double right are found in these lines. On L.45, as well. [Tosiyuki Nakaegawa, Japan] OK. It was corrected.
14-536 14 26 7 26 9 Please cite references to support this attribution statement [Thomas Stocker/ WGI TSU, Switzerland] The text was changed and the sentence removed.
14-537 14 26 12 26 12 Mixed evidence' is not a term coming from the IPCC uncertainty guidance note. Please revise accordingly. [Thomas Stocker/ WGI TSU, Switzerland]
OK. It is changed
14-538 14 26 19 26 42 The role of aerosols in the African monsoons is not discussed. Recent studies point towards a strong role for A short discussion of this is added in the monsoon
Expert and Government Review Comments on the IPCC WGI AR5 Second Order Draft – Chapter 14
Do not Cite, Quote or Distribute Page 38 of 118
Comment No
Chapter
FromPage
FromLine
To Page
To Line Comment Response
them. Since the role of aerosols is discussed for Asian mosoons, their role should also be discussed for the African monsoons. Some examples of these studies are Huang et al. (2009), Yoshiaka et al. (2010) and Mahajan et al. (2012). Huang, J., A. Adams, C. Wang, and C. Zhang, 2009a: Black carbon and West African monsoon precipitation: Observations and simulations. Ann. Geophys., 27, 4171–4181, doi:10.5194/angeo-27- 4171-2009. Yoshioka, M., N. M. Mahowald, A. J. Conley, W. D. Collins, D. W. Fillmore, C. S. Zender, and D. B. Coleman, 2007: Impact of desert dust radiative forcing on Sahel precipitation: Relative importance of dust compared to sea surface temperature variations, vegetation changes, and greenhouse gas warming. J. Climate, 20, 1445–1467. Mahajan S., K. J. Evans, J. J. Hack, J. E. Truesdale and J-F. Lamarque (2012): Inter-annual Global Tropospheric Aerosol Variability and its Impacts on Atlantic and African Climate by Direct and Semi-direct Effects, Journal of Climate (in press, available online), doi: 10.1175/JCLI-D- 12-00029.1 [Government of United States of America]
sections
14-539 14 26 24 26 25 this is not a complete sentence [George Kiladis, United States of America] Acknowledged and corrected
14-540 14 26 24 26 25 This sentence is incomplete. [Christian Reuten, Canada] Acknowledged and corrected
14-541 14 26 24 26 27 Check/correct the sentence "Anomalies in the tropical Atlantic (ref) and Mediterranean ref)." that is not a sentence. [BERNARD BOURLES, France]
Acknowledged and corrected
14-542 14 26 25 26 25 Delete the full stop to make sense of this. [Dave Rowell, United Kingdom of Great Britain & Northern Ireland] Acknowledged and corrected
14-543 14 26 25 Delete full stop that occurs before "SST influence". [Adrian Simmons, United Kingdom] Acknowledged and corrected
14-544 14 26 26 32 34 There is a considerable literature on the impact of the land surface on the west African Monsoon - see e.g. Zhao C, et al. 2011, Steiner et al 2009, Janicot et al 2011. In fact this section is remarkably brief given the very large decadal changes in the WAM and the work that has gone on. [European Union]
The issue will be briefly introduced
14-545 14 26 27 26 30 "... Warm anomalies in the Indian Ocean or in the Pacific during the growth phase of ENSO tend to increase vertical stability elsewhere and induce subsidence and dry near-surface flow over North Africa (Bader and Latif, 2003; Hagos and Cook, 2008; Janicot et al., 1996; Lu, 2009; Rowell, 2001). " In this part, the SST influence on the monsoon is reviewed. While some recent study also shows that some other large-scale pattern over middle and high latitude has also significant impact on West African summer monsoon, which should be included here. Thus above sentence is changed to "... Warm anomalies in the Indian Ocean or in the Pacific during the growth phase of ENSO tend to increase vertical stability elsewhere and induce subsidence and dry near-surface flow over North Africa (Bader and Latif, 2003; Hagos and Cook, 2008; Janicot et al., 1996; Lu, 2009; Rowell, 2001). Besides the tropical SST, some atmospheric pattern over the middle and high latitudes can also impact on the West African summer monsoon, resulting in anomalous precipitation over West Africa (Sun et al., 2010)". Reference: Sun, J. Q., H. J. Wang, W. Yuan, 2010: Linkage of the Boreal Spring Antarctic Oscillation to the West African Summer Monsoon, Journal of the Meteorological Society of Japan, 88(1), 15-28. [Jianqi Sun, China]
The monsoon sections have all been down sized leaving little roon for this
14-546 14 26 27 26 31 I think that it would be relevant to be more precise there, by refering to recent progresses done thanks to the AMMA program. Presently, it has been clearly shown that the SST variations in the Gulf of Guinea play an important role in the WAM onset and intensity. Maybe the following sentence could be added before the line 32: "It has been shown that SST cooling observed in boreal summer in the Gulf of Guinea -equatorial upwelling and cold tongue- plays a key role in the WAM onset and intensity (eg Caniaux et al., 2011). Processes responsible for the SST cooling and its seasonnal to interannual variability in the eastern tropical Atlantic involve both basin scale and regional forcings (eg Marin et al., 2009; Brandt et al., 2010 ), that numerical models fail to reproduce (eg Richter et al., 2008). [BERNARD BOURLES, France]
The monsoon sections have all been down sized leaving little roon for this
14-547 14 26 27 26 31 References: [BERNARD BOURLES, France] The monsoon sections have all been down sized
Expert and Government Review Comments on the IPCC WGI AR5 Second Order Draft – Chapter 14
Do not Cite, Quote or Distribute Page 39 of 118
Comment No
Chapter
FromPage
FromLine
To Page
To Line Comment Response
leaving little roon for this
14-548 14 26 27 26 31 Caniaux, G., H. Giordani, J.L. Redelsperger, F. Guichard, E. Key, and M. Wade: Coupling between the Atlantic Cold Tongue and the African Monsoon in boreal Spring and Summer, J. Geophys. Res, 116, C04003, doi:10.1029/2010JC006570, 2011 [BERNARD BOURLES, France]
The monsoon sections have all been down sized leaving little roon for this
14-549 14 26 27 26 31 Marin, F., G.Caniaux, B.Bourlès, H.Giordani, Y.Gouriou and E. Key: why were sea surface temperatures so different in the eastern equatorial Atlantic in June 2005 and 2006, J.Phys. Ocean., 39, 1416-1431, doi: 10.1175/2008JPO4030.1, 2009 [BERNARD BOURLES, France]
The monsoon sections have all been down sized leaving little roon for this
14-550 14 26 27 26 31 Brandt, P., G. Caniaux, B.Bourlès, A.Lazar, M.Dengler, A.Funk, V.Hormann, H.Giordani and F.Marin, Equatorial upper-ocean dynamics and their interaction with the West African monsoon, Atmospheric Science Letters, doi: 10.1002/asl.287, 2010 [BERNARD BOURLES, France]
The monsoon sections have all been down sized leaving little roon for this
14-551 14 26 27 26 31 Richter, I., and S. P. Xie, On the origin of equatorial Atlantic biases in coupled general circulation models, Clim. Dyn., 31, 587–598, doi:10.1007/s00382-008-0364z, 2008 [BERNARD BOURLES, France]
The monsoon sections have all been down sized leaving little roon for this
14-552 14 26 32 26 34 There is a considerable literature on the impact of the land surface on the west African Monsoon - see e.g. Zhao C, et al. 2011, Steiner et al 2009, Janicot et al 2011. In fact this section is remarkably brief given the very large decadal changes in the WAM and the work that has gone on. [European Union]
The monsoon sections have all been down sized leaving little roon for this
14-553 14 26 36 26 36 Change "and others" to "et al". [Dave Rowell, United Kingdom of Great Britain & Northern Ireland] Done
14-554 14 26 37 "a more reproducible response" than what? [Christian Reuten, Canada] Sentence improved
14-555 14 26 37 "simulates a more reproducible response" -- suggest to change to "a more robust response" [Thomas Stocker/ WGI TSU, Switzerland]
Done
14-556 14 26 40 26 42 In the context of "The limitations of model simulations in the region", Rowell (2013) has also examined the ability of both CMIP3 and CMIP5 models to reproduce SST teleconnections to Africa, which - as noted at the start of this paragraph - will likely be a crucial component of projected future changes for this continent. Rowell, D.P., 2013: Simulating Large-Scale Teleconnections to Africa: What is the State of the Art? J. Climate, submitted [Dave Rowell, United Kingdom of Great Britain & Northern Ireland]
Acknowledged and entering assessment. However this is about observations and therefore lees relevant to this section
14-557 14 26 44 27 20 One could consider integrating the summary statements in each 14.2.X, which could make the consideration of the findings easier (this is implemented in the regional sections of 14.7.x). [Markku Rummukainen, Sweden]
Suggestion is well received. But for want of space they are summarized only at the end of 14.2 under 14.2.5
14-558 14 26 44 27 20 This summary section is an example of where the uncertainty language needs to be looked at very carefully. If possible, please avoid 'medium to high confidence' type statements, and rather settle on a definitive confidence level. There are several instances where you indicate only medium or even low confidence in projections (e.g., line 15 page 27), yet still go on to provide a strong quantified likelihood statement. Please consider carefully in these instances whether or not your confidence in the projections is sufficient to be able to support such a quantified likelihood level. [Thomas Stocker/ WGI TSU, Switzerland]
Summary statements are revised to comply with the IPCC Uncertainty Language.
14-559 14 26 49 26 49 It would be clear to treat Dry days (DD) or consecutive dry days (CDD) in a separate sentence, given that this is an index related to drought, while the others listed in this statement relate to heavy precipitation. [Thomas Stocker/ WGI TSU, Switzerland]
this suggestion is taken care of
14-560 14 26 50 26 51 There seems to be a contradiction here that needs to be clarified. Above on lines 40 - 42, you state that limitations in model simulations in the African monsoon region suggest 'a cautious attitude to future projections'. Yet here, you now provide a very strong likelihood statement (very likely) that heavy precipitation will increase in the North and South African monsoon regions. [Thomas Stocker/ WGI TSU, Switzerland]
this suggestion is taken care of
14-561 14 26 51 26 53 given the “uncertainty” and “apparent weakening” of the (Indian) monsoon-ENSO teleconnection earlier in the Chapter, it seems this statement is unwarranted at least without further clarification of the regions involved. [Andrew Turner, United Kingdom of Great Britain & Northern Ireland]
This section is undergoing changes and this suggestion is taken in to consideration while revising the text
14-562 14 26 To restate the need for considering the linkages between different monsoons, can anything be said about the Confidence statements are now modified to reflect all
Expert and Government Review Comments on the IPCC WGI AR5 Second Order Draft – Chapter 14
Do not Cite, Quote or Distribute Page 40 of 118
Comment No
Chapter
FromPage
FromLine
To Page
To Line Comment Response
model biases in the tropical Atlantic and its relation and/or impact on model renditions of ENSO and Indian Ocean variability and other monsoon systems? How are the confidence levels assessed independently? [Government of United States of America]
these aspects to the extent feasible from the published literature and will reflect in the final draft
14-563 14 26 Increase in regional monsoons must be consistent with the role of the ocean warming that is mentioned by Annamalai et al. (2012) and the impact of model biases on representing the warming trends must be stated including inconsistencies if any in the ongoing trends vs projected trends. Do the trends switch sign in the models? If so, that should be mentioned. [Government of United States of America]
Regional monsoon sections have undergone substantial revisions and these issues are addressed
14-564 14 27 3 27 3 Add after 'small', the words 'with considerable uncertainty'. [Government of Australia] Uncertainty language in summary statements is being revised to comply with the IPCC definitions of uncertainty
14-565 14 27 3 "FOR the Indian summer monson…" [Christian Reuten, Canada] Will be taken care of
14-566 14 27 3 Add after 'small', the words 'with considerable uncertainty'. [Penny Whetton, Australia] See the response provided for 14-564
14-567 14 27 20 27 20 This is an odd phrase - suggest a cautious approach towards future projections. Whilst this may be honest, I'd suggest saying this differently. Useful to put some assessment into this. The confidence statements are not that informative. [Phil Jones, United Kingdom of Great Britain & Northern Ireland]
The uncertainty language in the summary statements is being revised to make them complaint with IPCC Uncertainty Language
14-568 14 27 23 36 43 As with the monsoon, this whole section on modes of variability and phenomenin is far too long. It seems as though you're trying to refer to everything that has been written. This is not what I thought an IPCC Assessment was meant to do. This reads like a scholarly review. Isn't there a review of each that you could refer to? There also seems to be a lot of overlap with Ch2 and possibly some other chapters. [Phil Jones, United Kingdom of Great Britain & Northern Ireland]
The revisions will reflect this valuable suggestion and the section is reduced in size and useful introductory material is now being moved to Supplementary Material
14-569 14 27 24 the section on Convergence Zones would benefit from a short introduction providing the context and stating why these regions are relevant and assessed here. Currently section 14.3.1 immediately jumps into the assessment of results. [Thomas Stocker/ WGI TSU, Switzerland]
A brief introduction is now added.
14-570 14 27 34 27 43 One explanation for the dominance of the 'warmer get wetter' over the 'rich get richer' is that the pattern of precip change associated with the weakening of the tropical circulation largely cancels out the 'rich get richer' pattern (Chadwick et al. 2012). This cancellation was also noted by Allan 2011 but to a lesser extent, possibly because of spatial averaging. In addition to SST gradient changes, the enhanced land-sea temperature gradient is also likely to play a role in surface pressure changes and hence in changes in the patterns of convergence and rainfall (Bayr & Dommenget 2012). Chadwick et al. 2012, 'Spatial Patterns of Precipitation Change in CMIP5: Why the Rich don't get Richer in the Tropics', In Press at J. Clim. Allan R. 2011, 'Regime dependent changes in global precipitation', Clim. Dyn. DOI: 10.1007/s00382-011-1134-x. Bayr & Dommenget 2012, 'The Tropospheric Land-Sea Warming Contrast as the Driver of Tropical Sea Level Pressure Changes', J. Clim. doi: 10.1175/JCLI-D-11-00731.1, in press. [Robin Chadwick, United Kingdom]
The Chadwick et al. paper is very relevant and now cited.
14-571 14 27 34 28 7 I would urge caution in wording some of the discussion of the role of sea surface temperature (SST) and its relation to rainfall, as this is not well agreed in the community. I don't mean to minimize the usefulness of this way of looking at the problem in some cases, but it may be a little overstated here. Kang & Held (2012) give a clear reiteration of the argument that SST is not causal. At climate timescales, it can be misleading to think of SST as a causal variable exception in regions where there are strong ocean transport changes supporting the SST anomaly. Elsewhere, the SST and the troposphere column come into mutual balance with the SST determined by the condition that the net surface heat flux has to balance out to approximately 0. The SST can be a useful variable in diagnosing the result of the column interaction, and of course changes are correlated with changes in precipitation, circulation etc. But if it's taken as causal you can end up with complicated handwaving such as occurs on in section 14.7.4 on Caribbean change. In the equatorial cold tongue, considering the SST anomalies as driving the precipitation anomalies is completely fine, since strong ocean transport makes the reaction different in a coupled model than in a system with the corresponding slab ocean (e.g., Chou et al 2006). In the subtropical descent regions, the SST and the column react mutually, and in a way that's different from within the convective regions, but statements like line 49-50 "reduced warming in the subtropical Southeast Pacific that weakens convection there" attribute causality that might equally well be
This is a useful comment. The revision acknowledges the interactive nature of SST pattern and convective change, and discusses the complementary nature of these views. The wet-get-wetter view is discussed in AR4 and ch 7 while the SST pattern effect emerged in the literature only after AR4 and is discussed only here in any detail in AR5.
Expert and Government Review Comments on the IPCC WGI AR5 Second Order Draft – Chapter 14
Do not Cite, Quote or Distribute Page 41 of 118
Comment No
Chapter
FromPage
FromLine
To Page
To Line Comment Response
argued to go the other direction. Although I very much respect and enjoy interacting with the lead author whose research is reflected, the amount of material and phrasing here appear a little out of balance with the current degree of uncertainty on this aspect. [J. David Neelin, United States of America]
14-572 14 27 34 28 7 One reference (of many possible) related to the discussion of counter arguments given in the previous comment: Kang & Held (2012) Climate Dynamics, 38(9-10), doi:10.1007/s00382-011-1048-7 [J. David Neelin, United States of America]
Kang and Held's work is discussed elsewhere in the section, and does not rule out the SST effect.
14-573 14 27 37 27 39 Figure 14.13 does not seem to show the North Pacific following a “warmer-gets-wetter” pattern. [Andrew Turner, United Kingdom of Great Britain & Northern Ireland]
We believe it does: the spatial correlation between precipitation and SST pattern is 0.61. The correlation weakens in the extratropics.
14-574 14 27 45 27 45 "Reproducible" may be a confusing word. Perhaps "typical" or "common"? [Markku Rummukainen, Sweden] Reworded.
14-575 14 27 50 27 52 why is it stated that the zonal SST gradient changes help weaken the Walker Cells? Is it not more likely they are responses of the ocean to changes in the cells as a result of Held-Soden arguments (I refer to page 14-31 lines 46-50). [Andrew Turner, United Kingdom of Great Britain & Northern Ireland]
Both effects are present. The statement does not rule out the Held and Soden mechanism.
14-576 14 28 1 28 1 Why the choice of the periods (esp the reference period as 1900-1949, which is different from many other used in AR5)? [Markku Rummukainen, Sweden]
The st+H592andard AR5 periods are now adopted.
14-577 14 28 12 28 13 (ITCZ) located immediately north of the equator, characterized by distinct seasonal migration across the equator - this wording is inconsistent. Probably it can be corrected by starting a new sentence beginning with "Its average position …. [Petra Seibert, Austria]
Rewritten.
14-578 14 28 26 28 27 Please add reference (Zhang and Delworth 2005) for the statement "Southward shifts of the Atlantic ITCZ and its relation to Atlantic thermohaline circulation ...". Also add that: "The weakening of the AMOC can lead to southward shift of ITCZ [Rong Zhang, United States of America]
This subsection has been rewritten.
14-579 14 28 26 28 27 in both tropical Atlantic and Pacific (Zhang and Delworth, 2005)". [Rong Zhang, United States of America] This subsection has been rewritten.
14-580 14 28 26 28 27 Reference: Zhang and Delowrth 2005: Simulated tropical response to a substantial weakening of the Atlantic thermohaline circulation, Journal of Climate, 18(12), doi:10.1175/JCLI3460.1. [Rong Zhang, United States of America]
This subsection has been rewritten.
14-581 14 28 49 28 56 Would information now have become available from CMIP5 models? [Markku Rummukainen, Sweden] Referred to Ch 9.
14-582 14 28 49 28 Make it more clear when you discuss CMIP3 vs CMIP5 models. Don't talk about climate models in general. It is relevant to know if problems seen in CMIP3 are still there in the new CMIP5. This comment applies also to other parts of the chapter! [Erik Kjellström, Sweden]
Referred to Ch 9.
14-583 14 28 55 28 56 A significant effect of convective parameterizations in atmospheric models on the “double ITCZ bias” is specified in the CMIP3 and CMIP5 multi-model studies, which is consistent with TRMM satellite observation. I suggest inserting some sentences as follows, after the specified lines (p28, after l.56). ‘In concert, CMIP3 and CMIP5 multi-model analysis reveals that the double ITCZ model bias is mitigated in climate models with parameterizations of deep convection sensitive to the mid-tropospheric humidity (Hirota et al. 2011, Hirota and Takayabu, submitted), which is consistent with a satellite observation (Takayabu et al. 2010).’ Corresponding references are as follows. Hirota, N., Y. N. Takayabu, M. Watanabe, M. Kimoto, 2011: Precipitation reproducibility over tropical oceans and its relationship to the double ITCZ problem in CMIP3 and MIROC5 climate models. J. Climate, 7,4859-4873. Hirota, N., and Y. N. Takayabu,. Reproducibility of precipitation distribution over the tropical oceans in CMIP5 multi-climate models, Climate Dynamics, submitted. Takayabu, Y. N., S. Shige, W.-K. Tao, and N. Hirota, 2010: Shallow and deep latent heating modes over tropical oceans observed with TRMM PR Spectral Latent Heating data, J. Climate, 23, 2030-2046. [Yukari Takayabu, Japan]
Referred to Ch 9.
14-584 14 28 55 Please briefly elaborate here on what particular changes to the models were effective at alleviating the biases. Referred to Ch 9.
Expert and Government Review Comments on the IPCC WGI AR5 Second Order Draft – Chapter 14
Do not Cite, Quote or Distribute Page 42 of 118
Comment No
Chapter
FromPage
FromLine
To Page
To Line Comment Response
[Government of United States of America]
14-585 14 29 1 29 6 This paragraph should summarise model projections of changes in ITCZ and other relevant studies (if any exist). There should be a reference for the first sentence. The discussion mixes projections and trends in a confusing way. [Josephine Brown, Australia]
This subsection has been rewritten.
14-586 14 29 3 4 This statement is somewhat out of place as the text is really about model results. [Erik Kjellström, Sweden] This subsection has been rewritten.
14-587 14 29 5 6 "can affect …. And the future behaviour of ITCZ". In what way? Please say stg on this here. [Erik Kjellström, Sweden]
This subsection has been rewritten.
14-588 14 29 8 54 This section on the SPCZ focuses on the occurrence of zonal events. While these are one aspect, it is also important to discuss changes to the mean position and intensity. This has far larger implications for many islanders. That the SPCZ latitude is linked to ENSO frequency therefore reliant on future ENSO behaviour (which is not known) could also be highlighted. These ideas are expanded upon on page 91, line 48. in the regional discussion but should appear here too. [Jaclyn Brown, Australia]
The mean change is now mentioned.
14-589 14 29 16 29 16 ENSO and IPO effects on the position of the SPCZ also discussed in detail in the already referenced paper:Folland C.K., Salinger M.J., Jiang, N. and N. Rayner, 2003: Trends and Variations in South Pacific Island and Ocean Surface Temperature. J. Climate, 16, 2859-2874. [Christopher Folland, United Kingdom of Great Britain & Northern Ireland]
Preference is given to post-AR4 work.
14-590 14 29 20 29 21 Should also add Matthew (2012) reference here: Matthews AJ (2012) A multiscale framework for the origin and variability of the South Pacific Convergence Zone. Q J R Meteorol Soc. doi:10.1002/qj.1870 [Josephine Brown, Australia]
Cited now.
14-591 14 29 29 29 38 Changes in mean SPCZ precipitation are also of interest, and are mentioned in the later Pacific Islands section. It would therefore be good to add a few sentences on this topic, e.g. "The majority of CMIP3 and CMIP5 models simulate increased austral summer mean precipitation in the SPCZ, with decreased precipitation at the eastern edge of the SPCZ (Brown et al. 2012a; 2012b). However, sea surface temperature biases can strongly influence precipitation changes in the SPCZ region (e.g. Widlanksy et al. 2012). Therefore, changes in SPCZ precipitation remain uncertain." [Josephine Brown, Australia]
The mean change is now mentioned.
14-592 14 30 1 A reference is needed to this first sentence of the paragraph. [Erik Kjellström, Sweden] OK. References were included.
14-593 14 30 40 Please provide a brief parenthetical definition for "boreal summer" (or add to glossary) [Government of United States of America]
The sentence has been deleted.
14-594 14 30 53 What kind of "progress"? Be more specific! [Erik Kjellström, Sweden] Rewritten.
14-595 14 30 55 30 57 Please cite references to support this statement regarding difficulties in projection extreme events, especially in the tropics. [Thomas Stocker/ WGI TSU, Switzerland]
The sentence has been deleted.
14-596 14 31 2 What kind of "variance" is refered to? Spatial? Temporal? [Erik Kjellström, Sweden] temporal variance.
14-597 14 31 2 It is not easy to understand what "a multi-variant index" is. Is it necessary to mention it? If so it should be explained a bit better what it includes. [Erik Kjellström, Sweden]
No, the phrase has been deleted.
14-598 14 31 13 33 27 The statements about IOD should be made totally consistent with the assessment of the failure of models to reproduce IOB changes considering IOB represents a much higher variance in the region. Cross reference with Chapter 9, section 9.5.3.4.2. [Government of United States of America]
Reworded.
14-599 14 31 21 31 23 Is it clear that the IOD and IOB are separate modes, or are they simply parts of the ENSO phenomenon? In other words, notwithstanding the correlations with ENSO, do the IOD and IOB still occur in non-ENSO years? Perhaps this could be clarified in this paragraph. [Adrian Simmons, United Kingdom]
Some IOD events occur without ENSO.
14-600 14 31 29 31 32 is there a disparity between the relative weaker warming of the northern Indian Ocean in observations with the projections for enhanced warming in the future (at least in SON season) presented in Figure 14.15? [Andrew Turner, United Kingdom of Great Britain & Northern Ireland]
The difference is due to aerosol (chung & Ramanathan 2006).
Expert and Government Review Comments on the IPCC WGI AR5 Second Order Draft – Chapter 14
Do not Cite, Quote or Distribute Page 43 of 118
Comment No
Chapter
FromPage
FromLine
To Page
To Line Comment Response
14-601 14 31 34 What period does "a reduced SST warming" refer to? Is it the long-term trend over 1858-1997? [Erik Kjellström, Sweden]
It is the latter.
14-602 14 31 35 Please correct awkward phrase "freshening of salinity". Either "freshening" or "reduction of salinity" would be better. [Government of United States of America]
Corrected.
14-603 14 31 36 31 36 change to stronger or weaker easterlies? [Christopher Folland, United Kingdom of Great Britain & Northern Ireland]
Reworded.
14-604 14 31 44 31 44 change to stronger or weaker easterlies? [Christopher Folland, United Kingdom of Great Britain & Northern Ireland]
Reworded.
14-605 14 31 47 "under global warming" --> "In a warming climate"? [Thomas Stocker/ WGI TSU, Switzerland] Sentence deleted.
14-606 14 31 53 31 54 Why the choice of the periods (esp the reference period as 1900-1949, which is different from many other used in AR5)? [Markku Rummukainen, Sweden]
The reference period changed to 1981-2000.
14-607 14 31 53 Figure 14.15: reference period (1900-1949) and 21st century period (2050-2099) are inconsistent with what is used in the other projection chapters and also with what was used so far in Chapter 14. Why are so different time periods used in this case? Suggest to homogenize throughout the Chapter as much as feasible. [Thomas Stocker/ WGI TSU, Switzerland]
The reference period changed to 1981-2000.
14-608 14 31 Suggest citing here an article that reports on the impact of improved model physics on its MJO rendition: Zhou, Neale, Jochum, Murtugudde, Better MJOs with bet-ter physics: the impact of improved convection parameterizations. J. Clim., 25, 1116-1136. [Government of United States of America]
reference seems relevant to Ch 9.
14-609 14 31 The statement from Cai et al. 2011b about models with strong Bjerknes feedback should be clarified as to whether this is a bias especially in the context of how these models perform in the 20th Century. [Government of United States of America]
The sentence has been deleted.
14-610 14 32 3 32 9 It might good to include an additional information about that the IOB contributes to accelerate the following ENSO transition as documented in Kug and Kang (2006) and Ohba and Ueda (2007). Kug, J.-S., and I.-S. Kang, 2006: Interactive feedback between the Indian Ocean and ENSO. J. Climate, 19, 1784–1801. Ohba, M., and H. Ueda, 2007: An impact of SST anomalies in the Indian Ocean in acceleration of the El Nino to La Nin a transition. J. Meteor. Soc. Japan, 85, 335–348. [Masamichi Ohba, Japan]
The IOB discussion has been drastically reduced, leaving litle room to discuss current climate.
14-611 14 32 21 Here it says "In an OAGCM" referring to Figure 14.16. The figure shows results from many GCMs so it is not really consistent with the statement made here. [Erik Kjellström, Sweden]
The CMIP5 paper did not make the IPCC deadline so the figure deleted and discussion toned down.
14-612 14 32 26 Says "Figure 14.3.4". Should it possibly be 14.16? [Erik Kjellström, Sweden] Yes, thanks.
14-613 14 32 36 A brief parenthetical definition of "Bjerknes feedback" the first time it is used would be helpful. E.g. move definition appearing on P36 L55 to here. [Government of United States of America]
Suggestion implemented.
14-614 14 32 44 48 First it says that there has been an "increase in IOD activity" and then that "IOD variability in SST remains nearly unchanged". I suggest to change "global warming" into "scenarios of a future warmer climate" if this is what is referred to in the second paragraph. [Erik Kjellström, Sweden]
The discussion of observations has been deleted. Reword.
14-615 14 32 45 32 46 "global warming might be the culprit" - please avoid the ambiguous term 'global warming' and be more explicit, egg, global increase in average temperature, or anthropogenic warming (if you mean to attribute to anthropogenic forcing). [Thomas Stocker/ WGI TSU, Switzerland]
Sentence deleted.
14-616 14 32 48 32 48 The statement would seem to be very definitive, and maybe should be reworded as suitable: "According to Ihara et al., " or "Based on … Ihara et al…" (same comment applies to line 56 on the same page). [Markku Rummukainen, Sweden]
Reworded.
14-617 14 32 48 32 48 please avoid the ambiguous term 'global warming', and be more explicit. 'global warming' in common usage often implies warming caused by humans, and this may not be what you want in this instance. [Thomas Stocker/ WGI TSU, Switzerland]
Reworded.
Expert and Government Review Comments on the IPCC WGI AR5 Second Order Draft – Chapter 14
Do not Cite, Quote or Distribute Page 44 of 118
Comment No
Chapter
FromPage
FromLine
To Page
To Line Comment Response
14-618 14 32 49 Please provide a brief parenthetical definition of "shoals", or add this term to the glossary. [Government of United States of America]
Changed to "lifts".
14-619 14 32 56 32 56 please avoid the ambiguous term 'global warming', and be more explicit. 'global warming' in common usage often implies warming caused by humans, and this may not be what you want in this instance. [Thomas Stocker/ WGI TSU, Switzerland]
Reworded.
14-620 14 32 57 Please be more precise than "off Indonesia". [Government of United States of America] Added "in the eastern Indian Ocean".
14-621 14 32 Statement about prolonged state of IOD for 2006-2008 does not clarify if the Bjerknes feedback occurs in all years and if the teleconnections claimed in Yamagata et al. 2004 cited in this context did occur. Previous claims about extended ENSO of 1991-194 and its relation to global warming were followed by no clarification for why there is a relative lull since 1997. It may be best to avoid unsubstantiated claims especially since the definition of IOD relies on a gradient. [Government of United States of America]
The discussion of observations has been deleted.
14-622 14 33 2 33 2 please avoid the ambiguous term 'global warming', and be more explicit. 'global warming' in common usage often implies warming caused by humans, and this may not be what you want in this instance. [Thomas Stocker/ WGI TSU, Switzerland]
Changed to "in a warmer climate".
14-623 14 33 9 Figure 14.17: skewness is shown in panel c), not in a) -- please correct caption. [Thomas Stocker/ WGI TSU, Switzerland]
Corrected.
14-624 14 33 16 33 25 If the paragraph is a summary, it would be good to label as such. Otherwise references may be needed. [Markku Rummukainen, Sweden]
this sentence has been absorbed into the section assessment statement.
14-625 14 33 19 33 19 please avoid the ambiguous term 'global warming', and be more explicit. 'global warming' in common usage often implies warming caused by humans, and this may not be what you want in this instance. [Thomas Stocker/ WGI TSU, Switzerland]
Reworded.
14-626 14 33 24 is "reproducible" the right word here? Would "robust" be better? [Thomas Stocker/ WGI TSU, Switzerland] Reworded.
14-627 14 33 30 33 30 Is reference to Chapter 10 correct? [Markku Rummukainen, Sweden] Should be "Ch 9".
14-628 14 33 30 for model evaluation issues reference to Ch9 should be added [Thomas Stocker/ WGI TSU, Switzerland] Referred to Ch 9.
14-629 14 33 45 Should “significantly” be replaced with “weakly” or “marginally” (what is the p value?)? [Government of United States of America]
Discussion deleted.
14-630 14 33 47 33 49 The statistical significance of the southwards shift of the ITCZ should be discussed. [Government of United States of America]
Assessed in the original papers.
14-631 14 33 48 33 48 The Sahel rainfall reduction is likely linked to the Amazon rainfall increase. The latter is likely forced by the SST changes and the latter through a Walker circulation response to the Amazon rainfall increase. See latter part of: Baines, P. and C.K. Folland, 2007: Evidence for a rapid global climate shift across the late 1960s. J. Climate, 12, 2721-2744 [Christopher Folland, United Kingdom of Great Britain & Northern Ireland]
The discussion has been deleted for the sake of space.
14-632 14 33 52 33 52 Fig. 14.18: Include the information that this is the leading SST EOF for the Atlantic Ocean. [Alice Grimm, Brazil]
Figure deleted.
14-633 14 33 52 Figure 14.18: caption needs to mention and explain the y-axis annotation (C^y/100yr used in the middle and bottom panels [Thomas Stocker/ WGI TSU, Switzerland]
Figure deleted.
14-634 14 33 53 33 53 Rayner et al (2003) reference missing from reference list [Christopher Folland, United Kingdom of Great Britain & Northern Ireland]
Figure deleted.
14-635 14 33 The statements about the projected changes in IOD asymmetry and its potential impacts on teleconnections are misleading if not accompanied by statements on the failure of these models to represent realistic IOD behavior in the unforced or the 20th century simulations. [Government of United States of America]
IOD is generally simulated, albeit too strong (Ch 9).
14-636 14 34 6 34 9 Mahajan et al. (2012) also show that the tropical North Atlantic cools more than the south tropical Atlantic. This The discussion has been deleted for the sake of
Expert and Government Review Comments on the IPCC WGI AR5 Second Order Draft – Chapter 14
Do not Cite, Quote or Distribute Page 45 of 118
Comment No
Chapter
FromPage
FromLine
To Page
To Line Comment Response
study could be cited here. Mahajan S., K. J. Evans, J. J. Hack, J. E. Truesdale and J-F. Lamarque (2012): Inter-annual Global Tropospheric Aerosol Variability and its Impacts on Atlantic and African Climate by Direct and Semi-direct Effects, Journal of Climate (in press, available online), doi: 10.1175/JCLI-D- 12-00029.1 [Government of United States of America]
space.H651.
14-637 14 34 7 34 7 Add: Knight, J., Allan R.J., Folland, C.K., Vellinga, M. and M.E. Mann, 2005: Natural Variations in the thermohaline circulation and future surface temperature. Geophys. Res. Lett., 32, L20708, doi: 1029/2005GL024233. [Christopher Folland, United Kingdom of Great Britain & Northern Ireland]
Preference is given to post-AR4 literaure.
14-638 14 34 11 19 Is there any information on CMIP5 models that could be added at the end of this paragraph? [Erik Kjellström, Sweden]
Updated with CMIP5 results by referring to Ch 12.
14-639 14 34 25 34 26 Mahajan et al. (2010) conclusively showed the dominance of the WES feedback in AMM for the first time. This study could be cited here. Mahajan S., R. Saravanan, P. Chang (2010): Free and forced variability of tropical Atlantic: Role of the Wind-Evaporation-Sea surface temperature (WES) feedback, Journal of Climate, 23, 5958-5977. [Government of United States of America]
Reference for WES is considered sufficient.
14-640 14 34 26 34 26 WES - if that is a reference, it is missing in the reference list. [Martin Stendel, Denmark] It is an abbrevation.
14-641 14 34 26 34 26 Xie and Philander (no capital letters) [Martin Stendel, Denmark] Taken care of
14-642 14 34 27 34 30 Saravanan and Chang (1999) demonstrated the link between ENSO and the Atlantic dipole mode (AMM). This study can be cited here. Saravanan, R., Ping Chang, 2000: Interaction between Tropical Atlantic Variability and El Niño–Southern Oscillation. J. Climate, 13, 2177–2194. [Government of United States of America]
The discussion has been deleted for the sake of space.
14-643 14 34 27 34 30 AMM's possible links with ENSO and NAO is also noted in a new research paper. It has been shown the evolution described by Hu et al., 2011 that leads to tropical North Atlantic warming is evident during the period of 1979-2010. Besides, signatures associated with Atlantic Niño (Atlantic Equatorial Mode, AEM) were also found significant in early summer. Clues suggest AMM, ENSO, NAO and AEM are related and their collaboration may contribute to strong interannual variability of the atmospheric circulation during JAS. Interestingly, the associated Hadley circulation mode, which is dominant in terms of the explained variance, is characterized by the ITCZ intensity change rather than the position displacement during the 32-year period, although this could be different in earlier decades. The paper is "Zhang, G. and Z. Wang, 2012: Interannual Variability of the Atlantic Hadley Circulation in Boreal Summer and Its Impacts on Tropical Cyclone Activity, J. Climate, submitted". [Gan Zhang, United States]
The discussion has been deleted for the sake of space.
14-644 14 34 29 34 29 "2009-2010" should be "2010" [Zeng-Zhen Hu, United States of America] The discussion has been deleted for the sake of space.
14-645 14 34 40 43 At two places it is stated "IPCC models". Use "CMIP3 models instead" [Erik Kjellström, Sweden] Corrected.
14-646 14 34 40 change "IPCC models" to "CMIP3 models" -- there are no IPCC models! [Thomas Stocker/ WGI TSU, Switzerland]
Corrected.
14-647 14 34 43 There is reference here to "IPCC model simulations". This suggests that the IPCC has a model or runs simulations. Elsewhere in the WG1 report the reference is to CMIP3, CMIP5 or some other sort of MIP, model simulations. [Adrian Simmons, United Kingdom]
Corrected.
14-648 14 34 43 change "IPCC models" to "CMIP3 models" -- there are no IPCC models! [Thomas Stocker/ WGI TSU, Switzerland]
Corrected.
14-649 14 34 57 34 57 Folland et al (2001) show that this mode modulates North East Brazil rainfall on interdecadal (as well as interannual) time scales:Folland, C.K., Colman, A., Rowell, D.P., and M.K. Davey, 2001: Predictability of North
Discussion has been substantially shortened.
Expert and Government Review Comments on the IPCC WGI AR5 Second Order Draft – Chapter 14
Do not Cite, Quote or Distribute Page 46 of 118
Comment No
Chapter
FromPage
FromLine
To Page
To Line Comment Response
East Brazil rainfall and real-time forecast skill, 1987-1998 J. Climate, 14, 1937-1958. [Christopher Folland, United Kingdom of Great Britain & Northern Ireland]
14-650 14 34 Section 14.3.4: If there is a statement in another chapter about the adequacy of data to capture the behavior of AMO in terms of its period then it should be alluded to here when statements about changes in AMO behavior are made. Cross reference to Chapters 2 and 9. [Government of United States of America]
Discussion related to AMO has been deleted.
14-651 14 35 5 Figure 14.19: please clarify units shown in the Figure and in the caption [Thomas Stocker/ WGI TSU, Switzerland]
Figure deleted.
14-652 14 35 17 35 17 Zebiak (no capital letters) [Martin Stendel, Denmark] fix format.
14-653 14 35 24 35 25 Zebiak, 1993; Carton and Huang, 1994; ... (no capital letters) [Martin Stendel, Denmark] Taken care of
14-654 14 35 24 35 25 "... (ZEBIAK,1993) (CARTON and HUANG, 1994; Keenlyside and Latif, 2007) ..." The format of citations need be fixed. The iterm "ZEBIAK,1993" should appear within the same brackets where the other two iterms stay. Besides, the author names probably should be changed into the lowercase form. [Gan Zhang, United States]
Taken care of
14-655 14 35 28 35 33 suggest to move this paragraph to section 14.3.5 "Assessment Summary" [Thomas Stocker/ WGI TSU, Switzerland]
We have deleted the summary in this subsection.
14-656 14 35 31 33 This statement needs references. [Erik Kjellström, Sweden] Paragaph deleted.
14-657 14 35 35 35 35 "... Atlantic variability Nino ..." probably should be "Atlantic Niño variability". [Gan Zhang, United States] Corrected.
14-658 14 35 37 35 37 "... Atlantic Nino ..." should be "Atlantic Niño". [Gan Zhang, United States] fixed.
14-659 14 35 41 35 41 "... Atlantic Nino ..." should be "Atlantic Niño". [Gan Zhang, United States] fixed.
14-660 14 35 43 35 46 The reference to the A1B emission scenario and a 2006 paper, suggests that this remark concerning poor simulation by models refers to CMIP3 models, not the CMIP5 models used for the main projections in this AR5 report. Is there any evidence that the CMIP5 models have improved over the CMIP3 models in this regard? [Adrian Simmons, United Kingdom]
CMIP5 results are not available in the literature.
14-661 14 35 51 35 51 Latif and Grötzner (with German "ö"). [Martin Stendel, Denmark] Taken care of
14-662 14 35 54 35 57 The Atlantic Nino region is also subjected to black carbon aerosols and perhaps dust. These should also be mentioned in addition to sulfate aerosols. [Government of United States of America]
Discussion deleted.
14-663 14 35 57 35 57 ".. by (Tokinaga and Xie, 2011)" probably need be changed as "by Tokinaga and Xie (2011)" . [Gan Zhang, United States]
Correct.
14-664 14 36 15 36 43 This summary section is an example of where the uncertainty language needs to be looked at very carefully. If possible, please avoid 'medium to high confidence' type statements, and rather settle on a definitive confidence level. There are several instances where you indicate only low or medium confidence in projections (e.g., line 22), yet still go on to provide a strong quantified likelihood statement. Please consider carefully in these instances whether or not your confidence in the projections is sufficient to be able to support such a quantified likelihood level. [Thomas Stocker/ WGI TSU, Switzerland]
Revised.
14-665 14 36 18 36 19 suggest to delete "in assessing" -- might be ambiguous as could be read that the medium confidence is in the process of assessing rather than the assessed result. [Thomas Stocker/ WGI TSU, Switzerland]
Reworded.
14-666 14 36 20 36 21 Delete sentence "The mechanism appears…" as this is not relevant in the brief summary and is outlined elsewhere. [Josephine Brown, Australia]
Deleted.
14-667 14 36 45 41 10 There were some observed evidences most recently, which may be included. Recently, McPhaden (2012) documented another shift of the equatorial climate around 1999/2000 and reported that while warm water volume (WWV) integrated along the equatorial Pacific led ENSO SST anomalies by 2–3 seasons during the 1980/90s, WWV variations decreased and lead time was reduced to only one season during the 2000s. Horii et al. (2012) argued that compared with 1981-2000, the
McPhaden(2012)'s work may be important but it is too detailed, and such change is related to change in 'ENSO flavor' because EP warming event has been decreased after 2000s. Regarding the changes in the troical Pacific interannual variability since 2000, Fig.
Expert and Government Review Comments on the IPCC WGI AR5 Second Order Draft – Chapter 14
Do not Cite, Quote or Distribute Page 47 of 118
Comment No
Chapter
FromPage
FromLine
To Page
To Line Comment Response
interrelationship of the WWV and ENSO became weak after 2000, especially for El Niño/La Niña events in 2005-2011. Furthermore, the discharge phases of WWV leading to La Niña events were less frequent since 2001. Hu et al. (2012) showed that compared with 1979-1999, the interannual variability in the tropical Pacific was significantly weaker in 2000-2011, and this shift can be seen by coherent changes in both the tropical atmosphere and ocean. For example, the equatorial thermocline tilt became steeper during 2000-2011, which was consistent with positive (negative) sea surface temperature anomalies, increased (decreased) precipitation, and enhanced (suppressed) convection in the western (central and eastern) tropical Pacific, which reflected an intensification of the Walker circulation. Hu et al. (2012) further argued that either too strong or too weak thermocline slope (trade wind) results in small ENSO variability. Horii, T., I. Ueki, and K. Hanawa, 2012: Breakdown of ENSO predictors in the 2000s: Decadal changes of recharge/discharge-SST phase relation and atmospheric intraseasonal forcing. Geophys. Res. Lett., 39, L10707. DOI: 10.1029/2012GL051740. McPhaden, M. J., 2012: A 21st century shift in the relationship between ENSO SST and warm water volume anomalies. Geophys. Res. Lett., 39, L09706. DOI: 10.1029/2012GL051826. Hu, Z.-Z., A. Kumar, H.-L. Ren, H. Wang, M. L'Heureux, and F.-F. Jin, 2012: Weakened interannual variability in the tropical Pacific Ocean since 2000. J. Climate (in press). [Zeng-Zhen Hu, United States of America]
14.13 and supplmentary support Hu et al. (2012) in many aspects. At least, the EP warming events decrease since 2000 so that the interannual variability over the eastern Pacific obviousely decreases. On the other hand, due to the increase of CP warming events, the interannual variability over the central Pacific somewhat increase. Intensified Pacific Walker circulation during the recent decades is mentioned.
14-668 14 36 45 Section 14.3 refers to the ENSO in several places, and discusses so-called Atlantic Ninos. So I wonder whether it would be better to move section 14.4, which is devoted to ENSO, ahead of section 14.3. [Adrian Simmons, United Kingdom]
14.4 refers the tropical Pacific ENSO not Atlantic phenomenon. But the entire section has been shortened so this issue is better dealt with
14-669 14 36 48 Abnormal' is a misleading word to use here. Perhaps you mean anomalous? Abnormal implies that there is something not natural about El Nino. [Jaclyn Brown, Australia]
Corrected and moved to Supplementary
14-670 14 36 49 no need to introduce "SST" as it has been introduced much earlier in the Chapter. It certainly has been used before. [Thomas Stocker/ WGI TSU, Switzerland]
Delected
14-671 14 36 51 36 51 change "s" with "that is" [Annalisa Cherchi, Italy] Corrected
14-672 14 36 51 36 52 Typo: extra "s" before "surface pressure" [Government of Canada] Corrected
14-673 14 36 51 "Oscillation, [a] surface" [Andrew Wittenberg, United States of America] Corrected
14-674 14 36 53 36 55 Due to a subtle wording issue this sentence is not true. It implies that El Niño and the Southern Oscillation would not exist without each other, which is an unsupported statement. For instance, El Niño and the Southern Oscillation have been shown to not be highly correlated (Deser and Wallace, JGR 1987), while, recently, the Southern Oscillation has been suggested to be able to exist regardless of ocean dynamics (Clement, DiNezio and Deser, J. Climate 2011). Furthermore, events such as the catastrophic El Niño during March 1925 (Murphy, Geogr. Rev. 1926) took place without a corresponding negative phase in the Southern Oscillation. A correct formulation of the sentence in question could be: "El Niño and Southern Oscillation are two different aspects of ENSO, which is caused by a positive feedback ..." [Ken Takahashi, Perú]
Corrected. Now in Supplementary
14-675 14 36 55 the "Bjerknes Feedback" has been used previously in the chapter and should be defined/explained upon it's first appearance in the Chapter. [Thomas Stocker/ WGI TSU, Switzerland]
Mentioned briefly. This part now in supplementary
14-676 14 36 41 Section 14.4: The discussion on ENSO discusses uncertainties in different flavors of ENSO and leaves the reader with a feeling of robust scientific questions that remain. In comparison, the phenomenon of IOD which has only been studied for about a decade is discussed as if it is indeed a mode and that it will continue to be active. No mention is made of the fact NONE of the models actually capture the extremely episodic nature of the zonal pattern and that there is still no consensus on whether this is really independent of ENSO or really has any impact or is a response to other giants in the neighborhood like the monsoons and ENSO. Much of the literature that disagrees with the deterministic view proposed in references cited here, has not been mentioned, including crucial papers that pointed out the role of the Bjerknes feedback for the first time or the ones that raised the issue of potential triggers related to ENSO. This will reignite credibility issues of the process if not addressed carefully. Especially considering that it is stated on 14-31 that IOD explains less than 15% of the variance. [Government of United States of America]
Different flavors of ENSO' moved to supplementary. Understand 'no consensus'. Supplenmenary summarizes the current literatures on this topic without bise. It is still important because it did happen regardless of indepent or not from convensional ENSO.
14-677 14 36 41 There are seemingly contradictory statements on whether central Pacific ENSO will become more frequent or This part moved to suplementary. The discussion
Expert and Government Review Comments on the IPCC WGI AR5 Second Order Draft – Chapter 14
Do not Cite, Quote or Distribute Page 48 of 118
Comment No
Chapter
FromPage
FromLine
To Page
To Line Comment Response
if it is just a natural part of the broad ENSO spectrum. In fact two papers by Yeh appear to be cited in both contexts. No statements are made about whether the models capture a sufficiently broad specturm of ENSO and if not, then how it affects the high confidence in the El Nino and La Nina teleconnections, especially over the aforementioned zonal pattern in the Indian Ocean. [Government of United States of America]
remains brief
14-678 14 37 1 Figure 14.21 could be omitted as it describes basic aspects. [Markku Rummukainen, Sweden] Not only the basic aspects but alos best summary on the background and ENSO change in future as described in the text.
14-679 14 37 14 37 46 It would be helpful to show a plot of these contrasting reconstructions, over their various time periods. [Andrew Wittenberg, United States of America]
Not easy to display this point but cited papers already told the point.
14-680 14 37 16 "[Some datasets suggest that] the tropical Pacific". Please also refer back to Sec. 2.7.5. [Andrew Wittenberg, United States of America]
Rewritten
14-681 14 37 16 Clarify what is meant by "tropical Pacific west-east SST contrast" -- should it say "equatorial contrast"? As pointed out in the following paragraph, the zonal-contrast changes in CMIP3/5 are secondary compared to the equator-to-subtropics gradient changes -- so it would be better to put the zonal gradient discussion last. [Andrew Wittenberg, United States of America]
changed
14-682 14 37 17 Please include the definition of “ocean dynamic thermostat” parenthetically, so people are clear that this is a definition, not an additional mechanism. [Government of United States of America]
This part is removed
14-683 14 37 17 Note that Tokinaga et al. (J. Climate 2012) found a weakening zonal SST gradient in bucket-only SSTs and nighttime marine air temperatures, consistent with the WASWind product. This suggests that the strengthening SST gradient seen in previous studies may have been an artifact of the changing observing system. [Andrew Wittenberg, United States of America]
It was mentioned in the text
14-684 14 37 19 37 19 See also Soloman and Newman Nature Climate Change 2, 691–699 (2012) doi:10.1038/nclimate1591 [Matthew Collins, United Kingdom of Great Britain & Northern Ireland]
This paper is cited.
14-685 14 37 19 Note that paleoclimate variations in the tropical Pacific (e.g. Cane et al. 1997) might not be direct analogs of future climate change. In particular, Holocene temperature variations were probably not driven by CO2 but by insolation variations. It is quite possible that the tropical Pacific/ENSO response would differ between these cases -- e.g. with an eastern equatorial Pacific thermostat-like cooling in response to enhanced solar heating of the tropics, versus an equatorially-enhanced warming in the case of reduced longwave cooling of the tropics. [Andrew Wittenberg, United States of America]
There exists a difference between the response to solar forcing and that to CO2 forcing, but this is not clearly identified so far. Argument on trend in the east-west contrast still needs to be investigated. So only balanced document is possible in AR5.
14-686 14 37 22 37 22 modify "decreased east-west SST" [Annalisa Cherchi, Italy] Modified
14-687 14 37 22 "of a decrease[d] east-west" [Andrew Wittenberg, United States of America] Modified
14-688 14 37 26 37 27 It is unusual to quote a temperature trend in terms of degrees per 50 years - I cannot recall seeing this anywhere else in the WG1 report. Quoting the trend as per decade or per century would be more consistent with what is done elsewhere. [Adrian Simmons, United Kingdom]
changed
14-689 14 37 26 37 33 The authors should consider tieing this discussion into what is shown in figure 14.21c and caption. [Government of United States of America]
Fig. 14.21 is delected
14-690 14 37 26 There is no section 2.6.8 [Andreas Sterl, Netherlands] changed
14-691 14 37 30 37 30 should this be '...proposed as an ENSO-related…"? [Government of United States of America] corrected
14-692 14 37 30 37 32 The statement is bit cryptic. Perhaps write what the response has been suggested to be like. [Markku Rummukainen, Sweden]
this part is delected
14-693 14 37 30 33 This sentence is difficult to understand. Isn't "El Nino-like" or "La Nina-like" in some way included in "ENSO events"? Also, Figure 14.1 that is referred to here has nothing to do with what is talked about here. [Erik Kjellström, Sweden]
This part is delected
Expert and Government Review Comments on the IPCC WGI AR5 Second Order Draft – Chapter 14
Do not Cite, Quote or Distribute Page 49 of 118
Comment No
Chapter
FromPage
FromLine
To Page
To Line Comment Response
14-694 14 37 30 Section 14.4.1: The observed intensification of Walker cell in the tropical Pacific over recent 2-3 decades is found to be caused by the stronger surface warming in the Indian Ocean (Luo, J.-J., W. Sasaki, and Y. Masumoto, 2012: Indian Ocean warming modulates Pacific climate change. PNAS, www.pnas.org/cgi/doi/10.1073/pnas.1210239109). The impacts of Indian Ocean-Pacific warming contrast on the Pacific climate change in the 20th and 21st centuries are also found in the CMIP3 and CMIP5 simulations/projections. [Government of Australia]
The section now pays less attention to observed changes. Thus this discussion is minimal now
14-695 14 37 30 Section 14.4.1: The observed intensification of the Walker cell in the tropical Pacific during the last 2-3 decades is recently found to be caused by the stronger surface warming in the Indian Ocean (Luo, J.-J., W. Sasaki, and Y. Masumoto, 2012: Indian Ocean warming modulates Pacific climate change. PNAS, www.pnas.org/cgi/doi/10.1073/pnas.1210239109). The impacts of Indian Ocean-Pacific warming contrast on the Pacific climate change in the 20th and 21st centuries are also found in the CMIP3 and CMIP5 simulations/projections. [Jing-Jia Luo, Australia]
The section now pays less attention to observed changes. Thus this discussion is minimal now
14-696 14 37 31 37 31 The terms "El Niño-like" and "La Niña-like", which describe a mean state change, can cause confusion. They should either be avoided or used with quotes and explanations. [Eric Guilyardi, France]
this part is delected
14-697 14 37 31 Here it is stated that mean tropical Pacific changes are not El Nino-like nor La Nina like. Yet on page 11, line 42 it states that the projected change is El Nino-like. Suggest going with my earlier comments that the term El Nino- like should be avoided as it is confusing and implies lots of dynamical changes that authors don't mean to suggest. [Jaclyn Brown, Australia]
this part is delected
14-698 14 37 31 "to global warming" --> "to a warming climate"? [Thomas Stocker/ WGI TSU, Switzerland] this part is delected
14-699 14 37 33 37 33 Fig 14.1 does not explicitly show the Bjerkes feedback. Bjerknes feedback is mentioned in various contexts in Chapter 14 without adequate explanation, and requires a diagram or description somewhere in this chapter [Christopher Folland, United Kingdom of Great Britain & Northern Ireland]
Text is no deleted
14-700 14 37 33 37 33 This last part of the sentence is unclear. What is the " - Bjerknes feedback" refering to ? [Eric Guilyardi, France]
Deleted
14-701 14 37 36 37 36 where are CMIP5 projections in terms of zonal SST gradient shown? [Annalisa Cherchi, Italy] CMIP3 showed but no studies for CMIP5 so far
14-702 14 37 37 37 37 What is nature of the "difference in evaporative cooling"? Expand this point as it is important. [Josephine Brown, Australia]
Modified
14-703 14 37 39 37 46 The discussion of the weakening of the tropical atmospheric circulation should be linked to the discussion of changes in SST gradients (above). Also, the last sentence is unclear - do recent trends suggest that the weakening of the circulation is no longer occurring? Does this imply that it will not occur in future? [Josephine Brown, Australia]
weakening is 20C trend while the intensification is more or less decadal change so far.
14-704 14 37 39 A reference to an increase in the strength of the equatorial undercurrent might also be appropriate here - Sen Gupta et al. 2012 doi:10.1029/2012GL051447 [Jaclyn Brown, Australia]
cited
14-705 14 37 45 "studies of" should be added after "several". Or state that "intensification … was reported for several observational and reanalysis datasets". [Adrian Simmons, United Kingdom]
Modified
14-706 14 37 50 37 50 What are reconstructed instrumental records/ [Phil Jones, United Kingdom of Great Britain & Northern Ireland] HadiSST, ERSST etc. but not mentioned in the text. Peer reviewed sources of information are quoted
14-707 14 37 53 put reference to chapter 5: section 5.4.1 [Maisa Rojas, Chile] referred
14-708 14 37 54 Misplaced reference to Lau et al. (BAMS 2008)? The one listed in the references was a JAMEX paper; and doesn't seem to fit here in the discussion of CGCM simulation of ENSO modulation. [Andrew Wittenberg, United States of America]
Deleted
14-709 14 37 54 In anticipation of the following paragraph, please add: "some studies have suggested" that modulation was due to changes in mean climate conditions. The way it is worded now, "was believed", could be misinterpreted as being the current state of community belief. [Andrew Wittenberg, United States of America]
changed
Expert and Government Review Comments on the IPCC WGI AR5 Second Order Draft – Chapter 14
Do not Cite, Quote or Distribute Page 50 of 118
Comment No
Chapter
FromPage
FromLine
To Page
To Line Comment Response
14-710 14 37 57 38 2 An Antarctic ice core proxy for ENSO-driven circumpolar winds shows evidence for stronger dominance of the El Nino state in the 20th century relative to the mean of the last millennium (Vance et al., 2012). Reference follows: [Government of Australia]
cited
14-711 14 37 57 38 2 T. R. Vance, T. D. van Ommen, M. A. J. Curran, C. T. Plummer, A. D. Moy, A millennial proxy record of ENSO and eastern Australian rainfall from the Law Dome ice core, East Antarctica, J. Climate, (in press) doi: 10.1175/JCLI-D-12-00003.1. [Government of Australia]
cited
14-712 14 37 57 38 2 An Antarctic ice core proxy for ENSO-driven circumpolar winds shows evidence for stronger dominance of the El Nino state in the 20th century relative to the mean of the last millennium (Vance et al., 2012). Reference follows: [Tasman van Ommen, Australia]
cited
14-713 14 37 57 38 2 T. R. Vance, T. D. van Ommen, M. A. J. Curran, C. T. Plummer, A. D. Moy, A millennial proxy record of ENSO and eastern Australian rainfall from the Law Dome ice core, East Antarctica, J. Climate, (in press) doi: 10.1175/JCLI-D-12-00003.1. [Tasman van Ommen, Australia]
cited
14-714 14 38 1 38 1 please avoid the ambiguous term 'global warming', and be more explicit. 'global warming' in common usage often implies warming caused by humans, and this may not be what you want in this instance. [Thomas Stocker/ WGI TSU, Switzerland]
changed
14-715 14 38 12 38 15 It is not evident that the past few decades observations would be decisive for the uncertainty on future ENSO behaviour. [Markku Rummukainen, Sweden]
We agree but it does not mean that what you commented. We mentioned that the future change in mean state is uncertain and additionally the past decades change as well.
14-716 14 38 13 38 13 please avoid the ambiguous term 'global warming', and be more explicit. 'global warming' in common usage often implies warming caused by humans, and this may not be what you want in this instance. [Thomas Stocker/ WGI TSU, Switzerland]
This term is now avoided, where the meaning is not obvious
14-717 14 38 14 38 15 …; Solomon and Newman, 2011; Vecchi and Wittenberg, 2010) (brackets wrong) [Martin Stendel, Denmark] Corrected
14-718 14 38 14 Change "unchanged in future" to "unchanged over the 21st century relative to the 20th century." [Andrew Wittenberg, United States of America]
Modified
14-719 14 38 15 "It is virtually certain[][,] however[,] that ENSO will not disappear [over the 21st century]." [Andrew Wittenberg, United States of America]
Modified
14-720 14 38 18 38 22 It seems Figures in this section are not correctly numbered (correspondance with text wrong) [Eric Guilyardi, France]
corrected and figures have been chsnged or deleted
14-721 14 38 18 38 22 EP and CP distinction (unclear and diverse definitions) is not needed in this general figure [Eric Guilyardi, France]
This part moved to supplementary
14-722 14 38 19 Figure 14.22 does not seem to be called in the text. [Markku Rummukainen, Sweden] corrected
14-723 14 38 24 38 24 Please define "best at simulating strong El Niño events". It should also be noted that the choice of criteria to define "best" models is subjective and analysis dependent. [Eric Guilyardi, France]
The criteria is that standard deviation of the scaled first EOF PC of tropical Pacific SST is over 0.78 oC, and thus it is subjective. But it is not necessary to define in the text. While we mentioned this result is based on the limited selection.
14-724 14 38 24 38 30 This paragraph could go in section 14.4.5 (refers to fig 14.25 and not 14.23) [Eric Guilyardi, France] Fig. 14.23 has been changed
14-725 14 38 25 38 25 "central Pacific El Niño" was not defined. [Eric Guilyardi, France] Modified/ENSO diversity has been moved to supplementary
14-726 14 38 28 Figure 14.23 is not about future changes. [Erik Kjellström, Sweden] delected
14-727 14 38 28 reference should probably be to Figure 14.25 rather than 14.23? [Thomas Stocker/ WGI TSU, Switzerland] corrected
Expert and Government Review Comments on the IPCC WGI AR5 Second Order Draft – Chapter 14
Do not Cite, Quote or Distribute Page 51 of 118
Comment No
Chapter
FromPage
FromLine
To Page
To Line Comment Response
14-728 14 38 39 38 47 The correct modelling of ENSO (and other) teleconnections in the current climate has been assessed by Yang and DelSole (2012) (in hindcast data) and Rowell (2013) (in CMIP3 and CMIP5 for Africa) (and maybe others), which is relevant for correctly modelling their likely future changes.Yang, X. and DelSole, T., 2012: Systematic Comparison of ENSO Teleconnection Patterns between Models and Observations. J. Climate, 25, 425-446. Rowell, D.P., 2013: Simulating Large-Scale Teleconnections to Africa: What is the State of the Art? J. Climate, submitted [Dave Rowell, United Kingdom of Great Britain & Northern Ireland]
General statement on teleconnectino is removed.
14-729 14 38 43 38 43 Horel and Wallace (no capital letters) [Martin Stendel, Denmark] corrected
14-730 14 38 46 38 47 Add: Ineson and Scaife, 2009 here - already in ref list. [Christopher Folland, United Kingdom of Great Britain & Northern Ireland]
This para is removed
14-731 14 38 49 39 2 Expansion of the warm pool and tropical convection - Hoyos and Webster (2011, Climate Dynamics) argue that the dynamic warm pool and associated convection are not moving eastward. [Jaclyn Brown, Australia]
Modified
14-732 14 38 53 38 53 Müller and Roeckner (with German "ü") in both references [Martin Stendel, Denmark] corrected
14-733 14 39 1 39 2 What is meant by “a substantial change in the zonal shift”? Change relative to what? Relative to those models that do produce more CP warming events? Or should “shift” be replaced by “position”? [Andreas Sterl, Netherlands]
Modified
14-734 14 39 4 Why not call this something less mysterious, like "Variations of El Nino patterns"? [Government of United States of America]
As we know, El Nino patterns keep changing, that is each and every El Nino pattern is differnet. However, these studies argued that this is not a simple change in the pattern but it is driven by the different physical processes. I think that is why they called it 'a different flavor of El Nino'. However, because of 'non concensus', this part is moved to supplementary.
14-735 14 39 6 39 10 The other names of different flavours of El Nino (and La Nina) should also be mentioned, e.g. Cold Tongue/Warm Pool, Modoki/Canonical and Central Pacific/Eastern Pacific. [Josephine Brown, Australia]
This part moved to supplementary. Different names are listed in the table of Supplementary.
14-736 14 39 6 39 20 This paragraph gives a nice account on the current debate on EP/CP. The rest of the text on ENSO in chap 14 should reflect more the associated uncertainties. [Eric Guilyardi, France]
This part is moved to supplementary material and uncertainties are addressed.
14-737 14 39 6 39 20 it would be worth citing Kumar et al. (2006, Science, see comment 1) here since they noted EOF1 of tropical Pacific SST to consist of an East Pacific-type ENSO mode, while EOF2 represents warming further west. [Andrew Turner, United Kingdom of Great Britain & Northern Ireland]
Cited and this part moved to supplementary
14-738 14 39 8 39 8 it should be "Stepaniak" [Annalisa Cherchi, Italy] Delected
14-739 14 39 8 39 8 Ask your Review Editor to spell his co-author's name! It is Stepaniak. It doesn't bode well getting references wrong and spelling author's names wrong. Loads of the references in this section go way, some many years before AR4. Why is this background needed. You are not writing a text book and not doing a review paper. [Phil Jones, United Kingdom of Great Britain & Northern Ireland]
Delected
14-740 14 39 8 39 8 Stepaniak [George Kiladis, United States of America] Deleted
14-741 14 39 8 Change Figure 14.24 into 14.23? [Erik Kjellström, Sweden] corrected
14-742 14 39 8 reference should probably be to Figure 14.23 rather than 14.24? [Thomas Stocker/ WGI TSU, Switzerland] corrected, but note that new figures are intorduced, while other have been deleted
14-743 14 39 8 "Trenberth and [St]epaniak" [Andrew Wittenberg, United States of America] Delected
14-744 14 39 10 39 10 Check whether the reference to 9.5.3.4.1 is relevant in this context that does not refer to model evaluation. [Markku Rummukainen, Sweden]
This part is moved to supplementary material and where ever needed cross referencing to other chapters is done.
14-745 14 39 11 "no basin-wide features" of what variable(s)? [Andrew Wittenberg, United States of America] This part moved to supplementary. Mentioned
Expert and Government Review Comments on the IPCC WGI AR5 Second Order Draft – Chapter 14
Do not Cite, Quote or Distribute Page 52 of 118
Comment No
Chapter
FromPage
FromLine
To Page
To Line Comment Response
14-746 14 39 11 "occurs rather episodically" -- what is meant here? less frequently? [Andrew Wittenberg, United States of America]
This part moved to supplementary. Meaning 'no clear cyclic feature'.
14-747 14 39 17 "part of a [continuous,] random distribution" [Andrew Wittenberg, United States of America] corrected
14-748 14 39 23 39 23 Table 14.1. Given the paragraph just above (14.4.4), I am not sure what this information brings to the report here. I believe less attention should be given to this EP/CP debate (which would help reduced the length of the ENSO section). IPCC is to provide an assessement, not to contribute to a debate by highlighting one side at the expense of the other. IPCC AR6 will be a better place to discuss this once the science is settled. [Eric Guilyardi, France]
This part moved to supplementary
14-749 14 39 23 Table 14.1 probably adds little to the assessment and could be left out. [Markku Rummukainen, Sweden] This part moved to supplementary.
14-750 14 39 23 Table 14.1: the header with the many acronyms etc. is hardly readable. We suggest to clean up the header to provide a short, concise introduction to the table; abbreviations used etc. and other details should be moved into a series of footnote [Thomas Stocker/ WGI TSU, Switzerland]
This part moved to supplementary
14-751 14 39 25 misplaced figure -- Figure 14.24 should appear on the next page. [Andrew Wittenberg, United States of America]
corrected
14-752 14 39 26 39 32 Misplaced figure 14.24 [Eric Guilyardi, France] corrected
14-753 14 39 34 39 44 it is surprising there is not mention of Kumar et al. (2006, Science, see comment 1) who noted differing impacts on Indian monsoon rainfall depending on the position of ENSO. This is borne out in observations, with 1997 being a rather normal monsoon and all of 2002, 2004, 2009 being weak monsoons based on central Pacific El Nino. [Andrew Turner, United Kingdom of Great Britain & Northern Ireland]
This part moved to suplementary and cited.
14-754 14 39 34 Acronym "CP El Nino" does not need to be defined here, as it is defined in the preceding paragraph. [Adrian Simmons, United Kingdom]
Modified
14-755 14 39 34 "different [from] those of" [Andrew Wittenberg, United States of America] Modified
14-756 14 39 46 39 47 the use of “possibly” here seems over-conservative. It seems obvious to me that if one changes the longitudinal position of diabatic heating anomalies on the equator then one will alter teleconnections (cite Turner et al., 2005, The role of the basic state in the ENSO-Monsoon relationship and implications for predictability Turner, A.G., P.M. Inness and J.M. Slingo, Q. J. R. Meteorol. Soc. 131: 781-804; and Annamalai et al., 2007, already in reference list). [Andrew Turner, United Kingdom of Great Britain & Northern Ireland]
Modified
14-757 14 39 56 "under global warming" --> "under a warming climate"? [Thomas Stocker/ WGI TSU, Switzerland] changed
14-758 14 40 11 put reference to chapter 5: section 5.4.1 [Maisa Rojas, Chile] This part is removed
14-759 14 40 20 40 20 "...and ice cores from tropical mountain glaciers (Vecchi and Wittenberg, 2010) as well as Antarctic ice cores." Antarctic records show ENSO links - if citations are needed, there is Vance et al., 2012 as well as Meyerson, E.A., Mayewski, P.A., Whitlow, S.I., Meeker, L.D.and Kreutz, K.J. and Twickler, M.S., 2002, The extratropical expression of ENSO recorded in a South Pole glaciochemical time series, Annals of Glaciology 35, 430-436. [Government of Australia]
This part is delected
14-760 14 40 20 40 20 "...and ice cores from tropical mountain glaciers (Vecchi and Wittenberg, 2010) as well as Antarctic ice cores." Antarctic records show ENSO links - if citations are needed, there is Vance et al., 2012 as well as Meyerson, E.A., Mayewski, P.A., Whitlow, S.I., Meeker, L.D.and Kreutz, K.J. and Twickler, M.S., 2002, The extratropical expression of ENSO recorded in a South Pole glaciochemical time series, Annals of Glaciology 35, 430-436. [Tasman van Ommen, Australia]
This part is delected
14-761 14 40 27 40 27 The following reference also made the point that the atmosphere feedbacks were uncertain: Lloyd J., E. Guilyardi, H. Weller, (2012). The Role of Atmosphere Feedbacks During ENSO in the CMIP3 Models. Part III: The Shortwave Flux Feedback. J. Clim., 25, 4275-4293 [Eric Guilyardi, France]
This sentence is more relevant to the observation.
14-762 14 40 28 40 29 This sentence is not needed. It is covered in Ch 5. Refer to that and don't repeat. Also that Chapter is looking at the proxy series. [Phil Jones, United Kingdom of Great Britain & Northern Ireland]
This part is modified
Expert and Government Review Comments on the IPCC WGI AR5 Second Order Draft – Chapter 14
Do not Cite, Quote or Distribute Page 53 of 118
Comment No
Chapter
FromPage
FromLine
To Page
To Line Comment Response
14-763 14 40 28 40 29 put reference to chapter 5: section 5.4.1 [Maisa Rojas, Chile] cited.
14-764 14 40 31 40 34 Recent studies revealed that the westerly wind bursts that affect the El Nino development are not stochastic but occur in condition prepared by ENSO itself. Climate models which show such interaction tend to perform better in ENSO. I suggest including some sentences as follows, after the lines specified. 'An examination of 18 CMIP3 models shows that models with realistic occurrences of strong equatorial westerly wind bursts preceding the El Nino events have high performances with ENSO occurrences (Seiki et al. 2011), consistent with their close interaction found in the real world (Eisenman et al. 2005, Seiki and Takayabu, 2007).' Corresponding references are as follows. Eisenman, I., L. Yu, and E. Tziperman, 2005. Westerly wind bursts: ENSO’s tail rather than a dog?, J. Clim., 18, 5224-5238. Seiki, A. and Y. N. Takayabu 2007. Westerly wind bursts and their relationship with intraseasonal variations and ENSO. Part I: Statistics. Mon. Wea. Rev., 135, 3325-3345. Seiki, A., Y. N. Takayabu, T. Yasuda, N. Sato, C. Takahashi, K. Yoneyama, and R. Shirooka, 2011. Westerly wind bursts and their relationship with ENSO in CMIP3 models. J. Geophys. Res., 116, D03303. [Yukari Takayabu, Japan]
This part has been shortened so we cannot include this.In addition, we want to emphasize future projections more than understanding ENSO or discuss observed variability
14-765 14 40 32 40 34 distinct ENSO regimes were also shown in Turner et al. (2007b, The effect of doubled CO2 and model basic state biases on the monsoon-ENSO system. II: Changing ENSO regimes. Turner, A.G., P.M. Inness and J.M. Slingo (2007) Q. J. R. Meteorol. Soc. 133: 1159-1173, DOI: 10.1002/qj.83) with severe impacts on rainfall predictability. [Andrew Turner, United Kingdom of Great Britain & Northern Ireland]
This part has been shorten so we cannot include this.
14-766 14 40 37 reference should probably be to Figure 14.24 rather than 14.25? [Thomas Stocker/ WGI TSU, Switzerland] correctly revised
14-767 14 40 37 reference should be to Fig. 14.24, not 14.25. [Andrew Wittenberg, United States of America] correctly revised
14-768 14 40 42 Insert Fig. 14.24 here, not Fig. 14.25. [Andrew Wittenberg, United States of America] correctly revised
14-769 14 40 47 26 the section about NAO needs a summary paragraph. Reference of paleo evidence is also missing (section 5.4.2) [Maisa Rojas, Chile]
This section deals with ENSO not NAO
14-770 14 41 5 41 5 Also cite Collins et al. (2010) op cit. [Eric Guilyardi, France] cited
14-771 14 41 5 41 7 Needs revision. [Markku Rummukainen, Sweden] revised
14-772 14 41 14 "pattern [within] the instrumental record" [Andrew Wittenberg, United States of America] corrected
14-773 14 41 15 41 15 Replace "constant radiative forcing" with "unforced pre-industrial" as the former implies no seasonal cycle etc. [Josephine Brown, Australia]
Deleted
14-774 14 41 15 41 16 If an attribution statement is needed here, probably good to refer to Section 10.3.3, as approriate. [Markku Rummukainen, Sweden]
referred
14-775 14 41 19 "ENSO will remain[] the dominant" [Andrew Wittenberg, United States of America] corrected
14-776 14 41 20 41 22 This point is unclear. Isn't the problem that models all have different projected future changes?? (As well as the large natural variability in ENSO variance and spatial patterns). [Josephine Brown, Australia]
It does mean that the in most models, the projected ENSO change is within the natural modulaiton range. This is now better formulated
14-777 14 41 21 41 21 If a change is projected, it would logically have a driver. Or does the result not display change but simulated variability? [Markku Rummukainen, Sweden]
There is a change between 20C and 21C but that change is within natural modulation range.
14-778 14 41 21 "to tell with confidence" -- could this be expressed in terms of the confidence levels defined in the Uncertainty Guidance note [Thomas Stocker/ WGI TSU, Switzerland]
carefully re-considered/Modified
14-779 14 41 23 41 24 This assessment of an eastward shift seems overly optimistic since it is only based on model projections and not well supported by observations. The speculation would be better catagorized as one with 'medium to low
Modified/We agree but this confidence is about the future change so based on the models.
Expert and Government Review Comments on the IPCC WGI AR5 Second Order Draft – Chapter 14
Do not Cite, Quote or Distribute Page 54 of 118
Comment No
Chapter
FromPage
FromLine
To Page
To Line Comment Response
confidence'. [Government of United States of America]
14-780 14 41 26 41 28 I'm not sure I really agree that there is a likely shift towards more CP El Ninos, even if this is caveated with a medium confidence statement. I still don't think that models adequately represent the full spectrum of modes and many have a bias towards CP events in their baseline simulations. It is more like this is a possibility and I would be uncomfortable about attaching a likelihood [Matthew Collins, United Kingdom of Great Britain & Northern Ireland]
this statement is having 'low confidence' and also to avoid CP/EP argument, the statement is modified. Since we are not sure this change is due to anthropogenic forcing, the global warming is changed to 'climate warming'.
14-781 14 41 26 41 28 Given the debate as to whether or not the CP El Nino is differentiated from 'normal' El Nino, the authors should make sure that the statement, particularly the confidence statement, is consistent with the previous discussion (p. 39-40). Cross reference with Chapter 2. [Government of United States of America]
this statement is having 'low confidence' and also to avoid CP/EP argument, the statement is modified. Since we are not sure this change is due to anthropogenic forcing, the global warming is changed to 'climate warming'.
14-782 14 41 26 41 28 Again, I am not sure this should be in the summary. If it has to stay there, I would put "low confidence" as we have no scientific understanding and add that "there is an unsettled debate on the very existence of the proposed CP/EP distinction". [Eric Guilyardi, France]
this statement is having 'low confidence' and also to avoid CP/EP argument, the statement is modified. Since we are not sure this change is due to anthropogenic forcing, the global warming is changed to 'climate warming'.
14-783 14 41 26 41 28 After reviewing the section, I don't think this assessment is justified: "There is medium confidence that • The intensity of central Pacific warming (CP El Niño) is likely to increase with increased greenhouse warming." Although the text and chain of logic is hard to follow, this seems to be based on a study looking at a selection of seven models. This finding needs some further scrutiny. Also I think the executive summary of Ch. 14 says that the confidence is low on this assessment (Ch. 14, p. 4, line 28-29) [Thomas Knutson, United States of America]
this statement is having 'low confidence' and also to avoid CP/EP argument, the statement is modified. Since we are not sure this change is due to anthropogenic forcing, the global warming is changed to 'climate warming'.
14-784 14 41 27 41 28 There seems to be a contradiction here that needs to be clarified. Above on lines 20-22 you state that due to natural variability it is not possible to tell with confidence if projected changes in ENSO in the 21st century will be influenced by anthropogenic forcing. Yet here you now provide a strong likelihood statement that the intensity of CP El Nino will increase with greenhouse warming. [Thomas Stocker/ WGI TSU, Switzerland]
this statement is having 'low confidence' and also to avoid CP/EP argument, the statement is modified. Since we are not sure this change is due to anthropogenic forcing, the global warming is changed to 'climate warming'.
14-785 14 41 30 47 15 This "Box" is a dreadfully long and unstructured read. It definitely needs more structure, for example by creating subsections within the box. [Christian Reuten, Canada]
Accepted. The Box has now been restructured as a formal section with defined subsections and about half of the material has been moved into the Supplemental Material .
14-786 14 41 30 47 15 Box 14.2 is extremely long compared with the boxes included in other chapters,and includes detailed assessment of the literature and conclusions therefrom. It should be cut to a page or so of generally accessible text, with the remainder of the material recast as a standard section of the chapter. [Adrian Simmons, United Kingdom]
Accepted. The Box has now been restructured as a formal section with defined subsections and about half of the material has been moved into the Supplemental Material .
14-787 14 41 32 Box 14.2 is several pages long, even before the figures are inserted. Suggest rethinking the format and/or level of detail. [Government of Canada]
Accepted. The Box has now been restructured as a formal section with defined subsections and about half of the material has been moved into the Supplemental Material .
14-788 14 41 32 Box 14.2 does seem quite extensive and streamlining of its contents could increase its readability. [Markku Rummukainen, Sweden]
Accepted. The Box has now been restructured as a formal section with defined subsections and about half of the material has been moved into the Supplemental Material .
14-789 14 41 32 consider adding "subheadings" to Box 14.2 Tropical Cyclones to help provide some more structure. [Thomas Stocker/ WGI TSU, Switzerland]
Accepted. The Box has now been restructured as a formal section with defined subsections and about half of the material has been moved into the Supplemental Material .
Expert and Government Review Comments on the IPCC WGI AR5 Second Order Draft – Chapter 14
Do not Cite, Quote or Distribute Page 55 of 118
Comment No
Chapter
FromPage
FromLine
To Page
To Line Comment Response
14-790 14 41 34 46 33 Some clarification about what future aspects of tropical cyclone activity are controlled by changes in potential intensity is in order. How does change in PI affect cyclogenesis? How about the projected change in intensity of the strongest storms? How mid-Atlantic decreases in PI affect storm tracks? Conversely, how might coastal increases in PI affect landfall? [Government of United States of America]
Rejected. This is a reasonable comment, but we feel that these topics are already adequately covered. The relationship between increasing PI and the strengthening of the strongest storms (both observed and projected) is discussed in numerous places throughout. Genesis is mentioned briefly on page 42, line 10, and then in a more physical framework in terms of the relationship to mass-flux, on page 45, line 9. Potential intensity is theoretically linked to intensity. For genesis, it serves as a proxy metric and is often lnked to genesis via a statistical model. Similarly, using PI to describe track variability is difficult to physically support. We feel that physically based discussions of genesis and track may be less confusing if done directly and not through a metric that is theoretically based on intensity.
14-791 14 41 34 46 33 This section is the longest of all. Why is there a need to go over so much older material. Much of this was covered in AR4. There seems intent here to refer to every paper written on the subject. This is not the aim of an IPCC Assessment. There are some good points made in these pages, but they get lost in the volume that has been written. Also this section and some others have numerous English mistakes and are not that well written. . [Phil Jones, United Kingdom of Great Britain & Northern Ireland]
Accepted in part. We have restructured the text into a formal section with subsections and have moved about half of the content into the Supplementary Material so that its length is more appropriate and the main points are less easily lost. We do not feel that that there is an over abundance of material repeated from the AR4, and we have made every attempt to provide a minimal amout of remedial information to the reader. We also feel that this is far from a literature review, and suggest that the reviewer may not be aware of the volume of post-AR4 literature on the topic. We have made every attempt to synthesize and assess this volume of literature while maintaining an appropriate number of formal citations, and we feel that this entirely congruent with the aim of this report. English mistakes will be handled at the editorial level.
14-792 14 41 49 42 11 Please include the findings of the following studies on the possible influence of climate change on the shift of tropical cyclone track and formation location over the western North Pacific. References : - Wang, R. F., L.G. Wu and C. Wang, 2011: Typhoon Track Changes Associated with Global Warming, J. Climate, doi: 10.1175/JCLI-D-11-00074.1. - Tu, Jien-Yi, Chia Chou, Pao-Shin Chu, 2009: The Abrupt Shift of Typhoon Activity in the Vicinity of Taiwan and Its Association with Western North Pacific–East Asian Climate Change. J. Climate, 22, 3617–3628. doi: 10.1175/2009JCLI2411.1. - Wu, L.G. and B. Wang, 2004 : Assessing impacts of global warming on tropical cyclone tracks, Journal of Climate, 17, p1686-1698. [Sai Ming Lee, Hong Kong, China]
Accepted in part. The Tu et al reference is already included, and Wu and Wang is pre-AR4. We have added the 2011 Wang et al reference with brief text.
14-793 14 41 52 41 57 "...This variability is driven largely by random fluctuations in atmospheric steering currents, but also is observed across a broad range of time-scales in response to more systematic modes of climate variability such as the El Niño – Southern Oscillation (ENSO), Pacific Decadal Oscillation, North Atlantic Oscillation, Atlantic Meridional Mode, and Madden-Julian Oscillation (Camargo et al., 2008; Camargo et al., 2007; Chand and Walsh, 2009; Chu et al., 2012; Ho et al., 2004; Kossin et al., 2010; Tu et al., 2009; Wang et al., 2010a; Wu et al., 2005). The NPO has also impact on the tropical cyclone, which should also be included here. Thus the above sentence is change to "...This variability is driven largely by random fluctuations in atmospheric steering currents, but also is observed across a broad range of time-scales in response to more systematic modes of climate variability such as the El Niño – Southern Oscillation (ENSO), Pacific Decadal Oscillation, North Atlantic Oscillation, Atlantic Meridional Mode, North Pacific Oscillation, and Madden-Julian Oscillation (Camargo et al., 2008; Camargo et al., 2007; Chand and Walsh, 2009; Chu et al., 2012; Ho et al., 2004;
Accepted. The suggested citation and text has been added.
Expert and Government Review Comments on the IPCC WGI AR5 Second Order Draft – Chapter 14
Do not Cite, Quote or Distribute Page 56 of 118
Comment No
Chapter
FromPage
FromLine
To Page
To Line Comment Response
Kossin et al., 2010; Tu et al., 2009; Wang et al., 2010a; Wu et al., 2005; Wang et al., 2007; Wang and Fan, 2005)." Reference: Wang, H. J., J. Q. Sun,K. Fan, 2007: Relationships between the North Pacific Oscillation and the typhoon/hurricane frequencies, Science in China (D): Earth Science, 50, 1409-1416. [Jianqi Sun, China]
14-794 14 42 2 42 2 The Philippines are by no measure small islands! [Martin Stendel, Denmark] Accepted. Replaced "small" with "particular group of".
14-795 14 42 5 42 8 The inferences on impacts on ecosystems and disaster and mitigation planning may not be needed here. [Markku Rummukainen, Sweden]
Noted. We feel that a periodic brief mention in an appropriate context is helpful to the reader. But throughout the chapter WG-II related issues have been removed as these are less relevant to WG-I
14-796 14 42 13 42 53 We have constructed a homogeneous record of hurricane surge threat since 1923. This is basically a measure of atlantic tropical cyclone activity based on tide gauge data. In this we see a significant rising trend. Please add this paper to the discussion in this paragraph. Aslak Grinsted, John C. Moore, and Svetlana Jevrejeva (2012), Homogeneous record of Atlantic hurricane surge threat since 1923, PNAS, doi:10.1073/pnas.1209542109 [Aslak Grinsted, Denmark]
Accepted. The paper and accompanying explanatory text has been added. Most of this section is now in the Supplemental Material.
14-797 14 42 13 42 53 Please include the assessment results by the UN ESCAP/WMO Typhoon Committee Expert Team on the impacts of tropical cyclone (TC) activity in the western North Pacific basin with a focus on the possible changes in TC track and impact areas, including landfalling statistics/trends (Lee et al., 2012a). For long term observations, the assessment found that, with considerable interannual and interdecadal variations in the TC activity in this basin, it remains uncertain whether there has been any detectable human influence on TC activities in the region. Observations also indicate some regional shifts in TC activity in the basin, such as a decreasing trend in TC occurrence in part of the South China Sea and an increasing trend along the east coast of China during the past 40 years. This change is apparently related to local circulation changes in the eastern Asia and western North Pacific, though the cause of the circulation changes is still a subject of further research. The assessment also provided latest information on the TC landfalling frequency trend of a number of Members of the Typhoon Committee, including China, Japan, Hong Kong, Korea Peninsula, the Philippines, Thailand, and Macao. [Sai Ming Lee, Hong Kong, China]
Accepted. The reference has been added.
14-798 14 42 13 42 53 Moreover, the recent study by Lee et al. (2012b) examines the long-term variations of TC frequency and intensity in the South China Sea and the vicinity of Hong Kong from 1961 to 2010 based on the best track data of four main weather agencies in the western North Pacific. The results show that, for the long-term trend, all datasets depict a decrease in the TC frequency in the South China Sea and the vicinity of Hong Kong during the study period, but the trend is not statistically significant at 5% level for most of the datasets. References :- Lee, T. C., T. R. Knutson, H. Kamahori, and, M. Ying, 2012a: Impacts of Climate Change on Tropical Cyclones in the Western North Pacific Basin. Part I : Past Observations. Tropical Cyclone Res. Rev. 1, 213-230. http://tcrr.typhoon.gov.cn/EN/abstract/abstract30.shtml - Lee T. C., Y. Y. Leung, M. H. Kok and H.S. Chan, 2012b: The long term variations of tropical cyclone activity in the South China Sea and the vicinity of Hong Kong. Tropical Cyclone Res. Rev. 2012, 1(3): 277-292 http://tcrr.typhoon.gov.cn/EN/abstract/abstract20.shtml [Sai Ming Lee, Hong Kong, China]
Noted, thank you.
14-799 14 42 13 The recent PNAS paper by Grinstead et al (2012) details landfalling Atlantic hurricanes by examining tidal gauge records. This independent data source indicates a detectible increase in intense hurricanes and this late breaking paper should be assessed in this section. see www.pnas.org/cgi/doi/10.1073/pnas.1209542109 [Government of United States of America]
Accepted. The citation has been added and has been assessed and discussed. Most of this section is now in the Supplemental Material.
14-800 14 42 32 42 34 The authors might want to explain what the "different physical characteristics" are. [Government of United States of America]
Rejected. This comment appears to be directed somewhere else. There is no discussion of "different physical characteristics" here and we are assuming that the reviewer is referring to some other section or chapter.
14-801 14 42 45 42 45 please avoid the ambiguous term of 'global warming', and be more explicit. 'global warming' in common usage Accepted. This is the specific term used by the cited
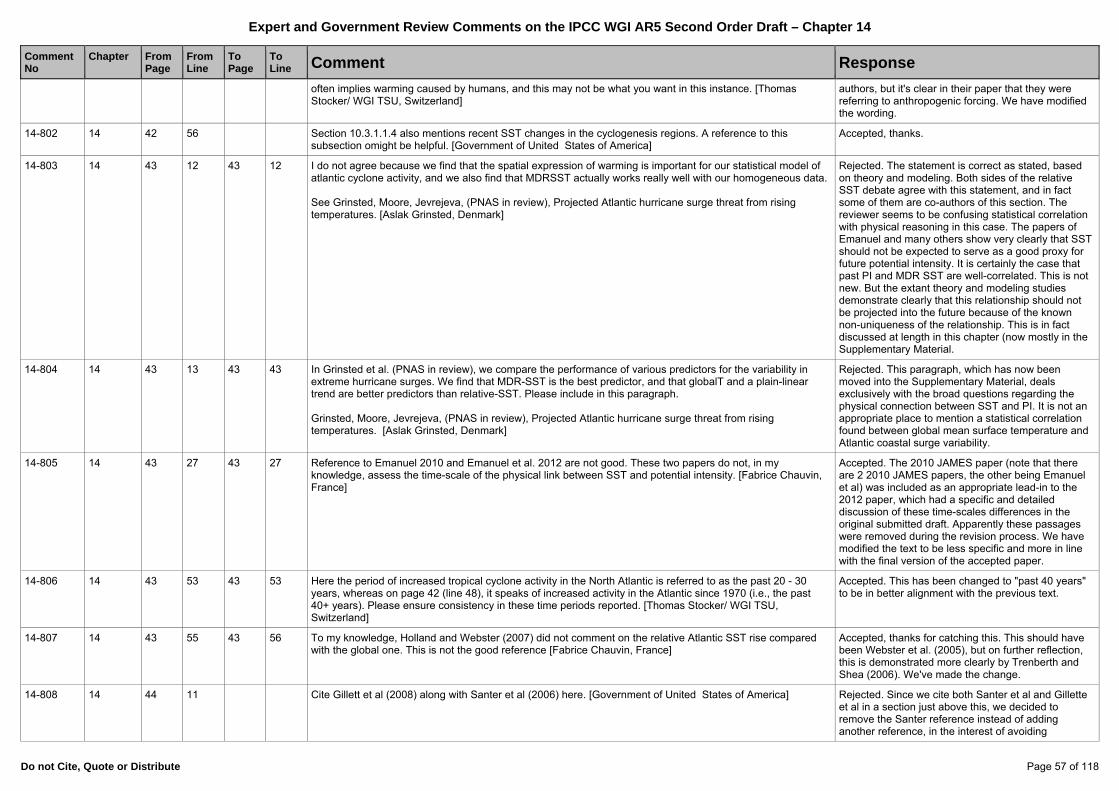
Expert and Government Review Comments on the IPCC WGI AR5 Second Order Draft – Chapter 14
Do not Cite, Quote or Distribute Page 57 of 118
Comment No
Chapter
FromPage
FromLine
To Page
To Line Comment Response
often implies warming caused by humans, and this may not be what you want in this instance. [Thomas Stocker/ WGI TSU, Switzerland]
authors, but it's clear in their paper that they were referring to anthropogenic forcing. We have modified the wording.
14-802 14 42 56 Section 10.3.1.1.4 also mentions recent SST changes in the cyclogenesis regions. A reference to this subsection omight be helpful. [Government of United States of America]
Accepted, thanks.
14-803 14 43 12 43 12 I do not agree because we find that the spatial expression of warming is important for our statistical model of atlantic cyclone activity, and we also find that MDRSST actually works really well with our homogeneous data. See Grinsted, Moore, Jevrejeva, (PNAS in review), Projected Atlantic hurricane surge threat from rising temperatures. [Aslak Grinsted, Denmark]
Rejected. The statement is correct as stated, based on theory and modeling. Both sides of the relative SST debate agree with this statement, and in fact some of them are co-authors of this section. The reviewer seems to be confusing statistical correlation with physical reasoning in this case. The papers of Emanuel and many others show very clearly that SST should not be expected to serve as a good proxy for future potential intensity. It is certainly the case that past PI and MDR SST are well-correlated. This is not new. But the extant theory and modeling studies demonstrate clearly that this relationship should not be projected into the future because of the known non-uniqueness of the relationship. This is in fact discussed at length in this chapter (now mostly in the Supplementary Material.
14-804 14 43 13 43 43 In Grinsted et al. (PNAS in review), we compare the performance of various predictors for the variability in extreme hurricane surges. We find that MDR-SST is the best predictor, and that globalT and a plain-linear trend are better predictors than relative-SST. Please include in this paragraph. Grinsted, Moore, Jevrejeva, (PNAS in review), Projected Atlantic hurricane surge threat from rising temperatures. [Aslak Grinsted, Denmark]
Rejected. This paragraph, which has now been moved into the Supplementary Material, deals exclusively with the broad questions regarding the physical connection between SST and PI. It is not an appropriate place to mention a statistical correlation found between global mean surface temperature and Atlantic coastal surge variability.
14-805 14 43 27 43 27 Reference to Emanuel 2010 and Emanuel et al. 2012 are not good. These two papers do not, in my knowledge, assess the time-scale of the physical link between SST and potential intensity. [Fabrice Chauvin, France]
Accepted. The 2010 JAMES paper (note that there are 2 2010 JAMES papers, the other being Emanuel et al) was included as an appropriate lead-in to the 2012 paper, which had a specific and detailed discussion of these time-scales differences in the original submitted draft. Apparently these passages were removed during the revision process. We have modified the text to be less specific and more in line with the final version of the accepted paper.
14-806 14 43 53 43 53 Here the period of increased tropical cyclone activity in the North Atlantic is referred to as the past 20 - 30 years, whereas on page 42 (line 48), it speaks of increased activity in the Atlantic since 1970 (i.e., the past 40+ years). Please ensure consistency in these time periods reported. [Thomas Stocker/ WGI TSU, Switzerland]
Accepted. This has been changed to "past 40 years" to be in better alignment with the previous text.
14-807 14 43 55 43 56 To my knowledge, Holland and Webster (2007) did not comment on the relative Atlantic SST rise compared with the global one. This is not the good reference [Fabrice Chauvin, France]
Accepted, thanks for catching this. This should have been Webster et al. (2005), but on further reflection, this is demonstrated more clearly by Trenberth and Shea (2006). We've made the change.
14-808 14 44 11 Cite Gillett et al (2008) along with Santer et al (2006) here. [Government of United States of America] Rejected. Since we cite both Santer et al and Gillette et al in a section just above this, we decided to remove the Santer reference instead of adding another reference, in the interest of avoiding
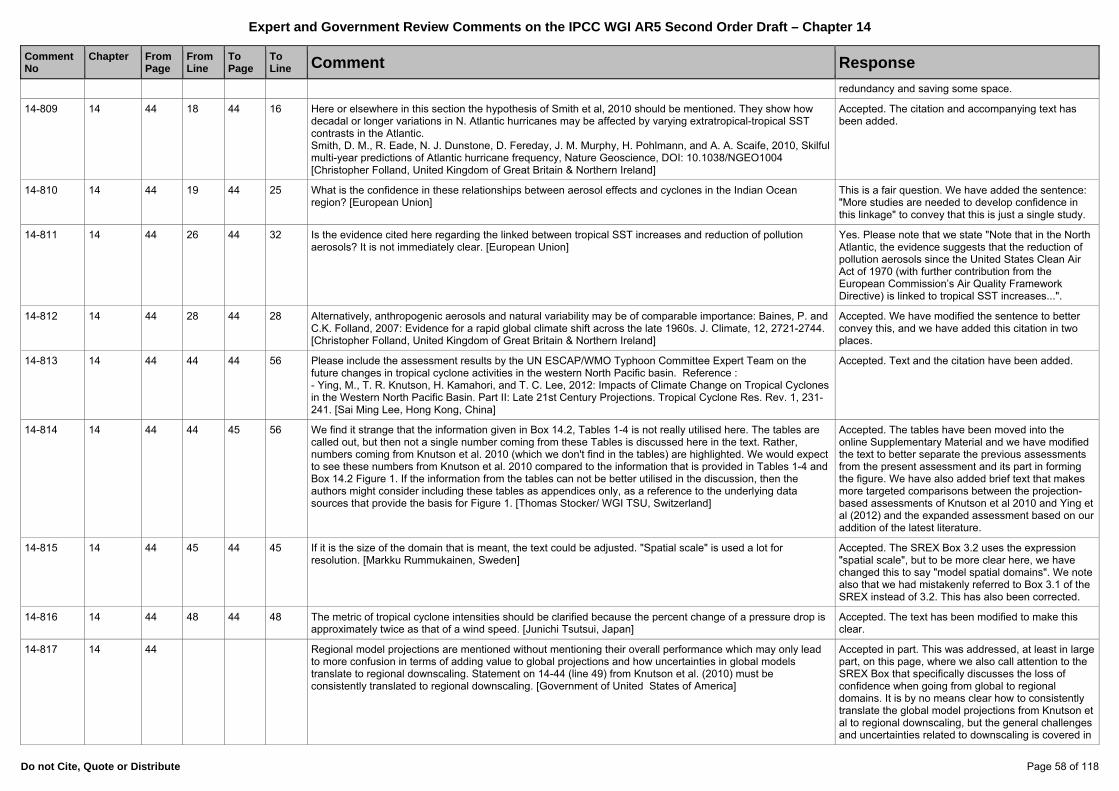
Expert and Government Review Comments on the IPCC WGI AR5 Second Order Draft – Chapter 14
Do not Cite, Quote or Distribute Page 58 of 118
Comment No
Chapter
FromPage
FromLine
To Page
To Line Comment Response
redundancy and saving some space.
14-809 14 44 18 44 16 Here or elsewhere in this section the hypothesis of Smith et al, 2010 should be mentioned. They show how decadal or longer variations in N. Atlantic hurricanes may be affected by varying extratropical-tropical SST contrasts in the Atlantic. Smith, D. M., R. Eade, N. J. Dunstone, D. Fereday, J. M. Murphy, H. Pohlmann, and A. A. Scaife, 2010, Skilful multi-year predictions of Atlantic hurricane frequency, Nature Geoscience, DOI: 10.1038/NGEO1004 [Christopher Folland, United Kingdom of Great Britain & Northern Ireland]
Accepted. The citation and accompanying text has been added.
14-810 14 44 19 44 25 What is the confidence in these relationships between aerosol effects and cyclones in the Indian Ocean region? [European Union]
This is a fair question. We have added the sentence: "More studies are needed to develop confidence in this linkage" to convey that this is just a single study.
14-811 14 44 26 44 32 Is the evidence cited here regarding the linked between tropical SST increases and reduction of pollution aerosols? It is not immediately clear. [European Union]
Yes. Please note that we state "Note that in the North Atlantic, the evidence suggests that the reduction of pollution aerosols since the United States Clean Air Act of 1970 (with further contribution from the European Commission’s Air Quality Framework Directive) is linked to tropical SST increases...".
14-812 14 44 28 44 28 Alternatively, anthropogenic aerosols and natural variability may be of comparable importance: Baines, P. and C.K. Folland, 2007: Evidence for a rapid global climate shift across the late 1960s. J. Climate, 12, 2721-2744. [Christopher Folland, United Kingdom of Great Britain & Northern Ireland]
Accepted. We have modified the sentence to better convey this, and we have added this citation in two places.
14-813 14 44 44 44 56 Please include the assessment results by the UN ESCAP/WMO Typhoon Committee Expert Team on the future changes in tropical cyclone activities in the western North Pacific basin. Reference : - Ying, M., T. R. Knutson, H. Kamahori, and T. C. Lee, 2012: Impacts of Climate Change on Tropical Cyclones in the Western North Pacific Basin. Part II: Late 21st Century Projections. Tropical Cyclone Res. Rev. 1, 231-241. [Sai Ming Lee, Hong Kong, China]
Accepted. Text and the citation have been added.
14-814 14 44 44 45 56 We find it strange that the information given in Box 14.2, Tables 1-4 is not really utilised here. The tables are called out, but then not a single number coming from these Tables is discussed here in the text. Rather, numbers coming from Knutson et al. 2010 (which we don't find in the tables) are highlighted. We would expect to see these numbers from Knutson et al. 2010 compared to the information that is provided in Tables 1-4 and Box 14.2 Figure 1. If the information from the tables can not be better utilised in the discussion, then the authors might consider including these tables as appendices only, as a reference to the underlying data sources that provide the basis for Figure 1. [Thomas Stocker/ WGI TSU, Switzerland]
Accepted. The tables have been moved into the online Supplementary Material and we have modified the text to better separate the previous assessments from the present assessment and its part in forming the figure. We have also added brief text that makes more targeted comparisons between the projection-based assessments of Knutson et al 2010 and Ying et al (2012) and the expanded assessment based on our addition of the latest literature.
14-815 14 44 45 44 45 If it is the size of the domain that is meant, the text could be adjusted. "Spatial scale" is used a lot for resolution. [Markku Rummukainen, Sweden]
Accepted. The SREX Box 3.2 uses the expression "spatial scale", but to be more clear here, we have changed this to say "model spatial domains". We note also that we had mistakenly referred to Box 3.1 of the SREX instead of 3.2. This has also been corrected.
14-816 14 44 48 44 48 The metric of tropical cyclone intensities should be clarified because the percent change of a pressure drop is approximately twice as that of a wind speed. [Junichi Tsutsui, Japan]
Accepted. The text has been modified to make this clear.
14-817 14 44 Regional model projections are mentioned without mentioning their overall performance which may only lead to more confusion in terms of adding value to global projections and how uncertainties in global models translate to regional downscaling. Statement on 14-44 (line 49) from Knutson et al. (2010) must be consistently translated to regional downscaling. [Government of United States of America]
Accepted in part. This was addressed, at least in large part, on this page, where we also call attention to the SREX Box that specifically discusses the loss of confidence when going from global to regional domains. It is by no means clear how to consistently translate the global model projections from Knutson et al to regional downscaling, but the general challenges and uncertainties related to downscaling is covered in
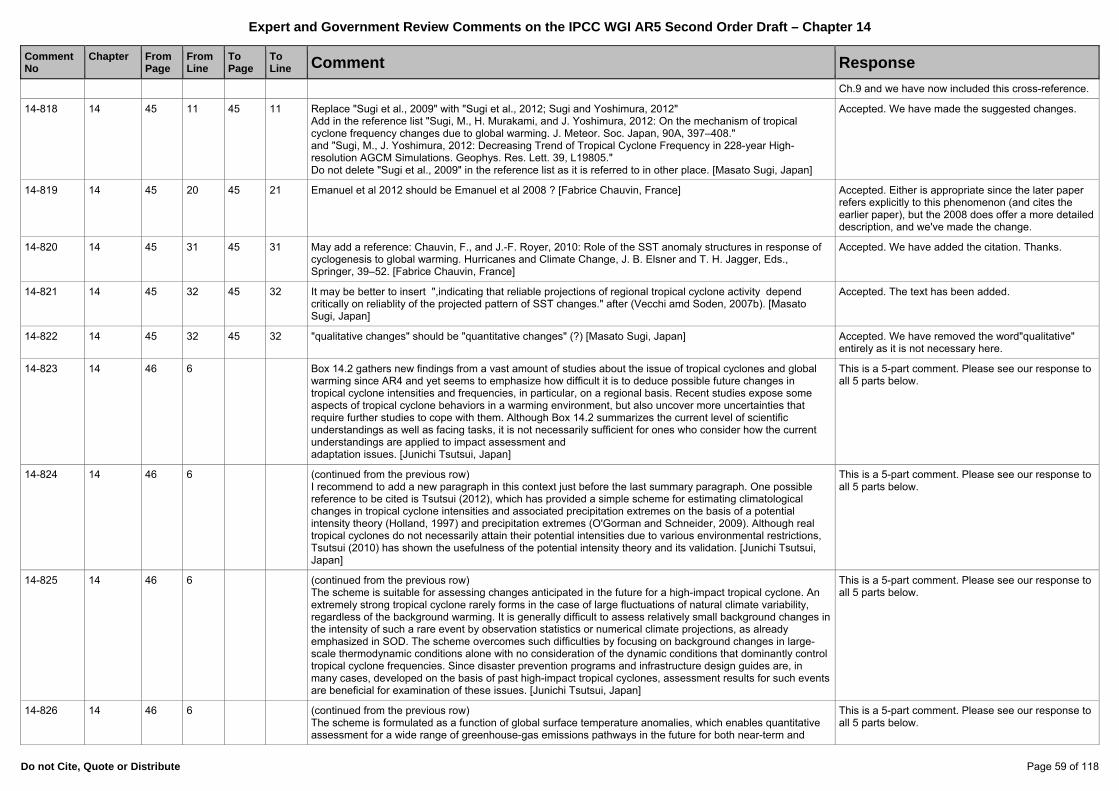
Expert and Government Review Comments on the IPCC WGI AR5 Second Order Draft – Chapter 14
Do not Cite, Quote or Distribute Page 59 of 118
Comment No
Chapter
FromPage
FromLine
To Page
To Line Comment Response
Ch.9 and we have now included this cross-reference.
14-818 14 45 11 45 11 Replace "Sugi et al., 2009" with "Sugi et al., 2012; Sugi and Yoshimura, 2012" Add in the reference list "Sugi, M., H. Murakami, and J. Yoshimura, 2012: On the mechanism of tropical cyclone frequency changes due to global warming. J. Meteor. Soc. Japan, 90A, 397–408." and "Sugi, M., J. Yoshimura, 2012: Decreasing Trend of Tropical Cyclone Frequency in 228-year High-resolution AGCM Simulations. Geophys. Res. Lett. 39, L19805." Do not delete "Sugi et al., 2009" in the reference list as it is referred to in other place. [Masato Sugi, Japan]
Accepted. We have made the suggested changes.
14-819 14 45 20 45 21 Emanuel et al 2012 should be Emanuel et al 2008 ? [Fabrice Chauvin, France] Accepted. Either is appropriate since the later paper refers explicitly to this phenomenon (and cites the earlier paper), but the 2008 does offer a more detailed description, and we've made the change.
14-820 14 45 31 45 31 May add a reference: Chauvin, F., and J.-F. Royer, 2010: Role of the SST anomaly structures in response of cyclogenesis to global warming. Hurricanes and Climate Change, J. B. Elsner and T. H. Jagger, Eds., Springer, 39–52. [Fabrice Chauvin, France]
Accepted. We have added the citation. Thanks.
14-821 14 45 32 45 32 It may be better to insert ",indicating that reliable projections of regional tropical cyclone activity depend critically on reliablity of the projected pattern of SST changes." after (Vecchi amd Soden, 2007b). [Masato Sugi, Japan]
Accepted. The text has been added.
14-822 14 45 32 45 32 "qualitative changes" should be "quantitative changes" (?) [Masato Sugi, Japan] Accepted. We have removed the word"qualitative" entirely as it is not necessary here.
14-823 14 46 6 Box 14.2 gathers new findings from a vast amount of studies about the issue of tropical cyclones and global warming since AR4 and yet seems to emphasize how difficult it is to deduce possible future changes in tropical cyclone intensities and frequencies, in particular, on a regional basis. Recent studies expose some aspects of tropical cyclone behaviors in a warming environment, but also uncover more uncertainties that require further studies to cope with them. Although Box 14.2 summarizes the current level of scientific understandings as well as facing tasks, it is not necessarily sufficient for ones who consider how the current understandings are applied to impact assessment and adaptation issues. [Junichi Tsutsui, Japan]
This is a 5-part comment. Please see our response to all 5 parts below.
14-824 14 46 6 (continued from the previous row) I recommend to add a new paragraph in this context just before the last summary paragraph. One possible reference to be cited is Tsutsui (2012), which has provided a simple scheme for estimating climatological changes in tropical cyclone intensities and associated precipitation extremes on the basis of a potential intensity theory (Holland, 1997) and precipitation extremes (O'Gorman and Schneider, 2009). Although real tropical cyclones do not necessarily attain their potential intensities due to various environmental restrictions, Tsutsui (2010) has shown the usefulness of the potential intensity theory and its validation. [Junichi Tsutsui, Japan]
This is a 5-part comment. Please see our response to all 5 parts below.
14-825 14 46 6 (continued from the previous row) The scheme is suitable for assessing changes anticipated in the future for a high-impact tropical cyclone. An extremely strong tropical cyclone rarely forms in the case of large fluctuations of natural climate variability, regardless of the background warming. It is generally difficult to assess relatively small background changes in the intensity of such a rare event by observation statistics or numerical climate projections, as already emphasized in SOD. The scheme overcomes such difficulties by focusing on background changes in large-scale thermodynamic conditions alone with no consideration of the dynamic conditions that dominantly control tropical cyclone frequencies. Since disaster prevention programs and infrastructure design guides are, in many cases, developed on the basis of past high-impact tropical cyclones, assessment results for such events are beneficial for examination of these issues. [Junichi Tsutsui, Japan]
This is a 5-part comment. Please see our response to all 5 parts below.
14-826 14 46 6 (continued from the previous row) The scheme is formulated as a function of global surface temperature anomalies, which enables quantitative assessment for a wide range of greenhouse-gas emissions pathways in the future for both near-term and
This is a 5-part comment. Please see our response to all 5 parts below.
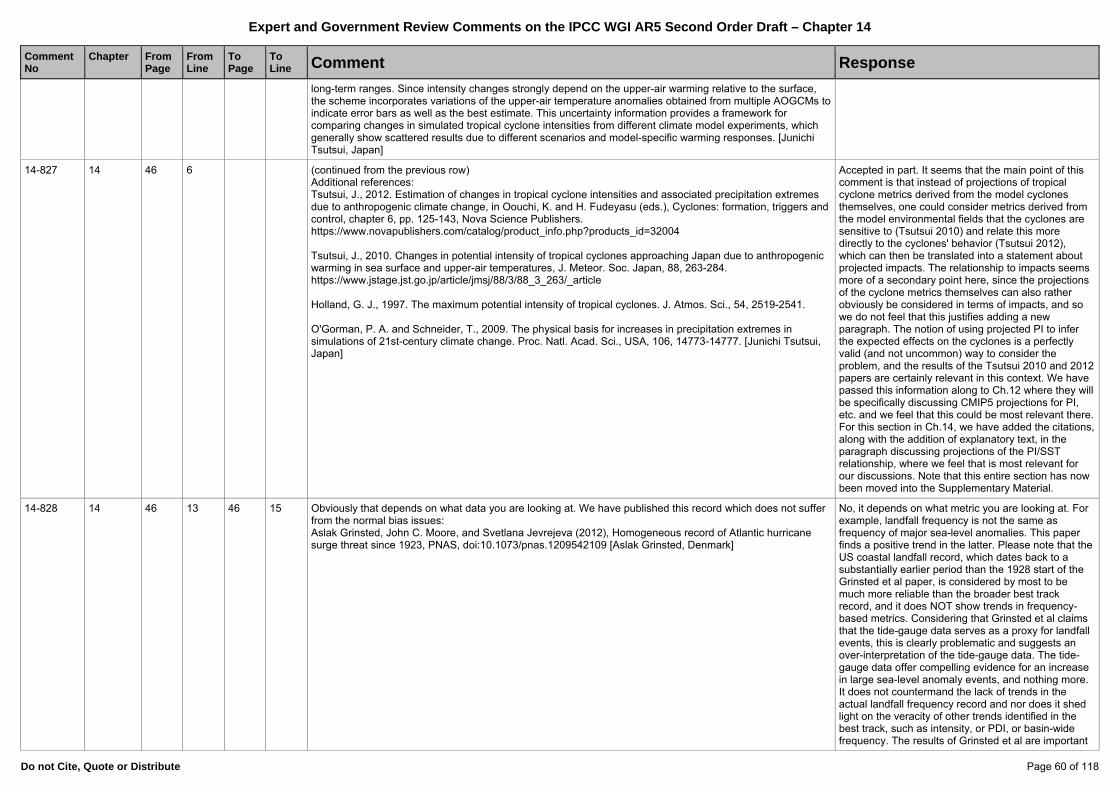
Expert and Government Review Comments on the IPCC WGI AR5 Second Order Draft – Chapter 14
Do not Cite, Quote or Distribute Page 60 of 118
Comment No
Chapter
FromPage
FromLine
To Page
To Line Comment Response
long-term ranges. Since intensity changes strongly depend on the upper-air warming relative to the surface, the scheme incorporates variations of the upper-air temperature anomalies obtained from multiple AOGCMs to indicate error bars as well as the best estimate. This uncertainty information provides a framework for comparing changes in simulated tropical cyclone intensities from different climate model experiments, which generally show scattered results due to different scenarios and model-specific warming responses. [Junichi Tsutsui, Japan]
14-827 14 46 6 (continued from the previous row) Additional references: Tsutsui, J., 2012. Estimation of changes in tropical cyclone intensities and associated precipitation extremes due to anthropogenic climate change, in Oouchi, K. and H. Fudeyasu (eds.), Cyclones: formation, triggers and control, chapter 6, pp. 125-143, Nova Science Publishers. https://www.novapublishers.com/catalog/product_info.php?products_id=32004 Tsutsui, J., 2010. Changes in potential intensity of tropical cyclones approaching Japan due to anthropogenic warming in sea surface and upper-air temperatures, J. Meteor. Soc. Japan, 88, 263-284. https://www.jstage.jst.go.jp/article/jmsj/88/3/88_3_263/_article Holland, G. J., 1997. The maximum potential intensity of tropical cyclones. J. Atmos. Sci., 54, 2519-2541. O'Gorman, P. A. and Schneider, T., 2009. The physical basis for increases in precipitation extremes in simulations of 21st-century climate change. Proc. Natl. Acad. Sci., USA, 106, 14773-14777. [Junichi Tsutsui, Japan]
Accepted in part. It seems that the main point of this comment is that instead of projections of tropical cyclone metrics derived from the model cyclones themselves, one could consider metrics derived from the model environmental fields that the cyclones are sensitive to (Tsutsui 2010) and relate this more directly to the cyclones' behavior (Tsutsui 2012), which can then be translated into a statement about projected impacts. The relationship to impacts seems more of a secondary point here, since the projections of the cyclone metrics themselves can also rather obviously be considered in terms of impacts, and so we do not feel that this justifies adding a new paragraph. The notion of using projected PI to infer the expected effects on the cyclones is a perfectly valid (and not uncommon) way to consider the problem, and the results of the Tsutsui 2010 and 2012 papers are certainly relevant in this context. We have passed this information along to Ch.12 where they will be specifically discussing CMIP5 projections for PI, etc. and we feel that this could be most relevant there. For this section in Ch.14, we have added the citations, along with the addition of explanatory text, in the paragraph discussing projections of the PI/SST relationship, where we feel that is most relevant for our discussions. Note that this entire section has now been moved into the Supplementary Material.
14-828 14 46 13 46 15 Obviously that depends on what data you are looking at. We have published this record which does not suffer from the normal bias issues: Aslak Grinsted, John C. Moore, and Svetlana Jevrejeva (2012), Homogeneous record of Atlantic hurricane surge threat since 1923, PNAS, doi:10.1073/pnas.1209542109 [Aslak Grinsted, Denmark]
No, it depends on what metric you are looking at. For example, landfall frequency is not the same as frequency of major sea-level anomalies. This paper finds a positive trend in the latter. Please note that the US coastal landfall record, which dates back to a substantially earlier period than the 1928 start of the Grinsted et al paper, is considered by most to be much more reliable than the broader best track record, and it does NOT show trends in frequency-based metrics. Considering that Grinsted et al claims that the tide-gauge data serves as a proxy for landfall events, this is clearly problematic and suggests an over-interpretation of the tide-gauge data. The tide-gauge data offer compelling evidence for an increase in large sea-level anomaly events, and nothing more. It does not countermand the lack of trends in the actual landfall frequency record and nor does it shed light on the veracity of other trends identified in the best track, such as intensity, or PDI, or basin-wide frequency. The results of Grinsted et al are important
Expert and Government Review Comments on the IPCC WGI AR5 Second Order Draft – Chapter 14
Do not Cite, Quote or Distribute Page 61 of 118
Comment No
Chapter
FromPage
FromLine
To Page
To Line Comment Response
because a trend in surge events is highly relevant (arguable more relevant than a trend in true landfall frequency), but they should be represented in this context and not oversold. We have added text, now in the Supplemental Material, that reiterates both the Callaghan and Power and Grinsted et al results.
14-829 14 46 25 "lower confidence" should not be in italics. Could be change to "low confidence" which could then be italicized. [Thomas Stocker/ WGI TSU, Switzerland]
Accepted. We have removed the italics.
14-830 14 46 36 Box 14.2, Figure 1: are the changes really given as the difference between the annual means for 2100 and 2000 or some are they for multi-year averages as usually used in Chapter 14 (and 11, 12)? Please clarify. [Thomas Stocker/ WGI TSU, Switzerland]
Accepted. We have added text in the figure caption to clarify the details of the assessment/elicitation process that led to the values in the figure, which refer roughly to a 20-yr period at the end of the 21st century relative to a 20-yr period at the beginning of the 21st century, with the two 20-yr periods separated by about 60-80 years.
14-831 14 46 36 Box 14.2, Figure 1: We wonder if this figure could be made more accessible, and graphically appealing, particularly given that this figure has been elevated to the technical summary. Would it be possible, for example, to graph each metric on a bar plot for each ocean basin, i.e., one plot (with 4 metrics) overlaying each ocean basin, plus the additional hemisphere and global plots. [Thomas Stocker/ WGI TSU, Switzerland]
Accepted. We have been in contact with the TSU and a new figure has been developed.
14-832 14 46 47 47 13 .Tables 1-4, taken together, are much too extensive given the uncertainties. Figure 1 of Box 14.2 seems to summarise the main results well. The main text could be made shorter and tighter, generally keeping references, by better integrating discussion of the past and future behavour of tropical cyclones. [Christopher Folland, United Kingdom of Great Britain & Northern Ireland]
Accepted. The tables have been moved into the online Supplementary Material and we have modified the text.
14-833 14 46 47 Box 14.2, Table 1: "warm climate runs"? -- suggest to "change climate change projections"; please specify the time periods considered. [Thomas Stocker/ WGI TSU, Switzerland]
Accepted in part. The tables attempt to consolidate a number of "studies of opportunity". That is, they are not part of a pre-arranged model comparison project, and are for the most part stand-alone. Consequently there is a wide variety of time periods and forcing scenarios considered in the different studies. These details are in fact mentioned in the table in the column marked "Experiment", and we feel that since the tables are now being moved into a less prominent place in the Supplemental Material, then this is probably adequate. We did reword the caption to better convey these points, and we modified the descriptor "warm climate runs".
14-834 14 46 54 Box 14.2, Table 2: please specify the time periods considered. [Thomas Stocker/ WGI TSU, Switzerland] Please see response to comment 14-833.
14-835 14 47 2 Box 14.2, Table 3: please specify the time periods considered. [Thomas Stocker/ WGI TSU, Switzerland] Please see response to comment 14-833.
14-836 14 47 12 Box 14.2, Table 4: please specify the exact time periods considered. [Thomas Stocker/ WGI TSU, Switzerland]
Please see response to comment 14-833.
14-837 14 47 17 Section 14.5: Section 14.5 misses any information about our understanding of physical mechanisms causing changes in the annular modes. It remains unclear whether simulated changes in the annular modes are consistent with our understanding of atmospheric circulation response to increasing greenhouse gas concentrations. On the other hand, such information is sufficiently well presented in Box 14.3 for Extra-tropical cyclones. Since it is the interactions between extratropical eddies and mean flow that gives rise to annular mode variability, I suggest adding a sentence saying that physical mechanisms causing annular modes response to GHG increases are discussed in Box 14.3. [Alexey Karpechko, Finland]
Added
14-838 14 47 23 47 23 We suggest this unnecessary footnote could be deleted. Content could be moved to the main text (after Now moved to main text
Expert and Government Review Comments on the IPCC WGI AR5 Second Order Draft – Chapter 14
Do not Cite, Quote or Distribute Page 62 of 118
Comment No
Chapter
FromPage
FromLine
To Page
To Line Comment Response
"SAM") [Thomas Stocker/ WGI TSU, Switzerland]
14-839 14 47 32 47 34 "... The NAO exists in boreal summer as well as in boreal winter, albeit with different physical haracteristics (Folland et al., 2009)." One closely related paper should be included here. Thus above sentence is changed to "... The NAO exists in boreal summer as well as in boreal winter, albeit with different physical haracteristics (Folland et al., 2009; Sun et al., 2008)." Reference: Sun, J., H. Wang, and W. Yuan (2008), Decadal variations of the relationship between the summer North Atlantic Oscillation and middle East Asian air temperature, J. Geophys. Res., 113, D15107, doi:10.1029/2007JD009626. [Jianqi Sun, China]
Added
14-840 14 47 36 47 43 In the text, the term “NAO is used to denote NAO, AO and NAM in boreal winter unless further distinction is required”. We need, however, to realize the clear and important distinction of the AO from others. As stated by Boldwin, NAM is defined by dominant EOF mode at each vertical level from the troposphere to stratosphere, and the NAM is called AO only when the EOF is applied to the sea-level pressure (SLP). Therefore, AO is defined by the variation of the SLP, and we emphasize that only AO is dynamically connected to the low-frequency variability of the barotropic component (vertical mean) of the atmospheric variables. The barotropic component obtains the energy from synoptic disturbances by barotropization (i.e., removal of baroclinicity). The energy in the synoptic scale is then transferred to planetary waves and zonal jet by zonalization (i.e., inverse energy cascade) owing to the nature of the 2D fluid mechanics. Most of the low-frequency natural variability of the atmosphere are contained in the autonomous variation in the barotropic component, among those the AO is the most dominant internal mode. The structure of the AO is theoretically obtained as the most unstable standing eigen-mode in the barotropic atmosphere (shallow water system) on a sphere, and the eigenvalue of the AO mode becomes zero under the adequate frictional damping (Tanaka and Matsueda 2005). Owing to this dynamical property, AO can excite resonantly by any quasi-stationary forcing with arbitrary time scales from one month to decades and even longer. Compared to the clear dynamical basis for the AO, NAM is defined only statistically with no dynamical basis. NAM at each vertical level is considered to represent a part of the structure of the dynamical AO. Likewise, NAO is defined statistically by the local teleconnection, and is considered to represent a part of the structure of the dynamical AO. When the CMIP models are analyzed, AO appears as the most dominant mode of variability without an exception. This result is reasonable for our dynamical understanding of the AO. However, the time series of the AO index of each CMIP model run are totally different with each other, indicating chaotic behavior, which is also consistent with our understanding of the AO (Ohashi and Tanaka 2010; Hirata et al. 2011). It is an internal, unpredictable variability of the atmosphere, responding to various anomalies of the climate system. Importantly, such an internal variability of the AO explains the larger fraction of variance in surface air temperature than that of the anthropogenic trend of the polar amplification (Nagato and Tanaka 2012). By means of the positive feedback between the AO and the local climate system of ocean, Arctic sea ice, and boreal ecosystem, we can expect an amplified response of natural and internal variability of the climate system at a wide range of the time scale. The present form of the IPCC-AR5 lacks the description of the abovementioned dynamical understanding of the AO and lacks the explanation of the natural variability induced by the AO as the atmospheric dynamical eigenmode which can dominate at decadal and even longer time scales. The present form lacks the quantitative evaluation of the magnitude of the natural and internal variability of the climate system associated with the unique dynamical property of the AO. It seems that the magnitude of the natural and internal variability of the climate system is underestimated compared to the anthropogenic trend of the global warming. We hope to revise the description of the related chapters accordingly. References: Tanaka, H. L. and M. Matsueda, 2005: Arctic Oscillation analyzed as a singular eigenmode of the global atmosphere. J. Meteor. Soc. Japan, 83, 611-619. Hirata, Y., Y. Shimo, H. L. Tanaka, and K. Aihara 2011: Chaotic properties of the Arctic Oscillation index. SOLA, 7, 33-36 Ohashi, M. and H. L. Tanaka, 2010: Data analysis of warming pattern in the Arctic. SOLA, 6A, 1-4. Nagato, Y. and H. L. Tanaka 2012: Estimation of global warming trend without the contributions from decadal variability of the Arctic Oscillation. Polar Science, 6, 15-22. [Hiroshi Tanaka, Japan]
Not included. A comprehensive review of the statistical and dynamical properties of these modes is outside the scope of this assessment on future projections
Expert and Government Review Comments on the IPCC WGI AR5 Second Order Draft – Chapter 14
Do not Cite, Quote or Distribute Page 63 of 118
Comment No
Chapter
FromPage
FromLine
To Page
To Line Comment Response
14-841 14 47 47 47 47 Does there need to be a reference to Walker (1924) and Rogers (1981). For some of these sections you seem to writing a historical summary. The NAO and NPO go back before Walker. [Phil Jones, United Kingdom of Great Britain & Northern Ireland]
These early references have now been removed
14-842 14 48 16 48 16 Typo: ")" after "b" at beginning of sentence [Government of Canada] Corrected
14-843 14 48 16 48 20 RCP4.5 projections are used in Figure 14.26 - is there much difference between the RCPs in the projections of NAO and NAM out to 2100? [John Caesar, United Kingdom of Great Britain & Northern Ireland]
It is not possible to assess this since no studies have been published yet that look at NAO under other scenarios than RCP4.5
14-844 14 48 16 48 20 Figure 14.26 uses RCP4.5 simulations to provide NAO and NAM indices. Is there much variability between different RCPs? [European Union]
See response to 843
14-845 14 48 43 48 53 This discussion seems to repeat from Ch 10 on Detection and Attribution. I get the impression that the authors of Chapters 2, 5, 10 and 14 have not had much interaction with each other. I know they probably have, but it isn't that obvious from the text that's been writte. [Phil Jones, United Kingdom of Great Britain & Northern Ireland]
The material here is complementary to that presented in 10.3.3.2
14-846 14 48 44 48 44 add: "winter" in fronrt of NAO (summer NAO interdecadal variations very different) [Christopher Folland, United Kingdom of Great Britain & Northern Ireland]
Done
14-847 14 48 45 48 53 It would be very helpful to provide a clearer bottom-line estimate of the overall contribution of natural variability in these NH extratropical modes (NAO, etc.) to the observed trends in temperature and precip. [Government of United States of America]
It is not possible to assess this since no publications have so far addressed this specific attribution question
14-848 14 49 8 49 8 At least two more studies demonstrated a sensitivity of NAO projections to representations of the stratosphere in climate models: Sigmond and Scinocca (2010) and Karpechko and Manzini (2012). I suggest refering to these studies here. Missing references: (1) Sigmond, M., and J. F. Scinocca (2010), The influence of the basic state on the Northern Hemisphere circulation response to climate change, J. Clim., 23, 1434–1446, doi:10.1175/2009JCLI3167.1. (2) Karpechko A. Yu., and E. Manzini, Stratospheric influence on tropospheric climate change in the Northern Hemisphere (2012), J. Geophys. Res., 117, D05133, doi:10.1029/2011JD017036. [Alexey Karpechko, Finland]
Added
14-849 14 49 10 13 Incorrect statements wrt solar forcing and NAO: all the papers cited show a positive correlation between solar activity and NAO index. [Joanna Haigh, United Kingdom]
Corrected
14-850 14 49 25 Figure 14.26: using reference periods different from the standard used in Ch.11/12 and the Annex I: Atlas will complicate cross-chapter comparison more complicated. Could the 2070-2099 and 1975-2004 time frames be changed to 2081-2100 and 1986-2005? [Thomas Stocker/ WGI TSU, Switzerland]
Time frames changed to facilitate cross-chapter comparison
14-851 14 49 36 In the Southern Hemisphere there are two jets – the subtropical and the eddy-driven polar jets – not just a mid-latitude jet. The implication here is that the phase of SAM is responsible for the changes in the storm tracks. However, SAM is essentially an equivalent barotropic phenomenon and changes in storms are caused by changes in baroclinicity and static stability as expressed for example through the Phillips Criterion. SAM does not explain the conversion of zonal potential energy into transient kinetic energy required for storm formation. Also, while SAM may be associated with changes in the polar jet, it is less correlated with changes in the subtropical jet over Australia – which is by far the most important for Australia during winter, when some of the largest and robust changes in rainfall have occurred over southern Australia. This section 14.5.2 needs to reflect the above points and include discussion of the Phillips Criterion and more sophisticated instability mechanisms for storm formation that have been used in climate change studies (Frederiksen and Frederiksen 2007, 2011). [Carsten Frederiksen, Australia]
Wording tightened up
14-852 14 49 36 In the Southern Hemisphere there are two jets – the subtropical and the eddy-driven polar jets – not just a mid-latitude jet. The implication here is that the phase of SAM is responsible for the changes in the storm tracks. However, SAM is essentially an equivalent barotropic phenomenon and changes in storms are caused by changes in baroclinicity and static stability as expressed for example through the Phillips Criterion. SAM does not explain the conversion of zonal potential energy into transient kinetic energy required for storm
Wording tightened up
Expert and Government Review Comments on the IPCC WGI AR5 Second Order Draft – Chapter 14
Do not Cite, Quote or Distribute Page 64 of 118
Comment No
Chapter
FromPage
FromLine
To Page
To Line Comment Response
formation. Also, while SAM may be associated with changes in the polar jet, it is less correlated with changes in the subtropical jet over Australia – which is by far the most important for Australia during winter, when some of the largest and robust changes in rainfall have occurred over southern Australia. This section 14.5.2 needs to reflect the above points and include discussion of the Phillips Criterion and more sophisticated instability mechanisms for storm formation that have been used in climate change studies (Frederiksen and Frederiksen 2007, 2011). [Government of Australia]
14-853 14 49 38 49 48 In the Southern Hemisphere there are two jets – the subtropical and the eddy-driven polar jets – not just a mid-latitude jet. The implication here is that the phase of SAM is responsible for the changes in the storm tracks. However, SAM is essentially an equivalent barotropic phenomenon and changes in storms are caused by changes in baroclinicity and static stability as expressed for example through the Phillips Criterion. SAM does not explain the conversion of zonal potential energy into transient kinetic energy required for storm formation. Also, while SAM may be associated with changes in the polar jet, it is less correlated with changes in the subtropical jet over Australia – which is by far the most important for Australia during winter, when some of the largest and robust changes in rainfall have occurred over southern Australia. This section 14.5.2 needs to reflect the above points and include discussion of the Phillips Criterion and more sophisticated instability mechanisms for storm formation that have been used in climate change studies (Frederiksen and Frederiksen 2007, 2011). [Jorgen Frederiksen, Australia]
Wording tightened up
14-854 14 49 44 49 46 The non-annular component of the SAM in the Pacific sector was discussed already by Sen Gupta and England (2006), if not earlier. Therefore, Sen Gupta and England (2006) should be credited here. Missing reference: Sen Gupta, A., and M. H. England (2006), Coupled ocean–atmosphere–ice response to variations in the southern annular mode. J. Climate, 19, 4457–4486. [Alexey Karpechko, Finland]
Noted, text moved to Supplementary Information
14-855 14 49 46 49 48 "... SAM variability has a major influence on the climate of Antarctica, Australasia, southern South America and South Africa (Thompson et al., 2011 and references therein; Watterson, 2009)." Some recent studies showed that the SAM has also impact on the climate over East Asia, West Africa, and North America, which should be included here. Thus above sentence is changed to "... SAM variability has a major influence on the climate of Antarctica, Australasia, southern South America, South Africa, East Asia, West Africa, and North America (Thompson et al., 2011 and references therein; Watterson, 2009; Sun et al., 2009; Sun et al., 2010; Sun, 2010)." References: Sun, J. Q., H. J. Wang, W. Yuan, 2009: A possible mechanism for the co-variability of the boreal spring Antarctic Oscillation and the Yangtze River valley summer rainfall, International Journal of Climatology, 29, 1276-1284, doi:10.1002/joc.1773. Sun, J. Q., H. J. Wang, W. Yuan, 2010: Linkage of the Boreal Spring Antarctic Oscillation to the West African Summer Monsoon, Journal of the Meteorological Society of Japan, 88(1), 15-28. Sun, J. Q., 2010:, Possible impact of the boreal spring Antarctic Oscillation on the North American summer monsoon, Atmos. Oceanic Sci. Lett., 3, 232–236. [Jianqi Sun, China]
Text shortened, references not added. Some o fthis moved to Supplementary Information.
14-856 14 49 54 49 56 Not clear what is meant here. [Markku Rummukainen, Sweden] Removed.
14-857 14 50 11 missing parenthesis [Maisa Rojas, Chile] OK
14-858 14 50 53 50 55 The caption for Figure 14.26 says that 'wintertime mean' SAM index is shown but is it correct? It seems that DJF SAM index is shown, therefore it is 'summertime mean' SAM index. Please clarify. [Alexey Karpechko, Finland]
All DJF. Caption changed.
14-859 14 51 6 51 15 I've stressed that sections are overlong, but I'm not finding these sections on Assessment that informative. The confidence statements are not that useful. [Phil Jones, United Kingdom of Great Britain & Northern Ireland]
Assessment statements rewritten to conform to confidence language standards, and statements shortened.
14-860 14 51 7 51 8 We could not make sense of this sentence. Please revise to clarify message. [Thomas Stocker/ WGI TSU, Switzerland]
Re-worded/removed
14-861 14 51 9 51 10 Please, see my comment #7 because it applies here too. [Alexey Karpechko, Finland] Text updated and revised. Wording now more careful
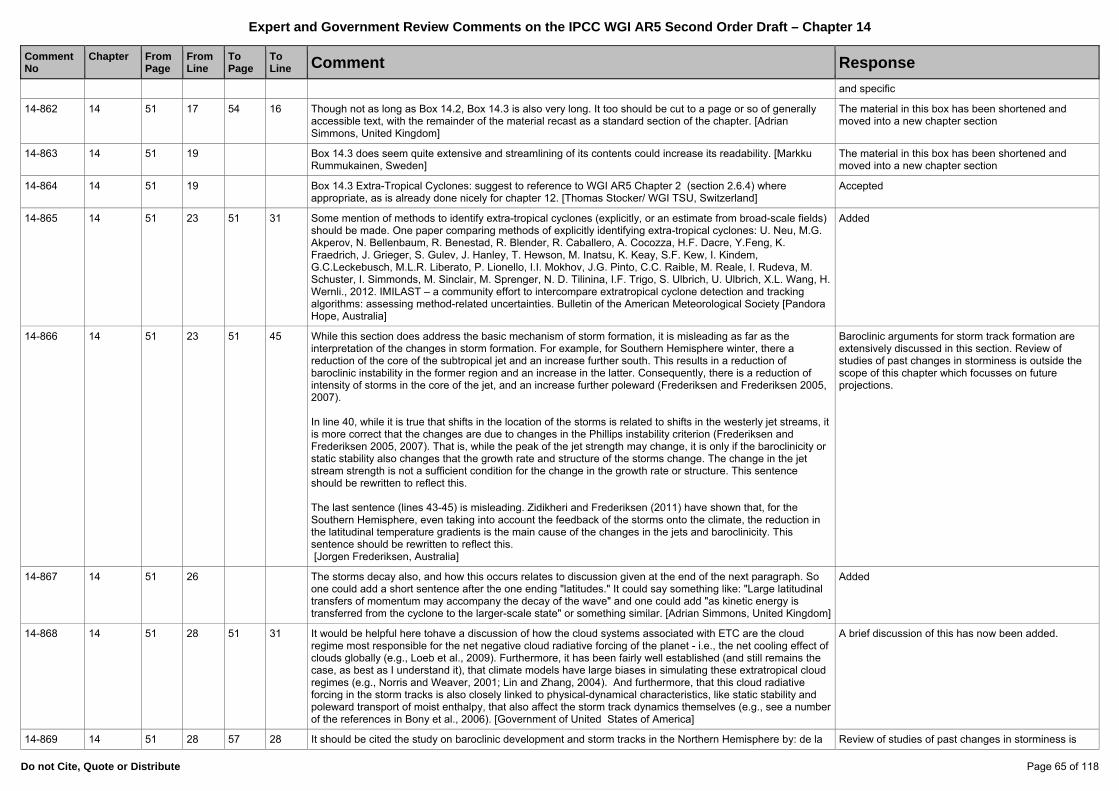
Expert and Government Review Comments on the IPCC WGI AR5 Second Order Draft – Chapter 14
Do not Cite, Quote or Distribute Page 65 of 118
Comment No
Chapter
FromPage
FromLine
To Page
To Line Comment Response
and specific
14-862 14 51 17 54 16 Though not as long as Box 14.2, Box 14.3 is also very long. It too should be cut to a page or so of generally accessible text, with the remainder of the material recast as a standard section of the chapter. [Adrian Simmons, United Kingdom]
The material in this box has been shortened and moved into a new chapter section
14-863 14 51 19 Box 14.3 does seem quite extensive and streamlining of its contents could increase its readability. [Markku Rummukainen, Sweden]
The material in this box has been shortened and moved into a new chapter section
14-864 14 51 19 Box 14.3 Extra-Tropical Cyclones: suggest to reference to WGI AR5 Chapter 2 (section 2.6.4) where appropriate, as is already done nicely for chapter 12. [Thomas Stocker/ WGI TSU, Switzerland]
Accepted
14-865 14 51 23 51 31 Some mention of methods to identify extra-tropical cyclones (explicitly, or an estimate from broad-scale fields) should be made. One paper comparing methods of explicitly identifying extra-tropical cyclones: U. Neu, M.G. Akperov, N. Bellenbaum, R. Benestad, R. Blender, R. Caballero, A. Cocozza, H.F. Dacre, Y.Feng, K. Fraedrich, J. Grieger, S. Gulev, J. Hanley, T. Hewson, M. Inatsu, K. Keay, S.F. Kew, I. Kindem, G.C.Leckebusch, M.L.R. Liberato, P. Lionello, I.I. Mokhov, J.G. Pinto, C.C. Raible, M. Reale, I. Rudeva, M. Schuster, I. Simmonds, M. Sinclair, M. Sprenger, N. D. Tilinina, I.F. Trigo, S. Ulbrich, U. Ulbrich, X.L. Wang, H. Wernli., 2012. IMILAST – a community effort to intercompare extratropical cyclone detection and tracking algorithms: assessing method-related uncertainties. Bulletin of the American Meteorological Society [Pandora Hope, Australia]
Added
14-866 14 51 23 51 45 While this section does address the basic mechanism of storm formation, it is misleading as far as the interpretation of the changes in storm formation. For example, for Southern Hemisphere winter, there a reduction of the core of the subtropical jet and an increase further south. This results in a reduction of baroclinic instability in the former region and an increase in the latter. Consequently, there is a reduction of intensity of storms in the core of the jet, and an increase further poleward (Frederiksen and Frederiksen 2005, 2007). In line 40, while it is true that shifts in the location of the storms is related to shifts in the westerly jet streams, it is more correct that the changes are due to changes in the Phillips instability criterion (Frederiksen and Frederiksen 2005, 2007). That is, while the peak of the jet strength may change, it is only if the baroclinicity or static stability also changes that the growth rate and structure of the storms change. The change in the jet stream strength is not a sufficient condition for the change in the growth rate or structure. This sentence should be rewritten to reflect this. The last sentence (lines 43-45) is misleading. Zidikheri and Frederiksen (2011) have shown that, for the Southern Hemisphere, even taking into account the feedback of the storms onto the climate, the reduction in the latitudinal temperature gradients is the main cause of the changes in the jets and baroclinicity. This sentence should be rewritten to reflect this. [Jorgen Frederiksen, Australia]
Baroclinic arguments for storm track formation are extensively discussed in this section. Review of studies of past changes in storminess is outside the scope of this chapter which focusses on future projections.
14-867 14 51 26 The storms decay also, and how this occurs relates to discussion given at the end of the next paragraph. So one could add a short sentence after the one ending "latitudes." It could say something like: "Large latitudinal transfers of momentum may accompany the decay of the wave" and one could add "as kinetic energy is transferred from the cyclone to the larger-scale state" or something similar. [Adrian Simmons, United Kingdom]
Added
14-868 14 51 28 51 31 It would be helpful here tohave a discussion of how the cloud systems associated with ETC are the cloud regime most responsible for the net negative cloud radiative forcing of the planet - i.e., the net cooling effect of clouds globally (e.g., Loeb et al., 2009). Furthermore, it has been fairly well established (and still remains the case, as best as I understand it), that climate models have large biases in simulating these extratropical cloud regimes (e.g., Norris and Weaver, 2001; Lin and Zhang, 2004). And furthermore, that this cloud radiative forcing in the storm tracks is also closely linked to physical-dynamical characteristics, like static stability and poleward transport of moist enthalpy, that also affect the storm track dynamics themselves (e.g., see a number of the references in Bony et al., 2006). [Government of United States of America]
A brief discussion of this has now been added.
14-869 14 51 28 57 28 It should be cited the study on baroclinic development and storm tracks in the Northern Hemisphere by: de la Review of studies of past changes in storminess is
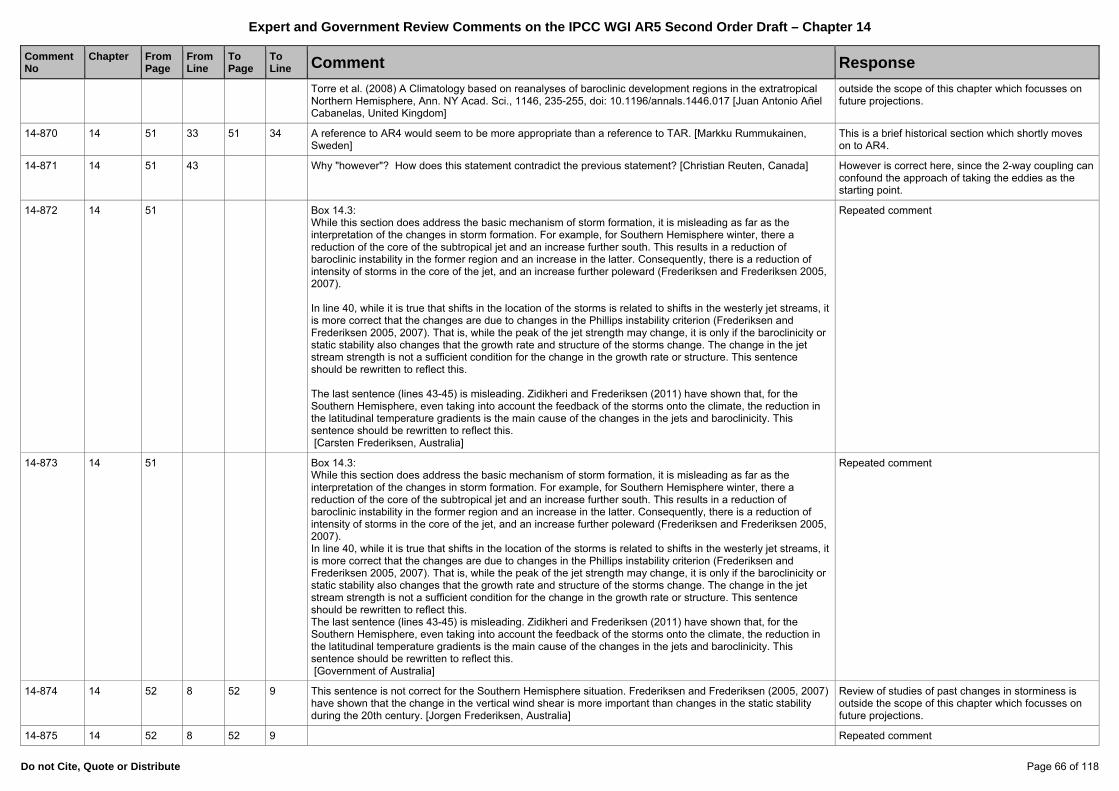
Expert and Government Review Comments on the IPCC WGI AR5 Second Order Draft – Chapter 14
Do not Cite, Quote or Distribute Page 66 of 118
Comment No
Chapter
FromPage
FromLine
To Page
To Line Comment Response
Torre et al. (2008) A Climatology based on reanalyses of baroclinic development regions in the extratropical Northern Hemisphere, Ann. NY Acad. Sci., 1146, 235-255, doi: 10.1196/annals.1446.017 [Juan Antonio Añel Cabanelas, United Kingdom]
outside the scope of this chapter which focusses on future projections.
14-870 14 51 33 51 34 A reference to AR4 would seem to be more appropriate than a reference to TAR. [Markku Rummukainen, Sweden]
This is a brief historical section which shortly moves on to AR4.
14-871 14 51 43 Why "however"? How does this statement contradict the previous statement? [Christian Reuten, Canada] However is correct here, since the 2-way coupling can confound the approach of taking the eddies as the starting point.
14-872 14 51 Box 14.3: While this section does address the basic mechanism of storm formation, it is misleading as far as the interpretation of the changes in storm formation. For example, for Southern Hemisphere winter, there a reduction of the core of the subtropical jet and an increase further south. This results in a reduction of baroclinic instability in the former region and an increase in the latter. Consequently, there is a reduction of intensity of storms in the core of the jet, and an increase further poleward (Frederiksen and Frederiksen 2005, 2007). In line 40, while it is true that shifts in the location of the storms is related to shifts in the westerly jet streams, it is more correct that the changes are due to changes in the Phillips instability criterion (Frederiksen and Frederiksen 2005, 2007). That is, while the peak of the jet strength may change, it is only if the baroclinicity or static stability also changes that the growth rate and structure of the storms change. The change in the jet stream strength is not a sufficient condition for the change in the growth rate or structure. This sentence should be rewritten to reflect this. The last sentence (lines 43-45) is misleading. Zidikheri and Frederiksen (2011) have shown that, for the Southern Hemisphere, even taking into account the feedback of the storms onto the climate, the reduction in the latitudinal temperature gradients is the main cause of the changes in the jets and baroclinicity. This sentence should be rewritten to reflect this. [Carsten Frederiksen, Australia]
Repeated comment
14-873 14 51 Box 14.3: While this section does address the basic mechanism of storm formation, it is misleading as far as the interpretation of the changes in storm formation. For example, for Southern Hemisphere winter, there a reduction of the core of the subtropical jet and an increase further south. This results in a reduction of baroclinic instability in the former region and an increase in the latter. Consequently, there is a reduction of intensity of storms in the core of the jet, and an increase further poleward (Frederiksen and Frederiksen 2005, 2007). In line 40, while it is true that shifts in the location of the storms is related to shifts in the westerly jet streams, it is more correct that the changes are due to changes in the Phillips instability criterion (Frederiksen and Frederiksen 2005, 2007). That is, while the peak of the jet strength may change, it is only if the baroclinicity or static stability also changes that the growth rate and structure of the storms change. The change in the jet stream strength is not a sufficient condition for the change in the growth rate or structure. This sentence should be rewritten to reflect this. The last sentence (lines 43-45) is misleading. Zidikheri and Frederiksen (2011) have shown that, for the Southern Hemisphere, even taking into account the feedback of the storms onto the climate, the reduction in the latitudinal temperature gradients is the main cause of the changes in the jets and baroclinicity. This sentence should be rewritten to reflect this. [Government of Australia]
Repeated comment
14-874 14 52 8 52 9 This sentence is not correct for the Southern Hemisphere situation. Frederiksen and Frederiksen (2005, 2007) have shown that the change in the vertical wind shear is more important than changes in the static stability during the 20th century. [Jorgen Frederiksen, Australia]
Review of studies of past changes in storminess is outside the scope of this chapter which focusses on future projections.
14-875 14 52 8 52 9 Repeated comment
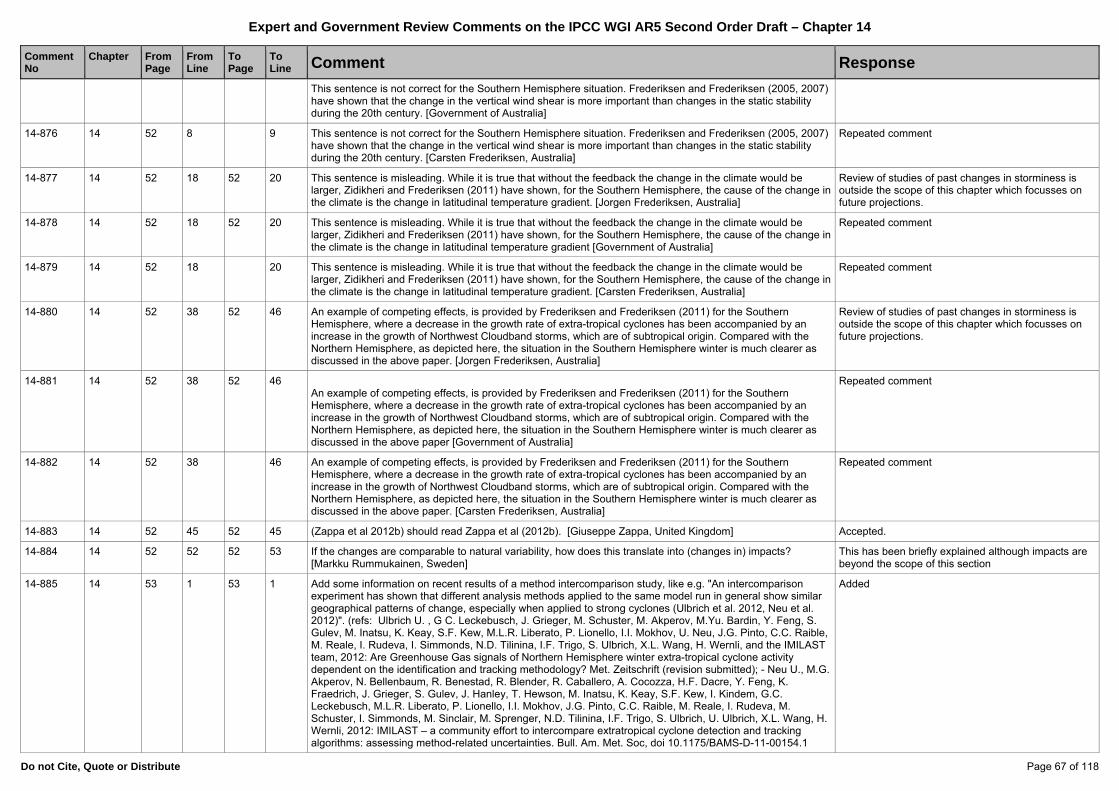
Expert and Government Review Comments on the IPCC WGI AR5 Second Order Draft – Chapter 14
Do not Cite, Quote or Distribute Page 67 of 118
Comment No
Chapter
FromPage
FromLine
To Page
To Line Comment Response
This sentence is not correct for the Southern Hemisphere situation. Frederiksen and Frederiksen (2005, 2007) have shown that the change in the vertical wind shear is more important than changes in the static stability during the 20th century. [Government of Australia]
14-876 14 52 8 9 This sentence is not correct for the Southern Hemisphere situation. Frederiksen and Frederiksen (2005, 2007) have shown that the change in the vertical wind shear is more important than changes in the static stability during the 20th century. [Carsten Frederiksen, Australia]
Repeated comment
14-877 14 52 18 52 20 This sentence is misleading. While it is true that without the feedback the change in the climate would be larger, Zidikheri and Frederiksen (2011) have shown, for the Southern Hemisphere, the cause of the change in the climate is the change in latitudinal temperature gradient. [Jorgen Frederiksen, Australia]
Review of studies of past changes in storminess is outside the scope of this chapter which focusses on future projections.
14-878 14 52 18 52 20 This sentence is misleading. While it is true that without the feedback the change in the climate would be larger, Zidikheri and Frederiksen (2011) have shown, for the Southern Hemisphere, the cause of the change in the climate is the change in latitudinal temperature gradient [Government of Australia]
Repeated comment
14-879 14 52 18 20 This sentence is misleading. While it is true that without the feedback the change in the climate would be larger, Zidikheri and Frederiksen (2011) have shown, for the Southern Hemisphere, the cause of the change in the climate is the change in latitudinal temperature gradient. [Carsten Frederiksen, Australia]
Repeated comment
14-880 14 52 38 52 46 An example of competing effects, is provided by Frederiksen and Frederiksen (2011) for the Southern Hemisphere, where a decrease in the growth rate of extra-tropical cyclones has been accompanied by an increase in the growth of Northwest Cloudband storms, which are of subtropical origin. Compared with the Northern Hemisphere, as depicted here, the situation in the Southern Hemisphere winter is much clearer as discussed in the above paper. [Jorgen Frederiksen, Australia]
Review of studies of past changes in storminess is outside the scope of this chapter which focusses on future projections.
14-881 14 52 38 52 46 An example of competing effects, is provided by Frederiksen and Frederiksen (2011) for the Southern Hemisphere, where a decrease in the growth rate of extra-tropical cyclones has been accompanied by an increase in the growth of Northwest Cloudband storms, which are of subtropical origin. Compared with the Northern Hemisphere, as depicted here, the situation in the Southern Hemisphere winter is much clearer as discussed in the above paper [Government of Australia]
Repeated comment
14-882 14 52 38 46 An example of competing effects, is provided by Frederiksen and Frederiksen (2011) for the Southern Hemisphere, where a decrease in the growth rate of extra-tropical cyclones has been accompanied by an increase in the growth of Northwest Cloudband storms, which are of subtropical origin. Compared with the Northern Hemisphere, as depicted here, the situation in the Southern Hemisphere winter is much clearer as discussed in the above paper. [Carsten Frederiksen, Australia]
Repeated comment
14-883 14 52 45 52 45 (Zappa et al 2012b) should read Zappa et al (2012b). [Giuseppe Zappa, United Kingdom] Accepted.
14-884 14 52 52 52 53 If the changes are comparable to natural variability, how does this translate into (changes in) impacts? [Markku Rummukainen, Sweden]
This has been briefly explained although impacts are beyond the scope of this section
14-885 14 53 1 53 1 Add some information on recent results of a method intercomparison study, like e.g. "An intercomparison experiment has shown that different analysis methods applied to the same model run in general show similar geographical patterns of change, especially when applied to strong cyclones (Ulbrich et al. 2012, Neu et al. 2012)". (refs: Ulbrich U. , G C. Leckebusch, J. Grieger, M. Schuster, M. Akperov, M.Yu. Bardin, Y. Feng, S. Gulev, M. Inatsu, K. Keay, S.F. Kew, M.L.R. Liberato, P. Lionello, I.I. Mokhov, U. Neu, J.G. Pinto, C.C. Raible, M. Reale, I. Rudeva, I. Simmonds, N.D. Tilinina, I.F. Trigo, S. Ulbrich, X.L. Wang, H. Wernli, and the IMILAST team, 2012: Are Greenhouse Gas signals of Northern Hemisphere winter extra-tropical cyclone activity dependent on the identification and tracking methodology? Met. Zeitschrift (revision submitted); - Neu U., M.G. Akperov, N. Bellenbaum, R. Benestad, R. Blender, R. Caballero, A. Cocozza, H.F. Dacre, Y. Feng, K. Fraedrich, J. Grieger, S. Gulev, J. Hanley, T. Hewson, M. Inatsu, K. Keay, S.F. Kew, I. Kindem, G.C. Leckebusch, M.L.R. Liberato, P. Lionello, I.I. Mokhov, J.G. Pinto, C.C. Raible, M. Reale, I. Rudeva, M. Schuster, I. Simmonds, M. Sinclair, M. Sprenger, N.D. Tilinina, I.F. Trigo, S. Ulbrich, U. Ulbrich, X.L. Wang, H. Wernli, 2012: IMILAST – a community effort to intercompare extratropical cyclone detection and tracking algorithms: assessing method-related uncertainties. Bull. Am. Met. Soc, doi 10.1175/BAMS-D-11-00154.1
Added
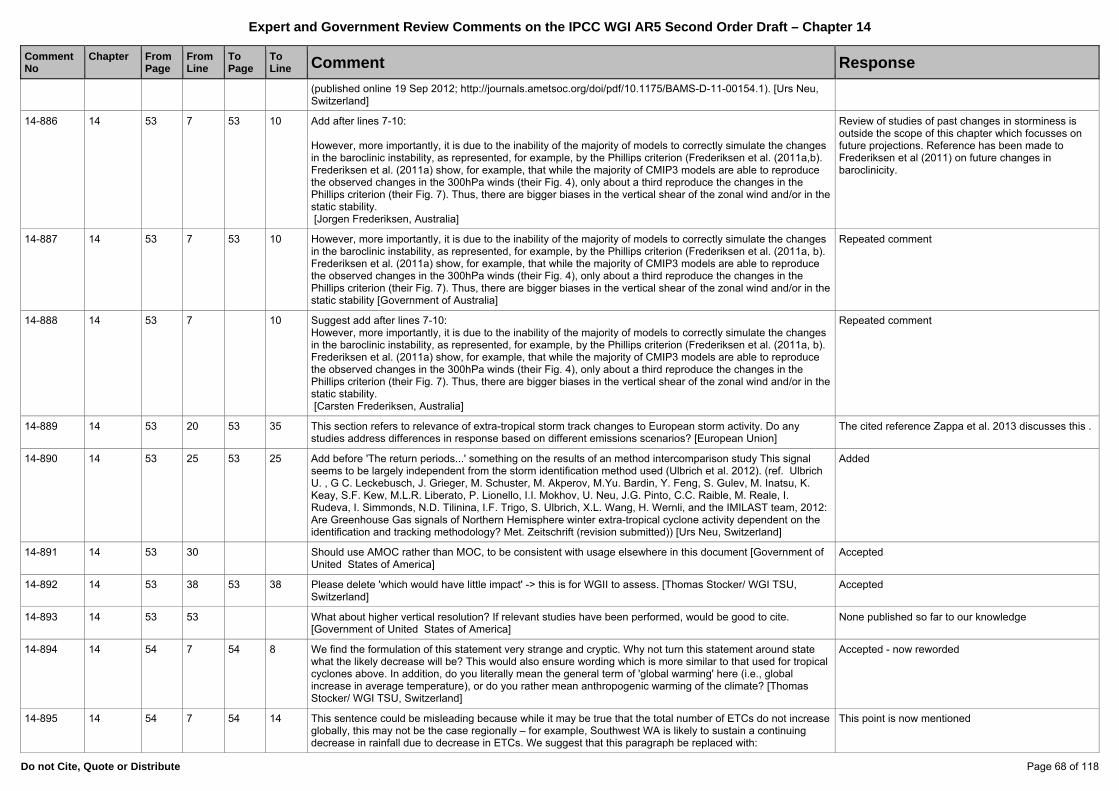
Expert and Government Review Comments on the IPCC WGI AR5 Second Order Draft – Chapter 14
Do not Cite, Quote or Distribute Page 68 of 118
Comment No
Chapter
FromPage
FromLine
To Page
To Line Comment Response
(published online 19 Sep 2012; http://journals.ametsoc.org/doi/pdf/10.1175/BAMS-D-11-00154.1). [Urs Neu, Switzerland]
14-886 14 53 7 53 10 Add after lines 7-10: However, more importantly, it is due to the inability of the majority of models to correctly simulate the changes in the baroclinic instability, as represented, for example, by the Phillips criterion (Frederiksen et al. (2011a,b). Frederiksen et al. (2011a) show, for example, that while the majority of CMIP3 models are able to reproduce the observed changes in the 300hPa winds (their Fig. 4), only about a third reproduce the changes in the Phillips criterion (their Fig. 7). Thus, there are bigger biases in the vertical shear of the zonal wind and/or in the static stability. [Jorgen Frederiksen, Australia]
Review of studies of past changes in storminess is outside the scope of this chapter which focusses on future projections. Reference has been made to Frederiksen et al (2011) on future changes in baroclinicity.
14-887 14 53 7 53 10 However, more importantly, it is due to the inability of the majority of models to correctly simulate the changes in the baroclinic instability, as represented, for example, by the Phillips criterion (Frederiksen et al. (2011a, b). Frederiksen et al. (2011a) show, for example, that while the majority of CMIP3 models are able to reproduce the observed changes in the 300hPa winds (their Fig. 4), only about a third reproduce the changes in the Phillips criterion (their Fig. 7). Thus, there are bigger biases in the vertical shear of the zonal wind and/or in the static stability [Government of Australia]
Repeated comment
14-888 14 53 7 10 Suggest add after lines 7-10: However, more importantly, it is due to the inability of the majority of models to correctly simulate the changes in the baroclinic instability, as represented, for example, by the Phillips criterion (Frederiksen et al. (2011a, b). Frederiksen et al. (2011a) show, for example, that while the majority of CMIP3 models are able to reproduce the observed changes in the 300hPa winds (their Fig. 4), only about a third reproduce the changes in the Phillips criterion (their Fig. 7). Thus, there are bigger biases in the vertical shear of the zonal wind and/or in the static stability. [Carsten Frederiksen, Australia]
Repeated comment
14-889 14 53 20 53 35 This section refers to relevance of extra-tropical storm track changes to European storm activity. Do any studies address differences in response based on different emissions scenarios? [European Union]
The cited reference Zappa et al. 2013 discusses this .
14-890 14 53 25 53 25 Add before 'The return periods...' something on the results of an method intercomparison study This signal seems to be largely independent from the storm identification method used (Ulbrich et al. 2012). (ref. Ulbrich U. , G C. Leckebusch, J. Grieger, M. Schuster, M. Akperov, M.Yu. Bardin, Y. Feng, S. Gulev, M. Inatsu, K. Keay, S.F. Kew, M.L.R. Liberato, P. Lionello, I.I. Mokhov, U. Neu, J.G. Pinto, C.C. Raible, M. Reale, I. Rudeva, I. Simmonds, N.D. Tilinina, I.F. Trigo, S. Ulbrich, X.L. Wang, H. Wernli, and the IMILAST team, 2012: Are Greenhouse Gas signals of Northern Hemisphere winter extra-tropical cyclone activity dependent on the identification and tracking methodology? Met. Zeitschrift (revision submitted)) [Urs Neu, Switzerland]
Added
14-891 14 53 30 Should use AMOC rather than MOC, to be consistent with usage elsewhere in this document [Government of United States of America]
Accepted
14-892 14 53 38 53 38 Please delete 'which would have little impact' -> this is for WGII to assess. [Thomas Stocker/ WGI TSU, Switzerland]
Accepted
14-893 14 53 53 What about higher vertical resolution? If relevant studies have been performed, would be good to cite. [Government of United States of America]
None published so far to our knowledge
14-894 14 54 7 54 8 We find the formulation of this statement very strange and cryptic. Why not turn this statement around state what the likely decrease will be? This would also ensure wording which is more similar to that used for tropical cyclones above. In addition, do you literally mean the general term of 'global warming' here (i.e., global increase in average temperature), or do you rather mean anthropogenic warming of the climate? [Thomas Stocker/ WGI TSU, Switzerland]
Accepted - now reworded
14-895 14 54 7 54 14 This sentence could be misleading because while it may be true that the total number of ETCs do not increase globally, this may not be the case regionally – for example, Southwest WA is likely to sustain a continuing decrease in rainfall due to decrease in ETCs. We suggest that this paragraph be replaced with:
This point is now mentioned
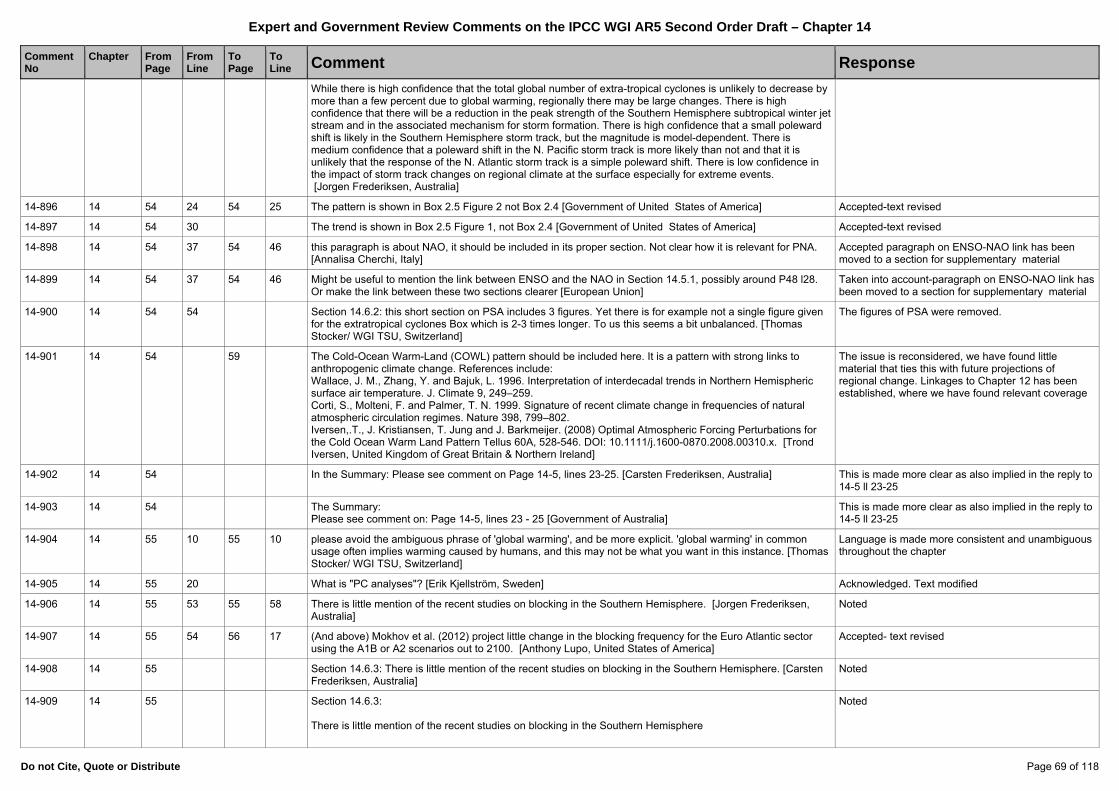
Expert and Government Review Comments on the IPCC WGI AR5 Second Order Draft – Chapter 14
Do not Cite, Quote or Distribute Page 69 of 118
Comment No
Chapter
FromPage
FromLine
To Page
To Line Comment Response
While there is high confidence that the total global number of extra-tropical cyclones is unlikely to decrease by more than a few percent due to global warming, regionally there may be large changes. There is high confidence that there will be a reduction in the peak strength of the Southern Hemisphere subtropical winter jet stream and in the associated mechanism for storm formation. There is high confidence that a small poleward shift is likely in the Southern Hemisphere storm track, but the magnitude is model-dependent. There is medium confidence that a poleward shift in the N. Pacific storm track is more likely than not and that it is unlikely that the response of the N. Atlantic storm track is a simple poleward shift. There is low confidence in the impact of storm track changes on regional climate at the surface especially for extreme events. [Jorgen Frederiksen, Australia]
14-896 14 54 24 54 25 The pattern is shown in Box 2.5 Figure 2 not Box 2.4 [Government of United States of America] Accepted-text revised
14-897 14 54 30 The trend is shown in Box 2.5 Figure 1, not Box 2.4 [Government of United States of America] Accepted-text revised
14-898 14 54 37 54 46 this paragraph is about NAO, it should be included in its proper section. Not clear how it is relevant for PNA. [Annalisa Cherchi, Italy]
Accepted paragraph on ENSO-NAO link has been moved to a section for supplementary material
14-899 14 54 37 54 46 Might be useful to mention the link between ENSO and the NAO in Section 14.5.1, possibly around P48 l28. Or make the link between these two sections clearer [European Union]
Taken into account-paragraph on ENSO-NAO link has been moved to a section for supplementary material
14-900 14 54 54 Section 14.6.2: this short section on PSA includes 3 figures. Yet there is for example not a single figure given for the extratropical cyclones Box which is 2-3 times longer. To us this seems a bit unbalanced. [Thomas Stocker/ WGI TSU, Switzerland]
The figures of PSA were removed.
14-901 14 54 59 The Cold-Ocean Warm-Land (COWL) pattern should be included here. It is a pattern with strong links to anthropogenic climate change. References include: Wallace, J. M., Zhang, Y. and Bajuk, L. 1996. Interpretation of interdecadal trends in Northern Hemispheric surface air temperature. J. Climate 9, 249–259. Corti, S., Molteni, F. and Palmer, T. N. 1999. Signature of recent climate change in frequencies of natural atmospheric circulation regimes. Nature 398, 799–802. Iversen,.T., J. Kristiansen, T. Jung and J. Barkmeijer. (2008) Optimal Atmospheric Forcing Perturbations for the Cold Ocean Warm Land Pattern Tellus 60A, 528-546. DOI: 10.1111/j.1600-0870.2008.00310.x. [Trond Iversen, United Kingdom of Great Britain & Northern Ireland]
The issue is reconsidered, we have found little material that ties this with future projections of regional change. Linkages to Chapter 12 has been established, where we have found relevant coverage
14-902 14 54 In the Summary: Please see comment on Page 14-5, lines 23-25. [Carsten Frederiksen, Australia] This is made more clear as also implied in the reply to 14-5 ll 23-25
14-903 14 54 The Summary: Please see comment on: Page 14-5, lines 23 - 25 [Government of Australia]
This is made more clear as also implied in the reply to 14-5 ll 23-25
14-904 14 55 10 55 10 please avoid the ambiguous phrase of 'global warming', and be more explicit. 'global warming' in common usage often implies warming caused by humans, and this may not be what you want in this instance. [Thomas Stocker/ WGI TSU, Switzerland]
Language is made more consistent and unambiguous throughout the chapter
14-905 14 55 20 What is "PC analyses"? [Erik Kjellström, Sweden] Acknowledged. Text modified
14-906 14 55 53 55 58 There is little mention of the recent studies on blocking in the Southern Hemisphere. [Jorgen Frederiksen, Australia]
Noted
14-907 14 55 54 56 17 (And above) Mokhov et al. (2012) project little change in the blocking frequency for the Euro Atlantic sector using the A1B or A2 scenarios out to 2100. [Anthony Lupo, United States of America]
Accepted- text revised
14-908 14 55 Section 14.6.3: There is little mention of the recent studies on blocking in the Southern Hemisphere. [Carsten Frederiksen, Australia]
Noted
14-909 14 55 Section 14.6.3: There is little mention of the recent studies on blocking in the Southern Hemisphere
Noted
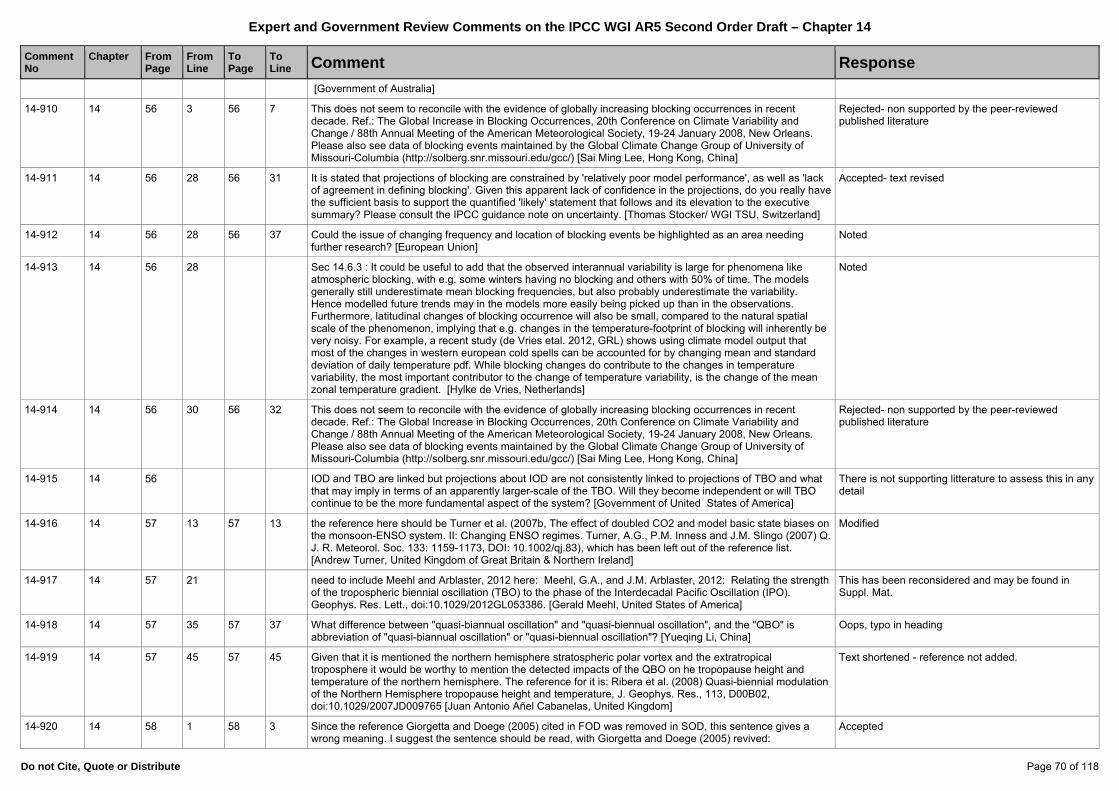
Expert and Government Review Comments on the IPCC WGI AR5 Second Order Draft – Chapter 14
Do not Cite, Quote or Distribute Page 70 of 118
Comment No
Chapter
FromPage
FromLine
To Page
To Line Comment Response
[Government of Australia]
14-910 14 56 3 56 7 This does not seem to reconcile with the evidence of globally increasing blocking occurrences in recent decade. Ref.: The Global Increase in Blocking Occurrences, 20th Conference on Climate Variability and Change / 88th Annual Meeting of the American Meteorological Society, 19-24 January 2008, New Orleans. Please also see data of blocking events maintained by the Global Climate Change Group of University of Missouri-Columbia (http://solberg.snr.missouri.edu/gcc/) [Sai Ming Lee, Hong Kong, China]
Rejected- non supported by the peer-reviewed published literature
14-911 14 56 28 56 31 It is stated that projections of blocking are constrained by 'relatively poor model performance', as well as 'lack of agreement in defining blocking'. Given this apparent lack of confidence in the projections, do you really have the sufficient basis to support the quantified 'likely' statement that follows and its elevation to the executive summary? Please consult the IPCC guidance note on uncertainty. [Thomas Stocker/ WGI TSU, Switzerland]
Accepted- text revised
14-912 14 56 28 56 37 Could the issue of changing frequency and location of blocking events be highlighted as an area needing further research? [European Union]
Noted
14-913 14 56 28 Sec 14.6.3 : It could be useful to add that the observed interannual variability is large for phenomena like atmospheric blocking, with e.g. some winters having no blocking and others with 50% of time. The models generally still underestimate mean blocking frequencies, but also probably underestimate the variability. Hence modelled future trends may in the models more easily being picked up than in the observations. Furthermore, latitudinal changes of blocking occurrence will also be small, compared to the natural spatial scale of the phenomenon, implying that e.g. changes in the temperature-footprint of blocking will inherently be very noisy. For example, a recent study (de Vries etal. 2012, GRL) shows using climate model output that most of the changes in western european cold spells can be accounted for by changing mean and standard deviation of daily temperature pdf. While blocking changes do contribute to the changes in temperature variability, the most important contributor to the change of temperature variability, is the change of the mean zonal temperature gradient. [Hylke de Vries, Netherlands]
Noted
14-914 14 56 30 56 32 This does not seem to reconcile with the evidence of globally increasing blocking occurrences in recent decade. Ref.: The Global Increase in Blocking Occurrences, 20th Conference on Climate Variability and Change / 88th Annual Meeting of the American Meteorological Society, 19-24 January 2008, New Orleans. Please also see data of blocking events maintained by the Global Climate Change Group of University of Missouri-Columbia (http://solberg.snr.missouri.edu/gcc/) [Sai Ming Lee, Hong Kong, China]
Rejected- non supported by the peer-reviewed published literature
14-915 14 56 IOD and TBO are linked but projections about IOD are not consistently linked to projections of TBO and what that may imply in terms of an apparently larger-scale of the TBO. Will they become independent or will TBO continue to be the more fundamental aspect of the system? [Government of United States of America]
There is not supporting litterature to assess this in any detail
14-916 14 57 13 57 13 the reference here should be Turner et al. (2007b, The effect of doubled CO2 and model basic state biases on the monsoon-ENSO system. II: Changing ENSO regimes. Turner, A.G., P.M. Inness and J.M. Slingo (2007) Q. J. R. Meteorol. Soc. 133: 1159-1173, DOI: 10.1002/qj.83), which has been left out of the reference list. [Andrew Turner, United Kingdom of Great Britain & Northern Ireland]
Modified
14-917 14 57 21 need to include Meehl and Arblaster, 2012 here: Meehl, G.A., and J.M. Arblaster, 2012: Relating the strength of the tropospheric biennial oscillation (TBO) to the phase of the Interdecadal Pacific Oscillation (IPO). Geophys. Res. Lett., doi:10.1029/2012GL053386. [Gerald Meehl, United States of America]
This has been reconsidered and may be found in Suppl. Mat.
14-918 14 57 35 57 37 What difference between "quasi-biannual oscillation" and "quasi-biennual oscillation", and the "QBO" is abbreviation of "quasi-biannual oscillation" or "quasi-biennual oscillation"? [Yueqing Li, China]
Oops, typo in heading
14-919 14 57 45 57 45 Given that it is mentioned the northern hemisphere stratospheric polar vortex and the extratropical troposphere it would be worthy to mention the detected impacts of the QBO on he tropopause height and temperature of the northern hemisphere. The reference for it is: Ribera et al. (2008) Quasi-biennial modulation of the Northern Hemisphere tropopause height and temperature, J. Geophys. Res., 113, D00B02, doi:10.1029/2007JD009765 [Juan Antonio Añel Cabanelas, United Kingdom]
Text shortened - reference not added.
14-920 14 58 1 58 3 Since the reference Giorgetta and Doege (2005) cited in FOD was removed in SOD, this sentence gives a wrong meaning. I suggest the sentence should be read, with Giorgetta and Doege (2005) revived:
Accepted
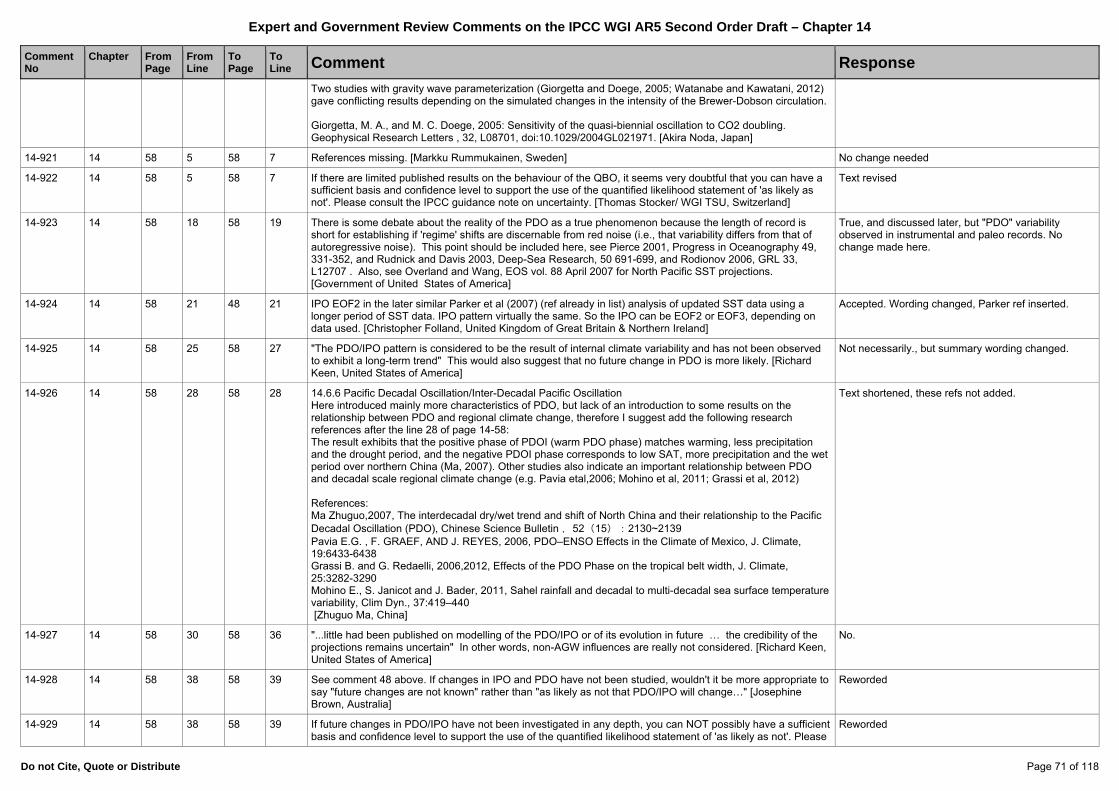
Expert and Government Review Comments on the IPCC WGI AR5 Second Order Draft – Chapter 14
Do not Cite, Quote or Distribute Page 71 of 118
Comment No
Chapter
FromPage
FromLine
To Page
To Line Comment Response
Two studies with gravity wave parameterization (Giorgetta and Doege, 2005; Watanabe and Kawatani, 2012) gave conflicting results depending on the simulated changes in the intensity of the Brewer-Dobson circulation. Giorgetta, M. A., and M. C. Doege, 2005: Sensitivity of the quasi-biennial oscillation to CO2 doubling. Geophysical Research Letters , 32, L08701, doi:10.1029/2004GL021971. [Akira Noda, Japan]
14-921 14 58 5 58 7 References missing. [Markku Rummukainen, Sweden] No change needed
14-922 14 58 5 58 7 If there are limited published results on the behaviour of the QBO, it seems very doubtful that you can have a sufficient basis and confidence level to support the use of the quantified likelihood statement of 'as likely as not'. Please consult the IPCC guidance note on uncertainty. [Thomas Stocker/ WGI TSU, Switzerland]
Text revised
14-923 14 58 18 58 19 There is some debate about the reality of the PDO as a true phenomenon because the length of record is short for establishing if 'regime' shifts are discernable from red noise (i.e., that variability differs from that of autoregressive noise). This point should be included here, see Pierce 2001, Progress in Oceanography 49, 331-352, and Rudnick and Davis 2003, Deep-Sea Research, 50 691-699, and Rodionov 2006, GRL 33, L12707 . Also, see Overland and Wang, EOS vol. 88 April 2007 for North Pacific SST projections. [Government of United States of America]
True, and discussed later, but "PDO" variability observed in instrumental and paleo records. No change made here.
14-924 14 58 21 48 21 IPO EOF2 in the later similar Parker et al (2007) (ref already in list) analysis of updated SST data using a longer period of SST data. IPO pattern virtually the same. So the IPO can be EOF2 or EOF3, depending on data used. [Christopher Folland, United Kingdom of Great Britain & Northern Ireland]
Accepted. Wording changed, Parker ref inserted.
14-925 14 58 25 58 27 "The PDO/IPO pattern is considered to be the result of internal climate variability and has not been observed to exhibit a long-term trend" This would also suggest that no future change in PDO is more likely. [Richard Keen, United States of America]
Not necessarily., but summary wording changed.
14-926 14 58 28 58 28 14.6.6 Pacific Decadal Oscillation/Inter-Decadal Pacific Oscillation Here introduced mainly more characteristics of PDO, but lack of an introduction to some results on the relationship between PDO and regional climate change, therefore I suggest add the following research references after the line 28 of page 14-58: The result exhibits that the positive phase of PDOI (warm PDO phase) matches warming, less precipitation and the drought period, and the negative PDOI phase corresponds to low SAT, more precipitation and the wet period over northern China (Ma, 2007). Other studies also indicate an important relationship between PDO and decadal scale regional climate change (e.g. Pavia etal,2006; Mohino et al, 2011; Grassi et al, 2012) References: Ma Zhuguo,2007, The interdecadal dry/wet trend and shift of North China and their relationship to the Pacific Decadal Oscillation (PDO), Chinese Science Bulletin ,52(15):2130~2139 Pavia E.G. , F. GRAEF, AND J. REYES, 2006, PDO–ENSO Effects in the Climate of Mexico, J. Climate, 19:6433-6438 Grassi B. and G. Redaelli, 2006,2012, Effects of the PDO Phase on the tropical belt width, J. Climate, 25:3282-3290 Mohino E., S. Janicot and J. Bader, 2011, Sahel rainfall and decadal to multi-decadal sea surface temperature variability, Clim Dyn., 37:419–440 [Zhuguo Ma, China]
Text shortened, these refs not added.
14-927 14 58 30 58 36 "...little had been published on modelling of the PDO/IPO or of its evolution in future … the credibility of the projections remains uncertain" In other words, non-AGW influences are really not considered. [Richard Keen, United States of America]
No.
14-928 14 58 38 58 39 See comment 48 above. If changes in IPO and PDO have not been studied, wouldn't it be more appropriate to say "future changes are not known" rather than "as likely as not that PDO/IPO will change…" [Josephine Brown, Australia]
Reworded
14-929 14 58 38 58 39 If future changes in PDO/IPO have not been investigated in any depth, you can NOT possibly have a sufficient basis and confidence level to support the use of the quantified likelihood statement of 'as likely as not'. Please
Reworded
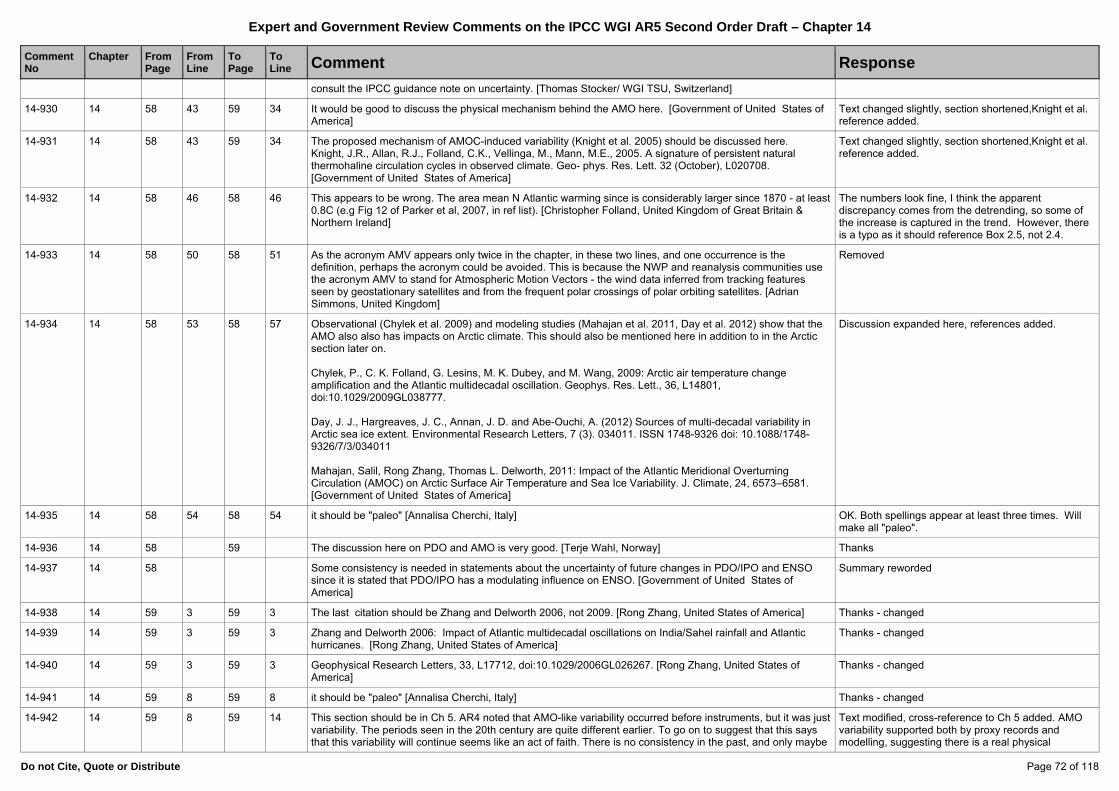
Expert and Government Review Comments on the IPCC WGI AR5 Second Order Draft – Chapter 14
Do not Cite, Quote or Distribute Page 72 of 118
Comment No
Chapter
FromPage
FromLine
To Page
To Line Comment Response
consult the IPCC guidance note on uncertainty. [Thomas Stocker/ WGI TSU, Switzerland]
14-930 14 58 43 59 34 It would be good to discuss the physical mechanism behind the AMO here. [Government of United States of America]
Text changed slightly, section shortened,Knight et al. reference added.
14-931 14 58 43 59 34 The proposed mechanism of AMOC-induced variability (Knight et al. 2005) should be discussed here. Knight, J.R., Allan, R.J., Folland, C.K., Vellinga, M., Mann, M.E., 2005. A signature of persistent natural thermohaline circulation cycles in observed climate. Geo- phys. Res. Lett. 32 (October), L020708. [Government of United States of America]
Text changed slightly, section shortened,Knight et al. reference added.
14-932 14 58 46 58 46 This appears to be wrong. The area mean N Atlantic warming since is considerably larger since 1870 - at least 0.8C (e.g Fig 12 of Parker et al, 2007, in ref list). [Christopher Folland, United Kingdom of Great Britain & Northern Ireland]
The numbers look fine, I think the apparent discrepancy comes from the detrending, so some of the increase is captured in the trend. However, there is a typo as it should reference Box 2.5, not 2.4.
14-933 14 58 50 58 51 As the acronym AMV appears only twice in the chapter, in these two lines, and one occurrence is the definition, perhaps the acronym could be avoided. This is because the NWP and reanalysis communities use the acronym AMV to stand for Atmospheric Motion Vectors - the wind data inferred from tracking features seen by geostationary satellites and from the frequent polar crossings of polar orbiting satellites. [Adrian Simmons, United Kingdom]
Removed
14-934 14 58 53 58 57 Observational (Chylek et al. 2009) and modeling studies (Mahajan et al. 2011, Day et al. 2012) show that the AMO also also has impacts on Arctic climate. This should also be mentioned here in addition to in the Arctic section later on. Chylek, P., C. K. Folland, G. Lesins, M. K. Dubey, and M. Wang, 2009: Arctic air temperature change amplification and the Atlantic multidecadal oscillation. Geophys. Res. Lett., 36, L14801, doi:10.1029/2009GL038777. Day, J. J., Hargreaves, J. C., Annan, J. D. and Abe-Ouchi, A. (2012) Sources of multi-decadal variability in Arctic sea ice extent. Environmental Research Letters, 7 (3). 034011. ISSN 1748-9326 doi: 10.1088/1748-9326/7/3/034011 Mahajan, Salil, Rong Zhang, Thomas L. Delworth, 2011: Impact of the Atlantic Meridional Overturning Circulation (AMOC) on Arctic Surface Air Temperature and Sea Ice Variability. J. Climate, 24, 6573–6581. [Government of United States of America]
Discussion expanded here, references added.
14-935 14 58 54 58 54 it should be "paleo" [Annalisa Cherchi, Italy] OK. Both spellings appear at least three times. Will make all "paleo".
14-936 14 58 59 The discussion here on PDO and AMO is very good. [Terje Wahl, Norway] Thanks
14-937 14 58 Some consistency is needed in statements about the uncertainty of future changes in PDO/IPO and ENSO since it is stated that PDO/IPO has a modulating influence on ENSO. [Government of United States of America]
Summary reworded
14-938 14 59 3 59 3 The last citation should be Zhang and Delworth 2006, not 2009. [Rong Zhang, United States of America] Thanks - changed
14-939 14 59 3 59 3 Zhang and Delworth 2006: Impact of Atlantic multidecadal oscillations on India/Sahel rainfall and Atlantic hurricanes. [Rong Zhang, United States of America]
Thanks - changed
14-940 14 59 3 59 3 Geophysical Research Letters, 33, L17712, doi:10.1029/2006GL026267. [Rong Zhang, United States of America]
Thanks - changed
14-941 14 59 8 59 8 it should be "paleo" [Annalisa Cherchi, Italy] Thanks - changed
14-942 14 59 8 59 14 This section should be in Ch 5. AR4 noted that AMO-like variability occurred before instruments, but it was just variability. The periods seen in the 20th century are quite different earlier. To go on to suggest that this says that this variability will continue seems like an act of faith. There is no consistency in the past, and only maybe
Text modified, cross-reference to Ch 5 added. AMO variability supported both by proxy records and modelling, suggesting there is a real physical
Expert and Government Review Comments on the IPCC WGI AR5 Second Order Draft – Chapter 14
Do not Cite, Quote or Distribute Page 73 of 118
Comment No
Chapter
FromPage
FromLine
To Page
To Line Comment Response
in the instrumental period. This is the problem with the AMO. It is just an average of SST over much of the North Atlantic. It isn't really an oscillation at all, like most of the others. [Phil Jones, United Kingdom of Great Britain & Northern Ireland]
mechanism. See for example Knight et al. (2005).
14-943 14 59 10 59 10 Chylek et al (2011) see pronounced intermittency in long historical proxy data sets, and evidence for a quasi 20 year as well as c70 year time scale of AMO variability in the proxy data and in very long coupled model runs:Chylek, P., C.K. Folland, H. Dijkstra, G. Lesins and M. K. Dubey, 2011: Ice-core data evidence for a prominent near 20 year time-scale of the Atlantic Multidecadal Oscillation. Geophys. Res. Lett., 38, L13704, doi:10.1029/2011GL047501 Chylek, P., C. K. Folland, L. Frankcombe, H Dijkstra, G. Lesins, and M. Dubey, 2012: Greenland ice core evidence for spatial and temporal variability of the Atlantic Multidecadal Oscillation. Geophys. Res. Lett., 39, L09705, doi./10.1029/2012GL051241. Possible mechanism of the c20 year AMO time -scale is in: Dong, B., and R. T. Sutton (2005), Mechanism of interdecadal thermohaline circulation variability in a coupled ocean-atmosphere GCM, J. Clim., 18, 1117–1135, doi:10.1175/JCLI3328. [Christopher Folland, United Kingdom of Great Britain & Northern Ireland]
Text modified, Chylek et al. (2012) added.
14-944 14 59 12 59 12 "suggest the likelihood" -> can you assign a quantified level of likelihood, using the terminology from the uncertainty guidance note? [Thomas Stocker/ WGI TSU, Switzerland]
Changed to "suggest that"
14-945 14 59 16 59 20 Is the potential offset to global warming effects resulting from the potential termination of the current warm phase of the Atlantic Multi-Decadal Oscillation (AMO) quantified? [European Union]
Based on Keenlyside et al (2008) the suggested effect is around 0.3C for a couple of decades, but this is just one paper. Prefer to leave the present qualitative statement.
14-946 14 59 16 59 23 Could a value for the estimated magnitude of the cooling offset be included here? [John Caesar, United Kingdom of Great Britain & Northern Ireland]
Based on Keenlyside et al (2008) the suggested effect is around 0.3C for a couple of decades, but this is just one paper. Prefer to leave the present qualitative statement.
14-947 14 59 16 59 23 Can estimates of the amount of North Atlantic cooling associated with a shift in the AMO be provided here? [European Union]
Based on Keenlyside et al (2008) the suggested effect is around 0.3C for a couple of decades, but this is just one paper. Prefer to leave the present qualitative statement.
14-948 14 59 18 59 18 More leaps of faith here. Why is the AMO (whatever it really is) going to continue in the same way for the next coupel of decades. [Phil Jones, United Kingdom of Great Britain & Northern Ireland]
Changed to "may occur"
14-949 14 59 20 59 23 Statistical models in fact predict that the AMV magnitude will be declining in the near future (Mahajan et al. 2012). This study could be cited here. Mahajan S., R. Zhang, T. L. Delworth, A. Rosati, S. Zhang, and Y-S. Chang (2011): Predict- ing the Atlantic Meridional Overturning Circulation using subsurface and surface fingerprints, Deep Sea Research Part II: Topical Studies in Oceanography, 58, 1895-1903. [Government of United States of America]
With consdierable error bars. The present text is consistent with the findings in the cited paper.
14-950 14 59 20 59 23 What is the relevance of this sentence. This seems like pie in the sky. Why not wait for AR8 to make statements like this. Again how do we know that the AMO is going to behave like it has done in the past? How do you know it's not influenced by anthropogenic forcing? [Phil Jones, United Kingdom of Great Britain & Northern Ireland]
Deleted.
14-951 14 59 20 59 23 All of these effects seem potentially very important. Please cite references to support each of these listed possible effects. [Thomas Stocker/ WGI TSU, Switzerland]
Deleted.
14-952 14 59 32 59 32 There seems to be a contradiction here. On line 18, you state that it is likely that the current warm phase of the AMO will terminate within the next few decades. However, here you now state that it is unlikely that the AMO will change its behaviour over the coming decades. Please clarify this apparent contradiction. [Thomas Stocker/ WGI TSU, Switzerland]
Confusion over wording. Means that the observed variability in the AMO is expected to continue, not inconsistent with the idea that the AMO will go to negative polarity in coming decades.
14-953 14 59 33 59 34 This final statement is very general, and could be misinterpreted out of context. It would be worth including Deleted.
Expert and Government Review Comments on the IPCC WGI AR5 Second Order Draft – Chapter 14
Do not Cite, Quote or Distribute Page 74 of 118
Comment No
Chapter
FromPage
FromLine
To Page
To Line Comment Response
what regions this statement is relevant for. Also please ensure this statement is consistent with the assessment given in Chapter 10. [Thomas Stocker/ WGI TSU, Switzerland]
14-954 14 59 36 59 56 This summary section is an example of where the uncertainty language needs to be looked at very carefully. If possible, please avoid 'low to medium confidence' type statements, and rather settle on a definitive confidence level. Also if your confidence is only low or medium confidence in projections, it seems doubtful that you would have a sufficient basis to support a strong quantified likelihood statement (line 43). Please consider carefully in these instances whether or not your confidence in the projections is sufficient to be able to support such a quantified likelihood level. The use of 'as likely as not' in the final paragraph (lines 52 - 56) has already been commented on, and seems inappropriate. [Thomas Stocker/ WGI TSU, Switzerland]
The uncertainty language is revised according to the agreed use throughout the chapter
14-955 14 59 43 59 43 "Low to medium", "likely" (italics) [Martin Stendel, Denmark] Copy edit level
14-956 14 59 48 59 48 "Low to medium" (italics) [Martin Stendel, Denmark] Copy edit level
14-957 14 59 No mention is made of the AMOC in the context of AMO on 14-59. Is that because there is link or is it not understood? [Government of United States of America]
The summary statements are all reconsidered. This is now made more clear
14-958 14 60 1 93 24 Section 14.7: Much of the future regional projections in section 14.7 are based on RCP4.5 as are many of the supporting maps from Annex I. This is a policy based scenario with the intention of stabilizing the increased radiative forcing to around 4.5 watts/meter**2. The most similar SRES scenario is B1, which was the low emissions scenario of AR4. A more appropriate scenario for section 14.7 would be the “no-policy” scenario, RCP8.5. Because the forcing change is so much larger, climate change signals are more robust and interpretation of projections clearer. [Government of United States of America]
Fair comment, but beyond our scope. The chapter is focusing on RCP4.5 in order to match the decision made for the Atlas. We do introduce the other scenarios briefly in the introductory section to the regions.
14-959 14 60 1 Section 14.7: The author team should ensure that time frames for projections are clearly specified, particularly for end-of-section findings. Also, where a phrase such as "by the end of the century" is used, the author team may consider further specifying the intended timeframe, especially if it is not 2081-2100. Where observations are described, similar attention to clarifying the timeframe of data should be employed. [Christopher Field, United States of America]
This isnow explicitly mentioned throughout
14-960 14 60 1 Section 14.7: thoroughness of cross-referencing -- In revising the subsections of 14.7, the author team should consider further cross-referencing other parts of the report. For example, the relevant maps of the Atlas could potentially be more explicitly referenced at the start of each section, further connections to earlier sections of the chapter could be made through parenthetical cross-references, and cross-references to the relevant regional chapters of the working group 2 contribution could be made where appropriate, to assist the reader. [Christopher Field, United States of America]
Done
14-961 14 60 1 Section 14.7: structure of the subsections -- To the extent possible, consistent structures for each subsection will aid readers in understanding presented material and in understanding gaps for specific regions. Further harmonization of structure across subsections could be considered. [Christopher Field, United States of America]
This has been harmonized as far as possible
14-962 14 60 1 Section 14.7: Authors of this section are encouraged to review the regional chapters of the working group 2 contribution to ensure appropriate consistency and cross-referencing between this section and regional climate information presented in working group 2. (The government and expert review for working group 2 occurs March 29 through May 24, 2013.) [Christopher Field, United States of America]
Dialogue with central WG-II CLAs and LAs are in place. The invittaion to attend the final WG-II LAM is considered and Ch14 expect to be present
14-963 14 60 1 Section 14.7: use of calibrated uncertainty language -- Wherever the author team uses calibrated uncertainty language from the Guidance Note on treatment of uncertainties, the terms should be italicized for clarity. The author team should carefully check all instances of likelihood terms, avoiding casual usage wherever possible. [Christopher Field, United States of America]
Done
14-964 14 60 1 Some sections in 14.7 includes "Model quality of GCMs and RCMs" others don't. It would be good if this was made uniform over the chapter and if no results/publications for either GCMs or RCMs are available for some regions this should be highlighted. [Erik Kjellström, Sweden]
Hamonized
14-965 14 60 1 Section 14.7, should throughout clarify which reference periods are used in which cases. [Markku This is hopefully better captured now
Expert and Government Review Comments on the IPCC WGI AR5 Second Order Draft – Chapter 14
Do not Cite, Quote or Distribute Page 75 of 118
Comment No
Chapter
FromPage
FromLine
To Page
To Line Comment Response
Rummukainen, Sweden]
14-966 14 60 1 The different regions' description is done with a varying sub-heading structure. This is confusing and suggest a common practice. The section on Europe could be an example. [Markku Rummukainen, Sweden]
Restructuring is hopefully handling this
14-967 14 60 1 Section 14.7 Further homogenisation across the various regional subsections of Section 14.7 should be achieved. Ideally, the same subsection headings should be used across all regions, and a uniform set of temperature and precipitation related quantities should be assessed across all regions. Currently some sections go into considerable detail repeating projected values that are also available from Table 14.2. To reduce overlap, we suggest that the chapter text is condensed wherever possible, and the reader is simply referred to the Atlas, and Table 14.2 for these values. [Thomas Stocker/ WGI TSU, Switzerland]
Done
14-968 14 60 1 Section 14.7: avoid repeating the assessment of regional observations from Ch2 and global projections from Ch12. In order to reduce the overall overlength of the Chapter we strongly encourage the authors to base their assessment on the, e.g., Ch2/12 assessments and rather than repeat conclusions to simply refer to these Chapters. [Thomas Stocker/ WGI TSU, Switzerland]
Opportunity to shorten
14-969 14 60 1 Section 14.7: The robustness of the assessment in some cases seems questionable to us, particularly where findings seem to be based on only single studies. [Thomas Stocker/ WGI TSU, Switzerland]
This has been reworked and hopefully better tracable now
14-970 14 60 1 Section 14.7 - figures: Currently this section has 6 figures only which have very different scopes. In order to further homogenise the appearance of this section and to provide the important information from RCMs consistently across the regions, we suggest that you provide figures comparing RCMs to CMIP5 GCMs side by side, for all regions (or continents) where multi-model RCM results are available. Figure 14.33 and 14.37 already go into this direction. On the other hand, the other figures in this section could be replaced. [Thomas Stocker/ WGI TSU, Switzerland]
This will be improved as some new figures are introduced
14-971 14 60 1 Section 14.7: discussion of CMIP5 projections is separated from the CMIP3 and RCM projections in many cases. This results in usually more than 1 set of projection results and it's unclear what a reader should do then, what to choose as the Chapters conclusion. Suggest to combine all projections into a synthesis of the assessed results avoiding to give the reader a choice of what to use. [Thomas Stocker/ WGI TSU, Switzerland]
This is now taken together as multiple lines of evidence
14-972 14 60 1 Section 14.7: needs more cross-referencing to Sections 14.2 - 14.6, and consistency with the assessment given in these earlier sections. For example the Europe regional section includes some aspects of model evaluation (14.7.6.2) which needs to be consistent with Ch9. [Thomas Stocker/ WGI TSU, Switzerland]
Done
14-973 14 60 6 60 7 This seems very convoluted. You are going to look at the projected changes in tempertaure and precipitation and then interpret them in terms of all the modes of varaibility in the previous sections. Wouldn't it be easier and obvious to look at how these modes of variability have varied in the projections? Then you could compare the modes of varaibility with what the models said. This goes back to your introductory points on p10 Lines 22-33. [Phil Jones, United Kingdom of Great Britain & Northern Ireland]
More an issue with wording than with content
14-974 14 60 8 60 8 Impacts are not assessed in WGI -- please revise. [Thomas Stocker/ WGI TSU, Switzerland] Handled
14-975 14 60 12 60 12 "Arctic" is mispelled in Table 4.2 [George Kiladis, United States of America] Corrected
14-976 14 60 17 suggest to be specific regarding Chapter and Sections referred to regarding the uncertainty assessment for temperature changes [Thomas Stocker/ WGI TSU, Switzerland]
Done
14-977 14 60 19 60 19 Is it wise to call this *sampling* uncertainty? In statistics, you have a sample and calculate a statistic from it to do some inference, i.e., to estimate an underlying quantity. The sampling uncertainty refers the fact that the estimate is uncertain because the sample is a finite realisation. In the case discussed here, the situation is different: also here, the uncertainty relates to the fact that our climate system has a random component (the internal variability) and therefore the actual future realisation of the climate system will look different from the projected forced (expected) climate. But here, one is in fact interested in the actual realisation, not the forced climate - and if one were interested in the forced signal only, one could take an ensemble and average out the unwanted internal variability. Therefore I would not call this sampling uncertainty. [Douglas Maraun, Germany]
Text modified and should make this point clear
Expert and Government Review Comments on the IPCC WGI AR5 Second Order Draft – Chapter 14
Do not Cite, Quote or Distribute Page 76 of 118
Comment No
Chapter
FromPage
FromLine
To Page
To Line Comment Response
14-978 14 60 25 60 25 Could chapter 9 of AR5 be referred to here instead or along with the AR4? [Thomas Stocker/ WGI TSU, Switzerland]
Acknowledged and changed
14-979 14 60 29 60 43 Strictly speaking, there would seem to be quite a lot of analysis of the regional changes without put in terms of the specific large-scale phenomena. One would, indeed, assume that some of the regional changes have more direct radiative etc. reasons. It would be useful to highlight also this. [Markku Rummukainen, Sweden]
Done
14-980 14 61 9 94 24 These sections are clearly written by different authors. Can I suggest that all authors read the section written on Australia and NZ. This section is clear and is well read and useful. Use this one as a template and all the others should be about the same size. Almost all of them are just far, far too long and read like reviews tring to cover all the papers that have ever been written. [Phil Jones, United Kingdom of Great Britain & Northern Ireland]
All of the regional sections have been dramatically shortened and harmonized. Although some differences remain due to inhomogeneous source of litterature being assessed
14-981 14 61 10 61 47 This section begins with a section that is old and well known. It also repeats from Ch 2. [Phil Jones, United Kingdom of Great Britain & Northern Ireland]
Some of the material in the first two paragraphs has been eliminated. We have examined all the material relating to the Arctic in Chapter 2, and have referred to this chapter where we can, and deleted where we can. However, much of the material on temperature and precipitation trends in Chapter 2 is not specificially written to support arguments relating to the Arctic. Also, in many cases it is incomplete from an Arctic perspective. So it is well worth having a section here that synthesizes observational material relating to the Arctic.
14-982 14 61 14 61 26 add references to the assessment in Sections 14.2-14.6 as appropriate to better link this regional climate change section to the climate phenomena sections. [Thomas Stocker/ WGI TSU, Switzerland]
We have added a relevance table to improve the link between the regional climate change and climate phenomena sections.
14-983 14 61 20 61 21 Other studies (Mahajan et al. 2011, Day et al. 2012) also demonstrate the role of the AMO on Arctic SST and sea-ice in recent years. These could also be cited here and in later parts of the Arctic section. Day, J. J., Hargreaves, J. C., Annan, J. D. and Abe-Ouchi, A. (2012) Sources of multi-decadal variability in Arctic sea ice extent. Environmental Research Letters, 7 (3). 034011. ISSN 1748-9326 doi: 10.1088/1748-9326/7/3/034011 Mahajan, Salil, Rong Zhang, Thomas L. Delworth, 2011: Impact of the Atlantic Meridional Overturning Circulation (AMOC) on Arctic Surface Air Temperature and Sea Ice Variability. J. Climate, 24, 6573–6581. [Government of United States of America]
The Mahajan et al reference has been included. The other one is mostly related to sea ice, and since the sea ice material is no longer referred to in this section, it has not been included.
14-984 14 61 24 This language is unclear: 'Other more analyses more confined...' [Government of United States of America] This material has now been deleted.
14-985 14 61 29 61 34 These sentences should be more carefully worded to clearly say that average regional temperatures may be unusual within the context of the past 2000 years. This is because Arctic warming is strongly spatially heterogenous for the reasons stated in the paragraph above - numerous modes affect the peripheral areas and it depends on the temporal context to define a state as 'highly unsuual' (e.g., see Barber et al., 2003 Climatic Change 63, 91-120). Many areas of the Arctic were likely were as warm as present during Medieval Climate Anomoly. Most were definitely warmer than present between 4000 and 9000 years ago, see Miller et al., 2011 QSR 29, 1679-1715 for summary of temperature and precipitation history of the Arctic. [Government of United States of America]
The warming, as seen in Figures 2.22 and 2.25, is quite homogeneous throughout the Arctic and even pan-Arctic land areas. But wording has been changed to clarify that the spatial context is the whole Arctic. Also, it is already very clearly stated that the temporal context is the past 2000 years. The Miller et al reference is useful in that it adds a somewhat deeper time perspective. This reference has been folded into the text.
14-986 14 61 38 Add "simulated" before "anthropogenic" unless there is any other way that the anthropogenic signature of the warming can be determined. [Erik Kjellström, Sweden]
This is actually meant to refer to the observed warming. The text has been modified to clarify.
14-987 14 61 39 61 40 This statement that areas strongly affected by the PDO are warming despite recent negative shifts needs a supporting reference. PDO trends since the 2000's are actually still unclear and temperature trends are too
This material relating to the PDO has been deleted in the revision, since as the reviewer points out, the
Expert and Government Review Comments on the IPCC WGI AR5 Second Order Draft – Chapter 14
Do not Cite, Quote or Distribute Page 77 of 118
Comment No
Chapter
FromPage
FromLine
To Page
To Line Comment Response
difficult to asses for such a short time period (e.g., Fairbanks AK, see Wendler and Shulski 2009, Arctic 62, 295-300.) So, it may be well shown that this statement may be true for the Atlantic but it is not so clear in the Pacific and this distinction in regional understanding should be made more clearly here. [Government of United States of America]
trends in this mode are difficult to ascertain.
14-988 14 61 39 61 40 Is there a reference to support the statement that there is 'difficulty in reconciling recent trends in known modes of variability with observed warming trends'? For many regions there is a very clear relationship between temperature and modes (again look at Alaska), so precisely what areas or study is this statement referring to? This statement should be more carefully worded and substantiated. And how much of the 'difficulty' is because there is so little station data to actually work with? This is such an important point and bears so significantly on what we know about Arctic climate that it should be more clearly described. See chap 14 p. 63 line 9 as an example of how problems with met station networks imposes important limits on certainty. [Government of United States of America]
This material has been modified to clarify that the difficult in reconciling observed trends with natural modes of variability may not apply to the entire Arctic. Note that the overall trends are based not only on point measurements, but also satellite data, see Figure 2.25.
14-989 14 61 41 61 47 There has been a huge amount of literature published on Arctic precipitation since 2005, so citing the ACIA report here is probably not the best choice. Moreover, I believe this sentence undersells the impotance of precipitation. I would look at Shiklomanov and Lammers, Env. Res. Lett., 2009; Pavelsky and Smith, J. Geophys. Res., 2006; ME Rawlins et al, J. Climate, 2010. While all of these papers indicate that there is substantial uncertainty in Arctic precipitation measurements, they also suggest that precipitation has likely increased in recent decades. Also, see Mclelland et al., J. Geophys. Res., 2004 for an explanation of why thawing ground ice cannot likely explain observed increases in river dicharge. Finally, increased snowmelt cannot explain observed increases in discharge without an accompanying increase in precipitation. [Tamlin Pavelsky, United States of America]
These references have been examined and those that showed observed trends in precipitation were incorporated into the text. There is also a statement to the effect that there is emerging evidence precipitation is increasing in pan-Arctic land areas.
14-990 14 61 43 61 44 There is a paper by Milliman, J.D., Farnsworth, K.L., Jones, P.D., Xu, K.H. and Smith, L.C., 2008: Climatic and anthropogenic factors affecting river discharge to the global ocean, 1951-2000. Global and Planetary Change 62, 187-194, and others by Dai and also by Dai/Milliman and others that look at Canadian and also Russian rivers flowing into the Arctic. They have looked at trends more convincingly than you dscuss here. This is referreed to in Ch 2, so there is repetition here again. [Phil Jones, United Kingdom of Great Britain & Northern Ireland]
The material has been streamlined, but this issue is now also treated much more comprehensively than in section 2.5.2, as is appropriate for a section specifically on the Arctic.
14-991 14 61 46 61 47 "undetected precipitation increases" would seem to need to be complemented with a preceeding "possible". [Markku Rummukainen, Sweden]
As per the other review comments above, there do seem to be some discernible precipitation increases. Accordingly, the word "undetected" has been eliminated here.
14-992 14 61 47 61 47 Would be more appropriate here to refer to chapter 4. Please revise. [Thomas Stocker/ WGI TSU, Switzerland]
This material relating to sea ice has now been deleted.
14-993 14 61 47 61 48 Should make reference to Chapter 4 instead of Chapter 9. [Thierry Fichefet, Belgium] This material relating to sea ice has now been deleted.
14-994 14 61 48 61 48 The recent appearance of an Arctic "ozone hole" could be mentioned here (Manney et al, 2011). As we have seen in the Southern Hemisphere, stratospheric ozone depletion has important implications for surface climate. Reference: Nature 478, 469–475 (27 October 2011) doi:10.1038/nature10556. [Thomas Bracegirdle, United Kingdom]
The Antarctic ozone hole has been so much more persistent that its Arctic counterpart. Its recovery over the next few decades will be correspondingly more dramatic, and its surface effects much more important to consider in the context of anthropogenic climate change than in Arctic. Moreover, at the present time, there is very little literature on the effects of future stratospheric ozone trends on Arctic surface climate. As such, it is very difficult to do justice to this topic in such a short assessment.
14-995 14 61 50 62 2 suggest to refer to Chapter 9 here when addressing the model evaluation. [Thomas Stocker/ WGI TSU, Switzerland]
We now refer to Chapter 9 at the end of this paragraph, and have deleted the material related to GCM biases, as this is can be found with some digging in Chapter 9.
Expert and Government Review Comments on the IPCC WGI AR5 Second Order Draft – Chapter 14
Do not Cite, Quote or Distribute Page 78 of 118
Comment No
Chapter
FromPage
FromLine
To Page
To Line Comment Response
14-996 14 61 55 The reference to Wilson et al could be complemented with Koenigk et al 2011 as they present results from simulations in which a RCM that has been run in climate mode (not forecast mode as in Wilson et al) and also for long integrations instead of a short 1-year period. "Koenigk, T., Döscher, R. and Nikulin, G. (2011), Arctic future scenario experiments with a coupled regional climate model. Tellus A, 63: 69–86. doi: 10.1111/j.1600-0870.2010.00474.x" [Erik Kjellström, Sweden]
This reference has been included in the context of future climate change below, since it is a future climate change simulation.
14-997 14 62 1 62 1 A possible addition here is the dynamical downscaling study of polar lows by Zahn and von Storch (2010). Reference: Zahn, M. and von Storch, H., 2010. Decreased frequency of North Atlantic polar lows associated with future climate warming. Nature, 467(7313): 309-312. [Thomas Bracegirdle, United Kingdom]
This reference has been included in the context of a short list of future climate change simulations at the regional scale.
14-998 14 62 1 Add a new sentence before "However, ". "Individual models have been utilized for Arctic climate change projections and process studies including rapid sea ice loss (Koenigk et al., 2011; Döscher et al., 2012). "Koenigk, T., Döscher, R. and Nikulin, G. (2011), Arctic future scenario experiments with a coupled regional climate model. Tellus A, 63: 69–86. doi: 10.1111/j.1600-0870.2010.00474.x" "Döscher, R. and Koenigk, T.: Arctic rapid sea ice loss events in regional coupled climate scenario experiments, Ocean Sci. Discuss., 9, 2327-2373, doi:10.5194/osd-9-2327-2012, 2012. " [Erik Kjellström, Sweden]
These references has been included in the context of a short list of future climate change simulations at the regional scale.
14-999 14 62 6 62 6 We're not talking about a thinning, but what is happening - a disappearance. [Phil Jones, United Kingdom of Great Britain & Northern Ireland]
This text has now been deleted.
14-1000 14 62 11 62 24 For the statements on lines 11-12 and 23-24, it would be helpful to specify further what is meant--for example, mean change exceeds X standard deviations of internal variability? [Christopher Field, United States of America]
Because of extreme space constraints, we will be relying on the atlas, and the information presented there, to guide the reader in interpreting what is meant statistically the statement that a mean change exceeds natural variability estimates.
14-1001 14 62 15 62 17 "will likely continue to be dominated by the signals of anthropogenic climate change" -- this implies that it was dominated by human caused climate change before; suggest to provide cross reference to relevant section of Chapter 10 where this attribution is provided. [Thomas Stocker/ WGI TSU, Switzerland]
The reference to the other chapter, where it is determined that the recent signals are likely to be at least partly anthropogenic in origin (Section 10.3.1.4) is now made.
14-1002 14 62 19 62 31 There is the issue of more precipitation falling in the Arctic in the future as more falling as rain than snow. This is more efficient, so will appear like an increase. This has been looked at in observational records on Svalbard, by DNMI. [Phil Jones, United Kingdom of Great Britain & Northern Ireland]
This is an interesting issue, but unfortunately due to extreme space constraints, it is not possible to devote space to a discussion of the future change in the snow/rain ratio.
14-1003 14 62 21 “Under the RCP4.5 scenario, the cold-season, ensemble-mean precipitation increases roughly 20–30% by the end of the 21st century (Figure AI.10).” What happens in the RCP8.5 scenario? [Government of United States of America]
We are following a decission made in this WGI report of referencing the RCP4.5 scenario as the main scenario, see also the Atlas.
14-1004 14 62 33 62 39 Also the summary. While it is correct to say sea-ice extent in any one year is not an indicator of a trend the sustained and dramatic loss of arctic sea ice over the last 30 years is a trend which is most likely to have a anthropogenic cause. In addition the sea ice thinning (i.e. loss of multi-year ice) indicate strongly the losses are likely to continue into the future. [European Union]
This material has been deleted in the revision.
14-1005 14 62 33 62 39 We recommend removing this paragraph, because changes in Arctic sea ice are comprehensively assessed in the preceding chapters 4,9,10,12 and 12, and therefore, do not need to be included in the Chapter 14 assessment. The summary statement below would also need to be revised accordingly. [Thomas Stocker/ WGI TSU, Switzerland]
We now simply refer to the other parts of the report.
14-1006 14 62 35 36 This statement is exactly what is being discussed in "Döscher, R., Wyser, K., Meier, H., Qian, M., and Redler, R.: Quantifying Arctic Contributions to Climate Predictability in a Regional Coupled Ocean-Ice-Atmosphere Model, Clim. Dynam., Volume 34, Numbers 7-8 (2010), 1157-1176, DOI: 10.1007/s00382-009-0567-y, 2010." [Erik Kjellström, Sweden]
This material has now been deleted.
14-1007 14 62 38 62 39 Is it possible to indicate what time frame would be needed to assess trends given the observed variability? [Christopher Field, United States of America]
This material has now been deleted.
Expert and Government Review Comments on the IPCC WGI AR5 Second Order Draft – Chapter 14
Do not Cite, Quote or Distribute Page 79 of 118
Comment No
Chapter
FromPage
FromLine
To Page
To Line Comment Response
14-1008 14 62 38 62 39 This is repeated in the paragraph just below and could indeed be stated only once and on the summary level. [Markku Rummukainen, Sweden]
This material has now been deleted.
14-1009 14 62 38 62 39 I believe it is pointed out in one of the earlier chapters that the thinning of ice makes it more susceptible to showing variability due to the internal variability of advecting winds. But the thinning is (likely? very likely?) largely of anthropogenic origin. Separation of anthropogenic effects from internal variability is not straightforward. [Adrian Simmons, United Kingdom]
This material has now been deleted.
14-1010 14 62 41 62 46 The sentence should be more carefully worded because it implies a certainty that is not supported by evidence. The previous sentence indicating a similarity between model predictions and recent trends SUGGESTS that the future will likely reflect anthropogenic change. It does not indicate anything more than a suggestion. [Government of United States of America]
We have eliminated the phase "will continue to be dominated" and replaced with "will be dominated" so as to avoid the detection and attribution issue the reviewer raises. This is more properly dealt with elsewhere in the report, in any case.
14-1011 14 62 41 62 46 The preeminence given to of precipitation vs sea ice in the summary is puzzling, because the observed sea-ice trend of the past 20 years is certainly significant, and may be more significant than many temperature and precipitation trends from individual locations. So (again) the emphasis on a relatively low confidence prediction such as precipitation when there may be more confidence in polar amplification due to sea ice loss is puzzling. And the role of sea ice loss on the behavior of modes of climate variability could be very signfiicant by altering Pacific and Atlantic SST gradients and that is not even mentioned. These aspects of regonal Arctic climate change are more relevant to this chapter and should be addressed here more explicitely. [Government of United States of America]
The sea ice dimension of Arctic climate change is discussed extensively elsewhere in the report, and is so not emphasized here. We certainly make it clear that it is important, and refer the reader to the other parts of the report.
14-1012 14 62 41 62 46 The beginning of this section said this would look at how the NAO and NAM would change and consistency, but this isn't mentioned for the Arctic. [Phil Jones, United Kingdom of Great Britain & Northern Ireland]
We have added a relevance table to improve the link between the regional climate change and climate phenomena sections.
14-1013 14 62 43 62 46 “There is high … forcing”. I do not think that this sentence is necessary. Many statements like this can be deleted. [Dabang Jiang, China]
The material on sea ice has been eliminated.
14-1014 14 62 44 Chapter 12 (Figure 12.30) concludes that Arctic sea ice will disappear in this century under most of the scenarios in most of the CMIP3/5 models. This finding should be assessed in the Arctic summary paragraph. [Government of United States of America]
The sea ice dimension of Arctic climate change is discussed extensively elsewhere in the report, and is so not emphasized here. We certainly make it clear that it is important, and refer the reader to the other parts of the report.
14-1015 14 62 48 65 8 surprised to see no discussion of changes in Greenland. [European Union] Changes in Greenland are briefly mentioned. But a more in depth discussion is not possible due to space limitations and the reader should consider looking into other parts of the report.
14-1016 14 62 48 65 8 I was surprised to see no discussion of changes in Greenland. [European Union] This appears to be a duplicate of #1015.
14-1017 14 62 48 please add references to the assessment in Sections 14.2-14.6 as appropriate to better link this regional climate change section to the climate phenomena sections. [Thomas Stocker/ WGI TSU, Switzerland]
We have created a relevance table to address this issue.
14-1018 14 62 56 62 56 Horel and Wallace (no capital letters) [Martin Stendel, Denmark] Edit made in revision.
14-1019 14 62 62 33 39 Also the summary. While it is correct to say sea-ice extent in any one year is not an indicator of a trend the sustained and dramatic loss of arctic sea ice over the last 30 years is a trend which is most likely to have a anthropogenic cause. In addition the sea ice thinning (i.e. loss of multi-year ice) indicate strongly the losses are likely to continue into the future. [European Union]
This comment is miscategorized and pertains to the Arctic section. The issues related to sea-ice are now less prominent.
14-1020 14 63 9 63 29 In this paragraph, the lines are blurred between observational evidence of regional climate trends and modeled evidence of regional climate trends. The opening two lines suggest that the content of the paragraph is based on observations, but reanalysis-based studies (e.g., Fall et al., 2010) and modeling-based studies (e.g., Bukovsky, 2012) are cited as evidence of "historical trends". [Government of United States of America]
Fall et al. has been deleted. Though Bukowski (2012) has a modeling focus, observed trends are also presented in this paper, and it is this aspect that justifies the citation.
14-1021 14 63 10 63 11 This paper grids the data and that is why they point out this problem. This has little relevance. This section is The Shen et al. reference has been removed. This
Expert and Government Review Comments on the IPCC WGI AR5 Second Order Draft – Chapter 14
Do not Cite, Quote or Distribute Page 80 of 118
Comment No
Chapter
FromPage
FromLine
To Page
To Line Comment Response
far too large - look at what was said about Australia and NZ. [Phil Jones, United Kingdom of Great Britain & Northern Ireland]
section has been shortened significantly.
14-1022 14 63 18 63 20 This should say 'decline in western North American snowpack' and it is disputable that a 'systematic decline' has clearly been established. A close look at Figure 1G, 3 and 4 and the supplemental data in Pederson et al., 2011 shows a near neutral or only very slight negative trend in the southern Rockies (Nevada, Utah, Colorado, Wyoming). A negative trend is much more clear for the Cascades, Northern Rockies and Sierra. Therefore, there is a suggestion of a 'systematic decline' but less than consensus. This is because of the significant influence of ENSO on snowpack patterns and trends (up to 50%). That simple point, for which there is full consensus, really should be emphasized here as it is more relevant to the subject of the chapter. Furthermore, there is evidence that Colorado Plateau dust deposition since settlement may be an important factor driving earlier timing of snowpack melting. It remains to be understood how Pacific SSTs and associated dynamics lead to record breaking snowpack extremes set in 2011 (max) and 2012 (min) and this alone should inspire considerably more caution for the language of confidence that is used here. [Government of United States of America]
We have significantly reduced the material on snowpack due to space contraints. In the remaining sentence, we have changed "systematic" to "general."
14-1023 14 63 22 63 24 In the sentence "The decline is particularly large in the late spring, when temperatures rise enough above freezing that warming ought to cause additional snowmelt (Kapnick and Hall, 2011).", the use of the word "ought" should be reviewed. It implies that additional snowmelt has not occurred when the previous two sentences are clear that it has, and the following sentence talks about models underestimating the observed melt. [Government of Canada]
This sentence is deleted in the revision.
14-1024 14 63 24 63 29 "Reductions in western NA snowpack over the last 50 years of the 20th century exceed model estimates of trends expected to occur by change due to internal variability alone (Pierce et al., 2008)" The period 1950-2000 covers a cold to warm PDO cycle, and any trends during this interval are strongly biased (or completely due to) the PDO. ... indicate that anthropogenic changes in snowpack are already underway." [Richard Keen, United States of America]
This passage is deleted in the revision.
14-1025 14 63 24 63 29 "tree-ring evidence reveals that the size and geographical coherence of late 20th century western North American snowpack reductions have no precedent in the last thousand years .... Thus both model and observational evidence indicate anthropogenic changes in snowpack are already underway." Other references (e.g., Meko, Woodhouse, et al., below) show medieval droughts far exceeding anything in recent decades. Thus there is evidence that recent changes are not unusual in the past millennium, and correlate well with PDO. [Richard Keen, United States of America]
This passage is deleted in the revision.
14-1026 14 63 24 63 29 Medieval drought in the upper Colorado River Basin David M. Meko, Connie A. Woodhouse, Christopher A. Baisan, Troy Knight, Jeffrey J. Lukas, Malcolm K. Hughes, and Matthew W. Salzer GEOPHYSICAL RESEARCH LETTERS, VOL. 34, L10705, doi:10.1029/2007GL029988, 2007 [Richard Keen, United States of America]
This passage is deleted in the revision.
14-1027 14 63 28 63 29 This statement should be more carefully phrased. The evidence cited in the previous sentence SUGGEST that anthropogenic changes in snowpack MAY already be underway. There is much paleo evidence (lakes and dendro) that snowpack was as low or lower than present during the Medieval Climatic Anomaly and during the early to middle Holocene (e.g., Meko et al., 2007 GRL 34, L10705, and Anderson 2011, Geology 39, 211-214 and references therein). [Government of United States of America]
This statement is deleted in the revision.
14-1028 14 63 34 63 38 Maybe reword as "It is unclear whether there have been regional trends in mean precipitation ..." [Government of United States of America]
Wording is changed as suggested.
14-1029 14 63 38 63 38 SREX -> Seneviratne et al. 2012 [Thomas Stocker/ WGI TSU, Switzerland] Edit made in revision.
14-1030 14 63 48 Wehner (2012) examined extreme precipitation in the NARCCAP ensemble finding that most of the models had significant biases that were not correlated to their errors in mean precipitation. Michael F. Wehner (2012) Very extreme seasonal precipitation in the NARCCAP ensemble: Model performance and projections. To appear in Climate Dynamics. DOI: 10.1007/s00382-012-1393-1 [Government of United States of America]
Because of space constraints, we had to reduce the space allotted to a discussion of NARCCAP significantly. We were not able to get into details of NARCCAP performance.
14-1031 14 63 50 63 54 suggest to delete the sentences referring to snowpack changes. Snow cover is picked up by Chapter 4, and The material on snowpack has been condensed
Expert and Government Review Comments on the IPCC WGI AR5 Second Order Draft – Chapter 14
Do not Cite, Quote or Distribute Page 81 of 118
Comment No
Chapter
FromPage
FromLine
To Page
To Line Comment Response
therefore our recommendation is that Chapter 14 limits their focus to the core Temperature and Precipitation variables across all regions in section 14.7. [Thomas Stocker/ WGI TSU, Switzerland]
dramatically. It is still mentioned, as it is an important feature of NA climate change. However, there are only a couple of sentences there now.
14-1032 14 63 56 64 2 "higher resolution of regional models almost certainly enhances credibility [of modeling changes in snowpack]": This needs to be substantiated by references. Yes, higher resolution could lead to improved predictions in mountainous areas, but higher credibility is not guaranteed. There could be issues with resolving pressure gradients in steep terrain, interactions of grid-scale and subgrid-scale microphysical processes, estimation of frozen precipitation, and estimation of compaction/melting/freezing/refreezing/albedo of snow in those areas. [Government of United States of America]
This sentence is deleted in the revision.
14-1033 14 63 56 64 2 "[besides snowpack], there is little progress to report in understanding the added value of using regional models to simulate climate change": Actually, lots of work has been done to understand and demonstrate value added by regional models (e.g., Kanamitsu and DeHaan, JGR, 2011; Feser et al., BAMS, 2011; Racherla et al., JGR, 2012; Otte et al., J. Climate, 2012; among many others). Nevertheless, it is appropriate to say that demonstrating value added by regional models is still an ongoing challenge, and much work remains to be done in that arena. [Government of United States of America]
Section 9.6.6 (and section 9.6 generally) has a lot of discussion of this issue. We now refer the reader to this section (and all its references) if he/she wishes to know more.
14-1034 14 64 1 64 2 It would be a good idea to cross-reference chapter 9 section 9.6.4 (added value). Also, nn article about "added value of using regional models to simulate climate change": Di Luca A, Elía R, Laprise R (2012) Potential for small scale added value of RCM’s downscaled climate change signal. Climate Dynamics. doi:10.1007/s00382-012-1415-z. [Ramon de Elia, Canada]
Section 9.6.6 is the appropriate cross-reference (now included). Note that the paper cited in this comment is discussed at length in that section.
14-1035 14 64 1 64 2 Suggest reference to Section 9.6.6 [Markku Rummukainen, Sweden] This section is now cross-referenced.
14-1036 14 64 7 64 7 "Canada/Greenland" should be separated by a comma to read "in Alaska, Canada and Greenland" as these are separate geographic and political regions. [Government of Canada]
Edit made in revision.
14-1037 14 64 12 64 12 "Canada/Greenland" should be separated by a comma to read "in Alaska, Canada and Greenland" as these are separate geographic and political regions. [Government of Canada]
Edit made in revision.
14-1038 14 64 13 64 13 "overwhelm" - wrong word. Better: "…when internal variability due to the wintertime storm track is large enough even to outweigh the large warming signals…" [Martin Stendel, Denmark]
This sentence is deleted in the revision.
14-1039 14 64 18 64 19 suggest to delete the sentences referring to snowpack changes. Snow cover is picked up by Chapter 4, and therefore our recommendation is that Chapter 14 limits their focus to the core Temperature and Precipitation variables across all regions in section 14 [Thomas Stocker/ WGI TSU, Switzerland]
See response to comment #14-1031.
14-1040 14 64 28 64 28 "Canada/Greenland" should be separated by a comma to read "in Alaska, Canada and Greenland" as these are separate geographic and political regions. [Government of Canada]
This sentence is deleted in the revision.
14-1041 14 64 33 64 56 Where "robust" is used throughout this paragraph, is it possible to assign calibrated uncertainty language from the guidance for authors, for example summary terms for evidence and agreement? Also, is "hydro climate" a well-known term with precise meaning? If not, could the term be clarified? [Christopher Field, United States of America]
The words "robust" and "hydroclimate" are no longer used.
14-1042 14 64 37 The robustness of the NA precipitation projection is far more robust under RCP8.5 than under RCP4.5, which is more similar to SRES B1 than the SRES A1B/A2 scenarios [Government of United States of America]
This point is well-taken. Unfortunately, we can't compare emissions scenarios due to space constraints. We also try to be as cosistent as possible with other parts of this report, in particular the Atlas, which in its main version refers to RCP4.5
14-1043 14 64 45 64 46 Suggest considering whether the work of Dai should be referred to here. E.g., Dai, A. 2011. Drought under global warming: a review. WIRES Clim. Change, 2: 45–65. doi: 10.1002/wcc.81; Dai, A. 2012. Increasing drought under global warming in observations and models. Nature Clim. Change. doi: 10.1038/nclimate1633. [Government of Canada]
Dai 2012 is now referenced.
Expert and Government Review Comments on the IPCC WGI AR5 Second Order Draft – Chapter 14
Do not Cite, Quote or Distribute Page 82 of 118
Comment No
Chapter
FromPage
FromLine
To Page
To Line Comment Response
14-1044 14 64 55 64 55 "vulnerable to future reductions in water resource availability" -> please reword to focus on the physical change in water availability. 'Vulnerability' involves an assessment outside the scope of WGI. [Thomas Stocker/ WGI TSU, Switzerland]
This material has been deleted.
14-1045 14 64 56 64 57 In addition to mentioning influence of tropical Pacific SSTs generally, the authors might mention ENSO and possibly PDO specifically. [Government of United States of America]
This material has been deleted.
14-1046 14 65 7 65 7 Central America' -> Do you mean the central area of the United States? Otherwise this is odd, because Central America is assessed in the next section. [Thomas Stocker/ WGI TSU, Switzerland]
The reference to Central America is removed.
14-1047 14 65 10 66 17 Section 14.7.4 Central America and Caribbean: Text was checked for inconsistencies with own professional experience and competency. No relevant disagreements were detected with considered text. [Dirk Thielen, Venezuela]
OK.
14-1048 14 65 35 65 43 The argument given these sentences is convoluted and has little evidence supporting it for the specific case of Caribbean rainfall change. It's part of an SST-based argument that is not well agreed upon the community (see comment on page 27). I would suggest just cutting the sentences. [J. David Neelin, United States of America]
In CMIP3 models the IAS region is the driest in the tropics and the point of the paragraph is to explain why that makes physical sense. That the relationship of local/regional warming to that of the global tropical strip is well established in the literature, but I agree that the text is unclear. I have not cut it out entirely but I have greatly reduced the length with better wording and more references.
14-1049 14 65 35 I suggest inserting a sentence along the lines of: Precipitation reduction over much of the Caribbean and Central America in regions was among the more robust regional precipitation signals within the tropics in CMIP3 models In a region which has a negative trend in observations (Neelin et al. 2006, Rauscher et al. 2008). [References used elsewhere in the chapter but are germane to note here] [J. David Neelin, United States of America]
This information is given now in the supplementary information
14-1050 14 65 46 65 46 total precipitation in the region..--> total precipitation in the region. High-resolution projections with the MRI/JMA 20-km mesh AGCM show reduction in rainfall amounts by 10–20 % for most of the Caribbean during the rainy seasons (Hall et al. 2012). Reference: Hall, T. C., A. M. Sealy, T. S. Stephenson, S. Kusunoki, M. A. Taylor, A. A. Chen and Kitoh, A., 2012. Future climate of the Caribbean from a super-high-resolution atmospheric general circulation model. Theor. Appl. Climatol., doi:10.1007/s00704-012-0779-7. ftp://mri-2.mri-jma.go.jp/skusunok/Rahman_2012_Strategies&Management.pdf [Shoji Kusunoki, Japan]
the text was changed, but this information is given in the Supplementary Information
14-1051 14 65 46 65 47 This sentence seems to be isolated. Is there any connection with the paragraph? [Dabang Jiang, China] The tex was reorganized.
14-1052 14 65 46 65 47 suggest to delete the sentence on AMOC weakening as it seems rather unrelated and misplaced here. [Thomas Stocker/ WGI TSU, Switzerland]
The text was changed
14-1053 14 66 1 66 1 "increases" is better than "changes" [Christopher Folland, United Kingdom of Great Britain & Northern Ireland] The text was changed
14-1054 14 66 19 69 29 This just reads like a review of South American literature. Section needs to be concise. You are not writing a text book. [Phil Jones, United Kingdom of Great Britain & Northern Ireland]
The text was reorganized and reduced. The basic features were transferred to the suplementary material.
14-1055 14 66 19 69 29 Section 14.7.5 South America: Text was checked for inconsistencies with own professional experience and competency. No relevant disagreements were detected with considered text. [Dirk Thielen, Venezuela]
OK.
14-1056 14 66 21 66 28 It would be convenient to start the paragraph with the climatological features (‘The South American Monsoon System (SAMS-Section 14.2.3.2) is responsible for the rainy season in large areas of the continent. The South Atlantic Convergence Zone (SACZ- Section 14.3.1.3) and Atlantic Intertropical Convergence Zone (ITCZ-Section 14.3.1.1) affect precipitation in large areas.’), and then mention the possible sources of variability.
The text was reorganized and changed
Expert and Government Review Comments on the IPCC WGI AR5 Second Order Draft – Chapter 14
Do not Cite, Quote or Distribute Page 83 of 118
Comment No
Chapter
FromPage
FromLine
To Page
To Line Comment Response
Could the Indian Ocean Dipole be considered a teleconnection pattern in the usual meaning? [Alice Grimm, Brazil]
14-1057 14 66 30 66 30 ‘ENSO is one of the main sources of interannual variability.’ It is the main source. If not, it would be worth mentioning the other main sources that have the same level of significant impact, in terms of magnitude and spatial coverage. [Alice Grimm, Brazil]
The text was changed .
14-1058 14 66 30 66 32 An important and opposite signal in also reported in Peruvian and Ecuatorian coast (e.g. Aceituno et al., 1988; Lagos et al., 2008; Takahashi et al 2004) [Jhan Carlo Espinoza, Peru]
The information of ENSO influences in specific regions were transferred to Supplementary Information
14-1059 14 66 30 66 32 ENSO does affect not only Brazil but the whole continent as described in many articles (see review in Garreaud et al 2009). [René Garreaud, Chile]
The information of ENSO influences in specific regions were transferred to Supplementary Information
14-1060 14 66 30 66 32 2003: Seasonality of the ENSO-Related Rainfall Variability in Central Chile and Associated Circulation Anomalies. Journal of Climate [Maisa Rojas, Chile]
Literature previous to 2006 is considered less important as AR5 should be seen against AR4, that did assess such material
14-1061 14 66 30 66 32 This description of El Niño impacts in South America is incomplete, emphasizing only the region east of the Andes. I suggest modifying the paragraph as follows: "ENSO is one of the main sources of interannual variability. During El Niño, coastal northern Peru and Ecuador experience torrential rainfall (Takahashi, 2004, and references therein), while the Central Andes tend to present reduced rainfall (Aceituno, 1988). Similarly, northeast Brazil is affected by droughts in El Niño and floods in La Niña, while large areas of La Plata basin (LPB; southeastern South America) have the opposite signal". References: Takahashi, K., 2004, Annales Geophysicae, doi:10.5194/angeo-22-3917-2004; Aceituno, P., 1988, Mon. Wea. Rev. [Ken Takahashi, Perú]
The information of ENSO influences in specific regions has been transferred to Supplementary Information
14-1062 14 66 32 66 32 add references here, or cross refer to another chapter [Christopher Folland, United Kingdom of Great Britain & Northern Ireland]
The text was reorganized and new references added.
14-1063 14 66 34 66 37 From the first 10 lines of this paragraph, it seems to be related to the influences of the tropical Atlantic SST anomalies. Therefore, the description of the influence of SAM and PSA on southeastern South America seems a little out of place in this paragraph. [Alice Grimm, Brazil]
The text was changed.
14-1064 14 66 34 66 47 suggest to clarify time scale of these changes, e.g., the aerosol effects or the AMOC effects. [Thomas Stocker/ WGI TSU, Switzerland]
OK. An attampt to calify this was made
14-1065 14 66 40 66 40 Include some references as: Yoon and Zeng 2010; and Espinoza et al., (2009 J. Of Hyd.) about negative correlation between tropical nort Atlantic SST and dischaegre on the Amazonean Rivers [Jhan Carlo Espinoza, Peru]
OK. References included.
14-1066 14 66 40 66 42 An article from 2008 is incorrectly used as reference for the 2010 drought in the Amazon. I recommend referencing Espinoza et al. (2011, doi:10.1029/2011GL047862) for this drought. [Ken Takahashi, Perú]
OK. New references were added in Supplementary information
14-1067 14 66 42 66 42 Reference of Marengo et al (2008) is not about 2010 drought. For this propose include: Lewis et al., 2011; Espinoza et al., 2011, Marengo et al., 2011 [Jhan Carlo Espinoza, Peru]
OK. New references added.
14-1068 14 66 49 66 50 Not clear why this general SREX based statement on droughts and floods is included here within a section on South America. Suggest deletion. [Thomas Stocker/ WGI TSU, Switzerland]
OK. Deleted.
14-1069 14 66 49 66 53 Increasing of the extreme hydrological evens is also well identified in the Amazonas - Solimoes river Basin (Espinoza et al 2011 and 2012, Marengo et al., 2011) [Jhan Carlo Espinoza, Peru]
OK. Added.
14-1070 14 66 49 66 53 I am surprised for the references missing about the recent climate evolution in the North of South America, in particular about the Andes and the Amazon regions. I suggest a deeper research about recent scientific literature over these regions. Some references are included them. [Jhan Carlo Espinoza, Peru]
The text was changed and Other references were included in the Supplementary Information
14-1071 14 66 49 66 53 Consider adding: "Another area with observed negative trends in precipitation during the last decades is OK. It was included.
Expert and Government Review Comments on the IPCC WGI AR5 Second Order Draft – Chapter 14
Do not Cite, Quote or Distribute Page 84 of 118
Comment No
Chapter
FromPage
FromLine
To Page
To Line Comment Response
south-central Chile (36-42°S) as reported by Quintana and Aceituno (2011)". The reference is "Quintana, J. and P. Aceituno, 2011: Changes in the rainfall regime along the extratropical west coast of South America (Chile): 30-43º S. Atmosfera, 25, 1-22. [René Garreaud, Chile]
14-1072 14 66 49 66 53 It would be convenient to include here the level of confidence (high confidence, low confidence, etc.) of this increase of floods and extreme droughts in South America, as is done in Chapter 2. There is also a geographically more comprehensive study of extreme precipitation trends in South America that should be included here: Haylock, M. R., T. C. Peterson, L. M. Alves, T. Ambrizzi, Y. M. T. Anunciação, J. Baez, V. R. Barros, M. A. Berlato, M. Bidegain, G. Coronel, V. Corradi, V. J. Garcia, A. M. Grimm, D. Karoly, J. A. Marengo, M. B. Marino, D. F. Moncunill, D. Nechet, J. Quintana, E. Rebello, M. Rusticucci, J. L. Santos, I. Trebejo, and L. A. Vincent, 2006: Trends in total and extreme South American rainfall 1960-2000 and links with sea surface temperature. Journal of Climate, 19, 1490-1512. [Alice Grimm, Brazil]
This reference was in SOD. Whenever is possible, the confidence levels were included.
14-1073 14 66 49 66 57 For the sentence on lines 49-50, it may be helpful to provide a more precise reference to chapter 3 of the special report, ensuring consistency. For the subsequent sentences, it would be preferable to clarify the general time frame for these trends as appropriate. [Christopher Field, United States of America]
OK. The text was changed to clarify.
14-1074 14 66 52 Include more detail on what constitutes a negative trend of extreme precipitation. Does it means a higher probability of negative effects? [Government of Chile]
negative trend means a reduction of wet precipitation extremes. Text has been improved to clarify this
14-1075 14 66 55 66 57 Please add the next paragraph so the discussion on recent temperature trend is complented with the observed trends along western South America. In the next cell I added the references. [René Garreaud, Chile]
OK. The discussion was included.
14-1076 14 66 55 66 57 In contrast with the widespread warming over the interior of the continent, recent studies have shown a prominent but localized coastal cooling (about -0.25/decade, detected in SST and surface air temperature) during the past 30-50 years extending from central Peru (~15°S; Gutierrez et al. 2011a) down to central Chile (~35°S; Falvey and Garreaud 2009), presumably in connection with an increase of the upwelling-favorable winds (Narayan et al. 2010). Such cooling trends are not inconsistent with a global climate change scenario. IPCC-AR4 simulations for the 21st century indicate further enhancement of the surface southerly winds along the Chilean coast (Garreaud and Falvey 2009) but no significant changes off Peru (Goubanova et el. 2010), along with an increase in density stratification at low and subtropical latitudes (Echevin et al. 2011). [René Garreaud, Chile]
This feature was cited with the reference of Garreaud and Falvey. The suggested text was included.
14-1077 14 66 55 66 57 Echevin V.,K. Goubanova, A. Belmadani, B. Dewitte (2012) Change in seasonal cycle of the upwelling of the Humboldt system associated to global warming: a downscaling experiment with the IPSL-CM4 model, Clim.Dyn , DOI 10.1007/s00382-011-1085-2 Falvey, M. and R. Garreaud, 2009: Regional cooling in a warming world: Recent temperature trends in the SE Pacific and along the west coast of subtropical South America (1979-2006). J. Geophys. Res., 114, D04102, doi:10.1029/2008JD010519. Garreaud, R. and M. Falvey, 2009: The coastal winds off western subtropical South America in future climate scenarios. Int. J. of Climatology, 29, 543-554. doi: 10.1002/joc.1716 Gutirrez, D., et al. (2011a), Coastal cooling and increased productivity in the main upwelling zone off Peru since the mid-twentieth century, Geophys. Res. Lett., 38, L07603, doi:10.1029/2010GL046324. Gutirrez, D., A. Bertrand, C. Wosnitza-Mendo, B. Dewitte, S. Purca, C. Pea, A. Chaigneau, J. Tam, M. Graco, V. Echevin, C. Grados, P. Fron & R. Guevara-Carrasco (2011b). Sensibilidad del sistema de afloramiento costero del Per al cambio climático e implicancias ecológicas. Revista Peruana Geo-Atmosférica, en prensa Goubanova, K., Echevin, V., Dewitte, B., Codron, F., Takahashi, K., Terray, P., and Vrac, M. (2010) Statistical downscaling of sea-surface wind over the Peru-Chile upwelling region: diagnosing the impact of climate change from the IPSL-CM4 model. Climate Dynamics, 1-14. [René Garreaud, Chile]
Thank you for the references. Some of them were included.
14-1078 14 66 55 67 2 Recent trends in precipitation and temperature in South America (i.e. not just Brasil and Argentina) have been presented in Haylock et al (2006, doi:10.1175/JCLI3695.1) and Vincent et al (2006, doi:10.1175/JCLI3589.1). These should be discussed. [Ken Takahashi, Perú]
OK. They are included.
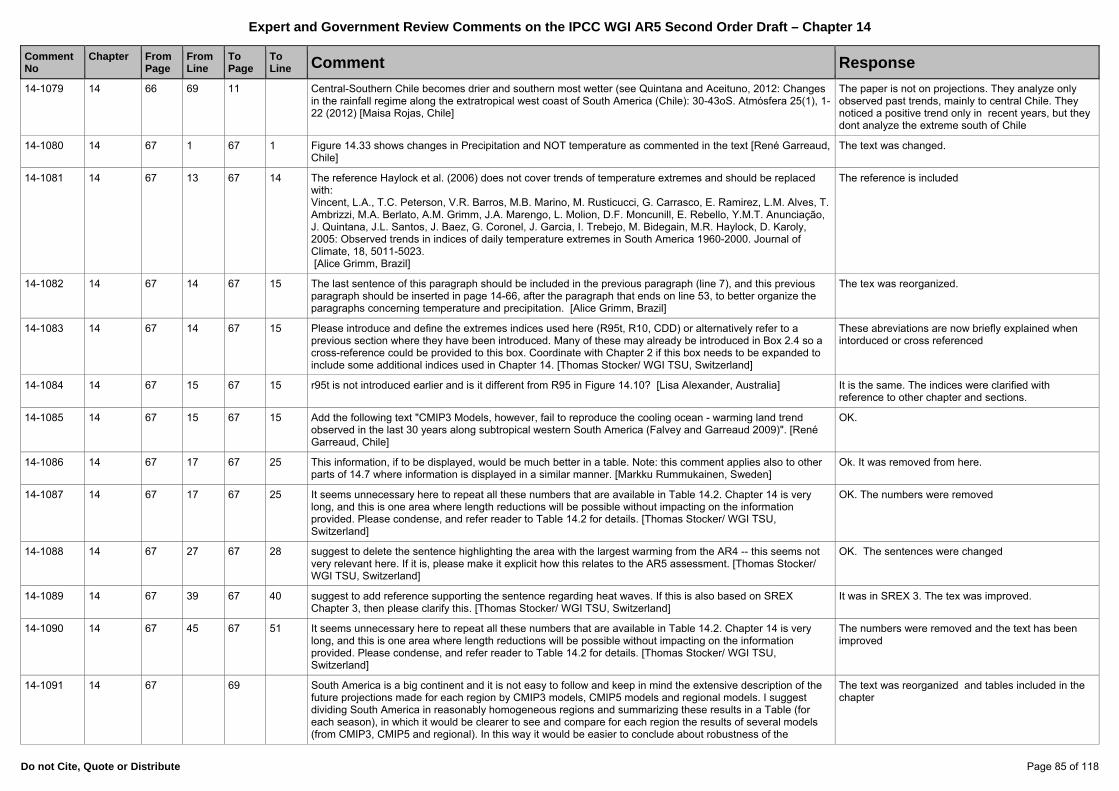
Expert and Government Review Comments on the IPCC WGI AR5 Second Order Draft – Chapter 14
Do not Cite, Quote or Distribute Page 85 of 118
Comment No
Chapter
FromPage
FromLine
To Page
To Line Comment Response
14-1079 14 66 69 11 Central-Southern Chile becomes drier and southern most wetter (see Quintana and Aceituno, 2012: Changes in the rainfall regime along the extratropical west coast of South America (Chile): 30-43oS. Atmósfera 25(1), 1-22 (2012) [Maisa Rojas, Chile]
The paper is not on projections. They analyze only observed past trends, mainly to central Chile. They noticed a positive trend only in recent years, but they dont analyze the extreme south of Chile
14-1080 14 67 1 67 1 Figure 14.33 shows changes in Precipitation and NOT temperature as commented in the text [René Garreaud, Chile]
The text was changed.
14-1081 14 67 13 67 14 The reference Haylock et al. (2006) does not cover trends of temperature extremes and should be replaced with: Vincent, L.A., T.C. Peterson, V.R. Barros, M.B. Marino, M. Rusticucci, G. Carrasco, E. Ramirez, L.M. Alves, T. Ambrizzi, M.A. Berlato, A.M. Grimm, J.A. Marengo, L. Molion, D.F. Moncunill, E. Rebello, Y.M.T. Anunciação, J. Quintana, J.L. Santos, J. Baez, G. Coronel, J. Garcia, I. Trebejo, M. Bidegain, M.R. Haylock, D. Karoly, 2005: Observed trends in indices of daily temperature extremes in South America 1960-2000. Journal of Climate, 18, 5011-5023. [Alice Grimm, Brazil]
The reference is included
14-1082 14 67 14 67 15 The last sentence of this paragraph should be included in the previous paragraph (line 7), and this previous paragraph should be inserted in page 14-66, after the paragraph that ends on line 53, to better organize the paragraphs concerning temperature and precipitation. [Alice Grimm, Brazil]
The tex was reorganized.
14-1083 14 67 14 67 15 Please introduce and define the extremes indices used here (R95t, R10, CDD) or alternatively refer to a previous section where they have been introduced. Many of these may already be introduced in Box 2.4 so a cross-reference could be provided to this box. Coordinate with Chapter 2 if this box needs to be expanded to include some additional indices used in Chapter 14. [Thomas Stocker/ WGI TSU, Switzerland]
These abreviations are now briefly explained when intorduced or cross referenced
14-1084 14 67 15 67 15 r95t is not introduced earlier and is it different from R95 in Figure 14.10? [Lisa Alexander, Australia] It is the same. The indices were clarified with reference to other chapter and sections.
14-1085 14 67 15 67 15 Add the following text "CMIP3 Models, however, fail to reproduce the cooling ocean - warming land trend observed in the last 30 years along subtropical western South America (Falvey and Garreaud 2009)". [René Garreaud, Chile]
OK.
14-1086 14 67 17 67 25 This information, if to be displayed, would be much better in a table. Note: this comment applies also to other parts of 14.7 where information is displayed in a similar manner. [Markku Rummukainen, Sweden]
Ok. It was removed from here.
14-1087 14 67 17 67 25 It seems unnecessary here to repeat all these numbers that are available in Table 14.2. Chapter 14 is very long, and this is one area where length reductions will be possible without impacting on the information provided. Please condense, and refer reader to Table 14.2 for details. [Thomas Stocker/ WGI TSU, Switzerland]
OK. The numbers were removed
14-1088 14 67 27 67 28 suggest to delete the sentence highlighting the area with the largest warming from the AR4 -- this seems not very relevant here. If it is, please make it explicit how this relates to the AR5 assessment. [Thomas Stocker/ WGI TSU, Switzerland]
OK. The sentences were changed
14-1089 14 67 39 67 40 suggest to add reference supporting the sentence regarding heat waves. If this is also based on SREX Chapter 3, then please clarify this. [Thomas Stocker/ WGI TSU, Switzerland]
It was in SREX 3. The tex was improved.
14-1090 14 67 45 67 51 It seems unnecessary here to repeat all these numbers that are available in Table 14.2. Chapter 14 is very long, and this is one area where length reductions will be possible without impacting on the information provided. Please condense, and refer reader to Table 14.2 for details. [Thomas Stocker/ WGI TSU, Switzerland]
The numbers were removed and the text has been improved
14-1091 14 67 69 South America is a big continent and it is not easy to follow and keep in mind the extensive description of the future projections made for each region by CMIP3 models, CMIP5 models and regional models. I suggest dividing South America in reasonably homogeneous regions and summarizing these results in a Table (for each season), in which it would be clearer to see and compare for each region the results of several models (from CMIP3, CMIP5 and regional). In this way it would be easier to conclude about robustness of the
The text was reorganized and tables included in the chapter
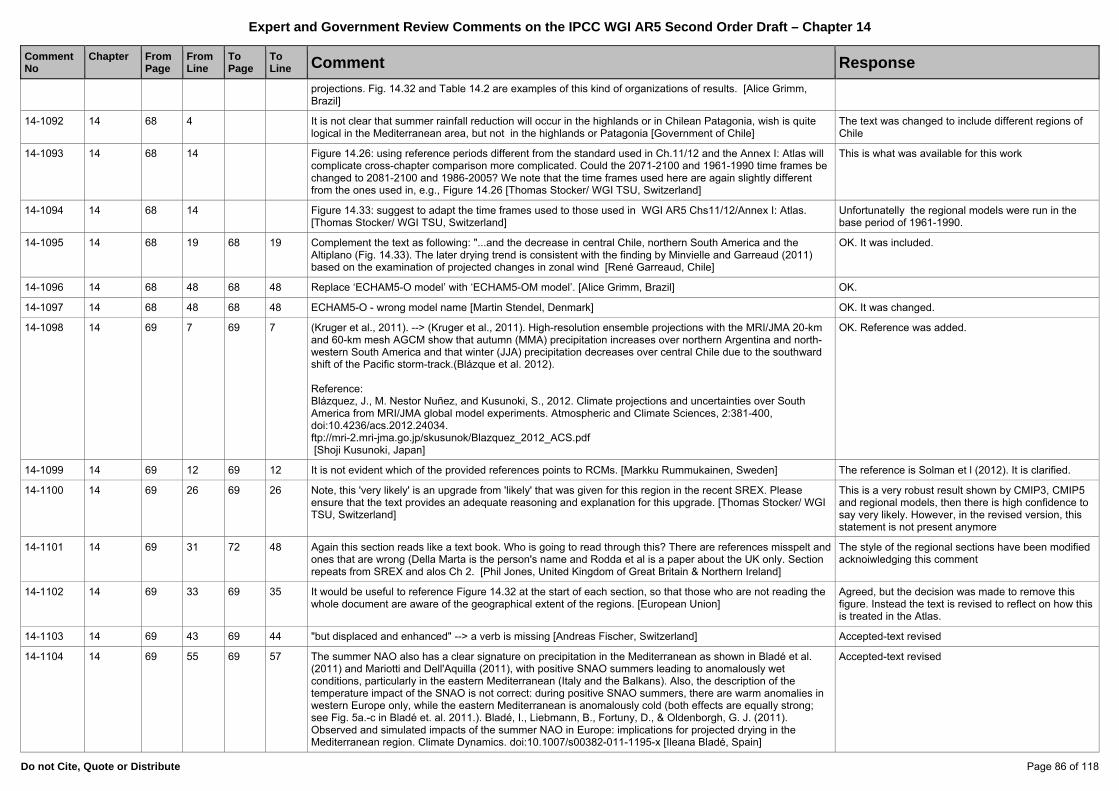
Expert and Government Review Comments on the IPCC WGI AR5 Second Order Draft – Chapter 14
Do not Cite, Quote or Distribute Page 86 of 118
Comment No
Chapter
FromPage
FromLine
To Page
To Line Comment Response
projections. Fig. 14.32 and Table 14.2 are examples of this kind of organizations of results. [Alice Grimm, Brazil]
14-1092 14 68 4 It is not clear that summer rainfall reduction will occur in the highlands or in Chilean Patagonia, wish is quite logical in the Mediterranean area, but not in the highlands or Patagonia [Government of Chile]
The text was changed to include different regions of Chile
14-1093 14 68 14 Figure 14.26: using reference periods different from the standard used in Ch.11/12 and the Annex I: Atlas will complicate cross-chapter comparison more complicated. Could the 2071-2100 and 1961-1990 time frames be changed to 2081-2100 and 1986-2005? We note that the time frames used here are again slightly different from the ones used in, e.g., Figure 14.26 [Thomas Stocker/ WGI TSU, Switzerland]
This is what was available for this work
14-1094 14 68 14 Figure 14.33: suggest to adapt the time frames used to those used in WGI AR5 Chs11/12/Annex I: Atlas. [Thomas Stocker/ WGI TSU, Switzerland]
Unfortunatelly the regional models were run in the base period of 1961-1990.
14-1095 14 68 19 68 19 Complement the text as following: "...and the decrease in central Chile, northern South America and the Altiplano (Fig. 14.33). The later drying trend is consistent with the finding by Minvielle and Garreaud (2011) based on the examination of projected changes in zonal wind [René Garreaud, Chile]
OK. It was included.
14-1096 14 68 48 68 48 Replace ‘ECHAM5-O model’ with ‘ECHAM5-OM model’. [Alice Grimm, Brazil] OK.
14-1097 14 68 48 68 48 ECHAM5-O - wrong model name [Martin Stendel, Denmark] OK. It was changed.
14-1098 14 69 7 69 7 (Kruger et al., 2011). --> (Kruger et al., 2011). High-resolution ensemble projections with the MRI/JMA 20-km and 60-km mesh AGCM show that autumn (MMA) precipitation increases over northern Argentina and north-western South America and that winter (JJA) precipitation decreases over central Chile due to the southward shift of the Pacific storm-track.(Blázque et al. 2012). Reference: Blázquez, J., M. Nestor Nuñez, and Kusunoki, S., 2012. Climate projections and uncertainties over South America from MRI/JMA global model experiments. Atmospheric and Climate Sciences, 2:381-400, doi:10.4236/acs.2012.24034. ftp://mri-2.mri-jma.go.jp/skusunok/Blazquez_2012_ACS.pdf [Shoji Kusunoki, Japan]
OK. Reference was added.
14-1099 14 69 12 69 12 It is not evident which of the provided references points to RCMs. [Markku Rummukainen, Sweden] The reference is Solman et l (2012). It is clarified.
14-1100 14 69 26 69 26 Note, this 'very likely' is an upgrade from 'likely' that was given for this region in the recent SREX. Please ensure that the text provides an adequate reasoning and explanation for this upgrade. [Thomas Stocker/ WGI TSU, Switzerland]
This is a very robust result shown by CMIP3, CMIP5 and regional models, then there is high confidence to say very likely. However, in the revised version, this statement is not present anymore
14-1101 14 69 31 72 48 Again this section reads like a text book. Who is going to read through this? There are references misspelt and ones that are wrong (Della Marta is the person's name and Rodda et al is a paper about the UK only. Section repeats from SREX and alos Ch 2. [Phil Jones, United Kingdom of Great Britain & Northern Ireland]
The style of the regional sections have been modified acknoiwledging this comment
14-1102 14 69 33 69 35 It would be useful to reference Figure 14.32 at the start of each section, so that those who are not reading the whole document are aware of the geographical extent of the regions. [European Union]
Agreed, but the decision was made to remove this figure. Instead the text is revised to reflect on how this is treated in the Atlas.
14-1103 14 69 43 69 44 "but displaced and enhanced" --> a verb is missing [Andreas Fischer, Switzerland] Accepted-text revised
14-1104 14 69 55 69 57 The summer NAO also has a clear signature on precipitation in the Mediterranean as shown in Bladé et al. (2011) and Mariotti and Dell'Aquilla (2011), with positive SNAO summers leading to anomalously wet conditions, particularly in the eastern Mediterranean (Italy and the Balkans). Also, the description of the temperature impact of the SNAO is not correct: during positive SNAO summers, there are warm anomalies in western Europe only, while the eastern Mediterranean is anomalously cold (both effects are equally strong; see Fig. 5a.-c in Bladé et. al. 2011.). Bladé, I., Liebmann, B., Fortuny, D., & Oldenborgh, G. J. (2011). Observed and simulated impacts of the summer NAO in Europe: implications for projected drying in the Mediterranean region. Climate Dynamics. doi:10.1007/s00382-011-1195-x [Ileana Bladé, Spain]
Accepted-text revised
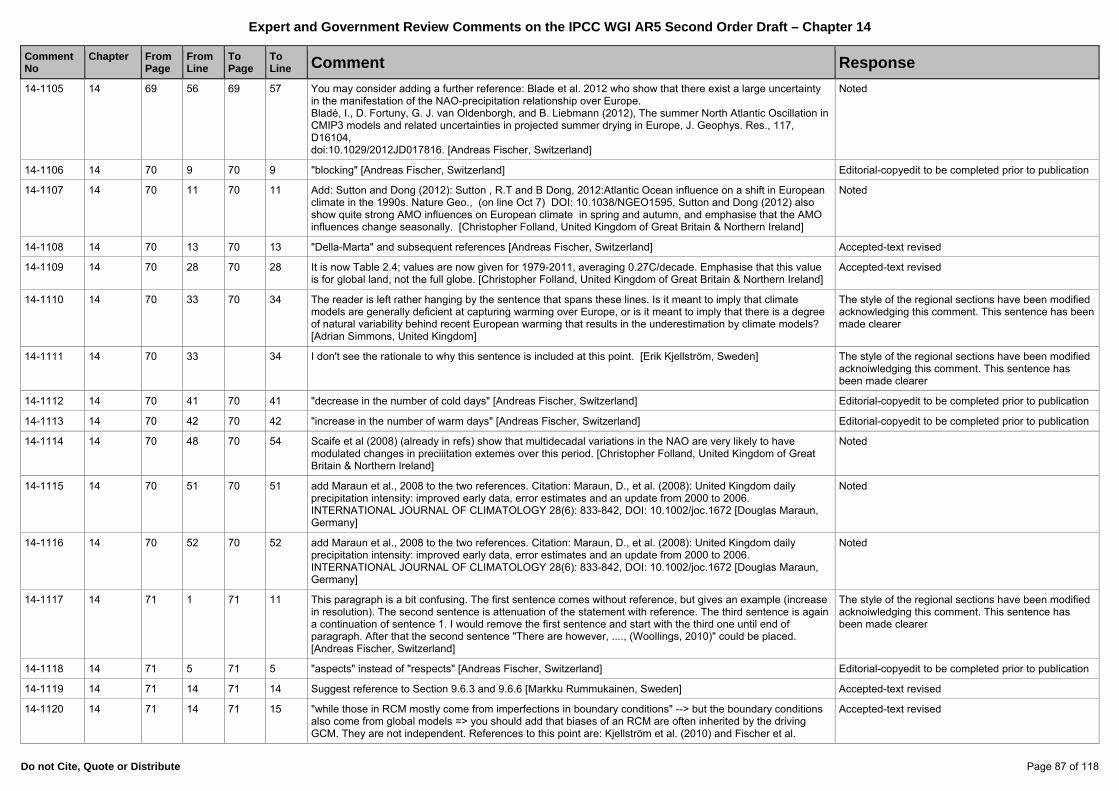
Expert and Government Review Comments on the IPCC WGI AR5 Second Order Draft – Chapter 14
Do not Cite, Quote or Distribute Page 87 of 118
Comment No
Chapter
FromPage
FromLine
To Page
To Line Comment Response
14-1105 14 69 56 69 57 You may consider adding a further reference: Blade et al. 2012 who show that there exist a large uncertainty in the manifestation of the NAO-precipitation relationship over Europe. Bladé, I., D. Fortuny, G. J. van Oldenborgh, and B. Liebmann (2012), The summer North Atlantic Oscillation inCMIP3 models and related uncertainties in projected summer drying in Europe, J. Geophys. Res., 117, D16104, doi:10.1029/2012JD017816. [Andreas Fischer, Switzerland]
Noted
14-1106 14 70 9 70 9 "blocking" [Andreas Fischer, Switzerland] Editorial-copyedit to be completed prior to publication
14-1107 14 70 11 70 11 Add: Sutton and Dong (2012): Sutton , R.T and B Dong, 2012:Atlantic Ocean influence on a shift in European climate in the 1990s. Nature Geo., (on line Oct 7) DOI: 10.1038/NGEO1595, Sutton and Dong (2012) also show quite strong AMO influences on European climate in spring and autumn, and emphasise that the AMO influences change seasonally. [Christopher Folland, United Kingdom of Great Britain & Northern Ireland]
Noted
14-1108 14 70 13 70 13 "Della-Marta" and subsequent references [Andreas Fischer, Switzerland] Accepted-text revised
14-1109 14 70 28 70 28 It is now Table 2.4; values are now given for 1979-2011, averaging 0.27C/decade. Emphasise that this value is for global land, not the full globe. [Christopher Folland, United Kingdom of Great Britain & Northern Ireland]
Accepted-text revised
14-1110 14 70 33 70 34 The reader is left rather hanging by the sentence that spans these lines. Is it meant to imply that climate models are generally deficient at capturing warming over Europe, or is it meant to imply that there is a degree of natural variability behind recent European warming that results in the underestimation by climate models? [Adrian Simmons, United Kingdom]
The style of the regional sections have been modified acknowledging this comment. This sentence has been made clearer
14-1111 14 70 33 34 I don't see the rationale to why this sentence is included at this point. [Erik Kjellström, Sweden] The style of the regional sections have been modified acknoiwledging this comment. This sentence has been made clearer
14-1112 14 70 41 70 41 "decrease in the number of cold days" [Andreas Fischer, Switzerland] Editorial-copyedit to be completed prior to publication
14-1113 14 70 42 70 42 "increase in the number of warm days" [Andreas Fischer, Switzerland] Editorial-copyedit to be completed prior to publication
14-1114 14 70 48 70 54 Scaife et al (2008) (already in refs) show that multidecadal variations in the NAO are very likely to have modulated changes in preciiitation extemes over this period. [Christopher Folland, United Kingdom of Great Britain & Northern Ireland]
Noted
14-1115 14 70 51 70 51 add Maraun et al., 2008 to the two references. Citation: Maraun, D., et al. (2008): United Kingdom daily precipitation intensity: improved early data, error estimates and an update from 2000 to 2006. INTERNATIONAL JOURNAL OF CLIMATOLOGY 28(6): 833-842, DOI: 10.1002/joc.1672 [Douglas Maraun, Germany]
Noted
14-1116 14 70 52 70 52 add Maraun et al., 2008 to the two references. Citation: Maraun, D., et al. (2008): United Kingdom daily precipitation intensity: improved early data, error estimates and an update from 2000 to 2006. INTERNATIONAL JOURNAL OF CLIMATOLOGY 28(6): 833-842, DOI: 10.1002/joc.1672 [Douglas Maraun, Germany]
Noted
14-1117 14 71 1 71 11 This paragraph is a bit confusing. The first sentence comes without reference, but gives an example (increase in resolution). The second sentence is attenuation of the statement with reference. The third sentence is again a continuation of sentence 1. I would remove the first sentence and start with the third one until end of paragraph. After that the second sentence "There are however, ...., (Woollings, 2010)" could be placed. [Andreas Fischer, Switzerland]
The style of the regional sections have been modified acknoiwledging this comment. This sentence has been made clearer
14-1118 14 71 5 71 5 "aspects" instead of "respects" [Andreas Fischer, Switzerland] Editorial-copyedit to be completed prior to publication
14-1119 14 71 14 71 14 Suggest reference to Section 9.6.3 and 9.6.6 [Markku Rummukainen, Sweden] Accepted-text revised
14-1120 14 71 14 71 15 "while those in RCM mostly come from imperfections in boundary conditions" --> but the boundary conditions also come from global models => you should add that biases of an RCM are often inherited by the driving GCM. They are not independent. References to this point are: Kjellström et al. (2010) and Fischer et al.
Accepted-text revised
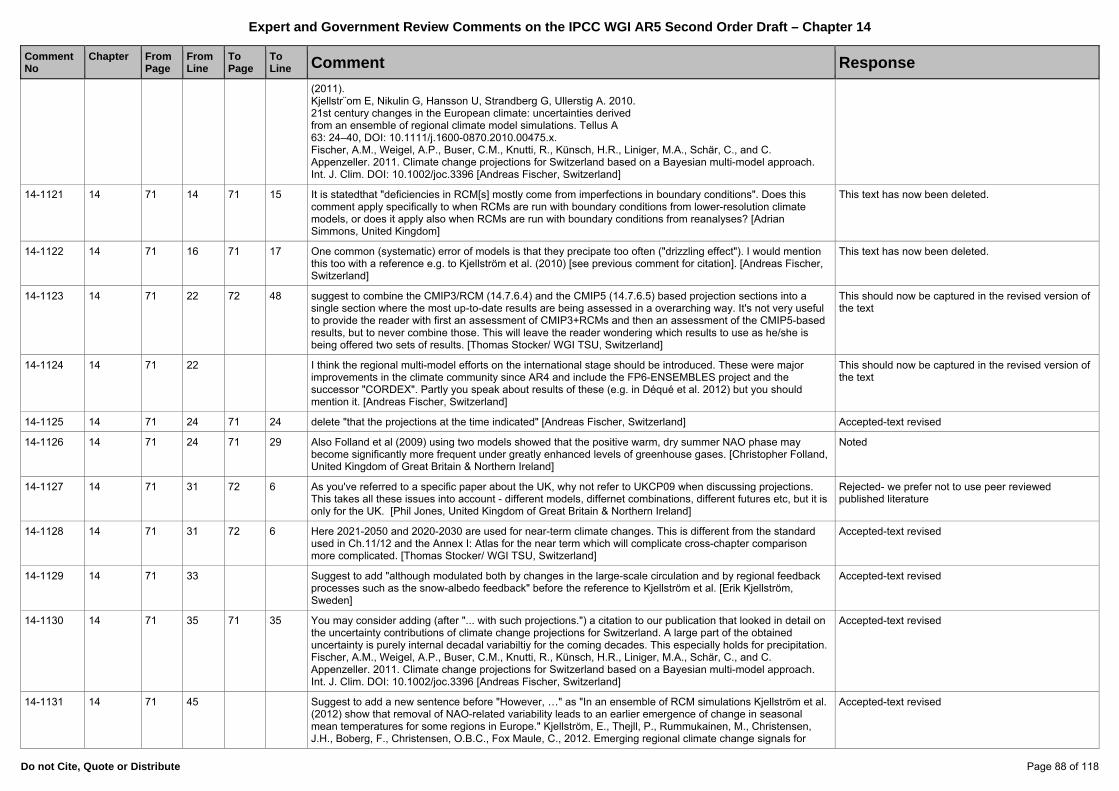
Expert and Government Review Comments on the IPCC WGI AR5 Second Order Draft – Chapter 14
Do not Cite, Quote or Distribute Page 88 of 118
Comment No
Chapter
FromPage
FromLine
To Page
To Line Comment Response
(2011). Kjellstr¨om E, Nikulin G, Hansson U, Strandberg G, Ullerstig A. 2010. 21st century changes in the European climate: uncertainties derived from an ensemble of regional climate model simulations. Tellus A 63: 24–40, DOI: 10.1111/j.1600-0870.2010.00475.x. Fischer, A.M., Weigel, A.P., Buser, C.M., Knutti, R., Künsch, H.R., Liniger, M.A., Schär, C., and C. Appenzeller. 2011. Climate change projections for Switzerland based on a Bayesian multi-model approach. Int. J. Clim. DOI: 10.1002/joc.3396 [Andreas Fischer, Switzerland]
14-1121 14 71 14 71 15 It is statedthat "deficiencies in RCM[s] mostly come from imperfections in boundary conditions". Does this comment apply specifically to when RCMs are run with boundary conditions from lower-resolution climate models, or does it apply also when RCMs are run with boundary conditions from reanalyses? [Adrian Simmons, United Kingdom]
This text has now been deleted.
14-1122 14 71 16 71 17 One common (systematic) error of models is that they precipate too often ("drizzling effect"). I would mention this too with a reference e.g. to Kjellström et al. (2010) [see previous comment for citation]. [Andreas Fischer, Switzerland]
This text has now been deleted.
14-1123 14 71 22 72 48 suggest to combine the CMIP3/RCM (14.7.6.4) and the CMIP5 (14.7.6.5) based projection sections into a single section where the most up-to-date results are being assessed in a overarching way. It's not very useful to provide the reader with first an assessment of CMIP3+RCMs and then an assessment of the CMIP5-based results, but to never combine those. This will leave the reader wondering which results to use as he/she is being offered two sets of results. [Thomas Stocker/ WGI TSU, Switzerland]
This should now be captured in the revised version of the text
14-1124 14 71 22 I think the regional multi-model efforts on the international stage should be introduced. These were major improvements in the climate community since AR4 and include the FP6-ENSEMBLES project and the successor "CORDEX". Partly you speak about results of these (e.g. in Déqué et al. 2012) but you should mention it. [Andreas Fischer, Switzerland]
This should now be captured in the revised version of the text
14-1125 14 71 24 71 24 delete "that the projections at the time indicated" [Andreas Fischer, Switzerland] Accepted-text revised
14-1126 14 71 24 71 29 Also Folland et al (2009) using two models showed that the positive warm, dry summer NAO phase may become significantly more frequent under greatly enhanced levels of greenhouse gases. [Christopher Folland, United Kingdom of Great Britain & Northern Ireland]
Noted
14-1127 14 71 31 72 6 As you've referred to a specific paper about the UK, why not refer to UKCP09 when discussing projections. This takes all these issues into account - different models, differnet combinations, different futures etc, but it is only for the UK. [Phil Jones, United Kingdom of Great Britain & Northern Ireland]
Rejected- we prefer not to use peer reviewed published literature
14-1128 14 71 31 72 6 Here 2021-2050 and 2020-2030 are used for near-term climate changes. This is different from the standard used in Ch.11/12 and the Annex I: Atlas for the near term which will complicate cross-chapter comparison more complicated. [Thomas Stocker/ WGI TSU, Switzerland]
Accepted-text revised
14-1129 14 71 33 Suggest to add "although modulated both by changes in the large-scale circulation and by regional feedback processes such as the snow-albedo feedback" before the reference to Kjellström et al. [Erik Kjellström, Sweden]
Accepted-text revised
14-1130 14 71 35 71 35 You may consider adding (after "... with such projections.") a citation to our publication that looked in detail on the uncertainty contributions of climate change projections for Switzerland. A large part of the obtained uncertainty is purely internal decadal variabiltiy for the coming decades. This especially holds for precipitation.Fischer, A.M., Weigel, A.P., Buser, C.M., Knutti, R., Künsch, H.R., Liniger, M.A., Schär, C., and C. Appenzeller. 2011. Climate change projections for Switzerland based on a Bayesian multi-model approach. Int. J. Clim. DOI: 10.1002/joc.3396 [Andreas Fischer, Switzerland]
Accepted-text revised
14-1131 14 71 45 Suggest to add a new sentence before "However, …" as "In an ensemble of RCM simulations Kjellström et al. (2012) show that removal of NAO-related variability leads to an earlier emergence of change in seasonal mean temperatures for some regions in Europe." Kjellström, E., Thejll, P., Rummukainen, M., Christensen, J.H., Boberg, F., Christensen, O.B.C., Fox Maule, C., 2012. Emerging regional climate change signals for
Accepted-text revised
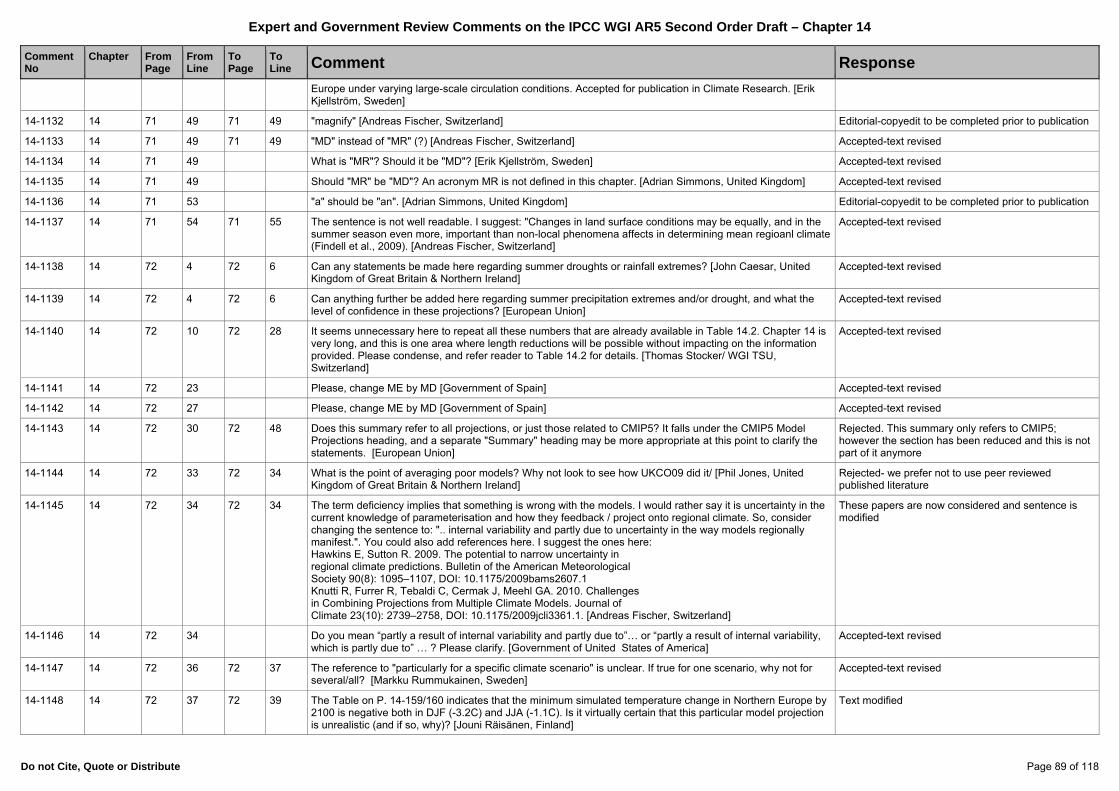
Expert and Government Review Comments on the IPCC WGI AR5 Second Order Draft – Chapter 14
Do not Cite, Quote or Distribute Page 89 of 118
Comment No
Chapter
FromPage
FromLine
To Page
To Line Comment Response
Europe under varying large-scale circulation conditions. Accepted for publication in Climate Research. [Erik Kjellström, Sweden]
14-1132 14 71 49 71 49 "magnify" [Andreas Fischer, Switzerland] Editorial-copyedit to be completed prior to publication
14-1133 14 71 49 71 49 "MD" instead of "MR" (?) [Andreas Fischer, Switzerland] Accepted-text revised
14-1134 14 71 49 What is "MR"? Should it be "MD"? [Erik Kjellström, Sweden] Accepted-text revised
14-1135 14 71 49 Should "MR" be "MD"? An acronym MR is not defined in this chapter. [Adrian Simmons, United Kingdom] Accepted-text revised
14-1136 14 71 53 "a" should be "an". [Adrian Simmons, United Kingdom] Editorial-copyedit to be completed prior to publication
14-1137 14 71 54 71 55 The sentence is not well readable. I suggest: "Changes in land surface conditions may be equally, and in the summer season even more, important than non-local phenomena affects in determining mean regioanl climate (Findell et al., 2009). [Andreas Fischer, Switzerland]
Accepted-text revised
14-1138 14 72 4 72 6 Can any statements be made here regarding summer droughts or rainfall extremes? [John Caesar, United Kingdom of Great Britain & Northern Ireland]
Accepted-text revised
14-1139 14 72 4 72 6 Can anything further be added here regarding summer precipitation extremes and/or drought, and what the level of confidence in these projections? [European Union]
Accepted-text revised
14-1140 14 72 10 72 28 It seems unnecessary here to repeat all these numbers that are already available in Table 14.2. Chapter 14 is very long, and this is one area where length reductions will be possible without impacting on the information provided. Please condense, and refer reader to Table 14.2 for details. [Thomas Stocker/ WGI TSU, Switzerland]
Accepted-text revised
14-1141 14 72 23 Please, change ME by MD [Government of Spain] Accepted-text revised
14-1142 14 72 27 Please, change ME by MD [Government of Spain] Accepted-text revised
14-1143 14 72 30 72 48 Does this summary refer to all projections, or just those related to CMIP5? It falls under the CMIP5 Model Projections heading, and a separate "Summary" heading may be more appropriate at this point to clarify the statements. [European Union]
Rejected. This summary only refers to CMIP5; however the section has been reduced and this is not part of it anymore
14-1144 14 72 33 72 34 What is the point of averaging poor models? Why not look to see how UKCO09 did it/ [Phil Jones, United Kingdom of Great Britain & Northern Ireland]
Rejected- we prefer not to use peer reviewed published literature
14-1145 14 72 34 72 34 The term deficiency implies that something is wrong with the models. I would rather say it is uncertainty in the current knowledge of parameterisation and how they feedback / project onto regional climate. So, consider changing the sentence to: ".. internal variability and partly due to uncertainty in the way models regionally manifest.". You could also add references here. I suggest the ones here: Hawkins E, Sutton R. 2009. The potential to narrow uncertainty in regional climate predictions. Bulletin of the American Meteorological Society 90(8): 1095–1107, DOI: 10.1175/2009bams2607.1 Knutti R, Furrer R, Tebaldi C, Cermak J, Meehl GA. 2010. Challenges in Combining Projections from Multiple Climate Models. Journal of Climate 23(10): 2739–2758, DOI: 10.1175/2009jcli3361.1. [Andreas Fischer, Switzerland]
These papers are now considered and sentence is modified
14-1146 14 72 34 Do you mean “partly a result of internal variability and partly due to”… or “partly a result of internal variability, which is partly due to” … ? Please clarify. [Government of United States of America]
Accepted-text revised
14-1147 14 72 36 72 37 The reference to "particularly for a specific climate scenario" is unclear. If true for one scenario, why not for several/all? [Markku Rummukainen, Sweden]
Accepted-text revised
14-1148 14 72 37 72 39 The Table on P. 14-159/160 indicates that the minimum simulated temperature change in Northern Europe by 2100 is negative both in DJF (-3.2C) and JJA (-1.1C). Is it virtually certain that this particular model projection is unrealistic (and if so, why)? [Jouni Räisänen, Finland]
Text modified
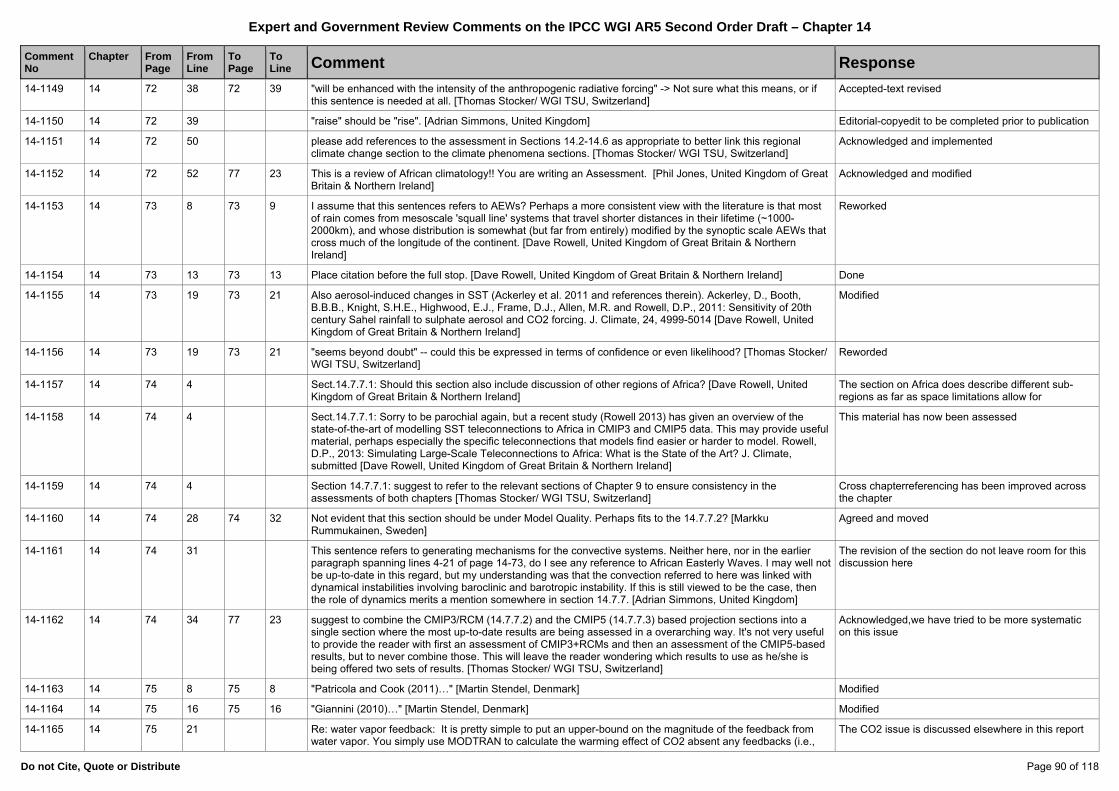
Expert and Government Review Comments on the IPCC WGI AR5 Second Order Draft – Chapter 14
Do not Cite, Quote or Distribute Page 90 of 118
Comment No
Chapter
FromPage
FromLine
To Page
To Line Comment Response
14-1149 14 72 38 72 39 "will be enhanced with the intensity of the anthropogenic radiative forcing" -> Not sure what this means, or if this sentence is needed at all. [Thomas Stocker/ WGI TSU, Switzerland]
Accepted-text revised
14-1150 14 72 39 "raise" should be "rise". [Adrian Simmons, United Kingdom] Editorial-copyedit to be completed prior to publication
14-1151 14 72 50 please add references to the assessment in Sections 14.2-14.6 as appropriate to better link this regional climate change section to the climate phenomena sections. [Thomas Stocker/ WGI TSU, Switzerland]
Acknowledged and implemented
14-1152 14 72 52 77 23 This is a review of African climatology!! You are writing an Assessment. [Phil Jones, United Kingdom of Great Britain & Northern Ireland]
Acknowledged and modified
14-1153 14 73 8 73 9 I assume that this sentences refers to AEWs? Perhaps a more consistent view with the literature is that most of rain comes from mesoscale 'squall line' systems that travel shorter distances in their lifetime (~1000-2000km), and whose distribution is somewhat (but far from entirely) modified by the synoptic scale AEWs that cross much of the longitude of the continent. [Dave Rowell, United Kingdom of Great Britain & Northern Ireland]
Reworked
14-1154 14 73 13 73 13 Place citation before the full stop. [Dave Rowell, United Kingdom of Great Britain & Northern Ireland] Done
14-1155 14 73 19 73 21 Also aerosol-induced changes in SST (Ackerley et al. 2011 and references therein). Ackerley, D., Booth, B.B.B., Knight, S.H.E., Highwood, E.J., Frame, D.J., Allen, M.R. and Rowell, D.P., 2011: Sensitivity of 20th century Sahel rainfall to sulphate aerosol and CO2 forcing. J. Climate, 24, 4999-5014 [Dave Rowell, United Kingdom of Great Britain & Northern Ireland]
Modified
14-1156 14 73 19 73 21 "seems beyond doubt" -- could this be expressed in terms of confidence or even likelihood? [Thomas Stocker/ WGI TSU, Switzerland]
Reworded
14-1157 14 74 4 Sect.14.7.7.1: Should this section also include discussion of other regions of Africa? [Dave Rowell, United Kingdom of Great Britain & Northern Ireland]
The section on Africa does describe different sub-regions as far as space limitations allow for
14-1158 14 74 4 Sect.14.7.7.1: Sorry to be parochial again, but a recent study (Rowell 2013) has given an overview of the state-of-the-art of modelling SST teleconnections to Africa in CMIP3 and CMIP5 data. This may provide useful material, perhaps especially the specific teleconnections that models find easier or harder to model. Rowell, D.P., 2013: Simulating Large-Scale Teleconnections to Africa: What is the State of the Art? J. Climate, submitted [Dave Rowell, United Kingdom of Great Britain & Northern Ireland]
This material has now been assessed
14-1159 14 74 4 Section 14.7.7.1: suggest to refer to the relevant sections of Chapter 9 to ensure consistency in the assessments of both chapters [Thomas Stocker/ WGI TSU, Switzerland]
Cross chapterreferencing has been improved across the chapter
14-1160 14 74 28 74 32 Not evident that this section should be under Model Quality. Perhaps fits to the 14.7.7.2? [Markku Rummukainen, Sweden]
Agreed and moved
14-1161 14 74 31 This sentence refers to generating mechanisms for the convective systems. Neither here, nor in the earlier paragraph spanning lines 4-21 of page 14-73, do I see any reference to African Easterly Waves. I may well not be up-to-date in this regard, but my understanding was that the convection referred to here was linked with dynamical instabilities involving baroclinic and barotropic instability. If this is still viewed to be the case, then the role of dynamics merits a mention somewhere in section 14.7.7. [Adrian Simmons, United Kingdom]
The revision of the section do not leave room for this discussion here
14-1162 14 74 34 77 23 suggest to combine the CMIP3/RCM (14.7.7.2) and the CMIP5 (14.7.7.3) based projection sections into a single section where the most up-to-date results are being assessed in a overarching way. It's not very useful to provide the reader with first an assessment of CMIP3+RCMs and then an assessment of the CMIP5-based results, but to never combine those. This will leave the reader wondering which results to use as he/she is being offered two sets of results. [Thomas Stocker/ WGI TSU, Switzerland]
Acknowledged,we have tried to be more systematic on this issue
14-1163 14 75 8 75 8 "Patricola and Cook (2011)…" [Martin Stendel, Denmark] Modified
14-1164 14 75 16 75 16 "Giannini (2010)…" [Martin Stendel, Denmark] Modified
14-1165 14 75 21 Re: water vapor feedback: It is pretty simple to put an upper-bound on the magnitude of the feedback from water vapor. You simply use MODTRAN to calculate the warming effect of CO2 absent any feedbacks (i.e.,
The CO2 issue is discussed elsewhere in this report
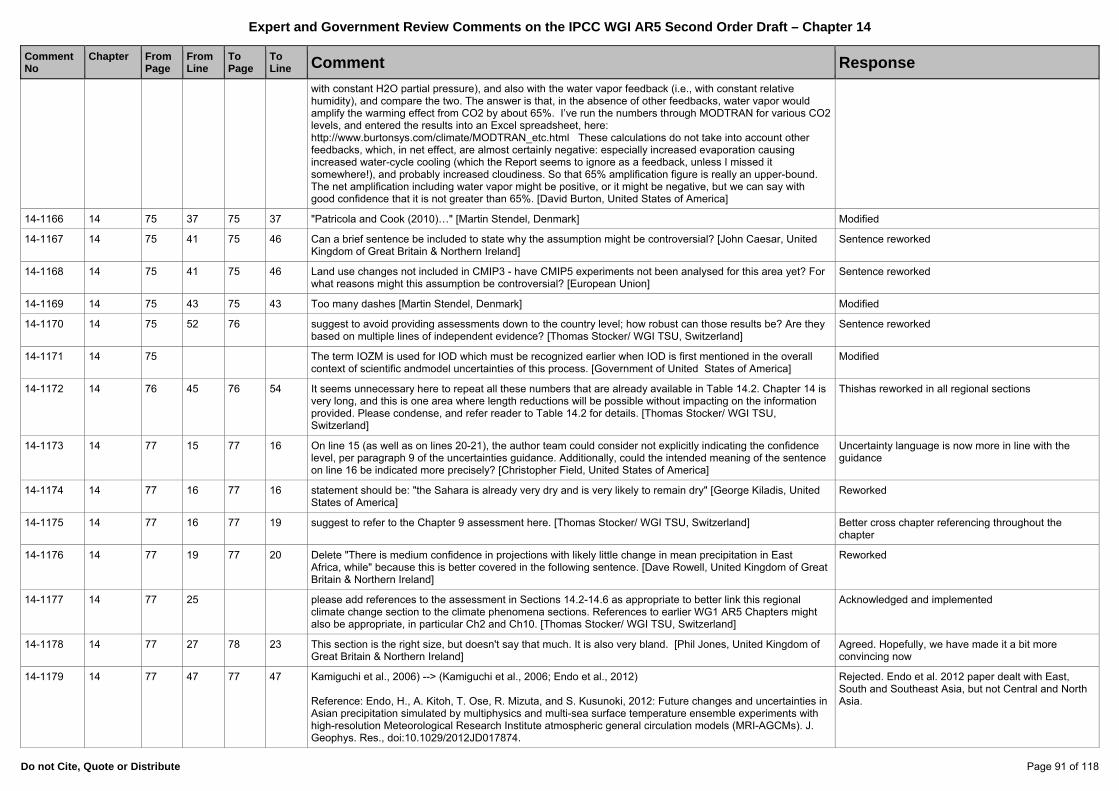
Expert and Government Review Comments on the IPCC WGI AR5 Second Order Draft – Chapter 14
Do not Cite, Quote or Distribute Page 91 of 118
Comment No
Chapter
FromPage
FromLine
To Page
To Line Comment Response
with constant H2O partial pressure), and also with the water vapor feedback (i.e., with constant relative humidity), and compare the two. The answer is that, in the absence of other feedbacks, water vapor would amplify the warming effect from CO2 by about 65%. I’ve run the numbers through MODTRAN for various CO2 levels, and entered the results into an Excel spreadsheet, here: http://www.burtonsys.com/climate/MODTRAN_etc.html These calculations do not take into account other feedbacks, which, in net effect, are almost certainly negative: especially increased evaporation causing increased water-cycle cooling (which the Report seems to ignore as a feedback, unless I missed it somewhere!), and probably increased cloudiness. So that 65% amplification figure is really an upper-bound. The net amplification including water vapor might be positive, or it might be negative, but we can say with good confidence that it is not greater than 65%. [David Burton, United States of America]
14-1166 14 75 37 75 37 "Patricola and Cook (2010)…" [Martin Stendel, Denmark] Modified
14-1167 14 75 41 75 46 Can a brief sentence be included to state why the assumption might be controversial? [John Caesar, United Kingdom of Great Britain & Northern Ireland]
Sentence reworked
14-1168 14 75 41 75 46 Land use changes not included in CMIP3 - have CMIP5 experiments not been analysed for this area yet? For what reasons might this assumption be controversial? [European Union]
Sentence reworked
14-1169 14 75 43 75 43 Too many dashes [Martin Stendel, Denmark] Modified
14-1170 14 75 52 76 suggest to avoid providing assessments down to the country level; how robust can those results be? Are they based on multiple lines of independent evidence? [Thomas Stocker/ WGI TSU, Switzerland]
Sentence reworked
14-1171 14 75 The term IOZM is used for IOD which must be recognized earlier when IOD is first mentioned in the overall context of scientific andmodel uncertainties of this process. [Government of United States of America]
Modified
14-1172 14 76 45 76 54 It seems unnecessary here to repeat all these numbers that are already available in Table 14.2. Chapter 14 is very long, and this is one area where length reductions will be possible without impacting on the information provided. Please condense, and refer reader to Table 14.2 for details. [Thomas Stocker/ WGI TSU, Switzerland]
Thishas reworked in all regional sections
14-1173 14 77 15 77 16 On line 15 (as well as on lines 20-21), the author team could consider not explicitly indicating the confidence level, per paragraph 9 of the uncertainties guidance. Additionally, could the intended meaning of the sentence on line 16 be indicated more precisely? [Christopher Field, United States of America]
Uncertainty language is now more in line with the guidance
14-1174 14 77 16 77 16 statement should be: "the Sahara is already very dry and is very likely to remain dry" [George Kiladis, United States of America]
Reworked
14-1175 14 77 16 77 19 suggest to refer to the Chapter 9 assessment here. [Thomas Stocker/ WGI TSU, Switzerland] Better cross chapter referencing throughout the chapter
14-1176 14 77 19 77 20 Delete "There is medium confidence in projections with likely little change in mean precipitation in East Africa, while" because this is better covered in the following sentence. [Dave Rowell, United Kingdom of Great Britain & Northern Ireland]
Reworked
14-1177 14 77 25 please add references to the assessment in Sections 14.2-14.6 as appropriate to better link this regional climate change section to the climate phenomena sections. References to earlier WG1 AR5 Chapters might also be appropriate, in particular Ch2 and Ch10. [Thomas Stocker/ WGI TSU, Switzerland]
Acknowledged and implemented
14-1178 14 77 27 78 23 This section is the right size, but doesn't say that much. It is also very bland. [Phil Jones, United Kingdom of Great Britain & Northern Ireland]
Agreed. Hopefully, we have made it a bit more convincing now
14-1179 14 77 47 77 47 Kamiguchi et al., 2006) --> (Kamiguchi et al., 2006; Endo et al., 2012) Reference: Endo, H., A. Kitoh, T. Ose, R. Mizuta, and S. Kusunoki, 2012: Future changes and uncertainties in Asian precipitation simulated by multiphysics and multi-sea surface temperature ensemble experiments with high-resolution Meteorological Research Institute atmospheric general circulation models (MRI-AGCMs). J. Geophys. Res., doi:10.1029/2012JD017874.
Rejected. Endo et al. 2012 paper dealt with East, South and Southeast Asia, but not Central and North Asia.
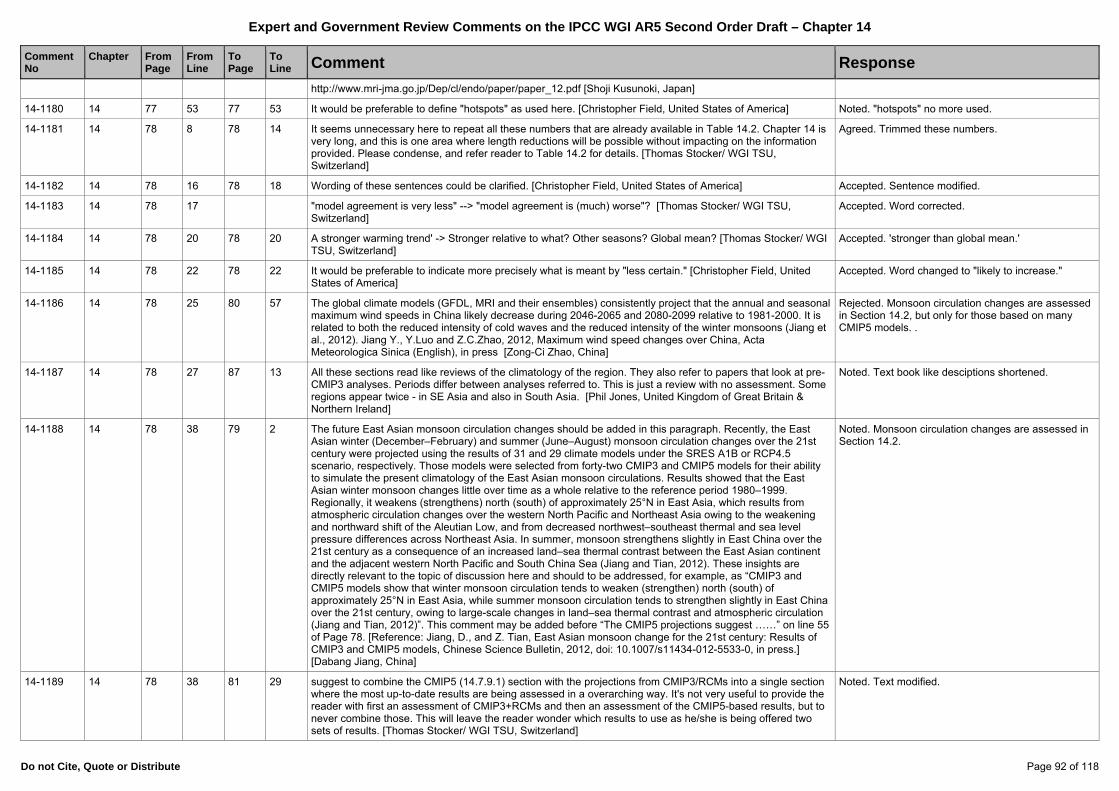
Expert and Government Review Comments on the IPCC WGI AR5 Second Order Draft – Chapter 14
Do not Cite, Quote or Distribute Page 92 of 118
Comment No
Chapter
FromPage
FromLine
To Page
To Line Comment Response
http://www.mri-jma.go.jp/Dep/cl/endo/paper/paper_12.pdf [Shoji Kusunoki, Japan]
14-1180 14 77 53 77 53 It would be preferable to define "hotspots" as used here. [Christopher Field, United States of America] Noted. "hotspots" no more used.
14-1181 14 78 8 78 14 It seems unnecessary here to repeat all these numbers that are already available in Table 14.2. Chapter 14 is very long, and this is one area where length reductions will be possible without impacting on the information provided. Please condense, and refer reader to Table 14.2 for details. [Thomas Stocker/ WGI TSU, Switzerland]
Agreed. Trimmed these numbers.
14-1182 14 78 16 78 18 Wording of these sentences could be clarified. [Christopher Field, United States of America] Accepted. Sentence modified.
14-1183 14 78 17 "model agreement is very less" --> "model agreement is (much) worse"? [Thomas Stocker/ WGI TSU, Switzerland]
Accepted. Word corrected.
14-1184 14 78 20 78 20 A stronger warming trend' -> Stronger relative to what? Other seasons? Global mean? [Thomas Stocker/ WGI TSU, Switzerland]
Accepted. 'stronger than global mean.'
14-1185 14 78 22 78 22 It would be preferable to indicate more precisely what is meant by "less certain." [Christopher Field, United States of America]
Accepted. Word changed to "likely to increase."
14-1186 14 78 25 80 57 The global climate models (GFDL, MRI and their ensembles) consistently project that the annual and seasonal maximum wind speeds in China likely decrease during 2046-2065 and 2080-2099 relative to 1981-2000. It is related to both the reduced intensity of cold waves and the reduced intensity of the winter monsoons (Jiang et al., 2012). Jiang Y., Y.Luo and Z.C.Zhao, 2012, Maximum wind speed changes over China, Acta Meteorologica Sinica (English), in press [Zong-Ci Zhao, China]
Rejected. Monsoon circulation changes are assessed in Section 14.2, but only for those based on many CMIP5 models. .
14-1187 14 78 27 87 13 All these sections read like reviews of the climatology of the region. They also refer to papers that look at pre-CMIP3 analyses. Periods differ between analyses referred to. This is just a review with no assessment. Some regions appear twice - in SE Asia and also in South Asia. [Phil Jones, United Kingdom of Great Britain & Northern Ireland]
Noted. Text book like desciptions shortened.
14-1188 14 78 38 79 2 The future East Asian monsoon circulation changes should be added in this paragraph. Recently, the East Asian winter (December–February) and summer (June–August) monsoon circulation changes over the 21st century were projected using the results of 31 and 29 climate models under the SRES A1B or RCP4.5 scenario, respectively. Those models were selected from forty-two CMIP3 and CMIP5 models for their ability to simulate the present climatology of the East Asian monsoon circulations. Results showed that the East Asian winter monsoon changes little over time as a whole relative to the reference period 1980–1999. Regionally, it weakens (strengthens) north (south) of approximately 25°N in East Asia, which results from atmospheric circulation changes over the western North Pacific and Northeast Asia owing to the weakening and northward shift of the Aleutian Low, and from decreased northwest–southeast thermal and sea level pressure differences across Northeast Asia. In summer, monsoon strengthens slightly in East China over the 21st century as a consequence of an increased land–sea thermal contrast between the East Asian continent and the adjacent western North Pacific and South China Sea (Jiang and Tian, 2012). These insights are directly relevant to the topic of discussion here and should to be addressed, for example, as “CMIP3 and CMIP5 models show that winter monsoon circulation tends to weaken (strengthen) north (south) of approximately 25°N in East Asia, while summer monsoon circulation tends to strengthen slightly in East China over the 21st century, owing to large-scale changes in land–sea thermal contrast and atmospheric circulation (Jiang and Tian, 2012)”. This comment may be added before “The CMIP5 projections suggest ……” on line 55 of Page 78. [Reference: Jiang, D., and Z. Tian, East Asian monsoon change for the 21st century: Results of CMIP3 and CMIP5 models, Chinese Science Bulletin, 2012, doi: 10.1007/s11434-012-5533-0, in press.] [Dabang Jiang, China]
Noted. Monsoon circulation changes are assessed in Section 14.2.
14-1189 14 78 38 81 29 suggest to combine the CMIP5 (14.7.9.1) section with the projections from CMIP3/RCMs into a single section where the most up-to-date results are being assessed in a overarching way. It's not very useful to provide the reader with first an assessment of CMIP3+RCMs and then an assessment of the CMIP5-based results, but to never combine those. This will leave the reader wonder which results to use as he/she is being offered two sets of results. [Thomas Stocker/ WGI TSU, Switzerland]
Noted. Text modified.
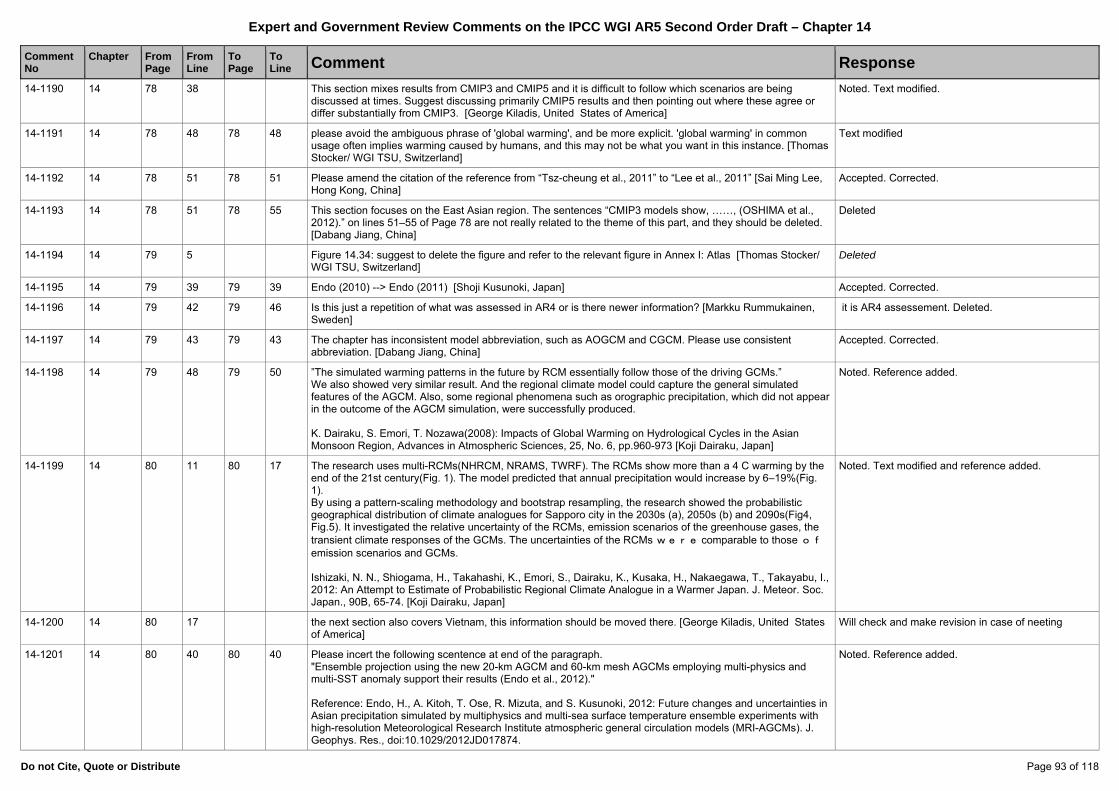
Expert and Government Review Comments on the IPCC WGI AR5 Second Order Draft – Chapter 14
Do not Cite, Quote or Distribute Page 93 of 118
Comment No
Chapter
FromPage
FromLine
To Page
To Line Comment Response
14-1190 14 78 38 This section mixes results from CMIP3 and CMIP5 and it is difficult to follow which scenarios are being discussed at times. Suggest discussing primarily CMIP5 results and then pointing out where these agree or differ substantially from CMIP3. [George Kiladis, United States of America]
Noted. Text modified.
14-1191 14 78 48 78 48 please avoid the ambiguous phrase of 'global warming', and be more explicit. 'global warming' in common usage often implies warming caused by humans, and this may not be what you want in this instance. [Thomas Stocker/ WGI TSU, Switzerland]
Text modified
14-1192 14 78 51 78 51 Please amend the citation of the reference from “Tsz-cheung et al., 2011” to “Lee et al., 2011” [Sai Ming Lee, Hong Kong, China]
Accepted. Corrected.
14-1193 14 78 51 78 55 This section focuses on the East Asian region. The sentences “CMIP3 models show, ……, (OSHIMA et al., 2012).” on lines 51–55 of Page 78 are not really related to the theme of this part, and they should be deleted. [Dabang Jiang, China]
Deleted
14-1194 14 79 5 Figure 14.34: suggest to delete the figure and refer to the relevant figure in Annex I: Atlas [Thomas Stocker/ WGI TSU, Switzerland]
Deleted
14-1195 14 79 39 79 39 Endo (2010) --> Endo (2011) [Shoji Kusunoki, Japan] Accepted. Corrected.
14-1196 14 79 42 79 46 Is this just a repetition of what was assessed in AR4 or is there newer information? [Markku Rummukainen, Sweden]
it is AR4 assessement. Deleted.
14-1197 14 79 43 79 43 The chapter has inconsistent model abbreviation, such as AOGCM and CGCM. Please use consistent abbreviation. [Dabang Jiang, China]
Accepted. Corrected.
14-1198 14 79 48 79 50 ”The simulated warming patterns in the future by RCM essentially follow those of the driving GCMs.” We also showed very similar result. And the regional climate model could capture the general simulated features of the AGCM. Also, some regional phenomena such as orographic precipitation, which did not appear in the outcome of the AGCM simulation, were successfully produced. K. Dairaku, S. Emori, T. Nozawa(2008): Impacts of Global Warming on Hydrological Cycles in the Asian Monsoon Region, Advances in Atmospheric Sciences, 25, No. 6, pp.960-973 [Koji Dairaku, Japan]
Noted. Reference added.
14-1199 14 80 11 80 17 The research uses multi-RCMs(NHRCM, NRAMS, TWRF). The RCMs show more than a 4 C warming by the end of the 21st century(Fig. 1). The model predicted that annual precipitation would increase by 6–19%(Fig. 1). By using a pattern-scaling methodology and bootstrap resampling, the research showed the probabilistic geographical distribution of climate analogues for Sapporo city in the 2030s (a), 2050s (b) and 2090s(Fig4, Fig.5). It investigated the relative uncertainty of the RCMs, emission scenarios of the greenhouse gases, the transient climate responses of the GCMs. The uncertainties of the RCMs were comparable to those of emission scenarios and GCMs. Ishizaki, N. N., Shiogama, H., Takahashi, K., Emori, S., Dairaku, K., Kusaka, H., Nakaegawa, T., Takayabu, I., 2012: An Attempt to Estimate of Probabilistic Regional Climate Analogue in a Warmer Japan. J. Meteor. Soc. Japan., 90B, 65-74. [Koji Dairaku, Japan]
Noted. Text modified and reference added.
14-1200 14 80 17 the next section also covers Vietnam, this information should be moved there. [George Kiladis, United States of America]
Will check and make revision in case of neeting
14-1201 14 80 40 80 40 Please incert the following scentence at end of the paragraph. "Ensemble projection using the new 20-km AGCM and 60-km mesh AGCMs employing multi-physics and multi-SST anomaly support their results (Endo et al., 2012)." Reference: Endo, H., A. Kitoh, T. Ose, R. Mizuta, and S. Kusunoki, 2012: Future changes and uncertainties in Asian precipitation simulated by multiphysics and multi-sea surface temperature ensemble experiments with high-resolution Meteorological Research Institute atmospheric general circulation models (MRI-AGCMs). J. Geophys. Res., doi:10.1029/2012JD017874.
Noted. Reference added.
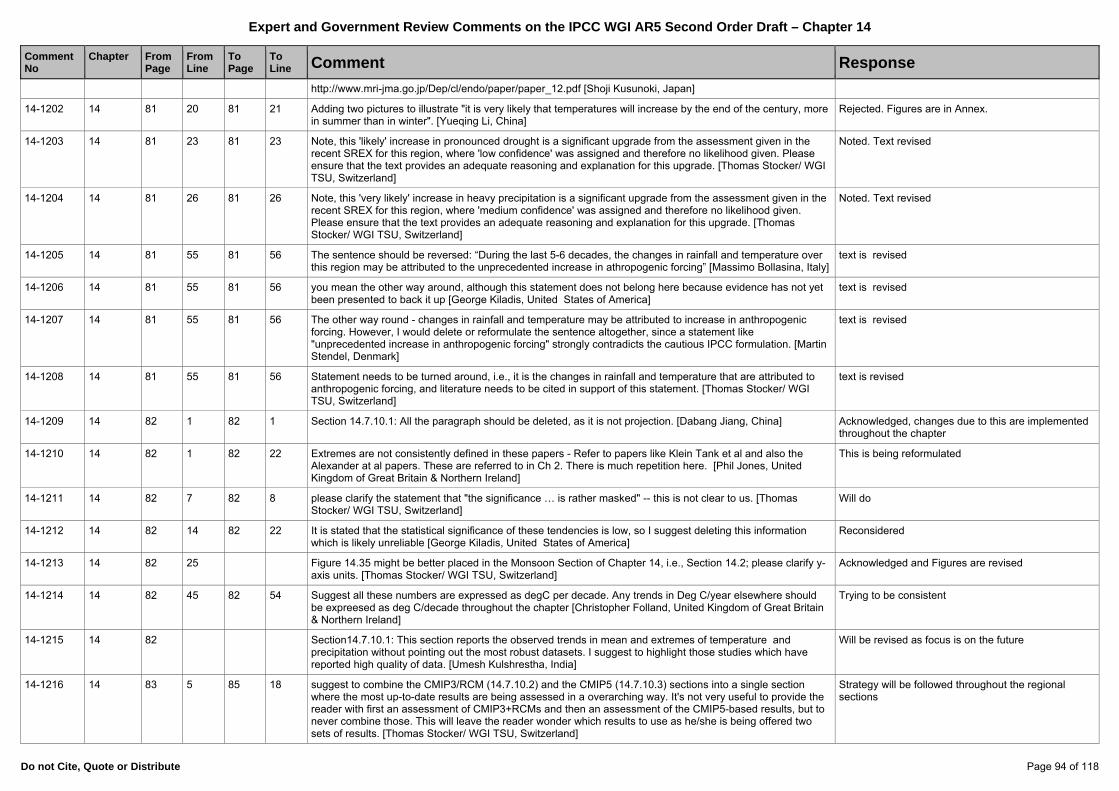
Expert and Government Review Comments on the IPCC WGI AR5 Second Order Draft – Chapter 14
Do not Cite, Quote or Distribute Page 94 of 118
Comment No
Chapter
FromPage
FromLine
To Page
To Line Comment Response
http://www.mri-jma.go.jp/Dep/cl/endo/paper/paper_12.pdf [Shoji Kusunoki, Japan]
14-1202 14 81 20 81 21 Adding two pictures to illustrate "it is very likely that temperatures will increase by the end of the century, more in summer than in winter". [Yueqing Li, China]
Rejected. Figures are in Annex.
14-1203 14 81 23 81 23 Note, this 'likely' increase in pronounced drought is a significant upgrade from the assessment given in the recent SREX for this region, where 'low confidence' was assigned and therefore no likelihood given. Please ensure that the text provides an adequate reasoning and explanation for this upgrade. [Thomas Stocker/ WGI TSU, Switzerland]
Noted. Text revised
14-1204 14 81 26 81 26 Note, this 'very likely' increase in heavy precipitation is a significant upgrade from the assessment given in the recent SREX for this region, where 'medium confidence' was assigned and therefore no likelihood given. Please ensure that the text provides an adequate reasoning and explanation for this upgrade. [Thomas Stocker/ WGI TSU, Switzerland]
Noted. Text revised
14-1205 14 81 55 81 56 The sentence should be reversed: “During the last 5-6 decades, the changes in rainfall and temperature over this region may be attributed to the unprecedented increase in athropogenic forcing” [Massimo Bollasina, Italy]
text is revised
14-1206 14 81 55 81 56 you mean the other way around, although this statement does not belong here because evidence has not yet been presented to back it up [George Kiladis, United States of America]
text is revised
14-1207 14 81 55 81 56 The other way round - changes in rainfall and temperature may be attributed to increase in anthropogenic forcing. However, I would delete or reformulate the sentence altogether, since a statement like "unprecedented increase in anthropogenic forcing" strongly contradicts the cautious IPCC formulation. [Martin Stendel, Denmark]
text is revised
14-1208 14 81 55 81 56 Statement needs to be turned around, i.e., it is the changes in rainfall and temperature that are attributed to anthropogenic forcing, and literature needs to be cited in support of this statement. [Thomas Stocker/ WGI TSU, Switzerland]
text is revised
14-1209 14 82 1 82 1 Section 14.7.10.1: All the paragraph should be deleted, as it is not projection. [Dabang Jiang, China] Acknowledged, changes due to this are implemented throughout the chapter
14-1210 14 82 1 82 22 Extremes are not consistently defined in these papers - Refer to papers like Klein Tank et al and also the Alexander at al papers. These are referred to in Ch 2. There is much repetition here. [Phil Jones, United Kingdom of Great Britain & Northern Ireland]
This is being reformulated
14-1211 14 82 7 82 8 please clarify the statement that "the significance … is rather masked" -- this is not clear to us. [Thomas Stocker/ WGI TSU, Switzerland]
Will do
14-1212 14 82 14 82 22 It is stated that the statistical significance of these tendencies is low, so I suggest deleting this information which is likely unreliable [George Kiladis, United States of America]
Reconsidered
14-1213 14 82 25 Figure 14.35 might be better placed in the Monsoon Section of Chapter 14, i.e., Section 14.2; please clarify y-axis units. [Thomas Stocker/ WGI TSU, Switzerland]
Acknowledged and Figures are revised
14-1214 14 82 45 82 54 Suggest all these numbers are expressed as degC per decade. Any trends in Deg C/year elsewhere should be expreesed as deg C/decade throughout the chapter [Christopher Folland, United Kingdom of Great Britain & Northern Ireland]
Trying to be consistent
14-1215 14 82 Section14.7.10.1: This section reports the observed trends in mean and extremes of temperature and precipitation without pointing out the most robust datasets. I suggest to highlight those studies which have reported high quality of data. [Umesh Kulshrestha, India]
Will be revised as focus is on the future
14-1216 14 83 5 85 18 suggest to combine the CMIP3/RCM (14.7.10.2) and the CMIP5 (14.7.10.3) sections into a single section where the most up-to-date results are being assessed in a overarching way. It's not very useful to provide the reader with first an assessment of CMIP3+RCMs and then an assessment of the CMIP5-based results, but to never combine those. This will leave the reader wonder which results to use as he/she is being offered two sets of results. [Thomas Stocker/ WGI TSU, Switzerland]
Strategy will be followed throughout the regional sections
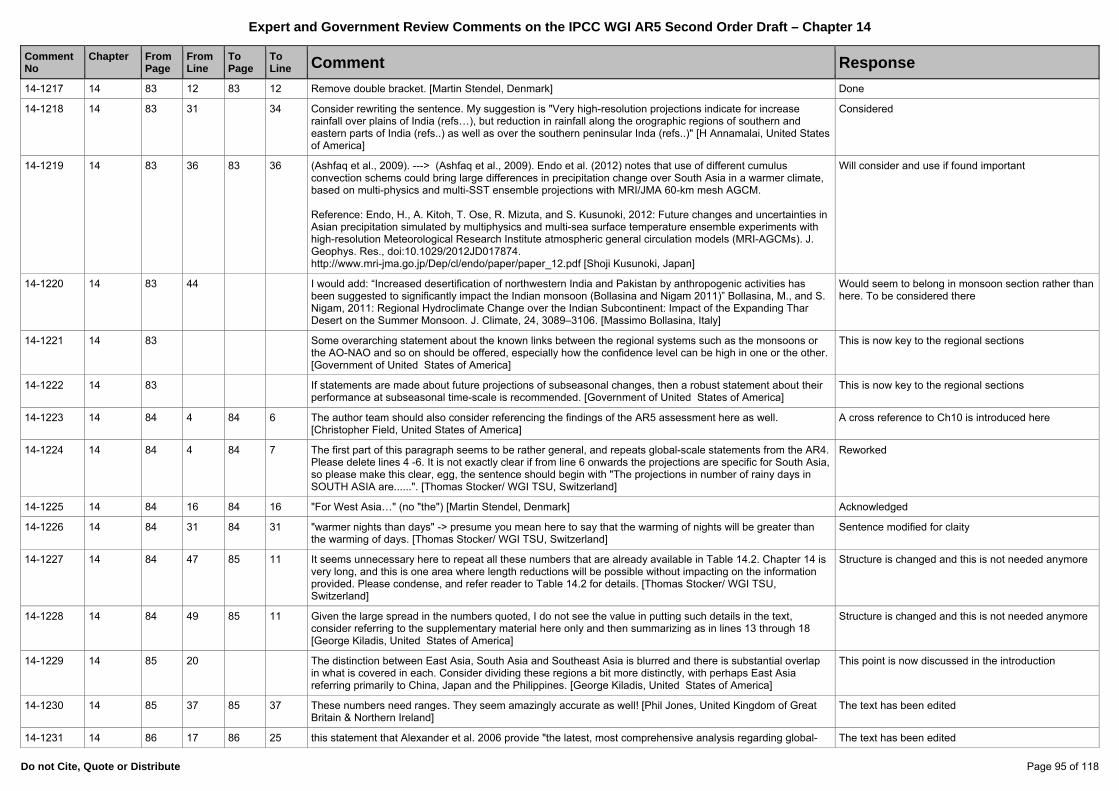
Expert and Government Review Comments on the IPCC WGI AR5 Second Order Draft – Chapter 14
Do not Cite, Quote or Distribute Page 95 of 118
Comment No
Chapter
FromPage
FromLine
To Page
To Line Comment Response
14-1217 14 83 12 83 12 Remove double bracket. [Martin Stendel, Denmark] Done
14-1218 14 83 31 34 Consider rewriting the sentence. My suggestion is "Very high-resolution projections indicate for increase rainfall over plains of India (refs…), but reduction in rainfall along the orographic regions of southern and eastern parts of India (refs..) as well as over the southern peninsular Inda (refs..)" [H Annamalai, United States of America]
Considered
14-1219 14 83 36 83 36 (Ashfaq et al., 2009). ---> (Ashfaq et al., 2009). Endo et al. (2012) notes that use of different cumulus convection schems could bring large differences in precipitation change over South Asia in a warmer climate, based on multi-physics and multi-SST ensemble projections with MRI/JMA 60-km mesh AGCM. Reference: Endo, H., A. Kitoh, T. Ose, R. Mizuta, and S. Kusunoki, 2012: Future changes and uncertainties in Asian precipitation simulated by multiphysics and multi-sea surface temperature ensemble experiments with high-resolution Meteorological Research Institute atmospheric general circulation models (MRI-AGCMs). J. Geophys. Res., doi:10.1029/2012JD017874. http://www.mri-jma.go.jp/Dep/cl/endo/paper/paper_12.pdf [Shoji Kusunoki, Japan]
Will consider and use if found important
14-1220 14 83 44 I would add: “Increased desertification of northwestern India and Pakistan by anthropogenic activities has been suggested to significantly impact the Indian monsoon (Bollasina and Nigam 2011)” Bollasina, M., and S. Nigam, 2011: Regional Hydroclimate Change over the Indian Subcontinent: Impact of the Expanding Thar Desert on the Summer Monsoon. J. Climate, 24, 3089–3106. [Massimo Bollasina, Italy]
Would seem to belong in monsoon section rather than here. To be considered there
14-1221 14 83 Some overarching statement about the known links between the regional systems such as the monsoons or the AO-NAO and so on should be offered, especially how the confidence level can be high in one or the other. [Government of United States of America]
This is now key to the regional sections
14-1222 14 83 If statements are made about future projections of subseasonal changes, then a robust statement about their performance at subseasonal time-scale is recommended. [Government of United States of America]
This is now key to the regional sections
14-1223 14 84 4 84 6 The author team should also consider referencing the findings of the AR5 assessment here as well. [Christopher Field, United States of America]
A cross reference to Ch10 is introduced here
14-1224 14 84 4 84 7 The first part of this paragraph seems to be rather general, and repeats global-scale statements from the AR4. Please delete lines 4 -6. It is not exactly clear if from line 6 onwards the projections are specific for South Asia, so please make this clear, egg, the sentence should begin with "The projections in number of rainy days in SOUTH ASIA are......". [Thomas Stocker/ WGI TSU, Switzerland]
Reworked
14-1225 14 84 16 84 16 "For West Asia…" (no "the") [Martin Stendel, Denmark] Acknowledged
14-1226 14 84 31 84 31 "warmer nights than days" -> presume you mean here to say that the warming of nights will be greater than the warming of days. [Thomas Stocker/ WGI TSU, Switzerland]
Sentence modified for claity
14-1227 14 84 47 85 11 It seems unnecessary here to repeat all these numbers that are already available in Table 14.2. Chapter 14 is very long, and this is one area where length reductions will be possible without impacting on the information provided. Please condense, and refer reader to Table 14.2 for details. [Thomas Stocker/ WGI TSU, Switzerland]
Structure is changed and this is not needed anymore
14-1228 14 84 49 85 11 Given the large spread in the numbers quoted, I do not see the value in putting such details in the text, consider referring to the supplementary material here only and then summarizing as in lines 13 through 18 [George Kiladis, United States of America]
Structure is changed and this is not needed anymore
14-1229 14 85 20 The distinction between East Asia, South Asia and Southeast Asia is blurred and there is substantial overlap in what is covered in each. Consider dividing these regions a bit more distinctly, with perhaps East Asia referring primarily to China, Japan and the Philippines. [George Kiladis, United States of America]
This point is now discussed in the introduction
14-1230 14 85 37 85 37 These numbers need ranges. They seem amazingly accurate as well! [Phil Jones, United Kingdom of Great Britain & Northern Ireland]
The text has been edited
14-1231 14 86 17 86 25 this statement that Alexander et al. 2006 provide "the latest, most comprehensive analysis regarding global- The text has been edited
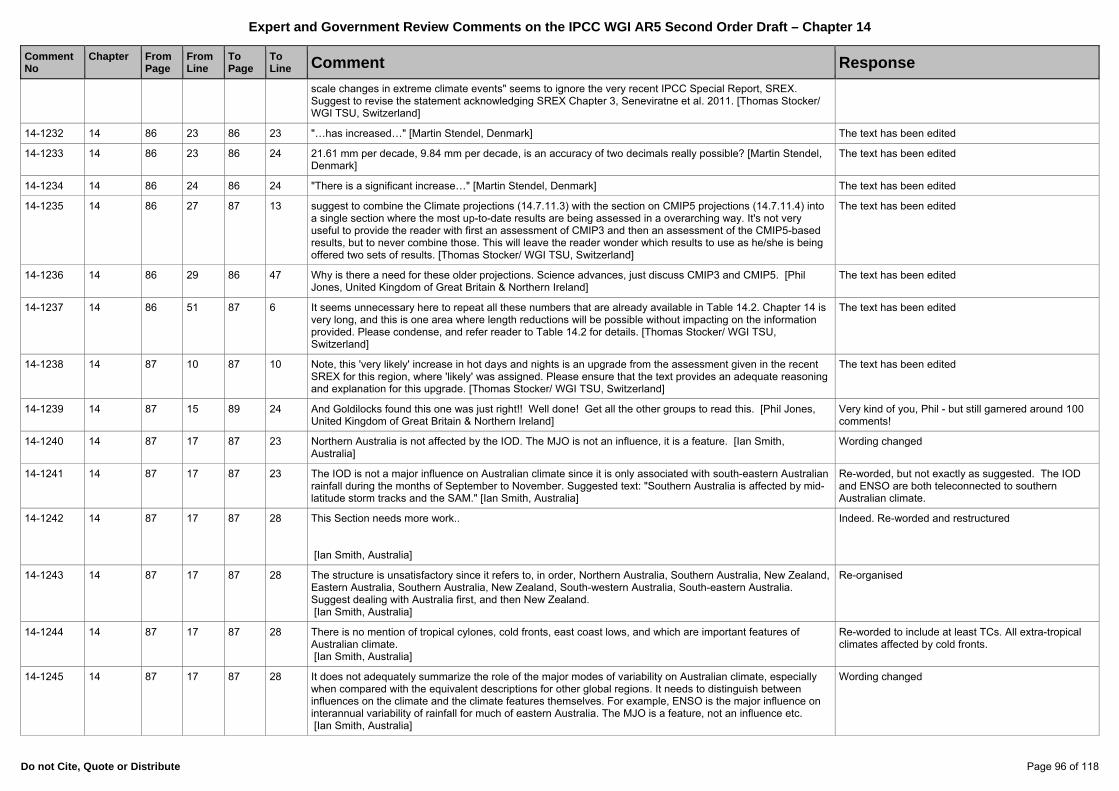
Expert and Government Review Comments on the IPCC WGI AR5 Second Order Draft – Chapter 14
Do not Cite, Quote or Distribute Page 96 of 118
Comment No
Chapter
FromPage
FromLine
To Page
To Line Comment Response
scale changes in extreme climate events" seems to ignore the very recent IPCC Special Report, SREX. Suggest to revise the statement acknowledging SREX Chapter 3, Seneviratne et al. 2011. [Thomas Stocker/ WGI TSU, Switzerland]
14-1232 14 86 23 86 23 "…has increased…" [Martin Stendel, Denmark] The text has been edited
14-1233 14 86 23 86 24 21.61 mm per decade, 9.84 mm per decade, is an accuracy of two decimals really possible? [Martin Stendel, Denmark]
The text has been edited
14-1234 14 86 24 86 24 "There is a significant increase…" [Martin Stendel, Denmark] The text has been edited
14-1235 14 86 27 87 13 suggest to combine the Climate projections (14.7.11.3) with the section on CMIP5 projections (14.7.11.4) into a single section where the most up-to-date results are being assessed in a overarching way. It's not very useful to provide the reader with first an assessment of CMIP3 and then an assessment of the CMIP5-based results, but to never combine those. This will leave the reader wonder which results to use as he/she is being offered two sets of results. [Thomas Stocker/ WGI TSU, Switzerland]
The text has been edited
14-1236 14 86 29 86 47 Why is there a need for these older projections. Science advances, just discuss CMIP3 and CMIP5. [Phil Jones, United Kingdom of Great Britain & Northern Ireland]
The text has been edited
14-1237 14 86 51 87 6 It seems unnecessary here to repeat all these numbers that are already available in Table 14.2. Chapter 14 is very long, and this is one area where length reductions will be possible without impacting on the information provided. Please condense, and refer reader to Table 14.2 for details. [Thomas Stocker/ WGI TSU, Switzerland]
The text has been edited
14-1238 14 87 10 87 10 Note, this 'very likely' increase in hot days and nights is an upgrade from the assessment given in the recent SREX for this region, where 'likely' was assigned. Please ensure that the text provides an adequate reasoning and explanation for this upgrade. [Thomas Stocker/ WGI TSU, Switzerland]
The text has been edited
14-1239 14 87 15 89 24 And Goldilocks found this one was just right!! Well done! Get all the other groups to read this. [Phil Jones, United Kingdom of Great Britain & Northern Ireland]
Very kind of you, Phil - but still garnered around 100 comments!
14-1240 14 87 17 87 23 Northern Australia is not affected by the IOD. The MJO is not an influence, it is a feature. [Ian Smith, Australia]
Wording changed
14-1241 14 87 17 87 23 The IOD is not a major influence on Australian climate since it is only associated with south-eastern Australian rainfall during the months of September to November. Suggested text: "Southern Australia is affected by mid-latitude storm tracks and the SAM." [Ian Smith, Australia]
Re-worded, but not exactly as suggested. The IOD and ENSO are both teleconnected to southern Australian climate.
14-1242 14 87 17 87 28 This Section needs more work.. [Ian Smith, Australia]
Indeed. Re-worded and restructured
14-1243 14 87 17 87 28 The structure is unsatisfactory since it refers to, in order, Northern Australia, Southern Australia, New Zealand, Eastern Australia, Southern Australia, New Zealand, South-western Australia, South-eastern Australia. Suggest dealing with Australia first, and then New Zealand. [Ian Smith, Australia]
Re-organised
14-1244 14 87 17 87 28 There is no mention of tropical cylones, cold fronts, east coast lows, and which are important features of Australian climate. [Ian Smith, Australia]
Re-worded to include at least TCs. All extra-tropical climates affected by cold fronts.
14-1245 14 87 17 87 28 It does not adequately summarize the role of the major modes of variability on Australian climate, especially when compared with the equivalent descriptions for other global regions. It needs to distinguish between influences on the climate and the climate features themselves. For example, ENSO is the major influence on interannual variability of rainfall for much of eastern Australia. The MJO is a feature, not an influence etc. [Ian Smith, Australia]
Wording changed
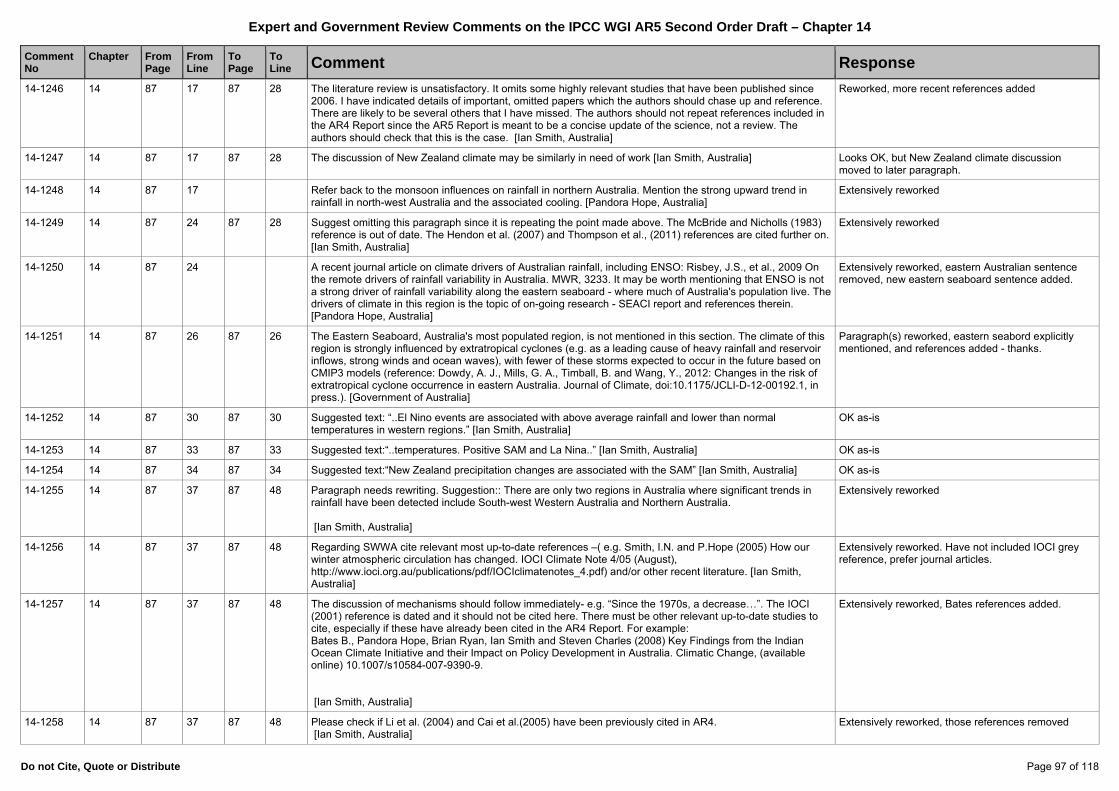
Expert and Government Review Comments on the IPCC WGI AR5 Second Order Draft – Chapter 14
Do not Cite, Quote or Distribute Page 97 of 118
Comment No
Chapter
FromPage
FromLine
To Page
To Line Comment Response
14-1246 14 87 17 87 28 The literature review is unsatisfactory. It omits some highly relevant studies that have been published since 2006. I have indicated details of important, omitted papers which the authors should chase up and reference. There are likely to be several others that I have missed. The authors should not repeat references included in the AR4 Report since the AR5 Report is meant to be a concise update of the science, not a review. The authors should check that this is the case. [Ian Smith, Australia]
Reworked, more recent references added
14-1247 14 87 17 87 28 The discussion of New Zealand climate may be similarly in need of work [Ian Smith, Australia] Looks OK, but New Zealand climate discussion moved to later paragraph.
14-1248 14 87 17 Refer back to the monsoon influences on rainfall in northern Australia. Mention the strong upward trend in rainfall in north-west Australia and the associated cooling. [Pandora Hope, Australia]
Extensively reworked
14-1249 14 87 24 87 28 Suggest omitting this paragraph since it is repeating the point made above. The McBride and Nicholls (1983) reference is out of date. The Hendon et al. (2007) and Thompson et al., (2011) references are cited further on. [Ian Smith, Australia]
Extensively reworked
14-1250 14 87 24 A recent journal article on climate drivers of Australian rainfall, including ENSO: Risbey, J.S., et al., 2009 On the remote drivers of rainfall variability in Australia. MWR, 3233. It may be worth mentioning that ENSO is not a strong driver of rainfall variability along the eastern seaboard - where much of Australia's population live. The drivers of climate in this region is the topic of on-going research - SEACI report and references therein. [Pandora Hope, Australia]
Extensively reworked, eastern Australian sentence removed, new eastern seaboard sentence added.
14-1251 14 87 26 87 26 The Eastern Seaboard, Australia's most populated region, is not mentioned in this section. The climate of this region is strongly influenced by extratropical cyclones (e.g. as a leading cause of heavy rainfall and reservoir inflows, strong winds and ocean waves), with fewer of these storms expected to occur in the future based on CMIP3 models (reference: Dowdy, A. J., Mills, G. A., Timball, B. and Wang, Y., 2012: Changes in the risk of extratropical cyclone occurrence in eastern Australia. Journal of Climate, doi:10.1175/JCLI-D-12-00192.1, in press.). [Government of Australia]
Paragraph(s) reworked, eastern seabord explicitly mentioned, and references added - thanks.
14-1252 14 87 30 87 30 Suggested text: “..El Nino events are associated with above average rainfall and lower than normal temperatures in western regions.” [Ian Smith, Australia]
OK as-is
14-1253 14 87 33 87 33 Suggested text:“..temperatures. Positive SAM and La Nina..” [Ian Smith, Australia] OK as-is
14-1254 14 87 34 87 34 Suggested text:“New Zealand precipitation changes are associated with the SAM” [Ian Smith, Australia] OK as-is
14-1255 14 87 37 87 48 Paragraph needs rewriting. Suggestion:: There are only two regions in Australia where significant trends in rainfall have been detected include South-west Western Australia and Northern Australia. [Ian Smith, Australia]
Extensively reworked
14-1256 14 87 37 87 48 Regarding SWWA cite relevant most up-to-date references –( e.g. Smith, I.N. and P.Hope (2005) How our winter atmospheric circulation has changed. IOCI Climate Note 4/05 (August), http://www.ioci.org.au/publications/pdf/IOCIclimatenotes_4.pdf) and/or other recent literature. [Ian Smith, Australia]
Extensively reworked. Have not included IOCI grey reference, prefer journal articles.
14-1257 14 87 37 87 48 The discussion of mechanisms should follow immediately- e.g. “Since the 1970s, a decrease…”. The IOCI (2001) reference is dated and it should not be cited here. There must be other relevant up-to-date studies to cite, especially if these have already been cited in the AR4 Report. For example: Bates B., Pandora Hope, Brian Ryan, Ian Smith and Steven Charles (2008) Key Findings from the Indian Ocean Climate Initiative and their Impact on Policy Development in Australia. Climatic Change, (available online) 10.1007/s10584-007-9390-9. [Ian Smith, Australia]
Extensively reworked, Bates references added.
14-1258 14 87 37 87 48 Please check if Li et al. (2004) and Cai et al.(2005) have been previously cited in AR4. [Ian Smith, Australia]
Extensively reworked, those references removed
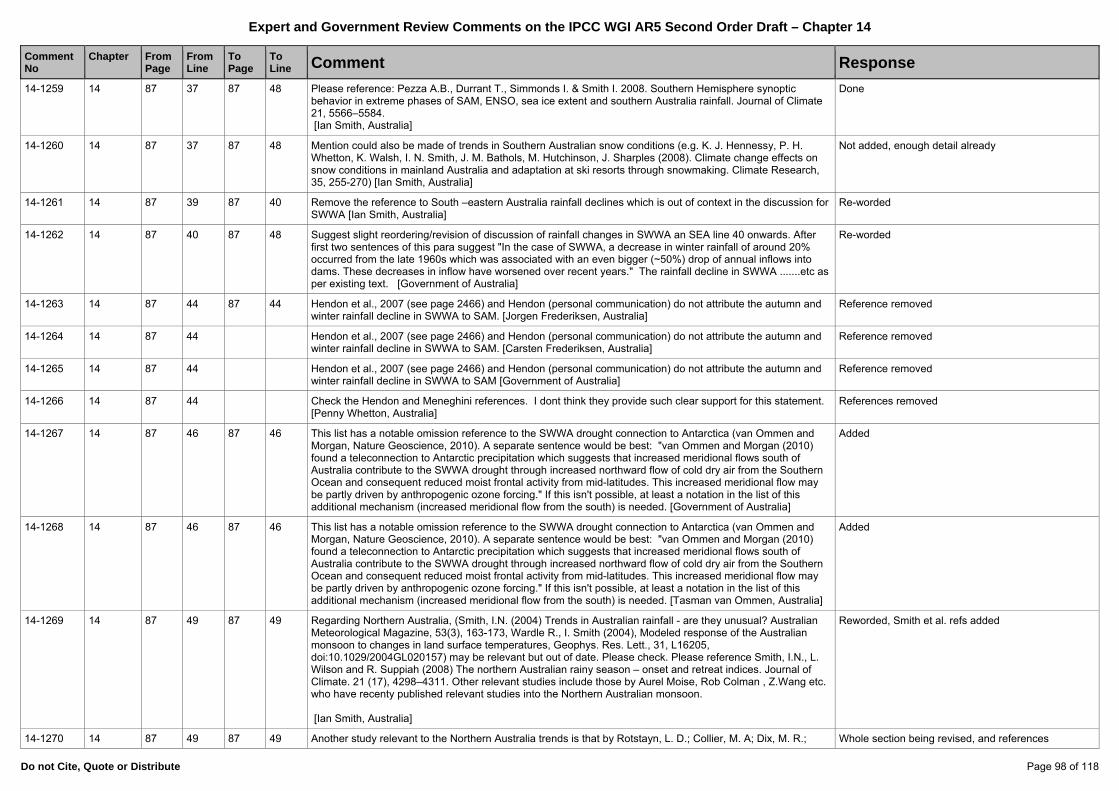
Expert and Government Review Comments on the IPCC WGI AR5 Second Order Draft – Chapter 14
Do not Cite, Quote or Distribute Page 98 of 118
Comment No
Chapter
FromPage
FromLine
To Page
To Line Comment Response
14-1259 14 87 37 87 48 Please reference: Pezza A.B., Durrant T., Simmonds I. & Smith I. 2008. Southern Hemisphere synoptic behavior in extreme phases of SAM, ENSO, sea ice extent and southern Australia rainfall. Journal of Climate 21, 5566–5584. [Ian Smith, Australia]
Done
14-1260 14 87 37 87 48 Mention could also be made of trends in Southern Australian snow conditions (e.g. K. J. Hennessy, P. H. Whetton, K. Walsh, I. N. Smith, J. M. Bathols, M. Hutchinson, J. Sharples (2008). Climate change effects on snow conditions in mainland Australia and adaptation at ski resorts through snowmaking. Climate Research, 35, 255-270) [Ian Smith, Australia]
Not added, enough detail already
14-1261 14 87 39 87 40 Remove the reference to South –eastern Australia rainfall declines which is out of context in the discussion for SWWA [Ian Smith, Australia]
Re-worded
14-1262 14 87 40 87 48 Suggest slight reordering/revision of discussion of rainfall changes in SWWA an SEA line 40 onwards. After first two sentences of this para suggest "In the case of SWWA, a decrease in winter rainfall of around 20% occurred from the late 1960s which was associated with an even bigger (~50%) drop of annual inflows into dams. These decreases in inflow have worsened over recent years." The rainfall decline in SWWA .......etc as per existing text. [Government of Australia]
Re-worded
14-1263 14 87 44 87 44 Hendon et al., 2007 (see page 2466) and Hendon (personal communication) do not attribute the autumn and winter rainfall decline in SWWA to SAM. [Jorgen Frederiksen, Australia]
Reference removed
14-1264 14 87 44 Hendon et al., 2007 (see page 2466) and Hendon (personal communication) do not attribute the autumn and winter rainfall decline in SWWA to SAM. [Carsten Frederiksen, Australia]
Reference removed
14-1265 14 87 44 Hendon et al., 2007 (see page 2466) and Hendon (personal communication) do not attribute the autumn and winter rainfall decline in SWWA to SAM [Government of Australia]
Reference removed
14-1266 14 87 44 Check the Hendon and Meneghini references. I dont think they provide such clear support for this statement. [Penny Whetton, Australia]
References removed
14-1267 14 87 46 87 46 This list has a notable omission reference to the SWWA drought connection to Antarctica (van Ommen and Morgan, Nature Geoscience, 2010). A separate sentence would be best: "van Ommen and Morgan (2010) found a teleconnection to Antarctic precipitation which suggests that increased meridional flows south of Australia contribute to the SWWA drought through increased northward flow of cold dry air from the Southern Ocean and consequent reduced moist frontal activity from mid-latitudes. This increased meridional flow may be partly driven by anthropogenic ozone forcing." If this isn't possible, at least a notation in the list of this additional mechanism (increased meridional flow from the south) is needed. [Government of Australia]
Added
14-1268 14 87 46 87 46 This list has a notable omission reference to the SWWA drought connection to Antarctica (van Ommen and Morgan, Nature Geoscience, 2010). A separate sentence would be best: "van Ommen and Morgan (2010) found a teleconnection to Antarctic precipitation which suggests that increased meridional flows south of Australia contribute to the SWWA drought through increased northward flow of cold dry air from the Southern Ocean and consequent reduced moist frontal activity from mid-latitudes. This increased meridional flow may be partly driven by anthropogenic ozone forcing." If this isn't possible, at least a notation in the list of this additional mechanism (increased meridional flow from the south) is needed. [Tasman van Ommen, Australia]
Added
14-1269 14 87 49 87 49 Regarding Northern Australia, (Smith, I.N. (2004) Trends in Australian rainfall - are they unusual? Australian Meteorological Magazine, 53(3), 163-173, Wardle R., I. Smith (2004), Modeled response of the Australian monsoon to changes in land surface temperatures, Geophys. Res. Lett., 31, L16205, doi:10.1029/2004GL020157) may be relevant but out of date. Please check. Please reference Smith, I.N., L. Wilson and R. Suppiah (2008) The northern Australian rainy season – onset and retreat indices. Journal of Climate. 21 (17), 4298–4311. Other relevant studies include those by Aurel Moise, Rob Colman , Z.Wang etc. who have recenty published relevant studies into the Northern Australian monsoon. [Ian Smith, Australia]
Reworded, Smith et al. refs added
14-1270 14 87 49 87 49 Another study relevant to the Northern Australia trends is that by Rotstayn, L. D.; Collier, M. A; Dix, M. R.; Whole section being revised, and references
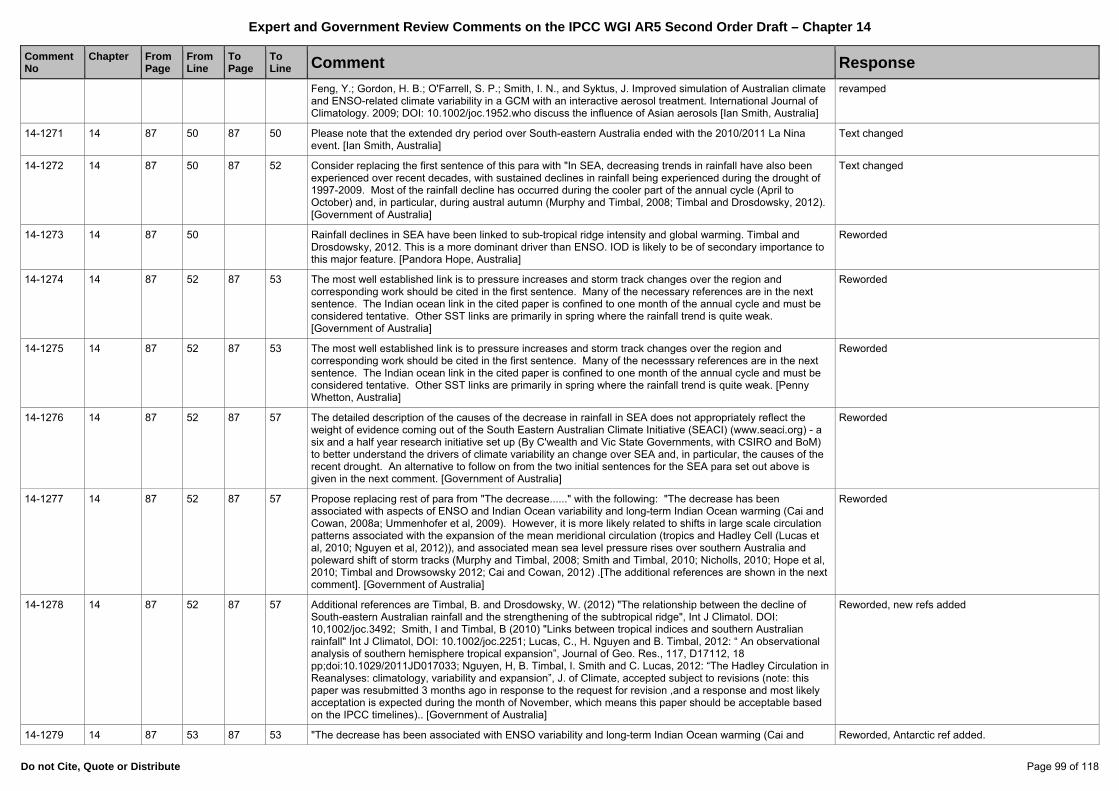
Expert and Government Review Comments on the IPCC WGI AR5 Second Order Draft – Chapter 14
Do not Cite, Quote or Distribute Page 99 of 118
Comment No
Chapter
FromPage
FromLine
To Page
To Line Comment Response
Feng, Y.; Gordon, H. B.; O'Farrell, S. P.; Smith, I. N., and Syktus, J. Improved simulation of Australian climate and ENSO-related climate variability in a GCM with an interactive aerosol treatment. International Journal of Climatology. 2009; DOI: 10.1002/joc.1952.who discuss the influence of Asian aerosols [Ian Smith, Australia]
revamped
14-1271 14 87 50 87 50 Please note that the extended dry period over South-eastern Australia ended with the 2010/2011 La Nina event. [Ian Smith, Australia]
Text changed
14-1272 14 87 50 87 52 Consider replacing the first sentence of this para with "In SEA, decreasing trends in rainfall have also been experienced over recent decades, with sustained declines in rainfall being experienced during the drought of 1997-2009. Most of the rainfall decline has occurred during the cooler part of the annual cycle (April to October) and, in particular, during austral autumn (Murphy and Timbal, 2008; Timbal and Drosdowsky, 2012). [Government of Australia]
Text changed
14-1273 14 87 50 Rainfall declines in SEA have been linked to sub-tropical ridge intensity and global warming. Timbal and Drosdowsky, 2012. This is a more dominant driver than ENSO. IOD is likely to be of secondary importance to this major feature. [Pandora Hope, Australia]
Reworded
14-1274 14 87 52 87 53 The most well established link is to pressure increases and storm track changes over the region and corresponding work should be cited in the first sentence. Many of the necessary references are in the next sentence. The Indian ocean link in the cited paper is confined to one month of the annual cycle and must be considered tentative. Other SST links are primarily in spring where the rainfall trend is quite weak. [Government of Australia]
Reworded
14-1275 14 87 52 87 53 The most well established link is to pressure increases and storm track changes over the region and corresponding work should be cited in the first sentence. Many of the necesssary references are in the next sentence. The Indian ocean link in the cited paper is confined to one month of the annual cycle and must be considered tentative. Other SST links are primarily in spring where the rainfall trend is quite weak. [Penny Whetton, Australia]
Reworded
14-1276 14 87 52 87 57 The detailed description of the causes of the decrease in rainfall in SEA does not appropriately reflect the weight of evidence coming out of the South Eastern Australian Climate Initiative (SEACI) (www.seaci.org) - a six and a half year research initiative set up (By C'wealth and Vic State Governments, with CSIRO and BoM) to better understand the drivers of climate variability an change over SEA and, in particular, the causes of the recent drought. An alternative to follow on from the two initial sentences for the SEA para set out above is given in the next comment. [Government of Australia]
Reworded
14-1277 14 87 52 87 57 Propose replacing rest of para from "The decrease......" with the following: "The decrease has been associated with aspects of ENSO and Indian Ocean variability and long-term Indian Ocean warming (Cai and Cowan, 2008a; Ummenhofer et al, 2009). However, it is more likely related to shifts in large scale circulation patterns associated with the expansion of the mean meridional circulation (tropics and Hadley Cell (Lucas et al, 2010; Nguyen et al, 2012)), and associated mean sea level pressure rises over southern Australia and poleward shift of storm tracks (Murphy and Timbal, 2008; Smith and Timbal, 2010; Nicholls, 2010; Hope et al, 2010; Timbal and Drowsowsky 2012; Cai and Cowan, 2012) .[The additional references are shown in the next comment]. [Government of Australia]
Reworded
14-1278 14 87 52 87 57 Additional references are Timbal, B. and Drosdowsky, W. (2012) "The relationship between the decline of South-eastern Australian rainfall and the strengthening of the subtropical ridge", Int J Climatol. DOI: 10,1002/joc.3492; Smith, I and Timbal, B (2010) "Links between tropical indices and southern Australian rainfall" Int J Climatol, DOI: 10.1002/joc.2251; Lucas, C., H. Nguyen and B. Timbal, 2012: “ An observational analysis of southern hemisphere tropical expansion”, Journal of Geo. Res., 117, D17112, 18 pp;doi:10.1029/2011JD017033; Nguyen, H, B. Timbal, I. Smith and C. Lucas, 2012: “The Hadley Circulation in Reanalyses: climatology, variability and expansion”, J. of Climate, accepted subject to revisions (note: this paper was resubmitted 3 months ago in response to the request for revision ,and a response and most likely acceptation is expected during the month of November, which means this paper should be acceptable based on the IPCC timelines).. [Government of Australia]
Reworded, new refs added
14-1279 14 87 53 87 53 "The decrease has been associated with ENSO variability and long-term Indian Ocean warming (Cai and Reworded, Antarctic ref added.
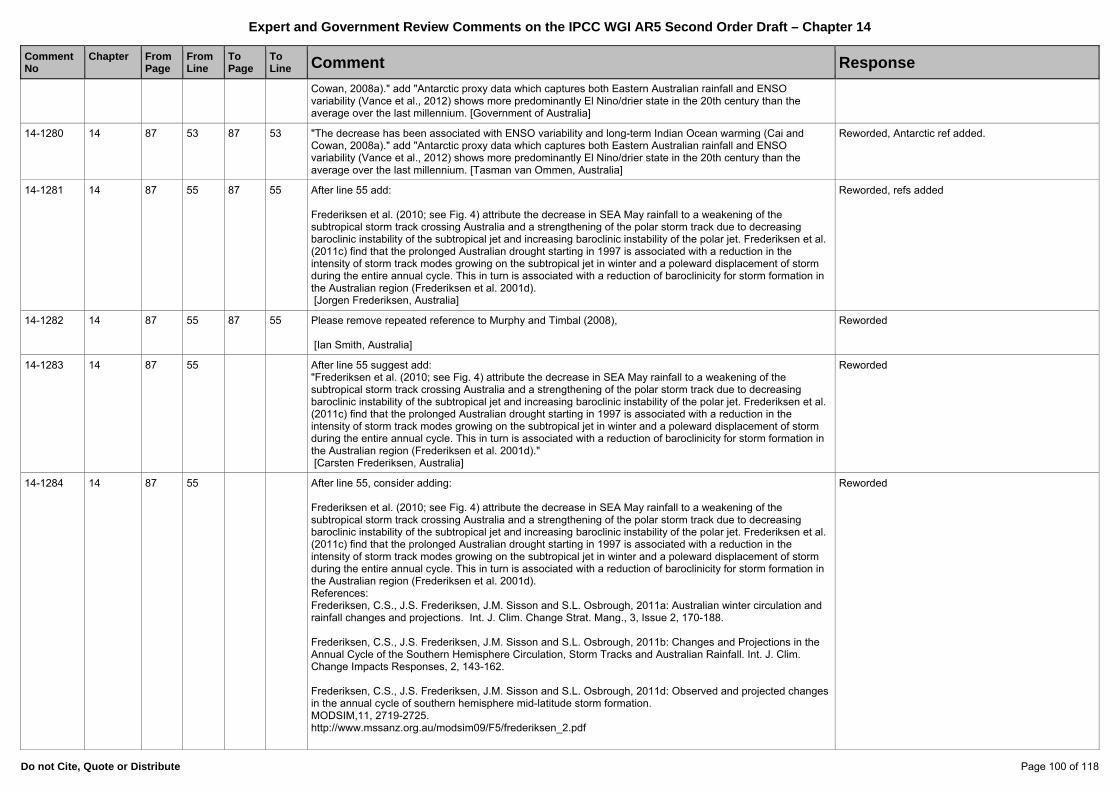
Expert and Government Review Comments on the IPCC WGI AR5 Second Order Draft – Chapter 14
Do not Cite, Quote or Distribute Page 100 of 118
Comment No
Chapter
FromPage
FromLine
To Page
To Line Comment Response
Cowan, 2008a)." add "Antarctic proxy data which captures both Eastern Australian rainfall and ENSO variability (Vance et al., 2012) shows more predominantly El Nino/drier state in the 20th century than the average over the last millennium. [Government of Australia]
14-1280 14 87 53 87 53 "The decrease has been associated with ENSO variability and long-term Indian Ocean warming (Cai and Cowan, 2008a)." add "Antarctic proxy data which captures both Eastern Australian rainfall and ENSO variability (Vance et al., 2012) shows more predominantly El Nino/drier state in the 20th century than the average over the last millennium. [Tasman van Ommen, Australia]
Reworded, Antarctic ref added.
14-1281 14 87 55 87 55 After line 55 add: Frederiksen et al. (2010; see Fig. 4) attribute the decrease in SEA May rainfall to a weakening of the subtropical storm track crossing Australia and a strengthening of the polar storm track due to decreasing baroclinic instability of the subtropical jet and increasing baroclinic instability of the polar jet. Frederiksen et al. (2011c) find that the prolonged Australian drought starting in 1997 is associated with a reduction in the intensity of storm track modes growing on the subtropical jet in winter and a poleward displacement of storm during the entire annual cycle. This in turn is associated with a reduction of baroclinicity for storm formation in the Australian region (Frederiksen et al. 2001d). [Jorgen Frederiksen, Australia]
Reworded, refs added
14-1282 14 87 55 87 55 Please remove repeated reference to Murphy and Timbal (2008), [Ian Smith, Australia]
Reworded
14-1283 14 87 55 After line 55 suggest add: "Frederiksen et al. (2010; see Fig. 4) attribute the decrease in SEA May rainfall to a weakening of the subtropical storm track crossing Australia and a strengthening of the polar storm track due to decreasing baroclinic instability of the subtropical jet and increasing baroclinic instability of the polar jet. Frederiksen et al. (2011c) find that the prolonged Australian drought starting in 1997 is associated with a reduction in the intensity of storm track modes growing on the subtropical jet in winter and a poleward displacement of storm during the entire annual cycle. This in turn is associated with a reduction of baroclinicity for storm formation in the Australian region (Frederiksen et al. 2001d)." [Carsten Frederiksen, Australia]
Reworded
14-1284 14 87 55 After line 55, consider adding: Frederiksen et al. (2010; see Fig. 4) attribute the decrease in SEA May rainfall to a weakening of the subtropical storm track crossing Australia and a strengthening of the polar storm track due to decreasing baroclinic instability of the subtropical jet and increasing baroclinic instability of the polar jet. Frederiksen et al. (2011c) find that the prolonged Australian drought starting in 1997 is associated with a reduction in the intensity of storm track modes growing on the subtropical jet in winter and a poleward displacement of storm during the entire annual cycle. This in turn is associated with a reduction of baroclinicity for storm formation in the Australian region (Frederiksen et al. 2001d). References: Frederiksen, C.S., J.S. Frederiksen, J.M. Sisson and S.L. Osbrough, 2011a: Australian winter circulation and rainfall changes and projections. Int. J. Clim. Change Strat. Mang., 3, Issue 2, 170-188. Frederiksen, C.S., J.S. Frederiksen, J.M. Sisson and S.L. Osbrough, 2011b: Changes and Projections in the Annual Cycle of the Southern Hemisphere Circulation, Storm Tracks and Australian Rainfall. Int. J. Clim. Change Impacts Responses, 2, 143-162. Frederiksen, C.S., J.S. Frederiksen, J.M. Sisson and S.L. Osbrough, 2011d: Observed and projected changes in the annual cycle of southern hemisphere mid-latitude storm formation. MODSIM,11, 2719-2725. http://www.mssanz.org.au/modsim09/F5/frederiksen_2.pdf
Reworded
Expert and Government Review Comments on the IPCC WGI AR5 Second Order Draft – Chapter 14
Do not Cite, Quote or Distribute Page 101 of 118
Comment No
Chapter
FromPage
FromLine
To Page
To Line Comment Response
Frederiksen, J.S., and C.S. Frederiksen, 2005: Decadal changes in Southern Hemisphere winter cyclogenesis. CSIRO Marine and Atmospheric Research Paper; 002, Aspendale, Vic.: CSIRO Marine and Atmospheric Research. V, 29pp. http://www.cmar.csiro.au/e-print/open/frederiksenjs_2005b.pdf Frederiksen, J.S., and C.S. Frederiksen, 2007: Interdecadal changes in Southern Hemisphere winter storm track modes. Tellus, 59 A, 599-617. Frederiksen, J.S., C.S. Frederiksen, S.L. Osbrough and J.M. Sisson, 2010: Causes of changing Southern Hemispheric weather systems. Chapter 8, Managing Climate Change, Eds. I. Jupp, P. Holper and W. Cai, CSIRO Publishing, pp85-98. Frederiksen, J.S., C.S. Frederiksen, S.L. Osbrough and J.M. Sisson, 2011c: Changes in southern hemisphere rainfall, circulation and weather systems. MODSIM, 11, 2712-2718. http://www.mssanz.org.au/modsim09/F5/frederiksen.pdf Zidikheri, M.J., and J.S. Frederiksen, 2011: Inverse method for attribution of climate change. ANZIAM J., 52, C823-C836. [Government of Australia]
14-1285 14 87 55 The review of Smith and Timbal (2010) (International Journal of Climatology, 32, 33-40) should be cited here. [Government of Australia]
Reworded, ref added
14-1286 14 87 55 The review of Smith and Timbal (2010) (International Journal of Climatology, 32, 33-40) should be cited here. I am also surprised to not see Frederiksen papers cited on storm track changes as their work is the most authoritative on this topic.(e.g. see Frederiksen, C.S., J.S. Frederiksen, J.M. Sisson, S.L. Osbrough, 2011: Changes and projections in Australian winter ainfall and circulation: Anthropogenic forcing and internal variablilty. Int. J. Climate Change Impacts and Responses, 2, 143-162. [Penny Whetton, Australia]
Refs added
14-1287 14 87 IOCI 2002, 2005, 2006 (www.ioci.org.au, http://www.ioci.org.au/publications/ioci-stage-2/cat_view/16-ioci-stage-2/22-reports/35-research-reports.html) for decline since late 1960s, Hope P. and Ganter CJ, 2010, IN: Jubb, I., Holper, P. and Cai, W. Managing Climate Change, CSIRO publishing, 53-64 for further decline since 2000. Also IOCI3 synthesis report (http://www.ioci.org.au/publications/ioci-stage-3/cat_view/17-ioci-stage-3/23-reports.html) [Pandora Hope, Australia]
Not cited - gray literature
14-1288 14 88 1 88 7 First sentence is incorrect. There are studies which suggest that drought exacerbates temperatures and not vice-versa. It is important to reference these. [Ian Smith, Australia]
Text removed
14-1289 14 88 1 88 7 Nicholls (2004), Karoly and Braganza (2005) appear to be out of date (i.e. check AR4). [Ian Smith, Australia] Text removed
14-1290 14 88 1 88 7 The Cai and Cowan (2008b) conclusion has been severly disputed and should not stand unchallenged here. [Ian Smith, Australia]
Text removed
14-1291 14 88 1 88 7 Please reference recent relevant studies by Stewart Franks (20??), and the recent Nature paper (2012) which includes Michael Roderick as co-author which disputes trends in global drought conditions. Even though controversial, these papers must be discussed here. [Ian Smith, Australia]
Text removed
14-1292 14 88 2 88 7 it is grey, but the report ( Hennessy, K.J., R. Fawcett, D.G.C. Kirono, F.S. Mpelasoka, D. Jones, J.M. Bathols, P.H. Whetton, M. StaffordSmith, M. Howden, C.D. Mitchell, N. Plummer, 2008a: An assessment of the impact of climate change on the nature and frequency of exceptional climatic events. DAFF CSIRO BoM, Canberra, 33 pp) provides the best evidence of drought trends in Australia and should really be cited here. [Government of Australia]
Grey literature and not considered here
14-1293 14 88 2 88 7 it is grey, but the report ( Hennessy, K.J., R. Fawcett, D.G.C. Kirono, F.S. Mpelasoka, D. Jones, J.M. Bathols, P.H. Whetton, M. StaffordSmith, M. Howden, C.D. Mitchell, N. Plummer, 2008a: An assessment of the impact of climate change on the nature and frequency of exceptional climatic events. DAFF CSIRO BoM, Canberra,
Grey literature and not considered here
Expert and Government Review Comments on the IPCC WGI AR5 Second Order Draft – Chapter 14
Do not Cite, Quote or Distribute Page 102 of 118
Comment No
Chapter
FromPage
FromLine
To Page
To Line Comment Response
33 pp) provides the best evidence of drought trends in Australia and should really be cited here. [Penny Whetton, Australia]
14-1294 14 88 2 Without doubt' is much too strong. If the worsening of the drought is considered to be due to temperature-driven increased potential evaporation, there is a body of work of Roderick and Farquhar that would contest this. [Government of Australia]
Text removed
14-1295 14 88 2 suggest to delete "It's without doubt that" and to express this in terms of the formal uncertainty terminology from the Guidance Note. [Thomas Stocker/ WGI TSU, Switzerland]
Text removed
14-1296 14 88 2 I think 'without doubt' is much too strong. If the worsening of the drought is considerd to be due to temperature-driven increased potential evaporation, there is a body of work of Roderick nd Farquhar that would contest this. [Penny Whetton, Australia]
Text removed
14-1297 14 88 6 88 7 Last sentence in para. More recent research has shown that the 15% reduction in flow for a 1 degree temperature rise estimated for the Murray Darling Basin is likely to be too high. Suggest adding another sentence as per next comment based on peer-reviewed literature. See also N.J. Potter, C. Petheram and L. Zhang (2011) [Sensitivity of streamflow to rainfall and temperature in south-eastern Australia during the Millennium drought. 19th International Congress on Modelling and Simulation, Perth, Australia, 12–16 December 2011 http://mssanz.org.au/modsim2011] who find an average result for 34 catchments of a 5% decrease in flow for a 1 degree rise in temperature. [Government of Australia]
Text removed
14-1298 14 88 6 88 7 See above comment. Proposed addition is: "However, Potter and Chiew (2011) have found that changes in evapotranspiration (reflecting increased temperatures) account for only 5% of the observed decrease in runoff in the Camapspe basin in the southern Murray Darling Basin during the recent drought, with around 78% of the observed runoff decrease being explained by changes in rainfall (the reduction in annual rainfall, reduced interannual variability and changes in seasonality)." [The reference is Potter, N and Chiew F.H.S (2011) An investigation into changes in climate characteristics causing the recent very low runoff in the southern Murray-Darling Basin using rainfall-runoff models. Water Resources Research Vol 47, W00G10, doi: 10.1029/2010WR010333,2011] [Government of Australia]
Text removed
14-1299 14 88 7 88 7 Spell out MDB: Murray-Darling Basin [Josephine Brown, Australia] Text removed
14-1300 14 88 20 88 25 It is highly anomalous (and inappropriate) that this paragraph about CMIP3-based projection work for Australia is so lacking detail and references (and the only paper cited is quite old) The equivalent NZ section which follows in the next paragraph is much more detailed. There is a wealth of material that can be referred to. There is the national projections for Australia (CSIRO and BoM 2007), and numerous journal articles (e.g. by Watterson, Moise, Timbal, Perkins, Pitman). [Government of Australia]
Reworded and more detail added
14-1301 14 88 20 88 25 It is highly anomalous (and inappropriate) that this pargraph about CMIP3-based projection work for Australia is so lacking detail and references (and the only paper cited is quite old) The equivalent NZ section which follows in the next paragraph is much more detailed. There is a wealth of material that can be referred to. There is the national projections for Australia (CSIRO and BoM 2007), and numerous journal articles (e.g. by Watterson, Moise, Timbal, Perkins, Pitman). [Penny Whetton, Australia]
Reworded and more detail added
14-1302 14 88 20 88 26 Please reference Smith, I. N. and Chandler, E. Refining rainfall projections for the Murray Darling Basin of south-east Australia—the effect of sampling model results based on performance. Climatic Change. 2009; online first ; DOI 10.1007/s10584-009-9757-1 which discusses model performance over Australia. [Ian Smith, Australia]
Reworded, ref added
14-1303 14 88 20 88 26 Please reference other relevant papers to appear in the Australian Meteorological and Oceanographic Journal which discuss CMIP5 model performance over Australia. Check if Hope (2006) is out of date. [Ian Smith, Australia]
Reworded, refs added
14-1304 14 88 20 89 24 suggest to combine the CMIP5 (14.7.12.1) section with the projections from CMIP3/RCMs into a single section where the most up-to-date results are being assessed in a overarching way. It's not very useful to provide the reader with first an assessment of CMIP3+RCMs and then an assessment of the CMIP5-based results, but to
Reworded

Expert and Government Review Comments on the IPCC WGI AR5 Second Order Draft – Chapter 14
Do not Cite, Quote or Distribute Page 103 of 118
Comment No
Chapter
FromPage
FromLine
To Page
To Line Comment Response
never combine those. This will leave the reader wonder which results to use as he/she is being offered two sets of results. [Thomas Stocker/ WGI TSU, Switzerland]
14-1305 14 88 24 88 25 Hope (2006) is a CMIP3 reference. Is there no more recent study on this topic?? [Josephine Brown, Australia] Reworded
14-1306 14 88 24 Surely there are some further references on projections of Australia's climate. www.climatechangeinaustralia.gov.au. [Pandora Hope, Australia]
Reworded, refs added
14-1307 14 88 32 88 34 Please avoid talking of flood or drought 'risk' as assessing projections in risk is outside the scope of WGI. Rather, speak of projections of flood or drought magnitudes, frequencies etc. Also, references need to be cited to support this statement. [Thomas Stocker/ WGI TSU, Switzerland]
Noted - changed to occurrence
14-1308 14 88 35 88 37 the AR4 has been very careful (and explicit) not to combine scenarios into a single range of projections. It's thus strongly suggested to stick to this and to only report scenario-dependent results. [Thomas Stocker/ WGI TSU, Switzerland]
Reworded
14-1309 14 88 40 88 41 It is odd that changes in sea level are reported for this region, but no other regions in Section 14.7. Suggest deleting here, as chapter 13 provides an assessment of regional changes in sea level. [Thomas Stocker/ WGI TSU, Switzerland]
Text removed
14-1310 14 88 43 89 24 Projected decrease in southern Australia precipitation is likely related to poleward expansion of the southern Hadley cell. Hu et al. (2012) demonstrated poleward expansion of the Hadley circulation in CMIP5 simulations (see Chapter 10, Figure 10.11). The poleward expansion will likely push the subtropical dry zone southward and cause less precipitation in southern Australia. [References: Hu, Y., L. Tao, and J. Liu, 2012: Poleward expansion of the Hadley circulation in CMIP5 simulations. Adv. Atmos. Sci., in press.] [Dabang Jiang, China]
Reworded and reorganised
14-1311 14 88 45 89 5 It seems unnecessary here to repeat all these numbers that are already available in Table 14.2. Chapter 14 is very long, and this is one area where length reductions will be possible without impacting on the information provided. Please condense, and refer reader to Table 14.2 for details. [Thomas Stocker/ WGI TSU, Switzerland]
Text removed
14-1312 14 88 46 88 46 Again, please separate out the discussion of projections for Australia from those of New Zealand [Ian Smith, Australia]
Will do - text reorganised
14-1313 14 88 53 89 5 The formulation in this paragraph (particularly the second sentence) gives too much weight to the multi-model mean, when consideration of the inter-model range would indicate the risk of substantial changes, particularly under RCP8.5 and sub regionally. See next comment for new reference [Government of Australia]
Text reworded
14-1314 14 88 53 89 5 There is now an accepted paper on CMIP5 projections for Australia which provides considerably more detail and should be cited. See Irving et al (in press) Climate projections for Australia: a first glance at CMIP5, AMOJ. A copy will be provided to the lead authors. [Government of Australia]
Text reworded and references updated
14-1315 14 88 53 89 5 The formulation in this paragraph (particulary the second sentence) gives too much weight to the multi-model mean, when consideration of the inter-model range would indicate the risk of substantial changes, particularly under RCP8.5 and sub regionally. See next comment for new reference [Penny Whetton, Australia]
Text reworded
14-1316 14 88 53 89 5 There is now an accepted paper on CMIP5 projections for Australia which provides considerably more detail and should be cited. See Irving et al (in press) Climate projections for Australia: a first glance at CMIP5, AMOJ. I will send a copy to the LAs. [Penny Whetton, Australia]
Text reworded, ref added
14-1317 14 88 53 89 24 The discussion of the projected changes is unsatisfactory. It should indicate, as per the maps, where there evidence for no significant change to rainfall, where there is evidence for a significant change to rainfall, and, finally, where there is no evidence for a change of either sign. [Ian Smith, Australia]
Text reworded
14-1318 14 88 53 89 24 It should indicate how the CMIP5 projections differ, if at all, from the CMIP3 projections. [Ian Smith, Australia] Text reworded
14-1319 14 88 53 89 24 It discusses Southern Australian rainfall projections but not Northern Australian projections. [Ian Smith, Text reworded
Expert and Government Review Comments on the IPCC WGI AR5 Second Order Draft – Chapter 14
Do not Cite, Quote or Distribute Page 104 of 118
Comment No
Chapter
FromPage
FromLine
To Page
To Line Comment Response
Australia]
14-1320 14 88 53 89 24 It does not discuss monsoon projections, projected changes to ENSO, projected changes to storm tracks, SAM, IOD, nor any of the climate features mentioned at the start of the Section. [Ian Smith, Australia]
No, but inappropriate to repeat material here
14-1321 14 88 53 89 24 It does not mention the role of “wet get wetter” and “dry get drier” as a summary for projected changes. There are obviously numerous references that can be used here and the authors should make the effort to chase these up if attempting a comprehensive summary of the projected changes. [Ian Smith, Australia]
Text reworded
14-1322 14 89 5 What does 'insignificant' mean? Not robust? Is this just the multi-model mean that is being referred to? [Government of Australia]
Not statistically significant. Text re-worded
14-1323 14 89 5 What does 'insignificant' mean? Not robust? Is this just the multi-model mean that is being referred to? [Penny Whetton, Australia]
Not statistically significant. Text re-worded
14-1324 14 89 7 89 9 The references cited (the only ones cited in this section on CMIP5 results) do not use CMIP5 results. They should be deleted, or their relevance more carefully explained. Priority here should go to papers using CMIP5. [Government of Australia]
Text reworded
14-1325 14 89 7 89 9 Again, this does not fully reflect SEACI research. Propose….."it is likely that cool season precipitation will continue to decrease over southern Australia associated with trends in the intensity and position of the subtropical ridge (Kent et al, 2011;Timbal and Drosdowsky, 2012), and potentially also trends in the SAM and the IOD (Cai et al etc refs as per in brackets in current text) [Government of Australia]
Text reworded
14-1326 14 89 7 89 9 Additional reference is Kent, D M, Kirono D G C, Timbal B. and Chiew FHS (2011) Representation of the Australian sub-tropical ridge in the CMIP3 models , Int J Climatol (2011) (wileyonlinelibrary.com) DOI: 10.1002/joc.3406. Timbal and Drosdowsky - given above. [Government of Australia]
Text reworded, CMIP3 ref not added
14-1327 14 89 7 89 9 This sentence is incorrect. Southern Australia cool season rainfall is not decreasing. SWWA rainfall is decreasing. [Ian Smith, Australia]
Text reworded
14-1328 14 89 7 89 9 The stated reasons for projected changes as a result of trends in SAM and IOD are conjectures, not facts, and should be presented as such. For example, expansion/intensification of the Hadley cell may be a reason why the drying is projected for Southern Australia. i.e. drying is more likely to be associated with the global pattern of mid-latitude drying, rather than specifically with a local IOD SST pattern or a southern Hemisphere model (SAM). The discussion should reflect these alternative ons and not those of the authors. [Ian Smith, Australia]
Text reworded
14-1329 14 89 7 89 9 The references cited (the only ones cited in this section on CMIP5 results) do not use CMIP5 results. They should be deleted, or their relevance more carefully explained. Priority here should go to papers using CMIP5. [Penny Whetton, Australia]
Text reworded, refs removed
14-1330 14 89 9 Do these articles use CMIP5 models? Are they relevant here? [Pandora Hope, Australia] Text reworded, refs removed
14-1331 14 89 10 order of 10%' - This is a significantly larger change than the range given for this case in the previous paragraph. Please provide further clarification. [Government of Australia]
Text reworded
14-1332 14 89 10 order of 10%' This is a significnatly larger change than the range given for this case in the previous paragraph. Needs clarification. [Penny Whetton, Australia]
Text reworded
14-1333 14 89 11 89 11 This is incorrect. The SREX did not assess a 'likely' increase in dry spells over southern Australia. SREX assigned only medium confidence to projected changes in drought in this region and gave no quantified likelihood (see SREX Chapter 3, Table 3.3). If chapter 14 is now upgrading this assessment to 'likely' you will need to carefully ensure that the text provides an adequate reasoning and explanation for this upgrade. [Thomas Stocker/ WGI TSU, Switzerland]
Removed
14-1334 14 89 16 89 17 As previously noted, the role of temperatures on aridity is controversial and not as clear cut as implied in this sentence. This statement is therefore inappropriate. [Ian Smith, Australia]
Text deleted
14-1335 14 89 16 89 17 Suggest this last sentence can be deleted. This goes beyond the scope of WGI of reporting on the observed and projected physical changes. [Thomas Stocker/ WGI TSU, Switzerland]
OK - removed
Expert and Government Review Comments on the IPCC WGI AR5 Second Order Draft – Chapter 14
Do not Cite, Quote or Distribute Page 105 of 118
Comment No
Chapter
FromPage
FromLine
To Page
To Line Comment Response
14-1336 14 89 26 92 29 This section is again very long and seems to be treating each island nation/group separately. The previous section showed how this should be written. Is Hennessy et al (2011) peer reviewed? I'm sure it was, but just checking. There is a lot of space givem to trends at individual stations. This section and some of the others seem like a way to mention every country in the UN list. Surely this can be summarised like the Aus/NZ section. [Phil Jones, United Kingdom of Great Britain & Northern Ireland]
Synthesised and shortened
14-1337 14 89 26 The Pacific Islands region is not marked in the figure 14.32 relating to this chapter. Not clear what your section encompasses. [Jaclyn Brown, Australia]
Removed
14-1338 14 89 26 Throughout section you need to be clear on which Brown paper you are referencing. There is JN Brown and JR Brown, both 2012. [Jaclyn Brown, Australia]
Noted
14-1339 14 89 26 add references to the assessment in Sections 14.2-14.6 as appropriate to better link this regional climate change section to the climate phenomena sections. References to earlier WG1 AR5 Chapters might also be appropriate, in particular Ch2 [Thomas Stocker/ WGI TSU, Switzerland]
Acknowledged and implemented
14-1340 14 89 29 89 29 Note that the PCCSP report (Hennessy et al.) does not examine all countries in the Pacific Islands region. E.g. French territories were excluded for political reasons, but should be included in the discussion here. [Josephine Brown, Australia]
Noted
14-1341 14 89 29 Reference to Hennessy et al is incorrect - should be Australian Bureau of Meteorology and Commonwealth Scientific and Industrial Research Organisation (2011). Climate Change in the Pacific: Scientific Assessment and New Research. Volume 1 - Regional Overview. http://www.cawcr.gov.au/projects/PCCSP/publications.html. [Jaclyn Brown, Australia]
Removed
14-1342 14 89 31 89 31 Please avoid talking of cyclone 'risk' as assessing changes in risk is outside the scope of WGI. Rather, speak of changes in cyclone activity, intensity, frequencies etc. Also, references need to be cited to support this statement. [Thomas Stocker/ WGI TSU, Switzerland]
Reworded
14-1343 14 89 38 The "West Pacific Monsoon (WPM)" is introduced here. Earlier, section 14.2.2.5 of the section on Monsoons refers to "The Western North Pacific Summer Monsoon (WNPSM)" but not the WPM, which is referred to on page 14-89 as moving from the Northern Hemisphere across the equator in the austral summer months.It would be helpful if the two discussions (and acronyms?) could be made consistent. [Adrian Simmons, United Kingdom]
Removed
14-1344 14 89 47 Figure 14.36: it's our clear preference not to include figures that are direct copies from other sources, in particular not from agency/institute etc. reports. In addition, the figure is basically only providing a geographical context and thus not conveying anything for the actual assessment. It would thus fit much better into Section 14.3.1 Convergence Zones. If this is not an option, we suggest to delete the figure from the report. The reference to the Pacific Climate Change Science Program partner countries in the caption will need to be deleted in any case. [Thomas Stocker/ WGI TSU, Switzerland]
Removed
14-1345 14 89 57 90 1 Brown et al. (2012) should be cited as Brown et al. (2012a), and alter other Brown papers accordingly. Please note that the lead author of this paper is Jaclyn N. Brown, whereas the lead author of Brown et al. (2012a) and Brown et al. (2012b) is Josephine R. Brown. [Josephine Brown, Australia]
Reworded
14-1346 14 90 24 90 24 Add: Folland et al, (2003) (already in ref list) [Christopher Folland, United Kingdom of Great Britain & Northern Ireland]
Text reworded here, more recent references added.
14-1347 14 91 20 91 23 The Pacific Climate Change Science Program (PCCSP) 'Climate Change in the Pacific' report is available online at http://www.cawcr.gov.au/projects/PCCSP/publications.html. This section notes that “future projections for tropical Pacific Island nations” (including Hennessey et al, 2011) “carry a large uncertainty, even in the direction of change”. “By 2055, under a high emissions scenario (A2), the increase is projected to be 1C-2C. A rise in the number of hot days and warm nights is also projected, and a decline in cooler weather, as already observed (Manton et al., 2001). For a low emission scenario, the lower range decreases about 0.5C while the upper range reduces by between 0.2C and 0.5C”. The PCCSP projected a 1.0 to 1.5 increase by 2055 depending on emissions scenarios. “For the Southern Group of the Cooks Islands, the Solomon Islands, and Tuvalu, average rainfall during the wet season is projected to
Text reworded and shortened.
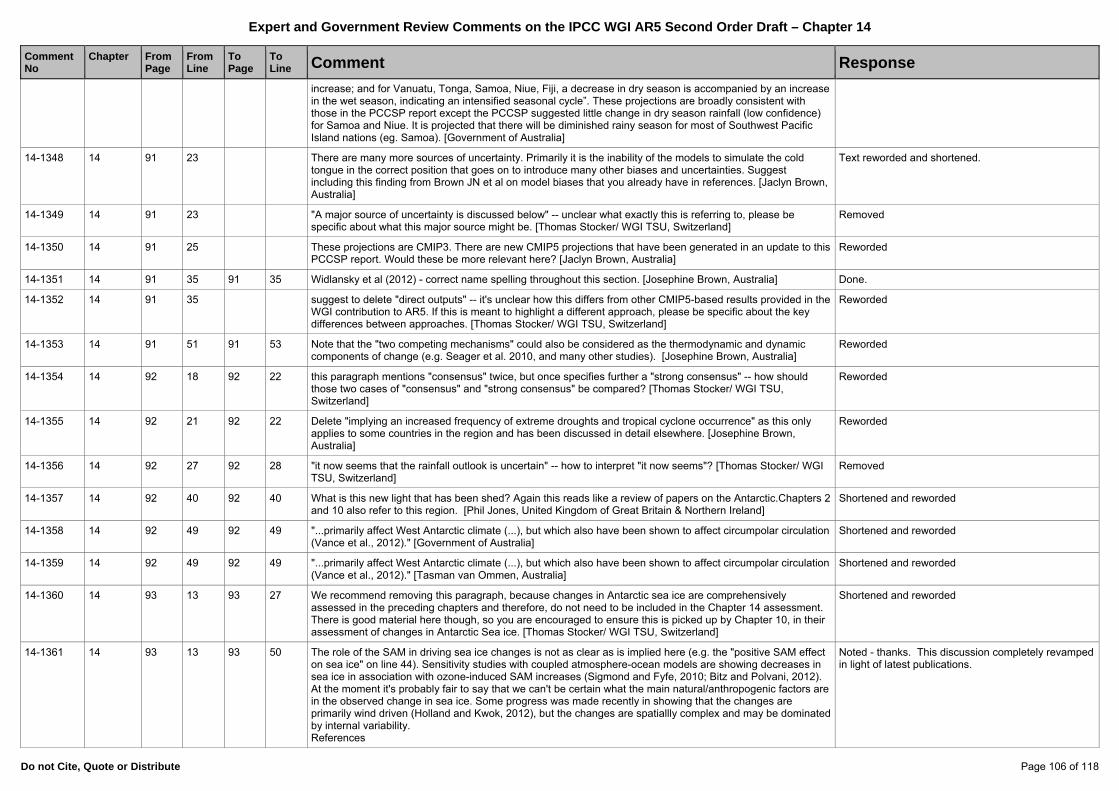
Expert and Government Review Comments on the IPCC WGI AR5 Second Order Draft – Chapter 14
Do not Cite, Quote or Distribute Page 106 of 118
Comment No
Chapter
FromPage
FromLine
To Page
To Line Comment Response
increase; and for Vanuatu, Tonga, Samoa, Niue, Fiji, a decrease in dry season is accompanied by an increase in the wet season, indicating an intensified seasonal cycle”. These projections are broadly consistent with those in the PCCSP report except the PCCSP suggested little change in dry season rainfall (low confidence) for Samoa and Niue. It is projected that there will be diminished rainy season for most of Southwest Pacific Island nations (eg. Samoa). [Government of Australia]
14-1348 14 91 23 There are many more sources of uncertainty. Primarily it is the inability of the models to simulate the cold tongue in the correct position that goes on to introduce many other biases and uncertainties. Suggest including this finding from Brown JN et al on model biases that you already have in references. [Jaclyn Brown, Australia]
Text reworded and shortened.
14-1349 14 91 23 "A major source of uncertainty is discussed below" -- unclear what exactly this is referring to, please be specific about what this major source might be. [Thomas Stocker/ WGI TSU, Switzerland]
Removed
14-1350 14 91 25 These projections are CMIP3. There are new CMIP5 projections that have been generated in an update to this PCCSP report. Would these be more relevant here? [Jaclyn Brown, Australia]
Reworded
14-1351 14 91 35 91 35 Widlansky et al (2012) - correct name spelling throughout this section. [Josephine Brown, Australia] Done.
14-1352 14 91 35 suggest to delete "direct outputs" -- it's unclear how this differs from other CMIP5-based results provided in the WGI contribution to AR5. If this is meant to highlight a different approach, please be specific about the key differences between approaches. [Thomas Stocker/ WGI TSU, Switzerland]
Reworded
14-1353 14 91 51 91 53 Note that the "two competing mechanisms" could also be considered as the thermodynamic and dynamic components of change (e.g. Seager et al. 2010, and many other studies). [Josephine Brown, Australia]
Reworded
14-1354 14 92 18 92 22 this paragraph mentions "consensus" twice, but once specifies further a "strong consensus" -- how should those two cases of "consensus" and "strong consensus" be compared? [Thomas Stocker/ WGI TSU, Switzerland]
Reworded
14-1355 14 92 21 92 22 Delete "implying an increased frequency of extreme droughts and tropical cyclone occurrence" as this only applies to some countries in the region and has been discussed in detail elsewhere. [Josephine Brown, Australia]
Reworded
14-1356 14 92 27 92 28 "it now seems that the rainfall outlook is uncertain" -- how to interpret "it now seems"? [Thomas Stocker/ WGI TSU, Switzerland]
Removed
14-1357 14 92 40 92 40 What is this new light that has been shed? Again this reads like a review of papers on the Antarctic.Chapters 2 and 10 also refer to this region. [Phil Jones, United Kingdom of Great Britain & Northern Ireland]
Shortened and reworded
14-1358 14 92 49 92 49 "...primarily affect West Antarctic climate (...), but which also have been shown to affect circumpolar circulation (Vance et al., 2012)." [Government of Australia]
Shortened and reworded
14-1359 14 92 49 92 49 "...primarily affect West Antarctic climate (...), but which also have been shown to affect circumpolar circulation (Vance et al., 2012)." [Tasman van Ommen, Australia]
Shortened and reworded
14-1360 14 93 13 93 27 We recommend removing this paragraph, because changes in Antarctic sea ice are comprehensively assessed in the preceding chapters and therefore, do not need to be included in the Chapter 14 assessment. There is good material here though, so you are encouraged to ensure this is picked up by Chapter 10, in their assessment of changes in Antarctic Sea ice. [Thomas Stocker/ WGI TSU, Switzerland]
Shortened and reworded
14-1361 14 93 13 93 50 The role of the SAM in driving sea ice changes is not as clear as is implied here (e.g. the "positive SAM effect on sea ice" on line 44). Sensitivity studies with coupled atmosphere-ocean models are showing decreases in sea ice in association with ozone-induced SAM increases (Sigmond and Fyfe, 2010; Bitz and Polvani, 2012). At the moment it's probably fair to say that we can't be certain what the main natural/anthropogenic factors are in the observed change in sea ice. Some progress was made recently in showing that the changes are primarily wind driven (Holland and Kwok, 2012), but the changes are spatiallly complex and may be dominated by internal variability. References
Noted - thanks. This discussion completely revamped in light of latest publications.
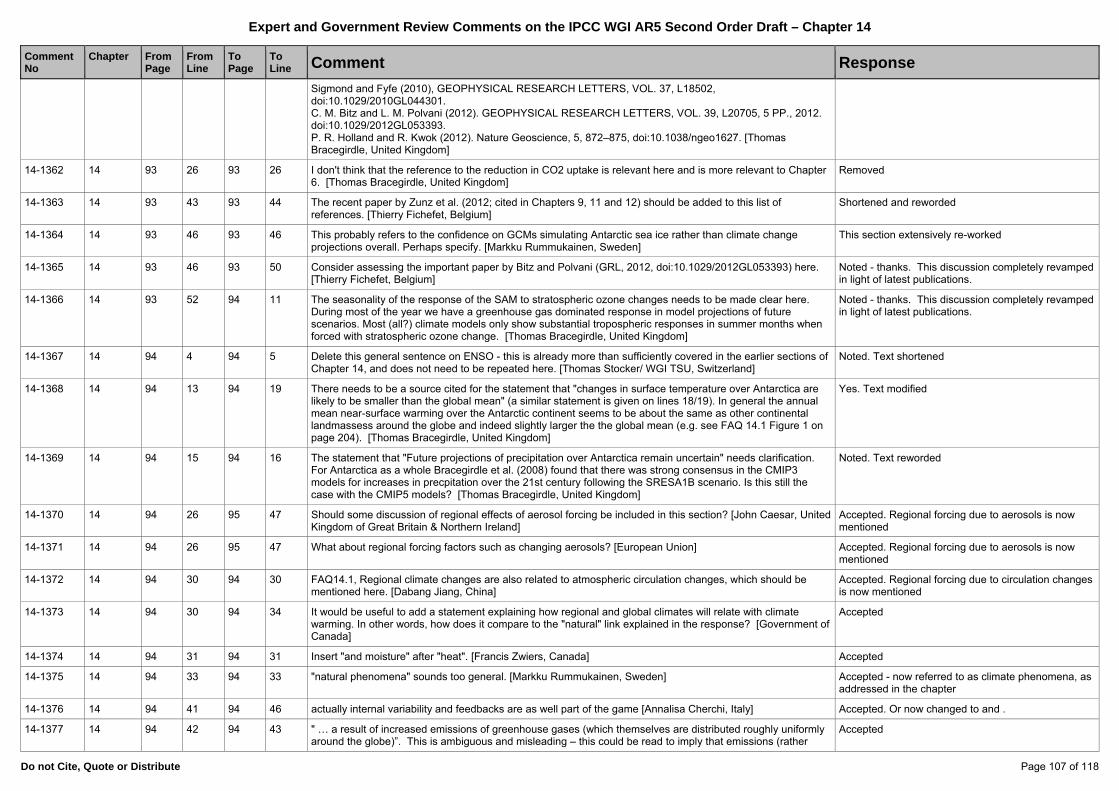
Expert and Government Review Comments on the IPCC WGI AR5 Second Order Draft – Chapter 14
Do not Cite, Quote or Distribute Page 107 of 118
Comment No
Chapter
FromPage
FromLine
To Page
To Line Comment Response
Sigmond and Fyfe (2010), GEOPHYSICAL RESEARCH LETTERS, VOL. 37, L18502, doi:10.1029/2010GL044301. C. M. Bitz and L. M. Polvani (2012). GEOPHYSICAL RESEARCH LETTERS, VOL. 39, L20705, 5 PP., 2012. doi:10.1029/2012GL053393. P. R. Holland and R. Kwok (2012). Nature Geoscience, 5, 872–875, doi:10.1038/ngeo1627. [Thomas Bracegirdle, United Kingdom]
14-1362 14 93 26 93 26 I don't think that the reference to the reduction in CO2 uptake is relevant here and is more relevant to Chapter 6. [Thomas Bracegirdle, United Kingdom]
Removed
14-1363 14 93 43 93 44 The recent paper by Zunz et al. (2012; cited in Chapters 9, 11 and 12) should be added to this list of references. [Thierry Fichefet, Belgium]
Shortened and reworded
14-1364 14 93 46 93 46 This probably refers to the confidence on GCMs simulating Antarctic sea ice rather than climate change projections overall. Perhaps specify. [Markku Rummukainen, Sweden]
This section extensively re-worked
14-1365 14 93 46 93 50 Consider assessing the important paper by Bitz and Polvani (GRL, 2012, doi:10.1029/2012GL053393) here. [Thierry Fichefet, Belgium]
Noted - thanks. This discussion completely revamped in light of latest publications.
14-1366 14 93 52 94 11 The seasonality of the response of the SAM to stratospheric ozone changes needs to be made clear here. During most of the year we have a greenhouse gas dominated response in model projections of future scenarios. Most (all?) climate models only show substantial tropospheric responses in summer months when forced with stratospheric ozone change. [Thomas Bracegirdle, United Kingdom]
Noted - thanks. This discussion completely revamped in light of latest publications.
14-1367 14 94 4 94 5 Delete this general sentence on ENSO - this is already more than sufficiently covered in the earlier sections of Chapter 14, and does not need to be repeated here. [Thomas Stocker/ WGI TSU, Switzerland]
Noted. Text shortened
14-1368 14 94 13 94 19 There needs to be a source cited for the statement that "changes in surface temperature over Antarctica are likely to be smaller than the global mean" (a similar statement is given on lines 18/19). In general the annual mean near-surface warming over the Antarctic continent seems to be about the same as other continental landmassess around the globe and indeed slightly larger the the global mean (e.g. see FAQ 14.1 Figure 1 on page 204). [Thomas Bracegirdle, United Kingdom]
Yes. Text modified
14-1369 14 94 15 94 16 The statement that "Future projections of precipitation over Antarctica remain uncertain" needs clarification. For Antarctica as a whole Bracegirdle et al. (2008) found that there was strong consensus in the CMIP3 models for increases in precpitation over the 21st century following the SRESA1B scenario. Is this still the case with the CMIP5 models? [Thomas Bracegirdle, United Kingdom]
Noted. Text reworded
14-1370 14 94 26 95 47 Should some discussion of regional effects of aerosol forcing be included in this section? [John Caesar, United Kingdom of Great Britain & Northern Ireland]
Accepted. Regional forcing due to aerosols is now mentioned
14-1371 14 94 26 95 47 What about regional forcing factors such as changing aerosols? [European Union] Accepted. Regional forcing due to aerosols is now mentioned
14-1372 14 94 30 94 30 FAQ14.1, Regional climate changes are also related to atmospheric circulation changes, which should be mentioned here. [Dabang Jiang, China]
Accepted. Regional forcing due to circulation changes is now mentioned
14-1373 14 94 30 94 34 It would be useful to add a statement explaining how regional and global climates will relate with climate warming. In other words, how does it compare to the "natural" link explained in the response? [Government of Canada]
Accepted
14-1374 14 94 31 94 31 Insert "and moisture" after "heat". [Francis Zwiers, Canada] Accepted
14-1375 14 94 33 94 33 "natural phenomena" sounds too general. [Markku Rummukainen, Sweden] Accepted - now referred to as climate phenomena, as addressed in the chapter
14-1376 14 94 41 94 46 actually internal variability and feedbacks are as well part of the game [Annalisa Cherchi, Italy] Accepted. Or now changed to and .
14-1377 14 94 42 94 43 " … a result of increased emissions of greenhouse gases (which themselves are distributed roughly uniformly around the globe)”. This is ambiguous and misleading – this could be read to imply that emissions (rather
Accepted
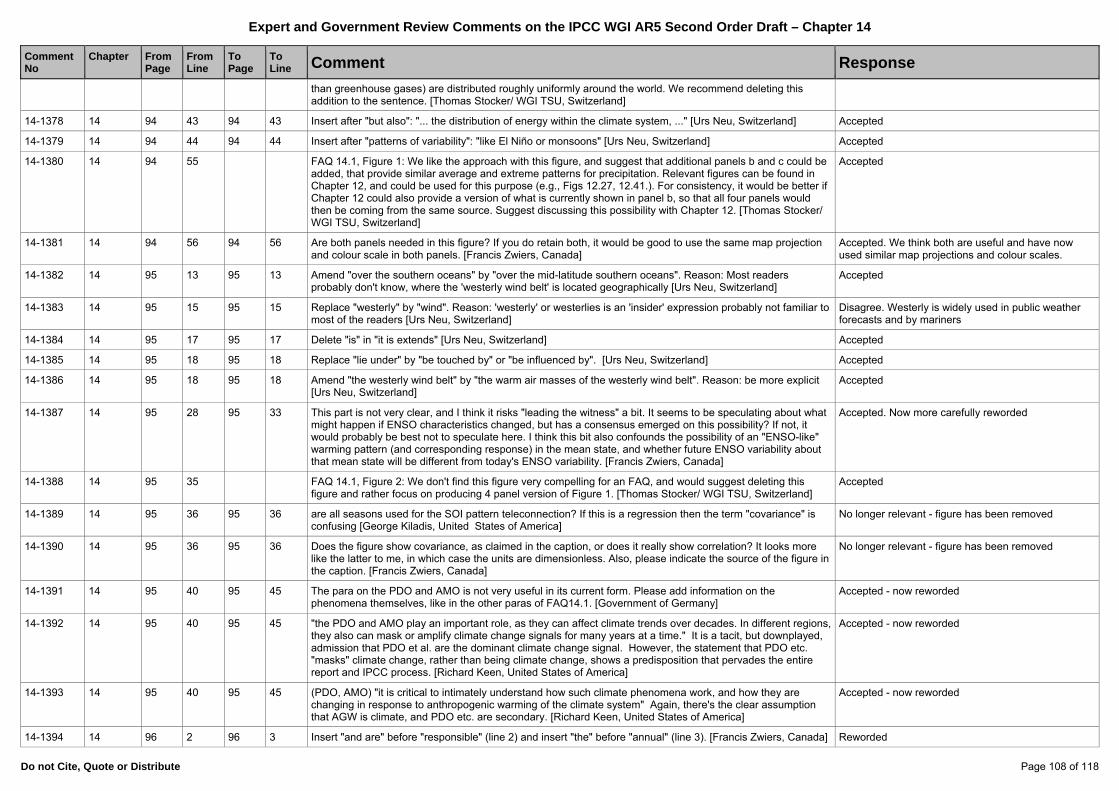
Expert and Government Review Comments on the IPCC WGI AR5 Second Order Draft – Chapter 14
Do not Cite, Quote or Distribute Page 108 of 118
Comment No
Chapter
FromPage
FromLine
To Page
To Line Comment Response
than greenhouse gases) are distributed roughly uniformly around the world. We recommend deleting this addition to the sentence. [Thomas Stocker/ WGI TSU, Switzerland]
14-1378 14 94 43 94 43 Insert after "but also": "... the distribution of energy within the climate system, ..." [Urs Neu, Switzerland] Accepted
14-1379 14 94 44 94 44 Insert after "patterns of variability": "like El Niño or monsoons" [Urs Neu, Switzerland] Accepted
14-1380 14 94 55 FAQ 14.1, Figure 1: We like the approach with this figure, and suggest that additional panels b and c could be added, that provide similar average and extreme patterns for precipitation. Relevant figures can be found in Chapter 12, and could be used for this purpose (e.g., Figs 12.27, 12.41.). For consistency, it would be better if Chapter 12 could also provide a version of what is currently shown in panel b, so that all four panels would then be coming from the same source. Suggest discussing this possibility with Chapter 12. [Thomas Stocker/ WGI TSU, Switzerland]
Accepted
14-1381 14 94 56 94 56 Are both panels needed in this figure? If you do retain both, it would be good to use the same map projection and colour scale in both panels. [Francis Zwiers, Canada]
Accepted. We think both are useful and have now used similar map projections and colour scales.
14-1382 14 95 13 95 13 Amend "over the southern oceans" by "over the mid-latitude southern oceans". Reason: Most readers probably don't know, where the 'westerly wind belt' is located geographically [Urs Neu, Switzerland]
Accepted
14-1383 14 95 15 95 15 Replace "westerly" by "wind". Reason: 'westerly' or westerlies is an 'insider' expression probably not familiar to most of the readers [Urs Neu, Switzerland]
Disagree. Westerly is widely used in public weather forecasts and by mariners
14-1384 14 95 17 95 17 Delete "is" in "it is extends" [Urs Neu, Switzerland] Accepted
14-1385 14 95 18 95 18 Replace "lie under" by "be touched by" or "be influenced by". [Urs Neu, Switzerland] Accepted
14-1386 14 95 18 95 18 Amend "the westerly wind belt" by "the warm air masses of the westerly wind belt". Reason: be more explicit [Urs Neu, Switzerland]
Accepted
14-1387 14 95 28 95 33 This part is not very clear, and I think it risks "leading the witness" a bit. It seems to be speculating about what might happen if ENSO characteristics changed, but has a consensus emerged on this possibility? If not, it would probably be best not to speculate here. I think this bit also confounds the possibility of an "ENSO-like" warming pattern (and corresponding response) in the mean state, and whether future ENSO variability about that mean state will be different from today's ENSO variability. [Francis Zwiers, Canada]
Accepted. Now more carefully reworded
14-1388 14 95 35 FAQ 14.1, Figure 2: We don't find this figure very compelling for an FAQ, and would suggest deleting this figure and rather focus on producing 4 panel version of Figure 1. [Thomas Stocker/ WGI TSU, Switzerland]
Accepted
14-1389 14 95 36 95 36 are all seasons used for the SOI pattern teleconnection? If this is a regression then the term "covariance" is confusing [George Kiladis, United States of America]
No longer relevant - figure has been removed
14-1390 14 95 36 95 36 Does the figure show covariance, as claimed in the caption, or does it really show correlation? It looks more like the latter to me, in which case the units are dimensionless. Also, please indicate the source of the figure in the caption. [Francis Zwiers, Canada]
No longer relevant - figure has been removed
14-1391 14 95 40 95 45 The para on the PDO and AMO is not very useful in its current form. Please add information on the phenomena themselves, like in the other paras of FAQ14.1. [Government of Germany]
Accepted - now reworded
14-1392 14 95 40 95 45 "the PDO and AMO play an important role, as they can affect climate trends over decades. In different regions, they also can mask or amplify climate change signals for many years at a time." It is a tacit, but downplayed, admission that PDO et al. are the dominant climate change signal. However, the statement that PDO etc. "masks" climate change, rather than being climate change, shows a predisposition that pervades the entire report and IPCC process. [Richard Keen, United States of America]
Accepted - now reworded
14-1393 14 95 40 95 45 (PDO, AMO) "it is critical to intimately understand how such climate phenomena work, and how they are changing in response to anthropogenic warming of the climate system" Again, there's the clear assumption that AGW is climate, and PDO etc. are secondary. [Richard Keen, United States of America]
Accepted - now reworded
14-1394 14 96 2 96 3 Insert "and are" before "responsible" (line 2) and insert "the" before "annual" (line 3). [Francis Zwiers, Canada] Reworded
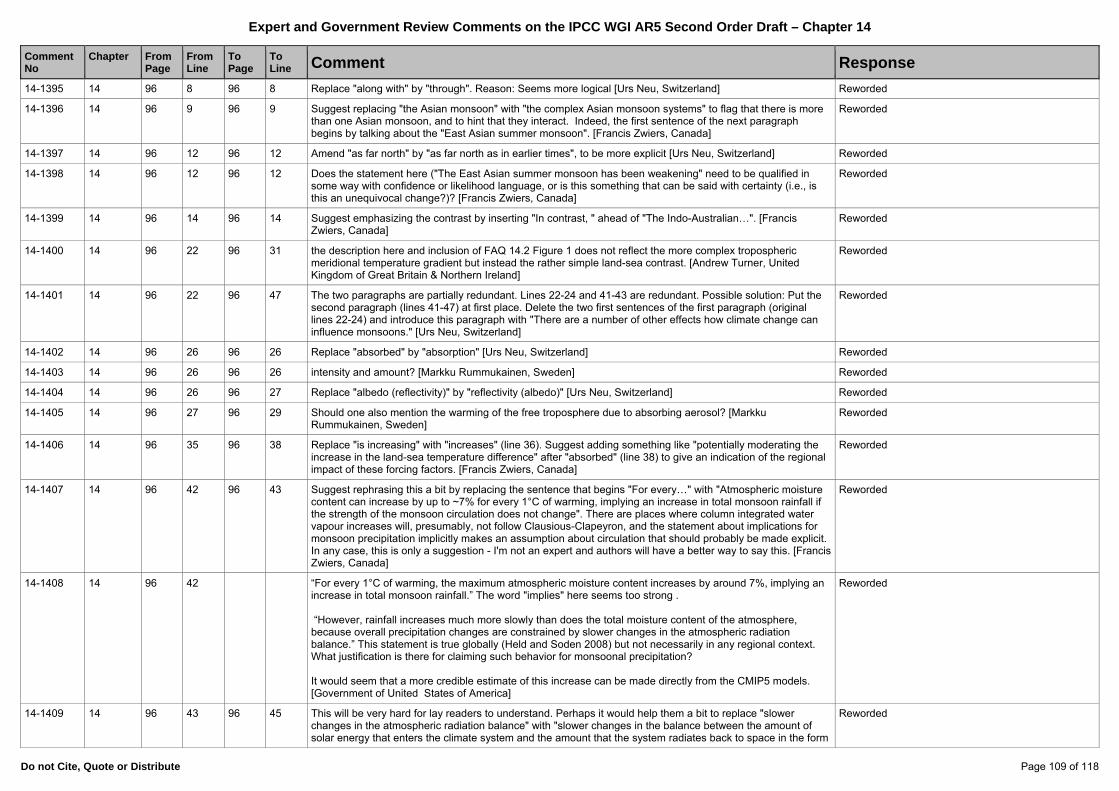
Expert and Government Review Comments on the IPCC WGI AR5 Second Order Draft – Chapter 14
Do not Cite, Quote or Distribute Page 109 of 118
Comment No
Chapter
FromPage
FromLine
To Page
To Line Comment Response
14-1395 14 96 8 96 8 Replace "along with" by "through". Reason: Seems more logical [Urs Neu, Switzerland] Reworded
14-1396 14 96 9 96 9 Suggest replacing "the Asian monsoon" with "the complex Asian monsoon systems" to flag that there is more than one Asian monsoon, and to hint that they interact. Indeed, the first sentence of the next paragraph begins by talking about the "East Asian summer monsoon". [Francis Zwiers, Canada]
Reworded
14-1397 14 96 12 96 12 Amend "as far north" by "as far north as in earlier times", to be more explicit [Urs Neu, Switzerland] Reworded
14-1398 14 96 12 96 12 Does the statement here ("The East Asian summer monsoon has been weakening" need to be qualified in some way with confidence or likelihood language, or is this something that can be said with certainty (i.e., is this an unequivocal change?)? [Francis Zwiers, Canada]
Reworded
14-1399 14 96 14 96 14 Suggest emphasizing the contrast by inserting "In contrast, " ahead of "The Indo-Australian…". [Francis Zwiers, Canada]
Reworded
14-1400 14 96 22 96 31 the description here and inclusion of FAQ 14.2 Figure 1 does not reflect the more complex tropospheric meridional temperature gradient but instead the rather simple land-sea contrast. [Andrew Turner, United Kingdom of Great Britain & Northern Ireland]
Reworded
14-1401 14 96 22 96 47 The two paragraphs are partially redundant. Lines 22-24 and 41-43 are redundant. Possible solution: Put the second paragraph (lines 41-47) at first place. Delete the two first sentences of the first paragraph (original lines 22-24) and introduce this paragraph with "There are a number of other effects how climate change can influence monsoons." [Urs Neu, Switzerland]
Reworded
14-1402 14 96 26 96 26 Replace "absorbed" by "absorption" [Urs Neu, Switzerland] Reworded
14-1403 14 96 26 96 26 intensity and amount? [Markku Rummukainen, Sweden] Reworded
14-1404 14 96 26 96 27 Replace "albedo (reflectivity)" by "reflectivity (albedo)" [Urs Neu, Switzerland] Reworded
14-1405 14 96 27 96 29 Should one also mention the warming of the free troposphere due to absorbing aerosol? [Markku Rummukainen, Sweden]
Reworded
14-1406 14 96 35 96 38 Replace "is increasing" with "increases" (line 36). Suggest adding something like "potentially moderating the increase in the land-sea temperature difference" after "absorbed" (line 38) to give an indication of the regional impact of these forcing factors. [Francis Zwiers, Canada]
Reworded
14-1407 14 96 42 96 43 Suggest rephrasing this a bit by replacing the sentence that begins "For every…" with "Atmospheric moisture content can increase by up to ~7% for every 1°C of warming, implying an increase in total monsoon rainfall if the strength of the monsoon circulation does not change". There are places where column integrated water vapour increases will, presumably, not follow Clausious-Clapeyron, and the statement about implications for monsoon precipitation implicitly makes an assumption about circulation that should probably be made explicit. In any case, this is only a suggestion - I'm not an expert and authors will have a better way to say this. [Francis Zwiers, Canada]
Reworded
14-1408 14 96 42 “For every 1°C of warming, the maximum atmospheric moisture content increases by around 7%, implying an increase in total monsoon rainfall.” The word "implies" here seems too strong . “However, rainfall increases much more slowly than does the total moisture content of the atmosphere, because overall precipitation changes are constrained by slower changes in the atmospheric radiation balance.” This statement is true globally (Held and Soden 2008) but not necessarily in any regional context. What justification is there for claiming such behavior for monsoonal precipitation? It would seem that a more credible estimate of this increase can be made directly from the CMIP5 models. [Government of United States of America]
Reworded
14-1409 14 96 43 96 45 This will be very hard for lay readers to understand. Perhaps it would help them a bit to replace "slower changes in the atmospheric radiation balance" with "slower changes in the balance between the amount of solar energy that enters the climate system and the amount that the system radiates back to space in the form
Reworded
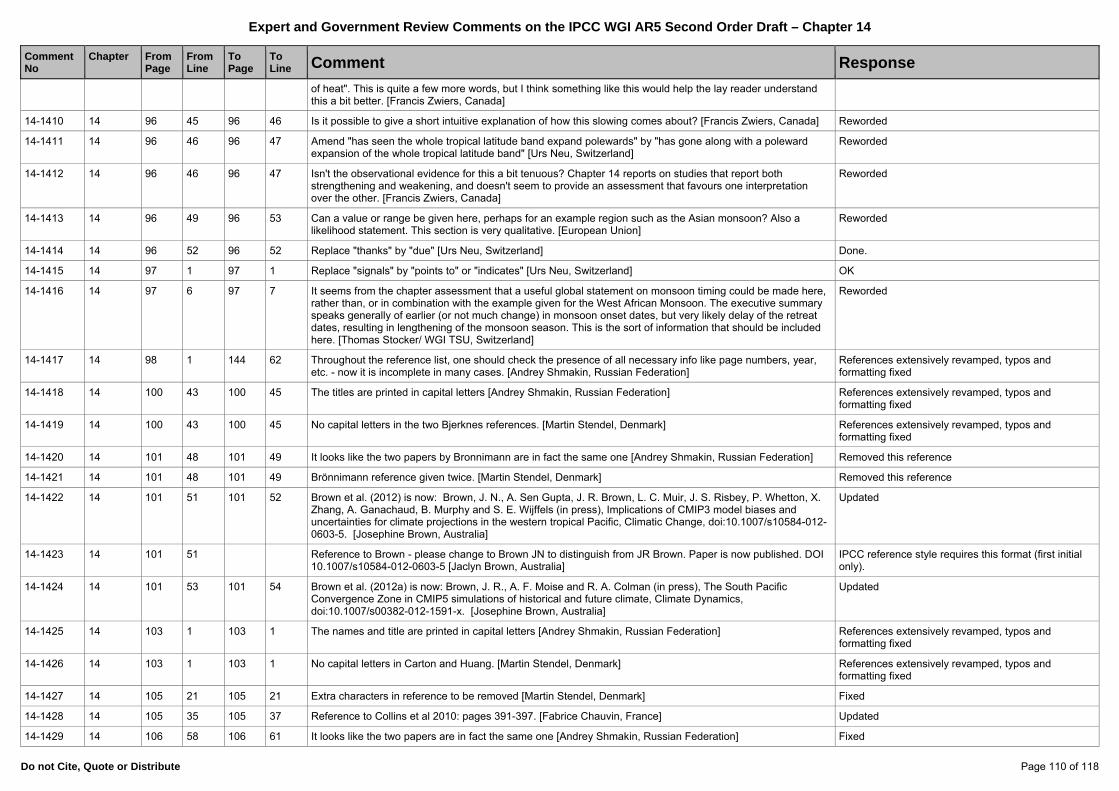
Expert and Government Review Comments on the IPCC WGI AR5 Second Order Draft – Chapter 14
Do not Cite, Quote or Distribute Page 110 of 118
Comment No
Chapter
FromPage
FromLine
To Page
To Line Comment Response
of heat". This is quite a few more words, but I think something like this would help the lay reader understand this a bit better. [Francis Zwiers, Canada]
14-1410 14 96 45 96 46 Is it possible to give a short intuitive explanation of how this slowing comes about? [Francis Zwiers, Canada] Reworded
14-1411 14 96 46 96 47 Amend "has seen the whole tropical latitude band expand polewards" by "has gone along with a poleward expansion of the whole tropical latitude band" [Urs Neu, Switzerland]
Reworded
14-1412 14 96 46 96 47 Isn't the observational evidence for this a bit tenuous? Chapter 14 reports on studies that report both strengthening and weakening, and doesn't seem to provide an assessment that favours one interpretation over the other. [Francis Zwiers, Canada]
Reworded
14-1413 14 96 49 96 53 Can a value or range be given here, perhaps for an example region such as the Asian monsoon? Also a likelihood statement. This section is very qualitative. [European Union]
Reworded
14-1414 14 96 52 96 52 Replace "thanks" by "due" [Urs Neu, Switzerland] Done.
14-1415 14 97 1 97 1 Replace "signals" by "points to" or "indicates" [Urs Neu, Switzerland] OK
14-1416 14 97 6 97 7 It seems from the chapter assessment that a useful global statement on monsoon timing could be made here, rather than, or in combination with the example given for the West African Monsoon. The executive summary speaks generally of earlier (or not much change) in monsoon onset dates, but very likely delay of the retreat dates, resulting in lengthening of the monsoon season. This is the sort of information that should be included here. [Thomas Stocker/ WGI TSU, Switzerland]
Reworded
14-1417 14 98 1 144 62 Throughout the reference list, one should check the presence of all necessary info like page numbers, year, etc. - now it is incomplete in many cases. [Andrey Shmakin, Russian Federation]
References extensively revamped, typos and formatting fixed
14-1418 14 100 43 100 45 The titles are printed in capital letters [Andrey Shmakin, Russian Federation] References extensively revamped, typos and formatting fixed
14-1419 14 100 43 100 45 No capital letters in the two Bjerknes references. [Martin Stendel, Denmark] References extensively revamped, typos and formatting fixed
14-1420 14 101 48 101 49 It looks like the two papers by Bronnimann are in fact the same one [Andrey Shmakin, Russian Federation] Removed this reference
14-1421 14 101 48 101 49 Brönnimann reference given twice. [Martin Stendel, Denmark] Removed this reference
14-1422 14 101 51 101 52 Brown et al. (2012) is now: Brown, J. N., A. Sen Gupta, J. R. Brown, L. C. Muir, J. S. Risbey, P. Whetton, X. Zhang, A. Ganachaud, B. Murphy and S. E. Wijffels (in press), Implications of CMIP3 model biases and uncertainties for climate projections in the western tropical Pacific, Climatic Change, doi:10.1007/s10584-012-0603-5. [Josephine Brown, Australia]
Updated
14-1423 14 101 51 Reference to Brown - please change to Brown JN to distinguish from JR Brown. Paper is now published. DOI 10.1007/s10584-012-0603-5 [Jaclyn Brown, Australia]
IPCC reference style requires this format (first initial only).
14-1424 14 101 53 101 54 Brown et al. (2012a) is now: Brown, J. R., A. F. Moise and R. A. Colman (in press), The South Pacific Convergence Zone in CMIP5 simulations of historical and future climate, Climate Dynamics, doi:10.1007/s00382-012-1591-x. [Josephine Brown, Australia]
Updated
14-1425 14 103 1 103 1 The names and title are printed in capital letters [Andrey Shmakin, Russian Federation] References extensively revamped, typos and formatting fixed
14-1426 14 103 1 103 1 No capital letters in Carton and Huang. [Martin Stendel, Denmark] References extensively revamped, typos and formatting fixed
14-1427 14 105 21 105 21 Extra characters in reference to be removed [Martin Stendel, Denmark] Fixed
14-1428 14 105 35 105 37 Reference to Collins et al 2010: pages 391-397. [Fabrice Chauvin, France] Updated
14-1429 14 106 58 106 61 It looks like the two papers are in fact the same one [Andrey Shmakin, Russian Federation] Fixed
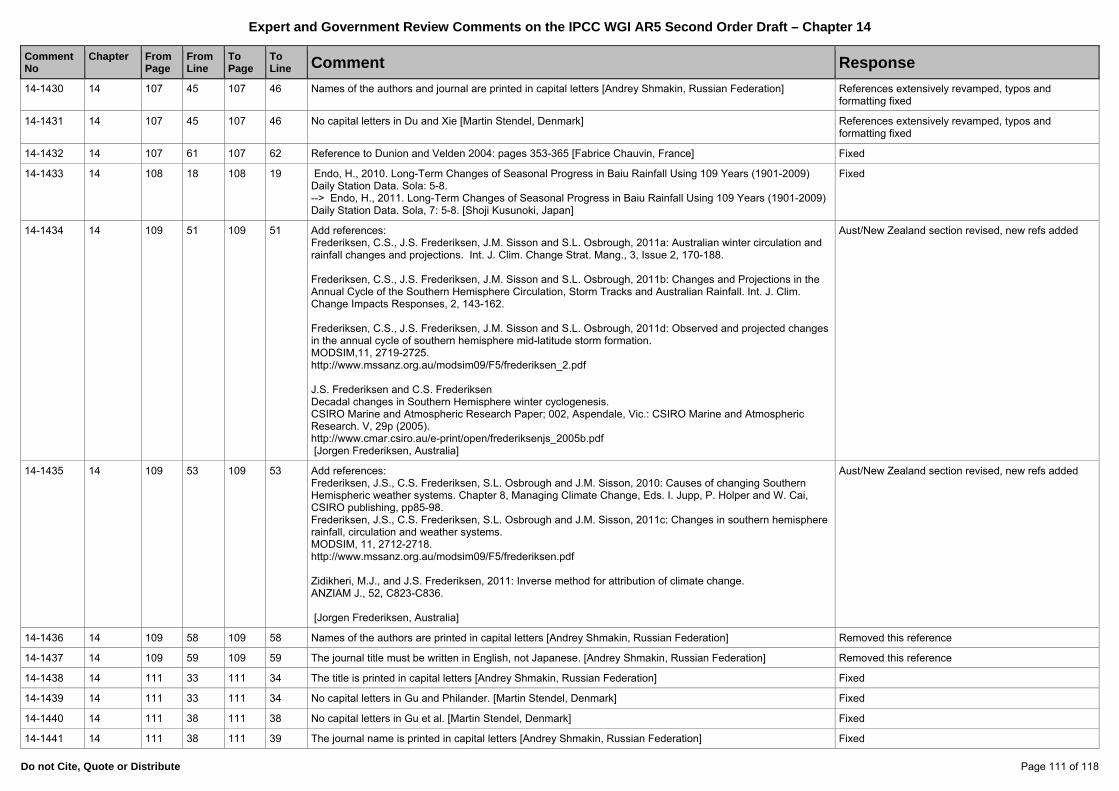
Expert and Government Review Comments on the IPCC WGI AR5 Second Order Draft – Chapter 14
Do not Cite, Quote or Distribute Page 111 of 118
Comment No
Chapter
FromPage
FromLine
To Page
To Line Comment Response
14-1430 14 107 45 107 46 Names of the authors and journal are printed in capital letters [Andrey Shmakin, Russian Federation] References extensively revamped, typos and formatting fixed
14-1431 14 107 45 107 46 No capital letters in Du and Xie [Martin Stendel, Denmark] References extensively revamped, typos and formatting fixed
14-1432 14 107 61 107 62 Reference to Dunion and Velden 2004: pages 353-365 [Fabrice Chauvin, France] Fixed
14-1433 14 108 18 108 19 Endo, H., 2010. Long-Term Changes of Seasonal Progress in Baiu Rainfall Using 109 Years (1901-2009) Daily Station Data. Sola: 5-8. --> Endo, H., 2011. Long-Term Changes of Seasonal Progress in Baiu Rainfall Using 109 Years (1901-2009) Daily Station Data. Sola, 7: 5-8. [Shoji Kusunoki, Japan]
Fixed
14-1434 14 109 51 109 51 Add references: Frederiksen, C.S., J.S. Frederiksen, J.M. Sisson and S.L. Osbrough, 2011a: Australian winter circulation and rainfall changes and projections. Int. J. Clim. Change Strat. Mang., 3, Issue 2, 170-188. Frederiksen, C.S., J.S. Frederiksen, J.M. Sisson and S.L. Osbrough, 2011b: Changes and Projections in the Annual Cycle of the Southern Hemisphere Circulation, Storm Tracks and Australian Rainfall. Int. J. Clim. Change Impacts Responses, 2, 143-162. Frederiksen, C.S., J.S. Frederiksen, J.M. Sisson and S.L. Osbrough, 2011d: Observed and projected changes in the annual cycle of southern hemisphere mid-latitude storm formation. MODSIM,11, 2719-2725. http://www.mssanz.org.au/modsim09/F5/frederiksen_2.pdf J.S. Frederiksen and C.S. Frederiksen Decadal changes in Southern Hemisphere winter cyclogenesis. CSIRO Marine and Atmospheric Research Paper; 002, Aspendale, Vic.: CSIRO Marine and Atmospheric Research. V, 29p (2005). http://www.cmar.csiro.au/e-print/open/frederiksenjs_2005b.pdf [Jorgen Frederiksen, Australia]
Aust/New Zealand section revised, new refs added
14-1435 14 109 53 109 53 Add references: Frederiksen, J.S., C.S. Frederiksen, S.L. Osbrough and J.M. Sisson, 2010: Causes of changing Southern Hemispheric weather systems. Chapter 8, Managing Climate Change, Eds. I. Jupp, P. Holper and W. Cai, CSIRO publishing, pp85-98. Frederiksen, J.S., C.S. Frederiksen, S.L. Osbrough and J.M. Sisson, 2011c: Changes in southern hemisphere rainfall, circulation and weather systems. MODSIM, 11, 2712-2718. http://www.mssanz.org.au/modsim09/F5/frederiksen.pdf Zidikheri, M.J., and J.S. Frederiksen, 2011: Inverse method for attribution of climate change. ANZIAM J., 52, C823-C836. [Jorgen Frederiksen, Australia]
Aust/New Zealand section revised, new refs added
14-1436 14 109 58 109 58 Names of the authors are printed in capital letters [Andrey Shmakin, Russian Federation] Removed this reference
14-1437 14 109 59 109 59 The journal title must be written in English, not Japanese. [Andrey Shmakin, Russian Federation] Removed this reference
14-1438 14 111 33 111 34 The title is printed in capital letters [Andrey Shmakin, Russian Federation] Fixed
14-1439 14 111 33 111 34 No capital letters in Gu and Philander. [Martin Stendel, Denmark] Fixed
14-1440 14 111 38 111 38 No capital letters in Gu et al. [Martin Stendel, Denmark] Fixed
14-1441 14 111 38 111 39 The journal name is printed in capital letters [Andrey Shmakin, Russian Federation] Fixed
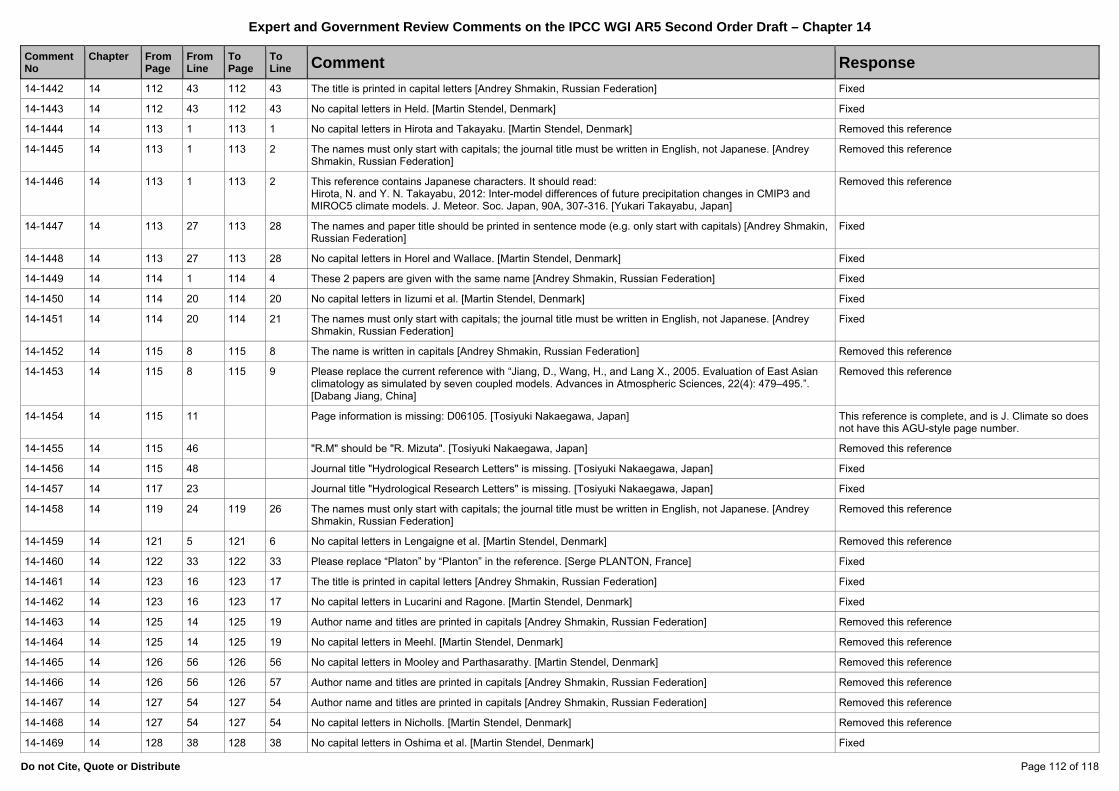
Expert and Government Review Comments on the IPCC WGI AR5 Second Order Draft – Chapter 14
Do not Cite, Quote or Distribute Page 112 of 118
Comment No
Chapter
FromPage
FromLine
To Page
To Line Comment Response
14-1442 14 112 43 112 43 The title is printed in capital letters [Andrey Shmakin, Russian Federation] Fixed
14-1443 14 112 43 112 43 No capital letters in Held. [Martin Stendel, Denmark] Fixed
14-1444 14 113 1 113 1 No capital letters in Hirota and Takayaku. [Martin Stendel, Denmark] Removed this reference
14-1445 14 113 1 113 2 The names must only start with capitals; the journal title must be written in English, not Japanese. [Andrey Shmakin, Russian Federation]
Removed this reference
14-1446 14 113 1 113 2 This reference contains Japanese characters. It should read: Hirota, N. and Y. N. Takayabu, 2012: Inter-model differences of future precipitation changes in CMIP3 and MIROC5 climate models. J. Meteor. Soc. Japan, 90A, 307-316. [Yukari Takayabu, Japan]
Removed this reference
14-1447 14 113 27 113 28 The names and paper title should be printed in sentence mode (e.g. only start with capitals) [Andrey Shmakin, Russian Federation]
Fixed
14-1448 14 113 27 113 28 No capital letters in Horel and Wallace. [Martin Stendel, Denmark] Fixed
14-1449 14 114 1 114 4 These 2 papers are given with the same name [Andrey Shmakin, Russian Federation] Fixed
14-1450 14 114 20 114 20 No capital letters in Iizumi et al. [Martin Stendel, Denmark] Fixed
14-1451 14 114 20 114 21 The names must only start with capitals; the journal title must be written in English, not Japanese. [Andrey Shmakin, Russian Federation]
Fixed
14-1452 14 115 8 115 8 The name is written in capitals [Andrey Shmakin, Russian Federation] Removed this reference
14-1453 14 115 8 115 9 Please replace the current reference with “Jiang, D., Wang, H., and Lang X., 2005. Evaluation of East Asian climatology as simulated by seven coupled models. Advances in Atmospheric Sciences, 22(4): 479–495.”. [Dabang Jiang, China]
Removed this reference
14-1454 14 115 11 Page information is missing: D06105. [Tosiyuki Nakaegawa, Japan] This reference is complete, and is J. Climate so does not have this AGU-style page number.
14-1455 14 115 46 "R.M" should be "R. Mizuta". [Tosiyuki Nakaegawa, Japan] Removed this reference
14-1456 14 115 48 Journal title "Hydrological Research Letters" is missing. [Tosiyuki Nakaegawa, Japan] Fixed
14-1457 14 117 23 Journal title "Hydrological Research Letters" is missing. [Tosiyuki Nakaegawa, Japan] Fixed
14-1458 14 119 24 119 26 The names must only start with capitals; the journal title must be written in English, not Japanese. [Andrey Shmakin, Russian Federation]
Removed this reference
14-1459 14 121 5 121 6 No capital letters in Lengaigne et al. [Martin Stendel, Denmark] Removed this reference
14-1460 14 122 33 122 33 Please replace “Platon” by “Planton” in the reference. [Serge PLANTON, France] Fixed
14-1461 14 123 16 123 17 The title is printed in capital letters [Andrey Shmakin, Russian Federation] Fixed
14-1462 14 123 16 123 17 No capital letters in Lucarini and Ragone. [Martin Stendel, Denmark] Fixed
14-1463 14 125 14 125 19 Author name and titles are printed in capitals [Andrey Shmakin, Russian Federation] Removed this reference
14-1464 14 125 14 125 19 No capital letters in Meehl. [Martin Stendel, Denmark] Removed this reference
14-1465 14 126 56 126 56 No capital letters in Mooley and Parthasarathy. [Martin Stendel, Denmark] Removed this reference
14-1466 14 126 56 126 57 Author name and titles are printed in capitals [Andrey Shmakin, Russian Federation] Removed this reference
14-1467 14 127 54 127 54 Author name and titles are printed in capitals [Andrey Shmakin, Russian Federation] Removed this reference
14-1468 14 127 54 127 54 No capital letters in Nicholls. [Martin Stendel, Denmark] Removed this reference
14-1469 14 128 38 128 38 No capital letters in Oshima et al. [Martin Stendel, Denmark] Fixed
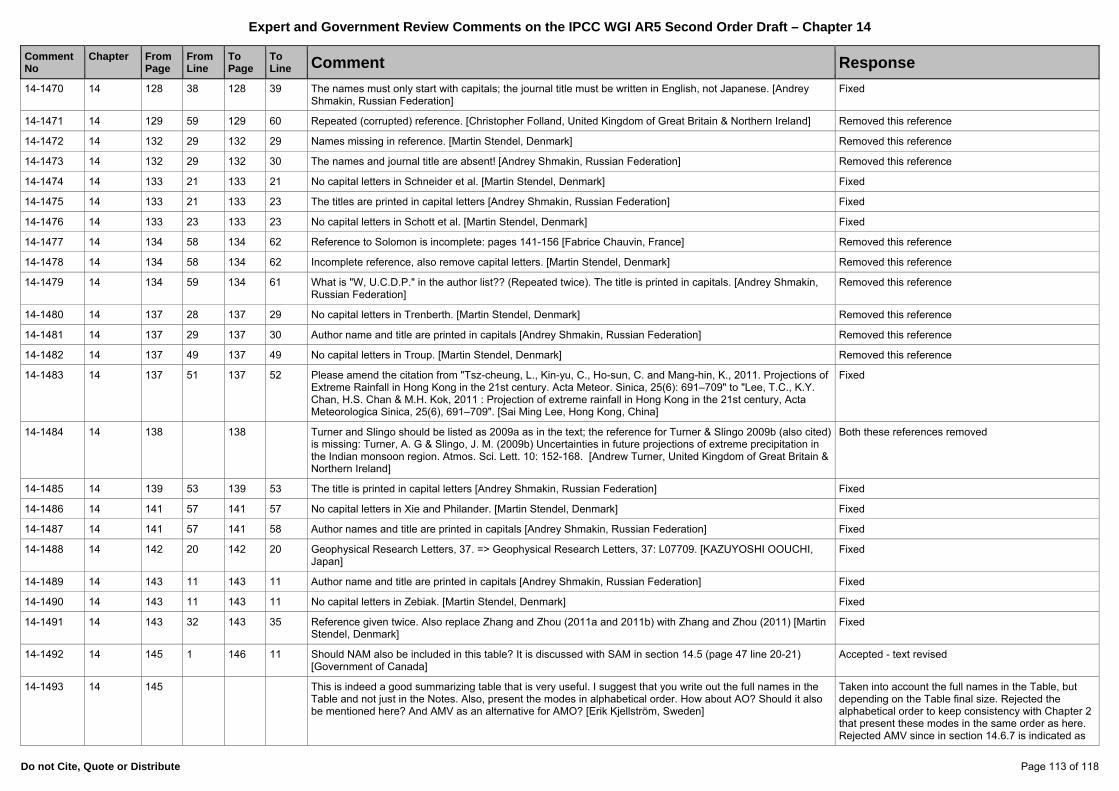
Expert and Government Review Comments on the IPCC WGI AR5 Second Order Draft – Chapter 14
Do not Cite, Quote or Distribute Page 113 of 118
Comment No
Chapter
FromPage
FromLine
To Page
To Line Comment Response
14-1470 14 128 38 128 39 The names must only start with capitals; the journal title must be written in English, not Japanese. [Andrey Shmakin, Russian Federation]
Fixed
14-1471 14 129 59 129 60 Repeated (corrupted) reference. [Christopher Folland, United Kingdom of Great Britain & Northern Ireland] Removed this reference
14-1472 14 132 29 132 29 Names missing in reference. [Martin Stendel, Denmark] Removed this reference
14-1473 14 132 29 132 30 The names and journal title are absent! [Andrey Shmakin, Russian Federation] Removed this reference
14-1474 14 133 21 133 21 No capital letters in Schneider et al. [Martin Stendel, Denmark] Fixed
14-1475 14 133 21 133 23 The titles are printed in capital letters [Andrey Shmakin, Russian Federation] Fixed
14-1476 14 133 23 133 23 No capital letters in Schott et al. [Martin Stendel, Denmark] Fixed
14-1477 14 134 58 134 62 Reference to Solomon is incomplete: pages 141-156 [Fabrice Chauvin, France] Removed this reference
14-1478 14 134 58 134 62 Incomplete reference, also remove capital letters. [Martin Stendel, Denmark] Removed this reference
14-1479 14 134 59 134 61 What is "W, U.C.D.P." in the author list?? (Repeated twice). The title is printed in capitals. [Andrey Shmakin, Russian Federation]
Removed this reference
14-1480 14 137 28 137 29 No capital letters in Trenberth. [Martin Stendel, Denmark] Removed this reference
14-1481 14 137 29 137 30 Author name and title are printed in capitals [Andrey Shmakin, Russian Federation] Removed this reference
14-1482 14 137 49 137 49 No capital letters in Troup. [Martin Stendel, Denmark] Removed this reference
14-1483 14 137 51 137 52 Please amend the citation from "Tsz-cheung, L., Kin-yu, C., Ho-sun, C. and Mang-hin, K., 2011. Projections of Extreme Rainfall in Hong Kong in the 21st century. Acta Meteor. Sinica, 25(6): 691–709" to "Lee, T.C., K.Y. Chan, H.S. Chan & M.H. Kok, 2011 : Projection of extreme rainfall in Hong Kong in the 21st century, Acta Meteorologica Sinica, 25(6), 691–709". [Sai Ming Lee, Hong Kong, China]
Fixed
14-1484 14 138 138 Turner and Slingo should be listed as 2009a as in the text; the reference for Turner & Slingo 2009b (also cited) is missing: Turner, A. G & Slingo, J. M. (2009b) Uncertainties in future projections of extreme precipitation in the Indian monsoon region. Atmos. Sci. Lett. 10: 152-168. [Andrew Turner, United Kingdom of Great Britain & Northern Ireland]
Both these references removed
14-1485 14 139 53 139 53 The title is printed in capital letters [Andrey Shmakin, Russian Federation] Fixed
14-1486 14 141 57 141 57 No capital letters in Xie and Philander. [Martin Stendel, Denmark] Fixed
14-1487 14 141 57 141 58 Author names and title are printed in capitals [Andrey Shmakin, Russian Federation] Fixed
14-1488 14 142 20 142 20 Geophysical Research Letters, 37. => Geophysical Research Letters, 37: L07709. [KAZUYOSHI OOUCHI, Japan]
Fixed
14-1489 14 143 11 143 11 Author name and title are printed in capitals [Andrey Shmakin, Russian Federation] Fixed
14-1490 14 143 11 143 11 No capital letters in Zebiak. [Martin Stendel, Denmark] Fixed
14-1491 14 143 32 143 35 Reference given twice. Also replace Zhang and Zhou (2011a and 2011b) with Zhang and Zhou (2011) [Martin Stendel, Denmark]
Fixed
14-1492 14 145 1 146 11 Should NAM also be included in this table? It is discussed with SAM in section 14.5 (page 47 line 20-21) [Government of Canada]
Accepted - text revised
14-1493 14 145 This is indeed a good summarizing table that is very useful. I suggest that you write out the full names in the Table and not just in the Notes. Also, present the modes in alphabetical order. How about AO? Should it also be mentioned here? And AMV as an alternative for AMO? [Erik Kjellström, Sweden]
Taken into account the full names in the Table, but depending on the Table final size. Rejected the alphabetical order to keep consistency with Chapter 2 that present these modes in the same order as here. Rejected AMV since in section 14.6.7 is indicated as
Expert and Government Review Comments on the IPCC WGI AR5 Second Order Draft – Chapter 14
Do not Cite, Quote or Distribute Page 114 of 118
Comment No
Chapter
FromPage
FromLine
To Page
To Line Comment Response
analogue to AMO.
14-1494 14 145 Box 14.1 Table 1 Why is the Summer NAO not included? [Geert Jan van Oldenborgh, Netherlands] Taken into account-text revised. But instead of consider it as an independent mode, a mention to sNAO impacts will be added in NAO box.
14-1495 14 148 156 Table 1: For some experiments, length of experiment is not indicated. For timeslice type experiment, the length of experiment may be written after "Timeslice" in the second column. For example, for (Sugi et al., 2009) Timeslice 25y (20y, 10y), for (Murakami et al. 2012) and (Murakami et al. 2011a) Timeslice 25y, and for (Yamada et al., 2010) Timeslice 5mon. Similar comment may be applicable to Table 2, 3 and 4 as well. [Masato Sugi, Japan]
Although the length of the time slice is relevant in so far as defining robustness of the results. As stated in the caption, it is the statistical significanse of the results that are in focus. Not many of the experiments quoeted have carried out such an analysis. The table is compiled to provide an overview of the available studies. In the assessment itself these factors are taken care of.
14-1496 14 150 Box 14.2, Table1 Yamada et al. 2010…Timeslice using CMIP3 => 1yr Timeslice using CMIP3 [KAZUYOSHI OOUCHI, Japan]
Noted, but the table is meant to provide an overview, not detail all experiments (see answer above)
14-1497 14 153 5 Define acronyms. [Christian Reuten, Canada] This material has been moved to Supplemntary material and the acronyms are now defined.
14-1498 14 155 Box 14.2, Table3 Yamada et al. 2010…Timeslice using CMIP3 => 1yr Timeslice using CMIP3 [KAZUYOSHI OOUCHI, Japan]
Noted, but the table is meant to provide an overview, not detail all experiments (see answer above)
14-1499 14 157 1 157 15 This is an excellent addition to this chapter, and useful continuity from AR4. However, I am not convinced at all by the decision to compute averages for different seasonal descriptions for temperature and precipitation. As I have already argued for the Atlas, I am not persuaded by the arguments for treating precipitation using 6-monthly periods, or temperature using three-monthly winter/summer periods alone. I would much prefer to see all four standard 3-monthly seasonal averages (DJF, MAM, JJA, and SON) as well as annual values for both temperature and precipitation. This would provide comparable periods across T and P, would also cover the monsoon (whenever it occurs - 6 monthly values don't solve timing issues in all regions anyway), would cover transition seasons for temperature, which are often MORE important than summer/winter seasons for impacts (contrary to the arguments propounded in the atlas text), and finally, would be consistent with the AR4 tables. This can't be a case of time and space saving, because most of the material will be contained either in electronic form for the atlas or as supplementary material. There seems to have been little or no consultation with WG II impacts people on this - it appears to be purely a climatological decision, and even then it really isn't too logical! [Timothy Carter, Finland]
Defer to decissions in the Atlas
14-1500 14 157 1 Should also note in the caption that in addition to the SREX regions, Table 14.2 also includes Antarctica, the Arctic, and the Caribbean. We also note that the Pacific Islands are missing from this table. As the only region from Section 14.7 not included in this table, some brief explanation in the captions is probably important. [Thomas Stocker/ WGI TSU, Switzerland]
Has been expanded to help on this
14-1501 14 165 1 165 15 This figure is overly complex. It would be better to have a figure showing the relevant climate features etc. similar to the PCCSP figure 14.36 and then separately illustrate the teleconnections associated with each mode in the relevant subsections. [Josephine Brown, Australia]
Disagree - only comment along these lines. I find this figure very useful, and visually appealing. Could perhaps do some re-sizing.
14-1502 14 165 3 165 4 In Box 14.1 Fig1 DEF presumably is DJF [Christopher Folland, United Kingdom of Great Britain & Northern Ireland]
Accepted-text revised
14-1503 14 165 7 Include a brief mnemonic of the monsoon index to aid the reader (so they can get the gist without having to look up Kim et al. 2011) [J. David Neelin, United States of America]
Taken into account- text revised. But instead a reference to subsection 14.2.1, where the index is already defined, will be included
14-1504 14 165 9 Reference still missing. [Christian Reuten, Canada] Noted
14-1505 14 165 165 In Fig 1, caption DEF should be written as DJF. [Madhavan Nair RAJEEVAN, India] Accepted-text revised
14-1506 14 165 I suggest to make the small maps larger so that they become readable. Change DEF into DJF. Also, I don't Accepted-text revised
Expert and Government Review Comments on the IPCC WGI AR5 Second Order Draft – Chapter 14
Do not Cite, Quote or Distribute Page 115 of 118
Comment No
Chapter
FromPage
FromLine
To Page
To Line Comment Response
think it is entirely clear what time period was considered for the mode indexes. [Erik Kjellström, Sweden]
14-1507 14 165 The panels on the left and right are too small to see. Can they be moved underneath the centre panel and be enlarged; else they should be in a separate figure. [Christian Reuten, Canada]
Taken into account- figure sizes revised
14-1508 14 165 The winter months in the small panels to the left and right should read "(DJF)" rather than "(DEF)". [Christian Reuten, Canada]
Accepted-text revised
14-1509 14 165 Box 14.1, Figure 1 erroneously mentions “DEF” instead of “DJF”. [Andrew Turner, United Kingdom of Great Britain & Northern Ireland]
Accepted-text revised
14-1510 14 165 Box 14.1 Fig.1 "DEF" in the titles of the subpanels should read "DJF". [Geert Jan van Oldenborgh, Netherlands]
Accepted-text revised
14-1511 14 166 8 166 8 "orange" [George Kiladis, United States of America] Figure has been deleted
14-1512 14 166 fig. 14.1 This figure should be re-thought. It is confusing and unclear why the boxed text is placed above the middle panel - they do not appear to label anything. The contours overlaying the coloring is not effective - too busy. The maps in the side panels are unreasonably small. [Government of United States of America]
Figure has been deleted
14-1513 14 166 Why are the reanalysis data series so short? For example, ERA-40 should start earlier. [Christian Reuten, Canada]
Figure has been deleted
14-1514 14 167 2 Fig.14.2d : Bottom Margin to be adjusted [Indrani Roy, U.K.] Bottom margin has been adjusted
14-1515 14 167 7 167 8 GMP and GMI should be switched to list them in the same order as shown in the figure. [Christian Reuten, Canada]
Accepted. Text modified.
14-1516 14 167 What is "GLB" in the title of panels c) and d)? Concerning the colors it would be very good if the separation between the two blue colors were made better. The dark blue is not always easily distinguishable from the black coast lines. Last sentence says that all indices are calculated for summer but it does not say for which region? Globally? In the GMA? Elsewhere? [Erik Kjellström, Sweden]
The 'GLB' label has been deleted; we cannot find better colors; meaning of 'summer' is defined more clearly in new caption
14-1517 14 168 8 168 9 CRU has upgraded to CRU TS 3.10.01 which fixes a significant bug. Was this version used? [Geert Jan van Oldenborgh, Netherlands]
CRU dataset has been updated
14-1518 14 170 I find the location of the data relative to the vertical axis scales in Figure 14.5 to be virtually unreadable. [Andrew Turner, United Kingdom of Great Britain & Northern Ireland]
box-whisker plots have been used instead of crosses
14-1519 14 171 4 171 7 Fig 14.6 caption is vague: Add range of calendar months to which this refers. [Christopher Folland, United Kingdom of Great Britain & Northern Ireland]
Figure has been deleted
14-1520 14 171 it is unclear If Figure 14.6 is for observations or CMIP models. [Andrew Turner, United Kingdom of Great Britain & Northern Ireland]
Figure has been deleted
14-1521 14 172 4 172 9 Introduce acronyms ERE and WRE. [Christian Reuten, Canada] Figure has been deleted
14-1522 14 172 4 172 9 It is not clear which description applies to the inset and which to the main figure. Moreover, what does "black" in line 7 refer to? [Christian Reuten, Canada]
Figure has been deleted
14-1523 14 172 172 The proper reference of IMD rainfall data may be mentioned in the text. Also mention the details of data which are used to derive ERE. Is it TRMM data? [Madhavan Nair RAJEEVAN, India]
Figure has been deleted
14-1524 14 172 173 Figures 14.7 and 14.8 are the wrong way round. [Andrew Turner, United Kingdom of Great Britain & Northern Ireland]
Figure has been deleted
14-1525 14 172 The legend of the inset shows the wrong slope for WRE. [Christian Reuten, Canada] Figure has been deleted
14-1526 14 172 Fig. 14.7 What do the two blue and two red lines in the insert denote? [Geert Jan van Oldenborgh, Netherlands]
Figure has been deleted
Expert and Government Review Comments on the IPCC WGI AR5 Second Order Draft – Chapter 14
Do not Cite, Quote or Distribute Page 116 of 118
Comment No
Chapter
FromPage
FromLine
To Page
To Line Comment Response
14-1527 14 172 Fig. 14.7 How is an ERE defined (assuming it is an extreme rainfall event)? [Geert Jan van Oldenborgh, Netherlands]
Figure has been deleted
14-1528 14 173 6 173 7 Use the proper names for "gfdl_cm2_0" etc. [Christian Reuten, Canada] Figure has been deleted
14-1529 14 173 8 Should "1pctto2x" be "1pct"? [Christian Reuten, Canada] Figure has been deleted
14-1530 14 173 It would be good to add CMIP5 results to this graph. [Erik Kjellström, Sweden] Figure has been deleted
14-1531 14 173 although my paper Turner & Annamalai (2012) has been cited in the relevant text, since Figure 14.8 is very closely related to Figure 4 of that paper, it should at least be cited in the figure caption! [Andrew Turner, United Kingdom of Great Britain & Northern Ireland]
Figure has been deleted
14-1532 14 174 4 174 9 Fig 14.9: add the meaning of b in the diagram to the caption [Christopher Folland, United Kingdom of Great Britain & Northern Ireland]
meaning of 'b' has been indicated in new caption
14-1533 14 174 In the two upper panels based on reanalysis there are relatively large differences between the two for individual years. This is not commented upon in the text. [Erik Kjellström, Sweden]
Figure has been moved to Supplementary Material
14-1534 14 175 4 175 7 Fig 14.10. Add the units of linear trend to caption [Christopher Folland, United Kingdom of Great Britain & Northern Ireland]
units have been added in new caption
14-1535 14 176 4 176 8 Include a brief mnemonic of the monsoon indices to aid the reader (so they can get the gist without having to look up Zhou et al. 2009) [J. David Neelin, United States of America]
detailed definitions of monsoon indices are provided in new caption
14-1536 14 176 What are "Guo" and "HW" in the titles of a) and b)? [Erik Kjellström, Sweden] panels for 'Guo' and 'HW' have been deleted
14-1537 14 176 the caption should give the reader a basic idea of whether the monsoon indices are circulation- or rainfall-based to avoid them being mis-interpreted. [Andrew Turner, United Kingdom of Great Britain & Northern Ireland]
detailed definitions of monsoon indices are provided in new caption
14-1538 14 178 What are the time periods used to produce the upper panel? Is it correct that the green and grey shading represents +/-5 % in this Figure and +/- 20 mm/month in Figure 14.15? [Erik Kjellström, Sweden]
time periods are given in new caption; meaning of green/grey shading is explained in caption
14-1539 14 178 Figure 14.13. See comments on page 27 [J. David Neelin, United States of America] comments on Page 27 have been addressed
14-1540 14 179 8 "day5"? [Christian Reuten, Canada] Figure has been deleted
14-1541 14 179 What is the period used for producing the maps? It is not evident how "the two leading principal component patterns of rainfall" are? Are the colors representing more/less precipitation compared to some long-term mean? [Erik Kjellström, Sweden]
Figure has been deleted
14-1542 14 182 What is "SSH"? Are the changes described in the last sentence statistically significant? [Erik Kjellström, Sweden]
Figure has been deleted
14-1543 14 183 4 183 4 Add: "for the tropical Atlantic" in first sentence of caption [Christopher Folland, United Kingdom of Great Britain & Northern Ireland]
Figure has been deleted
14-1544 14 183 the Figure 14.17 caption is wrong and should be a) SST variance, b) SSH variance, c) SST skewness. [Andrew Turner, United Kingdom of Great Britain & Northern Ireland]
Figure has been deleted
14-1545 14 186 1 186 2 I can re-draw fig 14.21 if you need me to. [Matthew Collins, United Kingdom of Great Britain & Northern Ireland]
Figure has been redrawn
14-1546 14 186 1 Fig.14.21 b,c : Texts not clear [Indrani Roy, U.K.] comment noted
14-1547 14 186 a colour bar should be provided with the anomaly panels of Figure 14.21 to avoid the dangerous mis-interpretation that blue equals cooling. [Andrew Turner, United Kingdom of Great Britain & Northern Ireland]
comment noted
14-1548 14 187 It is not clear where the Nino3&4 regions are [Erik Kjellström, Sweden] definitions of NINO3 and NINO4 are rather standard
14-1549 14 187 Figure 14.22: The error bars on these trend lines are likely very large, so they need to be shown, accounting noted, adding error bars would complicate the figure
Expert and Government Review Comments on the IPCC WGI AR5 Second Order Draft – Chapter 14
Do not Cite, Quote or Distribute Page 117 of 118
Comment No
Chapter
FromPage
FromLine
To Page
To Line Comment Response
for serial correlation etc. Even better would be to replace this figure with a simple equatorial hovmuller of observed SST from 1979-present -- this would convey more information, more clearly. [Andrew Wittenberg, United States of America]
too much
14-1550 14 189 fig. 14.24 This is an overly complex and ineffective figure - what do the blue, yellow and green boxes numbered with 'm2' 'm5' etc. mean? [Government of United States of America]
Figure has been deleted
14-1551 14 190 1 190 3 Fig. 14.25 would benefit from including standard deviation of observed SST data sets like ERSSTv3 and HadISST - from about 1876 when El Ninos are reasonably consistently reproduced. [Christopher Folland, United Kingdom of Great Britain & Northern Ireland]
Figure has been deleted
14-1552 14 192 The lower panels are not readable [Erik Kjellström, Sweden] clarity of lower panels has been improved
14-1553 14 194 1 196 3 Figs 14.28-14.30:Three separate PSA diagrams seems too many. [Christopher Folland, United Kingdom of Great Britain & Northern Ireland]
all three figures have been deleted
14-1554 14 194 2 194 3 Fig 14.28 Figs b and d appear to be reversed [Christopher Folland, United Kingdom of Great Britain & Northern Ireland]
Figure has been deleted
14-1555 14 194 2 Fig. 14.28: title should be b) PC1 and d) PC2 [Indrani Roy, U.K.] Figure has been deleted
14-1556 14 194 5 Fig. 14.28 (caption): P is missing from PC1 [Indrani Roy, U.K.] Figure has been deleted
14-1557 14 194 What are C1? PC1? PC2? (same in subsequent figures) [Erik Kjellström, Sweden] Figure has been deleted
14-1558 14 196 5 Fig.14.30: R from RCP is missing [Indrani Roy, U.K.] Figure has been deleted
14-1559 14 197 1 197 2 Fig. 14.31 What is the solid dark green line? [Christopher Folland, United Kingdom of Great Britain & Northern Ireland]
New figure has been generated with new coloring scheme for various models
14-1560 14 198 1 What about showing those regions not included in the SREX, but for which you do provide an assessment in Section 14.7., i.e., Arctic, Antarctic, Caribbean, and the Pacific Islands. [Thomas Stocker/ WGI TSU, Switzerland]
Figure has been deleted
14-1561 14 199 6 Fig. 14.33 (caption) : It will be clearer if at the end added ' (10RCMavg)' [Indrani Roy, U.K.] Figure has been deleted
14-1562 14 199 Figure 14.33: Figure was checked for inconsistencies with own professional experience and competency. No relevant disagreements were detected. [Dirk Thielen, Venezuela]
Figure has been deleted
14-1563 14 200 1 200 1 COMMENT ON PAGE 202, but could not enter > 200 into page number. Figure 14.36: The caption for this figure should be edited to remove content relevant to PCCSP report and replace with something like "Dominant climate features of the Pacific Island region". As several countries were excluded from the PCCSP program for political reasons, it would be more appropriate here to have a modified version of the figure with all countries named (or remove names). Also, extend the domain to cover all Pacific Island countries!!! There also appears to be a white box over Palau region. [Josephine Brown, Australia]
Figure has been deleted
14-1564 14 200 PAGE 201: what dataset is used for Figure 14.35? A broader diagram in the y-direction would also help elucidate the trends. [Andrew Turner, United Kingdom of Great Britain & Northern Ireland]
Figure has been deleted
14-1565 14 202 Fig 14.32: The warm pool is not well described in this figure. Perhaps add in a line showing mean position of 28.5 degreeC isotherm? [Jaclyn Brown, Australia]
Figure has been deleted
14-1566 14 203 2 Fig. 14.37 : Color bar can be added [Indrani Roy, U.K.] Figure has been deleted
14-1567 14 204 4 204 4 Amend "Average pattern of surface warming" by "Average pattern of regional relative surface warming". Reason: This is what is shown. [Urs Neu, Switzerland]
Figure redrawn; caption rewritten
14-1568 14 204 4 204 4 Amend "final decade" by "final two decades". Reason: This is what is shown according to figure legend. [Urs Neu, Switzerland]
Figure redrawn; caption rewritten
14-1569 14 204 5 204 5 Insert "(CMIP5)" after "Phase 5", to have a link between the name and the abbreviation in the graph [Urs Neu, Figure redrawn; caption rewritten
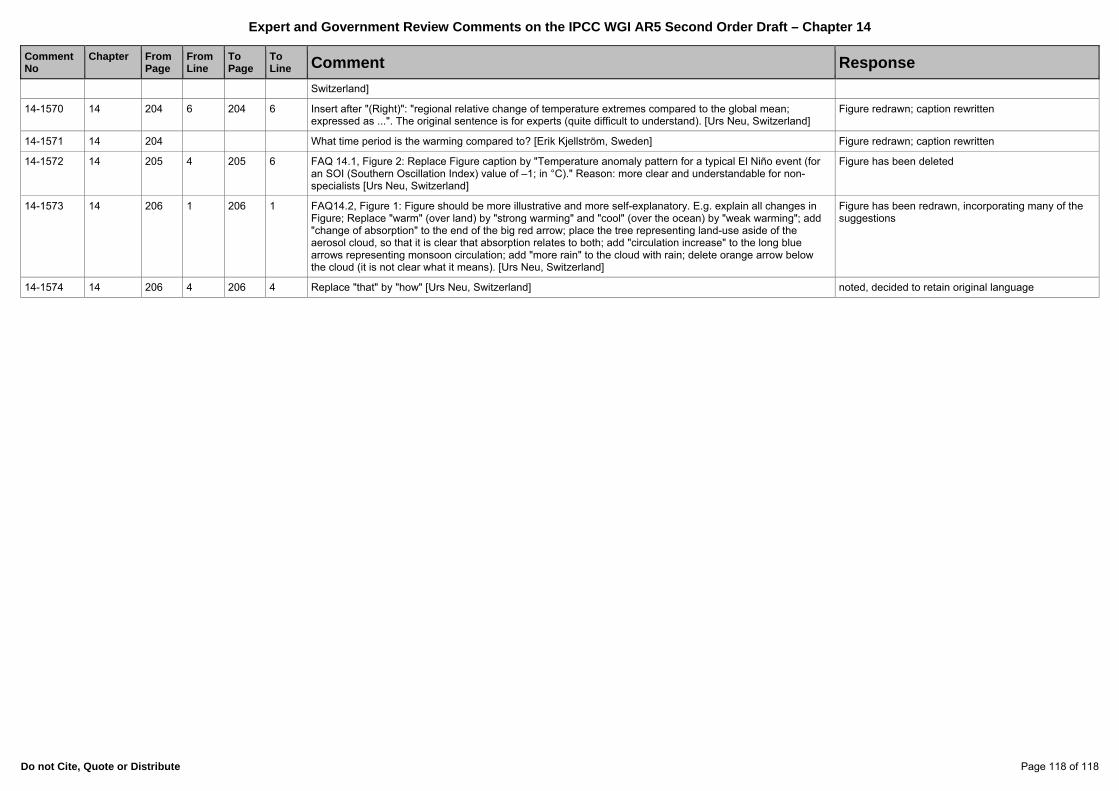
Expert and Government Review Comments on the IPCC WGI AR5 Second Order Draft – Chapter 14
Do not Cite, Quote or Distribute Page 118 of 118
Comment No
Chapter
FromPage
FromLine
To Page
To Line Comment Response
Switzerland]
14-1570 14 204 6 204 6 Insert after "(Right)": "regional relative change of temperature extremes compared to the global mean; expressed as ...". The original sentence is for experts (quite difficult to understand). [Urs Neu, Switzerland]
Figure redrawn; caption rewritten
14-1571 14 204 What time period is the warming compared to? [Erik Kjellström, Sweden] Figure redrawn; caption rewritten
14-1572 14 205 4 205 6 FAQ 14.1, Figure 2: Replace Figure caption by "Temperature anomaly pattern for a typical El Niño event (for an SOI (Southern Oscillation Index) value of –1; in °C)." Reason: more clear and understandable for non-specialists [Urs Neu, Switzerland]
Figure has been deleted
14-1573 14 206 1 206 1 FAQ14.2, Figure 1: Figure should be more illustrative and more self-explanatory. E.g. explain all changes in Figure; Replace "warm" (over land) by "strong warming" and "cool" (over the ocean) by "weak warming"; add "change of absorption" to the end of the big red arrow; place the tree representing land-use aside of the aerosol cloud, so that it is clear that absorption relates to both; add "circulation increase" to the long blue arrows representing monsoon circulation; add "more rain" to the cloud with rain; delete orange arrow below the cloud (it is not clear what it means). [Urs Neu, Switzerland]
Figure has been redrawn, incorporating many of the suggestions
14-1574 14 206 4 206 4 Replace "that" by "how" [Urs Neu, Switzerland] noted, decided to retain original language
Related Documents