Expert Review Comments on the IPCC WGI AR5 First Order Draft -- Chapter 5 Do not Cite, Quote or Distribute Page 1 of 157 Comment No Chapter From Page From Line To Page To Line Comment Response 5-1 5 0 0 0 0 The coverage of the chapter seems a bit too limited and selective although I understand the number of pages are limited. For example, why abrupt climate change in the Holocene is not covered only those in the glacial? Some of the topics probably are dealt in earlier reports, but because of its importance for future implications coverage of the Holocene climate change should be increased. [Takuro Kobashi, Japan] Taken into account. Covered in new section 5.5 (Holocene regional changes) within space limitations. 5-2 5 0 Too many references in the text will distract the attention of the readers [Muhammad Amjad, Pakistan] Noted 5-3 5 0 This chapter is generally difficult to read for non specialists. The style has to be corrected as well as the numerous typos and spelling mistakes. The content needs to be "simplified" and better organised. To my opinion, there is still some work to do on this chapter. [CATHERINE BELTRAN, France] Taken into account. Sections reorganised and logics better explained. 5-4 5 0 In general it is difficult to get the main message. It would be easier if the main results were highlighted and if "what's left to do" was clearly assigned. [CATHERINE BELTRAN, France] Noted 5-5 5 0 general comment. I found the material included in this chapter quite convincing. The overall organisation of the chapter is fine, except that the exact place of some pieces of information should be reconsidered. [PASCALE BRACONNOT, France] Noted; Revised introduction should give better guidance 5-6 5 0 The chapter covers a wide range of topics. In its present form, several sections still resemble most to an interesting syntheses from which it is not always easy to isolate the key points that are important with regards to the IPCC assessement. it also gives the feeling that very little is known and useful, just because there is too many places were it is said that things are not well understood, not well known, which is true, but tone down too much what is really known. I would suggest that there is a place were knowledge gap is highlited, but that the wording better reflect what is known and what are the progresses since last report that are of use to understand future changes. Similary it is important to tell about the uncertainties, but maybe withough making excessive use of this word by telling what is meant by uncertainty in the different parts. [PASCALE BRACONNOT, France] Taken into account. Text is revised to better stress the robust findings, provide a better coverage of the range of views, and the key uncertainties. 5-7 5 0 I would like to see some more discussion about the evolution of the climate in the first millennium CE prior to the Medieval Climate Anomaly, especially with the explicit mentioning of the Roman Warm Period and the Dark Age Cold Period. Since the publication of the IPCC Fourth Assessment Report many more long proxy records with high to medium temporal resolution – reflecting either changes in temperature, precipitation or drought – have been published making it potentially feasible to place the modern global warming into a much longer time perspective than was possible at the time of the IPCC Fourth Assessment Report. This is especially relevant since during the second millennium CE large volcanic eruptions and solar minimums have tended to coincide, making it hard to separate the influence of solar and volcanic forcing, whereas they are better separated during the first millennium CE. A better understanding of the regional to global climate during the first millennium CE is thus important in order to better understand the relative influence of volcanic and solar forcing, respectively, on decadal and longer time-scales. [Fredrik Charpentier Ljungqvist, Sweden] Taken into account to the extent possible given space constraints. New section 5.5 (Holocene regional changes) briefly refers to this time period. 5-8 5 0 Related to the comment above is the relative lack of discussion of natural multi-centennial (quasi)oscillations (e.g., the Bond cycles) in the climate system and their possible relationship to long-term changes in solar forcing. An improved understanding of natural multi-centennial climate (quasi)oscillations is important in order to better predict the direction of future natural climate evolution and for investigating if the cause of natural climate variability is likely to reinforce or counteract the anthropogenic global warming. A discussion of natural multi-centennial climate oscillations also places large-scale climate changes, as the Medieval Climate Anomaly and Little Ice Age, in a larger context. At the very least, the limitations of predicting climate from past multi-centennial climate (quasi)oscillations ought to be outlined. [Fredrik Charpentier Ljungqvist, Sweden] Taken into account together with comments 5-1 and 5-7. 5-9 5 0 Several recent studies discuss climate cycles, and the following can be mentioned as examples: Wanner, H., Solomina, O., Grosjean, M., Ritz, S. P., and Jetel, M.: Structure and origin of Holocene cold events, Quaternary Sci. Rev., 30, 3109–3123, 2011; Humlum, O., Solheim, J., and Stordahl, K.: Identifying natural contributions to late Holocene climate change, Glob. Planet. Change, 79, 145–156, 2011; Breitenmoser, P., Beer, J., Brönnimann, S., Frank, D., Steinhilber, F., and Wanner, H.: Solar and volcanic fingerprints in tree-ring chronologies over the past 2000 years. Palaeogeogr. Palaeocl., 313–314, 127–139, 2012. Breitenmoser et al. (2012) provides a good presentation of the detection of the DeVries cycle of solar activity in tree-ring records. Taken into account together with comments 5-1 and 5-7.

Welcome message from author
This document is posted to help you gain knowledge. Please leave a comment to let me know what you think about it! Share it to your friends and learn new things together.
Transcript

Expert Review Comments on the IPCC WGI AR5 First Order Draft -- Chapter 5
Do not Cite, Quote or Distribute Page 1 of 157
Comment No
Chapter FromPage
FromLine
To Page
To Line Comment Response
5-1 5 0 0 0 0 The coverage of the chapter seems a bit too limited and selective although I understand the number of pages are limited. For example, why abrupt climate change in the Holocene is not covered only those in the glacial? Some of the topics probably are dealt in earlier reports, but because of its importance for future implications coverage of the Holocene climate change should be increased. [Takuro Kobashi, Japan]
Taken into account. Covered in new section 5.5 (Holocene regional changes) within space limitations.
5-2 5 0 Too many references in the text will distract the attention of the readers [Muhammad Amjad, Pakistan] Noted
5-3 5 0 This chapter is generally difficult to read for non specialists. The style has to be corrected as well as the numerous typos and spelling mistakes. The content needs to be "simplified" and better organised. To my opinion, there is still some work to do on this chapter. [CATHERINE BELTRAN, France]
Taken into account. Sections reorganised and logics better explained.
5-4 5 0 In general it is difficult to get the main message. It would be easier if the main results were highlighted and if "what's left to do" was clearly assigned. [CATHERINE BELTRAN, France]
Noted
5-5 5 0 general comment. I found the material included in this chapter quite convincing. The overall organisation of the chapter is fine, except that the exact place of some pieces of information should be reconsidered. [PASCALE BRACONNOT, France]
Noted; Revised introduction should give better guidance
5-6 5 0 The chapter covers a wide range of topics. In its present form, several sections still resemble most to an interesting syntheses from which it is not always easy to isolate the key points that are important with regards to the IPCC assessement. it also gives the feeling that very little is known and useful, just because there is too many places were it is said that things are not well understood, not well known, which is true, but tone down too much what is really known. I would suggest that there is a place were knowledge gap is highlited, but that the wording better reflect what is known and what are the progresses since last report that are of use to understand future changes. Similary it is important to tell about the uncertainties, but maybe withough making excessive use of this word by telling what is meant by uncertainty in the different parts. [PASCALE BRACONNOT, France]
Taken into account. Text is revised to better stress the robust findings, provide a better coverage of the range of views, and the key uncertainties.
5-7 5 0 I would like to see some more discussion about the evolution of the climate in the first millennium CE prior to the Medieval Climate Anomaly, especially with the explicit mentioning of the Roman Warm Period and the Dark Age Cold Period. Since the publication of the IPCC Fourth Assessment Report many more long proxy records with high to medium temporal resolution – reflecting either changes in temperature, precipitation or drought – have been published making it potentially feasible to place the modern global warming into a much longer time perspective than was possible at the time of the IPCC Fourth Assessment Report. This is especially relevant since during the second millennium CE large volcanic eruptions and solar minimums have tended to coincide, making it hard to separate the influence of solar and volcanic forcing, whereas they are better separated during the first millennium CE. A better understanding of the regional to global climate during the first millennium CE is thus important in order to better understand the relative influence of volcanic and solar forcing, respectively, on decadal and longer time-scales. [Fredrik Charpentier Ljungqvist, Sweden]
Taken into account to the extent possible given space constraints. New section 5.5 (Holocene regional changes) briefly refers to this time period.
5-8 5 0 Related to the comment above is the relative lack of discussion of natural multi-centennial (quasi)oscillations (e.g., the Bond cycles) in the climate system and their possible relationship to long-term changes in solar forcing. An improved understanding of natural multi-centennial climate (quasi)oscillations is important in order to better predict the direction of future natural climate evolution and for investigating if the cause of natural climate variability is likely to reinforce or counteract the anthropogenic global warming. A discussion of natural multi-centennial climate oscillations also places large-scale climate changes, as the Medieval Climate Anomaly and Little Ice Age, in a larger context. At the very least, the limitations of predicting climate from past multi-centennial climate (quasi)oscillations ought to be outlined. [Fredrik Charpentier Ljungqvist, Sweden]
Taken into account together with comments 5-1 and 5-7.
5-9 5 0 Several recent studies discuss climate cycles, and the following can be mentioned as examples: Wanner, H., Solomina, O., Grosjean, M., Ritz, S. P., and Jetel, M.: Structure and origin of Holocene cold events, Quaternary Sci. Rev., 30, 3109–3123, 2011; Humlum, O., Solheim, J., and Stordahl, K.: Identifying natural contributions to late Holocene climate change, Glob. Planet. Change, 79, 145–156, 2011; Breitenmoser, P., Beer, J., Brönnimann, S., Frank, D., Steinhilber, F., and Wanner, H.: Solar and volcanic fingerprints in tree-ring chronologies over the past 2000 years. Palaeogeogr. Palaeocl., 313–314, 127–139, 2012. Breitenmoser et al. (2012) provides a good presentation of the detection of the DeVries cycle of solar activity in tree-ring records.
Taken into account together with comments 5-1 and 5-7.

Expert Review Comments on the IPCC WGI AR5 First Order Draft -- Chapter 5
Do not Cite, Quote or Distribute Page 2 of 157
Comment No
Chapter FromPage
FromLine
To Page
To Line Comment Response
[Fredrik Charpentier Ljungqvist, Sweden]
5-10 5 0 I would like to see a somewhat longer section discussing the Holocene Thermal Maximum. Our knowledge of the Holocene Thermal Maximum has increased substantially since the publication of the IPCC Fourth Assessment Report. The Holocene Thermal Maximum is rather important for understanding non-linear feedbacks in the climate system. The direct results of the orbital changes during the mid-Holocene should have been a large warming in the summer in the Northern Hemisphere and a slight cooling during the winter, whereas the Southern Hemisphere would have experienced somewhat cooler summers and warmer winters. But much evidence nevertheless points to a substantial warming during all season in most of the extra-tropical Northern Hemisphere and also in large parts of the Southern Hemisphere. This means that the enhanced seasonal forcing resulted in strong positive feedbacks in the climate system, and likely large-scale reorganization of the latitudinal heat transport, that are still poorly understood and not fully captured in the climate models. In proxy data and model comparisons it is quite clear that the proxy records usually show larger changes in annual mean temperature than the majority of the models for most regions. [Fredrik Charpentier Ljungqvist, Sweden]
Taken into account. Covered in new section 5.5 (Holocene regional changes) within space limitations.
5-11 5 0 One important reference that I would like to see mentioned in this context of the Holocene Thermal Maximum is Shakun and Carlson (2010) that shows, after assessing numerous proxy records, that the warmest conditions during the Holocene occurred in the Northern Hemisphere 8±3.2 ka and in the Southern Hemisphere 7.4±3.7 ka. It could also be of interest to refer to the borehole temperature estimates by Huang et al. (2008) that point to that the earth experienced multi-centennial periods with global mean temperatures at least 1°C above the pre-industrial temperatures or even more. The full reference to Huang et al. (2008) is: Huang, S. P., Pollack, H. N., and Shen, P.-Y.: A late Quaternary climate reconstruction based on borehole heat flux data, borehole temperature data, and the instrumental record, Geophys. Res. Lett., 35, L13703, doi:10.1029/2008GL034187, 2008. [Fredrik Charpentier Ljungqvist, Sweden]
Noted.
5-12 5 0 The concept of "climate sensitivity" is used frequently in this chapter, yet does not adequately define this concept (and for example, Charney vs. earth-system) at least until the very end in Box 5.3 A recommended focus on the differences between these concepts and precisely how they compare to each other in the beginning of the chapter. [Chris Colose, United States]
Taken into account. 5.1 and revised box 5.1 (Earth system feedbacks, now first box) address the differences between climate and Earth system sensivitiy.
5-13 5 0 Perhaps prefer the wording "astronomical forcing" to the wording "orbital forcing" ? [Bernard De Saedeleer, Belgium]
Noted
5-14 5 0 chapter 5 has redundancies with chapter 6, 8 and 13. I would suggest to keep all paleoaspects (past CO2, CH4, N2O, past RF forcing, greenhouse gases, solar, volcanic) within chapter 5 and refer to chapter 5 in chapter 6 and chapter 8. The past sea level discussion I would keep in chapter 13 and refer to chapter 13 in chapter 5. [Hubertus Fischer, Switzerland]
Taken into account. Overlaps clarified. Chapter 5 does not address mechanisms of the carbon cycle (this is in chapter 6). Chapter 5 still describes proxy-based information on sea level which is synthetized in Chapter 13.
5-15 5 0 I am having a major difficulty with this chapter with its current structure. While this chapter contains wonderful and exciting material, its structure, notably its section headings, do not make it clear what can be found where, because it does not explicitly guide users to relevant sections and there is no clear logic behind the current structuring. For instance I am missing a prominent section at the beginning of the chapter that addresses the issue of past climate variability in a sufficiently general manner and guides readers to the various insights current paleoclimatological research can provide. I am thinking here of the never-ending debate on how past climate variability compares to recent (instrumental period) and projected future climate variability. This is a very valid point in general, regardless of the seemingly never-ending tiresome hockey-stick curve debate, and this chapter needs to properly address this point. Given current structure there seems to be nowhere a dedicated section to this issue. I also find no section laying out clearly upfront what other points are addressed in this chapter. For instance what can we learn about future CC from past CC, what kind of variables (T, R, droughts, glaciers, ice and snow covers including sea ice, water cycle, sea level) are all covered by which proxies, what precision and reliability do they offer, what does that mean for future CC, what for possibly delayed impacts (hysteresis effects) such as Greenland ice shield possibly already doomed given current CO2 conc. falling in the range of mid-pliocene ones, what could insights from the past mean for future CC etc. I do neither in the current structure nor in the text of the chapter find a clear guide to all these issues. The only
Taken into account. Sections reorganised and logics and relevance for current and future changes better explained (executive summary, introduction and text), within space limitations. Comparisons of recent temperatures to last 2ka reconstructions is, and was, covered in 5.3.5.

Expert Review Comments on the IPCC WGI AR5 First Order Draft -- Chapter 5
Do not Cite, Quote or Distribute Page 3 of 157
Comment No
Chapter FromPage
FromLine
To Page
To Line Comment Response
exception being sea level, glaciers, and abrupt CC. But since only these few are explicitly visible, this gives the impression of a distorted und unbalanced, non-comprehensive treatment of above mentioned key issues. While much of this territory needed is actually in many ways somehow covered by the chapter somewhere, this is not done in a sufficiently explicit manner and certainly neither the structure nor the introduction helps to find these things. Moreover, the headings are often misleading and don't match the content of the section they are heading. This chapter needs therefore to be carefully reorganized. I suggest around key issues that are first introduced and then explicitly handled one by one while always relating the insights from the past to the pressing issues of current CC and the projected future CC. [Andreas Fischlin, Switzerland]
5-16 5 0 Remember, IPCC assessments are not only about what we know, but also about what we don't know, a specific kind of uncertainty (or you may say source of uncertainty). Consequently other variables such as precipitation, droughts, snow, ice cover, need all to be expicitly addressed in specific sections, which can be easily found. If data are lacking and/or uncertainties are huge, say so and those sections are brief. But then they are at least there. Moreover, all this is also very relevant for the other WGs, in particular WGII, which can use information from past paleoecological situations to assess future impacts. Therefore this chapter has to well coordinate with WGII. Some lessons from the past are relevant for risk, an issue pertaining to WGIII where this chapter has to provide a basis. [Andreas Fischlin, Switzerland]
Taken into account. wider range of views covered (especially in sections 5.2, 5.3, and 5.6). Impact-related information was removed after ZOD in consultation with WG-II
5-17 5 0 I guess authors have to sit back and carefully reflect on what they can contribute to current CC debates. IPCC needs to well inform policies and lessons to be learned from the past are really something where most politicians are amazingly ignorant and are likely to continue acting irresponsibly unless these important lessons surface more. Finally texts need more to state repeatedly where policy relevant insights have changed since AR4, where uncertainties have been found to be bigger than what was previously estimated or where they could be reduced, where corrections or perhaps clear refuting of previous IPCC findings emerged, or where mere confirmations or reaffirmations were found to previous IPCC findings. E.g. no global hockey stick figure is in this chapter, despite the fact that several papers were published since AR4 (e.g. Büntgen et al., 2011), which would even allow to go further into the past than in AR4, let alone the original hockey stick curve of TAR did. I am not convinced having no is so good and gives me almost the impression as if this chapter would rather like to avoid the issue. I believe IPCC can't afford that. [Andreas Fischlin, Switzerland]
Taken into account. Reconstructions of past hemispheric temperatures during the last 2 k now displayed in new Fig. 5.8 and expanded appendix. This focus is also extended for regional scales in Figure 5.13
5-18 5 0 To sum up, I suggest to restructure this chapter according to key issues and have headings that let the reader more easily find material. I also suggest to write in the ES some introductionary text quickly introducing the key issues and how they relate to the sections contained in the current version of the ES. I also suggest to have another FAQ along the lines "How different is current CC from past changes?" [Andreas Fischlin, Switzerland]
Partly taken into account. Revised introduction should guide readers better into the chapter. Chapter re-structured, clearer headings, new ES structure. FAQ not added but topic addressed
5-19 5 0 Why does section 5.5 not include a section on older interglacials? It is well known that MIS 11 provides a more suitable analogue for future warming than MIS 5, because conditions were more similar to the Holocene (Rohling et al., Earth Planet. Sci. Lett., 291, 97-105, 2010). A brief section outlining knowledge of older interglacials should be included here. [Roland Gehrels, United Kingdom]
Taken into account. Earlier interglacials now briefly addressed in 5.3. Short assessment of MIS11 sea level added to 5.6.
5-20 5 0 Throughout, the terms MCA and LIA are used, not always consistently. I urge you to abandon this practise and instead to refer to specified time periods, such as '1100 to 1400 CE'. That is, report the chronology derived from the specific age model of the proxy concerned, not a half-baked taxonomy of it. There are two reasons for this suggestion. First, it would not nurture preconceptions about the climate of the periods being discussed. Second, it would remove the confusing effect of the differing definitions of these putative epochs on the discussion of available evidence. Third it would remove at least some of the distorting Eurocentrism implicit in the use of the word 'medieval'. Finally, and most importantly, the implicit designation of distinct periods analogous to geological epochs is entirely inappropriate and counter productive for consideration of late Holocene variability, with its limited overall amplitude and spatial complexity. [Malcolm Hughes, USA]
Taken into account. Cautionary statement added in revised section 5.3.5 (hemispheric) and 5.5 (regional). However, as MCA and LIA are commonly used, we will continue with the use of the terms for reference because they help to make the text more readable. Definitions in glossary revised.
5-21 5 0 All parts of the chapter (starting in the Executive Summary) referring to the last 2000 years, are weakened by an emphasis on comparisons of 50 year periods. This presentational device is of course helpful when examining century-scale changes, but hides much important new information on decadal and multidecadal timescales of direct societal relevance. I urge you to add comparable compilations based on 20 or 30 year time blocks or replace the 50-year comparisons with one of these sets. The largest available and best understood set of precisely dated proxy records for this period, tree rings, are especially robust on these
Taken into account. 25 year time periods also considered.

Expert Review Comments on the IPCC WGI AR5 First Order Draft -- Chapter 5
Do not Cite, Quote or Distribute Page 4 of 157
Comment No
Chapter FromPage
FromLine
To Page
To Line Comment Response
decadal time scales (Hughes et al. 2011, see end of comment for ref.). This is especially important in the context of recent analyses showing continued warming over recent decades with the 2000's being the warmest decade of the instrumental period. Using 1961-2010 obscures this. ref cited Hughes, M.K., Diaz, H.F. and Swetnam, T.W. Tree Rings and Climate: Sharpening the Focus. In: Hughes, MK, Swetnam, TW and Diaz, HF, (editors) Dendroclimatology: Progress and Prospects. (Springer Verlag). pp 331-353 (2011). [Malcolm Hughes, USA]
5-22 5 0 this chapter is well organised, apart for a confusion in section 5.4 (see detailed comments). It is dense, of course, but reads relatively well. The citations are usually quite up to date, I have tried to bring some more articles to strengthen the text, along with some suggestions to clarify the text. I have kept my comments the most concise as possible, so I haven't written full sentences, I didn't mean to be rude by proceding this way. I'm looking forward to read the second order draft! [Masa KAGEYAMA, France]
Noted
5-23 5 0 Following my experties in atmospheric dust from Antarctic ice core records, I do not have any important comment or corrections. [Valter Maggi, Italy]
Noted
5-24 5 0 Overall this chapter is overly referenced in places and difficult to read. The paleoclimate archives chapter should easy to follow and understand (even for lay people) to ensure that all readers have confidence in the importance of paleoclimate archives. The chapter could emphasize more clearly the paleoclimate records which indicate non-linear climate behaviour and the associated CO2 thresholds. Perhaps include a section or BOX which addresses the mid-Pliocene warmth and why this interval is a good climate analogue for the modern, high CO2 climate system. [Christian Ohneiser, France]
Taken into account. Warm intervals of the Pliocene now expanded in section 5.2 and 5.3. We note, however, that the text is not targeted towards lay persons.
5-25 5 0 When referring to data use the words 'data indicate..'. When referring to conclusions of the IPCC panel or of authors use the word 'suggest' e.g. ch5, pp4, line 37. [Christian Ohneiser, France]
Noted
5-26 5 0 There is considerable overlap of content between chapter 13 (sea level) and chapter 5 (palaeoclimate). This is mainly because chapter 5 also tries to summarise sea-level evidence, which in my view is superfluous because chapter 13 is specifically meant for that, and does a better job at it. More worrying, the messages are not consistent. It would be better if chapter 5 would just refer for sea level to the more authoritative and balanced assessment of chapter 13. In both chapters 5 and 13, there is – for undisclosed reasons – great reliance on a single, yet unpublished, and actually not even accepted, study (Dutton and Lambeck, submitted). Especially in chapter 5, other studies are (very) critically assessed, but the same is not done for the D&L paper, which is presented as a sort of ‘end all’ statement. This may be a reflection of the authorships of the chapter, where personal preferences and opinions have obscured the scientific assessment processes by too much. It is a specific worry to me that the arguments in both chapters completely bypass the critical importance in coral studies (or any other sea-level study) of not just having well-dated masses of loose datapoints, but to also consider the stratigraphic context. Only strict stratigraphy can truly constrain relative age relationships and so irrefutably portrays developments through time, including rates of change. A key study for this appeared recently in Nature Geocience (Thompson et al., 2011), yet it is completely missing from both chapters 5 and 13. Possibly this omission resulted from a chapter-author-based bias in favour of strict closed system ages. However, any field geologist knows that – for reconstruction of temporal developments in a relative sense, and ultimately rates of change – less perfect datings within a tightly constrained stratigraphic framework are more valuable than perfect datings on a random collection of samples from settings that lack clear documentation of stratigraphic relationships relative to each other. More balance is needed. --- continued below ----- [Eelco Johan ROHLING, United Kingdom of Great Britain & Northern Ireland]
Taken into account. Assessment of uncertainties on proxy-based sea reconstructions changes in chapter 5 and summarized in chapter 13. New discussion of age scale uncertainties added in revised section 5.6 (sea level)
5-27 5 0 continued- This importance of stratigraphic control is exemplified by the fact that Thompson et al. (2011) observed in their Bahamas study region clear evidence for a millennial-scale oscillation within the last interglacial, where highstands are separated by erosional surfaces (lowstands) in a sequence that is highly reminiscent of similar successions observed within other last interglacial fossil reefs (e.g., Florida, Yucatan – see Thompson et al., 2011; Red Sea – see Bruggeman et al., 2004) and in coastal morphological
Taken into account. Assessment of uncertainties on proxy-based sea level reconstructions in chapter 5 and summarized in chapter 13. New discussion of age scale uncertainties added in revised section 5.6 (sea level)

Expert Review Comments on the IPCC WGI AR5 First Order Draft -- Chapter 5
Do not Cite, Quote or Distribute Page 5 of 157
Comment No
Chapter FromPage
FromLine
To Page
To Line Comment Response
developments (Orszag-Sperber et al., 2001) over tracts of hundreds of kilometres of length around the Red Sea (Plaziat et al., 1995, 1998; Orszag-Sperber et al., 2001; Bruggemann et al., 2004; see also further summaries in the supplement of Rohling et al., 2008). These clear variations are of an up-down nature and of a millennial timescale that is not compatible with any isostatic variability, and also the reproducibility of these variations is incompatible with any spurious tectonic explanations. Given the length of coastline over which these fluctuations have been documented in the Red Sea alone, I have calculated with my geophysical colleague Nick Harmon that a millennial-scale series of M>8 earthquakes would be needed with displacements that were first down, then up, then down, then up, then down, and then up again. That is an entirely unrealistic tectonic scenario. So if isostacy and tectonics cannot reasonably explain what is found, then the strong suspicion has to be that sea level oscillated. That then is confirmed by studies with tight stratigraphic control such as Rohling et al., (2008), which further extends the spatial evidence of oscillation in Red Sea sea-level markers, and such as Thompson et al. (2011) and those they refer to, from a completely different region. Moreover, the variability within the last interglacial is preserved also in the statistical compilation of Kopp et al. (2009), where it is of specific interest that (again stratigraphically well-constrained) deep-sea benthic oxygen isotope records also preserve evidence of a considerable oscillation (e.g., Lisiecki and Raymo, 2005). Hence, a compelling case is emerging in favour of a significant oscillation within the last interglacial, given that it is revealed in stratigraphically coherent records of: (1) fossil corals/reefs; (3) coastal sediment sequences; (3) Red Sea residence-time based sea-level reconstruction; (4) deep-sea benthic isotope records. Although each individual record might have its own sources of bias, these sources of bias are not the same/common between the various methods, so that the overall picture across different methods becomes hard to fault. I am puzzled that studies with the essential stratigraphic coherence are so close to being dismissed in the current write-up of chapters 5 and 13. This is not a balanced representation of the geological understanding of variability. It is a personally motivated/subjective choice, which is out of place in an impartial assessment report such as the IPCC. --- continued below ----- [Eelco Johan ROHLING, United Kingdom of Great Britain & Northern Ireland]
5-28 5 0 continued - As an aside, blowing our own trumpet a bit, I note that the Red Sea record of Rohling et al. (2008) is dismissed on vague grounds in chapter 5 (but not in the more authoritative chapter 13), without any real substantiation. In fact, the lack of fine-scale reproducibility of the variations using the record of core KL09, which is mentioned in chapter 5, was explained already in the study of Rohling et al (2008, see the supplement) as a result of the too-low sedimentation rate in KL09 to pick up such signals. The cause for the anomaly in KL09 was also further explained in Trommer et al. (2011). That latter study in addition shows that the last interglacial highstand corresponds to a relatively arid episode (evidence for humidity appearing only after the highstand had peaked), which would counter any suggestion that freshwater addition to the Red Sea might have caused the light isotope values that underlie the highstand sequence reported in Rohling et al. (2008), which I think the authors may be alluding to in their non-specified statement of possible ‘additional controls’. So the arguments given in chapter 5 to reject the Red Sea results do not hold water because they infer (but fail to specify) spurious additional controls that have been debunked already. Moreover, the arguments completely ignore the substantiating evidence for a substantial sea-level oscillation within the last interglacial from many other stratigraphically well-constrained studies (see above). I find it poor form that such stratigraphically careful studies as Bruggemann et al. (2004), Orszag-Sperber et al. (2001), and Thompson et al. (2011) have been systematically omitted from the sea-level compilations of both chapters 5 and 13. In short, chapter 5’s sea-level summary to me seems rather poorly thought through and incomplete/unbalanced. More importantly – it is not useful because there is a more authoritative special chapter on this subject (chapter 13). In addition, it is imperative that the various stratigraphically well-constrained studies that document a substantial oscillation within the target period are carefully included (both in chapter 5, if sea level is kept in there, and in chapter 13). --- continued below ----- [Eelco Johan ROHLING, United Kingdom of Great Britain & Northern Ireland]
Taken into account. Assessment of uncertainties on proxy-based sea level reconstructions in chapter 5 and summarized in chapter 13. New discussion of sea level variability during the last interglacial added in revised section 5.6 (sea level)
5-29 5 0 continued - New references: Bruggemann, J. H. et al. Stratigraphy, palaeoenvironments and model for the deposition of the Abdur Reef
Noted

Expert Review Comments on the IPCC WGI AR5 First Order Draft -- Chapter 5
Do not Cite, Quote or Distribute Page 6 of 157
Comment No
Chapter FromPage
FromLine
To Page
To Line Comment Response
Limestone: context for an important archaeological site from the last interglacial on the Red Sea coast of Eritrea. Palaeogeogr. Palaeoclimatol. Palaeoecol. 203, 179-206 (2004). Orszag-Sperber, F., Plaziat, J. C., Baltzer, F. & Purser, B. H. Gypsum salina-coral reef relationships during the Last Interglacial (Marine Isotopic Stage 5e) on the Egyptian Red Sea coast: a Quaternary analogue for Neogene marginal evaporites? Sed. Geol. 140, 61–85 (2001). Plaziat, J. C. et al. Mise en evidence, sur la côte récifale d'Egypte, d'une régression interrompant le plus haut niveau du Dernier Interglaciaire (5e): un nouvel indice de variations glacio-eustatiques haute fréquence au Pléistocène? Bull. Soc. Géol. Fr. 169, 115–125 (1998). Plaziat, J. C. et al. Quaternary changes in the Egyptian shoreline of the northwestern Red Sea and Gulf of Suez, Quat. Internat. 29/30, 11–22 (1995). Siddall, M., Bard, E., Rohling, E.J. & Hemleben, Ch., Sea-level reversal during Termination II. Geology 34, 817–820 (2006). Thompson, W.G., Curran, H.A., Wilson, M.A. & White, B., Sea-level oscillations during the last interglacial highstand recorded by Bahamas corals, Nature Geosci. 4, 684–687 (2011). Trommer, G., Siccha, M., Rohling, E.J., Grant, K., van der Meer, M.T.J., Schouten, S., Baranowski, U. & Kucera, M., Sensitivity of Red Sea circulation to sea level and insolation forcing during the last interglacial. Clim. Past 7, 941–955 (2011). [Eelco Johan ROHLING, United Kingdom of Great Britain & Northern Ireland]
5-30 5 0 This chapter could do with careful editing by a native English speaker, and shortening/breaking up of the sometimes long and convoluted sentences. [Eelco Johan ROHLING, United Kingdom of Great Britain & Northern Ireland]
Noted
5-31 5 0 Throughout this chapter, there are many instances where the authors speak of “warmer or colder temperatures”. This is a tautology, and is similar to talking about, for example, wetter or drier rainfall. It is grammatically more correct to talk about “higher or lower” temperatures, or about “warmer or colder conditions”. [Eelco Johan ROHLING, United Kingdom of Great Britain & Northern Ireland]
Noted
5-32 5 0 Comment text. I have impression that orbital-scale and decadal variability are dominating in this analyses. I can see potential reasons for that (better understood and covered in the literature), but it probably makes sense to check if there is a possibility to highlight the centennial trends as well. [Olga Solomina, Russian Federation]
Taken into account in revised section 5.5 (Regional Holocene changes).
5-33 5 0 Comment text. Do you explain somewhere what kind of radicarbon dates (calibrated-uncalibrated) are used in the chapter. Does "ka" always mean "calibrated age, years ago"? [Olga Solomina, Russian Federation]
Statement added to 5.1
5-34 5 0 MORE FOCUS ON PRECIPITATION: Most discussion here concerns paleo-temperatures, but precipitation is at least as well represented in the paleo records and is at least as important ecologically and culturally. A reasonable way to insert a more explicit discussion could be to add a new subsection (5.4.2) titled "Regional Precipitation Changes" after the one on temperatures (5.4.1). In that section, and throughout the text, fuller discussion of past precip regimes in relation to the present and future could focus on important but as yet weakly addressed topics such as the ITCZ and the westerlies. In particular, new methods for diatom-based reconstructions of water chemistry and depth are particularly informative in this regard. Such topics could include: regional-scale ranges of drought frequency and intensity in relation to modern and future conditions (Moon Lake, Yucatan, etc.); ENSO history; wet Sahara during early Holocene warm period; effects of latitudinal drift of the austral westerlies on rainfall in Chile and Africa; unusual and as yet unexplained wet anomalies during the cool LIA in East Africa that may be linked to solar variability. In a related vein, ENSO will likely continue to be a major driver of regional and global climate variability, but the few high-resolution records that could support or reject projections of ENSO responses to warming are not fully consistent with each other. A more thorough review of what we do and don't know about the paleo history of ENSO variability, especially during the late Holocene (MCA and LIA) should be addressed. [Jay Curt Stager, United States of America]
Taken into account. Monsoons and westerlies now addressed in 5.3. Specific section on modes (now 5.4). Clarified structure of section 5.5 (Holocene regional changes).

Expert Review Comments on the IPCC WGI AR5 First Order Draft -- Chapter 5
Do not Cite, Quote or Distribute Page 7 of 157
Comment No
Chapter FromPage
FromLine
To Page
To Line Comment Response
5-35 5 0 IMPROVE READABILITY: The text still requires smoothing, as some of it seems to be patched together from various writers. Much of the wording also needs clarification by writers who are skilled in science-interpretation for lay readers (I can help if needed). Also, please arrange the information more consistently so it can be found easily along with informational gaps that are yet to be filled: for instance, consistently dedicate distinct paragraphs to a global overview and then high, middle, and low latitude sites when discussing past temperature or precipitation patterns. [Jay Curt Stager, United States of America]
Taken into account. Text structure modified for better accessibility and readability.
5-36 5 0 MORE CLEARLY SPECIFY PALEO CONTRIBUTIONS TO CLIMATE QUESTIONS: It is important to emphasize that paleo studies have contributed very strongly to our understanding of global warming by identifying natural cycles and possible analogs for a warmer future. Please spell this out more distinctly, preferably early on and again in distinct subsections. Please address more explicitly the widely held misconception that today's warming is "just the due to natural cycles." The existence of these cycles is one of the most important contributions of paleo records , and they should be listed more explicitly, perhaps in a distinct subsection or table. Each should be described briefly but clearly along with the paleo evidence that reveals it. Specify how we know that the changes we see today are NOT caused by those cycles. (the various solar cycles, 500-550, 1500-1700, 2300-2700 cycles in paleo records, and longer orbital cycles). Records of less predictable, non-cyclic variability should also be briefly evaluated alongside these: ENSO, NAO, etc. Please add a distinct subsection on likely analogs of past warmings that best represent future scenarios. The PETM, Pliocene, Eemian Interglacial, early Holocene, and MCA would be good; Page 5-18, Lines 44-53 which links the MCA and LIA to modern times, is an excellent example of what paleo records can tell us about likely future conditions and would go well in such a summary along with equivalent statements about the other analog-periods. Note that the Pliocene event was not an abrupt warming like the PETM or present warming trends. [Jay Curt Stager, United States of America]
Taken into account in revised introduction and throughout the chapter.
5-37 5 0 MORE ATTENTION TO SOLAR-CLIMATE CONNECTIONS: Many who doubt human impacts on climate believe that today's warming is due to solar variability. Please address this issue head-on; misuse of paleo records is one source of such misinformation, so lay out exactly what the paleo evidence for solar forcing of past and present climate is, and how we know it is NOT responsible for the warming of the late 20th century. Keep this issue separate from the orbital insolation cycles; focus on possible solar variations in radiocarbon, 10-Be, and paleoclimate records. Warning: this topic can also raise strong responses in the scientific community, in part because a long-standing conflict between “believers” or “non-believers” is now intensified by the recent polarization around the causes of global warming. Do not let personal biases on this topic keep it out of the report; show the paleo evidence clearly and point out why it remains a topic of some controversy. [Jay Curt Stager, United States of America]
Taken into account. Revised FAQ5.1 (Sun - climate) now focused on the last millennium and current changes.
5-38 5 0 On balance, this is an excellent first draft summarizing the current state of knowledge from palaeoclimatic archives. The chapter’s structure and coverage of the material are appropriate in highlighting the aspects relevant to the IPCC mission. [Chronis Tzedakis, UK]
Noted
5-39 5 0 Please coordinate with Chapter 9 to ensure consistent treatment of model evaluation with regard to paleo-climatic information. [Thomas Stocker/ WGI TSU, Switzerland]
Noted
5-40 5 0 Table 5.3: Overall we found interpretation of this table very difficult. It is not clear what several abbreviations mean. Effort needed to simplify and improve readability of the table. [Thomas Stocker/ WGI TSU, Switzerland]
Taken into account. Table revised for readability.
5-41 5 0 Box 5.3: Ensure that the treatment of sensitivity, and related terminology is consistent across chapters. [Thomas Stocker/ WGI TSU, Switzerland]
Taken into account.
5-42 5 0 Make sure to use the appropriate method of implementing uncertainty language, I..e., uncertainty language should be implemented within the sentence and not inserted at the end of sentences in [ ]. [Thomas Stocker/ WGI TSU, Switzerland]
Taken into account.
5-43 5 0 Please coordinate with observation chapters, also Chapter 14, e.g., regarding monsoons, to avoid unnecessary overlaps and ensure consistency. [Thomas Stocker/ WGI TSU, Switzerland]
Taken into account.

Expert Review Comments on the IPCC WGI AR5 First Order Draft -- Chapter 5
Do not Cite, Quote or Distribute Page 8 of 157
Comment No
Chapter FromPage
FromLine
To Page
To Line Comment Response
5-44 5 0 Table 5.4: Please coordinate with Chapter 5, 3, and 13 to ensure X-chapter consistency. [Thomas Stocker/ WGI TSU, Switzerland]
Taken into account.
5-45 5 1 1 1 1 First off, a positive note on the structure - this reads well and the organisation and themes of the chapter really communicate a lot of what paleo has to offer climate change research. More attention needs to be paid to the inter-academy council recommendations covering complete discussion controversies and unknown issues, potentially biassed promotion of the author's own work and the discussion of certainty [Mark Siddall, UK]
Taken into account. Better coverage of range of views included in SOD.
5-46 5 1 1 1 1 throughout the document the words 'melts' or 'melting' are applied to ice sheets. A considerable part of the reduction of ice sheets is not through melting but through ice streaming, ultimately into the sea. Please use 'ice sheet reduction' which does not imply any particular mechanism. [Mark Siddall, UK]
Noted.
5-47 5 1 1 1 1 Throughout there are many numbers cited with no uncertainty estimate. This is not good enough unless there is an explicit statement to say that there is not enough data to do better. In the cases that we cannot quantify uncertainty, what does 'medium' or 'high confidence' mean and how consistent is the chapter (I think not consistent enought)? There are many examples of this. I have tried to note a few below. This is from the press release of the inter-academy council report on the IPCC: 'The committee also called for more consistency in how the Working Groups characterize uncertainty. In the last assessment, each Working Group used a different variation of IPCC’s uncertainty guidelines, and the committee found that the guidance is not always followed. The Working Group II report, for example, contains some statements that were assigned high confidence but for which there is little evidence. In future assessments, all Working Groups should qualify their understanding of a topic by describing the amount of evidence available and the degree of agreement among experts; this is known as the level of understanding scale. And all Working Groups should use a probability scale to quantify the likelihood of a particular event occurring, but only when there is sufficient evidence to do so.' [Mark Siddall, UK]
Taken into account. In accordanace with uncertainty guidelines; note that assessments can be based expert elicitation if uncertainties cannot be quantified.
5-48 5 1 1 1 1 There are several instances where the references used are not original. I will note those I spotted but this should be checked rigorously by each author and the lead authors [Mark Siddall, UK]
Noted.
5-49 5 1 1 1 Information from Paleoclimate Archives [Medani Bhandari, Nepal] Accepted
5-50 5 1 1 Very interesting and information filled chapter - the authors are to be commended! Lots of valuable information for policy-makers and colleagues as well. Excellent update on AR4. Given the importance of the paleoclimatic perspective for policy-makers the comments that follow are intended to help make key points more accessable and clear to this readership. Generally, I worry that the strong policy-relevant assessment material might be obscured somewhat by other material that at present seems more geared as a scholarly review - great for colleagues (like me!) but perhaps distracting for the primary IPCC audience - policymakers. Thus, I will highlight sections that either need to be crafted to be more policy-relevant, or maybe deleted in the hope that it will be easier for policy-makers to focus on the most relevant paleo information. [Jonathan Overpeck, USA]
Noted.
5-51 5 1 1 The FOD still reads like it was written by many voices and I'm sure you'll work to make it seem less so for the SOD. This will help readers. [Jonathan Overpeck, USA]
Noted.
5-52 5 1 1 In some cases, the FOD seems to showcase the work of the author team a bit more than what would be ideal. I recommend going through and making sure the SOD doesn't have that appearance. Make sure you're assessing all the literature on the topics you cover. [Jonathan Overpeck, USA]
Noted.
5-53 5 1 1 Generally need to strive to be as precise as possible, using IPCC language instead of other terminology to convey uncertainty or confidence. I'll try to highlight as much as I can. [Jonathan Overpeck, USA]
Noted.
5-54 5 1 2 1 2 The title is a bit confusing, as we expect that this chapter contains only data, and no model. If possible, try to slightly modify it ? [Bernard De Saedeleer, Belgium]
Rejected. It is not possible at this stage to modify the title. But this is clarified in the introduction.
5-55 5 1 12 1 16 I presume contributing author country affiliations will be added (as per other Chapters)? [Peter Burt, UK] Will be added to appendix of entire report (as in AR4)
5-56 5 1 35 1 55 TOC structure: it seems that there are 3 types of structures in parallel (5.1 Intro, Box 5.1, FAQ 5.1) : it is a bit confusing to have 3 times the "5.1" reference. I guess it is imposed by the global structure of the AR5. But what is the aim e.g. of the box structure ? [Bernard De Saedeleer, Belgium]
Noted. Boxes are introduced to highlight cross chapter issues. Numbering structure cannot be changed.

Expert Review Comments on the IPCC WGI AR5 First Order Draft -- Chapter 5
Do not Cite, Quote or Distribute Page 9 of 157
Comment No
Chapter FromPage
FromLine
To Page
To Line Comment Response
5-57 5 1 109 General comments: Overall, I do not have a lot of modifications to suggest. The chapter is well written and structured. Tables and figures are clear and well-captioned. It is easy to read and to understand. As a Ph.D. student, I learnt interesting things on several subjects. It is also a good summary of all the disciplines dealing with paleoclimatic studies. (1) the chapter concerns mainly temperature evolution. I would have liked that the sea-ice parameter was more taken into account in the interpretations. (2) the two FAQ are quite interesting as syntheses. However, I would have introduced a third one about, for instance: thermohaline circulation and climate changes: what is (are) the link(s)? [Sophie Bonnet, Canada]
Noted. Sea ice is explicitely addressed in section 5.5 (regional) for the Holocene time period and also in the polar amplification box (now box 5.2). We cannot add a new FAQ.
5-58 5 1 109 A general note: I realize what a huge task you all have undertaken and I appreciate the level of effort and hair-pulling that has gone into this so far. Thanks to all the authors for the massive effort and strong product you've written so far! [Julia Cole, USA]
Noted
5-59 5 1 156 The presentation and discussion of general Cenozoic climate, especially including the Early Paleogene and particularly the Paleocene-Eocene Thermal Maximum, are so "watered down" that key points are missing. My biggest complaints with AR4 were twofold: (1) only approximately 1.4 pages of text were devoted to the Pre-Quaternary climate, which has our best past analogs, albeit imperfect, in which to assess certain key components of models for carbon cycling and climate; (2) this limited text had some incorrect ideas and did not link to other sections. I assumed this section would expand in AR5; I never thought it would be "side-lined". Indeed, I cannot fathom the rationale or logic for omitting basic information that we know from this time interval. Clearly, this is not based on science. Seriously, how can a ~1000 page document purport to be authoritive on how Earth works at higher pCO2 and higher temperatures, and how Earth responds to massive inputs of carbon, and then mostly ignore available historical records from which to frame and address such query? Just consider ocean acidification. An astute reader from the general public might ask: how do you really know that ocean acidification will occur with massive carbon input? Should the answer entirely hang on theoretical grounds? Or should it be supplemented with the information that, when massive amounts of carbon were added to the ocean and atmosphere during the PETM and other hyperthermals, carbonate dissolution clearly occurred? Ultimately, I think such omission will "backfire". Smart people will ask why this information was excluded ... and what should the answer be? Some of the data does not fit our models and our views for how the world works so we decided to dismiss? The records are not quantitative enough so we decided to omit? Such explanations will go down like a Le(a)d Zeppelin, even with appropriate context. Observations from the the Early Paleogene are important because they actually support, at least qualititatively, many of the notions discussed and modeled in other chapters. This needs to be emphasized clearly. Basically, Earth has a history; this history has times marked by much warmer temperatures and higher pCO2 as well as past intervals of massive carbon injection; we do not fully understand how and why environmental changes and carbon cycling during these past times operated; we also cannot accurately quantify many of changes with available data; however, from a qualitative perspective, numerous records support theory and modeling. This does not come across in the current writing. The main problems are: (1) things are so bogged with couching that the obvious is missing (Early Eocene crocodilians didn't banter around metasequoia-cypress swamps in the Arctic to discuss with confidence that high latitudes at the time were really warm...) (2) insufficient space is given to presenting the records. Yes, I realize that space is limited: so why (given AR4) then spend 900+ pages on theory and modeling and <2 pages on data that actually constrain such models? [Gerald Dickens, USA]
Noted. Large uncertainties in reconstructions (T and pCO2) preclude more detailed assessment at this point. Ocean acidification is related to carbon cycle processes (chapter 6, not chapter 5). We assess uncertainties on estimates of Cenozoic CO2 concentration which is crucial for the use of deep time information in model-data comparisons. More focus is placed on Pliocene warm periods in the revised section 5.3.1 (High CO2 worlds).
5-60 5 1 This chapter marks an impressive compilation of material which complements AR4 and develops data and themes produced in 2007. It is very wide ranging and focuses successfully on key questions. [Chris Caseldine, United Kingdom of Great Britain & Northern Ireland]
Noted.
5-61 5 1 The chapter could do with some streamlining to make it easier to navigate, but overall, I think you've done a good job of teasing out the Global-Warming-relevant aspects of paleo-research. It is actually quite an interesting read. :-) [Julia Hargreaves, Japan]
Taken into account. The outline and introduction are modified.
5-62 5 1 I had less time to read chapter 5 thoroughly than I hoped I would, but what I have seen looks good to me - very balanced, careful, and well discussed. [Gabi Hegerl, UK]
Noted.
5-63 5 1 In general, the text could be more carefully structured and as it is now, the transitions between authors are very obvious. [Valerie Trouet, United States]
Noted.

Expert Review Comments on the IPCC WGI AR5 First Order Draft -- Chapter 5
Do not Cite, Quote or Distribute Page 10 of 157
Comment No
Chapter FromPage
FromLine
To Page
To Line Comment Response
5-64 5 1 I will focus my comments on the sections of this chapter that cover topics in my field of expertise, i.e. 5.3 and 5.4 [Valerie Trouet, United States]
Noted.
5-65 5 1 comments below are Typographical suggestions [Rob Wilson, United Kingdom of Great Britain & Northern Ireland]
Noted.
5-66 5 3 1 5 1 There are some inconsistencies in the executive summary with what is in the main text. I will elucidate these further on with regard to the main text but just here I will list those inconsistencies I spotted [Mark Siddall, UK]
Taken into account. Text and and executive summary revised.
5-67 5 3 3 5 17 Add confidence assessments to all bullet points currently lacking them. [Michael Neil Evans, United States of America]
Taken into account. Text and and executive summary revised.
5-68 5 3 3 23 24 "Available simulations from coupled climate models seem to underestimate the strength of this amplification with respect to proxy-based reconstructions by 30–50%".I think "seem" is not good it this context. Either the models do or they do not underestimate the amplification by 30–50% (or one cannot draw such a conclusion because of the uncertainties). [Raimund Muscheler, Sweden]
Taken into account.
5-69 5 3 3 27 27 …to to… [Raimund Muscheler, Sweden] Editorial
5-70 5 3 4 3 4 "estimates" : do you mean model or measurements ? [Bernard De Saedeleer, Belgium] Taken into account.
5-71 5 3 4 3 5 "Since AR4, several new estimates of past solar and volcanic radiative forcings have been produced, spanning at most the current interglacial period and the last 1500 years, respectively". Does this sentence mean to convey no new estimates were made for pre-Holocene periods (surely this is not the case)? [Andrew Glikson, Australia]
Clarified
5-72 5 3 4 5 16 Other Chapters note the confidence levels in italics. [Peter Burt, UK] Taken into account.
5-73 5 3 4 I'm unhappy with the use of “solar forcing” here. It is not clear at this point that orbital changes are dealt with separately. You could try past solar output instead. [Christopher Brierley, UK]
Noted.
5-74 5 3 5 6 "Large" and "magnitude" are too vague - how large? What magnitude - W/m2? Be specific if you can. Remember that the Exec Summ especially has to be very clear for a broader audience. "Large uncertainties" also conveys that any finding related to natural forcings is suspect and shouldn't be taken too seriously. I don't think that's what you mean. Say how big the uncertainties are and exactly how they limit the use of such data. Or perhaps leave for main text and stick to conclusions in the exec summary - ones where the uncertainty doesn't prevent you from concluding something useful. Also, "spread of model results" is vague - what model results? Why should a reader care? [Jonathan Overpeck, USA]
Taken into account.
5-75 5 3 5 "Large uncertainties" - This needs to be quantified better. Are the volcanic uncertainties really that large? [Alan Robock, USA]
Noted
5-76 5 3 7 3 7 delete comma after CH4 [Peter Burt, UK] Editorial
5-77 5 3 7 9 This statement is a good ES statement. Focused and relevant, including conf estimate. Although "by far" might upset some, I like it for a ES. [Jonathan Overpeck, USA]
Taken into account. ES has been rewritten
5-78 5 3 7 Consider adding "global" before the word "atmospheric" [Dunia H. Urrego, France-USA] Taken into account. ES has been rewritten
5-79 5 3 8 3 8 "very likely exceed by far" is unclear. Does the "very likely" pertain to the exceedence by far or the exceedence as such. In the first case the meaning of "by far" is vague. In the second case "by far" would be better dropped, since the uncertainty estimate is a probability estimate and ought to be interpreted as a an estimate about the significance of the difference. Finally, I would use a wording such as "by far" only if the significance is around p<=1%, thus would contradict "very likely" (0.90≤p<0.99), another issue I am having with this formulation. [Andreas Fischlin, Switzerland]
Taken into account. ES has been rewritten
5-80 5 3 9 It is not clear how the new data has expanded the statement from this sentence. [Christopher Brierley, UK] Taken into account. ES has been rewritten

Expert Review Comments on the IPCC WGI AR5 First Order Draft -- Chapter 5
Do not Cite, Quote or Distribute Page 11 of 157
Comment No
Chapter FromPage
FromLine
To Page
To Line Comment Response
5-81 5 3 10 3 12 There is an apparent contradiction between line 10 ("high confidence") and line 12 ("very uncertain"). Try to rephrase ? [Bernard De Saedeleer, Belgium]
Taken into account. ES has been rewritten
5-82 5 3 10 3 14 The first sentence should end after "..the past 65 Myr (million years). The second clause with its broad statement about uncertainty (implying all proxy data are "very uncertain") should be a separate sentence and revised to differentiate between the consistency of the low CO2 estimates from marine proxies over the last 23 Myrs compared with the wider range and higher values from older strata (and values in excess of 1125 ppm confirmed for the period around 50 Ma by the Nahcolite deposit), as outlined in section 5.2.2.2 [Peter Barrett, New Zealand]
Taken into account We will note convergence between different CO2proxies post 23Ma, but at this stage are we are unable to assess the confidence of individual proxies wrt to one another. We do also provide a Table 5.1 in FOD that provides a confidence assessment of the major assumptions used by each of the common proxy methods.
5-83 5 3 10 3 14 This is a very negative comment on the climatic reconstructions based on geological archives. Of course uncertainties increase with age and of course the time resolution is decreasing with age but those studies are very important for the understanding of the long term evolution of the Climate History of the Earth. [CATHERINE BELTRAN, France]
Taken into account. ES has been rewritten
5-84 5 3 10 14 Recommend just the first sentence, edited to end with "although the exact quantitative levels of ancient CO2 levels prior to 800ka are known only to +/- XXX ppm. "Very uncertain" is too vague and only suggests anything to do with these numbers is suspect. Again, that's not true. Since this section is "radiative forcings" you should skip the rest of the bullet and leave for later. Or just say that this level of uncertainty in CO2 levels precludes the use of pre-800ka paleo archives in estimating climate sensitivity. HOWEVER, I don't believe this - clearly the Pliocene is a case where you can look at Earth System sensitivity (as you do in the next bullet), abeit with some deminished level of confidence. Note also in this bullet - terms like "considerable uncertainty" is too vague, and "high CO2 worlds" needs to be defined if used. Better to just leave out and focus bullets about what you can say. [Jonathan Overpeck, USA]
Taken into account. ES has been rewritten
5-85 5 3 11 3 12 "though the reconstructed values obtained from geological archives are very uncertain". This statement is surprising as it is inconsistent, for example, with the multiple proxy-based CO2 values reported by Beerling and Royer (Nature Geoscience Vol 4, July 2011), yielding paleo-CO2 range which can be considered, in my view, to be reasonably well established. [Andrew Glikson, Australia]
Taken into account. ES has been rewritten
5-86 5 3 12 3 12 "very uncertain" is not a helpful formulation. I suggest authors try to quantify that uncertainty by relating estimates for that past to the variability/change current atmos. conc. have and are about to experience (for future of course only according to scenarios). And then I suggest authors stick to IPCC uncertainty language according to the guidelines. [Andreas Fischlin, Switzerland]
Taken into account. ES has been rewritten
5-87 5 3 12 3 13 considerable uncertainties - what is the definition of this? [Alan Robock, USA] Taken into account. ES has been rewritten
5-88 5 3 12 very uncertain - what is the definition of this? [Alan Robock, USA] Taken into account. ES has been rewritten
5-89 5 3 13 3 14 "this limits the use of past high CO2 worlds” for constraining climate sensitivity" - Well yes but there is universal agreement that these older high CO2 world hd much higher level of sealevel [Peter Clift, United States of America]
Taken into account. ES has been rewritten
5-90 5 3 14 "climate sensitivity" needs to be defined clearly. [Jay Curt Stager, United States of America] Taken into account. ES has been rewritten
5-91 5 3 17 3 17 "During the Middle Pliocene (3.3 to 3.0 million years ago)," The Pliocene is now re-defined between 5.332 to 2.588 million years-ago according to the 2009 version of the Geological Time Scale (http://www.quaternary.stratigraphy.org.uk/correlation/GSAchron09.jpg cited in http://www.quaternary.stratigraphy.org.uk/correlation/GSAchron09.jpg). Therefore, the "3.3 to 3.0 million years" interval constitutes the upper Pliocene, NOT the "middle Pliocene". This problem recurs throughout the draft AR4 where intervals within the Pliocene, in particular the late Pliocene, are not correctly referred to in the context of its redefined time scale of ~5.3 - 2.6 Ma. The problem may be best resolved by citing the actual ages rather than the part (cf. mid- or late-) of the epoch or period. [Andrew Glikson, Australia]
Taken into account.
5-92 5 3 17 3 18 The range of CO2 shown (330-420 ppm) is different from that shown in Chapter 13, page 3, lines 19-22 (350-415 ppm). [Henry Pollack, USA]
Taken into account. Text and ES has been rewritten consistently

Expert Review Comments on the IPCC WGI AR5 First Order Draft -- Chapter 5
Do not Cite, Quote or Distribute Page 12 of 157
Comment No
Chapter FromPage
FromLine
To Page
To Line Comment Response
5-93 5 3 17 3 20 State here the similarity of atmospheric CO2 concentrations with modern CO2 concentrations. [Christian Ohneiser, France]
Taken into account. ES has been rewritten
5-94 5 3 17 20 This is potentially a VERY important bullet, because of what the numbers imply - Earth system sensitivity could be significanly higher than standard or Charney sensitivity. I'm thinking of the Lunt et al 2010 Nat Geo paper. So, the bullet is already pretty good, but it lacks the punchline - why do these facts about the Pliocene matter to policy makers? Make it clear. [Jonathan Overpeck, USA]
Taken into account. ES has been rewritten and Pliocene warm periods expanded in 5.2 and 5.3
5-95 5 3 17 The terminology for the Pliocene needs to be consistent (middle, mid and MWMP are all used). I am also unhappy referring to it as middle. The Pliocene runs from 5.3-2.6Ma, so 3Ma is late not middle (obviously it was before the boundary between Plio-Pleistocene changed). The name will confusingly persist in the literature, but this report should use the current definitions. I personally feel that the uncertainly in dating is small enough that we can accurately call it 3Ma and not with a geological epoch at all. The term MPWP is especially awkward as it implies that earlier in the Pliocene was cooler, whilst in fact 4Ma was even warmer still. I won't mention this point further, but I feel quite strongly about it. [Christopher Brierley, UK]
Accepted. Text revised to clarify definitions of periods.
5-96 5 3 17 Use "Myr" instead of "million years" as this achronym is already defined [Dunia H. Urrego, France-USA] Noted
5-97 5 3 21 3 21 Middle Pliocene (Last Glacial Maximum) [Peter Clift, United States of America] Noted
5-98 5 3 21 3 21 Middle Pliocene (Last Glacial Maximum) - make it seem likethe LGM was during the Mid Pliocene [Peter Clift, United States of America]
Noted
5-99 5 3 21 3 22 I find these parantheses confusing. I suggest authors use a phrase using vs. Then you could also introduce LGM properly. I suggest: "high vs. low CO2 worlds such as the Middle Pliocene vs. Last Glacial Maximum (23'000 years ago)" [Andreas Fischlin, Switzerland]
Noted
5-100 5 3 21 3 22 high (low) - do not use this terrible construction. It is confusing and hard to understand. Write it out. See: Robock, Alan, 2010: Parentheses are (are not) for references and clarification (saving space). EOS, 91(45), 419, doi:10.1029/2010ES003202. http://climate.envsci.rutgers.edu/robock/Parentheses2010EO450004.pdf [Alan Robock, USA]
Noted
5-101 5 3 21 3 24 Please help eliminate from science the style of writing that uses parentheses to indicate opposites. It's really awkward and hard to read (see Alan Robocks editorial on this in EOS, if you don't believe me). Can be rewritten as follows: Polar amplification of temperature change occurs in both high and low CO2 climates but coupled models underestimate this amplification, compared to paleodata. (high confidence) - please pick medium or high here. Maybe you could have high if you leave out values in the exec summary quantify this in text?) [Julia Cole, USA]
Noted
5-102 5 3 21 3 24 This hypothesis is at odds with the comprehensive assessment of the Siberian temperatures during the Last Glacial Maximum included in these comments. [Marcel Crok, The Netherlands]
Taken into account. ES has been rewritten
5-103 5 3 21 3 24 it makes no sense to combine the LGM and Pliocene in one statement. The climate sensitivity seems to be different. [Gerrit Lohmann, Germany]
Taken into account. ES has been rewritten
5-104 5 3 21 4 11 The executive summary could be more clearly written in sentence construction, in techical content for an executive summary and to some extent in jargon usage - page 3 lines 21 to 24 being particularly awkward. [Mark Charlesworth, United Kingdom of Great Britain & Northern Ireland]
Taken into account. ES has been rewritten
5-105 5 3 21 24 Using the "high (low)" etc style is distracting to some, so maybe recraft to avoid. Seems that the IPCC confidence language is vague or subjective enough to avoid using "medium to high confidence" Just agree, and if you can't go with medium. Simulations from models is awk, just say "coupled model simulations". More important than all this nitpicky stuff is that you also need to say why this matters. And what the models aren't getting - the full magnitude of the amplification, but why, and why should a policy maker care. Does this mean simulations of future polar change may be biased, perhaps? Can't leave it to readers to fiture out the mystery of why you have this bullet... (which I think is a good one, btw) [Jonathan Overpeck, USA]
Taken into account. ES has been rewritten
5-106 5 3 21 The reverse-in-brackets convention is not in wide use, even among scientists. Please avoid it in the executive Taken into account. ES has been rewritten

Expert Review Comments on the IPCC WGI AR5 First Order Draft -- Chapter 5
Do not Cite, Quote or Distribute Page 13 of 157
Comment No
Chapter FromPage
FromLine
To Page
To Line Comment Response
summary. [Christopher Brierley, UK]
5-107 5 3 22 "The" is missing before global. [Christopher Brierley, UK] Noted
5-108 5 3 23 3 23 "Available simulations from coupled climate models" is this also true for AR5 GCMs? Please clarify, since quite a critical point. Consistency among chapters. [Andreas Fischlin, Switzerland]
Accepted - text revised
5-109 5 3 23 Only for the Pliocene does Fig 5.3 show a deficit in the model amplification - needs to be more specific [Eric Wolff, United Kingdom of Great Britain & Northern Ireland]
Taken into account. ES has been rewritten
5-110 5 3 25 31 The last part of this bullet is the key and it is buried by all the rest. Suggest cutting all but the senstivity statement and adding some sort of confidence that sensitivity is not more than 6 degrees. "difficult to reconcile" is vague. Also, you mention GCMs in this bullet and coupled models in the previous one - aren't they the same? Why confuse. Projections of what? Future climates? Again, I'd just focus on the last part and leave the rest of the interesting bullet in the main text where folks can go if they want to learn more. The sensitivy statement is the key and could get elevated to the TS or SPM even. [Jonathan Overpeck, USA]
Taken into account. ES has been rewritten
5-111 5 3 27 3 27 delete 2nd "to" [Peter Barrett, New Zealand] Noted
5-112 5 3 27 3 27 remove one "to" [Sophie Bonnet, Canada] Noted
5-113 5 3 27 3 27 Is 'to to' correct? [Mark Charlesworth, United Kingdom of Great Britain & Northern Ireland] Noted
5-114 5 3 27 3 27 to to negative - delete one "to" [Peter Clift, United States of America] Noted
5-115 5 3 27 3 27 change "to to negative" into "to negative" [Bernard De Saedeleer, Belgium] Noted
5-116 5 3 27 3 27 "to to" [Andreas Fischlin, Switzerland] Noted
5-117 5 3 27 3 27 The word "to" is duplicated. [Yueh-Hsin Lo, Taiwan R.O.C.] Noted
5-118 5 3 27 3 27 remove "to" for the second time [Olga Solomina, Russian Federation] Noted
5-119 5 3 27 3 27 to' is redundant [Zhaomin Wang, UK] Noted
5-120 5 3 27 3 28 This statement seems to depend on the discussion in the text, which is in turn based mainly on the McGregor paper. but that increase in variance is not a common feature of all reconstructions. (more below) [Julia Cole, USA]
Taken into account. ES has been rewritten
5-121 5 3 27 3 28 "negative (e.g., glacial) versus positive (e.g., projections) radiative perturbations" . "e.g. projections is not understood in the context of the preceding sentence. [Andrew Glikson, Australia]
Taken into account. ES has been rewritten
5-122 5 3 27 "to" has been written twice [Muhammad Amjad, Pakistan] Noted
5-123 5 3 27 GCM has been not defined in this chapter. Unsure whether it is needed here though. [Christopher Brierley, UK]
Noted
5-124 5 3 27 “to” occurs twice [Christopher Brierley, UK] Noted
5-125 5 3 27 response to to --> response to [Masa KAGEYAMA, France] Noted
5-126 5 3 27 abbreviation "CE" to be redefined in each chapter? [Masa KAGEYAMA, France] Noted
5-127 5 3 27 Define "GCMs" [Alan Robock, USA] Noted
5-128 5 3 27 to to [Alan Robock, USA] Noted
5-129 5 3 27 Delete the extra word "to" from the phrase "... response to to negative..." [Jay Curt Stager, United States of Noted

Expert Review Comments on the IPCC WGI AR5 First Order Draft -- Chapter 5
Do not Cite, Quote or Distribute Page 14 of 157
Comment No
Chapter FromPage
FromLine
To Page
To Line Comment Response
America]
5-130 5 3 27 remove “to” [Franco Talarico, Italy] Noted
5-131 5 3 27 Word "to" repeated before "negative" [Dunia H. Urrego, France-USA] Noted
5-132 5 3 27 delete 'to' [Elie Verleyen, Belgium] Noted
5-133 5 3 27 Delete “to” before “negative” [Rob Wilson, United Kingdom of Great Britain & Northern Ireland] Noted
5-134 5 3 28 3 28 Also the simple models do not propose a linear relationship. This statement is therefore quite questionable or at least requires a more careful reformulation. [Andreas Fischlin, Switzerland]
Taken into account. ES has been rewritten
5-135 5 3 28 3 30 This result about assymetry of the role of clouds in different climates is important, but at the moment is only based on a signle study. Therefore it should be confirmed by other studies to stay at the level of the executive summary. Also the last part of the paragraph should be revisited, it doesn't emerge logically from the previous arguments [PASCALE BRACONNOT, France]
Taken into account. ES has been rewritten
5-136 5 3 28 3 31 Is it a part of the previous bullet? [Olga Solomina, Russian Federation] Taken into account. ES has been rewritten
5-137 5 3 28 "projections" - What does this mean? Map projections? If it means scenarios of future climate, then say so and reference the appropriate chapter. [Alan Robock, USA]
Taken into account. ES has been rewritten
5-138 5 3 28 A word seems to be missing before "projections" [Dunia H. Urrego, France-USA] Taken into account. ES has been rewritten
5-139 5 3 30 3 31 and what happens here, i.e. near 6°C? How gradual vs. how abrupt does this "reconciliation" wane? Would be most welcome if some more precise description would be given of what happens > 3°C climate sensitivity as we approach 6°C. [Andreas Fischlin, Switzerland]
Taken into account. ES has been rewritten
5-140 5 3 30 3 31 "although values in excess of 6°C for doubling of atmospheric CO2 content are difficult to reconcile with our existing understanding". High climate sensitivity values are suggested in connection with slow feedbacks ( greenhouse gases, ice sheet area, land and sea areas and vegetation cover), namely, whereas fast feedbacks (water vapour, clouds, climate-driven aerosols, sea ice and snow cover) accord with Charney's climate sensiitivity of 3+/-1C per doubling of CO2, slow feedbacks are marked with significantly higher climate sensitivities, such as during glacial terminations (~180-280 ppm CO2; ~5C; Hansen et al., 2007, Phil. Trans. R. Soc. A365, 1925–1954) and as suggested from studies of the Pliocene (Pagani et al., 2010. Nature Geoscience, Vol 3, January, 2010) where CS values higher than 6C per doubling of CO2 are suggested. [Andrew Glikson, Australia]
Taken into account. ES has been rewritten to clarify statements on climate sensitivity and Earth system sensitivity
5-141 5 3 30 3 31 Is there a lower limit for climate sensitivity that can be included here as well as an upper limit? i.e. would it be possible to include a "…below X°C…" statement as well as an "…in excess of 6°C…"? [Andrew Russell, United Kingdom of Great Britain & Northern Ireland]
Taken into account. ES has been rewritten
5-142 5 3 30 Should be "for a doubling of the atmosphere" [Christopher Brierley, UK] Noted
5-143 5 3 31 3 31 replace "existing" with "present" [Peter Barrett, New Zealand] Noted
5-144 5 3 31 3 31 Change "reconcile" by "support". Otherwise it seems that changes above 6 C are as likely as "our existing understanding" and both need to be modified to make them match. [Yueh-Hsin Lo, Taiwan R.O.C.]
Noted
5-145 5 3 32 3 32 the (thousand years ago) is already mentioned at the line 8 and can be deleated here [Olga Solomina, Russian Federation]
Noted
5-146 5 3 32 38 what's the point of this bullet? Rewrite to make it more prominent. That carbon cycle feedbacks are always positive? That higher CO2 and CH4 means warmer (better), That models do the job only if they have coupled carbon cycle? Try to be more specific and not pile too much into a single bullet. Focus is needed. [Jonathan Overpeck, USA]
Taken into account. ES has been rewritten

Expert Review Comments on the IPCC WGI AR5 First Order Draft -- Chapter 5
Do not Cite, Quote or Distribute Page 15 of 157
Comment No
Chapter FromPage
FromLine
To Page
To Line Comment Response
5-147 5 3 32 Ka has been already defined at line 8 [Franco Talarico, Italy] Noted
5-148 5 3 32 Acronym for ka already defined, could get rid of "thousand of years ago" [Dunia H. Urrego, France-USA] Noted
5-149 5 3 32 delete '(thousand years ago)' - already mentioned earlier [Elie Verleyen, Belgium] Noted
5-150 5 3 33 “The” is superfluous before subsequent [Christopher Brierley, UK] Noted
5-151 5 3 34 3 35 Too vague statement in this sentence ("These data show very likely positive climate-carbon cycle feedbacks.") What do you really mean by positive climate-C cycle feedbacks? We know that they exist, but your statement does not make it clear what is now very likely: Transient phase of warming towards the interglacial or the saturation at the onset of the interglacial or the transient return to glacial at the end of the interglacial? And a hint at the nature of these feedbacks might also be needed. [Andreas Fischlin, Switzerland]
Taken into account. ES has been rewritten
5-152 5 3 35 3 36 "Since AR4, transient glacial-interglacial climate simulations have been performed with coupled climate-ice sheet models in response to orbital forcing. " I think one has to careful with this statement. The simulation of glacial-interglacial transitions are somehow missing, e.g. feedbacks with the ice sheets, sea level, carbon cycle etc. [Gerrit Lohmann, Germany]
Taken into account. ES has been rewritten
5-153 5 3 35 “Very likely show” not “show very likely” [Christopher Brierley, UK] Noted
5-154 5 3 37 3 38 Ok. Towards the end of the para it becomes clearer what the authors have in mind. But this is not new since AR4 or in which sense do the authors think this is new? Please clarify whether you consider this a mere confirmation of previous understanding or an important reaffirmation with perhaps reduced uncertainty or otherwise increased robustness or completely new (the impression I get from the current formulation, where I would disagree). [Andreas Fischlin, Switzerland]
Taken into account. ES has been rewritten
5-155 5 3 37 3 38 "Models are only able to capture the full range of the glacial-to-interglacial global mean temperature difference when taking into account the positive CO2 feedback." I think the full range has not evaluated with climate models. Only fist attempts have been documented which can be considered as preliminary with several simplifications. [Gerrit Lohmann, Germany]
Taken into account. ES has been rewritten
5-156 5 3 38 "positive CO2 feedback" - What about methane feedbacks? If successful with only CO2 feedbacks, does this mean methane feedbacks are unimportant or do not exist? [Alan Robock, USA]
Taken into account. ES has been rewritten
5-157 5 3 39 3 45 It should be clear that the larger changes are not the annual mean (event though it is important to tell how the mean is compared to present day) but the seasonality. At least without reference to changes in seasonality the pattern of the response to the insolation forcing cannot be fully understood. [PASCALE BRACONNOT, France]
Taken into account. ES has been rewritten. Seasonality now clearly addressed in 5.3
5-158 5 3 39 40 The two comprehensive syntheses discussed in the text were the Turney and Jones (2010) land and ocean, and McKay et al. (2011) ocean temperature syntheses, which concluded 1.5 and 0.7 degrees warming, respectively, so 2 degrees might be a little high. [Nicholas McKay, United States]
Taken into account. Text and ES have been rewritten on the uncertainty associated with LIG temperature change
5-159 5 3 39 45 I like what you do w/ the LIG in this chapter, but this bullet seems disconnected from the main text. What's the confidence that the LIG was 2 degrees warmer - really medium confidence? Text says it wasn't that warm - maybe only a faction of a degree, or up to 1.5 at most, but can't really say from the data because of seasonal bias? Need to models and they say less. In any case, just make jive with the main text. And double check. Also, what's the point of this bullet for policy makers - seems obscure. Models don't get everything? So what? LIG was warmer? So what? Maybe connect to the sea level bullet??? Then it has more relevance. [Jonathan Overpeck, USA]
Taken into account. Text and ES have been rewritten on the uncertainty associated with LIG temperature change
5-160 5 3 39 change "temperature" to "temperatures" [Alan Robock, USA] Noted
5-161 5 3 39 "part of the LIG was approx 2 degs warmer"; it would be misleading to suggest that the whole period 130-116 was warmer [Eric Wolff, United Kingdom of Great Britain & Northern Ireland]
Taken into account. ES has been rewritten
5-162 5 3 40 3 40 2°C globally? And how about previous results, e.g. I have summarized the understanding shortly after AR4 as Taken into account. Text and ES have been rewritten

Expert Review Comments on the IPCC WGI AR5 First Order Draft -- Chapter 5
Do not Cite, Quote or Distribute Page 16 of 157
Comment No
Chapter FromPage
FromLine
To Page
To Line Comment Response
follows: "The Last Interglaciation (LIG) or Eemiam (130±-116±1 ka BP) was characterized by regional warming, particular towards the poles. E.g. 3°C to 5°C warmer than present over Greenland and Antarctica {Jansen, 2007, Ja71, p. 453}, but global temperatures were not significantly warmer than today’s {Jansen, 2007, Ja071,`, p. 453;Kaspar, 2006, Ka150,`, +0.13°C warmer than preindustrial;Kubatzki, 2000, Ku045,`, p.802`, -0.8°C (CLIMBER-2) and -0.3°C (ECHAM-1/LSG)`, Table 2}. Not all Arctic ice, particularly not all from Greenland’s ice shield were melted, however. Sea levels were about 4-6 m above current levels {Otto-Bliesner, 2006, Ot007;IPCC, 2007, Ip012,`, p. 9}." What you state here differs therefore AFAIK quite substantially from AR4 and needs therefore to state this explicitly and assess the uncertainties. Cited References: ------------------------ Jansen, E., J. Overpeck, K. R. Briffa, J. C. Duplessy, F. Joos, V. Masson-Delmotte, D. Olago, B. Otto-Bliesner, W. R. Peltier, S. Rahmstorf, R. Ramesh, D. Raynaud, D. Rind, O. Solomina, R. Villalba & D. Zhang, 2007. Paleoclimate. In: S. Solomon, D. Qin, M. Manning, Z. Chen, M. Marquis, K. B. Averyt, M. Tignor & H. L. Miller (eds.), Climate change 2007: The Physical Science Basis. Contribution of Working Group I to the Fourth Assessment Report of the Intergovernmental Panel on Climate Change (IPCC). Cambridge University Press, Cambridge, UK and New York, NY, USA, pp. 433-497. Ja071 Kaspar, F. & U. Cubasch, 2007. Simulations of the Eemian interglacial and the subsequent glacial inception with a coupled ocean-atmosphere general circulation model. In: F. Sirocko, M. Claussen, M. F. Sánchez-Goòi & T. Litt (eds.), The Climate of Past Interglacials. Elsevier Science, Amsterdam, pp. 499-516. Ka150 http://dx.doi.org/10.1016/s1571-0866(07)80058-3 Kubatzki, C., M. Montoya, S. Rahmstorf, A. Ganopolski & M. Claussen, 2000. Comparison of the last interglacial climate simulated by a coupled global model of intermediate complexity and an AOGCM. Climate Dynamics, 16(10-11): 799-814. Ku045 http://dx.doi.org/10.1007/s003820000078 Otto-Bliesner, B. L., S. J. Marsha, J. T. Overpeck & G. H. H. A. X. Miller, 2006. Simulating Arctic climate warmth and icefield retreat in the last interglaciation. Science, 311(5768): 1751-1753. Ot007 http://dx.doi.org/10.1126/science.1120808 IPCC, 2007. Summary for policymakers. In: S. Solomon, D. Qin, M. Manning, Z. Chen, M. Marquis, K. B. Averyt, M. Tignor & H. L. Miller (eds.), Climate change 2007: The Physical Science Basis. Contribution of Working Group I to the Fourth Assessment Report of the Intergovernmental Panel on Climate Change (IPCC). Cambridge University Press, Cambridge, UK and New York, NY, USA, pp. 1-18. Ip012 [Andreas Fischlin, Switzerland]
on the uncertainty associated with LIG temperature change
5-163 5 3 40 3 40 "Last Interglacial Period (130-116 ka) was approximately 2°C warmer than pre-industrial climate". Lower temprature estimates for the Eemian of no more than +1C above pre-industrial Holocene are given in Hansen and Sato 2011 (www.columbia.edu/~jeh1/mailings/.../20110118_MilankovicPaper.pdf) [Andrew Glikson, Australia]
Taken into account. Text and ES have been rewritten on the uncertainty associated with LIG temperature change
5-164 5 3 40 3 41 I am very surprised to read such a large number emphasised here (2 degs C) and based on a very limited number of studies. Those studies and modelling results discussed in the text are conflicting, see below. It is hard to imagine that the LIG was as warm as the Mid Pliocene with such different forcing... [Mark Siddall, UK]
Taken into account. Text and ES have been rewritten on the uncertainty associated with LIG temperature change
5-165 5 3 41 42 The issue of seasonality and spatial coverage is a warm bias, not just uncertainty, because of the predominance of summer-sensitive, NH records. Therefore, 2C should probably be considered a high-end estimate [Nicholas McKay, United States]
Taken into account. Text (5.3) and ES have been rewritten on the uncertainty associated with LIG temperature change and seasonality issues
5-166 5 3 41 Hyphens for yet-to-be [Christopher Brierley, UK] Noted
5-167 5 3 43 3 44 "but underestimate the magnitude of high latitude warming" - You already said this on lines 23-24. [Alan Robock, USA]
Noted
5-168 5 3 43 Could benefit from a “the” before surface. [Christopher Brierley, UK] Noted

Expert Review Comments on the IPCC WGI AR5 First Order Draft -- Chapter 5
Do not Cite, Quote or Distribute Page 17 of 157
Comment No
Chapter FromPage
FromLine
To Page
To Line Comment Response
5-169 5 3 43 The sentence would benefit from explicitly stating whether the conclusions apply to the LI simulations only. [Christopher Brierley, UK]
Taken into account. ES has been rewritten
5-170 5 3 43 I have not noticed that the polar amplification is grossly underestimated in the PMIP2 models run for the LGM. I could be wrong as I have only just started looking at the more complete dataset (pollen+ice core+SST), but I do not know that anyone else has published results on this? I'm not sure where in the rest of this chapter this comment comes from. Section 5.1 promises discussion in 5.4.1, but I don't see anything relevant to this there. Perhaps this comment is only applicable to the Pliocene? [Julia Hargreaves, Japan]
Taken into account. Box, text (5.3) and ES have been rewritten
5-171 5 3 44 3 44 "possibly due to lack of vegetation feedbacks" is too vague and probably not correct. Even model with interactive vegetation have problems with the last interglacial. [Gerrit Lohmann, Germany]
Taken into account. ES has been rewritten
5-172 5 3 44 3 45 "but underestimate the magnitude of high latitude warming, possibly due to lack of vegetation feedbacks (Northern Hemisphere) and ice sheet feedbacks (Southern Hemisphere)." Does this statement refer to a shortcoming in the models? If so, clarify. [Andrew Glikson, Australia]
Taken into account. ES has been rewritten
5-173 5 3 46 3 47 It is not entirely clear what the evidence for centennial/millennial climate on previous interglacials is. In the main body of the report there is mention of a sea-level oscillation during the Last Interglacial. Is there additional evidence from other interglacials? [Chronis Tzedakis, UK]
Taken into account. Text and ES have been rewritten consistently
5-174 5 3 46 3 53 The latest at this bullet I started scratching considerably my head: What logic is behind the order of the bullets? I would either start from the present and then go back further and further in the past or then say the most robust things first etc. But this para fits neither scheme. I am afraid I see little logic behind a sequence 800ka, mid-pliocene, LGM, all of pleistocene, Eemiam, all of Holocene, MWP etc. Please fix this by searching for a more obvious logic, I find current sequence rather confusing and full of surprises. This also triggers once more my major point with respect to the structuring of the chapter. I do not find the headings very meaningful and therefore not helpful for understanging a logic behind the structure of this chapter. [Andreas Fischlin, Switzerland]
Taken into account. Chapter and ES structures have been modified for better logics and readability
5-175 5 3 46 53 This bullet has too many foci. Century to millennial - so what? Models only simulate Holocene if… so what? At least make the last two centences their own bullet. But, I'm not sure if there is higher amplitude between MCA and LIA if you look at the the amplitude of individual recons assessed in AR4 vs the newer ones. For example, Mann's new recons have more amplide than his old ones, but not more than some of the older ones (e.g. Moberg). And what's the significance of your statement if true? [Jonathan Overpeck, USA]
Taken into account. ES has been rewritten
5-176 5 3 47 “Is superimposed” not “are superimposed” [Christopher Brierley, UK] Editorial
5-177 5 3 48 3 49 The executive summary mentions "transient climate simulations explain the spatial and temporal complexity of the early-to-mid Holocene climate by the interplay of orbital forcing and the regional impacts of ice sheet decay" but this role of ice sheet decay on the regional response, as analysed in Renssen et al. 2009 for instance, is not discussed in the main text if I am right (see section 5.4.1.2). [Hugues Goosse, Belgium]
Taken into account. Text (new section 5.5.1) and ES have been rewritten consistently
5-178 5 3 49 3 49 insert space after full stop [Peter Burt, UK] Noted
5-179 5 3 49 3 49 change "decay.New" into "decay. New" [Bernard De Saedeleer, Belgium] Noted
5-180 5 3 51 3 51 replace "of temperature variations" with "in temperature variation" [Peter Barrett, New Zealand] Noted
5-181 5 3 51 3 53 The statement that "since AR4 larger amplitudes of temperature variations have been documented between the Medieval Climate Anomaly (about 950-1250 CE, MCA) and Little Ice Age (about 1450-1850 CE, LIA)", asuming this is referring to hemspheric scale changes, is at best misleading. A comparison of various reconstructions (e.g. Fig. 3 of Mann et al '08) shows Moberg et al '05 (which was included in the AR4 assessment) as having nearly the largest amplitude of all reconstructions. To this reviewer's knowledge, no reconstruction with a larger amplitude difference than Moberg et al '05 has been published since, though the Mann et al (2008) reconstructions and the (quite simlilar) Ljungqvist (2010) reconstruction come close. It would seem that the conclusion, therefore, is as much a consequence of how these periods have been defined (i.e.
Taken into account. Text (section 5.3.5) and ES have been rewritten.

Expert Review Comments on the IPCC WGI AR5 First Order Draft -- Chapter 5
Do not Cite, Quote or Distribute Page 18 of 157
Comment No
Chapter FromPage
FromLine
To Page
To Line Comment Response
the choice of AD 950-1250 and 1450-1850). But this choice appears to come (with very slight modification) from the definitions that were provided by Mann et al (2009). But Mann et al (2009) used those periods precisely because they defined the intervals of greatest difference in that reconstruction (a similar conclusion holds for the Lundquist reconstruction). Were one to use a metric of greatest different between peak warmth and peak cold in all reconstructions, I suspect that Moberg et al '03 and Esper et al '02 would both rank near the top, and they are among the earlier reconstructions in the comparison. Indeed, it is unclear even from Fig 5.13 that there is a clear temporal trend in the amplitude of the reconstructions, with Moberg still ranking among the largest. [Michael Mann, USA]
5-182 5 3 51 3 53 No convincing analysis has been made in ch. 5.3.5 that backs up the statement that ”Since AR4, larger amplitudes … have been documented”. This needs to be done, and can be done in Fig. 5.7 by separating results that show amplitudes for pre- and post-AR4 NH reconstructions, and write an appropriate discussion concerning the resuls that emerge. [Anders Moberg, Sweden]
Taken into account. Text (section 5.3.5) and ES have been rewritten.
5-183 5 3 51 3 53 The LIA period is here defined as 1450-1850, but as 1450-1750 in Fig. 5.7. Consistent definitions are needed. [Anders Moberg, Sweden]
Taken into account. Names of periods are related to time intervals in the revised text and ES. Periods are defined in glossary.
5-184 5 3 52 3 53 Whereas I think that the choice of 1450–1850 as 400-year period to define the Little Ice Age is rather unproblematic, the choice of 950–1250 as 300-year period to define the Medieval Climate Anomaly is more problematic. I would like to point out that the 10th century likely was the warmest during the Medieval Climate Anomaly (at least on higher latitudes in the Northern Hemisphere). Hence, the 300-year period 850–1150 might better capture the temperature maximum of the Medieval Climate Anomaly. [Fredrik Charpentier Ljungqvist, Sweden]
Noted. This is a difficult issue that has no easy resolution, balancing various factors such as period covered by model simulations and reconstructions etc. We have pointed out in the text of 5.3.5 that definitions vary between studies and regions -- e.g. as the comment indicates, the early definition may be appropriate for high latitude NH, but maybe not elsewhere.
5-185 5 3 53 "about 1450-1850 CE, LIA" - didn't it start in 1259, just after the big volcanic eruption? [Alan Robock, USA] Taken into account. The periods are not well defined and 1259 onwards is no more accepted than other definitions. Pointed this out in the text and provided improved glossary definitions.
5-186 5 3 53 here, the LIA is defined as 1450-1850CE, whereas later on in the text and in Fig. 5.1 it is 1450-1750 CE [Valerie Trouet, United States]
Accepted - text/figs now more consistent.
5-187 5 3 54 4 2 This bullet point is problematic on a number of levels, as expanded upon in subsequent specific comments. Among the problems, in short, are: 1) Every hemispheric reconstruction published in the peer-reviewed scientific literature since AR4 has bolstered the case for anomalous recent Northern Hemisphere mean warmth in a greater-than-millennial context. Thus, if anything, the confidence in this conclusion has increased since AR4. Yet the authors have apparently made a subjective choice to downgrade the confidence in this conclusion from 67% (likely) to roughly 50% (this is the way that 'medium confidence' was classified in AR4 and is how it will be interpreted, regardless of whether or not AR5 chooses to attach a numerical score to the categorization or not). 2) The chapter is in fact asking, and answering, the wrong question. Recent studies have clarified that it is only the rapidly accelerated warming of the past two-to-three decades which most clearly exceed the error estimates of reconstructions for the past millennium. Choosing a period as wide as 50 years is thus smoothing out the emerging signal. Had the authors instead asked whether the past 20 years appears to be outside the range of the past millennium, they would most certainly reach a higher level of confidence than with the too blunt use of 50 year blocks. Mann et al (2008) are quite explicit about this, noting that peak medieval warmth appears to reach the average warmth of the late 20th century (1961-1990) reference period, but not the warmth achieved over the past two decades. AR5 needs to confront this key distinction or risk providing a very misleading picture of what the paleoclimate record actually shows. [Michael Mann, USA]
Partly accepted. (1) Medium confidence does not mean 50%. The basis for this assessment is now explained more explicitly. (2) 30-year means are now also assessed.
5-188 5 3 54 4 2 How are these ”very likely” and ”medium confidence” uncertainty levels estimated? No convincing analyses in ch. 5.3.5 back up those judgements. [Anders Moberg, Sweden]
Taken into account. Text (section 5.3.5) and ES have been rewritten.
5-189 5 3 54 4 2 it is not clear if the conclusion "...that 1961–2010 CE was the warmest 50-year period during the last 1300 Accepted. Text revised.

Expert Review Comments on the IPCC WGI AR5 First Order Draft -- Chapter 5
Do not Cite, Quote or Distribute Page 19 of 157
Comment No
Chapter FromPage
FromLine
To Page
To Line Comment Response
years" refers to the Northern Hemisphere temperature or global temperatures. [Raimund Muscheler, Sweden]
5-190 5 3 54 4 2 This is imporant, but it seems to contradict the previous bullet? That is you can say how the MCA compares to the LIA, but comparison of MCA to modern is problemmatic? I don't get that (and problemmatic is vague - what do you mean???). Why not say what you can with confidence estimates to convey how well you think you know it. For these you should be able to use likelihood statements, no? Also, if you're going to get into the geography of warmth during the two periods (which I think is really key), you should do it in a separate bullet that is more specific. That is cut it out of this bullet and make the first bullet in the next section more comprehensive and precise. [Jonathan Overpeck, USA]
Taken into account. Text (section 5.3.5) and ES have been rewritten.
5-191 5 3 54 4 2 Please clarify the season for this statement – annual or summer. [Rob Wilson, United Kingdom of Great Britain & Northern Ireland]
Accepted. Text revised.
5-192 5 3 55 3 55 50-year → 50 year [Peter Burt, UK] Editorial - copyedit to be completed prior to publication
5-193 5 3 55 3 56 "the 50-year mean Northern Hemisphere temperature for 1961–2010 CE was very likely warmer than any previous 50-year mean in the last 800 years." is not a very solid statement. Representativeness of the proxies etc. [Gerrit Lohmann, Germany]
Rejected. The assessment statement is based on representativeness of the proxies, though the main text in 5.3.5 must be read to obtain the basis for the assessment.
5-194 5 3 56 I do not agree with the 800 vs. 1300 distinction. Frank et al. (2010) provide probabilities for the temperature differences between LIA, [Valerie Trouet, United States]
Rejected - Frank et al. ensemble doesn't include the calibration error (I.e. the residuals between a reconstruction and the target temperature), so it underestimates the uncertainty ranges that are needed for this assessment.
5-195 5 3 56 MCA, and 20thC. Referring to this paper could make this bullet point more concise and provide a quantification. [Valerie Trouet, United States]
Rejected - Frank et al. ensemble doesn't include the calibration error (I.e. the residuals between a reconstruction and the target temperature), so it underestimates the uncertainty ranges that are needed for this assessment.
5-196 5 3 56 Frank D, Esper J, Raible C, Büntgen U, Trouet V, Joos F (2010) Ensemble temperature reconstruction constraints on CO2 feedbacks. Nature 463, 527-530, DOI: 10.1038/nature08769 [Valerie Trouet, United States]
Noted
5-197 5 3 57 3 57 What to you mean by "problematic"? They do not differ significantly? If yes, please say so or say on which significance level the difference can be detected. Please do also make this crucial statement statistically very rigorous, so that readers are not only informed about error of type I but are also reminded of type II (see e.g. Fischlin, 2009). Then I suggest to use the usual IPCC uncertainty language and not such an ambiguous wording as "problematic". Cited References: ------------------------ Fischlin, A., 2009. Do we have sufficient safety margins in climate policies?. GAIA, 18(3): 193-199. http://www.sysecol.ethz.ch/Publications.html#Fi153 Fi153 [Andreas Fischlin, Switzerland]
Taken into account. Uncertainty language implemented in the revised ES and chapter.
5-198 5 3 57 3 57 "is still problematic". What does that mean? How do the authors decide which comparisons are "problematic" and which are not? The same potential sources of bias and uncertainty hold for nearly any empirical conclusion derived from paleoclimate data. The levels of uncertainty and precision vary, as do the degree of confidence in particular conclusions. One could argue that the main thing that is "problematic" (see previous comment) is the authors' choice of a 50 year interval for comparison, which wipes out the rapidly emerging signals of the past few decades. As John Tukey once famously said "An approximate answer to the right problem is worth a good deal more than an exact answer to an approximate problem." [Michael Mann, USA]
Accepted - text rephrased and 30-yr means are considered as well as 50-yr means. Explanation for retaining 50-yr means has now been added to the text.
5-199 5 3 57 4 1 "Comparison of the relative warmth of the Medieval and modern periods is still problematic but evidence for Rejected - less value in comparing medieval warmth
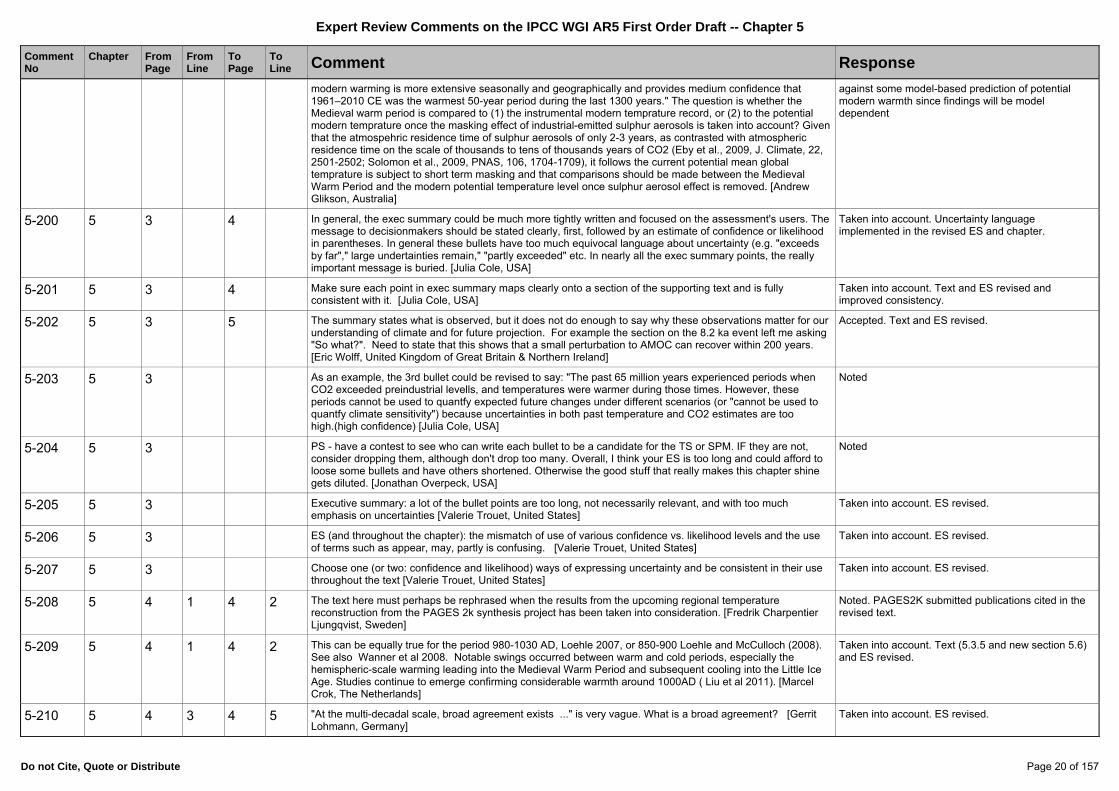
Expert Review Comments on the IPCC WGI AR5 First Order Draft -- Chapter 5
Do not Cite, Quote or Distribute Page 20 of 157
Comment No
Chapter FromPage
FromLine
To Page
To Line Comment Response
modern warming is more extensive seasonally and geographically and provides medium confidence that 1961–2010 CE was the warmest 50-year period during the last 1300 years." The question is whether the Medieval warm period is compared to (1) the instrumental modern temprature record, or (2) to the potential modern temprature once the masking effect of industrial-emitted sulphur aerosols is taken into account? Given that the atmospehric residence time of sulphur aerosols of only 2-3 years, as contrasted with atmospheric residence time on the scale of thousands to tens of thousands years of CO2 (Eby et al., 2009, J. Climate, 22, 2501-2502; Solomon et al., 2009, PNAS, 106, 1704-1709), it follows the current potential mean global temprature is subject to short term masking and that comparisons should be made between the Medieval Warm Period and the modern potential temperature level once sulphur aerosol effect is removed. [Andrew Glikson, Australia]
against some model-based prediction of potential modern warmth since findings will be model dependent
5-200 5 3 4 In general, the exec summary could be much more tightly written and focused on the assessment's users. The message to decisionmakers should be stated clearly, first, followed by an estimate of confidence or likelihood in parentheses. In general these bullets have too much equivocal language about uncertainty (e.g. "exceeds by far"," large undertainties remain," "partly exceeded" etc. In nearly all the exec summary points, the really important message is buried. [Julia Cole, USA]
Taken into account. Uncertainty language implemented in the revised ES and chapter.
5-201 5 3 4 Make sure each point in exec summary maps clearly onto a section of the supporting text and is fully consistent with it. [Julia Cole, USA]
Taken into account. Text and ES revised and improved consistency.
5-202 5 3 5 The summary states what is observed, but it does not do enough to say why these observations matter for our understanding of climate and for future projection. For example the section on the 8.2 ka event left me asking "So what?". Need to state that this shows that a small perturbation to AMOC can recover within 200 years. [Eric Wolff, United Kingdom of Great Britain & Northern Ireland]
Accepted. Text and ES revised.
5-203 5 3 As an example, the 3rd bullet could be revised to say: "The past 65 million years experienced periods when CO2 exceeded preindustrial levells, and temperatures were warmer during those times. However, these periods cannot be used to quantfy expected future changes under different scenarios (or "cannot be used to quantfy climate sensitivity") because uncertainties in both past temperature and CO2 estimates are too high.(high confidence) [Julia Cole, USA]
Noted
5-204 5 3 PS - have a contest to see who can write each bullet to be a candidate for the TS or SPM. IF they are not, consider dropping them, although don't drop too many. Overall, I think your ES is too long and could afford to loose some bullets and have others shortened. Otherwise the good stuff that really makes this chapter shine gets diluted. [Jonathan Overpeck, USA]
Noted
5-205 5 3 Executive summary: a lot of the bullet points are too long, not necessarily relevant, and with too much emphasis on uncertainties [Valerie Trouet, United States]
Taken into account. ES revised.
5-206 5 3 ES (and throughout the chapter): the mismatch of use of various confidence vs. likelihood levels and the use of terms such as appear, may, partly is confusing. [Valerie Trouet, United States]
Taken into account. ES revised.
5-207 5 3 Choose one (or two: confidence and likelihood) ways of expressing uncertainty and be consistent in their use throughout the text [Valerie Trouet, United States]
Taken into account. ES revised.
5-208 5 4 1 4 2 The text here must perhaps be rephrased when the results from the upcoming regional temperature reconstruction from the PAGES 2k synthesis project has been taken into consideration. [Fredrik Charpentier Ljungqvist, Sweden]
Noted. PAGES2K submitted publications cited in the revised text.
5-209 5 4 1 4 2 This can be equally true for the period 980-1030 AD, Loehle 2007, or 850-900 Loehle and McCulloch (2008). See also Wanner et al 2008. Notable swings occurred between warm and cold periods, especially the hemispheric-scale warming leading into the Medieval Warm Period and subsequent cooling into the Little Ice Age. Studies continue to emerge confirming considerable warmth around 1000AD ( Liu et al 2011). [Marcel Crok, The Netherlands]
Taken into account. Text (5.3.5 and new section 5.6) and ES revised.
5-210 5 4 3 4 5 "At the multi-decadal scale, broad agreement exists ..." is very vague. What is a broad agreement? [Gerrit Lohmann, Germany]
Taken into account. ES revised.

Expert Review Comments on the IPCC WGI AR5 First Order Draft -- Chapter 5
Do not Cite, Quote or Distribute Page 21 of 157
Comment No
Chapter FromPage
FromLine
To Page
To Line Comment Response
5-211 5 4 3 11 The 2nd centence in this one isn't needed (isn't it true that something limits what you can say in all your bullets, or do you know everything with perfect confidence?). Ax it here, add a confidence statement to the first sentence and detail the source of the uncertainty in the main text. Otherwise you're just telling readers that this bullet is of limited utility. "May have signficantly influenced" = vague vague vague. Replace with confidence language, forcing by forcing. High confidence that volc and internal variability, less for solar perhaps? "It may be partly responsible" What is "It"? Vague! Why do we care? Cut this sentence or be more clear. "highlight the Importance" So what? Say why it matters to policy makers, who, by the way, already know that volcanoes affect climate. Might cut this too. [Jonathan Overpeck, USA]
Taken into account. ES revised.
5-212 5 4 6 4 7 The mentioning of ”the onset of” MCA and LIA meaningless. The terms MCA and LIA simply define two particular time periods. No convincing analysis has shown that these two time periods were characterized by an ”onset” of any particular climatic conditions. Delete the entire sentence. [Anders Moberg, Sweden]
Taken into account. ES revised.
5-213 5 4 6 4 11 "Internal variability" is not well captured. Any comment on the unusual 1940s? It is very likely that the internal variability is underestimated. What about millenial changes? There is no solid statement about this issue when comparing models with data. [Gerrit Lohmann, Germany]
Noted. Obs. period is covered in other chapters.
5-214 5 4 7 4 7 Use abbreviations for Medieval Climate Anomaly and Litle Ice Age introduced on previous page. [Peter Burt, UK]
Noted
5-215 5 4 7 4 7 Add "the" before Little Ice Age. [Yueh-Hsin Lo, Taiwan R.O.C.] Noted
5-216 5 4 8 4 9 Delete this sentece too. It says absolutely nothing meaningful in the context (i.e. in the executive summary) [Anders Moberg, Sweden]
Taken into account. ES revised.
5-217 5 4 8 "It" - what does this mean? [Alan Robock, USA] Clarified
5-218 5 4 8 Please clarify what is meant by “It”? I assume you mean that internal variability may dominate during the medieval period, but this sentence could be better worded in this regard. [Rob Wilson, United Kingdom of Great Britain & Northern Ireland]
Clarified
5-219 5 4 9 4 11 Can we possibly learn from these insights anything for more recent global dimming, brightening? Climate sensitivity relevance? [Andreas Fischlin, Switzerland]
Noted. But recent changes are addressed in other chapters (e.g. 8, 10)
5-220 5 4 9 4 11 The statement has written seems false. Models indicate significantly greater response to large volcanic events than do the available annual hemispheric temperature reconstructions over the past millennium. Indeed, this remains true at decadal timescales. The problem is discussed at some length in chapter 10 of the FOD. This problem appears to be related to the response of tree-ring based temperature proxies, which are used in all annually-resolved hemispheric temperature reconstructions. Trees from treeline typically used to reconstruct the volcanic cooling signal suffer from an intrinsic underestimation bias due to the existence of a cooling threshhold (about 1C relative to the pre-anthropogenic baseline) beyond which the trees do not record. This problem has been identified and demonstrated by Mann et al (2012) [Mann, M.E., Fuentes, J.D., Rutherford, S., Underestimation of Volcanic Cooling in Tree-Ring Based Reconstructions of Hemispheric Temperatures, Nature Geosciences (in press)] and there is some discussion of the implications of the finding in chapter 10 of the FOD. The paper should be cited and discussed in chapter 5 as well, as it may explain an important source of bias in estimating climate responses to forcing from proxy data, and it may help to reconcile the fact that climate models predict more than 2C cooling in response to the AD 1258 eruption, but there is essentially no signal of this eruption in most proxy reconstructions (which make primary use of tree-rings). There is a similar, also less severed, underestimation bias for the AD 1453 and AD 1809/1815 eruptions. [Michael Mann, USA]
Taken into account. This study cited in the revised section.
5-221 5 4 9 4 11 It is unclear to me where in the full text the references and explanation for the importance of volcanic forcing can be found? [Valerie Trouet, United States]
Taken into account. Text and ES revised and improved consistency.
5-222 5 4 10 "multi-decadal" - change to "multi-century" based on the results of the new GRL Miller et al. paper [Alan Robock, USA]
Taken into account. Text and ES revised and improved consistency.
5-223 5 4 13 4 13 The title is not the same as the one which appears in the TOC: perhaps unify ? (this remark is also valid for other titles) [Bernard De Saedeleer, Belgium]
Taken into account. Titles modified in the revised ES and chapter.

Expert Review Comments on the IPCC WGI AR5 First Order Draft -- Chapter 5
Do not Cite, Quote or Distribute Page 22 of 157
Comment No
Chapter FromPage
FromLine
To Page
To Line Comment Response
5-224 5 4 13 who wrote these bullets? Gold star for focus! But, I'm in a cranky mood because I waited too long to do this review and it's late, so… [Jonathan Overpeck, USA]
Noted
5-225 5 4 14 4 14 It needs to be defined what is meant by ”not … uniformly warmer … globally”. Not warmer than when? [Anders Moberg, Sweden]
Taken into account. ES revised.
5-226 5 4 14 4 16 The text here must perhaps be rephrased when the results from the upcoming regional temperature reconstruction from the PAGES 2k synthesis project has been taken into consideration. [Fredrik Charpentier Ljungqvist, Sweden]
Noted. PAGES2K submitted publications cited in the revised text.
5-227 5 4 14 4 16 The heterogeneity issue is falsified by Esper and Frank 2009. See also http://www.co2science.org/data/timemap/mwpmap.html [Marcel Crok, The Netherlands]
Noted. Only papers submitted in the peer reviewed literature will be assessed.
5-228 5 4 14 16 Great bullet! True too, but need a confidence estimate. Could even add (after attaching confidence to the first sentence) something like, "For example, the eastern equatorial Pacific was colder than present (medium confidence)." [Jonathan Overpeck, USA]
Noted.
5-229 5 4 14 Replace "by uniformly warmer temperatures globally" with "globally uniform warmer temperatures" [Dunia H. Urrego, France-USA]
Noted.
5-230 5 4 17 4 17 What is "moderate confidence"? Medium confidence? Please stick to IPCC wording. The IPCC uncertainty guidance does not contain this wording. [Andreas Fischlin, Switzerland]
Taken into account. ES revised.
5-231 5 4 17 4 19 What is "moderate" confidence here? That term is not defined in the IPCC "uncertainty guidance" document. Is "medium" meant? It appears that the Kinnard et al study [Kinnard, C., Zdanowicz, C.M., Fisher, D.A., Isaksson, E., de Vernal, A., Thompson, L.G., Reconstructed changes in Arctic sea ice over the past 1,450 years, Nature, 472, 509-513 ] was not assessed in the FOD. Surely, inclusion of that study would raise the degree of confidence in this conclusion, since the authors use a quantitative reconstruction of Arctic sea ice extent to conclude that "both the duration and magnitude of the current decline in sea ice seem to be unprecedented for the past 1,450 years." [Michael Mann, USA]
Taken into account. ES revised.
5-232 5 4 17 4 19 This paragraph is incomplete. it should mention that there exists evidence that extended Mid-Holocene periods experienced summer Arctic sea-ice coverage smaller than presently, even suggesting the absence of summer sea-ice (Jakobsson et al. QSR 2010; Funder et. al, Science 2011) [Eduardo Zorita, Germany]
Taken into account. Text related to sea ice in new section 5.5.2 and ES revised.
5-233 5 4 17 19 Another good one - even got the confidence in - surprised you say medium confidence and high in the next one. Seems like it should be the other way around, but that's why you have author teams to reach consensus. [Jonathan Overpeck, USA]
Taken into account. ES revised.
5-234 5 4 18 4 18 "anomalous"? Do you mean unprecedented? If yes, please say so. Otherwise try to quantify uncertainty by giving significance of the deviation (=anomaly). [Andreas Fischlin, Switzerland]
Taken into account. ES revised.
5-235 5 4 20 4 21 And in the other alpine regions (Andes, Himalaya?)? Lack of data, or no or less significance in trends? Perhaps insert another bullet on those areas if no high confidence possible. [Andreas Fischlin, Switzerland]
Taken into account. ES revised.
5-236 5 4 20 "In some areas" - too vague. All? Most? Just two glaciers? Could be another great one…. [Jonathan Overpeck, USA]
Taken into account. ES revised.
5-237 5 4 21 4 21 Change the blank space in "6 000" by a comma to write "6,000". [Yueh-Hsin Lo, Taiwan R.O.C.] Editorial
5-238 5 4 21 Either insert comma or drop space in 6000 [Christopher Brierley, UK] Noted.
5-239 5 4 22 4 22 Which IGs? And were those warmer than current climate? What does that mean for future projected climate? Do we have to expect also such megadroughts? This is crucial and requires careful consideration and if understanding is too uncertain then you need to explicitly say so. [Andreas Fischlin, Switzerland]
Taken into account. ES revised.
5-240 5 4 22 26 "Extended periods of megadrought" - "Extended" is vague and you need to define megadrought too. "Have been observed" by who? Why not say "occurred" instead. Why is Asia omitted? Arid region records… "partly exceeded" = vague. I can't think of any continent where one or more paleodrought were not longer than
Taken into account. ES revised.

Expert Review Comments on the IPCC WGI AR5 First Order Draft -- Chapter 5
Do not Cite, Quote or Distribute Page 23 of 157
Comment No
Chapter FromPage
FromLine
To Page
To Line Comment Response
anything in the instrumental record. So, this needs work. "can be regarded as a natural part of" - what can? all current droughts? I don't think you can do this attribution, just no way. And to say the pre-industrial droughts were natural isn't news. Cut... or future out how to refocus. Also, why the added exclusive focus on the Indian Summer Monsoon? Need to broaden, since other monsoons are important and have paleo data too. Pehaps make a separate bullet focused on monsoons. Indian monsoon = southeast Asia? Again, good to be more specific about what "large region" means. And don't forget confidence statements... [Jonathan Overpeck, USA]
5-241 5 4 22 Megadroughts have not been limited to interglacials; one of the most severe and widespread droughts of the last 50 kyr happened during the last deglaciation (Stager et al 2011), and much of the tropics were drier during cold periods than during warm ones. They were also not "observed" directly by scientists during interglacials. I suggest omitting the first sentence (Lines 22-23) and changing the second sentence to something like: "The length and intensity of some local to regional-scale droughts around the world have sometimes exceeded the range of variability shown in recent observational records." This is an important point that should be further emphasized in the report; in many cases, we are not yet fully prepared for the natural range of variability, let alone the anthropogenic changes to come. [Jay Curt Stager, United States of America]
Taken into account. ES revised.
5-242 5 4 23 4 23 Language regarding length of megadroughts needs revising - they either exceeded those of the instrumental period most of the time or rarely or not at all. "..partly exceed.." is not a meaning ful expression in this context. [Peter Barrett, New Zealand]
Taken into account. ES revised.
5-243 5 4 23 4 24 Weak sentence structure. One has to think twice what belongs to what: What can be regarded as natural variability? Only those in the instrumental period or only those in past interglacials or even both? [Andreas Fischlin, Switzerland]
Taken into account. ES revised.
5-244 5 4 23 The sentence is not clear. Try "Past mega droughts sometimes lasted longer.... [Christopher Brierley, UK] Taken into account. ES revised.
5-245 5 4 24 "natural part" - does this mean part of random climate variation with no forcing attributed to it? How can you be sure of this? [Alan Robock, USA]
Taken into account. ES revised.
5-246 5 4 25 4 25 Intervals of drought ion last 2000 years. Yes but there is also evidence of Asia-wide superdroughts during the mid Holocene, mostly notably around 4 ka. [Peter Clift, United States of America]
Taken into account. ES revised.
5-247 5 4 25 summer monsoon [lower case] [Alan Robock, USA] Noted.
5-248 5 4 27 4 27 20th century → 20th Century [Peter Burt, UK] Noted.
5-249 5 4 27 4 27 It seems that the word "confidence" is used as a verb, which I think do not exists. Perhaps change ""confidence" to "confirm" ? [Bernard De Saedeleer, Belgium]
Noted.
5-250 5 4 27 Here's a general point… it would be good to talk to other CLAs and decide how to best convey confidence - integrated into the sentence like this bullet or in brackets at the end of each sentence. I like the latter, since it makes sentences awkward. But, main thing is to adopt on convention or the other. Also, I'm not sure I buy this bullet, but I'll leave it to paleoENSO experts to hash it out. [Jonathan Overpeck, USA]
Noted
5-251 5 4 27 define "ENSO" [Alan Robock, USA] Noted.
5-252 5 4 28 4 29 "It is likely that the probability of an El Niño event is increased in the two years following a major volcanic eruption." It will help to make a comment explaining the reason for this relation. [Andrew Glikson, Australia]
Taken into account. ES revised.
5-253 5 4 28 "likely" - I think this is a speculation and not likely. For example, it did not happen after the 1982 El Chichón eruption or the 1991 Pinatubo eruption. If it did not happen after the most studied recent large eruptions, how can you say it is likely? New GCM simulations (the paper is being written) by Stenchikov et al. show La Niña likely in the year after eruptions and not El Niño. So since observations and GCMs are equivocal, I would rate this less than likely. [Alan Robock, USA]
Taken into account. ES revised.
5-254 5 4 30 31 This statement is not novel at all. All the references that this statement refers to, and that are listed in section 5.4.3.2, were published [Valerie Trouet, United States]
Taken into account. ES revised and changed to at least the past 500 years

Expert Review Comments on the IPCC WGI AR5 First Order Draft -- Chapter 5
Do not Cite, Quote or Distribute Page 24 of 157
Comment No
Chapter FromPage
FromLine
To Page
To Line Comment Response
5-255 5 4 30 31 published prior to 2007. There are a couple newer NAO reconstructions and they go back to the start of the millennium. [Valerie Trouet, United States]
See answer to comment 5-254
5-256 5 4 30 31 so I suggest you delete this statement, it is not new since AR4, or you adapt it and change half millennium to millennium. [Valerie Trouet, United States]
See answer to comment 5-254
5-257 5 4 33 Love the sea level work in this chapter! But, you need to make sure it all fits with what they're saying in Chap 13 - I don't have time to detail, but right now it appears that some discussion with those guys is needed for sure. Hope you get to keep sea level strong in this chapter. [Jonathan Overpeck, USA]
Taken into account. Cross chapter consistency with chapter 13 implemented in the revised chapter and ES.
5-258 5 4 34 4 39 Very useful bullet [Andreas Fischlin, Switzerland] Noted
5-259 5 4 34 39 Makings of a fine bullet, but instead of laying out all the data, just give the most likely range with confidence estimate. +10 to 30, that is. "Most variation" vague. How about "… today, with most of the higher than present sea level a result of reduced WAIS and GIS ice sheets." [Jonathan Overpeck, USA]
Taken into account. ES revised.
5-260 5 4 37 4 37 "mid-Pliocene polar ice volume". Refer to my earlier comment for page 17 line 3) [Andrew Glikson, Australia] Noted.
5-261 5 4 37 simulations, indicate that mid-Pliocene… [Christian Ohneiser, France] Noted.
5-262 5 4 37 change "suggest" to "suggests" [Alan Robock, USA] Noted.
5-263 5 4 38 4 39 While this statement is likely true for a 10 m SL rise, it cannot possibly be true for 30 m or 40 m; needs modifying [Eric Wolff, United Kingdom of Great Britain & Northern Ireland]
Taken into account. ES revised.
5-264 5 4 38 “Is unusual” rather than “was unusual”. [Christopher Brierley, UK] Taken into account. ES revised.
5-265 5 4 40 41 Technically ok, I think the switch to "robust evidence" language just for this bullet is distracting. Suggest you stick to similar confidence language for all bullets except where you can use likelihood scale. [Jonathan Overpeck, USA]
Taken into account. ES revised.
5-266 5 4 42 4 42 Chapter 5 highlights that last interglacial sea level was 4-6 m higher than today whereas Chapter 13 highlights that last interglacial sea level greater than 6 m higher than today and possibly 10m; these statements are inconsistent. Suggest that this inconsistency be resolved as well as confidence and likelihood statements (e.g. is the confidence lower than stated and uncertainty higher than implied by these ranges or is one of these statement incorrect?). [Haroon Kheshgi, United States of America]
Taken into account. Cross chapter consistency with chapter 13 implemented in the revised chapter and ES.
5-267 5 4 42 4 42 Was not is already reported in the AR4? [Olga Solomina, Russian Federation] Taken into account. Progress since AR4 better stressed.
5-268 5 4 42 4 45 This seems to be a typo - it seems to directly contradict the main text: P30, lines 1-3 [Mark Siddall, UK] Noted.
5-269 5 4 42 4 55 This statement is inconsistent with the discussion in the chapter which indicates high confidence that sea level exceeded +6 m during the Last Interglacial stage. [Robert Kopp, USA]
Taken into account. ES revised.
5-270 5 4 42 42 The technical summary contradicts the sea level section here, which says at least 6m of rise, and 6 to 10m for the range [Nicholas McKay, United States]
Taken into account. Chapter text and ES revised for consistency.
5-271 5 4 42 45 This bullet needs to be synched with main text. The latter seems more accurate. E.g., in the main text you don't say 4-6m, but rather 6 to 10. The wording in the main text is good - stick with that. With 6m, let alone 10m, it's impossible to say the WAIS wasn't likely involved, so the sentence about the WAIS in this bullet is quite misleading. I know you're talking about direct geological evidence, but non-specialists won't get that nuanced point. Stick to what matters - during the last interglacial (give time range, btw) slr was at least 6m (high conf) to perhaps 10m (low conf) above present, and evidence indicates that both the GIS and AIS must have contributed to this rise, with only a small amount from thermal expansion of the ocean and alpine glacier retreat (high conf?). Something like that. Main thing is to be precise. [Jonathan Overpeck, USA]
Taken into account. Chapter text and ES revised for consistency.
5-272 5 4 42 While I think 4-6 m may be a good estimate, this is not what the text says (see later comments). You need to Taken into account. Chapter text and ES revised for

Expert Review Comments on the IPCC WGI AR5 First Order Draft -- Chapter 5
Do not Cite, Quote or Distribute Page 25 of 157
Comment No
Chapter FromPage
FromLine
To Page
To Line Comment Response
make sure everything is consistent here [Eric Wolff, United Kingdom of Great Britain & Northern Ireland] consistency.
5-273 5 4 43 4 44 Any updates on Greenland ice sheet relative to AR4? Jansen et al., 2007 prominently showed that even with a figure. Cited References: ------------------------ Jansen, E., Overpeck, J., Briffa, K. R., Duplessy, J.-C., Joos, F., Masson-Delmotte, V., Olago, D., Otto-Bliesner, B., Peltier, W. R., Rahmstorf, S., Ramesh, R., Raynaud, D., Rind, D., Solomina, O., Villalba, R., & Zhang, D., 2007. Paleoclimate. In: Solomon, S., Qin, D., Manning, M., Chen, Z., Marquis, M., Averyt, K. B., Tignor, M., & Miller, H. L. (eds.). Climate change 2007: The Physical Science Basis. Contribution of Working Group I to the Fourth Assessment Report of the Intergovernmental Panel on Climate Change (IPCC). Cambridge University Press: Cambridge, UK and New York, NY, USA. 433-497. (http://www.ipcc.ch/) Ja071 [Andreas Fischlin, Switzerland]
Taken into account. Progress since AR4 better stressed.
5-274 5 4 43 43 Because the better estimate is “at least 6m” of rise, this sentence should say that the rise cannot be explained by melting of the GIS and thermal expansion, and mountain glaciers, implying a contribution from Antarctica. [Nicholas McKay, United States]
Taken into account. Chapter text and ES revised for consistency.
5-275 5 4 46 4 49 This statement does not appear to be grounded in the text. [Robert Kopp, USA] Taken into account. Chapter text and ES revised for consistency.
5-276 5 4 46 4 49 Again this statement is hard to reconcile with discussion in the text concerning several recent works [Mark Siddall, UK]
Taken into account. Chapter text and ES revised for consistency.
5-277 5 4 46 49 Hard to say with high confidence that sea level rise early in the LIG (or even later) didn't exceed 3mm per year. I agree with your assessment of the Red Sea records, but still don't think you can rule out faster slr during the LIG. [Jonathan Overpeck, USA]
Taken into account. Chapter text and ES revised
5-278 5 4 48 4 49 The chapter shows no evidence of reconstructions of global mean sea-level in the past millennium. Thus this sentence is not justified. The empirical evidence of sea-level variations in the past millennium is limited to regional information, from salt mashes for instance, but this doe snot allow to estimate the magnitude of global mean sea-level variations in the past millennium [Eduardo Zorita, Germany]
Taken into account. Chapter text and ES revised
5-279 5 4 50 4 50 I would appreciate if authors could also assess what we currently know about soil formation processes, e.g. what time was needed for soils exposed after glacier retreat (e.g. early Holocene) to become fertile and allow for plant growth? Retreat of sea level and the soils in warmer climates, e.g. before LGM? These questions are also quite relevant for WGII. BTW, I do not suggest to have a bullet on this here, headings simply are not general enough to capture anywhere a point like this one (see my major comment on the structuring of this chapter). Here I merely felt would be the last resort where to possibly put it, despite the fact it doesn't fit. Finally, I believe authors need also to carefully coordinate with WGII impact chapters dealing with the issues of what to learn from past CC for future CC impacts on soils and vegetation etc. As long as these issues are in a total accross WGs properly assessed, all is fine. [Andreas Fischlin, Switzerland]
Noted but beyond the scope of WG1
5-280 5 4 51 5 6 In the executive summary the repeated experience of abrupt changes discussed in 5.6.1 should be highlighted to allow policy makers to be prudent (precautionary). Words along the following lines might be appropriate 'Greenland ice core records spanning the last glacial cycle depict 25 abrupt events, marked by an abrupt change of up to 18.5°C on a timescale of a few decades, possibly associated with several tens of meters of change in global sea level.' [Mark Charlesworth, United Kingdom of Great Britain & Northern Ireland]
Taken into account. ES revised to describe patterns of past abrupt changes
5-281 5 4 51 5 6 Three issues are all that is specified under "Evidence and Processes of Abrupt Climate Change". And 2/3 relate to AMOC. Is this representative? I.e., is present knowledge of abrupt change this limited, and biased to the North Atlantic/AMOC? [Tor Eldevik, Norway]
Noted. But due to space limitations and themes covered in AR4, it is decided to focus on AMOC in revised chapter 5.

Expert Review Comments on the IPCC WGI AR5 First Order Draft -- Chapter 5
Do not Cite, Quote or Distribute Page 26 of 157
Comment No
Chapter FromPage
FromLine
To Page
To Line Comment Response
5-282 5 4 51 5 16 Even if detailed studies of possible processes of other abrupt climate change and irreversibility (e.g. 12.5.5.5 to 12.5.5.8) have not been conducted these should be mentioned including a best assessment of uncertainty for further study but more importantly to inform policymaking to allow the possibility of prudence (precaution). [Mark Charlesworth, United Kingdom of Great Britain & Northern Ireland]
Noted
5-283 5 4 51 The abrupt change section here and in the main text is good for what it covers, but the chapter should also cover the growing wealth of evidence regarding "warm climate abrupt change" - e.g., what we discussed in Overpeck and Cole, 2006 Ann Rev Envir Res. If you want help with this, let me know, but there is plenty to cover, and it is arguably more relevant to the future, particularly at the regional scale, than the cold-climate abrupt change that needs the big glacial ice sheets to work. [Jonathan Overpeck, USA]
Taken into account. Aspects included in revised 5.3 (last interglacial), new 5.5 (Holocene) and 5.6 (sea level)
5-284 5 4 52 4 52 The bipolar seesaw is mentioned in several places (P 5-4, 5-8, 5-14, 5-17). I think that this important feature should be (graphically) explained in a “Box”. In a paleoclimate context it is a t least as interesting as polar amplification [Hans W Linderholm, Sweden]
Noted (better explanation of bipolar seesaw) but rejected (box only to address cross-chapter issues and polar amplification is while bipolar seesaw is not).
5-285 5 4 52 4 55 We are far away from simulating the DO and H evants in a consistent way. For this, one probably needs a climate model including the ice sheets etc. Until now, most modelling studies may be viewed as sensitivity studies. "closely resembles" is just not appropiate. [Gerrit Lohmann, Germany]
Taken into account. Text and ES revised.
5-286 5 4 52 A little poorly worded. Would read better as two sentences. [Christopher Brierley, UK] Taken into account. ES revised.
5-287 5 5 2 add 'and' after Zone [Elie Verleyen, Belgium] Noted
5-288 5 5 4 5 4 What events? Move to the previous bullet? [Olga Solomina, Russian Federation] Taken into account. ES revised.
5-289 5 5 4 "these events" - which? [Jonathan Overpeck, USA] Taken into account. ES revised.
5-290 5 5 4 "these events" - what events? [Alan Robock, USA] Taken into account. ES revised.
5-291 5 5 6 5 6 Wording should be improved to make it very clear that these events are unlikely in an interglacial such as the Holocene, even if it warms according to projections. The phrase "compared to IG periods" is a bit awkward and makes this meaning less clear. [Andreas Fischlin, Switzerland]
Taken into account. ES revised.
5-292 5 5 8 5 16 Again for an executive summary in order to infrom policy makers something along the lines of following taken from 5.7.1 'it is likely that the West Antarctic Ice Sheet will melt completely for atmospheric CO2 concentration above 400 ppm' would be appropriate to highlight given how quickly we are approaching 400ppm. [Mark Charlesworth, United Kingdom of Great Britain & Northern Ireland]
Taken into account. Text and ES revised.
5-293 5 5 9 5 12 But is the Greenland IS as well as the WAIS really of the same sensitivity or is there not a difference that would be worth-mentioning here? I would have said that the Greenland IS is more sensitive, given the size of the Southern Ocean vs. the North Atlantic, let alone the AMOC (unless it would come to a complete halt, which you do not expect in the near future according to the previous bullet). [Andreas Fischlin, Switzerland]
Taken into account. Text and ES revised.
5-294 5 5 9 12 very important bullet - need to make sure it works well with the preceeding LIG bullets. WAIS is highly senstive, eh? I agree, but the earlier LIG bullets didn't make it sound that way. And, why leave out the EAIS? 10m of slr probably would have required it. Pollard modeling (published?) says only ca. 3.5 m from WAIS likely, and evidence you cite say GIS only 2.5, and theromsteric only fraction of a meter, so... my guess is that we may have gotten some from the considerable EAIS mass that's grounded below sea level. [Jonathan Overpeck, USA]
Taken into account. Text and ES revised.
5-295 5 5 9 It is important to state the CO2 thresholds in this paragraph. The ~400ppm threshold indicates that the earth is approaching an important threshold in this decade. [Christian Ohneiser, France]
Taken into account. Text and ES revised.
5-296 5 5 11 5 12 "implying potential future irreversible melting on timescales of several millennia.". Estimates of Greenland and Antarctic ice melt rates (Rignot et al., 2008, Nature Geosci. 1, 106-110; Velicogna, 2009, Geophys. Res. Lett., 36; Rignot et al., 2011, Geophys. Res. Lett., 38 L05503; Hansen and Sato, 2011) suggest a doubling of ice melt rates on a scale of 5 - 10 years. On this basis Hansen and Sato (2011), commenting on the non-linear nature of ice melt rates, state the following: "Hansen (2007) suggested that a 10-year doubling time was
Rejected. This reference is relevant for chapter 13 (not chapter 5).

Expert Review Comments on the IPCC WGI AR5 First Order Draft -- Chapter 5
Do not Cite, Quote or Distribute Page 27 of 157
Comment No
Chapter FromPage
FromLine
To Page
To Line Comment Response
plausible, pointing out that such a doubling time from a base of 1 mm per year ice sheet contribution to sea level in the decade 2005-2015 would lead to a cumulative 5 m sea level rise by 2095" [Andrew Glikson, Australia]
5-297 5 5 11 Is the “compared to present-day levels” actually necessary? [Christopher Brierley, UK] Accepted
5-298 5 5 13 5 16 You should again at the risk of repeating yourself state here that you do consider this to be unlikely in the near future given the lack of large ice sheets (the bullet two above). I believe this to be too important to not say it explicitly here, given this is an IPCC report. [Andreas Fischlin, Switzerland]
Taken into account. Text and ES revised.
5-299 5 5 13 16 need to make clear why/how relevant to policy makers or maybe just delete. Interesting to us, but to them???? [Jonathan Overpeck, USA]
Taken into account. Text and ES revised.
5-300 5 5 14 "catastrophic" - why was it a catastrophe? What were the climate changes? [Alan Robock, USA] Taken into account. ES revised.
5-301 5 5 15 5 15 What do you mean by "recovery" ? Perhaps precise in a few words. [Bernard De Saedeleer, Belgium] Noted
5-302 5 6 1 6 35 I think the chapter needs a subsection on uncertainty in the reconstruction of radiative forcing and reconstructed climate variables from indirect (proxy) data. This can build on the Chapter 1 section on uncertainty in general and how it is assessed in the AR5WG1 report. In general it might be structured in terms of uncertainty in our understanding of: (1) the proxy system through which the environmental signal is recorded; (2) the processes by which the proxy archive is formed; (3) the development of a chronological model; (4) the way and type of proxy measurement(s) extracted from the archive, including postdepositional effects; (5) the network of sites from which proxy measurements are recorded; (6) measurement uncertainty and reproducibility. I think it can emphasize the idea embodied in the draft that independent, interproxy consistency can tell us how important these uncertainties are relative to the observed signal, and that the identification of uncertainties has and will lead to their reduction by efforts in additional and resampling, meta-analysis, model development, robust statistical reduction. [Michael Neil Evans, United States of America]
Taken into account. Text and ES revised.
5-303 5 6 1 6 35 I recommend using this section to spell out, strongly and clearly, just what paleo records can and cannot tell us. What are the main questions we want to ask of them, and how satisfactory are the answers in general? What are the main proxies and archives used? What remains to be found, and why? What are the main limitations (geographic coverage; questionable interpretation of geochemical records of paleotemperature/precip; dating and sampling resolution), and what are the main strengths (the natural rhythms, rates, and ranges of change; teleconnections; general temp-precip linkages)? [Jay Curt Stager, United States of America]
Taken into account. Text and ES revised.
5-304 5 6 3 6 4 Documentary and proxy information is hardly "quantitative" The documentary information iis merely anecdotal and the proxy informationis highly inaccurate. [VINCENT GRAY, NEW ZEALAND]
Rejected but text reformulated. Information from documentary information is available from the scientific literature with quantitative information demonstrated for instance for extreme events at high temporal resolution (see revised section 5.5.5. for several examples). Quantitave information including assessments of uncertainties is available from proxy records based on the scientific literature.
5-305 5 6 4 6 4 Only quantitative? Perhaps you can write "... a wealth of information, including quantitative data, on past regional ..." [Andreas Fischlin, Switzerland]
Taken into account. Text revised
5-306 5 6 4 This sentence implies that quantitative information is all that matters. In fact, most paleo information is qualitative in nature, but still extremely informative. For example, we know that much of the tropics tend to become much wetter during warm periods, so much so that the Sahara was covered in vegetation, rivers, and lakes during interglacials. Even though the exact magnitudes of changes in P-E at all times and places are unclear, this general qualitative pattern is extremely informative. This important point should be made clearly throughout the report: the abundant qualitative information that we glean from paleo records is at least as important as - and arguably more reliable than - much of the quantitative information. Critics have less solid ground to stand on when attacking qualitative records of change than those that claim quantitative precision
Taken into account. Text revised

Expert Review Comments on the IPCC WGI AR5 First Order Draft -- Chapter 5
Do not Cite, Quote or Distribute Page 28 of 157
Comment No
Chapter FromPage
FromLine
To Page
To Line Comment Response
(e.g. Hockey Stick controversy, etc.) [Jay Curt Stager, United States of America]
5-307 5 6 9 5 10 A reference or website address is needed to let readers find more information about the PMIP project. [Yueh-Hsin Lo, Taiwan R.O.C.]
Taken into account. Text revised
5-308 5 6 9 6 10 "making use of standardized simulations such as those coordinated within the Paleoclimate Modelling Intercomparison Project (PMIP)". The emphasis on PMIP is questionable since it deals with only time slice experiments. Also conceptually, the models are pretty similar and may not reflect the all possible approaches. Theoretical and conceptual models are not mentioned at all. [Gerrit Lohmann, Germany]
Noted
5-309 5 6 10 6 10 Give a reference for the PMIP ? [Bernard De Saedeleer, Belgium] Taken into account. Text revised
5-310 5 6 12 6 12 remove one "for" [Sophie Bonnet, Canada] Editorial
5-311 5 6 12 6 12 for' is redundant [Zhaomin Wang, UK] Editorial
5-312 5 6 12 Delete word "for" at end of line [Dunia H. Urrego, France-USA] Editorial
5-313 5 6 13 6 13 "middle Pliocene (since approximately 3 Ma)". 3 Ma is upper to late Pliocene, not middle Pliocene (see earlier comment for page 17 line 3). [Andrew Glikson, Australia]
Accepted - text revised
5-314 5 6 15 6 15 Please cite the relevant chapters, AR4 is almost 3000 pages big! [Andreas Fischlin, Switzerland] Noted
5-315 5 6 15 6 15 "Paleoclimatic methods were covered in AR4 and only new proxies or methods are addressed here." The statement is not acceptable since one cannot expect from the reader to go through the old AR4. The statement shall be made more specific. [Gerrit Lohmann, Germany]
to be discussed
5-316 5 6 15 6 15 It is stated that "... only new proxies or methods are addressed here." However, the rapidly growing field of scleroclimatology is not discussed in this chaper. Since AR4, researchers have applied the principles of dendrochronology to absolutely date the annual growth increments in several different types of marine shell. They have investigate the association with SSTs etc. Representative papers: Butler P.G., Richardson C.A., Scourse J.D., Wanamaker Jr A.D., Shammon T.M. and Bennell J.D. Marine climate in the Irish Sea: analysis of a 489-year marine master chronology derived from growth increments in the shell of the clam Arctica islandica. Quaternary Science Reviews 29, 1614–1632, 2010 AND Wanamaker A.D. Jr, Kreutz K.J., Schöne B.R. and Introne D.S. Gulf of Maine shells reveal changes in seawater temperature seasonality during the Medieval Climate Anomaly and the Little Ice Age. Palaeogeography, Palaeoclimatology, Palaeoecology 302, 43-51, 2011. As this is a novel development, it seems appropriate to discuss in a new sub-section. [Iain Robertson, UK]
to be discussed. May be a few words in the introduction regarding general issues raised in these cmments
5-317 5 6 18 6 18 insert 'Section' before 5.3 and 5.4 [Peter Burt, UK] Editorial
5-318 5 6 18 6 18 Here you are already a bit more specific than in the ES, but guidance is still insufficient. See my corresponding previous comment. [Andreas Fischlin, Switzerland]
Noted
5-319 5 6 21 6 21 Would "…past climate variability." be better than "…past climate anomalies."? Surely periods of stability are also interesting. [Andrew Russell, United Kingdom of Great Britain & Northern Ireland]
Noted
5-320 5 6 30 6 30 "Supplementary"? Better would be appendix, since supplementary would perhaps mean that only available via the web. A dangerous route to go for IPCC I would suggest to reconsider and better avoid. [Andreas Fischlin, Switzerland]
Noted and taken into account in the revised text
5-321 5 6 31 6 31 Perhaps change "to this chapter into "to Section 5.5" ? [Bernard De Saedeleer, Belgium] Noted
5-322 5 6 33 6 33 Anomalies are not the same as abrupt CC! Please reformulate. [Andreas Fischlin, Switzerland] Noted
5-323 5 6 33 6 35 Hysteresis effects might be as important on a human time scale, but do not imply irreversibility per se. Please consider and reformulate sentence. [Andreas Fischlin, Switzerland]
Taken into account. Text modified.

Expert Review Comments on the IPCC WGI AR5 First Order Draft -- Chapter 5
Do not Cite, Quote or Distribute Page 29 of 157
Comment No
Chapter FromPage
FromLine
To Page
To Line Comment Response
5-324 5 6 37 6 39 An explanation of what is considered as a forcing and a feedback in this chapter would be welcome. Refer to the box ? [PASCALE BRACONNOT, France]
Taken into account. Text modified.
5-325 5 6 37 7 49 To be frank, up to here from begin of this section I am a bit at a loss, because it became not clear why the authors discuss all this otherwise great material. Neither is a clear relationship to our improved understanding of past climate changes established (nor would it be obvious), nor do authors address the issue whether the discussed periodicities are currently possibly affecting climate variability as observed in the instrumental period, a most critical issue IPCC ought to address. See also the tiresome debate on an allegedly currently cooling Earth. Please make this connection at the end of this section by adding an approprate para or at least a cross-reference to a discussion/synthesis of what is introduced here further down. [Andreas Fischlin, Switzerland]
Taken into account. Text modified.
5-326 5 6 37 10 9 It strikes me that this subchapter 5.2 is entitled "Radiative Forcings and Radiative Perturbations from Earth System Feedbacks". However, having read this section I find almost nothing on feedbacks. Again a point that also relates to my major criticism of this chapter. The structure does not make sense. With a few exceptions you do not even describe feedbacks, let alone assess their relevance for past and possibly what we can learn from that for current and future CC. While Box 5.3 Figure 1 contains a nice schematic figure on possible feedback mechanisms, that box is only cited on page 36. Far too late. I believe major feedbacks and mechanisms of Earth system responses relevant at long-term time scales need to be introduced upfront of the chapter and discussed what we learned on them since AR4. An early reference to that figure may help too. Then cross-referencing other parts of the report where such mechanisms are discussed is of course also a possibility, since of course not everything needs to be introduced in this chapter. However, I believe paleoclimatological time scales require specific discussions that may not as well be covered by other chapters focussing on the instrumental period and the near future (mostly only up to 2100). Finally, this chapter needs also to address long-term future CC beyond 2100. All these scopes are not properly introduced up to this point of the chapter. [Andreas Fischlin, Switzerland]
Taken into account. Section title and text modified.
5-327 5 6 41 6 41 Roe (2006) made a convincing case that orbital forcing is indeed causing the ice ages. He showed that the right quantity that should be compared with the insolation - i.e. the sunshine near the Arctic circle - is not the ice volume itself but its time derivative. By taking the derivative, the faster, high-frequency, short-period cycles in the ice volume are amplified while the very slow ones (100,000-year cycles) are suppressed. Gerard Roe, In defense of Milankovitch, Geophysical Research Letters, Vol. 33, L24703, doi:10.1029/2006GL027817, 2006 [Marcel Crok, The Netherlands]
Noted. However, Section 5.3.2.1 had to be shortened and does not address the methodologies used to relate orbital forcing and ice volume. Roe (2006) does not question the orbital forcing of glacial cycles.
5-328 5 6 43 6 44 In this form I consider this statement to be wrong, since too sweeping a claim. Do we understand nothing of GHG forcing? No, I wouldn't say so, despite I agree with the authors (my guess it's what they were thinking) that proxy on GHGs for the past come with more uncertainty. But then I would argue, well-known is not the right term, since authors might more have thought of precision, which is not the same. I would say we know amazingly well what the CO2 conc. might have been in the ambient air where the ice core bubbles were formed during last 800ka, don't we, to mention just one counter-example? And one counter-example is enough to falsify this sweeping claim of this statement, isn't it? Please reformulate. [Andreas Fischlin, Switzerland]
Noted - text revised
5-329 5 6 43 6 45 This sentence is true not just for te last million years but for the whole 2.6 million years of the N Hemisphere Ice Ages, as Tzedakis et al. 2009 indicate. The Also Tzedakis 2010 reference deals only with MIS 11. Suggest rewording as " Thoughout the Quaternary ice ages, previous interglacial periods were characterized by different orbital configurations making it difficult to identify a best orbital analogue to our present interglacial (Tzedakis et al., 2009; 2010). [Peter Barrett, New Zealand]
Accepted - text revised
5-330 5 6 43 6 52 The discussion would benefit from a more detailed consideration of the contrasting views over when the current interglacial will end and the problems associated with finding the most suitable analogue from past orbital alignments. This is an issue that has increasing public exposure and would perhaps benefit from treatment as a FAQ. The case could then be put for MIS11 with some consideration of MIS19 and also link in to the debate over the Ruddiman hypothesis and the nature of natural vs anthropogenic GHG levels. [Chris Caseldine, United Kingdom of Great Britain & Northern Ireland]
Taken into account - text added to section 5.3.4

Expert Review Comments on the IPCC WGI AR5 First Order Draft -- Chapter 5
Do not Cite, Quote or Distribute Page 30 of 157
Comment No
Chapter FromPage
FromLine
To Page
To Line Comment Response
5-331 5 6 43 just say "…is the only precisely calculated…" since other forcings are well-known. [Jonathan Overpeck, USA] Accepted - text revised
5-332 5 6 45 6 45 Fig. 5.1 seems not to be referenced before Fig. 5.2 : perhaps invert the order of those 2 figs ? [Bernard De Saedeleer, Belgium]
Taken into account - order of figures verified.
5-333 5 6 45 6 46 This sentence has the following misleading wording: "...affect the annual, seasonal, and latitudinal distribution and magnitude of solar energy received..." Actually the total annual insolation (linked to the eccentricity cycle) hardly varies when compared to the spatial and seasonal changes in insolation linked to precession and obliquity. Hence reword the sentence to e.g.: "predominantly affect the seasonal and latitudinal distribution of radiation at the top of the atmosphere affecting the local duration and intensity of the seasons, although there are also relatively small changes in the annual total insolation." [Graham Weedon, UK]
Taken into account - text rewritten
5-334 5 6 45 Fig.5.2 is mentioned before Fig.5.1 in the text [Elie Verleyen, Belgium] Noted
5-335 5 6 47 6 47 Milankovitch Theory first mentioned without explanation on p15, line 15. Hence p 6 line 47 add: after "Timm et al., 2008)." new sentence: "The concept that changes in Earth's climate are linked to orbital changes is now called the Milankovitch Theory." [Strictly this should be the Croll-Milankovitch Theory.] [Graham Weedon, UK]
Taken into account - text rewritten
5-336 5 6 47 6 49 While it is true that it is impossible to match perfectly the phasing and amplitude of all three astronomical parameters between two different periods, Marine Isotope sub-Stage MIS 19c represents the closest orbital analogue to the current interglacial (Tzedakis et al., 2012). Although absolute values of obliquity are different because of the amplitude modulation of obliquity, the phasing between obliquity and precession during MIS 19 is very similar to that observed in MIS 1. Moreover, the MIS 1 and MIS 19c summer insolation intensity and energy signals at 65°N are virtually indistinguishable. [Chronis Tzedakis, UK]
Taken into account - text added to section 5.3.4
5-337 5 6 47 6 49 Reference: Tzedakis, P.C., Channell, J. E. T., Hodell, D. A., Kleiven, H. F. & Skinner, L. C. (2012) Determining the natural length of the current interglacial. Nature Geoscience 5, 138-141, doi: 10.1038/NGEO1358. [Chronis Tzedakis, UK]
Editorial
5-338 5 6 49 6 49 Include a reference to the latest paper by Tzedakis et al. (2012) (Nature Geoscience doi:10.1038/ngeo1358), which identify the closest analogue to current interglacial period. [Yueh-Hsin Lo, Taiwan R.O.C.]
Editorial
5-339 5 6 49 6 52 There is no consensus model yet on how exactly orbital parameters influence ice sheet extent and thus glacial cycles [Hubertus Fischer, Switzerland]
Taken into account - text rewritten
5-340 5 6 49 6 52 "Orbital forcing is the driver of glacial-interglacial changes (high confidence) .." It is probably important, but is the driver the right wording? [Gerrit Lohmann, Germany]
Taken into account - combined with comment 342
5-341 5 6 50 The correct phrasing is that orbital forcing (better astronomical, as tilt is not orbital) is the pacemaker of g-ig change. If you write "driver" then confidence would be low to very low, as in most senses it is clearly not. [Eric Wolff, United Kingdom of Great Britain & Northern Ireland]
Accepted - text revised
5-342 5 6 51 6 51 insolation distribution : be more specific [PASCALE BRACONNOT, France] Accepted - text revised
5-343 5 6 52 6 52 "Abrupt events" of which kind? This is not good enough. [Andreas Fischlin, Switzerland] Accepted - text deleted
5-344 5 6 52 Specify what is meant here by "abrupt events." Give an example, and point out why we know that slow insolation cycles are not causing today's anthropogenic warming. [Jay Curt Stager, United States of America]
Accepted - text deleted
5-345 5 6 52 Please clarify what “abrupt events” can be explained by orbital forcing on these relatively short millennial time-scales. [Rob Wilson, United Kingdom of Great Britain & Northern Ireland]
Accepted - text deleted
5-346 5 6 54 7 50 The solar forcing section should mention the current state of understanding of galactic cosmic ray infleunces, and refer the reader to section 7.4.7 for detailed discussion. [Richard Betts, United Kingdom of Great Britain & Northern Ireland]
Taken into account - A reference to chapter 8 has been added
5-347 5 6 54 Section 5.2.1.2: this isn't really my area but is a reference to Haigh et al. (2010) "An influence of solar spectral variations on radiative forcing of climate" in Nature required here? [Andrew Russell, United Kingdom of Great Britain & Northern Ireland]
Taken into account - text added

Expert Review Comments on the IPCC WGI AR5 First Order Draft -- Chapter 5
Do not Cite, Quote or Distribute Page 31 of 157
Comment No
Chapter FromPage
FromLine
To Page
To Line Comment Response
5-348 5 6 54 Subsection 5.2.1.2 Solar Forcing: There are some interesting results from the NASA SORCE mission that indicates that the SSI at some wavelengths are out of phase with the solar cycle (Harder et al., 2009). While these results are not fully validated and are highly debated for some wavelengths, it may be appropriate to recognize in the IPCC AR5 that there are increased uncertainties in how much the SSI can vary and in a more complex way than what was considered in the IPCC AR4 . I suggest you consider the addition of the following sentence on page 7 on line 9: "Interestingly, the contrasting dark and bright solar features provide a higher TSI value during solar cycle maximum and at most wavelengths, but there is the possibility that some wavelengths are out of phase with the solar cycle to complicate the solar forcing on Earth's atmosphere (Harder et al. 2009; Haigh et al., 2010; Cahalan et al., 2010)". These references are Harder, J. W., J. M. Fontenla, P. Pilewskie, E. C. Richard, and T. N. Woods, GRL, 36, L07801, 2009; Haigh, J. D., A. R. Winning, R. Toumi, J. W. Harder, Nature, 467, 696, 2010; Cahalan, R. F., G. Wen, J. W. Harder, P. Pilewskie, GRL, 37, L07705, 2010. [Thomas Woods, USA]
Accepted
5-349 5 6 56 6 12 There are still open questions on the calibration of satellite derived TSI reconstructions. This is explained in detail in chapter 8, but in chapter 5 the uncertainties are not mentioned at all. I would suggest to mention the uncertainties in chapter 5 and refer to chapter 8 for details. [Hubertus Fischer, Switzerland]
Accepted - see comment 5-380
5-350 5 6 56 6 56 "Since AR$, models [of solar physics] (e.g....." in the context of IPCC, "models" instantly puts the reader in mind of climate models and the distinction should be made. [Tasman van Ommen, Australia]
Accepted
5-351 5 6 56 7 12 This section begs for abbreviation: the information is all nice, but the level of detail is more than needed. The key statement here is at line 5-6 "can successfully reproduce the measured TSI changes" [Tasman van Ommen, Australia]
Noted
5-352 5 6 57 6 57 11-year → 11 year [Peter Burt, UK] Editorial
5-353 5 6 57 could the authors explain a little bit what is the spectral solar irradiance? [CATHERINE BELTRAN, France] Accepted
5-354 5 7 1 need error or confidence for 0.1% and the "several percent" (which is also vague and needs a reference). [Jonathan Overpeck, USA]
Accepted - reference added
5-355 5 7 2 7 6 difficult to follow. Should be reworded [PASCALE BRACONNOT, France] Rejected - due to space limitations
5-356 5 7 5 Delete ", and" before "can successfully…" [Dunia H. Urrego, France-USA] Editorial
5-357 5 7 7 7 7 insert comma after 'features' [Peter Burt, UK] Editorial
5-358 5 7 8 7 8 "Sunspots are dark features that reduce irradiance". There appears to be a confusion or an error in this statement, which is contrasted with the definition of sun spots as follows (http://en.wikipedia.org/wiki/Sunspot): "Since sunspots are darker than the surrounding photosphere it might be expected that more sunspots would lead to less solar radiation and a decreased solar constant. However, the surrounding margins of sunspots are brighter than the average, and so are hotter; overall, more sunspots increase the Sun's solar constant or brightness." [Andrew Glikson, Australia]
Rejected - sunspots are dark compared to the solar disc and therefore reduce the solar radiation. The bright areas on the surrounding photosphere are called faculae and overcompensate the darkening effect of the sunspots.
5-359 5 7 12 7 12 Reference should be 8.3 [Bo Andersen, Norway] Accepted
5-360 5 7 14 7 14 Comment on the wording "pre-instrumental times" : "pre-satellite era" would be more appropriate because some bands of the solar spectrum can actually be reconstructed back to the early 20th century, e.g. from images in the Ca K line. Incidentally, these observations, together with some other, are being used now to reconstruct the SSI back to 1915 without using sunspot numbers. [Thierry Dudok de Wit, France]
Accepted
5-361 5 7 14 7 15 Here is another place where a brief but firm statement that "these natural processes/cycles don't explain the modern warming," along with a clear explanatory phrase or sentence, could be both appropriate and useful. In the latter example, the listing of cycles here could be part of a concise, introductory summary of all relevant paleo-cycles mentioned above [Jay Curt Stager, United States of America]
Noted
5-362 5 7 14 7 23 The most recent reconstruction by Shapiro et el. (Astronomy and Astrophysics, 2011), which displays much Noted. But Shapiro does not provide new data. This

Expert Review Comments on the IPCC WGI AR5 First Order Draft -- Chapter 5
Do not Cite, Quote or Distribute Page 32 of 157
Comment No
Chapter FromPage
FromLine
To Page
To Line Comment Response
larger variations of TSI, is not even mentioned (?). [Eduardo Zorita, Germany] reconstruction is not displayed in Figure 5.1 but is briefly mentioned in section 5.3.5 (model-data comparison) as a sensitivity study
5-363 5 7 14 7 33 The reconstruction of Shapiro et al. (2011) is not discussed while it is mentioned in chapter 10, page 53, line 40 and in the new version of the PMIP forcing (Schmidt et al. 2011, http://www.geosci-model-dev-discuss.net/4/2451/2011/gmdd-4-2451-2011.pdf, see their figure 2) where it is suggested to use it as a sensitivity study (http://www.geosci-model-dev-discuss.net/4/C1216/2011/gmdd-4-C1216-2011.pdf). A comment on this reconstruction would thus be required. [Hugues Goosse, Belgium]
Noted. But Shapiro does not provide new data. This reconstruction is not displayed in Figure 5.1 but is briefly mentioned in section 5.3.5 (model-data comparison) as a sensitivity study
5-364 5 7 15 7 15 Could the statement "...(since 1978CE)..." be expanded a little? I assume it relates to some sort of satellite instrument but this isn’t clear from the current text. [Andrew Russell, United Kingdom of Great Britain & Northern Ireland]
Accepted - text reworded
5-365 5 7 21 7 23 A comment is needed on how certain is the deatailed information provided by the isotopic records on non-solar components. [Yueh-Hsin Lo, Taiwan R.O.C.]
Rejected - The main uncertainty comes from the different model assumptions. For more details we refer to the added references.
5-366 5 7 22 7 23 These comments on cosmogenics overlook the fact that climate processes themselves also can contaminate the cosmogenic archive. Suggest "...but also the geomagnetic field intensity, climate transport modulation (Pedro et al., submitted EPSL 2011), and effects of their respective geochemical cycles." An additional statment "The influence of internal climate variability can be reduced by combining multiple 10Be records to extract the common solar signal (Pedro et al, submitted EPSL 2011). [Tasman van Ommen, Australia]
Accepted - 2 references added
5-367 5 7 23 7 23 Comment on text: An even larger uncertainty comes from our lack of understanding of the variability of the SSI, which may have a bigger impact than the TSI everyone is focusing on. [Thierry Dudok de Wit, France]
Noted - due to space limitations we cannot show the SSI. We refer the reader to section 8.3 where a more detailed discussion is given.
5-368 5 7 25 7 28 Another place where a brief but firm statement that "these natural processes/cycles don't explain the modern warming," along with a clear explanatory phrase or sentence, could be both appropriate and useful. In the latter example, the listing of cycles here could be part of a concise, introductory summary of all relevant paleo-cycles mentioned above [Jay Curt Stager, United States of America]
Noted - see FAQ 5.1
5-369 5 7 26 7 27 Comment on text: The statement "Spectral analysis reveals the existence of cycles with periodicities of 27 87, 104, 130, 208, 350, 515, and 980 years (Stuiver and Braziunas, 1993)" applies to climate records and so the connection with the Sun is at best very loose. None, or very few, of these peridocities are observed in cosmogenic (aka solar) records. The few ones are the Suess/de Vries (~220 year) and Gleissberg (~ 80-90 year) cycles, but their periodicities certainly cannot be determined in such a crisp way as the text suggests. A more relevant reference and review for these questions would be [I. G. Usoskin, A History of Solar Activity over Millennia, Living Reviews in Solar Physics, 5 (2008), pp. 3–67.] This is expressed more correctly in Section 8.3.1.3 (page 8-25). [Thierry Dudok de Wit, France]
Rejected - The spectral analysis of Stuiver and Braziunas was done for 14C from tree rings and reflects therefore primarily the cosmic ray intensity modulated by solar activity. See Steinhilber, F., et al. (2012), 9,400 years of cosmic radiation and solar activity from ice cores and tree rings, PNAS, 109(16), 5967-5971.
5-370 5 7 26 7 28 At best these cycles are quasi periodic , the period lengths give the impression these are precisely known. Even the real solar cycle varies around 11 years (9-14years). Wavelet analysis enables cycles to be picked out of data when their amplitudes change in time or (as can be seen in Fig5.1d) when cycles appear/dissappear in the data. Whilst the timeseries analysis (using wavelets or whatever) can fit psudo-cycles to the data it doesn't necessarily mean those cycles have any real physical meaning (i.e. processes combine to give the impression of a cycle at different times). It would be helpful to clarify that here. [Gareth S Jones, UK]
Rejected - see for example: Peristykh, A. N., and P. E. Damon (2003), Persistence of the Gleissberg 88-year solar cycle over the last similar to 12,000 years: Evidence from cosmogenic isotopes, Journal of Geophysical Research-Space Physics, 108(A1), art. no.-1003.
5-371 5 7 26 spectral analysis of what? Cycles of what? [Jonathan Overpeck, USA] Accepted - added "of TSI"
5-372 5 7 27 how doe these periods relate to the ones on line 49? Confusing? [Jonathan Overpeck, USA] Accepted - periodicities harmonized
5-373 5 7 28 7 30 It is important that also Shapiro et al. (2011), showing a much larger amplitude of past solar variability, is referred to here since the debate of the amplitude of the low-frequency solar variability is still ongoing. The full reference to this article is: Shapiro, A., Schmutz, W., Rozanov, E., Schoell, M., Haberreiter, M., Shapiro, A.,
Accepted - reference to Shapiro added

Expert Review Comments on the IPCC WGI AR5 First Order Draft -- Chapter 5
Do not Cite, Quote or Distribute Page 33 of 157
Comment No
Chapter FromPage
FromLine
To Page
To Line Comment Response
and Nyeki, S.: A new approach to the long-term reconstruction of the solar irradiance leads to large historical solar forcing, Astron. Astrophys., 529, D07107, doi:10.1051/0004-6361/201016173, 2011. [Fredrik Charpentier Ljungqvist, Sweden]
5-374 5 7 28 7 30 The LBB95 (Lean et al. GRL 1995) TSI reconstruction has not be "often used" for some time. The reference for Lean 1995 in this chapter is for UV difference between the MM and PD. The recommended CMIP5 TSI reconstruction should be mentioned here. [Gareth S Jones, UK]
Taken into account - wrong reference to be replaced by: Lean, J., J. Beer, and R. Bradley (1995), Reconstruction of Solar Irradiance since 1610 - Implications for Climate-Change, Geophysical Research Letters, 22(23), 3195-3198.
5-375 5 7 28 7 30 It should be mentioned what "present" means in this context (solar minimum, solar maximum, average solar activity) [Raimund Muscheler, Sweden]
Accepted - text reworded
5-376 5 7 28 7 30 Subsection 5.2.1.2 Solar Forcing: I think a brief summary of a recent important Sun-climate result belongs in this subsection. Georg Feulner's climate modeling results for the Maunder Minimum period (Feulner, G., GRL, 38, L16706, 2011) indicate that the global cooling during the Maunder Minimum is more consistent with the smaller values of the long-term TSI variations, and his results also imply that the solar cycle maximum peaks are just as important, if not more important, than the long-term (secular) trends of the TSI at its minima levels between solar cycles. I suggest the following additional sentence for possible insertion on page 7 on line 30: "Recent climate simulations of the global cooling during the Maunder minimum also support the smaller TSI difference (< 0.1%) during the Maunder minimum [Feulner, 2011], and these results also emphasize that different levels in solar cycle maxima are just as important to global temperature changes as any long-term secular trends of the solar irradiance." [Thomas Woods, USA]
Accepted
5-377 5 7 28 7 33 Shapiro et al. (Astron. Astrophys., 529, 1-8, 2011) suggest larger TSI amplitudes. Their results need to be addressed here. If not, the discussion is biased. [Anders Moberg, Sweden]
Accepted - references added.
5-378 5 7 28 need refs for the recent reconstructions [Jonathan Overpeck, USA] Taken into account - more references are given in the caption of Fig. 5.1
5-379 5 7 29 7 29 Define the time period of the Maunder Minimum here, which is the first occasion where this term appears. The definition given on p. 5-43 is 1645-1715 CE. [Anders Moberg, Sweden]
Accepted
5-380 5 7 30 7 31 Subsection 5.2.1.2 Solar Forcing: The validated lower TSI value is a very important result since the IPCC AR4. I think your last sentence can be misleading on this result, so I offer a suggested revision of the last sentence to clarify the effects of having a lower TSI value: "The effect of this difference implies 1.2 W/m^2 lower solar energy input for the global radiative energy budget (e.g., Loeb et al., 2008). However, the lower TSI value does not affect the TSI long-term variations and thus this result is not expected to be very significant for simulated climate changes (see also FAQ 5.2)." The Loeb et al. 2008 reference is Loeb, N. G., B. A. Wielicki, D. R. Doelling, G. Louis Smith, D. F. Keyes, S. Kato, DN. Manalo-Smith, T. Wong, J. Climate, 22, 748, 2008. [Thomas Woods, USA]
Accepted
5-381 5 7 30 7 33 "The effect of this difference on simulated changes is expected to be only minor (see also FAQ 5.2)." The difference between 1365.5 and 1360.8 W/m2 is not discussed in FAQ 5.2.. In addition, the difference is about 4‰ which would indeed make a difference. So I think that this discussion has to be clarified. [Raimund Muscheler, Sweden]
Accepted - sentence added
5-382 5 7 32 7 33 Also link to 8.3.1.1.1? [Gareth S Jones, UK] Accepted - link added
5-383 5 7 32 7 33 This difference is not explained in FAQ5.2 [Philip JONES, UK] Accepted - link removed
5-384 5 7 32 33 "on simulated changes"… of what???? (sentence unclear) [Masa KAGEYAMA, France] Accepted - wording changed
5-385 5 7 36 7 49 Merely an editorial comment, but I suggest panels in Figure 5.1 should follow the same sequence as the subheadings in this section here, i.e. volcanic forcing a) comes not first unless this is also the case in the text. [Andreas Fischlin, Switzerland]
Rejected - comment correct, but the proposed change would separate panels b,c, and d which form an unit
5-386 5 7 49 7 49 Figure 5.1a and caption: maybe some dashed lines at the significant periods would help, but it is not clear in Accepted - dotted lines added

Expert Review Comments on the IPCC WGI AR5 First Order Draft -- Chapter 5
Do not Cite, Quote or Distribute Page 34 of 157
Comment No
Chapter FromPage
FromLine
To Page
To Line Comment Response
the figure that these listed periodicities are all present. [Tasman van Ommen, Australia]
5-387 5 7 51 8 8 This section is too technical and/or describes merely some data. No relevance is distilled in the concept of CC. What can be learned due to the effect of volcanoe eruptions? Inasmuch do these data help to better understand past CC? If these discussions should follow below, then you need at least to cross-reference those texts. [Andreas Fischlin, Switzerland]
Taken into account. Text has been revised to stress policy relevant findings as well as connections with other AR5 sections and chapters.
5-388 5 7 51 8 8 The long term reconstructions are very welcome and are a major contribution to understanding the role of volcanos in climate. However, the implication of the figures and text are that the volcanic eruption impacts are unifrom in latitude. We know from the the more recent record (satellite era) that high latitude eruptions, which may appear very strong in ice core data, tend to be very short-lived in the stratosphere and often do not even make it into the stratosphere and are almost exclusively locked into the hemisphere in which they occur. On the other hand, low latitude eruptions may (but not always) fill the tropical pipe and may persist as a distinct phenomena to more than 10 years. This should live to a latitudinally dependent climate forcing that could yield significantly different impact than a uniform impact. Do these models consider such an impact, does it matter to climate understanding? I am uncomfortable with ice-based reconstructions since they (to my knowledge with I admit is limited) can not distinguish the difference in the climatic importance of a primarily tropospheric and/or high latitude (and very short lived) event and a much longer-lived tropical event without modelling the processes by which the aerosol is removed. Is this a feature of these reconstructions? This will be difficult without knowing the altitude of the injection (which is pretty speculative prior to the 19th centruy at best and the 1960s for the cautious) and with a model that can't produce a tropical reservoir and latitudinal transport. [Larry Thomason, United States of America]
Taken into account. Reconstructions based on a network of ice core data from Greenland and Antarctica account for high latitude versus low latitude eruptions. Explanations for the methods can be found in Gao et al (2008) and Crowley and Unterman (2012). Text has been modified.
5-389 5 7 51 Subsection 5.2.1.3 Volcanic Forcing: This subsection seems to lack specific results / conclusions as desired for the IPCC report: e.g. numerical results of volcanic forcing and how the new results on volcanic forcing compare to AR4 results. The other subsections in Section 5.2 provide very good summaries of their new results and comparison to AR4 results, so I suggest you consider the style of those subsections as ideas on how to improve this Volcanic Forcing subsection. As one suggestion to improve this subsection, the last sentence of this subsection could be expanded by adding " and they found that the volcanic forcing can be as large as -20 W/m^2 over a period of a couple years". [Thomas Woods, USA]
Taken into account. Text has been modified and also refers to Chapter 8 for radiative forcing estimates.
5-390 5 7 57 check status of reference Crowley and Unterman, has to be peer reviewed and available [Hubertus Fischer, Switzerland]
Noted. The manuscript is under review.
5-391 5 7 58 NO estimate of uncertainty available for volcanic reconstruction: It is a strange place for it, but my climate sensitivity paper Hegerl et al. 2006, has one in the supplement, an estimate of the uncertainty in the Crowley reconstruction. If I remember right, order 50% for individual eruption strength, and much less for the amplitude of the entire reconstruction. We needed this as it was propagated through the estimation. I can send details (sorry rushed review but can help if you want me to) [Gabi Hegerl, UK]
Taken into account. The reference is cited in the revised text.
5-392 5 8 4 8 5 "not taken into account in the two available reconstructions." - I think the Crowley reconstruction does take this into account, but there are no observations to tell if it is correct. [Alan Robock, USA]
Taken into account. Text modified.
5-393 5 8 5 8 8 there is no statement about the results of these studies. Either mention the results or delete. [Hubertus Fischer, Switzerland]
Taken into account. Text modified.
5-394 5 8 7 8 need to add something to this sentence to say what the point is. Weak ending to a para. [Jonathan Overpeck, USA]
Taken into account. Text modified.
5-395 5 8 10 8 26 And what can we learn from this on the relevance of such forcing in the past vs. instrumental period and the future? See also my previous comment on the previous section. [Andreas Fischlin, Switzerland]
Taken into account. Text modified.
5-396 5 8 10 8 26 I am not sure why the Section "Black Carbon Aerosol Forcing" is included in section 5.2.1 as an "External Forcing", rather than in Section 5.2.2 as a "Radiative Perturbation & Earth System Feedback". Perhaps this is obvious to the climate scientist, but to me, perhaps a typical palaeo-scientist, black carbon – the fluxes of which are a function of climate, vegetation, potentially people – seems very much a dependent rather than independent variable (and therefore not "external" to the climate system...?) [Kale Sniderman, Australia]
Taken into account. Section "black carbon" removed (handled in Chapter 8)

Expert Review Comments on the IPCC WGI AR5 First Order Draft -- Chapter 5
Do not Cite, Quote or Distribute Page 35 of 157
Comment No
Chapter FromPage
FromLine
To Page
To Line Comment Response
5-397 5 8 10 8 26 The structure of the Section,"Black Carbon Aerosol Forcing", could be improved. For example, it is logical to describe current knowledge of the history of biomass burning, at global scale. However, if there is a perceived need to also describe trends in biomass burning at regional scales, then the reader would expect this to be done even-handedly and to include discussion of the differences/similarities of the fire records from various continents. However, the sentences about increased fire at the Pleistocene/Holocene transition in North America, and about a declining trend in Hudson Bay sediments [lines 14-17], are the only attempts to discuss biomass burning changes at regional scale. Hence, a change might be made to either (1) expand these two sentences, into a longer, more balanced discussion of all known LGM-Holocene continental fire histories; or (2) make it clearer how these North American fire records are uniquely relevant for understanding the past role of biomass burning as a radiative feedback, if it is thought that they are indeed uniquely relevant; or (3) omit this material about North America. [Kale Sniderman, Australia]
Taken into account. Section "black carbon" removed (handled in Chapter 8)
5-398 5 8 10 8 26 In the Section "Black Carbon Aerosol Forcing", atmospheric Black Carbon (BC) is implicitly treated as synonymous with all other products of biomass burning, and a number of palaeo-charcoal records or summary papers are discussed as if they constitute evidence for the history of atmospheric BC concentrations. Black Carbon is not defined in Chapter 5, but the Section heading ("...Aerosol Forcing"), as well as discussion of BC in Chapters 7 and 8, indicate that AR5 use of the term BC refers exclusively to particle sizes of <1µm, or even <<1µm/ If so, it may be worthwhile to explicitly define BC, because uses of the term elsewhere [e.g., Forbes et al., 2006, "Formation, transformation and transport of black carbon (charcoal) in terrestrial and aquatic ecosystems", Science of the Total Environment 370:190] embraces all particle sizes (aerosols up to macroscopic charcoal particles.) However, the palaeo-records cited in this Section are concerned only with what paleoecologists call "macro-charcoal" (typically particles >125µm diameter) or with "pollen-slide charcoal" (typically 10-125µm diameter). Hence even the smallest pollen-slide charcoal is at least an order of magnitude larger than the largest typical BC aerosol (~0.1-0.5 µm?) thus with much shorter horizontal and vertical dispersal properties and atmospheric residence times. Hence, to what extent can paleo-charcoal records confidently be interpreted in terms of past radiative contributions of aerosol-sized BC? Perhaps temporal changes in the production of 10µm-1000µm diameter sedimentary charcoal do correlate strongly with production of aerosol BC, and perhaps palaeo-charcoal records are a good proxy for past aerosol BC; but I am aware of no publications that demonstrate a link between BC and what palaeoecologists routinely measure as "charcoal". If the authors are aware of such a link, they should probably cite it early in this paragraph. [Kale Sniderman, Australia]
Taken into account. Section "black carbon" removed (handled in Chapter 8)
5-399 5 8 10 8 26 Section 5.2.1.4 The reasons for the fluctuations of the black carbon in the deposits should be more systematically explained. Some editing of this part is necessary. [Olga Solomina, Russian Federation]
Taken into account. Section "black carbon" removed (handled in Chapter 8)
5-400 5 8 16 8 16 Holocene decline of what? [Olga Solomina, Russian Federation] Taken into account. Section "black carbon" removed (handled in Chapter 8)
5-401 5 8 16 8 17 Hudson Bay record of fire. I am curious as to why this sentence and reference is included. This is one record out of 100s that have been produced. Why was this one record selected? The other references in the section refer to results from a global database, and that seems more reasonable. Further, I seriously doubt that the small change in summer insolation over this time period could directly affect changes in fire regime. Fire regime is determined by vegetation type, by time since the last fire (fuel load), and by present and precedent weather and climate, especially precipitation, etc. These seem more important than a direct response to changes in insolation, which your sentence seems to imply. [Konrad Gajewski, Canada]
Taken into account. Section "black carbon" removed (handled in Chapter 8)
5-402 5 8 17 8 19 Specify how "...its variations are mostly driven by precipitation." Does it become drier when it becomes warmer, or vice versa? [Jay Curt Stager, United States of America]
Taken into account. Section "black carbon" removed (handled in Chapter 8)
5-403 5 8 20 8 20 superscript 'th' (x2) [Peter Burt, UK] Rejected (see style guide)
5-404 5 8 24 8 25 "Two recent Antarctic ice cores indicate a large scale black carbon concentration decrease in the second half of the 25 20th century following grass fire and biofuels emission reductions". Bowman et al. 2006 (Fire in the Earth system, Science 324, 481, see figure 1) does not show significant decrease in fires during the last 100 years. [Andrew Glikson, Australia]
Taken into account. Section "black carbon" removed (handled in Chapter 8)

Expert Review Comments on the IPCC WGI AR5 First Order Draft -- Chapter 5
Do not Cite, Quote or Distribute Page 36 of 157
Comment No
Chapter FromPage
FromLine
To Page
To Line Comment Response
5-405 5 8 25 8 26 20th century → 20th Century [Peter Burt, UK] Rejected (see style guide)
5-406 5 8 26 8 26 Black carbon and particulates also mentioned in Chapter 2 [Peter Burt, UK] Taken into account. Section "black carbon" removed (handled in Chapter 8)
5-407 5 8 30 8 30 This level of title does not appears in the TOC: but I would advise to include it, as they are not so many. [Bernard De Saedeleer, Belgium]
Noted. The section title has been revised to be more explicit about its content.
5-408 5 8 32 8 44 The conclusion that "Current … rates of increase are not encountered in ice core records over the last 800 kyr" is irrelevant (wrt "rates of increase") as the present and paleo rates cannot be compared. The latter follows from the opening statement "… provides a direct, albeit low-pass filtered ... record". [Tor Eldevik, Norway]
Taken into account. Assessment reformulated.
5-409 5 8 34 8 34 Merely editorial: Inconsistent format for references to other parts of AR5. (e.g. lines 25-26 vs. line 34) [Andreas Fischlin, Switzerland]
Accepted. References formatted.
5-410 5 8 35 8 35 Siegenthaler et al., 2005 was available for AR4 (10+2 times cited by WGI+II), not really new. Or give perhaps a hint why you believe it to be so important to cite it once more in this context. [Andreas Fischlin, Switzerland]
Accepted. New references cited.
5-411 5 8 35 Meure should be Macfarling Meure. Also for N2O, the correct references would be two papers by Schilt. [Eric Wolff, United Kingdom of Great Britain & Northern Ireland]
Taken into account. Reference modified and other references added.
5-412 5 8 36 8 36 Is "…throughout the pre-industrial period." exact enough? Is this variability only referring to the pre-industrial period in the Holocene or do the data go back further? [Andrew Russell, United Kingdom of Great Britain & Northern Ireland]
Taken into account. The statement is related to high resolution records, mostly available for the late Holocene. Text has been modified.
5-413 5 8 39 8 42 The ice core CO2 concentration represents a weighted average of concentration over several hundred years (air bubble closure time). It is technically incorrect to compare several hundreds year average with the current instrumental annual measurements. The cited ice core value of 300 ppm is a several hundred year average – we can be sure that annual values went far below as well as far above 300 ppm within averaging time of several hundred years. If the CO2 went to 400 ppm and stayed there for a hundred years and then went to 200 ppm for another hundred years, we still would just see 300 ppm average in air sample. If you want to be honest with policymakers and general public, this should be brought to their attention. Same applies to concentrations of other gases deduced from ice core air bubbles. [Petr Chylek, USA]
Taken into account. The statement has been modified.
5-414 5 8 41 8 42 Here is a good example of the type of well-timed, informative summary statement linking past and present conditions that should be used even more frequently throughout the text. Breaking the paragraph here or (better yet) moving the statement up to the top of the section to be followed by the paleo evidence for it, would make it stand out more strongly. [Jay Curt Stager, United States of America]
Noted.
5-415 5 8 41 8 43 This sentence is the kind of statements that make all other elaborations very pertinent. They are lacking in previous paras. I say this not only to laud the authors, but most of all to let you know how I see you could improve above texts and respond to the critique I made there. [Andreas Fischlin, Switzerland]
Noted.
5-416 5 8 41 8 43 Joos and Spahni did not say that these concentrations and rates of increase have not been seen for 800 kyr, because they were correctly cautious because of resolution issues. You need to be equally cautious. Something like "No concentrations comparable to current ones are observed over 800 kyrs, though resolution deeper in the ice precludes absolute certainty that such concentrations did not occur. It can be said that such concentrations and rates of increase did not occur in the last 22 kyr (check), and are unlikely in the last 800 kyr. [Eric Wolff, United Kingdom of Great Britain & Northern Ireland]
Taken into account. Text modified for consistency with Joos and Spahni (2008).
5-417 5 8 43 8 43 GHG → GHGs [Peter Burt, UK] Noted.
5-418 5 8 43 8 44 change to: " The long CO2 record shows clear glacial/interglacial cycles with substantially higher interglacial CO2 and CH4 concentrations in the ice core record after the Mid Brunhes event (430,000 yrs BP) than before." [Hubertus Fischer, Switzerland]
Taken into account. Text modified.
5-419 5 8 44 8 44 Editorial: Too long para. Perhaps make a new one here (between these two sentences)? [Andreas Fischlin, Accepted.Text split into several paragraphs.

Expert Review Comments on the IPCC WGI AR5 First Order Draft -- Chapter 5
Do not Cite, Quote or Distribute Page 37 of 157
Comment No
Chapter FromPage
FromLine
To Page
To Line Comment Response
Switzerland]
5-420 5 8 45 8 45 define/quantify high resolution [Peter Burt, UK] Taken into account. Data resolution explicitely mentioned in the revised text.
5-421 5 8 45 8 45 delete comma after CH4 [Peter Burt, UK] Noted. Text revised.
5-422 5 8 49 8 49 Editorial: Too long para. Perhaps make a new one here (between these two sentences)? [Andreas Fischlin, Switzerland]
Accepted.Text split into several paragraphs.
5-423 5 8 51 8 51 “was” should be “have been”. [Eelco Johan ROHLING, United Kingdom of Great Britain & Northern Ireland] Editorial.
5-424 5 8 52 8 52 “carbon enriched” needs to be hyphenated. [Eelco Johan ROHLING, United Kingdom of Great Britain & Northern Ireland]
Editorial.
5-425 5 8 52 add reference on d13CO2: Schmitt, J., Schneider, R., Elsig, J., Leuenberger, D., Lourantou, A., Lavric, J., Chappellaz, J., Köhler, P., Joos, F., Stocker, T. F., Leuenberger, M., and Fischer, H. (2011). Quantitative carbon isotopic constraints on the deglacial CO2 rise from ice cores, Science, 2012 (submitted). [Hubertus Fischer, Switzerland]
Accepted.
5-426 5 8 53 8 54 Recent authors have suggested that there was a large change in peat C uptake during the Holocene (Yu et al 2010), which then requires a release of terrestrial C to balance 13C. I am not sure this is right, but it probably has to be mentioned. [Eric Wolff, United Kingdom of Great Britain & Northern Ireland]
Taken into account. Open debate on the causes of Holocene CO2 changes briefly mentioned.
5-427 5 8 55 8 55 Editorial: Too long para. Perhaps make a new one here (between these two sentences)? [Andreas Fischlin, Switzerland]
Accepted.
5-428 5 8 55 8 57 Add reference to Singarayer et al 2011, Nature 470, 82-85 [Eric Wolff, United Kingdom of Great Britain & Northern Ireland]
Accepted
5-429 5 8 57 9 1 "GHG isotopes in ice cores also confirm the anthropogenic origin of the current GHG increase". Specify which particular isotopes. [Andrew Glikson, Australia]
Taken into account. The new text refers to isotopes of CH4 and CO2.
5-430 5 8 57 9 2 This statement is somewhat 'throw-away'. Ideally it needs a paragraph to explain what is meant here. At least another sentence to explain the importance of the isotopes [Mark Siddall, UK]
Taken into account. Text modified
5-431 5 9 1 9 1 Oh, BTW, there is something important I have to say! ;-) Please drop "also" from this sentence. [Andreas Fischlin, Switzerland]
Taken into account. Text modified
5-432 5 9 1 9 2 According to the citations it seems you were here only thinking of CH4 and not GHGs in general. In my opinion this is first of all missing out on an important opportunity (see my previous comment) and 2ndly misleading if one writes "GHG" and means only CH4. Finally, the reference Ferretti is not new and was prominently cited in AR4. Finally I suggest to add here other works, i.e. e.g. Elsig et al., 2009, Lüthi et al., 2008, or Fischer et al., 2008? Cited References: ------------------------ Elsig, J., Schmitt, J., Leuenberger, D., Schneider, R., Eyer, M., Leuenberger, M., Joos, F., Fischer, H., & Stocker, T. F., 2009. Stable isotope constraints on Holocene carbon cycle changes from an Antarctic ice core. Nature, 461(7263): 507-510. http://dx.doi.org/10.1038/nature08393 El045 Fischer, H., Behrens, M., Bock, M., Richter, U., Schmitt, J., Loulergue, L., Chappellaz, J., Spahni, R., Blunier, T., Leuenberger, M., & Stocker, T. F., 2008. Changing boreal methane sources and constant biomass burning during the last termination. Nature, 452(7189): 864-867. http://dx.doi.org/10.1038/nature06825 Fi136 Lüthi, D., Le Floch, M., Bereiter, B., Blunier, T., Barnola, J. M., Siegenthaler, U., Raynaud, D., Jouzel, J., Fischer, H., Kawamura, K., & Stocker, T. F., 2008. High-resolution carbon dioxide concentration record 650,000-800,000 years before present. Nature, 453(7193): 379-382. http://dx.doi.org/10.1038/nature06949
Taken into account. Text modified.

Expert Review Comments on the IPCC WGI AR5 First Order Draft -- Chapter 5
Do not Cite, Quote or Distribute Page 38 of 157
Comment No
Chapter FromPage
FromLine
To Page
To Line Comment Response
Lu087 [Andreas Fischlin, Switzerland]
5-433 5 9 4 9 43 This chapter is well written and mostly reflects our current best estimates of CO2 during the Cenozoic. I would only recommend a few changes in the text and the data used for Figure 5.2: [Baerbel Hoenisch, USA]
Noted
5-434 5 9 4 9 43 Line 15: Hemming & Hanson 1992 never suggested the reconstruction of atmospheric CO2 from d11B. Foster 2008 was one of the later users of the pairing of pH from d11B with alkalinity to estimate CO2 but the first to introduce this method were Sanyal et al. (1995, Nature 373, p.234-236) and Pearson and Palmer (2000, Nature 406, p.695-699) and those two studies would be more appropriate to cite here than Hemming & Hanson (1992) and Foster (2008). [Baerbel Hoenisch, USA]
Accepted - Text revised
5-435 5 9 4 9 43 Line 19: insert “of to “…a range geological records…” [Baerbel Hoenisch, USA] Accepted - Text revised
5-436 5 9 4 9 43 Line 31: delete “in” from “…within in the range…” [Baerbel Hoenisch, USA] Editorial
5-437 5 9 4 9 43 Line 40: replace Pacific by Atlantic [Baerbel Hoenisch, USA] Editorial
5-438 5 9 4 10 40 This chapter is clearly focused on the recent geological times (not older than the Pliocene), the authors shouldn't add this discussion about the climate back to the Eocene because it's not the subject and it makes things more difficult to follow. However, a distinct chapter exclusively dedicated to the past climatic (pre-Pliocene) archives would be interesting. [CATHERINE BELTRAN, France]
Noted - this chapter does include the Eocene where relavant
5-439 5 9 6 9 6 “on” should be “about”, and “concentration” should be “concentrations” [Eelco Johan ROHLING, United Kingdom of Great Britain & Northern Ireland]
Editorial
5-440 5 9 6 Geological proxies provide indirect estimate of atmospheric CO2 concentrations on timescales beyond the ice core records which indicate comparable or much high atmospheric CO2 concentrations than today. [Christian Ohneiser, France]
Noted
5-441 5 9 9 Remove .. but with less precision and accuracy...'and place in following sentence…. [Christian Ohneiser, France]
Noted
5-442 5 9 10 9 10 "against modern systems": do you mean "against modern measurement systems" ? [Bernard De Saedeleer, Belgium]
Accepted - Text revised
5-443 5 9 10 Geological CO2 proxies are less precise and less accurate than the ice core records, however, there is good agreement between ice core CO2 records and those from the geological record (Figure 5.2). Terrestrial proxies are based on…. [Christian Ohneiser, France]
Noted
5-444 5 9 14 9 15 do you mean "B isotope...for ocean pH, assuming alkalinity can be estimated"? The current wording implies that one measurement can give both pH and alkalinity which is wrong. [Eric Wolff, United Kingdom of Great Britain & Northern Ireland]
Accepted - Text revised
5-445 5 9 15 It seems strange to cite a 2008 paper to describe the old science of the AR4 [Christopher Brierley, UK] Accepted - Text revised
5-446 5 9 19 9 19 After "..to a range.." add "of" [Peter Barrett, New Zealand] Editorial
5-447 5 9 19 9 19 "of" missing in "to a range geological records" [Andreas Fischlin, Switzerland] Editorial
5-448 5 9 19 9 19 Change "range" by "a wider range of". [Yueh-Hsin Lo, Taiwan R.O.C.] Editorial
5-449 5 9 19 change "range" to "range of" [Alan Robock, USA] Editorial
5-450 5 9 19 add “of” between “range” and “geological” [Franco Talarico, Italy] Editorial
5-451 5 9 20 9 22 Fig 5.2 shows the "significant degree of variation between the different techniques " in line 21 applies most to the distant past in contrast to the relative consistency in the last 4 Ma. Suggest adding after "..differet techniques remains" the words "for the distant past". [Peter Barrett, New Zealand]
Accepted - Text revised
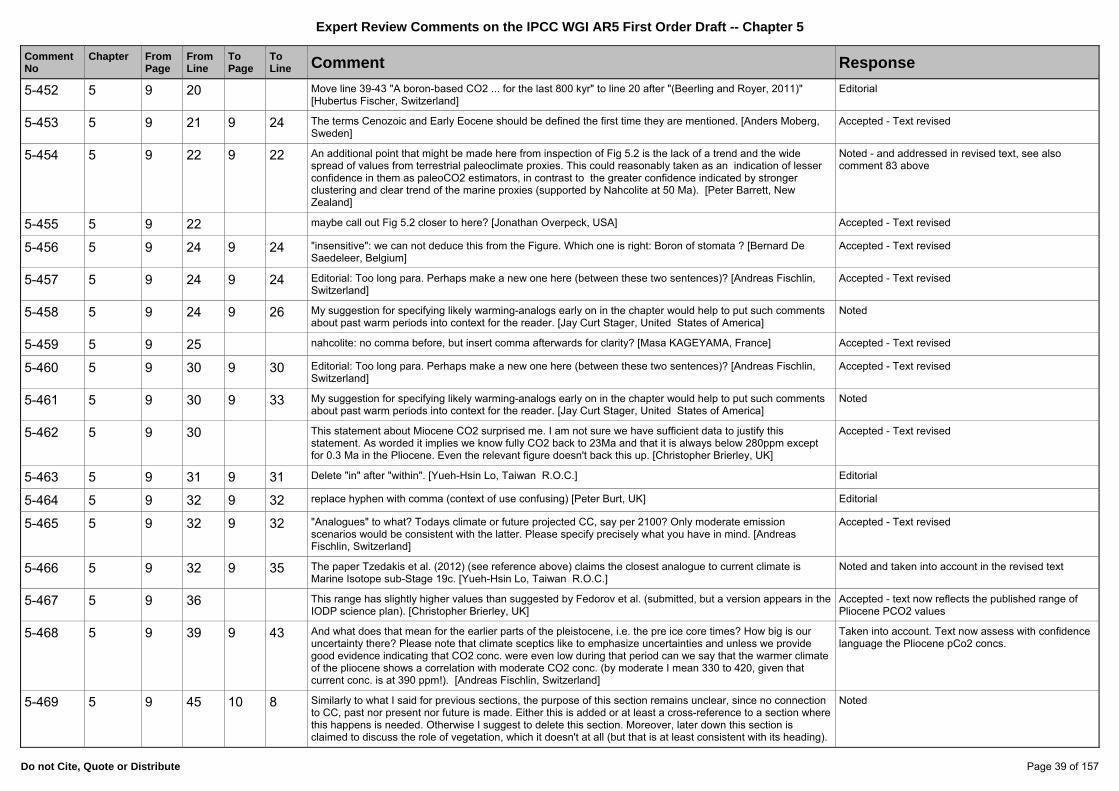
Expert Review Comments on the IPCC WGI AR5 First Order Draft -- Chapter 5
Do not Cite, Quote or Distribute Page 39 of 157
Comment No
Chapter FromPage
FromLine
To Page
To Line Comment Response
5-452 5 9 20 Move line 39-43 "A boron-based CO2 ... for the last 800 kyr" to line 20 after "(Beerling and Royer, 2011)" [Hubertus Fischer, Switzerland]
Editorial
5-453 5 9 21 9 24 The terms Cenozoic and Early Eocene should be defined the first time they are mentioned. [Anders Moberg, Sweden]
Accepted - Text revised
5-454 5 9 22 9 22 An additional point that might be made here from inspection of Fig 5.2 is the lack of a trend and the wide spread of values from terrestrial paleoclimate proxies. This could reasonably taken as an indication of lesser confidence in them as paleoCO2 estimators, in contrast to the greater confidence indicated by stronger clustering and clear trend of the marine proxies (supported by Nahcolite at 50 Ma). [Peter Barrett, New Zealand]
Noted - and addressed in revised text, see also comment 83 above
5-455 5 9 22 maybe call out Fig 5.2 closer to here? [Jonathan Overpeck, USA] Accepted - Text revised
5-456 5 9 24 9 24 "insensitive": we can not deduce this from the Figure. Which one is right: Boron of stomata ? [Bernard De Saedeleer, Belgium]
Accepted - Text revised
5-457 5 9 24 9 24 Editorial: Too long para. Perhaps make a new one here (between these two sentences)? [Andreas Fischlin, Switzerland]
Accepted - Text revised
5-458 5 9 24 9 26 My suggestion for specifying likely warming-analogs early on in the chapter would help to put such comments about past warm periods into context for the reader. [Jay Curt Stager, United States of America]
Noted
5-459 5 9 25 nahcolite: no comma before, but insert comma afterwards for clarity? [Masa KAGEYAMA, France] Accepted - Text revised
5-460 5 9 30 9 30 Editorial: Too long para. Perhaps make a new one here (between these two sentences)? [Andreas Fischlin, Switzerland]
Accepted - Text revised
5-461 5 9 30 9 33 My suggestion for specifying likely warming-analogs early on in the chapter would help to put such comments about past warm periods into context for the reader. [Jay Curt Stager, United States of America]
Noted
5-462 5 9 30 This statement about Miocene CO2 surprised me. I am not sure we have sufficient data to justify this statement. As worded it implies we know fully CO2 back to 23Ma and that it is always below 280ppm except for 0.3 Ma in the Pliocene. Even the relevant figure doesn't back this up. [Christopher Brierley, UK]
Accepted - Text revised
5-463 5 9 31 9 31 Delete "in" after "within". [Yueh-Hsin Lo, Taiwan R.O.C.] Editorial
5-464 5 9 32 9 32 replace hyphen with comma (context of use confusing) [Peter Burt, UK] Editorial
5-465 5 9 32 9 32 "Analogues" to what? Todays climate or future projected CC, say per 2100? Only moderate emission scenarios would be consistent with the latter. Please specify precisely what you have in mind. [Andreas Fischlin, Switzerland]
Accepted - Text revised
5-466 5 9 32 9 35 The paper Tzedakis et al. (2012) (see reference above) claims the closest analogue to current climate is Marine Isotope sub-Stage 19c. [Yueh-Hsin Lo, Taiwan R.O.C.]
Noted and taken into account in the revised text
5-467 5 9 36 This range has slightly higher values than suggested by Fedorov et al. (submitted, but a version appears in the IODP science plan). [Christopher Brierley, UK]
Accepted - text now reflects the published range of Pliocene PCO2 values
5-468 5 9 39 9 43 And what does that mean for the earlier parts of the pleistocene, i.e. the pre ice core times? How big is our uncertainty there? Please note that climate sceptics like to emphasize uncertainties and unless we provide good evidence indicating that CO2 conc. were even low during that period can we say that the warmer climate of the pliocene shows a correlation with moderate CO2 conc. (by moderate I mean 330 to 420, given that current conc. is at 390 ppm!). [Andreas Fischlin, Switzerland]
Taken into account. Text now assess with confidence language the Pliocene pCo2 concs.
5-469 5 9 45 10 8 Similarly to what I said for previous sections, the purpose of this section remains unclear, since no connection to CC, past nor present nor future is made. Either this is added or at least a cross-reference to a section where this happens is needed. Otherwise I suggest to delete this section. Moreover, later down this section is claimed to discuss the role of vegetation, which it doesn't at all (but that is at least consistent with its heading).
Noted

Expert Review Comments on the IPCC WGI AR5 First Order Draft -- Chapter 5
Do not Cite, Quote or Distribute Page 40 of 157
Comment No
Chapter FromPage
FromLine
To Page
To Line Comment Response
[Andreas Fischlin, Switzerland]
5-470 5 9 45 10 8 Overall fairly shallow. Just emphasize that there is not much data or agreement between records. Emphasize radiative forcing estimates. [Christian Ohneiser, France]
Noted
5-471 5 9 45 10 8 section 5.2.2.3. Here you may be interested in a new comparison of records (including new records) of dust flux from major dust source regions compared with the Antarctic deposition record (Roberts et al., 2011). These comparisons clearly show that ablation was not a simple function of (high) glacial to (low) interglacial contrasts, but that there are great temporal and spatial complexities to be accounted for, for which there is not enough data coverage (so far). For example, Arabian and Chinese loess plateau source variabilities seem to have been rather similar to each other, but Saharan variability was very different, and potentially even different between the western and eastern Sahara. (Roberts, A.P., Rohling, E.J., Grant, K.M., Larrasoana, J.C., Liu, Q., Atmospheric dust variability from major global source regions over the last 500,000 years. Quaternary Science Reviews, 30, 3537-3541, 2011). [Eelco Johan ROHLING, United Kingdom of Great Britain & Northern Ireland]
Noted.
5-472 5 9 46 9 46 First recall briefly what is MDA ? [Bernard De Saedeleer, Belgium] Noted but the text clearly relates dust with MDA.
5-473 5 9 47 9 47 Quantify 'large' - something like six orders of magnitude? [Mark Siddall, UK] Noted, text modified.
5-474 5 9 48 9 48 "stadial" is a candidate for the glossary [Andreas Fischlin, Switzerland] Noted
5-475 5 9 49 9 49 "interstadial" is even more so a candidate for the glossary [Andreas Fischlin, Switzerland] Noted
5-476 5 9 49 9 49 "Greenlandic" - better to write "Greenland" [Andrew Glikson, Australia] Editorial
5-477 5 9 50 9 50 "dust sources in Asia". The dust (loess) was derived not only from Asia but also from north Europe and north America glacial terrains. [Andrew Glikson, Australia]
Rejected. Transport of dust from Eastern Asian desert areas has been the principal provenance of dust found in the Greenland ice sheet. Dust deposited in Greenland during the LGM was found to have come all the way from eastern Asia (Biscaye et al., 1997). The Asian isotopic (Sr-Nd) field has considerable overlap with other potential source areas as North Africa and North America, but the use of mineralogical tracers, e.g. the kaolinite / chorite ratio precludes these latter as sources. Svensson et al. (2000) clearly show that Greenland dust deposited from 44 to 14 kyr B.P. derived from Eastern Asian deserts. This was determined by comparing the mineralogical and isotopic composition of ice core dust with samples taken from northern hemisphere potential source areas (PSAs),being careful to compare the same grain size fraction (smaller than 5 micron in diameter). For present-day, Bory et al. (2003) provide evidence that long-range transport from eastern Asian deserts provides mineral dust to all elevated interior sites (Dye 3, Site A, GRIP, and NorthGRIP), while most sites located located closer to the margin of the ice sheet at lower altitude (Hans Tausen and Renland) receive dust from proximal source regions. African and North American deserts do not play a significant role in the dust deposited over Greenland.
5-478 5 9 51 9 51 The sentence needs to identify the other party (suggested here in CAPS) in the strong coherence eg "A strong Taken into account. Sentence modified.

Expert Review Comments on the IPCC WGI AR5 First Order Draft -- Chapter 5
Do not Cite, Quote or Distribute Page 41 of 157
Comment No
Chapter FromPage
FromLine
To Page
To Line Comment Response
coherence is observed BETWEEN DUST IN GREENLAND ICE CORES AND aeolian deposition of European loess formations" [Peter Barrett, New Zealand]
5-479 5 9 54 9 54 repkace "..increased.." by "...higher than interglacial cores..." [Peter Barrett, New Zealand] Taken into account. Sentence modified.
5-480 5 9 54 9 54 "In central Antarctica glacial MDA concentrations are increased by a factor of 50-70". Is this a general feature for glacials/stadials vs. interstadials/interglacials or in a specific transition (the former I presume). Please clarify. [Hans W Linderholm, Sweden]
Noted. Text modified.
5-481 5 9 54 9 56 Here you miss an important process and citation to: Chylek, P., G. Lesins, and U. Lohman, 2001: Enhancement of dust source area during past glacial periods due to changes in the Hadley circulation, Journal of Geophysical Research, 106, 18477-18485. [Petr Chylek, USA]
Noted. will be considered during revision
5-482 5 9 54 9 56 Why use concentration rather than dust flux, whih is more relevant for atmospheric concentration at a site like central Antarctic ones, and more comparable with what is used in marine cores. I appreciate that Lambert published as concentration, but other authors using proxies such as Ca and Fe used flux, and flux can be determiend from Lambert's data. At the very least one should say "by a factor of 70, implying a flux chnage of about factor 30". [Eric Wolff, United Kingdom of Great Britain & Northern Ireland]
Accepted. Text revised.
5-483 5 9 54 9 57 A better and more detailed description of the sources and origin of dust is needed in this paragraph. [Yueh-Hsin Lo, Taiwan R.O.C.]
Noted. Text modified but due to space limitations details are found in the cited referneces.
5-484 5 9 54 55 the increase of MDA concentration should be reported indicating the temporal interval in which the increase has been measured [Franco Talarico, Italy]
Noted but this is a general feature of glacial-interglacial changes.
5-485 5 10 1 add after "Marino et al., 2009). MDA flux records from marine sediments from the Atlantic sector of the Southern Ocean (Martinez-Garcia et al., 2011) show a glacial/interglacial decline of only a factor of 5 and may serve as first-order estimate for the changes in Patagonian dust source strength. cite: Martınez-Garcia, A., Rosell-Mele, A., Jaccard, S. L., Geibert, W., Sigman, D. M., and Haug, G. H. (2011). Southern Ocean dust–climate coupling over the past four million years. Nature 476, 312-316. [Hubertus Fischer, Switzerland]
Accepted. Text revised.
5-486 5 10 3 10 3 replace "glacial emissions" with "dust production" and replace "dust sources" with "sources in glacial times". [Peter Barrett, New Zealand]
Taken into account. Sentence modified.
5-487 5 10 3 10 3 "enhanced glacial emissions". Replace with "enhanced glacial dust release" (the term emission mostly relates to gases). [Andrew Glikson, Australia]
Taken into account. Sentence modified.
5-488 5 10 4 10 4 2-4 times' [Mark Siddall, UK] Taken into account. Sentence modified.
5-489 5 10 4 10 4 "2-4 [times] more dust" [Tasman van Ommen, Australia] Taken into account. Sentence modified.
5-490 5 10 4 10 5 After "2-4" add "times" and after "more dust" say than what . [Peter Barrett, New Zealand] Taken into account. Sentence modified.
5-491 5 10 4 10 5 "showing 2-4 more dust deposition". Over what periods of time? [Andrew Glikson, Australia] Taken into account. Sentence modified.
5-492 5 10 4 What does this sentence means? [Christian Ohneiser, France] Noted. See SOD Box 5.1 for the definition of radiative forcings, forcings and feedbacks.
5-493 5 10 6 Reword so it isn't a forcing. [Christopher Brierley, UK] Noted. See SOD Box 5.1 for the definition of radiative forcings, forcings and feedbacks.
5-494 5 10 7 10 8 I suggest citing Winckler et al 2008 Science here [Mark Siddall, UK] Rejected Winkler et al (2008) is cited in the previous paragraph.
5-495 5 10 8 add after "Yue et al., 2010). As indicated by the strong spatial heterogeneity in MDA fluxes, also its radiative forcing is subject to pronounced regional changes." [Hubertus Fischer, Switzerland]
Noted. Text modified to clarify that estimates are related to the global mean values.
5-496 5 10 10 10 26 After reporting significant progress since AR4 in developing a first order trend in paleoCO2 levels over the last 65 Ma Section 5.3 "Earth System Responses and Feedbacks.." begins by summarising ways of estimating
Noted and Taken into account. The emphasis in AR5 is on developments since AR4. We have assessed all

Expert Review Comments on the IPCC WGI AR5 First Order Draft -- Chapter 5
Do not Cite, Quote or Distribute Page 42 of 157
Comment No
Chapter FromPage
FromLine
To Page
To Line Comment Response
sea surface temperature (Table 5.2) but limits itself to presenting both SST and SAT from proxies and modelling for just 3 well studied periods in the past, one 5ºC colder than today (Last Glacial Maximum) and the others ~2ºC (warm Pliocene ~3 Ma) and ?15ºC (Early Eocene Climatic Optimum ~50Ma) warmer. This is useful because both modelling and proxies indicate polar amplification as a feature of both cooler and warmer climates, though issues remain unresolved with regard to climate sensivity between these two complementary approaches. However recent advances in two significant Earth System Responses have not been covered. They are the deep-sea temperature record and ice sheet (sea level) history. Recent work on these could usefully be set against the newly compiled Cenozoic CO2 trends along with a brief summary of Gasson et al's 2012 Reviews of Geophysics paper on uncertainties in the relationship between temperature, ice volume and sea level as an indication of our current state of knowledge. [Peter Barrett, New Zealand]
the new compilations for deep sea-temperature published since AR4 including the paper by Cramer et al. which attempts to extrat the deep ocean temperature component from the Cenozoic d18O record and now cite this work in the revised text. It is not reasonable to use deep sea temperature as a proxy for surface temperature response to pCO2 (e.g. climate sensitivity) as the reviewer suggests. We have also decided not to plot the Cenozoic deep ocean temperature curve or the d18O curve in Figure 5.1 because we did not want direct comparsions to be drawn between Cenozic pCO2 and temperature or ice volume as both records are of very different resolution and quality.
5-497 5 10 10 10 26 Deep-sea temperature is useful both as a high latitude surface temperature proxy and because it is more uniform (and hence well estimated from fewer data) than sea surface temperature. However the most reliable and long-standing proxy, del18O includes an ice volume component. AR4 presented the best del18O compilation of the time as a climate curve for comparison with a paleoCO2 compilation. A new analysis (Cramer et al., 2011, J Geophys Res-Oceans) combines the use of del18O as a temperature+ice volume proxy, Mg/Ca as a temperature proxy and backstripping the New Jersey sea level record as an ice volume proxy, to extract a robust long term deep-sea temperature trend over the last 110 Ma and sea level trends over the last 50 Ma. The approach also allows estimation of errors. The analysis indicates deep-sea temperature peaking at 14+2ºC at 50Ma, declining to 6ºC at 34Ma with a step down to 3ºC at 14Ma and to 0ºC at ~2Ma. It also indicates major ice sheet growth (50 m SLE) from around 34 Ma, expanding further at 14 and 2 Ma. Another recent paper bears on ice sheet history Wilson et al 2011, PPP, show how Antarctica was 20% larger in the latest Eocene, and so could accommodate ice sheets even larger than today's when they first became continental around 34 Ma. [Peter Barrett, New Zealand]
Noted and Taken into account see comment 496
5-498 5 10 10 11 61 High CO2 concentration worlds and temperature changes is very important, report gives good informations about that, but the other greenhouse gases such as methans, N2O, O3 ..etc is also important , chpter 6 in this report gives excellent informations about these gases, so if short sentencses about the worls changes of these gases if added here in chapter 5 it will be more benifit for whole the A5 reports, generall points, for AR5 report, all chapters ------Contributing Authors names should follow the same format as in the other chapters i.e ( name (country)), : chapter 1- 8 with country name , then chapters 9-10-11-12 with out country names, so please use same style for all chapters in the report.- ---- in general : very good report but in most of sections which AR4 coverage befor should AR5 gives flash informations about the climate changes parameters in the case of increases or decreases in both time and space doime, i.e report abstract in view pages is needed. [ALI GEATH ELJADID, LIBYA]
Noted
5-499 5 10 12 10 12 The analysis of whether a particular geologic era has been either warm or cold, is highly dependent on reconstructions of plate tectonic movements. It requires the assessment of the latitude of geologic sites which produces proxies that give climate indications and this depends on paleo-magnetization. In the last few decades, secondary magnetizations (i.e. remagnetizations) have been recognized to be a common process in different tectonic settings and much more widespread than previously thought. Sediments can undergo remagnetization later in another plate tectonic setting, obscuring the original orientation (Torsvik et al 2005, Rowan and Roberts 2008, Soto et al 2010, Font et al 2011, Liu et al 2011 etc). Obviously this requires the revisiting of numerous sites to assess if the original assumptions are correct. If, for instance Northern Canada were to be closer to the equator in the Paleocene, then no other paleoclimate explanation is required to find thermophilous fossils there. Therefore, the current assessments of early geological hot and cold periods must be considered to be uncertain and it appears that it really does not contribute anything with enough confidence to an adequate climate reconstruction of the geologic past. [Marcel Crok, The Netherlands]
Noted - Eocene reconstructions take into account paleolatitude. The revised text acknowledges different continental configurations and inferences made concerning surface temperatuures and CO2 are assessed within the known uncertainties.
5-500 5 10 12 "High CO2 Worlds and Temperature." This section may be a good place to address my recommendation for specifically listing our best analogs. The earlier in the chapter it appears, therefore, the better. But note that
Noted and Taken into account. Title of this subsection has been chnaged to refelct earth System responses.

Expert Review Comments on the IPCC WGI AR5 First Order Draft -- Chapter 5
Do not Cite, Quote or Distribute Page 43 of 157
Comment No
Chapter FromPage
FromLine
To Page
To Line Comment Response
the title as it now stands leaves out precipitation, which is just as important (as per my comments above). This is a serious oversight which is also problematic in the chapter as a whole, but it is easily addressed by shortening the title to "HIGH CO2 WORLDS" or "WARMER WORLDS OF THE PAST" and following it by subsections dealing with temperature and precipitation and ice cover separately. Be sure to organize the information according to the same geographical categories of regional descriptions for each subsection as well: global overview, then high, middle, and low latitudes. [Jay Curt Stager, United States of America]
Paleo-precip is addressed as appropriate and relevant in this Chapter
5-501 5 10 16 Global temperatures not surface temperatures. [Christopher Brierley, UK] Accepted - Text revised
5-502 5 10 19 22 section 5.3.1: this sentence can be left out [Valerie Trouet, United States] Noted
5-503 5 10 21 10 22 Assuming that calibration is correct is an important assumption. Therefore, a sentence describing the potential issues caused by this approach should be inlcuded here. [Yueh-Hsin Lo, Taiwan R.O.C.]
Accepted - Text revised
5-504 5 10 23 Delete comma before word "assessments" [Dunia H. Urrego, France-USA] Accepted - Text revised
5-505 5 10 28 10 40 Very good para. [Andreas Fischlin, Switzerland] Noted
5-506 5 10 30 10 30 "MPWP 3.3-3.0 Ma" this is not the mid-Pliocene but upper to late Pliocene (see my comment for page 17 line 3) [Andrew Glikson, Australia]
Accepted - Text revised
5-507 5 10 30 May help to define LGM again. [Christopher Brierley, UK] Noted - and LGM removed from this subsection
5-508 5 10 30 Why is the LGM discussed in the High CO2 worlds section? It was a low CO2 world. [Julia Hargreaves, Japan] Noted - and LGM removed from this subsection
5-509 5 10 34 10 34 Please give a range and not just a best estimate of +10°C, given the uncertainty. [Andreas Fischlin, Switzerland]
Accepted - Text revised
5-510 5 10 35 10 35 Define what is meant by the pre-industrial mean. [Anders Moberg, Sweden] Accepted - Text revised
5-511 5 10 35 10 36 The text here states that CO2 during EECO was above 1000 ppm [moderate confidence] , but several observations shown in Fig. 5.2 (bottom) show levels well below 1000 ppm. This needs to be addressed. [Anders Moberg, Sweden]
Accepted - Text revised
5-512 5 10 37 10 40 Readers may wonder if this suggests that a sea level rise of similar magnitude should occur if we follow a relatively moderate GHG emissions scenario leading to 2-3 degrees warming. I recommend addressing that briefly here, in a single sentence or phrase. [Jay Curt Stager, United States of America]
Noted - Addressed in irreversibility section 5.8
5-513 5 10 38 10 38 "MPWP". The warm period is in the upper to late Pliocene. The terminology needs to change or, alternatively, just specify ages without specifying epoch/period (see comment for page 17 line 3). [Andrew Glikson, Australia]
Accepted - Text revised
5-514 5 10 42 10 44 The sentence could be made clearer [Hans W Linderholm, Sweden] Noted
5-515 5 10 44 45 polar amplification is 2-3 times the global mean --> clarify sentence: Delta(T) at poles 2-3x larger than Delta(Tglobe)? [Masa KAGEYAMA, France]
Accepted - Text revised
5-516 5 10 45 10 45 Comma after “(Box 5.1.)” should be removed. [Eelco Johan ROHLING, United Kingdom of Great Britain & Northern Ireland]
Editorial
5-517 5 10 45 Remove comma after Box 5.1 [Christopher Brierley, UK] Editorial
5-518 5 10 46 10 47 "Comments on the polar amplification is suppressed in SST compred to SAT due to the presence of sea ice…". This expression is bit awkward. The suppression of polar amplification in SST is due to physical characteristics of ocean, which cannot be lower than -1.9degC. [Seong-Joong Kim, Republic of Korea]
Accepted - Text revised
5-519 5 10 46 Temperature spelt wrongly. [Christopher Brierley, UK] Editorial

Expert Review Comments on the IPCC WGI AR5 First Order Draft -- Chapter 5
Do not Cite, Quote or Distribute Page 44 of 157
Comment No
Chapter FromPage
FromLine
To Page
To Line Comment Response
5-520 5 10 47 10 52 "substantial extra trop amplification compared to multimodel mean" is apparent in Fig 5.3 only for the MPWP. The data are well within the model spread for EECO, and even below the model average for LGM. This statement needs to be more careful, and perhaps suggests that there is not as much of a weakness as you imply. I also am aware there is a submitted paper by Rohling group that looks at polar amplification in an interesting new way, and you may want to consider this for SOD. [Eric Wolff, United Kingdom of Great Britain & Northern Ireland]
Accepted - Text revised. Agree and have adjusted statement accordingly
5-521 5 10 47 49 ah, here's the point that needs to be added to the Exec Summ polar amp bullet - why it matters. Good stuff. [Jonathan Overpeck, USA]
Noted
5-522 5 10 48 10 52 However, this report should cite Huber & Caballero (2011) for why this may be less of an issue now. [Chris Colose, United States]
Noted
5-523 5 10 48 This sentence is rather confusing. Should it read global mean not multi-model mean? [Christopher Brierley, UK]
Noted
5-524 5 10 48 insert "in the reconstructions" between "land" and "compared" [Masa KAGEYAMA, France] Editorial
5-525 5 10 49 10 52 the statement is important, but I am not convinced that his paragraphe where there is a reference to LGM in a high CO2 words and temperature is at the right place. The statement is event stronger when considering wide range of periods and models. I understand that the box on polar amplification is the place were the syntheses is made, but the best place to refer to the box is to be defined. [PASCALE BRACONNOT, France]
Noted - and LGM removed from this subsection
5-526 5 10 49 This could indicate a weakness in the climate models ability to correctly simulate warmth at high latitudes under high CO2 conditions…. (this is IMPORTANT as an indicator of non-linear climate system and should be highlighted in the introduction). [Christian Ohneiser, France]
Noted
5-527 5 10 50 10 50 ..abilty to correctly simulate warmth..' → '..ability to simulate warmth correctly..' (avoids split infinitive) [Peter Burt, UK]
Editorial
5-528 5 10 50 10 52 "This could indicate a weakness in the climate models' ability to correctly simulate warmth at the higher latitudes, or it may result in part from a lack of coverage of high-latitude proxies, or uncertainties in the assumptions of the response of the proxy to temperature (Table 5.2)." Acording to Hansen et al. 2007 (Phil. Trans. R. Soc. A365, 1925–1954) the major feedback responsible for fast polar warming is the ice melt/water albedo flip, where they state: "Chief among these feedbacks is the large change in absorbed solar energy that occurs with the ‘albedo flip’ when snow and ice become wet" [Andrew Glikson, Australia]
Noted in revised text
5-529 5 10 52 10 52 The warming may not be solely based on increased CO2 levels. Knorr et al. (2011, GRL) found a warmer climate under pre-industrial CO2 levels for the Miocene. [Gerrit Lohmann, Germany]
Noted
5-530 5 10 54 10 54 delete comma after Cenozoic [Peter Burt, UK] Editorial
5-531 5 10 54 10 56 It would be good if authors would discuss more in detail the various approaches or at least refer to other parts of AR5 where climate sensitivity is discussed. Notably also what about papers such as Royer et al., 2007? Cited References: ------------------------ Royer, D. L., Berner, R. A., & Park, J., 2007. Climate sensitivity constrained by CO2 concentrations over the past 420 million years. Nature, 446(7135): 530-532. http://dx.doi.org/10.1038/nature05699 Ro174 [Andreas Fischlin, Switzerland]
Noted and Taken into account as a number of reviewers have highlighted this issue. Addressed in Box 5.1 and in text.
5-532 5 10 54 10 57 There seems to be some confusion in this paragraph between Earth system sensitivity and fast-feedback climate sensitivity; the papers cited in the first sentence are on the former, whereas the “climate model sensitivities” referred to in the second sentence are presumably the latter. I would suggest clarifying this discussion, and moving Box 5.3 up so that it is closer to this discussion. [Robert Kopp, USA]
Noted and Taken into account as a number of reviewers have highlighted this issue. Addressed in Box 5.1 and in text.
5-533 5 10 56 11 1 But are these uncertainties really so assymetrical to likely cancel each other out in approaches such as Royer et al., 2007? If authors do not agree with me, then I doubt this statement can be made in such general terms.
Noted. Text and assessment revised.

Expert Review Comments on the IPCC WGI AR5 First Order Draft -- Chapter 5
Do not Cite, Quote or Distribute Page 45 of 157
Comment No
Chapter FromPage
FromLine
To Page
To Line Comment Response
Thus improvement is needed in any case. Cited References: ------------------------ Royer, D. L., Berner, R. A., & Park, J., 2007. Climate sensitivity constrained by CO2 concentrations over the past 420 million years. Nature, 446(7135): 530-532. http://dx.doi.org/10.1038/nature05699 Ro174 [Andreas Fischlin, Switzerland]
5-534 5 10 56 You need a reference for the "high end of model sensitivities". Some of these estimated an ES sensitivity and did not have much to say about CS in the Charney sense. [Eric Wolff, United Kingdom of Great Britain & Northern Ireland]
Noted and Taken into account as a number of reviewers have highlighted this issue. Addressed in Box 5.1 and in text.
5-535 5 10 57 "low confidence" seems to be applied to all of the Cenozoic. This is misleading, no? Pliocene? Last 800 years? Best be precise. [Jonathan Overpeck, USA]
Noted and Taken into account in revised text
5-536 5 11 1 11 1 "case [of] the abrupt..." [Tasman van Ommen, Australia] Editorial
5-537 5 11 1 11 11 pb of writing? Should have a clear conclusion (using qualibrated likehood langage). [PASCALE BRACONNOT, France]
Text has been modified.
5-538 5 11 1 Delete word "also" before word "still" [Dunia H. Urrego, France-USA] Editorial
5-539 5 11 3 “Mass of carbon” not “mass carbon” [Christopher Brierley, UK] Editorial
5-540 5 11 3 Sentences reads likes an excuse to include the two citations. Perhaps you could say what the update is? [Christopher Brierley, UK]
Noted and Taken into account in revised text
5-541 5 11 6 7 Perhaps define clathrate and theromogenic? [Jonathan Overpeck, USA] Noted and Taken into account in revised text
5-542 5 11 7 11 8 In this sentence there is no mention of the potential sources of the pulse in C. These sources should be described. [Yueh-Hsin Lo, Taiwan R.O.C.]
Noted and Taken into account in revised text
5-543 5 11 8 11 11 Here is a good example of clearly spelling out a limitation of the PETM as a warming-analog; include this sort of thing more consistently for each such analog (Pliocene, Eemian, etc.). The same can be said for Page 5-12, Lines 51-52, and for Page 5-13, Lines 54-55. [Jay Curt Stager, United States of America]
Noted and Taken into account in revised text
5-544 5 11 9 No need to repeat the ranges again. [Christopher Brierley, UK] Noted and Taken into account in revised text
5-545 5 11 9 Add comma after word "present" [Dunia H. Urrego, France-USA] Editorial
5-546 5 11 10 11 11 "to derive a robust quantitative estimate of climate sensitivity from the PETM." Presumably the climate sensitivity on an ice-free Earth as before and after the PETM would have been very different from that under glacial or interglacial conditions, due to the 'albedo flip' feedback effect on the latter. [Andrew Glikson, Australia]
Noted and Taken into account in revised text
5-547 5 11 15 Should “Earths” have an apostrophe? Definitely needs a colon rather than comma after “parameters”. [Christopher Brierley, UK]
Editorial
5-548 5 11 15 Earths --> Earth's [Masa KAGEYAMA, France] Editorial
5-549 5 11 34 The 3oC value is now for late Pliocene, not early-mid. Brierley & Fedorov 2010 suggest ~4oC for 4Ma. [Christopher Brierley, UK]
Noted and taken into account. We are consistently using 2-3 degrees C for 3.3-3 Ma interval based on model and data reconstructions. For the ealier Pliocene the data density and coverage is insufficient to derive a global surface average.
5-550 5 11 37 11 38 In the caption of Figure 5.3, figure caption c) is not included. [Seong-Joong Kim, Republic of Korea] Accepted - Text revised

Expert Review Comments on the IPCC WGI AR5 First Order Draft -- Chapter 5
Do not Cite, Quote or Distribute Page 46 of 157
Comment No
Chapter FromPage
FromLine
To Page
To Line Comment Response
5-551 5 11 37 11 51 The caption for Fig. 5.3c is missing. [Anders Moberg, Sweden] Accepted - Text revised
5-552 5 11 Table 5.1: Alkenones: I consider the confidence fo productivity changes only medium [Hubertus Fischer, Switzerland]
Noted
5-553 5 11 Table 5.1: Boron isotopes. The confidence assessment is too optimistic for this method. [Hubertus Fischer, Switzerland]
Noted
5-554 5 12 7 12 7 Apparently the polar amplification is based on present observations of a stronger warming Arctic and the assumption that the Arctic was extremely cold during the Last Glacial Maximum. Concerning the first observation, I don’t see any research about the role of aircraft contrails. Especially the Arctic area is crowded with airliners, flying east-west great circles for the shortest distance. The engines are pumping tons of water into the tropopause every second. Contrails can be persistent and generate high cirrus clouds, which are believed to contribute to warming. Apparently there is no research done on this factor. [Marcel Crok, The Netherlands]
Noted and Taken into account in the revsied text. There is no robust consensus in the published lieterature on this point.
5-555 5 12 7 13 11 BOX 5.1 is very confusing. The introduction is good. Sentences are too long (9 lines!). Shorten all sentences, simplify the message and uncertainties. Reduces the number of references. Polar amplification is a credible concept (regardless of uncertainties) which must be addressed. This Box should be very clear and easy to understand. [Christian Ohneiser, France]
Accepted - Text revised
5-556 5 12 7 13 11 Box 5.1: Polar Amplification. I am not sure that this box belongs to the paleochapter. At least a half of the text here discuss general processes [Olga Solomina, Russian Federation]
Noted - It will stay in Chapter 5
5-557 5 12 7 I like the integrated instrumental to paleo nature of this box, but if space is an issue, I think the para on p 10, lines 42-52 does a very nice concise job that makes this box optional. And as I noted in my intro comments, you might want to wack out some material just to make it easier for readers to get your important policy-relevant points. And if you do include this box, make sure it all fits with other chaptes. Lots of overlap opportunity. [Jonathan Overpeck, USA]
Noted - have reduced overlap between Box 5.2 and 5.3.1
5-558 5 12 9 12 9 "greater surface temperature" : do you mean SAT and/or SST ? - Fig. 5.3c plots SAT& SST: explain if there is a difference, or unify the names? [Bernard De Saedeleer, Belgium]
Noted and Taken into account in the revsied text.
5-559 5 12 9 12 15 This paragraph gives the impression that "polar amplification" is an observed feature both of the Arctic and Antarctica in the present climate. This is misleading as it does in general not hold for Antarctica. [Tor Eldevik, Norway]
Noted and Taken into account in the revsied text.
5-560 5 12 9 12 15 You need in this para also to cross-reference the current AR5 assessment of Arctic warming trends, not only AR4 (Lemke et al., 2007). [Andreas Fischlin, Switzerland]
Noted and Taken into account in the revsied text.
5-561 5 12 9 12 38 The discussion of polar amplification in the Box should point out the differences in long-term trends (from instrumental data) between the seasons. Warming in the Arctic is mainly in the non-summer seasons. Paleo data are mostly summer responsive. Vinther et al. (2010) is important in this regard. Much of this box is not about proxy data, but probably needs the context. [Philip JONES, UK]
Noted and Taken into account in the revsied text.
5-562 5 12 10 12 12 This suggests that in terms of polar amplification the last 50 years are most important or most interesting; Chylek et al 2009 though shows that the amplification rate was much higher in the Arctic in both the 1910-1940 and in the 1940-1970 period. The factor 2 you mention here only works for the recent warming or as Chylek et al put it: The commonly held assumption of a factor of 2–3 for the Arctic amplification has been valid only for the current warming period 1970–2008. [Marcel Crok, The Netherlands]
Noted and Taken into account in the revsied text.
5-563 5 12 13 12 14 The WAIS trend of 0.1 degs is therefore NOT a polar amplification (less than global average). It would also be fair here to emphasise that East Antarctica also shows no significant warming. Even though there are likely reasons for this (mentioned later) it has to be stated that polar amplification is well-observed in the Arctic but not so far in Antarctica. [Eric Wolff, United Kingdom of Great Britain & Northern Ireland]
Noted and Taken into account in the revsied text.
5-564 5 12 14 12 15 "West Antarctic temperature also displays a warming trend of about 0.1°C per decade over the same time period (O’Donnell et al., 2010; Steig et al.,2009)." The NASA website "Satellites Confirm Half-Century of West
Noted and Taken into account in the revsied text.

Expert Review Comments on the IPCC WGI AR5 First Order Draft -- Chapter 5
Do not Cite, Quote or Distribute Page 47 of 157
Comment No
Chapter FromPage
FromLine
To Page
To Line Comment Response
Antarctic Warming" states: "West Antarctica warmed at a higher rate, rising 0.31°F (0.17°C) per decade." (http://www.nasa.gov/topics/earth/features/warming_antarctica.html) [Andrew Glikson, Australia]
5-565 5 12 14 "warming trend of about 0.1°C per decade" - this is less than the global average trend, so is the opposite of polar amplification. Furthermore, Antarctic sea ice has been increasing (Chapter 4), so how can that be if warming is amplified in the Antarctic region? Rather you have to say that both poles are quite different from each other because of their geography, and thus respond quite differently, as Chapter 4 says. [Alan Robock, USA]
Noted and Taken into account in the revsied text.
5-566 5 12 17 12 17 sentence in this line seems odd, please check sense (polar amplification in Arctic amplification?) [Peter Burt, UK]
Noted and Taken into account in the revsied text.
5-567 5 12 17 12 17 "It is not entirely clear whether the polar amplification in the Arctic amplification". There is a problem in this part of the sentence (repetition of the same word) [Andrew Glikson, Australia]
Noted and Taken into account in the revsied text.
5-568 5 12 17 12 17 I guess it should be “… polar amplification in the Arctic [delete additional amplification]…” [Hans W Linderholm, Sweden]
Noted and Taken into account in the revsied text.
5-569 5 12 17 12 17 amplification two times [Olga Solomina, Russian Federation] Editorial
5-570 5 12 17 12 17 "amplification in the Arctic [xxx amplification delete] is mainly" [Tasman van Ommen, Australia] Editorial
5-571 5 12 17 12 18 In references on line 18, please, add: Chylek, P., C. Folland, G. Lesins, and M. Dubey, 2010: Twenties century bipolar seesaw of the Arctic and Antarctic surface air temperatures, Geophysical Research Letters, 37, L08703, doi:10.1029/2010GL042793 [Petr Chylek, USA]
Noted and Taken into account in the revsied text.
5-572 5 12 17 12 18 Please take out "amplification" after "Arctic", and take out "in agreement with recent observations" [Seong-Joong Kim, Republic of Korea]
Editorial
5-573 5 12 17 12 39 I find that this paragraph is too long and doesn't make enouth reference to the past. A wider range of observation in the first part of the box would be welcome. [PASCALE BRACONNOT, France]
Noted and Taken into account in the revsied text.
5-574 5 12 17 12 39 Otherwise excellent para [Andreas Fischlin, Switzerland] Noted and Taken into account in the revsied text.
5-575 5 12 17 12 39 Should cite here also the recent work by Sukyoung Lee and colleagues looking at the relative roles of various atmospheric processes, including stationary eddy heat flux, adiabatic warming, and downward IR, in explaining observed Arctic polar amplification [Lee, S., T. T. Gong*, N. C. Johnson, S. B. Feldstein, and D. Pollard, 2011: On the possible link between tropical convection and the Northern Hemisphere Arctic surface air temperature change between 1958-2001. J. Climate, 24, 4350-4367, 2011]. Also relevant is Lee, S., Feldstein, S., Pollard, D., White, T., Do Planetary Wave Dynamics Contribute to Equable Climates?, J Climate, 24, 2391-2404. [Michael Mann, USA]
Noted and Taken into account in the revsied text.
5-576 5 12 17 12 39 Whilst I notice that Antarctic temperature trends and the SAM are dealt with in other Chapters, it still seems odd that this long paragraph is almost entirely about the Arctic. Would it be at least worth referring to recent review papers that describe and contextualise recent changes? Examples include Russell and McGregor (2010) "Southern hemisphere atmospheric circulation: impacts on Antarctic climate and reconstructions from Antarctic ice core data" in Climatic Change and Mayewski et al. (2009) "State of the Antarctic and Southern Ocean climate system" in Reviews of Geophysics. I would add a sentence on line 37 along the lines of "Similarly diverse and complex forcing mechanisms are behind the Antarctic Penisula and Western Antarctic warming trends (Mayewski et al, 2009; Russell and McGregor, 2010)." [Andrew Russell, United Kingdom of Great Britain & Northern Ireland]
Noted and Taken into account in the revsied text and will make a clear distinction between Arctic amplification processes and contemporary processes in the Antarctic. Polar amplification is defined as polar latitudinal warming at a rate greater than global average warming. This is observed in the Antarctic in paleo-reconstructions
5-577 5 12 17 12 47 Polar amplification has been found to be due in large part to solar absorption in the air, clouds, and snow by black carbon in fossil-fuel soot and biofuel soot (Jacobson, M.Z., Short-term effects of controlling fossil-fuel soot, biofuel soot and gases, and methane on climate, Arctic ice, and air pollution health, J. Geophys. Res., 115, D14209, doi:10.1029/2009JD013795, 2010) [Mark Z. Jacobson, U.S.A.]
Noted and Taken into account in the revsied text.
5-578 5 12 17 39 Laîné et al, 2009 (Journal of Climate, 22, 4621-4635) show that polar amplification for the northern Noted and Taken into account in the revsied text.

Expert Review Comments on the IPCC WGI AR5 First Order Draft -- Chapter 5
Do not Cite, Quote or Distribute Page 48 of 157
Comment No
Chapter FromPage
FromLine
To Page
To Line Comment Response
hemisphere also results from the simple fact that the fraction of land increases with latitude and that continents warm more than the oceans. I think this simple idea should be added somewhere in this paragraph [Masa KAGEYAMA, France]
5-579 5 12 17 39 this paragraph needs re-ordering. Start with the basis and progress towards the most recent refs, as they add more and more processes to explain polar amplification. In particular, I find the first sentence out of place. [Masa KAGEYAMA, France]
Noted and Taken into account in the revsied text.
5-580 5 12 17 Consider deleting word "amplification" after word "Arctic" to avoid repetition [Dunia H. Urrego, France-USA] Noted and Taken into account in the revsied text.
5-581 5 12 23 12 23 You need here also to cross-reference WGII AR4 (Rosenzweig et al., 2007), Rosenzweig et al. (2008) as well as forthcoming chapter 4 WGII AR5. Cited References: ------------------------ Rosenzweig, C., Casassa, G., Karoly, D. J., Imeson, A., Liu, C., Menzel, A., Rawlins, S., Root, T. L., Seguin, B., & Tryjanowski, P., 2007. Assessment of observed changes and responses in natural and managed systems. In: Parry, M. L., Canziani, O. F., Palutikof, J. P., van der Linden, P. J., & Hanson, C. E. (eds.). Climate change 2007: Impacts, adaptation and vulnerability. Contribution of Working Group II to the Fourth Assessment Report of the Intergovernmental Panel of Climate Change (IPCC). Cambridge University Press: Cambridge, UK. 79-131. (http://www.ipcc.ch) Ro183 Rosenzweig, C., Karoly, D., Vicarelli, M., Neofotis, P., Wu, Q. G., Casassa, G., Menzel, A., Root, T. L., Estrella, N., Seguin, B., Tryjanowski, P., Liu, C. Z., Rawlins, S., & Imeson, A., 2008. Attributing physical and biological impacts to anthropogenic climate change. Nature, 453(7193): 353-U20. http://dx.doi.org/10.1038/nature06937 Ro203 [Andreas Fischlin, Switzerland]
Noted and Taken into account in the revsied text.
5-582 5 12 25 12 25 I suggest to split here this overly long para. [Andreas Fischlin, Switzerland] Noted and Taken into account in the revsied text.
5-583 5 12 25 27 this sentence seems a little bit complicated (rephrase?) [Franco Talarico, Italy] Noted and Taken into account in the revsied text.
5-584 5 12 25 Manabe and Stouffer, 1980 Add reference to Robock (1983): Robock, Alan, 1983: Ice and snow feedbacks and the latitudinal and seasonal distribution of climate sensitivity. J. Atmos. Sci., 40, 986-997. [Alan Robock, USA]
Noted and Taken into account in the revsied text.
5-585 5 12 25 change "associated" to "is associated" [Alan Robock, USA] Noted and Taken into account in the revsied text.
5-586 5 12 25 Insert “is” before “associated” [Rob Wilson, United Kingdom of Great Britain & Northern Ireland] Noted and Taken into account in the revsied text.
5-587 5 12 27 12 28 Soden et al., 2008 This was first pointed out by Robock (1983): Robock, Alan, 1983: Ice and snow feedbacks and the latitudinal and seasonal distribution of climate sensitivity. J. Atmos. Sci., 40, 986-997. [Alan Robock, USA]
Editorial
5-588 5 12 28 Insert “is” before “associated” [Rob Wilson, United Kingdom of Great Britain & Northern Ireland] Editorial
5-589 5 12 29 12 30 "opposes surface warming at all latitudes, but less so in the Arctic". It would help if a brief explanation is given. The same applies to other statements in the report, where a brief explanation, where available, would enhance readability. [Andrew Glikson, Australia]
Noted and Taken into account in the revsied text.
5-590 5 12 30 12 30 I suggest to split here once more this overly long para. [Andreas Fischlin, Switzerland] Noted and Taken into account in the revsied text.
5-591 5 12 34 12 39 The ocean heat transport is declining in some models for the scenario integrations, right? You are picking particular studies. [Gerrit Lohmann, Germany]
Noted and Taken into account in the revsied text.
5-592 5 12 35 12 35 20th century → 20th Century [Peter Burt, UK] Rejected (see style guide)
5-593 5 12 35 12 39 In the Antarctic, polar amplification is not as abvious as that in the Arctic. [Seong-Joong Kim, Republic of Noted and Taken into account in the revsied text and
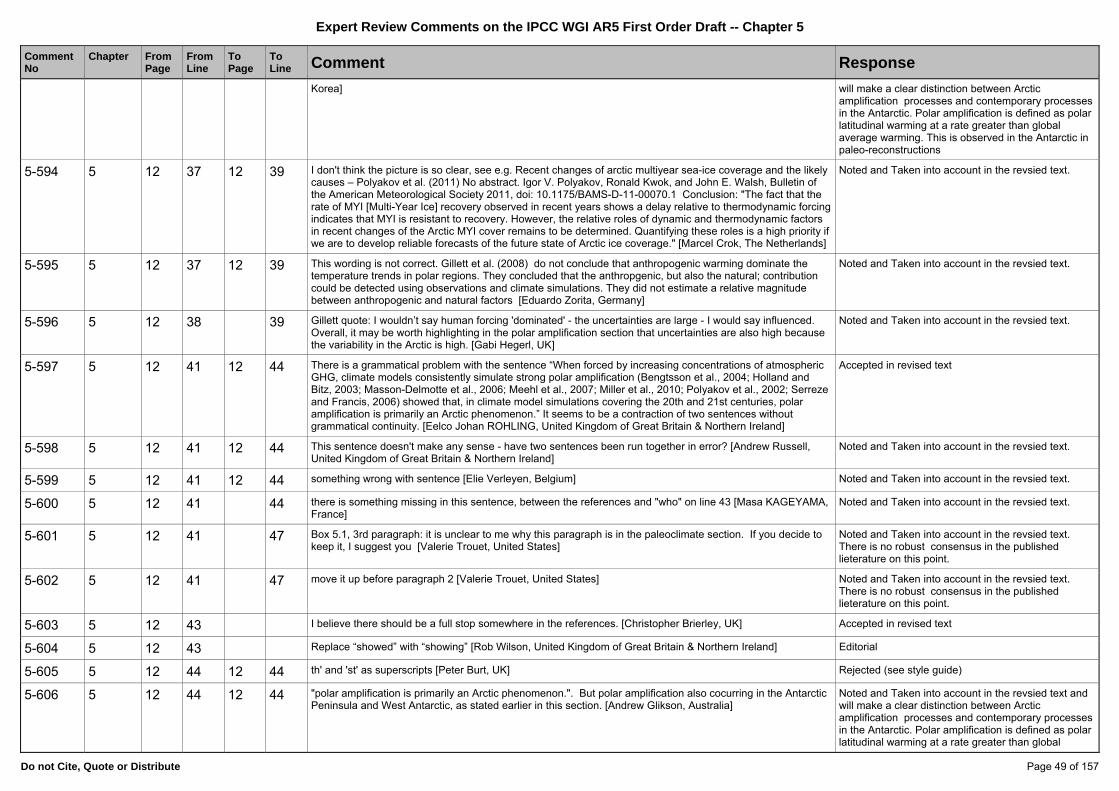
Expert Review Comments on the IPCC WGI AR5 First Order Draft -- Chapter 5
Do not Cite, Quote or Distribute Page 49 of 157
Comment No
Chapter FromPage
FromLine
To Page
To Line Comment Response
Korea] will make a clear distinction between Arctic amplification processes and contemporary processes in the Antarctic. Polar amplification is defined as polar latitudinal warming at a rate greater than global average warming. This is observed in the Antarctic in paleo-reconstructions
5-594 5 12 37 12 39 I don't think the picture is so clear, see e.g. Recent changes of arctic multiyear sea-ice coverage and the likely causes – Polyakov et al. (2011) No abstract. Igor V. Polyakov, Ronald Kwok, and John E. Walsh, Bulletin of the American Meteorological Society 2011, doi: 10.1175/BAMS-D-11-00070.1 Conclusion: "The fact that the rate of MYI [Multi-Year Ice] recovery observed in recent years shows a delay relative to thermodynamic forcing indicates that MYI is resistant to recovery. However, the relative roles of dynamic and thermodynamic factors in recent changes of the Arctic MYI cover remains to be determined. Quantifying these roles is a high priority if we are to develop reliable forecasts of the future state of Arctic ice coverage." [Marcel Crok, The Netherlands]
Noted and Taken into account in the revsied text.
5-595 5 12 37 12 39 This wording is not correct. Gillett et al. (2008) do not conclude that anthropogenic warming dominate the temperature trends in polar regions. They concluded that the anthropgenic, but also the natural; contribution could be detected using observations and climate simulations. They did not estimate a relative magnitude between anthropogenic and natural factors [Eduardo Zorita, Germany]
Noted and Taken into account in the revsied text.
5-596 5 12 38 39 Gillett quote: I wouldn’t say human forcing 'dominated' - the uncertainties are large - I would say influenced. Overall, it may be worth highlighting in the polar amplification section that uncertainties are also high because the variability in the Arctic is high. [Gabi Hegerl, UK]
Noted and Taken into account in the revsied text.
5-597 5 12 41 12 44 There is a grammatical problem with the sentence “When forced by increasing concentrations of atmospheric GHG, climate models consistently simulate strong polar amplification (Bengtsson et al., 2004; Holland and Bitz, 2003; Masson-Delmotte et al., 2006; Meehl et al., 2007; Miller et al., 2010; Polyakov et al., 2002; Serreze and Francis, 2006) showed that, in climate model simulations covering the 20th and 21st centuries, polar amplification is primarily an Arctic phenomenon.” It seems to be a contraction of two sentences without grammatical continuity. [Eelco Johan ROHLING, United Kingdom of Great Britain & Northern Ireland]
Accepted in revised text
5-598 5 12 41 12 44 This sentence doesn't make any sense - have two sentences been run together in error? [Andrew Russell, United Kingdom of Great Britain & Northern Ireland]
Noted and Taken into account in the revsied text.
5-599 5 12 41 12 44 something wrong with sentence [Elie Verleyen, Belgium] Noted and Taken into account in the revsied text.
5-600 5 12 41 44 there is something missing in this sentence, between the references and "who" on line 43 [Masa KAGEYAMA, France]
Noted and Taken into account in the revsied text.
5-601 5 12 41 47 Box 5.1, 3rd paragraph: it is unclear to me why this paragraph is in the paleoclimate section. If you decide to keep it, I suggest you [Valerie Trouet, United States]
Noted and Taken into account in the revsied text. There is no robust consensus in the published lieterature on this point.
5-602 5 12 41 47 move it up before paragraph 2 [Valerie Trouet, United States] Noted and Taken into account in the revsied text. There is no robust consensus in the published lieterature on this point.
5-603 5 12 43 I believe there should be a full stop somewhere in the references. [Christopher Brierley, UK] Accepted in revised text
5-604 5 12 43 Replace “showed” with “showing” [Rob Wilson, United Kingdom of Great Britain & Northern Ireland] Editorial
5-605 5 12 44 12 44 th' and 'st' as superscripts [Peter Burt, UK] Rejected (see style guide)
5-606 5 12 44 12 44 "polar amplification is primarily an Arctic phenomenon.". But polar amplification also cocurring in the Antarctic Peninsula and West Antarctic, as stated earlier in this section. [Andrew Glikson, Australia]
Noted and Taken into account in the revsied text and will make a clear distinction between Arctic amplification processes and contemporary processes in the Antarctic. Polar amplification is defined as polar latitudinal warming at a rate greater than global

Expert Review Comments on the IPCC WGI AR5 First Order Draft -- Chapter 5
Do not Cite, Quote or Distribute Page 50 of 157
Comment No
Chapter FromPage
FromLine
To Page
To Line Comment Response
average warming. This is observed in the Antarctic in paleo-reconstructions. Not that Antarctic zonal temperatures are not rising faster than the global average. Antarctic warming is regional
5-607 5 12 46 47 take this opportunity to state that only a few models simulate the climate ice-sheet interactions??? [Masa KAGEYAMA, France]
Noted and Taken into account in the revsied text.
5-608 5 12 47 12 47 But here I would also discuss the inability of current GCMs (I am not yet familiar enough with AR5 GCM runs) to accurately simulate recent decline in Arctic sea ice cover (e.g. Stroeve et al., 2007; Holland et al., 2010). Cited References: ------------------------ Stroeve, J., Holland, M. M., Meier, W., Scambos, T., & Serreze, M. C., 2007. Arctic sea ice decline: Faster than forecast. Geophys. Res. Lett., 34L09501, doi:10.1029/2007GL029703. http://dx.doi.org/10.1029/2007GL029703 Str034 Holland, M. M., Serreze, M. C., & Stroeve, J., 2010. The sea ice mass budget of the Arctic and its future change as simulated by coupled climate models. Clim. Dyn., 34(2-3): 185-200. http://dx.doi.org/10.1007/s00382-008-0493-4 Ho243 [Andreas Fischlin, Switzerland]
Noted and Taken into account in the revsied text.
5-609 5 12 52 12 52 "radiative perturbation" : do you mean the ice-albedo feedback? [Bernard De Saedeleer, Belgium] Noted and taken into account.
5-610 5 12 53 12 54 "During past interglacials, orbital forcing induces large changes in seasonal and latitudinal distribution of insolation, without significant changes in global mean radiative forcing and temperature.". This statement is not understood, as during the interglacials the overall decrease in the Earth surface albedo (due to lesser sea ice, land ice and snow, and lesser dust, and an increase in sea surface and dark vegetation) during interglacial periods increased mean surface temperatures by ~5C (Hansen et al., 2007, 2008, 2011). [Andrew Glikson, Australia]
Noted and Taken into account in the revsied text. Note that over long timescales these orbitally forced influences on radiative forcing may be out of phase.
5-611 5 12 54 12 54 "without significant changes" : is this statement supported by a particular reference / prove / result ? [Bernard De Saedeleer, Belgium]
Noted and Taken into account in the revsied text.
5-612 5 12 57 13 3 A further issue is that the time period covered by the data and the model are rarely the same; the model may be a snapshot of a particular orbital time, while the data are often an average over thousands of years, or even a scattering of data with varying dates. [Eric Wolff, United Kingdom of Great Britain & Northern Ireland]
Noted and Taken into account in the revsied text. Note that over long timescales these orbitally forced influences on radiative forcing may be out of phase.
5-613 5 12 Table 5.2: d18O planktonic vs Mg/Ca. The same assumptions are qualified with different confidences for the two methods. Please correct to make this consistent [Hubertus Fischer, Switzerland]
Noted and Taken into account in the revsied text.
5-614 5 12 Table 5.2 TEX86 given that a verification of the location of production is not possible (see Limitations), the confidence that such species record SST is only medium [Hubertus Fischer, Switzerland]
Noted and Taken into account in the revsied text.
5-615 5 13 1 13 11 This is an important paragraph that would benefit from a rewriting to better highlight the key statements and the degree of confidence one can have from past reconstructions and model-data comparisons. [PASCALE BRACONNOT, France]
Noted and Taken into account in the revsied text.
5-616 5 13 1 change "are" to "is" [Alan Robock, USA] Editorial
5-617 5 13 2 13 3 Useful to add a reference to support the claim that "the vast majority of these sites reflect summer temperature estimates" (presumably rather than mean annual surface temperature estimates). For land-based temperature there's the issue of the elevation effect also. [Peter Barrett, New Zealand]
Noted and Taken into account in the revsied text.
5-618 5 13 3 I don’t feel this sentence is necessary. There is no further mention of hemispheric means. [Christopher Brierley, UK]
Noted and Taken into account in the revsied text.
5-619 5 13 4 clarify "data constrained model output approaches" [Masa KAGEYAMA, France] Noted and Taken into account in the revsied text.

Expert Review Comments on the IPCC WGI AR5 First Order Draft -- Chapter 5
Do not Cite, Quote or Distribute Page 51 of 157
Comment No
Chapter FromPage
FromLine
To Page
To Line Comment Response
5-620 5 13 6 13 8 Here is an excellent example of a clear, strong summary statement about what paleo-analogs tell us about a warmer future. Place it more prominently in the text, perhaps as a separate paragraph/line at the end of the section... and do this equally well for EVERY topic, and please don't forget precipitation history as well as temperature. [Jay Curt Stager, United States of America]
Noted
5-621 5 13 7 13 7 "A consistent feature of GCMs and temperature proxy reconstructions are: that for warmer (Eocene and Pliocene) climate states pole-equator temperature gradients are significantly reduced,". The likely consequence of lack or lower extent of polar ice in the Eocene and Pliocene, respectively. [Andrew Glikson, Australia]
Noted
5-622 5 13 8 13 8 ampolification → amplification [Peter Burt, UK] Editorial
5-623 5 13 8 13 8 replace "Polar ampolification" by "Polar amplification" [Bernard De Saedeleer, Belgium] Editorial
5-624 5 13 8 same as comment 5, reformulate, polar amplification is a ratio, not a temperature difference! [Masa KAGEYAMA, France]
Noted
5-625 5 13 8 Correct mispelled word "amplification" at the end of line. [Dunia H. Urrego, France-USA] Editorial
5-626 5 13 8 should read amplification [Elie Verleyen, Belgium] Accepted
5-627 5 13 9 13 9 "unequivocal in SAT, but not resolved in SST due to …" : please explain a little bit further, or give a reference? Why do you think SST should have the same shape as SAT? [Bernard De Saedeleer, Belgium]
Noted and Taken into account in the revsied text.
5-628 5 13 9 13 9 (“not resolved in SST due to the presence of high-latitude sea ice”) This is not the case for the Eocene Arctic Ocean, which should not have been sea-ice covered and does have a temperature record (Sluijs et al., 2006, Subtropical Arctic Ocean temperatures during the Paleocene/Eocene thermal maximum, Nature 441: 610-613 ) indicating mean annual temperatures of ~18 C in the latest Paleocene and ~23 C during the PETM. [Robert Kopp, USA]
Noted and Taken into account in the revsied text.
5-629 5 13 10 13 11 "Comparisons between proxy and GCM temperature reconstructions ..." I think until now not all possibilities have been evaluated to change the temperature gradients. It sounds as this was analyzed in detail, but only recently some modelling exercises were performed, but we are far away from a deep understanding. [Gerrit Lohmann, Germany]
Noted and Taken into account in the revsied text.
5-630 5 13 11 13 11 In addition the authors may like to consider Rohling et al Climate Dynamics, 2011, cited p61, line 51-52 [Mark Siddall, UK]
Noted and Taken into account in the revsied text.
5-631 5 13 16 14 7 This section is an important one and should state clearly what can be done and what cannot be done from LGM or other paleo periodes. The different questions should appear more clearly, as well as the different approaches. It is also important to clearly say that the a wider definition of climate sensitivity is adopted compared to the strict model definitinon. There are different questions, 1. what is the sensitivity of the climate system depending on the forcing applied to it. 2 Can past climate reconstruction provide bounds on this sensitivity. 3. can this tell us something on the model used for future climate projections. There are su-questions such as : is it possible to isolate the CO2 part of the forcing and the response? and how can we link past information to future projections. [PASCALE BRACONNOT, France]
Noted and taken into account in the revised text
5-632 5 13 16 14 7 Why is the discussion of sensitivity and feedbacks restricted to the LGM? [PASCALE BRACONNOT, France] Due to space limitations, we restricted the illustration of feedbacks and the quantitative assessment of sensitivity to the LGM but also refer to a recent review by Rohling et al (accepted) throughout other time periods. The role of amplifying feedbacks is also mentioned for other periods (e.g. MH) in the revised text.
5-633 5 13 18 13 18 move 'better' to after 'climate; to avoid split infinitive [Peter Burt, UK] Editorial

Expert Review Comments on the IPCC WGI AR5 First Order Draft -- Chapter 5
Do not Cite, Quote or Distribute Page 52 of 157
Comment No
Chapter FromPage
FromLine
To Page
To Line Comment Response
5-634 5 13 18 "validate" is too strong, use, e.g., "evaluate" [Tor Eldevik, Norway] Accepted
5-635 5 13 19 13 19 delete comma after results [Peter Burt, UK] Editorial
5-636 5 13 19 13 19 "climate sensitivity." : what do you mean by this words? Give a definition (+units?) ? Is the "climate sensitivity." the same quantity as the "climate feedback parameter (Fig. 5.4). It seems not : please explain a little bit better the definitions / differences. [Bernard De Saedeleer, Belgium]
Taken into account - "climate sensitivity" is defined as the global mean equilibrium temperature change under 2xCO2, and it is explained in the Glossary of this report. "Climate feedback parameter" is now explained in the caption of Fig. 5.4
5-637 5 13 19 13 19 Perhaps change "stable," by "stable: " ? [Bernard De Saedeleer, Belgium] Accepted - the word "stable" is removed.
5-638 5 13 19 13 19 "LGM is known to be relatively stable" - perhaps explain better what you mean here? Given all the variability associated with Heinrich events, etc, this may be confusing. [Konrad Gajewski, Canada]
Accepted - the word "stable" is removed.
5-639 5 13 19 13 19 "The LGM is known to be relatively stable,". Is the term "stable" correct, despite the Dansgaard-Oeschger cycles which were of considerable amplitude? [Andrew Glikson, Australia]
Accepted - the word "stable" is removed.
5-640 5 13 19 13 22 Long sentence, difficult to understand. Consider breaking it up by adding a period after the word "uncertanties" and the acronym "LGM" before the word "proxy" [Dunia H. Urrego, France-USA]
Accepted
5-641 5 13 19 The LGM was stable? I'm not so sure about that, or what mentioning it here would be useful for even if it were true. [Jay Curt Stager, United States of America]
Accepted - the word "stable" is removed.
5-642 5 13 22 13 22 I don't think the Braconnot et al references are the best for referencing climate reconstructions [PASCALE BRACONNOT, France]
Accepted
5-643 5 13 22 13 22 change reference to Braconnot et al., 2007a, 2007b) [Peter Burt, UK] Rejected (EndNote Web does not allow this)
5-644 5 13 22 reconstructions of what? Climate? [Jonathan Overpeck, USA] Accepted - text revised to "climate reconstrcutions"
5-645 5 13 24 13 24 C-13 has been used for the ocean circulation by Hesse et al. (2011, Paleoceanogr). A comprehensive evaluation has not been undertaken. [Gerrit Lohmann, Germany]
Taken into account
5-646 5 13 28 13 28 Observations of the tropics during the LGM indicate no decrease in biologic productivity (Kastner and Goñi 2003) or even an order of magnitude larger (Boot et al 2006), which is certainly not indicative of lower temperatures. [Marcel Crok, The Netherlands]
Noted. Within the tropics, marine productivity is not primarily controlled by temperature. The revised 5.3.3 section addresses the uncertainties in tropical SST reconstructions (based on published temperature sensitive proxies).
5-647 5 13 28 13 30 The MARGO reconstruction indicates a global mean SST change of -2ºC, not -5ºC as indicated; it does not, however, include land temperature constraints. It is therefore unclear where the 5ºC global temperature decrease in this sentence is coming from. On the other hand, Shakun and Carlson (2010, A global perspective on Last Glacial maximum to Holocene climate change, Quaternary Science Reviews 29: 1810-1816) suggest a global mean cooling of >4.9 C. [Robert Kopp, USA]
Taken into account-- Now MARGO for the ocean temperature and land data from Bartlein et al (2011) are taken into account as well as global estimation from Schmittner et al 2011, Annan and Hargreaves (submitted).Shakun et al 2012 will be taken into account.
5-648 5 13 28 Consider adding "SST" after the word "LGM" to avoid ambiguity as surface air temperatures over the Amazon have been estimated to be >5 degrees cooler than today during the LGM (see Urrego et al 2005 JQS) [Dunia H. Urrego, France-USA]
Accepted
5-649 5 13 29 13 29 The different datasets that are sited do not provide a global estimate of temperature. References to Shmidtner et al., science, 2011 paper and new work coming out on the subject using model and data to infer global sensitivity would be welcome, as well as a statement on the uncertainty. [PASCALE BRACONNOT, France]
Accepted --- global estimation from Schmittner et al 2011, Annan and Hargreaves (submitted).Shakun et al 2012, Rohling, et al submitted are taken into account.
5-650 5 13 29 13 29 uncertainty estimate? [Mark Siddall, UK] Taken into account --- New works are referred

Expert Review Comments on the IPCC WGI AR5 First Order Draft -- Chapter 5
Do not Cite, Quote or Distribute Page 53 of 157
Comment No
Chapter FromPage
FromLine
To Page
To Line Comment Response
5-651 5 13 29 Further precision needed. The implication is that SSTs are being described, but Greenland values look like air temperature to me. [Christopher Brierley, UK]
Taken into account -- the phrase is clarified.
5-652 5 13 29 here and elsewhere, don't forget uncertainty estimates [Jonathan Overpeck, USA] Taken into account --- --- global estimation from Schmittner et al 2011, Annan and Hargreaves (submitted).Shakun et al 2012,Rohling, et al submitted are taken into account.
5-653 5 13 30 13 30 The temperature reconstruction for Greenland and Antarctica is based on isotope ratios in precipitation in (Ant)arctic areas, the accuracy of which has been challenged (Helsen 2006). The wording may suggest that the Greenland temperature was representative of the whole Arctic. But Siberia seems to be problematic for this model. For instance, it has been noted that there was no ice sheet on Siberia, which was erroneously explained by Krinner et al 2006 to be caused by albedo lowering dust on the ice. [Marcel Crok, The Netherlands]
Source of the temperature reconstruction is clarified:Greenland ice core temperature is estimated from borehole temperatures and Antarctica ice core temperature is insensitive to the methodology (Uemura et al, 2011, CPD)
5-654 5 13 30 13 32 The references (Koehler et al., 2010, Rohling et al., 2009; Siddall et al., 2010) given for LGM Greenland temperature change are not appropriate, non shows original Greenland data, but they all only do interpretation of and effects of temperature on other things, e.g. sea level. A much better reference for LGM temperature change in Greenland is Dahl-Jensen, D.; Mosegaard, K.; Gundestrup, N.; Clow, G. D.; Johnsen, S. J.; Hansen, A. W. & Balling, N. Past temperatures directly from the Greenland ice sheet. Science, 1998, 282, 268-271 which shows borehole reconstructions and the GRIP ice cores showing a LGM cooling of -23 K. [Peter Koehler, Germany]
Taken into account --- all the references are replaced by the original ice core articles.
5-655 5 13 30 With Stenni you may also want to reference Pedro et al CP 7, 671 (2011) [Eric Wolff, United Kingdom of Great Britain & Northern Ireland]
Rejected - Pedro et al. discuss timing of the temperature change but not the magnitude the temperature iteself. We instead decided to cite Uemura et al. (2011, CPD).
5-656 5 13 31 13 31 The Rohling et al. (2009) reference given here needs to be the Rohling et al. (accepted, J. Clim.) reference from the reference list, I think. [Eelco Johan ROHLING, United Kingdom of Great Britain & Northern Ireland]
Editorial
5-657 5 13 31 13 32 I do not think any of these references are the original references for the Greenland temperature [Mark Siddall, UK]
Noted but because none of the studies are new since AR4 statement was removed.
5-658 5 13 31 13 32 This is a very odd and inappropriate set of refs for the 20-25 degree cooling of Greenland. All of these are citing earlier work if they state a temperature change. Why not NGRIP Project members or the even more primary Cuffey et al 1995, Johnsen et al 1995 or Severinghaus 99? [Eric Wolff, United Kingdom of Great Britain & Northern Ireland]
Noted but because none of the studies are new since AR4 statement was removed.
5-659 5 13 32 13 34 “The overall pattern of reconstructed tropical SST during the LGM generally is well simulated…”. Compared to what? I assume that it is in comparison with proxy data? [Hans W Linderholm, Sweden]
taken into account ---- "compared to MARGO data."
5-660 5 13 32 The following article explores the past 4000-yr Greenland SAT. Kobashi, T., K. Kawamura, J. P. Severinghaus, J.-M. Barnola, T. Nakaegawa, B. M. Vinther, S. J. Johnsen, and J. E. Box (2011), High variability of Greenland surface temperature over the past 4000 years estimated from trapped air in an ice core, Geophys. Res. Lett., 38, L21501, doi:10.1029/2011GL049444 [Tosiyuki Nakaegawa, Japan]
Editorial
5-661 5 13 33 Specify that this mention of tropical upwelling is most important in the context of ENSO variability; no mention of climatic effects is given here. [Jay Curt Stager, United States of America]
Taken into account.
5-662 5 13 36 13 36 "Masson-Delmotte et al., 2008; [add Siddall EPSL, 2011]" [Tasman van Ommen, Australia] Accepted
5-663 5 13 36 13 39 The last sentence if not needed if there is no result with it. [PASCALE BRACONNOT, France] Taken into account - the new results are now shown in Fig. 5.4, and the remark is added.
5-664 5 13 38 13 38 Change "relation" by "relationship" [Yueh-Hsin Lo, Taiwan R.O.C.] Editorial
5-665 5 13 41 14 7 This section could discuss a larger literature, including some that take the "observational-only" perspective on Taken into account: global estimation from

Expert Review Comments on the IPCC WGI AR5 First Order Draft -- Chapter 5
Do not Cite, Quote or Distribute Page 54 of 157
Comment No
Chapter FromPage
FromLine
To Page
To Line Comment Response
constraining climate sensitvity (several of Hansen's papers) even if the approach is falling out of favor. Moreover, it should be mentioned that the Schmittner study does not appear robust to their choice of data (whether they use land or ocean data to constrain the best models) and may use a very small global temperature change. [Chris Colose, United States]
Schmittner et al 2011, Annan and Hargreaves (submitted).Shakun et al 2012,Rohling, et al submitted are taken into account.
5-666 5 13 41 14 7 The discussion of sensitivity is good and meshes well with ch10. Estimating climate sensitivity can due to methods and assumptions also quite easily underestimate particularly the mode, so the argument that missing dust may underestimate the forcing is good, but other factors may also lead to an underestimate of sensitivity, so maybe moderate this statement a bit [Gabi Hegerl, UK]
Accepted
5-667 5 13 41 14 7 Whole section on CS from LGM is not clearly written. Does not seem to build on what was already done by Knutti in AR4, and just leaves a confusing outcome. Surely what LGM does is to confirm that typical CS (eg 3) are compatible with LGM data, and that very high CS are unlikely. Make this clear. [Eric Wolff, United Kingdom of Great Britain & Northern Ireland]
Taken into account: whole section is revised with enhanced clarification.
5-668 5 13 42 13 42 replace "using a pair of" with "pairing" [Peter Barrett, New Zealand] Editorial
5-669 5 13 42 13 42 delete comma after ) [Peter Burt, UK] Editorial
5-670 5 13 42 43 sentence does not make sense [Julia Hargreaves, Japan] Taken into accout - Text revised.
5-671 5 13 42 Like the use of "first" "second" etc. Elsewhere you use "Firstly" "secondly" - best be consistent. [Jonathan Overpeck, USA]
Editorial - changed
5-672 5 13 43 13 43 delete "to the radiative forcing" (unnecessary repetition) [Peter Barrett, New Zealand] Taken into account. Text revised.
5-673 5 13 43 13 43 In addition to Edwards et al a citation should be added to: Chylek, P., and U. Lohmann, 2008: Aerosol radiative forcing and climate sensitivity deduced from the Last Glacial Maximum to Holocene transition, Geophysical Research Letters, 35, L04804, doi:10.1029/2007GL032759 [Petr Chylek, USA]
Rejected - The method in the raised paper is heavily criticized by Ganopolski and Schneider von Deimling (2008, GRL, 35, L23703, doi:10.1029/2008GL033888) and Hargreaved and Annan (2009, Clim. Past, 5, 143-145)
5-674 5 13 45 13 45 delete "even". Replace "even though there is no guaratee that the climate sensitivity is independent on forcingsd and climate state." with "However this may not be so." [Peter Barrett, New Zealand]
Taken into account partly: "even" is deleted. Reworded.
5-675 5 13 45 13 46 "In this method, there is an important assumption; i.e., the climate response to a certain amount of radiative forcing is the same even under different climate states (warm or cold climate), even though there is no guarantee thatthe climate sensitivity is independent on forcings and climate state." This a key question, as under fast-rate shifts in climate states what is defined as "slow feedbacks" (greenhouse gas levels, ice sheet melt,vegetation change) occur over shorter time scales and involve multiple feedbacks (cf. CO2 release from warming water, methane release, extensive fires, collapse of the North Atlantic Thermohaline Current), which complicates the definition of 'climate sensitivity'. [Andrew Glikson, Australia]
noted
5-676 5 13 46 13 46 on → of [Peter Burt, UK] Editorial
5-677 5 13 46 13 50 It is very unclear what authors are talking about. Also from caption of Figure 5.4 it is far from understandable what is what, notably for panels a) and b). Was the feedback parameter derived from proxy data (as this sentence seems to imply), then where is the associated uncertainty. And why are LGM vs. 2xCO2 compared? LGM vs. 1/2 CO2 would make more sense. Please explain and label axis for panels a) and b) understandably by improving on the caption and making clear what is data derived and what comes from models. [Andreas Fischlin, Switzerland]
Taken into account: the figure, the figure caption and the main text related to the figure are replaced and simplified.
5-678 5 13 46 13 50 As written, this section does not make sense. Sentence needs rewriting. [Eric Wolff, United Kingdom of Great Britain & Northern Ireland]
Taken into account: the figure, the figure caption and the main text related to the figure are replaced and simplified.

Expert Review Comments on the IPCC WGI AR5 First Order Draft -- Chapter 5
Do not Cite, Quote or Distribute Page 55 of 157
Comment No
Chapter FromPage
FromLine
To Page
To Line Comment Response
5-679 5 13 46 Laîné et al (same ref as above) also show the different sensitivities to CO2 for glacial vs interglacial backgrounds [Masa KAGEYAMA, France]
Taken into account
5-680 5 13 47 13 47 The Schmittner et al. (submitted) paper has since come out in Science, and can be fully referenced. [Eelco Johan ROHLING, United Kingdom of Great Britain & Northern Ireland]
Editorial
5-681 5 13 47 13 47 Schmittner now published not submitted [Tasman van Ommen, Australia] Editorial
5-682 5 13 47 13 48 "including models having structural differences", A good point, where are the structural or conceptual differences. In PMIP 3 it is not so obvious. [Gerrit Lohmann, Germany]
Multi-model analysis and their feedback analysis are shown both for PMIP2 and PMIP3 models and are explained.
5-683 5 13 48 13 48 "(LGM vs. 2 x CO2)" : what do you mean ? This seems not to be explained nowhere. [Bernard De Saedeleer, Belgium]
It is aimed at linking Past and future climate by showing the ratio of sensitivity in climate response. This is more clarified in SOD.
5-684 5 13 49 13 49 "0.6 to 2" : are there units ? (it seems there are, as °C is used @ line 57) -- is this the right unit ? [Bernard De Saedeleer, Belgium]
It is the "ratio".
5-685 5 13 49 13 50 As well as Crucifix, it would be appropriate to cite Yoshimori et al J Clim 2011 here [Tasman van Ommen, Australia]
Accepted
5-686 5 13 50 13 50 Reference to Fig. 5.4: where do you see this on Fig. 5.4? It is not so evident. [Bernard De Saedeleer, Belgium] Taken into account: the figure, the figure caption and the main text related to the figure are replaced and simplified.
5-687 5 13 51 13 51 delete "in the models" (unnecessary repetition) [Peter Barrett, New Zealand] Editorial
5-688 5 13 51 13 55 There appears to be an internal contradiction in these sentences. Dust and vegetation, which tend to increase climate sensitivity, are in many cases not included in models; yet climate sensitivity from LGM experiment is therefore more likely overestimated than underestimated. [Robert Kopp, USA]
Taken into account : Main text is restructured to avoid misunderstaning.
5-689 5 13 53 13 53 McGee reference should be after Lambert et al. [Peter Burt, UK] already done.
5-690 5 13 54 13 54 The referenced section does not discuss vegetation feedbacks at all, which may go in more than just one direction. Assuming here that there are dominantly positive feedbacks from vegetation appears more than a bit daring and would require for sure much more discussion. Needs much improvement. [Andreas Fischlin, Switzerland]
Taken into account: the role of vegetation is discussed more carefully.
5-691 5 13 55 13 55 if dust and veg contribute to increased climate sensitivity and they are not included does that not mean climate sensivity derived from the experiments will be under-estimated? [Peter Barrett, New Zealand]
Taken into account : Main text is restructured to avoid misunderstaning.
5-692 5 13 55 13 55 "more likely overestimated than underestimated", I can't follow. How come, if processes with positive feedback were not included? [Andreas Fischlin, Switzerland]
Taken into account : Main text is restructured to avoid misunderstaning.
5-693 5 13 55 13 56 "Third, the physics perturbed ensemble method using a single climate model is used". It will help could some of the terms, such as "physics perturbed ensemble" be briefly explained. [Andrew Glikson, Australia]
Taken into account: rephrased for clarification
5-694 5 13 56 13 56 "perturbed ensemble method " : what is it? Please explain a little bit, or give a reference? [Bernard De Saedeleer, Belgium]
Taken into account: rephrased for clarification
5-695 5 13 56 13 56 a reference is missing [Gerrit Lohmann, Germany] Taken into account: link to the references is clarified
5-696 5 13 56 13 57 This sentence is poorly constructed and the reader is not told what "EMIC" and "EBM" are, what they tell us, or why anybody would or wouldn't use them for models. [Jay Curt Stager, United States of America]
Taken into account : Less comprehensive model than GCM was meant ,but clarifed.
5-697 5 13 57 I have strong reservations about the recent paper by Schmittner et al. I understand that there is similar concern elsewhere in the community. As such I do not feel it should be mentioned so heavily here. [Christopher Brierley, UK]
Taken into account:newer references are added.
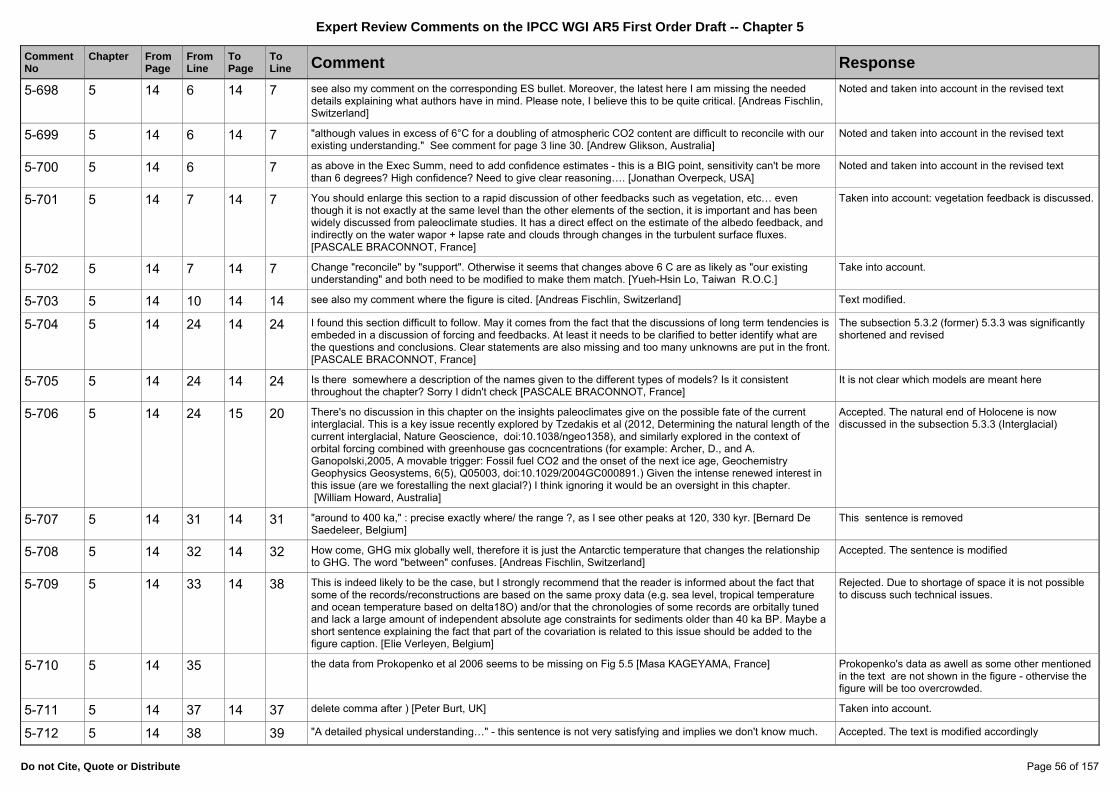
Expert Review Comments on the IPCC WGI AR5 First Order Draft -- Chapter 5
Do not Cite, Quote or Distribute Page 56 of 157
Comment No
Chapter FromPage
FromLine
To Page
To Line Comment Response
5-698 5 14 6 14 7 see also my comment on the corresponding ES bullet. Moreover, the latest here I am missing the needed details explaining what authors have in mind. Please note, I believe this to be quite critical. [Andreas Fischlin, Switzerland]
Noted and taken into account in the revised text
5-699 5 14 6 14 7 "although values in excess of 6°C for a doubling of atmospheric CO2 content are difficult to reconcile with our existing understanding." See comment for page 3 line 30. [Andrew Glikson, Australia]
Noted and taken into account in the revised text
5-700 5 14 6 7 as above in the Exec Summ, need to add confidence estimates - this is a BIG point, sensitivity can't be more than 6 degrees? High confidence? Need to give clear reasoning…. [Jonathan Overpeck, USA]
Noted and taken into account in the revised text
5-701 5 14 7 14 7 You should enlarge this section to a rapid discussion of other feedbacks such as vegetation, etc… even though it is not exactly at the same level than the other elements of the section, it is important and has been widely discussed from paleoclimate studies. It has a direct effect on the estimate of the albedo feedback, and indirectly on the water wapor + lapse rate and clouds through changes in the turbulent surface fluxes. [PASCALE BRACONNOT, France]
Taken into account: vegetation feedback is discussed.
5-702 5 14 7 14 7 Change "reconcile" by "support". Otherwise it seems that changes above 6 C are as likely as "our existing understanding" and both need to be modified to make them match. [Yueh-Hsin Lo, Taiwan R.O.C.]
Take into account.
5-703 5 14 10 14 14 see also my comment where the figure is cited. [Andreas Fischlin, Switzerland] Text modified.
5-704 5 14 24 14 24 I found this section difficult to follow. May it comes from the fact that the discussions of long term tendencies is embeded in a discussion of forcing and feedbacks. At least it needs to be clarified to better identify what are the questions and conclusions. Clear statements are also missing and too many unknowns are put in the front. [PASCALE BRACONNOT, France]
The subsection 5.3.2 (former) 5.3.3 was significantly shortened and revised
5-705 5 14 24 14 24 Is there somewhere a description of the names given to the different types of models? Is it consistent throughout the chapter? Sorry I didn't check [PASCALE BRACONNOT, France]
It is not clear which models are meant here
5-706 5 14 24 15 20 There's no discussion in this chapter on the insights paleoclimates give on the possible fate of the current interglacial. This is a key issue recently explored by Tzedakis et al (2012, Determining the natural length of the current interglacial, Nature Geoscience, doi:10.1038/ngeo1358), and similarly explored in the context of orbital forcing combined with greenhouse gas cocncentrations (for example: Archer, D., and A. Ganopolski,2005, A movable trigger: Fossil fuel CO2 and the onset of the next ice age, Geochemistry Geophysics Geosystems, 6(5), Q05003, doi:10.1029/2004GC000891.) Given the intense renewed interest in this issue (are we forestalling the next glacial?) I think ignoring it would be an oversight in this chapter. [William Howard, Australia]
Accepted. The natural end of Holocene is now discussed in the subsection 5.3.3 (Interglacial)
5-707 5 14 31 14 31 "around to 400 ka," : precise exactly where/ the range ?, as I see other peaks at 120, 330 kyr. [Bernard De Saedeleer, Belgium]
This sentence is removed
5-708 5 14 32 14 32 How come, GHG mix globally well, therefore it is just the Antarctic temperature that changes the relationship to GHG. The word "between" confuses. [Andreas Fischlin, Switzerland]
Accepted. The sentence is modified
5-709 5 14 33 14 38 This is indeed likely to be the case, but I strongly recommend that the reader is informed about the fact that some of the records/reconstructions are based on the same proxy data (e.g. sea level, tropical temperature and ocean temperature based on delta18O) and/or that the chronologies of some records are orbitally tuned and lack a large amount of independent absolute age constraints for sediments older than 40 ka BP. Maybe a short sentence explaining the fact that part of the covariation is related to this issue should be added to the figure caption. [Elie Verleyen, Belgium]
Rejected. Due to shortage of space it is not possible to discuss such technical issues.
5-710 5 14 35 the data from Prokopenko et al 2006 seems to be missing on Fig 5.5 [Masa KAGEYAMA, France] Prokopenko's data as awell as some other mentioned in the text are not shown in the figure - othervise the figure will be too overcrowded.
5-711 5 14 37 14 37 delete comma after ) [Peter Burt, UK] Taken into account.
5-712 5 14 38 39 "A detailed physical understanding…" - this sentence is not very satisfying and implies we don't know much. Accepted. The text is modified accordingly
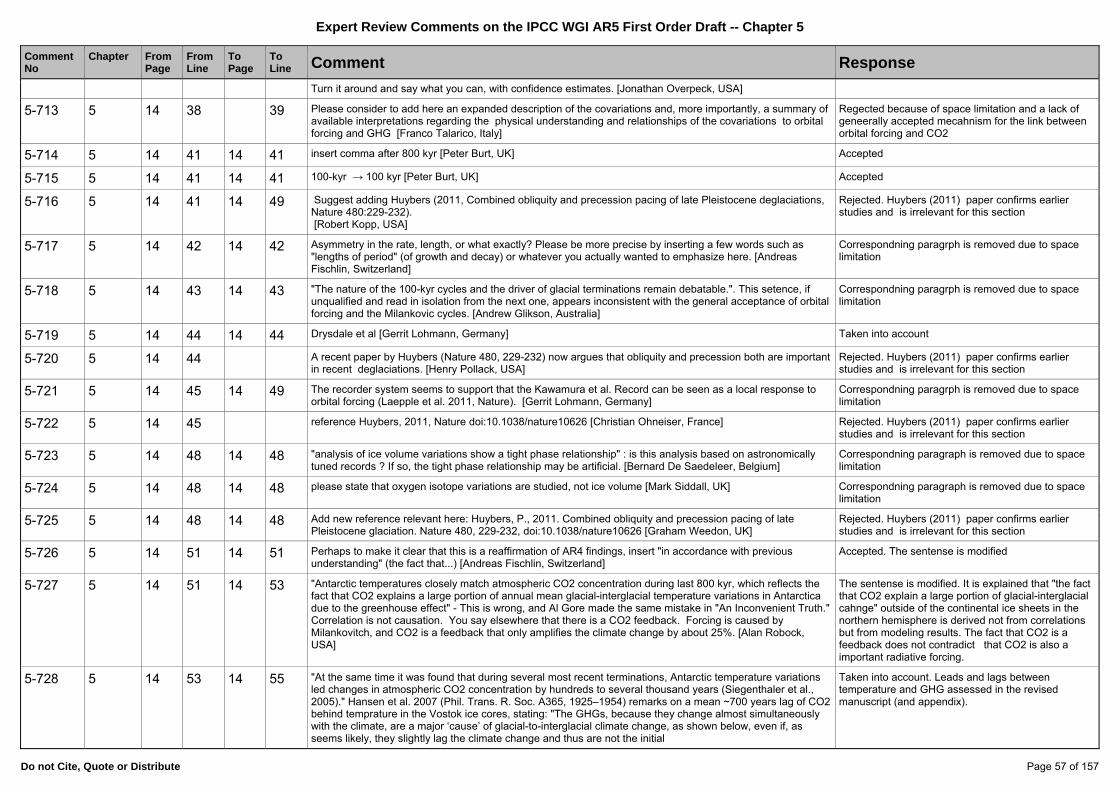
Expert Review Comments on the IPCC WGI AR5 First Order Draft -- Chapter 5
Do not Cite, Quote or Distribute Page 57 of 157
Comment No
Chapter FromPage
FromLine
To Page
To Line Comment Response
Turn it around and say what you can, with confidence estimates. [Jonathan Overpeck, USA]
5-713 5 14 38 39 Please consider to add here an expanded description of the covariations and, more importantly, a summary of available interpretations regarding the physical understanding and relationships of the covariations to orbital forcing and GHG [Franco Talarico, Italy]
Regected because of space limitation and a lack of geneerally accepted mecahnism for the link between orbital forcing and CO2
5-714 5 14 41 14 41 insert comma after 800 kyr [Peter Burt, UK] Accepted
5-715 5 14 41 14 41 100-kyr → 100 kyr [Peter Burt, UK] Accepted
5-716 5 14 41 14 49 Suggest adding Huybers (2011, Combined obliquity and precession pacing of late Pleistocene deglaciations, Nature 480:229-232). [Robert Kopp, USA]
Rejected. Huybers (2011) paper confirms earlier studies and is irrelevant for this section
5-717 5 14 42 14 42 Asymmetry in the rate, length, or what exactly? Please be more precise by inserting a few words such as "lengths of period" (of growth and decay) or whatever you actually wanted to emphasize here. [Andreas Fischlin, Switzerland]
Correspondning paragrph is removed due to space limitation
5-718 5 14 43 14 43 "The nature of the 100-kyr cycles and the driver of glacial terminations remain debatable.". This setence, if unqualified and read in isolation from the next one, appears inconsistent with the general acceptance of orbital forcing and the Milankovic cycles. [Andrew Glikson, Australia]
Correspondning paragrph is removed due to space limitation
5-719 5 14 44 14 44 Drysdale et al [Gerrit Lohmann, Germany] Taken into account
5-720 5 14 44 A recent paper by Huybers (Nature 480, 229-232) now argues that obliquity and precession both are important in recent deglaciations. [Henry Pollack, USA]
Rejected. Huybers (2011) paper confirms earlier studies and is irrelevant for this section
5-721 5 14 45 14 49 The recorder system seems to support that the Kawamura et al. Record can be seen as a local response to orbital forcing (Laepple et al. 2011, Nature). [Gerrit Lohmann, Germany]
Correspondning paragrph is removed due to space limitation
5-722 5 14 45 reference Huybers, 2011, Nature doi:10.1038/nature10626 [Christian Ohneiser, France] Rejected. Huybers (2011) paper confirms earlier studies and is irrelevant for this section
5-723 5 14 48 14 48 "analysis of ice volume variations show a tight phase relationship" : is this analysis based on astronomically tuned records ? If so, the tight phase relationship may be artificial. [Bernard De Saedeleer, Belgium]
Correspondning paragraph is removed due to space limitation
5-724 5 14 48 14 48 please state that oxygen isotope variations are studied, not ice volume [Mark Siddall, UK] Correspondning paragraph is removed due to space limitation
5-725 5 14 48 14 48 Add new reference relevant here: Huybers, P., 2011. Combined obliquity and precession pacing of late Pleistocene glaciation. Nature 480, 229-232, doi:10.1038/nature10626 [Graham Weedon, UK]
Rejected. Huybers (2011) paper confirms earlier studies and is irrelevant for this section
5-726 5 14 51 14 51 Perhaps to make it clear that this is a reaffirmation of AR4 findings, insert "in accordance with previous understanding" (the fact that...) [Andreas Fischlin, Switzerland]
Accepted. The sentense is modified
5-727 5 14 51 14 53 "Antarctic temperatures closely match atmospheric CO2 concentration during last 800 kyr, which reflects the fact that CO2 explains a large portion of annual mean glacial-interglacial temperature variations in Antarctica due to the greenhouse effect" - This is wrong, and Al Gore made the same mistake in "An Inconvenient Truth." Correlation is not causation. You say elsewhere that there is a CO2 feedback. Forcing is caused by Milankovitch, and CO2 is a feedback that only amplifies the climate change by about 25%. [Alan Robock, USA]
The sentense is modified. It is explained that "the fact that CO2 explain a large portion of glacial-interglacial cahnge" outside of the continental ice sheets in the northern hemisphere is derived not from correlations but from modeling results. The fact that CO2 is a feedback does not contradict that CO2 is also a important radiative forcing.
5-728 5 14 53 14 55 "At the same time it was found that during several most recent terminations, Antarctic temperature variations led changes in atmospheric CO2 concentration by hundreds to several thousand years (Siegenthaler et al., 2005)." Hansen et al. 2007 (Phil. Trans. R. Soc. A365, 1925–1954) remarks on a mean ~700 years lag of CO2 behind temprature in the Vostok ice cores, stating: "The GHGs, because they change almost simultaneously with the climate, are a major ‘cause’ of glacial-to-interglacial climate change, as shown below, even if, as seems likely, they slightly lag the climate change and thus are not the initial
Taken into account. Leads and lags between temperature and GHG assessed in the revised manuscript (and appendix).

Expert Review Comments on the IPCC WGI AR5 First Order Draft -- Chapter 5
Do not Cite, Quote or Distribute Page 58 of 157
Comment No
Chapter FromPage
FromLine
To Page
To Line Comment Response
instigator of change." [Andrew Glikson, Australia]
5-729 5 14 54 14 58 What the correlation of temperature and CO2 in the Antarctic ice cores shows is a strong coupling between temperature and CO2, with temperature sometimes leading, and at other times CO2 sometimes leading. The coupling derives, inter alia, from the inverse dependence of CO2 solubility on temperature in the oceans, changes in the terrestrial and marine biosphere, and changes in ocean circulation, such as the AMOC perturbation cited. When one factor is leading, it pulls the other along with it. In the present-day, CO2 is leading, and pulling the temperature upward. [Henry Pollack, USA]
Taken into account. Leads and lags between temperature and GHG assessed in the revised manuscript (and appendix).
5-730 5 14 55 14 55 The Siegenthaler result lacks the precision of recent results. At this point a comment and reference to Pedro et al., 2012 Submitted Climate of the Past, should be made - Pedro et al., find a lag at the last deglaciation of 200+-200yr, i.e. Very short and almost immediate at its lower bound. [Tasman van Ommen, Australia]
The issue of dating uncertainties is mentioned.
5-731 5 14 55 14 58 This discussion may prove to be of particular public interest, and special effort should therefore be taken to ensure it is completely clear. The concept of the bipolar see-saw needs to be explained somewhere. A box examining the timing relationship between CO2 and temperature may be warranted. [Robert Kopp, USA]
Accepted. This part of the section is modified. The discussion of lead and lag is broadened and Shakun et al. (2012) paper is cited
5-732 5 14 55 58 This is a point - or explanation - that could be elevated to the Exec Summ - mainly because it is often cited as evidence that temp drives CO2 rather than the other way around. I know it's a stupid argument, but why not make it clear to any policy makers who are confused by the misinformation being pushed by some. [Jonathan Overpeck, USA]
Accepted. The discussion of lead and lags is broadened.
5-733 5 14 55 I have not carefully re-read Siegenthaler, but I am very surprised if there is any clear evidence for a lead in a termination by several thousand years. In an inception maybe. But in the last termination (which is the only one where we have really good resolved data), the lead of Antarctic temperature is a few hundred years (Monnin) or less (Loulergue 2007, CP). And actually looking again at Siegenthaler, the highest lag they cite in a termination is 2800 years (not several thousand) and this is for one of the poorly resolved early termiantions. In fact they go on to cite other studies that clearly converge on a few hundred years for the better documented recent terminations. There is also a submitted paper (Shakun et al, Nature) that shows that the lead of global temperature is approximately zero, and this should be used if it is published in time. It will allow a much clearer explanation of the relationship among global T, Antarctic T and CO2. [Eric Wolff, United Kingdom of Great Britain & Northern Ireland]
Accepted. Shakun et al. (2012) paper is cited. Differences between different terminations are mentioned.
5-734 5 14 56 Is the "bipolar seesaw" explained clearly anywhere in the text? The average reader will not know what this is; define it somewhere so this and the additional mentions of it on Page 5-17, Lines 3 and 6 make more sense. [Jay Curt Stager, United States of America]
Accepted. The meaning of "bipolar seesaw" is clarifired.
5-735 5 14 58 15 31 A distinction needs to be made between CO2 as a "driver" (Line 1, p 15) and CO2 as a feedback (Line 30-31 p 15). The point needs to be made that on the orbital timescale CO2 seems to be a feedback to orbital cycles not the primary driver (as we are introducing now). People will jump on this statement (with the usual known lag between T and CO2) so you need to be clear about it [William Howard, Australia]
Accepted. The word "driving" is removed
5-736 5 14 58 "principal role of CO2 variations" - again, why is this dominant? CO2 is a feedback. [Alan Robock, USA] Accepted. The sentense is corrected
5-737 5 14 I think it needs clarifying that you are discussing only fast feedbacks and not looking at the Earth System Sensitivity (e.g. Hansen et al, Lunt et al, 2011; Pagani et al 2010). The Earth System sensitivity would be higher, and I feel may exceed 6oC even as Charney sensitivity doesn’t. [Christopher Brierley, UK]
This comment is related to the subsection 5.3.3.
5-738 5 15 1 15 1 I would here leave "Antarctic" out. Remember the climate sceptics/denialists. If you like you can leave "Antarctic" in there, to remain fully precise and correct; but then I would add at the end of the sentence something along the lines ", which confirms the theoretical expectation of the forcing role of CO2 for temperature in general". [Andreas Fischlin, Switzerland]
Accepted. The discussion of lead and lags are broadened and now include both hemispheres
5-739 5 15 1 15 7 It is not clear if the length of summer season is the first order effect. Also interesting is that the GCMs are not able to simulate Antarctic seasonality (Laepple et al., 2011, also reply). [Gerrit Lohmann, Germany]
This paragraph is removed because of space limitation
5-740 5 15 4 15 4 delete e from "eprecessional"? [Peter Barrett, New Zealand] Editorial

Expert Review Comments on the IPCC WGI AR5 First Order Draft -- Chapter 5
Do not Cite, Quote or Distribute Page 59 of 157
Comment No
Chapter FromPage
FromLine
To Page
To Line Comment Response
5-741 5 15 4 15 4 "eprecessional". Change to "precessional". [Andrew Glikson, Australia] Editorial
5-742 5 15 4 15 4 typo: "eprocessional" [Michael Mann, USA] Editorial
5-743 5 15 4 15 4 precessional' not 'eprecessional' [Mark Siddall, UK] Editorial
5-744 5 15 4 15 4 What does "eprecessional" mean? Should this be "precessional"? [Graham Weedon, UK] Editorial
5-745 5 15 4 7 This last sentence is another that seems to dwell on uncertainty rather than saying what can be said with confidence estimates. That is, the coincidence doesn't make it impossible to garner understanding, does it? It just lowers confidence? Its just too vague as written. [Jonathan Overpeck, USA]
This paragraph is removed because of space limitation
5-746 5 15 4 eprecessional --> precessional [Masa KAGEYAMA, France] Editorial
5-747 5 15 4 eprecessional… [Jonathan Overpeck, USA] Editorial
5-748 5 15 4 precesssional [Alan Robock, USA] Editorial
5-749 5 15 4 "coincidence between maxima" - But if it is non-linear, doesn't this have to be run through a climate model and not just studied with correlations? [Alan Robock, USA]
This paragraph is removed because of space limitation
5-750 5 15 4 remove “e” from “e”precessional” [Franco Talarico, Italy] Editorial
5-751 5 15 4 Correct mispelled word "eprecessional" [Dunia H. Urrego, France-USA] Editorial
5-752 5 15 4 This statement maybe needs to reference Laepple et al 2011, Nature 471, 94, and the critique in Sime Nature 479, E1-2 [Eric Wolff, United Kingdom of Great Britain & Northern Ireland]
This paragraph is removed because of space limitation
5-753 5 15 5 15 5 austral is a candidate for the glossary [Andreas Fischlin, Switzerland] "austral" is a rather commonl term
5-754 5 15 6 cite: Laepple, T., Werner, M., and Lohmann, G. (2011). Synchronicity of Antarctic temperatures and local solar insolation on orbital timescales. Nature 471, 91-94. [Hubertus Fischer, Switzerland]
This paragraph is removed because of space limitation
5-755 5 15 9 15 9 modeling → modelling [Peter Burt, UK] Accepted and apply for whole text
5-756 5 15 9 15 9 Maybe it is the way it is stated, but is there really any question that the oribital parameters greatly affect the climate: causing ice ages, and also causing the broad-scale interglacial climate variability, this has been known since CLIMAP and COHMAP days. This has been so well established that to claim this is the result of recent modelling work understates the reality. Perhaps you mean the recent modelling attempts are better quantifying the details of the relation, or something like that. [Konrad Gajewski, Canada]
This is precisely what is written in the text: recent modleing attempts confirm previous speculations about the role of the orbital forcing in driving glacial cycles.
5-757 5 15 9 20 why need this para? What's the point? Reads more like a review than an assessment. [Jonathan Overpeck, USA]
I would suggest to shorten modeling discussion by combining this and the next para.
5-758 5 15 10 15 12 Alone the orbital forcing? I would contest this. I therefore think you need to mention that CO2 and other feedbacks are all included here and that this 10°C difference is a difference between equilibria. [Andreas Fischlin, Switzerland]
Rejected. 10C summer tempertaure difference mentioned in the text is the response to the orbital forcing alone
5-759 5 15 15 15 15 Milankovitch → Croll-Milankovitch [Peter Burt, UK] Rejected. "Milankovitch theory" is much more gnerally accepted term than "Croll-Milankovitch theory" (25/1)
5-760 5 15 15 15 16 "Milankovitch theory that a reduction in summer insolation produces sufficient cooling to .." is not correct. Milankovich has not proposed the NH ice sheet growth based on NH insolation. This is based on Imbrie et al. [Gerrit Lohmann, Germany]
Rejected. Milankovich theory is based on the assumption that the NH ice sheet growth based on NH summer insolation
5-761 5 15 15 Mention that reduction in summer insulation in the “northern hemisphere”??? or is this statement relevant for both hemispheres. Please clarify. [Rob Wilson, United Kingdom of Great Britain & Northern Ireland]
Accepted. NH is added
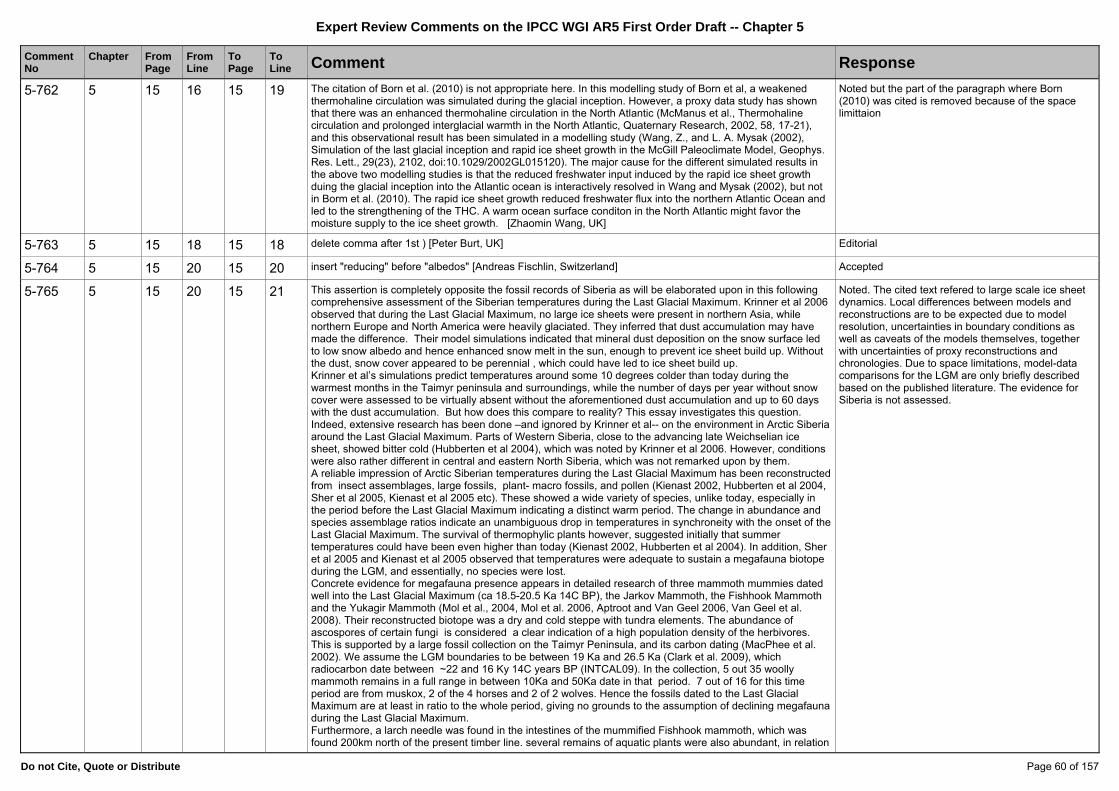
Expert Review Comments on the IPCC WGI AR5 First Order Draft -- Chapter 5
Do not Cite, Quote or Distribute Page 60 of 157
Comment No
Chapter FromPage
FromLine
To Page
To Line Comment Response
5-762 5 15 16 15 19 The citation of Born et al. (2010) is not appropriate here. In this modelling study of Born et al, a weakened thermohaline circulation was simulated during the glacial inception. However, a proxy data study has shown that there was an enhanced thermohaline circulation in the North Atlantic (McManus et al., Thermohaline circulation and prolonged interglacial warmth in the North Atlantic, Quaternary Research, 2002, 58, 17-21), and this observational result has been simulated in a modelling study (Wang, Z., and L. A. Mysak (2002), Simulation of the last glacial inception and rapid ice sheet growth in the McGill Paleoclimate Model, Geophys. Res. Lett., 29(23), 2102, doi:10.1029/2002GL015120). The major cause for the different simulated results in the above two modelling studies is that the reduced freshwater input induced by the rapid ice sheet growth duing the glacial inception into the Atlantic ocean is interactively resolved in Wang and Mysak (2002), but not in Borm et al. (2010). The rapid ice sheet growth reduced freshwater flux into the northern Atlantic Ocean and led to the strengthening of the THC. A warm ocean surface conditon in the North Atlantic might favor the moisture supply to the ice sheet growth. [Zhaomin Wang, UK]
Noted but the part of the paragraph where Born (2010) was cited is removed because of the space limittaion
5-763 5 15 18 15 18 delete comma after 1st ) [Peter Burt, UK] Editorial
5-764 5 15 20 15 20 insert "reducing" before "albedos" [Andreas Fischlin, Switzerland] Accepted
5-765 5 15 20 15 21 This assertion is completely opposite the fossil records of Siberia as will be elaborated upon in this following comprehensive assessment of the Siberian temperatures during the Last Glacial Maximum. Krinner et al 2006 observed that during the Last Glacial Maximum, no large ice sheets were present in northern Asia, while northern Europe and North America were heavily glaciated. They inferred that dust accumulation may have made the difference. Their model simulations indicated that mineral dust deposition on the snow surface led to low snow albedo and hence enhanced snow melt in the sun, enough to prevent ice sheet build up. Without the dust, snow cover appeared to be perennial , which could have led to ice sheet build up. Krinner et al’s simulations predict temperatures around some 10 degrees colder than today during the warmest months in the Taimyr peninsula and surroundings, while the number of days per year without snow cover were assessed to be virtually absent without the aforementioned dust accumulation and up to 60 days with the dust accumulation. But how does this compare to reality? This essay investigates this question. Indeed, extensive research has been done –and ignored by Krinner et al-- on the environment in Arctic Siberia around the Last Glacial Maximum. Parts of Western Siberia, close to the advancing late Weichselian ice sheet, showed bitter cold (Hubberten et al 2004), which was noted by Krinner et al 2006. However, conditions were also rather different in central and eastern North Siberia, which was not remarked upon by them. A reliable impression of Arctic Siberian temperatures during the Last Glacial Maximum has been reconstructed from insect assemblages, large fossils, plant- macro fossils, and pollen (Kienast 2002, Hubberten et al 2004, Sher et al 2005, Kienast et al 2005 etc). These showed a wide variety of species, unlike today, especially in the period before the Last Glacial Maximum indicating a distinct warm period. The change in abundance and species assemblage ratios indicate an unambiguous drop in temperatures in synchroneity with the onset of the Last Glacial Maximum. The survival of thermophylic plants however, suggested initially that summer temperatures could have been even higher than today (Kienast 2002, Hubberten et al 2004). In addition, Sher et al 2005 and Kienast et al 2005 observed that temperatures were adequate to sustain a megafauna biotope during the LGM, and essentially, no species were lost. Concrete evidence for megafauna presence appears in detailed research of three mammoth mummies dated well into the Last Glacial Maximum (ca 18.5-20.5 Ka 14C BP), the Jarkov Mammoth, the Fishhook Mammoth and the Yukagir Mammoth (Mol et al., 2004, Mol et al. 2006, Aptroot and Van Geel 2006, Van Geel et al. 2008). Their reconstructed biotope was a dry and cold steppe with tundra elements. The abundance of ascospores of certain fungi is considered a clear indication of a high population density of the herbivores. This is supported by a large fossil collection on the Taimyr Peninsula, and its carbon dating (MacPhee et al. 2002). We assume the LGM boundaries to be between 19 Ka and 26.5 Ka (Clark et al. 2009), which radiocarbon date between ~22 and 16 Ky 14C years BP (INTCAL09). In the collection, 5 out 35 woolly mammoth remains in a full range in between 10Ka and 50Ka date in that period. 7 out of 16 for this time period are from muskox, 2 of the 4 horses and 2 of 2 wolves. Hence the fossils dated to the Last Glacial Maximum are at least in ratio to the whole period, giving no grounds to the assumption of declining megafauna during the Last Glacial Maximum. Furthermore, a larch needle was found in the intestines of the mummified Fishhook mammoth, which was found 200km north of the present timber line. several remains of aquatic plants were also abundant, in relation
Noted. The cited text refered to large scale ice sheet dynamics. Local differences between models and reconstructions are to be expected due to model resolution, uncertainties in boundary conditions as well as caveats of the models themselves, together with uncertainties of proxy reconstructions and chronologies. Due to space limitations, model-data comparisons for the LGM are only briefly described based on the published literature. The evidence for Siberia is not assessed.
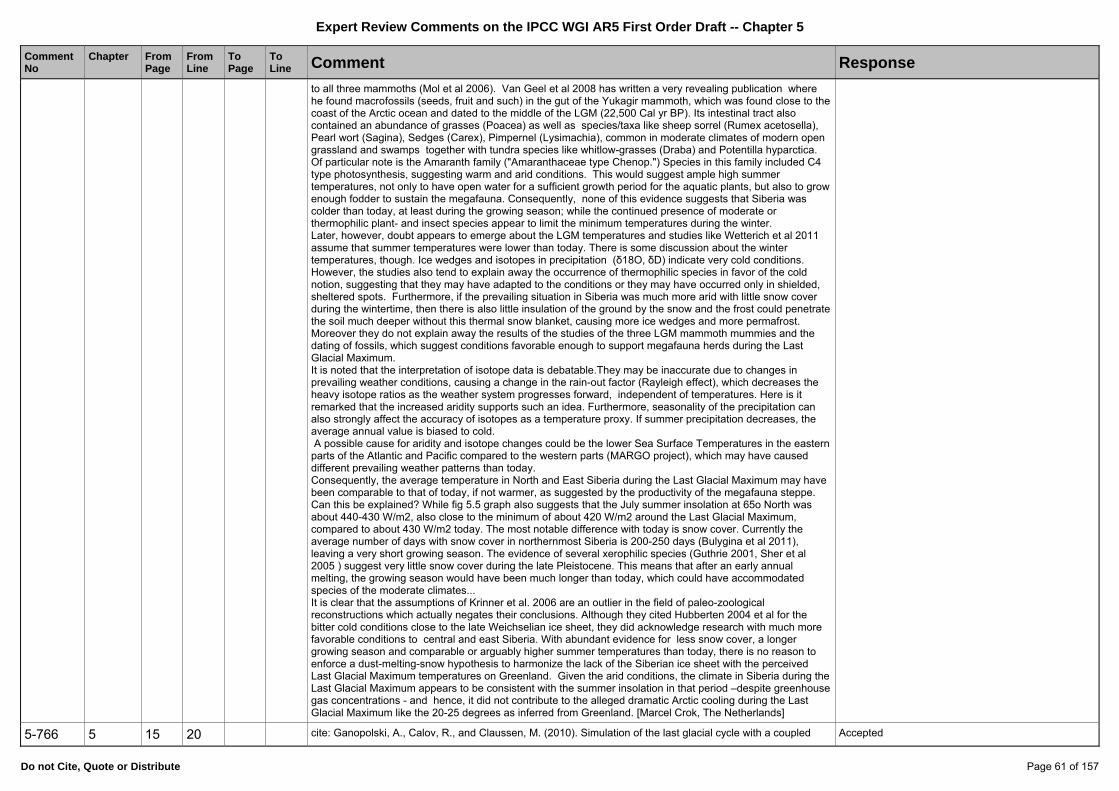
Expert Review Comments on the IPCC WGI AR5 First Order Draft -- Chapter 5
Do not Cite, Quote or Distribute Page 61 of 157
Comment No
Chapter FromPage
FromLine
To Page
To Line Comment Response
to all three mammoths (Mol et al 2006). Van Geel et al 2008 has written a very revealing publication where he found macrofossils (seeds, fruit and such) in the gut of the Yukagir mammoth, which was found close to the coast of the Arctic ocean and dated to the middle of the LGM (22,500 Cal yr BP). Its intestinal tract also contained an abundance of grasses (Poacea) as well as species/taxa like sheep sorrel (Rumex acetosella), Pearl wort (Sagina), Sedges (Carex), Pimpernel (Lysimachia), common in moderate climates of modern open grassland and swamps together with tundra species like whitlow-grasses (Draba) and Potentilla hyparctica. Of particular note is the Amaranth family ("Amaranthaceae type Chenop.") Species in this family included C4 type photosynthesis, suggesting warm and arid conditions. This would suggest ample high summer temperatures, not only to have open water for a sufficient growth period for the aquatic plants, but also to grow enough fodder to sustain the megafauna. Consequently, none of this evidence suggests that Siberia was colder than today, at least during the growing season; while the continued presence of moderate or thermophilic plant- and insect species appear to limit the minimum temperatures during the winter. Later, however, doubt appears to emerge about the LGM temperatures and studies like Wetterich et al 2011 assume that summer temperatures were lower than today. There is some discussion about the winter temperatures, though. Ice wedges and isotopes in precipitation (δ18O, δD) indicate very cold conditions. However, the studies also tend to explain away the occurrence of thermophilic species in favor of the cold notion, suggesting that they may have adapted to the conditions or they may have occurred only in shielded, sheltered spots. Furthermore, if the prevailing situation in Siberia was much more arid with little snow cover during the wintertime, then there is also little insulation of the ground by the snow and the frost could penetrate the soil much deeper without this thermal snow blanket, causing more ice wedges and more permafrost. Moreover they do not explain away the results of the studies of the three LGM mammoth mummies and the dating of fossils, which suggest conditions favorable enough to support megafauna herds during the Last Glacial Maximum. It is noted that the interpretation of isotope data is debatable.They may be inaccurate due to changes in prevailing weather conditions, causing a change in the rain-out factor (Rayleigh effect), which decreases the heavy isotope ratios as the weather system progresses forward, independent of temperatures. Here is it remarked that the increased aridity supports such an idea. Furthermore, seasonality of the precipitation can also strongly affect the accuracy of isotopes as a temperature proxy. If summer precipitation decreases, the average annual value is biased to cold. A possible cause for aridity and isotope changes could be the lower Sea Surface Temperatures in the eastern parts of the Atlantic and Pacific compared to the western parts (MARGO project), which may have caused different prevailing weather patterns than today. Consequently, the average temperature in North and East Siberia during the Last Glacial Maximum may have been comparable to that of today, if not warmer, as suggested by the productivity of the megafauna steppe. Can this be explained? While fig 5.5 graph also suggests that the July summer insolation at 65o North was about 440-430 W/m2, also close to the minimum of about 420 W/m2 around the Last Glacial Maximum, compared to about 430 W/m2 today. The most notable difference with today is snow cover. Currently the average number of days with snow cover in northernmost Siberia is 200-250 days (Bulygina et al 2011), leaving a very short growing season. The evidence of several xerophilic species (Guthrie 2001, Sher et al 2005 ) suggest very little snow cover during the late Pleistocene. This means that after an early annual melting, the growing season would have been much longer than today, which could have accommodated species of the moderate climates... It is clear that the assumptions of Krinner et al. 2006 are an outlier in the field of paleo-zoological reconstructions which actually negates their conclusions. Although they cited Hubberten 2004 et al for the bitter cold conditions close to the late Weichselian ice sheet, they did acknowledge research with much more favorable conditions to central and east Siberia. With abundant evidence for less snow cover, a longer growing season and comparable or arguably higher summer temperatures than today, there is no reason to enforce a dust-melting-snow hypothesis to harmonize the lack of the Siberian ice sheet with the perceived Last Glacial Maximum temperatures on Greenland. Given the arid conditions, the climate in Siberia during the Last Glacial Maximum appears to be consistent with the summer insolation in that period –despite greenhouse gas concentrations - and hence, it did not contribute to the alleged dramatic Arctic cooling during the Last Glacial Maximum like the 20-25 degrees as inferred from Greenland. [Marcel Crok, The Netherlands]
5-766 5 15 20 cite: Ganopolski, A., Calov, R., and Claussen, M. (2010). Simulation of the last glacial cycle with a coupled Accepted

Expert Review Comments on the IPCC WGI AR5 First Order Draft -- Chapter 5
Do not Cite, Quote or Distribute Page 62 of 157
Comment No
Chapter FromPage
FromLine
To Page
To Line Comment Response
climate ice-sheet model of intermediate complexity. Climate of the Past 6, 229-244. [Hubertus Fischer, Switzerland]
5-767 5 15 22 15 22 "models" : of which level of complexity? [Bernard De Saedeleer, Belgium] Accepted. It is now specified: "different degrees of complexity"
5-768 5 15 22 15 25 Bonelli et al 2009 and Ganopolski et al 2010 are at odds with the fossil records of Yukon Canada. Bonelli’s Fig 4 shows a persistent thick ice sheet of at least 4000 meter thickness on the Yukon Territory, Canada, between 75K and 21K years. Ganapolski shows a similar map for 21K years This area, however, happens to produce an abundance of megafauna fossils dated throughout the late Pleistocene, covering most of that period (ie Zazula et al 2007, Harington 2011). Abe-Ouchi et al 2007 appear to observe the Yukon record in their fig 7 correctly, however they project the late Weichselian ice sheet too far into Siberia, where none existed. Moreover they infer tens of degrees colder conditions in Siberia during the Last Glacial Maximum. Obviously all these publications have some tension with the observation that things are in agreement with paleoclimate data. Furthermore, there are detailed models constructed upon the ice sheet–sea level “yo-yo”. Bintanja et al. (2002) contend that during the Last Glacial Maximum the Eurasian ice sheets contributed the most to the sea level lowering (64.6 meters –fig 3), this would have required an ice sheet mass almost equivalent to present day Antarctica. In reality, the only available ice sheet centered on Fennoscandia was very limited in size (Mangerud et al 2002, Hubberten et al 2004), comprising an area about twice the size of current Greenland. This implies that it could only have contributed some 12-14 meters to the sea level balance. Hence, there is a deficiency of about 50 meters of sea level versus the extent of the ice sheets, which accumulates with deficiencies found for the extentof glaciation of Antarctica during the Last Glacial Maximum, (Gore et al 2001, Anderson et al. 2004, Waddington et al, 2005, Hillenbrand et al 2012). The glaciation in the Himalayas was less than previously assumed (Finkel et al 2003). In addition, the North American glaciation had its restrictions, as evidenced, for instance, by the abundant late Pleistocene fossil record from the Yukon territory, which demonstrates that,together with the enigmatic 100k-year cycle, our current knowledge of the real processes surrounding the last glaciation is still very poor. For instance, how could the oceanic CO2 overturning (Marchitto et al. 2007) have been caused by warming when temperatures of the deep ocean waters (Bathypelagic and Abyssopelagic) are near constant 0-3 ºC (thermocline) anywhere, Arctic or tropics alike (Gibson et al. 2007). Without firm evidence of the hypotheses about ice sheet volume and temperature changes, there is no ground for speculation about which are the main driving forces in paleoclimate change. [Marcel Crok, The Netherlands]
Noted. See also answer to comment 5-765. The detailed comparison of ice sheet model simulations outputs with field evidence is beyond the scope of this chapter. Revised text mentions : "Comprehensive understanding of the dynamics of glacial cycles, especially its strongly nonlinear aspects, remains a scientific challenge".
5-769 5 15 22 15 31 The models are not able to simulate the cycles without some severe assumptions (dust, ocean circulation etc.) [Gerrit Lohmann, Germany]
Noted.
5-770 5 15 23 15 25 I see no ice volume or other ice characteristic in Figure 5.5. [Andreas Fischlin, Switzerland] Noted. Ice volume is expressed in term of global sea level
5-771 5 15 23 25 maybe it should be explained here that the approach of Abe-Ouchi et al (2007), based on computing several climate states a priori and using combinations of these to force an ice-sheet model is different from Bonelli 2009 or Ganopolski 2010 who use an EMIC model coupled to an ice-sheet model [Masa KAGEYAMA, France]
Noted.The cited paper are based on different modeling approach but there is no space to dicuss these technical issues. Revised text precises"Climate-ice sheet models with varying degrees of complexity ".
5-772 5 15 26 15 28 The statement is not very clear : please give some details ? [Bernard De Saedeleer, Belgium] Taken into account. The statement is clarified
5-773 5 15 28 15 28 Submitted → submitted [Peter Burt, UK] Editorial
5-774 5 15 28 15 28 I guess you mean the simulated amplitude. If yes, then please say so or the statement is difficult to understand. [Andreas Fischlin, Switzerland]
Accepted. The word "simulated" is added
5-775 5 15 31 15 31 "well"? Please be clearer what you mean by "well". Do we understand hardly a thing here (I would not agree) or do you mean not yet fully understood? [Andreas Fischlin, Switzerland]
Accepted. "not yet well undertsood" is changed to "not fully understood"
5-776 5 15 33 15 42 I suggest including the modelling work of Bintanja and colleagues concerning the MPT here. I think the implications of this work may be particularly important for the MPT: Bintanja, R., van de Wal, R.S.W., 2008.
Noted but this paragraph is removed because of space limitation

Expert Review Comments on the IPCC WGI AR5 First Order Draft -- Chapter 5
Do not Cite, Quote or Distribute Page 63 of 157
Comment No
Chapter FromPage
FromLine
To Page
To Line Comment Response
North American ice-sheet dynamics and the onset of 100,000-year glacial cycles. Nature 454, 869–872.... [Mark Siddall, UK]
5-777 5 15 34 15 34 "beween around 1.3 Ma and 0.7 Ma (MPT)" : I know the MPT, but I don't know the other transition @ 1.3 Ma : what is its name ? [Bernard De Saedeleer, Belgium]
Noted but this paragraph is removed because of space limitation
5-778 5 15 34 15 34 Add primary references to mid Pleistocene transition: Pisias, N.G., and Moore, T.C., 1981. The evolution of Pleistocene climate: a time series approach. Earth Planetary Sci. Lett. 52, 450-458. And: Ruddiman, W.F., Raymo, M. and McIntyre, A. 1986. Matuyama 41,000-year cycles: North Atlantic Ocean and northern hemisphere ice sheets. Earth Planet. Sci. Lett. 80, 117-129. [Graham Weedon, UK]
Noted but this paragraph is removed because of space limitation
5-779 5 15 34 15 37 This paragraph doesn't make sense, especially when the authors talk about the changes in subglacial conditions DUE TO glacial erosion of a thick regolith layer [CATHERINE BELTRAN, France]
Noted but this paragraph is removed because of space limitation
5-780 5 15 35 15 37 How should erosion of a thick regolith layer change atmospheric CO2, i.e. gradually lower it? I can't follow at all and I fear most reader would neither. [Andreas Fischlin, Switzerland]
Noted but this paragraph is removed because of space limitation
5-781 5 15 35 is --> are, explanation --> explanationS. [Masa KAGEYAMA, France] Editorial
5-782 5 15 36 add 'the' between during and Pleistocene [Elie Verleyen, Belgium] Editorial
5-783 5 15 37 15 38 "or changes in subglacial conditions due to glacial erosion of a thick regolith layer (Clark and Pollard, 1998; Clark et al., 2006; Ganopolski and Calov, Submitted)." A brief explanation of the proposed mechanism would help here. As a geneal comment, such brief explanations, where known, would greatly help with the readability of the report. [Andrew Glikson, Australia]
Noted but this paragraph is removed because of space limitation
5-784 5 15 39 15 40 again Milankovich theory shall be replaced [Gerrit Lohmann, Germany] Rejected. The use of "Milankovitch theory" is correct
5-785 5 15 39 Again, this reads like a interesting review for other specialists rather than an assessment for the IPCC. "an apparent problem for classical Milankovitch theory"??? Way too vague and what's the point? To make readers think that all of the other text regarding orbital forcing might be wrong? I think you could delete this para. Or if not, you need to highlight why its relevant to the assessment and also be more precise about what you mean. But, this is way into the world of specialist debates, no? (and, I think interesting, but not for policy-makers) [Jonathan Overpeck, USA]
Noted. Text revised.
5-786 5 15 41 15 41 replace "were" with "have been" [Peter Barrett, New Zealand] Editorial
5-787 5 15 44 15 44 Fig 5.5 also demonstrates that the substantial interglacial spike at 440-380 ka in the graphs b-g is not reflected at all in graph a, the summer 65N insolation, which shows a minimum in local amplitude. This clearly runs counter to the assumption that orbital cycles control ice ages. [Marcel Crok, The Netherlands]
Noted. There are different aspects in orbital forcing vs glacial interglacial dynamics. There is strong consensus on the role of orbital forcing as a pacemaker of transitions, as well as open questions such as the mechanisms responsible for different intensities of interglacial periods.
5-788 5 15 51 15 51 to be consistent with other figures in this chapter you should show Rohling et al 2009 alongside Waelbroeck 2002 [Mark Siddall, UK]
Noted but not implemented in revised Figure because of readability as the figure also includes several datasets.
5-789 5 15 52 15 52 Waelbroeck et al 2002 only covers the last 400 ka. It could easily be extended here, or you could use: Siddall M., Hönisch B., Waelbroeck C., Huybers P., 2010: Changes in deep Pacific temperature during the mid-Pleistocene transition and Quaternary, Quaternary Science Reviews, 29(1-2), 170-182, [Mark Siddall, UK]
Accepted
5-790 5 15 57 16 15 In all this discussion of the Last Interglacial no where is it stated that the LIG occurred largely at greenhouse gas concentrations characteristic of the perindustrial Holocene, thus the LIG provides a means of (at least attempting to) separate (imperfectly) GHG forcings from internal feedbacks and orbital forcing [William Howard, Australia]
Accepted - text revised
5-791 5 15 Fig. 5.5: in b) replace EPICA community members, 2004 by Lüthi et al., 2008 [Hubertus Fischer, Switzerland] Editorial

Expert Review Comments on the IPCC WGI AR5 First Order Draft -- Chapter 5
Do not Cite, Quote or Distribute Page 64 of 157
Comment No
Chapter FromPage
FromLine
To Page
To Line Comment Response
5-792 5 16 1 16 5 It could be relevant to mention the Past4future project, which is a Collaborative Project under the 7th Framework Programme of the European Commission. Similarly to PMIP and MARGO projects, the aim is to compare and combine results from models and data (proxies), with a focus on interglacial periods. They investigate notably climate dynamic and abrupt changes overs these periods. Particularly, the last interglacial (5e) since it could be an analogue for the future climatic conditions (cf. http://www.past4future.eu). [Sophie Bonnet, Canada]
Rejected - no peer-reviewed published literature
5-793 5 16 4 16 5 "No systematic simulations have been conducted ..." what is the meaning systematic? PMIP or climate sensitivity studies? [Gerrit Lohmann, Germany]
Accepted - text revised
5-794 5 16 5 not yet useful --> not useful yet ? [Masa KAGEYAMA, France] Editorial
5-795 5 16 7 16 7 delete comma after 'ice' [Peter Burt, UK] Editorial
5-796 5 16 7 16 12 It is premature to conclude that interglacials from the interval 430-800 kyr BP were ‘cooler’ or ‘weaker’ compared to post-430 kyr BP interglacials and that this is a “globally robust feature”. This is not observed in some terrestrial archives from Eurasia (Prokopenko et al., 2002; Yin & Guo, 2008), suggesting the presence of regional variability. Moreover, recent temperature reconstructions from Britain show that the earlier interglacials (450-780 kyr BP) were as warm as, and in some cases warmer than, those after 430 kyr BP (Candy et al., 2010) [Chronis Tzedakis, UK]
Accepted - text revised to better address the presence of regional variability concerning early versus late interglacials
5-797 5 16 7 16 12 Candy I. et al. (2010) Pronounced warmth during early Middle Pleistocene interglacials: Investigating the Mid-Brunhes Event in the British terrestrial sequence. Earth-Science Reviews 103, 183–196. [Chronis Tzedakis, UK]
Taken into account - combined with comment 797
5-798 5 16 7 16 12 Prokopenko, A. A. et al. (2002) Muted climate variations in continental Siberia during the mid-Pleistocene epoch. Nature 418, 65-68. [Chronis Tzedakis, UK]
Taken into account - combined with comment 797
5-799 5 16 7 16 12 Yin, Q. & Guo, Z. T. (2008)Strong summer monsoon during the cool MIS-13. Clim. Past 4, 29-34. [Chronis Tzedakis, UK]
Taken into account - combined with comment 797
5-800 5 16 8 16 8 geographic → geographical [Peter Burt, UK] Editorial
5-801 5 16 9 delete ',' between controls and of [Elie Verleyen, Belgium] Editorial
5-802 5 16 10 16 10 Rohling et al now has a doi number: doi.org/10.1175/2011JCLI4078.1 [Mark Siddall, UK] Editorial
5-803 5 16 11 16 11 What is meant by "stronger interglacials"? Warmer? Higher variability? Please be more specific. [Hans W Linderholm, Sweden]
Accepted - text revised
5-804 5 16 12 16 12 insert comma after 'earlier' [Peter Burt, UK] Editorial
5-805 5 16 12 16 13 Interglacials during the interval 430-800 kyr BP are indeed characterized by greater benthic foraminiferal oxygen isotope (d18Obenthic) values. The latter may point to lower-than-present sea-level highstands, but the magnitude of the deep-water temperature component of d18Obenthic has not been evaluated; it is thus possible that the greater d18Obenthic values reflect lower deep-water temperatures instead of greater residual ice. Until this is undertaken, or independent and direct sea-level determinations become available it may be premature to conclude that these earlier interglacials were characterized by higher ice volumes than post-430 kyr BP interglacials. [Chronis Tzedakis, UK]
Accepted - text revised
5-806 5 16 13 16 13 GHG → GHGs [Peter Burt, UK] Editorial
5-807 5 16 14 16 connection to the phase between precession and obliquity through time... --> this needs more explanations. As it is now, the whole sentence is not very useful. It would be easier to understand each mechanism with a brief summary of each study, before concluding. [Masa KAGEYAMA, France]
Accepted - text revised within space limitations
5-808 5 16 15 16 16 You mean each three times "connection to"? Wording is not very clear. Please improve, perhaps by inserting each time "to". [Andreas Fischlin, Switzerland]
Accepted - text revised

Expert Review Comments on the IPCC WGI AR5 First Order Draft -- Chapter 5
Do not Cite, Quote or Distribute Page 65 of 157
Comment No
Chapter FromPage
FromLine
To Page
To Line Comment Response
5-809 5 16 16 16 16 The strength of the preceding glacial is not a feature that can consistently be applied to explain the higher interglacial intensities after 430 kyr BP. There are weak glacials during that period (e.g. MIS 8) and indeed one of the strongest glacials (MIS 16) occurred before 430 kyr BP. [Chronis Tzedakis, UK]
Accepted - text revised
5-810 5 16 18 17 9 This whole discussion needs to be much more rigorous. It seems that the lack of consensus between models and data and the lack of many rigorous statistical analyses of LIG temperarture means that we cannot say much. I am not convinced that the data is informative enough to cite 'medium confidence' when there are many unanswered questions. I also struggle to see how a mean ocean surface temperature of 0.4 to 0.3 degsC (70% of the earths surface) translates to a global mean warming of 2 degsC [Mark Siddall, UK]
Accepted - text revised to better assess data uncertainties, including seasonality and chronology. Text also revised to assess confidence in published estimates of global mean warming
5-811 5 16 19 16 19 It is difficult to see on that Fig. [Bernard De Saedeleer, Belgium] Taken into account. Figure revised.
5-812 5 16 19 this period is very difficult to spot on Fig 5.2. Maybe include a zoom on the last 8 glacial-interglacial cycles? [Masa KAGEYAMA, France]
Taken in to account - combined with comment 812
5-813 5 16 21 16 22 The LIG estimate of global mean annual temperature of ~2°C warmer than pre-industrial should be considered preliminary at this stage. By extension, it is not yet clear whether this can be included in the executive summary (5-3, line 39). The majority of the data compiled for this (Clark & Huybers, 2009; Turney & Jones, 2010; McKay et al., 2011) are from marine records and the careful assessment by McKay et al. (2011) of the different SST proxies and comparison with the SSTs of Turney & Jones (2010) suggests peak LIG SSTs of 0.7°±0.6 °C compared to late Holocene. Beside Greenland and Antarctic ice cores, the Clark & Huybers (2009) data set only includes reconstructions from two high-latitude pollen records and as such may well be overestimating the extent of the temperature anomaly. [Chronis Tzedakis, UK]
Taken into account - combined with comment 811
5-814 5 16 21 16 22 The vast majority of terrestrial data of the Turney & Jones (2010) synthesis essentially rely on two exercises to reconstruct temperatures from pollen records in Eurasia (Kaspar et al., 2005; Velichko et al., 2008). The problem is that this conflates temperatures from two demonstrably different periods: Kaspar et a (2005) reconstructed temperatures during the Corylus pollen zone, which corresponds to ~125 kyr BP. Velichko et al. (2008), on the other hand, reconstructed temperatures from the Carpinus pollen zone, which follows the Corylus zone and may well reflect slightly cooler conditions. In addition, by using only presence-absence of pollen taxa, rather than pollen abundances, Kaspar et al. may be underestimating the amplitude of warming. New reconstructions and compilations are much needed to address these issues. [Chronis Tzedakis, UK]
Taken into account - combined with comment 811
5-815 5 16 21 What about the McKay et al 2011 paper you cite later in the text - need to take that into account here. [Jonathan Overpeck, USA]
Accepted - text revised
5-816 5 16 22 16 22 a → an [Peter Burt, UK] Editorial
5-817 5 16 22 16 22 preindustrial → pre-industrial [Peter Burt, UK] Editorial
5-818 5 16 22 16 22 It is not acceptable to cite a Nature News and Views in this context. N&Vs is essentially 'grey literature'. This cannot be compared with the rigorous modelling efforts noted later. How large is the uncertainty? It is hard to imagine that the LIG was as warm as the Mid Pliocene with such different forcing...are you actually confident to state 2 degsC on the basis of the evidence presented?? [Mark Siddall, UK]
Taken into account - combined with comment 811
5-819 5 16 22 24 It should be made clear that the uncertainties due to seasonality and spatial coverage most likely drive a warm bias, since the majority of records are summer sensitive, from the northern Hemisphere [Nicholas McKay, United States]
Taken into account - combined with comment 811
5-820 5 16 22 LIG 2°C warmer than preindustrial --> globally, regionally? [Masa KAGEYAMA, France] Taken into account - combined with comment 811
5-821 5 16 22 This kind of information is most informative when it also refers to the present day, not to preindustrial times. The average reader is more concerned with how the future or past may differ from the familiar conditions of here and now; referring them mainly to preindustrial conditions requires them to carry yet another abstract concept or number in mind as they sift through this maze of unfamiliar material. I therefore recommend that a reference to modern conditions (say, AD 2000 or even 1950) be included alongside every such reference to preindustrial conditions, perhaps in parentheses for the sake of clarity. [Jay Curt Stager, United States of
Rejected - no peer-reviewed published literature to assess
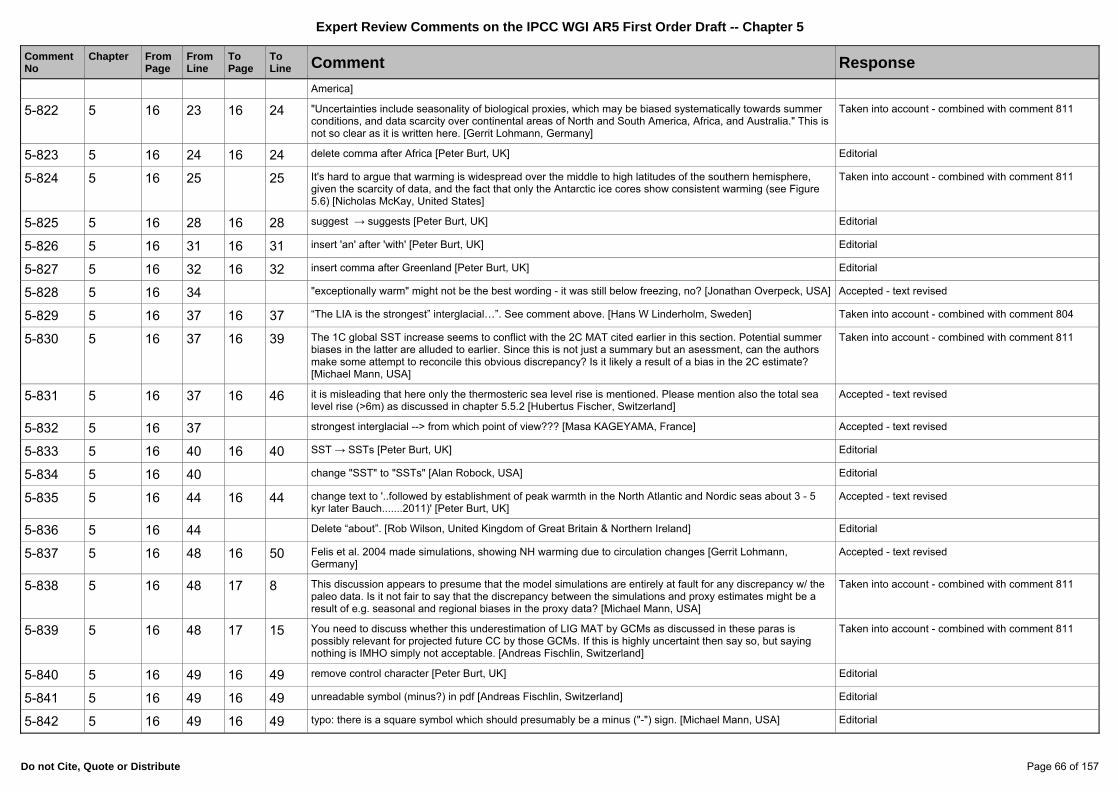
Expert Review Comments on the IPCC WGI AR5 First Order Draft -- Chapter 5
Do not Cite, Quote or Distribute Page 66 of 157
Comment No
Chapter FromPage
FromLine
To Page
To Line Comment Response
America]
5-822 5 16 23 16 24 "Uncertainties include seasonality of biological proxies, which may be biased systematically towards summer conditions, and data scarcity over continental areas of North and South America, Africa, and Australia." This is not so clear as it is written here. [Gerrit Lohmann, Germany]
Taken into account - combined with comment 811
5-823 5 16 24 16 24 delete comma after Africa [Peter Burt, UK] Editorial
5-824 5 16 25 25 It's hard to argue that warming is widespread over the middle to high latitudes of the southern hemisphere, given the scarcity of data, and the fact that only the Antarctic ice cores show consistent warming (see Figure 5.6) [Nicholas McKay, United States]
Taken into account - combined with comment 811
5-825 5 16 28 16 28 suggest → suggests [Peter Burt, UK] Editorial
5-826 5 16 31 16 31 insert 'an' after 'with' [Peter Burt, UK] Editorial
5-827 5 16 32 16 32 insert comma after Greenland [Peter Burt, UK] Editorial
5-828 5 16 34 "exceptionally warm" might not be the best wording - it was still below freezing, no? [Jonathan Overpeck, USA] Accepted - text revised
5-829 5 16 37 16 37 “The LIA is the strongest” interglacial…”. See comment above. [Hans W Linderholm, Sweden] Taken into account - combined with comment 804
5-830 5 16 37 16 39 The 1C global SST increase seems to conflict with the 2C MAT cited earlier in this section. Potential summer biases in the latter are alluded to earlier. Since this is not just a summary but an asessment, can the authors make some attempt to reconcile this obvious discrepancy? Is it likely a result of a bias in the 2C estimate? [Michael Mann, USA]
Taken into account - combined with comment 811
5-831 5 16 37 16 46 it is misleading that here only the thermosteric sea level rise is mentioned. Please mention also the total sea level rise (>6m) as discussed in chapter 5.5.2 [Hubertus Fischer, Switzerland]
Accepted - text revised
5-832 5 16 37 strongest interglacial --> from which point of view??? [Masa KAGEYAMA, France] Accepted - text revised
5-833 5 16 40 16 40 SST → SSTs [Peter Burt, UK] Editorial
5-834 5 16 40 change "SST" to "SSTs" [Alan Robock, USA] Editorial
5-835 5 16 44 16 44 change text to '..followed by establishment of peak warmth in the North Atlantic and Nordic seas about 3 - 5 kyr later Bauch.......2011)' [Peter Burt, UK]
Accepted - text revised
5-836 5 16 44 Delete “about”. [Rob Wilson, United Kingdom of Great Britain & Northern Ireland] Editorial
5-837 5 16 48 16 50 Felis et al. 2004 made simulations, showing NH warming due to circulation changes [Gerrit Lohmann, Germany]
Accepted - text revised
5-838 5 16 48 17 8 This discussion appears to presume that the model simulations are entirely at fault for any discrepancy w/ the paleo data. Is it not fair to say that the discrepancy between the simulations and proxy estimates might be a result of e.g. seasonal and regional biases in the proxy data? [Michael Mann, USA]
Taken into account - combined with comment 811
5-839 5 16 48 17 15 You need to discuss whether this underestimation of LIG MAT by GCMs as discussed in these paras is possibly relevant for projected future CC by those GCMs. If this is highly uncertaint then say so, but saying nothing is IMHO simply not acceptable. [Andreas Fischlin, Switzerland]
Taken into account - combined with comment 811
5-840 5 16 49 16 49 remove control character [Peter Burt, UK] Editorial
5-841 5 16 49 16 49 unreadable symbol (minus?) in pdf [Andreas Fischlin, Switzerland] Editorial
5-842 5 16 49 16 49 typo: there is a square symbol which should presumably be a minus ("-") sign. [Michael Mann, USA] Editorial
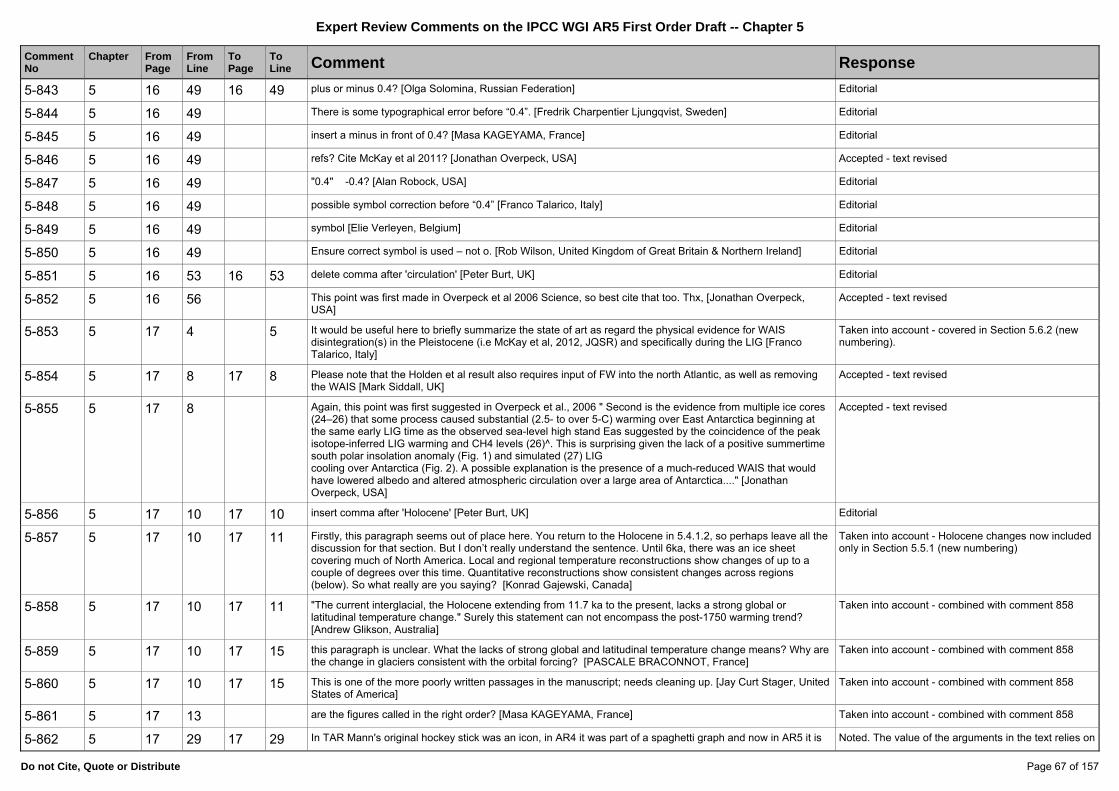
Expert Review Comments on the IPCC WGI AR5 First Order Draft -- Chapter 5
Do not Cite, Quote or Distribute Page 67 of 157
Comment No
Chapter FromPage
FromLine
To Page
To Line Comment Response
5-843 5 16 49 16 49 plus or minus 0.4? [Olga Solomina, Russian Federation] Editorial
5-844 5 16 49 There is some typographical error before “0.4”. [Fredrik Charpentier Ljungqvist, Sweden] Editorial
5-845 5 16 49 insert a minus in front of 0.4? [Masa KAGEYAMA, France] Editorial
5-846 5 16 49 refs? Cite McKay et al 2011? [Jonathan Overpeck, USA] Accepted - text revised
5-847 5 16 49 "0.4" -0.4? [Alan Robock, USA] Editorial
5-848 5 16 49 possible symbol correction before “0.4” [Franco Talarico, Italy] Editorial
5-849 5 16 49 symbol [Elie Verleyen, Belgium] Editorial
5-850 5 16 49 Ensure correct symbol is used – not o. [Rob Wilson, United Kingdom of Great Britain & Northern Ireland] Editorial
5-851 5 16 53 16 53 delete comma after 'circulation' [Peter Burt, UK] Editorial
5-852 5 16 56 This point was first made in Overpeck et al 2006 Science, so best cite that too. Thx, [Jonathan Overpeck, USA]
Accepted - text revised
5-853 5 17 4 5 It would be useful here to briefly summarize the state of art as regard the physical evidence for WAIS disintegration(s) in the Pleistocene (i.e McKay et al, 2012, JQSR) and specifically during the LIG [Franco Talarico, Italy]
Taken into account - covered in Section 5.6.2 (new numbering).
5-854 5 17 8 17 8 Please note that the Holden et al result also requires input of FW into the north Atlantic, as well as removing the WAIS [Mark Siddall, UK]
Accepted - text revised
5-855 5 17 8 Again, this point was first suggested in Overpeck et al., 2006 " Second is the evidence from multiple ice cores (24–26) that some process caused substantial (2.5- to over 5-C) warming over East Antarctica beginning at the same early LIG time as the observed sea-level high stand Eas suggested by the coincidence of the peak isotope-inferred LIG warming and CH4 levels (26)^. This is surprising given the lack of a positive summertime south polar insolation anomaly (Fig. 1) and simulated (27) LIG cooling over Antarctica (Fig. 2). A possible explanation is the presence of a much-reduced WAIS that would have lowered albedo and altered atmospheric circulation over a large area of Antarctica...." [Jonathan Overpeck, USA]
Accepted - text revised
5-856 5 17 10 17 10 insert comma after 'Holocene' [Peter Burt, UK] Editorial
5-857 5 17 10 17 11 Firstly, this paragraph seems out of place here. You return to the Holocene in 5.4.1.2, so perhaps leave all the discussion for that section. But I don’t really understand the sentence. Until 6ka, there was an ice sheet covering much of North America. Local and regional temperature reconstructions show changes of up to a couple of degrees over this time. Quantitative reconstructions show consistent changes across regions (below). So what really are you saying? [Konrad Gajewski, Canada]
Taken into account - Holocene changes now included only in Section 5.5.1 (new numbering)
5-858 5 17 10 17 11 "The current interglacial, the Holocene extending from 11.7 ka to the present, lacks a strong global or latitudinal temperature change." Surely this statement can not encompass the post-1750 warming trend? [Andrew Glikson, Australia]
Taken into account - combined with comment 858
5-859 5 17 10 17 15 this paragraph is unclear. What the lacks of strong global and latitudinal temperature change means? Why are the change in glaciers consistent with the orbital forcing? [PASCALE BRACONNOT, France]
Taken into account - combined with comment 858
5-860 5 17 10 17 15 This is one of the more poorly written passages in the manuscript; needs cleaning up. [Jay Curt Stager, United States of America]
Taken into account - combined with comment 858
5-861 5 17 13 are the figures called in the right order? [Masa KAGEYAMA, France] Taken into account - combined with comment 858
5-862 5 17 29 17 29 In TAR Mann's original hockey stick was an icon, in AR4 it was part of a spaghetti graph and now in AR5 it is Noted. The value of the arguments in the text relies on

Expert Review Comments on the IPCC WGI AR5 First Order Draft -- Chapter 5
Do not Cite, Quote or Distribute Page 68 of 157
Comment No
Chapter FromPage
FromLine
To Page
To Line Comment Response
gone. Apparantly the authors want to move on. But moving on is impossible without really admitting all the weaknesses and the cherry picking of proxy data (bristlecone pines, Yamal amongst others) in most of the reconstructions, as McIntyre has showed extensively on his blog. Climategate was about the hockeystick. From these emails we know that members of 'the team' read climate audit as well. In this case a blog post on December 13 2011, http://climateaudit.org/2011/12/13/ar5-and-mikes-pnas-trick/, led to a change in text between the ZOD and the FOD. One of the major problems of IPCC is that scientists too closely involved in a controversial topic operate as lead authors, like Osborn in this case. This remains a big problem for IPCC and can only be resolved by making the author teams more balanced. Why not invite McIntyre and McKitrick as lead authors for AR6 and try to find 'consensus' between all parties or - if this turns out to be impossible - make explicit about what there is consensus and about what dissensus? There are tenths of blog posts at Climate Audit on Mann et al., 2008. A major issue is the upside down use of the Tiljander proxy, which in itself is already unreliable due to human disturbance. Kaufman acknowledged this error in his Arctic reconstruction, but so far Mann has refused to correct it. You should either remove the reference to Mann (2008) or explain how it relies on the Tiljander proxies. For the impact of the proxy on the reconstruction see e.g. http://climateaudit.org/2008/10/02/its-saturday-night-live/, http://climateaudit.org/2008/12/03/all-proxy-cps/ [Marcel Crok, The Netherlands]
various reconstructions using different proxy data bases. The results discussed stem from various sources of information and methods. Criticisms of "Mann's original hockeystick", specifically those related to statistical methods and non-centred PCA, were considered by Ammann and Wahl (2007) which is referred to here and included as superceding the Mann et al. (1999) work. Discussion of the strengths and weaknesses of all individual proxy records and multi-proxy reconstructions is not possible within the space available, and the focus is on an overall evaluation of the limitations and progress in this area. However, regarding uncertainties in proxy records, see changes in 5.3.5.2 and the new Appendix.
5-863 5 17 29 17 29 it is positive how the authors stress the limitations and uncertainties [Gerrit Lohmann, Germany] Noted
5-864 5 17 29 20 19 Droughts/floods during the last 2000 years should be added. For example, reference: Ren G.Y., Ding Y.H., Zhao Z.C., Zheng J.Y., Wu T.W., Tang G.L. and Xu Y., Recent progress in studies of climate change in China, in press; TSU will give you the paper. [Zong-Ci Zhao, China]
Noted. Taken into consideration in Section 5.5.5 Megadroughts and floods
5-865 5 17 29 20 35 In general, I would have liked to see the AR5 going a bit beyond just temperature, especially when making a comparison between the MCA, LIA and the present. As it is stated, there is a difference in the regional manifestation between the last decades and the MCA, e.g. in terms of hydrology, and I feel that it would be beneficial to highlight reconstructed precipitation/drought patterns as well. [Hans W Linderholm, Sweden]
Noted. Taken into consideration in Section 5.5
5-866 5 17 32 17 32 replace 'since' with 'because' [Mark Siddall, UK] Editorial - copyedit to be completed prior to publication
5-867 5 17 33 17 34 "may be more strongly influenced by internal variability.". It will help to bring here some of these processes, i.e. ENSO, IOD, NATH circulation etc. [Andrew Glikson, Australia]
Rejected - no space for generic background info
5-868 5 17 35 17 36 This is a peculiar summary, because it only emphasizes work since AR4 in refining uncertainties, when much of the work since AR4 has been aimed at refinding the spatial characteristis of climate change over the past two millennia and in making direct comparisons between observations and models and/or in the area of data assimilation. A summary statement like this needs to objective characterize the collective developments, not focus on one particular issue like "uncertainties". [Michael Mann, USA]
Accepted - text revised to give broader summary.
5-869 5 17 39 17 39 This level of title does not appears in the TOC: but I would advise to include it, as they are not so many. [Bernard De Saedeleer, Belgium]
Noted - editorial decision needed
5-870 5 17 39 18 40 Very dry and hard to follow. Sentences are long and sentence structures are overly complex. The uncertainty estimates and limitations are very important in this assessment and should be as clear and easy to digest! I have no suggestions on how to improve this section because it is difficult understand what the author is trying to say. [Christian Ohneiser, France]
Accepted - structure and ordering of 5.3.5 have been modified to make it easier to follow.
5-871 5 17 41 18 14 This should include a discussion of the seasonality. Perhaps there should be more discussion of how proxies repsond to annual temperatures when they are mostly summer responsive. Using GCM data as surrogate realities is useful, but there is a need to look at how JJA trends in models compare with DJF. Which of the published reconstructions underestimate the amplitudes? What are the non-climatic influences that cannot be excluded? [Philip JONES, UK]
Noted. This is an issue that needs more research and difficult to make specific statements in our assessment unless the information is already in the literature. See new Section 5.3.5.2 regarding uncertainties in reconstructions
5-872 5 17 43 I think the Frank et al. 2010 paper you refer to here is the one I cite earlier in the comments rather than the one provided in the refs [Valerie Trouet, United States]
Rejected. The citation was correct. We need to check if these things survive up to the SOD submisssion.
5-873 5 17 44 17 44 temperature sensitive proxy. The word proxy is often misleading. Here I suppose it refers to a proxy for Noted. We made small changes but not 100% clear

Expert Review Comments on the IPCC WGI AR5 First Order Draft -- Chapter 5
Do not Cite, Quote or Distribute Page 69 of 157
Comment No
Chapter FromPage
FromLine
To Page
To Line Comment Response
temperature at the local or regional scale?Similar remarks arise in other places. The author should adopt a rule on the use of the word and the way to present the different proxy records of different variables [PASCALE BRACONNOT, France]
what this means; proxy is used for individual local records, reconstruction is used for climate estimates that may be local, regional up to global
5-874 5 17 45 17 46 Christiansen (2011) has been sharply called into question by Tingley and if it is cited, then so too must the comment by Tingley [REF} [Michael Mann, USA]
Taken into account - comment by Moberg pointing out potential problems with Christiansen method has been cited.
5-875 5 17 46 17 47 for "climate field reconstruction" based surface temperature pattern reconstructions, please also cite Mann et al (2009). [Michael Mann, USA]
Accepted - text revised Taken into account. Text revised
5-876 5 17 47 17 47 There are several more studies using climate field reconstruction in addition to the proposed submitted paper. Mann et al. (2009) reconstruction, that is discussed later, should at least be cited here. [Hugues Goosse, Belgium]
Accepted - text revised Taken into account. Text revised
5-877 5 17 47 17 47 Mann et al., 2009 should also be cited here as it uses climate field reconstruction methods. Mann, M.E., Zhihua Zhang, Rutherford S, Bradley, R.S., Hughes, M.K. Shindell, D., Ammann, C., Faluvegi, G., Fenbiao Ni. Global Signatures and Dynamical Origins of the “Little Ice Age” and “Medieval Climate Anomaly”. Science. 326: 1256-1260 (2009) [Malcolm Hughes, USA]
Accepted - text revised Taken into account. Text revised
5-878 5 17 47 17 47 The field reconstruction by Mann et al. (2009, Science) should be referred to. Also, Ljungqvist et al. is now published (Clim. Past, 8, 227-249, 2012) [Anders Moberg, Sweden]
Accepted - text revised Taken into account. Text revised
5-879 5 17 47 17 47 The statement ”The latter APPLY temporal and spatial relationships...” is inadequate as regards the Ljungqvist et al method, but is relevant for the Mann et al. (2009) method. [Anders Moberg, Sweden]
accepted - text revised to be more precise
5-880 5 17 47 17 47 Ljunqvist et al reference would be well accompanied by a Neukom et al. GRL, 2010, reference [Tasman van Ommen, Australia]
Noted. The regional temperature section 5.5 deals with this information.
5-881 5 17 49 17 50 It is simply incorrect to list McShane & Wyner (2011) among papers using "Bayesian hierarchical methods". They use Principal component regression with AR(2) errors! Perhaps one could argue that the errors are subjected to Bayesian inference, but that is a far cry from the true Bayesian hierarchical approach used by Tingley, Li, and others. Important to get these things right. [Michael Mann, USA]
Accepted - in the revised text the cite is used now in the context of bayesian inference (see Tingley et al., 2012)
5-882 5 17 50 Put "a priori" in italics. [Jay Curt Stager, United States of America] Editorial - copyedit to be completed prior to publication
5-883 5 17 54 Hans von Storch pioneered this method of pseudo-proxies (I think!) so may be worth citing, my 2007 paper has pseudoproxies too (self serving sorry!) [Gabi Hegerl, UK]
Noted - a review paper integrates all references in the topic now
5-884 5 17 55 17 56 Both the concept of and name ("pseudoproxies") was first put forward by Mann and Rutherford (2002) and that should be cited in this context [Mann, M.E., Rutherford, S., Climate Reconstruction Using 'Pseudoproxies', Geophysical Research Letters, 29 (10), 1501, doi: 10.1029/2001GL014554, 2002]. [Michael Mann, USA]
Noted. A review paper integrates all references in the topic now
5-885 5 17 56 17 57 Moberg et al. (Climate Dynamics 31: 957-971, 2008) can be added to the list of references to pseudo-proxy studies. [Anders Moberg, Sweden]
Noted. A review paper integrates all references in the topic now
5-886 5 17 57 18 1 Please cite Mann et al (2005) [Mann, M.E., Rutherford, S., Wahl, E., Ammann, C., Testing the Gonzalez-Roucoity of Methods Used in Proxy-based Reconstructions of Past Climate, Journal of Climate, 18, 4097-4107, 2005] and Mann et al (2007) [Mann, M.E., Rutherford, S., Wahl, E., Ammann, C., Robustness of Proxy-Based Climate Field Reconstruction Methods, J. Geophys. Res., 112, D12109, doi: 10.1029/2006JD008272, 2007] and also Schmidt et al (2011) [Schmidt, G.A., Mann, M.E., Rutherford, S.D., A comment on "A statistical analysis of multiple temperature proxies: Are reconstructions of surface temperatures over the last 1000 years reliable?" by McShane and Wyner. Ann. Appl. Stat., 5, 65–70, 2011] which test a variety of methods including those advocated by McShane & Wyner (2011) using pseudoproxy tests. Mann et al (2005) was the first to explicitly test simple compositing approaches as well as CFR approaches. [Michael Mann, USA]
Noted. A review paper integrates all references in the topic now
5-887 5 17 58 17 58 what is the meaning of "overall amplitude" ? [Gerrit Lohmann, Germany] Accepted. Text has been rephrased.
5-888 5 17 58 18 1 If Christiansen et al (2009) is to be cited here, then so too must be the comment by Rutherford et al (2010) Rejected. The reply by Rutherford et al. (2010) and
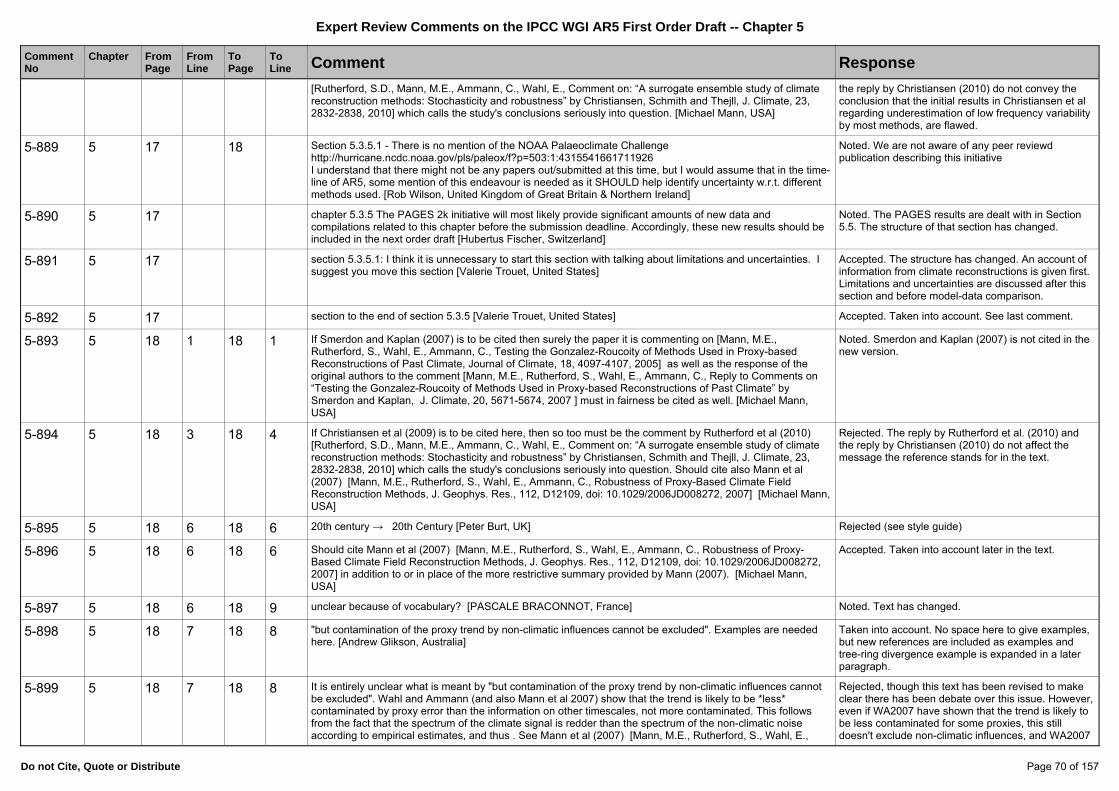
Expert Review Comments on the IPCC WGI AR5 First Order Draft -- Chapter 5
Do not Cite, Quote or Distribute Page 70 of 157
Comment No
Chapter FromPage
FromLine
To Page
To Line Comment Response
[Rutherford, S.D., Mann, M.E., Ammann, C., Wahl, E., Comment on: “A surrogate ensemble study of climate reconstruction methods: Stochasticity and robustness” by Christiansen, Schmith and Thejll, J. Climate, 23, 2832-2838, 2010] which calls the study's conclusions seriously into question. [Michael Mann, USA]
the reply by Christiansen (2010) do not convey the conclusion that the initial results in Christiansen et al regarding underestimation of low frequency variability by most methods, are flawed.
5-889 5 17 18 Section 5.3.5.1 - There is no mention of the NOAA Palaeoclimate Challenge http://hurricane.ncdc.noaa.gov/pls/paleox/f?p=503:1:4315541661711926 I understand that there might not be any papers out/submitted at this time, but I would assume that in the time-line of AR5, some mention of this endeavour is needed as it SHOULD help identify uncertainty w.r.t. different methods used. [Rob Wilson, United Kingdom of Great Britain & Northern Ireland]
Noted. We are not aware of any peer reviewd publication describing this initiative
5-890 5 17 chapter 5.3.5 The PAGES 2k initiative will most likely provide significant amounts of new data and compilations related to this chapter before the submission deadline. Accordingly, these new results should be included in the next order draft [Hubertus Fischer, Switzerland]
Noted. The PAGES results are dealt with in Section 5.5. The structure of that section has changed.
5-891 5 17 section 5.3.5.1: I think it is unnecessary to start this section with talking about limitations and uncertainties. I suggest you move this section [Valerie Trouet, United States]
Accepted. The structure has changed. An account of information from climate reconstructions is given first. Limitations and uncertainties are discussed after this section and before model-data comparison.
5-892 5 17 section to the end of section 5.3.5 [Valerie Trouet, United States] Accepted. Taken into account. See last comment.
5-893 5 18 1 18 1 If Smerdon and Kaplan (2007) is to be cited then surely the paper it is commenting on [Mann, M.E., Rutherford, S., Wahl, E., Ammann, C., Testing the Gonzalez-Roucoity of Methods Used in Proxy-based Reconstructions of Past Climate, Journal of Climate, 18, 4097-4107, 2005] as well as the response of the original authors to the comment [Mann, M.E., Rutherford, S., Wahl, E., Ammann, C., Reply to Comments on “Testing the Gonzalez-Roucoity of Methods Used in Proxy-based Reconstructions of Past Climate” by Smerdon and Kaplan, J. Climate, 20, 5671-5674, 2007 ] must in fairness be cited as well. [Michael Mann, USA]
Noted. Smerdon and Kaplan (2007) is not cited in the new version.
5-894 5 18 3 18 4 If Christiansen et al (2009) is to be cited here, then so too must be the comment by Rutherford et al (2010) [Rutherford, S.D., Mann, M.E., Ammann, C., Wahl, E., Comment on: “A surrogate ensemble study of climate reconstruction methods: Stochasticity and robustness” by Christiansen, Schmith and Thejll, J. Climate, 23, 2832-2838, 2010] which calls the study's conclusions seriously into question. Should cite also Mann et al (2007) [Mann, M.E., Rutherford, S., Wahl, E., Ammann, C., Robustness of Proxy-Based Climate Field Reconstruction Methods, J. Geophys. Res., 112, D12109, doi: 10.1029/2006JD008272, 2007] [Michael Mann, USA]
Rejected. The reply by Rutherford et al. (2010) and the reply by Christiansen (2010) do not affect the message the reference stands for in the text.
5-895 5 18 6 18 6 20th century → 20th Century [Peter Burt, UK] Rejected (see style guide)
5-896 5 18 6 18 6 Should cite Mann et al (2007) [Mann, M.E., Rutherford, S., Wahl, E., Ammann, C., Robustness of Proxy-Based Climate Field Reconstruction Methods, J. Geophys. Res., 112, D12109, doi: 10.1029/2006JD008272, 2007] in addition to or in place of the more restrictive summary provided by Mann (2007). [Michael Mann, USA]
Accepted. Taken into account later in the text.
5-897 5 18 6 18 9 unclear because of vocabulary? [PASCALE BRACONNOT, France] Noted. Text has changed.
5-898 5 18 7 18 8 "but contamination of the proxy trend by non-climatic influences cannot be excluded". Examples are needed here. [Andrew Glikson, Australia]
Taken into account. No space here to give examples, but new references are included as examples and tree-ring divergence example is expanded in a later paragraph.
5-899 5 18 7 18 8 It is entirely unclear what is meant by "but contamination of the proxy trend by non-climatic influences cannot be excluded". Wahl and Ammann (and also Mann et al 2007) show that the trend is likely to be *less* contaminated by proxy error than the information on other timescales, not more contaminated. This follows from the fact that the spectrum of the climate signal is redder than the spectrum of the non-climatic noise according to empirical estimates, and thus . See Mann et al (2007) [Mann, M.E., Rutherford, S., Wahl, E.,
Rejected, though this text has been revised to make clear there has been debate over this issue. However, even if WA2007 have shown that the trend is likely to be less contaminated for some proxies, this still doesn't exclude non-climatic influences, and WA2007

Expert Review Comments on the IPCC WGI AR5 First Order Draft -- Chapter 5
Do not Cite, Quote or Distribute Page 71 of 157
Comment No
Chapter FromPage
FromLine
To Page
To Line Comment Response
Ammann, C., Robustness of Proxy-Based Climate Field Reconstruction Methods, J. Geophys. Res., 112, D12109, doi: 10.1029/2006JD008272, 2007] for a thorough discussion of this, including pseudoproxy experiments demonstrating that finding. Von Storch et al (2006) provide nothing that contradicts those findings. Statement needs to be removed. [Michael Mann, USA]
is more of an argument for this rather than a demonstration of it.
5-900 5 18 7 18 8 Although this chapter is entitled "Information from Paleoclimate Archives" it is effectively restricted to the temperature reconstruction. It is important to stress that many high resolution proxies record factors other than just temperature. So the phrase "contamination of the proxy trend by non-climatic influences" is awkward as many of these other 'influences' are climatically controlled. An example of the reconstruction of other important climatic factors can be found in Gagen, M., E. Zorita, D. McCarroll, G.H.F. Young, H. Grudd, R. Jalkanen, N.J. Loader, I. Robertson, and A. Kirchhefer. Cloud response to summer temperatures in Fennoscandia over the last thousand years. Geophys. Res. Lett. 38, L05701, 2011. [Iain Robertson, UK]
Accepted. Reference taken into account in changed text.
5-901 5 18 9 18 30 lines 9 and 10 are essentially repeated in lines 30 and 31. [Henry Pollack, USA] Noted. Text has changed avoiding repetition.
5-902 5 18 10 18 10 insert 2nd ) after ) [Peter Burt, UK] accepted
5-903 5 18 10 18 10 Please also cite here both Mann et al (2007) [Mann, M.E., Rutherford, S., Wahl, E., Ammann, C., Robustness of Proxy-Based Climate Field Reconstruction Methods, J. Geophys. Res., 112, D12109, doi: 10.1029/2006JD008272, 2007] and Emile-Geay et al (in press; cited elswhere in this chapter). [Michael Mann, USA]
Noted. Text has changed and this lines have been eliminated.
5-904 5 18 10 18 10 It is odd to cite the equatorial Pacific here when in fact that is more high-resolution proxy evidence there than in many other regions (like the North Atlantic or the South Pacific). It would make more sense to cite those regions. Note also that uncertainties in equatorial Pacific reconstructions have been shown to be tied more closely to uncertainties and potential biases in the modern data available for calibration than to climate reconstruction approaches or proxy uncertainties (Emile-Geay et al, in press) [Michael Mann, USA]
Noted. Text has changed and these lines have been eliminated.
5-905 5 18 10 A final “)” is needed after (Smerdon et al., 2011) [Rob Wilson, United Kingdom of Great Britain & Northern Ireland]
accepted
5-906 5 18 12 18 12 The issues related to removing low-frequency signals when processing paleoclimatic records should be briefly discussed. Low-frequency variance could be important for these non-explained variability, but some statistical methodology could remove these signals in order to reduce the noise for the high-frequency signals. [Yueh-Hsin Lo, Taiwan R.O.C.]
Noted. Text has changed and these lines have been eliminated.
5-907 5 18 16 18 17 Particular relevant is the recent paper by Goosse et al (2011) cited in chapter 10 of the FOI [Goosse, H., et al., 2011b: The Role of Forcing and Internal Dynamics in Explaining the “Medieval Climate Anomaly”. Climate Dynamics (in revision)] and this should be cited here as well. [Michael Mann, USA]
Accepted, though this paragraph has been moved to 5.3.5.3.
5-908 5 18 16 18 22 needs further explanations [PASCALE BRACONNOT, France] Accepted, text has been revised in this direction
5-909 5 18 16 18 22 The statements are complex - it would help to bring some examples. [Andrew Glikson, Australia] Accepted, text has been revised in this direction
5-910 5 18 16 18 22 A link with the section 10.7 of chapter 10 where new simulations with data assimilation are discussed would be useful for the reader. [Hugues Goosse, Belgium]
accepted - text revised
5-911 5 18 18 18 18 Li et al. (DOI: 10.1198/jasa.2010.ap09379) can be added as a reference to Bayesian methods. [Anders Moberg, Sweden]
accepted - text revised
5-912 5 18 26 18 26 McShane and Wyner (2011) is an extraordinary choice of authority for this statement, given the problems with it discussed in several of the associated commentaries on it published in the same issue of the same journal. As an absolute minimum you should cite those commentaries with this, or else not use this reference because it obscures rather than clarifies the important topic of the limitations of proxy-based reconstructions at global/hemispheric scales. [Malcolm Hughes, USA]
Accepted that the text needs to be revised with particular care to balance the insights and limitations provided by this paper and the comments were subsequently published.
5-913 5 18 26 18 26 It is inappropriate to cite McShane & Wyner (2011) without noting that a dozen comments on that paper subsequently published in the same journal identified fundamental problems whcih invalidate the claims made.
Accepted that the text needs to be revised with particular care to balance the insights and limitations

Expert Review Comments on the IPCC WGI AR5 First Order Draft -- Chapter 5
Do not Cite, Quote or Distribute Page 72 of 157
Comment No
Chapter FromPage
FromLine
To Page
To Line Comment Response
The critiques are too numerous to list here, but the authors include numerous experts in this field, e.g. Tingley, Smerdon, Kaplan, Nychka, Ammann, Wahl, Li, Berliner, and Schmidt/Mann/Rutherford, among others (a summary and links to the various published comments are available at: http://www.realclimate.org/index.php/archives/2010/12/responses-to-mcshane-and-wyner/). Schmidt et al (2011) [Schmidt, G.A., Mann, M.E., Rutherford, S.D., A comment on "A statistical analysis of multiple temperature proxies: Are reconstructions of surface temperatures over the last 1000 years reliable?" by McShane and Wyner. Ann. Appl. Stat., 5, 65–70, 2011] show that M&W used 40 extra proxy records which had been flagged by the original authors as not meeting quality control criteria for use in paleoclimate reconstruction (mostly, these were tree-ring records that not pass a minimum threshold for chronology replication). Using this incorrect 95 proxy dataset, M&W nonetheless found recent warmth to be unusual in a long-term context: they estimated an 80% likelihood that the decade 1997-2006 was warmer than any other for at least the past 1000 years. Schmidt et al (2011) showed however that use of the correct (55 proxy) dataset with the same estimation procedure (which involved retaining K=10 PCs of the proxy data), yields a higher probability of 84% that recent decadal warmth is unprecedented for the past millennium. Using pseudoproxy tests, however, Schmidt et al showed that only a lower number of K=4 PCs could be defended. That choice yields a very close match with the Mann et al (2008) reconstruction, and a considerable higher probability (up to 99%) that recent decadal warmth is unprecedented for at least the past millennium. These posterior probabilities imply substantially higher confidence than the “likely” assessment by Mann et al (2008) and the IPCC AR4 (a 67% level of confidence). Indeed, a probability of 99% not only exceeds the IPCC “very likely” threshold (90%), but reaches the “virtually certain” (99%) threshold. In this sense, the M&W analysis, using the proper proxy data and proper methodological choices, yields inferences regarding the unusual nature of recent warmth that are even more confident than expressed in AR4 and, ironically, far more confident inferences than the flawed current FOI conclusion of "medium confidence". The various comments collectively raised a number of other serious issues with the methods used by M&W, specifically their use of inappropriate hold-out periods, their flawed use of the ‘Lasso’ method, the lack of any independent tests of their methods using pseudoproxy data (Schmidt et al show that the lasso performs extremely poorly in pseudoproxy tests), and call into question the conclusions they draw about the usefulness of proxy data, methods for assessing the merit of particular reconstruction approaches, and whether the Bayesian approach outlined in the last part of the paper is really what it is claimed to be. In short, M&W has been definitvely refuted, and does not deserve the creedance granted it by the authors of this section. Certainly, it cannot be cited without acknowledging the deep flaws that have been identified with it. [Michael Mann, USA]
provided by this paper and the comments were subsequently published.
5-914 5 18 26 18 26 Mann et al (2008) and (2009) both focus on these precise issues and should be cited here. So too should Emile-Geay et al (in press) be cited, as it looks particularly closely at the issue of target series/instrumental data quality as well as proxy data distribution and quality. [Michael Mann, USA]
Noted. The part has been removed in the revised text for other reasons, so the extra references aren't needed to support the removed statement.
5-915 5 18 27 18 27 Neukom & Gergis (DOI: 10.1177/0959683611427335) can be added as a reference, specifically for SH proxies [Anders Moberg, Sweden]
accepted - text revised
5-916 5 18 27 18 27 add ref [Neukom and Gergis, Holocene, 2011] [Tasman van Ommen, Australia] accepted - text revised
5-917 5 18 30 18 31 This sentence repeats material in lines 8 through 10 of this page and should therefore be deleted. [Malcolm Hughes, USA]
Noted. The repetitions have been avoided and the text modified in both parts of the section.
5-918 5 18 30 18 31 Same problem as identified above for line 18 above same page. It is odd to cite the equatorial Pacific here when in fact that is more high-resolution proxy evidence there than in many other regions (like the North Atlantic or the South Pacific). It would make more sense to cite those regions. Note also that uncertainties in equatorial Pacific reconstructions have been shown to be tied more closely to uncertainties and potential biases in the modern data available for calibration than to climate reconstruction approaches or proxy uncertainties (Emile-Geay et al, in press) [Michael Mann, USA]
Accepted. The text has been changed. The suggested references have been taken into account to draft the SOD
5-919 5 18 33 18 33 the structural uncertainty of what? [PASCALE BRACONNOT, France] Accepted. Text has been modified for clarity.
5-920 5 18 33 18 40 "Hide the decline" was one of the most awful examples in the climategate emails of manipulation with the data, in this case not showing Briffa's reconstruction after 1960. With only eight lines of text once more the authors just want to move on instead of dealing with this problem. Briffa's reconstruction was based on several
Taken into account. The text has been modified trying to give a better account of the divergence problem. The hacked email referred to by the reviewer was not

Expert Review Comments on the IPCC WGI AR5 First Order Draft -- Chapter 5
Do not Cite, Quote or Distribute Page 73 of 157
Comment No
Chapter FromPage
FromLine
To Page
To Line Comment Response
hundreds of proxies, so it's untrue that the divergence problem only applies to "some tree ring chronologies". This comment on the draft of AR4 is still valid: "Show the Briffa et al reconstruction through to its end; don’t stop in 1960. Then comment and deal with the “divergence problem” if you need to. Don’t cover up the divergence by truncating this graphic. This was done in IPCC TAR; this was misleading (comment ID #: 309-18)" So much for progress since AR4. [Marcel Crok, The Netherlands]
about the depiction of the Briffa et al. reconstruction in either TAR or AR4. There is support in the literature that the divergence problem does not affect all tree-ring chronologies, so it is correct to note that it applies to "some" of them. The Briffa et al. reconstruction is not used in the new Fig. 5.8 or 5.9a or Table 5.1, so the issue of truncating it or not truncating it is moot.
5-921 5 18 34 35 same comment as the previous one [Valerie Trouet, United States] Rejected. The reference to Frank et al 2010 is correct
5-922 5 18 34 replace "by using" by "related to the use" ? [Masa KAGEYAMA, France] Taken into account as part of a wide rephrasing of that sentence
5-923 5 18 35 18 35 "non-stationarity in proxy-climate relationships". Define the term "non-stationarity". [Andrew Glikson, Australia] Rejected - no space for generic background info, but made clear that it is non-stationary in time.
5-924 5 18 35 18 38 Tree-ring divergence needs to mention that much of this is in MXD and not in TRW. The original defeinition of this was emphasizing MXD records. [Philip JONES, UK]
Noted. Some papers discuss both proxy types can be affected by the divergence problem. See references provided in C-928 for example.
5-925 5 18 35 18 40 It is said later in the text that dendrochonological methods are very accurate. However, the divergence problem could be seen as a contradiction.to this affirmation. A better explanation of the imporatnce of this divergence issue when reconstructing temperate records from the recent past is needed here. [Yueh-Hsin Lo, Taiwan R.O.C.]
Noted. Text has been modified
5-926 5 18 35 18 40 Ironically, with all of the emphasis on the divergence problem, the properties of RCS, and associated issues with low-frequency variability, it appears that the community has by-and-large overlooked the fact that the most criticial bias in tree-ring based estimates of temperature may in fact related to high-frequencies, namely a severe underestimation of the cooling response to large volcanic eruptions. This has been demonstrated by Mann et al (2012) [ Mann, M.E., Fuentes, J.D., Rutherford, S., Underestimation of Volcanic Cooling in Tree-Ring Based Reconstructions of Hemispheric Temperatures, Nature Geosciences (in press)] and has already been incorporated into discussions of biases in proxy reconstructions in chapter 10 of the FOD. Mann et al (2012) shows that climate models closely reproduce the low-frequency behavior of the D'Arrigo et al (2006) temperature reconstruction, which is base on a near-hemispheric network of treeline proximal tree ring width series. The models suggest, however, that the tree-ring estimates severely underestimate the short-term cooling associated with very large volcanic eruptions. Mann et al (2012) show that this behavior can be explained by thresholds in the biological growth response near treeline. The abstract is as follows: The largest tropical eruption of the past millennium occurred during AD 1258/1259, with an estimated radiative forcing several times larger than the 1991 Pinatubo eruption1. The prominent (~2 oC) predicted2-5 cooling, however, is largely absent in tree-ring reconstructions of temperature6-8 (and muted in reconstructions that employ a mix of tree-rings and other proxy data9-10), seemingly calling into question the climate impact of the eruption11,2,5. Using a tree growth model driven by simulated temperature variations, we show that the discrepancy likely arises as an artifact of the reduced sensitivity to cooling in trees growing near treeline, combined with secondary effects of chronological errors due to missing growth rings, and volcanically-induced alterations of diffuse light. Our findings support a substantial climate impact2-5 of volcanic eruptions in past centuries greater than that estimated by tree-ring-based reconstructions. [Michael Mann, USA]
Accepted. Mann et al. (2012) now cited.
5-927 5 18 35 Add space before parenthesis [Dunia H. Urrego, France-USA] Editorial - copyedit to be completed prior to publication
5-928 5 18 37 18 40 This sections omits a vitally important finding of Esper et al., (2009) and Buentgen et al., (2008) (refs at end of comment). In many hundreds of tree-ring records from Siberia and the European Alps, there was no 'divergence' between tree-ring ring-width and density reported for recent decades if appropriate methods of tree-ring data preparation and calibration are applied. This implies that a large part of all the 'divergence' is a result of artefacts produced by particular methods. Note also that Mann et al (2008) noted apparent 'divergence' in other proxies. This section should be rewritten to take these important findings into account. Refs: Esper et al., (2009) Trends and uncertainties in Siberian indicators of twentieth century warming.Global
Accepted. Text has been modified.

Expert Review Comments on the IPCC WGI AR5 First Order Draft -- Chapter 5
Do not Cite, Quote or Distribute Page 74 of 157
Comment No
Chapter FromPage
FromLine
To Page
To Line Comment Response
Change Biology: 1-14. doi:10.1111/j.1365-2486.2009.01913.x ; Buentgen, U. et al., Testing for tree-ring divergence in the European Alps. Global Change Biology, 14:2443-2453. [Malcolm Hughes, USA]
5-929 5 18 40 18 40 Here you are missing out on some works such as Wilmking & Singh, 2008. Cited References: ------------------------ Wilmking, M. & Singh, J., 2008. Eliminating the "divergence problem" at Alaska's northern treeline. Climate of the Past Discussions, 4(3): 741--759. http://dx.doi.org/10.5194/cpd-4-741-2008 Wi310 [Andreas Fischlin, Switzerland]
Rejected. This manuscript has not been accepted for final publication in Climate of the Past and cannot be cited.
5-930 5 18 42 19 29 Section 5.3.5.2 Reconstruction and Simulation of Global and Hemispheric Temperatures: I suggest that an important paper [Huang et al, "A late Quaternary climate reconstruction based on boehole heat flux data, borehole temperature data, and the instrumental record", Geophysical Research Letters, L13703, doi: 10.1029/2008GL034187, 2008] has been overlooked in this section, perhaps lost in the conceptual gap between smoothed high resolution reconstructions on the one hand, and long-term model simulations on the other. This paper clearly reconstructs the MCA and LIA, separated by 500 years, with a temperature difference between the two of about 0.6K +/- 0.3, depending on what interval one chooses to average. For the difference between the LIA and the 20th century, the difference is about 0.9 K +/- 0.3. These results sit at the high end of the ranges shown in Figure 5.7e,f but are comparable. The timing of the MCA and LIA in Huang et al appears to be more recent than the intervals 950-1250 and 1450-1750CE, but this is likely a result only of the choice of slightly too large thermal diffusivity in the reconstruction/inversion. A reduction of thermal diffusivity by about 25% would place the reconstructed events in the same time intervals as the others included in the discussion. [Henry Pollack, USA]
Rejected. The FOD Fig. 5.7 was NH only, while HPS2008 is global. The new SOD Fig. 5.8c shows global, but we have chosen not to include the HPS2008 reconstruction because it targeted the last 20,000 years. It did this by merging three data types: the instrumental record, the high-quality temperature profiles used for the 500-yr inversions, and much noisier heat flux data for the period prior to about 500 years ago. This data merge has its advantages and disadvantages, but it may particularly impact the character of the smaller events like the MWP/LIA relative to the much larger LGM signal. The temporal resolution of the inversion is also much lower (and progressively less back in time) than suggested by a comparison to the decadally filtered recon series, and the timing and amplitude of the MWP/LIA events is less constrained than the more robust features of LGM character of the curve. For instance, differences in the choice of thermal diffusivity can impact both the magnitude and timing of these events in the inversion.
5-931 5 18 42 20 19 Where is the reconstruction of global temperatures? All is just NH temperatures. GCMs are global of course, but where are the global temperature reconstructions? The only place I expect to find them would be in this section (according to the section headings and chapter structure). I do not argue to change the section heading to its actual content, i.e. "Reconstruction and Simulation of NH Temperatures" and move it to chapter section 5.4. I ask for improving on the content so that it matches the heading and can remain under 5.3. And that content is of crucial relevance (remember the hockey stick debate). Very, very critical omission. [Andreas Fischlin, Switzerland]
Accepted - some assessment of the global situation now included in revised Table 5.3 (now called Table 5.1) and in the text of 5.3.5.1.
5-932 5 18 42 20 19 The text in this section is very dense and assumes quite a lot of existing knowledge. It may be hard to follow for the non-specialist. Perhaps the text can be ‘opened up’ a bit here, making it more readable. This is important as it all leads to Table 5.3, which is pretty crucial and should be taken in carefully by the reader. As it is, the reader is likely to be confused by the time he/she gets to Table 5.3, because of the dense text in section 5.3.5.2. [Eelco Johan ROHLING, United Kingdom of Great Britain & Northern Ireland]
Accepted - structure and ordering of 5.3.5 have been modified to make it easier to follow, and Table 5.3 (now Table 5.1) has been significantly improved
5-933 5 18 44 18 47 The statement that "Large-scale temperature reconstructions published since AR4 (Figure 5.7; Table 5.3) suggest greater overall amplitude of NH temperature and stronger evidence that the MCA (illustrated here as 950–1250 CE) and the 20th century were warmer than the average over the last 1000 or even 2000 years, while the LIA (illustrated here as 1450–1750 CE) was significantly cooler." is at best misleading. A comparison of various reconstructions (e.g. Fig. 3 of Mann et al '08) shows Moberg et al '05 (which was included in the AR4 assessment) as having nearly the largest amplitude of all reconstructions. To this reviewer's knowledge, no reconstruction with a larger amplitude difference than Moberg et al '05 has been published since, though the Mann et al (2008) reconstructions and the (quite simlilar) Ljungqvist (2010) reconstruction come close. It would seem that the conclusion, therefore, is as much a consequence of how these periods have been
Accepted - statement has been removed.

Expert Review Comments on the IPCC WGI AR5 First Order Draft -- Chapter 5
Do not Cite, Quote or Distribute Page 75 of 157
Comment No
Chapter FromPage
FromLine
To Page
To Line Comment Response
defined here (i.e. the choice of AD 950-1250 and 1450-1850). This choice appears to come (with very slight modification) from the definitions that were provided by Mann et al (2009). Mann et al (2009) used those periods precisely because they defined the intervals of greatest difference in that reconstruction (a similar conclusion holds for the Ljungqvist reconstruction). Were one to use a metric of greatest difference between peak multidecadal warmth and cold in all reconstructions, Moberg et al '03 (and Esper et al '02 which for some reason has been ignored in this assessment) would both rank near the top, and they are among the earlier reconstructions. Indeed, it is unclear from Fig 5.7d that there is a clear temporal trend in the amplitude of the reconstructions, with Moberg still ranking among the largest. This problem is discussed further in subsequent comments below. [Michael Mann, USA]
5-934 5 18 44 18 47 The claim that larger amplitudes of LIA cooling are evident in recent work relative to AR4 is completely undermined by Figure 5.7e which seems to show precisely the opposite. Larger differences are found for reconstructions of 2006 or earlier than for reconstructions since e.g. 2008. The trend over the years is in the opposite direction from what is being claimed here. [Michael Mann, USA]
Accepted - statement has been removed.
5-935 5 18 44 18 53 Is the 1961-2010CE period the instrumental record? This occurs in the plot and the discussion here. [Philip JONES, UK]
Accepted - text now clear about what is instrumental data and also shows it in new SOD Fig. 5.8.
5-936 5 18 44 18 53 This text attempts to compare achievements made pre- and post-AR4, but no convincing explicit analysis is made in the AR5 FOD. This needs to be done. One way is to explicitly compare results obtained for pre- and post-AR4 climate reconstructions in a figure (e.g. in Fig. 5.7 bottom) and discuss results from such a comparison in the text. [Anders Moberg, Sweden]
Noted - revised text has been re-ordered/re-structured to provide the assessment first and then consider the remaining problems afterwards.
5-937 5 18 44 It is interesting to note that all pre 2004 large scale reconstructions (Jones et al, 1998; Mann et al, 1999; Crowley & Lowery 2000 etc) are NOT included in Figure 5.7 or Table 5.3. A clear statement is needed why these reconstructions are not included. You cannot dominate TAR with Mann et al. (1999) and ignore it in AR5 without some rationale for this decision. Were the methods of these earlier studies wrong? Were the input series biased (e.g. tree-ring data not being processed using RCS etc). [Rob Wilson, United Kingdom of Great Britain & Northern Ireland]
Noted. The database of reconstructions considered for AR5 makes use of all published reconstructions except those that have been superceeded by some later version using similar or improved method and data that does not significantly stand as a different reconstruction. See Appendix and note that MBH1999 is considered to be superceded by Ammann/Wahl, who use centred PCA rather than non-centred. Their results are quite similar.
5-938 5 18 44 I would also insert an extra column in Table 5.3 with the study codes used in the lower figures (e.g. FEC2007 = Frank et al. 2007) to facilitate comparison between Figure 5.7 and the table. NB. HE2006 is Hegerl et al. (2007) so you might want to change to HE2007. [Rob Wilson, United Kingdom of Great Britain & Northern Ireland]
Taken into account - table in Appendix 5.4 gives this information
5-939 5 18 44 The upper figure showing the overlap between the error ranges of the different reconstructions needs some expansion in the figure caption and/or text. Were all the original series re-calibrated and consistent error bars generated or do IPCC utilised the published error bars from these studies. This figure is also similar to one from AR4 – you might want to highlight what the differences are – i.e. different input data etc. [Rob Wilson, United Kingdom of Great Britain & Northern Ireland]
Taken into account - Appendix 5.4 gives more information
5-940 5 18 44 The caption for Figure 5.7 is also a bit of a mess. Ensure that figure boxes are more clearly labelled (A-F) and that the correct text is referred to the correct figure in the caption. At the moment, (C) is not listed in the figure caption at all. [Rob Wilson, United Kingdom of Great Britain & Northern Ireland]
Accepted - caption revised
5-941 5 18 44 There seems little integration of what is shown in this chapter (specifically figure 5.7) and the attribution work detailed in chapter 10 (e.g. Figure 10.18). I find this confusing as any large scale attribution study would benefit from using an ensemble of NH reconstructions with associated error ranges as shown in Figure 5.7. I understand that such an attribution study might not have been done/published, but again, I would have expected more linkages between Ch 5 and Ch 10 in this regard. [Rob Wilson, United Kingdom of Great Britain & Northern Ireland]
Noted. Chapter 10 now includes D&A results thatuse more reconstructions.
5-942 5 18 45 redefine MCA? [Masa KAGEYAMA, France] Accepted. New text and more clear definitions have been included, and a glossary entry
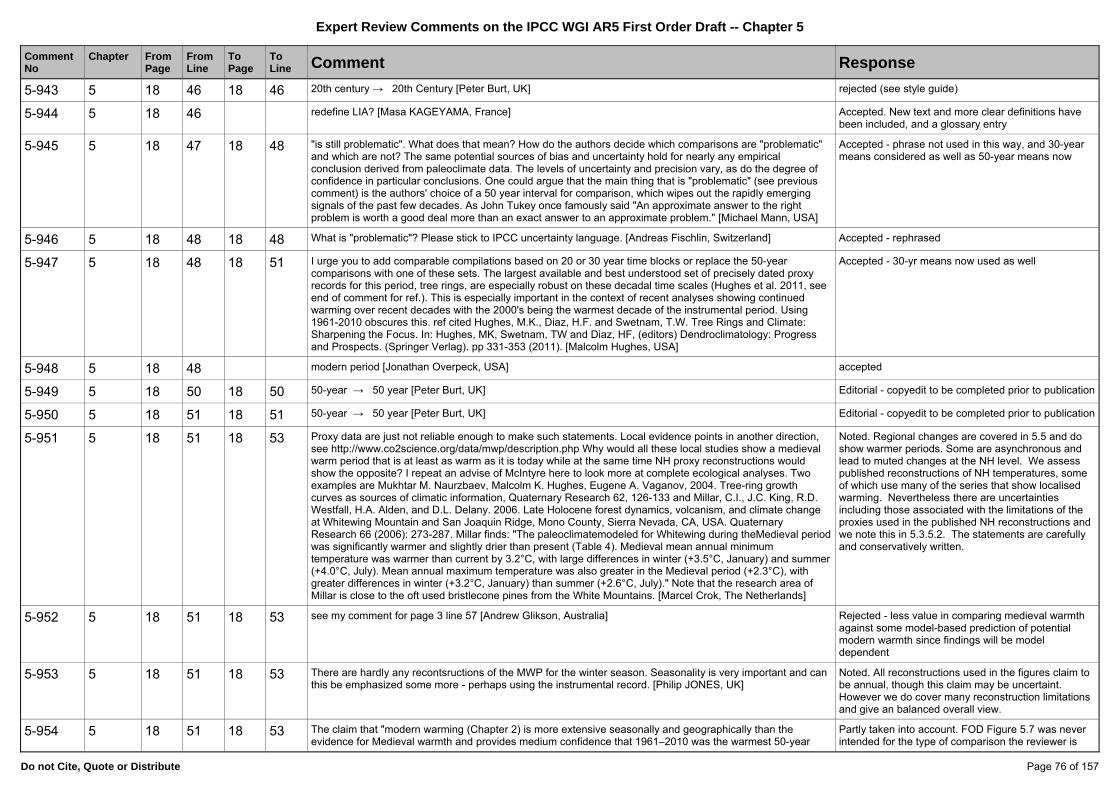
Expert Review Comments on the IPCC WGI AR5 First Order Draft -- Chapter 5
Do not Cite, Quote or Distribute Page 76 of 157
Comment No
Chapter FromPage
FromLine
To Page
To Line Comment Response
5-943 5 18 46 18 46 20th century → 20th Century [Peter Burt, UK] rejected (see style guide)
5-944 5 18 46 redefine LIA? [Masa KAGEYAMA, France] Accepted. New text and more clear definitions have been included, and a glossary entry
5-945 5 18 47 18 48 "is still problematic". What does that mean? How do the authors decide which comparisons are "problematic" and which are not? The same potential sources of bias and uncertainty hold for nearly any empirical conclusion derived from paleoclimate data. The levels of uncertainty and precision vary, as do the degree of confidence in particular conclusions. One could argue that the main thing that is "problematic" (see previous comment) is the authors' choice of a 50 year interval for comparison, which wipes out the rapidly emerging signals of the past few decades. As John Tukey once famously said "An approximate answer to the right problem is worth a good deal more than an exact answer to an approximate problem." [Michael Mann, USA]
Accepted - phrase not used in this way, and 30-year means considered as well as 50-year means now
5-946 5 18 48 18 48 What is "problematic"? Please stick to IPCC uncertainty language. [Andreas Fischlin, Switzerland] Accepted - rephrased
5-947 5 18 48 18 51 I urge you to add comparable compilations based on 20 or 30 year time blocks or replace the 50-year comparisons with one of these sets. The largest available and best understood set of precisely dated proxy records for this period, tree rings, are especially robust on these decadal time scales (Hughes et al. 2011, see end of comment for ref.). This is especially important in the context of recent analyses showing continued warming over recent decades with the 2000's being the warmest decade of the instrumental period. Using 1961-2010 obscures this. ref cited Hughes, M.K., Diaz, H.F. and Swetnam, T.W. Tree Rings and Climate: Sharpening the Focus. In: Hughes, MK, Swetnam, TW and Diaz, HF, (editors) Dendroclimatology: Progress and Prospects. (Springer Verlag). pp 331-353 (2011). [Malcolm Hughes, USA]
Accepted - 30-yr means now used as well
5-948 5 18 48 modern period [Jonathan Overpeck, USA] accepted
5-949 5 18 50 18 50 50-year → 50 year [Peter Burt, UK] Editorial - copyedit to be completed prior to publication
5-950 5 18 51 18 51 50-year → 50 year [Peter Burt, UK] Editorial - copyedit to be completed prior to publication
5-951 5 18 51 18 53 Proxy data are just not reliable enough to make such statements. Local evidence points in another direction, see http://www.co2science.org/data/mwp/description.php Why would all these local studies show a medieval warm period that is at least as warm as it is today while at the same time NH proxy reconstructions would show the opposite? I repeat an advise of McIntyre here to look more at complete ecological analyses. Two examples are Mukhtar M. Naurzbaev, Malcolm K. Hughes, Eugene A. Vaganov, 2004. Tree-ring growth curves as sources of climatic information, Quaternary Research 62, 126-133 and Millar, C.I., J.C. King, R.D. Westfall, H.A. Alden, and D.L. Delany. 2006. Late Holocene forest dynamics, volcanism, and climate change at Whitewing Mountain and San Joaquin Ridge, Mono County, Sierra Nevada, CA, USA. Quaternary Research 66 (2006): 273-287. Millar finds: "The paleoclimatemodeled for Whitewing during theMedieval period was significantly warmer and slightly drier than present (Table 4). Medieval mean annual minimum temperature was warmer than current by 3.2°C, with large differences in winter (+3.5°C, January) and summer (+4.0°C, July). Mean annual maximum temperature was also greater in the Medieval period (+2.3°C), with greater differences in winter (+3.2°C, January) than summer (+2.6°C, July)." Note that the research area of Millar is close to the oft used bristlecone pines from the White Mountains. [Marcel Crok, The Netherlands]
Noted. Regional changes are covered in 5.5 and do show warmer periods. Some are asynchronous and lead to muted changes at the NH level. We assess published reconstructions of NH temperatures, some of which use many of the series that show localised warming. Nevertheless there are uncertainties including those associated with the limitations of the proxies used in the published NH reconstructions and we note this in 5.3.5.2. The statements are carefully and conservatively written.
5-952 5 18 51 18 53 see my comment for page 3 line 57 [Andrew Glikson, Australia] Rejected - less value in comparing medieval warmth against some model-based prediction of potential modern warmth since findings will be model dependent
5-953 5 18 51 18 53 There are hardly any recontsructions of the MWP for the winter season. Seasonality is very important and can this be emphasized some more - perhaps using the instrumental record. [Philip JONES, UK]
Noted. All reconstructions used in the figures claim to be annual, though this claim may be uncertaint. However we do cover many reconstruction limitations and give an balanced overall view.
5-954 5 18 51 18 53 The claim that "modern warming (Chapter 2) is more extensive seasonally and geographically than the evidence for Medieval warmth and provides medium confidence that 1961–2010 was the warmest 50-year
Partly taken into account. FOD Figure 5.7 was never intended for the type of comparison the reviewer is

Expert Review Comments on the IPCC WGI AR5 First Order Draft -- Chapter 5
Do not Cite, Quote or Distribute Page 77 of 157
Comment No
Chapter FromPage
FromLine
To Page
To Line Comment Response
period in the last 1300 years." is problematic. Conclusions regarding how anomalous recent warmth is in comparison with past warmth should not be based on qualitative arguments about seasonal or geographic tendencies as this is an ill-defined measure here. The conclusions should be based on the quantitative information available for assessment--namely the actual reconstructions of northern hemisphere mean temperature and their uncertainties. A visual comparison is unfortunately hampered by the choice in Figure 5.7a of truncating the vertical axis in such a way that the most recent warming (in the models, reconstructions, and instrumental record) is hidden from view. Nonetheless, the key observation can still be made from this figure: while the uncertainties increase back in time, the central tendencies of the reconstructions are clear: the nominal levels of warmth during the peak of the Medieval interval are well below the nominal levels of warmth of the most recent 50 years. The authors' use of the term "medium confidence" implies only a 50/50 proposition, i.e. that there is equal chance that medieval warmth could have been warmer (that is based on the only quantifiable definition that the IPCC has provided of this terminology). Such a conclusion however is at odds with the central tendencies shown, which indicate that the most likely conclusion is that the recent period is warmer. AR4 reached a conclusion of likely (i.e. 67%) which is consistent with the results shown in Fig 5.7a. The current AR5 (FOD) conclusion of "medium confidence" is not. [Michael Mann, USA]
using it for, only for data-model comparisons. Tabel 5.3 (now Table 5.1) was the quantitative assessment the review wants and this has now been supplemented by the new SOD Figure 5.8 which has the instrumental data and runs up to present, though needs Table 5.1 too, because Fig 5.8 doesn't show the uncertainty ranges. The term medium confidence does not mean 50/50, and the text has been expanded to explain the basis for this assessment. There are fewer independent reconstructions before 1200 and they show less robust evidence because published uncertainties don't include all major sources of uncertainty.
5-955 5 18 51 18 53 In addition to the other problems already noted, the use of a 50 year averaging interval is problematic in the comparison of past and recent warmth, because recent studies indicate that it is only the rapidly accelerated warming of the past two-to-three decades which most clearly exceed the error estimates of reconstructions for the past millennium. Choosing a period as wide as 50 years is thus smoothing out the emerging signal. Had the authors of the chapter section instead asked whether the past 20-30 years appears to be outside the range of the past millennium, they would most certainly reach a higher level of confidence than with the too blunt use of 50 year blocks. Mann et al (2008) are quite explicit about this, noting that peak medieval warmth appears to reach the average warmth of the late 20th century (1961-1990) reference period, but not the warmth achieved over the past two decades. AR5 needs to confront this key distinction or risk providing a very misleading picture of what the paleoclimate record actually shows. [Michael Mann, USA]
Accepted - 30-yr means now used as well
5-956 5 18 51 53 It is unclear to me how you come to this conclusion based on the data in Table 5.3 [Valerie Trouet, United States]
Accepted - further explanation now given in 5.3.5.1
5-957 5 18 52 18 52 The sentense is too complex and probably needs editing [Olga Solomina, Russian Federation] Accepted - changed as part of a larger re-write
5-958 5 18 53 18 53 50-year → 50 year [Peter Burt, UK] Editorial - copyedit to be completed prior to publication
5-959 5 18 57 19 1 proper English is "..simulations have used different ESTIMATES of natural and anthropogenic…" [Michael Mann, USA]
accepted
5-960 5 18 Throughout the chapter reference is made to temperature in a number of forms. Although distinctions are made concerning global temperatures there is perhaps too little consideration of the range of types of temperature that different proxies provide eg most pollen or chironomid reconstructions are July or mean summer temperature. Thus it may be worth considering how best to provide this context and clarify just exactly what parameters are produced. This is especially important when looking at early Holocene temperatures when the precessional forcing likely produces higher sumemr temperatures but greater seasonal contrasts. [Chris Caseldine, United Kingdom of Great Britain & Northern Ireland]
Noted. Of less relevance for section 5.3.5
5-961 5 19 2 suggest you say why the weaker solar irradiance variations are now preferred [Jonathan Overpeck, USA] Noted. The reader is refered to Section 5.2.1 where the assessment reports on solar forcing also for the last millennium. Also a comment is included with citations in order to be more specific here about the difference in TSI changes the text reffers to.
5-962 5 19 2 earlier [Alan Robock, USA] Editorial - copyedit to be completed prior to publication
5-963 5 19 2 Correct mispelled word "earliear" [Dunia H. Urrego, France-USA] Editorial - copyedit to be completed prior to publication
5-964 5 19 2 should be earlier [Elie Verleyen, Belgium] Editorial - copyedit to be completed prior to publication

Expert Review Comments on the IPCC WGI AR5 First Order Draft -- Chapter 5
Do not Cite, Quote or Distribute Page 78 of 157
Comment No
Chapter FromPage
FromLine
To Page
To Line Comment Response
5-965 5 19 5 7 this last phrase isn't that clear, maybe reword to be more precise about what you're saying? [Jonathan Overpeck, USA]
Accepted. Text has been modified
5-966 5 19 6 19 6 internal variability on millenial time scales has not evaluated. This is linked to Holocene climate modes. [Gerrit Lohmann, Germany]
Accepted. Text has been modified but internal variability is further illustrated in Chapter 10 as a byproduct of detection/attribution
5-967 5 19 9 19 17 This partly repeats a separate comment provided for Figure 5.7. The fact that the volcanic response is both too weak on average relative to the models and also the observation made here that the "simulations show a faster recovery after peak negative forcing" (a better way of characterizing that observation is that the reconstructions are showing *too slow* a recovery compared to what is expected from model physics) is almost certainly a testament to a bias recently identified in tree-ring estimates of past temperature change by Mann et al (2012), who note that this bias influences essentially all hemispheric reconstructions whether annual or decadal (which are all based either entirely or at least partially on tree rings). This is shown to be particularly important for very large eruptions, something that is in fact observed by the comparison here ( Panels b and c of Figure 5.7a) for reasons described below. Model simulations (GCM simulations and simple energy balance models driven by the full range of estimated volcanic and solar forcing) predict significantly greater than 1.5C Northern Hemisphere mean cooling relative to the 1961-1990 reference period for several years following each of the 3 largest volcanic forcing episodes (AD 1258, AD 1453, and AD 1809+1815) of the past millennium. For AD 1258, the cooling response is roughly 2.5C. Annually-resolved tree-ring reconstructions (e.g. the D'Arrigo et al '06 reconstruction) however never show more than 1C cooling relative to the modern reference period. In the case of AD 1258 there is no evidence of cooling in the years immediately following the eruption, and a greatly muted cooling (roughly 1C relative to modern reference period) occurs at a delay of several years. A similar story is found for the 1815 eruption. This is all described by Mann et al (2012) [Mann, M.E., Fuentes, J.D., Rutherford, S., Underestimation of Volcanic Cooling in Tree-Ring Based Reconstructions of Hemispheric Temperatures, Nature Geosciences (in press)] who reproduce this behavior theoretically as a consequence of artifacts of the biological growth response to very large eruptions for trees--such as used in most reconstructions--at the boreal or alpine treeline. This problem can clearly be seen in Figure 5.7bc--note how the reconstructed cooling is both underestimated and smeared/delayed relative to the modeled cooling--precisely as predicted by Mann et al (2012). However, by only showing the average response to many eruptions (most of which are quite small) rather than the specific response to very large eruptions, the figure actually tends to hide the problem. Chapter 10 of FOD notes the potential impact of this bias. [Michael Mann, USA]
Partly accepted. Mann et al. is now cited, plus further discussion and references related to the match between models and reconstructions (and early instrumental data) and tree-ring issues. It is now also stated that the land vs. land&sea issue could have influenced this comparison
5-968 5 19 9 19 22 deterministic view of forcing -> response [Gerrit Lohmann, Germany] Noted.
5-969 5 19 9 22 how have the composites been constructed?have they been constructed from models which have been run under different forcing scenarios? Also, give which years have been used, so that people can make the calculation for their own model runs later on. [Masa KAGEYAMA, France]
Accepted - see appendix 5.4
5-970 5 19 15 19 15 response → responses [Peter Burt, UK] accepted
5-971 5 19 18 19 18 "(Figure 5.7d," : do you mean "(Figure 5.1a," ? [Bernard De Saedeleer, Belgium] Noted
5-972 5 19 20 19 20 insert comma after 'cases' [Peter Burt, UK] accepted
5-973 5 19 20 I am not entirely convinced by these very low values for temperature response to solar forcing. At least for the Maunder Minimum, several reconstructions – including my own (Ljungqvist, 2010) – show a much larger temperature response. [Fredrik Charpentier Ljungqvist, Sweden]
Noted. The results have been revised and more details of their construction are given in appendix 5.4.
5-974 5 19 20 0.0C does not make sense [Valerie Trouet, United States] Noted. Not clear what the reviewer means.
5-975 5 19 24 19 29 This paragraph is trying to be too economical - the insertion of the "spatial pattern Figure 5.8" comment breaks the flow of discussion about 5.7. I suggest you break out the spatial part of the discussion to the latter part of the paragraph. [Tasman van Ommen, Australia]
Accepted

Expert Review Comments on the IPCC WGI AR5 First Order Draft -- Chapter 5
Do not Cite, Quote or Distribute Page 79 of 157
Comment No
Chapter FromPage
FromLine
To Page
To Line Comment Response
5-976 5 19 24 19 34 Should be after the discussion on trends? Because it is an other way of testing trends or differences between extreme periods [PASCALE BRACONNOT, France]
Taken into account, text revised.
5-977 5 19 24 29 I highly recommend that you site Frank et al. 2010 (ref provided above), so that you can compare the provided temperature ranges [Valerie Trouet, United States]
Taken into account, text revised.
5-978 5 19 24 29 with the temperature ranges based on probabilities based on the AR4 reconstruction [Valerie Trouet, United States]
Rejected - Frank et al. ensemble doesn't include the calibration error (I.e. the residuals between a reconstruction and the target temperature), so it underestimates the uncertainty ranges that are needed for this assessment.
5-979 5 19 26 19 28 The comparisondiscussed here also "hides" the fact that these various reconstructions do not purport to measure the same thing, and the spread argued for is artificially inflated by grouping together e.g. land temperature reconstructons (which support larger variations, for good physical reasons) and land+ocean reconstructions (which support smaller variations). This is most clear in the case of the Mann et al (2008) EIV reconstructions, where the land temperature reconstruction, as expected, shows a larger change than the land+ocean reconstruction. By lumping together land only and land+ocean temperature reconstructions, the authors of this section have artificially inflated the true range of disagreement among competing estimates. Reconstructions that target different regions (e.g. land vs. land+ocean, or mid-latitudes only vs. tropics+extratropics), should not be lumped together. This artificially gives the appearance of disagreement when, in fact, the amplitudes of different seriues might vary in substantial part simply due to basic climate physics/dynamics. [Michael Mann, USA]
Accepted - the new SOD figure 5.8 shows the individual NH temperature reconstructions and also distinguish between those that represent land+marine, land or extratropical-land temperatures.
5-980 5 19 29 compasion --> comparison [Masa KAGEYAMA, France] accepted
5-981 5 19 32 19 32 "weaker" : how much weaker ? [Bernard De Saedeleer, Belgium] Taken into account, text revised.
5-982 5 19 32 19 34 The statement "The simulated changes are much reduced with weaker solar variability, and the inter-model differences suggest that internal variability may have significantly influenced the MCA-to-LIA transition (Jungclaus et al., 2010)" is not supportable. There is no way to know whether intermodel differences are due to internal variability or different physics of the models, leading to different radiatively forced responses. In fact, we know from prior work (e.g. CMIP3 intercomparison project) that the forced responses of ENSO among models varies greatly, anywhere from a strong La Nina like response to positive forcing in some models to a strong El Nino-like response in others. To conclude that there is a large role of internal variability, one needs to look at the differences among realizations in an ensemble of simulations involving a specific model and specific forcings. See next comment. [Michael Mann, USA]
Taken into accoung. Text has been revised. There is no comparable inter-model temperature response pattern apart from the one described ni the text. Some models do have an ensemble of experiments with identical physcal configurations, which allow to asses internal variability.
5-983 5 19 32 19 34 As noted above, the role of internal variability can only be ascertained by looking at an ensemble of multiple realizations using a specific model and forcings. This was done for the MCA-LIA transition by Mann et al (2009) who show that the main signature in the ensemble mean response of a positive NAO/AO/NAM circulation anomaly (consistent roughly w/ the observed spatial temperature reconstruction) is robust, i.e. the force response is clearly important in explaining the main anomalies, though they do show that there is some variability from one realization to the next, demonstrating that there is indeed some role of internal variability. That conclusion is also consistent with the finding of Goosse et al (2011) which addresses the very same questions (i.e. distinguishing the impacts of internal vs. forced variability) using paleo data assimilation. This latter work [Goosse, H., et al., 2011b: The Role of Forcing and Internal Dynamics in Explaining the “Medieval Climate Anomaly”. Climate Dynamics (in revision)] is cited in chapter 10 of the FOD. It was surprised to find this work ignored in this chapter. [Michael Mann, USA]
The paper is cited in the text now. See answer to 5-982
5-984 5 19 34 19 35 This is a very strange sentence that seems to imply that only the reconstruction of Mann et al 2009 differs from these model runs, especially in the tropical Pacific. I suggest it be deleted, as this issue is dealt with on page 22, lines 13 to 21 to the opposite effect. It would help to point out there that various of the authors cited there (Diaz et al, Graham 2007, Seager et al,) report other proxy records not used by Mann et al 2009 to arrive at the finding of a cooler, more La Nina-like equatorial Pacific before ~1500. [Malcolm Hughes, USA]
Accepted, the text has been revised and changed

Expert Review Comments on the IPCC WGI AR5 First Order Draft -- Chapter 5
Do not Cite, Quote or Distribute Page 80 of 157
Comment No
Chapter FromPage
FromLine
To Page
To Line Comment Response
5-985 5 19 34 19 35 more explicit. What are the patterns in the tropical Pacific? [Gerrit Lohmann, Germany] Noted, the text has been revised and changed
5-986 5 19 34 19 35 There are several basic problems with the statement "The simulated anomalies also differ from the reconstruction of Mann et al.(2009), particularly in the tropical Pacific." as detailed in separate comments below. [Michael Mann, USA]
Accepted, the text has been revised and changed
5-987 5 19 34 19 35 First problem with statement "The simulated anomalies also differ from the reconstruction of Mann et al.(2009), particularly in the tropical Pacific": The actual spatial pattern of Mann et al (2009) and the full range of model results (not just the composite of all models and standard deviation--which is very difficult to interpret visually) should be shown as a Figure (potentially in addition to 5.8) so that readers can judge for themselves, rather than trust the author of this sentence, whether or not the reconstructed pattern is or is not consistent with the actual range of model simulations. Indeed, Mann et al (2009) show that pattern seen in the extratropics of the Northern Hemisphere IS consistent with simulations of the GISS ModelE which contains important stratospheric chemistry known (e.g. Shindell et al, Science, 2001) to be important in getting the right response of the AO/NAO/NAM to solar forcing. This physics is missing in most of the models contributing to the composite shown here. [Michael Mann, USA]
Accepted, the text has been revised and changed.Additionally, the new Figure 5.10 includes the Mann et al (2009) field reconstruction data. Model pannels incude also an evaluation of model agreement.
5-988 5 19 34 19 35 Second problem with statement "The simulated anomalies also differ from the reconstruction of Mann et al.(2009), particularly in the tropical Pacific": The statement is *false*. It is false because, as noted above, many of the key features in the Northern Hemisphere, including the enhanced high-latitude continental warming, is actually remarkably consistent with simulations of of the NASA GISS ModelE (as shown in Mann et al '09) and indeed--at least by and large--many of the simulations that contribute to the composite shown. The only clear discrepancy is related to the La Nina-like anomaly pattern in the tropical Pacific and some other teleconnected regions (e.g. North Pacific), though even here there is a hint of this pattern in the model composite shown, with an east-west SST contrast across the tropical Pacific and enhanced warming in the mid-latitude North Pactific that are consistent w/ a La Nina-like dynamical response. Presumably the match is even closer in some of the individual models--but the reader is not shown these! [Michael Mann, USA]
Noted, the text has been revised and changed
5-989 5 19 34 19 35 Third problem with statement "The simulated anomalies also differ from the reconstruction of Mann et al.(2009), particularly in the tropical Pacific": The statement is a "straw man*. It is a straw man because tacit in the statement is the misleading implication that Mann et al (2009) stands alone in demonstrating a La Nina like pattern during the MCA (and thus, in the MCA-LIA transition in the tropical Pacific). As is clear from this chapter itself, this is not the case. This finding is common now to a multitude of recent studies, several of which are discussed/cited later (p. 22) in this chapter (e.g. Diaz et al., 2011; Graham et al., 2011; Graham et al., 2007; Seager et al., 2007; Seager et al.,2008; Trouet et al., 2009). Graham et al (2011) specifically conclude that "Notably, the pattern of tropical SST change responsible for the proxy-model agreement in our results is strikingly similar to MCA-LIA SST differences in a recent proxy based reconstruction (Mann et al. 2009)." Other studies come to similar conclusions. A La Nina like pattern of contrast across the tropical Pacific is consistent with hydrological evidence from lakes in tropical East Africa (Tierney et al, New perspectives on multidecadal drought in East Africa during the Common Era, Eos Trans/AGU, Dec. 11) as well as temperature evidence across the tropical IndoPacific consistent with La Nina-like pattern of temperature gradient similar to that shown in Mann et al (2009) with temperatures in the western Pacific warm pool comparable to modern-day (Oppo et al 2009) but temperatures elsewhere in the tropical indoPacific, e.g. the tropical east African lake temperature reconstruction of Tierney et al 2010a, that are far below modern-day. [Michael Mann, USA]
Noted, the text has been revised and changed. New references have been included and the issue is discussed in more detail now. Also see Section 5.1
5-990 5 19 34 35 I know folks like to focus on Mann recons, but you need to justify why you singled out the mann et al recon for criticism here. Best be comprehensive? [Jonathan Overpeck, USA]
Noted, the text has been revised and changed. Figure 5.10 includes now the Mann et al (2012) and the Ljungqvist et al (2012) data sets.
5-991 5 19 35 19 35 space required between al. and ( [Peter Burt, UK] accepted
5-992 5 19 37 19 55 Figure 5.7 is very difficult to follow - there is a great deal of information, and it should be reviewed to see if there is a clear way of displaying or captioning it. [Tasman van Ommen, Australia]
Noted. Some improvements to 5.7 and its caption have been made, but there is indeed much information, but it is useful to retain this information
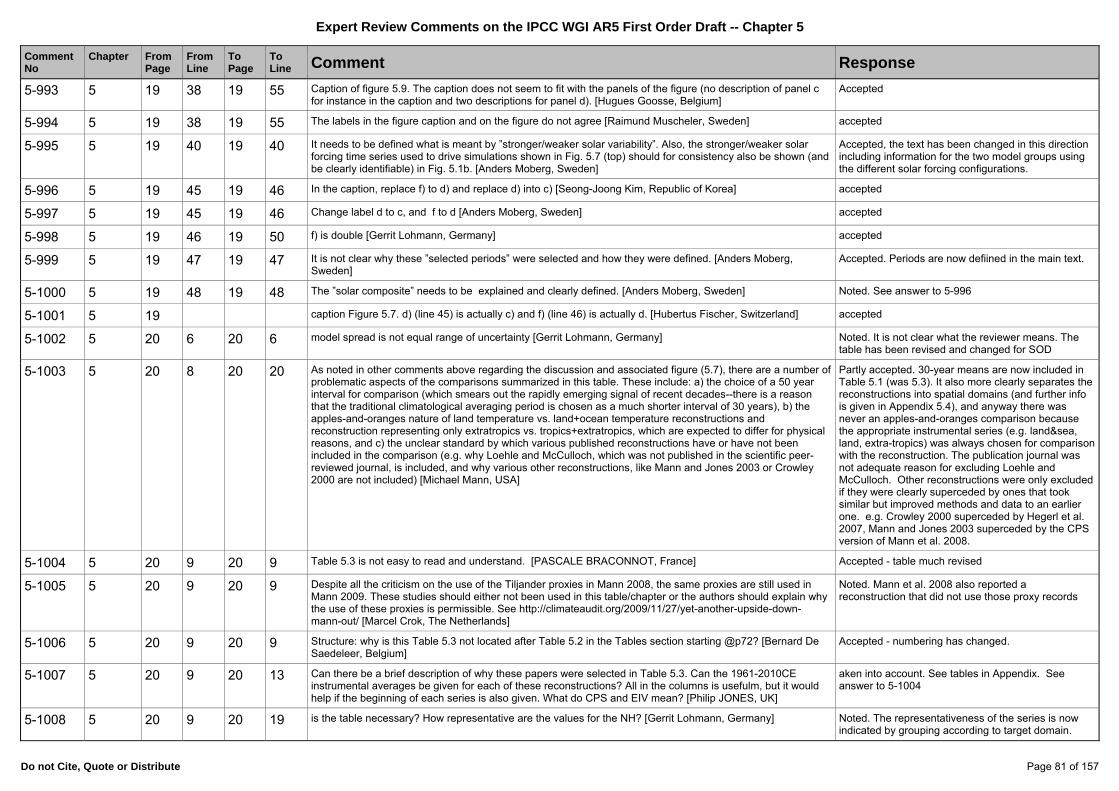
Expert Review Comments on the IPCC WGI AR5 First Order Draft -- Chapter 5
Do not Cite, Quote or Distribute Page 81 of 157
Comment No
Chapter FromPage
FromLine
To Page
To Line Comment Response
5-993 5 19 38 19 55 Caption of figure 5.9. The caption does not seem to fit with the panels of the figure (no description of panel c for instance in the caption and two descriptions for panel d). [Hugues Goosse, Belgium]
Accepted
5-994 5 19 38 19 55 The labels in the figure caption and on the figure do not agree [Raimund Muscheler, Sweden] accepted
5-995 5 19 40 19 40 It needs to be defined what is meant by ”stronger/weaker solar variability”. Also, the stronger/weaker solar forcing time series used to drive simulations shown in Fig. 5.7 (top) should for consistency also be shown (and be clearly identifiable) in Fig. 5.1b. [Anders Moberg, Sweden]
Accepted, the text has been changed in this direction including information for the two model groups using the different solar forcing configurations.
5-996 5 19 45 19 46 In the caption, replace f) to d) and replace d) into c) [Seong-Joong Kim, Republic of Korea] accepted
5-997 5 19 45 19 46 Change label d to c, and f to d [Anders Moberg, Sweden] accepted
5-998 5 19 46 19 50 f) is double [Gerrit Lohmann, Germany] accepted
5-999 5 19 47 19 47 It is not clear why these ”selected periods” were selected and how they were defined. [Anders Moberg, Sweden]
Accepted. Periods are now defiined in the main text.
5-1000 5 19 48 19 48 The ”solar composite” needs to be explained and clearly defined. [Anders Moberg, Sweden] Noted. See answer to 5-996
5-1001 5 19 caption Figure 5.7. d) (line 45) is actually c) and f) (line 46) is actually d. [Hubertus Fischer, Switzerland] accepted
5-1002 5 20 6 20 6 model spread is not equal range of uncertainty [Gerrit Lohmann, Germany] Noted. It is not clear what the reviewer means. The table has been revised and changed for SOD
5-1003 5 20 8 20 20 As noted in other comments above regarding the discussion and associated figure (5.7), there are a number of problematic aspects of the comparisons summarized in this table. These include: a) the choice of a 50 year interval for comparison (which smears out the rapidly emerging signal of recent decades--there is a reason that the traditional climatological averaging period is chosen as a much shorter interval of 30 years), b) the apples-and-oranges nature of land temperature vs. land+ocean temperature reconstructions and reconstruction representing only extratropics vs. tropics+extratropics, which are expected to differ for physical reasons, and c) the unclear standard by which various published reconstructions have or have not been included in the comparison (e.g. why Loehle and McCulloch, which was not published in the scientific peer-reviewed journal, is included, and why various other reconstructions, like Mann and Jones 2003 or Crowley 2000 are not included) [Michael Mann, USA]
Partly accepted. 30-year means are now included in Table 5.1 (was 5.3). It also more clearly separates the reconstructions into spatial domains (and further info is given in Appendix 5.4), and anyway there was never an apples-and-oranges comparison because the appropriate instrumental series (e.g. land&sea, land, extra-tropics) was always chosen for comparison with the reconstruction. The publication journal was not adequate reason for excluding Loehle and McCulloch. Other reconstructions were only excluded if they were clearly superceded by ones that took similar but improved methods and data to an earlier one. e.g. Crowley 2000 superceded by Hegerl et al. 2007, Mann and Jones 2003 superceded by the CPS version of Mann et al. 2008.
5-1004 5 20 9 20 9 Table 5.3 is not easy to read and understand. [PASCALE BRACONNOT, France] Accepted - table much revised
5-1005 5 20 9 20 9 Despite all the criticism on the use of the Tiljander proxies in Mann 2008, the same proxies are still used in Mann 2009. These studies should either not been used in this table/chapter or the authors should explain why the use of these proxies is permissible. See http://climateaudit.org/2009/11/27/yet-another-upside-down-mann-out/ [Marcel Crok, The Netherlands]
Noted. Mann et al. 2008 also reported a reconstruction that did not use those proxy records
5-1006 5 20 9 20 9 Structure: why is this Table 5.3 not located after Table 5.2 in the Tables section starting @p72? [Bernard De Saedeleer, Belgium]
Accepted - numbering has changed.
5-1007 5 20 9 20 13 Can there be a brief description of why these papers were selected in Table 5.3. Can the 1961-2010CE instrumental averages be given for each of these reconstructions? All in the columns is usefulm, but it would help if the beginning of each series is also given. What do CPS and EIV mean? [Philip JONES, UK]
aken into account. See tables in Appendix. See answer to 5-1004
5-1008 5 20 9 20 19 is the table necessary? How representative are the values for the NH? [Gerrit Lohmann, Germany] Noted. The representativeness of the series is now indicated by grouping according to target domain.

Expert Review Comments on the IPCC WGI AR5 First Order Draft -- Chapter 5
Do not Cite, Quote or Distribute Page 82 of 157
Comment No
Chapter FromPage
FromLine
To Page
To Line Comment Response
5-1009 5 20 9 20 19 This table is very space hungry and obscures the message. At least the caption should note the time frame of the comparisons (last 2ky)... But the information would be vastly more impressive and comprehensible as a figure showing the ranges of certainty as bars. I have submitted a suggested replacement as a figure to the coordinating lead author and the tsu. [Tasman van Ommen, Australia]
Taken into account - Table 5.3 (now 5.1) is much changed and hopefully easier to interpret/read. Timescales are now provided
5-1010 5 20 9 20 20 What is the objective criterion that has been used to determine which reconstructions were included in the comparison. Noteable reconstructions that are not included are Esper et al (2003), Jones et al (1998), Crowley and Lowery (2000), Mann et al (1999), and Mann and Jones (2003). Note also that Loehle and McCulloch was not published in a scientific peer-reviewed journal (it was published by Energy & Environment, a periodical that is not recognized by the Institute for Scientific Information (ISI), and is not by any conventional definition a scientific peer-reviewed journal) [Michael Mann, USA]
The publication journal was not adequate reason for excluding Loehle and McCulloch. Other reconstructions were only excluded if they were clearly superceded by ones that took similar but improved methods and data to an earlier one. e.g. Crowley 2000 superceded by Hegerl et al. 2007, Mann and Jones 2003 superceded by the CPS version of Mann et al. 2008.
5-1011 5 20 9 20 20 The reference for Loehle and McCulloch is not provided (it is Energy & Environment, a periodicall that is not recognized by the Institute for Scientific Information (ISI) and is not by any conventional definition a scientific peer-reviewed journal). [Michael Mann, USA]
The publication journal was not adequate reason for excluding Loehle and McCulloch.
5-1012 5 20 9 This table could be made more straightforward perhaps? Get rid of the third column? Also in the table caption, there is the vague statement about likelihoods will be signficantly reduced by additional sources of error. Sign and additional both are vague and give the reader the impression that the entire table is suspect. If so, maybe just delete? Not sure I like having to go to supplemental material - this is too important for that. Plus, it suggests that all the recons are equally informative and/or equally suspect. [Jonathan Overpeck, USA]
Taken into account - Table 5.3 (now 5.1) is much changed and hopefully easier to interpret/read. Timescales are now provided
5-1013 5 20 13 20 14 Possibly better to arrange details by author (source) alphabetical order, makes this look more structured [Peter Burt, UK]
Noted. Now listed according to domain and length of reconstruction
5-1014 5 20 13 20 14 The basis for selection of NH temperature estimates used in Table 5.3 is not clear. Most estimates are post-AR4 but some are pre-AR4. Why? Either use only post AR4, or use all series used bost pre- and post-AR4 to discuss systematic differences between pre- and post-AR4 records. This comment goes along with some of my previous comments regarding statements that have been made concerning pre- and post-AR4 results, which are not backed up by any explicit analysis. [Anders Moberg, Sweden]
Reconstructions were only excluded if they were clearly superceded by ones that took similar but improved methods and data to an earlier one. e.g. Crowley 2000 superceded by Hegerl et al. 2007, Mann and Jones 2003 superceded by the CPS version of Mann et al. 2008.
5-1015 5 20 13 14 In Table 5.3 “CPS” and ”EIV” should be explained in the footnotes [Franco Talarico, Italy] Rejected - reader can refer to cited papers
5-1016 5 20 Table 5.3: Christiansen and Ljungqvist is no longer “submitted” but published as Christiansen and Ljungqvist (2011). The full reference to this article is: Christiansen, B. and Ljungqvist, F. C.: Reconstruction of the extratropical NH mean temperature over the last millennium with a method that preserves low-frequency variability, J. Clim., 24, 6013–6034, 2011. [Fredrik Charpentier Ljungqvist, Sweden]
Noted. Replaced by their 2012 paper.
5-1017 5 20 Table 5.3: Leclercq and Oerlemans is still in press and the publication year will be 2012 and not 2011. [Fredrik Charpentier Ljungqvist, Sweden]
accepted
5-1018 5 20 Table 5.3: The reference to Frank et al. (2007) must be an error. There is no reference to Frank et al. (2007) in the literature list. Please, check this up. [Fredrik Charpentier Ljungqvist, Sweden]
accepted
5-1019 5 20 Table 5.3: Why is the reconstruction by Briffa et al. (2001) included, that does not reach back to the Medieval Climate Anomaly, when the reconstruction by Esper et al. (2002) is not included? Esper et al. (2002) does cover the Medieval Climate Anomaly. The full reference to Esper et al. (2002) is: Esper, J., Cook, E. R., and Schweingruber, F. H.: Low-frequency signals in long tree-ring chronologies for reconstructing past temperature variability, Science, 295, 2250–2253, 2002. [Fredrik Charpentier Ljungqvist, Sweden]
Accepted. Briffa et al. (2001) no longer included. Esper et al. was and still is included, but under the guise of Frank et al. (2007), who made a small revision to Esper's method.
5-1020 5 20 Table 5.3 - please repeat, using 20 or 30-year periods for the reason given in comment #2 above. [Malcolm Hughes, USA]
Accepted - 30-yr means now used as well
5-1021 5 20 Table 5.3 - a) re: Loehle and McCulloch, 2008 was published in 'Energy and Environment'. Does this fall within IPCC's definition of a peer-reviewed journal? Note that this reference is not presently in the reference list for
Noted. IPCC doesn't define the peer-reviewed literature and this paper can't be excluded on the

Expert Review Comments on the IPCC WGI AR5 First Order Draft -- Chapter 5
Do not Cite, Quote or Distribute Page 83 of 157
Comment No
Chapter FromPage
FromLine
To Page
To Line Comment Response
this chapter. [Malcolm Hughes, USA] basis of the journal. Reference list now fixed.
5-1022 5 20 Table 5.3: Again, I think Frank et al. 2010 should be included in this table [Valerie Trouet, United States] Rejected - Frank et al. ensemble doesn't include the calibration error (I.e. the residuals between a reconstruction and the target temperature), so it underestimates the uncertainty ranges that are needed for this assessment.
5-1023 5 21 1 21 1 What is meant by "phenomena"? I suggest you simply write "Regional Changes"? [Andreas Fischlin, Switzerland]
Noted and taken into account in the revised text
5-1024 5 21 1 21 1 If there is one 'structural tying in' needed it is here. Polar amplification needs somehow mentioning in the context of this section, although it is discussed in detail elsewhere. Perhaps just a brief reference to the appropriate discussion box is needed in this section [Mark Siddall, UK]
Noted and taken into account in the revised text
5-1025 5 21 5 21 25 In this section on regional temperature changes, as noted earlier for such sections throughout the draft, I recommend sticking to a standard format of organizing the discussion of records in latitudinal order: high, middle, and low. The current layout makes little sense because the first two subsections deal with time, the second two deal with location, and then ice gets a big subsection of its own. Furthermore, the tropics are left out of the list altogether! The theme is regional, not temporal variation, so geography should be the basis of the layout, not time, and the records are also currently jumbled within these subsections without much rhyme or reason. In sum, I recommend listing the key regions in distinct subsections here, most reasonably by latitude. Within the "High Latitude" section, for instance, discuss the northern and southern poles separately, and within each region discuss the progression of changes through time. Don't mingle the polar regions with the mid-latitudes; they operate under very different climatic boundary conditions (e.g. ice vs. none, polar vortex vs. westerlies, etc.). The current sea ice story can be included in the polar sections, perhaps with a bit of trimming down as well. Perhaps give a brief summary of the global time frame at the outset as a template for the time sequences to be discussed in each region: which time periods are to be considered, and why? [Jay Curt Stager, United States of America]
Noted. Structure of section 5.5 has been completely revised.
5-1026 5 21 8 21 8 From this place I am lost in the organisation of the chapter. The jump between regional or global (interhemispheric is not regional for me), and regional to atmospheric modes, looking at different forcings and periods is difficult to follow. I would suggest to revisit the outline to really include in the previsous section all the material on global interhemispheric information, and then really concentrate here on regions and circulation. There is also a mixture of periods and regions as can be seen from the different sub-titles that would benefit from clarification. [PASCALE BRACONNOT, France]
Noted. Structure of section 5.5 has been completely revised.
5-1027 5 21 8 21 8 This section is called Regional Temperature Changes, but the first two subsections are about a past period. [Philip JONES, UK]
Noted. Structure of section 5.5 has been completely revised.
5-1028 5 21 8 This section is in need of more general work than the other chapters because it is more of collections of isolated topics that don't fit with any compelling organizational theme, and don't uniformly inform issues of concern to policy-makers. I bet policy-makers would like it better if you approach this section region by region (in comprehensive manner - that is cover all of the regions of the globe for which there is paleo data) and then assess and report on the paleo perspectives - integrated across time scales and issues - that are relevant for decision-making. It think that was the intent in the scoping, and am pretty sure that's what the governments want. During the scoping, there was a sense by some of us that this chapter would feed into what has become a rather dull regional annex, where rather than just extracted model-based perspectives, the policy-makers for various regions would get what they really want - an integrated assessment of the physical challenges likely to affect their regions. I could be wrong, but perhaps you could write this section more with policy-makers in mind and less your scientific colleagues. As it is, it is more of a review. [Jonathan Overpeck, USA]
Noted. Structure of section 5.5 has been completely revised.
5-1029 5 21 8 There is good material in this section for sure, and some of it is quite relevant, but it just isn't as effective as it needs to be. I know that it would be hard to do a comprehensive job, but it just seems odd the way its executed. Also the subheadings are odd - within 5.4.1 (temperature), we have LGM (time period), Holocene (time period), N Hem (big region), S Hem (big region), Holocene ice (back to time period covered earlier and
Noted. Structure of section 5.5 has been completely revised.

Expert Review Comments on the IPCC WGI AR5 First Order Draft -- Chapter 5
Do not Cite, Quote or Distribute Page 84 of 157
Comment No
Chapter FromPage
FromLine
To Page
To Line Comment Response
special focus on phenomenon that is not temperature). Then 5.4.2 and 5.4.3 with subheading logic that is again not all that straightfoward. [Jonathan Overpeck, USA]
5-1030 5 21 8 Thinking about it, what if you rearranged 5.4 to first start with an overview talking about how the section would work - focused on the regions, drawing from the rest of the chapter, and adding key regionally-specific assessments on issues that are likely to be important for the FUTURE of the region. I say "future" because it would be too big a job to review everything regional, and the only solution is to stick to issues that are relevant to policy-makers - e.g., the future. I bet that policy-makers would be most pleased if you adopted a non standard format - perhaps bullets, perhaps use tables to summarize key issues for each region and text to support, but for sure go region by region. Make the regions the same as in the WGII (I'm a WGII LA and they would LOVE this, and LOVE paleopeople for this!). these are: Africa, Europe, Asia, Australasia, North America, Central and South America, Polar Regions, Small Islands, Open Oceans. If you organize this section this way (use this order, since it matches what the policy-makers will see elsewhere, I bet you'll be talked about as THE innovator of IPCC WGI by both WGII and the gov'ts. You'll get more citations and a rather hotdge-podge section will become a hit. [Jonathan Overpeck, USA]
Noted. Structure of section 5.5 has been completely revised.
5-1031 5 21 8 For example, for North America, what are the key pollicy-relevant points important to regional policy- and decision-makers? For sure drought and megadrought. You have good text here and need to just make it more comprehensive, Say more about what the full range of past recent (last 2k?) drought is and how models can't get the time evolution or full amplitude of the natural drought variability that will be superimposed on future antho change. That is, make it clear to policy-makers that they need to plan for such droughts in the future. Decision-makers in the Western US know this and are using paleo data for a reason - see Connie Woodhouse work, or ask her to write for you. It's good you get into the dynamics, but need to then higlight that the paleo work makes it clear that accurate assessment of future drought risk requires accurate simulations of ENSO and North Atlantic variability, and until we have this, the best approach is to assume that the range of drought variability that occured in the past could characterize the future. NEXT, talk about stationarity and how its not just a dead concept (see paper by Milly et al) because future climate change will be different from the 20th century, but because the paleo record makes it clear that the concept of stationarity of mean and variance is merely and artifact of using instrumental records that are too short. No paleo scientist would use stationarity unless, it was redefined as the full range of what has appened before, not just a 20th century snapshot. NEXT floods - there is great flood literature for SW North America and The upper Midwest/Mississippi. NEXT, big climate change since LGM - or since 15ka - is compariable in magnitude to what is projected for the future in North America, and the paleo reveals that the associated vegetation (pollen, macrofossil, midden, etc data) was large - did any part of North America's landscapes not change dramatically - implication is that they will in the future. I'm working with a large team led by Stave Jackson that will make this point for all continents in a paper that will be submitted this summer. [Jonathan Overpeck, USA]
Taken into account, policy relevant information is distributed in different subsections
5-1032 5 21 8 continuing with my N American example. NEXT, talk about wildfire and how the dendr records reveal that warmer temps will mean more large wildfire (Westerling et al Science paper), and others. NEXT Glaciers. You get the point, what can paleo say that has relevance to the future of the region? do this for each of the IPCC regions. Added later - stremflow records, remember that Polar regions is the place for permafrost., LIG boreal forests went to the Arctic Ocean, ocean circulations change likely. [Jonathan Overpeck, USA]
Noted. Structure of section 5.5 has been completely revised.
5-1033 5 21 10 21 28 Besides sea surface temperature changes, terrestrial surface temperature changes from both proxy data and simulations need to be added in this paragraph. Particularly, regional model-data comparison since AR4 needs to be discussed to assess the consistency between each other. For example, the PMIP2 simulations are in general in better agreement with data than PMIP1 simulations in the tropics and China, implying the important role of interactive ocean (Braconnot et al., 2007b; Jiang et al., 2011). The PMIP1 and 2 simulations were revealed to successfully reproduce surface cooling trend over China during the Last Glacial Maximum, but they failed to reproduce its magnitude (Jiang et al., 2011). [Reference not included in the current Chapter 5: Jiang, D., X. Lang, Z. Tian, and D. Guo, Last glacial maximum climate over China from PMIP simulations, Palaeogeography, Palaeoclimatology, Palaeoecology, 2011, 309, 347–357.] [Dabang Jiang, China]
Noted. Focus is on PMIP2-PMIP3 simulations. Recent syntheses (Bartlein et al, submitted; Harrison et al, submitted) have been included.
5-1034 5 21 10 LGM section is a good review, but not very comprehensive and not at all relevant. If you're going to do LGM, why such a sketchy lilst of citations. Unless you can make it relevant and more comprehensive (all regions of the globe, balance between oceans and land - policy makers care even less about the ocean change - they
Accepted and removed

Expert Review Comments on the IPCC WGI AR5 First Order Draft -- Chapter 5
Do not Cite, Quote or Distribute Page 85 of 157
Comment No
Chapter FromPage
FromLine
To Page
To Line Comment Response
live on land) I would delete this section because it is a review and not an assessment (great for me, the scientist, but now for policy-makers who will just get bored reading stuff with no apparent relevance for them). [Jonathan Overpeck, USA]
5-1035 5 21 12 21 28 when discussing tropical cooling at LGM a reference to Otto-Bliesner et al 2009 should be made. Also in addition to the multi-proxy MRGO reconstruction, what can be infered from the different proxies should be provided with the right references. [PASCALE BRACONNOT, France]
Noted. Section on tropical SST expanded in 5.3.3. Regional section now focused on Holocene.
5-1036 5 21 12 21 28 The english in this paragraph could use some smoothing over. [Michael Mann, USA] Accepted, text revised
5-1037 5 21 13 21 13 The reference to “Figure 5.3 lower left panel” should be between brackets, not between commas, as it is not an integral part of the sentence structure. [Eelco Johan ROHLING, United Kingdom of Great Britain & Northern Ireland]
Editorial
5-1038 5 21 13 There has also been the GLAMAP reconstruction between CLIMAP and MARGO. Sarnthein et al, paleoceanography, 2003 [Masa KAGEYAMA, France]
Noted. Section on tropical SST expanded in 5.3.3. Regional section now focused on Holocene.
5-1039 5 21 17 21 18 specify how is the "polar front" defined [Andrew Glikson, Australia] Rejected, space limitations in SOD
5-1040 5 21 20 21 20 “the good” should be “a good” [Eelco Johan ROHLING, United Kingdom of Great Britain & Northern Ireland] Editorial
5-1041 5 21 21 21 21 “indicate” should be “indicates” [Eelco Johan ROHLING, United Kingdom of Great Britain & Northern Ireland] Editorial
5-1042 5 21 21 22 Be consistent with the values of cooling. Some values have negative signs, others not. [Rob Wilson, United Kingdom of Great Britain & Northern Ireland]
Accepted, text revised
5-1043 5 21 23 25 Do you mean gradients in the LGM SST or in the modern-LGM anomaly? Which latitude band are you considering? Once this gradient has been defined, can you confirm that it is too small in all the climate models? The only relevant thing I see in the two cited papers is a picture of the ensemble mean in Braconnot et al. In my recent paper (Hargreaves et al 2011, CP) I concluded that the only really glaring bias in the PMIP2 LGM anomaly compared to MARGO was that the MARGO anomaly was greater on the east side of the Atlantic in the tropics (also possibly in the Pacific - see fig 7 of the paper). This is a region that is generally problematic for GCMs (upwelling region) run even for the modern. Not also that, if only a visual inspection is made, some illusion may be caused by the uncertainty in the MARGO data (compared figs 6 and 7 in the paper). Personally, I am uncertain that interpreting the pattern in the bias as a gradient is very helpful. [Julia Hargreaves, Japan]
Noted but LGM changes no more assessed in the regional changes which focus on the current interglacial period.
5-1044 5 21 24 for PMIP2 model-data comparison for the LGM tropics, please cite Otto-Bliesner et al, 2009 (Climate Dynamics) [Masa KAGEYAMA, France]
Noted but LGM changes no more assessed in the regional changes which focus on the current interglacial period.
5-1045 5 21 25 21 28 It's probably worth specifying what the "deviations" were and say which PART of that large continent of Africa they happened in. [Jay Curt Stager, United States of America]
Noted but major revisions in text.
5-1046 5 21 27 add 'a' between document and hydrological [Elie Verleyen, Belgium] Editorial
5-1047 5 21 30 31 section 5.4.1.2: you mention explicitly the time period 10ka to 2ka in the title of this section, yet the two last paragraphs of the section [Valerie Trouet, United States]
Noted.
5-1048 5 21 30 31 have <2ka as a topic (late Holocene) [Valerie Trouet, United States] Noted.
5-1049 5 21 30 Again, what the policy makers is a way to find out what paleo says about their region. A long good review of Holocene doesn't do that, It's really hard to find policy relevant statements in this section unless you're a paleo scientist and can infer them [Jonathan Overpeck, USA]
Noted.
5-1050 5 21 32 21 41 "What is meant by "warm than today"? Earlier in the paragraph "today" seems to be defined as "late 20th century". What is meant here? The decade 2001-2010 (the warmest decade on record)? Or a much colder late 20th century base period such as 1961-1990? The baseline one uses matters here, and it is essential that
Taken into account, the structure of this section has been changed

Expert Review Comments on the IPCC WGI AR5 First Order Draft -- Chapter 5
Do not Cite, Quote or Distribute Page 86 of 157
Comment No
Chapter FromPage
FromLine
To Page
To Line Comment Response
terms like "today" and "late 20th century" be defined in a rigorous and objective manner. Otherwise, they have little meaning. [Michael Mann, USA]
5-1051 5 21 32 21 51 This paragraph like much of the text uses far too many abbreviations for easy reading I rapidly lost track of what all these meant and had to keep referring back into the early part of the chapter if I could find them at all. This overuse makes the whole document very hard to read. Authors may be used to them but not everyone is. I don't udnerstand what the function of them is. [Peter Clift, United States of America]
Taken into account, the section is more clear now with less abbreviations
5-1052 5 21 32 21 51 I might just point out some references below, which are providing regional reconstructions (Europe and North America) that show that, in fact, Holocene climates are more complex than simply a response to Milankovitch variability (cf lines 34-35), including evidence of a 1200 yr variability. - Davis, B et al. 2003. The temperature of Europe during the Holocene reconstructed from pollen data Quat Sci Rev 22: 1701-; Viau, A et al. 2006. Millennial-scale temperature variations in North America during the Holocene. Journal of Geophysical Research – Atmospheres 111, D09102, doi:10.1029/2005JD006031 [Konrad Gajewski, Canada]
Partly accepted, Davis et al. 2003 is pre AR4 and not included. Viau et al. 2012 is taken into account
5-1053 5 21 33 21 33 20th century → 20th Century [Peter Burt, UK] Rejected (see style guide)
5-1054 5 21 36 Making reference to Jansen et al. (2007) is not appropriate. What is the original relevant reference? Same goes for P 5-22, Line 23. [Rob Wilson, United Kingdom of Great Britain & Northern Ireland]
Taken into account, appropriate reference is added
5-1055 5 21 37 21 39 This sentence doesn't make sense, it states that "summer season temperatures warmer than today" are "reflecting warmer summer and winters". That is a contradiction. Also "ubiquitous" is mispelled. [Michael Mann, USA]
Taken into account
5-1056 5 21 38 21 39 Please add Sundqvist et al. (2010) to the list of references here. In the proxy data synthesis of Sundqvist et al. (2010) it is shown that both summer, winter and annual mean temperature at 6 ka on the high latitudes were significantly higher than in the pre-industrial period (c. 1750 CE). The full reference to Sundqvist et al. (2010) is: Sundqvist, H. S., Zhang, Q., Moberg, A., Holmgren, K., Körnich, H., Nilsson, J., and Brattström, G.: Climate change between the mid and late Holocene in northern high latitudes – Part 1: Survey of temperature and precipitation proxy data, Clim. Past, 6, 591–608, doi:10.5194/cp-6-591-2010, 2010. [Fredrik Charpentier Ljungqvist, Sweden]
Taken into account
5-1057 5 21 39 21 39 The survey by Sundqvist et al ( Climate of the Past 6: 591-608, doi: 10.5194/cp-6-591-2010) can be added to the list of references re summers and winters in the mid Holocene. [Anders Moberg, Sweden]
Taken into account
5-1058 5 21 39 Shouldn’t Figure 5.9 come before 5.10? [Rob Wilson, United Kingdom of Great Britain & Northern Ireland] Taken into account, numbering of figures has changed in the SOD
5-1059 5 21 41 21 42 Lang & Wolff (2011) only looked at records spanning the last 800 kyr. As such, this is a rather limited dataset to investigate changes in Holocene SSTs. [Chronis Tzedakis, UK]
Taken into account, reference is removed
5-1060 5 21 42 21 42 oceanographic [Tasman van Ommen, Australia] Taken into account
5-1061 5 21 45 21 45 All of a sudden the term "Holocene thermal maximum" is used. But it is never defined. What is it? And why should we be surprised that it isn't found? These things need to be explained so that readers not immersed in the technical literature have some idea what you are talking about. [Michael Mann, USA]
Accepted, text revised
5-1062 5 21 47 21 49 Similar results are found in the terrestrial record: Millennial-scale variability in both the early Holocene and late Holocene are greater than the mid-Holocene (Viau et al reference above). [Konrad Gajewski, Canada]
Noted, considered in revision
5-1063 5 21 48 21 48 "high-amplitude, millennial to centennial scale variations" - can you be more specific? [Peter Clift, United States of America]
Accepted, text revised
5-1064 5 21 50 51 I thought cooler conditions for stronger monsoons could also result from wetter soils (which can then react to warming through increasing their latent heat flux rather their sensible heat flux?) [Masa KAGEYAMA, France]
Accepted, considered in revision
5-1065 5 21 53 21 54 Diaz et al. is no longer “in press” but published as Diaz et al. (2011). The full reference to this article is: Diaz, H. F., Trigo, R., Hughes, M. K., Mann, M. E., Xoplaki, E. and Barriopedro, D: Spatial and temporal characteristics of climate in Medieval times revisited, Bull. Am. Meteorol. Soc., 92, 1487–1500, 2011. [Fredrik
Accepted

Expert Review Comments on the IPCC WGI AR5 First Order Draft -- Chapter 5
Do not Cite, Quote or Distribute Page 87 of 157
Comment No
Chapter FromPage
FromLine
To Page
To Line Comment Response
Charpentier Ljungqvist, Sweden]
5-1066 5 21 53 22 4 Using the experiments undertaken by 36 climate models within the PMIP1 and PMIP2, Jiang et al. (2012) examined annual and seasonal surface temperatures over China during the mid-Holocene. 35 out of the 36 PMIP models reproduced colder than baseline annual temperature during that period. Seasonal temperature change followed closely the change in incoming solar radiation at the top of the atmosphere over China during the mid-Holocene. Temperature was reduced (elevated) in boreal winter and spring (summer) in all of the PMIP models at the national scale. Colder (warmer) than baseline temperature was derived from 14 of the 16 atmosphere-only (18 of the 20 coupled) models during the mid-Holocene boreal autumn. Of importance is that the above results are in stark contrast to warmer than present annual and winter climate conditions over the country as derived from multi-proxy data for the mid-Holocene. Coupled models perform generally better than atmosphere-only models. This research is closely relevant to the issue of discussion and should to be addressed. For example, “In China, however, there is a considerable model-data mismatch in annual and winter temperatures between the simulations from PMIP phases 1 and 2 and multi-proxy data during the mid-Holocene (Jiang et al., 2012)” may be added before “At latitudes ……” on line 56 of Page 21. [Reference: Jiang, D., X. Lang, Z. Tian, and T. Wang, Considerable model-data mismatch in temperature over China during the mid-Holocene: Results of PMIP simulations, Journal of Climate, 2012, in press. (Please refer to http://journals.ametsoc.org/toc/clim/0/0 before about August 2012)] [Dabang Jiang, China]
Accepted - reference added
5-1067 5 21 25 section 5.4.1 is strangely organised. The 1st two sections (5.4.1.1&2) are on different periods, while sections 5.4.1.3&4 are on different geographical zones and section 5.4.1.5 is on Holocene sea-ice. The information should be better organised. [Masa KAGEYAMA, France]
Point taken, the section has been restructured
5-1068 5 21 24 section 5.4.1: the structure of this section does not make sense to me: 5.4.1.1 and .2 are temporally determined, .3 and .4 spatially, [Valerie Trouet, United States]
Point taken, the section has been restructured
5-1069 5 21 24 and .5 thematically. Please reorganize [Valerie Trouet, United States] Point taken, the section has been restructured
5-1070 5 22 1 22 1 Insert full stop and 'The' after ) and change 'Northward' to northward [Peter Burt, UK] Editorial
5-1071 5 22 2 22 2 are → is [Peter Burt, UK] Editorial
5-1072 5 22 6 22 24 A heading is needed for this section [Chronis Tzedakis, UK] Taken into account, the section has been restructured
5-1073 5 22 6 24 this paragraph concerns the last 2 kyr, it does not belong to section 5.4.1.2 (Early to mid Holocene) --> create new subection about last 2kyrs? [Masa KAGEYAMA, France]
Taken into account, the section has been restructured
5-1074 5 22 6 ka instead of kyr [Valerie Trouet, United States] Rejected
5-1075 5 22 6 This para is about last 2ka, but appears in a section headed 10-2 ka. You need a new section here. [Eric Wolff, United Kingdom of Great Britain & Northern Ireland]
Taken into account, the section has been restructured
5-1076 5 22 7 22 7 Fig. 5.11 seems to be referenced before Fig. 5.9 & 5.10 : perhaps change the order of the figs ? [Bernard De Saedeleer, Belgium]
Taken into account, the numbering of the figures has been changed in the SOD
5-1077 5 22 7 22 7 Change Fig. 5.11 to 5.9 [Anders Moberg, Sweden] Accepted but revised figures have been renumbered.
5-1078 5 22 7 22 7 The reference to Fig. 5.11 is not correct [Chronis Tzedakis, UK] Accepted but revised figures have been renumbered.
5-1079 5 22 7 Fig. 5.10 instead of 5.11 [Valerie Trouet, United States] Accepted but revised figures have been renumbered.
5-1080 5 22 7 is figure 5.11 the correct reference here? [Elie Verleyen, Belgium] Accepted but revised figures have been renumbered.
5-1081 5 22 7 I think you should be referring to Figure 5.9. [Rob Wilson, United Kingdom of Great Britain & Northern Ireland] Accepted but revised figures have been renumbered.
5-1082 5 22 7 Figure 5.11 should read 5.9 surely. [Eric Wolff, United Kingdom of Great Britain & Northern Ireland] Accepted but revised figures have been renumbered.

Expert Review Comments on the IPCC WGI AR5 First Order Draft -- Chapter 5
Do not Cite, Quote or Distribute Page 88 of 157
Comment No
Chapter FromPage
FromLine
To Page
To Line Comment Response
5-1083 5 22 8 22 8 Fig. 5.8h : do you mean 5.8 ? [Bernard De Saedeleer, Belgium] Accepted but revised figures have been renumbered.
5-1084 5 22 8 22 8 There is no Fig 5.8h [Anders Moberg, Sweden] Accepted but revised figures have been renumbered.
5-1085 5 22 8 there is no section h in Fig. 5.8 [Valerie Trouet, United States] Accepted but revised figures have been renumbered.
5-1086 5 22 8 There is no figure 5.8h. Please ensure that reference is made to the correct figures. [Rob Wilson, United Kingdom of Great Britain & Northern Ireland]
Accepted but revised figures have been renumbered.
5-1087 5 22 10 22 13 There is a false dichotomy here, it is implied that solar variability and internal variability are the only two competing mechanisms that can explain climate changes over the past millennium (i.e. "MCA" and "LIA"), but volcanic forcing is shown elsewhere in this chapter as being a major player on this timescale, larger in magnitude even on centennial timescales than solar. [Michael Mann, USA]
Taken into account. Text revised.
5-1088 5 22 13 22 16 With regard to the sentence "Changes in the persistence or frequency..more La Nina-like conditions during the MCA": this could be stated more clearly. The various studies cited specifically support a La Nina-like pattern in the mean state for the MCA relative to the LIA. The evidence in fact goes beyond what is cited: A La Nina like pattern of contrast across the tropical Pacific is consistent with hydrological evidence from lakes in tropical East Africa (Tierney et al, New perspectives on multidecadal drought in East Africa during the Common Era, Eos Trans/AGU, Dec. 11) as well as independent proxy temperature evidence across the tropical IndoPacific which is consistent with a La Nina-like pattern of temperature gradient similar to that shown in Mann et al (2009): temperatures in the western Pacific warm pool comparable to modern-day (Oppo et al 2009) but temperatures elsewhere in the tropical indoPacific, e.g. the tropical east African lake temperature reconstruction of Tierney et al 2010a, that are far below modern-day. This doesn't of course mean that this is the last word on the topic. The details of precisely what was going on w/ ENSO and tropical Pacific climate over the past millennium continue to be enigmatic in some respects, and this is still a developing area of the science. But if one had to bet one way or the other, the evidence definitely seems to point toward a La Nina-like MCA relative to the LIA. [Michael Mann, USA]
Taken into account. Text revised.
5-1089 5 22 13 Goosse et al. 2010 should also be cited here (reference is in the reference list) [Valerie Trouet, United States] Taken into account
5-1090 5 22 15 22 16 This use of just one paper showing more La Nina-like conditions during the MCA is too shallow to include here without putting it into the context of the unfortunate inconsistencies among paleo-ENSO records during this key time period. For instance Rein et al. (2005) suggest relatively less El Nino activity then, but Moy et al. (2002) show the opposite. This illustrates my general point about paleo-ENSO: it's well worth discussing this problem somewhere in the manuscript because many models depend on these records for testing. Rein, B., A. Lückge, L. Reinhardt, F. Sirocko, A. Wolf, and W.-C. Dullo, 2005. Paleooceanography 20: PA4003, doi:10.102920004PA001099. Moy, C.M., G.O. Seltzer, D.T. Rodbell, and D.M. Anderson, 2002. Nature 420: 162-165. [Jay Curt Stager, United States of America]
Taken into account. Evidence for ENSO variability more extensively assessed in revised section 5.4
5-1091 5 22 17 22 17 after "...Tierney et al., 2010b); although evidence for more El Nino like state and stronger ENSO band periodicity has also been reported (Vance et al., J. Climate, Submitted, 2012). [Tasman van Ommen, Australia]
Text revised for SOD
5-1092 5 22 18 22 19 This sentence is not clear. I do not understand what means "SST-forced changes to large-scale circulation". The NAO is not correclty defined here (difference of SLP between the Icelandic low and Azores high for instance, or first EOF of SLP over the North Atlantic region). The NAO is usually considered as a mode of variability so that it can hardly explain changes in the mean state of climate. In order to explain regional climatic variations over the last millennium, changes in NAO persistence or frequency can be invoked as made by Trouet et al. (2009). The existence of such changes remains debated, and their explanations are merely related to changes in meridional gradient in the stratosphere (Shindell et al. 2001) or tropical changes and associated teleocnnections (Mann et al. 2009, Swingedouw et al. 2011). [Didier Swingedouw, France]
Text revised for SOD
5-1093 5 22 20 22 24 not at the right place, [PASCALE BRACONNOT, France] Accepted
5-1094 5 22 21 22 21 Mann et al (2009) argue for an important role of forced changes in both the NAO/AO/NAM and ENSO in explaining the pattern of the MCA/LIA transition, and should be cited here. [Michael Mann, USA]
Accepted

Expert Review Comments on the IPCC WGI AR5 First Order Draft -- Chapter 5
Do not Cite, Quote or Distribute Page 89 of 157
Comment No
Chapter FromPage
FromLine
To Page
To Line Comment Response
5-1095 5 22 21 22 24 The statement that "There is high confidence that the MCA was not characterized by concurrently warmer global temperatures, but rather by a range of temperature, hydroclimate and oceanic changes with distinct regional and seasonal expressions" is the clearest and most lucid expression of the collective evidence in this entire chapter, and deserves more prominent placement and emphasis. Any reasonable interpretation of that statement is that there is *high confidence* that peak hemispheric or global-scale Medieval warmth did not exceed that of the current day (which we might define by the most recent 30 year climatological averaging period). The conclusion would appear to call into question the assertion earlier in the chapter that there is only "medium confidence" (i.e. 50/50 likelihood--a "toss up") that current warmth exceeds that of the MCA at the hemispheric scale. The two statements cannot both be correct: the claim that the proposition is simply a toss up, as implied by the "medium confidence" assertion, is not objectively supported by the evidence in the chapter. That evidence supports a stronger conclusion consistent with statement in this current paragraph. [Michael Mann, USA]
Taken into account. Text revised for SOD
5-1096 5 22 21 22 24 The statement ”There is high confidence that the MCA was not characterized by concurrently warmer global temperatures...” is not fully understandable. What is meant by concurrently warmer global temperatures? Warmer than when? Moreover, the results by Ljungqvist et al. (Clim. Past, 8, 227-249, 2012) for the Northern Hemisphere land areas needs to be commented upon in this context. Their abstract states that ”Geographically widespread positive temperature anomalies are observed from the 9th to 11th centuries, similar in extent and magnitude to the 20th century mean.” [Anders Moberg, Sweden]
Taken into account. Text revised for SOD
5-1097 5 22 21 22 24 Excellent summary sentence here; I recommend also including a statement about what CO2 levels were like during the MCA, in comparison to what they are today and where they're likely headed. [Jay Curt Stager, United States of America]
Rejected, not scope of this section to to attribution
5-1098 5 22 22 22 24 This significant statement concerning the character of the Medieval Climate Anomaly should be supported by some references to recent research. It does not look that good to only refer to the last IPCC report. Some of the conclusions about a heterogeneous Medieval Climate Anomaly in the last IPCC report have also been questioned by Esper and Frank (2009). It would be fair to also refer to this article with some comment. The full reference to this article is: Esper, J. and Frank, D.C.: IPCC on heterogeneous Medieval Warm Period, Clim. Change, 94, 267–273, 2009. [Fredrik Charpentier Ljungqvist, Sweden]
Taken into account, Esper and Frank (2009) has been added
5-1099 5 22 23 A citation to work other than the AR4 would be stronger here, as it would imply progress since AR4 [Richard Telford, Norway]
Taken into account, text revised.
5-1100 5 22 26 22 26 Shouldn’t this heading be "Last 2k - Northern Hemisphere Mid to High Latitudes". You go from a subsection on LGM, then Early Holocene, then two sections on different regions, but which deal only with the late Holocene. [Konrad Gajewski, Canada]
Taken into account, structure has been changed
5-1101 5 22 26 23 19 You could consider to mention/report the high-resolution proxy record of precipitation and evaporation variability through the past 1700 yr from d18O analysis of a varved lake sequence from central Turkey (M.D. Jones et al., 2006 Geology, 34 (5). 361-364) and the result oh the PALEOVAN project (http://www.eawag.ch/forschung/surf/gruppen/van/index_EN) [Franco Talarico, Italy]
Rejected, Luterbacher et al. 2012 include this reference in their review
5-1102 5 22 26 Ditto except for… [Jonathan Overpeck, USA] Point taken
5-1103 5 22 28 22 28 warm' temperature has no physical meaning! Use 'higher' or better, quantify projected range [Peter Burt, UK] Point taken
5-1104 5 22 28 22 33 not at the right place? This section is all about last millenniumn but it is not stated in the title [PASCALE BRACONNOT, France]
Point taken, subsection structure and titles has been changed
5-1105 5 22 28 “1100 CE” must be an error for “1000 CE”. The SST reconstructions in the different articles by Sicre et al. all show an abrupt onset of the Medieval Climate Anomaly – with more than a 1°C increase in less than a decade – around 980 CE. [Fredrik Charpentier Ljungqvist, Sweden]
Point taken
5-1106 5 22 29 22 29 20th century → 20th Century [Peter Burt, UK] Rejected (see style guide)

Expert Review Comments on the IPCC WGI AR5 First Order Draft -- Chapter 5
Do not Cite, Quote or Distribute Page 90 of 157
Comment No
Chapter FromPage
FromLine
To Page
To Line Comment Response
5-1107 5 22 29 The article by Sicre et al. (2008) has now been superseded by Sicre et al. (2011) where the SST reconstruction is extended into the 21st century. Please, refer to the newer article instead. The full reference to Sicre et al. (2011) is: Sicre, M.-A., Hall, I. R., Mignot, J., Khodri, M., Ezat, U., Truong, M.-X., Eiríksson, J. J., and Knudsen, K.-L.: Sea surface temperature variability in the subpolar Atlantic over the last two millennia, Paleoceanography, 26, PA4218, doi:10.1029/2011PA002169, 2011. [Fredrik Charpentier Ljungqvist, Sweden]
Point taken
5-1108 5 22 30 22 30 appear → appears [Peter Burt, UK] corrected
5-1109 5 22 31 22 31 I would add the following sentence after the reference of Spielhagen et al. (2011): " However, depending on the proxy used, reconstructed SSTs can show some discrepancies. For instance, Bonnet et al. (2010) studied the same core as in Spielhagen et al. (2011) but by analyzing dinocysts and not foraminifera. Both proxies reflect different water masses and consequently, for the 1100 CE to 1400 CE period, dinocysts record a cooling trend suggesting an enhanced flux of the East Greenland Current." [Sophie Bonnet, Canada]
Point taken
5-1110 5 22 32 22 32 When were medieval times in this case? When is recent? [Malcolm Hughes, USA] Point taken, dates are specified
5-1111 5 22 32 The article by Kobashi et al. (2010) has now been superseded by Kobashi et al. (2011). Please, refer to the newer article instead. The full reference to Kobashi et al. (2011) is: Kobashi, T., Kawamura, K., J. Severinghaus, P., Barnola, J.-M., Nakaegawa, T., Vinther, B.M., Johnsen, S.J., and Box, J.E.: High variability of Greenland surface temperature over the past 4000 years estimated from trapped air in an ice core, Geophys. Res. Lett., 38, L21501, doi:10.1029/2011GL049444, 2011. [Fredrik Charpentier Ljungqvist, Sweden]
Accepted
5-1112 5 22 32 Please remove “except for the most recent decades” since some, but not all, regions in the Arctic/sub-Arctic seem to have experienced higher temperatures during the Medieval Climate Anomaly than even during the first decade of the 21st century. This is evident from proxy records for parts of Greenland, Iceland and northern Fennoscandia. In some parts of the Arctic/sub-Arctic the modern warming seems indeed to have exceeded the level of the medieval warming but not in all parts. To the list of references here should also be added Grudd (2008) that is referred to in other places. [Fredrik Charpentier Ljungqvist, Sweden]
Point taken
5-1113 5 22 33 22 33 Add the reference: Bonnet et al. (2010). [Sophie Bonnet, Canada] Point taken
5-1114 5 22 33 22 33 Please cite"Kobashi, T., K. Kawamura, J. P. Severinghaus, J.-M. Barnola, T. Nakaegawa, B. M. Vinther, S. J. Johnsen, and J. E. Box (2011), High variability of Greenland surface temperature over the past 4000 years estimated from trapped air in an ice core, Geophys. Res. Lett., 38(L21501)." [Takuro Kobashi, Japan]
Accepted
5-1115 5 22 33 22 33 Kaufman et al (2009), cited below on this page, should also be cited here. [Michael Mann, USA] Accepted
5-1116 5 22 35 22 37 Does it mean that the temperature pattern fits to the LIA-MCA concept only in the Central Asia? At the moment it reads like this. I see your point further in the text that the temporal boudaries of these periods where different in different regions, but the general concept of the LIA-MCA is not discussed in the chapter. Probalby it should be, at least briefly. The other side of this problem: the 2ka chapter is based mainly on tree-ring results and does not include the coarser records (e.g. tree line, glaciers), meanwhile it gives some independent impression on the longer-term trends. We might think of better connection with the glacier box here. [Olga Solomina, Russian Federation]
Point taken, section has been restructured. Glacier section includes also statements about MCA
5-1117 5 22 35 I would say 'various regions in Asia' to distinguish this paragraph from the following [Valerie Trouet, United States]
Point taken
5-1118 5 22 37 22 37 th' as superscript (x2) [Peter Burt, UK] Rejected (see style guide)
5-1119 5 22 37 22 39 It is somewhat unclear if these statements refer to both the Western Himalayas, the Tibetan Plateau and the Tianshan Mountains or only to the Western Himalayas. [Fredrik Charpentier Ljungqvist, Sweden]
point has been clarified
5-1120 5 22 38 22 38 20th century → 20th Century [Peter Burt, UK] Rejected (see style guide)
5-1121 5 22 38 22 39 In 5.4.1.3., where temperature reconstructions from East Asia are discussed, I would add the reconstruction from Liu et al. 2009 (Annual temperatures during the last 2485 years in the Eastern Tibetan Plateau inferred
Point taken

Expert Review Comments on the IPCC WGI AR5 First Order Draft -- Chapter 5
Do not Cite, Quote or Distribute Page 91 of 157
Comment No
Chapter FromPage
FromLine
To Page
To Line Comment Response
from tree rings. Science in China D 52: 348-359) [Hans W Linderholm, Sweden]
5-1122 5 22 39 22 39 20th century → 20th Century [Peter Burt, UK] Rejected (see style guide)
5-1123 5 22 41 22 42 The statement that "the large uncertainty precludes a quantitative comparison with modern temperatures" is nonsensical. Statistical inferences are drawn based on a consideration of both the central estimates and their associated uncertainties. Large uncertainties cannot "preclude" a comparison. They might preclude a definitive conclusion regarding the nature of the comparison, but they most certain do not "preclude" a comparison. [Michael Mann, USA]
Point taken, statement has been changed
5-1124 5 22 45 22 45 “China temperatures” should be “temperatures in China” or “Chinese temperatures” [Eelco Johan ROHLING, United Kingdom of Great Britain & Northern Ireland]
Accepted
5-1125 5 22 46 22 46 GHG → GHGs [Peter Burt, UK] Editorial
5-1126 5 22 50 22 50 tree-rings → tree rings [Peter Burt, UK] Editorial
5-1127 5 22 50 22 53 An additional example of warm summer temperatures during the MCA followed by cool temperatures derives from lake sediments in Wisconsin: Wahl, E.R., et al., A pollen-based reconstruction of summer temperature in central North America and implications for circulation patterns during medieval times, Glob. Planet. Change (2011), doi:10.1016/j.gloplacha.2011.10.005 [Bryan Shuman, United States of America]
Point taken
5-1128 5 22 50 22 53 The possibility that 21st centuries are exceeding MCA (and early Holocene) high temperatures is also documented for Wyoming: Shuman, B. (2012) Recent Wyoming temperature trends, their drivers, and impacts in a 14,000-year context. Climatic Change, Doi: 10.1007/s10584-011-0223-5 [Bryan Shuman, United States of America]
Point taken
5-1129 5 22 52 Replace “Colorado” with “Arizona” since the study by Salzer and Kipfmueller (2005) concerns the Southern Colorado Plateau in modern Arizona or more specifically the San Francisco Peak area of northern Arizona. [Fredrik Charpentier Ljungqvist, Sweden]
Point taken
5-1130 5 22 53 22 54 I must question that the tree-ring study by Wilson et al. (2007) for the Gulf of Alaska does not show evidence of the Medieval Climate Anomaly. Admittedly, it does not support warming of centennial length but it does show very high temperatures during parts of the 10th century. I would also like to see a reference to D’Arrigo et al. (2006) here since they also studied tree-ring evidence from the Gulf of Alaska. The Gulf of Alaska chronology used by D’Arrigo et al. (2006) is processed to capture long-term information, whereas the chronology by Wilson el al. (2007) is processed to highlight multi-decadal or higher frequency information. [Fredrik Charpentier Ljungqvist, Sweden]
Point taken
5-1131 5 22 53 54 Wilson et al (2007a) did not pick up a warmer MCA because they detrended the tree-ring data using a data-adaptive approach - “negative exponential functions or regression lines of negative/zero slope” and with a mean sample length of ~260 years, it is not surprising that multi-centennial or millennial scale variability was not picked up. The focus of Wilson et al (2007a) was on the multi-decadal (PDO related) signal. However, an RCS processed version for the Gulf of Alaska tree-ring composite was used in D’Arrigo et al (2006 – CSTA Figure 2 and 7) which clearly shows elevated temperatures during the Medieval period. You might want to state this in the text. [Rob Wilson, United Kingdom of Great Britain & Northern Ireland]
Point taken
5-1132 5 22 54 22 54 20th century → 20th Century [Peter Burt, UK] Rejected (see style guide)
5-1133 5 22 54 22 54 “then” should be “than” [Eelco Johan ROHLING, United Kingdom of Great Britain & Northern Ireland] Editorial
5-1134 5 22 55 22 55 tree-ring → tree ring [Peter Burt, UK] Editorial
5-1135 5 22 55 22 57 The text here must perhaps be rephrased when the results from the upcoming Arctic temperature reconstruction from the PAGES 2k synthesis project have been published. Preliminary results have shown much a larger amplitude of past temperature variability than in Kaufman et al. (2009). [Fredrik Charpentier Ljungqvist, Sweden]
Point taken, however we are not aware of a new publication to date

Expert Review Comments on the IPCC WGI AR5 First Order Draft -- Chapter 5
Do not Cite, Quote or Distribute Page 92 of 157
Comment No
Chapter FromPage
FromLine
To Page
To Line Comment Response
5-1136 5 22 56 Possible causes of the strong early 20th Century warming in Kaufman et al. 2009 merit discussion. [Richard Telford, Norway]
Point taken
5-1137 5 22 57 22 57 2000-year → 2000 year [Peter Burt, UK] Editorial
5-1138 5 22 57 22 57 Please incert "During the past 4000 years, average Greenland temperature cooled by 1.5 °C (Kobashi et al., 2011). In Greenland, the recent decade (2010-2011) was the three warmest decades with 1930s and 1140s in the past 1000 years, but similar temperatures with the recent decade were norm in earlier periods during the past 4000 years (Kobashi et al., 2011). Kobashi, T., K. Kawamura, J. P. Severinghaus, J.-M. Barnola, T. Nakaegawa, B. M. Vinther, S. J. Johnsen, and J. E. Box (2011), High variability of Greenland surface temperature over the past 4000 years estimated from trapped air in an ice core, Geophys. Res. Lett., 38(L21501)." [Takuro Kobashi, Japan]
Point taken, however due to space limitations we have shortened the statement
5-1139 5 22 57 22 57 it is not clear if orbital forcing is responsible of the cooling trend of the last 2000 years [Gerrit Lohmann, Germany]
Noted. New paper of Esper et al. 2012 (Nat. C. Change accepted in May 2012) discusses the role of orbital forcing in N Scandinavian summer temperature covering the past 2100 years
5-1140 5 22 22 Reference : Bonnet, S., de Vernal, A., Hillaire-Marcel, C., Radi, T., and Husum, K., 2010, Variability of sea-surface temperature and sea-ice cover in the Fram Strait over the last two millennia: Marine Micropaleontology, v. 74, no. 3-4, p. 59-74, doi: 10.1016/j.marmicro.2009.12.001. [Sophie Bonnet, Canada]
Taken into account
5-1141 5 22 23 section 5.4.1.3 seems to be about the last 2 kyrs too??? [Masa KAGEYAMA, France] Noted and taken into account in the revised text
5-1142 5 22 23 This whole 2k section is very confusing. Hopefully the PAGES 2k activity will provide clear statements that can be cited if published in time. [Eric Wolff, United Kingdom of Great Britain & Northern Ireland]
Taken into account. Whole section restructured and rewritten, including PAGES2k results.
5-1143 5 22 The PAGES 2k initiative will most likely provide significant amounts of new data and compilations related to this chapter before the submission deadline. Accordingly, these new results should be included in the next order draft [Hubertus Fischer, Switzerland]
Taken into account. Whole section restructured and rewritten, including PAGES2k results.
5-1144 5 23 2 22 5 In the same paragraph where Scandinavia is discussed, the reference to Linderholm 2009 should actually be to Linderholm et al. 2010 (Climate of the Past 6: 93-114). [Hans W Linderholm, Sweden]
Point taken
5-1145 5 23 3 The article by Helama et al. (2009) has now been superseded by Helama et al. (2010). Please, refer to the newer article instead. The full reference to Helama et al. (2010) is: Helama, S., Fauria, M., Mielikäinen, K., Timonen, M., and Eronen, M.: Sub-Milankovitch solar forcing of past climates: mid and late Holocene perspectives, Bull. Geol. Soc. Am., 122, 1981–1988, 2010. [Fredrik Charpentier Ljungqvist, Sweden]
Point taken
5-1146 5 23 4 23 5 The reference to "warm conditions... that were comparable or higher than 20th century" is ill defined. No studies I am familiar with argue that the 20th century on the whole is exceptional--they only argue that the most recent decades of the 20th century may be. So to say that some period is comprable to or higher than the "20th century" is pretty much saying nothing. Given that the trend over the 20th century is nearly 1C, it very much matters what part of the 20th century you are talking about. Early 20th century? Mid 20th century? What about the most recent 2-3 decades? Please provide either a more meaningful and instructive statement here, or eliminate. [Michael Mann, USA]
Taken into account. Assessment reformulated when possible from the literature.
5-1147 5 23 5 23 5 insert 'to' after 'comparable' [Peter Burt, UK] Editorial
5-1148 5 23 5 23 5 20th century → 20th Century [Peter Burt, UK] Rejected (see style guide)
5-1149 5 23 6 Please include a reference to Büntgen et al. (2011) here. The article by Corona et al. (2010) has now been superseded by Corona et al. (2011). Please, refer to the newer article instead. The full reference to Corona et al. (2011) is: Corona, C., Edouard, J.-L., Guibal, F., Guiot, J., Bernard, S., Thomas, A., and Denelle, N.: Long-term summer (AD 751–2008) temperature fluctuation in the French Alps based on tree-ring data, Boreas, 40, 351–366, 2011. [Fredrik Charpentier Ljungqvist, Sweden]
Accepted
5-1150 5 23 6 Buentgen et al. 2011 (reference in reference list) can also be cited here [Valerie Trouet, United States] Accepted

Expert Review Comments on the IPCC WGI AR5 First Order Draft -- Chapter 5
Do not Cite, Quote or Distribute Page 93 of 157
Comment No
Chapter FromPage
FromLine
To Page
To Line Comment Response
5-1151 5 23 7 23 8 20th century → 20th Century [Peter Burt, UK] Rejected (see style guide)
5-1152 5 23 7 8 Reword to “......points to warm conditions around 1000 CE, followed by generally lower temperatures. However the late 20th century warmth here appears to be unprecedented over the past 1500 years. Guiot et al., (2010) combined..........” [Rob Wilson, United Kingdom of Great Britain & Northern Ireland]
Point taken
5-1153 5 23 8 23 8 → Guiot et al. (2010) [Peter Burt, UK] Accepted
5-1154 5 23 8 23 8 "1500 years. (Guiot et al., 2010) combined" should be "1500 years. Guiot et al. (2010) combined" [Andrew Glikson, Australia]
Accepted
5-1155 5 23 11 23 11 20th century → 20th Century [Peter Burt, UK] Rejected (see style guide)
5-1156 5 23 11 Please name these decades specifically. From 1950 on? From 1980, etc? This really makes a difference. [Malcolm Hughes, USA]
Point taken
5-1157 5 23 12 23 19 More can be said about climate in Europe as evidenced from historical documents for the last 500 years, not only for summer but for all seasons. An entire special issue with several papers in Climatic Change was devoted to this topic, with Brázdil et al (2010) providing an overview. [Anders Moberg, Sweden]
Noted. Due to space limitations, focus on the longest European reconstructions and new findings since AR4.
5-1158 5 23 12 19 Finally, I'm ready along and find something that clearly written to be relevant - European temperatures. This would be GREAT in a section foused on Europe. As the floods, talk about recent strominess? Fire, glaciers, snow, put it all in a Euro section rather than burying it in a section that is mostly good review, but not good policy-relevant assessment. [Jonathan Overpeck, USA]
Noted.
5-1159 5 23 13 23 13 10-year → 10 year [Peter Burt, UK] Editorial
5-1160 5 23 15 23 15 16th century → 16th Century [Peter Burt, UK] Rejected (see style guide)
5-1161 5 23 15 23 17 Although "information on pre-16th century winter temperature variations in Europe is scarce" reference should still be made to the pioneering work of Leijonhufvud et al. (2010) who reconstructed winter/spring temperatures from documentary and instrumental records from Stockholm harbour (Leijonhufvud L., Wilson R., Moberg A., Söderberg J., Retsö D., Söderlind U. Five centuries of Stockholm winter/spring temperatures reconstructed from documentary evidence and instrumental observations. Climatic Change 101, 1–2, 2010. [Iain Robertson, UK]
Rejected due to space limitations
5-1162 5 23 16 23 19 This list is incomplete: There are several findings that current winter situations are the warmest in last 500 to 1.000 years , e.g. Pfister et al. and Giovanna Battipaglia / David Frank / Ulf Büntgen / Petr Dobrovolný / Rudolf Brázdil / Christian Pfister / Jan Esper, Five centuries of Central European temperature extremes reconstructed from tree-ring density and documentary evidence, in : Global and Planetary Change 72, (2010) 182-191, [Paul Dostal, Germany]
Rejected, the major references for European Winter temperature changes have been mentioned
5-1163 5 23 18 23 19 "current winter conditions in central Europe are the warmest in the context of the past millennium." is this a robust result? Representativeness of the data. [Gerrit Lohmann, Germany]
Point taken, revised text focused on summer and annual temperature reconstructions for Europe.
5-1164 5 23 21 23 42 same as comment 36 [Masa KAGEYAMA, France] Point taken
5-1165 5 23 23 23 27 McIntyre has shown on his blog that there is hardly any progress since AR4: http://climateaudit.org/2012/01/19/neukom-and-the-steig-overunder/ As McIntyre notes: "Many of these records are listed by Neukom and Gergis as only “available upon request”. The most intriguing such example is Eric Steig’s Siple Dome dD (and d18O) series – see excerpt below – which Neukom obtained as a “personal communications”. The Siple Dome core was drilled in 1993-4: the data was publicly funded. Even by Lonnie Thompson standards, this is a long time for the data to remain both unpublished and unarchived, particularly given the scarcity of long SH proxies. One cannot help but think that the data set would have been promptly published if
Point taken, only data are presented that public available

Expert Review Comments on the IPCC WGI AR5 First Order Draft -- Chapter 5
Do not Cite, Quote or Distribute Page 94 of 157
Comment No
Chapter FromPage
FromLine
To Page
To Line Comment Response
it had HS shape and, ergo, my prediction is that, if and when, the data ever is made “available”, it will not have a Hockey Stick shape." So far Neukom and Steig refuse to make their data available to McIntyre. This is unacceptable and to me it is a mystery why after so many years of discussion about data availability prominent scientists in this field still continue to obstruct requests for data. IPCC can of course play an important role in this by demanding that all data behind publications that are referred to in AR5 are made available by the authors. [Marcel Crok, The Netherlands]
5-1166 5 23 23 23 34 The uncertainties and reliability of the newly published regional reconstructions deserve more attention – bearing the former ”hockey-stick” debate in mind. For example, the South American temperature reconstruction by Neukom et al. (2011) is based on very little evidence from South America before around 1700. Not paying attention to the significance of this lack of information is almost guaranteed to lead to an un-necessarily heated debate going on far beyond the arena of peer-reviewed scientific literature. [Anders Moberg, Sweden]
Taken into account. we have mentioned that the Neukom reconstruction are based on very few records before 1700.
5-1167 5 23 28 no need to cite Neukom et al. 2011 here again (already cited in L26 and L29) [Valerie Trouet, United States] Noted.
5-1168 5 23 29 23 30 The statement "temperatures between 900 CE and 1350 CE that are mostly warmer than the 20th century climatology" tells us literally nothing. What is meant by 20th century climatology, the average over the 20th century? No studies I am familiar with argue that the 20th century on the whole is exceptional--they only argue that the most recent decades of the 20th century may be. So to say that some period is comprable to or higher than the "20th century" is pretty much saying nothing. Given that the trend over the 20th century is nearly 1C, it very much matters what part of the 20th century you are talking about. Early 20th century? Mid 20th century? What about the most recent 2-3 decades? Please provide either a more meaningful and instructive statement here, or eliminate. [Michael Mann, USA]
Noted. See comment above re the definition of a common reference period within the 20th century
5-1169 5 23 30 23 30 20th century → 20th Century [Peter Burt, UK] Rejected (see style guide)
5-1170 5 23 36 23 36 Looking at Figure 3C of the Kaufman et al., 2009 paper you cite, I see no 'clear evidence of an MCA-like warm phase, etc.,' but rather a long decline over the whole reconstructed period with decadal to multidecadal excursions to either side throughout the record. Where in this paper did you see the 'clear evidence of an MCA-like warm phase'? [Malcolm Hughes, USA]
Point taken, reformulated
5-1171 5 23 36 23 37 The statement "In contrast to the Arctic (Kaufman et al., 2009), proxy records from coastal East Antarctica do not show clear evidence of an MCA-like warm phase" is puzzling, because Kaufman et al (2009) doesn't show evidence of an "MCA-like warm phase" either. Kaufman et al (2009) instead suggests that Arctic (summer) trends were characterized by an essentially monontonic two millennium-long cooling trend prior to the unprecednted warming of the past century. [Michael Mann, USA]
Point taken, reformulated
5-1172 5 23 45 23 53 I guess figure 5.9 will be updated for the SOD as additional information is expected in the coming months.The Guiot et al. (2010) reconstruction is an alternative one for summer temperature in Europe. I do not see the reference period on each panel. [Hugues Goosse, Belgium]
Point taken, indeed the figure will be updated by new published evidence
5-1173 5 23 51 23 53 This section must be updated as soon as the new temperature reconstructions from the PAGES 2k synthesis project have been published. [Fredrik Charpentier Ljungqvist, Sweden]
Point taken, indeed the figure will be updated by new published evidence
5-1174 5 23 52 23 52 There are lots of long European reconstructions. Why was Buntgen et al (2011) chosen? This could probably be asked about some of the other areas as well (such as China). [Philip JONES, UK]
Accepted, new published evidence will be considered. Note that the focus here is on long 2000 year reconstructions
5-1175 5 23 56 23 56 "The Mid Holocene Optimum around 8 ka to 9 ka" - the "optimum" is different in different regions. Probably it makes sense to avoid this term [Olga Solomina, Russian Federation]
Noted
5-1176 5 23 57 Bartlein et al. (2010) is an error for Bartlein et al. (2011). [Fredrik Charpentier Ljungqvist, Sweden] Accepted
5-1177 5 23 Fig. 5.9: the different spectral properties of the various regional reconstructions are suspicious. It is hard to believe that e.g. Australasia exhibits absolutely no centennial variability. I suspect some effect of the different
Accepted, new published evidence will be considered and the figure updated

Expert Review Comments on the IPCC WGI AR5 First Order Draft -- Chapter 5
Do not Cite, Quote or Distribute Page 95 of 157
Comment No
Chapter FromPage
FromLine
To Page
To Line Comment Response
methods used in the compilations. [Hubertus Fischer, Switzerland]
5-1178 5 23 Fig. 5.10: I cannot see different symbol sizes as mentioned in the caption [Hubertus Fischer, Switzerland] Editorial
5-1179 5 24 7 35 why is the information from this section not distributed in the previous ones? Why single out sea-ice reconstructions compared to other variables? [Masa KAGEYAMA, France]
Sea ice an important feedback. Warrants to be handled separately
5-1180 5 24 7 Sea ice - put in a polar section. [Jonathan Overpeck, USA] See revised structure in SOD
5-1181 5 24 9 24 11 Sea ice variations can also be inferred from ice break up dates and instrumental records. See Leijonhufvud et al (2010; reference above) and Loader N.J., Jalkanen R., McCarroll D. and Moberg A. Spring temperature variability in northern Fennoscandia AD 1693-2011. Journal of Quaternary Science 26(6), 566-570, 2011. [Iain Robertson, UK]
Considered for SOD
5-1182 5 24 11 24 11 Add the reference de Vernal et al. (2008) which is more complete concerning sea-ice reconstructions with dinocysts, in addition to de Vernal and Rochon (2011). [Sophie Bonnet, Canada]
Taken into account.
5-1183 5 24 11 The utility of microfossils for reconstructing sea-ice is probably over-estimated as the studies do not account for autocorrelation or the uneven distribution of sites along the environmental gradient. [Richard Telford, Norway]
Noted.
5-1184 5 24 16 24 16 parallell [Peter Clift, United States of America] Editorial
5-1185 5 24 16 parallell --> parallel [Masa KAGEYAMA, France] Editorial
5-1186 5 24 17 24 17 have → has [Peter Burt, UK] Editorial
5-1187 5 24 17 24 17 “American” should be “America” [Eelco Johan ROHLING, United Kingdom of Great Britain & Northern Ireland] Editorial
5-1188 5 24 19 24 19 20th century → 20th Century [Peter Burt, UK] Rejected ref. style guide
5-1189 5 24 19 24 31 Too many qualifiers in this text… remove words such as 'apparently, relatively…' This section needs a careful proof read. [Christian Ohneiser, France]
Accepted
5-1190 5 24 24 24 24 "was characterised by both by a long-term trend driven by the orbital forcing, but also punctuated by strong" should be "was characterised by a long-term trend driven by the orbital forcing and punctuated by strong" [Andrew Glikson, Australia]
Accepted
5-1191 5 24 24 24 24 Take about "by" after "characterised" [Seong-Joong Kim, Republic of Korea] Noted.
5-1192 5 24 24 The glacier box is a paleo IPCC tradition and it still works. You could still use the box in my recommended reorganization and cite it from multiple regional subsections, where you would still highlight the importance of receeding glaciers (e.g. for water supply). Make your stuff clearly relevant in the regional subsections and use boxes to focus on the assessment of cross-cutting science issues. [Jonathan Overpeck, USA]
Noted. Information on glaciers now included in the revised regional section (.5.5) to improve consistency.
5-1193 5 24 24 remove “by” after “both” [Franco Talarico, Italy] Editorial
5-1194 5 24 24 by (both by) [Valerie Trouet, United States] Editorial
5-1195 5 24 24 Delete “by” after “both” [Rob Wilson, United Kingdom of Great Britain & Northern Ireland] Editorial
5-1196 5 24 27 24 27 20th century → 20th Century [Peter Burt, UK] Rejected - style guide
5-1197 5 24 27 Delete “as” before “also” [Rob Wilson, United Kingdom of Great Britain & Northern Ireland] Editorial
5-1198 5 24 28 24 28 19th century → 19th Century [Peter Burt, UK] Rejected - style guide
5-1199 5 24 28 24 31 What is "moderate" confidence here? That term is not defined in the IPCC "uncertainty guidance" document. Is Accepted. Confidence statement revised and

Expert Review Comments on the IPCC WGI AR5 First Order Draft -- Chapter 5
Do not Cite, Quote or Distribute Page 96 of 157
Comment No
Chapter FromPage
FromLine
To Page
To Line Comment Response
"medium" meant? It appears that the Kinnard et al study [Kinnard, C., Zdanowicz, C.M., Fisher, D.A., Isaksson, E., de Vernal, A., Thompson, L.G., Reconstructed changes in Arctic sea ice over the past 1,450 years, Nature, 472, 509-513 ] was not assessed in the FOD. Surely, inclusion of that study would raise the degree of confidence in this conclusion, since the authors use a quantitative reconstruction of Arctic sea ice extent to conclude that "both the duration and magnitude of the current decline in sea ice seem to be unprecedented for the past 1,450 years." [Michael Mann, USA]
reference now cited.
5-1200 5 24 30 24 31 Please, add Kinnard et al. (2011) to the list of references. The full reference to Kinnard et al. (2011) is: Kinnard, C., Zdanowicz, C.M., Fisher, D.A., Isaksson, E., de Vernal, A., and Thompson, L.G.: Reconstructed changes in Arctic sea ice over the past 1,450 years, Nature, 479, 509–512, 2011. [Fredrik Charpentier Ljungqvist, Sweden]
Accepted
5-1201 5 24 30 Since Kaufman et al. 2009 contains neither sea-ice nor SST proxies, is it relevant here? [Richard Telford, Norway]
Rejected, Sea ice and SST is tighly coupled, thus relevant
5-1202 5 24 31 24 31 Add reference: Bonnet et al. (2010) and Kinnard et al. (2011) [Sophie Bonnet, Canada] Accepted. References cited now.
5-1203 5 24 33 24 35 Wolff et al 2003, GRL 22, 2158, using ice core sea salt also propose an increase in sea ice over the Holocene for the Indian ocean sector, and (citing Steig et al 98 sea salt and diatom data) for the Ross Sea. This should probably also be cited. Although there are uncertainties about the quantification from sea salt, the qualitative result should be solid. [Eric Wolff, United Kingdom of Great Britain & Northern Ireland]
Noted. Text focuses on marine records produced since AR4.
5-1204 5 24 34 24 35 "with a rather abrupt increase between 5 ka and 4 ka" is not due to orbital forcing [Gerrit Lohmann, Germany] Taken into account. Text revised.
5-1205 5 24 34 24 35 As soon as the trends in both hemispheres are opposite this sentense is a little confusing [Olga Solomina, Russian Federation]
Accepted
5-1206 5 24 35 24 35 "Ice core reconstruction of sea ice extent from methanesulphonat (Curran et al., Science, 2002), shows a marked (~20% decline) in sea ice extent in East Antarctica over the latter half of the 20th Century." This work, while not so recent, remains the current status over this time period and region and is a powerful palaeoobservation of change in sea ice extent that is missing from the report. [Tasman van Ommen, Australia]
Noted. Text focuses on marine records produced since AR4.
5-1207 5 24 38 25 57 Comments on 'Box 5.2: Glacier Variations During the Holocene' p. 24-25. Parts of the text in Box 5.2 are partly irrelevant and do not provide an updated review of Holocene glacier variations on a global scale. In addition, the selection of references to the different sections also looks a bit arbitrary. The records in Box 5.2, Figure 1 are not well displayed and the figure caption is partly wrong and not sufficiently precise. Suggestion: As for glacier mass balance and glacier length records presented in Chapter 4 (Cryosphere), I suggest that regional syntheses of Holocene glacier length changes/ELA variations are made (suggest the eleven regions: 1. Alaska, 2. Western Canada/Cordillera/Western North America, 3. Eastern Canada/Arctic, 4. South America, 5. Antarctica and Sub-Antarctic Islands, 6. Greenland, 7. Iceland, 8. Scandinavia, 9. The Alps, 10. Himalaya and Tibet, and 11. New Zealand) mainly based on the worldwide syntheses of Lateglacial and Holocene glacier variations published in Quaternary Science Reviews 28 in 2009. More recent records (published after 2009) may also be added where relevant. Suggest that the most well-dated and continuous records are used in the syntheses and displayed in the figure. I also suggest that only continuous glacial records (e.g. lake sediments, tree logs/rings) for the last 2000 years are used in Box 5.2, Figure 1 (for example The Alps, Scandinavia, Himalaya and southern Tibet). [Atle Nesje, Norway]
Accepted. The figure is deleted, the references are revised and some of them replaced by more recent and relevant. The suggestion is rejected due to the lack of space and absence of striking global general evidences different from the IPCC 4 reports.

Expert Review Comments on the IPCC WGI AR5 First Order Draft -- Chapter 5
Do not Cite, Quote or Distribute Page 97 of 157
Comment No
Chapter FromPage
FromLine
To Page
To Line Comment Response
5-1208 5 24 42 25 57 BOX 5.2 Very confusing and difficult to read! At the end of Box 5.2 I am left wondering what the consensus is and whether there is one. e.g. These are confident evidence of reduced sizes of glaciers in the past, but the precise.... Work on this box. Choose a theme (or the results) and then write around these. [Christian Ohneiser, France]
Accepted, see comment above
5-1209 5 24 45 24 45 "length" should be "length" [Andrew Glikson, Australia] Editorial
5-1210 5 24 45 24 45 change "lengh" to ""length" [Seong-Joong Kim, Republic of Korea] Editorial
5-1211 5 24 45 Replace “lenght” with “length” [Rob Wilson, United Kingdom of Great Britain & Northern Ireland] Editorial
5-1212 5 24 46 lenght --> length [Masa KAGEYAMA, France] Editorial
5-1213 5 24 51 24 51 underrepresented → under represented [Peter Burt, UK] Editorial
5-1214 5 24 14 Reference:Kinnard, C., Zdanowicz, C.M., Fisher, D.A., Isaksson, E., de Vernal, A., Thompson, L.G., 2011. Reconstructed changes in Arctic sea ice over the past 1,450 years, Nature, 479, 509-513. [Sophie Bonnet, Canada]
Accepted
5-1215 5 24 24 Reference: de Vernal, A., Hillaire-Marcel, C., Solignac, S., Radi, T., Rochon, A., 2008. Reconstructing Sea Ice Conditions in the Arctic and Sub-Arctic Prior to Human Observations, in Eric T. DeWeaver, Cecilia M. Bitz, L-Bruno Tremblay (Eds): Arctic Sea Ice Decline: Observations, Projections, Mechanisms, and Implications, Geophysical Monograph Series 180, Doi: 10.1029/180GM04, ISBN 978-0-87590-445-0, 350pp. [Sophie Bonnet, Canada]
Accepted if space allows
5-1216 5 24 delete 'by' between both and a [Elie Verleyen, Belgium] Editorial
5-1217 5 25 1 25 1 "opposite multi-millennial trends" an brief explanation is warranted here [Andrew Glikson, Australia] Accepted
5-1218 5 25 2 5 sentence to be reformulated, some words are missing… [Masa KAGEYAMA, France] Accepted
5-1219 5 25 3 25 3 southern Himalayas glaciers - southern Himalayan glaciers [Peter Clift, United States of America] Editorial
5-1220 5 25 4 25 4 text missing after 'that' [Peter Burt, UK] Accepted
5-1221 5 25 4 25 4 monsoon → Monsoon (match convention of Chapter 14 and elsewhere in this Chapter) [Peter Burt, UK] Editorial
5-1222 5 25 4 25 4 Missing word at + in sentence: "... shows that + in the Asian monsoon area might be the result..." What is missing at + ? [Graham Weedon, UK]
Accepted
5-1223 5 25 4 25 5 This poorly worded sentence needs repair. [Jay Curt Stager, United States of America] Accepted
5-1224 5 25 4 add 'variations' between area and might [Elie Verleyen, Belgium] Accepted
5-1225 5 25 11 high frequency --> which timescales? [Masa KAGEYAMA, France] Accepted, reworded
5-1226 5 25 12 15 this sentence should be moved up, before the more detailed statements about the last 2ky glaciers (around line 7) [Masa KAGEYAMA, France]
Noted.
5-1227 5 25 13 Delete “the” before “precise” [Rob Wilson, United Kingdom of Great Britain & Northern Ireland] Editorial
5-1228 5 25 15 25 15 th' as superscript [Peter Burt, UK] Rejected - style guide
5-1229 5 25 15 25 15 19th centuries → 19th Centuries [Peter Burt, UK] Rejected - style guide
5-1230 5 25 18 25 18 Linderholm and Jansson 2007 could possibly be added as a reference after Nesje 2009 (a reconstruction of Storglaciären mass balance back to CE 1500 based on tree-ring data and a NAO index, Annals of Galciology
Accepted if space allows

Expert Review Comments on the IPCC WGI AR5 First Order Draft -- Chapter 5
Do not Cite, Quote or Distribute Page 98 of 157
Comment No
Chapter FromPage
FromLine
To Page
To Line Comment Response
46: 261-267) [Hans W Linderholm, Sweden]
5-1231 5 25 19 25 19 "evidences" better write "evidence" [Andrew Glikson, Australia] Editorial
5-1232 5 25 19 25 20 "further evidences and modeling are required..." is not proper english, and its unclear precisely what is meant here. Perhaps "further confirmation from modeling studies will be required..." [Michael Mann, USA]
Accepted
5-1233 5 25 22 25 44 section starting Line 22. Here the English is awkward and this section needs a good overhaul. See, for example, the sentences “These are confident evidences of reduced sizes of glaciers in the past ….” (line 24), or “… but in others they are still larger and did not reach the equilibrium with the modern climate which is changing with very high speed” (line 28), or “In the western North American glaciers were similar however some prominent advances …” (line 37). These clippings demonstrate a grammar that is so poor that it obscures the message. Much work is needed in this section to clean up the language so that it becomes clear and unequivocal. [Eelco Johan ROHLING, United Kingdom of Great Britain & Northern Ireland]
Accepted
5-1234 5 25 22 In this subsection, I recommend starting with a very brief summary of WHAT major factors cause fluctuations in glacial ice growth and retreat. (e.g. wetness, temperature, under-ice melting vs. anchoring, sublimation, etc.) [Jay Curt Stager, United States of America]
Taken into acocunt
5-1235 5 25 23 25 23 "consistently" better write "consistent" [Andrew Glikson, Australia] Editorial
5-1236 5 25 23 Place “globally” after “retreating” [Rob Wilson, United Kingdom of Great Britain & Northern Ireland] Editorial
5-1237 5 25 24 25 24 evidences → evidence [Peter Burt, UK] Editorial
5-1238 5 25 24 25 24 "These are confident evidences" better write "There is confidient evidence" [Andrew Glikson, Australia] Accepted
5-1239 5 25 27 Whereas it seems quite clear that the recent glacier retreat is unprecedented in the Andes in the last 6000 years, the evidence for this in Scandinavia is more inconclusive. The article by Nesje (2009) does not really give support to such a statement. Please, recheck it and also invoke other references if the statement is not changed. [Fredrik Charpentier Ljungqvist, Sweden]
Accepted
5-1240 5 25 28 25 25 "others" better write "other" [Andrew Glikson, Australia] Editorial
5-1241 5 25 29 25 29 "equilibrium-line altitude" define the term [Andrew Glikson, Australia] Editorial
5-1242 5 25 30 25 30 20th century → 20th Century [Peter Burt, UK] Rejected - style guide
5-1243 5 25 33 25 33 21st century → Century [Peter Burt, UK] Rejected - style guide
5-1244 5 25 33 25 34 You don't mention Antarctic Peninsula ice shelf changes. There has been considerable work showing that ice shelves on the north east of the Antarctic peninsula, which have disappeared recently, had been present continuously for various lengths of time (around 2 kyr for Prince Gustav, longer for Larsen A and even longer for Larsen B). Cite Pudsey, C. J., and J. Evans (2001),Geology, 29(9), 787-790; Bentley, M. J., et al. (2005), Geology, 33(3), 173-176.; Domack, E., et al. (2005), Nature, 436(7051), 681-685.; and maybe Hodgson, D. A. (2011), First synchronous retreat of ice shelves marks a new phase of polar deglaciation, Proc. Natl. Acad. Sci. U. S. A. [Eric Wolff, United Kingdom of Great Britain & Northern Ireland]
Taken into account, text expanded and Hodgson et al (2011) cited.
5-1245 5 25 33 36 this sentence is too long. It should be splitted into 2. [Masa KAGEYAMA, France] Noted.
5-1246 5 25 35 25 35 advanced → advances [Peter Burt, UK] Editorial
5-1247 5 25 35 25 35 "prominent advanced" should be "prominent advances" [Andrew Glikson, Australia] Editorial
5-1248 5 25 35 25 35 Change "advanced" to "advancement" [Seong-Joong Kim, Republic of Korea] Editorial
5-1249 5 25 35 advanced --> advances [Masa KAGEYAMA, France] Editorial

Expert Review Comments on the IPCC WGI AR5 First Order Draft -- Chapter 5
Do not Cite, Quote or Distribute Page 99 of 157
Comment No
Chapter FromPage
FromLine
To Page
To Line Comment Response
5-1250 5 25 35 “advance” not “advanced” [Rob Wilson, United Kingdom of Great Britain & Northern Ireland] Editorial
5-1251 5 25 36 25 36 delete comma before SE and replace with 'and' [Peter Burt, UK] Editorial
5-1252 5 25 37 25 37 Edit for sense: ' In western North America, glaciers were similar (to what?). Howeverr, some prominent.... Zealand and SE Tibet.' [Peter Burt, UK]
Noted.
5-1253 5 25 37 25 37 Change "however" into "although" [Seong-Joong Kim, Republic of Korea] Editorial
5-1254 5 25 37 25 37 "In western North America, levels of glacial retreat were similar, though some prominent advances…" [Michael Mann, USA]
Noted.
5-1255 5 25 37 25 38 this part of sentense should be deleted - it seems to come from a previous version [Olga Solomina, Russian Federation]
Noted.
5-1256 5 25 37 25 40 This part is poorly worded, hard to follow. Clarify the wording so the times and places and patterns are clearer. I also recommend including the following paper on Ruwenzori glacier retreat in East Africa. Russell, J., H. Eggermont, R. Taylor, and D. Verschuren, 2008. Paleolimnological records of recent glacier recession in the Ruwenzori Mountains, Uganda-D.R. Congo. Journal of Paleolimnology doi 10.1007/s10933-008-9224-4. [Jay Curt Stager, United States of America]
Taken into account, text revised.
5-1257 5 25 37 Re-word to “In western North America, glacial movement was similar.......” [Rob Wilson, United Kingdom of Great Britain & Northern Ireland]
Noted.
5-1258 5 25 40 25 40 "conditions(Koch" should be "conditions (Koch" [Andrew Glikson, Australia] Noted.
5-1259 5 25 40 25 40 This should be related back to the discussion of evidence for a La Nina-like MCA earlier in this chapter, e.g. page 19, 3rd paragraph; page 22, 2nd paragraph [Michael Mann, USA]
Accepted.
5-1260 5 25 40 25 44 this should be a separate paragraph [Olga Solomina, Russian Federation] Accepted
5-1261 5 25 40 As noted for Page 5-22, this claim of more La Nina-like conditions during the LIA is contradicted by several paleo-ENSO records; this again highlights the important unresolved problem with late Holocene paleo-ENSO history which is well worth pointing out clearly in this report. [Jay Curt Stager, United States of America]
Not really relevant for this subsection, more a general comment for consideration
5-1262 5 25 42 25 42 insert comma after 'Therefore' [Peter Burt, UK] Editorial
5-1263 5 25 42 25 44 The sentence "therefore while comparing… (see chapter 4)" should be at the beginning of this paragraph (line 22) to make clear since the beginning that advances/retreats in glaciers cannot be directly and simultaneously linked to changes in temperature. [Yueh-Hsin Lo, Taiwan R.O.C.]
Noted.
5-1264 5 25 48 reptersent --> represent [Masa KAGEYAMA, France] Editorial
5-1265 5 25 48 misspelling: "reptersent" [Henry Pollack, USA] Editorial
5-1266 5 25 48 Replace “reptersent” with “represent” [Franco Talarico, Italy] Editorial
5-1267 5 25 48 should be represent [Elie Verleyen, Belgium] Editorial
5-1268 5 25 51 There is a typographical error in this line. [Fredrik Charpentier Ljungqvist, Sweden] Editorial
5-1269 5 25 For glaciers I would again like some comment on the varying relationship between summer temperature and winter/annual precipitation in determining glacier response, especially as this varies latitudinally and regionally. In Iceland for example the southern glaciers are very clearly sensitive to summer temperatures and trach such changes closely whereas in the north warmer temperatures can mean higher precipitation and a more muted response to change. The chapter overall has a heavy emphasis on temperature reconstruction with relatively little on precipitation, except for obvious areas such as the monsoon. It may be worth explaining the sorts of climate phenomena that rae more difficult to reconstruct at present eg ppn. Similarly the challenges of
Accepted. We added the first [paragraph explaining that both temperature and precipitation impact the glacier changes. We mention the region where the precipitation plays an important role. However this problem is considered more in details in the ch 4

Expert Review Comments on the IPCC WGI AR5 First Order Draft -- Chapter 5
Do not Cite, Quote or Distribute Page 100 of 157
Comment No
Chapter FromPage
FromLine
To Page
To Line Comment Response
identifying greater extreme events are still being looked at within the discipline. [Chris Caseldine, United Kingdom of Great Britain & Northern Ireland]
5-1270 5 25 Box5.2 Figure 1 ugly figure [Hubertus Fischer, Switzerland] Accepted, the figure is deleted
5-1271 5 26 4 26 4 change the title? For me the section is not on atmospheric circulation but on precipitation and signature of changes in the hydrological cycle. [PASCALE BRACONNOT, France]
We have changed this section. Now we have a subsection called "Monsoon Systems and Convergence Zones" in a section called: "Regional Changes during the Holocene"
5-1272 5 26 4 rename section to reflect the fact that it is more about hydrological cycles than atmospheric circulation? [Masa KAGEYAMA, France]
We have changed this section. Now we have a subsection called "Monsoon Systems and Convergence Zones" in a section called: "Regional Changes during the Holocene"
5-1273 5 26 4 Section 5.4.2: In a study we performed on the NBY-89 Ice Core obtained from Byrd Station, West Antarctica, sea salt sodium concentration patterns indicated very distinct behavior between 1969 and 1989 comparing to the period between 1711 and 1969. We found interannual periodicities similar to those of ENSO events. High sea salt sodium concentrations could be the result of increasing storminess in Antarctic Peninsula region in relation to atmospheric circulation changes. I believe that sea salt sodium can be a candidate to be used as a proxy data for atmospheric circulation changes at least in the Antarctic region. Reference: "Tracking the El Nino events from Antarctic ice core records", Keskin, S.S and I. Ölmez, Journal of Radioanalytical and Nuclear Chemistry, v. 259, n.1, p. 199-202, (2004). [Siddik Sinan Keskin, Turkey]
Noted. ENSO discussion focused on information from the tropical Pacific and not from far field teleconnections.
5-1274 5 26 4 This title should refer to precipitation, not the vague "atmospheric circulation." [Jay Curt Stager, United States of America]
Noted. Now we have a subsection called "Monsoon Systems and Convergence Zones" in a section called: "Regional Changes during the Holocene"
5-1275 5 26 6 29 6 5.4.2 Needs work. What is the message? [Christian Ohneiser, France] Noted. section 5.4.2 is being completaly redrafted
5-1276 5 26 6 Monsoons are key to multiple regions and you could either deal with them region by region (that's what the policy makers would likely prefer, or do that with a box for cross-cutting stuff - this latter option is not efficient, however). As written, this section isn't for policy-makers - need to stress relevance. [Jonathan Overpeck, USA]
Noted.We have changed this section and put more emphasis in the last millennium, stressing policy relevance
5-1277 5 26 8 is the capital letter of "Monsoon" justified? [Masa KAGEYAMA, France] Noted.
5-1278 5 26 9 26 9 ITCZ : give a reference, and/or show on a map ? [Bernard De Saedeleer, Belgium] Noted.
5-1279 5 26 11 26 11 insert comma afetr 'AR4' [Peter Burt, UK] Editorial
5-1280 5 26 13 15 this list seems pretty short - there have been many more relevant papers, no? For example, African monsoon - Shanahan et al 2009, Science, but there are lots more. Need to be more comprehensive, but also focused more on what the implications are for policy makers. E.g., Shanahan et al highlights that Sahel droughts much longer and more severe than those of the 20th century have occured regularly in the past, and seem to relate to N Atlantic variabilty. What's the relevance - such droughts could reoccur in the future only with hotter temperatures. Regional policy-makers need to know this. [Jonathan Overpeck, USA]
Noted. The Shanahan paper is mentioned in the section on megadroughts.
5-1281 5 26 14 Add Stager et al. 2011 to the list of references for lake sediment records.Add Stager et al. 2011 to the list of references for lake sediment records. Stager, J.C., D.R. Ryves, B.M. Chase, & F.S.R. Pausata, 2011. Catastrophic drought in the Afro-Asian monsoon regions during Heinrich Event 1. Science 331: 1299-1302 [Jay Curt Stager, United States of America]
Rejected. The reference was not introduced in the revised text. Main conclusions questioned by Thomas et al (2012) which is cited in the revised text.
5-1282 5 26 18 26 19 It is worth noting here that recent evidence strongly challenges the interpretation of the Asian speleothem records as pure rainfall signals. Pausata et al. (2011) show that much of the 18O signal in these records merely represents a distant source area over the Indian Ocean. Although this issue is still under active debate, it is important enough to mention here. Pausata et al. 2011 Nature Geoscience 4:474-480. [Jay Curt Stager, United States of America]
Taken into account. Revised text includes statement on interpretation of speleothem data and Pausata et al (2011) is cited.

Expert Review Comments on the IPCC WGI AR5 First Order Draft -- Chapter 5
Do not Cite, Quote or Distribute Page 101 of 157
Comment No
Chapter FromPage
FromLine
To Page
To Line Comment Response
5-1283 5 26 20 Insert “as” after “such” [Rob Wilson, United Kingdom of Great Britain & Northern Ireland] Editorial
5-1284 5 26 21 "feature" glacial inceptions and terminations. Per se, these are not proxies of sea-level or ice-sheets, but maybe "feature" could be replaced by "reflect"? [Masa KAGEYAMA, France]
Noted.
5-1285 5 26 23 Fig 5.11 instead of Fig 5.12 [Masa KAGEYAMA, France] Editorial
5-1286 5 26 24 26 24 This reference Yin QZ, Berger A, Driesschaert E, Goosse H, Loutre MF and Crucifix M, The Eurasian ice sheet reinforces the East Asian summer monsoon during the interglacial 500,000 years ago. Climate of the Past, 2008, 4, 79-90. could also be considered for the link between monsoon and ice-sheet [PASCALE BRACONNOT, France]
Noted and taken into account in the revised text
5-1287 5 26 26 again Shanahan et al 2009 make this point, and others before them - just citing Wolffe et al isn't appropriate. [Jonathan Overpeck, USA]
Noted and taken into account in the revised text
5-1288 5 26 29 26 31 This mentions a wet early Holocene in the Northern Hemisphere but that was clearly not the case in much of eastern North America, which experienced some of the driest conditions of the Holocene. Furthermore, this section does not mention the spectacular, well-documented wetting of the Sahara during that time frame, the so-called "African Humid Period" as in Gasse (2000), DeMenocal et al. (2000), and others. Gasse, F. 2000. Hydrological changes in the African tropics since the Last Glacial Maximum. Quaternary Science Reviews 19: 189-211. DeMenocal, P., et al., 2000. Quat. Sci. Rev. 19:347-361. [Jay Curt Stager, United States of America]
Noted. Focus is on new data from south America and Asia, due to space limitation. TAR and AR4 had addressed the "African humid period".
5-1289 5 26 31 26 31 out-of-phase trends : I do not see it .. Where is it ? [Bernard De Saedeleer, Belgium] Noted and taken into account in the revised text
5-1290 5 26 31 26 31 "mid-Holocene Optimum around 8 ka to 9 ka" should be "early-Holocene Optimum around 8 ka to 9 ka" (i.e. since 8 and 9 ka are early Holocene). [Andrew Glikson, Australia]
Noted and taken into account in the revised text
5-1291 5 26 32 I think it is more common today to talk about the Holocene Thermal Maximum than the Holocene Optimum. [Fredrik Charpentier Ljungqvist, Sweden]
Noted and taken into account in the revised text
5-1292 5 26 32 change to 9 ka to 8 ka; moreover, I wouldn't call this mid Holocene but rather Early Holocene [Elie Verleyen, Belgium]
Noted and taken into account in the revised text
5-1293 5 26 33 26 33 I suppose the ref is Braconnot et al. 2008 and not 2007a (Braconnot, P., Marzin, C., Gregoire, L., Mosquet, E. and Marti, O., 2008. Monsoon response to changes in Earth's orbital parameters: comparisons between simulations of the Eemian and of the Holocene. Climate of the Past, 4(4): 281-294) [PASCALE BRACONNOT, France]
Noted and taken into account in the revised text
5-1294 5 26 36 26 39 The synthesis of Lezine et al. Of the evoluation of the hydrological conditions over west Africa is an interesting update that could be considered in this section. (Lezine, A.M., Hely, C., Grenier, C., Braconnot, P. and Krinner, G., 2011. Sahara and Sahel vulnerability to climate changes, lessons from Holocene hydrological data. Quaternary Science Reviews, 30(21-22): 3001-3012.) [PASCALE BRACONNOT, France]
Noted and taken into account in the revised text
5-1295 5 26 37 39 I don't understand this sentence [Masa KAGEYAMA, France] Noted and taken into account in the revised text
5-1296 5 26 38 26 38 You quote the study of (Hong et al., 2005) and the changes in monsoon strength across Asia. This is a very odd study that appears completely at odds with almost all other proxy records. I even doubt that his so called east Asian monsoon proxy is even very monsoonal at all, while his south asian record is really Chinese and really east Asian. I would take this whole study with a large pinch of salt. he may be showing differences between the monsoon regions and those too far north to be affected by this system. [Peter Clift, United States of America]
Noted and taken into account in the revised text
5-1297 5 26 41 26 53 This paragraph is too vague. Do we understand the mechanisms? What are the questions raised by different records? [PASCALE BRACONNOT, France]
Noted and taken into account in the revised text

Expert Review Comments on the IPCC WGI AR5 First Order Draft -- Chapter 5
Do not Cite, Quote or Distribute Page 102 of 157
Comment No
Chapter FromPage
FromLine
To Page
To Line Comment Response
5-1298 5 26 44 26 44 "Convergence Zone the Central American Monsoons" should be "Convergence Zone and the Central American Monsoons" [Andrew Glikson, Australia]
Noted
5-1299 5 26 46 Check that “paleo-climate” written consistently throughout the whole chapter (and report). I think “paleoclimate” is used most....i.e. title of the chapter. [Rob Wilson, United Kingdom of Great Britain & Northern Ireland]
Noted
5-1300 5 26 47 26 50 This discussion of Monsoons over the past millennium is overly general (since different Monsoonal systems are governed by very different climate dynamics) and biased toward one cited study (Liu et al 2009a). Fan et al (2009) reach different conclusions based on an exhaustive analysis of the South Asian Summer Monsoon (SASM) over the past millennium in both a forced simulation of the NCAR CSM 1.4 coupled model and via comparison with various published proxy reconstructions of the SASM [Fan, F., Mann, M.E., Ammann, C.M., Understanding Changes in the Asian Summer Monsoon over the Past Millennium: Insights From a Long-Term Coupled Model Simulation, J. Climate, 22, 1736-1748, 2009]. It is puzzling that this work, which predates the other two studies cited here (Liu et al 2009 and Anchukaitis et al 2010) is not acknowledged here. The abstract of the paper is as follows: The Asian summer monsoon (ASM) and its variability were investigated over the past millennium through the analysis of a long-term simulation of the NCAR Climate System Model, version 1.4 (CSM 1.4) coupled model driven with estimated natural and anthropogenic radiative forcing during the period 850–1999. Analysis of the simulation results indicates that certain previously proposed mechanisms, such as warmer large-scale temperatures favoring a stronger monsoon through their effect on Eurasian snow cover, appear inconsistent with the mechanisms active in the simulation. Forced changes in tropical Pacific sea surface temperatures play an apparent role in the long-term changes in the ASM. Analyses of the simulation results suggest that the direct radiative effect of solar forcing variations on the ASM is quite weak and that dynamical responses may be far more important. Volcanic radiative forcing leads to a clearly detectable shortterm reduction in the strength of the ASM. Comparisons with long-term proxy reconstructions of the ASM are attempted but are limited by the divergent behavior among different reconstructions as well as the limitations in the model’s coupled dynamics. [Michael Mann, USA]
Taken into account. Section has changed.
5-1301 5 26 47 26 50 Some global models may well show this pattern of LIA drying, but the paleo records clearly show that they are inaccurate. Equatorial East Africa was largely wetter during the LIA, an odd but important pattern which may have something to do with solar variability effects on the ITCZ though its cause is still unresolved. Stager, J.C., C. Cocquyt, R. Bonnefille, C. Weyhenmeyer, and N. Bowerman. 2009. Quat. Res. 72: 47-56. Stager, J.C., Ryves D., Cumming B.F., Meeker L.D., and Beer J. 2005. J. Paleolimnol. 33:243-251. Verschuren, D., K.R. Laird, and B.F. Cumming. 2000. Nature 403: 410-413. Verschuren, D., J.S. Sinninghe Damsté, J. Moernaut, I. Kristen, M. Blaauw, M. Fagot, G.H. Haug, and CHALLACEA project members. 2009. Nature 462: 637-641. Note also that the Liu et al 2009a citation is misplaced relative to Liu et al 2009b in the list of references. [Jay Curt Stager, United States of America]
Noted. Focus is on new data from south America and Asia, due to space limitation.
5-1302 5 26 50 26 50 Systems → systems [Peter Burt, UK] Editorial
5-1303 5 26 55 26 57 This introduction seems a bit too vague. Please specify what is meant by the "variability" (what, where, when) and exactly WHY it can't be explained by "external forcings" (what are they, exactly?) or SST variability (why is that unexpected? and what episodes ARE explained by these factors?). Also, dry spells during the last several millennia are also reported for East Africa as well. (see citations in previous comment-line) [Jay Curt Stager, United States of America]
Noted and taken into account in the revised text
5-1304 5 26 55 27 3 Please also cite here Fan et al (2009) who perform an analysis of the South Asian Summer Monsoon (SASM) over the past millennium for both a forced simulation of the NCAR CSM 1.4 coupled model and via comparison with various published proxy reconstructions of the SASM [Fan, F., Mann, M.E., Ammann, C.M., Understanding Changes in the Asian Summer Monsoon over the Past Millennium: Insights From a Long-Term Coupled Model Simulation, J. Climate, 22, 1736-1748, 2009]. It is puzzling that this work, which predates the other two studies cited here (Liu et al 2009 and Anchukaitis et al 2010) is not acknowledged here. The abstract of the paper is as follows: The Asian summer monsoon (ASM) and its variability were investigated over the past millennium through the analysis of a long-term simulation of the NCAR Climate System Model,
Noted and taken into account in the revised text

Expert Review Comments on the IPCC WGI AR5 First Order Draft -- Chapter 5
Do not Cite, Quote or Distribute Page 103 of 157
Comment No
Chapter FromPage
FromLine
To Page
To Line Comment Response
version 1.4 (CSM 1.4) coupled model driven with estimated natural and anthropogenic radiative forcing during the period 850–1999. Analysis of the simulation results indicates that certain previously proposed mechanisms, such as warmer large-scale temperatures favoring a stronger monsoon through their effect on Eurasian snow cover, appear inconsistent with the mechanisms active in the simulation. Forced changes in tropical Pacific sea surface temperatures play an apparent role in the long-term changes in the ASM. Analyses of the simulation results suggest that the direct radiative effect of solar forcing variations on the ASM is quite weak and that dynamical responses may be far more important. Volcanic radiative forcing leads to a clearly detectable shortterm reduction in the strength of the ASM. Comparisons with long-term proxy reconstructions of the ASM are attempted but are limited by the divergent behavior among different reconstructions as well as the limitations in the model’s coupled dynamics. [Michael Mann, USA]
5-1305 5 26 cite: Kanner, L. C., Burns, S. J., Cheng, H., and Edwards, L. (2012). High-latitude forcing of the South American Summer Monsoon during the last glacial. Science 335, 570-573. [Hubertus Fischer, Switzerland]
Noted and taken into account in the revised text
5-1306 5 26 For this entire section on monsoons: the word "monsoon" need not be capitalized. It also needs to be defined immediately. The most important convergence zone is the ITCZ, so I recommend focusing specifically on that (and defining it here) rather than the vague term "convergence zones." It is also needs a much more thorough/accurate discussion of rainfall history in tropical and southern Africa (I can help with this if need be). [Jay Curt Stager, United States of America]
Noted and taken into account in the revised monsoon section.
5-1307 5 27 1 27 2 Second Buckley et al. reference out of alphabetical order [Peter Burt, UK] Noted.
5-1308 5 27 19 27 47 In parallel to other syntheses of the topic of megadroughts (such as in the U.S. Climate Change Science Program Synthesis and Assessment Product 3.4: Abrupt Climate Change, 2008, Chapter 3. Hydrological Variability and Change, E. R. Cook et al.), it would be useful to expand this section beyond the last 2000 years (and the dendroclimatic record). The goal for this section as stated in lines 21-23 on p. 27 (i.e. "estimations of the frequency, duration and severity of past dry periods") could be enhanced by including a more balanced synthesis of the relevant literature on moisture changes throughout interglacial periods, especially as this goal falls within the scope of section 5.4 laid out on p. 21, lines 3-6. Temperature is dealt with across a range of time scales and in the context of various dynamics, but "precipitation related changes" are not. As currently written, the text provides an extremely narrow (albeit important) view of moisture-related regional changes. Given that effects on water supplies are arguably one of the greatest areas of concern, this topic seems well-worth developing within the scope of this section. [Bryan Shuman, United States of America]
Noted. However, due to space limitations, focus is on the last centuries.
5-1309 5 27 19 27 47 Even a brief review of longer-term phenomena would 1) parallel the discussion of temperature changes in the previous sections (i.e., what regional hydrologic changes took place beyond monsoon regions in the context of the radiative forcing and atmosphere-ocean dynamics of past warm periods?); [Bryan Shuman, United States of America]
Rejected due to space limitations
5-1310 5 27 19 27 47 2) provide a perspective on climate regimes other than the late-Holocene regime, which the Earth system is deviating from now; and [Bryan Shuman, United States of America]
Point taken, the section now captures the whole Holocene
5-1311 5 27 19 27 47 3) represent important trends and abrupt shifts that dendroclimatic records may not capture (via the segment-length curse, etc). [Bryan Shuman, United States of America]
Noted and taken into account in the revised text
5-1312 5 27 19 27 47 Regarding points 1 and 2: Several useful examples of hydroclimatic change before ca. 2000 yrs BP derive from mid-latitude North America, and speak to “understanding the effects of dynamical and radiative influences on regional [moisture levels]” (see p. 5-22, line 8, where this statement is made about temperature). [Bryan Shuman, United States of America]
Noted and taken into account in the revised text
5-1313 5 27 19 27 47 I would propose a paragraph after line 23 on p. 5-27 such as: Regional paleohydrologic datasets indicate that interglacial moisture patterns can experience abrupt shifts, such as in response to ice sheet decay in North America by ca. 8400 cal yr BP (Williams et al., 2010). As the ice-sheet-dominated climate regime shifted to a seasonally-extreme insolation-driven climate (with high seasonal temperatures), the North American Great Plains grassland transformed into a desert with active dune areas surrounded by expanded grasslands and retracted forests (Grimm et al., 2011; MacDonald 1989; Maio et al., 2007; Nelson and Hu 2008; Williams et al., 2009); the shift likely also severely altered river flow
Noted. However, due to space limitations, focus is on the last centuries.
Expert Review Comments on the IPCC WGI AR5 First Order Draft -- Chapter 5
Do not Cite, Quote or Distribute Page 104 of 157
Comment No
Chapter FromPage
FromLine
To Page
To Line Comment Response
regimes (Knox 2000; Shinker et al., 2010; Shuman et al., 2010). Paleohydrologic records also indicate that mid-latitude moisture patterns underwent rapid transitions in the absence of major ice sheets, such as at ca. 5500 yr BP when lake-based datasets indicate a transition in North American moisture patterns (e.g., Kirby et al., 2002; Lindstrom 1990; Minckley et al., 2012; Newby et al., 2011; Yu et al., 1997) associated with the abrupt demise of a major moisture-sensitive tree species in eastern North America (Foster et al., 2006) and with major cultural changes (Munoz et al., 2010; Kelly et al., submitted). Data spanning previous interglacials also show evidence of transitions to severely arid episodes such as forecast for some regions by AD 2100 (Fawcett et al., 2011). [Bryan Shuman, United States of America]
5-1314 5 27 19 27 47 Regarding point 3 above: Dendroclimate reconstructions, while highly informative and fascinating, are usually limited (via the segment-length curse and growth-curve detrending) from detecting trends persisting longer than decades, which both models and other proxy datasets indicate were likely; thus, the current discussion of megadroughts may under-represent the potential range of hydroclimatic variability during interglacials. Simulated and reconstructed Holocene trends both reveal the likelihood of century-to-millennial scale non-stationarity not apparent in dendroclimatic records; low-frequency variations are likely greater than shown in Fig. 5.12f. Non-dendroclimatic datasets spanning the past 2000 years (e.g., from speleothems, Asmerom et al., 2007; Denniston et al., 2007; lake-sediment geochemistry, Anderson et al., 2005, Benson et al., 2002; fossil diatoms, Laird et al., 1996; and bog sediments, Booth et al., 2006) record important low-frequency variation, including abrupt shifts (see Fig. 3.15 in Cook et al., 2008). Likewise, transient EMIC simulations (e.g., Timm and Timmerman 2007) produce both orbital-scale and centennial-to-millennial hydroclimatic (evaporation minus precipitation) trends at regional scales, which are similar to empirical observations of regionally-varied trends, variability, and abrupt hydroclimatic shifts. Section 5.4.2.2. might provide a more complete and balanced view of the literature if the potential importance of low-frequency trends were mentioned. Especially as a parallel to Section 5.7 on Irreversibility, the potential that hydrologic regimes can shift into persistent states that last well beyond multi-decadal “megadroughts” (and thus reasonable resource planning horizons) would underscore the importance of the low-frequency variations that are not discussed. [Bryan Shuman, United States of America]
Taken into account. Text revised and some references included.
5-1315 5 27 19 27 47 References cited above: [Bryan Shuman, United States of America] Noted
5-1316 5 27 19 27 47 Anderson, L., Abbott, M. B., Finney, B. P., and Burns, S. J. (2005). Regional atmospheric circulation change in the North Pacific during the Holocene inferred from lacustrine carbonate oxygen isotopes, Yukon Territory, Canada. Quaternary Research 64, 21-35. Asmerom, Y., Polyak, V., Burns, S., and Rassmussen, J. (2007). Solar forcing of Holocene climate: New insights from a speleothem record, southwestern United States. Geology 35, 1-4. Benson, L., Kashgarian, M., Rye, R., Lund, S., Paillet, F., Smoot, J., Kester, C., Mensing, S., Meko, D., and Lindström, S. (2002). Holocene multidecadal and multicentennial droughts affecting Northern California and Nevada. Quaternary Science Reviews 21, 659-682. Booth, R. K., Notaro, M., Jackson, S. T., and Kutzbach, J. E. (2006). Widespread drought episodes in the western Great Lakes region during the past 2000 year: Geological extent and potential mechanisms. Earth and Planetary Science Letters 242, 415-427. Denniston, R. F., DuPree, M., Dorale, J. A., Asmerom, Y., Polyak, V. J., and Carpenter, S. J. (2007). Episodes of late Holocene aridity recorded by stalagmites from Devil's Icebox Cave, central Missouri, USA. Quaternary Research 68, 45-52. Faison, E. K., Foster, D. R., Oswald, W. W., Hansen, B. C. S., and Doughty, E. (2006). Eearly Holocene openlands in southern New England. Ecology 87, 2537-2547. Fawcett, P. J., Werne, J. P., Anderson, R. S., Heikoop, J. M., Brown, E. T., Berke, M. A., Smith, S. J., Goff, F.,
Noted

Expert Review Comments on the IPCC WGI AR5 First Order Draft -- Chapter 5
Do not Cite, Quote or Distribute Page 105 of 157
Comment No
Chapter FromPage
FromLine
To Page
To Line Comment Response
Donohoo-Hurley, L., Cisneros-Dozal, L. M., Schouten, S., Sinninghe Damste, J. S., Huang, Y., Toney, J., Fessenden, J., WoldeGabriel, G., Atudorei, V., Geissman, J. W., and Allen, C. D. (2011). Extended megadroughts in the southwestern United States during Pleistocene interglacials. Nature 470, 518-521. [Bryan Shuman, United States of America]
5-1317 5 27 19 27 47 Grimm, E. C., Donovan, J. J., and Brown, K. J. (2011). A high-resolution record of climate variability and landscape response from Kettle Lake, northern Great Plains, North America. Quaternary Science Reviews 30, 2626-2650. Kelly, R. L., Surovell, T. A., Shuman, B., and Smith, G. M. (Submitted). A Continuous Climatic Impact on Holocene Human Population in the Rocky Mountains. Proceedings of the National Academy of Science. Kirby, M., Patterson, W., Mullins, H., and Burnett, A. (2002). Post-Younger Dryas climate interval linked to circumpolar vortex variability: isotopic evidence from Fayetteville Green Lake, New York. Climate Dynamics 19, 321-330. Laird, K. R., Fritz, S. C., Maasch, K. A., and Cumming, B. F. (1996). Greater drought intensity and frequency before 1200 A.D. in the Northern Great Plains. Nature 384, 552-554. Lindstrom, S. (1990). Submerged tree stumps as indicators of mid-Holocene aridity in the Lake Tahoe Basin. Journal of California and Great Basin Anthropology 12, 146-157. Macdonald, G. M. (1989). Postglacial palaeoecology of the subalpine forest -- grassland ecotone of southwestern Alberta: New insights on vegetation and climate change in the Canadian Rocky Mountains and adjacent foothills. Palaeogeography, Palaeoclimatology, Palaeoecology 73, 155-173. Miao, X., Mason, J. A., Swinehart, J. B., Loope, D. B., Hanson, P. R., Goble, R. J., and Liu, X. (2007). A 10,000 year record of dune activity, dust storms, and severe drought in the central Great Plains. Geology 35, 119-122. Minckley, T., Shriver, R. K., and Shuman, B. (2012). Resilience and regime change in a southern Rocky Mountain ecosystem during the past 17000 years. Ecological Monographs In Press (doi:http://dx.doi.org/10.1890/11-0283.1). Munoz, S. E., Gajewski, K., and Peros, M. C. (2011). Synchronous environmental and cultural change in the prehistory of the northeastern United States. Proceedings of the National Academy of Science 107, 22008–2201. [Bryan Shuman, United States of America]
Noted
5-1318 5 27 19 27 47 Nelson, D. M., and Hu, F. S. (2008). Patterns and drivers of Holocene vegetational change near the prairie-forest ecotone in Minnesota: revisiting McAndrews' transect. New Phytologist 179, 449-459. Newby, P. E., Shuman, B. N., Donnelly, J. P., and MacDonald, D. (2011). Repeated century-scale droughts over the past 13,000 yrs near the Hudson River watershed, USA. Quaternary Research 75, 523-530. Shinker, J. J., B. N. Shuman, T. Minckley, and Henderson, A. (2010). Climatic shifts in the availability of contested waters: a long-term perspective from the headwaters of the North Platte River. . Annals of the Association of American Geographers 100, 866-879. Shuman, B., Pribyl, P., Minckley, T. A., and Shinker, J. J. (2010). Rapid hydrologic shifts and prolonged droughts in Rocky Mountain headwaters during the Holocene. Geophys. Res. Lett. 37, L06701. Williams, J. W., Shuman, B., and Bartlein, P. J. (2009). Rapid responses of the prairie-forest ecotone to early Holocene aridity in mid-continental North America. Global and Planetary Change 66, 195-207. Williams, J. W., Shuman, B., Bartlein, P. J., Diffenbaugh, N. S., and Webb, T. (2010). Rapid, time-
Noted

Expert Review Comments on the IPCC WGI AR5 First Order Draft -- Chapter 5
Do not Cite, Quote or Distribute Page 106 of 157
Comment No
Chapter FromPage
FromLine
To Page
To Line Comment Response
transgressive, and variable responses to early Holocene midcontinental drying in North America. Geology 38, 135-138. Yu, Z., Andrews, J. H., and Eicher, U. (1997). Middle Holocene dry climate caused by change in atmospheric circulation patterns: Evidence from lake levels and stable isotopes. Geology 25, 251-254. [Bryan Shuman, United States of America]
5-1319 5 27 19 this dought and flood info will work well in a new or focused more on regions and being more explicit about how it is relevant. [Jonathan Overpeck, USA]
Noted and taken into account in the revised text
5-1320 5 27 19 Section 5.4.2.2: I'm not sure I understand why "Megadroughts and Floods" is a subsection of "Regional Changes in Atmospheric Circulation" [Andrew Russell, United Kingdom of Great Britain & Northern Ireland]
Noted. Section name has changed
5-1321 5 27 22 It's difficult to tell from the sentence structure that "megadrought" is a term being defined here. Also, why do they require a distinct subsection? Such events would be adequately covered if this whole section on paleo-precip uses the suggested format of grouping the discussion by latitudinal region, and using standard time windows in temporal order within each regional discussion. [Jay Curt Stager, United States of America]
Noted. We now have a section on megadroughts and floods in revised 5.5.
5-1322 5 27 25 define PDSI [Masa KAGEYAMA, France] Editorial
5-1323 5 27 26 "Monsoon Asia" should perhaps be changed to "monsoonal Asia." [Jay Curt Stager, United States of America]
Editorial
5-1324 5 27 29 27 31 For evidence from "proxy reconstructions" please cite Mann et al '09 and Trouet et al '09. For evidence from "model simulations", please cite Mann et al, 2005; Trouet et al 2009; Graham et al; 2011 [Michael Mann, USA]
Noted and taken into account in the revised text
5-1325 5 27 32 the refs here are a subset, and you need to also recognize that the North Pacific and N Atlantic likely play roles as highlighted in J. Conroy et al., 2009 GRL and the references therein - read the intro. Note that Seager has said this too. Its not all the tropical Pacific. [Jonathan Overpeck, USA]
Noted and taken into account in the revised text
5-1326 5 27 34 27 35 As a co-author of the cited (Emile-Geay et al) study, I think the description is a bit misleading, because the reason isn't given: the equivocal nature of the conclusions is, in this study, largely a result of the fact that reconstruction appears to depend critically on the instrumental data used to calibrate the proxy data, with different instrumental SST products yielding widely varying results. [Michael Mann, USA]
Noted and taken into account in the revised text
5-1327 5 27 35 27 35 favored → favoured [Peter Burt, UK] Editorial
5-1328 5 27 36 I think Mann et al. 2009 and Trouet et al. 2009 are the most appropriate citations for this sentence (both in reference list) [Valerie Trouet, United States]
Noted and taken into account in the revised text
5-1329 5 27 37 38 Similar to the Wilson et al. comment above. Touchan et al. (2011) used a data adaptive spline of 67% the series length for detrending. This will remove (depending on the mean sample length of course) much of the centennial and longer scale variability from the resulting chronologies and reconstruction. Please add in a caveat statement in this regard. [Rob Wilson, United Kingdom of Great Britain & Northern Ireland]
Noted and taken into account in the revised text
5-1330 5 27 38 27 41 With regard to the behavior of the Asian Summer Monsoon over the past millennium (including MCA and LIA), the various proxy reconstructions (including those cited here) are not in agreement with regard to the broad trends. Model simulations suggest an important role for external forcing, and a potentially important role of large-scale changes in ENSO influencing the Asian Summer Monsoon. Fan et al (2009) [Fan, F., Mann, M.E., Ammann, C.M., Understanding Changes in the Asian Summer Monsoon over the Past Millennium: Insights From a Long-Term Coupled Model Simulation, J. Climate, 22, 1736-1748, 2009] should be cited for the above findings. [Michael Mann, USA]
Noted and taken into account in the revised text
5-1331 5 27 40 27 40 14th century → 14th Century [Peter Burt, UK] Editorial
5-1332 5 27 42 27 42 from1000 CE - space please [Peter Clift, United States of America] Editorial
Expert Review Comments on the IPCC WGI AR5 First Order Draft -- Chapter 5
Do not Cite, Quote or Distribute Page 107 of 157
Comment No
Chapter FromPage
FromLine
To Page
To Line Comment Response
5-1333 5 27 42 27 42 There needs to be a space between "from" and "1000" [Michael Mann, USA] Editorial
5-1334 5 27 47 27 47 th' as superscipt (x2) and centuries → Centuries [Peter Burt, UK] Rejected (see style guide)
5-1335 5 27 49 This figure summarizes past droughts in two regions but there is no explanation of how this relates to modern times (or why those two regions are chosen). What about the classic record of droughts on the Great Plains from Moon Lake? Such records are important to us today in part because they show how recent observational records often fail to capture the full range of natural variability; this is a good place to point that out. Laird, K.R., S.C. Fritz, K.A. Maasch, & B.F. Cumming, 1996. Nature 384: 552-554. Woodhouse, C.A., D.M. Meko, G. M, MacDonald, D. W. Stahle, & E. R. Cook. 2010. PNAS 107: 21283-21288. [Jay Curt Stager, United States of America]
Taken into account
5-1336 5 27 54 27 55 What is meant here by the "strange parallels"topic? Please explain or omit. [Jay Curt Stager, United States of America]
Noted and taken into account in the revised text
5-1337 5 27 section 5.4.2.2 it is unclear to me why the section about megadroughts and floods is under changes in atmospheric circulation [Valerie Trouet, United States]
Noted and taken into account in the revised text
5-1338 5 28 4 28 12 Again, this sort of subsection might read more clearly if the discussion took the records systematically by latitude and did so more thoroughly. This paragraph jumbles a sparse selection of sites from all over the globe; a fuller coverage of distinct regions/latitudes could work better. For instance, as noted earlier, much of equatorial East Africa was also cooler and wetter during the LIA but otherwise cooler and drier in most of the other cold/glacial episodes... point out whether temperature and precip tend to be consistently related or not, because readers will wonder if a warmer future necessarily means wetter/drier at any given location. As suggested here in the case of East Africa, the paleo record shows that it's not always that simple, and this sort of complexity has yet to be modeled accurately. In contrast, warming more consistently tends to make the austral westerlies drift poleward, which typically causes drier conditions in the austral winter rainfall zones of South America, Africa, and Australia-NZ. Biastoch, A., Böning, C. W., Schwarzkopf, F. U., and Lutjeharms, J. R. E. Nature 462, 495-498, 2009. Lamy, F., Kilian, R., Arz, H. W., Francois, J.-P., Kaiser, J., Prange, M., and Steinke, T. Nature Geoscience 3, 695-699, 2010 It is also worth noting somewhere in this precipitation section that 11-year solar cycles have been linked to rainfall variability in some parts of the world, most notably through records of East African lake levels. The likely mechanisms and stability of these sun-rainfall connections are not yet well known, but the patterns are striking and are the foci of ongoing investigation. Stager, J.C., A. Ruzmaikin, D. Conway, P. Verburg, and P.J. Mason. 2007. J. Geophys. Res. 112: D15106, doi: 10.1029/2006JD008362. Pisoft, Petr; Holtanová, Eva; Huszár, Peter; Miksovský, Jirí; ák, Michal. 2012. Climatic Change 110: 85-99. [Jay Curt Stager, United States of America]
Point taken, the structure of this section has been changed
5-1339 5 28 7 28 7 floor frequency - flood frequency [Peter Clift, United States of America] Editorial
5-1340 5 28 7 28 7 "in press).In some instances increased floor frequency may have coincided with relatively cool and wet climate conditions (Benito et al., 2008; Luterbacher et al., in press; Macklin et al., 2006) (Figure 9 5.13).In" should be: "in press). In some instances increased flood frequency may have coincided with relatively cool and wet climate conditions (Benito et al., 2008; Luterbacher et al., in press; Macklin et al., 2006) (Figure 9 5.13). In" (note: change "floor" to "flood") [Andrew Glikson, Australia]
Noted and taken into account in the revised text
5-1341 5 28 7 28 7 I think you mean "flood" not "floor". [Yueh-Hsin Lo, Taiwan R.O.C.] Editorial
5-1342 5 28 7 28 7 “floor” should be “flood”. Also, this sentence misses a space at the beginning. [Eelco Johan ROHLING, United Kingdom of Great Britain & Northern Ireland]
Editorial
5-1343 5 28 7 28 7 Typo: change "floor" to "flood" [Graham Weedon, UK] Editorial

Expert Review Comments on the IPCC WGI AR5 First Order Draft -- Chapter 5
Do not Cite, Quote or Distribute Page 108 of 157
Comment No
Chapter FromPage
FromLine
To Page
To Line Comment Response
5-1344 5 28 7 floor --> flood [Masa KAGEYAMA, France] Editorial
5-1345 5 28 7 "floor" should be "flood?" [Jay Curt Stager, United States of America] Editorial
5-1346 5 28 7 Add space after “in press).” [Franco Talarico, Italy] Noted and taken into account in the revised text
5-1347 5 28 7 flood frequency instead of floor frequency [Valerie Trouet, United States] Editorial
5-1348 5 28 7 should be 'flood' [Elie Verleyen, Belgium] Editorial
5-1349 5 28 7 “floor” should be “flood” [Rob Wilson, United Kingdom of Great Britain & Northern Ireland] Editorial
5-1350 5 28 9 28 12 The Wetter 2011 study makes no mention of solar activity/maunder minimum being associated with flooding. Remove reference to "maunder minimum" or add an appropriate reference to support statement linking the low solar activity period with flooding on the Rhine. [Gareth S Jones, UK]
Noted and taken into account in the revised text
5-1351 5 28 9 Add space after “5.13).” [Franco Talarico, Italy] Editorial
5-1352 5 28 14 28 29 It is not very clear if there is a climate change impact, finally, or not (line 14 "not unusual" - line 19 "not exceptional" - line 29 "Global warming has changed ..." [Bernard De Saedeleer, Belgium]
Noted and taken into account in the revised text
5-1353 5 28 14 36 My understanding is that part of the relevance for paleooflood work is that in some regions bigger floods have occurred in the past (e.g, western/southwestern North America) and thus could happen again. I've heard paleoflood folks suggest that watersheds have size dependent upper bounds on likely flook magnitude. I don't understand this, but if true, that's also quite relevant. Again, need to be more systemmatic in this whole section about stating what you know by region and with confidence estimates [Jonathan Overpeck, USA]
Noted and taken into account in the revised text
5-1354 5 28 14 36 Discussion on European flood frequency is all well and good, but surely some discussion is needed on how these extreme events are placed on top of mean state precipitation changes? Although there are only a few data-sets that reconstruct past changes in mean precipitation, there are some > 500 years in length. Here are some tree-ring examples below. Luterbacher should be aware of instrumental/historical reconstructions of mean state change. Brázdil R, Stepánková P, Kyncl T, Kyncl J (2002) Fir tree-ring reconstruction of March–July precipitation in southern Moravia (Czech Republic), 1376–1996. Clim Res 20: 223–239 Büntgen U, Trouet V, Frank D, Leuschner HH, Friedrichs D, Luterbacher J, Esper J (2010b) Tree-ring indicators of German summer drought over the last millennium. Quaternary Sci Rev 29: 1005-1016 Büntgen U, Tegel W, Nicolussi K, McCormick M, Frank D, Trouet V, Kaplan J, Herzig F, Heussner U, Wanner H, Luterbacher J, Esper J (2011) 2500 years of European climate variability and human susceptibility. Science 331: 578-582 Cooper RJ, Melvin TM, Tyers I, Wilson RJS, Briffa KR. A tree-ring reconstruction of East Anglian hydroclimate variability over the last millennium. Submitted to Clim Dyn. Helama S, Meriläinen J, Tuomenvirta H (2009) Multicentennial megadrought in northern Europe coincided with a global El Niño–Southern Oscillation drought pattern during the Medieval Climate Anomaly. Geology 37:175–178 Wilson RJS, Luckman BH, Esper J (2005b) A 500 year dendroclimatic reconstruction of spring-summer precipitation from the lower Bavarian Forest region, Germany. Int J Clim 25:611–630 Wilson RJS, Miles D, Loader N, Melvin TM, Cunningham L, Cooper RJ, Briffa, KR (submitted) A millennial long March-July precipitation reconstruction for southern-central England. Submitted to Climate Dynamics [Rob Wilson, United Kingdom of Great Britain & Northern Ireland]
Accepted, new published evidence will be incorportated. Some of the listed publications were already in the FOD. Pre AR4 publications will not be added.

Expert Review Comments on the IPCC WGI AR5 First Order Draft -- Chapter 5
Do not Cite, Quote or Distribute Page 109 of 157
Comment No
Chapter FromPage
FromLine
To Page
To Line Comment Response
5-1355 5 28 14 good statement for policy makers - it would be nice to make this more regionally explicit (equally true for all regions? With what confidence). Don't forget that every statement that is relevant for policy makers should have likelihood or confidence statements, no? [Jonathan Overpeck, USA]
Noted and taken into account in the revised text
5-1356 5 28 16 28 19 Insert following study on extreme historical flood events: The highest peak flows in the modern instrumental record were 17 exceeded by reconstructed flows during the historical period in the rivers Rhine (Herget and Meurs, 2010; 18 Wetter et al., 2011), Neckar (Bürger et al.: Hydrometeorological reconstruction of the 1824 food event in the Neckar River basin (southwest Germany). Hydrological Sciences - Journal - des Sciences Hydrologiques, 51(5) October 2006, Special issue: Historical Hydrology, 864 - 877, Seidel and Bardossy 2010), Vltava (Brázdil et al., 2005), Tiber (Calenda et al., 2005), Llobregat (Thorndycraft and 19 Benito, 2006), and Gardon (Sheffer et al., 2008)., Neckar (Bürger et al. 2006: .). Complete with Bürger et al. the reference list. [Paul Dostal, Germany]
Accepted, additional references have been included.
5-1357 5 28 16 28 19 Add this reference to the refence list and Seidel, J. und A. Bárdossy: Berücksichtigung von historischen Extremereignissen in der Extremwertstatistik . Geographische Rundschau 3/2010 (2010) 42-47. [Paul Dostal, Germany]
Rejected, not peer reviewed literature
5-1358 5 28 20 28 20 century → Century [Peter Burt, UK] Rejected (see style guide)
5-1359 5 28 22 28 22 50-yr → 50 yr [Peter Burt, UK] Editorial
5-1360 5 28 23 28 23 19th century → 19th Century [Peter Burt, UK] Rejected (see style guide)
5-1361 5 28 23 define "ordinary" and "extraordinary" floods [Masa KAGEYAMA, France] Noted and taken into account in the revised text
5-1362 5 28 24 28 24 20th century → 20th Century [Peter Burt, UK] Rejected (see style guide)
5-1363 5 28 24 28 24 19th century → 19th Century [Peter Burt, UK] Rejected (see style guide)
5-1364 5 28 24 28 25 Unify the caps (lower, upper) for the reference to Figs 5.13 A-C -> a-c and F-I [Bernard De Saedeleer, Belgium]
Editorial
5-1365 5 28 28 28 28 The ( ) seem to be at the wrong place in the sentence [Bernard De Saedeleer, Belgium] Point taken
5-1366 5 28 28 The Little Ice Age is here referred to as 1550 CE to 1850 CE whereas it in all other places is referred to as 1450 CE to 1850 CE. See also Comment #1. [Fredrik Charpentier Ljungqvist, Sweden]
Point taken
5-1367 5 28 29 28 29 Global warming : on which time scale? [PASCALE BRACONNOT, France] Point taken
5-1368 5 28 30 Add "s" to word "flooding" for number correspondence [Dunia H. Urrego, France-USA] Editorial
5-1369 5 28 32 28 36 As this part describes the mid-latitude winter rainfall zone of Africa, a complementary discussion of the WRZ in South America is appropriate here as well (Lamy et al refs). Again, this section would work better if the mid-latitudes are treated distinctly as part of a systematic, latitude-based organization outline. This part, for example, simply jumbles temperate South Africa and tropical northern hemisphere India. [Jay Curt Stager, United States of America]
Point taken, structure of the section has been changed
5-1370 5 28 36 28 36 monsoon → Monsoon [Peter Burt, UK] Noted
5-1371 5 29 8 29 8 General remark for §5.4.3: please first shortly define/describe the 4 modes, like it is done for AMO (only) on p5-30 lines 30-33. Fig. 5.14 is only for ENSO : no Figs available for the 3 other modes (IOD, NAO, AMO) ? [Bernard De Saedeleer, Belgium]
Taken into account : "(see chapter 14 for defintions)"
5-1372 5 29 8 Again, this section seems more like a review for specialists rather than an assessment for the IPCC. See what you can do to focus it down to what's relevant and has estimated confidence. Maybe delete the rest since it only dilutes. I think the ENSO work is key given the broad influences it has. Why not do it as a box, where you
Noted, We have decided that rather than dealing mostly with ENSO impacts (partly discussed now in 5.5.5), this section will focus directly on what is known

Expert Review Comments on the IPCC WGI AR5 First Order Draft -- Chapter 5
Do not Cite, Quote or Distribute Page 110 of 157
Comment No
Chapter FromPage
FromLine
To Page
To Line Comment Response
review what we know about ENSO behavior and what it means for the future and regions. for example, we know that the range of past ENSO variability is quite wider than what we've seen in the instrumental record and that models can't simulate this range. So what? We'll we can get decadal La Nina's that can cause decadal dry anomalies in the SW US. Not being able to simulate these means models may be underestimating the future frequency of long drought (medium confidence?). would be good to connect this discussion more with droughts and floods for obvious reasons, and this is another illustration of how my suggestions for a regions-based section would work for modes too. [Jonathan Overpeck, USA]
about ENSO's sensitivity to external forcings in models and paleo-data. Before understanding the teleconnections and impacts, it is essential to understand and assess how ENSO varies without and with external forcings. Furthermore, attributing regional impacts directly to ENSO can be difficult, as ENSO usually explains only a fraction of the variance (for instance with respect to the hydroclimate in the SW US).
5-1373 5 29 8 Section 5.4.3: similar to my previous comment, this segmentation seems odd as well in that "Regional Changes in Atmospheric Circulation" (i.e. Section 5.4.2) could probably be included as a sub-section of 5.4.3. [Andrew Russell, United Kingdom of Great Britain & Northern Ireland]
Accepted. Revised section titles "5.4 Modes of Variability", "5.5 Regional Changes during the Holocene"
5-1374 5 29 10 29 48 The comment in Lines 19-21 and Lines 36-37 do point out that the ENSO records are too sparse and info-limited to allow us to choose between models, but this point needs to be made more prominently and clearly so a non-specialist will understand what it's trying to say. Furthermore, you wouldn't know this was true from the way paleo-ENSO is handled elsewhere in the manuscript (where single papers are cited in order to suggest that ENSO was more/less active at any given time in the past). Use this part as a benchmark to guide descriptions of ENSO history wherever they arise in the chapter. For instance, Figure 5.14 (see page 5-30) implies that it represents a complete summary of all relevant paleo-ENSO records, but in fact it does not and is therefore of questionable validity. Here in this subsection may be the best place to more clearly show exactly what paleo-ENSO records can and cannot tell us yet. They DO consistently show generally less El Nino activity in the early-mid Holocene, for instance, but they DON'T consistently tell us what conditions were like during the MCA, which is arguably more relevant to present and near-future warming than the early Holocene. [Jay Curt Stager, United States of America]
Accept: Old Figure 5.14 deleted and replaced by a new figure that illustrates more clearly the response of ENSO to external forcings in models and paleo-proxy data. We explicitly say in the revised text that "ENSO proxies for the LGM are too sparse (Koutavas and Joanidis, 2009; Wolff et al., 2011) to help constrain the simulated ENSO responses to LGM boundary conditions" and ""
5-1375 5 29 11 29 11 ENSO, NAO : give also the full name (like it is done for IOD & AMO) + give a reference / description ? Insert a map to localise them ? [Bernard De Saedeleer, Belgium]
Accepted- Revised text reads "Since AR4 new proxies and model simulations have provided new insights into the forced and unforced past variability of the El Niño-Southern Oscillation (ENSO), the Indian Ocean Dipole (IOD), the North Atlantic Oscillation (NAO) and longer term variability associated with the Atlantic Multidecadal Oscillation (AMO) (see chapter 14 for definitions and illustration)"
5-1376 5 29 14 29 48 This section covers ENSO variability, but seems a bit narrow, restricting attention to the tropical Pacific (admittedly consistent with the section title), but not really capturing the importance of ENSO in a more global context. This could be extended to ENSO impacts more widely. In particular for high southern latitudes, there is a story to tell. A recently submitted paper (Vance et al., 2012, J. Climate) documents ENSO connections to Antarctic circulation for the last millenium which shows an impact on high latitude wind stress, which is inferred to be stronger in past periods of negative SOI. At line 36, the comment about an active ENSO phase during the 20th Century, could note that this is seen in the high latitude proxy, which also indicates a similar phase in the period 1160-1260 AD. [Tasman van Ommen, Australia]
Noted, We have decided that rather than dealing mostly with ENSO impacts (partly discussed now in 5.5.5), this section will focus directly on what is known about ENSO's sensitivity to external forcings in models and paleo-data. Before understanding the teleconnections and impacts, it is essential to understand and assess how ENSO varies without and with external forcings. Furthermore, attributing regional impacts directly to ENSO can be problematic, as ENSO usually explains only a fraction of the variance (oftentimes less than 50%) of variables in teleconnected regions such as SW US or Antarctica .
5-1377 5 29 14 Section 5.4.3.1: Notably missing from this section is a discussion of whether ENSO existed in a permanent El Niño state during the mid-Pliocene warm period (e.g., Wara et al., 2005, Science 309: 758-761; Fedorov et al., 2006, Science 313: 1485-1489), or not (e.g., Haywood et al., 2007, Paleoceanography 22: PA1213; Watanbe et al., 2011, Nature 471: 209-211; van der Heydt et al., 2011, Clim Past 7: 903-915; van der Heydt and Dijkstra, 2011, Nature Geoscience 4: 502-503; Scroxton et al., 2011, Paleoceanograpy 26: PA2215), an area
Accepted - we included a brief discussion of Pliocene ENSO variability

Expert Review Comments on the IPCC WGI AR5 First Order Draft -- Chapter 5
Do not Cite, Quote or Distribute Page 111 of 157
Comment No
Chapter FromPage
FromLine
To Page
To Line Comment Response
in which there has been significant development since AR4. [Robert Kopp, USA]
5-1378 5 29 16 29 48 The section on ENSO needs a more succinct distillation of the current state of understanding. [Chronis Tzedakis, UK]
Noted - the revised figure provides a more distilled view of ENSO's response to forcings
5-1379 5 29 16 48 I see that all of Jessica Conroy's recent papers on tropical Pacific variability/change are not cited and worry that you're missing other key recent work as well. Do a complete lit search perhaps? How does the mean state change vs variability? [Jonathan Overpeck, USA]
Accepted - Conroy 2008 is cited. Clearly our short section can not be a comprehensive review of all papers written on the subject of Holocene ENSO. Many of the proxy papers on this subject do not even use proxy data that have interannual resolution. We have decided not to expand on this literature here in the context of our more quantitative assessment. Mean state changes versus variance changes are difficult to discuss in the context of the Holocene, because the Holocene annual mean changes in the EEP are small and many proxies are nonlinear thereby hampering the separation between variance and mean state changes
5-1380 5 29 18 An excellent reference on the LGM ENSO from PMIP models is diNezio et al. 2011 Paleoceanography (Bette is a co author). This paper does as well as any in trying to bring order to the apparent chaos of the latest simulations. [Julia Cole, USA]
Rejected - diNezio's paper deals with tropical mean state changes,not with LGM ENSO ( "ENSO" referring here to the interannual variability)
5-1381 5 29 20 29 20 do currently not → do not currently [Peter Burt, UK] Accepted - text revised
5-1382 5 29 20 Reference Moy et al 2002 Nature, doi:10.1038/nature01194. Moy et al detected high/low ENSO activity, alternating at timescales of ~2,000 years. [Christian Ohneiser, France]
Rejected: To be able to make firm statements about interannual variability of ENSO, this subsection focuses on the discussion of ENSO proxies with at least interannual resolution. The validity of the Pallcacocha data as an ENSO proxy has been questioned many times. Not only is it difficult to separate mean and interannual variance changes from this record, but also the present-day correlation between rainfall near Pallcacocha with ENSO is quite low
5-1383 5 29 22 29 22 AMOC : take care that the reader could confuse AMO and AMOC : perhaps precise the difference ? [Bernard De Saedeleer, Belgium]
Accepted - text revised
5-1384 5 29 23 29 23 Similar results were also found for the Early and the mid-Holocene when a fresh water flux is considered in addition of the insolation forcing (Braconnot, P., Luan, Y., Brewer, S. and Zheng, W., 2011. Impact of Earth’s orbit and freshwater fluxes on Holocene climate mean seasonal cycle and ENSO characteristics. Climate Dynamics 10.1007/s00382-011-1029-x onlinefirst) [PASCALE BRACONNOT, France]
Accepted - text revised
5-1385 5 29 23 "consistently triggers" - in all models? Or in just this one? I recall that models tend to disagree in how fershwater hosing influences the tropical Pacific, and I fear this statement relies too much on one result. (e.g. papers by Zhang and Delworth) [Julia Cole, USA]
Accepted - text revised
5-1386 5 29 25 Replace “data” with “records” [Rob Wilson, United Kingdom of Great Britain & Northern Ireland] Accepted - text revised
5-1387 5 29 30 29 30 This is not exactly what is said in Zheng et al. 2008. The reinforcement in SST is valid only for a short period of time in the seasonal cycle. The major feature is the intensified trade winds and the link with the late retreate of the monsoon from its summer location over land to its winter location over the ocean + the diversity of model results concerning the detailed mecanisms. [PASCALE BRACONNOT, France]
Noted - the discussion of the physical mechanisms for the MH ENSO reduction has been delelted. Instead we have used the space and expanded the discussion to include some Pliocene information
5-1388 5 29 33 5 37 I have low confidence in our paleoreconstructions of ENSO before the 20th century, for both means and Accepted - point well taken. The old ENSO figure has

Expert Review Comments on the IPCC WGI AR5 First Order Draft -- Chapter 5
Do not Cite, Quote or Distribute Page 112 of 157
Comment No
Chapter FromPage
FromLine
To Page
To Line Comment Response
changes in variances. First, the statement here on ENSO state depends on reference to McGregor et al, 2010 and Li et al 2011. McGregor etal (2010) is a meta-analysis of published ENSO reconstructions, many of which share common input data; they cannot be considered “individual”. Stahle et al (1998) and Evans et al (2002) referenced in the McGregor et al (2010) study show no correlation for 1801-1900, which is a pre-calibration interval for both studies (Evans et al 2002, Table 3) and therefore a stiff test. Subsequent unpublished results (Evans and Kaplan, with input from Cook, 2008) using the same reconstruction target and reconstruction methodologies, but with completely independent marine and terrestrial proxy data, show little agreement in results. This is mainly due to lack of stable correlation between the different proxy datasets; this may be due to larger or more systematic age model error in the less-well dated and replicated proxy data. Li et al (2011, ref at p 5-58, line37-8 ) is, I think, much better support for these statements, although it relies only on the North American teleconnection for analysis of the full last millennium. However, their Fig 2b shows that at Palmyra Atoll in the central Pacific, modern variance is lower than 19th century variance and similar to earlier ranges of variance. The Galapagos coral record (their Fig 2b, green) shows no change in variance. Their Fig 3b does not clearly show an increase in variance in the 2-8 year periods. The authors themselves do not make the case for a change in variance in the paper; the multivariate ENSO index (http://www.esrl.noaa.gov/psd/enso/mei/) does not show a change, 1950-2012. If you agree then the statement in the executive summary should also be modified accordingly. [Michael Neil Evans, United States of America]
been removed and replaced by a new figure focusing on mid-Holocene, LGM and weak AMOC. Sentence changed to "Statistical efforts to extract variance changes in different annually–resolved ENSO proxies reveal a period of weak ENSO variance from 1660 CE to 1880 CE (McGregor et al., 2010) compared to the 20th century. However, the inter-proxy uncertainties are quite considerable"
5-1389 5 29 34 29 36 Again, it feels like one paper is being relied upon excessively here; the changes in variance of ENSO tend to be really different in different records. I realize the McGregor synthesis suggests this pattern. But individual ENSO reconstructions show very different patterns and I do not believe that by combining such different reconstructions, you necessarilyconverge on the true answer, especially when the reconstructions come from very different locations. (OK, maybe you would with n=100, but not with n=11.) See for example figure 2 of Li et al. 2011 (Nature), which presents a very different picture of past ENSO variance (multiple records, each with distinct patterns). My own gut feeling is that we do not have the appropriate data to make convicing claims about ENSO variance changes. Thus my strong reaction that this claim is overstated here, and in the exec summary. [Julia Cole, USA]
Accepted - the statement has been tuned down. Nevertheless, McGregor is still cited here, because it is one of the few papers that systematically compares existing ENSO reconstructions. We state now "inter-proxy uncertainties are quite considerable"
5-1390 5 29 35 29 35 20th century → 20th Century [Peter Burt, UK] Accepted
5-1391 5 29 36 Please consider also including reference to D’Arrigo et al (2005). They studied variance changes in multiple ENSO reconstruction backs to 1400. D'Arrigo, R., Cook, E.R., Wilson, R.J., Allan, R and Mann, M.E. 2005. On the Variability of ENSO Over the Past Six Centuries. Geophysical Research Letters, 32, L03711, doi:10.1029/2004GL022055 [Rob Wilson, United Kingdom of Great Britain & Northern Ireland]
Accepted - Paper cited
5-1392 5 29 39 29 41 The potential role of both volcanic and solar forcing of ENSO was first explored in Mann et al (2005) [Mann, M.E., Cane, M.A., Zebiak, S.E., Clement, A., Volcanic and Solar Forcing of the Tropical Pacific Over the Past 1000 Years, Journal of Climate, 18, 447-456, 2005] which should be cited here in addition to being cited later in this paragraph. [Michael Mann, USA]
Accepted - paper cited
5-1393 5 29 41 As above - A solar influence on ENSO variability was also discussed and evidence provided in D’Arrigo et al (2005). [Rob Wilson, United Kingdom of Great Britain & Northern Ireland]
Rejected - D'Arrigo 2005 is cited now in the context low ENSO variance from 1660 CE to 1880 CE, but the evidence for a solar influence on ENSO is not robust, as pointed out in McGregor et al. (2010)
5-1394 5 29 43 29 45 There is also some evidence that ENSO responds to short-term solar forcing as well. If we're going to include such speculations about volcanism, then we should also include the solar hypotheses, too. In fact, we simply don't know exactly what causes ENSO events to occur in the first place... and that is an important point to make here. Without knowing exactly how that system works, and without knowing which parts of the paleo-ENSO records are most accurate, we stand little chance of projecting ENSO conditions into the future, too. [Jay Curt Stager, United States of America]
Rejected - I don't know of any statistically robust evidence of "shorttern" solar forcing on ENSO. For the volcanic hypothesis there is at least statistically firm evidence from two studies that use totally different paleo-ENSO reconstructions. The McGregor paper uses a combination of 11 different ENSO proxies. I agree that the physical understanding of ENSO's response to external forcing is still not very mature.

Expert Review Comments on the IPCC WGI AR5 First Order Draft -- Chapter 5
Do not Cite, Quote or Distribute Page 113 of 157
Comment No
Chapter FromPage
FromLine
To Page
To Line Comment Response
5-1395 5 30 6 30 56 The section on extratropical modes is lacking in southern hemisphere, where SAM, PSA and zonal wave 3 circulation are of interest and tractable by proxy data. The topic of the SH westerlies, including the Southern Annular Mode, is an obvious omission, especially given the likely importance of SO ventilation in past CO2 exchange on glacial-interglacial timescales.The Southern Annular Mode, and efforts to reconstruct it are of importance in view of the likely impact of anthropogenic forcing on SAM. A small section needs to be solicited from a contributing author. In this section, references such as Schulmeister (The Southern Hemisphere westerlies in the Australasian sector over the last glacial cycle: a synthesis, Quaternary International, 2004) and attempts to reconstruct SAM, including Goodwin et al. (2004, Climate Dynamics) would prove useful. With a little more space, this could also include other extratropical modes such as the zonal wave three (Raphael, GRL, 31, L23212, 2004) and its impact on climate of coastal Antarctica and Southern Australia (van Ommen and Morgan, Nature Geosci, 2010). For PSA, a starting point is Villalba (2002, Clim. Change 59, 177–23). [Tasman van Ommen, Australia]
Taken into account. SH included.
5-1396 5 30 6 Section 5.4.3.2: is it worth mentioning the SAM here? There haven't been many analyses from paleoclimate archives (e.g. Goodwin et al., 2004; Jones and Widmann, 2004; Mayewski et al., 2004; Delmotte et al., 2005; Russell et al., 2006) and they're pretty inconclusive (see Russell and McGregor (2010) for an overview) but it seems like a gap in this section. [Andrew Russell, United Kingdom of Great Britain & Northern Ireland]
Taken into account. SAM mentioned in revised text.
5-1397 5 30 6 This subsection deals with extra-tropical modes; discussion of the austral westerlies and/or variable circulation patterns surrounding Antarctica would also be appropriate here in addition to the usual northern hemisphere emphasis. [Jay Curt Stager, United States of America]
Taken into account. SH westerlies now included.
5-1398 5 30 8 30 16 I do not understand the sentence: "a weakening of the AO and its variability". As mentionned earlier, the AO, like the NAO, is mainly defined as a variability mode, which means that it explains variability. So sentence should be "a weakening of the AO variability". Then line 14 is written "mean intensification of the NAO". Once more, I believe there is a confusion between mean state and variability. Do the authors mean "an intensification of the positive phase of the NAO" or an "intensification of the variance of the index"? (no reference is related to this assertion, so that I cannot verify by myself). Line 15 I also find "a weakening of the NAO". I believe the authors need to clarify their terminology. The NAO is not a mean state characteristic of the climate like the ocean circulation intensity of the atmospheric jet stream strength, which can indeed weakens. The NAO is only depicting phase of an oscillation. If the authors want to say "mean state change of SLP following NAO-like pattern" I think they should say it. I believe it is more enlightening to talk about changes in the jet stream to explained modification of atmospheric circulation. [Didier Swingedouw, France]
Noted. First two points accepted, text rewritten.
5-1399 5 30 8 30 28 it may be worth mentioning the new findings that also the summer NAO (SNAO) is strongly associated with climate (mainly Europe, but also in North America, and downstream), this was first shown by Folland et al. 2009 (Journal of Climate 22: 1082-1103), a paper including a ca. 300 year SNAO reconstruction. It’s regional association with drought over the last 500 years, including links to Sahel drought, was further discussed by Linderholm et al. 2009 (a reference that is already included in the literature list). [Hans W Linderholm, Sweden]
Rejected due to space restrictions
5-1400 5 30 8 30 28 Although this may be outside the scope of this chapter, Linderholm et al. 2011 (journal of Geophysical Research 116: D13107) showed a teleconnection between the SNAO and the East Asian summer monsoon (thus indicating an additional (to ENSO etc.) high-latitude influence on monsoon variability. Such a link has previously been reported for outside summer (mainly winter) The temporal nature of this teleconnection was studied for the last 400 years in Linderholm et al. (submitted), where periods of strong association between the SNAO and summer climate in East Asia were shown. [Hans W Linderholm, Sweden]
Rejected due to space restrictions
5-1401 5 30 10 30 10 "planetary wave activity" : what is it ? [Bernard De Saedeleer, Belgium] Rejected, term is correctly used
5-1402 5 30 12 the role of topography in shaping the LGM NAO has been further demonstrated by Pausata et al 2011 (Climate of the Past) and Rivière et al (2009, Journal of Climate) [Masa KAGEYAMA, France]
Point taken
5-1403 5 30 14 30 15 "orbitally accelerated" : what do you mean ? [Bernard De Saedeleer, Belgium] Accepted - "orbitally accelerated" deleted
5-1404 5 30 16 30 16 ".. NAO during the Holocene." missing reference [Gerrit Lohmann, Germany] Accepted - revised text includes Rimbu et al 2003 reference

Expert Review Comments on the IPCC WGI AR5 First Order Draft -- Chapter 5
Do not Cite, Quote or Distribute Page 114 of 157
Comment No
Chapter FromPage
FromLine
To Page
To Line Comment Response
5-1405 5 30 16 30 17 SST based reconstructions indicate atmospheric circulation trends [Gerrit Lohmann, Germany] Noted
5-1406 5 30 20 30 24 This list omits the best NAO reconstruction, which is given in Vinther et al. (2010). This doesn't say it is the NAO, but it a reconstruction of winter temps in SW Greenland. The NAO is a winter phenomenon. This reconstruction is of winter and you ignore it! There is also this paper that probably provides a better recontruction than most proxies - Cornes, R.C., Jones, P.D., Briffa, K.R. and Osborn, T.J., 2012: Estimates of the North Atlantic Oscillation back to 1692 using a Paris-London westerly index. Int. J. Climatol. 32 (in press), doi:10.1002/joc.3416. [Philip JONES, UK]
Partly rejected: Vinther et al. (2010) does not represent a NAO reconstruction. Cornes et al. 2012 has been included in SOD
5-1407 5 30 20 22 All of the here cited references are older than 2007, about from Kuttel et al and Trouet et al., and thus are not new to AR5 [Valerie Trouet, United States]
Taken into account,this part has been restructured only taken into consideration the NAO reconstructions since AR4
5-1408 5 30 24 30 26 Please explain how strong positive NAO is manifested in modern climate conditions and what this has to do with modern and near-future warming. [Jay Curt Stager, United States of America]
Rejected, as this part deals with the past understanding of the NAO rather than current and future development. The reviewers request is addressed in other chapters of AR5
5-1409 5 30 26 30 28 Shoud cite here Mann et al (2009) [Mann, M.E., Zhang Z., Rutherford, S., Bradley, R.S., Hughes, M.K., Shindell, D., Ammann, C., Falugevi, G., Ni, F., Global Signatures and Dynamical Origins of the “Little Ice Age” and “Medieval Climate Anomaly”, Science, 326, 1256-1260, 2009 ] who demonstrate that the main signature in the ensemble mean response of the GISS ModelE to solar forcing during the MCA to LIA transition is a positive NAO/AO/NAM circulation anomaly in the MCA-LIA difference, consistent roughly w/ the observed features of the spatial surface temperature reconstruction analyzed. This study *does* indeed find robust evidence for a solar-forced NAO/AO/NAM signal during the past millennium. [Michael Mann, USA]
Taken into account. Text revised.
5-1410 5 30 26 as mentioned before, the Trouet et al. reconstruction allow this statement to be 950 years instead of half millennium [Valerie Trouet, United States]
Taken into account. Text revised.
5-1411 5 30 32 30 32 I suggest that these numbers could be briefly compared to the quantitative contributions the numbers imply. For the discussion of the LIG the value of the high stand level is used to imply that contributions are required from Greenland the WAIS and the EAIS...similarly here. The point is that these numbers are reasonable given the budget of the existing ice sheets and indicate that the ice sheets DID collapse under Quaternary conditions - i.e. ice sheet collapse is a physical possibility [Mark Siddall, UK]
Taken into account (but wrong line numbers for the comment). Text revised.
5-1412 5 30 33 30 33 For "climate model simulations" cite both Delworth and Mann (2000) and Knight et al (2005) [Knight, J.R., Allan, R.J., Folland, C.K., Vellinga, M., Mann, M.E., A Signature of Persistent Natural Thermohaline Circulation Cycles in Observed Climate, Geophysical Research Letters, 32, L20708, doi: 10.1029/2005GL02423, 2005] [Michael Mann, USA]
Accepted - reference included
5-1413 5 30 33 30 37 I checked Knudsen et al. (2011), but could not find any evidences for the AMO to be driven by the multidecadal oscillations of the AMOC. Knudsen et al. only analyzed 14C and 10Be to reject the solar forcing as a cause. We have to note that the role of solar forcing in driving the climate system is still under investigation. There might be other focing mechanisms that might be responsible, e.g., volcanic focing, or some focing unknown at the moment. Reagrding the origin of the AMO and the model results, the authors of this chapter should refer to the relevant discussions in Chapter 9 (page 47 and 48), which are acceptable. [Zhaomin Wang, UK]
Accepted - text revised accordingly
5-1414 5 30 35 30 35 peninsula → Peninsula [Peter Burt, UK] Editorial
5-1415 5 30 35 30 45 Christy 2010 is in press, J. Hydromet. [John Christy, USA] Noted
5-1416 5 30 37 AMOC instead of Atlantic meridional overturning circulation [Valerie Trouet, United States] Noted - Editorial
5-1417 5 30 39 30 39 For "at least pacemaking" cite also Waple et al (2002) [Waple, A., Mann, M.E., Bradley, R.S., Long-term Patterns of Solar Irradiance Forcing in Model Experiments and Proxy-based Surface Temperature Reconstructions, Climate Dynamics, 18, 563-578, 2002] who state, with regard to the AMO and solar forcing,
Accepted - citation included

Expert Review Comments on the IPCC WGI AR5 First Order Draft -- Chapter 5
Do not Cite, Quote or Distribute Page 115 of 157
Comment No
Chapter FromPage
FromLine
To Page
To Line Comment Response
"The evolution in the North Atlantic exhibited by the empirical low-frequency sensitivity pattern to solar radiative forcing suggests a scenario in which this intrinsic multidecadal mode of variability may indeed resonate with solar radiative forcing." [Michael Mann, USA]
5-1418 5 30 39 "considerable" might be too strong [Masa KAGEYAMA, France] Accepted - "considerable" removed
5-1419 5 30 41 30 41 "multidecadal changes to the NAO" be more specific [Gerrit Lohmann, Germany] Noted - this sentence has been deleted
5-1420 5 30 44 46 Shanahan et al 2009 Science illustrates variable, but persistent coherence with the Gray et al 04 AMO recon. This gives me a feeling that the latter is correct and that this statement in the text is inaccurate. [Jonathan Overpeck, USA]
Accepted - The text has been changed to "Whereas most of these records show a good correspondence with the instrumental data during the industrial period, there still exists some uncertainty in the reconstructions prior to 1900 CE (Winter et al., 2011).". Comparing the raw timeseries of the Shanahan and the Gray records I find very little correlation among the two. I am not sure how to reconcile this with the cross-spectral coherence in Figure 4b in Shanahan.
5-1421 5 30 46 30 46 replace "hirtherto" by "hitherto" [Bernard De Saedeleer, Belgium] Editorial
5-1422 5 31 1 31 1 I suggest you drop "and related processes". It is more confusing than really helping. [to TSU, sorry, did not know how to insert a comment in this spreadsheet without causing havoc] [Andreas Fischlin, Switzerland]
Accepted
5-1423 5 31 1 31 7 Referring to an Appendix is a very odd way to start this section. It needs a proper introduction. [Roland Gehrels, United Kingdom]
Taken into account. Text revised.
5-1424 5 31 1 32 14 Section 5.5 is very good and I wish this chapter would treat other important topics such as temperature and all the other ones I mentioned in my major critique of this chapter equally well. [Andreas Fischlin, Switzerland]
Noted.
5-1425 5 31 1 Sea level = great section! Nick McKay and I discussed and he's going to give you the feedback for the LIG section 5.5.2.As I noted in my Exec Summary comments above, you want to make sure this section is used to update the ES, and also that it all jives with Chapter 13. My guess is they need to be listening more to you. [Jonathan Overpeck, USA]
Noted. Coordination with Chapter 13 has been improved thanks to common contributing authors.
5-1426 5 31 2 I don't know what you mean by a range where the low end has high confidence and the high end has low confidence. There should normally be equal confidence at either end of the range, with highest probability somewhere in between. [Eric Wolff, United Kingdom of Great Britain & Northern Ireland]
Noted. Text has been revised.
5-1427 5 31 3 31 7 Do not only tell what is in the Appendix, but also what is in §5.5 itself. [Bernard De Saedeleer, Belgium] Taken into account. Text revised.
5-1428 5 31 3 31 7 I don't think appendix 5A is necessary. In fact the goal of the assessment is to summarize the available knowledge. This is in contradiction to the appendix which suggests the reader to come up with their "own evaluation" [Hubertus Fischer, Switzerland]
Taken into account. Text revised.
5-1429 5 31 3 31 36 How does this value of 'at least 6 m higher' compare with '+4 to +6 m during the last interglacial relative to present [high confidence].' in the executive summary? [Mark Siddall, UK]
Taken into account. Consistency between text and ES verified in the revised version.
5-1430 5 31 5 31 5 Why using the confusing term "supplementary information". I suggest you simply write "Appendix 5.A provides …" [Andreas Fischlin, Switzerland]
Taken into account. Text revised.
5-1431 5 31 6 Replace “has” with “have” [Rob Wilson, United Kingdom of Great Britain & Northern Ireland] Noted and Taken into account in the revised text.
5-1432 5 31 11 31 32 And where is the rest coming from, especially in case of the upper estimate of +40m? Why not clearly stating that all of Greenland IS and WAIS are gone to get at least roughly +13m and that the rest must then be coming from other parts of Antarctica. This is important and belongs into this section. May I remind once more, current CO2 conc. is 390 ppm and estimates for mid-pliocene are 330-420 ppm! (This chapter, p. 3, lines 17-18 etc.). Since this may possibly also go into the SPM you have to devote utmost care and clarity to this.
Noted and Taken into account in the revised text.

Expert Review Comments on the IPCC WGI AR5 First Order Draft -- Chapter 5
Do not Cite, Quote or Distribute Page 116 of 157
Comment No
Chapter FromPage
FromLine
To Page
To Line Comment Response
[Andreas Fischlin, Switzerland]
5-1433 5 31 12 31 13 insert "on continents" after "ice" and before "at that time than presently" [Andreas Fischlin, Switzerland] Noted. All of these minor editorial comments are being dealt with in the revised text.
5-1434 5 31 13 31 13 Miller et al. (submitted) - You really can't cite submitted papers [Peter Clift, United States of America] Noted (reference updated) and rejected (submitted papers prior to July 31st, 2012 can be cited).
5-1435 5 31 15 31 15 "eustatic" is a candidate for the glossary [Andreas Fischlin, Switzerland] Accepted
5-1436 5 31 15 what does the 66% refer to? [Masa KAGEYAMA, France] Accepted, has been removed from revised text
5-1437 5 31 22 31 25 Again, it is obviously impossible that most variation is in Greenland and WAIS (contributing at most about 10-12 m SL) if the most likely SL rise is 20 m. You need either to moderate this statement or make a different estimate of your preferred SL rise [Eric Wolff, United Kingdom of Great Britain & Northern Ireland]
Noted and Taken into account in the revised text.
5-1438 5 31 22 Please consider to add additional references for mid-Pliocene NH records since the quoted paper (Maslin et al, 2000) do not include evidence from proximal sub-arctic or arctic records [Franco Talarico, Italy]
Accepted, has been removed from revised text
5-1439 5 31 34 33 16 This section is not a balanced summary of available knowledge and sits somewhat uncomfortable in the report. The overall tone is a criticism of one particular paper (Kopp et al. 2009) and the section relies very heavily on a paper that is submitted (Dutton and Lambeck, Science) which appears to disagree with the Kopp et al. paper. The Red Sea sea-level record also gets a bashing. The section should not be dominated by personal preferences of one school of thought over another. A much better balance is required. [Roland Gehrels, United Kingdom]
Accepted. New contributing authors have been added and section deeply revised.
5-1440 5 31 34 33 16 Split this section into sea-level rise and fall. Do not combine the two! It is too confusing. What are we most concerned about. Rates of change? Periods of sea-level rise or fall? [Christian Ohneiser, France]
Taken into account. Whole section deeply re-structured and focused.
5-1441 5 31 34 33 16 is the problem with this section that some of the caveats in the appendix need to be in the text? there are valid criticisms of all of the studies mentioned and some of these are general challenges faced by all the studies…these need to be used to balance the text [Mark Siddall, UK]
Taken into account. Appendix only used for methodological precisions. Text revised.
5-1442 5 31 34 Section 5.5.2: The discussion of Kopp et al. (2009) in this section reveals several core mis-understanding of this work. Kopp et al. used a Bayesian approach to integrate the uncertainties in observational data with an understanding of the physics of (static equilibrium) sea level change. That is, the paper sought to address the question: what is the posterior probability distribution for global mean sea level during the Last Interglacial stage, given observations of local sea level (and their associated interpretive and geochronological uncertainties) and a prior understanding of the physics of how local sea level observations should relate to one another and to global mean sea level? This prior understanding -- but not the posterior outcome -- was based in part on the Lisiecki and Raymo oxygen isotope stack and its associated age model. To the extent observational data provide better age constraints then this age model, the integration process revises the age model accordingly. Only in the event that none of the data provided better age constraints than the LR stack would it be fair to say the Kopp et al. analysis was based on the LR age model. As can be seen by comparing the LR stack to the posterior PDF (e.g., Figure 4a vs Figure S1 of Kopp et al., 2009), the incorporation of observational data significantly alters the age model: median estimates of the LR-dervied GSL curve falls below present values at ~121 ka, whereas median estimates of the posterior curve falls below present values at ~116 ka. This is not to say that considering alternative age models for the prior would not be a useful exercise; the use of the LR curve for the prior is significant because the age constraints on many data points are poor, and for these data points, best estimate ages will tend toward the framework established by the prior and better constrained data. [Robert Kopp, USA]
Accepted. New contributing authors have been added and section deeply revised.
5-1443 5 31 34 Section 5.5.2: The discussion of the Last Interglacial age model in this section seems a bit slanted. There are two schools of geochronologists active in this question, one represented by Dutton and Lambeck (submitted), the other represented by Thompson et al., (e.g., Science 2005, 308: 401-404; Nature Geoscience 2011, 4:
Accepted. New contributing authors have been added and section deeply revised.
Expert Review Comments on the IPCC WGI AR5 First Order Draft -- Chapter 5
Do not Cite, Quote or Distribute Page 117 of 157
Comment No
Chapter FromPage
FromLine
To Page
To Line Comment Response
684-687). One camp prefers to screen for corals that appear to exhibit closed-system U/Th behavior; the other camp prefers to correct for open-system behavior. Thompson et al. (2005) place the LIG highstand at 125-115 ka. [Robert Kopp, USA]
5-1444 5 31 36 32 3 The discussion of the Kopp et al. (2009) paper on P. 5-31 to 5-32 is peculiar and feels like a push forward of personal opinions/preferences. First there is a part that for all intents and purposes amounts to a wrist-slapping of Kopp for being a bit sloppy (without him having a chance to defend himself). However, the passage then concludes that all is OK after all, because the Dutton and Lambeck analysis (which is not similarly critically discussed, and unfortunately has not even passed peer review yet) confirms Kopp’s key findings. I find this passage not of the style and balance/impartiality that one might expect from an IPCC report; it is bad form to use such an important policy document for trying to push personal statements of this nature. I suggest that this is toned down, or alternatively that similarly critical assessment of the D&L paper is also included (e.g., written by Kopp, or Thompson). Either way, more balance and objectivity is clearly needed. [Eelco Johan ROHLING, United Kingdom of Great Britain & Northern Ireland]
Accepted. New contributing authors have been added and section deeply revised.
5-1445 5 31 36 32 26 I read here: “Emerged paleo-shorelines provide high confidence that GMSL during the LIG was AT LEAST 6 m higher than today”, but on P. 5-32; L. 26, I see: “In summary, there is high confidence that GMSL during the LIG was at least 6 m higher than today”. Yet in the synthesis (P. 5-4; L. 21), I read: “Global sea level was +4 to +6 m during the last interglacial relative to present [high confidence]”. To me, these statements seem to be mutually exclusive, yet all are assigned high confidence? This is a bad source of confusion in a summary of a physical evidence chapter, in my opinion. Such internal inconsistencies would give critics much ammunition that is completely unnecessary; it only reflects sloppiness in the synthesis, not uncertainty in the data. [Eelco Johan ROHLING, United Kingdom of Great Britain & Northern Ireland]
Accepted. Consistency between section and executive summary has been verified. Both have been modified.
5-1446 5 31 36 32 30 You seem to give contradictory statements about the LIG, and in the end I am not sure what your assessment is. After discussing Kopp, you come to a range (page 32, line 2) of 6-10 m, repeated in lines 26-28. But everything you show in Fig 5.15 shows 4-6 m, and that is what you give in the exec summary. It reads like the views of 2 different writers have not been reconciled. You really need to sort out this critical issue. [Eric Wolff, United Kingdom of Great Britain & Northern Ireland]
Accepted. Consistency between section and executive summary has been verified. Both have been modified.
5-1447 5 31 40 31 43 I have questioned Bob Kopp about this and his response, as is clear in his paper, is that the benthic d18O starting condition of his iterative Bayesian approach does not affect the outcome, which is conditioned by his data. [Mark Siddall, UK]
Accepted. New contributing authors have been added and section deeply revised.
5-1448 5 31 44 31 45 Muhs et al., 2011, finds that LIG high stand in the Florida Keys began “as early as ~127 ka, [and] was certainly underway by ~124 ka” and “suspect that more data are needed from other islands in the Bahamas to test the idea that sea level was higher than present by ~129 ka.” Thus the attribution of a 129-130 ka start to the LIG highstand to Muhs et al., 2011, is somewhat misleading. Stirling et al. (1998) place the onset of the Last Interglacial at 128 ± 1 ka; writing this as 129-130 ka is also somewhat misleading. Kopp et al.’s median estimate places the LIG highstand from 126-115 ka; if the Rohling et al. Red Sea curve (which Kopp et al. adjusted to align with the LR curve) is excluded, their median estimate shifts to 128-116 ka (their Figure S8). [Robert Kopp, USA]
Accepted. New contributing authors have been added and section deeply revised.
5-1449 5 31 46 32 3 A lot of space here is given to citing, then analysing and somewhat rebutting Kopp et al. This seems at odds with a synthesis (as opposed to analysis/research) document. It would be preferable, if not essential that the chapter authors lean on published analysis to balance Kopp, rather than drawing new conclusions. It appears that perhaps the submitted Dutton and Lambeck may be the source of appropriate reviewed conclusions. If so, this will allow the interpretive detail to be removed and this section shortened - but without such a citation, the present text seems out of the spirit for a report synthesising published conclusions. [Tasman van Ommen, Australia]
Accepted. New contributing authors have been added and section deeply revised.
5-1450 5 31 48 31 55 Please refer to the Kopp et al paper and in particular to the sensitivity tests in the supplementary information. Rigorous sensitivity studies are carried out by systematically removing different types of data (including those mentioned) from the analysis. It is not adequate to state that this biases his approach when he did study this issue carefully. [Mark Siddall, UK]
Accepted. New contributing authors have been added and section deeply revised.

Expert Review Comments on the IPCC WGI AR5 First Order Draft -- Chapter 5
Do not Cite, Quote or Distribute Page 118 of 157
Comment No
Chapter FromPage
FromLine
To Page
To Line Comment Response
5-1451 5 31 50 31 56 The discussion of individual data points (5-31, lines 50-56) is better suited for a formal comment on Kopp et al. and is not appropriate for an IPCC assessment report. Moreover, it appears to have been made without a close examination of Kopp et al. and its data table, and without acknowledging the uncertainty estimates represented in the data table, which play a core role in the analysis. To address the specific instances raised: Cape Cuvier (as discussed by Stirling et al., 1998) is not included in the data set because it is inconsistent with other Cape Range localities and yet there is no independent constraint on local uplift rate; one major point of including a physical sea level model in the analysis is to be able to incorporate intermediate-field and near-field sea level sites like Bermuda and the Bahamas; the authors took a conservative approach in setting the age uncertainties for observations, so sites with low-quality ages play only a minor role in setting the age model; notches from Bermuda are not included in the data set, and the Grape Bay subtidal/intertidal facies transitions that are included from Bermuda have relatively loose age constraints that reflect their poor dating (165 ± 52 ka for the Belmont Formation and 119 ± 9 ka for the Devonshire Member of the Rocky Bay Formation). I agree that these data “need to be interpreted with caution to estimate LIG ice volumes;” that is the entire purpose of taking a statistical approach. [Robert Kopp, USA]
Accepted. New contributing authors have been added and section deeply revised.
5-1452 5 31 57 32 3 I am VERY uncomfortable at the precedence that this appears to place on one deterministic approach (Dutton et al submitted) versus the first ever rigorously statistical approach from the Kopp paper. Especially when the precedence happens to be a not-yet-accepted paper from the IPCC authors themselves. Please rebalance this to note the strengths of the Kopp approach and its weaknesses and the strengths/weaknesses of Dutton et al. ....e.g. close-system screening issues and in particular the sensitivity to the extent of MIS 6 glaciations (this is an issue for both Kopp et al and Dutton et al)...Of course the reality is that we are nowhere near 100 % clear on this. Stating this will give impetus for new research in this area. We should not pretend to have resolved these issues...Can the Dutton et al paper rule out variability ??? I do not think the data or modelling close this question. [Mark Siddall, UK]
Accepted. New contributing authors have been added and section deeply revised.
5-1453 5 31 this chapter is highly redundant with chapter 13.3 [Hubertus Fischer, Switzerland] Noted. Coordination with Chapter 13 has been improved thanks to common contributing authors.
5-1454 5 31 Did you think of including something about MIS11. This is an important time because if the +20 m insisted on by Hearty et al was right, then it would suggest that a long warm period could give such a sea level. It is probably therefore important to mention it, but then to say that there are strong arguments for a much smaller rise, eg Bowen CP 2010, Rohling papers etc. [Eric Wolff, United Kingdom of Great Britain & Northern Ireland]
Noted. MIS 11 is briefly assessed in the revised text.
5-1455 5 32 2 32 3 This sentence is oddly phrased. The statement that GMSL was “between +6 m (high confidence) and +10 m (low confidence)” is provided with confidence estimates as though it were two statements. (I assume these two implicit statement are that GMSL was “at least +6 m (high confidence) and possibly higher than +10 m (low confidence).” A more appropriate phrasing would be that GMSL was “between +6 and +10 m (high confidence).” [Robert Kopp, USA]
Taken into account. Text revised.
5-1456 5 32 5 32 6 I can't see how this statement is possible. Again, a published paper with rigorous sensitivity analysis and reasoning is given 'medium confidence' while another, unpublished and deterministic paper (Dutton et al) is give 'high confidence' [Mark Siddall, UK]
Taken into account. Text deeply revised. Note that the Dutton et al paper is now accepted.
5-1457 5 32 6 32 10 This is good and the way it needs also to be done in previous section (see my previous comment) [Andreas Fischlin, Switzerland]
Noted.
5-1458 5 32 6 6 “model results” should be changed to “paleoceanographic synthesis”. In that paper (McKay et al., 2011), the model simulated 0.2 m of thermal contraction. [Nicholas McKay, United States]
Taken into account.
5-1459 5 32 10 32 21 A map showing constraints on LIG Greenland Ice Sheet extent might be useful. [Robert Kopp, USA] Noted. One figure shows ice core sites as well as ice sheet model results. All contraints cannot be shown due to space restrictions.
5-1460 5 32 13 20 What are the geologic and ice sheet constraints on the maximum contribution from the GIS to Eemian sea level rise? [Nicholas McKay, United States]
Noted. While space restrictions do not allow a comprehensive descriptions, new information from the NEEM ice core and from ice sheet models is

Expert Review Comments on the IPCC WGI AR5 First Order Draft -- Chapter 5
Do not Cite, Quote or Distribute Page 119 of 157
Comment No
Chapter FromPage
FromLine
To Page
To Line Comment Response
mentioned.
5-1461 5 32 14 cite Otto-Bliesner et al 06 Science and the comment/reply that paper sparked [Jonathan Overpeck, USA] Accepted.
5-1462 5 32 15 32 15 This sentence reads as though Colville et al. 1.6-2.2 m constraint applies only to southern Greenland, as opposed to GIS as a whole. [Robert Kopp, USA]
Taken into account. Text revised.
5-1463 5 32 15 32 30 The discussion about potential Antarctic and Greenland contributions to the interglacial high-stand should state that it's unlikely that each ice-sheet reached it's minimal volume during an overlapping time. [Lev Tarasov, Canada]
Taken into account. Phase lag between Greenland and Antarctic climate mentioned in revised text.
5-1464 5 32 16 21 If there is an issue with the effect of insolation then it should be clearly stated to which simulations this applies. Casting a general feeling of doubt while implicating only some unnamed subset of the simulations is a biased way of representing the situation. [Julia Hargreaves, Japan]
Noted. Text revised.
5-1465 5 32 20 32 20 Give dates for Eemian [Peter Burt, UK] Taken into account. New subsection on LIG start and end added.
5-1466 5 32 20 add 'the' between during and Eemian [Elie Verleyen, Belgium] Editorial
5-1467 5 32 20 Insert “the” before “Eemian” [Rob Wilson, United Kingdom of Great Britain & Northern Ireland] Editorial
5-1468 5 32 21 22 please consider here the opportunity to follow comment No. 9 [Franco Talarico, Italy] Noted but what is comment no.9?
5-1469 5 32 22 24 What is mnimal contribution? Be explicit. If the LIG slr above modern was 6 to 10 m, I suspect several m came from WAIS and some more from the EIS. Need to make things more clear and consistent for the reader/policy-maker. This sentence is confusing the issue and needs some assessment/context. [Jonathan Overpeck, USA]
Accepted. New contributing authors have been added and section deeply revised.
5-1470 5 32 26 32 30 Again, this is excellent and exactly the way it needs also to be done in previous section (see my previous comment) [Andreas Fischlin, Switzerland]
Noted
5-1471 5 32 26 30 need to match exec summary here and elsewhere, see my comments above [Jonathan Overpeck, USA] Noted
5-1472 5 32 27 32 27 This statement seems to be more restrictive about Greenland ice shet and WAIS being the only sources for a 6m sea level rise. The statements above about equivaocal WAIS losses, the fact that WAIS has limited SLR contribution anyway and the NH estimates which may be not much more than 2m all point to some likely E. Antarctic contribution even for only 6m LIG rise. It may be better to say that the presence of at least some Greenland IS in the LIG and doubt over the total contribution from the WAIS, make a contribution from the EAIS to LIG sea level likely, even at 6m, and increasingly necessary at higher sea levels. Note also the finding of a more extensive marine-based ice sheet in East Antarctica (Young et al., Nature, 2010) opens the way for the Aurora Subglacial Basin and previously suspected Wilkes Subglacial Basin to contribute more than earlier estimates. [Tasman van Ommen, Australia]
Accepted. The issue of EAIS stability was added in the revised text.
5-1473 5 32 28 32 29 This is an odd sentence, since the documentation is of local sea levels, whereas it is a higher GMSL that would require an EAIS contribution. Without some way of inferring GMSL from LSL observations, it is not possible to make inferences about ice volumes from these observations. [Robert Kopp, USA]
Noted and Taken into account in the revsied text.
5-1474 5 32 32 32 32 meter → metre [Peter Burt, UK] Editorial
5-1475 5 32 32 32 34 Blanchon et al. (2009) is notably missing from this list of citations, though it is cited two paragraphs later. [Robert Kopp, USA]
revised
5-1476 5 32 32 33 16 This bit contains some real surprise statements for me. It lacks any reference to excellent stratigraphic criteria for the oscillation, such as Orszag-Sperber et al. (2001), Bruggemann et al. (2004), and Thompson et al. (2011). I will not go into this any further here, because I did that already in my opening statement about both chapters 5 and 13 regarding the state of affairs concerning LIG sea level. Chapter 13 has a much more authoritative and balanced/neutral treatment of LIG sea level. I suggest that this section in chapter 5 therefore
Accepted. New contributing authors have been added and section deeply revised.
Expert Review Comments on the IPCC WGI AR5 First Order Draft -- Chapter 5
Do not Cite, Quote or Distribute Page 120 of 157
Comment No
Chapter FromPage
FromLine
To Page
To Line Comment Response
could and should be removed, because many of the statements are personal choices/opinions rather than real arguments (similar to the Kopp et al discussion above), and also because a good few of the statements are demonstrably incorrect. [Eelco Johan ROHLING, United Kingdom of Great Britain & Northern Ireland]
5-1477 5 32 38 32 41 Kopp et al. did not estimate a median rate of fall into "this fluctuation" -- this would have required an approach analogous to that which they employ to calculate exceedance probabilities, in which they would have had to sample many histories from the posterior probability distribution, algorithmically identify any fluctuations regardless of precise timing within the stage, and then compute rates. They did not do this. The quoted rates are their estimates of the rate of sea level change at 122-121 ka and 119-118 ka -- two specific intervals in time, defined with respect to time and not with respect to the sea level fluctuation. An accurate phrasing would be: "Based on their GMSL reconstruction, Kopp et al. (2009) estimated that sea level feel at -3.0 m/ky (67% range of -4.7 to -1.2 m/ky) at about 122 ka and recovered at +3.5 m/ky (67% range of -4.4 to 7.4 m/ky) at about 119 ka. [Robert Kopp, USA]
Accepted. New contributing authors have been added and section deeply revised.
5-1478 5 32 38 32 47 This paragraph seems like an orphan. It does not relate to the preceding or following text well. [Christian Ohneiser, France]
Accepted. Text revised.
5-1479 5 32 41 32 43 Much more balance is needed. See above that the prior assumption does not condition the duration in the Kopp study. Reasonable arguments are given in a recent published study for a shorter LIG duration: Thompson W.G., H.A. Curran, M.A. Wilson & B. White, Sea-level oscillations during the last interglacial highstand recorded by Bahamas corals. Nature Geoscience (2011) doi:10.1038/ngeo1253. This work should not be ignored but discussed fully along with caveats for this and other approaches. We simply do not have the understanding down for the duration of the LIG yet. a shorter LIG would do much to reconcile the local sea-level records with other climate records for the LIG. This reads like the opinion of the authors, not like an objective review of the literature. From the inter-academy press release (summarising their report): 'IPCC should encourage review editors to fully exercise their authority to ensure that all review comments are adequately considered. Review editors should also ensure that genuine controversies are reflected in the report and be satisfied that due consideration was given to properly documented alternative views. Lead authors should explicitly document that the full range of thoughtful scientific views has been considered.' [Mark Siddall, UK]
Accepted. New contributing authors have been added and section deeply revised.
5-1480 5 32 41 32 44 As noted previously, the prior distribution used by Kopp et al. is based on the LR oxygen isotope stack, but it is not accurate to say that the posterior distribution is based on the age model of the stack. It is influenced by the stack’s age model, but that age model is revised in light of data. It is therefore not appropriate to scale rates as suggested here. [Robert Kopp, USA]
Accepted. New contributing authors have been added and section deeply revised.
5-1481 5 32 44 32 44 insert comma after 'relationships' [Peter Burt, UK] Editorial
5-1482 5 32 44 44 instead of “70% lower”, what precisely would the rates have been in this situation? [Nicholas McKay, United States]
Noted. Text revised.
5-1483 5 32 57 32 57 define 'open system' and 'close system' [Andrew Glikson, Australia] Noted and Taken into account in the revised text.
5-1484 5 32 57 32 57 This issue covering open-system corrections for Thompson and Goldstein 2005 has been largely addressed by Thompson et al 2011. I am not suggesting that there are no issues with open-system corrections BUT there are also issues with screening for closed-system ages. Please add balance by critiquing the closed-system ages. [Mark Siddall, UK]
Noted and Taken into account in the revised text.
5-1485 5 32 For this LIG section to be more powerful, you should discuss the Antarctic and Arctic climates that led to this Sl rise. Describe what is observed in Antarctic ice cores, Greenland ice, and circumArctic data, discuss how the chnages relate to what is expected by 2100, how much confidence we have in the climates (which requires discussion of Masson-Delmotte, Risi, Sime papers on ice core isotope calibration) - definitely needs a stronger text. [Eric Wolff, United Kingdom of Great Britain & Northern Ireland]
Noted but an in depth discussion of ice core records is not possible due to lenght requirements. Literature (incl. cited ref) briefly reviewed in revised 5.3
5-1486 5 33 2 33 2 first on → in [Peter Burt, UK] Editorial
5-1487 5 33 6 33 16 If there is no confidence in this reconstruction, then the authors shouldn't talk about it [CATHERINE Taken into account. Text revised.

Expert Review Comments on the IPCC WGI AR5 First Order Draft -- Chapter 5
Do not Cite, Quote or Distribute Page 121 of 157
Comment No
Chapter FromPage
FromLine
To Page
To Line Comment Response
BELTRAN, France]
5-1488 5 33 6 33 16 I would delete this whole paragraph as it dilutes the information. I do not see why it is necessary, unless there are some historical reasons. [Suzanne Leroy, UK]
Noted. But the whole section has been deeply revised based on other comments.
5-1489 5 33 6 33 16 Remove this paragraph if you assign very little confidence to its validity. [Christian Ohneiser, France] Noted. But the whole section has been deeply revised based on other comments.
5-1490 5 33 6 33 16 See general comment on the chapter that I made in Row 17, which provide info regarding my opinion on this section that: "the arguments given in chapter 5 to reject the Red Sea results do not hold water because they infer (but fail to specify) spurious additional controls that have been debunked already. Moreover, the arguments completely ignore the substantiating evidence for a substantial sea-level oscillation within the last interglacial from many other stratigraphically well-constrained studies" [Eelco Johan ROHLING, United Kingdom of Great Britain & Northern Ireland]
Accepted. New contributing authors have been added and section deeply revised.
5-1491 5 33 6 33 16 There are a range of issues here. The first is that the reason for the discrepancy is understood: Trommer, G., Siccha, M., Rohling, E.J., Grant, K., van der Meer, M.T.J., Schouten, S., Baranowski, U., and Kucera, M., Sensitivity of Red Sea circulation to sea level and insolation forcing during the last interglacial. Climate of the Past, 7, 941-955, 2011. Essentially the southern more core is affected by the upwelling waters from the Gulf of Aden during extreme high stands. [Mark Siddall, UK]
Accepted. New contributing authors have been added and section deeply revised.
5-1492 5 33 6 33 16 The second issue is that, as discussed elsewhere in the Holocene SL section, there IS evidence for early Holocene sea-level variability [Mark Siddall, UK]
Noted. Text revised.
5-1493 5 33 6 33 16 The third issue is that these records were compared with Thompson and Goldstein 2005 and Kopp et al 2009 very favourably. New work by Thompson et al 2011, Nat Geo, which is not discussed here also finds fluctuations in sea level during the LIG. [Mark Siddall, UK]
Noted and Taken into account in the revised text.
5-1494 5 33 6 33 16 Fourth - see above discussion. The new results from Thompson et al 2011 show a shorter duration for the LIG. Overall what comes across is very strongly is an articulate statement of the author's point of view but not a rounded summary of the topic. From the inter-academy council report: 'Equally important is combating confirmation bias—the tendency of authors to place too much weight on their own views relative to other views (Jonas et al., 2001). As pointed out to the Committee by a presenter and some questionnaire respondents, alternative views are not always cited in a chapter if the Lead Authors do not agree with them.' [Mark Siddall, UK]
Noted and Taken into account in the revised text which now assesses more comprehensively and objectively the sea level estimates for the LIG period.
5-1495 5 33 6 33 16 You could add that the rates of SL fall implied by the rapid changes seen by Rohling seem implausible. [Eric Wolff, United Kingdom of Great Britain & Northern Ireland]
Noted.
5-1496 5 33 6 16 Great assessment of the Red Sea record. You are right. I'm pretty sure that the changing strength of the E African monsoon would have had a serious influence on Red Sea O isotopes. Also, some of the implied sea level DROPS are too fast to make sense, particularly given the climate of the Eem. [Jonathan Overpeck, USA]
Noted
5-1497 5 33 6 16 If the results of these studies are not acceptable, the paragraph could be conveniently shortened avoiding to give a detailed discussion and description of all arguments corroborating the low confidence of Rohling et al 2008a model [Franco Talarico, Italy]
Noted.
5-1498 5 33 9 33 10 This sentence leaves the impression that the Rohling et al. curve is controlled by ocean volume in the same way as marine benthic oxygen isotope curves. It is not; it is controlled by the hydrologic balance in the Red Sea, and as such it is highly sensitive to local sea level at the strait of Bab-el-Mendeb. [Robert Kopp, USA]
Noted and Taken into account in the revised text.
5-1499 5 33 15 16 Is this piece of interesting information included in a reviewed reference yet? [Masa KAGEYAMA, France] Noted and taken into account in the revised text
5-1500 5 33 18 Nice review(!) but what's the relevance? Need to highlight better (e.g., the baseline of slow change from which recent slr took off from) and maybe shorten given that this is a pretty strightforward point? [Jonathan Overpeck, USA]
Taken into account. Text deeply restructured, re-focused, and re-written.

Expert Review Comments on the IPCC WGI AR5 First Order Draft -- Chapter 5
Do not Cite, Quote or Distribute Page 122 of 157
Comment No
Chapter FromPage
FromLine
To Page
To Line Comment Response
5-1501 5 33 18 Section 5.5.3 The Holocene: The Huang et al paper mentioned in comment 5 above may also have relevance to this section, inasmuch as it reconstructs a mid-Holocene (9ka to 4Ka) warm period. [Henry Pollack, USA]
Noted
5-1502 5 33 20 33 20 decrease in ice volume of 5–10 m - 5-10 m is not a volume. Do you mean sealevel? [Peter Clift, United States of America]
Noted
5-1503 5 33 20 33 20 Ice volume measured in m? I guess you mean sea level change due to ice volume changes. Please rephrase accordingly. [Andreas Fischlin, Switzerland]
Noted
5-1504 5 33 20 33 20 "decrease in ice volume of 5-10 m" - what does it mean? [Olga Solomina, Russian Federation] Noted.
5-1505 5 33 20 33 22 I don't think there is a consensus yet on the existence of the 19.6ka pulse, cf Hanebuth et al, Science 2000, Peltier and Fairbanks, QSR 2006 and some of the uncertainties discussed in Hanebuth et al, GPC 2009 (the latter by the way makes a claim for such a pulse only by ignoring the physics of relative sea level (RSL) when they jutapox RSL records from different sites). Neither the Sunda Shelf nor Barbados records show evidence of a significant 19ka pulse. [Lev Tarasov, Canada]
Noted. The section was deeply rewritten.
5-1506 5 33 20 33 35 need to clarify the different timings. I had to reread several times to understand [PASCALE BRACONNOT, France]
Noted and taken into account in the revised text
5-1507 5 33 20 Should read 'The first decrease in ice volume leading to a 5-10 m of eustatic sea level rise occurred .... [Elie Verleyen, Belgium]
Noted and taken into account in the revised text
5-1508 5 33 22 33 22 NH → Northern Hemisphere [Peter Burt, UK] Editorial
5-1509 5 33 23 33 23 non-printing character after 'yr' [Peter Burt, UK] Editorial
5-1510 5 33 23 33 23 within the first 9000 years - The widely accepted start of the Holocene is around 12 ka not 19 ka. [Peter Clift, United States of America]
Noted and taken into account in the revised text
5-1511 5 33 23 33 23 here and throughout. The superscript '-1' is missing from the units in my pdf [Mark Siddall, UK] Editorial
5-1512 5 33 23 problem with the minus sign in mm yr-1 [Masa KAGEYAMA, France] Editorial
5-1513 5 33 23 Correct superscript for "mm yr-1" [Dunia H. Urrego, France-USA] Editorial
5-1514 5 33 23 should read -1 [Elie Verleyen, Belgium] Editorial
5-1515 5 33 23 Ensure correct symbol is used – not o. Ditto for P 5-34, Lines 23-24. [Rob Wilson, United Kingdom of Great Britain & Northern Ireland]
Editorial
5-1516 5 33 24 33 30 Deschamps et al. (Ice sheet collapse and sea-level rise at the Bølling warming, 14,600 yr ago., in rev.) provide an updated record of MWP 1A from Tahiti, drilled during IODP Expedition 310. Their record supports a significant AIS contribution. [Robert Kopp, USA]
Taken into account. The new Deschamps paper which was not available for the FOD has been discussed in the revised text.
5-1517 5 33 25 33 26 draft states “about 20 “ for mwp1a, it could have been as low as 14 m given living depth variations of the A. Palmata corals and uncertainties in tectonic uplift . (updated coral data are in Peltier and Fairbanks, QSR 2006). [Lev Tarasov, Canada]
Taken into account. The new Deschamps paper which was not available for the FOD has been discussed in the revised text.
5-1518 5 33 25 I have not seen the latest papers but I thought the consensus was that MWP1A is less fast than previously thought. At least Stanford et al 2011 (GPC) certainly gave rates much less than 4 m/century (they give a maximum rate of 2.6 m/century, with a preferred range nearer 1 m/century). I realise this paper is controversial and there is I believe some more recent work, but please ensure this number for 1A is robust and properly referenced to recent data. [Eric Wolff, United Kingdom of Great Britain & Northern Ireland]
Taken into account. The new Deschamps paper which was not available for the FOD has been discussed in the revised text.
5-1519 5 33 26 33 26 Some would say the magnitude of MWP 1A is closer to 15 m. [Roland Gehrels, United Kingdom] Taken into account. The new Deschamps paper which was not available for the FOD has been discussed in the revised text.

Expert Review Comments on the IPCC WGI AR5 First Order Draft -- Chapter 5
Do not Cite, Quote or Distribute Page 123 of 157
Comment No
Chapter FromPage
FromLine
To Page
To Line Comment Response
5-1520 5 33 26 33 28 this part of sentense is understandable, but sounds heavy to me [Olga Solomina, Russian Federation] Noted and taken into account in the revised text
5-1521 5 33 28 33 30 Should also mention that no current generation 3D glaciological model of Antarctica (Pollard's Pennstate and Ritz's GRISLI) has replicated a large meltwater pulse 1A contribution from that ice sheet. I know from personal use that the Pollard Pennstate model generates only a 1 m contribution. [Lev Tarasov, Canada]
Noted
5-1522 5 33 31 please specify exactly which time interval you are referring to [Hubertus Fischer, Switzerland] Taken in to account.
5-1523 5 33 33 33 33 Bard et al. (2010) show that MWP 1B probably did not exist, so this paper is incorrectly cited. MWP 1B is only recorded in Barbados and the discussion should probably make this clear. [Roland Gehrels, United Kingdom]
Taken into account. The new Deschamps paper which was not available for the FOD has been discussed in the revised text.
5-1524 5 33 33 Bard et al (2010) questions the existence of MWP-1B [Elie Verleyen, Belgium] Noted and taken into account in the revised text
5-1525 5 33 34 add 'the' between with and start [Elie Verleyen, Belgium] Editorial
5-1526 5 33 35 33 35 A comment regarding the origin of the 'Youngest dryas' will be helpful here [Andrew Glikson, Australia] Probably not necessary in the revised text
5-1527 5 33 39 33 39 higher resolution sea level records - based on what? You compare them with coral records but what are these based on? [Peter Clift, United States of America]
Taken into account. Text revised.
5-1528 5 33 39 33 40 Note the Carlson et al 2008 Nat Geo paper here to quantify this - Carlson et al was a multi-proxy, multi-disciplinary approach [Mark Siddall, UK]
Noted
5-1529 5 33 42 33 42 a highstand has a magnitude, not an "amplitude" [Roland Gehrels, United Kingdom] Noted
5-1530 5 33 43 33 43 The Horton and Edwards (2006) paper should not be cited in this context. It has nothing to do with highstands. Instead cite Mitrovica JX and Milne GA 2002, On the origin of late Holocene sea-level highstands within equatorial basins, Quaternary Science Reviews 21, 2179-2190. [Roland Gehrels, United Kingdom]
Noted
5-1531 5 33 44 33 44 Explain the term 'GIA' [Andrew Glikson, Australia] Taken into account. In glossary
5-1532 5 33 44 define GIA [Masa KAGEYAMA, France] Taken into account. In glossary
5-1533 5 33 48 33 48 Delete "also". [Roland Gehrels, United Kingdom] Editorial
5-1534 5 33 48 33 50 this part of the text has to be reconciled with the glacier box. The Neoglacial advances (increase of glaciers) begun 6-4000 years ago and there were periods when glaciers where even larger than during the LIA. [Olga Solomina, Russian Federation]
Noted.
5-1535 5 33 49 33 49 Change "this" to "late Holocene". [Roland Gehrels, United Kingdom] Editorial
5-1536 5 33 52 33 52 Incorrect to capitalise Late. The late Holocene is not a formal epoch. [Roland Gehrels, United Kingdom] Editorial
5-1537 5 33 52 33 52 This first sentence seems to be saying two different things - separate into two sentences, or rephrase for clarity. [Marcus Sarofim, USA]
Taken into account. Text revised.
5-1538 5 33 53 33 53 delete "and" [Roland Gehrels, United Kingdom] Editorial
5-1539 5 33 57 33 57 You can also cite salt-marsh records here. The following paper contains a section on this topic and is also a critique of the palaeosea-level section in AR4: Gehrels WR (2010) Sea-level changes since the last glacial maximum: an assessment of the IPCC Fourth Assessment Report, Journal of Quaternary Science 25, 26-38. It should be cited somewhere in chapter 5. [Roland Gehrels, United Kingdom]
Noted but 3 other references of the same author already cited (relevant to the source data).
5-1540 5 34 2 34 2 "The observational record" : which one ? [Bernard De Saedeleer, Belgium] Noted. Text clarified
5-1541 5 34 2 34 27 Table 5.4 suggests that previous to 1900, there was little sea level change (best estimate, 0 total magnitude) - this should be reflected and explained in the text. There is definitely interest in how much sea level has
Noted. Text was deeply revised and Table was suppressed.

Expert Review Comments on the IPCC WGI AR5 First Order Draft -- Chapter 5
Do not Cite, Quote or Distribute Page 124 of 157
Comment No
Chapter FromPage
FromLine
To Page
To Line Comment Response
changed during the time that humans have had significant coastal infrastructure... [Marcus Sarofim, USA]
5-1542 5 34 2 If the last 2 kyr of record are the most reliable, remember to tell us here exactly WHAT it tells us about sea level rise in relation to the recent past and modern/future warming. [Jay Curt Stager, United States of America]
Taken into account. Text revised.
5-1543 5 34 3 34 3 decimeter → decimetre [Peter Burt, UK] Editorial
5-1544 5 34 10 34 10 Also cite Toker E, Sivan D, Stern E, Shirman B, Tsimplis M, Spada, G (2012) Evidence for centennial scale sea-level variability during the Medieval Climate Optimum (Crusader Period) in Israel, eastern Mediterranean. Earth and Planetary Science Letters 315-316, 51-61. [Roland Gehrels, United Kingdom]
Rejected because the original Crusader paper points to no confidence that the two outliers in the water-table data set represent a real change in sea level
5-1545 5 34 12 34 12 twentieth century → 20th Century [Peter Burt, UK] Editorial
5-1546 5 34 12 34 12 "salt marsh plants (line 4) / records (line 12) / proxy (line 21)" : as it seems important, please explain at the beginning a little bit more what this is exactly ? [Bernard De Saedeleer, Belgium]
Noted.
5-1547 5 34 12 34 12 I suggest you cross-reference the AR5 texts where extant SLR are discussed. Perhaps here where tide-gauge records are the first time mentioned. [Andreas Fischlin, Switzerland]
Noted. Coordination with Chapter 13 has been improved thanks to common contributing authors.
5-1548 5 34 15 34 15 Kemp et al was published in early 2011: Kemp, A.C., Horton, B.P., Donnelly, J.P., Mann, M.E., Vermeer, M., Rahmstorf, S., Climate related sea-level variations over the past two millennia, Proc. Nat. Acad. Sci., 108, 11017-11022, 2011 [Michael Mann, USA]
Taken into account.
5-1549 5 34 15 34 15 update Kemp et al in press: Kemp, A.C., Horton, B.P., Donnelly, J.P., Mann, M.E., Vermeer, M., & Rahmstorf, S. 2011 Climate related sea-level variations over the past two millennia. Proc. Nat. Ac. Sci. (doi:10.1073/pnas.1015619108.) [Mark Siddall, UK]
Accepted
5-1550 5 34 22 34 22 "late in the nineteenth century or early in the 20th century" - see line 24: 1840-1920. [Roland Gehrels, United Kingdom]
Noted
5-1551 5 34 22 34 22 you may refer here to the ch 4 and the glacier box: this was the time when the glaciers were retreating very fast [Olga Solomina, Russian Federation]
Noted
5-1552 5 34 23 34 23 non-printing character after 'yr' [Peter Burt, UK] Editorial
5-1553 5 34 23 34 24 should be -1 [Elie Verleyen, Belgium] Editorial
5-1554 5 34 23 Correct superscript for "mm yr-1" [Dunia H. Urrego, France-USA] Editorial
5-1555 5 34 24 34 24 non-printing character after 'yr' [Peter Burt, UK] Editorial
5-1556 5 34 24 34 27 something wrong with sentence; make two sentences? [Elie Verleyen, Belgium] Noted.
5-1557 5 34 24 Correct superscript for "mm yr-1" [Dunia H. Urrego, France-USA] Editorial
5-1558 5 34 25 34 25 Kemp et al was published in early 2011: Kemp, A.C., Horton, B.P., Donnelly, J.P., Mann, M.E., Vermeer, M., Rahmstorf, S., Climate related sea-level variations over the past two millennia, Proc. Nat. Acad. Sci., 108, 11017-11022, 2011 [Michael Mann, USA]
Accepted
5-1559 5 34 26 34 26 change "this" to "which" [Roland Gehrels, United Kingdom] Editorial
5-1560 5 34 26 34 26 "this" should better be "which" [Andrew Glikson, Australia] Editorial
5-1561 5 34 27 34 27 what is LSL? Local sea level? [Roland Gehrels, United Kingdom] Noted
5-1562 5 34 33 34 33 Structure: move also this Table 5.4 in the Tables section starting @p72? [Bernard De Saedeleer, Belgium] Noted

Expert Review Comments on the IPCC WGI AR5 First Order Draft -- Chapter 5
Do not Cite, Quote or Distribute Page 125 of 157
Comment No
Chapter FromPage
FromLine
To Page
To Line Comment Response
5-1563 5 34 33 Table 5.4: Shouldn't 0.25m/100 years be in the "maximum" rate of change column? And this should also be reflected/explained in the text better… [Marcus Sarofim, USA]
Taken into account. Text revised.
5-1564 5 34 36 34 36 Table 5.4 - Geological Period - You should insert dates in years too so people know when "Termination 1" is, as wll as for the LIG and Temrination II etc [Peter Clift, United States of America]
Taken into account. Text revised.
5-1565 5 34 36 34 37 Se level change sign in termination II and I should be negative [Seong-Joong Kim, Republic of Korea] Noted but section on Termination II has been removed.
5-1566 5 34 36 The table gives yet another estimate of LIG sea level, with 8m suddenly appearing as the maximum (see earlier comments as you cite 4-6 m and 6-10 m elsewhere). This needs coordinating with the text. The table is also not very clear, which line in the right column corresponds to which value? [Eric Wolff, United Kingdom of Great Britain & Northern Ireland]
Taken into account. Table suppressed and text clarified.
5-1567 5 34 Table 5.4. The fourth column "maximum" contains only one value, +8 m for the Last Interglacial. Is this is useful column to include? Also, the value could well be higher (see Kopp et al. 2009). Also note that here the term "Last Interglacial" is used. Elsewhere it says "Last Interglaciation". Be consistent (I prefer the former). [Roland Gehrels, United Kingdom]
Taken into account. Table suppressed and text clarified.
5-1568 5 34 Table 5.4: The row on the LIG appears not to be connected to the text. The value attributed to Kopp et al. is inconsistent with Kopp et al.’s 95% confidence that peak sea level during the LIG exceeded 6.6 m. [Robert Kopp, USA]
Taken into account. Table suppressed and text clarified.
5-1569 5 34 Please use the same units for the rates of sea level change. The modern rates are normally given in mm/yr; be consistent and use those units for the Terminations and Interglacial. Why is no rate given for the Pliocene? (please explain in the table or caption). [Jay Curt Stager, United States of America]
Taken into account. Table suppressed and text clarified.
5-1570 5 36 6 36 6 Change "locxal" to "local" [Seong-Joong Kim, Republic of Korea] Editorial
5-1571 5 36 16 38 24 The discussion of Abrupt Climate Change needs to define a time scale for what constitutes "abrupt". The chapter covers a wide range of time scales so this definition is important, and the examples given similarly cover a range of timescales for their rates and overall intervals. [William Howard, Australia]
Accepted - We specify now the DO/HE timescale
5-1572 5 36 16 See my comment above for the Exec Summ bullet. I like what you have here as a review, but am not sure of its relevance, and I am sure policy-makers would like to hear more about warm climate abrupt change as highlighted by Overpeck and Cole 2006 Ann Rev Envi Res. Many papers have updated this perspective, and that's what policy-makers really want to hear about - paleo perspectives on abrupt change issues that they should be worrying about for the future. But, I personally love the cold climate review - I continue to learn! [Jonathan Overpeck, USA]
Noted - we have reviewed the warm climate abrupt climate change literature and mostly found discussion of abrupt regional hydroclimate changes due to shifts of rainfall fronts. This mechanism is discussed more in the context of the section 5.5.5 (Megadroughts and Floods).
5-1573 5 36 18 36 19 what do you mean by this sentence exactly ? [Bernard De Saedeleer, Belgium] Accepted - we provide a more precise definition
5-1574 5 36 18 36 22 Please explain WHY we care about abrupt changes such as D-O and Heinrich events. Make it clearer that they are important because today's changes are also unusually rapid, though they may not seem so to the casual observer who lacks a geologic perspective. We are risking setting off some major ice sheet collapses, so studying them and their effects in the past is of crucial importance. [Jay Curt Stager, United States of America]
Accepted - we added the sentence "Documentation of abrupt climate changes in the past using multiple sources of proxy evidence can provide important benchmarks to test climate models, their instability mechanisms and sensitivities even to future forcings. "
5-1575 5 36 19 36 19 have → has [Peter Burt, UK] Editorial
5-1576 5 36 21 36 21 system → System [Peter Burt, UK] Editorial
5-1577 5 36 24 37 45 I'm amazed that in a page and a half on abrupt (DO/Heinrich) changes and their impacts, not one mention is made of these events in multiple abolsutely dated terrestrial systems (caves). It appears that you’ve only cited marine records here. Yet marine sediment records in most cases cannot be dated precisely in absolute terms. Cave records from several continents document these events with precise chronology and suggest that the rearrangement of precipitation patterns extended into the subtropics, e.g. westerlies and the East Asian
Accepted - we added a discussion of speleothem data and included several of these records in the new monsoon Figure.

Expert Review Comments on the IPCC WGI AR5 First Order Draft -- Chapter 5
Do not Cite, Quote or Distribute Page 126 of 157
Comment No
Chapter FromPage
FromLine
To Page
To Line Comment Response
monsoon (>30N).If any impacts of abrupt change are relevant beyond teh field of paleo, I'd think it'd be the rearrangement of raifall. I also think it would make more sense to separate the stage 3 DO discussion more explicitly from the deglacial. As it stands, you have a section explicitly labelled deglacial, and a section that combines the deglacial and stage 3. Finally, the text would be more transparent if observations and model results were explicitly identified as such. [Julia Cole, USA]
5-1578 5 36 24 37 45 Example recent references for caves would be Fleitmann et al. 2009 (GRL), Wagner et al. 2010 and Asmerom et al. 2010 (both in Nature Geosci), Oster et al. 2009 (EPSL - deglacial only), Lachniet et al. 2011 (QSR, deglacial only). These add to earlier references including Burns et al. 2003 (Science), X. Wang et al. 2004 (Nature), Y. Wang et al. 2001 (Science), Genty 2003 (Science) and many more. [Julia Cole, USA]
Accepted - we added many more speleothem references
5-1579 5 36 26 38 24 This section needs more context. What are we learning for the future from DO events? [Eric Wolff, United Kingdom of Great Britain & Northern Ireland]
Noted. Revised text mentions more clearly the relevance of DO events.
5-1580 5 36 35 36 35 Change Fluckiger to Fluckier (??) [Seong-Joong Kim, Republic of Korea] Rejected - Flückiger is correct spelling
5-1581 5 36 36 36 39 The effect of smoother stadial-interstadial transitions in the Portuguese margin compared to Greenland may be related to differences in sampling resolution. Mean resolution on the Portuguese margin cores is ~200 yr. [Chronis Tzedakis, UK]
Accepted - smoothness statement deleted
5-1582 5 36 40 here and throughout this chapter. The correct reference is not Barbante et al, 2006 but EPICA community members, 2006!!! [Hubertus Fischer, Switzerland]
Editorial
5-1583 5 36 40 Barbante et al should be referenced as EPICA Community Members [Eric Wolff, United Kingdom of Great Britain & Northern Ireland]
Editorial
5-1584 5 36 48 36 48 Heeinrich → Heinrich [Peter Burt, UK] Editorial
5-1585 5 36 48 36 48 Heeinrich stadials - spelling [Peter Clift, United States of America] Editorial
5-1586 5 36 48 36 48 replace "Heeinrich stadials." by "Heinrich stadials." [Bernard De Saedeleer, Belgium] Editorial
5-1587 5 36 48 36 48 should read 'Heinrich', not 'Heeinrich' [Andrew Glikson, Australia] Editorial
5-1588 5 36 48 36 48 Change "Heeinrich" to "Heinrich" [Seong-Joong Kim, Republic of Korea] Editorial
5-1589 5 36 48 36 49 While some papers suggest that Heinrich events were accompanied by a global sea level rise, these do not necessarily represent strong evidence, given chronological uncertainties. [Chronis Tzedakis, UK]
Noted. But SOD does not assess anymore sea level variations associated with Heinrich events.
5-1590 5 36 48 Heeinrich --> Heinrich [Masa KAGEYAMA, France] Editorial
5-1591 5 36 48 please replace “Heeinrich” with “Heinrich” [Franco Talarico, Italy] Editorial
5-1592 5 36 48 Correct mispelled word "Heeinrich" [Dunia H. Urrego, France-USA] Editorial
5-1593 5 36 48 should read Heinrich [Elie Verleyen, Belgium] Editorial
5-1594 5 36 48 Should be “Heinrich stadials” [Rob Wilson, United Kingdom of Great Britain & Northern Ireland] Editorial
5-1595 5 36 49 36 49 this definition needs careful revision. Hemming 2004 RoG reminds us that Heinrich events are IRD events and DO events are temperature events. The question of cause and effect is open and the definition here portrays it as closed. The whole point of stratigraphic labels is to characterise events and not to give cause and effect. By mixing the two the later discussion is confused [Mark Siddall, UK]
Accepted - to avoid confusion we have rephrased the sentence to "There is strong evidence to suggest that these stadials, referred to as Heinrich stadials, were accompanied by freshwater input into the North Atlantic, rising global sea level attaining values of up to several metres"
5-1596 5 36 52 36 52 meters → metres [Peter Burt, UK] Editorial

Expert Review Comments on the IPCC WGI AR5 First Order Draft -- Chapter 5
Do not Cite, Quote or Distribute Page 127 of 157
Comment No
Chapter FromPage
FromLine
To Page
To Line Comment Response
5-1597 5 36 52 36 52 the zero sea level here is a result of a confusion of terms. The millennial sea-level fluctuations may (likely do) result from changes in ice sheets other than iceberg release events (Heinrich events). The deterministic quantification of Heinrich iceberg release may well give zero meters but sea-level rise events around the same time give much larger numbers. The confusion in defining Heinrich events results in this range of numbers. See Siddall et al 2008 RoG for discussion [Mark Siddall, UK]
Accepted - to avoid confusion we have rephrased the sentence to "There is strong evidence to suggest that these stadials, referred to as Heinrich stadials, were accompanied by freshwater input into the North Atlantic, rising global sea level attaining values of up to several metres"
5-1598 5 36 52 36 52 first reference on independent sea-level data: Chappell, J. (2002), Sea level changes forced ice breakouts in the Last Glacial Cycle: New results from coral terraces, Quat. Sci.Rev., 21(10), 1229–1240, doi:10.1016/S0277-3791(01)00141-X. [Mark Siddall, UK]
Accepted -citation included
5-1599 5 36 52 36 52 most recent synthesis of Huon data: Yokoyama, Y., and T. M. Esat, 2011: Global climate and sea level: Enduring variability and rapid fluctuations over the 47 past 150,000 years. Oceanography, 24, 54–69. [Mark Siddall, UK]
Accepted -citation included
5-1600 5 36 52 36 52 Should be Siddall et al 2003 Nature in this context (not Siddall et al 2006) [Mark Siddall, UK] Noted - we have deleted the 2006 reference
5-1601 5 36 52 another reference for sea-level changes related to Heinrich events is Roche et al 2004 (Nature) [Masa KAGEYAMA, France]
Noted. But SOD does not assess anymore sea level variations associated with Heinrich events.
5-1602 5 36 53 replace by "millennial-scale freshwater input pulses" to avoid misunderstandings referring to sea level changes [Hubertus Fischer, Switzerland]
Accepted - text changed accordingly
5-1603 5 36 55 36 55 for mechanisms, also see: 'Clark, P. U., S. W. Hostetler, N. G. Pisias, A. Schmittner, and K. J. Meissner (2007), Mechanisms for a 7-kyr climate and sea-level oscillation during marine isotope stage 3, in Ocean Circulation: Mechanisms and Impacts, Geophys. Monogr. Ser., vol. 173, edited by A. Schmittner, J. Chiang, and S. Hemmings, pp. 209–246, AGU, Washington, D. C.' [Mark Siddall, UK]
Rejected- we do not have enough space to discuss all the hypothesized mechanisms.
5-1604 5 36 56 36 56 should likely be "prior to weakening" instead of "prior weakening" [Andrew Glikson, Australia] Editorial
5-1605 5 37 1 37 23 cite: Kanner, L. C., Burns, S. J., Cheng, H., and Edwards, L. (2012). High-latitude forcing of the South American Summer Monsoon during the last glacial. Science 335, 570-573. [Hubertus Fischer, Switzerland]
Accepted -citation included
5-1606 5 37 5 The termination is also recoded in Greenland SAT (Kobashi, Takuro; Severinghaus, Jeffrey P.; Barnola, 2008. Jean-Marc, 4 ± 1.5 °C abrupt warming 11,270 yr ago identified from trapped air in Greenland ice. Earth and Planetary Science Letters, Volume 268, Issue 3-4, p. 397-407.) [Tosiyuki Nakaegawa, Japan]
Noted
5-1607 5 37 11 17 Kageyama et al (Climate of the Past, 2009) explain the southward shift of the Atlantic ITCZ during the collapse of the AMOC by the reorganisation of the equator-to-pole transport: if the Atlantic ocean is forced to transport less heat because of an AMOC collapse, the atmosphere must carry more heat and one way of doing this is to shift the ITCZ towards the warm southern hemisphere. This mechanisms has been shown to operate for other climatic backgrounds by Swingedouw et al 2009 (Journal of Climate) [Masa KAGEYAMA, France]
Noted - unfortunately, our space constraints do not allow us to go into the detailed mechanisms of positive and negative feedbacks of abrupt climate change.
5-1608 5 37 12 37 12 "associated with the DO and Heirich stadials". It is more correct to state 'associated with the DO interstadials and Heinrich events stadials' [Andrew Glikson, Australia]
Rejected- we keep the old formulation to keep consistence with the rest of the text
5-1609 5 37 13 Add Stager et al 2011 as a reference for changes in tropical hydroclimate during Heinrich events. Specify that HS-1 saw a massive drought spanning the Afro-Asian monsoon region ca. 17 kyr ago, possibly with southward drift of the ITCZ but also weakening the monsoon system as well. [Jay Curt Stager, United States of America]
Accepted - the Stager reference is included now
5-1610 5 37 15 37 15 the characteristics of monsoons in Asia - Can you be a little more specific about what it is that changed? [Peter Clift, United States of America]
Accepted - text changed accordingly
5-1611 5 37 18 37 18 I am very surprised not to see the original Blunier and Brook references here. Please use original references where possible [Mark Siddall, UK]
Rejected- in an assessment it makes sense to cite the lates publications on this subject. A review would definitely have to cite also the Blunier paper
5-1612 5 37 21 23 this sentence might give the wrong impression that all vegetation changes during abrupt events are the consequences of North Atlantic cooling, while this connection is not necessarily a direct one. Fur instance, in
Accepted - text changed accordingly

Expert Review Comments on the IPCC WGI AR5 First Order Draft -- Chapter 5
Do not Cite, Quote or Distribute Page 128 of 157
Comment No
Chapter FromPage
FromLine
To Page
To Line Comment Response
the tropics, vegetation might be affected more by the ITCZ-related changes in precip than by the North Atlantic temperatures. [Masa KAGEYAMA, France]
5-1613 5 37 27 37 27 Kageyama et al. (2009) made a nice analysis of climatic response to AMOC variations under LGM conditions. This study could be also noted with Menviel et al. (2011) and Otto-Bliesner and Brady 2010) I believe. (Kageyama M., Mignot J., Swingedouw D., Marzin C., Alkama R. and Marti O. Sensitivity of a glacial climate to fresh water fluxes: a modelling study. Climate of the Past 5, 551-570, 2009. ) [Didier Swingedouw, France]
Noted - the AMOC sensitivity to different background conditions is now included in the revised text.
5-1614 5 37 28 37 28 "that a relation exists between DO events" - relationship [Peter Clift, United States of America] Accepted - text changed accordingly
5-1615 5 37 37 37 37 "...is still controversial, [but new timing constraints showing a rapid CO2 response to warming (within 200+-200yr; Pedro et al., Climate of the Past, Submitted) indicate a need for a fast response mechanism]. [Tasman van Ommen, Australia]
Noted and taken into account in the revised text
5-1616 5 37 39 37 42 Arguably the best marine record showing a clear fingerprint of interhemispheric changes in surface and deep-water hydrography extending into earlier glacial cycles is by Margari et al. (2010) and this should be included in the references. In addition, that work also underlines the dependence of the bipolar see-saw on background climate conditions and magnitude of iceberg discharge. [Chronis Tzedakis, UK]
Accepted -citation included
5-1617 5 37 39 37 42 Reference: Margari, V., Skinner, L.C., Tzedakis, P.C., Ganopolski, A., Vautravers, M. & Shackleton, N.J. (2010) The nature of millennial-scale climate variability during the past two glacial periods. Nature Geoscience 3, 127-133, doi:10.1038/NGEO740. [Chronis Tzedakis, UK]
Noted
5-1618 5 37 39 cite Barker, S., Knorr, G., Edwards, R. L., Parrenin, F., Putnam, A. E., Skinner, L. C., Wolff, E., and Ziegler, M. (2011). 800,000 years of abrupt climate variability. Science 334, 347-351. [Hubertus Fischer, Switzerland]
Accepted - citation included
5-1619 5 37 45 37 45 The statement can be improved with a comment regarding the origin of the DO cycles. [Andrew Glikson, Australia]
Noted. Text revised.
5-1620 5 37 49 37 57 the alternative freshwater history is related to deglacial warming: the BA warming causes sea level rise. The meltwater is therefore not the trigger, but a response. [Gerrit Lohmann, Germany]
Rejected - subsection 5.6.2 was removed. Most of the key messages are discussed in the sea level section "Past Changes in Sea level - Holocene and Last Termination" - new Section 5.6.3
5-1621 5 37 57 37 57 "actual role of Northern Hemisphere freshwater releases in shaping the last deglaciation". Note that Heinrich meltwater event-1 (~15 - 18 kyr ago) ocurs at the outset of Termination-1 (see for example Figure 4 in Yokoyama and Esat, 2011, Oceanography 24(2):54–69, doi:10.5670/oceanog.2011.27. [Andrew Glikson, Australia]
Rejected - subsection 5.6.2 was removed. Most of the key messages are discussed in the sea level section "Past Changes in Sea level - Holocene and Last Termination" - new Section 5.6.3
5-1622 5 38 2 38 38 "whereas the simulated changes in Greenland' - You are comparing simulations with simulations. This seems wrong. Don't you mean observations? [Peter Clift, United States of America]
Rejected - subsection 5.6.2 was removed. Most of the key messages are discussed in the sea level section "Past Changes in Sea level - Holocene and Last Termination" - new Section 5.6.3
5-1623 5 38 6 38 16 "triggering mechanisms of the Younger Dryas" it is also possible that the YD BA sequence is like a DO. Is the dynamics of DOs understood? [Gerrit Lohmann, Germany]
Rejected - subsection 5.6.2 was removed. Most of the key messages are discussed in the sea level section "Past Changes in Sea level - Holocene and Last Termination" - new Section 5.6.3
5-1624 5 38 10 38 10 It could be interesting to introduce the hypothesis of Bradley and England (2008): "We propose that the forcing responsible for the Younger Dryas cold episode was thus the result of extremely thick sea-ice being driven from the Arctic Ocean, dampening or shutting off the thermohaline circulation, as sea-level rose and Atlantic and Pacific waters entered the Arctic Basin". [Sophie Bonnet, Canada]
Rejected - subsection 5.6.2 was removed. Most of the key messages are discussed in the sea level section "Past Changes in Sea level - Holocene and Last Termination" - new Section 5.6.3
5-1625 5 38 13 38 13 "falsified" seems that something not correct has been done. Change this word ? [Bernard De Saedeleer, Belgium]
Noted.
5-1626 5 38 17 It's important to remember that many readers will have heard that global warming will trigger a new super-glacial by shutting down the AMOC. Here is a good place to clear that up; there is probably not enough
Rejected - subsection 5.6.2 was removed. Most of the key messages are discussed in the sea level section

Expert Review Comments on the IPCC WGI AR5 First Order Draft -- Chapter 5
Do not Cite, Quote or Distribute Page 129 of 157
Comment No
Chapter FromPage
FromLine
To Page
To Line Comment Response
unstable ice left in the North Atlantic region to do that sort of thing today, and most reliable models show that future GHG warming will easily swamp out any regional climatic effects in Europe from slowing or shutdowns of AMOC, even in the unlikely event that they do occur. [Jay Curt Stager, United States of America]
"Past Changes in Sea level - Holocene and Last Termination" - new Section 5.6.3
5-1627 5 38 21 38 22 Tarasov and Peltier, QSR 2006 offers a detailed regionally disaggregated meltwater chronology with error bars. For the context, I think there is more uncertainty in the numerical representation of meltwater injection in GCMs. [Lev Tarasov, Canada]
Rejected - subsection 5.6.2 was removed. Most of the key messages are discussed in the sea level section "Past Changes in Sea level - Holocene and Last Termination" - new Section 5.6.3
5-1628 5 38 44 39 45 More emphasis needs to be placed on this section! The importance of the 400 ppm CO2 threshold for modern ice sheet stability should be emphasised at the beginning of Chapter 5 and in Chapter 1. [Christian Ohneiser, France]
Taken into account. Text revised but confidence level is low.
5-1629 5 38 44 41 52 I do not like this concept of irreversibility = never. A hysteresis requiring thousands of years for returning to previous state is not never, but could be considered of a comparable significance for human time scales. These differences, I mean actual irreversibility or for human time scales "practically" irreversible vs. rather quickly reversible need all to be distinguished, introduced and made clear and understood. With this current text, this is unfortunately not yet the case. I urge the authors to significantly improve on this point. I believe this to be a key issue that deserves quite some attention in the context of an IPCC report. See also my related previous comments and my major critique on this chapter. [Andreas Fischlin, Switzerland]
Taken into account. Text revised.
5-1630 5 38 46 38 50 Probably the most interesting cases are not truly irreversible, and while the timescale is as described here, the timescale does not define the interesting behavior. Instead, the most important aspect is hysteresis in response to forcing, such that the system can return to its original state (multiple equilibrium states, as described now), but not if forcing is returned to the initial condition. As an example, the authors well know that most models show that Greenland's ice sheet can persist under modern climate, can be removed by too much warming, but if removed cannot grow back if the modern climate is restored; cooler conditions would be required. This behavior is not truly irreversible, and is not defined by the timescale (even if regrowth really is slower than removal), so a reader will be confused how this fits into the definition used to open section 5.7. It would be helpful to rewrite so that this type of behavior (which may also be exhibited by north Atlantic circulation, ecosystems such as the Brazilian rainforest, and more) is explicitly included here. [Richard B. Alley, United States of America]
Taken into account. Text revised.
5-1631 5 38 52 39 19 Need to make this section jive with the sea level section. And also be more specific about confidence. For example… [Jonathan Overpeck, USA]
Noted
5-1632 5 38 58 38 58 replace "33 Ma" with "at 34 Ma" [Peter Barrett, New Zealand] Noted
5-1633 5 38 59 39 2 "consistent with the existence of threshold behaviour in the East Antarctic Ice sheet simulated by the ice sheet models under CO2 concentrations of 600–800 ppm (DeConto and Pollard, 2003; Langebroek et al., 2009)." Note that according to Zachos et al. (2001), Beerling and Royer (2011) and other papers the East Anarctic ice sheet formed about or below <500 ppm CO2. [Andrew Glikson, Australia]
Noted
5-1634 5 38 38 Reference: Bradley, R., and England, J., 2008, The Younger Dryas and the Sea of Ancient Ice: Quaternary Research, v. 70, no. 1, p. 1-10, doi: 10.1016/j.yqres.2008.03.002. [Sophie Bonnet, Canada]
Noted and taken into account in the revised text
5-1635 5 38 Figure 5.18: The correct reference is not Barbante et al, 2006 but EPICA community members, 2006!!! [Hubertus Fischer, Switzerland]
Noted and taken into account in the revised text
5-1636 5 39 2 39 2 Suggest also Gasson et al RoG in press for this reference - proofs returned [Mark Siddall, UK] Noted and taken into account in the revised text
5-1637 5 39 2 39 3 "...might happen during some previous..." should read as "...might have happened during some previous..." Also, this is a very important point worth emphasizing; we are heading into an artificially enhanced interglacial, so these paleo records make it clear that major WAIS instability is well within the realm of possibility in the near future, perhaps even with near-certainty. [Jay Curt Stager, United States of America]
Noted and taken into account in the revised text
5-1638 5 39 3 39 3 "might happen" should be "might have happened" [Richard B. Alley, United States of America] Editorial
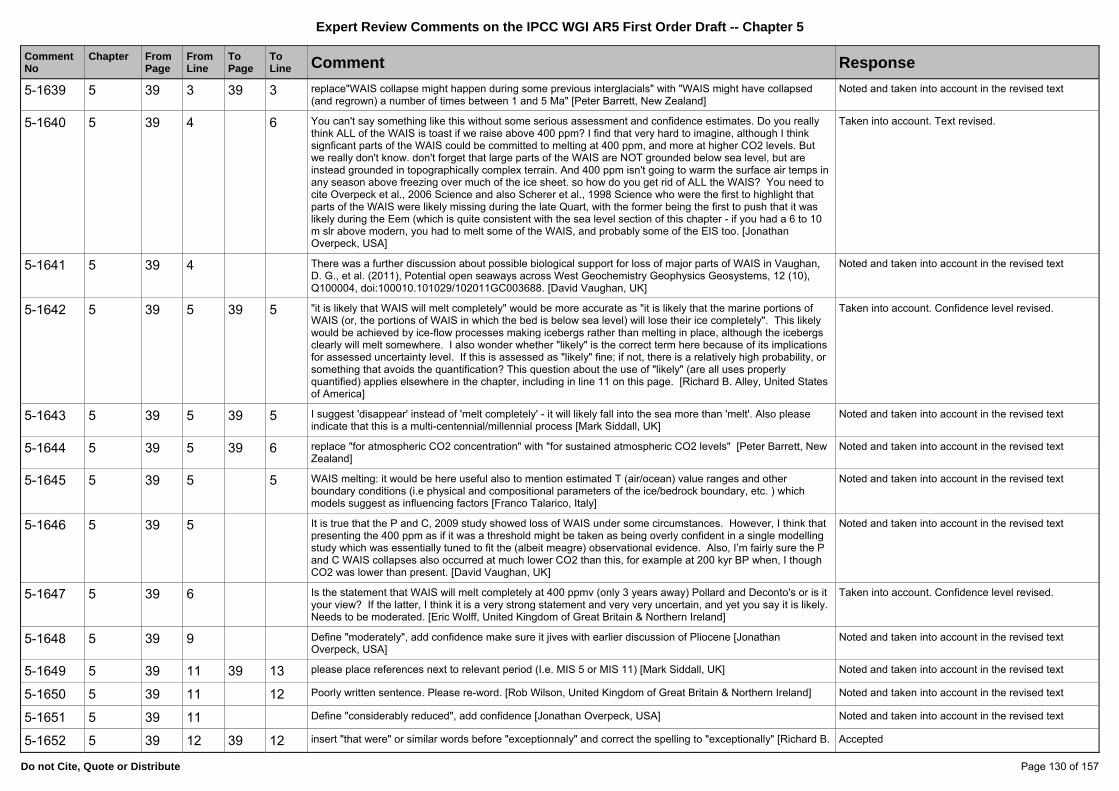
Expert Review Comments on the IPCC WGI AR5 First Order Draft -- Chapter 5
Do not Cite, Quote or Distribute Page 130 of 157
Comment No
Chapter FromPage
FromLine
To Page
To Line Comment Response
5-1639 5 39 3 39 3 replace"WAIS collapse might happen during some previous interglacials" with "WAIS might have collapsed (and regrown) a number of times between 1 and 5 Ma" [Peter Barrett, New Zealand]
Noted and taken into account in the revised text
5-1640 5 39 4 6 You can't say something like this without some serious assessment and confidence estimates. Do you really think ALL of the WAIS is toast if we raise above 400 ppm? I find that very hard to imagine, although I think signficant parts of the WAIS could be committed to melting at 400 ppm, and more at higher CO2 levels. But we really don't know. don't forget that large parts of the WAIS are NOT grounded below sea level, but are instead grounded in topographically complex terrain. And 400 ppm isn't going to warm the surface air temps in any season above freezing over much of the ice sheet. so how do you get rid of ALL the WAIS? You need to cite Overpeck et al., 2006 Science and also Scherer et al., 1998 Science who were the first to highlight that parts of the WAIS were likely missing during the late Quart, with the former being the first to push that it was likely during the Eem (which is quite consistent with the sea level section of this chapter - if you had a 6 to 10 m slr above modern, you had to melt some of the WAIS, and probably some of the EIS too. [Jonathan Overpeck, USA]
Taken into account. Text revised.
5-1641 5 39 4 There was a further discussion about possible biological support for loss of major parts of WAIS in Vaughan, D. G., et al. (2011), Potential open seaways across West Geochemistry Geophysics Geosystems, 12 (10), Q100004, doi:100010.101029/102011GC003688. [David Vaughan, UK]
Noted and taken into account in the revised text
5-1642 5 39 5 39 5 "it is likely that WAIS will melt completely" would be more accurate as "it is likely that the marine portions of WAIS (or, the portions of WAIS in which the bed is below sea level) will lose their ice completely". This likely would be achieved by ice-flow processes making icebergs rather than melting in place, although the icebergs clearly will melt somewhere. I also wonder whether "likely" is the correct term here because of its implications for assessed uncertainty level. If this is assessed as "likely" fine; if not, there is a relatively high probability, or something that avoids the quantification? This question about the use of "likely" (are all uses properly quantified) applies elsewhere in the chapter, including in line 11 on this page. [Richard B. Alley, United States of America]
Taken into account. Confidence level revised.
5-1643 5 39 5 39 5 I suggest 'disappear' instead of 'melt completely' - it will likely fall into the sea more than 'melt'. Also please indicate that this is a multi-centennial/millennial process [Mark Siddall, UK]
Noted and taken into account in the revised text
5-1644 5 39 5 39 6 replace "for atmospheric CO2 concentration" with "for sustained atmospheric CO2 levels" [Peter Barrett, New Zealand]
Noted and taken into account in the revised text
5-1645 5 39 5 5 WAIS melting: it would be here useful also to mention estimated T (air/ocean) value ranges and other boundary conditions (i.e physical and compositional parameters of the ice/bedrock boundary, etc. ) which models suggest as influencing factors [Franco Talarico, Italy]
Noted and taken into account in the revised text
5-1646 5 39 5 It is true that the P and C, 2009 study showed loss of WAIS under some circumstances. However, I think that presenting the 400 ppm as if it was a threshold might be taken as being overly confident in a single modelling study which was essentially tuned to fit the (albeit meagre) observational evidence. Also, I’m fairly sure the P and C WAIS collapses also occurred at much lower CO2 than this, for example at 200 kyr BP when, I though CO2 was lower than present. [David Vaughan, UK]
Noted and taken into account in the revised text
5-1647 5 39 6 Is the statement that WAIS will melt completely at 400 ppmv (only 3 years away) Pollard and Deconto's or is it your view? If the latter, I think it is a very strong statement and very very uncertain, and yet you say it is likely. Needs to be moderated. [Eric Wolff, United Kingdom of Great Britain & Northern Ireland]
Taken into account. Confidence level revised.
5-1648 5 39 9 Define "moderately", add confidence make sure it jives with earlier discussion of Pliocene [Jonathan Overpeck, USA]
Noted and taken into account in the revised text
5-1649 5 39 11 39 13 please place references next to relevant period (I.e. MIS 5 or MIS 11) [Mark Siddall, UK] Noted and taken into account in the revised text
5-1650 5 39 11 12 Poorly written sentence. Please re-word. [Rob Wilson, United Kingdom of Great Britain & Northern Ireland] Noted and taken into account in the revised text
5-1651 5 39 11 Define "considerably reduced", add confidence [Jonathan Overpeck, USA] Noted and taken into account in the revised text
5-1652 5 39 12 39 12 insert "that were" or similar words before "exceptionnaly" and correct the spelling to "exceptionally" [Richard B. Accepted

Expert Review Comments on the IPCC WGI AR5 First Order Draft -- Chapter 5
Do not Cite, Quote or Distribute Page 131 of 157
Comment No
Chapter FromPage
FromLine
To Page
To Line Comment Response
Alley, United States of America]
5-1653 5 39 12 39 12 replace "exceptionnaly" with "exceptionally" [Peter Barrett, New Zealand] Editorial
5-1654 5 39 12 39 12 exceptionally long': use in this context is poor English, and better quantified at the least [Peter Burt, UK] Noted and taken into account in the revised text
5-1655 5 39 12 39 12 “exceptionnaly” should be “exceptionally” [Eelco Johan ROHLING, United Kingdom of Great Britain & Northern Ireland]
Noted and taken into account in the revised text
5-1656 5 39 15 39 15 "lay" should be "lie" or "be" or "occur" [Richard B. Alley, United States of America] Editorial
5-1657 5 39 17 39 19 mention the time scale on which the Greenland ice sheet melts away [Hubertus Fischer, Switzerland] Noted and taken into account in the revised text
5-1658 5 39 17 19 This statement, with some confidence, should be in the Exec Summ. I think there is a more recent estimate of when it'll be cold enough for another glaciation. Can't remembe the paper or how good it is. Was it a Peltier paper (or one of his students). You should search and assess competing assertions. [Jonathan Overpeck, USA]
Noted and taken into account in the revised text
5-1659 5 39 17 Replace “can” with “could”, Unless you can cite a reference to show this has happened. [David Vaughan, UK] Editorial
5-1660 5 39 18 39 18 perhaps qualify "may not re-grow" by adding "naturally" to open the possibility of geoengineering schemes [Richard B. Alley, United States of America]
Noted and taken into account in the revised text
5-1661 5 39 18 39 19 The latests estimations show that the next Ice Age could be as soon as 1500 years if pre-industrial atmospheric CO2 concentrations were present (See Tzedakis et al. 2012. Nature Geoscience doi:10.1038/ngeo1358) [Yueh-Hsin Lo, Taiwan R.O.C.]
Noted and taken into account in the revised text
5-1662 5 39 18 50 kyr from now is just one model estimate, change to "which might be 50 kyr from now" [Eric Wolff, United Kingdom of Great Britain & Northern Ireland]
Noted and taken into account in the revised text
5-1663 5 39 23 39 23 modeling → modelling [Peter Burt, UK] editorial
5-1664 5 39 23 39 24 "High sensitivity" is misleading, at least in the present context; freshwater hosing is a quite extreme way of assessing sensitivity. (And "high sensitivity" to freshwater is presumably a relative statement, wrt what? Heat?) The two suits of experiments in the quoted paper (Stouffer et al. 2006) artificially add huge amounts of freshwater to the northern North Atlantic for 100 years (corresponding to 50% and 500%, respectively, of the total northern freshwater input in the present climate). I presume a similar change forced upon to the ocean heat budget would result in AMOC demonstrating even highter sensitivity to heat fluxes. [Tor Eldevik, Norway]
Accepted, revised in SOD
5-1665 5 39 24 39 26 I do not fully agree with the sentence "although this was not yet confirmed with the comprehensive climate models. I think one such study using FAMOUS AOGCM has been done by Hawkins et al. (2011) and confirm the possibility of multipled equilibrium states. So I propose rather "only confirmed by one low resolution AOGCM (FAMOUS, Hawkins et al. 2011) up to now". (Hawkins E., R. S. Smith, L. C. Allison, J. M. Gregory, T. J. Woollings, H. Pohlmann, and B. de Cuevas Bistability of the Atlantic overturning circulation in a global climate model and links to ocean freshwater transport. Geophys. Res. Lett., 38, L10605, doi:10.1029/2011GL047208, 2011) [Didier Swingedouw, France]
Accepted, revised in SOD
5-1666 5 39 25 39 26 Study by Hawkins et al. (2011, GRL) found bistability of the AMOC to freshwater hosing in a complex (low resolution) GCM. [ED HAWKINS, United Kingdom of Great Britain & Northern Ireland]
Accepted, revised in SOD
5-1667 5 39 26 39 26 "was not confirmed" would be better as "has not yet been confirmed" [Richard B. Alley, United States of America]
Accepted, revised in SOD
5-1668 5 39 26 Change to “....this has not yet been confirmed.....” [Rob Wilson, United Kingdom of Great Britain & Northern Ireland]
Accepted, revised in SOD
5-1669 5 39 31 39 31 It may be sensible to include the Carlson et al 2008 Nat Geo paper - this was partly a development of LeGrande et al 2006 [Mark Siddall, UK]
Accepted, revised in SOD

Expert Review Comments on the IPCC WGI AR5 First Order Draft -- Chapter 5
Do not Cite, Quote or Distribute Page 132 of 157
Comment No
Chapter FromPage
FromLine
To Page
To Line Comment Response
5-1670 5 39 31 39 55 Recent research has indicated that the duration of the 8.2Ka event is approximately 160 years (Daley TJ, Thomas ER, Holmes JA, Street-Perrott FA, Chapman MR, Tindall JC, Valdes PJ, Loader NJ, Marshall JD, Wolff EW, Hopley PJ, Atkinson T, Barber KE, Fisher EH, Robertson I., Hughes PDM and Roberts CN. The 8200 yr BP event in stable isotope records from the North Atlantic region. Global and Planetary Change 79, 288-302, 2011). I recommend that the text is updated. [Iain Robertson, UK]
Accepted, revised in SOD
5-1671 5 39 31 39 55 Rohling and Palike (2005) Nature 434:975-979. is a major review of this 8.2 ka event that should be consulted and cited here as well. [Jay Curt Stager, United States of America]
Accepted.
5-1672 5 39 31 40 6 While Agassiz drainage is the only plausible cause for 8.2 ka, it does need to be pointed out that one has to go to the far end of the range of dates for the drainage to reach the rather well-dated Greenland 8.2 ka event. I suggest taking a look at Daley et al, 2011, GPC 79, 288-302 for a consistent picture of the event and the timings reported. they report that the event itself may be recording synchronously in the Atlantic, but there is still a concern that it is hard to reconcile the preferred date for the Agassiz drainage with the start date of the recorded climate effects. i think this issue needs to be more explicitly discussed. [Eric Wolff, United Kingdom of Great Britain & Northern Ireland]
Accepted, revised in SOD
5-1673 5 39 31 notation for the 8.2 ka event? The rest of the chapter uses kyr BP… [Masa KAGEYAMA, France] Editorial
5-1674 5 40 1 40 6 Observations shall be mentioned, like a possible response to the GSA in the 1970ies in the NH and SH. [Gerrit Lohmann, Germany]
Rejected, not necessarily analogous
5-1675 5 40 5 40 6 Please provide references supporting the operation of the bipolar seesaw during the 8.2 event. [Chronis Tzedakis, UK]
Accepted, revised in SOD
5-1676 5 40 7 should you think about a irrversibility of vegetation section? Veg responds faster in some respects than ocean or ice, but isn't there a good likelihood that we'll never get back to the same exact climate as today and pre-indistrial, thus, we are entering a period of rapid veg/ecosystem change that will continue until GHG concertrations stabilize (thousands of years from now) and that climate could be quite different from now, so in a sense veg change is very likely irreversable. [Jonathan Overpeck, USA]
Rejected, space limitations
5-1677 5 40 7 and what about permafrost and the methane/CO2 therein? Also marine clathrates. If the warming is large enough (e.g., like the many PETM-like events) could we loose a good amount of the carbon and get a) a sign positive feedback and b) a long time before it could accumulate again - that is, cooling back to near 20th century avrage (before widespread melting) and persistence for thousands of years (the time it took for that carbon to accumulate). sounds more irreversable than ocean circulation change. [Jonathan Overpeck, USA]
Rejected, literature not conclusive for existence of Holocene methane emissions of this type
5-1678 5 40 7 again, nice FOD and look forward to the SOD. Thanks for all the excellent effort. [Jonathan Overpeck, USA] Noted
5-1679 5 40 38 40 59 This subsection needs clearer writing, less jargon, and an explicit linkage to the paleoclimate records described earlier. It should either undergo a major overhaul, or be omitted altogether. The next page is also weak and seems unrelated to the rest of the chapter. Perhaps some of the material in Lines 20-39 on Page 5-41 could be moved earlier to help flesh out the subsection on glaciers on page 5-24? [Jay Curt Stager, United States of America]
Accepted - the box is now structured differently and uses less jargon. We explictely state why we focus on climate-ice-sheet interactions
5-1680 5 40 40 40 40 system → System [Peter Burt, UK] Editorial
5-1681 5 40 45 40 45 system → System [Peter Burt, UK] Editorial
5-1682 5 40 47 40 47 system → System [Peter Burt, UK] Editorial
5-1683 5 40 47 40 48 The definition issue of "irreversible" on p. 38 influences the discussion here. The time until return to the original state following a jump to a new equilibrium state depends in part on the "noise" or "signal" in the forcing--how long until the forcing is strong enough to exceed the width of the hysteresis loop. I greatly appreciate the effort to avoid the technical term, but I believe that the chapter would be improved by
Rejected - We think that introducing yet another concept (hyseteris loop) would rather complicate the section than make it more readable.

Expert Review Comments on the IPCC WGI AR5 First Order Draft -- Chapter 5
Do not Cite, Quote or Distribute Page 133 of 157
Comment No
Chapter FromPage
FromLine
To Page
To Line Comment Response
introducing the concept of a hysteresis loop in some fashion. [Richard B. Alley, United States of America]
5-1684 5 40 51 40 51 system → System [Peter Burt, UK] Editorial
5-1685 5 40 52 40 52 system → System [Peter Burt, UK] Editorial
5-1686 5 40 58 40 58 "Charney climate sensitivity" : give a reference? [Bernard De Saedeleer, Belgium] Accepted - references included
5-1687 5 40 41 Box 5.3: it would be good to highlight that some components not included in the traditional evaluation of climate sensitivity are not as slow as previously thought: vegetation and ice-sheets, in some aspects, can react fast, through changes in phenology for vegetation, and through melt water fluxes to the oceans for the ice-sheets. [Masa KAGEYAMA, France]
Noted - we have rewritten the sentence to " In contrast, the Earth-system sensitivity (Hansen et al., 2008; Lunt et al., 2010) accounts also for other Earth System feedbacks such as ice sheets, vegetation and the carbon cycle which often respond on timescales of hundreds to thousands of years and beyond"
5-1688 5 40 41 Box 5.3: the paragraph about ice-sheets might be out of place? What about the other feedbacks? Is this explained anywhere else in the report? (sorry, I didn't have time to check all chapters) [Masa KAGEYAMA, France]
Rejected - due to a lack of space we have decided not to provide a comprehensive discussion of all earth-system feedbacks, but ather illustrate the complexities already arising from ice-sheet climate interactions. We have added a sentence making this point clear
5-1689 5 40 41 Box 5.3: what about the constraints on climate sensitivity that can be brought be palaeoclimatic data? If Box 5.3 is indeed in the paleoclimate chapter, then this should be briefly addressed here. Also, since there are a lot of uncertainties in the evaluation of the climate sensitivity when the "slow" components are taken into account, maybe some directions could be given about what should be done??? [Masa KAGEYAMA, France]
Noted - given the few studies on Earth system sensitivity published to date, it may be very difficult to provide any constraints at this point. Furthermore, as our Box explains, equilibrium concepts may not really hold (ice-sheets are not even in equilibrium with the orbital forcing)
5-1690 5 40 The main text seems to end very abruptly. No conclusions? [Eric Wolff, United Kingdom of Great Britain & Northern Ireland]
Accepted - a few sentences were added that provide a conclusion to the ice-sheet-climate feedback paragraph
5-1691 5 41 4 41 4 Earth-system → Earth System [Peter Burt, UK] Editorial
5-1692 5 41 5 41 5 system → System [Peter Burt, UK] Editorial
5-1693 5 41 6 41 6 This is a useful description of the different meanings of sensitivity. But, because ice sheets and vegetation can begin their response to forcing quickly, and vegetation might make a very rapid response under certain situations (as shown by Tinner and Lotter, 2001, there was important pollen response in central Europe to the 8.2 ka event, despite a duration that was of the same order as envisioned in considering the Charney sensitivity, not the Earth system sensitivity. Thus, I believe it would be wise to add a line something like "Because ice sheets and vegetation can begin their responses to forcing rapidly but extend those responses over long times, actual climatic reponse to climatic forcing is not perfectly represented by either the Charney or Earth system sensitivity." [Richard B. Alley, United States of America]
Accepted - Box text revised.
5-1694 5 41 6 While the ES sensitivity of Lunt certainly includes ice sheets and vegetation, I don't think he included C cycle, because if I recall, he prescribed CO2. You need to be careful with this because if you really include everything you can find yourself with the rather odd situation for the LGM to PI, where there is a huge climate change and the only forcing is a negligible (at global scale) orbital forcing: with a definition that includes all feedbacks, the sensitivity would be huge (probably more than 30), but this is not the way the ES sensitivity seems to have been defined by anyone as far as I recall. I think you need to redefine this to be something useable! [Eric Wolff, United Kingdom of Great Britain & Northern Ireland]
Declined - the LGM was clearly not an equilibrium state. This can be shown by transiently running an ice-sheet model through an entire glacial cycle and then repeating the experiment, but freezing the LGM boundary conditions for another ~20 ky, rather than simulating Termination 1. For the LGM the ESS concept should not be applied.
5-1695 5 41 8 41 8 Earth-system → Earth System [Peter Burt, UK] Editorial
5-1696 5 41 9 41 9 Earth-system → Earth System [Peter Burt, UK] Editorial

Expert Review Comments on the IPCC WGI AR5 First Order Draft -- Chapter 5
Do not Cite, Quote or Distribute Page 134 of 157
Comment No
Chapter FromPage
FromLine
To Page
To Line Comment Response
5-1697 5 41 12 41 12 Earth-system → Earth System [Peter Burt, UK] Editorial
5-1698 5 41 14 41 14 Earth-system → Earth System (x2) [Peter Burt, UK] Editorial
5-1699 5 41 15 41 15 Earth-system → Earth System [Peter Burt, UK] Editorial
5-1700 5 41 15 41 15 "estimates of sensitivity from 30% to 50%... to about 100% above..." Is not so clear to read, as the low percentages lead the reader while reading to be thinking of sensitivities less than the Charney sensitivity (which is odd) until they hit the word "above". Better language is "have been derived and range from 130%-150% (Lunt et al., 2010a) to about 200% of the Charney sensitivity" [Tasman van Ommen, Australia]
Noted and taken into account in the revised text
5-1701 5 41 24 41 24 drops → drop [Peter Burt, UK] Editorial
5-1702 5 41 24 should be drop [Elie Verleyen, Belgium] Accepted
5-1703 5 41 29 39 Sorry, but this chunk of text is not at all easy to understand, lacks citations that give support to the statements, and I don’t think makes the key point clear. Which is, I think. There are feedbacks that promote rapid retreat of ice sheets once certain climate (including ocean) thresholds are passed. There are other thresholds that may prolong stability, and delay retreat, but the fact that the sea-level shows the “saw - tooth” structure indicates that retreat is almost always more rapid than regrowth. [David Vaughan, UK]
Partly accepted - more citations have been included. However, the key point the reviewer is trying to make is not the key point this paragraph tries to make. Since this is a Box which may include some educational matarials , we have decided to just provide an overview of thepossible ice-sheet -climate feedbacks, without putting them into the context of glacial terminations, thresholds or inceptions.
5-1704 5 41 31 41 32 Give a reference? [Bernard De Saedeleer, Belgium] Accepted
5-1705 5 41 32 41 34 The discussion of higher ice sheets causing more calving is not accurate. Inland ice flows in response to the driving stress, which is the product of ice thickness, surface slope, density and gravity; thus, ice is not flowing in response to pressure, but more in response to pressure gradient. Furthermore, although higher pressure gives a lower melting point, the effect is weak (about 1 degree per thousand meters of ice, to one significant digit), and pressure itself does not cause melting. Calving goes up rapidly with water depth at the grounding line (our Science paper on calving is one source, although not the only, and I include it as a pointer to physics rather than as a request to cite; Alley, R.B., H.J. Horgan, I.Joughin, K.M. Cuffey, T.K. Dupont, B.R. Parizek, S. Anandakrishnan and J. Bassis. A simple law for ice-shelf calving. Science 322, 1344-1344 (2008)). [Richard B. Alley, United States of America]
Accepted - text revised accordingly
5-1706 5 41 35 The primary evidence of (unprovoked) instabilities on the millennial timescales was the MacAyeal models that showed “binge-purge” behaviour. I don’t think modern models show the same behaviour. [David Vaughan, UK]
Rejeted - Even modern ice-sheet models exhibit spontaenous unforced millennial-scale variability as discussed in R. Calov, R. Greve, A. Abe-Ouchi, E. Bueler, P. Huybrechts, J.V. Johnson, F. Pattyn, D. Pollard, C. Ritz, F. Saito, and L. Tarasov. Results from the Ice-sheet model intercomparison project Heinrich Event intercomparison (ISMIP HEINO). Journal of Glaciology, 56:371–383, 2010.
5-1707 5 41 41 41 41 Earth-system → Earth System [Peter Burt, UK] Editorial
5-1708 5 41 44 41 44 Earth-system → Earth System [Peter Burt, UK] Editorial
5-1709 5 42 1 42 5 Please, cite the sources of reconstructions of global mean sea level in the past 2 millennia. If there are no such sources, FAQ 1 should restrict its scope to the regional records cited, e.g. the salt marsh records of North America [Eduardo Zorita, Germany]
Noted and taken into account in the revised text
5-1710 5 42 1 43 11 FAQ 5.1: I think this FAQ does a good job of covering the desirable scope. However, there are some places where the language could usefully be simplified and / or technical terms expanded or explained, for the benefit of the non-specialist reader. The figure is clear and helpful. [David Wratt, New Zealand]
Noted and taken into account in the revised text
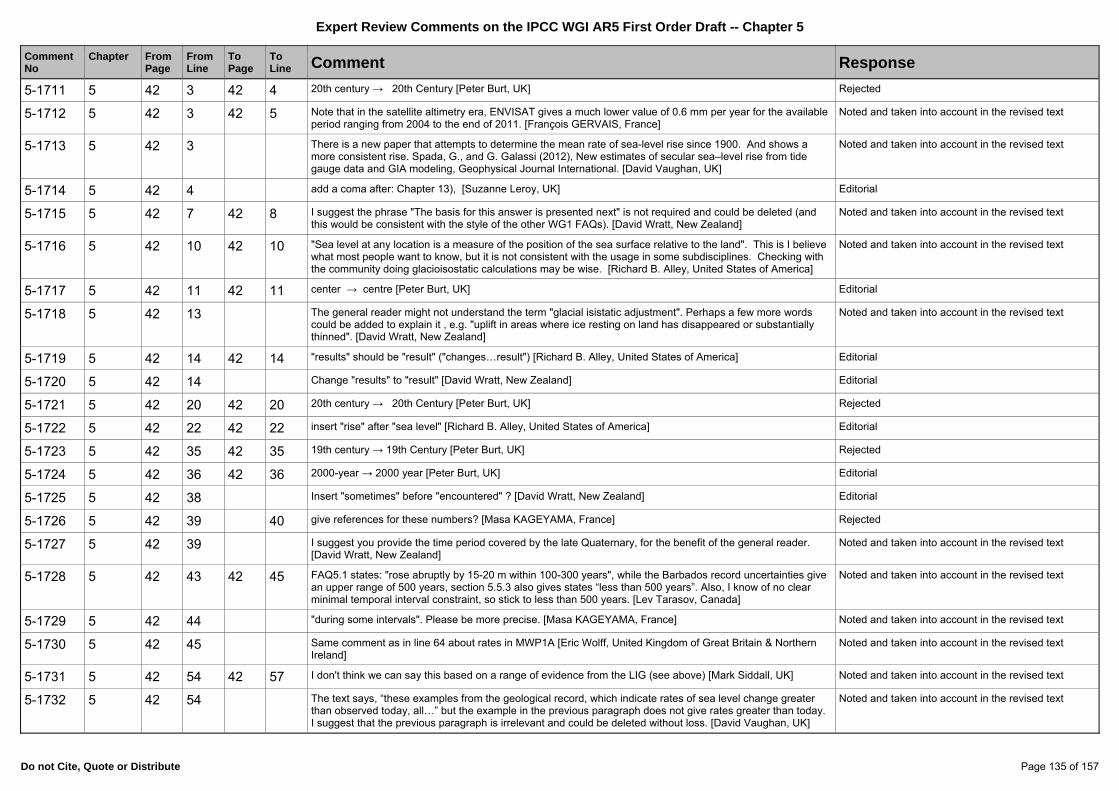
Expert Review Comments on the IPCC WGI AR5 First Order Draft -- Chapter 5
Do not Cite, Quote or Distribute Page 135 of 157
Comment No
Chapter FromPage
FromLine
To Page
To Line Comment Response
5-1711 5 42 3 42 4 20th century → 20th Century [Peter Burt, UK] Rejected
5-1712 5 42 3 42 5 Note that in the satellite altimetry era, ENVISAT gives a much lower value of 0.6 mm per year for the available period ranging from 2004 to the end of 2011. [François GERVAIS, France]
Noted and taken into account in the revised text
5-1713 5 42 3 There is a new paper that attempts to determine the mean rate of sea-level rise since 1900. And shows a more consistent rise. Spada, G., and G. Galassi (2012), New estimates of secular sea–level rise from tide gauge data and GIA modeling, Geophysical Journal International. [David Vaughan, UK]
Noted and taken into account in the revised text
5-1714 5 42 4 add a coma after: Chapter 13), [Suzanne Leroy, UK] Editorial
5-1715 5 42 7 42 8 I suggest the phrase "The basis for this answer is presented next" is not required and could be deleted (and this would be consistent with the style of the other WG1 FAQs). [David Wratt, New Zealand]
Noted and taken into account in the revised text
5-1716 5 42 10 42 10 "Sea level at any location is a measure of the position of the sea surface relative to the land". This is I believe what most people want to know, but it is not consistent with the usage in some subdisciplines. Checking with the community doing glacioisostatic calculations may be wise. [Richard B. Alley, United States of America]
Noted and taken into account in the revised text
5-1717 5 42 11 42 11 center → centre [Peter Burt, UK] Editorial
5-1718 5 42 13 The general reader might not understand the term "glacial isistatic adjustment". Perhaps a few more words could be added to explain it , e.g. "uplift in areas where ice resting on land has disappeared or substantially thinned". [David Wratt, New Zealand]
Noted and taken into account in the revised text
5-1719 5 42 14 42 14 "results" should be "result" ("changes…result") [Richard B. Alley, United States of America] Editorial
5-1720 5 42 14 Change "results" to "result" [David Wratt, New Zealand] Editorial
5-1721 5 42 20 42 20 20th century → 20th Century [Peter Burt, UK] Rejected
5-1722 5 42 22 42 22 insert "rise" after "sea level" [Richard B. Alley, United States of America] Editorial
5-1723 5 42 35 42 35 19th century → 19th Century [Peter Burt, UK] Rejected
5-1724 5 42 36 42 36 2000-year → 2000 year [Peter Burt, UK] Editorial
5-1725 5 42 38 Insert "sometimes" before "encountered" ? [David Wratt, New Zealand] Editorial
5-1726 5 42 39 40 give references for these numbers? [Masa KAGEYAMA, France] Rejected
5-1727 5 42 39 I suggest you provide the time period covered by the late Quaternary, for the benefit of the general reader. [David Wratt, New Zealand]
Noted and taken into account in the revised text
5-1728 5 42 43 42 45 FAQ5.1 states: "rose abruptly by 15-20 m within 100-300 years", while the Barbados record uncertainties give an upper range of 500 years, section 5.5.3 also gives states “less than 500 years”. Also, I know of no clear minimal temporal interval constraint, so stick to less than 500 years. [Lev Tarasov, Canada]
Noted and taken into account in the revised text
5-1729 5 42 44 "during some intervals". Please be more precise. [Masa KAGEYAMA, France] Noted and taken into account in the revised text
5-1730 5 42 45 Same comment as in line 64 about rates in MWP1A [Eric Wolff, United Kingdom of Great Britain & Northern Ireland]
Noted and taken into account in the revised text
5-1731 5 42 54 42 57 I don't think we can say this based on a range of evidence from the LIG (see above) [Mark Siddall, UK] Noted and taken into account in the revised text
5-1732 5 42 54 The text says, “these examples from the geological record, which indicate rates of sea level change greater than observed today, all…” but the example in the previous paragraph does not give rates greater than today. I suggest that the previous paragraph is irrelevant and could be deleted without loss. [David Vaughan, UK]
Noted and taken into account in the revised text

Expert Review Comments on the IPCC WGI AR5 First Order Draft -- Chapter 5
Do not Cite, Quote or Distribute Page 136 of 157
Comment No
Chapter FromPage
FromLine
To Page
To Line Comment Response
5-1733 5 42 FAQ 5.1: The idea of using FAQs is very good. This one, however, needs a clearer, simpler explanation. Lines 10-18 in particular are in poor shape. Please spell it out simply and clearly: WHAT were those past rates, exactly, and what do they tell us about modern and near-future times? In Lines 54-57, or elsewhere in the FAQ 5.1 explanation, it's worth mentioning again that there is FAR less ice on the planet today than there was during the major melt-water pulses of the past. [Jay Curt Stager, United States of America]
Noted and taken into account in the revised text
5-1734 5 42 I think this misses a key point, that sea-level has risen very rapidly in the (geologically) recent past. And although this occurred at a time when there was a lot more ice on the planet available to melt, and the transition from glacial to interglacial conditions was already long-established, the rates of change in CO2 we probably not as rapid as we are experiencing today. Thus the analogue should not be forgotten, but cannot be used in a conclusive way. [David Vaughan, UK]
Noted and taken into account in the revised text
5-1735 5 42 FAQ 5.1: Opening chapeau needs to be explicit about the sign of change - unusually large or unusually small relative to the paleo-record. [Thomas Stocker/ WGI TSU, Switzerland]
Noted and taken into account in the revised text
5-1736 5 42 FAQ 5.1: The second paragraph (first after the chapeau) is currently very technical and therefore is a difficult entry point for the reader. [Thomas Stocker/ WGI TSU, Switzerland]
Noted and taken into account in the revised text
5-1737 5 42 FAQ 5.1, Fig 1: Suggest adding a listing of the relevant processes that were occurring for each of the time periods considered here. [Thomas Stocker/ WGI TSU, Switzerland]
Noted and taken into account in the revised text
5-1738 5 42 FAQ 5.1, Fig 1: Please coordinate with Chapters 3 and 13 to ensure consistency regarding the two recent time frames. We suggest you also add an estimate of the maximum rates observed during the freshwater pulses. What do the error bars indicate? Given this is an FAQ, more explanation is required in the caption. [Thomas Stocker/ WGI TSU, Switzerland]
Noted and taken into account in the revised text
5-1739 5 43 14 44 39 FAQ 5.2 should include a clear discussion of the current understanding of the role of galactic cosmic rays as a possible influence on climate on palaeoclimate timescales. Section 7.4.7 discusses the issue in general but this FAQ should take the opportunity to visibly address the point in the palaeo context. [Richard Betts, United Kingdom of Great Britain & Northern Ireland]
Rejected. The topic of galactic cosmic rays is beyond the scope of the FAQ. GCR are addressed in Chapter 8. Regarding paleoclimate variability, to our knowledge, there is so far no robust proxy evidence allowing to assess the role of cosmic rays.
5-1740 5 43 14 44 39 suggested mechanisms such as the cosmic ray - cloud hypothesis are not discussed in the FAQ section. I think it would be good to mention all suggested mechanisms of a solar influence on climate and how important they could be. [Raimund Muscheler, Sweden]
Noted and taken into account in the revised text
5-1741 5 43 14 44 39 FAQ 5.2: Should something also be included in this FAQ regarding galactic cosmic rays, since although they are not a direct solar forcing they do vary through the solar cycle? Perhaps a paragraph could be included which draws on the information in Section 7.4.7.3 ? [David Wratt, New Zealand]
Noted and taken into account in the revised text
5-1742 5 43 16 FAQ 5.2: comment regarding AR5's near complete omission of the massive evidence for a solar-magnetic climate driver My training is in economics where we are very familiar with what statisticians call "the omitted variable problem" (or when it is intentional, "omitted variable fraud"). Whenever an explanatory variable is omitted from a statistical analysis, its explanatory power gets misattributed to any correlated variables that are included. This problem is manifest at the very highest level of AR5, and is built into each step of its analysis. For the 1750-2010 period examined, two variables correlate strongly the observed warming (and hence with each other). Solar magnetic activity and atmospheric CO2 were both trending upwards over the period, and both stepped up to much higher levels over the second half of the 20th century. This pair of correlations with temperature change give rise to the two main competing theories of 20th century warming. Was it driven by rapidly increasing human release of CO2, or by the 80 year "grand maximum" of solar activity that began in the early 1920's. ("Grand minima and maxima of solar activity: new observational constraints," Usoskin et al. 2007.)
Noted and taken into account in the revised text

Expert Review Comments on the IPCC WGI AR5 First Order Draft -- Chapter 5
Do not Cite, Quote or Distribute Page 137 of 157
Comment No
Chapter FromPage
FromLine
To Page
To Line Comment Response
The empirical evidence in favor of the solar explanation is overwhelming. Dozens of peer-reviewed studies have found a very high degree of correlation (.5 to .8) between solar-magnetic activity and global temperature going back many thousands of years (Bond 2001, Neff 2001, Shaviv 2003, Usoskin 2005, and many others listed below). In other words, solar activity "explains," in the statistical sense, 50 to 80% of past temperature change. Such a high degree of correlation over such long time periods implies causality, which can only go one way. Global temperature cannot be driving solar activity, so there must be some mechanism by which solar activity is driving or modulating global temperature change. The high degree of correlation also suggests that solar activity is the PRIMARY driver of global temperature on every time scale studied (which is pretty much every time scale but the Milankovitch cycle). In contrast, CO2 and temperature records reveal no discernable warming effect of CO2. There is a correlation between CO2 and temperature, but with CO2 changes following temperature changes by an average of about 800 years (Caillon 2003), indicating that it is temperature change that is driving CO2 change (as it should, since warming oceans are able to hold less CO2). This does not rule out the possibility that CO2 also drives temperature, and in theory a doubling of CO2 should cause about a 1 degree increase in temperature before any feedback effects are accounted, but feedbacks could be negative, so there no reason, just from what we know about the greenhouse mechanism, that CO2 has to be a significant player. The one thing we can say is that whatever the warming effect of CO2, it is not detectable in the raw CO2 vs. temperature data. This is in glaring contrast to solar activity, which lights up like a neon sign in the raw data. Literally dozens of studies finding .5 to .8 degrees of correlation with temperature. So how is it that the IPCC's current generation of general circulation models start with the ASSUMPTION that CO2 has done 40 times as much to warm the planet as solar activity since 1750? This is the ratio of AR5's radiative forcing estimates for variation in CO2 and variation in total solar effects listed in table 8.9 on page 8-45. RF for CO2 is entered as 2.79 W/m^2 while RF for total solar effects is entered as .07 W/m^2. The 50% driver of global temperature according to mountains of temperature correlation data is ASSUMED to have 1/40th the warming effect of something whose warming effect is not even discernable in the temperature record. And this is on the INPUT side of the GCM's. The models aren't using gigaflops of computing power to FIND that CO2 has that much larger a warming effect. The warming ratio is fixed at the outset. Garbage in, garbage out. [Sorry for using ALL CAPS for emphasis but Excel is not letting me use italics.] The "how" is very simple. The 40 times greater warming effect of CO2 is achieved by blatant omitted variable fraud. As I will fully document, all of the evidence for a strong solar magnetic driver of climate is simply left out of AR5. Of the many careful empirical studies that show a high correlation between solar activity and climate, not a single one is even mentioned ANYWHERE in the First Order Draft. On page 7-50, line 52, there is a single reference to a single paper (Kirkby 2007) where the text suggests some correlation between solar activity and climate, but it fails to mention even that the correlation to temperature is positive, never mind its dramatic magnitude, or the numerous repeated findings of this result. And that's it. One oblique reference in the entire report. A person reading AR5 from cover to cover would come away with not even a hint that for more than ten years a veritable flood of studies have been finding solar activity to explain something on the order of half of all past temperature variation. It is COMPLETELY omitted. As a result, AR5 misattributes virtually all of the explanatory power of solar-magnetic activity to the correlated CO2 variable. This misattribution can be found both in AR5's analytical discussions and in its statistical estimations and projections, and the error could not be more consequential. If it is solar-magnetic activity that drives climate then the sun's recent descent into a state of profound quiescence portends imminent global cooling, possibly rapid and severe, and unlike warming, cooling is actually dangerous, and really can feed back on itself in runaway fashion. Nothing could be more perverse in such a circumstance than to unplug the modern world in a misbegotten jihad against CO2. The IPCC's omitted variable fraud must stop. AR5's misattribution of 20th century warming
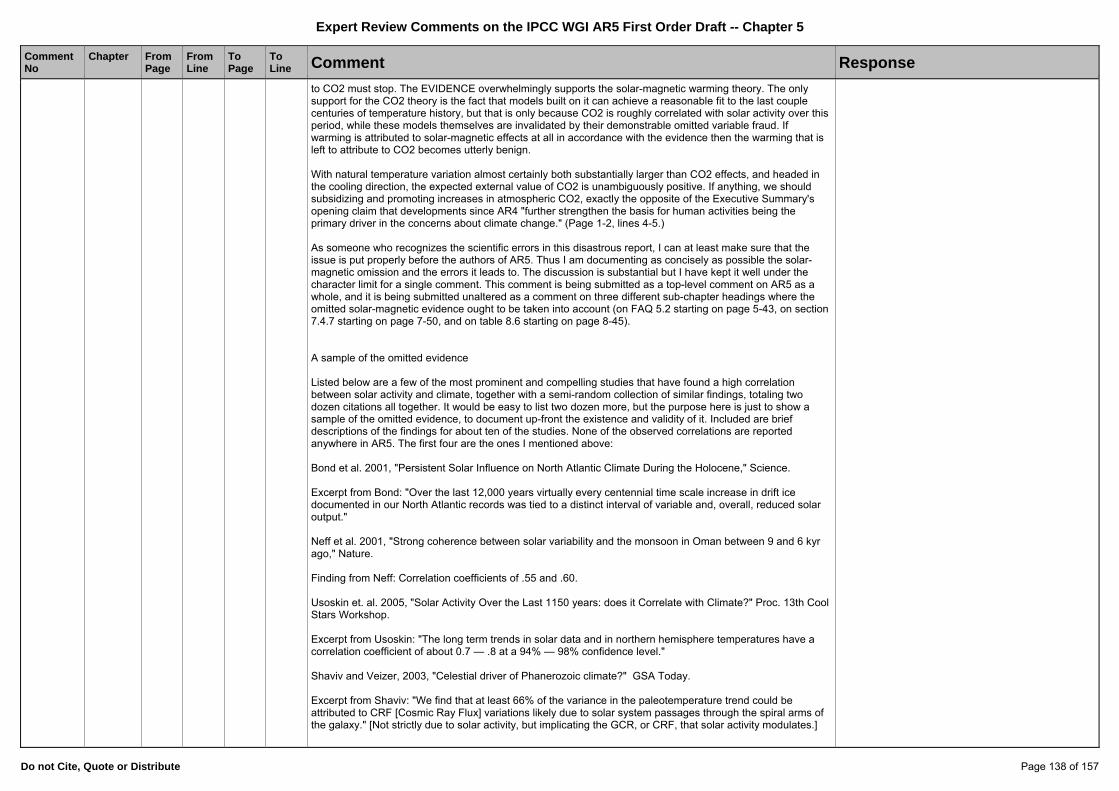
Expert Review Comments on the IPCC WGI AR5 First Order Draft -- Chapter 5
Do not Cite, Quote or Distribute Page 138 of 157
Comment No
Chapter FromPage
FromLine
To Page
To Line Comment Response
to CO2 must stop. The EVIDENCE overwhelmingly supports the solar-magnetic warming theory. The only support for the CO2 theory is the fact that models built on it can achieve a reasonable fit to the last couple centuries of temperature history, but that is only because CO2 is roughly correlated with solar activity over this period, while these models themselves are invalidated by their demonstrable omitted variable fraud. If warming is attributed to solar-magnetic effects at all in accordance with the evidence then the warming that is left to attribute to CO2 becomes utterly benign. With natural temperature variation almost certainly both substantially larger than CO2 effects, and headed in the cooling direction, the expected external value of CO2 is unambiguously positive. If anything, we should subsidizing and promoting increases in atmospheric CO2, exactly the opposite of the Executive Summary's opening claim that developments since AR4 "further strengthen the basis for human activities being the primary driver in the concerns about climate change." (Page 1-2, lines 4-5.) As someone who recognizes the scientific errors in this disastrous report, I can at least make sure that the issue is put properly before the authors of AR5. Thus I am documenting as concisely as possible the solar-magnetic omission and the errors it leads to. The discussion is substantial but I have kept it well under the character limit for a single comment. This comment is being submitted as a top-level comment on AR5 as a whole, and it is being submitted unaltered as a comment on three different sub-chapter headings where the omitted solar-magnetic evidence ought to be taken into account (on FAQ 5.2 starting on page 5-43, on section 7.4.7 starting on page 7-50, and on table 8.6 starting on page 8-45). A sample of the omitted evidence Listed below are a few of the most prominent and compelling studies that have found a high correlation between solar activity and climate, together with a semi-random collection of similar findings, totaling two dozen citations all together. It would be easy to list two dozen more, but the purpose here is just to show a sample of the omitted evidence, to document up-front the existence and validity of it. Included are brief descriptions of the findings for about ten of the studies. None of the observed correlations are reported anywhere in AR5. The first four are the ones I mentioned above: Bond et al. 2001, "Persistent Solar Influence on North Atlantic Climate During the Holocene," Science. Excerpt from Bond: "Over the last 12,000 years virtually every centennial time scale increase in drift ice documented in our North Atlantic records was tied to a distinct interval of variable and, overall, reduced solar output." Neff et al. 2001, "Strong coherence between solar variability and the monsoon in Oman between 9 and 6 kyr ago," Nature. Finding from Neff: Correlation coefficients of .55 and .60. Usoskin et. al. 2005, "Solar Activity Over the Last 1150 years: does it Correlate with Climate?" Proc. 13th Cool Stars Workshop. Excerpt from Usoskin: "The long term trends in solar data and in northern hemisphere temperatures have a correlation coefficient of about 0.7 — .8 at a 94% — 98% confidence level." Shaviv and Veizer, 2003, "Celestial driver of Phanerozoic climate?" GSA Today. Excerpt from Shaviv: "We find that at least 66% of the variance in the paleotemperature trend could be attributed to CRF [Cosmic Ray Flux] variations likely due to solar system passages through the spiral arms of the galaxy." [Not strictly due to solar activity, but implicating the GCR, or CRF, that solar activity modulates.]
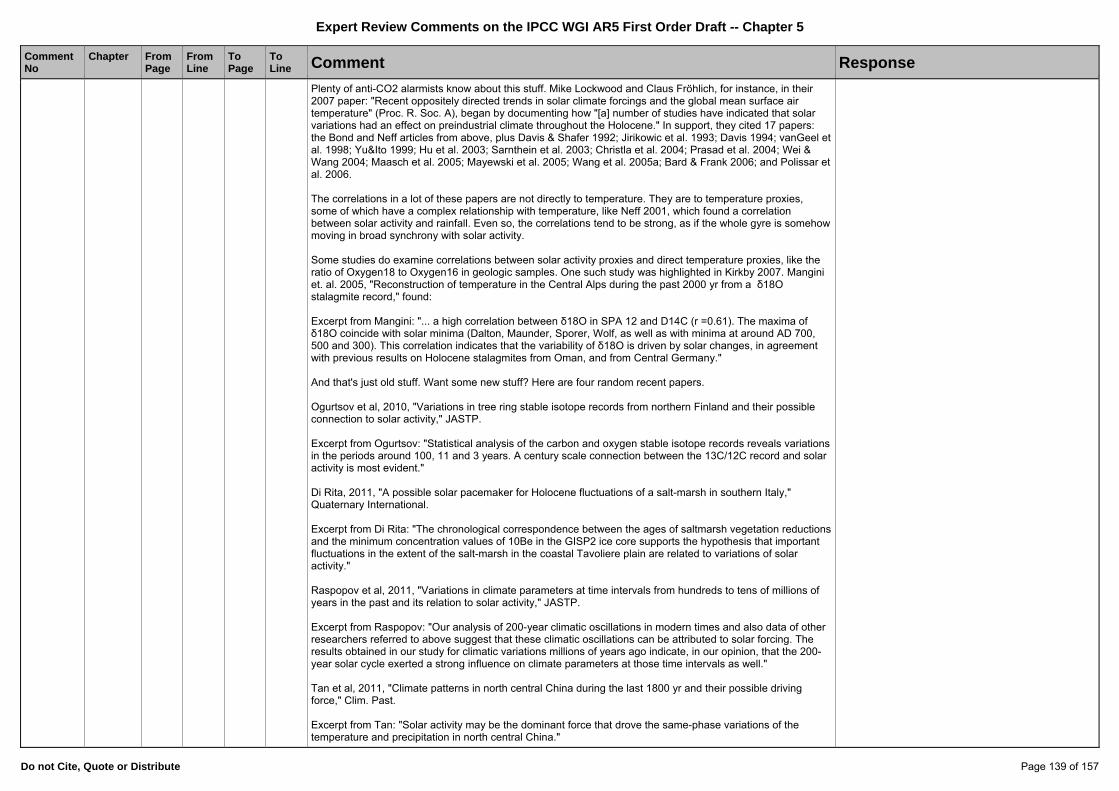
Expert Review Comments on the IPCC WGI AR5 First Order Draft -- Chapter 5
Do not Cite, Quote or Distribute Page 139 of 157
Comment No
Chapter FromPage
FromLine
To Page
To Line Comment Response
Plenty of anti-CO2 alarmists know about this stuff. Mike Lockwood and Claus Fröhlich, for instance, in their 2007 paper: "Recent oppositely directed trends in solar climate forcings and the global mean surface air temperature" (Proc. R. Soc. A), began by documenting how "[a] number of studies have indicated that solar variations had an effect on preindustrial climate throughout the Holocene." In support, they cited 17 papers: the Bond and Neff articles from above, plus Davis & Shafer 1992; Jirikowic et al. 1993; Davis 1994; vanGeel et al. 1998; Yu&Ito 1999; Hu et al. 2003; Sarnthein et al. 2003; Christla et al. 2004; Prasad et al. 2004; Wei & Wang 2004; Maasch et al. 2005; Mayewski et al. 2005; Wang et al. 2005a; Bard & Frank 2006; and Polissar et al. 2006. The correlations in a lot of these papers are not directly to temperature. They are to temperature proxies, some of which have a complex relationship with temperature, like Neff 2001, which found a correlation between solar activity and rainfall. Even so, the correlations tend to be strong, as if the whole gyre is somehow moving in broad synchrony with solar activity. Some studies do examine correlations between solar activity proxies and direct temperature proxies, like the ratio of Oxygen18 to Oxygen16 in geologic samples. One such study was highlighted in Kirkby 2007. Mangini et. al. 2005, "Reconstruction of temperature in the Central Alps during the past 2000 yr from a δ18O stalagmite record," found: Excerpt from Mangini: "... a high correlation between δ18O in SPA 12 and D14C (r =0.61). The maxima of δ18O coincide with solar minima (Dalton, Maunder, Sporer, Wolf, as well as with minima at around AD 700, 500 and 300). This correlation indicates that the variability of δ18O is driven by solar changes, in agreement with previous results on Holocene stalagmites from Oman, and from Central Germany." And that's just old stuff. Want some new stuff? Here are four random recent papers. Ogurtsov et al, 2010, "Variations in tree ring stable isotope records from northern Finland and their possible connection to solar activity," JASTP. Excerpt from Ogurtsov: "Statistical analysis of the carbon and oxygen stable isotope records reveals variations in the periods around 100, 11 and 3 years. A century scale connection between the 13C/12C record and solar activity is most evident." Di Rita, 2011, "A possible solar pacemaker for Holocene fluctuations of a salt-marsh in southern Italy," Quaternary International. Excerpt from Di Rita: "The chronological correspondence between the ages of saltmarsh vegetation reductions and the minimum concentration values of 10Be in the GISP2 ice core supports the hypothesis that important fluctuations in the extent of the salt-marsh in the coastal Tavoliere plain are related to variations of solar activity." Raspopov et al, 2011, "Variations in climate parameters at time intervals from hundreds to tens of millions of years in the past and its relation to solar activity," JASTP. Excerpt from Raspopov: "Our analysis of 200-year climatic oscillations in modern times and also data of other researchers referred to above suggest that these climatic oscillations can be attributed to solar forcing. The results obtained in our study for climatic variations millions of years ago indicate, in our opinion, that the 200- year solar cycle exerted a strong influence on climate parameters at those time intervals as well." Tan et al, 2011, "Climate patterns in north central China during the last 1800 yr and their possible driving force," Clim. Past. Excerpt from Tan: "Solar activity may be the dominant force that drove the same-phase variations of the temperature and precipitation in north central China."

Expert Review Comments on the IPCC WGI AR5 First Order Draft -- Chapter 5
Do not Cite, Quote or Distribute Page 140 of 157
Comment No
Chapter FromPage
FromLine
To Page
To Line Comment Response
Saltmarshes, precipitation, "oscillations." It's all so science-fair. How about something just plain scary? Solheim et al. 2011, "Temperature prognosis based on long sunspot cycle 23," (not sure if this has been published yet, but you can find it here: http://www.au.agwscam.com/pdf/SolheimSolarTemperature.pdf). Excerpt from Solheim: "We find that for the Norwegian local stations investigated that 30-90% of the temperature increase in this period may be attributed to the Sun. For the average of 60 European stations we find ≈ 60% and globally (HadCRUT3) ≈ 50%. The same relations predict a temperature decrease of ≈ 0.9°C globally and 1.1−1.7°C for the Norwegian stations investigated from solar cycle 23 to 24." First Chapter 5 error: omitting all solar variables besides TSI Chapter 5, the paleo observations chapter, is the right place for the evidence for a solar-magnetic climate driver to be introduced because most of this evidence is obtained from the deposition of cosmogenic isotopes in various paleologic strata: ice cores, geologic cores and tree rings. When solar activity is strong, less galactic cosmic radiation (GCR) is able to penetrate the solar wind and reach earth, so variation in cosmogenic isotopes found in time-dated strata serves as a proxy for solar activity. But when chapter 5 does get around to looking at cosmogenic records, it only looks at how they can be used to reconstruct total solar irradiance (TSI). It never even hints at the flood of studies that show a high degree of correlation between solar activity and various paleo proxies for climate and temperature! This occurs under the subheading "FAQ 5.2: Is the Sun a Major Driver of Climate Changes?" which is placed as an addendum to Chapter 5, starting on page 5-43. This FAQ mentions the long-period chang in TSI that come with orbital variation (Milankovitch cycles), a factor which hasn't changed enough since 1750 to account for any significant amount of the warming since that date. Neither can TSI be responsible for significant recent warming because, as solar activity jumps dramatically up and down over the roughly 11 year solar cycle, TSI is known to remain remarkably stable, varying only .1 to .2% (as noted on page 5-43, line 53). Thus, concludes FAQ 5.2, solar variation cannot be responsible for any significant amount of the warming since 1750. But it is only able to reach this conclusion by completely omitting any consideration those solar variables other than TSI that could be affecting global temperature. Unlike TSI, solar wind speed and pressure vary considerably over the solar cycle and between solar cycles. So do the Ap index and the F10.7cm radio flux progression. The GCR that the solar wind modulates, the neutron counts measured at Climax and Oulu and other locations, can vary by a full order of magnitude over the solar cycle. In contrast, TSI varies so little that it is called "the solar constant." If there is a mechanism by which solar variation is driving global temperature, it is most likely to work through those solar variables that actually vary significantly with solar activity. Yet the discussion in FAQ 5.2 pretends that these other solar variables do not even exist. So that's the first error in FAQ 5.2: pretending to have addressed the range of possible solar effects while studiously neglecting to mention that there are a bunch of solar variables that, unlike TSI, vary tremendously over the solar cycle and might affect our climate in ways that we do not yet understand. We in-effect live inside of the sun's "atmosphere," the extended corona created by the sun's magnetic field and the solar wind. AR5 simply assumes that this solar environment has no effect on global climate, and they do it by rank omission of the relevant variables. The omitted variable problems that result are not an accident. They are omitted variable fraud. Second Chapter 5 error: the highly irrational assumption that temperature would be driven by the trend in solar activity rather than the level Perhaps in an effort to justify ignoring all solar variables other than TSI, FAQ 5.2 ends with what it presents as a general reason to dismiss the possibility that solar variation made any significant contribution to late 20th

Expert Review Comments on the IPCC WGI AR5 First Order Draft -- Chapter 5
Do not Cite, Quote or Distribute Page 141 of 157
Comment No
Chapter FromPage
FromLine
To Page
To Line Comment Response
century warming by ANY mechanism. Page 5-44, lines 25-28: "[The sun can't be] a major driver of the climate changes over the past 40 years because instrumental TSI and SSI records contain no significant trend; whereas records of global mean temperature and GHG concentrations contain significant trends of increasing values. This lack of agreement in trends demonstrates that the Sun did not play a role during this period." TSI peaks at the high point of the solar cycle, just as the other solar variables do, so no matter what solar variable you look at, it can't have been the cause of recent warming, because these variables showed no upward trend over this period, right? Wrong. That's like saying you can't heat a pot of water by turning the flame to maximum and leaving it there, that you have to turn up the flame sloooooowly if you want the water to heat. It is incredible to see something so completely unscientific in AR5, passing as highly vetted science. And the "flame" DID stay on maximum. Again, there was an 80 year "grand maximum" of solar activity starting in the early 1920's (Usoskin 2007). AR5 is in-effect assuming that the oceans had already equilibrated to whatever temperature forcing effect this high level of solar activity might have. Otherwise the continued temperature forcing from the continued high level of solar activity would have caused continued warming. Claims of rapid ocean equilibration have been made (Schwartz 2007), but they don't stand up to scrutiny. In order to get his result, Schwartz used an energy balance model with the oceans represented by a single heat sink. That is, he assumed that the whole ocean changed temperature at once! Once you move to a 2 heat sink model where it takes time for heat to transfer from one ocean layer to another (Kirk-Davidoff 2009), it becomes clear that the rapid temperature adjustment of the ocean surface tells us next to nothing about how long it takes for the ocean to equilibrate to a long term forcing. The paleo-temperature record is typified by multi-century warming and cooling phases, suggesting that equilibration can easily take centuries, making it ludicrous to assume that the warming effect of a grand maximum that began in the 1920's must have been spent by 1970 or 1980 or by ANY particular date. So no, there is no way to save the utterly incompetent argument in FAQ 5.2 that a solar driver of temperature can only cause warming when it is on the increase. If solar wind pressure or GCR does in some way drive global temperature, there is every reason to believe that it would have continued to warm the planet for as long as solar activity remained at grand maximum levels. There is NO EXCUSE for the IPCC to be omitting these variables, which are much more likely than TSI to be responsible for the high observed degree of correlation between solar activity and climate. For chapter 5 to be tenable, all of the now massive evidence that there is SOME mechanism by which solar activity is driving MOST temperature change must be laid out in full. Technical note: misattribution is assigned manually in AR5, but the concept is the same as for purely statistical omitted variable fraud If TSI and the other solar variables all move roughly together, won't omitting the solar variables other than TSI cause any explanatory power they might have to be attributed to TSI rather than CO2, since they are more closely correlated with TSI? In a purely statistical estimation scheme yes, but the IPCC uses a combination of parameterized elements and estimated elements, and one of the elements that is parameterized is radiative forcings of CO2 and TSI, meaning that their relative warming effects are parameterized as well, with CO2 being assigned 40 times the warming effect of TSI over the 1750 to 2010 period. This parameterization means that the explanatory power of the omitted solar magnetic variables gets attributed forty parts to CO2 for every one part to TSI. This structure forces the misattribution onto CO2. You can think of it a manual assignment of the misattribution.

Expert Review Comments on the IPCC WGI AR5 First Order Draft -- Chapter 5
Do not Cite, Quote or Distribute Page 142 of 157
Comment No
Chapter FromPage
FromLine
To Page
To Line Comment Response
The general concept of the omitted variable remains the same. There is only so much attribution for warming to go around (100%). If attribution is given to the solar-magnetic variables in accordance with the evidence from the historic and paleo records—at least 50%—then there less than 50% that can possibly be attributable to other causes. Which again beings the scientific competence of IPCC into question. If CO2 has 40 times the warming effect of the 50% driver of global temperature (total solar effects), that makes it what? The 2000% driver of global temperature? Chapter 7 inverts the scientific method, using theory to dismiss evidence Where chapter 5 simply pretends that no solar variable other than TSI exists, Chapter 7 doesn't have that option. It is tasked to address directly the possibility that variables like the solar wind and GCR could be affecting climate. But Chapter 7 still comes up with a way to avoid mentioning any of the massive evidence that there must be SOME mechanism by which solar activity is driving climate. Just as it starts to touch on the subject, it jumps instead to examining the tenability of PARTICULAR THEORIES about the mechanism by which solar activity might drive climate. This happens right at the beginning of section 7.4.7.1. "Correlations Between Cosmic Rays and Properties of Aerosols and Clouds." This is on page 7-50, lines 50-53: "Many empirical relationships or correlations have been reported between GCR or cosmogenic isotope archives and some aspects of the climate system, such as SSTs in the Pacific Ocean (Meehl et al., 2009), some reconstruction of past climate (Kirkby, 2007) or tree rings (Dengel et al., 2009). We focus here on observed relationships between GCR and aerosol- and cloud-properties." The first sentence of 7.4.7.1 is as close as AR5 comes to making any mention of overwhelming evidence that there is SOME mechanism by which solar activity drives global temperature. The Kirkby citation suggest some correlation between solar activity and climate, but what the correlation might be is completely obscured, and that's it. The second sentence effects the transition into looking at the evidence for particular theories of the mechanism involved. A short discussion later, the evidence for these particular mechanisms is asserted (quite tendentiously) to be "too weak" for the mechanisms to be "climatically-significant" (page 7-52, lines 33-35). This proclaimed weakness in turn becomes the rationale for omitting the mechanisms from the IPCC's general circulation models, and hence from the projections that are made with those models. What do the AR5 draft authors do with the overwhelming evidence that there is SOME mechanism at work that makes solar magnetic the primary driver of global temperature? So they don't like the particular theories offered. They have to still acknowledge that SOME such mechanism must be at work, don't they? Ahh, but readers don't know about that evidence, because it was skipped over with that single oblique reference to Kirkby 2007, and AR5 continues as if the evidence doesn't exist. They never use it. They never mention it. They never think about it. It is GONE. They declare their dissatisfaction with the available theories for how such a mechanism would work, and use this as an excuse to completely ignore the massive evidence that there is some such mechanism at work. This is an exact inversion of the scientific method, which says that evidence always trumps theory. The IPCC is throwing away the evidence for a solar-magnetic driver of climate because it isn't satisfied with the theories that have been proposed to account for it. This is the DEFINITION of anti-science: putting theory (or ideology, or ANYTHING) over evidence. Evidence has to be the trump card, or its not science. The IPCC is engaged in actual, definitional, anti-science, exactly inverting the scientific method. It is as if a pre-Newtonian "scientist" were to predict that a rock released into the air will waft away on the breeze, because we understand the force that the breeze imparts on the rock, but we have no good theory of
Expert Review Comments on the IPCC WGI AR5 First Order Draft -- Chapter 5
Do not Cite, Quote or Distribute Page 143 of 157
Comment No
Chapter FromPage
FromLine
To Page
To Line Comment Response
the mechanism by which heavy objects are pulled to the ground. We should therefore ignore the overwhelming evidence that there is SOME mechanism that pulls heavy objects to the ground, and until such time as we can identify the mechanism, proceed as if no such mechanism existed. This is what the IPCC is actually doing with the solar-climate evidence. Y'all aren't scientists. You are pure, definitional, ANTI-SCIENTISTS. More anti-science: Chapter 7 repeats the second Chapter 5 error You know, that bit about thinking that a climate driver can only cause continued warming if its own level continues to increase? Chapter 7 says it again: just leaving a proposed climate driver on maximum can't possibly cause warming. From page 7-52, lines 35-37: Moreover it should be noted that one study infers no trend in cosmic ray intensity over the last 50 years (McCracken and Beer 2007). And that's the end of the section, AR5's punctuation mark on why solar activity and GCR should be dismissed as an explanation for late 20th century warming. This is anti-scientific in its own way. Scientists are supposed to be smart. They aren't supposed to think that you have to slowly turn up the flame under a pot of water in order to heat it. You could collect every imbecile in the world together and not a one of them would ever come up with the idea that they have to turn the heat up slowly. It's beyond stupid. It's like, insanely stupid. And multiple chapter-writing teams are proclaiming the same nonsense. Fruitcakes. Okay, I guess that means I'm ready to wrap up. Y'all have taken all these tens of billions of dollars of research money and used it perpetrate a fraud. As I have documented above, you have perpetrated the grandest and most blatant example of omitted variable fraud in history, but so far only the skeptic half the world knows it. You still have a shot, before global cooling is an established fact, to make a rapid turn around and save some shred of your reputations. But if AR5 comes out insisting that CO2 is a dominant warming influence just as global cooling is becoming an established fact, then you all are finished on the spot. You'll still have your filthy lucre, but the tap is going to turn off, and your reputations will be destroyed forever. Can you imagine a worse juxtoposition? And this is what the evidence says is going to happen, ALL of that evidence that you have been so studiously omitting. I'm eager for your embarrassment, but I would much rather see you save yourselves, so that the needed policy reversals can some that much sooner. The anti-CO2 policies that your fraudulent "science" has supported are right now destroying the world economy. You idiots are KILLING our future. Please wake up and try to save your own reputations before your lunatic anti-science ruins us all. End comment [Alec Rawls, United States]
5-1743 5 43 18 43 21 Replace with ”The energy input from the Sun is the main driver of the climate system through the diurnal and seasonal variations. Is it also a main driver for climate change? The answer clearly depends on the timescales involved. Changes in insolation due to well described changes in orbital parameters are dominant drivers for glaciation. Also the evolution of the Sun as star over timescales of billions of years has, and will have dominant effects on climate change. The crucial questions on the short and medium term is whether variations in solar parameters have important impact on observed climate change and if the global heating the last 40 years can be attributed to solar effects?” [Bo Andersen, Norway]
Noted and taken into account in the revised text
5-1744 5 43 18 "The Sun is the main driver of the climate system". It might be more accurate to state that the Sun is the main driver of atmospheric and oceanic dynamics? [Masa KAGEYAMA, France]
Noted and taken into account in the revised text
5-1745 5 43 21 I suggest the phrase "The basis for this answer is presented next" is not required and could be deleted (and this would be consistent with the style of the other WG1 FAQs). [David Wratt, New Zealand]
Noted and taken into account in the revised text
5-1746 5 43 23 43 26 "power" is mentioned here but actually it should be "power per area" [Raimund Muscheler, Sweden] Noted and taken into account in the revised text

Expert Review Comments on the IPCC WGI AR5 First Order Draft -- Chapter 5
Do not Cite, Quote or Distribute Page 144 of 157
Comment No
Chapter FromPage
FromLine
To Page
To Line Comment Response
5-1747 5 43 24 43 24 meter → metre [Peter Burt, UK] Editorial
5-1748 5 43 29 43 29 delete 'etc' [Peter Burt, UK] Noted and taken into account in the revised text
5-1749 5 43 29 43 29 one should add that 30% is "directly" emitted back into space [Raimund Muscheler, Sweden] Noted and taken into account in the revised text
5-1750 5 43 37 43 37 insert comma after 'elliptical' [Peter Burt, UK] Noted and taken into account in the revised text
5-1751 5 43 37 43 37 Is it really the changes in annual insolation that reach 3% ? [Hugues Goosse, Belgium] Noted and taken into account in the revised text
5-1752 5 43 37 42 variations in incoming solar flux related to changes in the Earth's orbit are not only related to changes in the eccentricity of the orbit. Seasonal changes in incoming solar fluxes are much larger than those given in the text (annual means). Variations of obliquity and precession are very important in driving changes in the solar incoming energy flux on times scales of 21 to 40 kyr, this should be stated here. Otherwise, orbital changes in solar fluxes will not be adequately described. [Masa KAGEYAMA, France]
Noted and taken into account in the revised text
5-1753 5 43 40 43 41 Although total annual insolation varies only by 0.2-0.3 W/m^2 - as stated - what really matters for orbitally-driven Pleistocene-Recent climate changes are the local re-distributions of insolation during the year and varying by latitude as driven by the precession- and obliquity-cycles. These are much more important insolation changes than the total annual change because of threshold effects during the year. For example retention of some snow from year-to-year during spring/summer melting depends more on cumulative and threshold seasonal temperatures rather than mean annual temperature. Add a sentence explaining this - this will then tie in with the FAQ summary on p44 line 16. [Graham Weedon, UK]
Noted and taken into account in the revised text
5-1754 5 43 40 43 41 I think you are referring to mean global forcing between an eccentricity max and min; the mean forcing between glacial and interglacial takes all sorts of values, sometimes even negative I think. [Eric Wolff, United Kingdom of Great Britain & Northern Ireland]
Noted and taken into account in the revised text
5-1755 5 43 45 43 45 11-year → 11 year [Peter Burt, UK] Editorial
5-1756 5 43 45 “begin” to “began” [Rob Wilson, United Kingdom of Great Britain & Northern Ireland] Editorial
5-1757 5 43 45 For the benefit of the general reader, perhaps add in brackets "sometimes called the sunspot cycle" after the phrase "11-year activity cycle". [David Wratt, New Zealand]
Noted and taken into account in the revised text
5-1758 5 43 46 43 46 11-year → 11 year [Peter Burt, UK] Editorial
5-1759 5 43 51 43 51 "well defined periodicities up to 2200 years". Really? [Gareth S Jones, UK] Noted and taken into account in the revised text
5-1760 5 43 53 43 53 "ranges"-> "range" [Raimund Muscheler, Sweden] Editorial
5-1761 5 43 56 43 56 insert 'the' after 'affect' [Peter Burt, UK] Editorial
5-1762 5 43 Excellent choice of topics here. In particular; the solar question is frequently raised. People want to know if the modern warming is due to the sun, so focus most strongly on that issue. Exactly what are the known solar cycles, and how exactly do we know that they do NOT explain the recent warming? Probably good to mention, however, that solar variability does seem to correlate with precipitation variability in some regional/local-scale paleo records. Once again, it's worth pointing out that these are not causing the modern changes; the timing of the 11-year, 22-year, 88-year solar cycles simply do not fit what we see going on now. [Jay Curt Stager, United States of America]
Noted and taken into account in the revised text
5-1763 5 43 FAQ 5.2: The FAQ loses structure at the end by reverting to a bullet list. This should be avoided, and a compelling summary paragraph should be provided. [Thomas Stocker/ WGI TSU, Switzerland]
Taken into account in the revised text
5-1764 5 43 FAQ 5.2: Page 44, line 7: Suggest to put the solar radiative forcing in the context of man-made greenhouse forcing provided in W m2, thereby allowing a direct comparison. [Thomas Stocker/ WGI TSU, Switzerland]
Taken into account in the revised text

Expert Review Comments on the IPCC WGI AR5 First Order Draft -- Chapter 5
Do not Cite, Quote or Distribute Page 145 of 157
Comment No
Chapter FromPage
FromLine
To Page
To Line Comment Response
5-1765 5 43 FAQ 5.2, Fig 1: use 106 for panel B, so that single number for all three axis. [Thomas Stocker/ WGI TSU, Switzerland]
Noted and taken into account in the revised text
5-1766 5 43 FAQ 5.2, Fig 1: Remove 'until the sun.....'. It is a bit dramatic in this context and certainly outside the timeframe covered by this IPCC assessment. [Thomas Stocker/ WGI TSU, Switzerland]
Taken into account in the revised text
5-1767 5 44 1 71 24 the papers can be more equilibrated, the list is somehow biased [Gerrit Lohmann, Germany] Noted and taken into account in the revised text
5-1768 5 44 4 I suggest expanding "GHG" to "greenhouse gases" for the benefit of the general reader. [David Wratt, New Zealand]
Noted and taken into account in the revised text
5-1769 5 44 6 I suggest expanding "GHG" to "greenhouse gases" for the benefit of the general reader. [David Wratt, New Zealand]
Noted and taken into account in the revised text
5-1770 5 44 12 44 13 The bullet point regarding the 4.6 billion year history of solar variability is irrelevant to the real question being asked about sun-climate connections; people aren't asking about 4.8 billion years ago when they ask this kind of question. I'd leave it out. Furthermore, the second bullet does not relate to solar variability at all; it has to do with orbital cycles of the Earth and hemispherically asymmetric insolation changes, not energy output variations in the sun. Leave it out adn stick to the main point here. [Jay Curt Stager, United States of America]
Noted and taken into account in the revised text
5-1771 5 44 17 44 24 Comment on text: There is a second reason for this inconclusive conclusion: decadal and multi-decadal changes in the solar spectral variability (and not just the TSI) are still badly known and could provide a another leverage of the solar variability on climate, e.g.[ J. D. Haigh, A. R. Winning, R. Toumi, and J. W. Harder, An influence of solar spectral variations on radiative forcing of climate, Nature, 467 (2010), pp. 696–699.] [Thierry Dudok de Wit, France]
Noted and taken into account in the revised text
5-1772 5 44 23 44 23 "...may end in the next 11-22 years" requires a reference [Tasman van Ommen, Australia] Noted and taken into account in the revised text
5-1773 5 44 25 44 28 “No, in terms of being a driver for the climate trends over the past 40 years, because neither the TSI nor the SSI show positive trends; whereas records for global temperature as well as GHG concentrations show clear and correlated positive trends. The lack of agreement excludes that solar changes have had a domination effect over the period. At the finest levels the TSI may even have shown a slight negative trend over the period, thereby possibly having had negative effect on the heating” [Bo Andersen, Norway]
Noted and taken into account in the revised text
5-1774 5 44 25 44 28 8.3.1.1.1 claims there is a significant decline in solar irradiance over the satellite era (albeit less than 40 years). This should be mentioned/linked to. [Gareth S Jones, UK]
Noted and taken into account in the revised text
5-1775 5 44 30 Axis labels for FAQ 5.2 Figure 1: For the benefit of the general reader I suggest not using scientific notation (10^x years) on the x-axis numbering. For Figure 1(a) I suggest replacing [10^9 yr] with [billions of years]. For figure 1(b) there is room to gove the x-axix numbers in full, ie: -1,000,000; -500,000, ... . For figure 1(c) the x-axis nubers could also be given in full, ie -8,000; -6,000; -4,000; ... [David Wratt, New Zealand]
Noted and taken into account in the revised text
5-1776 5 44 Other common FAQs to consider answering here could include: "Will global warming trigger another ice age?" "Is today's warming too fast to be due to natural causes?" "Is the well-known Hockey Stick version of the last millennium's temperature history now discredited or is it still valid?" "What were the most extreme greenhouse gas warming scenarios of the past, and could we exceed them as a result of our activities in modern times?" "How do we know for sure that today's warming is due mostly to human activity rather than natural cycles?" [Jay Curt Stager, United States of America]
Noted and taken into account in the revised text
5-1777 5 45 71 I had no time to check the references / bibliography [Bernard De Saedeleer, Belgium] Editorial
5-1778 5 47 33 36 Bozbiyik et al: this reference is given twice [Masa KAGEYAMA, France] Editorial
5-1779 5 52 27 52 35 The same article by Ge et al. (2010) is included twice. [Fredrik Charpentier Ljungqvist, Sweden] Editorial
5-1780 5 54 8 9 Should be; Hargreaves, J.C., A. Abe-Ouchi, and J.D. Annan [Julia Hargreaves, Japan]
Noted and taken into account in the revised text

Expert Review Comments on the IPCC WGI AR5 First Order Draft -- Chapter 5
Do not Cite, Quote or Distribute Page 146 of 157
Comment No
Chapter FromPage
FromLine
To Page
To Line Comment Response
5-1781 5 55 1 55 2 reference incomplete [Suzanne Leroy, UK] Noted and taken into account in the revised text
5-1782 5 56 12 56 14 Kemp et al was published in early 2011: Kemp, A.C., Horton, B.P., Donnelly, J.P., Mann, M.E., Vermeer, M., Rahmstorf, S., Climate related sea-level variations over the past two millennia, Proc. Nat. Acad. Sci., 108, 11017-11022, 2011 [Michael Mann, USA]
Editorial
5-1783 5 57 29 There is a typographical error in this line. [Fredrik Charpentier Ljungqvist, Sweden] Noted and taken into account in the revised text
5-1784 5 61 31 An accent is missing on the “e” in Karlén. [Fredrik Charpentier Ljungqvist, Sweden] Editorial
5-1785 5 62 60 There is a typographical error in this line. [Fredrik Charpentier Ljungqvist, Sweden] Editorial
5-1786 5 67 2 Part of the Stager et al 2011 citation is missing: it is Science 331:1299-1302. [Jay Curt Stager, United States of America]
Editorial
5-1787 5 72 72 Table 5.1. : "least an order of / magnitude" in the last column, 3rd bullet : delete the carriage return [Bernard De Saedeleer, Belgium]
Editorial
5-1788 5 72 72 Table 5.1. column "Limitations": "successfully reconstruct" : give a reference? [Bernard De Saedeleer, Belgium]
Noted and taken into account in the revised text
5-1789 5 72 75 You don't mention the issue of seasonal biases for any proxies. What season's temperature deos each proxy represent? This can be a cause of error and interproxy discrepancy. [Eric Wolff, United Kingdom of Great Britain & Northern Ireland]
Accepted and Taken into account in revised text
5-1790 5 72 delete 'and' after B(OH)4- in the first bullet of the assumptions column of Boron isotopes [Elie Verleyen, Belgium]
Accepted in revsied text
5-1791 5 73 73 Table 5.1. pay attention that the header of the Table is missing on this page. [Bernard De Saedeleer, Belgium] Accepted in revsied text
5-1792 5 73 Table 5.1. Firt row, last column. The method "carbon isotoped in soil carbonate and organic matter" seems to have a lower confidence in most of its assuptioms compared to the other methods. This issue should be mentioned in the main text and estimates from this method should be cited with caution. [Yueh-Hsin Lo, Taiwan R.O.C.]
Noted
5-1793 5 73 Table 5.1. Second row, fourth colum. The assumption that short-term response is the same as the evolutionary response is very difficult to test, and it could be contested. Estimates from this method should be cited cautiously, and the assumption should be better supported in this table. [Yueh-Hsin Lo, Taiwan R.O.C.]
Noted
5-1794 5 73 should read paleosoil (second last bullet of assumptions column of carbon isotopes [Elie Verleyen, Belgium] Accepted in revsied text
5-1795 5 73 You say stomata have been used to reconstruct g-ig changes successfully. This surprising statement needs a reference. I think one needs to mention some of the holocene studies which suggest CO2 changes that are not at all supported by ice core data. This section seems to give much more credence to stomata than I think a bald assessment would support. [Eric Wolff, United Kingdom of Great Britain & Northern Ireland]
Accepted in revsied text
5-1796 5 74 Table 5.2: Line 2 column 4 (Limitations of d18O of mixed-layer planktonic foraminifera). Another limitation is missing in this table: the vital effect of extinct species that is not always constrained. [CATHERINE BELTRAN, France]
Accepted in revsied text
5-1797 5 74 Table 5.2: Line 3 column 4 (Limitations of Mg/Ca of mixed-layer planktonic foraminifera). The effect of dissolution of the foraminifera shells and the amount of gametogenic calcite have a strong influence (bias) on the Mg/Ca SSTs reconstructions and shouldn't be ignored [CATHERINE BELTRAN, France]
Accepted in revsied text
5-1798 5 74 Table 5.2: What about the clumped isotopes? Eventhough it's a new proxy, it is powerful [CATHERINE BELTRAN, France]
Noted. Emerging information currently restricuted to single points which do not yet allow to assess large scale temperature anomalies, which are assessed in this chapter.

Expert Review Comments on the IPCC WGI AR5 First Order Draft -- Chapter 5
Do not Cite, Quote or Distribute Page 147 of 157
Comment No
Chapter FromPage
FromLine
To Page
To Line Comment Response
5-1799 5 74 Mg/Ca, 2-5%/10 Myr, not myr [Eric Wolff, United Kingdom of Great Britain & Northern Ireland] Accepted in revsied text
5-1800 5 75 75 Table 5.2: in microfossil census modern analogue techniques: specify that dinocyst assemblages are also used to reconstruct sea-surface temperatures. [Sophie Bonnet, Canada]
Accepted in revsied text
5-1801 5 75 75 Table 5.1. pay attention that the header of the Table is missing on this page. [Bernard De Saedeleer, Belgium] Accepted in revsied text
5-1802 5 76 11 I suggest to add the most recent estimate as well. This can be found in Whitehouse et al. (2012). A deglacial model for Antarctica: geological constraints and glaciological modelling as a basis for a new model of Antarctic glacial isostatic edjustment. Quaternary Science Reviews (published online) [Elie Verleyen, Belgium]
Noted and taken into account in the revised text
5-1803 5 77 4 77 4 Precise somewhere at the beginning of the § if sea levels are indirectly determined by ice volume proxies (and give references) ? It seems independent but sometimes it is not clear [Bernard De Saedeleer, Belgium]
Noted and taken into account in the revised text
5-1804 5 77 28 should be -1 [Elie Verleyen, Belgium] Noted and taken into account in the revised text
5-1805 5 78 It is strange to have the title again, but I guess it is a constrain coming from the full AR5 [Bernard De Saedeleer, Belgium]
Noted and taken into account in the revised text
5-1806 5 79 1 79 3 Here and in other places, authors should avoid using absolute TSI (since that is likely to be revised). Use anomalies from PMOD (i.e. scale all values by 1361/1366 and minus 1361 W/m2). [Gavin Schmidt, USA]
Noted and taken into account in the revised text
5-1807 5 79 2 79 3 Show and identify in Fig. 5.1b the ”strong” and ”weak” solar forcings used for Fig. 5.7. [Anders Moberg, Sweden]
Noted and taken into account in the revised text
5-1808 5 79 7 79 9 It should be mentioned that (I am sure) most peaks have not been tested isotopically for stratospheric origin, so the lack of a marker for this is absence of evidence not evidence of absence. [Eric Wolff, United Kingdom of Great Britain & Northern Ireland]
Noted and taken into account in the revised text
5-1809 5 79 9 76 9 I suggest to cite: PALSEA, 2009: The sea-level conundrum: case studies from palaeo-archives, Journal of Quaternary Science, DOI: 10.1002/jqs.1270 [Mark Siddall, UK]
Noted and taken into account in the revised text
5-1810 5 79 11 79 11 The Lean et al. 1995 reference in the references (5-58) is incorrect. It should be Lean, Beer and Bradley, GRL, 1995, doi:10.1029/95GL03093. Are you sure the reconstruction is from that reference and not a later Lean reference (there are differences)? [Gareth S Jones, UK]
Noted and taken into account in the revised text
5-1811 5 79 13 79 13 Fig. 5.1. - caption : "has been added artificially to the original data." : why ? [Bernard De Saedeleer, Belgium] Noted and taken into account in the revised text
5-1812 5 79 17 79 18 Legend of Figure 5.1 d): This legend is incomplete and should rather state what is actually shown, i.e. "Modulus of wavelet transform (Torrence and Compo, 1998) of the TSI, using Morlet wavelets". Note that this figure suffers from several problems. First, the colour scaling does not even allow to see the perdiocity of the solar cycle. Second, this figure does not provide any convincing evidence at all of the sharp periodicities that are mentioned in the text. To me, this is an example of a figure that is useless because its potential is not exploited at all. To reveal periodicities, a plot of the power spectral density would suffice. [Thierry Dudok de Wit, France]
Noted and taken into account in the revised text
5-1813 5 79 17 79 18 The parenthesis with periodicities (87, 104, …) should be deleted as these numbers do not follow from inspection of Fig. 5.1d. Write instead something about what Fig. 5.1d really shows. [Anders Moberg, Sweden]
Noted and taken into account in the revised text
5-1814 5 79 18 79 22 This section misunderstands the Red Sea oxygen isotope record. As a marginal basin the planktic isotope record is sensitive to sea-level change because there is a factor of 1000 change in the cross section of the strait over the glacial to interglacial range. This is very different to benthic isotopes which respond to changes in isotopes due to growth of ice sheets. The Red Sea work is entirely independent of the benthic isotopes. See Siddall et al 2008 RoG but best description of the method is: Siddall, M., Rohling, E. J., Smeed, D.A., Hemleben, Ch., Meischner, 2004: Understanding the Red Sea response to sea level, Earth and Planetary Science Letters, 225, 421-434 [Mark Siddall, UK]
Notes. Will be clarified in SOD.H1828
5-1815 5 79 79 An explanatory diagram or two could help here [Mark Siddall, UK] Noted and taken into account in the revised text
Expert Review Comments on the IPCC WGI AR5 First Order Draft -- Chapter 5
Do not Cite, Quote or Distribute Page 148 of 157
Comment No
Chapter FromPage
FromLine
To Page
To Line Comment Response
5-1816 5 79 Figure 5.1a: Please, also include the TSI reconstruction by Shapiro et al. (2011). [Fredrik Charpentier Ljungqvist, Sweden]
Noted and taken into account in the revised text
5-1817 5 79 Fig. 5.1. For an easier comparison, superimpose the yellow part of the blue curve c) onto b) ? [Bernard De Saedeleer, Belgium]
Noted and taken into account in the revised text
5-1818 5 79 Fig. 5.1.d : add a colorscale ? [Bernard De Saedeleer, Belgium] Noted and taken into account in the revised text
5-1819 5 79 Fig 5.1 What do the colours represent in panel d? [Gareth S Jones, UK] Noted and taken into account in the revised text
5-1820 5 79 fig5.1 Include The recommended CMIP5 TSI reconstruction in Panel b. (Lean JL, calculations of solar irradiance: available at http://sparcsolaris.gfz-potsdam.de/input_data.php). [Gareth S Jones, UK]
Noted and taken into account in the revised text
5-1821 5 79 Fig 5.1: what is the yellow bar on plot c? what is the colour scale for plot d? [Masa KAGEYAMA, France] Noted and taken into account in the revised text
5-1822 5 79 Figures general: It can be confusing when figures have different time scales between panels (e.g. Fig 5.2). When this is unavoidable, we suggest to make these differences very clear to avoid confusion. [Thomas Stocker/ WGI TSU, Switzerland]
Noted
5-1823 5 79 Figures general: Chapter 5 contains some very long figure captions. As a general principle, avoid giving any assessment and interpretation within the captions. Keep captions strictly explanatory. [Thomas Stocker/ WGI TSU, Switzerland]
Noted
5-1824 5 80 1 81 15 This Figure should present only those records that the community has the greatest confidence in. I realize that it is based on Beerling & Royer 2011 for simplicity, but instead of adding the data of Pearson & Palmer 2000, I would recommend to remove those data and also remove the data of Tripati et al. 2009. While Pearson and Palmer’s data set was a landmark paper in 2000, we now know a lot more about the d11B proxy and the use of the same calibration curve for various different foraminifer species is simply not appropriate (e.g. summary of empirical calibrations in Hönisch et al., GCA 2007; but also Foster, EPSL 2008). In addition, the d11B-seawater estimates used by Pearson & Palmer 2000 are extremely questionable for times >30 Ma, as borne out by comparisons with model estimates (Lemarchand et al. 2000), estimates used for the E/O boundary by Pearson et al. 2009, and new estimates based on boron isotopes in benthic foraminifers (Hönisch & Raitzsch, Geology, in review). I would therefore recommend extreme caution with this record. Given all reservations and that it deviates greatly from other estimates, I would recommend not to include it in this Figure. [Baerbel Hoenisch, USA]
Noted - but we do not feel there is enough community consensus with the various proxies to cherry pick one proxy dataset over another, We have assessed the assumptions involved in table 5.2. Tripati dataset is removed.
5-1825 5 80 1 81 15 I also strongly recommend to remove the B/Ca estimates of Tripati et al. 2009 from this record, as they are based on an erroneous use of the correlation between the apparent Boron partition coefficient into foraminifer shells and temperature, where temperature essentially drives the CO2 reconstruction but it is independent of the B/Ca proxy. This problem is described in a manuscript by my student Katherine Allen and myself, which is currently in revision in EPSL. While I realize that those decisions would have to be made based on unpublished data, the evidence is overwhelming and I would be happy to provide figures that demonstrate the issues surrounding the d11B-seawater estimates and the B/Ca estimates. For the sake of simplicity, I would recommend to use Beerling & Royer’s 2011 Figure excluding the B/Ca record, and not adding the Pearson & Palmer data. Consequently, the description of uncertainties of the boron isotope estimates in Line 22/23 in Section 5.2.2.2 can then also be removed. [Baerbel Hoenisch, USA]
Accepted - Tripati dataset is removed.
5-1826 5 80 1 81 15 Figure caption: [Baerbel Hoenisch, USA] Noted
5-1827 5 80 1 81 15 Line 4: “Blue line” should be green [Baerbel Hoenisch, USA] Accepted in revised text
5-1828 5 80 1 81 15 Line 5: Delete “d11B” [Baerbel Hoenisch, USA] Accepted in revised text
5-1829 5 80 1 81 15 Line 9/10: delete reference to Pearson & Palmer, if the data end up being removed from the figure [Baerbel Hoenisch, USA]
Noted see above 1825
5-1830 5 80 5 80 6 Fig. 5.1. - caption : "sea level (purple)" : where is that curve ? - LR05: is it really SL or ice volume or ocean T° Noted - it's a calibration of the d18O curve to sea-level

Expert Review Comments on the IPCC WGI AR5 First Order Draft -- Chapter 5
Do not Cite, Quote or Distribute Page 149 of 157
Comment No
Chapter FromPage
FromLine
To Page
To Line Comment Response
(all the 3??) ? [Bernard De Saedeleer, Belgium]
5-1831 5 80 5 Replace word "Earths" with "Earth's" [Dunia H. Urrego, France-USA] Accepted in revised text
5-1832 5 80 Fig. 5.2: Top panel x-axis needs to be labeled. [Alan Robock, USA] Accepted in revised text
5-1833 5 81 3 81 3 Fig. 5.1. - caption : replace "Tropical sea surface temperature" by "Tropical sea surface temperature (black)" ? [Bernard De Saedeleer, Belgium]
Accepted in revised text
5-1834 5 81 3 81 3 Fig. 5.1. - caption : "has been added artificially to the original data." : why ? [Bernard De Saedeleer, Belgium] Noted and clarified in SOD.
5-1835 5 81 4 81 4 Fig. 5.1. - caption : "EPICA Dome C ice core (blue line; " : there is no blue line on that plot - is it the green one ? [Bernard De Saedeleer, Belgium]
Accepted in revised text
5-1836 5 81 4 "blue line" looks green to me [Eric Wolff, United Kingdom of Great Britain & Northern Ireland] Accepted in revised text
5-1837 5 81 8 should read compiled(?) Sentence is not correct as well [Elie Verleyen, Belgium] Accepted in revised text
5-1838 5 81 9 81 9 Fig. 5.1. - caption : "(see for details") : see what ? [Bernard De Saedeleer, Belgium] Accepted in revised text
5-1839 5 81 14 15 indicate dates for the Eocene and mid Pliocene in the legend or add period names on the graph [Masa KAGEYAMA, France]
Accepted in revised text
5-1840 5 82 4 82 4 Fig. 5.3. - caption : "climate model output" : which model ? Perhaps say "multi-model mean output" or something like that ? [Bernard De Saedeleer, Belgium]
Accepted in revised text
5-1841 5 82 6 82 6 Fig. 5.3. - caption : "top row" : a bit confusing, as the Figure is oriented in an unusual direction [Bernard De Saedeleer, Belgium]
Noted
5-1842 5 82 83 Mention in caption how sure you are the data cover the same time slice as the model runs. [Eric Wolff, United Kingdom of Great Britain & Northern Ireland]
Noted
5-1843 5 82 Fig. 5.3 : please explain (preferably in the text @Box 5.1) why there are black min & red maxima @ poles ? Black is not an amplification then? [Bernard De Saedeleer, Belgium]
Noted this is due to the effect of sea ice on SST gradients and is explained in text.
5-1844 5 82 Fig. 5.3 : the order of the sub-Figs e > .. > a is quite unusual : invert a > b > .. > e ? [Bernard De Saedeleer, Belgium]
Noted.
5-1845 5 82 Fig 5.3: on plots b and d, to really compare to data, why not plot min and max along each latitude line, rather than 2*standard deviations? [Masa KAGEYAMA, France]
Noted
5-1846 5 82 Fig. 5.3: Left column: If white means no data, it has to be represented differently, because the scale makes it look like values near 0C. [Alan Robock, USA]
Accepted
5-1847 5 83 1 "preindustrial value" - give precise years for averaging. [Alan Robock, USA] Accepted in revised text
5-1848 5 83 2 zonal means have been computed only for the model, have they not? [Masa KAGEYAMA, France] YES and Noted in revised text
5-1849 5 83 5 83 5 Fig. 5.3. - caption : "zonal plots" : why use this zonal average ? Please comment/explain. [Bernard De Saedeleer, Belgium]
We had along discussion over this and have decided to zoanllly average the model ouput and plot site specific temperatures for the data because of the biased nature of data density
5-1850 5 83 9 SSTs in grey? SAT in red? [Masa KAGEYAMA, France] Noted
5-1851 5 83 13 83 16 Fig. 5.3. - caption : references are given for some models, but not for all : give for all ? [Bernard De Saedeleer, Belgium]
Accepted in revised text
5-1852 5 83 15 83 15 Roberts et al. 2011 (PALEOCEANOGRAPHY, VOL. 26, PA4203, doi:10.1029/2010PA002025) is a better Accepted in revised text

Expert Review Comments on the IPCC WGI AR5 First Order Draft -- Chapter 5
Do not Cite, Quote or Distribute Page 150 of 157
Comment No
Chapter FromPage
FromLine
To Page
To Line Comment Response
reference for the GISS Paleogene experiment than Roberts et al. (2009). The later paper has a better description of the simulated Eocene/Paleocene climatology and prescribed boundary conditions. (Although it depends on what experiment has been included in the comparison plots. If it is the 'closed' scenario from 2009, the existing reference is fine, although much of what is in the 2011 paper still applies...) [Chris Roberts, Uk]
5-1853 5 84 6 "climate feedback parameter" - why are the values negative? A positive radiative forcing produces warming, so the values have to be positive, as they are in panels b and d. [Alan Robock, USA]
Taken into account - Here, the positive feedback is represented by positive values, following the AR4 Fig.8.14. The values in the revised plot is now represented by temperature change to facilitate the understanding (Fig. 5.4a). Fig. 5.4d (Fig. 5.4b in the revised MS) does not include the so-called Planck response, which is a large negative (about -3.3 W/m**2/K), and that is why "All" is positive. The additional explanation is now added in the caption.
5-1854 5 84 6 "stratosphere-adjusted radiative forcing" - In Chapter 7 we are using new terminology, and the default includes not just stratosphere adjustment, but also fast tropospheric adjustment. Please change this to be consistent. [Alan Robock, USA]
Rejected - We had discussions with several LAs in other chapters on the radiative forcing and decided that the LGM RF should be calculated as stratosphere-adjusted forcing without tropospheric adjustments.
5-1855 5 84 8 "c) zonal mean surface air temperature change" - what are the three lines? [Alan Robock, USA] Taken into accout - They indicated mean and +/-1 standard deviation, but the figure is removed.
5-1856 5 84 13 84 13 Fig. 5.4. - caption : "Also plotted are the one-to-one lines." : what is the conclusion if we are near/above/below this line ? [Bernard De Saedeleer, Belgium]
Noted - If we are above the line, that means the climate sensitivity for 2xCO2 estimated solely by reconstructed LGM climate change is most likely overestimated, and if below the estimated value is underestimated. If all data are near, then the climate sensitivity for 2xCO2 is likely well estimated by the LGM climate change information.
5-1857 5 84 Fig 5.4, legend "climate feedback parameter" and "shortwave feedback parameter" have to be explained [Masa KAGEYAMA, France]
Taken into accout - They are now explained in the caption.
5-1858 5 84 Fig 5.4: very difficult to distinguish between the black and blue colors [Masa KAGEYAMA, France] Taken into accout - The colors are changed for better visibility.
5-1859 5 84 Fig 5.4: Combines too many different variables into one figure. Consider separating into multiple figures. [Thomas Stocker/ WGI TSU, Switzerland]
Taken into accout - all figures now represent temperature change but one which shows climate feedbacks.
5-1860 5 84 I tried hard but in the end I simply could not understand this caption and what the figure is showing. Please explain more clearly. [Eric Wolff, United Kingdom of Great Britain & Northern Ireland]
Taken into accout - The figure is now improved by representing many variables in terms of temperatrue change. The explanation for the feedback parameter is also added.
5-1861 5 85 4 85 4 Fig. 5.5. - caption : "a) Maximum summer insolation" : why "Maximum" ? [Bernard De Saedeleer, Belgium] Noted. This dataset is no more depicted in the revised figure.
5-1862 5 85 4 85 4 Fig. 5.5. - caption : "a) Maximum summer insolation" : why "Maximum" ? [Bernard De Saedeleer, Belgium] Noted. This dataset is no more depicted in the revised figure.
5-1863 5 85 4 Does maximum mean midsummer (day)? [Eric Wolff, United Kingdom of Great Britain & Northern Ireland] Noted. This dataset is no more depicted in the revised figure.
5-1864 5 85 7 85 7 Fig. 5.5. - caption : replace "e) the of Antarctic" by "e) the Antarctic" [Bernard De Saedeleer, Belgium] Accepted

Expert Review Comments on the IPCC WGI AR5 First Order Draft -- Chapter 5
Do not Cite, Quote or Distribute Page 151 of 157
Comment No
Chapter FromPage
FromLine
To Page
To Line Comment Response
5-1865 5 85 10 85 10 Fig. 5.5. - caption : "reconstructed" : from which data ? [Bernard De Saedeleer, Belgium] Noted. Caption has been modified.
5-1866 5 85 13 85 14 Fig. 5.5. - caption : "short/long-dashed and dotted lines" : we do not clearly see the differences on the plot [Bernard De Saedeleer, Belgium]
Noted. Panels have been expanded.
5-1867 5 85 13 85 14 Not all the dashed lines are visible on these figures, may need better drawing or different symbols. [Eric Wolff, United Kingdom of Great Britain & Northern Ireland]
Noted. Panels have been expanded.
5-1868 5 85 13 85 14 You don't include Holden et al (2010 CP and 2011 JQS) who also did an 800 ka run (GENIE) and calculated some of these values.; for Greenland temperature did you think of including the derived calculations of Barker et al 2011 (Science)? I can see arguments for and against but it should be considered. [Eric Wolff, United Kingdom of Great Britain & Northern Ireland]
Noted. A new figure shows results from Barker et al (2012) regarding millennial variability.
5-1869 5 85 14 "change of the time scale at 140 ka" - I find this confusing. It would be better to continue the values in the left panel all the way to the present, and then still keep the blow-up panel on the right. It would be very useful to have a complete time series of all these values from 800 ka to the present on one graph with no change in time scale. [Alan Robock, USA]
Rejected. The expansion on the last climatic cycle allows to better see the model data comparison.
5-1870 5 85 Fig 5.5: difficult to distinguish the different model results but maybe that's not too important for the message of this figure? [Masa KAGEYAMA, France]
Noted. Figure has been revised.
5-1871 5 85 explain why Laskar 2004 is used for Fig 5.2 and Berger and Loutre for Figure 5.5. This can be misleading for people who do not know these datasets [Masa KAGEYAMA, France]
Noted. Orbital parameters are not shown any more in Fig. 5.2
5-1872 5 85 Fig 5.5: Models are hard to detect in the figure, please increase the visibility of the corresponding line plots. [Thomas Stocker/ WGI TSU, Switzerland]
Noted. Figure has been revised.
5-1873 5 86 4 86 4 Fig. 5.6. - caption : "Model-data comparison" : I do not see how we could compare the model and the data on the basis of these figures, as (top) seems annual and (bottom and middle) are seasonal : impossible to compare different quantities ? [Bernard De Saedeleer, Belgium]
Noted. Including annual and JJA plots was confusing. Figure has been revised
5-1874 5 86 5 86 5 Fig. 5.6. - caption : "Turney and Jones (2010) and McKay et al. (2011)." : if possible, separate both estimates (squares and circles) instead of circles only. [Bernard De Saedeleer, Belgium]
Noted and taken into account in the revised text
5-1875 5 87 1 87 2 In Fig. 5.7d, the black curves can be changed to either red or blue, depending on whether they are associated with ”strong” or ”weak” solar forcing. It will then be necessary to choose another colour for the curve that represent volcanic forcing. [Anders Moberg, Sweden]
Rejected - the figure is already complex and adding further information might distract reader
5-1876 5 87 1 87 4 Figure 5.7a is extremely misleading because the recent warming has been truncated, which gives a false appearance of similarity between past and recent warmth. As I'm certain it is not the intent of the authors to provided a distorted picture, please fix this plot so that it shows the full extent of modern warming (i.e. both the observed and modeled warming through the first decade of the 21st century). Please show the instrumental record through 2010, appropriately smoothed, for comparison. Judging from where the vertical axis has been truncated, the vertical axis probably has to be extended more than +0.5C to display the full range of variation shown by the data. [Michael Mann, USA]
Accepted - the purpose of FOD Figure 5.7 was not to compare modern temperatures with earlier warmth and the instrumental record could not be included because of the reference period. However we added a new figure which shows the reconstructions and instrumental data, using data through to 2011 (SOD Figure 5.8).
5-1877 5 87 1 87 4 Panels b and c of Figure 5.7a substantially obscure a recently discovered very important bias that exists for large eruptions. Model simulations (GCM simulations and simple energy balance models driven by the full range of estimated volcanic and solar forcing) predict significantly greater than 1.5C Northern Hemisphere mean cooling relative to the 1961-1990 reference period for several years following each of the 3 largest volcanic forcing episodes (AD 1258, AD 1453, and AD 1809+1815) of the past millennium. For AD 1258, the cooling response is roughly 2.5C. Annually-resolved tree-ring reconstructions (e.g. the D'Arrigo et al '06 reconstruction) however never show more than 1C cooling relative to the modern reference period. In the case of AD 1258 there is no evidence of cooling in the years immediately following the eruption, and a greatly muted cooling (roughly 1C relative to modern reference period) occurs at a delay of several years. A similar story is found for the 1815 eruption. This is all described by Mann et al (2012) [Mann, M.E., Fuentes, J.D., Rutherford, S., Underestimation of Volcanic Cooling in Tree-Ring Based Reconstructions of Hemispheric Temperatures, Nature Geosciences (in press)] who reproduce this behavior theoretically as a consequence of
Taken into account - the figure has not been modified but Mann et al. (2012) fnding is considered in the text.

Expert Review Comments on the IPCC WGI AR5 First Order Draft -- Chapter 5
Do not Cite, Quote or Distribute Page 152 of 157
Comment No
Chapter FromPage
FromLine
To Page
To Line Comment Response
artifacts of the biological growth response to very large eruptions for trees--such as used in most reconstructions--at the boreal or alpine treeline. This problem can clearly be seen in Figure 5.7bc--note how the reconstructed cooling is both underestimated and smeared/delayed relative to the modeled cooling--precisely as predicted by Mann et al (2012). However, by only showing the average response to many eruptions (most of which are quite small) rather than the specific response to very large eruptions, the figure actually tends to hide the problem. Chapter 10 of FOD notes the potential impact of this bias. [Michael Mann, USA]
5-1878 5 87 1 87 4 On closer inspection, there are some problematic details with the comparison in Figure 5.7e, namely a serious "apples and oranges" problem. This is most easily seen in the comparison of the two different Mann et al (2008) EIV reconstructions. These differ in amplitude only because Mann et al (2008) find a larger difference in land-only temperature than in land+ocean, something that is hardly surprising given that SST tends to change less than land air temperatures on most timescales, and in response to most forcings. So in this case, what might look like a discrepancy in the estimates to a casual reader actually has to do with the fact that the two reconstructions are physically measuring two different quantities (in fact, the Mann et al 2009 spatial pattern shows why this is the case--the reconstructions appear to show cool SSTs over a large part of the tropics during the MCA which reduces the amplitude of the difference relative to the extratropics and relative to land only). This calls into question the entire figure, and whether or not the authors of this section have accounted for the fact that different reconstructions attempt to reconstruct different sub-regions of the Northern Hemisphere both with regard to land vs. ocean, but also latitudinal ranges (e.g. full NH vs. extratropics only). There are physical reasons for why the amplitude of temperature change should vary depending on the regions represented. It is unclear that the authors of this section have in any way dealt with this problem, other than casually acknowleding in the figure caption that this fundamental problem in the comparison exists. [Michael Mann, USA]
Taken into account - the new SOD Figure 5.8 shows individual reconstructions and distinguishes their geographical domains via different colours, we also add a further note to the text about the effect of different domains on the volcanic response, and provide a detailed table in the Appendix. The reviewer points to an issue that is not easy to solve in one figure, except by removing some reconstructions and focussing on one domain (e.g. land-only), but with the loss of other information.
5-1879 5 87 2 87 6 panel e) and f) ! The forcing is quite different, e.g. in CO2. Is the EGMAM model included? [Gerrit Lohmann, Germany]
Taken into account - appendix list models and forcings
5-1880 5 87 6 87 6 Fig. 5.7. - caption : "stronger/weaker" : by how much ? [Bernard De Saedeleer, Belgium] Accepted - text provides clearer explanation and appendix gives details of forcings
5-1881 5 87 Figure 5.7(a): Because the green shaded area (reconstructions) shows shading of varying intensity, it is difficult to discern the spread of reconstructions. For what it is worth, the Pollack & Smerdon (2004) reconstruction coordinates (referenced to its 1500-1850 mean) are +0.954K at year 2000, +0.365K at year 1900, +0.127K at year 1800,-0.008 at year 1700, -0.071K at year 1600, and -0.089 at year 1500. This reconstruction lies very close to the bold red line (apparently not defined in the caption, but presumably a 'mid-strength' solar forcing simulation) throughout the entire range of the P&S 2004 reconstruction. The logic of using the 1500-1850 mean as a reference level is not apparent in either the text or the figure caption. For simulations it may make no difference, but for most proxy reconstructions that interval is outside the proxy calibration interval, and therefore the reconstructions are probably less well constrained and perhaps less suited for establishing a reference level. [Henry Pollack, USA]
Noted. The new version of the text incorporates a Figure where reconstructions are shown relative to the calibration period and a figure of comparison with simulations where they are both compared with reference to 1500-1850 AD. In the first case the figure can be interpreted as truly reconstruction uncertainties. The second figure is intends to illustrate the spread in a manner that allows for comparison with model simulations. Explanations will be included in the text with regard to this issue.
5-1882 5 87 Fig 5.7: Current figure combines reconstructions with simulations, and we would encourage a more specific and comprehensive treatment of the data reconstructions is provided. We therefore suggest an additional figure similar to Fig 6.10 (AR4) which would then serve to complement the top panel of fig 5.7. [Thomas Stocker/ WGI TSU, Switzerland]
Accepted - new SOD figure 5.8.
5-1883 5 88 4 88 4 Fig. 5.7. - caption : please explain better what is inside the ( ) [Bernard De Saedeleer, Belgium] Taken into account - caption revised
5-1884 5 88 5 88 5 Fig. 5.7. - caption : replace "d)" by "c)" [Bernard De Saedeleer, Belgium] Editorial
5-1885 5 88 5 88 5 panel c) ! [Gerrit Lohmann, Germany] Editorial
5-1886 5 88 5 88 6 d and f should surely be c and d [Eric Wolff, United Kingdom of Great Britain & Northern Ireland] Editorial
5-1887 5 88 5 6 is it c) instead of d) and d) instead of f)? [Masa KAGEYAMA, France] Editorial
Expert Review Comments on the IPCC WGI AR5 First Order Draft -- Chapter 5
Do not Cite, Quote or Distribute Page 153 of 157
Comment No
Chapter FromPage
FromLine
To Page
To Line Comment Response
5-1888 5 88 5 Change "d)" to "c)" [Alan Robock, USA] Editorial
5-1889 5 88 6 88 6 Fig. 5.7. - caption : replace "f)" by "d)" [Bernard De Saedeleer, Belgium] Editorial
5-1890 5 88 6 change "f)" to "d)" [Alan Robock, USA] Editorial
5-1891 5 88 8 88 8 Fig. 5.7. - caption : "during the solar composite": what do you mean by this ? [Bernard De Saedeleer, Belgium] Accepted - caption revised and explanation in the main text
5-1892 5 88 8 88 8 Fig. 5.7. - caption : "during the solar composite": what do you mean by this ? [Bernard De Saedeleer, Belgium] Accepted - caption revised and explanation in the main text
5-1893 5 88 15 88 15 Fig. 5.7. - caption : "supplementary material.": this supplementary material is for §5.5 and we are in § 5.3.4 … ? [Bernard De Saedeleer, Belgium]
Noted
5-1894 5 89 1 89 3 Specifiy what is meant by ‘strong’ or ‘weak’ - these are relative terms and may be ambiguous. [Gavin Schmidt, USA]
Accepted. This is clarified now in the text
5-1895 5 89 1 89 11 Figure 5.8 is quite informative, but I would in addition (or instead) like to see a figure where reconstructed and modeled temperatures for the MCA, LIA and 20th century were shown. I feel that this is an issue which is debated, especially MCA vs. 20C climate, and it would add to the discussion in the chapter. Possibly this could be done in a way similar to that used by Ljungkvist et al. 2012 (Climate of the Past 8, 227-249) [Hans W Linderholm, Sweden]
Accepted. The figure has changed in this direction and the discussion in Section 5.3.5
5-1896 5 89 5 annual surface air temperature change? [Masa KAGEYAMA, France] Noted. Text has changed
5-1897 5 89 11 89 11 Fig. 5.8. - caption : "R21" : what is it ? [Bernard De Saedeleer, Belgium] Noted. This was the lowest model resolution that all model fields were interpolated to. This has changed in the present version of the figure
5-1898 5 90 0 90 0 Figure 5.9. The Australasia panel looks completely wrong. Why does the Arctic reconstruction omit E. Siberia? [Philip JONES, UK]
Taken into account. Figure completely revised after PAGES2k results.
5-1899 5 92 4 92 4 Fig. 5.10. - caption : "Model-data comparison" : I do not see how we could compare the model and the data on the basis of these figures, as (top) seems annual and (bottom and middle) are seasonal : impossible to compare different quantities ? [Bernard De Saedeleer, Belgium]
Noted and taken into account.
5-1900 5 93 4 93 4 "Box 5.2, Figure1:" is a strange numbering between Fig. 5.10 & Fig. 5.11 [Bernard De Saedeleer, Belgium] Taken into account. The figure is being revised to better highlight the seasonality of the responses to orbital forcing, both data and models.
5-1901 5 93 5 93 5 Box 5.2, Figure1 - caption : change "reptersent" by "represent" [Bernard De Saedeleer, Belgium] Editorial
5-1902 5 93 Box 5.2, Figure1 - caption : Unify the caps (lower, upper) for the reference to a) b) -> A and B ? [Bernard De Saedeleer, Belgium]
Editorial
5-1903 5 93 Box 5.2, figure 1: at the top of the two sets of figures, 'A' and 'B' should be replaced by 'a' and 'b' [Suzanne Leroy, UK]
Editorial
5-1904 5 93 Box 5.2, Figure 1: Right column, top panel: How can it be +40 on both sides of 0? [Alan Robock, USA] Editorial
5-1905 5 93 Box 5.2, Fig 1: Figure and captions require work to be useful. For example, arrow on the left indicating small and large glaciers not obvious, progression from North to South not highlighted, changes in quantity displayed needs to be made clear (distance from LIA vs. delta ELA) or use only one quantity. [Thomas Stocker/ WGI TSU, Switzerland]
Editorial
5-1906 5 94 13 Add space between parenthesis [Dunia H. Urrego, France-USA] Noted - the figure has been completely redrawn
5-1907 5 94 16 Delete comma before word "that" [Dunia H. Urrego, France-USA] Noted - the figure has been completely redrawn

Expert Review Comments on the IPCC WGI AR5 First Order Draft -- Chapter 5
Do not Cite, Quote or Distribute Page 154 of 157
Comment No
Chapter FromPage
FromLine
To Page
To Line Comment Response
5-1908 5 94 Fig 5.11: LOVECLIM has not been built to represent the monsoon system well, but the comparison to data is remarkable. So maybe there is more that can be said about the necessary dynamics to be represented to get the "correct" representation of the monsoon signal??? [Masa KAGEYAMA, France]
Noted - the figure has been completely redrawn. The figure now shows the multi-model ensemble mean (including the LOVECLIM model). Interesting question raised by the reviewer, but we do not have space to speculate on the minimum model dynamics for monsoon variations here.
5-1909 5 95 7 The covariance of drought - What are red dots and what are the lines? Which scale should be used for each? [Alan Robock, USA]
Taken into account, caption has been expanded and legend added
5-1910 5 95 Fig. 5.12: panels b and e of this figure are not sufficiently explained in the caption. What do the red dots represent ? And the black lines? [Valerie Trouet, United States]
Taken into account, caption has been expanded and legend added
5-1911 5 95 Fig. 5.12: the histogram in panels b and e do not have a vertical axis assigned to them [Valerie Trouet, United States]
Taken into account, marginal histogram axes now complete
5-1912 5 95 In parts b and e which colour is which (add to caption). I don't think you actually use the rather complex info in these plots (b,e) in the text, so why not remove them. [Eric Wolff, United Kingdom of Great Britain & Northern Ireland]
Taken into account, caption expanded and figure integrated into written section
5-1913 5 96 Fig 5.13: Please coordinate with Chapter 2 to ensure consistent coverage of historical flood records. [Thomas Stocker/ WGI TSU, Switzerland]
Noted. There is no overlap
5-1914 5 98 10 98 10 Fig. 5.14. - caption : "from a \chi^2 distribution" : why this distribution? [Bernard De Saedeleer, Belgium] Noted - the figure has been completely redrawn showing now the simulated response to external forcing using PMIP2/PMIP3 models and other CGCMs (for waterhosing)
5-1915 5 98 Figure 5-14: I do not find this very informative or very supportive of the statements in the text or executive summary. I also note that the ENSO variance envelope (which is as large in the 1400s as in the late 20th century) is large when n is small. To me, this makes the "evidence" less convincing. [Julia Cole, USA]
Noted - the figure has been completely redrawn showing now the simulated response to external forcing using PMIP2/PMIP3 models and other CGCMs (for waterhosing)
5-1916 5 98 Fig. 5.14: In left panel, lines are so thick that it is impossible to see anything. Expand the figure the width of the page and make the lines thinner. [Alan Robock, USA]
Noted - the figure has been completely redrawn showing now the simulated response to external forcing using PMIP2/PMIP3 models and other CGCMs (for waterhosing)
5-1917 5 99 4 100 20 Fig. 5.15. - the caption seems way too long - put some details rather in the text ? [Bernard De Saedeleer, Belgium]
Noted and taken into account in the revised text
5-1918 5 99 4 100 20 Fig. 5.17. - caption : Unify the caps (lower, upper) for the reference to a) b) -> A and B ? [Bernard De Saedeleer, Belgium]
Noted and taken into account in the revised text
5-1919 5 99 4 100 20 Fig. 5.15. - the caption seems way too long - put some details rather in the text ? [Bernard De Saedeleer, Belgium]
Noted and taken into account in the revised text
5-1920 5 99 4 100 20 Fig. 5.15. - the caption seems way too long - put some details rather in the text ? [Bernard De Saedeleer, Belgium]
Noted and taken into account in the revised text
5-1921 5 99 6 based on the assumption [Masa KAGEYAMA, France] Noted and taken into account in the revised text
5-1922 5 99 7 99 7 "and isostatic effects" - this doesn't read correctly. [Roland Gehrels, United Kingdom] Noted and taken into account in the revised text
5-1923 5 99 Figure 5.15a: I suggest truncating the Kopp et al. curve at 129 ka, since the stray 84th percentile line before 129 ka is confusing, and the analysis does not provide a significant constraint on their prior before this time point. I would also suggesting dotting the confidence intervals rather than showing them as solid lines. [Robert Kopp, USA]
Noted and taken into account in the revised text

Expert Review Comments on the IPCC WGI AR5 First Order Draft -- Chapter 5
Do not Cite, Quote or Distribute Page 155 of 157
Comment No
Chapter FromPage
FromLine
To Page
To Line Comment Response
5-1924 5 99 Fig 5.15: "predicted" -> simulated. 'Elevation' is confusing term to use in this context, and a term not used by Chapters 3 or 13. Caption is too long and contains assessment. [Thomas Stocker/ WGI TSU, Switzerland]
Noted and taken into account in the revised text
5-1925 5 101 1 101 3 I doubt that four decimal places for SLR (down to the tenth of a millimeter!) are really justified here. [Gavin Schmidt, USA]
Noted and taken into account in the revised text
5-1926 5 101 8 101 8 Fig. 5.16. - caption : replace "Red points" by "Red squares" ? [Bernard De Saedeleer, Belgium] Editorial
5-1927 5 101 108 All figures have some problem in printing their captions [Muhammad Amjad, Pakistan] Noted and taken into account in the revised text
5-1928 5 101 Fig 5.16: indicate how these ice-sheets were simulated, which forcing scenarios have been used? [Masa KAGEYAMA, France]
Noted and taken into account in the revised text
5-1929 5 101 Fig 5.16: Modeled ice sheet distributions in each case, i.e., each model, needs to be put in context with the temporal evolution of that particular model (see Fig 5.15f). Otherwise somebody could infer the difference between the two panels presented is the actual ice loss. In addition, changes in ice area should be related to driving forces of mass balance, by including a time series for mean balance quantities for each model simulation, e.g. include additional panels for T and Precip. [Thomas Stocker/ WGI TSU, Switzerland]
Noted and taken into account in the revised text
5-1930 5 102 6 102 6 What is meant by "representative"? In terms of GIA and even the timing of acceleration the record is not representative at all. [Roland Gehrels, United Kingdom]
Noted and taken into account in the revised text
5-1931 5 102 7 102 7 In some locations the change occurs in the early 20th century. [Roland Gehrels, United Kingdom] Noted and taken into account in the revised text
5-1932 5 102 Fig. 5.17. - caption : Unify the caps (lower, upper) for the reference to a) b) ..j) -> A, B, .., J ? [Bernard De Saedeleer, Belgium]
Editorial
5-1933 5 102 Fig. 5.17. - map : put the letters 'A' etc in bold for an easier reading ? [Bernard De Saedeleer, Belgium] Editorial
5-1934 5 102 Fig 5.17. This figure is much improved compared to the zero draft, but there are several issues that still need to be addressed. All panels showing proxy data display the sea-level index points. The North Carolina record, however, also includes a lot of interpolated points which have not been dated. The precision of this record is therefore misleading. It is possible to display the New Zealand record, for example, in the same way, and it would look a lot more precise. But it would be better to display the North Carolina record in the same way as the others. There is no need to include the Tump Point record. If the North Carolina record is "representative" (see comment 34) for the entire East Coast, then there is certainly no need to show two records from the same area? [Roland Gehrels, United Kingdom]
Noted and taken into account in the revised text
5-1935 5 102 Fig, 5.17. I don't see the point of showing the low-resolution Blekinge record. One of the best European records is from the Netherlands (Van de Plassche O. 1982. Sea-level change and water-level movements in the Netherlands during the Holocene. Mededelingen Rijks Geologische Dienst 36(1): 1–93). Replace Blekinge with this dataset. [Roland Gehrels, United Kingdom]
Noted and taken into account in the revised text
5-1936 5 102 Why show the Bay of Biscay record? Much better and longer ones are those from Iceland (Gehrels, W.R., Marshall, W.A., Gehrels, M.J., Larsen, G., Kirby, J.R., Eiriksson, J., Heinemeier, J., Shimmield, T., 2006. Rapid sea-level rise in the North Atlantic Ocean since the first half of the 19th century. The Holocene 16, 948-964) and Nova Scotia (Gehrels, W.R., Kirby, J.R., Prokoph, A., Newnham, R.M., Achterberg, E.P., Evans, E.H., Black, S., Scott, D.B., 2005. Onset of recent rapid sea-level rise in the western Atlantic Ocean. Quaternary Science Reviews 24, 2083-2100). [Roland Gehrels, United Kingdom]
Noted and taken into account in the revised text
5-1937 5 102 The previous three comments lead to the question, what is it that should be shown in Fig. 5.17? Do you want the best records, or do you want a wide regional representation? My feeling is that you want both, i.e. show for each region the highest-quality record that is available. This means that I would also show a South American record in the right hand column. The paper by Milne et al. (2005), Modelling Holocene relative sea-level observations from the Caribbean and South America, Quaternary Science Reviews 24, 1183-1202, shows several. [Roland Gehrels, United Kingdom]
Noted and taken into account in the revised text
5-1938 5 102 I am lost with the age scales on this figure. It would be easier to read if the age scale was indicated for every Noted and taken into account in the revised text

Expert Review Comments on the IPCC WGI AR5 First Order Draft -- Chapter 5
Do not Cite, Quote or Distribute Page 156 of 157
Comment No
Chapter FromPage
FromLine
To Page
To Line Comment Response
plot, maybe. [Masa KAGEYAMA, France]
5-1939 5 102 Fig 5.17: Figure contains several combinations of different quantities and time scales. We suggest using a careful layout to avoid confusion, e.g. consider to graphically separate global from regional records. [Thomas Stocker/ WGI TSU, Switzerland]
Noted and taken into account in the revised text
5-1940 5 102 Part b, spelling of Louisiana [Eric Wolff, United Kingdom of Great Britain & Northern Ireland] Editorial
5-1941 5 103 7 103 7 local - typo [Roland Gehrels, United Kingdom] Editorial
5-1942 5 103 14 103 14 delete (j) [Roland Gehrels, United Kingdom] Editorial
5-1943 5 104 Fig 5.18. We wonder about the purpose of figure, given it receives only a very limited discussion in the text. This could be a figure on model evaluation or abrupt climate change - not clear to us? Please note: Caption refers to 3 transient climate models but only 2 are displayed. [Thomas Stocker/ WGI TSU, Switzerland]
Noted - the figure has been completely redrawn featuring now the millennial-scale variability during previous glacial periods versus interglacials
5-1944 5 104 It would make sense to include in Fig 5.18 figures from the submitted Shakun et al paper if that looks like making it to publication. Lead author Otto-Bliesner should know about this one. [Eric Wolff, United Kingdom of Great Britain & Northern Ireland]
Noted - the figure has been completely redrawn featuring now the millennial-scale variability during previous glacial periods versus interglacials
5-1945 5 105 4 105 4 Fig. 5.19. - caption :"the 8.2 ka event" : please explain what happened there ? Min (volume ice) ? [Bernard De Saedeleer, Belgium]
Noted. Caption is revised but the description of the event is found in the text section.
5-1946 5 105 Fig. 5.19. - put sub-Figs 5)e)f) side-by-side with a)b)c)d) ? [Bernard De Saedeleer, Belgium] Noted but not implemented.
5-1947 5 105 Fig 5.19: how have the model results been "aligned" on the records? According the fresh water hosing scenario compared to drainage of lakes Agassiz and Ojibway or via the climate signal on the North Atlantic/Greenland? [Masa KAGEYAMA, France]
Noted. Caption is revised.
5-1948 5 105 Fig 5.19: Units need to be added to indicate what is shown by the colour bars. Layout to make better use of space and enlarge maps. [Thomas Stocker/ WGI TSU, Switzerland]
Noted. Legend added to the colour bars.
5-1949 5 107 5 107 5 Box 5.3, Figure1 - caption : "Schematic illustration" : from where ? Source = ? [Bernard De Saedeleer, Belgium]
Rejected - one of the LAs made the figure for this Chapter - no Source needed
5-1950 5 107 Box 5.3, Figure1 - "stationary wave feedback" : what is it ? [Bernard De Saedeleer, Belgium] Rejected - Stationary wave feedback is explained in the text
5-1951 5 107 Box 5.3, figure 1: catabatic, not katabatic [Suzanne Leroy, UK] Rejected - Both spellings can be found in the literature
5-1952 5 107 Box 5.3, Fig 1: Very nice figure, but given the broader scope of the box, please consider using a schematic that provides a more comprehensive overview of Earth-system feedbacks. Current figure is focused only on ice-sheet/solid earth/climate feedbacks. [Thomas Stocker/ WGI TSU, Switzerland]
Rejected - since the main text in the Box focusses on the ice-sheet-climate interactions as an example for earth system feedbacks, we restrict also the figure to this. A more comprehensive view (including carbon cycle /climate feedbacks) would distort the figure message.
5-1953 5 108 1 108 1 Delete box around chart. Spell out "4" and "2" in the caption [Peter Clift, United States of America] Noted and taken into account in the revised text
5-1954 5 108 4 108 4 FAQ 5.1, Figure1 - caption : "Estimates" : from where ? Source/reference = ? [Bernard De Saedeleer, Belgium]
Noted and taken into account in the revised text
5-1955 5 109 1 109 3 The global insolation scale in panel c is not consistent with panel b [Gavin Schmidt, USA] Noted and taken into account in the revised text
5-1956 5 109 5 109 5 FAQ 5.2, Figure1 - caption : "insolation was around 25% lower than today" : please give a reference? [Bernard De Saedeleer, Belgium]
Noted and taken into account in the revised text
5-1957 5 109 changes in insolation at orbital time scales should also be represented via changes in obliquity and precession. Or maybe plot the classical 65°N June insolation? [Masa KAGEYAMA, France]
Noted and taken into account in the revised text

Expert Review Comments on the IPCC WGI AR5 First Order Draft -- Chapter 5
Do not Cite, Quote or Distribute Page 157 of 157
Comment No
Chapter FromPage
FromLine
To Page
To Line Comment Response
5-1958 5 109 FAQ 5.2, Figure 1: Need to state what the solar constant was assumed to be for the present, and how this assumption affects all three diagrams. For the bottom panel, is it only TSI changes, or are orbital changes considered, too? [Alan Robock, USA]
Noted and taken into account in the revised text
Related Documents