Planar measurements of soot volume fraction and OH in a JP-8 pool fire Tara L. Henriksen a, * , Graham J. Nathan b , Zeyad T. Alwahabi c , Nader Qamar c , Terry A. Ring a , Eric G. Eddings a a Department of Chemical Engineering, University of Utah, Salt Lake City, UT 84112, USA b School of Mechanical Engineering, University of Adelaide, SA 5005, Australia c School of Chemical Engineering, University of Adelaide, SA 5005, Australia article info Article history: Received 10 December 2008 Received in revised form 2 March 2009 Accepted 5 March 2009 Available online xxxx Keywords: Incandescence Fluorescence Pool fire JP-8 abstract The simultaneous measurement of soot volume fraction by laser induced incandescence (LII) and quali- tative imaging of OH by laser induced fluorescence (LIF) was performed in a JP-8 pool fire contained in a 152 mm diameter pan. Line of sight extinction was used to calibrate the LII system in a laminar flame, and to provide an independent method of measuring average soot volume fraction in the turbulent flame. The presence of soot in the turbulent flame was found to be approximately 50% probable, resulting in high levels of optical extinction, which increased slightly through the flame from approximately 30% near the base, to approximately 50% at the tip. This high soot loading pushes both techniques toward their detection limit. Nevertheless, useful accuracy was obtained, with the LII measurement of apparent extinction in the turbulent flame being approximately 21% lower than a direct measurement, consistent with the influence of signal trapping. The axial and radial distributions of soot volume fraction are pre- sented, along with PDFs of volume fraction, and new insight into the behavior of soot sheets in pool fires are sought from the simultaneous measurements of OH and LII. Ó 2009 Published by Elsevier Inc. on behalf of The Combustion Institute. 1. Introduction This study was undertaken to provide insight into, and new data of, the evolution of soot in buoyancy-driven, soot laden pool fires of JP-8, the kerosene-based fuel used for jet engines. Such information is needed for the development and validation of modern combustion simulations. The spatially resolved measurement of soot volume fraction in turbulent flames from a well-characterized pool fire rep- resents a critical void in currently available validation datasets. Laser induced incandescence, LII, is reaching maturity as a diag- nostic technique in lightly sooting flames [1–4] where it has been used to provide spatially and temporally resolved measurement of soot volume fraction, f v , in both laminar and turbulent flames [5]. It has recently been extended to determine soot volume fraction in laminar flames at elevated pressures [6–9] and under microgravity conditions [10]. In turbulent conditions, LII has been applied to as- sess the effects of mixing on soot production using low sooting fuels in both momentum driven and buoyancy dominated flames [11–13]. Shaddix et al. and Shaddix and Smyth used LII to measure soot volume fraction in steady and flickering methane, propane and ethylene diffusion flames [14,15]. Other recent studies have employed LII to determine soot volume fraction in more heavily sooting systems such as in diesel engine exhausts [16–19], and precessing jet bluff body flames of propane [20]. LII has also been employed in a scale model of a gas turbine combustor burning JP-8, by Meyer et al. [21], where the high mixing rates greatly re- duce the presence of soot relative to a pool fire. Murphy and Shaddix [22] provided the first in-situ measure- ments of soot volume fraction in a large JP-8 pool fire generated from a 2-m pan. These were performed using a semi-intrusive method, with a probe resolution of 5 mm, owing to the challenges of performing LII in such conditions. Xin et al. [23] have recently reported LII measurements in turbulent buoyant flames. However, these data were obtained using methane and ethylene, rather than heavily sooting liquid fuels. Indeed, only limited measurements of soot volume fraction using LII in turbulent jet flames are available [20,24]. There are currently no published LII measurements of spa- tially resolved soot volume fraction in turbulent flames from pool fires with heavily sooting liquid fuels, such as JP-8. Schefer et al. [25], Starner et al. [26] and Carter et al. [27] (among others) have shown that the high temperature reaction zone in turbulent jet diffusion flames of hydrocarbon fuels lies in a 0.5 mm thick sheet between the CH layer on the fuel-rich side and the OH layer, on the fuel-lean side. Though more difficult to image, the CH layer is arguably a more precise locator of the reac- tion zone because it is generally thinner than the OH layer, espe- cially in the tail region of the flame. Carter et al. [27] went to considerable lengths to ensure a soot-free flame for their CH imag- 0010-2180/$ - see front matter Ó 2009 Published by Elsevier Inc. on behalf of The Combustion Institute. doi:10.1016/j.combustflame.2009.03.002 * Corresponding author. Fax: +1 801 585 9291. E-mail addresses: [email protected], [email protected] (T.L. Henriksen). Combustion and Flame xxx (2009) xxx–xxx Contents lists available at ScienceDirect Combustion and Flame journal homepage: www.elsevier.com/locate/combustflame ARTICLE IN PRESS Please cite this article in press as: T.L. Henriksen et al., Combust. Flame (2009), doi:10.1016/j.combustflame.2009.03.002

Welcome message from author
This document is posted to help you gain knowledge. Please leave a comment to let me know what you think about it! Share it to your friends and learn new things together.
Transcript

Combustion and Flame xxx (2009) xxx–xxx
ARTICLE IN PRESS
Contents lists available at ScienceDirect
Combustion and Flame
journal homepage: www.elsevier .com/locate /combustflame
Planar measurements of soot volume fraction and OH in a JP-8 pool fire
Tara L. Henriksen a,*, Graham J. Nathan b, Zeyad T. Alwahabi c, Nader Qamar c,Terry A. Ring a, Eric G. Eddings a
a Department of Chemical Engineering, University of Utah, Salt Lake City, UT 84112, USAb School of Mechanical Engineering, University of Adelaide, SA 5005, Australiac School of Chemical Engineering, University of Adelaide, SA 5005, Australia
a r t i c l e i n f o a b s t r a c t
Article history:Received 10 December 2008Received in revised form 2 March 2009Accepted 5 March 2009Available online xxxx
Keywords:IncandescenceFluorescencePool fireJP-8
0010-2180/$ - see front matter � 2009 Published bydoi:10.1016/j.combustflame.2009.03.002
* Corresponding author. Fax: +1 801 585 9291.E-mail addresses: [email protected], vbrit
(T.L. Henriksen).
Please cite this article in press as: T.L. Henrikse
The simultaneous measurement of soot volume fraction by laser induced incandescence (LII) and quali-tative imaging of OH by laser induced fluorescence (LIF) was performed in a JP-8 pool fire contained in a152 mm diameter pan. Line of sight extinction was used to calibrate the LII system in a laminar flame, andto provide an independent method of measuring average soot volume fraction in the turbulent flame. Thepresence of soot in the turbulent flame was found to be approximately 50% probable, resulting in highlevels of optical extinction, which increased slightly through the flame from approximately 30% nearthe base, to approximately 50% at the tip. This high soot loading pushes both techniques toward theirdetection limit. Nevertheless, useful accuracy was obtained, with the LII measurement of apparentextinction in the turbulent flame being approximately 21% lower than a direct measurement, consistentwith the influence of signal trapping. The axial and radial distributions of soot volume fraction are pre-sented, along with PDFs of volume fraction, and new insight into the behavior of soot sheets in pool firesare sought from the simultaneous measurements of OH and LII.
� 2009 Published by Elsevier Inc. on behalf of The Combustion Institute.
1. Introduction
This study was undertaken to provide insight into, and new dataof, the evolution of soot in buoyancy-driven, soot laden pool fires ofJP-8, the kerosene-based fuel used for jet engines. Such informationis needed for the development and validation of modern combustionsimulations. The spatially resolved measurement of soot volumefraction in turbulent flames from a well-characterized pool fire rep-resents a critical void in currently available validation datasets.
Laser induced incandescence, LII, is reaching maturity as a diag-nostic technique in lightly sooting flames [1–4] where it has beenused to provide spatially and temporally resolved measurement ofsoot volume fraction, fv, in both laminar and turbulent flames [5]. Ithas recently been extended to determine soot volume fraction inlaminar flames at elevated pressures [6–9] and under microgravityconditions [10]. In turbulent conditions, LII has been applied to as-sess the effects of mixing on soot production using low sootingfuels in both momentum driven and buoyancy dominated flames[11–13]. Shaddix et al. and Shaddix and Smyth used LII to measuresoot volume fraction in steady and flickering methane, propaneand ethylene diffusion flames [14,15]. Other recent studies haveemployed LII to determine soot volume fraction in more heavily
Elsevier Inc. on behalf of The Com
n et al., Combust. Flame (2009
sooting systems such as in diesel engine exhausts [16–19], andprecessing jet bluff body flames of propane [20]. LII has also beenemployed in a scale model of a gas turbine combustor burningJP-8, by Meyer et al. [21], where the high mixing rates greatly re-duce the presence of soot relative to a pool fire.
Murphy and Shaddix [22] provided the first in-situ measure-ments of soot volume fraction in a large JP-8 pool fire generatedfrom a 2-m pan. These were performed using a semi-intrusivemethod, with a probe resolution of 5 mm, owing to the challengesof performing LII in such conditions. Xin et al. [23] have recentlyreported LII measurements in turbulent buoyant flames. However,these data were obtained using methane and ethylene, rather thanheavily sooting liquid fuels. Indeed, only limited measurements ofsoot volume fraction using LII in turbulent jet flames are available[20,24]. There are currently no published LII measurements of spa-tially resolved soot volume fraction in turbulent flames from poolfires with heavily sooting liquid fuels, such as JP-8.
Schefer et al. [25], Starner et al. [26] and Carter et al. [27](among others) have shown that the high temperature reactionzone in turbulent jet diffusion flames of hydrocarbon fuels lies ina 0.5 mm thick sheet between the CH layer on the fuel-rich sideand the OH layer, on the fuel-lean side. Though more difficult toimage, the CH layer is arguably a more precise locator of the reac-tion zone because it is generally thinner than the OH layer, espe-cially in the tail region of the flame. Carter et al. [27] went toconsiderable lengths to ensure a soot-free flame for their CH imag-
bustion Institute.
), doi:10.1016/j.combustflame.2009.03.002

2 T.L. Henriksen et al. / Combustion and Flame xxx (2009) xxx–xxx
ARTICLE IN PRESS
ing. A study by Pickett and Ghandi [11] concluded that the simul-taneous imaging of OH and soot could provide a good indication ofthe location of the high temperature reaction zone. To date, LIF hasonly been reported qualitatively in turbulent reacting systems, be-cause of the difficulties in correcting for the effects of quenching[5], which would require simultaneous knowledge of the tempera-ture, pressure and collision partners or chemical composition ofthe flame [28,29]. At the same time, the imaging of OH becomesincreasingly challenging with more heavily sooting fuels. This isboth because, as a primary oxidizer of soot and its precursors,OH is less prevalent in such flames, and because the interferenceby scattering from soot particles becomes increasingly strong withmore heavily sooting fuels. As a result, to our knowledge no simul-taneous soot volume fraction and OH images have been reported inturbulent pool fires of heavily sooting fuels.
To meet model validation needs, the present study aims to pro-vide new, spatially resolved measurement of the distribution ofsoot volume fraction in a well defined, turbulent pool fire of JP-8.It also aims to provide new insight of the instantaneous spatialrelationships between the high temperature reaction zone andsoot, using OH as an indicator, in a substantially sooting JP-8 poolfire. Despite limitations of the technique in this application, the re-sults presented here provide a nonintrusive measure of soot vol-ume fraction and OH in situ in heavily sooting pool fires.
2. Experimental
2.1. Burner and fuel
The circular aluminum pool fire pan had a 152 mm internaldiameter (ID), 165 mm outer diameter (OD) and height of76 mm. Cooling water was circulated through the 13 mm shell sur-rounding the fuel cavity. A batch of 500 L of commercial blend JP-8was obtained of standard composition. A typical composition forthe JP-8 fuel blend is shown in Table 1 [30]. This fuel was fed tothe pool fire pan through a 6 mm opening in the bottom of thepan and passed through a fuel dispenser to distribute the incomingfuel with reasonable uniformity. The pan and fuel supply systemwere securely mounted to a two-dimensional traverse, which al-lowed the entire system to be traversed through the opticalarrangement. A constant fuel level in the pan was maintained bykeeping the pool fire pan level with a reservoir can, whose fuelheight was maintained by an ultrasonic level sensor. A pump trig-gered by a PID control program replenished fuel to the reservoirpan. More information on the burner and extinction experimentis reported by Henriksen et al. [34], and on the LII and OH methodby Henriksen [31].
2.2. Optical arrangement
The measurements were performed in the diagnostic laborato-ries of the Fluid Mechanics, Energy, and Combustion Group at theUniversity of Adelaide. The fundamental output of a Nd: YAG laser
Table 1Composition of JP-8 jet fuel.
Wt%
n-Paraffin �28Branched paraffin �29Mono-aromatics �18Diaromatics �2Cycloparaffin �20Nondetermined �3
Total 100
Please cite this article in press as: T.L. Henriksen et al., Combust. Flame (2009
provided an infrared (IR) beam at 1064 nm with a pulse width of5 ns. A series of cylindrical and spherical lenses were used to ex-pand the incoming IR beam into a 0.5 mm weakly diverging sheetin one plane that measured 85 mm tall by 1 mm wide in the imageplane, which passed through the center of the flame. The size ofthis sheet was chosen to ensure that the intensity throughout thisregion was within the plateau region of the fluence curve (de-scribed below), whilst providing larger sheets than the 45 mm pos-sible with a parallel sheet for the simultaneous images with OH.The LII images were recorded with an ICCD camera (ICCD-576-G/1, Princeton Instruments) operated at a 40 ns gate width and zerogate delay. The gate of the camera was triggered by the Q-switch ofthe ND: YAG laser to ensure that the laser pulse arrives at the startof the gate. A zero gate delay was chosen to avoid bias towards lar-ger particles caused by long or delayed detection. An interferencefilter with a center wavelength of 430 nm and a 10 nm bandwidth(Andover) was used to suppress any C2 LIF during signal detection.
The recorded image was clipped at the data processing stage, tominimize power losses due to edge effects. After the clipping pro-cedure, the volume imaged by each pixel was 0.625 � 0.625 �1 mm, resulting in an imaged area of 50 mm � 360 mm. The rela-tive signal to noise ratio (S/N) was 50. Approximately 1000pictures were taken by the ICCD camera for each height in the tur-bulent flame.
The second harmonic output radiation (532 nm) of a pulsed Nd:YAG laser (Brilliant B, Quantel) was used to pump a tunable dye la-ser (Lambda Physik SCANMATE, utilizing Rhodamine 6G dye) near565 nm, producing short (�5 ns), narrow bandwidth (�0.08 cm�1)pulses. The output beam passed through a BBO (frequency dou-bling) crystal and the fundamental fraction was separated by a Pel-len Brocca prism and discarded. The frequency doubled laserradiation, at 281.4 nm [29], was directed through a cylindrical tele-scope lens system to produce a sheet of �0.5 mm thickness andsufficient uniformity, and passed through the center of the flame.The (1–1 and 0–0) fluorescence, near 307 nm, was collected by aUV lens, after transmission through a band pass filter (bandwidth10 nm FWHM) and a dichroic filter. This combination was foundbe very effective at minimizing interference from PAH excited mol-ecules. The transmitted fluorescence was imaged onto a gatedintensified CCD camera (Princeton Instruments ICCD-576) orthog-onal to the laser sheet. A gate width of 50 ns was used, well belowthe 100 ns required to reduce background flame radiation relativeto the noise floor.
Online (the precise spectral wavelength required to excite OH)and offline measurements were recorded at various heights inthe flame to determine a signal to noise ratio of 3. For simultaneousimaging, the LII camera was adjusted to offer an imaged area(99 � 246 mm) more closely corresponding to that provided bythe LIF camera (88 � 133 mm). The resolution limitations of theLIF camera resulted in only a portion of simultaneously overlappedspatial region in the flame. This simultaneously imaged positionspanned from the center of the flame to r/d � 0.8, where d is thepan diameter and r the radius.
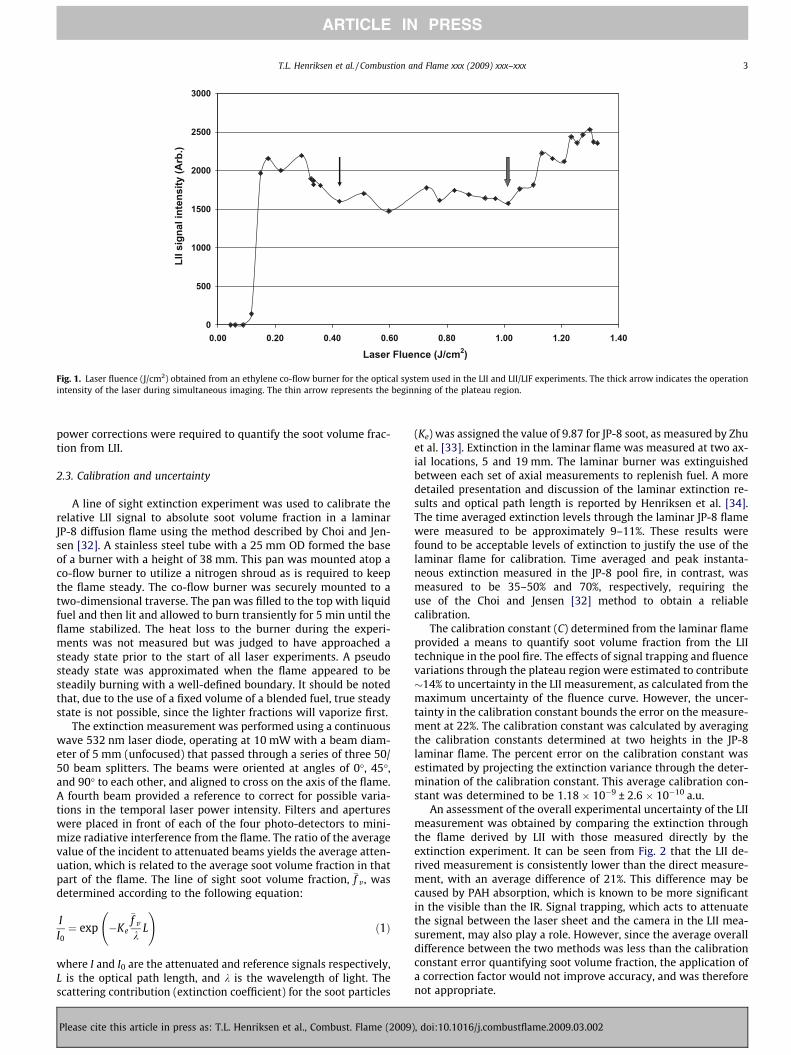
The laser fluence was measured for the LII sheet passingthrough a laminar ethylene co-flow flame. The intensity (Fig. 1)was measured on the LII camera as the power of the laser wasslowly increased by use of neutral density filters. The plateau re-gion occurred between 0.4 J/cm2 (thin black arrow) and 1.1 J/cm2.Instantaneous LII images were collected while operating at 1.3 J/cm2 near the end of the fluence curve, and simultaneous measure-ments operated with an LII excitation power source of 1.01 J/cm2,with position indicated by the thick arrow in Fig. 1. The standarddeviation of the plateau region was 5.8%, and the maximum uncer-tainty due to laser power fluctuation on the LII signal was deter-mined to be 14%, which is much less than the calibration error(22%) associated with the technique (Section 2.3). As such, no laser
), doi:10.1016/j.combustflame.2009.03.002
0
500
1000
1500
2000
2500
3000
0.00 0.20 0.40 0.60 0.80 1.00 1.20 1.40
Laser Fluence (J/cm2)
LII s
igna
l int
ensi
ty (A
rb.)
Fig. 1. Laser fluence (J/cm2) obtained from an ethylene co-flow burner for the optical system used in the LII and LII/LIF experiments. The thick arrow indicates the operationintensity of the laser during simultaneous imaging. The thin arrow represents the beginning of the plateau region.
T.L. Henriksen et al. / Combustion and Flame xxx (2009) xxx–xxx 3
ARTICLE IN PRESS
power corrections were required to quantify the soot volume frac-tion from LII.
2.3. Calibration and uncertainty
A line of sight extinction experiment was used to calibrate therelative LII signal to absolute soot volume fraction in a laminarJP-8 diffusion flame using the method described by Choi and Jen-sen [32]. A stainless steel tube with a 25 mm OD formed the baseof a burner with a height of 38 mm. This pan was mounted atop aco-flow burner to utilize a nitrogen shroud as is required to keepthe flame steady. The co-flow burner was securely mounted to atwo-dimensional traverse. The pan was filled to the top with liquidfuel and then lit and allowed to burn transiently for 5 min until theflame stabilized. The heat loss to the burner during the experi-ments was not measured but was judged to have approached asteady state prior to the start of all laser experiments. A pseudosteady state was approximated when the flame appeared to besteadily burning with a well-defined boundary. It should be notedthat, due to the use of a fixed volume of a blended fuel, true steadystate is not possible, since the lighter fractions will vaporize first.
The extinction measurement was performed using a continuouswave 532 nm laser diode, operating at 10 mW with a beam diam-eter of 5 mm (unfocused) that passed through a series of three 50/50 beam splitters. The beams were oriented at angles of 0�, 45�,and 90� to each other, and aligned to cross on the axis of the flame.A fourth beam provided a reference to correct for possible varia-tions in the temporal laser power intensity. Filters and apertureswere placed in front of each of the four photo-detectors to mini-mize radiative interference from the flame. The ratio of the averagevalue of the incident to attenuated beams yields the average atten-uation, which is related to the average soot volume fraction in thatpart of the flame. The line of sight soot volume fraction, �f v , wasdetermined according to the following equation:
II0¼ exp �Ke
�f v
kL
!ð1Þ
where I and I0 are the attenuated and reference signals respectively,L is the optical path length, and k is the wavelength of light. Thescattering contribution (extinction coefficient) for the soot particles
Please cite this article in press as: T.L. Henriksen et al., Combust. Flame (2009
(Ke) was assigned the value of 9.87 for JP-8 soot, as measured by Zhuet al. [33]. Extinction in the laminar flame was measured at two ax-ial locations, 5 and 19 mm. The laminar burner was extinguishedbetween each set of axial measurements to replenish fuel. A moredetailed presentation and discussion of the laminar extinction re-sults and optical path length is reported by Henriksen et al. [34].The time averaged extinction levels through the laminar JP-8 flamewere measured to be approximately 9–11%. These results werefound to be acceptable levels of extinction to justify the use of thelaminar flame for calibration. Time averaged and peak instanta-neous extinction measured in the JP-8 pool fire, in contrast, wasmeasured to be 35–50% and 70%, respectively, requiring theuse of the Choi and Jensen [32] method to obtain a reliablecalibration.
The calibration constant (C) determined from the laminar flameprovided a means to quantify soot volume fraction from the LIItechnique in the pool fire. The effects of signal trapping and fluencevariations through the plateau region were estimated to contribute�14% to uncertainty in the LII measurement, as calculated from themaximum uncertainty of the fluence curve. However, the uncer-tainty in the calibration constant bounds the error on the measure-ment at 22%. The calibration constant was calculated by averagingthe calibration constants determined at two heights in the JP-8laminar flame. The percent error on the calibration constant wasestimated by projecting the extinction variance through the deter-mination of the calibration constant. This average calibration con-stant was determined to be 1.18 � 10�9 ± 2.6 � 10�10 a.u.
An assessment of the overall experimental uncertainty of the LIImeasurement was obtained by comparing the extinction throughthe flame derived by LII with those measured directly by theextinction experiment. It can be seen from Fig. 2 that the LII de-rived measurement is consistently lower than the direct measure-ment, with an average difference of 21%. This difference may becaused by PAH absorption, which is known to be more significantin the visible than the IR. Signal trapping, which acts to attenuatethe signal between the laser sheet and the camera in the LII mea-surement, may also play a role. However, since the average overalldifference between the two methods was less than the calibrationconstant error quantifying soot volume fraction, the application ofa correction factor would not improve accuracy, and was thereforenot appropriate.
), doi:10.1016/j.combustflame.2009.03.002

0
0.1
0.2
0.3
0.4
0.5
0.6
0.7
0.8
0.9
1
0 0.5 1 1.5 2 2.5 3x/d
Ext
inct
ion
Extinction Experiment
LII derived
Fig. 2. A comparison of the direct extinction measurement with that derived from the LII measurement for the JP-8 pool fire.
4 T.L. Henriksen et al. / Combustion and Flame xxx (2009) xxx–xxx
ARTICLE IN PRESS
3. Results and discussion
3.1. Calibration results
Measurements of soot volume fraction averaged across the en-tire path of the flame were performed by an extinction experimentwithout applying an Abel transform based on radial measurementsthrough the flame [32]. Such a measurement only equates to localsoot volume fraction values when the soot is uniformly distributedalong that path, a condition not satisfied by the JP-8 laminar flame.
The path length used to calculate the JP-8 soot volume fractionin the laminar flame was measured from the LII images, which canbe used to precisely define the dimensions of the two separate sootsheets that attenuated the laser beam in the extinction experi-ment. The soot volume fraction is then determined from the cali-bration constant (which relates the intensity of soot in the LIIimage to the attenuation measured from extinction) and the LIIpixel intensity, according to the following equation:
Fig. 3. Collage of time averaged soot volume fraction (ppm) from lam
Please cite this article in press as: T.L. Henriksen et al., Combust. Flame (2009
f 0v ¼ C � I ð2Þ
The instantaneous peak soot volume fraction, f 0v ;max of2.57 ppm occurs at an axial position x/d = 1.40 for the JP-8 lam-inar flame. A time averaged image offers a relative means ofidentifying regions in the flames corresponding to consistentlyhigher amounts of soot volume fraction. The time averaged sootvolume fraction is shown for the JP-8 laminar flame in Fig. 3,where the �f v ;max of 1.75 ppm occurs at an axial distance x/d = 1.01. The JP-8 laminar flame has a diffused cone like shape,where the bulk of the soot is concentrated in the center, justabove the vapor dome. The higher value of f 0v ;max as comparedto �f v ;max is consistent with the expectation of varying local sootconcentration in a transient system. However, the instantaneoussoot volume fraction is an order of magnitude higher than thatreport by Shaddix and Smyth (0.33 ppm) for a laminar methanediffusion flame [15]. This is somewhat expected, since JP-8 is asubstantially more sooting fuel than methane.
inar JP-8 diffusion flame averaged from 250 images (over 5 min).
), doi:10.1016/j.combustflame.2009.03.002

T.L. Henriksen et al. / Combustion and Flame xxx (2009) xxx–xxx 5
ARTICLE IN PRESS
3.2. LII results
A collage of the time averaged soot volume fraction in the poolfire (each averaged over 1000 images) is shown in Fig. 4. The sootvolume fraction was determined by multiplying the LII intensity by
Fig. 4. Collage of time averaged soot volume fraction (ppm) from turbu
Fig. 5. Time averaged radial distribution of soot volume fraction (ppm) in a JP
Please cite this article in press as: T.L. Henriksen et al., Combust. Flame (2009
the calibration constant. The peak value of time averaged soot vol-ume fraction, �f v , in the JP-8 pool fire was measured to be 0.40 ppm,and this value occurred close to the burner at x/d = 0.004. This va-lue is comparable to the �f v value (0.77 ppm) calculated from anemission measurement by Murphy and Shaddix [22], 0.1 m from
lent JP-8 pool fire from 1000 images (over 20 min) at 10 heights.
-8 pool fire, at height 1, approximately 25 mm from the base of the pan.
), doi:10.1016/j.combustflame.2009.03.002

6 T.L. Henriksen et al. / Combustion and Flame xxx (2009) xxx–xxx
ARTICLE IN PRESS
the centerline in a 2 m JP-8 pool fire using a semi-intrusive probe.Also for comparison, Qamar et al. [28] reported LII measurementsof peak time averaged soot volume fraction in a 6 mm turbulentnatural gas flame (DEFLT) of 0.15 ppb. The magnitude of the differ-ence in �f v between these two burner types is not surprising, as re-sults from this study and others by Qamar et al. [20] demonstratedthat high strain rates result in generally lower local soot volumefraction. The axial and radial distribution of fv viewed in the collagereveals that more soot is found near the base of the pan and in thecenter of the flame. The imperfect matching of the time averagedcollage images at the edges of successive sheets is attributed to
Fig. 6. Axial distribution of time averaged soot volume fraction radially integrated fromrepresents a planar integral at a fixed height.
0
0.1
0.2
0.3
0.4
0.5
0.6
0.7
0.8
0.9
1
0 1
Inte
rmit
ten
cy
Fig. 7. Intermittency as a function of height al
Please cite this article in press as: T.L. Henriksen et al., Combust. Flame (2009
variations in laser fluence through the sheet, due partly to lasersheet broadening (7%), and to extinction losses through the flame.These effects contribute to a ‘‘saw toothed” shape in the time aver-aged profile, which is slightly more pronounced on the left side (la-ser-out side) of Fig. 4. These effects were reduced, but noteliminated, by clipping the images from 85 to 50 mm in heightfor the data extracted from the images.
To assess the relative symmetry of the soot distributions asmeasured on the laser-in and laser-out side of the flame, and to as-sess power losses through the flame, radial plots were analyzed ateach of 10 heights [31], though only data for one height is shown in
the edge of the flame to the centerline of the JP-8 pool fire. Each point on the line
2 3 4
x/d
ong the centerline of the JP-8 burner axis.
), doi:10.1016/j.combustflame.2009.03.002

Table 2Coefficients for determining the best-fit equation for the JP-8 probability function.
x/d A B
0.205052 0.0875 �0.00240.533136 0.0875 �0.00240.86122 0.0866 �0.00281.189304 0.0759 �0.00261.517388 0.1242 �0.00361.845472 0.1496 �0.00412.173556 0.1714 �0.00482.50164 0.1687 �0.00532.829724 0.3264 �0.00793.157808 0.2018 �0.0071
Avg. 0.1480 �0.0043
T.L. Henriksen et al. / Combustion and Flame xxx (2009) xxx–xxx 7
ARTICLE IN PRESS
Fig. 5. Consistent with the time averaged collages, the radial distri-bution of �f v exhibits a peak at the center (as depicted in [31]), anddecreases toward the edge of the pan. The symbols in Fig. 5 denotethe measurements on the laser-in side of the axis, while the solidlines denote the values on the laser-out side. The intensity of thelaser-in side is slightly greater than the laser-out side due to lossesof the light signal attributed to attenuation, so the laser-in valuesare considered to be the more reliable of the two.
Following Qamar et al. [20], Fig. 6 presents the axial distributionof total time averaged soot per mm of flame height. It represents adouble integral of �f v through concentric rings at each unit heightfrom the edge of the flame to the centerline. That is, each pointin Fig. 6 represents the total soot in a plane parallel to the fuel sur-face and the integral under the curve represents the total soot vol-ume in the flame. The integrations were performed only from thelaser-in side of the data, assuming that the soot is axisymmetricin the mean, which is a reasonable assumption. It is evident thatthe total amount of soot in the JP-8 flame exhibits a slight decreasein the first half-pan diameter, and then increases with height byabout 40% to remain approximately constant near the flame tip.This trend is quite unlike the measurement in jet flames [20], inthat the soot here does not exhibit any net burnout in the regionof the flame tip. However, it is consistent with the broadening ofthe JP-8 soot profiles with increased height (Fig. 4) and with the vi-sual observation of the increased presence of soot outside theflame envelope with increasing height, including above the flametip. It is also consistent with previous measurements of totalextinction in this flame [31,34].
To further assess the distribution of soot in the turbulentflames, the axial distribution of intermittency, In, along the center-line is presented in Fig. 7. Here In is defined as the probability of notfinding soot at a given location. It was calculated by binarizing theLII measurements. A value of 0 was assigned to values above anintensity threshold, corresponding to the presence of soot, whilea value of 1 was assigned to any intensity values below this thresh-old, corresponding to the presence of no soot. The threshold(100 counts on the ICCD array) was chosen by systematically inter-polating its value until no effect on intermittency trends was ob-served. It is evident that the intermittency of soot in the JP-8pool fire is nearly constant with height. Its value 0.4 < In < 0.5,
0.00001
0.0001
0.001
0.01
0.1
1
0 500 1000
F
log
(Pro
bab
ility
)
Fig. 8. Log of the probability of soot volume fractio
Please cite this article in press as: T.L. Henriksen et al., Combust. Flame (2009
represents a high probability of finding soot everywhere. This ismuch higher than the values In > 0.97 reported by Qamar et al.[28] for a methane jet flame, consistent with a much higher sootloading in the JP-8 flame.
The probability distribution of the local instantaneous soot vol-ume fraction was also measured along the centerline at 10 differ-ent axial locations in the flame. The probabilities were calculatedby binning a sample of 4 � 5 pixels along the centerline to providereasonably converged statistics. The log of the probabilities of sootvolume fraction is presented in Fig. 8. The symbols represent data,while the lines represent the lines of best fit based on an exponen-tial function. It is evident that in each case, the data is reasonablywell described by an exponential function (not unlike those used inpopulation modeling) with typically a 95% fit to the data, whichwas clipped at values of zero for illustrative purposes. In somecases there is a slight departure from the exponential function atlow fv, with a slight peak evident at fv > 0. This is in contrast tothe flames with much lower soot loadings reported by Qamaret al. [24,28], in which all pdf’s followed an exponential distribu-tion. However it is to be expected that flames with low values ofIn will not have a most probable value of fv = 0.
It is evident from Fig. 8 that the maximum instantaneous val-ues of soot volume fraction, f 0v ;max is approximately 2.5 ppm. Thisis an order of magnitude higher than the averaged maximum va-lue ð�f v ;maxÞ of 0.4 ppm, but is still slightly lower than was mea-
1500 2000 2500 3000
v (ppb)
n in a JP-8 pool fire at a height 1 (x/d = 0.20).
), doi:10.1016/j.combustflame.2009.03.002
8 T.L. Henriksen et al. / Combustion and Flame xxx (2009) xxx–xxx
ARTICLE IN PRESS
sured for the laminar flame (2.6 ppm). It is comparable with thepeak values of 2 ppm measured for a methane flickering flame,and significantly lower than the 8.5 and 18 ppm measured forpropane and ethylene flickering laminar flames [14,15]. Giventhat the values of f 0v ;max measured for turbulent flames of pro-pane were around 4 ppm [20], and that JP-8 is a heavily sootingfuel, the present measurement seems to be somewhat low. Thisdifference may be, in part, due to the effects of signal trapping,as discussed above.
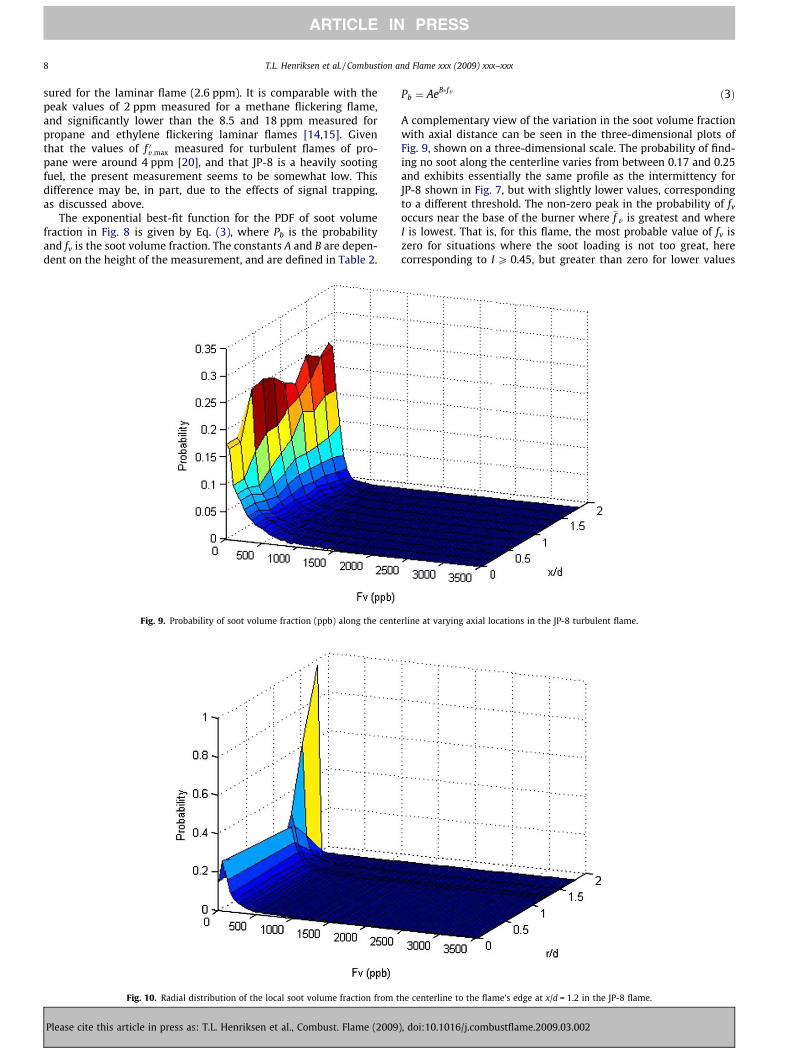
The exponential best-fit function for the PDF of soot volumefraction in Fig. 8 is given by Eq. (3), where Pb is the probabilityand fv is the soot volume fraction. The constants A and B are depen-dent on the height of the measurement, and are defined in Table 2.
Fig. 10. Radial distribution of the local soot volume fraction from t
Fig. 9. Probability of soot volume fraction (ppb) along the cente
Please cite this article in press as: T.L. Henriksen et al., Combust. Flame (2009
Pb ¼ AeB�fv ð3Þ
A complementary view of the variation in the soot volume fractionwith axial distance can be seen in the three-dimensional plots ofFig. 9, shown on a three-dimensional scale. The probability of find-ing no soot along the centerline varies from between 0.17 and 0.25and exhibits essentially the same profile as the intermittency forJP-8 shown in Fig. 7, but with slightly lower values, correspondingto a different threshold. The non-zero peak in the probability of fv
occurs near the base of the burner where �f v is greatest and whereI is lowest. That is, for this flame, the most probable value of fv iszero for situations where the soot loading is not too great, herecorresponding to I P 0.45, but greater than zero for lower values
he centerline to the flame’s edge at x/d = 1.2 in the JP-8 flame.
rline at varying axial locations in the JP-8 turbulent flame.
), doi:10.1016/j.combustflame.2009.03.002

T.L. Henriksen et al. / Combustion and Flame xxx (2009) xxx–xxx 9
ARTICLE IN PRESS
of I. The probability of finding higher values of fv tends toward anexponential decrease from the most probable value of fv, althoughit departs somewhat from the exponential function close to thepeak value.
The radial trends of local soot volume fraction probability distri-bution are shown in Fig. 10, also on a linear scale, at the firstmeasurement height. The shape of the distribution is approxi-mately constant for r/d < 1, i.e. until the edge of the flame isapproached. Toward the edge, the intermittency increases dramat-ically, reflecting fluctuations in the outer envelope, and a rapidincrease in the probability of finding no soot there. Commensuratewith this increase, the slope in the decay function changesdramatically.
Fig. 11. A typical example of an instantaneous and simultaneous image
Please cite this article in press as: T.L. Henriksen et al., Combust. Flame (2009
3.3. Simultaneous imaging results
For the simultaneous images, the LIF camera was aligned to im-age an area of 88 mm � 133 mm, corresponding to just over halfthe flame width on the laser-in side. As for the LII alone, one thou-sand image pairs were collected at each of eight heights. The LIIimages were calibrated, while the OH is reported in arbitrary units(a.u.), as described above. The LII and LIF images were overlappedusing a common grid, imaged cold. A typical example of an imagepair at the base of the flame is shown in Fig. 11, with the two imagesseparate, and in Fig. 12 with the images spatially overlapped. Forclarity OH is shown in gray scale while the LII is shown in color. Itis evident that the OH sheet is found radially on the outside of the
of LII (top) and OH LIF (bottom), recorded at the base of the flame.
), doi:10.1016/j.combustflame.2009.03.002

10 T.L. Henriksen et al. / Combustion and Flame xxx (2009) xxx–xxx
ARTICLE IN PRESS
soot sheets, with good matching of their shapes. This is consistentwith the general expectation for this region of the flame where littleunburned soot is found outside the visible flame envelope, where OHmarks the oxidizer side of the reaction zone and the soot marks thefuel-rich side. It is also evident that despite the relatively poor signalto noise ratio, the OH can be discriminated from the soot because ofthe spatial separation of the two species.
By visual inspection of the entire set of simultaneous imagepairs, four categories of the spatial relationship between the sootand OH sheets were identified. These are:
I. OH is only present on the outside (right hand side) of thesoot sheet
Fig. 12. Overlapped im
Fig. 13. Example of category I, O
Please cite this article in press as: T.L. Henriksen et al., Combust. Flame (2009
II. OH is present to the right and left/top/bottom of the sootsheet
III. Soot appears to be ‘‘breaking through” an OH regionIV. There is a strong visual correlation in the shape of the soot
and OH sheets.
Examples of each category are shown in Figs. 13–16. Of theseclassifications, only the first and last are mutually exclusive. Asample of approximately 130 simultaneous images from variousheights was assessed statistically, and the results are shown inFig. 17. Though subjective, some consistent and interesting trendsare apparent. Firstly, the shape of the OH distribution is stronglycorrelated with that of the soot sheets in general, although this de-
ages from figure.
H on the right side of soot.
), doi:10.1016/j.combustflame.2009.03.002
T.L. Henriksen et al. / Combustion and Flame xxx (2009) xxx–xxx 11
ARTICLE IN PRESS
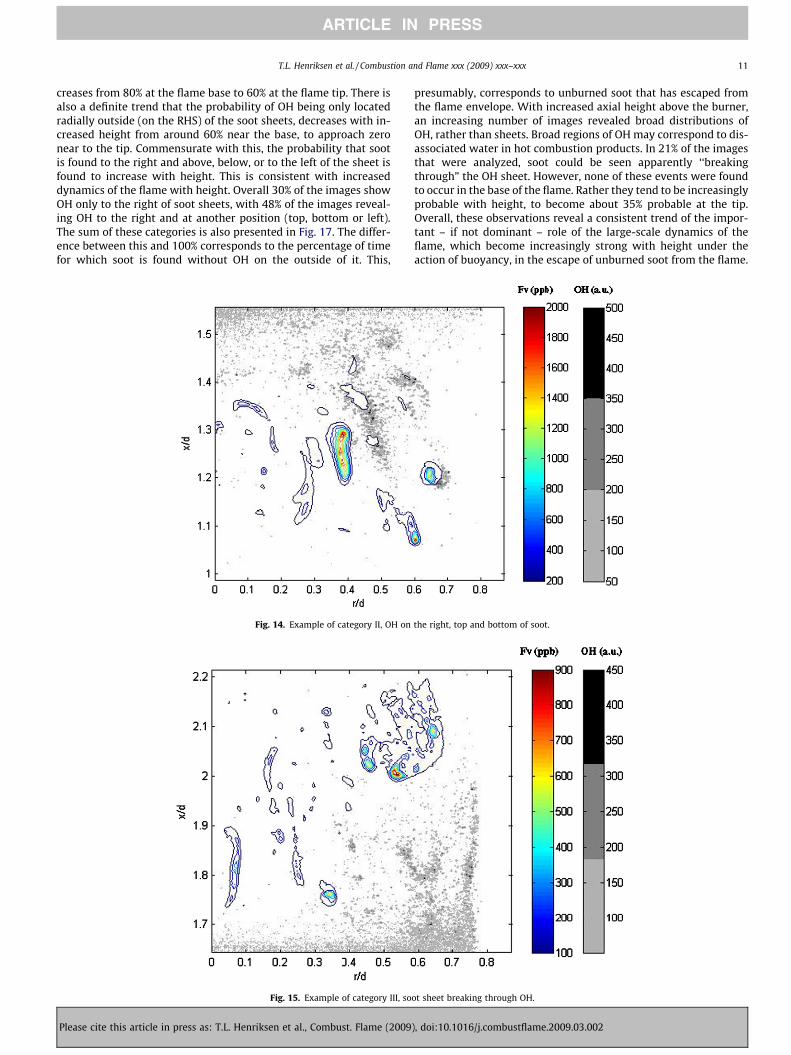
creases from 80% at the flame base to 60% at the flame tip. There isalso a definite trend that the probability of OH being only locatedradially outside (on the RHS) of the soot sheets, decreases with in-creased height from around 60% near the base, to approach zeronear to the tip. Commensurate with this, the probability that sootis found to the right and above, below, or to the left of the sheet isfound to increase with height. This is consistent with increaseddynamics of the flame with height. Overall 30% of the images showOH only to the right of soot sheets, with 48% of the images reveal-ing OH to the right and at another position (top, bottom or left).The sum of these categories is also presented in Fig. 17. The differ-ence between this and 100% corresponds to the percentage of timefor which soot is found without OH on the outside of it. This,
Fig. 14. Example of category II, OH on
Fig. 15. Example of category III, so
Please cite this article in press as: T.L. Henriksen et al., Combust. Flame (2009
presumably, corresponds to unburned soot that has escaped fromthe flame envelope. With increased axial height above the burner,an increasing number of images revealed broad distributions ofOH, rather than sheets. Broad regions of OH may correspond to dis-associated water in hot combustion products. In 21% of the imagesthat were analyzed, soot could be seen apparently ‘‘breakingthrough” the OH sheet. However, none of these events were foundto occur in the base of the flame. Rather they tend to be increasinglyprobable with height, to become about 35% probable at the tip.Overall, these observations reveal a consistent trend of the impor-tant – if not dominant – role of the large-scale dynamics of theflame, which become increasingly strong with height under theaction of buoyancy, in the escape of unburned soot from the flame.
the right, top and bottom of soot.
ot sheet breaking through OH.
), doi:10.1016/j.combustflame.2009.03.002
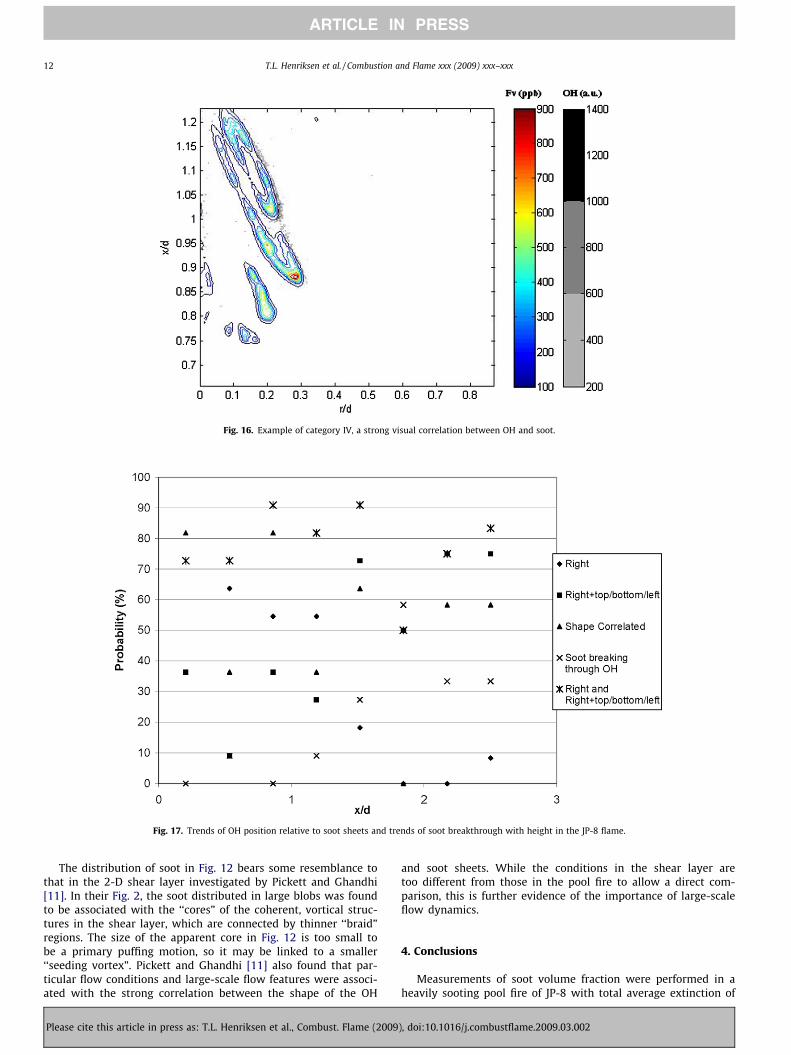
Fig. 16. Example of category IV, a strong visual correlation between OH and soot.
Fig. 17. Trends of OH position relative to soot sheets and trends of soot breakthrough with height in the JP-8 flame.
12 T.L. Henriksen et al. / Combustion and Flame xxx (2009) xxx–xxx
ARTICLE IN PRESS
The distribution of soot in Fig. 12 bears some resemblance tothat in the 2-D shear layer investigated by Pickett and Ghandhi[11]. In their Fig. 2, the soot distributed in large blobs was foundto be associated with the ‘‘cores” of the coherent, vortical struc-tures in the shear layer, which are connected by thinner ‘‘braid”regions. The size of the apparent core in Fig. 12 is too small tobe a primary puffing motion, so it may be linked to a smaller‘‘seeding vortex”. Pickett and Ghandhi [11] also found that par-ticular flow conditions and large-scale flow features were associ-ated with the strong correlation between the shape of the OH
Please cite this article in press as: T.L. Henriksen et al., Combust. Flame (2009
and soot sheets. While the conditions in the shear layer aretoo different from those in the pool fire to allow a direct com-parison, this is further evidence of the importance of large-scaleflow dynamics.
4. Conclusions
Measurements of soot volume fraction were performed in aheavily sooting pool fire of JP-8 with total average extinction of
), doi:10.1016/j.combustflame.2009.03.002

T.L. Henriksen et al. / Combustion and Flame xxx (2009) xxx–xxx 13
ARTICLE IN PRESS
35–50% and peak instantaneous extinction of up to 70%. It is notyet realistic to correct for the effects of signal trapping in a turbu-lent flame, which, under these conditions, are significant. Calibra-tion was performed against a small laminar pool fire of JP-8using Choi’s method [32] to account for signal trapping. The errorassociated with the calibration constant was found to be 22%, lar-gely because the laminar flame was not truly steady, but exhibitedfractionation due to the fixed pool of liquid. However, these error-bars were comparable with the overall uncertainty in the measure-ment of 21%, evaluated by a direct comparison of the LII derivedextinction with a direct and independent measure of extinction.The LII measurement of extinction was found to be consistentlylower than the actual extinction, consistent with the influence ofsignal trapping in the turbulent flame.
The time averaged soot volume fraction, �f v in the JP-8 poolfire was found to exhibit a peak value of about 0.40 ppm. Thisagrees quite well with the value measured elsewhere by asemi-intrusive measure for a larger flame [22], and is half an or-der of magnitude greater than the values measured in propanejet flames [20], consistent with a higher soot loading. This peakis located on the burner axis close to the burner surface at x/d = 0.004. The time averaged peak value is an order of magnitudelower than the peak instantaneous value, f 0v ;max, measured to beabout 2.5 ppm. However, these values are probably slightly low-er than the true values due to the combined effects of signaltrapping and PAH attenuation. The radial distributions of �f v werefound to decrease from the centerline to the edge in approxi-mately a Gaussian fashion, and a comparison of soot volumefraction on the left and right side of the flame revealed a slightpower loss in the LII signal intensity due to attenuation. Theprobability of not finding soot at a given location, termed theintermittency, I, was found to increase along the centerline ofthe pool fire from a low of about 35% near to the base, to beapproximately constant at about 50% elsewhere. The total sootvolume per meter, obtained by integrating �f v through planardisks, was measured to increase with height through the flamefrom 2.5 mm2 to 3.5 mm2, consistent with considerable sootbeing emitted from the flame. The probability density functionsof fv were found to be approximately exponential. However,the most probable value of fv was slightly greater than zerowhere I was lowest, resulting in some departure from an expo-nential distribution for those conditions.
The simultaneous imaging of fv by LII and of OH by planar LIF,performed in a JP-8 pool fire, revealed the generally expected trendof the OH typically being found in sheets adjacent to soot layers,confirming the reliability of the detection method. The sheets ina sample of the image pairs were visually sorted into four catego-ries. Clear differences were found in the base and tip regions of theflame. On average, 52% of the OH sheets were found to exhibit astrong visual correlation to the shape of the soot sheets. Howeverthis correlation decreased from 80% at the base, to about 60% nearto the tip. The probability that the OH was found predominantly onthe outside (RHS) of the OH was found to decrease from approxi-mately 60% near the base to less than 10% near to the tip, consis-tent with increased dynamics of the large structures with height,under the influence of buoyancy. Likewise, the number of eventsin which soot was judged to be ‘‘breaking through” the reactionzone marked by OH, and into the oxidizer stream, was found to in-crease from zero at the flame base to around 35% near to the tip.This implies an important role of large-scale dynamics in the es-cape of soot from the flame.
Please cite this article in press as: T.L. Henriksen et al., Combust. Flame (2009
Acknowledgments
This work was sponsored by the Center for the Simulation ofAccidental Fires and Explosions at the University of Utah, whichwas funded by the U.S. Department of Energy under Contract No.LLL B341493, with matching funds provided by the University ofUtah Research Fund. The Fluid Mechanics, Energy and CombustionGroup at the University of Adelaide, and the Australian ResearchCouncil provided experimental support. The authors would liketo gratefully acknowledge the support of Dr. Keith King at the Uni-versity of Adelaide; Dr. Adel Sarofim, and Mr. Dana Overacker atthe University of Utah.
References
[1] R.S. Barlow, Sandia H2/He Flame Data – Release 2.0, Sandia NationalLaboratories, 2003. Available from: <http://www.ca.sandia.gov/TNF>.
[2] R.S. Barlow, C.D. Carter, Combust. Flame 97 (1994) 261–280.[3] R.S. Barlow, C.D. Carter, Combust. Flame 104 (1996) 288–299.[4] Y. Xin, J. Gore, in: 35th National Heat Transfer Conference, June 10–12, 2001.[5] K. Koshe-Honehaus, J.B. Jeffries, Applied Combustion Diagnostics, Taylor and
Francis, New York, 2002.[6] K.P. Geigle, Y. Schneider-Kuhnle, M.S. Tsurikov, R. Hadef, R. Luckerath, V.
Kruger, W. Stricker, M. Aigner, P.E. Bengtsson, G. Smallwood, Proc. Combust.Inst. 30 (2005) 1645–1653.
[7] M.S. Tsurikov, K.P. Geigle, V. Kruger, Y. Schneider-Kuhnle, W. Sticker, R.Luckrath, R. Hadef, M. Aigner, Combust. Sci. Technol. 177 (2005) 1835–1862.
[8] L.L. McCrain, W.L. Roberts, Combust. Flame 140 (2005) 60–69.[9] K.A. Thomson, D.R. Snelling, G.J. Smallwood, F. Liu, Appl. Phys. B 83 (2006)
469–475.[10] J. Reimann, S. Wil, Microgravity Sci. Technol. 16 (2005) 333–337.[11] L.M. Pickett, J.B. Ghandi, Combust. Flame 132 (2003) 138–152.[12] M. Commodo, S. Violi, A. D’Anna, A. D’Alessio, C. Allouis, F. Beretta, P. Minutolo,
Combust. Sci. Technol. 179 (2007) 387–400.[13] Y. Xin, J.P. Gore, Proc. NHTC 1 (2001) 923–929.[14] C.R. Shaddix, J.E. Harrington, K.C. Smyth, Combust. Flame 99 (1994) 723–
732.[15] C.R. Shaddix, K.C. Smyth, Combust. Flame 107 (1996) 418–452.[16] D.R. Snelling, G.J. Smallwood, R.A. Sawchuk, W.S. Neil, D. Gareau, D.J. Clavel,
W.L. Chippior, F. Liu, O.L. Gulder, W.D. Bachalo, SAE Technical Paper Series,Warrendale, PA, 2000.
[17] A. Boiarciuc, F. Foucher, C. Mounaim-Rousselle, Appl. Phys. B 83 (2006) 413–421.
[18] A. Boiarciuc, F. Foucher, B. Moreau, O. Pajot, C. Mounaim-Rousselle, in:Proceedings of the 12th International Symposium on Application of LaserTechniques to Fluid Mechanics, Lisbon, 2004.
[19] D.R. Snelling, G.J. Smallwood, R.A. Sawchuk, W.S. Neil, D. Gareau, W.L.Chippior, F. Liu, O.L. Gulder, SAE Technical Paper 1999-01-3653, Warrendale,PA, 1999.
[20] N. Qamar, G.J. Nathan, Z.T. Alwahabi, K.D. King, Proc. Combust. Inst. 30 (2005)1493–1500.
[21] T.R. Meyer, S. Roy, S.P. Gogineni, V.M. Belovich, E. Corporan, J.R. Gord, Proc.ASME Turbo Expo: Combust. Fuels Educ. 1 (2004) 827–836.
[22] J.J. Murphy, C.R. Shaddix, Combust. Sci. Technol. 178 (2006) 865–894.[23] Y. Xin, J.P. Gore, G.J. Nathan, M.A. Mikofski, K.P. Geigle, Proc. Combust. Inst. 30
(2005) 719–726.[24] N. Qamar, Z.T. Alwahabi, Q.N. Chan, G.J. Nathan, D. Roekaerts, in: Proceedings
of the Australian Combustion Symposium, University of Sydney, December 9–11, 2007, pp. 42–45.
[25] R.W. Schefer, M. Namazian, J. Kelly, Opt. Lett. 16 (11) (1991) 858–861.[26] S.H. Starner, R.W. Bilger, R.W. Dibble, R.S. Barlow, D.C. Fourguette, M.B. Long,
Int. Symp. Combust. 24 (1992) 341–349.[27] C.D. Carter, J.M. Donobar, J.F. Driscoll, Appl. Phys. B: Lasers Opt. 66 (1) (1998)
129–132.[28] N. Qamar, Z.T. Alwahabi, Q.N. Chan, G.J. Nathan, D. Roekaerts, Combust. Flame,
in press, doi:10.1016/j.combustflame.2009.02.011.[29] D.A. Kliner, R.L. Farrow, J. Chem. Phys. 110 (1999) 412–422.[30] E.G. Eddings, S. Yan, W. Ciro, A.F. Sarofim, Combust. Sci. Technol. 177 (2005)
715–735.[31] T.L. Henriksen, Ph.D. Thesis, The University of Utah, May 2008.[32] M.Y. Choi, K.A. Jensen, Combust. Flame 112 (1998) 485–491.[33] J. Zhu, M.Y. Choi, G.W. Mulholland, S.L. Manzello, L.A. Gritzo, J. Suo-Anttila,
Proc. Combust. Inst. 29 (2002) 2367–2374.[34] T.L. Henriksen, G.J. Nathan, T.A. Ring, E.G. Eddings, Combust. Sci. Technol. 180
(4) (2008) 699–712.
), doi:10.1016/j.combustflame.2009.03.002
Related Documents