COMBINING THE MICROWAVE MODEL CLOUD AND THE GROWTH MODEL PROMET-V FOR SOIL MOISTURE RETRIEVAL FROM ERS-SAR DATA Roswitha Stolz (1) , Karl Schneider (1) , Leon Schouten (2) , Hans van Leeuwen (2) , Heike Bach (3) (1) Institute for Geography, University of Munich Luisenstr. 37, 80333Munich, Germany [email protected] [email protected] (2) SYNOPTICS Integrated Remote Sensing & GIS Applications BV P.O. Box 117, 6700 AC Wageningen The Netherlands [email protected] (3) VISTA- Remote Sensing Applications in Geosciences GmbH Luisenstr.45, 80333 Munich Germany [email protected] ABSTRACT Within the frame of the project GeoBIRD (ESA contract 12950/98/NL/GD entitled "Retrieval of geo- and bio-physical information from remote sensing data") an attempt was made to derive soil moisture by combining the microwave remote sensing model CLOUD and the land surface process model PROMET-V (PROcess oriented Modular Environment and Vegetation model. Three test sites in Europe, which show different dominant vegetation types were chosen. The CLOUD model was fitted for each of the vegetation types. The plant water content which is a central vegetation parameter required for the CLOUD model was derived from PROMET-V and the backscatter values are extracted from corrected and calibrated ERS data. By inverting the CLOUD model, the spatially distributed soil moisture values can be calculated. These modelled soil moisture results are compared to in situ soil moisture measurements which are available for selected fields in the different testsites. A sensitivity study was carried out and the achieved accuracies are compared and discussed. 1. INTRODUCTION Soil moisture is an important land surface parameter, which can limit vegetation growth and plays a key role in the hydrological cycle as well as in agriculture. It is an important storage term regarding the water budget and reflects changes in the water mass balance. In addition, soil moisture not only exerts an important control on the transfer of energy and water at the land surface, it is also a major factor in development of floods [1]. Despite its importance, it is rarely used in land surface process models as an input parameter. This may be due to two limiting elements. Firstly to the difficulties which occur in measuring soil moisture consistently over large areas, and secondly to its high spatially and temporally variability especially near the surface. While synoptic and spatially covering surface soil moisture measurements are not feasible using conventional measuring techniques, remote sensing of the backscatter in the microwave region provides a means to calculate surface soil moisture [1,2]. Although most of the experiments which have proven that soil moisture can be detected using ERS data are dealing with bare soil conditions [3,2], a number of experiments show good results in estimating soil moisture under vegetation [11,13]. To detect soil moisture under vegetation cover, the influence of the canopy has to be eliminated. Thus, for deriving soil moisture on a spatial scale, the type and growth condition of the vegetation cover are important parameters and their influences have to be eliminated [2,5]. ULABY et al pointed out that based on theoretical model predictions as well as experimental observations, strong evidence exists in support of radar's potential for sensing soil moisture under vegetation cover, but no operational algorithm exists at present [2]. Therefore within the frame of the project GeoBIRD (ESA contract 12950/98/NL/GD entitled "Retrieval of geo- and bio-physical information from remote sensing data") an attempt was made to derive soil moisture by combining the radiative transfer model CLOUD, developed by ATTEMA and ULABY 1978 [7] and the land surface process model

Welcome message from author
This document is posted to help you gain knowledge. Please leave a comment to let me know what you think about it! Share it to your friends and learn new things together.
Transcript
COMBINING THE MICROWAVE MODEL CLOUD AND THE GROWTH MODELPROMET-V FOR SOIL MOISTURE RETRIEVAL FROM ERS-SAR DATA
Roswitha Stolz (1), Karl Schneider(1) , Leon Schouten (2), Hans van Leeuwen(2), Heike Bach (3)
(1)Institute for Geography, University of MunichLuisenstr. 37, 80333Munich, Germany
[email protected]@iggf.geo.uni-muenchen.de
(2) SYNOPTICS Integrated Remote Sensing & GIS Applications BVP.O. Box 117, 6700 AC Wageningen
(3) VISTA- Remote Sensing Applications in Geosciences GmbHLuisenstr.45, 80333 Munich
ABSTRACT
Within the frame of the project GeoBIRD (ESA contract 12950/98/NL/GD entitled "Retrieval of geo- and bio-physicalinformation from remote sensing data") an attempt was made to derive soil moisture by combining the microwaveremote sensing model CLOUD and the land surface process model PROMET-V (PROcess oriented ModularEnvironment and Vegetation model. Three test sites in Europe, which show different dominant vegetation types werechosen. The CLOUD model was fitted for each of the vegetation types. The plant water content which is a centralvegetation parameter required for the CLOUD model was derived from PROMET-V and the backscatter values areextracted from corrected and calibrated ERS data.By inverting the CLOUD model, the spatially distributed soil moisture values can be calculated. These modelled soilmoisture results are compared to in situ soil moisture measurements which are available for selected fields in thedifferent testsites. A sensitivity study was carried out and the achieved accuracies are compared and discussed.
1. INTRODUCTION
Soil moisture is an important land surface parameter, which can limit vegetation growth and plays a key role in thehydrological cycle as well as in agriculture. It is an important storage term regarding the water budget and reflectschanges in the water mass balance. In addition, soil moisture not only exerts an important control on the transfer ofenergy and water at the land surface, it is also a major factor in development of floods [1]. Despite its importance, it israrely used in land surface process models as an input parameter. This may be due to two limiting elements. Firstly tothe difficulties which occur in measuring soil moisture consistently over large areas, and secondly to its high spatiallyand temporally variability especially near the surface. While synoptic and spatially covering surface soil moisturemeasurements are not feasible using conventional measuring techniques, remote sensing of the backscatter in themicrowave region provides a means to calculate surface soil moisture [1,2].Although most of the experiments which have proven that soil moisture can be detected using ERS data are dealingwith bare soil conditions [3,2], a number of experiments show good results in estimating soil moisture under vegetation[11,13]. To detect soil moisture under vegetation cover, the influence of the canopy has to be eliminated. Thus, forderiving soil moisture on a spatial scale, the type and growth condition of the vegetation cover are important parametersand their influences have to be eliminated [2,5]. ULABY et al pointed out that based on theoretical model predictions aswell as experimental observations, strong evidence exists in support of radar's potential for sensing soil moisture undervegetation cover, but no operational algorithm exists at present [2].Therefore within the frame of the project GeoBIRD (ESA contract 12950/98/NL/GD entitled "Retrieval of geo- andbio-physical information from remote sensing data") an attempt was made to derive soil moisture by combining theradiative transfer model CLOUD, developed by ATTEMA and ULABY 1978 [7] and the land surface process model
PROMET-V (PROcess oriented Modular Environment and Vegetation model (PROMET-V)) developed bySCHNEIDER and MAUSER to estimate soil moisture using ERS-SAR data for different agricultural landuse.
2. TEST-SITES
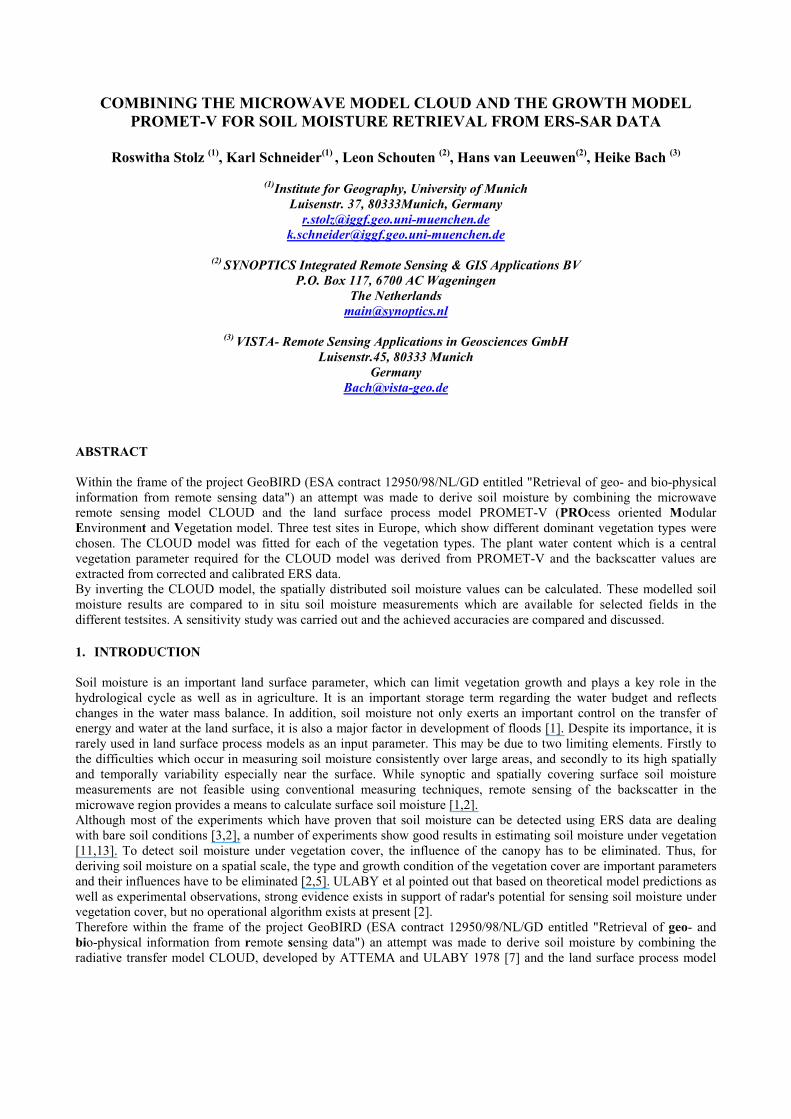
The derived methods have to be applicable for a large variety of different vegetation types as well as for areas ofdifferent climatic and surface conditions. Therefore the soil moisture study within GeoBIRD was performed for the landuse classes maize, wheat and grassland, which are prominent land use types in middle Europe within three verydifferent environments:- Flevoland (Netherlands)- Upper Rhine Valley (Germany)- Alpine Foreland (Germany)
Fig.1: Geographical distribution of the test-sites
All test-sites vary strongly in soil and climatic conditions. Additionally the Alpine Foreland test-site, which is withmore than 700 km² the largest one, shows a very rugged terrain. Table 1 gives a short overview on the three testsites.
Tab.1: Overview on the natural conditions of the agricultural test-sites
Test site Location(center coordinate) Size Mean annual temperature
Mean annual precipitationTerrain/elevation
Main land useclasses
Alpine Foreland 47.5°N, 11°E 710 km² 6.0 - 7.7 °C1100 - 1500 mm
Rugged550m-2000m
Grassland,cereals
Upper Rhine Valley 48°N, 8°E 50 km² 10°C650 mm
Flat200m Maize, cereals
Flevoland 52.5°N, 5.5°E 40 km² 9.5°C800 mm
Flat -2 - +2m
Cereals, beet,potatoes
3. METHOD
According to ULABY et al [2] the ERS-SAR instrument is with 5.3. Ghz and an incident angle of 23° well suited forsoil moisture detection. Due to the steep incidence angle and the appearance of the canopy, soil moisture can bedetected under agricultural vegetation. However, it is necessary to correct the influence of the vegetation cover and thesoil effects. Therefore it is necessary to use a model which considers the vegetation and soil influences on thebackscatter signal. For the scope of GeoBIRD only semi-empirical models are taken into account. One of the firstradiative transfer models which has been developed by ATTEMA and ULABY 1978 [7] is the semi-empirical CLOUDmodel. It was developed to simulate the total backscatter under consideration of the local incidence angles and the
Upper Rhine
(Germany)Valley
Flevoland(Netherlands)
Alpine Foreland(Germany)
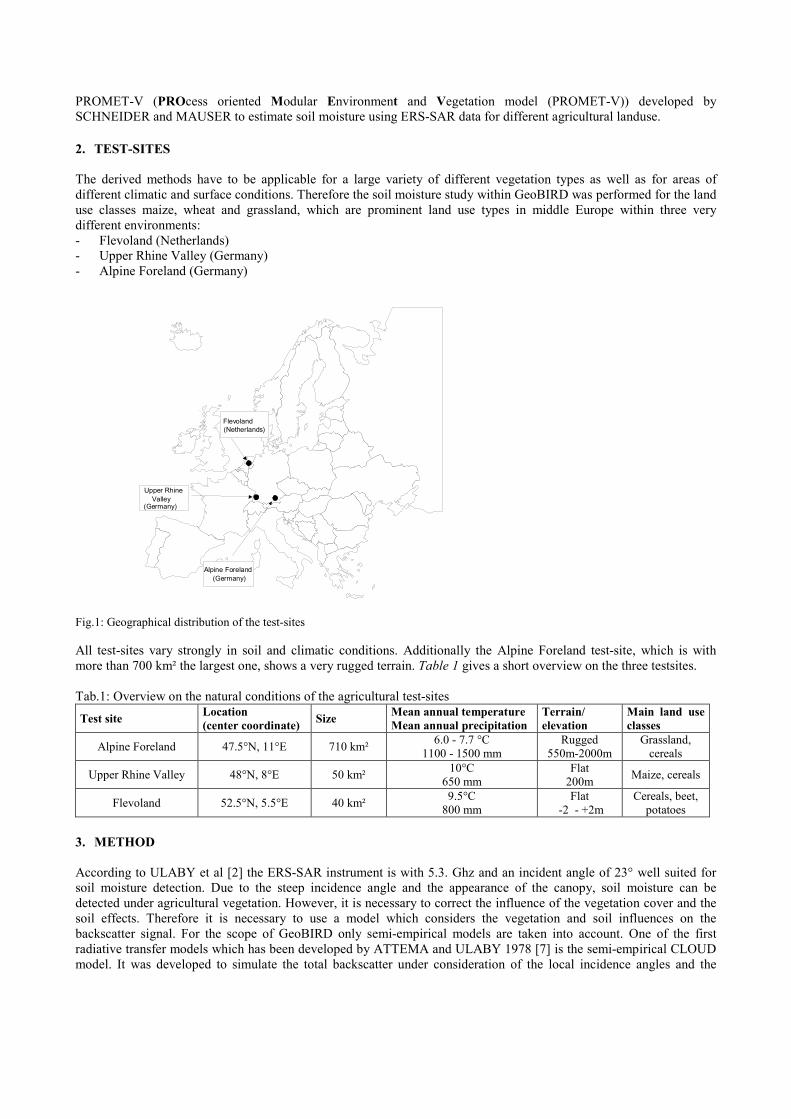
influences of vegetation and soil roughness. In this model the vegetation is represented as a collection of small identicalwater droplets (a cloud). The vegetative matter, that is the stems and leaves, holds the droplets in place [7]. The modelconsists of two terms. The first one refers to the direct backscatter from the soil underneath the vegetation corrected forthe attenuation by the vegetation. The second term refers to the direct backscatter of the vegetation layer. The totalbackscatter of the vegetation is the result of the contribution of the individual droplets that can be added incoherently.The formulation of the model is shown in Eq.1.
θθθθθθθθγγγγ cos***
cos**
*1*dwDmBdwD
lin eGeC−−−−−−−−
++++
−−−−==== (1)
withγlin total backscatter = σ0 / cos(θ) [-]C parameter related to the dielectric and structural properties of the vegetationD parameter related to the extinction properties of the vegetationG soil roughness parameterB parameter related to the dielectric properties of the soilθ incidence angle [degrees]W gravimetric water content of the vegetation layer [kg/m³]d height of the vegetation layer [m]ms gravimetric soil moisture content [Vol.%]
This general equation requires four constants. Two of them are related to the properties of the soil (G and B) and theother two are related to the crop or the vegetation layer (C and D). These constants will have to be estimated by fittingprocedures.
3.1. Fitting Procedure of the CLOUD Model
For its application in the agricultural test-sites, the CLOUD parameters were calibrated for the land use classes maize,wheat and meadows. Two groups of land use classes were distinguished:
• small-leaved crops (wheat, meadows), where the attenuation of the canopy is assumed to be more dominant.• broad-leaved crops (maize), where besides some attenuation by the canopy layer the backscatter of the canopy
is more significant.Fitting the parameters for CLOUD was conducted by SYNOPTICS Integrated Remote Sensing & GIS Applications BV ,one of the partners within the GEoBIRD project. It was done using the ERS backscatter and ground truth data fromdifferent fields regarding the canopy water content and the soil moisture of the three test-sites. For each crop theCLOUD parameters have to be fitted separately. This was done by applying the Levenberg-Marquardt algorithm, a non-linear regression technique. The fitting was carried out using the backscatter expressed in m²/m² (gamma linear) [8].The results are listed in Tab. 2. For small-leaved crops the C-parameter, which accounts for the backscatter of the crop,is assumed to be equal zero. For broad-leaved crops the two ERS acquisition modes (ascending and descending) weredifferentiated. A comparison of the parameters of the different crops shows that the parameter values are within asimilar range. Only the attenuation coefficient D of meadows is very small compared to the value of this parameter forwheat and maize.
Tab. 2: Derived CLOUD parameters per crop.
CropMaize
Parameter Wheat Meadows Asc. mode Desc. modeC - (0) - (0) 0.1912 0.1912D 0.4501 0.0871 0.6542 0.6542B 0.058 0.0131 0.058 0.058G 0.0384 0.0650 0.0282 0.0770
3.2. Soil Moisture Estimation using the CLOUD Model
By converting the CLOUD model it can be used to derive either the plant water content or the soil moisture. Thisrequires that the other free parameters are known. These are in the case of the soil moisture determination: The totalbackscatter and the plant water content. Sensitivity analyses of the CLOUD parameters of Tab.2 showed that the ERS
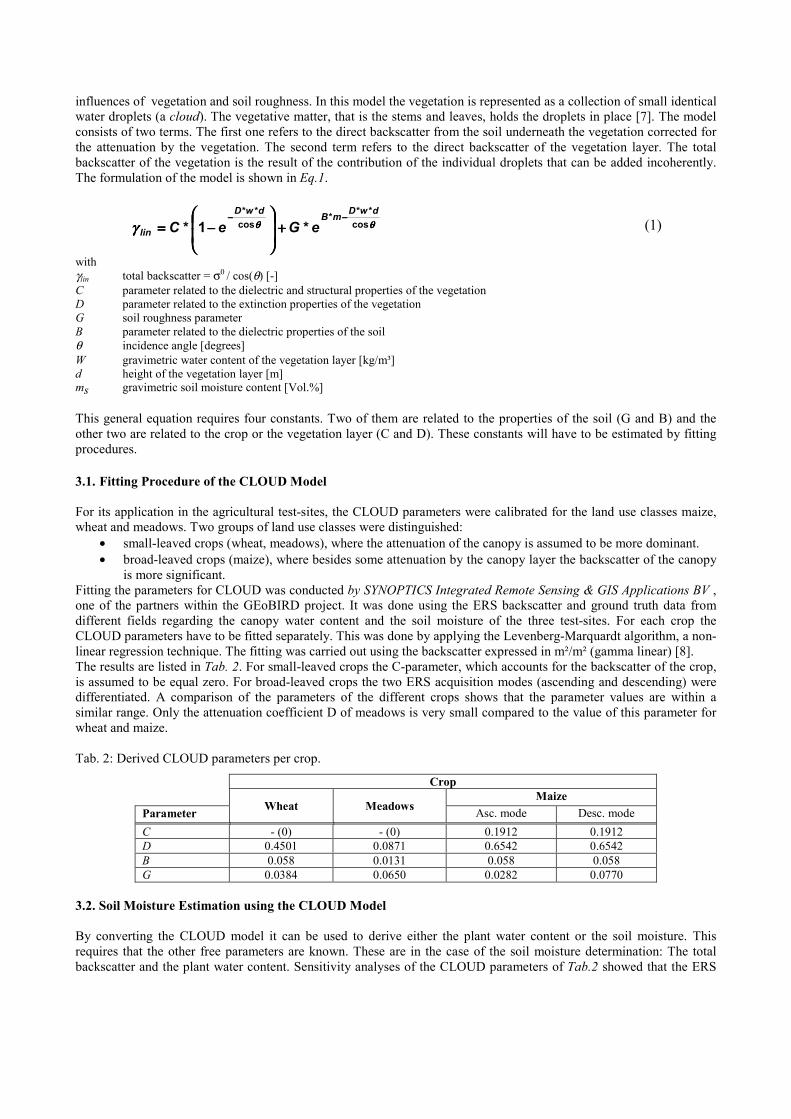
signal has a similar sensitivity to soil moisture and biomass. Soil moisture was selected to be the unknown parameter,which will be derived from the backscatter measurement. It was selected because compared to the vegetationparameters it shows a very high spatial and temporal variability. For most applications the knowledge about thisvariability is of particular importance. The remotely sensed radar backscatter can retrieved this variability much betterthan the relatively coarse land surface process model.The application of the CLOUD model is illustrated in Fig.2. Geometrically and radiometrically corrected ERSbackscatter intensities will serve as measured input [9]. The CLOUD model will be used in an inverted way to derivesoil moisture values from measured microwave backscatters. In order to set appropriate values of the vegetationparameters within CLOUD and to reach unique solutions for the inversion, biomass and canopy water content derivedfrom the vegetation growth model PROMET-V are used as input to the CLOUD model.
Fig. 2.: Combination of gmoisture
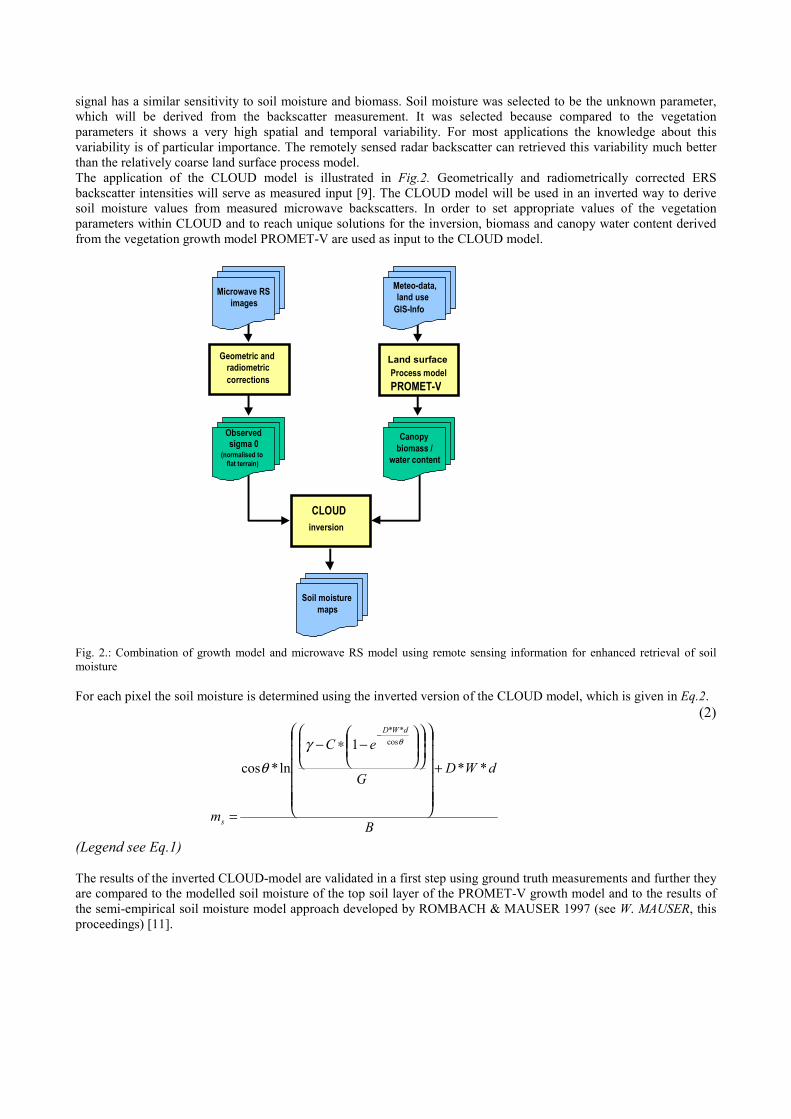
For each pixel the soil m
(Legend see Eq.1)
The results of the inverare compared to the mothe semi-empirical soilproceedings) [11].
rowth model and microwave RS model using remote sensing information for enhanced retrieval of soil
oisture is determined using the inverted version of the CLOUD model, which is given in Eq.2.(2)
ted CLOUD-model are validated in a first step using ground truth measurements and further theydelled soil moisture of the top soil layer of the PROMET-V growth model and to the results of
moisture model approach developed by ROMBACH & MAUSER 1997 (see W. MAUSER, this
B
dWDG
eC
m
dWD
s
**
1
ln*cos
cos**
+
−∗−
=
−θγ
θ
Microwave RSimages
Geometric andradiometriccorrections
CLOUDinversion
Land surfaceProcess modelPROMET-V
Meteo-data,land use
GIS-Info
Observedsigma 0
(normalised toflat terrain)
Soil moisturemaps
Canopybiomass /
water content
3.2.1. ERS-Data Convertion
To apply Eq. 2 the data have to be converted into total backscatter values, expressed as γlin (m²/m²). These are derivedfrom the calibrated and corrected intensities of the ERS-1 and 2 satellite data of the German test-sites using Eq. 3 and 4.
(3)
DN = calibrated intensity values multiplied by 10000
(4)
θ = local incidence angle
3.2.2. Deriving the Canopy Water Content from the Growth Model PROMET-V
The spatially distributed PROcess oriented Modular Environment and Vegetation model (PROMET-V)[10,12] is usedto provide the plant water content as input in the CLOUD model. PROMET-V models water, carbon and nitrogenfluxes, their interactions and feedback. The model is based on physical and plant physiological equations and consists ofseveral modules. Remote sensing data are used to provide spatially distributed model inputs, e.g. land use, to updatemodel parameters and to validate model results. The CERES model was selected as a basis to develop the plantproduction model for agricultural crops.Besides a list of energy balance and hydrological parameters, PROMET-V models for numerous plant parameters dailyvalues on a pixel base. For example wet and dry biomass, total LAI (leaf area index) and green LAI. Several PROMET-V outputs are required as input for CLOUD to parameterise the canopy. The plant water content in kg/m² is thenecessary vegetation input parameter for CLOUD. PROMET-V however, does not explicitly model the plant watercontent. Therefore it is necessary to derive it from other modelled plant parameters such as biomass, LAIgreen andLAItotal . During extensive field campaigns the growth height and the wet and dry biomass were measured for meadows,maize and wheat. For maize and wheat additionally the green LAI was measured. Using these ground truth data,regression calculations between the plant water content and the different measured plant parameters were carried out.For meadows there is a high correlation between the dry biomass and the plant water content. A coefficient ofdetermination as high as R² = 0.86 was achieved using more than 150 measurement points. Applying the regressionequation, the result shows that 82% of the total biomass is plant water. This result corresponds well to the values givenin literature. In the Alpine Foreland test-site where grassland is the dominating land use, the meadows are always cutbefore they dry out and develop brown leaves. So the relationship is valid over the complete vegetation period.Concerning the other crops there is no simple correlation between the plant water content and the dry biomass, which isvalid for the whole duration of the vegetation period, due to the drying out of the plants during senescence. During thedifferent phenological phases the course of the correlation changes. Instead, the total and green LAI seems to be bestsuited for a general relation with plant water, which is valid for all stages of growth. Ground truth measurements arecarried out during the vegetation period as well in the Upper Rhine valley test-site as in the Alpine Foreland testsite.The values from 10 maize fields and 7 cereal field were taken into account to determine a correlation between the LAIand the plant water content. To derive a function which is valid though out the whole vegetation period, not only thegreen LAI has to be taken into account. Due to the drying out of the plants during maturing, the fraction of the brownleaves has to be considered. This was done by deriving the remaining water content of a senescent, brown plant fromground truth measurements. This value is used as the constant c in the empirically derived relation of Eq. 5.
( )pw LAI c LAI LAIgreen green total≈ + × − (5)
pw = plant water indexFor maize: c = 0.48For cereals: c = 0.3
During the first vegetation periods the green LAI is equal to the total LAI and therefore the second term is zero. Whenthe plant starts ripening the total LAI consists of the green and the brown LAI and finally the green LAI is zero.Regressions between the measured plant water content and the LAI-relation shown in Eq.5 for maize and wheat were
dB DN=
⋅log1010000
10
γθ
=1010
dB
cos
calculated. The two correlations show high scores with a coefficient of determination R² = 0.67 for wheat and R² = 0.86for maize. A very probable reason for the higher correlation of maize is that the LAI measurements of maize can beperformed more accurately than for the cereals due to the larger leaves.For all three crops the spatially distributed plant water content required for CLOUD can now be calculated per pixelusing the PROMET-V model results for green and total LAI and biomass and the equations of regression.
3.3. The Validity Range of the CLOUD Parameter ConstantsThe fitting of the model constants C,B,G and D was carried out on the basis of ground truth measurements of a limitednumber of fields. Because the estimates are assessed statistically, the resulting values are only taking the dB values ofthe training fields into account. Hence it is very likely that the analysis of the radar data of the complete test-sites wouldshow a much wider range of dB values than covered by the selected ground truth fields. In this context it is important tocheck whether the range in which CLOUD is calibrated extends over the entire dB range of the land uses and soilmoisture conditions considered in the study. The dB values of the available meadows for the parameter fit range from–12 dB to –8.5 dB. A statistical analysis of 25 meadows randomly selected from the available ERS image data show arange of –15.7 to –6.7 dB (taken all acquisition dates into account). In order to check the sensitivity of the inversionprocess to the measured backscatter values, the inverted model equation (Eq.2) was used with a range of backscattervalues between the two extremes under consideration of different plant water content. This procedure was conducted formaize and wheat in the Freiburg and Flevoland test-sites as well. Tab. 3 shows an overview on the resulting soilmoisture values from the inverted CLOUD model at the extreme ends of the measured backscatter and for tworeasonable, but also extreme plant water contents.
Tab.3: Overview on the backscatter range of the ERS data of the different test-sites and the resulting soil moisturevalues applying CLOUD
Backscatter [dB] (measuredmean per field) Soil Moisture [Vol %]
at plant water 0.2 kg/m² at plant water 2.4 kg/m²LandusedBmin dBmax at dBmin at dBmax at dBmin at dBmax
Meadows -15.7 -6.7 -42.6 % 79.8 % -7.7 % 85.9 %Wheat -17,5 -3,6 -9.5 % 41.3 % 6.2 % 57.0 %Maize -11.5 -4.2 -5.6 % 27.7 % not defined 44.2 %
Tab. 3 clearly demonstrates that the whole range of valid parameter values is not covered through the calibration of theCLOUD model. Extremely high or even negative soil moisture values appear. For meadows reliable soil moisturevalues can be retrieved using the CLOUD model with the given parameter fit only within a backscatter range of –12 dBto –8.5 dB. Below and above the model is not reliable. Additionally it should be mentioned that with the given set ofcalibration constants for the CLOUD model it is clearly shown, that the plant water content only has minor influence onthe soil moisture content determined through the inversion of CLOUD. The model is only sensitive to large differencesin biomass (and consequently in plant water as well). For wheat (for both land use types the parameter C is zero), thevalidity range is much wider and the influence of the plant water becomes larger than for grassland. As expected, thestrongest dependency of the modelled soil moisture on the plant water is for maize. With increasing plant water contentthe inversion of the CLOUD model is not defined. The term in brackets on which the logarithm is applied becomes thennegative. This occurs above approx. 2 kg/m² plant water content and for dB values lower than –8 dB. Both values arewithin a realistic range and occur in this combination in reality on agricultural fields. This may indicate that the modeltheory may not adequately describe the scattering processes in canopies of broad-leaved crops. The model is notcalibrated for plant water contents above 5.5 kg/m² and below 0.2 kg/m². Then, soil moisture values higher than 100%or negative values, therefore meaningless, are modelled for all occurring dB values. Such high biomass values can behardly achieved, but some fields in the Alpine Foreland test-sites show them (modelled and measured).
4. RESULTS
For each of the three agricultural test-sites and each acquisition date a data set consisting of the radar backscatter, themodelled plant water content and the CLOUD parameters was obtained. Because the CLOUD parameter were onlycalibrated for the three major land use types wheat, maize and meadows, all other land uses were masked. The soilmoisture distributions resulting from the CLOUD model inversion are compared with the ground truth measurementsper field and the soil moisture values of the first soil layer modelled of PROMET-V.The CLOUD model uses measured ERS-backscatter. Therefore the retrieved surface soil moisture is limited by thepenetration depth of the C-band microwaves. PROMET-V uses general physical principles of mass and energy

conservation and a mechanistic description of the hydraulic flows of water in the plant and the soil. It models a layeredsoil and gives aggregated soil moisture information from the upper 5 cm [10]. Due to this model approach and thecomparatively coarse spatial scale at which the GIS-information on soil-properties and plant parameters are available,PROMET-V in general tends to show spatially more homogeneous soil moisture distributions. To make the resultsbetter comparable and to emphasise the soil moisture patterns in a test-site, the resulting soil moisture values areaggregated to classes, covering 10 Vol %.In addition, the fieldwise results are also compared with the ground truth measurements and the results derived from theso-called IGGF-model approach, which is as well a semi-empirical soil moisture model using the ERS backscatter. Thisapproach was developed by ROMBACH and MAUSER [11] and is further specified in a contribution of MAUSER inthese proceedings.
4.1 Retrieval of Soil Moisture in the Alpine Foreland Testsite
Fig.3: Res
not defined (<0%)Date: 14. June 1995
ults of the soil moisture retrieval for the Alpine Foreland test site
not defined (>80%)
not defined (equation notdefined)0% - 10%
20% - 30%
10% - 20%
50% - 60%
40% - 50%
30% - 40%
60% - 80%
soil moisture retrieved from the CLOUD model soil moisture retrieved from thePROMET-V growth model
maizespring barley
winter barleyspring wheatwinter wheat
meadows
coniferous forestdeciduous forest
built-up areaswater
loam Lt2
sandy loam Ls3
loamy sand Sl3
loam L
clay T
water
organic soil
rock
loamy sand Sl4
soil typesland use
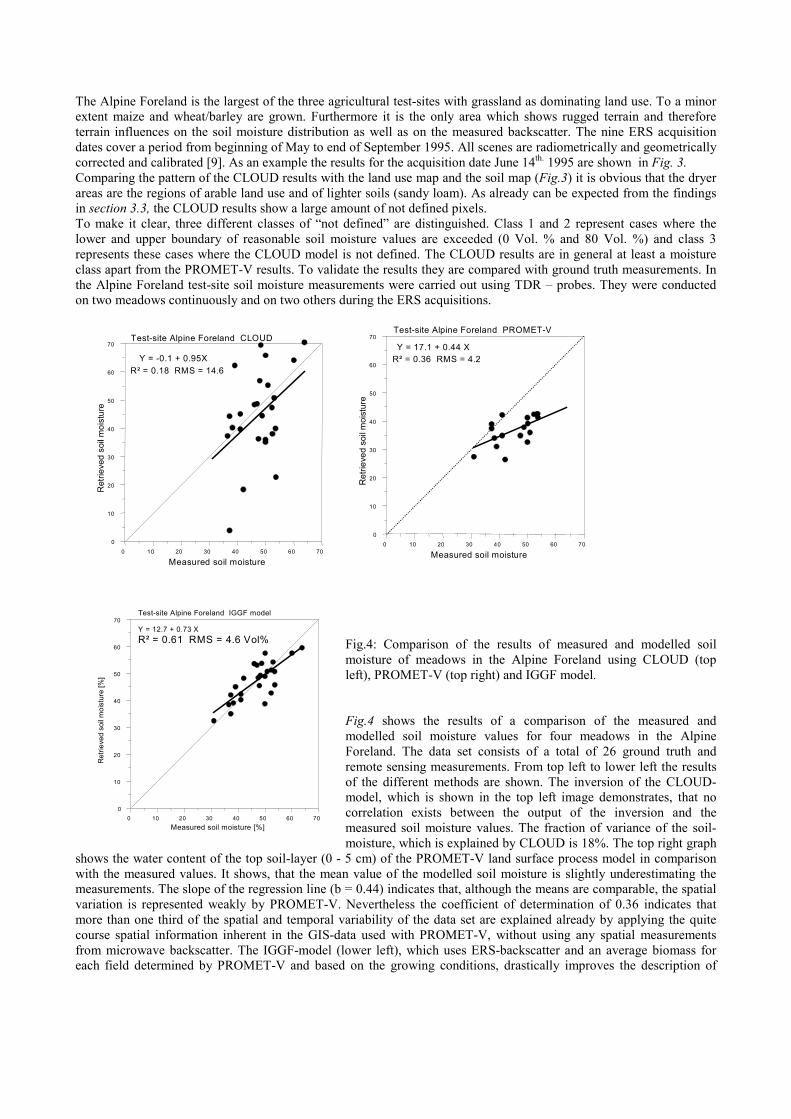
The Alpine Foreland is the largest of the three agricultural test-sites with grassland as dominating land use. To a minorextent maize and wheat/barley are grown. Furthermore it is the only area which shows rugged terrain and thereforeterrain influences on the soil moisture distribution as well as on the measured backscatter. The nine ERS acquisitiondates cover a period from beginning of May to end of September 1995. All scenes are radiometrically and geometricallycorrected and calibrated [9]. As an example the results for the acquisition date June 14th. 1995 are shown in Fig. 3.Comparing the pattern of the CLOUD results with the land use map and the soil map (Fig.3) it is obvious that the dryerareas are the regions of arable land use and of lighter soils (sandy loam). As already can be expected from the findingsin section 3.3, the CLOUD results show a large amount of not defined pixels.To make it clear, three different classes of “not defined” are distinguished. Class 1 and 2 represent cases where thelower and upper boundary of reasonable soil moisture values are exceeded (0 Vol. % and 80 Vol. %) and class 3represents these cases where the CLOUD model is not defined. The CLOUD results are in general at least a moistureclass apart from the PROMET-V results. To validate the results they are compared with ground truth measurements. Inthe Alpine Foreland test-site soil moisture measurements were carried out using TDR – probes. They were conductedon two meadows continuously and on two others during the ERS acquisitions.
Fig.4: Comparison of the results of measured and modelled soilmoisture of meadows in the Alpine Foreland using CLOUD (topleft), PROMET-V (top right) and IGGF model.
Fig.4 shows the results of a comparison of the measured andmodelled soil moisture values for four meadows in the AlpineForeland. The data set consists of a total of 26 ground truth andremote sensing measurements. From top left to lower left the resultsof the different methods are shown. The inversion of the CLOUD-model, which is shown in the top left image demonstrates, that nocorrelation exists between the output of the inversion and themeasured soil moisture values. The fraction of variance of the soil-moisture, which is explained by CLOUD is 18%. The top right graph
shows the water content of the top soil-layer (0 - 5 cm) of the PROMET-V land surface process model in comparisonwith the measured values. It shows, that the mean value of the modelled soil moisture is slightly underestimating themeasurements. The slope of the regression line (b = 0.44) indicates that, although the means are comparable, the spatialvariation is represented weakly by PROMET-V. Nevertheless the coefficient of determination of 0.36 indicates thatmore than one third of the spatial and temporal variability of the data set are explained already by applying the quitecourse spatial information inherent in the GIS-data used with PROMET-V, without using any spatial measurementsfrom microwave backscatter. The IGGF-model (lower left), which uses ERS-backscatter and an average biomass foreach field determined by PROMET-V and based on the growing conditions, drastically improves the description of
0
10
20
30
40
50
60
70
Ret
rieve
d so
il m
oist
ure
[%]
0 10 20 30 40 50 60 70Measured soil moisture [%]
Test-site Alpine Foreland IGGF model
Y = 12.7 + 0.73 XR² = 0.61 RMS = 4.6 Vol%
0
10
20
30
40
50
60
70
Ret
rieve
d so
il m
oist
ure
0 10 20 30 40 50 60 70
Measured soil moisture
Test-site Alpine Foreland PROMET-V
Y = 17.1 + 0.44 XR² = 0.36 RMS = 4.2
0
10
20
30
40
50
60
70
Ret
rieve
d so
il m
oist
ure
0 10 20 30 40 50 60 70
Measured soil moisture
Test-site Alpine Foreland CLOUD
Y = -0.1 + 0.95XR² = 0.18 RMS = 14.6
spatial soil moisture variability. The slope of the regression line increases to 0.73 and 61% of the variability in the dataset are explained using this approach which takes advantage of physically based microwave backscatter measurements.The slope of the regression line also drastically increases from b = 0.44 when only using PROMET-V to b = 0.73 whenusing the remote sensing based IGGF-approach. This indicates, that 73% of the dynamic range of the measured soil-moisture is captured by the IGGF-model based on the measurement of microwave backscatter.
4.2. Retrieval of soil moisture in the Upper Rhine Valley and Flevoland test-site
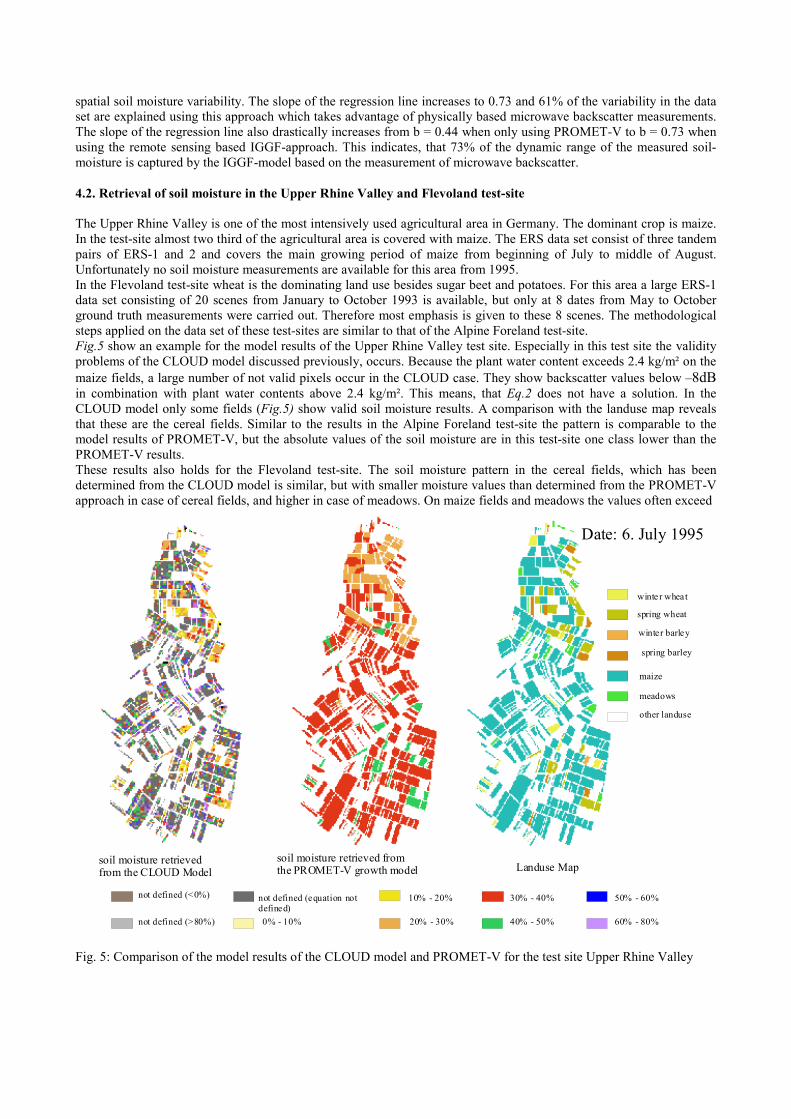
The Upper Rhine Valley is one of the most intensively used agricultural area in Germany. The dominant crop is maize.In the test-site almost two third of the agricultural area is covered with maize. The ERS data set consist of three tandempairs of ERS-1 and 2 and covers the main growing period of maize from beginning of July to middle of August.Unfortunately no soil moisture measurements are available for this area from 1995.In the Flevoland test-site wheat is the dominating land use besides sugar beet and potatoes. For this area a large ERS-1data set consisting of 20 scenes from January to October 1993 is available, but only at 8 dates from May to Octoberground truth measurements were carried out. Therefore most emphasis is given to these 8 scenes. The methodologicalsteps applied on the data set of these test-sites are similar to that of the Alpine Foreland test-site.Fig.5 show an example for the model results of the Upper Rhine Valley test site. Especially in this test site the validityproblems of the CLOUD model discussed previously, occurs. Because the plant water content exceeds 2.4 kg/m² on themaize fields, a large number of not valid pixels occur in the CLOUD case. They show backscatter values below –8dBin combination with plant water contents above 2.4 kg/m². This means, that Eq.2 does not have a solution. In theCLOUD model only some fields (Fig.5) show valid soil moisture results. A comparison with the landuse map revealsthat these are the cereal fields. Similar to the results in the Alpine Foreland test-site the pattern is comparable to themodel results of PROMET-V, but the absolute values of the soil moisture are in this test-site one class lower than thePROMET-V results.These results also holds for the Flevoland test-site. The soil moisture pattern in the cereal fields, which has beendetermined from the CLOUD model is similar, but with smaller moisture values than determined from the PROMET-Vapproach in case of cereal fields, and higher in case of meadows. On maize fields and meadows the values often exceed
Fig
. 5: Comparison of the model results of the CLOUD model and PROMET-V for the test site Upper Rhine Valleynot defined (>80%)
not defined (<0%) not defined (equation notdefined)0% - 10% 20% - 30%
10% - 20% 50% - 60%
40% - 50%
30% - 40%
60% - 80%
soil moisture retrievedfrom the CLOUD Model Landuse Map
other landuse
maize
spring barley
winter barley
spring wheat
winte r wheat
meadows
soil moisture retrieved from the PROMET-V growth model
Date: 6. July 1995
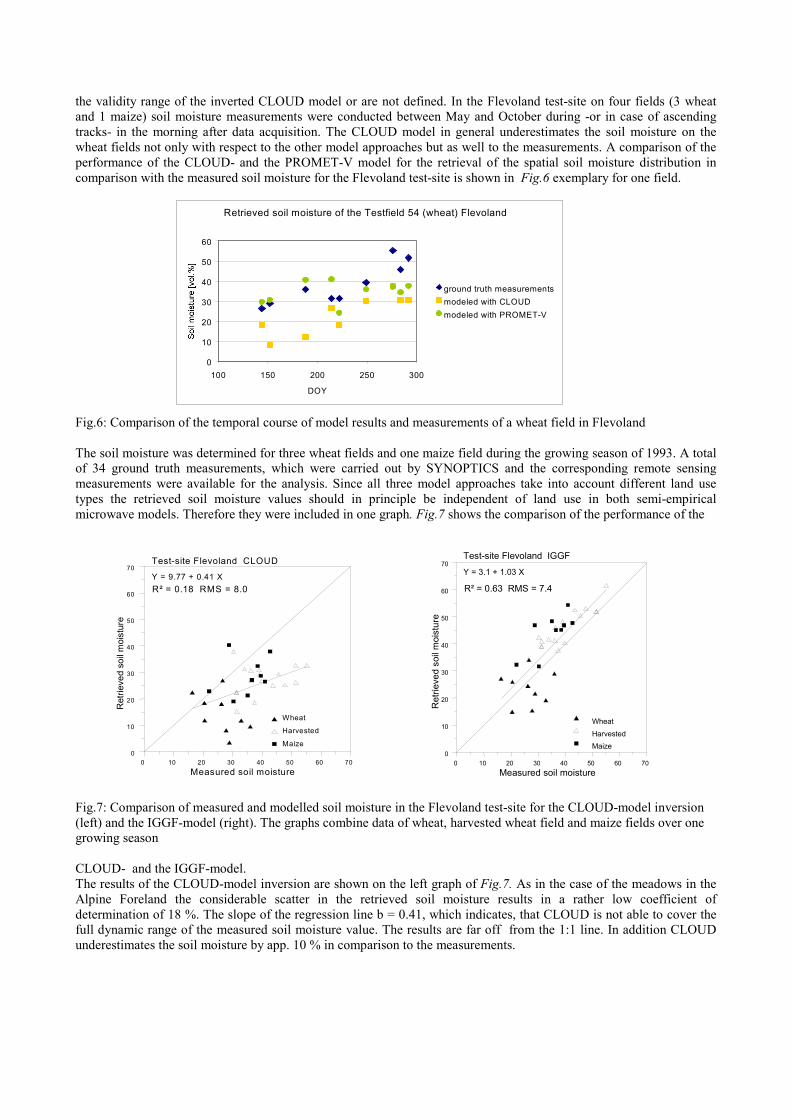
the validity range of the inverted CLOUD model or are not defined. In the Flevoland test-site on four fields (3 wheatand 1 maize) soil moisture measurements were conducted between May and October during -or in case of ascendingtracks- in the morning after data acquisition. The CLOUD model in general underestimates the soil moisture on thewheat fields not only with respect to the other model approaches but as well to the measurements. A comparison of theperformance of the CLOUD- and the PROMET-V model for the retrieval of the spatial soil moisture distribution incomparison with the measured soil moisture for the Flevoland test-site is shown in Fig.6 exemplary for one field.
Fig.6: Comparison of the temporal course of model results and measurements of a wheat field in Flevoland
The soil moisture was determined for three wheat fields and one maize field during the growing season of 1993. A totalof 34 ground truth measurements, which were carried out by SYNOPTICS and the corresponding remote sensingmeasurements were available for the analysis. Since all three model approaches take into account different land usetypes the retrieved soil moisture values should in principle be independent of land use in both semi-empiricalmicrowave models. Therefore they were included in one graph. Fig.7 shows the comparison of the performance of the
Fig(legro
CLThAldefulun
Retrieved soil moisture of the Testfield 54 (wheat) Flevoland
0
10
20
30
40
50
60
100 150 200 250 300
DOY
ground truth measurementsmodeled with CLOUDmodeled with PROMET-V
.7: Comparisoft) and the IGGwing season
OUD- and the results of thepine Forelandtermination ofl dynamic randerestimates th
0
10
20
30
40
50
60
70
Ret
rieve
d so
il m
oist
ure
0
Te
Y =R²
n of measured and modelled soil moisture in the Flevoland test-site for the CLOUD-model inversionF-model (right). The graphs combine data of wheat, harvested wheat field and maize fields over one
e IGGF-model. CLOUD-model inversion are shown on the left graph of Fig.7. As in the case of the meadows in the the considerable scatter in the retrieved soil moisture results in a rather low coefficient of 18 %. The slope of the regression line b = 0.41, which indicates, that CLOUD is not able to cover thege of the measured soil moisture value. The results are far off from the 1:1 line. In addition CLOUDe soil moisture by app. 10 % in comparison to the measurements.
10 20 30 40 50 60 70Measured soil moisture
Wheat
Harvested
Maize
st-site Flevoland CLOUD
9.77 + 0.41 X= 0.18 RMS = 8.0
0
10
20
30
40
50
60
70
Ret
rieve
d so
il m
oist
ure
0 10 20 30 40 50 60 70Measured soil moisture
WheatHarvestedMaize
Test-site Flevoland IGGF
Y = 3.1 + 1.03 X
R² = 0.63 RMS = 7.4
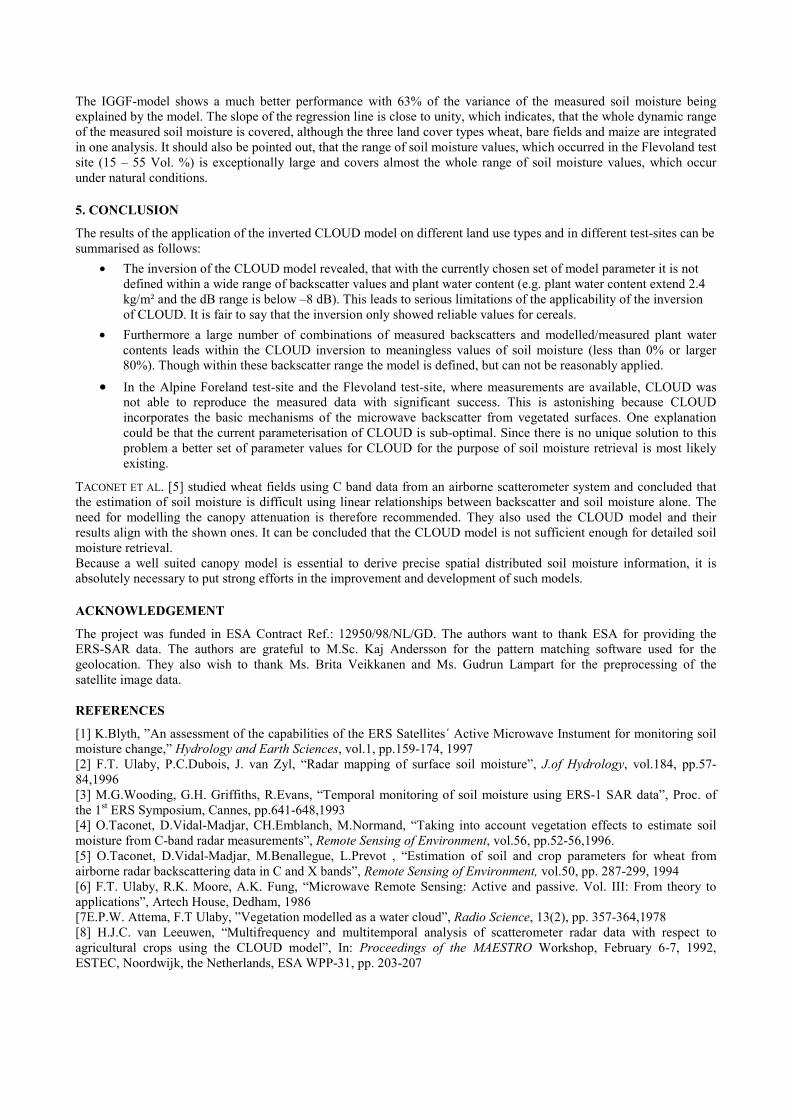
The IGGF-model shows a much better performance with 63% of the variance of the measured soil moisture beingexplained by the model. The slope of the regression line is close to unity, which indicates, that the whole dynamic rangeof the measured soil moisture is covered, although the three land cover types wheat, bare fields and maize are integratedin one analysis. It should also be pointed out, that the range of soil moisture values, which occurred in the Flevoland testsite (15 – 55 Vol. %) is exceptionally large and covers almost the whole range of soil moisture values, which occurunder natural conditions.
5. CONCLUSION
The results of the application of the inverted CLOUD model on different land use types and in different test-sites can besummarised as follows:
• The inversion of the CLOUD model revealed, that with the currently chosen set of model parameter it is notdefined within a wide range of backscatter values and plant water content (e.g. plant water content extend 2.4kg/m² and the dB range is below –8 dB). This leads to serious limitations of the applicability of the inversionof CLOUD. It is fair to say that the inversion only showed reliable values for cereals.
• Furthermore a large number of combinations of measured backscatters and modelled/measured plant watercontents leads within the CLOUD inversion to meaningless values of soil moisture (less than 0% or larger80%). Though within these backscatter range the model is defined, but can not be reasonably applied.
• In the Alpine Foreland test-site and the Flevoland test-site, where measurements are available, CLOUD wasnot able to reproduce the measured data with significant success. This is astonishing because CLOUDincorporates the basic mechanisms of the microwave backscatter from vegetated surfaces. One explanationcould be that the current parameterisation of CLOUD is sub-optimal. Since there is no unique solution to thisproblem a better set of parameter values for CLOUD for the purpose of soil moisture retrieval is most likelyexisting.
TACONET ET AL. [5] studied wheat fields using C band data from an airborne scatterometer system and concluded thatthe estimation of soil moisture is difficult using linear relationships between backscatter and soil moisture alone. Theneed for modelling the canopy attenuation is therefore recommended. They also used the CLOUD model and theirresults align with the shown ones. It can be concluded that the CLOUD model is not sufficient enough for detailed soilmoisture retrieval.Because a well suited canopy model is essential to derive precise spatial distributed soil moisture information, it isabsolutely necessary to put strong efforts in the improvement and development of such models.
ACKNOWLEDGEMENT
The project was funded in ESA Contract Ref.: 12950/98/NL/GD. The authors want to thank ESA for providing theERS-SAR data. The authors are grateful to M.Sc. Kaj Andersson for the pattern matching software used for thegeolocation. They also wish to thank Ms. Brita Veikkanen and Ms. Gudrun Lampart for the preprocessing of thesatellite image data.
REFERENCES
[1] K.Blyth, ”An assessment of the capabilities of the ERS Satellites´ Active Microwave Instument for monitoring soilmoisture change,” Hydrology and Earth Sciences, vol.1, pp.159-174, 1997[2] F.T. Ulaby, P.C.Dubois, J. van Zyl, “Radar mapping of surface soil moisture”, J.of Hydrology, vol.184, pp.57-84,1996[3] M.G.Wooding, G.H. Griffiths, R.Evans, “Temporal monitoring of soil moisture using ERS-1 SAR data”, Proc. ofthe 1st ERS Symposium, Cannes, pp.641-648,1993[4] O.Taconet, D.Vidal-Madjar, CH.Emblanch, M.Normand, “Taking into account vegetation effects to estimate soilmoisture from C-band radar measurements”, Remote Sensing of Environment, vol.56, pp.52-56,1996.[5] O.Taconet, D.Vidal-Madjar, M.Benallegue, L.Prevot , “Estimation of soil and crop parameters for wheat fromairborne radar backscattering data in C and X bands”, Remote Sensing of Environment, vol.50, pp. 287-299, 1994[6] F.T. Ulaby, R.K. Moore, A.K. Fung, “Microwave Remote Sensing: Active and passive. Vol. III: From theory toapplications”, Artech House, Dedham, 1986[7E.P.W. Attema, F.T Ulaby, ”Vegetation modelled as a water cloud”, Radio Science, 13(2), pp. 357-364,1978[8] H.J.C. van Leeuwen, “Multifrequency and multitemporal analysis of scatterometer radar data with respect toagricultural crops using the CLOUD model”, In: Proceedings of the MAESTRO Workshop, February 6-7, 1992,ESTEC, Noordwijk, the Netherlands, ESA WPP-31, pp. 203-207

[9] G. Riegler, R.Stolz, W.Mauser, “Geometric and radiometric corrections of ERS SAR data for biomass estimation ofmeadows in rugged terrain”, Proc. of SPIE, EUROPTO Series vol.3499, pp. 224-236, Barcelona 1998[10] K. Schneider, W. Mauser ,“Using Remote Sensing Data to Model Water, Carbon and Nitrogen Fluxes withPROMET-V”, Remote Sensing for Agriculture, Ecosystems and Hydrology, SPIE Vol. 4171, in press, 2000[11] M. Rombach, W. Mauser, 1997, “Multi-annual analysis of ERS surface soil moisture measurements of differentland uses”, Proc. 3.ERS Symposium, “Space at the service of the environment”, ESA SP-414[12] W. Mauser , “Comparison of ERS SAR data derived soil moisture distributions with SVAT model results”,Proceedings of ERS-ENVISAT-Symposium 2000, this issue[13] N. Oppelt, K. Schneider, W. Mauser, ”Mesoscale soil moisture patterns derived from ERS data”, Proc. of SPIE-EUROPTO Series, vol.3499, Barcelona 1998
Related Documents


