Combining multiple laser scans of spotted microarrays by means of a two-way ANOVA model Jerome Ambroise, Bertrand Bearzatto, Annie Robert, Benoit Macq, Jean-Luc Gala Motivation: Assessment of gene expression on spotted microarrays is based on measurement of fluorescence intensity emitted by hybridized spots. Unfortu- nately, quantifying fluorescence intensity from hybridized spots does not always correctly reflect gene expression level. Low expression level produces low fluo- rescence intensity which tends to be confounded with local background while high expression level produces high fluorescence intensity that rapidly reaches a satura- tion level. Most algorithms that combine data acquired at different voltages of the photomultiplier tube (PMT) assume that a change in scanner setting transforms the intensity measurements by a multiplicative constant. Methods and Results: In this paper we introduce a new model of spot fore- ground intensity which integrates a PMT voltage independent scanner optical bias. This new model is used to implement a ”Combining Multiple Scan using a Two-way ANOVA” (CMS2A) method, which is based on a maximum likelihood estimation of the scanner optical bias. After having calculated scanner bias, coefficients of the two-way ANOVA model are used for correcting the saturated spots intensities obtained at high PMT voltage by using their counterpart values at lower PMT volt- ages. The method was compared to state-of-the-art multiple scan algorithms, using data generated from the MAQC study. CMS2A produced fold-changes that were highly correlated with QRT-PCR fold-changes. As the scanner optical bias is ac- curately estimated within CMS2A, this method allows also avoiding fold-change compression biases whatever the value of this optical bias. 1 Introduction Microarrays are a powerful technology used in functional genomics that allow in- vestigators to study the expression levels of thousands of genes simultaneously in a single assay. Among the types of studies that can be conducted with spotted microarrays, class comparison aims to detect differentially expressed genes. If one- color spotted microarrays are used, each sample is hybridized on a separate array. Gene expression levels are then computed from the fluorescence intensities emit- ted by corresponding spots. The most common scanning configuration uses a laser

Welcome message from author
This document is posted to help you gain knowledge. Please leave a comment to let me know what you think about it! Share it to your friends and learn new things together.
Transcript
Combining multiple laser scans of spotted microarraysby means of a two-way ANOVA modelJerome Ambroise, Bertrand Bearzatto, Annie Robert, Benoit Macq, Jean-Luc Gala
Motivation: Assessment of gene expression on spotted microarrays is basedon measurement of fluorescence intensity emitted by hybridized spots. Unfortu-nately, quantifying fluorescence intensity from hybridized spots does not alwayscorrectly reflect gene expression level. Low expression level produces low fluo-rescence intensity which tends to be confounded with local background while highexpression level produces high fluorescence intensity that rapidly reaches a satura-tion level. Most algorithms that combine data acquired at different voltages of thephotomultiplier tube (PMT) assume that a change in scanner setting transforms theintensity measurements by a multiplicative constant.
Methods and Results: In this paper we introduce a new model of spot fore-ground intensity which integrates a PMT voltage independent scanner optical bias.This new model is used to implement a ”Combining Multiple Scan using a Two-wayANOVA” (CMS2A) method, which is based on a maximum likelihood estimationof the scanner optical bias. After having calculated scanner bias, coefficients ofthe two-way ANOVA model are used for correcting the saturated spots intensitiesobtained at high PMT voltage by using their counterpart values at lower PMT volt-ages. The method was compared to state-of-the-art multiple scan algorithms, usingdata generated from the MAQC study. CMS2A produced fold-changes that werehighly correlated with QRT-PCR fold-changes. As the scanner optical bias is ac-curately estimated within CMS2A, this method allows also avoiding fold-changecompression biases whatever the value of this optical bias.
1 IntroductionMicroarrays are a powerful technology used in functional genomics that allow in-vestigators to study the expression levels of thousands of genes simultaneously ina single assay. Among the types of studies that can be conducted with spottedmicroarrays, class comparison aims to detect differentially expressed genes. If one-color spotted microarrays are used, each sample is hybridized on a separate array.Gene expression levels are then computed from the fluorescence intensities emit-ted by corresponding spots. The most common scanning configuration uses a laser
to excite the fluorescent dye and a photomultiplier tube (PMT) to detect the fluo-rescence signal. The fluorescence intensity of each spot is extracted after imageacquisition.
Unfortunately, quantification of the fluorescence intensity does not alwaysperfectly reflect the level of gene expression. Low gene expression levels producelow fluorescence intensities which tend to be confounded with the local backgroundbecause of the presence of an additive noise partially caused by quantization, i.e.discretization in the analog-to-digital converter. On the other hand, high gene ex-pression levels produce high fluorescence intensities which rapidly reach the satu-ration level. Indeed, considering that pixel intensities are coded on a 16-bits grayscale, the highest value that can be recorded cannot exceed 65 535. When pixelsintensities from a spot are above the upper threshold of detection, those intensityvalues are truncated to the upper threshold. Consequently, the linearity betweenfluorescence intensity and gene expression level is not achieved on the whole rangeof mRNA copy number which, in turn, leads to biased estimations of the genesexpression fold-changes.
The existing relationship between gene expression level and fluorescenceintensity, as given by the calibration curve, depends on the scanner settings and,more specifically, on the voltage of the photomultiplier tube (PMT) which is eas-ily adjustable. Indeed, fluorescent photons produced by excited spots are amplifiedby PMT voltage (or PMT gain), which, in turn, strongly influences the calibrationcurve. The linear dynamic range is the whole range of target concentrations wherea linear relationship is noted between dye concentrations, an indicator of gene ex-pression level, and fluorescence intensity. This curve shifts toward low level ofexpression when PMT voltage is increased. To obtain non-biased estimations ofgenes expressions fold-changes, it is mandatory to work with fluorescence intensi-ties distributed within the linear dynamic range. PMT voltage should therefore beselected according to the intensity of the fluorescent signal that needs to be quan-tified. However, among the whole panel of genes to be quantified, some have avery weak expression level while others disclose a much higher expression pat-tern. Fluorescent signals associated with spots of interest on spotted microarraystherefore sometimes appear to be extremely variable in such a way that selectinga well defined PMT voltage can be suboptimal, if not impossible. Most of theprotocols recommend therefore to scan the microarray at a PMT voltage that mini-mizes the number of spots showing a fully saturated fluorescence signal or that areconfounded with local background. Using this methodology is, however, far frombeing optimal when the identification of truly differentially expressed genes is atstake. A way to solve this issue is to improve the estimations of the gene expressionfold-changes by scanning the spots at different PMT voltages and by combiningthe information extracted from the acquired image successively at different PMT
voltages.Some authors have developed approaches that use either pixel level data or
spot summary data to calculate new values for the saturated spots. In that respect,Dudley, Aach, Steffen, and Church (2002) proposed to extrapolate, linearly and it-eratively, the signal intensities of saturated spots using unsaturated data obtainedat a lower PMT setting. Lyng, Badiee, Svendsrud, Hovig, Myklebost, and Stokke(2004) suggested correcting saturated spot intensities recorded at the highest PMTvoltage by using corresponding intensities obtained at the lowest PMT voltage. Cal-culation of this correction factor assumes that a constant ratio exists between inten-sities of individual spots in both scans. de la Nava, Van Hijum, and Trelles (2004)presented two mathematical models based on linear and gamma curves in order toextend the dynamic range of gene expression data. Piepho, Keller, Hoecker, andHochholdinger (2006) suggested a non-linear latent regression model to combinedifferent signals from identical spots in order to correct for the biases caused bythe saturation limit and to reduce technical errors for spots emitting low signals.Skibbe, Wang, Zhao, Borsuk, Nettleton, and Schnable (2006) compared Dudley’smethod with the multiple-scan method. In the multiple-scan method, the statisticalanalysis is performed separately at each PMT voltage, the smallest P-value beingkept for each gene. Khondoker, Glasbey, and Worton (2006) proposed a statisticalmodel based on a non-linear relationship with both additive and multiplicative er-ror terms for estimating the ”true intensities” of saturated spots. Gupta, Auvinen,Thomas, and Arjas (2006) suggested an approach based on a Bayesian latent in-tensity model in order to use several scans obtained at varying scanner sensitivities.Finally, Glasbey and Khondoker (2009) showed that combining multiple laser scansby maximizing the likelihood of a Gaussian structural regression model increasesthe power of detection of differential gene expression levels.
All the methods reported here above assume that a change in PMT volt-age multiplies intensity measurements by a constant. However, Bengtsson, Jon-sson, and Vallon-Christersson (2004) showed the presence of a channel specificbias present in two-color microarray data. They proposed a scanning protocol fortwo-color microarray and a constrained affine model that allow to identify and es-timate the bias in each channel and to obtain a larger dynamic range as well asa greater signal-to-noise ratio. One advantage of the Bengtsson et al. method isthat it takes into account the channel bias for computing the multiplicative effect ofPMT voltage. Conversely, a drawback of this method is that the local backgroundsubtraction step is replaced by the subtraction of channel specific biases. Indeed,spatial heterogeneity of local background can induce a biased estimation of fold-changes, especially with one-color microarray data, where local background maydiffer markedly for each of the two control and reference spots referring to the samegene.
Accordingly, a first aim of this paper is to introduce a model for spot fore-ground intensity that integrates the PMT voltage multiplicative effect and a scanneroptical bias which is independent of the PMT voltage. A second objective is to usethis model to develop an algorithm combining data acquired at multiple PMT volt-ages while integrating the scanner optical bias. A third objective is to compare fea-tures of this algorithm with those of state-of-the-art methods. Such a comparison isperformed by using datasets generated by the MicroArray Quality Control (MAQC)project with Dual chip Eppendorf arrays and with Taqman quantitative PCR (qPCR)(Shi, Reid, Jones, Shippy, Warrington, Baker, Collins, De Longueville, Kawasaki,Lee et al., 2006). Data from the MAQC project provide indeed a unique opportunityto compare advantages and disadvantages of various analysis methods and to try toreach a consensus on the most satisfactory way to analyze microarray data. To thebest of our knowledge, the current analysis performed at different PMT voltagesand comparison with the existing multiple scan algorithms is a new application ofthe MAQC dataset.
2 ModelIn this paper, we introduce a new model for the measured spot foreground intensitywhich integrates the scanner-induced, PMT voltage-independent optical bias. Themodel integrates the signal resulting from hybridization, two background compo-nents and the PMT voltage related-effect. Each array scan generates for each spoti values, which represent the median of pixel intensities for both foreground andlocal background. These pixel intensities are dependent of the PMT voltage v (v =300V, .. 700V), as defined for image acquisition. In the current work, these valuesnamed foreground intensities and local background intensities, are referred to as Yivand Biv, respectively. As a first step, we assume a general measurement model withboth additive and multiplicative errors.
Yi = αi +µieηi + εi (1)
Yi is the measured intensity value, αi is the mean background, µi is the trueexpression and ηi and εi are multiplicative and additive error terms considered to beindependent and Gaussian-distributed. This widely used model in analytical chem-istry (Rocke and Durbin, 2001) was also applied to gene expression microarray innumerous studies (Rocke and Durbin, 2001, Durbin, Hardin, Hawkins, and Rocke,2002, Durbin and Rocke, 2003, Huber, Von Heydebreck, Sueltmann, Poustka, andVingron, 2003, Rocke and Durbin, 2003, Cui, Kerr, and Churchill, 2003, Lin, Du,
Huber, and Kibbe, 2008). In this paper, we suggest dividing the background inten-sity αi into two distinct components.
αi = δ +λi (2)
The first component, δ , is the optical bias which is generated by the scannerand therefore independent of spot i. The second component, λi, is the backgrounddue to glass slide autofluorescence and to unspecific hybridization. The latter isdependent on spatial localization, hence dependent on spot i.
When a spot is excited by the laser, photons are emitted and are transformedin an electron signal by striking the cathode. In the literature, it has been shownthat the electron signal is proportional to the number of photons and to the PMTvoltage (Khondoker et al., 2006, Gupta et al., 2006). Increasing the scanner PMTvoltage multiplies each intensity measurement by a constant. Besides this observa-tion, Bengtsson et al. (2004) demonstrated a channel-specific bias when studyingtwo-color microarrays scanned at multiple PMT voltages. Decomposing the localbackground αi, as in equation 2, enables us to consider the scanner optical bias (δ )as being independent of the PMT voltage, as given by the following formula, whereβv stands for the PMT multiplicative effect on recorded intensities:
Yiv = δ +βv(λi +µi)eηiv + εiv (3)
Introducing a scanner optical bias when correcting the saturated spots helpsavoid underestimation of correction factors. Model 3 remains valid up to the satu-ration threshold. As it is reasonable to assume that background intensity inducedby the glass slide auto-fluorescence and the unspecific hybridization (λi) equallyaffects foreground and local background areas of a spot, local background intensitycan be modeled as follows:
Biv = δ +(βv (λi))eηiv + εiv (4)
Random error terms ηiv and εiv follow a normal distribution with a 0 meanand variances of σ2
η and σ2ε , respectively. For any spot without specific hybridiza-
tion (µi = 0), the probability of obtaining a local background higher than fore-ground (Biv > Yiv) is equal to 0.5, due to both random error terms. This probabilitydecreases when specific hybridization intensity (µi) and PMT voltage (βv) increase.This is the reason why the number of spots whose foreground intensity is lowerthan local background decreases at a higher PMT voltage (Table 1).
3 Methods
3.1 Data
MAQC project data generated on Eppendorf Dualchip (Shi et al., 2006) were usedin this study. Eppendorf Dualchip analyzes the expression level of 294 genes fromfour distinct samples assessed in five replicates on three different sites. As datafrom site 2 were affected by annotation problems, we only used data from sites 1and 3. Regarding the samples assessed in the MAQC study, sample A correspondsto the Universal Human Reference RNA (UHRR) from Stratagene while sample Bcorresponds to the Human Brain Reference RNA (HBRR) from Ambion. SamplesC and D are a mixture from the original samples. In order to maximize the rangeof resulting fold-changes, it was decided to use samples A and B rather than C orD. Each array was scanned at three PMT voltages different from the PMT used ineach site, namely 50, 70 and 100 for site 1, and 450, 700 and 800 for site 3. Rawdata were downloaded from the Gene Expression Omnibus (GEO) repository (GEOaccession: GSE5350) (Edgar, Domrachev, and Lash, 2002).
On Eppendorf Dualchip platforms, each gene expression level is assessedon three replicated spots. In addition to these spots, Eppendorf arrays contain in-ternal standard spots as well as negative and positive hybridization control spots, sothat a total of 1089 spots are present on each array (3 * 363). Accordingly, each siteprovides data for 10,890 spots (2 samples * 5 biological replicates * 1089 spots). Inthe current study, foreground intensities above 50 000 were considered as partiallysaturated. Lyng et al. (2004) have indeed shown that expression ratios are indepen-dent from PMT voltage within the intensity range from 200 to 50 000. As displayedin Table 1, data acquired at low PMT voltage contain no saturated spot but severalspots whose foreground intensities are lower than local background. Conversely,data acquired at high PMT voltage contain numerous saturated spots but very fewspots that have a foreground intensity lower than the local background. This ob-servation illustrates the increase in signal-to-noise ratio with the PMT voltage andprompts the use of methods combining data acquired at multiple PMT voltages.
Normalized qPCR data, downloaded from the GEO repository, and linearmodels from the limma package, were used to calculate gene expression fold-changes between samples A and B. In the current study, these values are referredto as gold-standard fold-changes. All data from the MAQC study used in this studyare summarized in Table 2.

Table 1: Number of spot whose foreground intensity is lower than local backgroundintensity (Yiv ≤ Biv) and whose fluorescence signal is saturated (Yiv > 50000) fromEppendorf platform in sites 1 and 3.
PMT voltage Site 1 Site3Yiv ≤ Biv Sat. Yiv ≤ Biv Sat.
Low 670 0 1316 0Medium 409 261 459 135High 350 1161 392 382
Table 2: Data generated from MAQC study which are used in this study
technology Platform and site Sample A Sample Bn = number of replicates
Spotted cDNA Eppendorf: Site 1 5 5Spotted cDNA Eppendorf: Site 3 5 5
qPCR Taqman 4 4
3.2 CMS2A
A second objective of this paper is to present CMS2A, a new algorithm basedon model 3 for combining data acquired at different PMT voltages. At first, theCMS2A method estimates the scanner optical bias δ by using a maximum likeli-hood approach. As model 3 is only valid for unsaturated spots, all saturated spots(Yiv > 50000) are first filtered out. The lowest foreground intensities (Yiv <Biv+20)are also discarded in order to make additive error ε insignificant. When the scanneroptical bias is subtracted from foreground intensities and a log2 transformation isapplied, the following model is obtained:
log2(Yiv −δ ) = log2(βv)+ log2(λi +µi)+ηiv (5)
Model 5 can be seen as a two-way ANOVA model. The approach consistsin finding the value which maximizes the likelihood of the estimated model in agrid of possible δ values. Once the δ value is estimated, the last step is to calculatesaturated values obtained at high PMT voltage using data acquired at lower PMTvoltage. If data have been acquired at three voltages (1=low, 2=medium, 3=high),the following correction is applied on saturated spots acquired at high PMT voltage:
Yi3 = ((Yi2 − δ )∗ Fcor)+ δ (6)
Where Yi3 is the corrected intensity of spot i acquired at high PMT voltage,Yi2 is the intensity of spot i acquired at medium PMT voltage and Fcor is the esti-mated correction factor. This correction factor is calculated based on the differenceof the PMT voltage effects in the log2 scale, as estimated in the two-way ANOVAmodel.
Fcor = 2(log2(β3)−log2(β2)) (7)
If the intensity acquired at medium PMT voltage Yi2 is also saturated, thecorrected value (Yi3) is obtained by using data acquired at low PMT voltage (Yi1). Inthis case, Fcor is calculated based on the difference between log2(β3) and log2(β1).The principle of the CMS2A method is therefore to keep all non-saturated signalsobtained at the highest PMT voltage and to calculate all saturated signals from dataacquired at lower PMT voltage. While this procedure seems similar to the onereported by Lyng et al. and Dudley et al., the main difference lies in the multi-plicative effect of PMT voltage, which is calculated after subtraction of the PMTvoltage-independent scanner optical bias.
3.3 Comparison with state-of-the-art methods
A third objective of this study is to compare features of CMS2A with those of state-of-the-art multiple scan algorithms. Implementation details of methods tested inthis study appear below:
Khondoker: Khondoker et al.’s algorithm is implemented in the ”multi-scan” method from the ”multiscan” Bioconductor package. As background sub-traction is not recommended in this method, two versions were applied: the firstversion (Khondoker 1) consists in applying the multiscan method on foreground in-tensities without subtracting local background. The second version (Khondoker 2)consists in subtracting the local background intensities from the foreground, in or-der to filter out the negative values that can not be handled by the multiscan functionand to apply the multiscan function on the remaining corrected intensities.
Bengtsson: Bengtsson et al.’s algorithm is implemented in the ”calibrate-Multiscan” function from the ”aroma.light” Bioconductor package. In this method,all foreground intensities are calculated from intensities scanned at different PMTvoltage. The authors recommend working with foreground intensities without sub-tracting local background noise in order to avoid negative values. However, a biasequivalent to the channel specific bias is calculated with a constrained affine modeland subtracted from foreground intensities.
Lyng: Lyng et al.’s algorithm is based on the requirement of a constant ratiobetween individual spot intensities in two separate scans and was implemented inR. At first, a correction factor is calculated by using spots with intensities that liewithin the range of 20.000 to 30.000 pixels at the highest PMT voltage. A correctionof saturated spots (foreground intensities above 50 000) at high PMT voltage isperformed by calculating the product of intensities obtained at lower PMT voltageand the correction factor. This method is very similar to the method proposed byDudley et al. (2002).
Low: In this method, only data acquired at a single low PMT voltage areused. Spots of the weakly expressed genes tend to be confounded with the localbackground whereas spots of the highly expressed genes are not saturated.
High: In contrast with the above method, only data acquired at a singlehigh PMT voltage are used. Spots of the weakly expressed genes tend to be abovethe local background noise whereas spots of highly expressed tend to reach thesaturation threshold.
Medium: This is an alternative to both previous methods. In this case, dataare only acquired at a single medium PMT voltage.
After having combined all data scanned at different PMT voltages, the ’Ed-wards’ background correction method was applied. The ’Edwards’ background cor-rection method minimizes the fold-change compression and optimizes the correla-tion between microarray fold-changes and qPCR fold-changes (Ambroise, Bearzatto,Robert, Govaerts, Macq, and Gala, 2011), while avoiding the missing values causedby the log2 transformation. After background correction and log2 transformation,data were normalized using internal standards as recommended by the manufac-turer. Considering the relatively low number of biological replicates, the eBayesalgorithm (Smyth, 2004) from the limma Bioconducor package was then used tocalculate the log2 fold-changes (Allison, Cui, Page, and Sabripour, 2006).
4 Results and Discussion
4.1 CMS2A
CMS2A was applied to data from site 1 and site 3 to combine intensities acquiredat low, medium and high PMT voltages. The scanner optical bias δ of each ar-ray was estimated separately (Table 3) by using the methodology described in themethod section. Effects of the CMS2A method on the first arrays of sites 1 and3 are illustrated in figures 1 and 2, respectively. The data representation used tomonitor and detect the presence of a scanner bias (figures 1-A and 2-A) consists
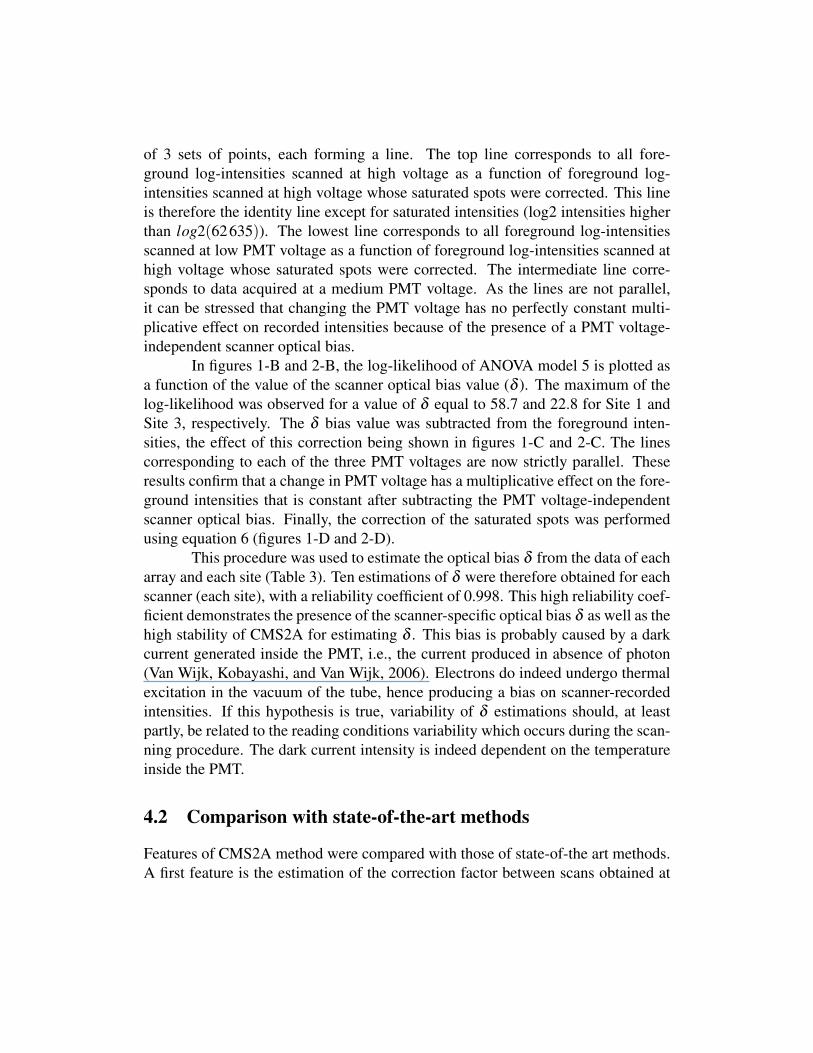
of 3 sets of points, each forming a line. The top line corresponds to all fore-ground log-intensities scanned at high voltage as a function of foreground log-intensities scanned at high voltage whose saturated spots were corrected. This lineis therefore the identity line except for saturated intensities (log2 intensities higherthan log2(62635)). The lowest line corresponds to all foreground log-intensitiesscanned at low PMT voltage as a function of foreground log-intensities scanned athigh voltage whose saturated spots were corrected. The intermediate line corre-sponds to data acquired at a medium PMT voltage. As the lines are not parallel,it can be stressed that changing the PMT voltage has no perfectly constant multi-plicative effect on recorded intensities because of the presence of a PMT voltage-independent scanner optical bias.
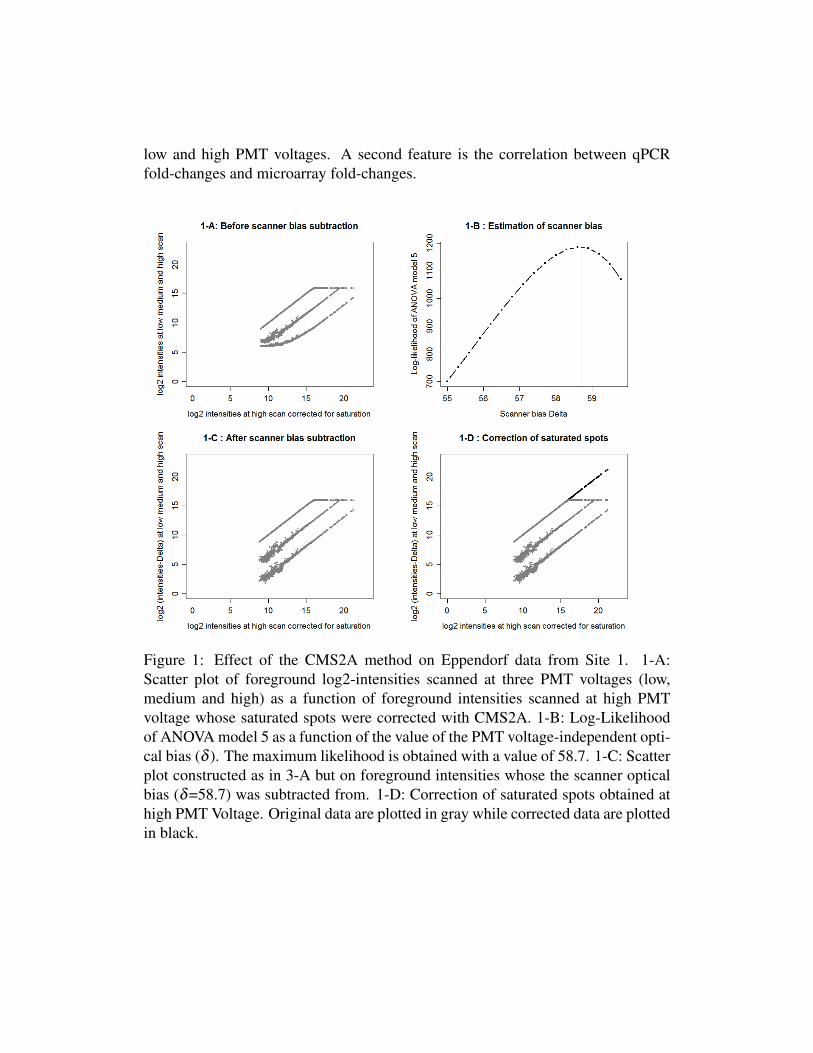
In figures 1-B and 2-B, the log-likelihood of ANOVA model 5 is plotted asa function of the value of the scanner optical bias value (δ ). The maximum of thelog-likelihood was observed for a value of δ equal to 58.7 and 22.8 for Site 1 andSite 3, respectively. The δ bias value was subtracted from the foreground inten-sities, the effect of this correction being shown in figures 1-C and 2-C. The linescorresponding to each of the three PMT voltages are now strictly parallel. Theseresults confirm that a change in PMT voltage has a multiplicative effect on the fore-ground intensities that is constant after subtracting the PMT voltage-independentscanner optical bias. Finally, the correction of the saturated spots was performedusing equation 6 (figures 1-D and 2-D).
This procedure was used to estimate the optical bias δ from the data of eacharray and each site (Table 3). Ten estimations of δ were therefore obtained for eachscanner (each site), with a reliability coefficient of 0.998. This high reliability coef-ficient demonstrates the presence of the scanner-specific optical bias δ as well as thehigh stability of CMS2A for estimating δ . This bias is probably caused by a darkcurrent generated inside the PMT, i.e., the current produced in absence of photon(Van Wijk, Kobayashi, and Van Wijk, 2006). Electrons do indeed undergo thermalexcitation in the vacuum of the tube, hence producing a bias on scanner-recordedintensities. If this hypothesis is true, variability of δ estimations should, at leastpartly, be related to the reading conditions variability which occurs during the scan-ning procedure. The dark current intensity is indeed dependent on the temperatureinside the PMT.
4.2 Comparison with state-of-the-art methods
Features of CMS2A method were compared with those of state-of-the art methods.A first feature is the estimation of the correction factor between scans obtained at
low and high PMT voltages. A second feature is the correlation between qPCRfold-changes and microarray fold-changes.
Figure 1: Effect of the CMS2A method on Eppendorf data from Site 1. 1-A:Scatter plot of foreground log2-intensities scanned at three PMT voltages (low,medium and high) as a function of foreground intensities scanned at high PMTvoltage whose saturated spots were corrected with CMS2A. 1-B: Log-Likelihoodof ANOVA model 5 as a function of the value of the PMT voltage-independent opti-cal bias (δ ). The maximum likelihood is obtained with a value of 58.7. 1-C: Scatterplot constructed as in 3-A but on foreground intensities whose the scanner opticalbias (δ=58.7) was subtracted from. 1-D: Correction of saturated spots obtained athigh PMT Voltage. Original data are plotted in gray while corrected data are plottedin black.
Figure 2: Effect of the CMS2A method on Eppendorf data from Site 3. The maxi-mum likelihood is obtained for an optical bias (δ ) value of 22.8.
Table 3: Estimations of the scanner optical bias (δ ) for both sites
Replicate Estimations in site 1 Estimations in site 3Array A Array B Array A Array B
Sample 1 58.7 58.5 22.8 22.2Sample 2 58.1 57.4 19.6 19.6Sample 3 57.9 56.9 22.2 20.2Sample 4 57.9 56.6 19.6 20.2Sample 5 56.6 58.2 20.8 20.2
4.2.1 Multiplicative factor
For all multiple scan methods, the multiplicative effects of the PMT voltages onrecorded intensities are calculated. The multiplicative effects obtained with each of
the methods assessed in this study are displayed in Table 4. Regarding site 1, thehigh scanner optical bias value (δ ≈ 58) induced high differences between multi-plicative effects obtained by the different methods. Multiplicative effect betweenlow and high voltage is close to 120 for the methods which take into account theoptical scanner bias (CMS2A, Bengtsson, Khondoker 2) while it is close to 90 forthose that did not. We consider here that the Khondoker 2 method takes into con-sideration the scanner optical bias when calculating the multiplicative effect. Withthe latter method, local background intensities Biv, which include the scanner opti-cal bias (see equation 4), are indeed subtracted from foreground intensities beforeapplying the ”multiscan” function. Such an amendment of the first version of theKhondoker method therefore leads to less variable estimations of the multiplicativeeffect, an observation in line with the existence of a scanner optical bias. In site3, the scanner bias had a lower value (δ ≈ 21), bringing the multiplicative effectestimations of each method closer to each other.
Table 4: Correction factor between scans obtained at low and high PMT voltages
Method site1 site3sample A sample B sample A sample BFcor sd Fcor sd Fcor sd Fcor sd
CMS2A 122.4 1.6 122.2 1.1 62.3 1.3 62.5 2.3Lyng 95.1 0.9 95.3 1.0 58.3 1.1 56.4 3.6Bengtsson 122.0 1.4 122.7 1.9 52.2 3.4 50.9 8.7Khondoker 1 90.2 4.5 44.3 2.8 44.8 3.0 18.7 4.1Khondoker 2 123.6 1.1 124.6 1.6 61.1 1.2 60.5 2.3
4.2.2 Correlation between qPCR fold-changes and microarray fold-changes
Intraclass correlation (ICC) and product-moment correlation (r) coefficients werecalculated between log2 qPCR fold-changes and log2 Eppendorf fold-changes fromboth sites (Site 1 and 3) after each multiple scan method (Table 5). The intraclasscorrelation coefficient is designed to assess consistency or conformity between twoor more quantitative measurements (Muller and Buttner, 1994) while the product-moment correlation coefficient is a measure of the strength of linear dependencebetween two variables. Correlation coefficients were calculated using the 133 genesfor which expression level is commonly quantified on the Eppendorf Dualchip and
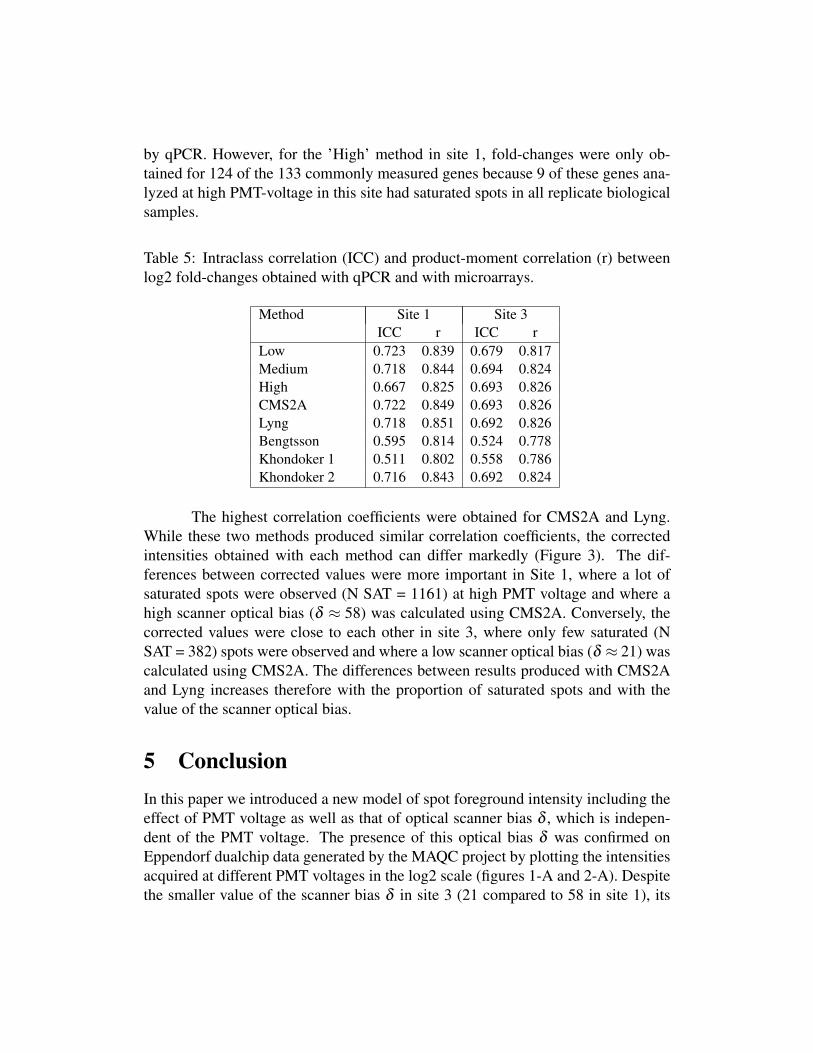
by qPCR. However, for the ’High’ method in site 1, fold-changes were only ob-tained for 124 of the 133 commonly measured genes because 9 of these genes ana-lyzed at high PMT-voltage in this site had saturated spots in all replicate biologicalsamples.
Table 5: Intraclass correlation (ICC) and product-moment correlation (r) betweenlog2 fold-changes obtained with qPCR and with microarrays.
Method Site 1 Site 3ICC r ICC r
Low 0.723 0.839 0.679 0.817Medium 0.718 0.844 0.694 0.824High 0.667 0.825 0.693 0.826CMS2A 0.722 0.849 0.693 0.826Lyng 0.718 0.851 0.692 0.826Bengtsson 0.595 0.814 0.524 0.778Khondoker 1 0.511 0.802 0.558 0.786Khondoker 2 0.716 0.843 0.692 0.824
The highest correlation coefficients were obtained for CMS2A and Lyng.While these two methods produced similar correlation coefficients, the correctedintensities obtained with each method can differ markedly (Figure 3). The dif-ferences between corrected values were more important in Site 1, where a lot ofsaturated spots were observed (N SAT = 1161) at high PMT voltage and where ahigh scanner optical bias (δ ≈ 58) was calculated using CMS2A. Conversely, thecorrected values were close to each other in site 3, where only few saturated (NSAT = 382) spots were observed and where a low scanner optical bias (δ ≈ 21) wascalculated using CMS2A. The differences between results produced with CMS2Aand Lyng increases therefore with the proportion of saturated spots and with thevalue of the scanner optical bias.
5 ConclusionIn this paper we introduced a new model of spot foreground intensity including theeffect of PMT voltage as well as that of optical scanner bias δ , which is indepen-dent of the PMT voltage. The presence of this optical bias δ was confirmed onEppendorf dualchip data generated by the MAQC project by plotting the intensitiesacquired at different PMT voltages in the log2 scale (figures 1-A and 2-A). Despitethe smaller value of the scanner bias δ in site 3 (21 compared to 58 in site 1), its
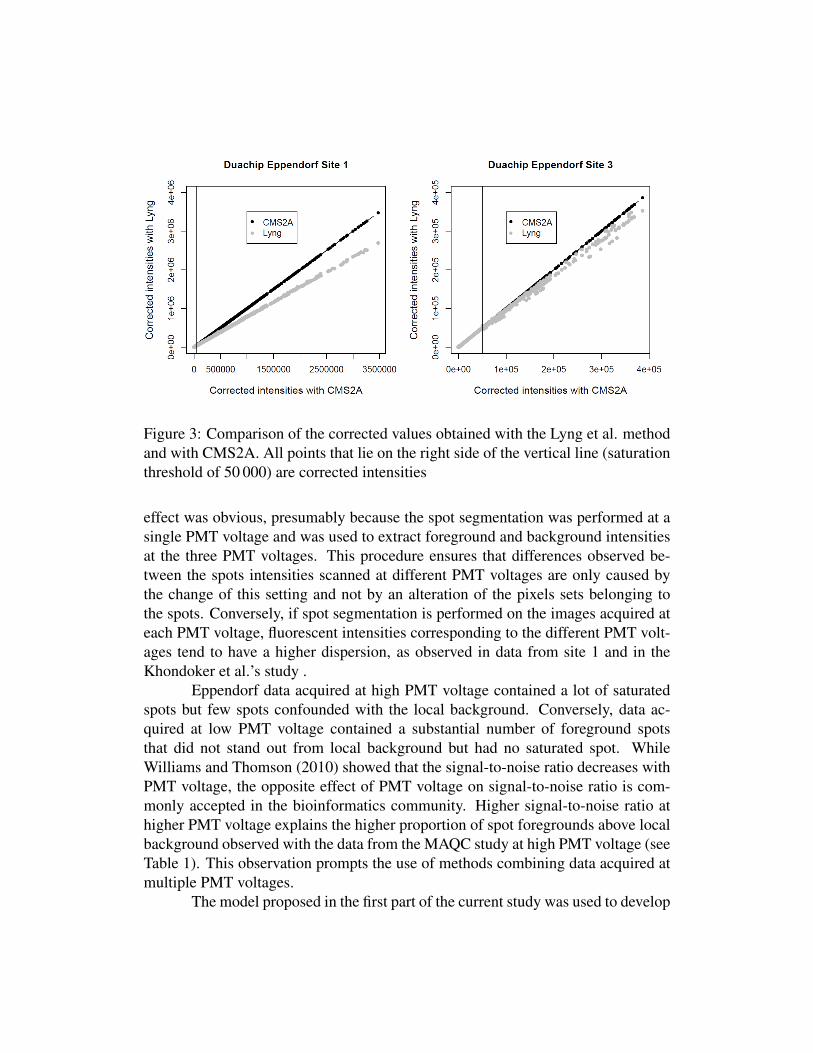
Figure 3: Comparison of the corrected values obtained with the Lyng et al. methodand with CMS2A. All points that lie on the right side of the vertical line (saturationthreshold of 50 000) are corrected intensities
effect was obvious, presumably because the spot segmentation was performed at asingle PMT voltage and was used to extract foreground and background intensitiesat the three PMT voltages. This procedure ensures that differences observed be-tween the spots intensities scanned at different PMT voltages are only caused bythe change of this setting and not by an alteration of the pixels sets belonging tothe spots. Conversely, if spot segmentation is performed on the images acquired ateach PMT voltage, fluorescent intensities corresponding to the different PMT volt-ages tend to have a higher dispersion, as observed in data from site 1 and in theKhondoker et al.’s study .
Eppendorf data acquired at high PMT voltage contained a lot of saturatedspots but few spots confounded with the local background. Conversely, data ac-quired at low PMT voltage contained a substantial number of foreground spotsthat did not stand out from local background but had no saturated spot. WhileWilliams and Thomson (2010) showed that the signal-to-noise ratio decreases withPMT voltage, the opposite effect of PMT voltage on signal-to-noise ratio is com-monly accepted in the bioinformatics community. Higher signal-to-noise ratio athigher PMT voltage explains the higher proportion of spot foregrounds above localbackground observed with the data from the MAQC study at high PMT voltage (seeTable 1). This observation prompts the use of methods combining data acquired atmultiple PMT voltages.
The model proposed in the first part of the current study was used to develop
CMS2A, a new algorithm that aims to correct saturated spots acquired at high PMTvoltage by exploiting data acquired at lower PMT voltage. CMS2A is based ona maximum likelihood estimation of the scanner optical bias δ and on correctionfactors which reflect the multiplicative effects of PMT voltage on bias-correctedforeground intensities. The CMS2A was applied to Eppendorf data from two dis-tinct sites enrolled in the MAQC project. Ten estimations of δ were calculated fromdata of each site (i.e., from each scanner from these sites) with a reliability coeffi-cient of 0.998. Results confirm the presence of the scanner-specific optical bias δ
and demonstrate the high stability of CMS2A to estimate it.Characteristics of the new algorithm were compared with those of state-
of-the-art methods. Among the latter, the method of Bengtsson et al. and bothversions of Khondoker et al. calculated all intensities by taking into considerationdata acquired at different PMT voltages. On the other hand, Lyng et al.’s methodand CMS2A only take the intensities acquired at high PMT voltage for weakly ex-pressed genes and correct the saturated spot obtained for highly expressed geneby multiplying their corresponding intensities acquired at lower PMT voltage bya correction factor. This strategy is motivated by the higher signal-to-noise ratioobserved at high PMT Voltage. The difference between CMS2A and Lyng’s meth-ods lies in the correction factor computation, with the scanner optical bias beingaccounted for only in CMS2A.
A comparison was performed between the correction factors obtained withall multiple scan methods. In Site 1 (where δ ≈ 58), higher correction factors wereobtained with the methods that consider scanner optical bias (CMS2A, Bengtsson,Khondoker 2) than with the methods that neglect it (Lyng, Khondoker 1). For bothsites, product-moment and intraclass correlation coefficients were calculated be-tween the qPCR fold-changes and the microarray fold-changes obtained after thedifferent multiple scan methods. The lowest correlation coefficients were obtainedwith Bengtsson and Khondoker-1 methods which do not perform local backgroundsubtraction. Furthermore, current results are in line with data obtained in our pre-vious study (Ambroise et al., 2011), showing that local background subtraction isan essential preprocessing step when processing one-color microarray data. Withthis type of array, the local background affecting each of the two spots measuringto the expression level of the same gene in two different conditions can indeed bedifferent. In comparison, the Khondoker 2 method produced higher correlation co-efficients. However, this method produced some missing values. Before applyingthis method, local background was indeed subtracted from foreground and negativevalues were filtered because the Khondoker method cannot consider them.
The highest correlation coefficients between microarray fold-changes andqPCR fold-changes were obtained with CMS2A and Lyng’s method. Regarding thedata from Site 3, correlation coefficients obtained with CMS2A and Lyng’s method
were very similar because the number of saturated spots at high PMT voltage wasrelatively small. Significant differences between corrected intensities were how-ever obtained with both methods on data from Site 1 where a higher number ofsaturated spots and a higher optical bias (δ ≈ 58) were recorded. Results showthat CMS2A and Lyng’s method tend to produce similar results when the scan-ner optical bias is relatively low. In contrast, an increase of the scanner opticalbias and of the proportion of saturated spots significantly impacts on the results.Overlooking the scanner optical bias in these cases leads indeed to a significantunderestimation of the multiplicative effect of PMT Voltage, hence to an impor-tant underestimation of the corrected intensities. Using CMS2A therefore avoidesunderestimation biases whatever the value of the scanner optical bias may be. Inthe present study, CMS2A was applied on two microarray datasets generated ina class comparison application. In such microarray applications, underestimationbiases can produce fold-change compressions. Using CMS2A therefore limits thefold-change compression effect, which is an important drawback of the microarraytechnology (Ritchie, Silver, Oshlack, Holmes, Diyagama, Holloway, and Smyth,2007, Tarca, Romero, and Draghici, 2006, Ambroise et al., 2011). Moreover, theuse of CMS2A is not limited to class comparison application. In fact, the methodcan also be applied to microarray data from a class prediction study (Tarca, Romero,and Draghici, 2006) in order to improve classification accuracy.
ReferencesAllison, D., X. Cui, P. Page, and M. Sabripour (2006): “Microarray data analysis:
from disarray to consolidation and consensus,” Nature Reviews Genetics, 7, 55.Ambroise, J., B. Bearzatto, A. Robert, B. Govaerts, B. Macq, and J. Gala (2011):
“Impact of the spotted microarray preprocessing method on fold-change com-pression and variance stability,” BMC Bioinformatics, 12, 413.
Bengtsson, H., G. Jonsson, and J. Vallon-Christersson (2004): “Calibration and as-sessment of channel-specific biases in microarray data with extended dynamicalrange,” BMC bioinformatics, 5, 177.
Cui, X., M. Kerr, and G. Churchill (2003): “Transformations for cDNA microarraydata,” Statistical applications in genetics and molecular biology, 2, 4.
de la Nava, G., S. Van Hijum, and O. Trelles (2004): “Saturation and quantizationreduction in microarray experiments using two scans at different sensitivities,”

Statistical Applications in Genetics and Molecular Biology, 3, 1057.Dudley, A., J. Aach, M. Steffen, and G. Church (2002): “Measuring absolute ex-
pression with microarrays with a calibrated reference sample and an extendedsignal intensity range,” Proceedings of the National Academy of Sciences of theUnited States of America, 99, 7554.
Durbin, B., J. Hardin, D. Hawkins, and D. Rocke (2002): “A variance-stabilizingtransformation for gene-expression microarray data,” Bioinformatics, 18, S105.
Durbin, B. and D. Rocke (2003): “Estimation of transformation parameters formicroarray data,” Bioinformatics, 19, 1360.
Edgar, R., M. Domrachev, and A. Lash (2002): “Gene expression omnibus: Ncbigene expression and hybridization array data repository,” Nucleic acids research,30, 207.
Glasbey, C. and M. Khondoker (2009): “Efficiency of functional regression esti-mators for combining multiple laser scans of cDNA microarrays,” Biometricaljournal. Biometrische Zeitschrift, 51, 45.
Gupta, R., P. Auvinen, A. Thomas, and E. Arjas (2006): “Bayesian hierarchicalmodel for correcting signal saturation in microarrays using pixel intensities,” Sta-tistical applications in genetics and molecular biology, 5, 20.
Huber, W., A. Von Heydebreck, H. Sueltmann, A. Poustka, and M. Vingron (2003):“Parameter estimation for the calibration and variance stabilization of microarraydata,” Statistical Applications in Genetics and Molecular Biology, 2, 3.
Khondoker, M., C. Glasbey, and B. Worton (2006): “Statistical estimation of geneexpression using multiple laser scans of microarrays,” Bioinformatics, 22, 215.
Lin, S., P. Du, W. Huber, and W. Kibbe (2008): “Model-based variance-stabilizingtransformation for Illumina microarray data,” Nucleic Acids Research, 36, e11.
Lyng, H., A. Badiee, D. Svendsrud, E. Hovig, O. Myklebost, and T. Stokke (2004):“Profound influence of microarray scanner characteristics on gene expressionratios: analysis and procedure for correction,” BMC genomics, 5, 10.
Muller, R. and P. Buttner (1994): “A critical discussion of intraclass correlationcoefficients,” Statistics in Medicine, 13, 2465–2476.
Piepho, H., B. Keller, N. Hoecker, and F. Hochholdinger (2006): “Combining sig-nals from spotted cDNA microarrays obtained at different scanning intensities,”Bioinformatics, 22, 802–807.
Ritchie, M., J. Silver, A. Oshlack, M. Holmes, D. Diyagama, A. Holloway, andG. Smyth (2007): “A comparison of background correction methods for two-colour microarrays,” BIOINFORMATICS-OXFORD-, 23, 2700.
Rocke, D. and B. Durbin (2001): “A model for measurement error for gene expres-sion arrays,” Journal of Computational Biology, 8, 557–569.
Rocke, D. and B. Durbin (2003): “Approximate variance-stabilizing transforma-tions for gene-expression microarray data,” Bioinformatics, 19, 966.

Shi, L., L. Reid, W. Jones, R. Shippy, J. Warrington, S. Baker, P. Collins,F. De Longueville, E. Kawasaki, K. Lee, et al. (2006): “The MicroArray QualityControl (MAQC) project shows inter-and intraplatform reproducibility of geneexpression measurements,” Nature biotechnology, 24, 1151–1161.
Skibbe, D., X. Wang, X. Zhao, L. Borsuk, D. Nettleton, and P. Schnable (2006):“Scanning microarrays at multiple intensities enhances discovery of differentiallyexpressed genes,” Bioinformatics, 22, 1863.
Smyth, G. (2004): “Linear models and empirical Bayes methods for assessing dif-ferential expression in microarray experiments,” Statistical applications in genet-ics and molecular biology, 3, 1027.
Tarca, A., R. Romero, and S. Draghici (2006): “Analysis of microarray experimentsof gene expression profiling,” American journal of obstetrics and gynecology,195, 373–388.
Van Wijk, R., M. Kobayashi, and E. Van Wijk (2006): “Anatomic characterizationof human ultra-weak photon emission with a moveable photomultiplier and CCDimaging,” Journal of Photochemistry & Photobiology, B: Biology, 83, 69–76.
Williams, A. and E. Thomson (2010): “Effects of scanning sensitivity and multiplescan algorithms on microarray data quality,” BMC bioinformatics, 11, 127.
Related Documents