Genome Biology 2008, 9:S7 Open Access 2008 Tian et al. Volume 9, Suppl 1, Article S7 Method Combining guilt-by-association and guilt-by-profiling to predict Saccharomyces cerevisiae gene function Weidong Tian * , Lan V Zhang *§ , Murat Taşan * , Francis D Gibbons *¶ , Oliver D King *¥ , Julie Park † , Zeba Wunderlich *# , J Michael Cherry † and Frederick P Roth *‡ Addresses: * Department of Biological Chemistry and Molecular Pharmacology, Harvard Medical School, Longwood Avenue, Boston, Massachusetts 02115, USA. † Department of Genetics, School of Medicine, Stanford University, Stanford, California 94305-5120, USA. ‡ Center for Cancer Systems Biology (CCSB), Dana-Farber Cancer Institute, Jimmy Fund Way, Boston, Massachusetts 02115, USA. § McKinsey and Company, Hansen Way, Palo Alto, California 94304, USA. ¶ Merrimack Pharmaceuticals, Kendall Square, Cambridge, Massachusetts 02139, USA. ¥ Boston Biomedical Research Institute (BBRI), Grove St., Watertown, Massachusetts 02472, USA. # Massachusetts Institute of Technology, Massachusetts Ave, Cambridge, Massachusetts 02139, USA. Correspondence: Frederick P Roth. Email: [email protected] © 2008 Tian et al; licensee BioMed Central Ltd. This is an open access article distributed under the terms of the Creative Commons Attribution License (http://creativecommons.org/licenses/by/2.0), which permits unrestricted use, distribution, and reproduction in any medium, provided the original work is properly cited. Abstract Background: Learning the function of genes is a major goal of computational genomics. Methods for inferring gene function have typically fallen into two categories: 'guilt-by-profiling', which exploits correlation between function and other gene characteristics; and 'guilt-by-association', which transfers function from one gene to another via biological relationships. Results: We have developed a strategy ('Funckenstein') that performs guilt-by-profiling and guilt- by-association and combines the results. Using a benchmark set of functional categories and input data for protein-coding genes in Saccharomyces cerevisiae, Funckenstein was compared with a previous combined strategy. Subsequently, we applied Funckenstein to 2,455 Gene Ontology terms. In the process, we developed 2,455 guilt-by-profiling classifiers based on 8,848 gene characteristics and 12 functional linkage graphs based on 23 biological relationships. Conclusion: Funckenstein outperforms a previous combined strategy using a common benchmark dataset. The combination of 'guilt-by-profiling' and 'guilt-by-association' gave significant improvement over the component classifiers, showing the greatest synergy for the most specific functions. Performance was evaluated by cross-validation and by literature examination of the top- scoring novel predictions. These quantitative predictions should help prioritize experimental study of yeast gene functions. Introduction The rapid development of high-throughput technologies has made it possible to study the properties and relationships of thousands of genes in parallel [1-6]. A current challenge in genomic analysis is to combine this increasingly rich trove of evidence to infer biological function. The sheer volume of Published: 27 June 2008 Genome Biology 2008, 9:S7 The electronic version of this article is the complete one and can be found online at http://genomebiology.com/2008/9/S1/S7

Welcome message from author
This document is posted to help you gain knowledge. Please leave a comment to let me know what you think about it! Share it to your friends and learn new things together.
Transcript
Open Access2008Tianet al.Volume 9, Suppl 1, Article S7MethodCombining guilt-by-association and guilt-by-profiling to predict Saccharomyces cerevisiae gene functionWeidong Tian*, Lan V Zhang*§, Murat Taşan*, Francis D Gibbons*¶, Oliver D King*¥, Julie Park†, Zeba Wunderlich*#, J Michael Cherry† and Frederick P Roth*‡
Addresses: *Department of Biological Chemistry and Molecular Pharmacology, Harvard Medical School, Longwood Avenue, Boston, Massachusetts 02115, USA. †Department of Genetics, School of Medicine, Stanford University, Stanford, California 94305-5120, USA. ‡Center for Cancer Systems Biology (CCSB), Dana-Farber Cancer Institute, Jimmy Fund Way, Boston, Massachusetts 02115, USA. §McKinsey and Company, Hansen Way, Palo Alto, California 94304, USA. ¶Merrimack Pharmaceuticals, Kendall Square, Cambridge, Massachusetts 02139, USA. ¥Boston Biomedical Research Institute (BBRI), Grove St., Watertown, Massachusetts 02472, USA. #Massachusetts Institute of Technology, Massachusetts Ave, Cambridge, Massachusetts 02139, USA.
Correspondence: Frederick P Roth. Email: [email protected]
© 2008 Tian et al; licensee BioMed Central Ltd. This is an open access article distributed under the terms of the Creative Commons Attribution License (http://creativecommons.org/licenses/by/2.0), which permits unrestricted use, distribution, and reproduction in any medium, provided the original work is properly cited.
Abstract
Background: Learning the function of genes is a major goal of computational genomics. Methodsfor inferring gene function have typically fallen into two categories: 'guilt-by-profiling', whichexploits correlation between function and other gene characteristics; and 'guilt-by-association',which transfers function from one gene to another via biological relationships.
Results: We have developed a strategy ('Funckenstein') that performs guilt-by-profiling and guilt-by-association and combines the results. Using a benchmark set of functional categories and inputdata for protein-coding genes in Saccharomyces cerevisiae, Funckenstein was compared with aprevious combined strategy. Subsequently, we applied Funckenstein to 2,455 Gene Ontology terms.In the process, we developed 2,455 guilt-by-profiling classifiers based on 8,848 gene characteristicsand 12 functional linkage graphs based on 23 biological relationships.
Conclusion: Funckenstein outperforms a previous combined strategy using a common benchmarkdataset. The combination of 'guilt-by-profiling' and 'guilt-by-association' gave significantimprovement over the component classifiers, showing the greatest synergy for the most specificfunctions. Performance was evaluated by cross-validation and by literature examination of the top-scoring novel predictions. These quantitative predictions should help prioritize experimental studyof yeast gene functions.
IntroductionThe rapid development of high-throughput technologies hasmade it possible to study the properties and relationships of
thousands of genes in parallel [1-6]. A current challenge ingenomic analysis is to combine this increasingly rich trove ofevidence to infer biological function. The sheer volume of
Published: 27 June 2008
Genome Biology 2008, 9:S7
The electronic version of this article is the complete one and can be found online at http://genomebiology.com/2008/9/S1/S7
Genome Biology 2008, 9:S7
http://genomebiology.com/2008/9/S1/S7 Genome Biology 2008, Volume 9, Suppl 1, Article S7 Tian et al. S7.2
information makes manual human evaluation impracticable.Therefore, it is urgently necessary to develop improved auto-mated algorithms to assist and accelerate the process of func-tional annotation.
The transfer of function annotation from one gene to anothervia biological relationships ('guilt-by-association') has beenwidely used, especially on the basis of homology relation-ships. However, accurate functional annotation via homologyoften requires high sequence similarity between homologousproteins [7], and many proteins do not have homologs withknown function. Function may also be assigned to a genebased on a profile of its characteristics ('guilt-by-profiling').Sequence-based guilt-by-profiling methods, for example,assign functions based on matches to motifs derived frommultiple sequence alignments [8-11].
Sequence-based relationships and characteristics are bettersuited to predict catalytic activity or structural role ratherthan involvement in a biological process, for example,osmotic stress response. Biological relationships other thanhomology have proven useful in guilt-by-association studies,including protein-protein physical interactions [12], geneticinteractions derived from examination of double-perturba-tion and phenotyping experiments [13], correlated geneexpression [14], or correlated phylogenetic profiles [15]. Algo-rithms to predict function from interactions have evolvedfrom simple inspection of neighborhood interactions [12,16]to consider the global structure of the interaction network[17,18].
Beyond sequence patterns, a wide variety of biological char-acteristics has proven useful in guilt-by-profiling functionprediction, including phenotype [19,20], subcellular localiza-tion [21], gene chromosome neighborhood [22], previouslyknown functional annotations [23], and membership withingene expression clusters [24,25] or protein complexes [5].
Many guilt-by-profiling and guilt-by-association efforts havebeen reported. Some guilt-by-profiling studies have exploitedgene-gene relationships by transforming them into genecharacteristics [14], and some guilt-by-association studieshave exploited gene characteristics by treating shared anno-tation with a gene characteristic as a gene-gene relationship.Only a few attempts have been made to integrate both typesof inference. In particular, Deng and coworkers [26] inferredgene function by exploiting both gene-gene relationships andgene characteristics. This approach, discussed further below,used protein pattern annotation and protein complex infor-mation as gene characteristics, and also exploited proteininteraction, genetic interaction, and expression correlationrelationships.
Here, we introduce Funckenstein, a new method combiningboth guilt-by-profiling and guilt-by-association approachesto predict protein function. Initially, Funckenstein uses sepa-
rate classifiers for guilt-by-profiling and guilt-by-association.It can integrate a very large number of gene characteristicsand gene-gene relationships to infer functions, thanks to thescalability of its component classifiers. Funckenstein thencombines prediction results using logistic regression opti-mized for precision versus recall performance, achieving abetter performance than either approach alone.
Here we apply Funckenstein to a benchmark of integratedSaccharomyces cerevisiae genomic data used previously topredict broad gene functions, and show that Funckensteinachieves higher precision at all levels of recall. Because pre-dictions of more specific gene functions are generally moreuseful to experimental biologists, we also apply Funckensteinto score 2,455 Gene Ontology (GO) terms for all protein-cod-ing genes in S. cerevisiae. The results are assessed by cross-validation and by evaluation of top predictions by an expertcurator from the Saccharomyces Genome Database (SGD).Together, the results show that Funckenstein achieves highprecision in cross-validation and in the prediction of novelfunctions.
ResultsA method combining guilt-by-profiling with guilt-by-associationWe have developed an algorithm (Funckenstein) that com-bines both guilt-by-profiling and guilt-by-association to makegene function predictions. Guilt-by-profiling was performedusing the random forest (RF) method [27]. However, for com-parison we also performed guilt-by-profiling using a probabi-listic decision tree (PDT) method [28] with an early-stoppingcriterion to limit over-fitting. Guilt-by-association was per-formed in two steps: first, generate a functional linkage (FL)graph [29], that is, a graph with edge weights reflecting theprobability that two genes share a sufficiently specific GOterm; and second, use the FL graph to assign a score to each(candidate gene, GO term) combination based on the weightof links between the candidate gene and genes currentlyassigned to that GO term. The RF and FL predictions werethen combined via a logistic regression model that optimizesprecision versus recall performance. A full description of thealgorithm and optimization of its parameters may be found inMaterials and methods.
Performance evaluation using a previous benchmarkA combined approach was applied previously to predict S.cerevisiae gene functions. Specifically, a Markov randomfield (MRF) guilt-by-association approach integrated infor-mation from protein interactions, genetic interactions, andgene expression correlation [26]. This approach alsoemployed guilt-by-profiling, in that a gene-specific prior wascalculated from Pfam protein sequence patterns [8] and pro-tein complex membership using a naïve Bayes (NB) method[30]. We will refer to this combined approach as 'MRF-NB'.
Genome Biology 2008, 9:S7
http://genomebiology.com/2008/9/S1/S7 Genome Biology 2008, Volume 9, Suppl 1, Article S7 Tian et al. S7.3
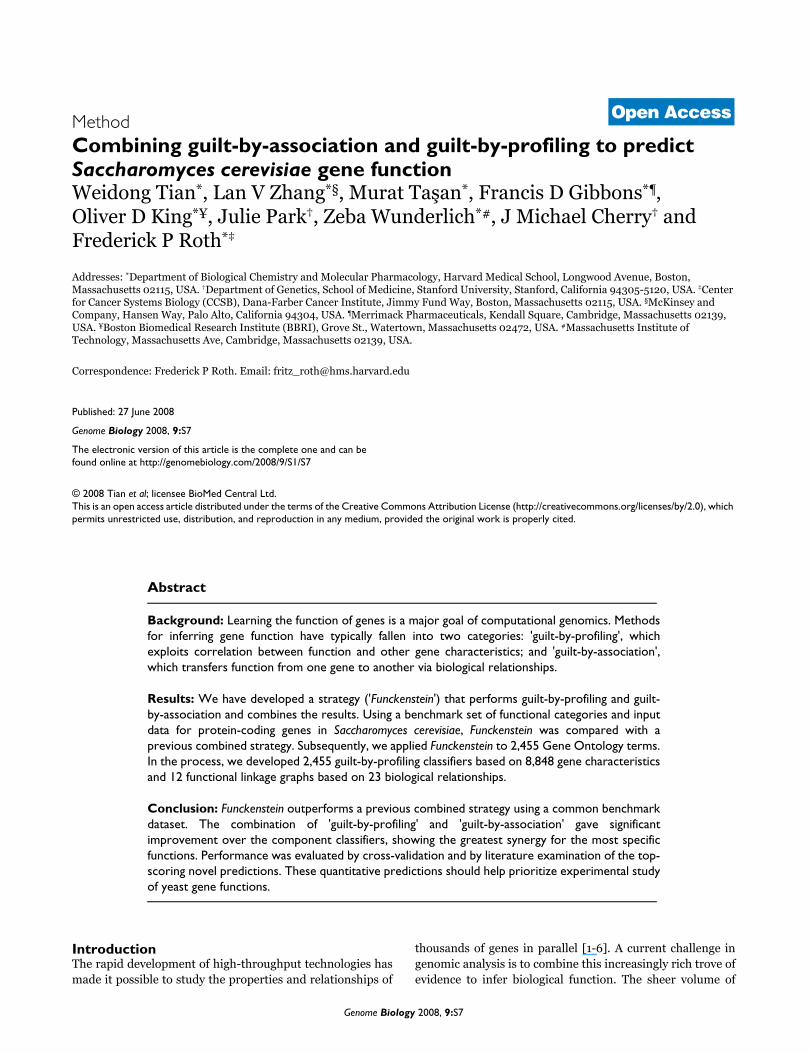
MRF-NB was applied previously to protein-coding S. cerevi-siae genes to predict a small set of functional categoriesderived from literature annotation by the Munich Informa-tion Center for Protein Sequences (MIPS) [31]. MIPS func-tional categories are hierarchical, with top-level functionsdescribing very general protein functions (for example,'metabolism') and lower levels describing more specific func-tions (for example, 'proton driven symporter'). The MRF-NBapproach was applied to 13 top-level MIPS functional catego-ries and trained on the 3,588 yeast genes that had beenassigned at least one of these categories (see Table 1 fordetails). For the purposes of comparison, we trained Funck-enstein on the same data sets used for the MRF analysis andcompared our cross-validation performance with the cross-validation performance reported previously [26].
To train Funckenstein's guilt-by-profiling classifiers, we usedprotein sequence pattern and complex membership data. Forguilt-by-association analysis, we used four types of pairwisebiological relationships: pairwise physical and genetic inter-actions, correlated gene expression (with a correlation coeffi-cient greater than 0.9), and interaction according to a large-scale affinity purification dataset [5]. When using affinitypurification-derived interactions for predictions, we consid-ered both the 'spoke' model (interactions defined to existbetween bait and prey proteins) and the 'matrix' model (inter-action defined not only between bait and prey protein, butalso between prey proteins purified with the same bait) [32].Because the 'matrix' model gave a slightly worse predictionperformance (Table 2), we used the 'spoke' model for affinitypurification-derived interactions.
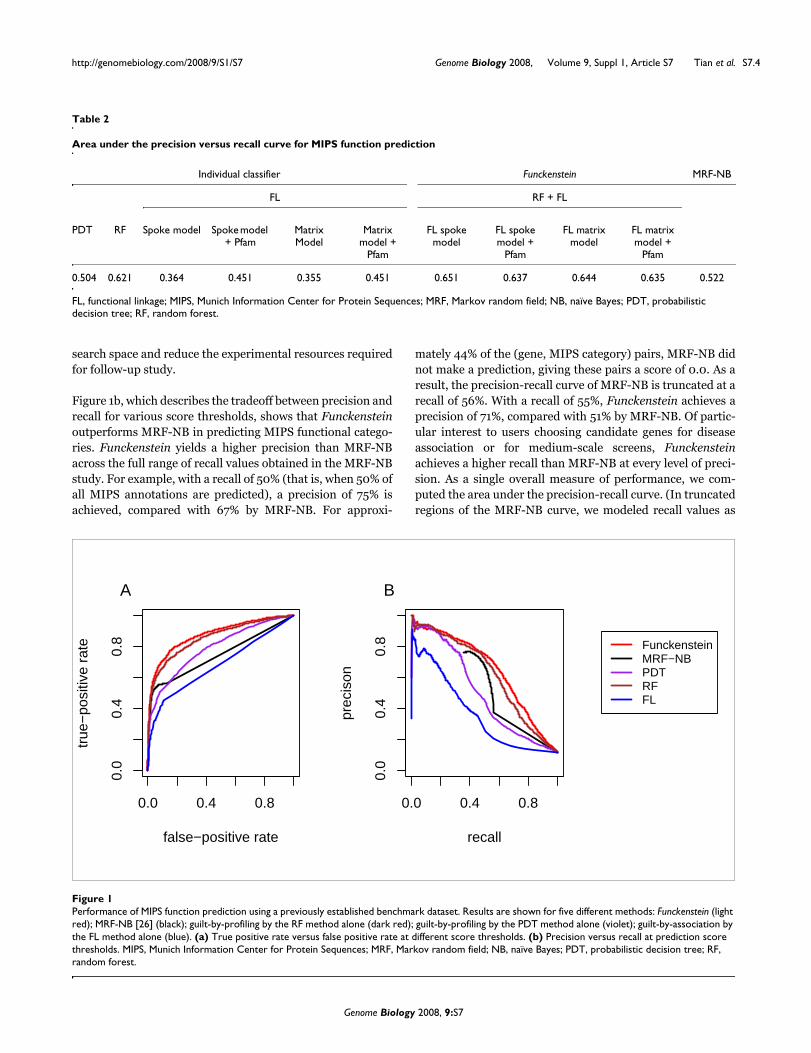
Receiver operating characteristic (ROC) curves reflect thetradeoff between recall and false positive rate that can beachieved by tuning a given method. Here, false positive rate isdefined as the fraction of (gene, MIPS category) pairs thatwere predicted to be positive, among all pairs that are incor-rect annotations according to the MIPS annotation. The ROCcurves for Funckenstein and MRF-NB (Figure 1a) reflect asimilar trend to that observed in the precision versus recallcurves, with Funckenstein yielding an area under the ROCcurve (AUC) of 0.88, compared with an AUC of 0.75 for MRF-NB. An AUC of 50% would indicate performance equal to thatof random guessing and an AUC of 100% would indicate per-fect performance. Although AUC is a measure of overall per-formance that is used for many applications, it is lessappropriate here. Because the total number of unannotatedgene/MIPS functional category pairs far exceeds the numberof annotations, only performance at extremely low false-pos-itive rates will be relevant to most users. Furthermore, mostbiologists are more interested in precision (fraction of predic-tions that are correct) than in false positive rate as definedabove. Therefore, we used the precision-recall curve to evalu-ate prediction performance in all subsequent analyses.
The precision that a given user requires depends on theirapplication. Since each of our predictions is accompanied bya quantitative measure of confidence, users may consideronly the highest-precision predictions. Alternatively, userswishing to select candidate genes for further study - for exam-ple, for medium-scale genomic experiments - may wish toinclude a greater number of 'trues' at the expense of precision.Predictions offer a principled form of triage to reduce the
Table 1
MIPS functional classes used to compare with MRF -NB approach
Functional categories No. of genes annotated
Cell cycle and DNA processing 600
Cell fate 411
Cell rescue, defense and virulence 264
Cellular transport and transport mechanisms 479
Control of cellular organization 192
Energy 242
Metabolism 1,048
Protein fate (folding, modification, destination) 578
Protein synthesis 335
Regulation of/interaction with cellular environment 193
Transcription 753
Transport facilitation 306
Others (cellular communication/signal transduction mechanism, or protein activity regulation, or protein with binding function or cofactor requirement (structural or catalytic), or transposable elements, viral and plasmid proteins)
81
Total 3,588
MIPS, Munich Information Center for Protein Sequences; MRF, Markov random field; NB, naive bayes
Genome Biology 2008, 9:S7
http://genomebiology.com/2008/9/S1/S7 Genome Biology 2008, Volume 9, Suppl 1, Article S7 Tian et al. S7.4
search space and reduce the experimental resources requiredfor follow-up study.
Figure 1b, which describes the tradeoff between precision andrecall for various score thresholds, shows that Funckensteinoutperforms MRF-NB in predicting MIPS functional catego-ries. Funckenstein yields a higher precision than MRF-NBacross the full range of recall values obtained in the MRF-NBstudy. For example, with a recall of 50% (that is, when 50% ofall MIPS annotations are predicted), a precision of 75% isachieved, compared with 67% by MRF-NB. For approxi-
mately 44% of the (gene, MIPS category) pairs, MRF-NB didnot make a prediction, giving these pairs a score of 0.0. As aresult, the precision-recall curve of MRF-NB is truncated at arecall of 56%. With a recall of 55%, Funckenstein achieves aprecision of 71%, compared with 51% by MRF-NB. Of partic-ular interest to users choosing candidate genes for diseaseassociation or for medium-scale screens, Funckensteinachieves a higher recall than MRF-NB at every level of preci-sion. As a single overall measure of performance, we com-puted the area under the precision-recall curve. (In truncatedregions of the MRF-NB curve, we modeled recall values as
Table 2
Area under the precision versus recall curve for MIPS function prediction
Individual classifier Funckenstein MRF-NB
FL RF + FL
PDT RF Spoke model Spoke model + Pfam
Matrix Model
Matrix model +
Pfam
FL spoke model
FL spoke model +
Pfam
FL matrix model
FL matrix model +
Pfam
0.504 0.621 0.364 0.451 0.355 0.451 0.651 0.637 0.644 0.635 0.522
FL, functional linkage; MIPS, Munich Information Center for Protein Sequences; MRF, Markov random field; NB, naïve Bayes; PDT, probabilistic decision tree; RF, random forest.
Performance of MIPS function prediction using a previously established benchmark datasetFigure 1Performance of MIPS function prediction using a previously established benchmark dataset. Results are shown for five different methods: Funckenstein (light red); MRF-NB [26] (black); guilt-by-profiling by the RF method alone (dark red); guilt-by-profiling by the PDT method alone (violet); guilt-by-association by the FL method alone (blue). (a) True positive rate versus false positive rate at different score thresholds. (b) Precision versus recall at prediction score thresholds. MIPS, Munich Information Center for Protein Sequences; MRF, Markov random field; NB, naïve Bayes; PDT, probabilistic decision tree; RF, random forest.
0.0 0.4 0.8
0.0
0.4
0.8
false−positive rate
true
−po
sitiv
e ra
te
A
0.0 0.4 0.8
0.0
0.4
0.8
recall
prec
ison
B
FunckensteinMRF−NBPDTRFFL
Genome Biology 2008, 9:S7
http://genomebiology.com/2008/9/S1/S7 Genome Biology 2008, Volume 9, Suppl 1, Article S7 Tian et al. S7.5
having precision corresponding to that of the nearestobserved recall value.) The area under the precision-recallcurve of Funckenstein was 0.651, greater than the 0.522observed for the MRF-NB approach.
We also investigated the individual contributions of Funcken-stein classifiers of each type (guilt-by-profiling or guilt-by-association) in predicting MIPS functional categories. Theguilt-by-profiling classifier outperforms the guilt-by-associa-tion classifier (Figure 1b) with precision-recall curve areas of0.621 and 0.364, respectively. In fact, the guilt-by-profilingclassifier alone already outperforms MRF-NB (area 0.522).Figure 1 also shows the performance of an alternative PDTguilt-by-profiling method in predicting MIPS functional cate-gories. The RF method is undoubtedly an improvement overthe PDT method (area 0.621 versus 0.504). This supports ourchoice to use the RF method for all other guilt-by-profilingpredictions described here.
Combining the two component classifiers led to better per-formance than was achieved with either alone. However, theimprovement of Funckenstein over the guilt-by-profilingclassifier was modest for the MIPS benchmark (area of 0.651compared with 0.621 under that of guilt-by-profiling classi-fier). This could be because of the very limited number ofavailable interactions in this dataset. More substantialimprovement would be expected as more relationships areincluded.
Note that differences in component classifier performancemay be due either to algorithmic differences or to the value ofthe features used for prediction, and the comparison abovedoes not separate these effects. Therefore, we also investi-gated the effect of transforming gene features into gene-generelationships for use by the FL classifier. Specifically, wetreated shared annotation with a Pfam domain as a gene-generelationship (information found in expression cluster mem-bership features was already available to the FL classifier asprotein interactions). This substantially improved the per-formance of the FL classifier to an area under the precision-recall curve of 0.451 (versus the previous 0.364 area). How-ever, use of the improved FL guilt-by-association classifierwithin Funckenstein actually reduced its overall performance(area 0.651 versus 0.637). One explanation is that the inclu-sion of the same evidence type in both component classifiersmay lead to 'over-counting' of evidence and, thus, a slightlyweaker Funckenstein. Thus, it may be important to includecomponent classifiers using relatively independent input fea-tures for the success of Funckenstein.
Application to Gene Ontology terms using an expanded integrated datasetAlthough it enabled us to compare Funckenstein and MRF-NB methods directly, the previously defined set of functionalcategories has the drawback of being somewhat non-specific.(For example, it is not immediately clear what specific follow-
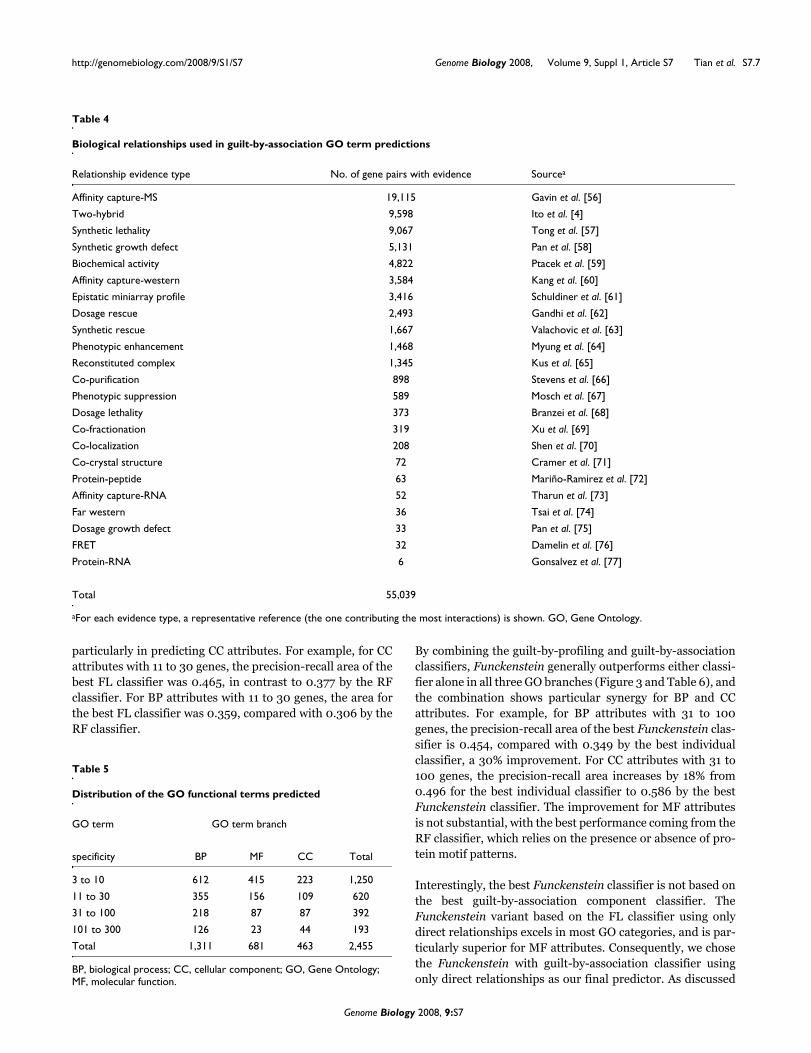
up experiment would test the hypothesis that a gene isinvolved in 'metabolism'.) Therefore, we sought to applyFunckenstein to predict more specific GO functional terms.We also expanded the scope of the data used to make predic-tions. We assembled data for 21 gene characteristic types and23 experimentally determined gene-gene relationship types(shown in Tables 3 and 4, respectively).
Terms in the GO vocabulary are organized within a rooteddirected acyclic graph with three branches that describe bio-logical process (BP), molecular function (MF), and cellularcomponent (CC), respectively. Within each GO branch, achild GO term may descend from multiple parental GO terms.The vocabulary is structured such that annotation with agiven GO term implies 'propagation' of this annotation to allancestral terms. We obtained GO annotation for all protein-coding S. cerevisiae genes from SGD and, for each gene, weassigned ancestral GO terms implied by annotated descend-ent terms.
For GO term prediction, we selected yeast protein-codinggenes annotated by at least one of the attribute types listed inTables 3 and 4. Out of these 6,368 genes, the numbers of 'ver-ified', 'uncharacterized', and 'dubious' open reading frameswere 4,476, 1,312, and 580, respectively, when we initiatedthe work. In total, 5,790 genes were assigned to at least oneGO term, including all 'verified' and 'uncharacterized' openreading frames.
Some GO terms describe extremely general functions; forexample, 'catalytic activity' (GO:0003824) had 1,885 associ-ated genes. To focus on specific GO terms with the greatestpotential to guide future experimentation, we considered onlyGO terms assigned to 300 or fewer genes. We excluded GOterms assigned to fewer than three genes, because of theextreme difficulty in developing a classifier with such a lim-ited number of positive training examples. After this filtering,2,455 GO terms remained. For convenience, we separated GOterms into 12 categories corresponding to all combinations ofthree GO branches (BP, MF, and CC) and four specificity lev-els (Table 5). Specificity levels are defined according to thenumber of annotated genes: 3 to 10, 11 to 30, 31 to 100, and101 to 300 genes. To avoid circularity due to logical depend-ency between GO terms, we have not allowed classifiers topredict GO terms using other GO terms. The functional link-age graphs used in guilt-by-association analysis were trainedseparately for each of the 12 GO categories, and the logisticregression parameter for combining guilt-by-association andguilt-by-profiling predictions was optimized separately foreach GO category by maximizing the area under the corre-sponding precision versus recall curve.
GO term predictions using both guilt-by-profiling and guilt-by-association classifiers were made for the 6,368 S. cerevi-siae protein-coding genes that are either annotated with a GOterm or have at least one gene characteristic or interaction.
Genome Biology 2008, 9:S7
http://genomebiology.com/2008/9/S1/S7 Genome Biology 2008, Volume 9, Suppl 1, Article S7 Tian et al. S7.6
This resulted in a score for each of 6,368 S. cerevisiae genesfor each of 2,455 GO terms for a total of 15,633,440 quantita-tive annotation scores.
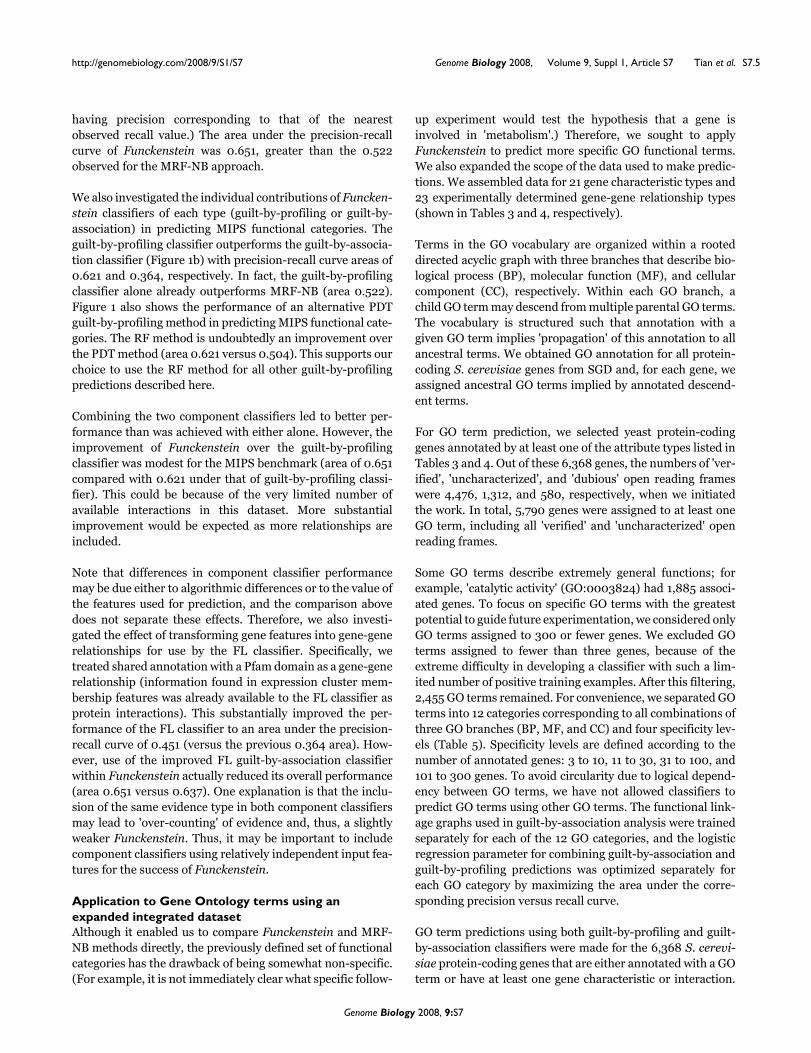
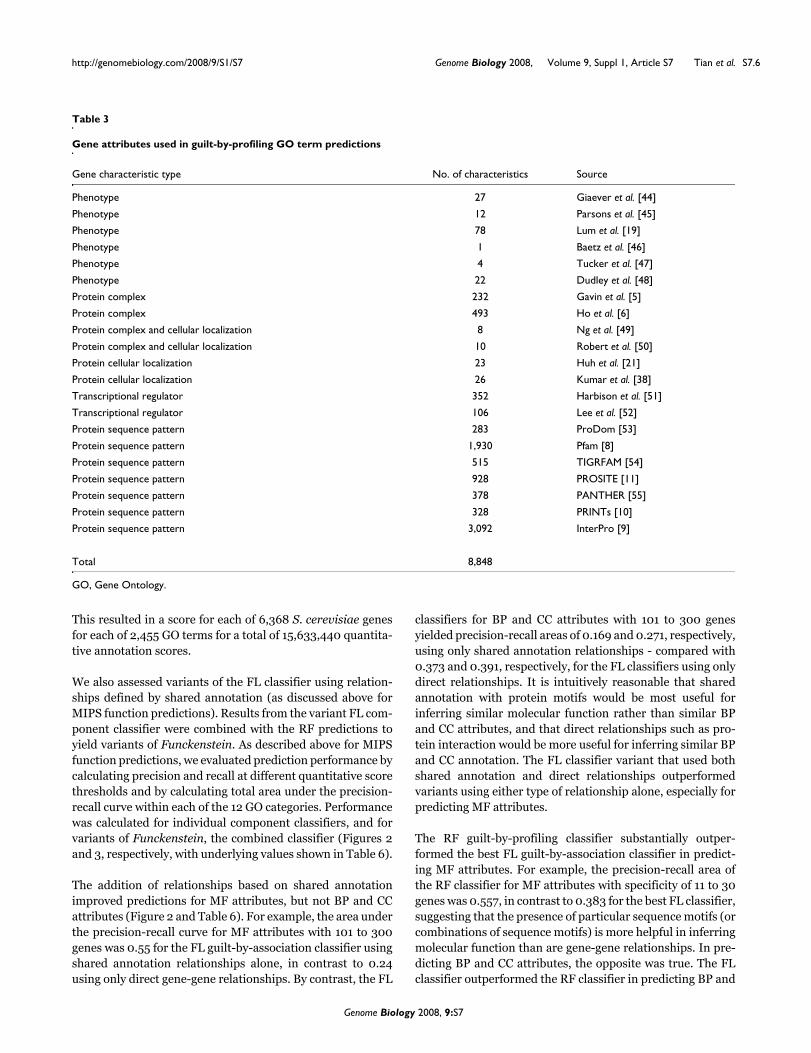
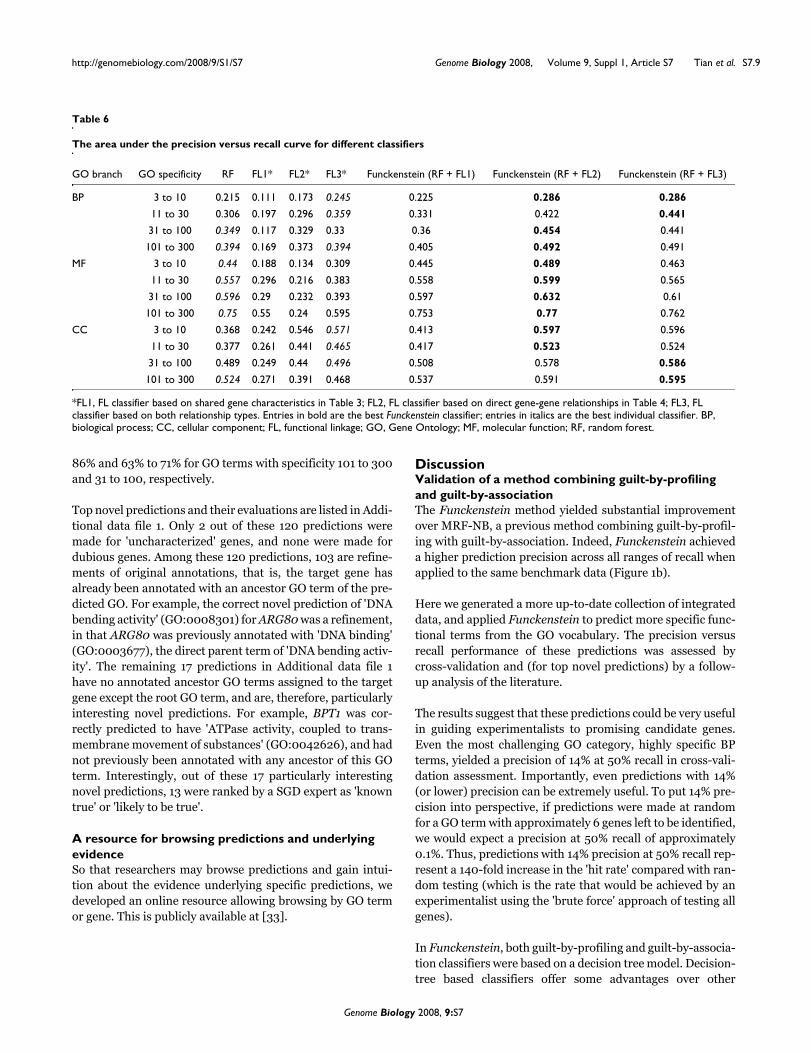
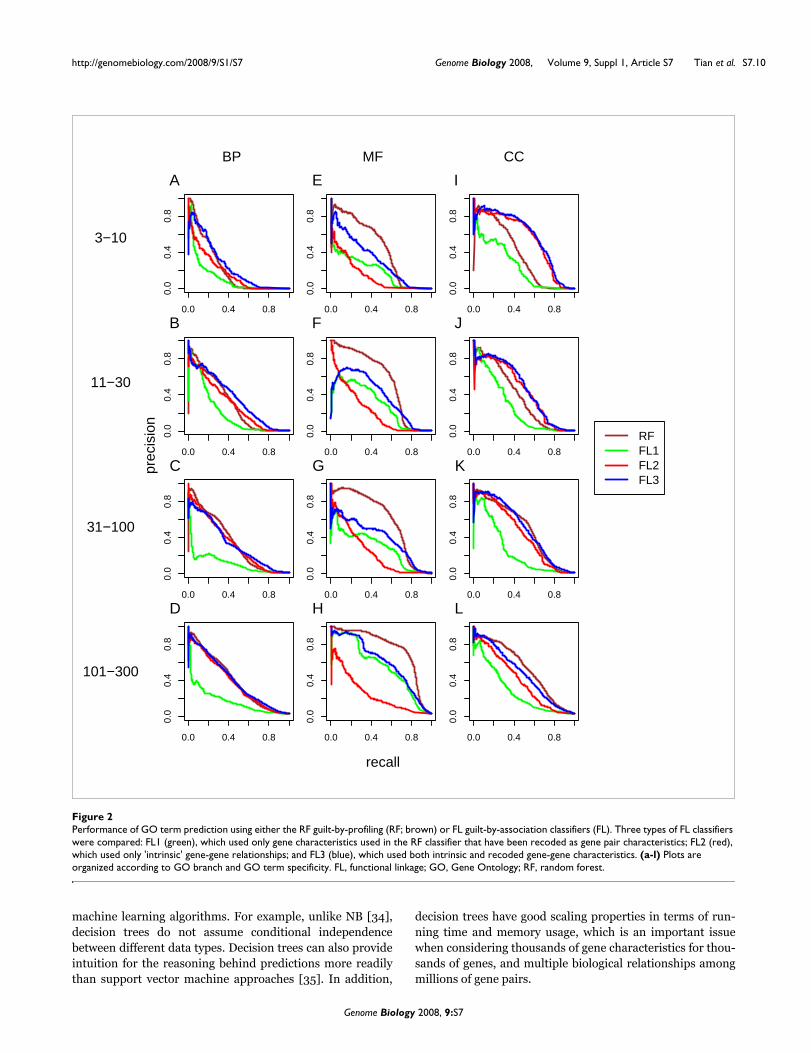
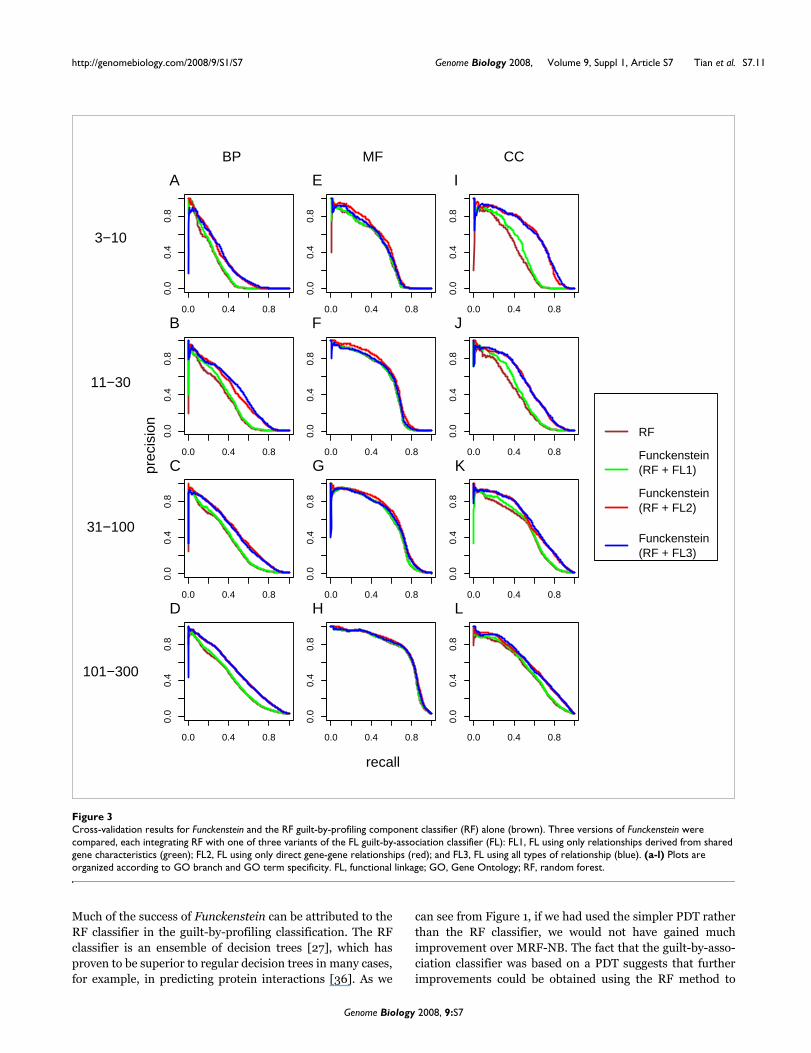
We also assessed variants of the FL classifier using relation-ships defined by shared annotation (as discussed above forMIPS function predictions). Results from the variant FL com-ponent classifier were combined with the RF predictions toyield variants of Funckenstein. As described above for MIPSfunction predictions, we evaluated prediction performance bycalculating precision and recall at different quantitative scorethresholds and by calculating total area under the precision-recall curve within each of the 12 GO categories. Performancewas calculated for individual component classifiers, and forvariants of Funckenstein, the combined classifier (Figures 2and 3, respectively, with underlying values shown in Table 6).
The addition of relationships based on shared annotationimproved predictions for MF attributes, but not BP and CCattributes (Figure 2 and Table 6). For example, the area underthe precision-recall curve for MF attributes with 101 to 300genes was 0.55 for the FL guilt-by-association classifier usingshared annotation relationships alone, in contrast to 0.24using only direct gene-gene relationships. By contrast, the FL
classifiers for BP and CC attributes with 101 to 300 genesyielded precision-recall areas of 0.169 and 0.271, respectively,using only shared annotation relationships - compared with0.373 and 0.391, respectively, for the FL classifiers using onlydirect relationships. It is intuitively reasonable that sharedannotation with protein motifs would be most useful forinferring similar molecular function rather than similar BPand CC attributes, and that direct relationships such as pro-tein interaction would be more useful for inferring similar BPand CC annotation. The FL classifier variant that used bothshared annotation and direct relationships outperformedvariants using either type of relationship alone, especially forpredicting MF attributes.
The RF guilt-by-profiling classifier substantially outper-formed the best FL guilt-by-association classifier in predict-ing MF attributes. For example, the precision-recall area ofthe RF classifier for MF attributes with specificity of 11 to 30genes was 0.557, in contrast to 0.383 for the best FL classifier,suggesting that the presence of particular sequence motifs (orcombinations of sequence motifs) is more helpful in inferringmolecular function than are gene-gene relationships. In pre-dicting BP and CC attributes, the opposite was true. The FLclassifier outperformed the RF classifier in predicting BP and
Table 3
Gene attributes used in guilt-by-profiling GO term predictions
Gene characteristic type No. of characteristics Source
Phenotype 27 Giaever et al. [44]
Phenotype 12 Parsons et al. [45]
Phenotype 78 Lum et al. [19]
Phenotype 1 Baetz et al. [46]
Phenotype 4 Tucker et al. [47]
Phenotype 22 Dudley et al. [48]
Protein complex 232 Gavin et al. [5]
Protein complex 493 Ho et al. [6]
Protein complex and cellular localization 8 Ng et al. [49]
Protein complex and cellular localization 10 Robert et al. [50]
Protein cellular localization 23 Huh et al. [21]
Protein cellular localization 26 Kumar et al. [38]
Transcriptional regulator 352 Harbison et al. [51]
Transcriptional regulator 106 Lee et al. [52]
Protein sequence pattern 283 ProDom [53]
Protein sequence pattern 1,930 Pfam [8]
Protein sequence pattern 515 TIGRFAM [54]
Protein sequence pattern 928 PROSITE [11]
Protein sequence pattern 378 PANTHER [55]
Protein sequence pattern 328 PRINTs [10]
Protein sequence pattern 3,092 InterPro [9]
Total 8,848
GO, Gene Ontology.
Genome Biology 2008, 9:S7
http://genomebiology.com/2008/9/S1/S7 Genome Biology 2008, Volume 9, Suppl 1, Article S7 Tian et al. S7.7
particularly in predicting CC attributes. For example, for CCattributes with 11 to 30 genes, the precision-recall area of thebest FL classifier was 0.465, in contrast to 0.377 by the RFclassifier. For BP attributes with 11 to 30 genes, the area forthe best FL classifier was 0.359, compared with 0.306 by theRF classifier.
By combining the guilt-by-profiling and guilt-by-associationclassifiers, Funckenstein generally outperforms either classi-fier alone in all three GO branches (Figure 3 and Table 6), andthe combination shows particular synergy for BP and CCattributes. For example, for BP attributes with 31 to 100genes, the precision-recall area of the best Funckenstein clas-sifier is 0.454, compared with 0.349 by the best individualclassifier, a 30% improvement. For CC attributes with 31 to100 genes, the precision-recall area increases by 18% from0.496 for the best individual classifier to 0.586 by the bestFunckenstein classifier. The improvement for MF attributesis not substantial, with the best performance coming from theRF classifier, which relies on the presence or absence of pro-tein motif patterns.
Interestingly, the best Funckenstein classifier is not based onthe best guilt-by-association component classifier. TheFunckenstein variant based on the FL classifier using onlydirect relationships excels in most GO categories, and is par-ticularly superior for MF attributes. Consequently, we chosethe Funckenstein with guilt-by-association classifier usingonly direct relationships as our final predictor. As discussed
Table 4
Biological relationships used in guilt-by-association GO term predictions
Relationship evidence type No. of gene pairs with evidence Sourcea
Affinity capture-MS 19,115 Gavin et al. [56]
Two-hybrid 9,598 Ito et al. [4]
Synthetic lethality 9,067 Tong et al. [57]
Synthetic growth defect 5,131 Pan et al. [58]
Biochemical activity 4,822 Ptacek et al. [59]
Affinity capture-western 3,584 Kang et al. [60]
Epistatic miniarray profile 3,416 Schuldiner et al. [61]
Dosage rescue 2,493 Gandhi et al. [62]
Synthetic rescue 1,667 Valachovic et al. [63]
Phenotypic enhancement 1,468 Myung et al. [64]
Reconstituted complex 1,345 Kus et al. [65]
Co-purification 898 Stevens et al. [66]
Phenotypic suppression 589 Mosch et al. [67]
Dosage lethality 373 Branzei et al. [68]
Co-fractionation 319 Xu et al. [69]
Co-localization 208 Shen et al. [70]
Co-crystal structure 72 Cramer et al. [71]
Protein-peptide 63 Mariño-Ramirez et al. [72]
Affinity capture-RNA 52 Tharun et al. [73]
Far western 36 Tsai et al. [74]
Dosage growth defect 33 Pan et al. [75]
FRET 32 Damelin et al. [76]
Protein-RNA 6 Gonsalvez et al. [77]
Total 55,039
aFor each evidence type, a representative reference (the one contributing the most interactions) is shown. GO, Gene Ontology.
Table 5
Distribution of the GO functional terms predicted
GO term GO term branch
specificity BP MF CC Total
3 to 10 612 415 223 1,250
11 to 30 355 156 109 620
31 to 100 218 87 87 392
101 to 300 126 23 44 193
Total 1,311 681 463 2,455
BP, biological process; CC, cellular component; GO, Gene Ontology; MF, molecular function.
Genome Biology 2008, 9:S7
http://genomebiology.com/2008/9/S1/S7 Genome Biology 2008, Volume 9, Suppl 1, Article S7 Tian et al. S7.8
above for MIPS function predictions, it appears that comple-mentarity of individual classifiers is more important than useof individually optimized component classifiers.
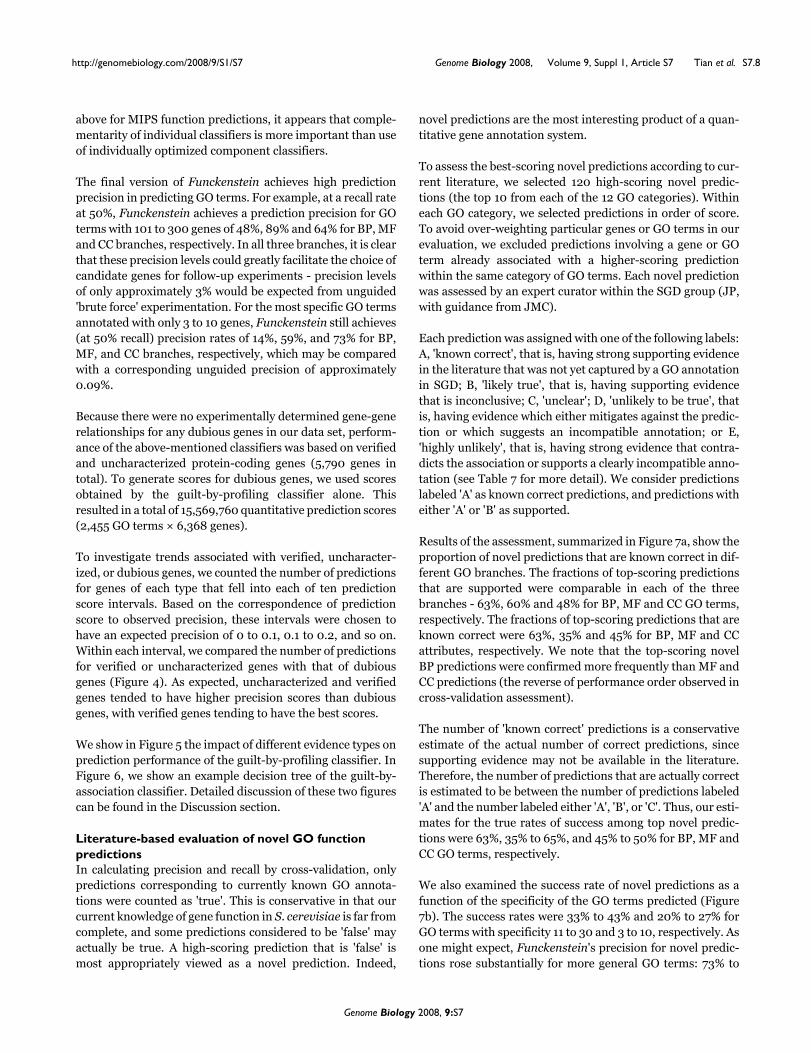
The final version of Funckenstein achieves high predictionprecision in predicting GO terms. For example, at a recall rateat 50%, Funckenstein achieves a prediction precision for GOterms with 101 to 300 genes of 48%, 89% and 64% for BP, MFand CC branches, respectively. In all three branches, it is clearthat these precision levels could greatly facilitate the choice ofcandidate genes for follow-up experiments - precision levelsof only approximately 3% would be expected from unguided'brute force' experimentation. For the most specific GO termsannotated with only 3 to 10 genes, Funckenstein still achieves(at 50% recall) precision rates of 14%, 59%, and 73% for BP,MF, and CC branches, respectively, which may be comparedwith a corresponding unguided precision of approximately0.09%.
Because there were no experimentally determined gene-generelationships for any dubious genes in our data set, perform-ance of the above-mentioned classifiers was based on verifiedand uncharacterized protein-coding genes (5,790 genes intotal). To generate scores for dubious genes, we used scoresobtained by the guilt-by-profiling classifier alone. Thisresulted in a total of 15,569,760 quantitative prediction scores(2,455 GO terms × 6,368 genes).
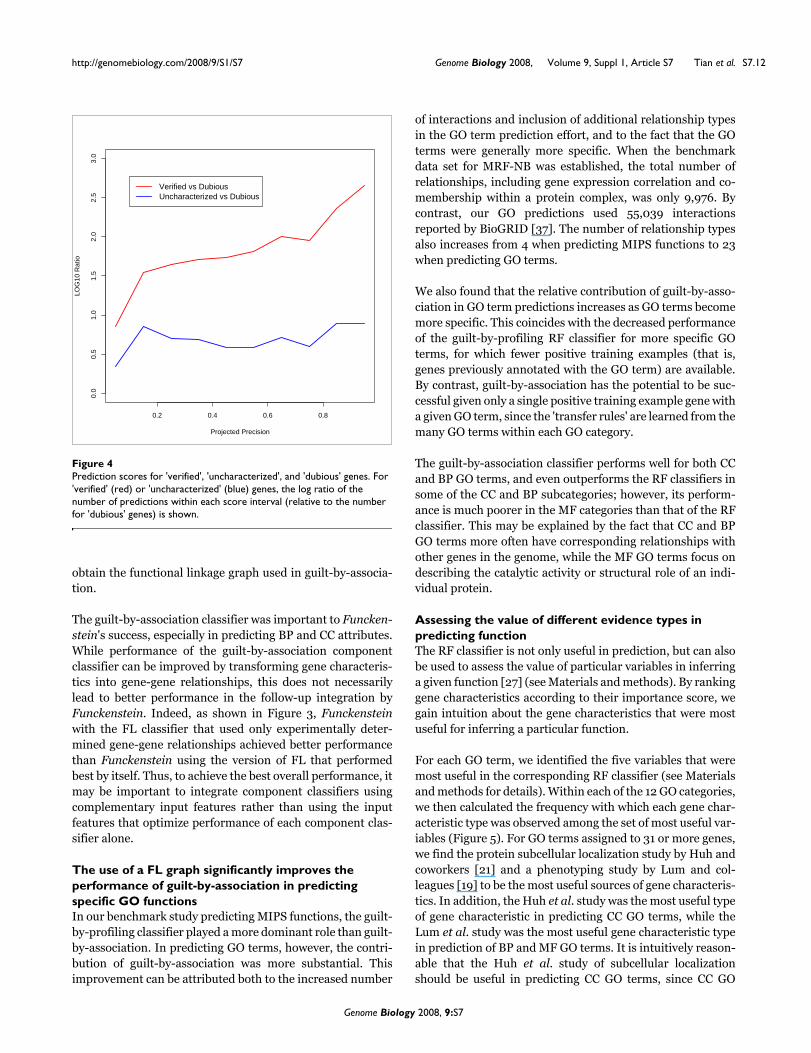
To investigate trends associated with verified, uncharacter-ized, or dubious genes, we counted the number of predictionsfor genes of each type that fell into each of ten predictionscore intervals. Based on the correspondence of predictionscore to observed precision, these intervals were chosen tohave an expected precision of 0 to 0.1, 0.1 to 0.2, and so on.Within each interval, we compared the number of predictionsfor verified or uncharacterized genes with that of dubiousgenes (Figure 4). As expected, uncharacterized and verifiedgenes tended to have higher precision scores than dubiousgenes, with verified genes tending to have the best scores.
We show in Figure 5 the impact of different evidence types onprediction performance of the guilt-by-profiling classifier. InFigure 6, we show an example decision tree of the guilt-by-association classifier. Detailed discussion of these two figurescan be found in the Discussion section.
Literature-based evaluation of novel GO function predictionsIn calculating precision and recall by cross-validation, onlypredictions corresponding to currently known GO annota-tions were counted as 'true'. This is conservative in that ourcurrent knowledge of gene function in S. cerevisiae is far fromcomplete, and some predictions considered to be 'false' mayactually be true. A high-scoring prediction that is 'false' ismost appropriately viewed as a novel prediction. Indeed,
novel predictions are the most interesting product of a quan-titative gene annotation system.
To assess the best-scoring novel predictions according to cur-rent literature, we selected 120 high-scoring novel predic-tions (the top 10 from each of the 12 GO categories). Withineach GO category, we selected predictions in order of score.To avoid over-weighting particular genes or GO terms in ourevaluation, we excluded predictions involving a gene or GOterm already associated with a higher-scoring predictionwithin the same category of GO terms. Each novel predictionwas assessed by an expert curator within the SGD group (JP,with guidance from JMC).
Each prediction was assigned with one of the following labels:A, 'known correct', that is, having strong supporting evidencein the literature that was not yet captured by a GO annotationin SGD; B, 'likely true', that is, having supporting evidencethat is inconclusive; C, 'unclear'; D, 'unlikely to be true', thatis, having evidence which either mitigates against the predic-tion or which suggests an incompatible annotation; or E,'highly unlikely', that is, having strong evidence that contra-dicts the association or supports a clearly incompatible anno-tation (see Table 7 for more detail). We consider predictionslabeled 'A' as known correct predictions, and predictions witheither 'A' or 'B' as supported.
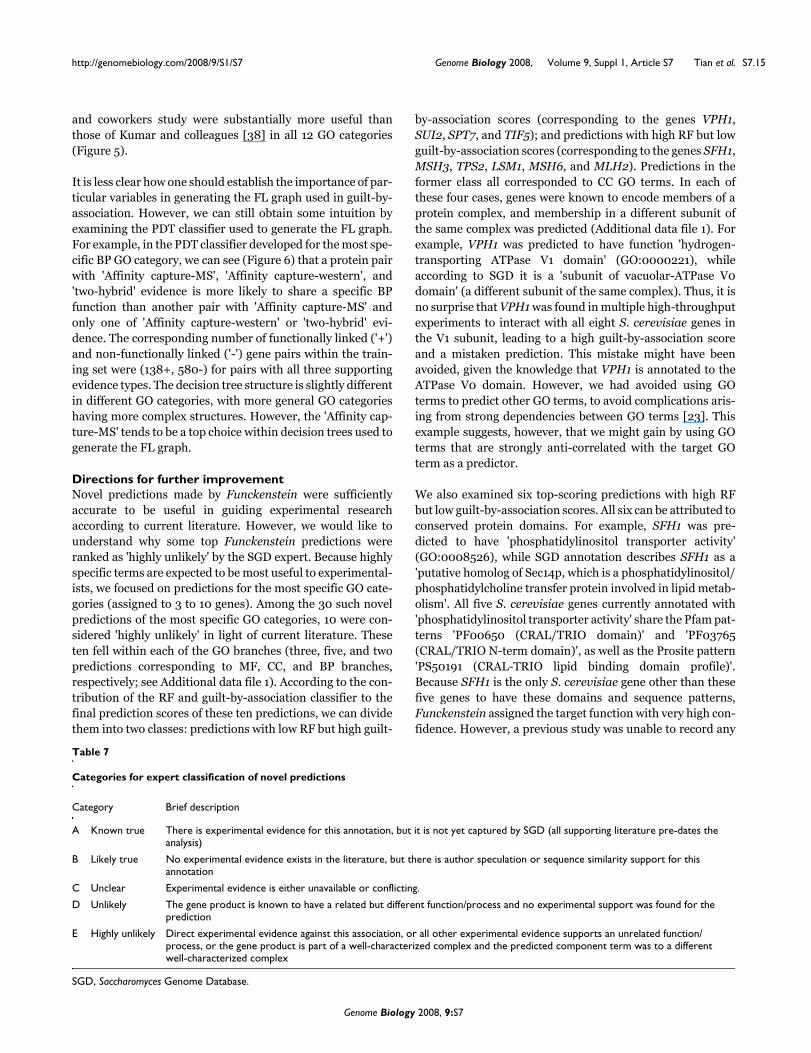
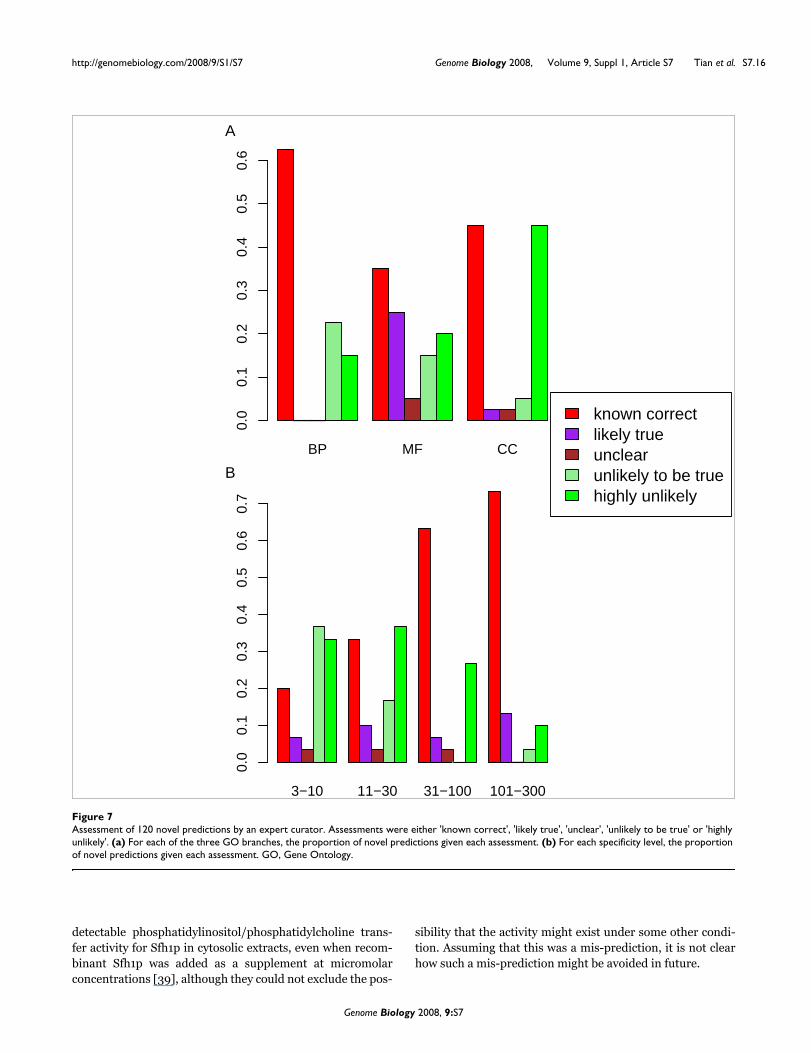
Results of the assessment, summarized in Figure 7a, show theproportion of novel predictions that are known correct in dif-ferent GO branches. The fractions of top-scoring predictionsthat are supported were comparable in each of the threebranches - 63%, 60% and 48% for BP, MF and CC GO terms,respectively. The fractions of top-scoring predictions that areknown correct were 63%, 35% and 45% for BP, MF and CCattributes, respectively. We note that the top-scoring novelBP predictions were confirmed more frequently than MF andCC predictions (the reverse of performance order observed incross-validation assessment).
The number of 'known correct' predictions is a conservativeestimate of the actual number of correct predictions, sincesupporting evidence may not be available in the literature.Therefore, the number of predictions that are actually correctis estimated to be between the number of predictions labeled'A' and the number labeled either 'A', 'B', or 'C'. Thus, our esti-mates for the true rates of success among top novel predic-tions were 63%, 35% to 65%, and 45% to 50% for BP, MF andCC GO terms, respectively.
We also examined the success rate of novel predictions as afunction of the specificity of the GO terms predicted (Figure7b). The success rates were 33% to 43% and 20% to 27% forGO terms with specificity 11 to 30 and 3 to 10, respectively. Asone might expect, Funckenstein's precision for novel predic-tions rose substantially for more general GO terms: 73% to
Genome Biology 2008, 9:S7
http://genomebiology.com/2008/9/S1/S7 Genome Biology 2008, Volume 9, Suppl 1, Article S7 Tian et al. S7.9
86% and 63% to 71% for GO terms with specificity 101 to 300and 31 to 100, respectively.
Top novel predictions and their evaluations are listed in Addi-tional data file 1. Only 2 out of these 120 predictions weremade for 'uncharacterized' genes, and none were made fordubious genes. Among these 120 predictions, 103 are refine-ments of original annotations, that is, the target gene hasalready been annotated with an ancestor GO term of the pre-dicted GO. For example, the correct novel prediction of 'DNAbending activity' (GO:0008301) for ARG80 was a refinement,in that ARG80 was previously annotated with 'DNA binding'(GO:0003677), the direct parent term of 'DNA bending activ-ity'. The remaining 17 predictions in Additional data file 1have no annotated ancestor GO terms assigned to the targetgene except the root GO term, and are, therefore, particularlyinteresting novel predictions. For example, BPT1 was cor-rectly predicted to have 'ATPase activity, coupled to trans-membrane movement of substances' (GO:0042626), and hadnot previously been annotated with any ancestor of this GOterm. Interestingly, out of these 17 particularly interestingnovel predictions, 13 were ranked by a SGD expert as 'knowntrue' or 'likely to be true'.
A resource for browsing predictions and underlying evidenceSo that researchers may browse predictions and gain intui-tion about the evidence underlying specific predictions, wedeveloped an online resource allowing browsing by GO termor gene. This is publicly available at [33].
DiscussionValidation of a method combining guilt-by-profiling and guilt-by-associationThe Funckenstein method yielded substantial improvementover MRF-NB, a previous method combining guilt-by-profil-ing with guilt-by-association. Indeed, Funckenstein achieveda higher prediction precision across all ranges of recall whenapplied to the same benchmark data (Figure 1b).
Here we generated a more up-to-date collection of integrateddata, and applied Funckenstein to predict more specific func-tional terms from the GO vocabulary. The precision versusrecall performance of these predictions was assessed bycross-validation and (for top novel predictions) by a follow-up analysis of the literature.
The results suggest that these predictions could be very usefulin guiding experimentalists to promising candidate genes.Even the most challenging GO category, highly specific BPterms, yielded a precision of 14% at 50% recall in cross-vali-dation assessment. Importantly, even predictions with 14%(or lower) precision can be extremely useful. To put 14% pre-cision into perspective, if predictions were made at randomfor a GO term with approximately 6 genes left to be identified,we would expect a precision at 50% recall of approximately0.1%. Thus, predictions with 14% precision at 50% recall rep-resent a 140-fold increase in the 'hit rate' compared with ran-dom testing (which is the rate that would be achieved by anexperimentalist using the 'brute force' approach of testing allgenes).
In Funckenstein, both guilt-by-profiling and guilt-by-associa-tion classifiers were based on a decision tree model. Decision-tree based classifiers offer some advantages over other
Table 6
The area under the precision versus recall curve for different classifiers
GO branch GO specificity RF FL1* FL2* FL3* Funckenstein (RF + FL1) Funckenstein (RF + FL2) Funckenstein (RF + FL3)
BP 3 to 10 0.215 0.111 0.173 0.245 0.225 0.286 0.286
11 to 30 0.306 0.197 0.296 0.359 0.331 0.422 0.441
31 to 100 0.349 0.117 0.329 0.33 0.36 0.454 0.441
101 to 300 0.394 0.169 0.373 0.394 0.405 0.492 0.491
MF 3 to 10 0.44 0.188 0.134 0.309 0.445 0.489 0.463
11 to 30 0.557 0.296 0.216 0.383 0.558 0.599 0.565
31 to 100 0.596 0.29 0.232 0.393 0.597 0.632 0.61
101 to 300 0.75 0.55 0.24 0.595 0.753 0.77 0.762
CC 3 to 10 0.368 0.242 0.546 0.571 0.413 0.597 0.596
11 to 30 0.377 0.261 0.441 0.465 0.417 0.523 0.524
31 to 100 0.489 0.249 0.44 0.496 0.508 0.578 0.586
101 to 300 0.524 0.271 0.391 0.468 0.537 0.591 0.595
*FL1, FL classifier based on shared gene characteristics in Table 3; FL2, FL classifier based on direct gene-gene relationships in Table 4; FL3, FL classifier based on both relationship types. Entries in bold are the best Funckenstein classifier; entries in italics are the best individual classifier. BP, biological process; CC, cellular component; FL, functional linkage; GO, Gene Ontology; MF, molecular function; RF, random forest.
Genome Biology 2008, 9:S7
http://genomebiology.com/2008/9/S1/S7 Genome Biology 2008, Volume 9, Suppl 1, Article S7 Tian et al. S7.10
machine learning algorithms. For example, unlike NB [34],decision trees do not assume conditional independencebetween different data types. Decision trees can also provideintuition for the reasoning behind predictions more readilythan support vector machine approaches [35]. In addition,
decision trees have good scaling properties in terms of run-ning time and memory usage, which is an important issuewhen considering thousands of gene characteristics for thou-sands of genes, and multiple biological relationships amongmillions of gene pairs.
Performance of GO term prediction using either the RF guilt-by-profiling (RF; brown) or FL guilt-by-association classifiers (FL)Figure 2Performance of GO term prediction using either the RF guilt-by-profiling (RF; brown) or FL guilt-by-association classifiers (FL). Three types of FL classifiers were compared: FL1 (green), which used only gene characteristics used in the RF classifier that have been recoded as gene pair characteristics; FL2 (red), which used only 'intrinsic' gene-gene relationships; and FL3 (blue), which used both intrinsic and recoded gene-gene characteristics. (a-l) Plots are organized according to GO branch and GO term specificity. FL, functional linkage; GO, Gene Ontology; RF, random forest.
0.0 0.4 0.8
0.0
0.4
0.8
A
0.0 0.4 0.8
0.0
0.4
0.8
B
0.0 0.4 0.8
0.0
0.4
0.8
C
0.0 0.4 0.8
0.0
0.4
0.8
D
0.0 0.4 0.80.
00.
40.
8
E
0.0 0.4 0.8
0.0
0.4
0.8
F
0.0 0.4 0.8
0.0
0.4
0.8
G
0.0 0.4 0.8
0.0
0.4
0.8
H
0.0 0.4 0.8
0.0
0.4
0.8
I
0.0 0.4 0.80.
00.
40.
8
J
0.0 0.4 0.8
0.0
0.4
0.8
K
0.0 0.4 0.8
0.0
0.4
0.8
L
RFFL1FL2FL3
prec
isio
n
recall
3−10
11−30
31−100
101−300
BP MF CC
Genome Biology 2008, 9:S7
http://genomebiology.com/2008/9/S1/S7 Genome Biology 2008, Volume 9, Suppl 1, Article S7 Tian et al. S7.11
Much of the success of Funckenstein can be attributed to theRF classifier in the guilt-by-profiling classification. The RFclassifier is an ensemble of decision trees [27], which hasproven to be superior to regular decision trees in many cases,for example, in predicting protein interactions [36]. As we
can see from Figure 1, if we had used the simpler PDT ratherthan the RF classifier, we would not have gained muchimprovement over MRF-NB. The fact that the guilt-by-asso-ciation classifier was based on a PDT suggests that furtherimprovements could be obtained using the RF method to
Cross-validation results for Funckenstein and the RF guilt-by-profiling component classifier (RF) alone (brown)Figure 3Cross-validation results for Funckenstein and the RF guilt-by-profiling component classifier (RF) alone (brown). Three versions of Funckenstein were compared, each integrating RF with one of three variants of the FL guilt-by-association classifier (FL): FL1, FL using only relationships derived from shared gene characteristics (green); FL2, FL using only direct gene-gene relationships (red); and FL3, FL using all types of relationship (blue). (a-l) Plots are organized according to GO branch and GO term specificity. FL, functional linkage; GO, Gene Ontology; RF, random forest.
0.0 0.4 0.8
0.0
0.4
0.8
A
0.0 0.4 0.8
0.0
0.4
0.8
B
0.0 0.4 0.8
0.0
0.4
0.8
C
0.0 0.4 0.8
0.0
0.4
0.8
D
0.0 0.4 0.80.
00.
40.
8
E
0.0 0.4 0.8
0.0
0.4
0.8
F
0.0 0.4 0.8
0.0
0.4
0.8
G
0.0 0.4 0.8
0.0
0.4
0.8
H
0.0 0.4 0.8
0.0
0.4
0.8
I
0.0 0.4 0.80.
00.
40.
8
J
0.0 0.4 0.8
0.0
0.4
0.8
K
0.0 0.4 0.8
0.0
0.4
0.8
L
RF
Funckenstein (RF + FL1)
Funckenstein (RF + FL2)
Funckenstein (RF + FL3)
prec
isio
n
recall
3−10
11−30
31−100
101−300
BP MF CC
Genome Biology 2008, 9:S7
http://genomebiology.com/2008/9/S1/S7 Genome Biology 2008, Volume 9, Suppl 1, Article S7 Tian et al. S7.12
obtain the functional linkage graph used in guilt-by-associa-tion.
The guilt-by-association classifier was important to Funcken-stein's success, especially in predicting BP and CC attributes.While performance of the guilt-by-association componentclassifier can be improved by transforming gene characteris-tics into gene-gene relationships, this does not necessarilylead to better performance in the follow-up integration byFunckenstein. Indeed, as shown in Figure 3, Funckensteinwith the FL classifier that used only experimentally deter-mined gene-gene relationships achieved better performancethan Funckenstein using the version of FL that performedbest by itself. Thus, to achieve the best overall performance, itmay be important to integrate component classifiers usingcomplementary input features rather than using the inputfeatures that optimize performance of each component clas-sifier alone.
The use of a FL graph significantly improves the performance of guilt-by-association in predicting specific GO functionsIn our benchmark study predicting MIPS functions, the guilt-by-profiling classifier played a more dominant role than guilt-by-association. In predicting GO terms, however, the contri-bution of guilt-by-association was more substantial. Thisimprovement can be attributed both to the increased number
of interactions and inclusion of additional relationship typesin the GO term prediction effort, and to the fact that the GOterms were generally more specific. When the benchmarkdata set for MRF-NB was established, the total number ofrelationships, including gene expression correlation and co-membership within a protein complex, was only 9,976. Bycontrast, our GO predictions used 55,039 interactionsreported by BioGRID [37]. The number of relationship typesalso increases from 4 when predicting MIPS functions to 23when predicting GO terms.
We also found that the relative contribution of guilt-by-asso-ciation in GO term predictions increases as GO terms becomemore specific. This coincides with the decreased performanceof the guilt-by-profiling RF classifier for more specific GOterms, for which fewer positive training examples (that is,genes previously annotated with the GO term) are available.By contrast, guilt-by-association has the potential to be suc-cessful given only a single positive training example gene witha given GO term, since the 'transfer rules' are learned from themany GO terms within each GO category.
The guilt-by-association classifier performs well for both CCand BP GO terms, and even outperforms the RF classifiers insome of the CC and BP subcategories; however, its perform-ance is much poorer in the MF categories than that of the RFclassifier. This may be explained by the fact that CC and BPGO terms more often have corresponding relationships withother genes in the genome, while the MF GO terms focus ondescribing the catalytic activity or structural role of an indi-vidual protein.
Assessing the value of different evidence types in predicting functionThe RF classifier is not only useful in prediction, but can alsobe used to assess the value of particular variables in inferringa given function [27] (see Materials and methods). By rankinggene characteristics according to their importance score, wegain intuition about the gene characteristics that were mostuseful for inferring a particular function.
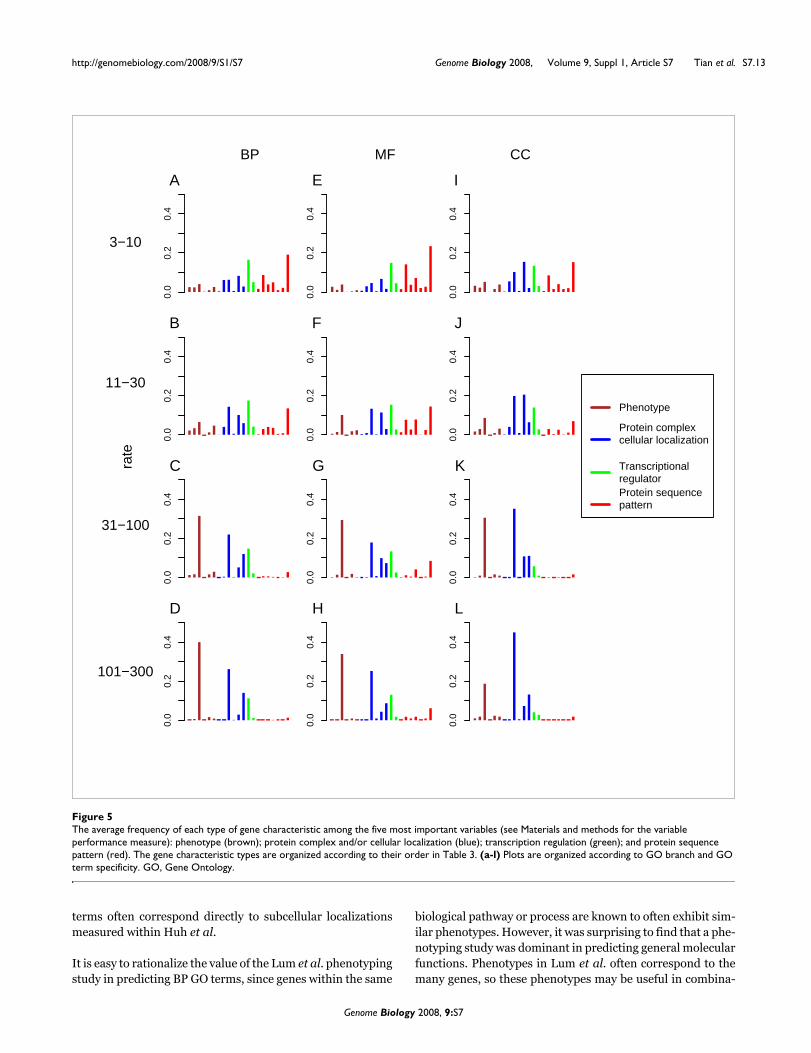
For each GO term, we identified the five variables that weremost useful in the corresponding RF classifier (see Materialsand methods for details). Within each of the 12 GO categories,we then calculated the frequency with which each gene char-acteristic type was observed among the set of most useful var-iables (Figure 5). For GO terms assigned to 31 or more genes,we find the protein subcellular localization study by Huh andcoworkers [21] and a phenotyping study by Lum and col-leagues [19] to be the most useful sources of gene characteris-tics. In addition, the Huh et al. study was the most useful typeof gene characteristic in predicting CC GO terms, while theLum et al. study was the most useful gene characteristic typein prediction of BP and MF GO terms. It is intuitively reason-able that the Huh et al. study of subcellular localizationshould be useful in predicting CC GO terms, since CC GO
Prediction scores for 'verified', 'uncharacterized', and 'dubious' genesFigure 4Prediction scores for 'verified', 'uncharacterized', and 'dubious' genes. For 'verified' (red) or 'uncharacterized' (blue) genes, the log ratio of the number of predictions within each score interval (relative to the number for 'dubious' genes) is shown.
0.2 0.4 0.6 0.8
0.0
0.5
1.0
1.5
2.0
2.5
3.0
Projected Precision
LOG
10 R
atio
Verified vs DubiousUncharacterized vs Dubious
Genome Biology 2008, 9:S7
http://genomebiology.com/2008/9/S1/S7 Genome Biology 2008, Volume 9, Suppl 1, Article S7 Tian et al. S7.13
terms often correspond directly to subcellular localizationsmeasured within Huh et al.
It is easy to rationalize the value of the Lum et al. phenotypingstudy in predicting BP GO terms, since genes within the same
biological pathway or process are known to often exhibit sim-ilar phenotypes. However, it was surprising to find that a phe-notyping study was dominant in predicting general molecularfunctions. Phenotypes in Lum et al. often correspond to themany genes, so these phenotypes may be useful in combina-
The average frequency of each type of gene characteristic among the five most important variables (see Materials and methods for the variable performance measure): phenotype (brown); protein complex and/or cellular localization (blue); transcription regulation (green); and protein sequence pattern (red)Figure 5The average frequency of each type of gene characteristic among the five most important variables (see Materials and methods for the variable performance measure): phenotype (brown); protein complex and/or cellular localization (blue); transcription regulation (green); and protein sequence pattern (red). The gene characteristic types are organized according to their order in Table 3. (a-l) Plots are organized according to GO branch and GO term specificity. GO, Gene Ontology.
0.0
0.2
0.4
A0.
00.
20.
4
B
0.0
0.2
0.4
C
0.0
0.2
0.4
D
0.0
0.2
0.4
E
0.0
0.2
0.4
F0.
00.
20.
4
G
0.0
0.2
0.4
H
0.0
0.2
0.4
I
0.0
0.2
0.4
J
0.0
0.2
0.4
K0.
00.
20.
4
L
Phenotype
Protein complex cellular localization
Transcriptional regulatorProtein sequence pattern
rate
3−10
11−30
31−100
101−300
BP MF CC
Genome Biology 2008, 9:S7
http://genomebiology.com/2008/9/S1/S7 Genome Biology 2008, Volume 9, Suppl 1, Article S7 Tian et al. S7.14
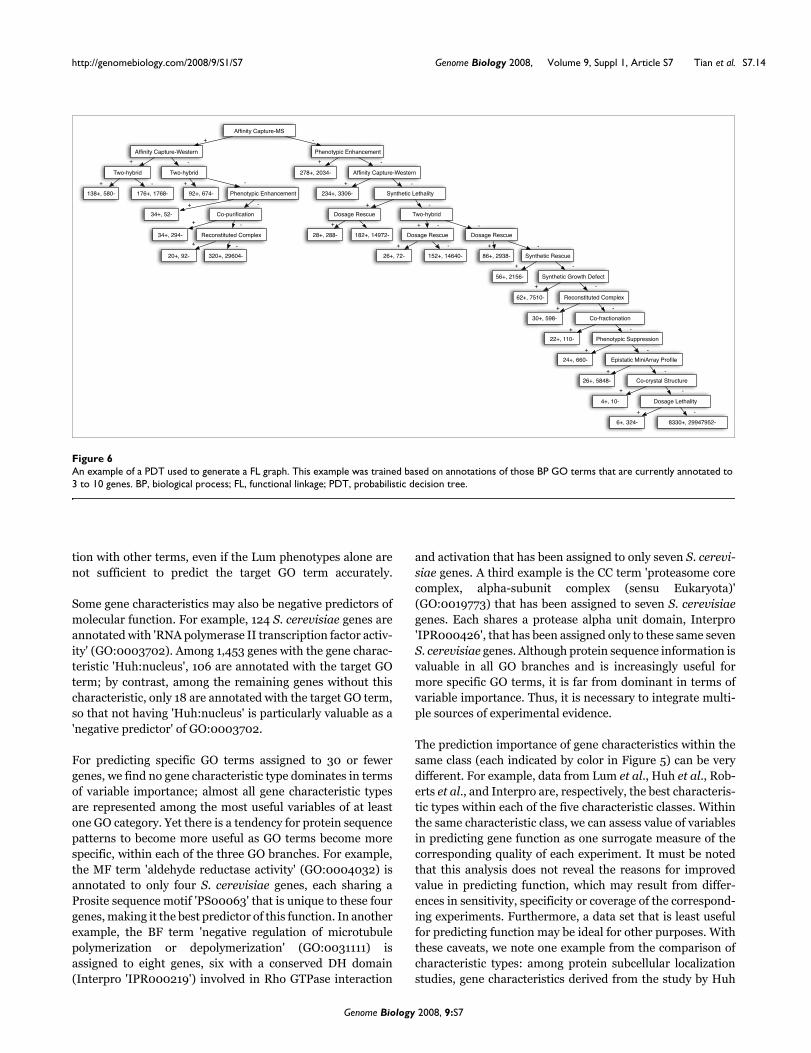
An example of a PDT used to generate a FL graphFigure 6An example of a PDT used to generate a FL graph. This example was trained based on annotations of those BP GO terms that are currently annotated to 3 to 10 genes. BP, biological process; FL, functional linkage; PDT, probabilistic decision tree.
����������� ����
����������� ������� � ���������������������
������� �� ������� �� �� !"��#$%� ����������� ������� �
&$ !"�' #� &�(!"�&�( � )�!"�(�%� ��������������������� �$%!"�$$#(� ����������*���+���
$%!"�'�� ���� ������� ,��-��.����� ������� ��
$%!"��)%� .����������������+�/ � !"�� � & �!"�&%)��� ,��-��.����� ,��-��.�����
�#!"�)�� $�#!"��)(#%� �(!"����� &'�!"�&%(%#� (!"��)$ � ����������.�����
'(!"��&'(� ����������0 �����,�����
(�!"��'&#� .����������������+�/
$#!"�') � ��� ���������
��!"�&&#� ��������������� ������
�%!"�((#� �������������� ��� ��+�
�(!"�' % � ��� ���+��� ���� �
%!"�&#� ,��-��*���+���
(!"�$�%� $$#!"��))%�)'��
! �
!
! !
!
!
!
!
!
!
!
!
!
!
!
!
!
!
!
!
!
! �
�
�
�
�
�
�
�
�
�
�
�
�
�
�
�
�
�
�
�
�
tion with other terms, even if the Lum phenotypes alone arenot sufficient to predict the target GO term accurately.
Some gene characteristics may also be negative predictors ofmolecular function. For example, 124 S. cerevisiae genes areannotated with 'RNA polymerase II transcription factor activ-ity' (GO:0003702). Among 1,453 genes with the gene charac-teristic 'Huh:nucleus', 106 are annotated with the target GOterm; by contrast, among the remaining genes without thischaracteristic, only 18 are annotated with the target GO term,so that not having 'Huh:nucleus' is particularly valuable as a'negative predictor' of GO:0003702.
For predicting specific GO terms assigned to 30 or fewergenes, we find no gene characteristic type dominates in termsof variable importance; almost all gene characteristic typesare represented among the most useful variables of at leastone GO category. Yet there is a tendency for protein sequencepatterns to become more useful as GO terms become morespecific, within each of the three GO branches. For example,the MF term 'aldehyde reductase activity' (GO:0004032) isannotated to only four S. cerevisiae genes, each sharing aProsite sequence motif 'PS00063' that is unique to these fourgenes, making it the best predictor of this function. In anotherexample, the BF term 'negative regulation of microtubulepolymerization or depolymerization' (GO:0031111) isassigned to eight genes, six with a conserved DH domain(Interpro 'IPR000219') involved in Rho GTPase interaction
and activation that has been assigned to only seven S. cerevi-siae genes. A third example is the CC term 'proteasome corecomplex, alpha-subunit complex (sensu Eukaryota)'(GO:0019773) that has been assigned to seven S. cerevisiaegenes. Each shares a protease alpha unit domain, Interpro'IPR000426', that has been assigned only to these same sevenS. cerevisiae genes. Although protein sequence information isvaluable in all GO branches and is increasingly useful formore specific GO terms, it is far from dominant in terms ofvariable importance. Thus, it is necessary to integrate multi-ple sources of experimental evidence.
The prediction importance of gene characteristics within thesame class (each indicated by color in Figure 5) can be verydifferent. For example, data from Lum et al., Huh et al., Rob-erts et al., and Interpro are, respectively, the best characteris-tic types within each of the five characteristic classes. Withinthe same characteristic class, we can assess value of variablesin predicting gene function as one surrogate measure of thecorresponding quality of each experiment. It must be notedthat this analysis does not reveal the reasons for improvedvalue in predicting function, which may result from differ-ences in sensitivity, specificity or coverage of the correspond-ing experiments. Furthermore, a data set that is least usefulfor predicting function may be ideal for other purposes. Withthese caveats, we note one example from the comparison ofcharacteristic types: among protein subcellular localizationstudies, gene characteristics derived from the study by Huh
Genome Biology 2008, 9:S7
http://genomebiology.com/2008/9/S1/S7 Genome Biology 2008, Volume 9, Suppl 1, Article S7 Tian et al. S7.15
and coworkers study were substantially more useful thanthose of Kumar and colleagues [38] in all 12 GO categories(Figure 5).
It is less clear how one should establish the importance of par-ticular variables in generating the FL graph used in guilt-by-association. However, we can still obtain some intuition byexamining the PDT classifier used to generate the FL graph.For example, in the PDT classifier developed for the most spe-cific BP GO category, we can see (Figure 6) that a protein pairwith 'Affinity capture-MS', 'Affinity capture-western', and'two-hybrid' evidence is more likely to share a specific BPfunction than another pair with 'Affinity capture-MS' andonly one of 'Affinity capture-western' or 'two-hybrid' evi-dence. The corresponding number of functionally linked ('+')and non-functionally linked ('-') gene pairs within the train-ing set were (138+, 580-) for pairs with all three supportingevidence types. The decision tree structure is slightly differentin different GO categories, with more general GO categorieshaving more complex structures. However, the 'Affinity cap-ture-MS' tends to be a top choice within decision trees used togenerate the FL graph.
Directions for further improvementNovel predictions made by Funckenstein were sufficientlyaccurate to be useful in guiding experimental researchaccording to current literature. However, we would like tounderstand why some top Funckenstein predictions wereranked as 'highly unlikely' by the SGD expert. Because highlyspecific terms are expected to be most useful to experimental-ists, we focused on predictions for the most specific GO cate-gories (assigned to 3 to 10 genes). Among the 30 such novelpredictions of the most specific GO categories, 10 were con-sidered 'highly unlikely' in light of current literature. Theseten fell within each of the GO branches (three, five, and twopredictions corresponding to MF, CC, and BP branches,respectively; see Additional data file 1). According to the con-tribution of the RF and guilt-by-association classifier to thefinal prediction scores of these ten predictions, we can dividethem into two classes: predictions with low RF but high guilt-
by-association scores (corresponding to the genes VPH1,SUI2, SPT7, and TIF5); and predictions with high RF but lowguilt-by-association scores (corresponding to the genes SFH1,MSH3, TPS2, LSM1, MSH6, and MLH2). Predictions in theformer class all corresponded to CC GO terms. In each ofthese four cases, genes were known to encode members of aprotein complex, and membership in a different subunit ofthe same complex was predicted (Additional data file 1). Forexample, VPH1 was predicted to have function 'hydrogen-transporting ATPase V1 domain' (GO:0000221), whileaccording to SGD it is a 'subunit of vacuolar-ATPase V0domain' (a different subunit of the same complex). Thus, it isno surprise that VPH1 was found in multiple high-throughputexperiments to interact with all eight S. cerevisiae genes inthe V1 subunit, leading to a high guilt-by-association scoreand a mistaken prediction. This mistake might have beenavoided, given the knowledge that VPH1 is annotated to theATPase V0 domain. However, we had avoided using GOterms to predict other GO terms, to avoid complications aris-ing from strong dependencies between GO terms [23]. Thisexample suggests, however, that we might gain by using GOterms that are strongly anti-correlated with the target GOterm as a predictor.
We also examined six top-scoring predictions with high RFbut low guilt-by-association scores. All six can be attributed toconserved protein domains. For example, SFH1 was pre-dicted to have 'phosphatidylinositol transporter activity'(GO:0008526), while SGD annotation describes SFH1 as a'putative homolog of Sec14p, which is a phosphatidylinositol/phosphatidylcholine transfer protein involved in lipid metab-olism'. All five S. cerevisiae genes currently annotated with'phosphatidylinositol transporter activity' share the Pfam pat-terns 'PF00650 (CRAL/TRIO domain)' and 'PF03765(CRAL/TRIO N-term domain)', as well as the Prosite pattern'PS50191 (CRAL-TRIO lipid binding domain profile)'.Because SFH1 is the only S. cerevisiae gene other than thesefive genes to have these domains and sequence patterns,Funckenstein assigned the target function with very high con-fidence. However, a previous study was unable to record any
Table 7
Categories for expert classification of novel predictions
Category Brief description
A Known true There is experimental evidence for this annotation, but it is not yet captured by SGD (all supporting literature pre-dates the analysis)
B Likely true No experimental evidence exists in the literature, but there is author speculation or sequence similarity support for this annotation
C Unclear Experimental evidence is either unavailable or conflicting.
D Unlikely The gene product is known to have a related but different function/process and no experimental support was found for the prediction
E Highly unlikely Direct experimental evidence against this association, or all other experimental evidence supports an unrelated function/process, or the gene product is part of a well-characterized complex and the predicted component term was to a different well-characterized complex
SGD, Saccharomyces Genome Database.
Genome Biology 2008, 9:S7
http://genomebiology.com/2008/9/S1/S7 Genome Biology 2008, Volume 9, Suppl 1, Article S7 Tian et al. S7.16
detectable phosphatidylinositol/phosphatidylcholine trans-fer activity for Sfh1p in cytosolic extracts, even when recom-binant Sfh1p was added as a supplement at micromolarconcentrations [39], although they could not exclude the pos-
sibility that the activity might exist under some other condi-tion. Assuming that this was a mis-prediction, it is not clearhow such a mis-prediction might be avoided in future.
Assessment of 120 novel predictions by an expert curatorFigure 7Assessment of 120 novel predictions by an expert curator. Assessments were either 'known correct', 'likely true', 'unclear', 'unlikely to be true' or 'highly unlikely'. (a) For each of the three GO branches, the proportion of novel predictions given each assessment. (b) For each specificity level, the proportion of novel predictions given each assessment. GO, Gene Ontology.
BP MF CC
0.0
0.1
0.2
0.3
0.4
0.5
0.6
A
3−10 11−30 31−100 101−300
0.0
0.1
0.2
0.3
0.4
0.5
0.6
0.7
B
known correctlikely trueunclearunlikely to be truehighly unlikely
Genome Biology 2008, 9:S7
http://genomebiology.com/2008/9/S1/S7 Genome Biology 2008, Volume 9, Suppl 1, Article S7 Tian et al. S7.17
ConclusionWe have developed a combined algorithm named 'Funcken-stein' that combines both gene characteristics and gene-generelationships to predict functions. Funckenstein shows sub-stantial improvement over a promising previous method inpredicting MIPS functions of S. cerevisiae genes. We havetherefore applied Funckenstein to systematically predict2,455 more specific GO terms for S. cerevisiae genes. Incross-validation Funckenstein achieves high precision withinall three GO branches, even for the most specific GO terms.Funckenstein has generated a large number of novel predic-tions that can be readily explored by experimentalists. Theassessment of the top 120 novel predictions by an SGD expertsuggests that the resulting novel predictions have the poten-tial to be extremely useful to experimentalists.
Materials and methodsPrediction methodsThe probabilistic decision tree classifierThe PDT is a simple and effective tool for modeling the prob-ability of one variable describing an object conditioned onother known characteristics of that object [40]. The decisiontree is a graph describing the recursive division of a set ofobjects into successively smaller partitions. For a detaileddescription, see [28,40]. In short, all objects in the trainingset are initially assigned to the root node. Objects are recur-sively split into smaller partitions on the basis of the value ofa particular predictive variable. The predictive variable usedto split objects at each node was chosen based on the Giniimpurity measure [28], a measure of uniformity of objectswith respect to a given variable of interest. To avoid overfit-ting, we implemented an 'early stopping' criterion to decidewhether the next proposed split provides sufficient informa-tion to justify the accompanying increase in model complex-ity. For the predictive variable offering the largest reductionin Gini impurity, we compute the corresponding hypergeo-metric distribution probability:
where N is the total number of genes in the parent node, andNT and NF are the total number of genes in the parent nodeannotated with and without the target GO term, respectively,while NTL and NFL, NTR and NFR are the corresponding num-bers at the left and right daughter node given the split, respec-tively. We reject the split and determine the node to be a 'leafnode' if the hypergeometric distribution probability P > α(with α = 0.01 except where otherwise specified). We com-pute the probability of a given gene i to be annotated with thetarget GO term j as:
where NT and NF are as defined above, PT is the overall frac-tion of genes annotated with the target GO term and Ψ is thenumber of pseudocounts used to correct for small samplesizes (Ψ = 1 for all results described).
Random forest classifierWhereas the PDT classifier produces only one tree as a pre-dictive model for a given GO term, a RF classifier is composedof an ensemble of many decision trees. Each decision tree inthe 'forest' differs from the PDT in that: training genes at theroot node are selected by bootstrap resampling (samplingwith replacement) from the full training set; at every node,only a fraction of available object characteristics are assessedas candidates for splitting the next node; and there is noearly-stopping criterion (since the process of averaging overdiverse trees is an intrinsic safeguard against overfitting[27]). The score for a given candidate gene and GO term isthen the fraction of trees trained on that GO term that classifythat gene as positive. More details on the RF classifier can befound in [27].
Because the extremely large number of predictive variablesavailable in our data set (8.848 for the GO term predictionstudy) impacts the memory and time efficiency of the RFmethod, we introduced modifications to the RF method. Weperformed feature selection to eliminate variables that weremarginally uninformative. For feature selection we examinedthe set of unique genes at the root node and computed thehypergeometric distribution probability P (as defined in thePDT description above), retaining only those characteristicswith P < α. Because of the bootstrap resampling in selectingtraining genes, the selected features may vary between trees.We also imposed the same early stopping criterion andmethod for calculating a probability score at each leaf nodethat were described for PDTs above. The final RF score for agiven gene and GO term was then the average of the probabil-ity scores at leaf nodes corresponding to that gene across alltrees in the forest trained on that GO term.
There are three free parameters of the RF classifier: thenumber of random variables at each split, the threshold forfeature selection, and the threshold for early stopping. Opti-mization of these parameters is described below in the 'Train-ing and cross-validation' section.
We also estimated the importance of each variable in predict-ing each given GO term. Variable importance was computedusing Gini impurity (also used above in the context of PDTs).Specifically, importance of a given variable is the sum of thereduction in Gini impurity over all appearances of that varia-ble over all decision trees in the forest [27].
Guilt-by-association classifierGuilt-by-association was performed using a FL graph, inwhich each edge in the graph is assigned a weight related tothe probability that two genes share a common GO term
PNT N F N L N R
N NTL NTR N FL N FR= ⋅ ⋅ ⋅
⋅ ⋅ ⋅ ⋅! ! ! !
! ! ! ! !
P i jNT PT
NT N F( , ) = + ⋅
+ +ΨΨ
Genome Biology 2008, 9:S7
http://genomebiology.com/2008/9/S1/S7 Genome Biology 2008, Volume 9, Suppl 1, Article S7 Tian et al. S7.18
whose specificity (number of genes) is within the specificityrange of a given GO category [29]. The FL graph is then usedto assign scores to particular gene and GO term combina-tions. We produced a separate FL graph for each of 12 GO cat-egories, corresponding to each combination of three GObranches (BP, MF, and CC) and four specificity levels (3 to 10,11 to 30, 31 to 100, and 101 to 300). We used the PDT methodto produce each FL graph. Unlike PDTs predicting specificGO terms where the objects under study are genes, here theobjects of interest are gene pairs. The variable to be predictedfor each gene pair is the answer to the question 'are these twoproteins functionally linked, that is, do they share any one ofthe specific GO terms in a specified GO category?' Theattributes used for this classifier are gene-gene relationships,such as protein or genetic interactions. To limit over-fitting,we used the same PDT early-stopping criterion described inthe context of function prediction, with threshold 10-8. Thus,for each GO category, each pair of S. cerevisiae genes isassigned a FL 'weight' reflecting the probability that the genepair shares a specific GO term in that category. To score theannotation of a particular candidate gene with a particularGO term, we retrieve FL weight scores for all pairings of thecandidate gene with genes known to have the GO term andaverage the top three FL scores.
Combining guilt-by-profiling and guilt-by-association scoresGuilt-by-profiling and guilt-by-association classifier scoresare combined by a simple logistic regression model with onefree parameter. For a given gene i and a target function j, letthe probability score computed by the guilt-by-profiling andguilt-by-association classifiers be PGBP(i, j) and PGBA(i, j),respectively, then the corresponding combined score P(i, j) isdefined as:
where w is optimized over the range from 0 to 1 based on areaunder the precision versus recall curve obtained in cross-val-idation.
Training and cross-validationFor both PDT and RF classifiers, we performed ten-foldcross-validation to obtain a probability score for each geneand used these scores to assess performance. For the RF clas-sifier, we obtained an 'out-of-bag' score for every gene. Eachtree in the forest uses only approximately 66% of genes intraining. Therefore, for each gene we identified the approxi-mately 33% of trees that did not use that gene in training andaveraged the scores for that gene to obtain its 'out-of-bag'score.
We optimized the free parameters of the RF classifier accord-ing to the performance of 'out-of-bag' scores. To evaluate per-formance of a set of scores, we obtain at multiple scorethresholds the number of true positive (TP), false positive
(FP), true negative (TN), and false negative (FN) genes at thegiven threshold. TP (FP) is defined as the number of proteinswith a score greater than the threshold, which are (are not)currently annotated with target function. FN (TN) is definedas the number of proteins with a score below the thresholdthat are (are not) currently annotated with the target func-tion. Thus, we can compute 'precision':
'recall' or 'true positive rate':
and 'false positive rate':
Thus, to assess the performance of a given set of scores, wecan plot Pprecision versus Precall, or Ptrue versus Pfalse (the latteris often called a ROC curve). Although the ROC curve iswidely used in evaluating the performance of a classifier, it isnot the best measure for this application. Because annota-tions are sparse, only very low false positive rates correspondto predictions with a level of precision that is likely to be use-ful. Therefore, we used the area under the precision-recallcurve to optimize the three free parameters of the RF classi-fier and the single free parameter of the logistic regressionprocedure used to combine guilt-by-profiling and guilt-by-association scores. We also used the precision-recall curve tocompute the 'projected precision' corresponding to a givenprediction score. First, we computed its corresponding recall.Then, we identified the maximal precision at or greater thanthe recall in the precision-recall curve, and used that preci-sion as the 'projected precision' corresponding to a given pre-diction score.
Predictions of MIPS functions using a previously defined benchmark data setData sourcesFor comparison with the earlier MRF-NB method, we usedthe benchmark data set to which it was previously applied.This used the MIPS catalog of functional categories ('FunCat')[41]. Although this catalog currently includes 28 top-levelfunctional categories that describe general functions, we usedthe 13 functional classes derived previously from MIPS [26](see Table 1 for detailed description). We also predicted onlyfor the 3,588 S. cerevisiae genes annotated with at least oneof the 13 function classes, as was done previously. We usedthe same information used in training the MRF-NB model,including Pfam domain and tandem affinity purification(TAP) complexes [5], protein and genetic interactions derivedfrom MIPS, and gene expression correlation. We downloaded
log log log(( , )( , )
) (( , )( , )
) ( ) (P i j
P i jw
PGBP i jPGBP i j
w1 1
1−
= ⋅−
+ − ⋅ PPGBA i jPGBA i j
( , )( , )
)1−
PTP
TP FPprecision =+
P PTP
TP FNrecall true= =+
PFP
FP TNfalse =+
Genome Biology 2008, 9:S7
http://genomebiology.com/2008/9/S1/S7 Genome Biology 2008, Volume 9, Suppl 1, Article S7 Tian et al. S7.19
this information from the website corresponding to the previ-ous MRF-NB publication without any post-processing [42].
We trained PDT and RF guilt-by-profiling classifiers usinggene characteristics, that is, protein domain and complexinformation. The FL graph for the guilt-by-association classi-fier was trained using protein and genetic interactions fromMIPS, gene expression correlation, and TAP complex interac-tion based on the 'spoke' model [32].
GO function predictionSources of dataWe downloaded associations of GO terms with S. cerevisiaegenes from SGD [43] in December 2006. We also down-loaded the GO directed acyclic graph structure from the GOdatabase (November 30, 2006 release) and used it to 'propa-gate' associations so association to a particular GO term waspropagated to all ancestral GO terms. We identified 2,530 GOterms that are associated with at least three S. cerevisiaegenes according to the propagated annotation. We defined ameasure of functional specificity for each GO term by count-ing the number of genes currently associated with that GOterm. Then, following the same strategy that was used in arecent critical assessment of Mus musculus gene functions(unpublished data), we divided these GO terms into 12 sub-categories according to GO branches and GO specificities (3to 10, 11 to 30, 31 to 100, and 101 to 300 genes). The totalnumber of GO terms in these 12 categories was 2,455. Theparameters of the RF classifier and Funckenstein weretrained independently for each of the 12 GO subsets.
For guilt-by-profiling predictions, we collected a largenumber of gene attributes derived both from sequence analy-sis and high-throughput experimental data (see Table 3 fordetails). For guilt-by-association predictions, we downloadedexperimentally determined interaction types from the BioG-RID database [37]. This database defines 23 protein andgenetic interaction types, for example, yeast two-hybrid pro-tein interaction and synthetic lethal genetic interaction (seeTable 4 for details), corresponding to a total of 55,039 uniquegene pairs with some relationship. We also computed sharedannotation relationships for all gene characteristics in Table3. Within a given class of gene characteristics, a gene pair wasconsidered to have shared annotation if the number of sharedcharacteristics was more than 90% of the number of uniquecharacteristics held by either protein.
AbbreviationsAUC, area under the ROC curve; BP, biological process; CC,cellular component; FL, functional linkage; GO, Gene Ontol-ogy; MF, molecular function; MIPS, Munich InformationCenter for Protein Sequences; MRF, Markov random field;NB, naïve Bayes; PDT, probabilistic decision tree; ROC,Receiver operating characteristic; RF, random forest; SGD,Saccharomyces Genome Database.
Competing interestsThe authors declare that they have no competing interests.
Authors' contributionsWT, LVZ, MT, and FPR conceived the study. WT, MT, LVZ,ODK, and FR developed the methodology for prediction andevaluation. WT, LVZ, and ZW assembled the data. WT per-formed the analysis. MT and LVZ carried out early variationsof the analysis. WT and FDG constructed the website. JP per-formed analysis of novel predictions with guidance fromJMC. WT and FR drafted the manuscript. All authors readand approved the final manuscript.
Additional data filesThe following additional data are available with the onlineversion of this paper. Additional data file 1 is a table listing theresults of expert evaluation of GO predictions by Funcken-stein.Additional data file 1Expert evaluation of GO predictions by FunckensteinExpert evaluation of GO predictions by Funckenstein.Click here for file
AcknowledgementsWe thank the West Quad Computing Group at Harvard Medical Schoolfor computational resources and support. Computational resources werealso provided by the National Science Foundation through the TeraGridprogram. This work was supported by US National Institutes of Health(NIH) grants HG003224 (FR), HG0017115 (FR), DK071507 (WT), F32HG004098 (MT), F32 HG02552 (ODK), HG001315 (JP and JMC), and theKeck Foundation (FR). ZW is a Howard Hughes Medical Institute Predoc-toral Fellow.
This article has been published as part of Genome Biology Volume 9 Supple-ment 1, 2008: Quantitative inference of gene function from diverse large-scale datasets. The full contents of the supplement are available online athttp://genomebiology.com/supplements/9/S1
References1. Spellman PT, Sherlock G, Zhang MQ, Iyer VR, Anders K, Eisen MB,
Brown PO, Botstein D, Futcher B: Comprehensive identificationof cell cycle-regulated genes of the yeast Saccharomyces cer-evisiae by microarray hybridization. Mol Biol Cell 1998,9:3273-3297.
2. Shalon D, Smith SJ, Brown PO: A DNA microarray system foranalyzing complex DNA samples using two-color fluores-cent probe hybridization. Genome Res 1996, 6:639-645.
3. Uetz P, Giot L, Cagney G, Mansfield TA, Judson RS, Knight JR, Lock-shon D, Narayan V, Srinivasan M, Pochart P, Qureshi-Emili A, Li Y,Godwin B, Conover D, Kalbfleisch T, Vijayadamodar G, Yang M, John-ston M, Fields S, Rothberg JM: A comprehensive analysis of pro-tein-protein interactions in Saccharomyces cerevisiae. Nature2000, 403:623-627.
4. Ito T, Chiba T, Ozawa R, Yoshida M, Hattori M, Sakaki Y: A compre-hensive two-hybrid analysis to explore the yeast proteininteractome. Proc Natl Acad Sci USA 2001, 98:4569-4574.
5. Gavin AC, Bösche M, Krause R, Grandi P, Marzioch M, Bauer A,Schultz J, Rick JM, Michon AM, Cruciat CM, Remor M, Höfert C,Schelder M, Brajenovic M, Ruffner H, Merino A, Klein K, Hudak M,Dickson D, Rudi T, Gnau V, Bauch A, Bastuck S, Huhse B, LeutweinC, Heurtier MA, Copley RR, Edelmann A, Querfurth E, Rybin V, et al.:Functional organization of the yeast proteome by system-atic analysis of protein complexes. Nature 2002, 415:141-147.
6. Ho Y, Gruhler A, Heilbut A, Bader GD, Moore L, Adams SL, Millar A,Taylor P, Bennett K, Boutilier K, Yang L, Wolting C, Donaldson I,Schandorff S, Shewnarane J, Vo M, Taggart J, Goudreault M, Muskat B,Alfarano C, Dewar D, Lin Z, Michalickova K, Willems AR, Sassi H,
Genome Biology 2008, 9:S7
http://genomebiology.com/2008/9/S1/S7 Genome Biology 2008, Volume 9, Suppl 1, Article S7 Tian et al. S7.20
Nielsen PA, Rasmussen KJ, Andersen JR, Johansen LE, Hansen LH, etal.: Systematic identification of protein complexes in Saccha-romyces cerevisiae by mass spectrometry. Nature 2002,415:180-183.
7. Tian W, Skolnick J: How well is enzyme function conserved asa function of pairwise sequence identity? J Mol Biol 2003,333:863-882.
8. Finn RD, Mistry J, Schuster-Böckler B, Griffiths-Jones S, Hollich V,Lassmann T, Moxon S, Marshall M, Khanna A, Durbin R, Eddy SR, Son-nhammer EL, Bateman A: Pfam: clans, web tools and services.Nucleic Acids Res 2006:D247-D251.
9. Mulder NJ, Apweiler R, Attwood TK, Bairoch A, Bateman A, Binns D,Bradley P, Bork P, Bucher P, Cerutti L, Copley R, Courcelle E, Das U,Durbin R, Fleischmann W, Gough J, Haft D, Harte N, Hulo N, KahnD, Kanapin A, Krestyaninova M, Lonsdale D, Lopez R, Letunic I, Mad-era M, Maslen J, McDowall J, Mitchell A, Nikolskaya AN, et al.: Inter-Pro, progress and status in 2005. Nucleic Acids Res2005:D201-D205.
10. Attwood TK: The PRINTS database: a resource for identifica-tion of protein families. Brief Bioinform 2002, 3:252-263.
11. Hulo N, Bairoch A, Bulliard V, Cerutti L, De Castro E, Langendijk-Genevaux PS, Pagni M, Sigrist CJ: The PROSITE database. NucleicAcids Res 2006:D227-D230.
12. Schwikowski B, Uetz P, Fields S: A network of protein-proteininteractions in yeast. Nat Biotechnol 2000, 18:1257-1261.
13. Ye P, Peyser BD, Pan X, Boeke JD, Spencer FA, Bader JS: Gene func-tion prediction from congruent synthetic lethal interactionsin yeast. Mol Syst Biol 2005, 1:2005.0026.
14. Wu LF, Hughes TR, Davierwala AP, Robinson MD, Stoughton R, Alt-schuler SJ: Large-scale prediction of Saccharomyces cerevisiaegene function using overlapping transcriptional clusters. NatGenet 2002, 31:255-265.
15. Date SV, Marcotte EM: Discovery of uncharacterized cellularsystems by genome-wide analysis of functional linkages. NatBiotechnol 2003, 21:1055-1062.
16. Hishigaki H, Nakai K, Ono T, Tanigami A, Takagi T: Assessment ofprediction accuracy of protein function from protein-proteininteraction data. Yeast 2001, 18:523-531.
17. Vazquez A, Flammini A, Maritan A, Vespignani A: Global proteinfunction prediction from protein-protein interaction net-works. Nat Biotechnol 2003, 21:697-700.
18. Deng M, Tu Z, Sun F, Chen T: Mapping Gene Ontology to pro-teins based on protein-protein interaction data. Bioinformatics2004, 20:895-902.
19. Lum PY, Armour CD, Stepaniants SB, Cavet G, Wolf MK, Butler JS,Hinshaw JC, Garnier P, Prestwich GD, Leonardson A, Garrett-EngeleP, Rush CM, Bard M, Schimmack G, Phillips JW, Roberts CJ, Shoe-maker DD: Discovering modes of action for therapeutic com-pounds using a genome-wide screen of yeast heterozygotes.Cell 2004, 116:121-137.
20. Clare A, King RD: Machine learning of functional class fromphenotype data. Bioinformatics 2002, 18:160-166.
21. Huh WK, Falvo JV, Gerke LC, Carroll AS, Howson RW, WeissmanJS, O'Shea EK: Global analysis of protein localization in bud-ding yeast. Nature 2003, 425:686-691.
22. von Mering C, Huynen M, Jaeggi D, Schmidt S, Bork P, Snel B:STRING: a database of predicted functional associationsbetween proteins. Nucleic Acids Res 2003, 31:258-261.
23. King OD, Foulger RE, Dwight SS, White JV, Roth FP: Predictinggene function from patterns of annotation. Genome Res 2003,13:896-904.
24. Hughes TR, Marton MJ, Jones AR, Roberts CJ, Stoughton R, ArmourCD, Bennett HA, Coffey E, Dai H, He YD, Kidd MJ, King AM, MeyerMR, Slade D, Lum PY, Stepaniants SB, Shoemaker DD, Gachotte D,Chakraburtty K, Simon J, Bard M, Friend SH: Functional discoveryvia a compendium of expression profiles. Cell 2000,102:109-126.
25. Stolovitzky G: Gene selection in microarray data: the ele-phant, the blind men and our algorithms. Curr Opin Struct Biol2003, 13:370-376.
26. Deng M, Chen T, Sun F: An integrated probabilistic model forfunctional prediction of proteins. J Comput Biol 2004,11:463-475.
27. Breiman L: Random forest. Machine Learn 2001, 45:5-32.28. Breiman L, Friedman JH, Olshen RA, Stone CJ: Classification and
Regression Trees Belmont, CA: Wadsworth International Group; 1984. 29. Lee I, Date SV, Adai AT, Marcotte EM: A probabilistic functional
network of yeast genes. Science 2004, 306:1555-1558.
30. Lewis D: Naive (Bayes) at forty: The independence assump-tion in information retrieval. In Proceedings of the 10th EuropeanConference on Machine Learning: 21 to 23 April 1998; Chemnitz, GermanyEdited by: Nedllec C, Rouveirol C. London, UK: Springer-Verlag;1998:4-15.
31. Mewes HW, Frishman D, Guldener U, Mannhaupt G, Mayer K,Mokrejs M, Morgenstern B, Munsterkotter M, Rudd S, Weil B: MIPS:a database for genomes and protein sequences. Nucleic AcidsRes 2002, 30:31-34.
32. Bader GD, Hogue CW: Analyzing yeast protein-protein inter-action data obtained from different sources. Nat Biotechnol2002, 20:991-997.
33. Yfunc [http://llama.med.harvard.edu/Yfunc/]34. Myers CL, Robson D, Wible A, Hibbs MA, Chiriac C, Theesfeld CL,
Dolinski K, Troyanskaya OG: Discovery of biological networksfrom diverse functional genomic data. Genome Biol 2005,6:R114.
35. Brown MP, Grundy WN, Lin D, Cristianini N, Sugnet CW, Furey TS,Ares M Jr, Haussler D: Knowledge-based analysis of microarraygene expression data by using support vector machines. ProcNatl Acad Sci USA 2000, 97:262-267.
36. Qi Y, Bar-Joseph Z, Klein-Seetharaman J: Evaluation of differentbiological data and computational classification methods foruse in protein interaction prediction. Proteins 2006, 63:490-500.
37. Stark C, Breitkreutz BJ, Reguly T, Boucher L, Breitkreutz A, Tyers M:BioGRID: a general repository for interaction datasets.Nucleic Acids Res 2006:D535-D539.
38. Kumar A, Agarwal S, Heyman JA, Matson S, Heidtman M, Piccirillo S,Umansky L, Drawid A, Jansen R, Liu Y, Cheung KH, Miller P, GersteinM, Roeder GS, Snyder M: Subcellular localization of the yeastproteome. Genes Dev 2002, 16:707-719.
39. Li X, Routt SM, Xie Z, Cui X, Fang M, Kearns MA, Bard M, Kirsch DR,Bankaitis VA: Identification of a novel family of nonclassicyeast phosphatidylinositol transfer proteins whose functionmodulates phospholipase D activity and Sec14p-independ-ent cell growth. Mol Biol Cell 2000, 11:1989-2005.
40. Quinlan JR: C4.5.: Programs for Machine Learning San Mateo, CA: Mor-gan Kaufmann; 1993.
41. Ruepp A, Zollner A, Maier D, Albermann K, Hani J, Mokrejs M, TetkoI, Güldener U, Mannhaupt G, Münsterkötter M, Mewes HW: TheFunCat, a functional annotation scheme for systematic clas-sification of proteins from whole genomes. Nucleic Acids Res2004, 32:5539-5545.
42. MRF-NB [http://www.cmb.usc.edu/msms/IntegrateFunctionPrediction/]
43. Saccharomyces Genome Database [http://www.yeastgenome.org/]
44. Giaever G, Flaherty P, Kumm J, Proctor M, Nislow C, Jaramillo DF,Chu AM, Jordan MI, Arkin AP, Davis RW: Chemogenomic profil-ing: identifying the functional interactions of small moleculesin yeast. Proc Natl Acad Sci USA 2004, 101:793-798.
45. Parsons AB, Brost RL, Ding H, Li Z, Zhang C, Sheikh B, Brown GW,Kane PM, Hughes TR, Boone C: Integration of chemical-geneticand genetic interaction data links bioactive compounds tocellular target pathways. Nat Biotechnol 2004, 22:62-69.
46. Baetz K, McHardy L, Gable K, Tarling T, Reberioux D, Bryan J,Andersen RJ, Dunn T, Hieter P, Roberge M: Yeast genome-widedrug-induced haploinsufficiency screen to determine drugmode of action. Proc Natl Acad Sci USA 2004, 101:4525-4530.
47. Tucker CL, Fields S: Quantitative genome-wide analysis ofyeast deletion strain sensitivities to oxidative and chemicalstress. Comparative Functional Genomics 2004, 5:216-224.
48. Dudley AM, Janse DM, Tanay A, Shamir R, Church GM: A globalview of pleiotropy and phenotypically derived gene functionin yeast. Mol Syst Biol 2005, 1:2005.0001.
49. Ng HH, Robert F, Young RA, Struhl K: Genome-wide locationand regulated recruitment of the RSC nucleosome-remode-ling complex. Genes Dev 2002, 16:806-819.
50. Robert F, Pokholok DK, Hannett NM, Rinaldi NJ, Chandy M, Rolfe A,Workman JL, Gifford DK, Young RA: Global position and recruit-ment of HATs and HDACs in the yeast genome. Mol Cell 2004,16:199-209.
51. Harbison CT, Gordon DB, Lee TI, Rinaldi NJ, Macisaac KD, DanfordTW, Hannett NM, Tagne JB, Reynolds DB, Yoo J, Jennings EG, Zei-tlinger J, Pokholok DK, Kellis M, Rolfe PA, Takusagawa KT, Lander ES,Gifford DK, Fraenkel E, Young RA: Transcriptional regulatorycode of a eukaryotic genome. Nature 2004, 431:99-104.
52. Lee TI, Rinaldi NJ, Robert F, Odom DT, Bar-Joseph Z, Gerber GK,
Genome Biology 2008, 9:S7
http://genomebiology.com/2008/9/S1/S7 Genome Biology 2008, Volume 9, Suppl 1, Article S7 Tian et al. S7.21
Hannett NM, Harbison CT, Thompson CM, Simon I, Zeitlinger J, Jen-nings EG, Murray HL, Gordon DB, Ren B, Wyrick JJ, Tagne JB, VolkertTL, Fraenkel E, Gifford DK, Young RA: Transcriptional regulatorynetworks in Saccharomyces cerevisiae. Science 2002,298:799-804.
53. Bru C, Courcelle E, Carrere S, Beausse Y, Dalmar S, Kahn D: TheProDom database of protein domain families: more empha-sis on 3D. Nucleic Acids Res 2005:D212-D215.
54. Selengut JD, Haft DH, Davidsen T, Ganapathy A, Gwinn-Giglio M,Nelson WC, Richter AR, White O: TIGRFAMs and GenomeProperties: tools for the assignment of molecular functionand biological process in prokaryotic genomes. Nucleic AcidsRes 2007:D260-D264.
55. Mi H, Guo N, Kejariwal A, Thomas PD: PANTHER version 6: pro-tein sequence and function evolution data with expandedrepresentation of biological pathways. Nucleic Acids Res2007:D247-D252.
56. Gavin AC, Aloy P, Grandi P, Krause R, Boesche M, Marzioch M, RauC, Jensen LJ, Bastuck S, Dümpelfeld B, Edelmann A, Heurtier MA,Hoffman V, Hoefert C, Klein K, Hudak M, Michon AM, Schelder M,Schirle M, Remor M, Rudi T, Hooper S, Bauer A, Bouwmeester T,Casari G, Drewes G, Neubauer G, Rick JM, Kuster B, Bork P, et al.:Proteome survey reveals modularity of the yeast cellmachinery. Nature 2006, 440:631-636.
57. Tong AH, Lesage G, Bader GD, Ding H, Xu H, Xin X, Young J, BerrizGF, Brost RL, Chang M, Chen Y, Cheng X, Chua G, Friesen H, Gold-berg DS, Haynes J, Humphries C, He G, Hussein S, Ke L, Krogan N,Li Z, Levinson JN, Lu H, Ménard P, Munyana C, Parsons AB, Ryan O,Tonikian R, Roberts T, et al.: Global mapping of the yeast geneticinteraction network. Science 2004, 303:808-813.
58. Pan X, Ye P, Yuan DS, Wang X, Bader JS, Boeke JD: A DNA integ-rity network in the yeast Saccharomyces cerevisiae. Cell 2006,124:1069-1081.
59. Ptacek J, Devgan G, Michaud G, Zhu H, Zhu X, Fasolo J, Guo H, JonaG, Breitkreutz A, Sopko R, McCartney RR, Schmidt MC, Rachidi N,Lee SJ, Mah AS, Meng L, Stark MJ, Stern DF, De Virgilio C, Tyers M,Andrews B, Gerstein M, Schweitzer B, Predki PF, Snyder M: Globalanalysis of protein phosphorylation in yeast. Nature 2005,438:679-684.
60. Kang JS, Kim SH, Hwang MS, Han SJ, Lee YC, Kim YJ: The structuraland functional organization of the yeast mediator complex.J Biol Chem 2001, 276:42003-42010.
61. Schuldiner M, Collins SR, Thompson NJ, Denic V, Bhamidipati A,Punna T, Ihmels J, Andrews B, Boone C, Greenblatt JF, Weissman JS,Krogan NJ: Exploration of the function and organization of theyeast early secretory pathway through an epistatic min-iarray profile. Cell 2005, 123:507-519.
62. Gandhi M, Goode BL, Chan CS: Four novel suppressors of gic1gic2 and their roles in cytokinesis and polarized cell growthin Saccharomyces cerevisiae. Genetics 2006, 174:665-678.
63. Valachovic M, Bareither BM, Shah Alam Bhuiyan M, Eckstein J, Bar-buch R, Balderes D, Wilcox L, Sturley SL, Dickson RC, Bard M:Cumulative mutations affecting sterol biosynthesis in theyeast Saccharomyces cerevisiae result in synthetic lethalitythat is suppressed by alterations in sphingolipid profiles.Genetics 2006, 173:1893-1908.
64. Myung K, Kolodner RD: Suppression of genome instability byredundant S-phase checkpoint pathways in Saccharomycescerevisiae. Proc Natl Acad Sci USA 2002, 99:4500-4507.
65. Kus BM, Caldon CE, Andorn-Broza R, Edwards AM: Functionalinteraction of 13 yeast SCF complexes with a set of yeast E2enzymes in vitro. Proteins 2004, 54:455-467.
66. Stevens SW, Ryan DE, Ge HY, Moore RE, Young MK, Lee TD, Abel-son J: Composition and functional characterization of theyeast spliceosomal penta-snRNP. Mol Cell 2002, 9:31-44.
67. Mosch HU, Fink GR: Dissection of filamentous growth by trans-poson mutagenesis in Saccharomyces cerevisiae. Genetics 1997,145:671-684.
68. Branzei D, Seki M, Onoda F, Enomoto T: The product of Saccha-romyces cerevisiae WHIP/MGS1, a gene related to replicationfactor C genes, interacts functionally with DNA polymerasedelta. Mol Genet Genomics 2002, 268:371-386.
69. Xu H, Wickner W: Bem1p is a positive regulator of the homo-typic fusion of yeast vacuoles. J Biol Chem 2006,281:27158-27166.
70. Shen WC, Bhaumik SR, Causton HC, Simon I, Zhu X, Jennings EG,Wang TH, Young RA, Green MR: Systematic analysis of essentialyeast TAFs in genome-wide transcription and preinitiation
complex assembly. EMBO J 2003, 22:3395-3402.71. Cramer P, Bushnell DA, Fu J, Gnatt AL, Maier-Davis B, Thompson NE,
Burgess RR, Edwards AM, David PR, Kornberg RD: Architecture ofRNA polymerase II and implications for the transcriptionmechanism. Science 2000, 288:640-649.
72. Marino-Ramirez L, Hu JC: Isolation and mapping of self-assem-bling protein domains encoded by the Saccharomyces cerevi-siae genome using lambda repressor fusions. Yeast 2002,19:641-650.
73. Tharun S, Parker R: Targeting an mRNA for decapping: dis-placement of translation factors and association of theLsm1p-7p complex on deadenylated yeast mRNAs. Mol Cell2001, 8:1075-1083.
74. Tsai WY, Chow YT, Chen HR, Huang KT, Hong RI, Jan SP, Kuo NY,Tsao TY, Chen CH, Cheng SC: Cef1p is a component of thePrp19p-associated complex and essential for pre-mRNAsplicing. J Biol Chem 1999, 274:9455-9462.
75. Pan X, Yuan DS, Xiang D, Wang X, Sookhai-Mahadeo S, Bader JS,Hieter P, Spencer F, Boeke JD: A robust toolkit for functionalprofiling of the yeast genome. Mol Cell 2004, 16:487-496.
76. Damelin M, Silver PA: In situ analysis of spatial relationshipsbetween proteins of the nuclear pore complex. Biophys J 2002,83:3626-3636.
77. Gonsalvez GB, Lehmann KA, Ho DK, Stanitsa ES, Williamson JR, LongRM: RNA-protein interactions promote asymmetric sortingof the ASH1 mRNA ribonucleoprotein complex. Rna 2003,9:1383-1399.
Genome Biology 2008, 9:S7
Related Documents