Combined Analysis of Extant Rhynchonellida (Brachiopoda) Using Morphological and Molecular Data David Bapst Sandra J. Carlson Holly A. Schreiber Feel free to tweet this talk! @dwbapst

Welcome message from author
This document is posted to help you gain knowledge. Please leave a comment to let me know what you think about it! Share it to your friends and learn new things together.
Transcript
Combined Analysis of Extant Rhynchonellida (Brachiopoda) Using Morphological and Molecular Data
David Bapst
Sandra J. Carlson
Holly A. SchreiberFeel free to
tweet this talk!
@dwbapst
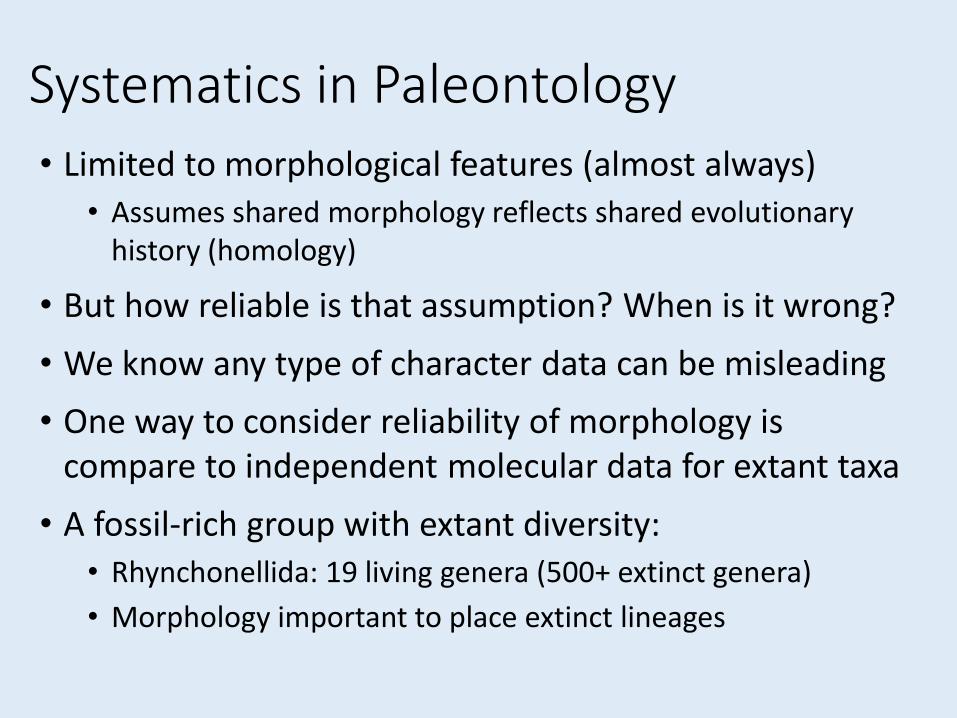
Systematics in Paleontology• Limited to morphological features (almost always)
• Assumes shared morphology reflects shared evolutionary history (homology)
• But how reliable is that assumption? When is it wrong?
• We know any type of character data can be misleading
• One way to consider reliability of morphology is compare to independent molecular data for extant taxa
• A fossil-rich group with extant diversity:• Rhynchonellida: 19 living genera (500+ extinct genera)
• Morphology important to place extinct lineages

Rhynchonellida• Articulated brachiopods with spirolophe lophophores
supported on crura
• 10/19 extant genera live at bathyal or abyssal depths and are difficult to collect
Crura

Compare with tanglegrams via R package phytools
Note: All topologies in this talk are single MPTs or majority-rule / half-compat summaries
Morphology(56 Characters, Reweighted Parsimony MPT)
Schreiber et al. 2013
18S and 28S rDNA(3435 base pairs, Bayesian)
Cohen & Bitner 2013
Rh
ynch
on
elli
da

Morphology(56 Characters, Reweighted Parsimony MPT)
Schreiber et al. 2013
18S and 28S rDNA(3435 base pairs, Bayesian)
Cohen & Bitner 2013

Morphology(56 Characters, Reweighted Parsimony MPT)
Schreiber et al. 2013
18S and 28S rDNA(3435 base pairs, Bayesian)
Cohen & Bitner 2013

Morphology(56 Characters, Reweighted Parsimony MPT)
Schreiber et al. 2013
18S and 28S rDNA(3435 base pairs, Bayesian)
Cohen & Bitner 2013
Scattered Superfamilies
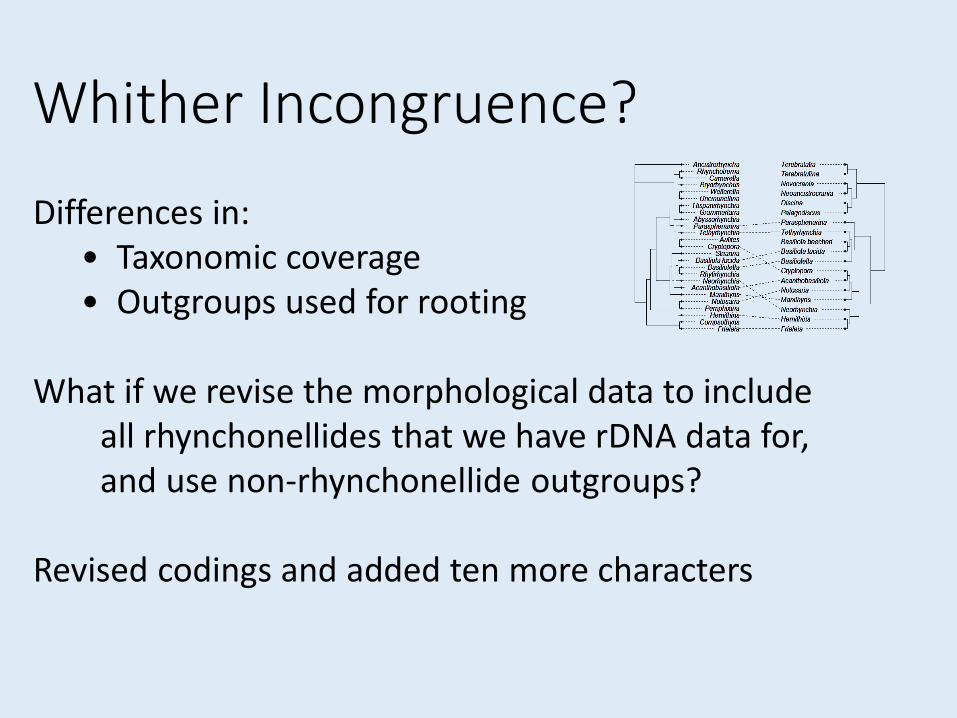
Differences in:• Taxonomic coverage• Outgroups used for rooting
What if we revise the morphological data to include all rhynchonellides that we have rDNA data for, and use non-rhynchonellide outgroups?
Revised codings and added ten more characters
Whither Incongruence?

• But what about just combining the two datasets?• Maybe it would support one topology or the other
• Maybe it would find third alternative topology
Whither Incongruence?
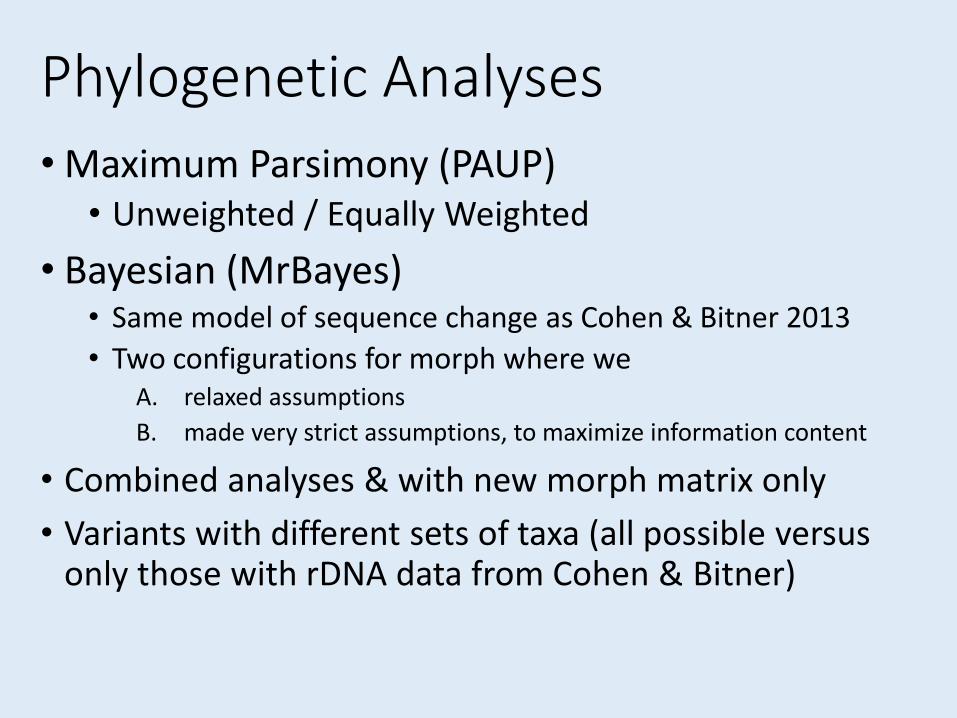
Phylogenetic Analyses
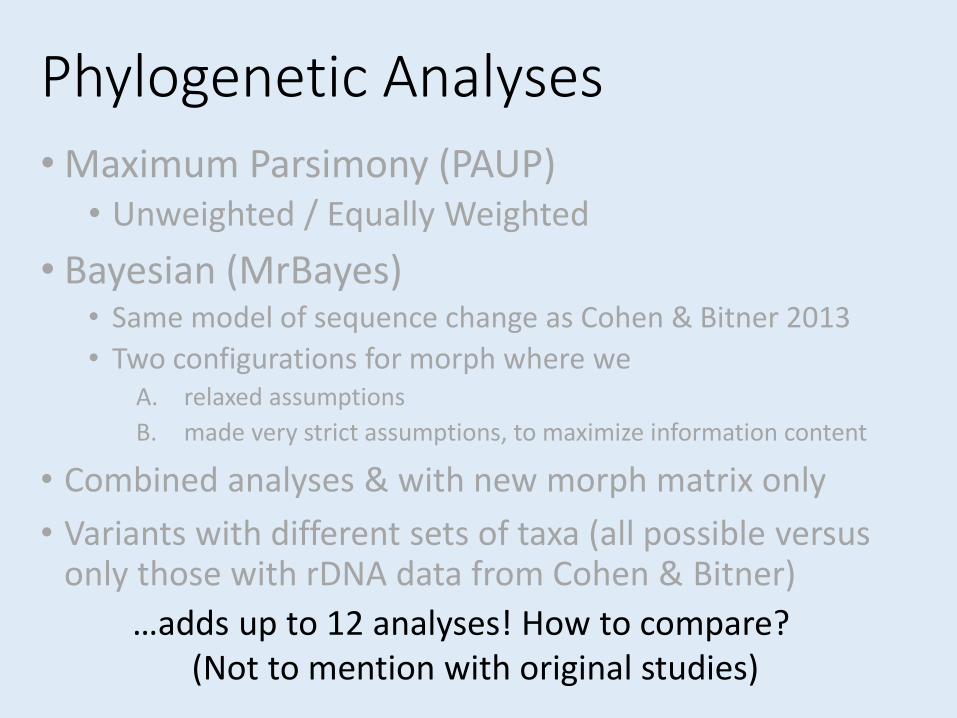
• Maximum Parsimony (PAUP)• Unweighted / Equally Weighted
• Bayesian (MrBayes)• Same model of sequence change as Cohen & Bitner 2013
• Two configurations for morph where weA. relaxed assumptions
B. made very strict assumptions, to maximize information content
• Combined analyses & with new morph matrix only
• Variants with different sets of taxa (all possible versus only those with rDNA data from Cohen & Bitner)
Phylogenetic Analyses
• Maximum Parsimony (PAUP)• Unweighted / Equally Weighted
• Bayesian (MrBayes)• Same model of sequence change as Cohen & Bitner 2013
• Two configurations for morph where weA. relaxed assumptions
B. made very strict assumptions, to maximize information content
• Combined analyses & with new morph matrix only
• Variants with different sets of taxa (all possible versus only those with rDNA data from Cohen & Bitner)
…adds up to 12 analyses! How to compare? (Not to mention with original studies)

Contradiction Distance• Compare summary trees, but polytomies count as
differences in most metrics (e.g. Robinson-Foulds).
• Want to know how much two trees actively contradict
𝐶1 = 𝑁𝑢𝑚𝑏𝑒𝑟 𝑜𝑓 𝑆𝑝𝑙𝑖𝑡𝑠 𝑖𝑛 𝑇1 𝐶𝑜𝑛𝑡𝑟𝑎𝑑𝑖𝑐𝑡𝑒𝑑 𝐵𝑦 𝑇2
𝐶2 = 𝑁𝑢𝑚𝑏𝑒𝑟 𝑜𝑓 𝑆𝑝𝑙𝑖𝑡𝑠 𝑖𝑛 𝑇2 𝐶𝑜𝑛𝑡𝑟𝑎𝑑𝑖𝑐𝑡𝑒𝑑 𝐵𝑦 𝑇1
𝐶𝐷12 =𝐶1 + 𝐶2
2 ∗ (𝑁𝑢𝑚𝑏𝑒𝑟 𝑜𝑓 𝑠ℎ𝑎𝑟𝑒𝑑 𝑡𝑖𝑝𝑠 − 2)
• Disagreement between two topologies is fraction of total possible splits that could disagree, across both• CD between star tree and fully resolved tree is 0
• CD between two completely contradictory topologies is 1

Pairwise Contradiction Distance
Yikes!

Pairwise Contradiction Distance
Not surprising…

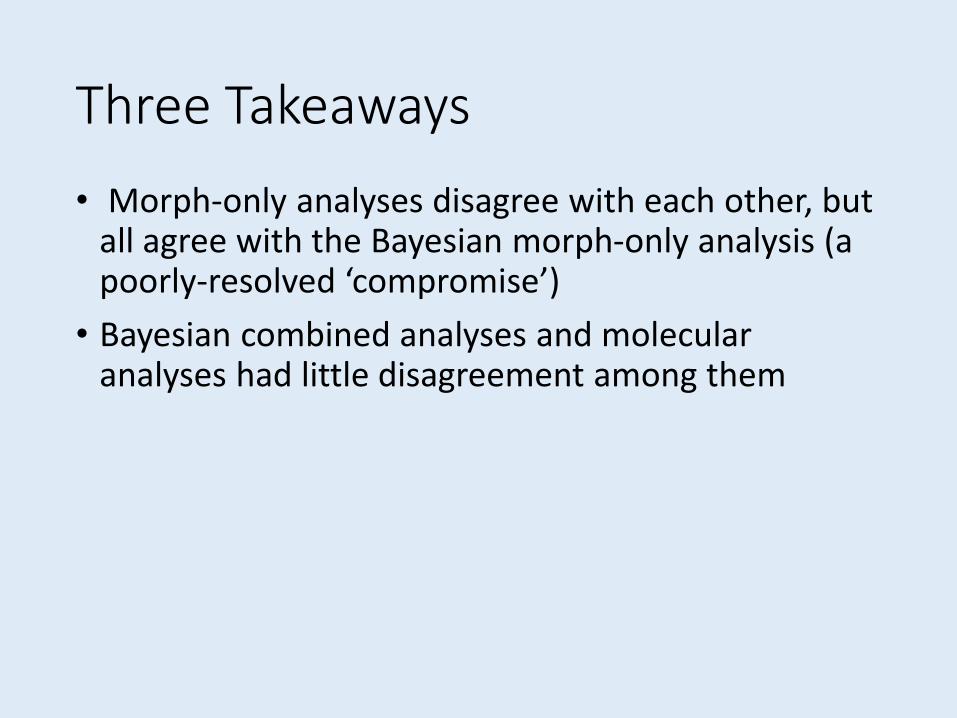
Three Takeaways
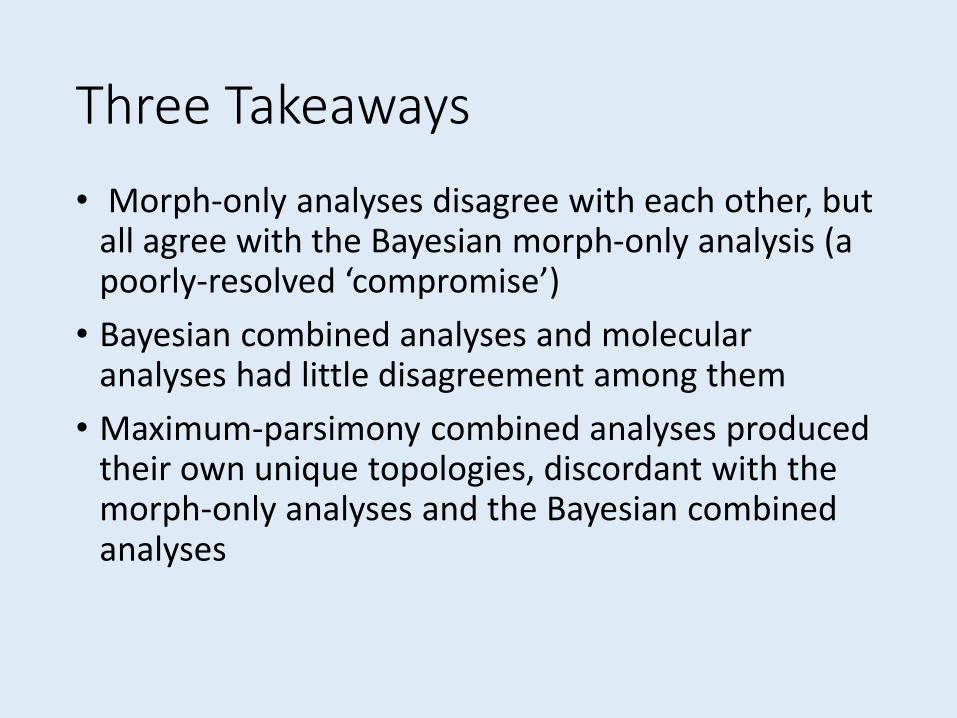
• Morph-only analyses disagree with each other, but all agree with the Bayesian morph-only analysis (a poorly-resolved ‘compromise’)

18S and 28S rDNA(3435 base pairs, Bayesian)
Cohen & Bitner 2013
Revised Morphological Matrix (66 characters, Bayesian)
This Study
CD = 0.41

18S and 28S rDNA(3435 base pairs, Bayesian)
Cohen & Bitner 2013
Revised Morphological Matrix (66 characters, Bayesian)
This Study
CD = 0.41
The morph-only analyses aren’t even sure if the Rhynchonellida is monophyletic
Three Takeaways
• Morph-only analyses disagree with each other, but all agree with the Bayesian morph-only analysis (a poorly-resolved ‘compromise’)
• Bayesian combined analyses and molecular analyses had little disagreement among them
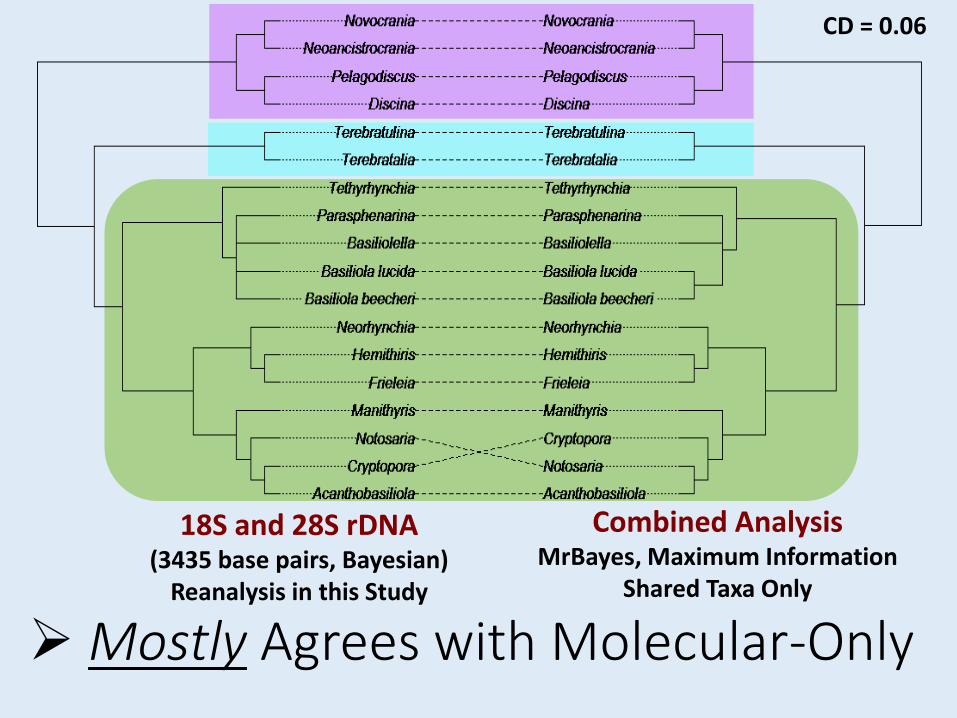
18S and 28S rDNA(3435 base pairs, Bayesian)
Reanalysis in this Study
Combined AnalysisMrBayes, Maximum Information
Shared Taxa Only
Mostly Agrees with Molecular-Only
CD = 0.06
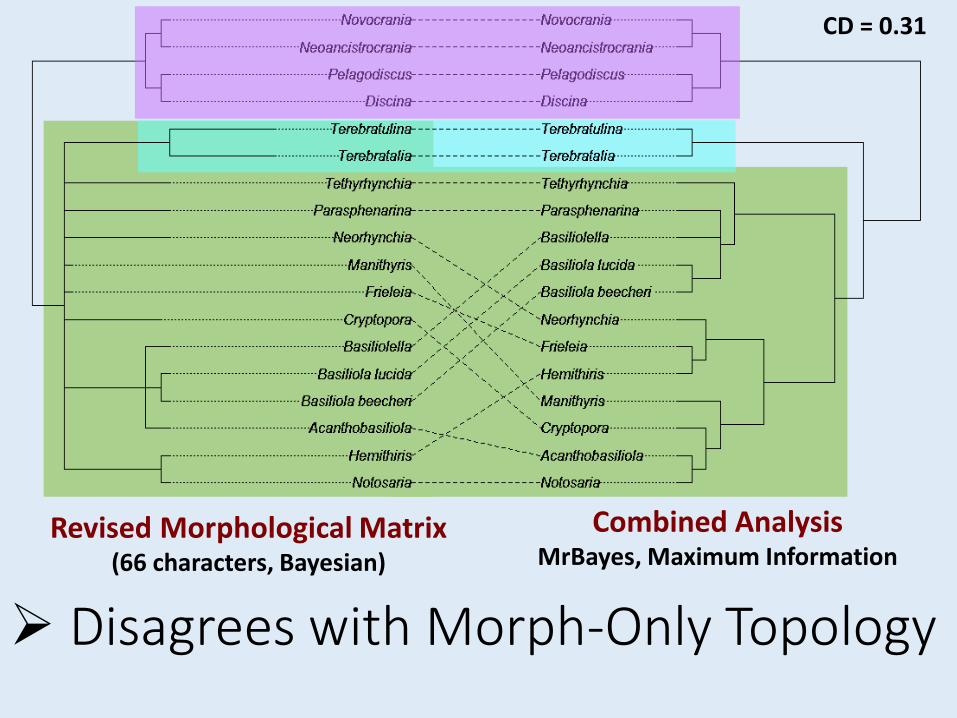
Disagrees with Morph-Only Topology
Revised Morphological Matrix (66 characters, Bayesian)
Combined AnalysisMrBayes, Maximum Information
CD = 0.31
Three Takeaways
• Morph-only analyses disagree with each other, but all agree with the Bayesian morph-only analysis (a poorly-resolved ‘compromise’)
• Bayesian combined analyses and molecular analyses had little disagreement among them
• Maximum-parsimony combined analyses produced their own unique topologies, discordant with the morph-only analyses and the Bayesian combined analyses

So, the molecular signal wins in the combined analysis…
•But how much of this is due to having 53 times more molecular characters than morphological?
•Need sensitivity analyses to test if partition size matters…

1. Repeat morph characters 53 times so partitions are roughly equal in size…Won’t converge in MrBayes
Sensitivity Analyses

Sensitivity Analyses2. Simulate 66 binary characters on morph-only
MP majority-rule consensus, with single transitions, creating data with no homoplasy• Maximum support possible for morph-only tree
• Recombine with molecular data—which wins?
Actual DataBayesian
Combined AnalysisSimulated Data
Almost identical to Bayesian combined/mol trees
CD = 0.25
Effect of Missing Data?
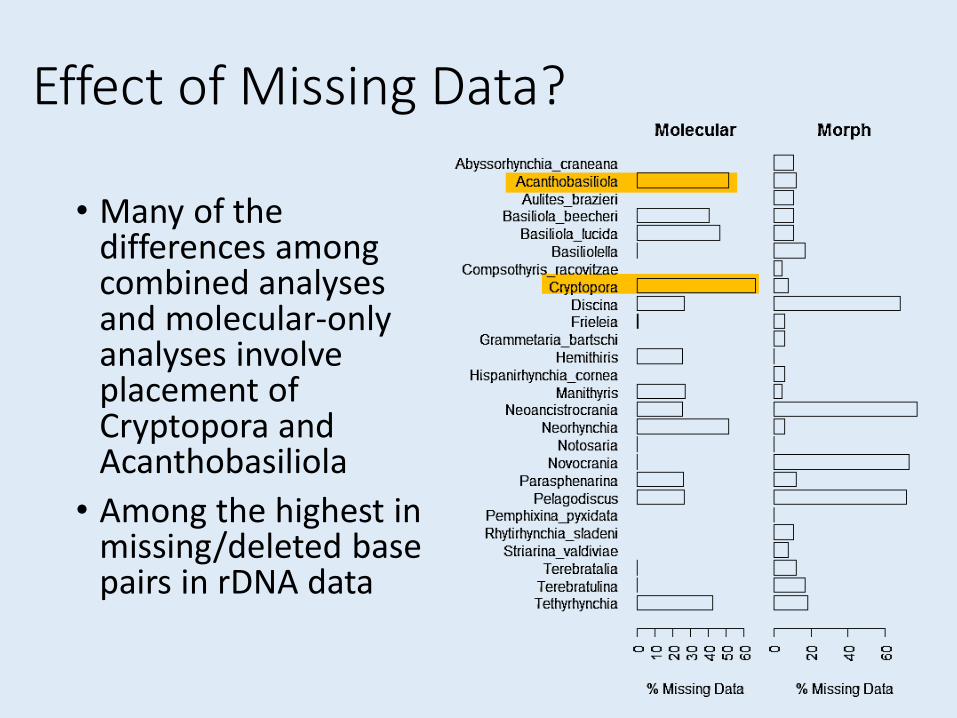
• Many of the differences among combined analyses and molecular-only analyses involve placement of Cryptopora and Acanthobasiliola
• Among the highest in missing/deleted base pairs in rDNA data
Conclusions• Morph-only analyses contradicted each other
• Molecular-only and (Bayesian) combined analyses were congruent with each other
• Sensitivity analyses suggest large size of molecular partition may be controlling factor
• Still, small number of morph chars did impact the much larger molecular dataset in combined analyses• Impacted taxa also missing much of their molecular data
• Is noisy signal of morph data due to long branches? • Code large fossil taxa within Rhynchonellida crown to test
This research was funded by NSF 1147537.
We thank A. Wright and P. Smits for discussion.
Consistency Indices for Morph Data
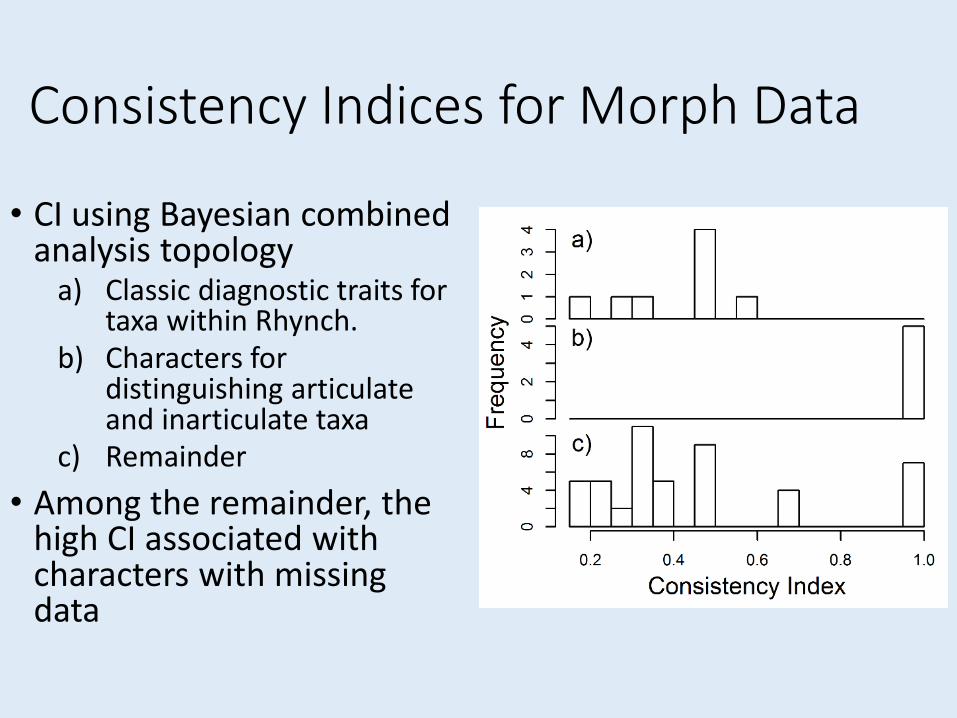
• CI using Bayesian combined analysis topology
a) Classic diagnostic traits for taxa within Rhynch.
b) Characters for distinguishing articulate and inarticulate taxa
c) Remainder
• Among the remainder, the high CI associated with characters with missing data


Related Documents
![[Epicurus] Extant Writings (Bailey)](https://static.cupdf.com/doc/110x72/577cd3a81a28ab9e789751e5/epicurus-extant-writings-bailey.jpg)