Combine and conquer: methods for multitask learning in biology and language Meghana Kshirsagar August 12, 2015 CMU-LTI-15-009 Language Technologies Institute School of Computer Science Carnegie Mellon University 5000 Forbes Ave., Pittsburgh, PA 15213 www.lti.cs.cmu.edu THESIS COMMITTEE Jaime G. Carbonell (Chair) Judith Klein-Seetharaman (University of Warwick) Jeff Schneider (Robotics Institute, CMU) Gunnar R ¨ atsch (Memorial Sloan Kettering Cancer Center) Submitted in partial fulfillment of the requirements for the degree of DOCTOR OF PHILOSOPHY Copyright c 2015, Meghana Kshirsagar

Welcome message from author
This document is posted to help you gain knowledge. Please leave a comment to let me know what you think about it! Share it to your friends and learn new things together.
Transcript

Combine and conquer: methods for multitasklearning in biology and language
Meghana KshirsagarAugust 12, 2015
CMU-LTI-15-009
Language Technologies InstituteSchool of Computer ScienceCarnegie Mellon University
5000 Forbes Ave., Pittsburgh, PA 15213www.lti.cs.cmu.edu
THESIS COMMITTEEJaime G. Carbonell (Chair)
Judith Klein-Seetharaman (University of Warwick)Jeff Schneider (Robotics Institute, CMU)
Gunnar Ratsch (Memorial Sloan Kettering Cancer Center)
Submitted in partial fulfillment of the requirements for the degree ofDOCTOR OF PHILOSOPHY
Copyright c©2015, Meghana Kshirsagar

Abstract
Generalizing beyond an individual task and borrowing knowledge from re-lated tasks are the hallmarks of true intelligence. Knowing one language makesit easier to learn other languages, similar sports require learning similar skills tomaster them, etc. While building supervised machine learning models, such op-portunities arise in machine translation for similar languages, modeling molecu-lar processes of related organisms, predicting links across different types of socialnetworks, extracting information from related sources of data etc. There are sev-eral benefits of borrowing from related tasks, beyond the ability to generalize.In many supervised learning applications the main bottleneck is insufficient la-beled data (i.e annotations) to learn a good model. Obtaining additional labels isoften expensive, requires resources and can be very time consuming. Howeverthere are often at hand, other related applications which have plentiful labeledinformation that can be utilized. Multitask learning [Caruana, 1997] is a familyof machine learning methods that addresses this issue of building models usingdata from multiple problem domains (i.e ‘tasks’) by exploiting the similarity be-tween them. The goal is to achieve performance benefits on the low-resource taskcalled the target task or on all the tasks involved.
This thesis focuses on developing and extending multitask learning modelsfor various types of data. Two diverse applications motivate the methods in thiswork. The first one is, modeling infectious diseases via host-pathogen interac-tions where we study molecular level interactions between pathogens such asbacteria and viruses and their hosts (such as humans). The question we addressis: Can we model host-pathogen interactions better by leveraging data across multiplediseases?, towards which we develop new methods to jointly learn models acrossseveral hosts and pathogens. The other application that we consider, semanticparsing, is the process of mapping a natural-language sentence into a formal rep-resentation of its meaning. Since there are several ways to represent meaning,there are several linguistic resources (one per representation) and each annotatesa different text corpus. Here we focus on: how to leverage information from re-sources with different representations and distributions? Overall, we explore variousmechanisms of sharing information across tasks: by enforcing priors, structuredsimilarity, feature augmentation and instance-level transfer. We show how ourmodels can be interpreted to obtain additional insights into the problems.
In terms of impact, we build the first models for host-pathogen interactionsfor several bacteria and viruses and the first to involve a plant host. The methodswe develop perform better than other computational methods. The predictionswe obtain for the bacteria, Salmonella were validated by laboratory experiments,and we find that our model has a significantly higher recall compared to othercomputational models. Since there is very little known about how plant immunesystems work, we exploit the data from other hosts. With the predictions fromour model, we compare two hosts: human and the plant host Arabidopsis thaliana.The model we develop for viral pathogens leads us to some interesting insightson pathogen-specific protein sequence structures. Finally, leveraging several lin-guistic resources leads us to achieve impressive gains for the task of frame se-mantic role labeling.
1

Acknowledgements
They say, it’s not the destination but the journey that matters the most. The samecan be said of a PhD (which is a reasonably long and complex journey). For me, thisjourney would not have been possible without the support of my advisors, peers,family and friends. I am grateful to be able to acknowledge their contributions here.
A majority of my thesis work has been in the field of computational biology - atthe confluence of machine learning and molecular biology. I was fortunate to havefound the “right” research area - one that I am passionate about and deeply care for.For this, I am extremely grateful to my advisors, Jaime Carbonell and Judith Klein-Seetharaman for introducing some exciting problems and opportunities for contribu-tion in this vast and upcoming area. I still remember my first research discussionwith Jaime on transfer learning and with Judith on Salmonella and how much it hadexcited me. I came in with no prior experience in bioinformatics and little relevantbackground in biology. I am very thankful to them for having placed their trust inme, and for taking me on as an advisee. I transferred to CMU from UIUC (where Ispent a year, unsuccessful in finding a research topic) and I am happy to have foundthe right advisor and research combination here.
Jaime’s expertise in extremely diverse subject areas such as biology and language(to name a few) has made it possible for me to think of problems in these as manifes-tations of a more general underlying computational setting. Working with him hasexposed me to a variety of rich problems and has led to my confidence in machinelearning algorithms as a powerful ally for many unconventional data sources (indus-trial safety is one example). His emphasis on making methods simple and generalhas influenced my research greatly in later years. Jaime’s advising style of nudging injust the right amount has led me to gain skills needed as an independent researcher,to view problems at an abstract level. I am thankful for his flexibility in always mak-ing time for meetings and for last minute discussions on papers. I would also like tothank Jaime’s group for discussions and suggestions in group meetings, in particularKeerthiram Murugesan, Wan Li, Selen Uguroglu.
In my early years, I am thankful to Judith for making it easier for me to navi-gate the overwhelming sea of biological concepts and terminology by pointing mein the relevant direction. Judith is one of the rare biologists who sees computationas an exciting companion for biology (I have hence met many that either regard itsuspiciously or that see it as a mere tool). Her excitement and belief in computa-tional modeling of complex biological phenomena has influenced some of my ambi-tious efforts towards jointly modeling some daringly disparate hosts and pathogens.I am also thankful to Judith’s research group, both at UPitt and Warwick for beingmy “quick reference” for concepts and tools. A very special thanks and gratitude toSylvia Schlekar for being very patient with paper submissions, especially when thecomputational results were bad and when there were mistakes in my models. Mostof the wet-lab experiments and the Salmonella data used in my thesis came from herdiligent efforts. I am also thankful to her for hosting me in Julich. I would also like tothank Joan Planas, Naveena Yanamalla, Dariush Mohammedyani for their help.
I benefitted greatly from discussions with other computational biologists here atCMU, in particular from Ziv Bar-Joseph and his group who have also been fun com-panions at conferences: Anthony Gitter, Saket Navlakha and Siddhartha Jain whoseresearch being very related has influenced my own work.
3
In my last year I worked on frame semantic parsing, thanks to an early discus-sion of various multitask settings with Jaime and encouragement from Chris Dyer– whose approachable personality and excitement led me to pursue this directionfurther. Chris has a very broad understanding of machine learning and NLP anddiscussions with him have always led to new knowledge and ideas even in the com-putational biology aspects of my research. Very special thanks to Nathan Schneiderand Sam Thomson, first for being friends and then for being such nice collaborators(indeed, it was all those lunches and dinners together that rubbed some NLP ontome). It was fun to write the ACL paper, and I am thankful for their help and patiencein all the technical aspects that were very new to me. I would also like to thank NoahSmith for his help and the most for inspiring me to write better - concise and accurate.
Before I began my PhD, one of my main mentors was my Masters thesis advisorat IIT Bombay - Prof. S. Sudarshan. My basic understanding of research, of the bestpractices and priorities has come from his guidance. I will always be indebted to himfor being such an inspirational advisor.
I made many friends here at CMU and also during my one year at UIUC. Firstand foremost, I would like to thank Kriti Puniyani would brought to me the idea ofswitching from UIUC to CMU and helping with it, and for also inspiring me to takeup computational biology and for being a great TA and help in technical difficulties.I want to thank all my other friends as well, for their company made my PhD yearsa pleasant and diverse experience – Ravi Tumkur, Lavanya Anandan, Rajesh Kar-mani and many others at UIUC. At CMU – my batchmates and great friends, DaniYogatama for constant dinner company and academic gossip, Derry Wijaya for be-ing my fun ‘offmie’ and sounding board, Hobarters - Sunayana Sitaram and AnjaliMenon for being ‘counsellors’ in the toughest of times and providing delicious newfoods, Bhavana Dalvi for being together for so long as a great friend and flatmate,Ruta Desai for all the fun projects, random discussions and with Wolfgang Richter formaking LaptopRehab possible, and with Lara Martins for the roadshows, PrasannaKumar for providing constant potassium nourishment through bananas, organizingLTI events, my pingpong buddies and dinner companions, Nathan Schneider, WaleedAmmar, Sam Thomson. For daily scrum in my last semester, Subhodeep Moitra andReyyan Yeniterzi. There are many others who have helped and been there and I wantto thank you all.
Last but not the least, I want to thank my parents and my brother – for theirunconditional love, for having faith in me always, for everything they have done forme throughout my life and being here for my defense. My love, Alekh for inspiringme to do my best, for being a part of everything I have withstood and achieved in thelast few years.
4

Contents
Contents 5
List of Figures 7
List of Tables 10
1 Introduction 13
2 Modeling infectious diseases via host-pathogen protein interactions 212.1 Predicting host-pathogen PPIs . . . . . . . . . . . . . . . . . . . . . . . . 222.2 Host-pathogen PPI datasets . . . . . . . . . . . . . . . . . . . . . . . . . 232.3 Features for host-pathogen PPI prediction . . . . . . . . . . . . . . . . . 232.4 The curse of missing negatives . . . . . . . . . . . . . . . . . . . . . . . 272.5 Evaluating PPI prediction methods . . . . . . . . . . . . . . . . . . . . . 282.6 Motivation for multitask approaches . . . . . . . . . . . . . . . . . . . . 28
3 Multi-Task Pathway-based Learning (MTPL) 293.1 Related work . . . . . . . . . . . . . . . . . . . . . . . . . . . . . . . . . . 303.2 Approach . . . . . . . . . . . . . . . . . . . . . . . . . . . . . . . . . . . . 313.3 Datasets and features . . . . . . . . . . . . . . . . . . . . . . . . . . . . . 323.4 The objective function and optimization . . . . . . . . . . . . . . . . . . 353.5 Experiments . . . . . . . . . . . . . . . . . . . . . . . . . . . . . . . . . . 403.6 Results and Discussion . . . . . . . . . . . . . . . . . . . . . . . . . . . . 423.7 Unified multi-task pathway objective (U-MTPL) . . . . . . . . . . . . . 473.8 Co-immunoprecipitation (co-ip) studies: validation of predicted Salmonella
interactions . . . . . . . . . . . . . . . . . . . . . . . . . . . . . . . . . . . 493.9 Conclusion . . . . . . . . . . . . . . . . . . . . . . . . . . . . . . . . . . . 51
4 Multitask matrix completion 534.1 Prior work . . . . . . . . . . . . . . . . . . . . . . . . . . . . . . . . . . . 554.2 Datasets and features . . . . . . . . . . . . . . . . . . . . . . . . . . . . . 564.3 Bilinear low-rank matrix decomposition . . . . . . . . . . . . . . . . . . 574.4 The bilinear sparse low-rank multitask model (BSL-MTL) . . . . . . . . 584.5 Experimental setup . . . . . . . . . . . . . . . . . . . . . . . . . . . . . . 604.6 Results . . . . . . . . . . . . . . . . . . . . . . . . . . . . . . . . . . . . . 614.7 Conclusions and future extensions . . . . . . . . . . . . . . . . . . . . . 64
5 Transfer learning models for new hosts and pathogens 675.1 Source tasks . . . . . . . . . . . . . . . . . . . . . . . . . . . . . . . . . . 69
5
5.2 Methods . . . . . . . . . . . . . . . . . . . . . . . . . . . . . . . . . . . . 695.3 Negative examples . . . . . . . . . . . . . . . . . . . . . . . . . . . . . . 775.4 Results and Discussion . . . . . . . . . . . . . . . . . . . . . . . . . . . . 77
6 Frame-Semantic Role Labeling with Heterogeneous Annotations 876.1 FrameNet . . . . . . . . . . . . . . . . . . . . . . . . . . . . . . . . . . . . 886.2 Model . . . . . . . . . . . . . . . . . . . . . . . . . . . . . . . . . . . . . . 916.3 Learning . . . . . . . . . . . . . . . . . . . . . . . . . . . . . . . . . . . . 926.4 Experimental Setup . . . . . . . . . . . . . . . . . . . . . . . . . . . . . . 936.5 Results . . . . . . . . . . . . . . . . . . . . . . . . . . . . . . . . . . . . . 936.6 Conclusion . . . . . . . . . . . . . . . . . . . . . . . . . . . . . . . . . . . 95
7 Conclusion 977.1 Summary and key contributions . . . . . . . . . . . . . . . . . . . . . . 977.2 Future research directions . . . . . . . . . . . . . . . . . . . . . . . . . . 98
Bibliography 101
6
List of Figures
2.1 An example of a supervised classification method for predicting proteininteractions . . . . . . . . . . . . . . . . . . . . . . . . . . . . . . . . . . . . . 23
2.2 Phylogenetic tree of all the bacterial species and the number of bacteria-human PPIs (log-scale) in PHISTO database for each bacteria. Highlightedbacterial species represent the PPI datasets that we use for our models inChapter §3. . . . . . . . . . . . . . . . . . . . . . . . . . . . . . . . . . . . . . 24
3.1 Genealogy of the bacterial species (highlighted in blue), for which we de-velop PPI prediction models in this chapter. The gram stain and the dis-eases caused by each bacterial species are also shown in paranthesis. . . . 30
3.2 (A) Host-pathogen protein-protein interaction (PPI) prediction where thehost is human and the pathogens are bacteria. (B) An example depictingthe commonality in the bacterial attack of human proteins. Pathway-1 andpathway-3 (highlighted) represent critical processes targeted by all bacte-rial species. . . . . . . . . . . . . . . . . . . . . . . . . . . . . . . . . . . . . . 31
3.3 Heatmap showing pathways enriched in each bacterial-human PPI inter-actions dataset. The horizontal axis represents the pathways (about 2100of them) and the vertical axis represents the 4 datasets. Each entry in theheat-map represents the p-value of a pathway w.r.t one dataset. Darkervalues represent more enrichment. The black columns that span across all4 rows show the commonly enriched pathways. . . . . . . . . . . . . . . . 34
3.4 Part of the “glucose transport pathway” in human. Grey nodes representthe human proteins (genes) involved. Edges represent causality in the pro-cess. This pathway involves the transport of glucose from outside the cellto various components inside the cell. . . . . . . . . . . . . . . . . . . . . . 36
3.5 A schematic illustrating the pathway summarizing function S for a taskT1. On the left are the examples from the input predicted to be positive,indicated by X+. The matrix P has the pathway vectors for each examplein X+. The summary function aggregates the pathway vectors to get thedistribution. . . . . . . . . . . . . . . . . . . . . . . . . . . . . . . . . . . . . 37
3.6 The exponential function ez/C for different values of C. . . . . . . . . . . . 383.7 Precision-Recall curves for MTPL for all tasks . . . . . . . . . . . . . . . . . 433.8 The intersection of enriched human pathways from predicted interactions.
The total number of enriched pathways for each bacterial species are: B.anthracis: 250, F. tularensis: 164, Y. pestis: 400 and S. typhi.: 40. The sizeof the intersection between all tasks’ enriched pathways is: 17. The sizeof this intersection for the high-throughput datasets (excluding S. typhi) ismuch larger: 104. . . . . . . . . . . . . . . . . . . . . . . . . . . . . . . . . . 45
7

3.9 Enrichment intersection between training PPIs and predicted PPIs. Cut-offused for enrichment: 10−7. . . . . . . . . . . . . . . . . . . . . . . . . . . . . 46
3.10 Schematic showing one standard procedure for Co-immunoprecipitationanalysis of protein interactions. 1. The procedure starts with a cell lysatewhich contains the protein interactions. The bacterial protein is the anti-gen. An antigen-specific antibody (Y) is added, which binds to it. 2. Pro-tein G-beads are introduced. The “immune complexes” bind to the beads(or are captured by a beaded support). 3. The beaded complexes are sep-arated from the unbound proteins in step 4, which are then washed away.5. Elution is used to remove the complexes from the G-beads. Finallythe complexes left behind are analyzed using a method like Western Blotwhich helps identify the binding partner. . . . . . . . . . . . . . . . . . . . 50
3.11 Recall on the 7414 PPIs from the co-immunoprecipitation experiments. . 51
3.12 Precision-Recall curve for MTPL and two of our baselines on the 7414 PPIsfrom the co-immunoprecipitation experiments. The precision was com-puted w.r.t the set of all protein pairs investigated by the pulldown exper-iment. . . . . . . . . . . . . . . . . . . . . . . . . . . . . . . . . . . . . . . . . 52
4.1 Multiple bipartite graphs with different types of nodes: on the left are pro-teins from host species and on the right virus species’ proteins. Edgesrepresent protein interactions. Each bipartite graph is one task. . . . . . . 54
4.2 Genealogy of the viruses that we consider in this work. . . . . . . . . . . . 57
4.3 Principal component analysis of virus proteins in the original feature space(top) and projected subspace (bottom). Shape of the points indicates whichvirus that protein comes from. The first two principal components areshown. . . . . . . . . . . . . . . . . . . . . . . . . . . . . . . . . . . . . . . . 63
4.4 Sequence motifs that contribute significantly to interactions across all viruses(top) and that is specific to Ebola virus (bottom). See Section 4.6 for details. 63
4.5 3D structure obtained by docking ebola virion spike glycoprotein (green)with human ubiquitin-protein ligase (cyan). The putative binding sites areshown using sticks. . . . . . . . . . . . . . . . . . . . . . . . . . . . . . . . . 64
5.1 Transfer of PPIs from the source host (for ex: human) to another host, thetarget host (for example Arabidopsis), for the common pathogen, Salmonella. 69
5.2 Approach-1 (a) Ortholog based protein interaction inference. ‘S1’ repre-sents a Salmonella protein and S2 is the homolog of S1 or S1 itself. H rep-resents a human protein and A represents an Arabidopsis protein that is anortholog of the human protein. . . . . . . . . . . . . . . . . . . . . . . . . . 70
5.3 Approach-1(b) Graph based interaction transfer. The big circles show thetwo protein complexes found to be enriched by Network Blast : the Ara-bidopsis protein complex on the left, and the human protein complex onthe right. The edges within a protein complex are the PPIs within the hostorganism. The edges connecting the two protein complexes (i.e the twocircles) are the homology edges. The solid line connecting sipA with a hu-man protein node is a bootstrap interaction. We use this to infer the newplant-Salmonella interaction indicated by the dotted line. . . . . . . . . . . 72
8

5.4 Transductive Support Vector Machine (SVM) for transfer learning. Thefirst panel shows the conventional SVM classifier. The second panel showsT-SVM with circles representing unlabeled examples. We use examplesfrom the target task i.e Arabidopsis-Salmonella protein pairs as the unlabeledexamples to influence the classifier boundary. . . . . . . . . . . . . . . . . . 74
5.5 Overlap amongst the novel PPI predictions from each approach. All pre-dictions from the homology based approach and the T-SVM are shown.For the KMM-SVM method, we filter the predictions using a threshold of0.7 on the interaction probability reported by the classifier. We picked thisthreshold based on the interaction probabilities reported on the known in-teractions. . . . . . . . . . . . . . . . . . . . . . . . . . . . . . . . . . . . . . 80
6.1 Part of a sentence from FrameNet full-text annotation. 3 frames and theirarguments are shown: DESIRING is evoked by want, ACTIVITY FINISH byfinish, and HOLDING OFF ON by hold off. Thin horizontal lines representingargument spans are labeled with role names. (Not shown: July and Augustevoke CALENDRIC UNIT and fill its Unit role.) . . . . . . . . . . . . . . . . 88
6.2 A PropBank-annotated sentence from OntoNotes [Hovy et al., 2006]. ThePB lexicon defines rolesets (verb sense–specific frames) and their core roles:e.g., finish-v-01 ‘cause to stop’, A0 ‘intentional agent’, A1 ‘thing finish-ing’, and A2 ‘explicit instrument, thing finished with’. (finish-v-03,by contrast, means ‘apply a finish, as to wood’.) Clear similarities to theFrameNet annotations in figure 6.1 are evident, though PB uses lexicalframes rather than deep frames and makes some different decisions aboutroles (e.g., want-v-01 has no analogue to Focal participant). . . . . . . . 89
6.3 Frequency of each role appearing in the test set. . . . . . . . . . . . . . . . 946.4 F1 for each role appearing in the test set, ranked by frequency. F1 val-
ues have been smoothed with loess, with a smoothing parameter of 0.2.“Siblings” refers to hierarchy features. . . . . . . . . . . . . . . . . . . . . . 95
9

List of Tables
2.1 Feature Set: summary of the various categories of features and the numberof features in each category. h represents the host protein, and p representsthe pathogen protein in a given protein pair <p, h>. . . . . . . . . . . . . . 26
3.1 Characteristics of the datasets per task. Each task is human-X , where Xis the bacterial species (for brevity we only list the bacterial species in-volved). The number of bacterial proteins (size of proteome), the numberof PPI and other statistics are shown. . . . . . . . . . . . . . . . . . . . . . . 33
3.2 Features per task. Each task is human-X PPI, where X is the bacterialspecies (for brevity we only list the bacterial species involved). The detailsof each feature type are in §2.3. . . . . . . . . . . . . . . . . . . . . . . . . . 33
3.3 Conserved interactions in the form of interologs across the various host-bacterial datasets. H-X: stands for human-pathogen where the pathogen‘X’ can be B, F, Y and S referring to B. anthracis, F. tularensis, Y. pestis and S.typhi. respectively. The non-zero entry ‘2’ for ‘H-B vs H-F’ means there aretwo PPIs in the H-B dataset that have interologs in the H-F dataset. . . . . 35
3.4 Averaged 10 fold cross-validation performance for all methods for a pos-itive:negative class ratio of 1:100. Accuracy is reported as the F1 measurecomputed on the positive class. The standard deviation over the 10 foldsis also reported. . . . . . . . . . . . . . . . . . . . . . . . . . . . . . . . . . . 42
3.5 F1 computed during 10 fold cross-validation of various pairwise modelsfrom MTPL. Positive : negative class ratio was 1:100. The best F1 achievedfor each task (i.e for each bacterial species) is shown in bold. For example,B. anthracis has the best performance of 32 when it is coupled with S. typhi. 44
3.6 The 17 commonly enriched pathways in the predicted interactions fromMTPL. . . . . . . . . . . . . . . . . . . . . . . . . . . . . . . . . . . . . . . . 47
3.7 Performance on four tasks. Averaged F-score from a 10 fold cross-validation.The standard deviation over the 10 folds is also reported. . . . . . . . . . . 48
3.8 Averaged 10 fold cross-validation performance for all methods for a pos-itive:negative class ratio of 1:100. Accuracy is reported as the F1 measurecomputed on the positive class. The standard deviation over the 10 foldsis also reported. . . . . . . . . . . . . . . . . . . . . . . . . . . . . . . . . . . 48
3.9 The number of positives retrieved by each method in their top predictions. 51
4.1 Tasks and their sizes. Each column corresponds to one bipartite graph be-tween human proteins and the pathogen indicated in the column header.All pathogens are single stranded RNA viruses. Row 4 shows that each ofour graphs is extremely sparse. . . . . . . . . . . . . . . . . . . . . . . . . . 54
10

4.2 Area Under the Precision-Recall curve for each task in the two settings. X%training indicates the fraction of the labeled data used for training and tun-ing the model with the rest (100-X)% used as test data. We report the aver-age AUC-PR over 10 random train-test splits (stratified splits that maintainthe class-skew of 1:100). The standard deviation is also shown. The per-formance of the best baseline and the overall best method (BSL-MTL) ishighlighted in bold. . . . . . . . . . . . . . . . . . . . . . . . . . . . . . . . . 62
5.1 Datasets used in the various approaches, their sizes and the appropriatecitations . . . . . . . . . . . . . . . . . . . . . . . . . . . . . . . . . . . . . . 70
5.2 Performance of the machine learning based methods on various transfersettings. We compare them with a simple baseline: inductive kernel-SVM.We report precision (P), recall (R) and f-score (F1). The data that was usedto build each of the models is shown in the first column. The second col-umn shows the target task – the data on which we evaluate the model. Thenumbers in bold font indicate the highest performance in that column (i.efor that metric). . . . . . . . . . . . . . . . . . . . . . . . . . . . . . . . . . . 78
5.3 List of all enriched GO terms obtained by applying enrichment analysistool FuncAssociate (Berriz et al. [2003]) on the set of highly targeted Ara-bidopsis proteins (i.e Arabidopsis proteins predicted to interact with at least3 Salmonella effectors). The shown terms had a p-value less than 0.001. . . 83
5.4 Table 5.3 continued from above ... . . . . . . . . . . . . . . . . . . . . . . . . 845.5 GO terms that were enriched in the most targetted Arabidopsis proteins in
our predictions. To get this list, we performed a GO enrichment analy-sis using the FuncAssociate [Berriz et al., 2003]. We then procure the setof Arabidopsis genes which correspond to the enriched GO terms; i.e GOterms with a p-value of < 0.001. We further filter this set to include onlythose Arabidopsis genes predicted to interact with at least 3 Salmonella ef-fector proteins. In this table, we show around 20 such Arabidopsis genesfor the lack of space. The remaining are available via the download link. . 85
6.1 Characteristics of the training and test data. (These statistics exclude thedevelopment set, which contains 4,463 frames over 746 sentences.) . . . . 90
6.2 Argument identification results on the full-text test set. Model size is inmillions of features. . . . . . . . . . . . . . . . . . . . . . . . . . . . . . . . 94
11


Chapter 1
Introduction
Humans acquire knowledge and skills by categorizing the various problems/tasksencountered, recognizing how the tasks are related to each other and taking advan-tage of this organization when learning a new task. For instance, a person that knowshow to drive a car will use that knowledge while learning to drive a truck obviatingthe need to learn every aspect of driving from scratch. Often, learning a new taskcan result in improvements in the ability to perform other tasks learned in the past.By transferring knowledge across related learning tasks, a learner can become “moreexperienced” and generalize better [Thrun, 1996].
Statistical machine learning methods can also benefit from exploiting such simi-larities in the learning problems. There are several benefits of borrowing from relatedtasks, beyond the ability to generalize. In many supervised learning applications themain bottleneck is insufficient labeled data (i.e annotations) to learn a good model.Labeled data typically comes from manual annotation, surveys, experiments mea-suring physical quantities such as temperatures, pressures, biological properties etc.These data collection efforts are often very expensive and time consuming (especiallythose requiring experiments). In such scenarios, labeled data available in other re-lated problems can be tapped into. Such opportunities for sharing knowledge arisein several problems.
Consider the problem of web-page classification, where the goal is to automati-cally classify a given web-page into one (or more) of several categories 1: ‘clothing’,‘movie’, ‘music’, ‘soccer’, ‘business’, ‘product’ etc. Building good supervised classi-fiers requires a large number of training examples for each category – i.e labels as-signed to web-pages manually by human annotators. Given the large number of pos-sible categories, manual annotation will be a herculean effort, that is very expensiveand time-consuming. However, we know that certain categories are related, for in-stance: webpages labeled ‘soccer’ and ‘basketball’ will both have sports related terms(“team”, “player”, “win” etc). The task of classifying ‘soccer’ webpages is thus simi-lar to that of classifying ‘basketball’ webpages. If we can couple these tasks, very fewlabeled examples would be sufficient to obtain good classifiers for both.
The term Multitask Learning (MTL) was coined by Caruana [1997] to refer tolearning methods and algorithms that can share information among related tasksand help to perform those tasks together more efficiently than in isolation. The con-ventional machine learning approach of learning each task independently, oblivious
1The DMOZ directory has a list of 1,017,500 different categories of web-pages
13

to other related tasks is often called Single task learning (STL) or independent tasklearning. Some more examples of ‘multitask’ settings are:
1. Modeling users’ preferences for movies (i.e the ‘Netflix’ problem). Here, a taskis predicting one user’s ratings; often there are very few (or no) ratings availablefor most users. Yet, the ways different people make decisions about movies isrelated as there will be common patterns in their interests.
2. Task similarities also arise while studying the biology of organisms. The theoryof evolution tells us that many organisms have evolved from the same ancestorspecies; this causes them to exhibit some common characteristics. An exampleof such a shared characteristic is: the splice sites (i.e gene boundaries) in DNAsequences have similar properties across related organisms. Here, the biolog-ical phenomenon being studied: ‘detecting DNA splice sites in an organism’ isa ‘task’. Widmer et al. [2010] use genome sequence data from 15 eukaryoticorganisms (i.e 15 tasks) to build a multitask model and show that one can in-deed significantly improve the splice-site prediction performance compared totraditional approaches that look at individual organisms.
A very related problem called Transfer learning (TL) involves extracting knowl-edge from one or more source tasks and transferring it to a target task. In contrastto multi-task learning, where all tasks are learned simultaneously, transfer learningcares most about building a good model on the target task. The roles of the source andtarget tasks are not symmetric in transfer learning. The NIPS workshop on “Learn-ing to Learn” 2 was one of the first to focus on the need for lifelong machine learn-ing methods that retain and reuse previously learned knowledge. Published litera-ture exploring this general idea has used different terms, such as ‘life-long learning’[Thrun, 1996], ‘inductive transfer’ [Mitchell, 1980], ‘transductive learning’ [Vapnik,1998], ‘knowledge transfer’ to refer to slightly different manifestations of the sameproblem. Transfer learning is sometimes also called ‘domain adaptation’ in someresearch communities, and can be viewed as a more targeted version of multitasklearning.
What kind of information can be shared between tasks?
At a high level, the following are some possibilities:
• The features found to be relevant for learning one task can be used to learn an-other task
• The model parameters learned for a task can serve as a prior for other tasks (inthe ‘transfer’ learning setting)
• Task parameters can lie close to each other in some geometric sense
• The structure of the underlying statistical model, such as: dependencies be-tween the variables, the probability distribution of the model’s parameters canbe shared by several tasks
2http://socrates.acadiau.ca/courses/comp/dsilver/NIPS95 LTL/nips95.workshop.pdf
14

How is information shared between tasks?
Any MTL method has two main objectives: to minimize the training error (i.e empir-ical risk minimization) and to enforce task relatedness. While some methods achievethis in a pipeline fashion, where independent models are learned for tasks and thenthe task structure is enforced as a post-processing step (possibly followed by moremodel estimation steps), most recent methods perform this jointly. The task struc-ture is enforced/learned along with parameter estimation. Objective functions whichexpress this have the following general form, where θt is the set of parameters corre-sponding to the task t:
minθ1,...θt
∑t∈all tasks
lt + λ Ω(θ1, . . . θt)
The term lt can represent a loss function such as least squared error. Ω is the mech-anism by which the tasks are coupled together and is sometimes called a ‘task reg-ularizer’ because it introduces a bias that favours models with a certain structure.The parameter λ controls the extent to which the multitask structure is enforced. Ina bayesian setting, the objective function will involve the negative log likelihood de-rived for a probabilistic model that explains how the tasks are related to each other.A simple example of a function Ω that couples two tasks is:
Ω(θ1, θ2) = ‖θ1 − θ2‖ (1.1)
Here we are encoding the knowledge that the models corresponding to the two taskshave similar parameters. From the perspective of each task t, this term is boundingthe variance of the task parameters θt.
Focus of this thesis
The overarching goal of this thesis is to discover the underlying multitask models thatcan best explain the observed relationships between real-world tasks. We find how task-relationships in real-world problems can be connected to mathematical models of thedata that manifest similar relationships. We focus on the following two very distinctproblems:
• Modeling molecular mechanisms of infectious diseases: Infectious diseases are causedby pathogens such as bacteria and viruses. At the molecular level, pathogenesisinvolves the pathogen introducing its’ proteins into the host cells, where theyinteract with the host’s proteins thereby enabling the pathogen to obtain nutri-ents, replicate and survive inside the host. These ‘molecular mechanisms usedby a pathogen’ i.e host-pathogen protein interactions represent a task, and thereis one task per pathogen. Though the microbial world is very diverse, we findthat the infection mechanisms employed by different pathogens share some as-pects: (1) they have similar proteins, by virtue of their common ancestors (2)they infect similar biological processes in their hosts. These biological similari-ties allow us to define task relationships which are then used to learn the tasksjointly. This challenging domain is the central focus of this thesis.
• Semantic understanding of natural language text: Semantic parsing is a problem innatural language processing where the objective is inferring the meaning of a
15

sentence. For instance, the sentence John stole a car indicates that ‘John’ is aThief, who stole the Property: ‘car’. The verb ‘stole’ is the relation or actionconnecting the two entities ‘thief’ and ‘property’. The same meaning can be rep-resented in different forms: we could say ‘John’ is a Perpetrator who stolethe Item: ‘car’. As a result of this, the various lexical resources that have beenbuilt for semantic parsing, use different representations though they capturesimilar semantics. Each resource differs in: the types of relations it focuses on,the text corpus that was annotated, the distribution of the entity types etc. Com-bining the information from all resources thus has obvious benefits in terms ofimproved coverage compared to what can be achieved with a single resource(due to its limited focus). We can consider a task to be: ‘semantic parsing us-ing one representation’ and the different tasks (one task per representation) arerelated via the shared semantics that they encode.
We build several multitask and transfer learning models for the first problem. Forsemantic parsing, we develop transfer learning (domain adaptation) based models.The key contributions of this thesis are:
1. The methods in this thesis are one of the first to combine host-pathogen proteininteractions data across several pathogens and hosts
2. Our multitask learning model for host-bacterial interactions involves a noveltask regularizer that incorporates the biological hypothesis that: infection mech-anisms are similar across pathogens
3. For multitask graph completion, we develop a new model that learns a lowerdimensional representation of the data. Our model significantly outperformsmethods from prior work
4. The human-bacterial interaction models are the first ever models involving thesebacterial organisms
5. By combining data from multiple resources, we improve the state-of-the-art insemantic parsing
6. Unlike most prior work on modeling host pathogen interactions, our modelsare interpretable and lead us to interesting hypotheses and insights into theproblem
7. Our code and data is made publicly available
MTL and TL literature: methods
Early work on MTL used a hidden layer neural network with few nodes and a set ofnetwork weights shared by all the tasks [Caruana, 1997, Thrun and Pratt, 1998, Bax-ter, 2000]. Later methods were based on variance regularizers [Evgeniou and Pontil,2004, Maurer, 2006] which are based on assumptions similar to that of the simple reg-ularizer Ω from Equation 1.1. Other assumptions on task parameters are: that they liein a low dimensional subspace [Argyriou et al., 2008, Liu et al., 2009], or on a manifold[Agarwal et al., 2010]. Liu et al. [2009] use a `1,2 regularization over the parameter ma-trix (consisting of parameter vectors from all tasks). Ando and Zhang [2005] present
16

a framework for learning predictive functional structures from multiple tasks thatalso exploits unlabeled data. Jalali et al. [2010] propose a model for joint learning ofmultiple linear regression functions. They decompose the parameter matrix into twocomponents which are regularized independently via different norms.
Another widely studied approach for multi-task learning is the task clusteringapproach [Bakker and Heskes, 2003, Jacob et al., 2009, Kumar and Daume III, 2012].Its main idea is to group the tasks into several clusters and then learn similar datafeatures or model parameters for the tasks within each cluster. An advantage of thisapproach is its robustness against outlier tasks because they reside in separate clustersthat do not affect other tasks.
A number of MTL approaches are Bayesian, where a probability model capturingthe relations between the different tasks is estimated simultaneously with the mod-els’ parameters for each of the individual tasks. In [Allenby and Rossi, 1998, Bakkerand Heskes, 2003] a hierarchical Bayes model is estimated which assumes that theparameters of all tasks are sampled from an unknown Gaussian distribution. Taskrelatedness is captured by the Gaussian distribution: the smaller the variance of theGaussian the more related the tasks are. Bonilla et al. [2007] propose a Gaussian pro-cess based method to model and learn task relationships in the form of a task covari-ance matrix. Zhang and Schneider [2010] attempt to learn the full task covariancematrix and use it in learning of predictor functions by placing a matrix variate prioron the task parameter matrix.
Recent work [Maurer et al., 2013] on jointly learning features and models for mul-tiple tasks uses ideas from sparse coding and dictionary learning. They assume thatthe tasks parameters are well approximated by sparse linear combinations of theatoms of a dictionary. [Yuan et al., 2012] address the problem of visual classifica-tion via a multitask joint sparse representation model that combines multiple featuresand/or instances.
While the focus on MTL methods is often on task relationships, Transfer Learn-ing (TL) methods investigate what to transfer. The ability to transfer from the sourcetask(s) to the target task depends on how much the tasks differ and in what way.There has been a lot of theoretical work characterizing the distance between tasksand its relationship to the classification error on the target task [Ben-David et al., 2007,Crammer et al., 2008, Mansour et al., 2009, Ben-David et al., 2010]. The setting wherethere is a covariate shift (i.e distribution of the features changes) in the target taskhas seen a lot of work. Instance-based transfer learning methods have been proposedthat reweight the source instances to indicate their relevance for the target task [Fanet al., 2005, Huang et al., 2007, Sugiyama et al., 2008, Cortes et al., 2008]. Other waysin which the tasks can differ are: the distribution of the output (i.e labels) changes[Japkowicz and Stephen, 2002, Yu and Zhou, 2008], the conditional distribution (la-bels given features) changes [Jiang and Zhai, 2007]. More recent work has looked atcombinations of these settings [Zhang et al., 2013, Wang and Schneider, 2014].
On the applications front, approaches that transfer feature representations try tolearn a good feature representation for the target domain that encodes the knowl-edge to be transferred. Blitzer et al. [2006] proposed the structural correspondencelearning (SCL) algorithm, which extends Ando and Zhang [2005], to make use ofthe unlabeled data from the target domain to extract some relevant features that re-duce the distance between the tasks. Daume [2007] proposed a feature augmentationapproach, that learns task-specific weights, for NLP problems. Such feature augmen-
17
tation is now widely used in supervised domain adaptation scenarios. Uguroglu andCarbonell [2011] find the features that vary the most between the source and tar-get tasks (i.e differently distributed features) using a maximum mean discrepancybased method. This allows them to use invariant features for the target task. Wu andDietterich [2004] exploit the plentiful low quality source task data for image classi-fication problems, where the target task data is inadequate. Parameter-transfer ap-proaches [Schwaighofer et al., 2004, Raina et al., 2006, Bonilla et al., 2007] assume thatthe source tasks and the target tasks share some parameters or prior distributions ofthe hyperparameters of the models. The transferred knowledge is encoded into theseparameters and priors. The two popular regimes of transfer: parameter transfer andrepresentation transfer have been theoretically analyzed in recent work [Maurer et al.,2013], with Pentina and Lampert [2014] proposing PAC-style generalization boundsto analyze lifelong learning algorithms.
The recent developments in the field of deep learning are also relevant to multi-task learning: both deep learning and multi-task learning show that we can leverageauxiliary tasks to help solving a task of interest [Bottou, 2014]. There has been workon learning representations that benefit extraction from a variety of datasets [Bordeset al., 2012], representations that benefit a range of natural language processing tasks[Collobert et al., 2011]. Our work differs from these in that we do not learn repre-sentations but use and develop new features that work well in our problems, whichsuffer from data scarcity issues. Approaches from deep learning that have workedsuccessfully on real-world datasets have typically involved problems where there isplentiful data to efficiently learn these parameter-rich models with several layers andnon-linear functions.
The most recent and relevant prior work to the specific problems and approachesthat we consider, has been cited in the appropriate chapters.
Thesis map
We begin with an introduction to the concepts, challenges and approaches concerningthe problem of building models for infectious diseases. This problem forms the mainfocus of this thesis, and we cover the various aspects of computational prediction ofhost-pathogen interactions in Chapter §2. These key aspects are common to all themultitask and transfer learning approaches that we present in subsequent chapters.Chapter §3 presents the Multitask Pathway based learning approach, that combineshost-pathogen interactions data from several bacterial species using domain knowl-edge related to their infection mechanisms. In Chapter §4, a different perspective ofthis problem is presented that uses matrix decomposition based methods to share in-formation across various viruses. While the first two chapters use data coming fromthe host species: human, the next chapter §5 involves a new host species: the plantArabidopsis thaliana. This is a transfer learning setting, as we do not have any su-pervised data available for plant-pathogen interactions. We exploit interactions datafrom various hosts and pathogens to build a model for the target task involving theplant host. Continuing in this transfer theme, Chapter §6 presents a different applica-tion: semantic analysis of natural language text. Here, we present domain adaptationbased approaches to improve the semantic parsing on a target domain of interest.
We hope this brief introduction has provided a high level intuition of the contri-butions of this thesis and intrigued the reader’s curiosity to delve into the rest of the
18

material.
19


Chapter 2
Modeling infectious diseases viahost-pathogen protein interactions
The biological functions and processes in our body involve several types of moleculesand various interactions between them. Protein molecules are the workhorses that fa-cilitate most biological processes in a cell. And among the molecular interactions inour body, the majority and the most vital ones are the ones between proteins. Some ofthe early studies towards understanding protein-protein interactions focused on dis-covering interactions within single organisms such as yeast cells, human cells. Theinteraction maps from these studies gave us a glimpse into the biological processeswithin an organism pertaining to: cell growth, proliferation, tissue formation, diges-tion and nutrient uptake, reproduction, blood circulation etc.
However this knowledge only forms part of the picture concerning living organ-isms, because an important part of our sustenance depends on how we counter in-fectious diseases – those that are caused by external agents called pathogens. Infec-tious diseases are a major health concern worldwide, causing millions of illnesses anddeaths each year. Newly emerging viral diseases, such as swine H1N1 influenza, se-vere acute respiratory syndrome (SARS) and bacterial infections, such as the recurrentSalmonella and E. coli outbreaks not only lead to wide-spread loss of life and health,but also result in heavy economic losses.
Key to the infection process are host-pathogen interactions at the molecular level,where pathogen proteins physically bind with human proteins to manipulate impor-tant biological processes in the host cell, to evade the host’s immune response and tomultiply within the host. Comprehending protein interactions between host speciessuch as mammals and pathogen species such as viruses and bacteria, is thus crucial inorder to advance our understanding of pathogenesis. Laboratory based experimen-tal methods have emerged towards studying these interactions. The discovery of themolecular interactions between Herpesvirus and human cells [Uetz et al., 2006], pio-neered this field of cross-species interaction studies. These experimental studies canbe broadly categorized into small-scale or large-scale methods. Small-scale methodsare very time consuming but give very reliable results. Large-scale methods are moreefficient as they screen a large number of proteins, but they tend to have a high falsepositive rate.
• Small-scale methods: These refer to biochemical, biophysical and genetic exper-iments that involve a few proteins. Examples of small-scale methods are: co-
21

immunoprecipitation (co-IP), far-western blot analysis, pull-down assays, co-crystalization.
• Large-scale techniques: High-throughput screening methods which work withthe entire proteome of organisms, for example yeast two-hybrid (Y2H) assays.Affinity purification is another large-scale methods and is followed by massspectrometry, microarray analysis, western blot.
Databases like PHI-base, PIG, HPIDB, PHISTO aggregate host-pathogen proteininteractions from several small-scale and high throughput experiments via manualliterature curation. These databases are valuable sources of information for develop-ing models of the modus-operandi of pathogens.
2.1 Predicting host-pathogen PPIs
The most reliable experimental methods for studying protein-protein interactions(PPI) are often very time-consuming and expensive, making it hard to investigate theprohibitively large set of possible host-pathogen interactions – for example, the bac-terium Bacillus anthracis which causes anthrax has about 2321 proteins which whencoupled with the 25000 or so human proteins gives ≈60 million protein pairs to test,experimentally. Computational techniques complement laboratory-based methodsby predicting highly probable PPIs. These techniques use the known interactionsdata from previous experiments and predict the most plausible new interactions. Ex-perimental biologists use the highest-scoring interactions thus obtained and designexperiments to validate these and study them further. This helps in ruling out thevalidation of the vast majority of unlikely PPIs.
In particular, supervised machine learning based methods use the few experimentally-discovered interactions as training data and formulate the interaction prediction prob-lem in a classification setting, with target classes: “interacting” or “non-interacting”.Features are derived for each host-pathogen protein pair using various attributesof the two proteins such as: protein sequences from Uniprot [UniProt Consortium,2011], protein family from Pfam [Finn et al., 2010], protein structure and domainfrom PDB, gene ontology from GO database [Ashburner et al., 2000], gene expres-sion from GEO [Barrett et al., 2011], interactions between protein families from iPfam[Finn et al., 2005], protein domain interactions from 3DID [Stein et al., 2011], to namea few. The general outline of the supervised PPI prediction procedure is illustrated inFigure 2.1.
In this setting, some of the important challenges from the machine learning per-spective, that are generally encountered are:
1. Highly unbalanced classes since the set of “interacting” proteins is very small(for example, yeast has around 6000 proteins allowing for about 18 million po-tential interactions, but the estimated number of actual interactions is below100,000)
2. Absence of a clear “negative” class since there is no notion of provably “non-interacting” protein pairs
3. Missing values in the features where certain properties of the proteins are notavailable for various reasons.
22

Feature Genera*on
[f1, f2 . . . . fN]
Known interac4ons (training data)
Gene Ontology (GO) Gene Expression (GEO) Uniprot (sequence)
Training • Build model
Predic*on • For new protein pairs, generate features and apply model
f2
f1
f2
f1
x model
Figure 2.1: An example of a supervised classification method for predicting proteininteractions
4. Sparse datasets: interactions data available in several databases is very smallexcept for few well studied pathogens. For example: the PHI-base databasecovers 64 diseases but has only 1335 interactions, PIG covers only 12 pathogens.
2.2 Host-pathogen PPI datasets
Several data repositories like PHI-base [Winnenburg et al., 2008], PIG [Driscoll et al.,2009], HPIDB [Kumar and Nanduri, 2010], PHISTO [Tekir et al., 2012] aggregate host-pathogen protein interactions from several small-scale and high throughput experi-ments via manual literature curation. We use the PHISTO database for many of ourdatasets as it gives the UniprotKB protein ids for the interacting proteins. The otherdatabases do not always list the host protein involved in a PPI. In this thesis, we workwith nine different pathogens, five of which are bacterial species and the remainingare viruses. The genealogy of all bacterial species in PHISTO (version from 2012) isshown in Figure 2.2. We use four bacteria-human PPI datasets in our models (shownhighlighted).
2.3 Features for host-pathogen PPI prediction
The host-pathogen PPI prediction problem is cast as a two-class classification prob-lem: each protein pair x = <p, h> is an instance belonging to either the positive,‘interaction’ class or the negative, ‘non-interaction’ class. For each pair, we derivedfeatures which can belong to one of the three types: (a) feature derived on the pair x(b) features derived using either the host protein h or the pathogen protein p. Basedon the source of information, we can also categorize our feature set into the follow-ing groups: (1) GO similarity, (2) graph based features using the human interactome,(3) gene expression, (4) sequence-kmer features, (5) features from protein family andprotein domain interactions, (6) interolog based features.
1. Protein sequence k-mer (or n-gram) features: Since the sequence of a proteindetermines its structure and consequently its function, it may be possible to pre-dict PPIs using the amino acid sequence of a protein pair. Shen et al. [2007] in-
23

0 1 2 3 4 (logscale) 10 100 1000 M.arthriti
C.sordelli
C.difficil
C.botulinu
S.dysgalac
S.pyogenes
L.monocyto
B.anthraci
S.aureus
C.trachoma
N.meningit
V.cholerae
E.coliO157
E.coliK12
S.enterica
Y.pseudotu
Y.pestis
Y.enteroco
S.flexneri
L.pneumoph
M.catarrha
P.aerugino
F.tularens
H.pyloriJ9
C.jejuni
M. anthri*dis
C. difficile C. sordelli
S. aureus
S. dysgalac*ae
C. trachoma*s
V. cholerae N. meningi*dis
E. coli-‐O15 E. coli-‐K12
S. enterica
Y. enterocoli*ca Y. pes2s
L. pneumophila S. flexneri
P. aeruginosa
C. jejuni H. pylori-‐J9
B. anthracis
M. catarrhalis
L. monocytogenes
Y. pseudotubercu.
S. pyrogenes
C. botulinum
0
Number of PPIs in PHISTO
F. tularensis
Bacteria
Figure 2.2: Phylogenetic tree of all the bacterial species and the number of bacteria-human PPIs (log-scale) in PHISTO database for each bacteria. Highlighted bacterialspecies represent the PPI datasets that we use for our models in Chapter §3.
troduced the “conjoint triad model” for predicting PPIs using only amino acidsequences. They partitioned the twenty amino acids into seven classes basedon their electrostatic and hydrophobic properties. A protein’s amino acid se-quence is first transformed to a class-sequence (by replacing each amino acidby its class). For k=3, they count the number of times each distinct three-mer(set of three consecutive amino acids) occurred in the sequence. Since thereare 343 (73) possible three-mers (with an alphabet of size 7), the feature vectorcontaining the three-mer frequency counts will have 343 elements. To accountfor protein size, they normalized the counts by linearly transforming them tolie between 0 and 1. Thus the value of each feature in the feature vector is thenormalized count for each of the possible amino acid three-mers. We use two-,three-, four-, and five-mers. For each hostpathogen protein pair, we computethe k-mer features for the two individual proteins and then concatenate the twofeature vectors. Therefore, each hostpathogen protein pair had a feature vectorof length at most 98 (2 ∗ 72), 646, 4802, and 33614, in the cases of two-, three-,four-, and five-mers, respectively.
2. GO similarity features: These features model the similarity between the func-tional properties of two proteins. Gene Ontology [Ashburner et al., 2000] pro-vides GO-term annotations for three important protein properties: molecular
24

function (F), cellular component (C) and biological process (P). We derive 3types of features using these properties. For each of ’F’, ’C’ and ’P’, GO sim-ilarity features were separately defined that compute the similarity of GO termsfrom host and pathogen proteins. The similarity between two individual GOterms was computed using the G-Sesame algorithm [Du et al., 2009]. This fea-ture is a matrix of all the GO term combinations found in a given protein pair:< p, h >, the rows of the matrix represent GO terms from protein p and thecolumns represent GO terms from h.
3. Graph based features using the human interactome: These features are de-rived using only the host protein ‘h’ from the pair. Pathogens generally targethost proteins that are important in several host processes; these host proteinsinteract with many other host proteins to carry out their tasks. This insightis captured in the form of three graph properties: degree, between-ness central-ity and clustering coefficient of the host protein “node” in the host interactomegraph. When the host is human, the interactome was downloaded from HPRD[Prasad et al., 2009]. The degree of a node is the number of its neighbouringnodes in the graph. The clustering coefficient of a node ‘n’ is defined as: theratio of the number of edges present amongst n’s neighbors to the number ofall possible edges that could be present between the neighbours. Betweennesscentrality for a node ‘n’, is defined as the sum over all pairs of nodes (u, v), thefraction of shortest paths from u to v, that pass through n. Mathematically, it
is:∑
u,v∈V \n
shortest pathsn(u, v)
shortest paths(u, v). Intuitively, nodes that occur on many shortest
paths between other vertices have higher betweenness than those that do not.
4. Gene expression features: The intuition behind this feature is that genes thatare significantly differentially regulated upon being subject to Salmonella, aremore likely to be involved in the infection process, and thereby in interactionswith bacterial proteins. These features are derived using the gene of the hostprotein ‘h’ from the pair. We selected 3 transcriptomic datasets GDS77, GDS78,GDS80 from the GEO database [Barrett et al., 2011], which give the differentialgene expression of human genes infected by Salmonella, under 7 different controlconditions. The 3 datasets give us a total of 7 features: the dataset GDS77 hastwo samples representing two conditions and gave 2 features; datasets GDS78and GDS80 had time series gene expression with 3 and 2 control conditionsrespectively – the time series in each condition was averaged resulting in 3 and2 features, respectively. All datasets reported log-ratios and did not requirefurther normalization.
5. Features from PFam and protein domain interactions: Two pair-level featureswere computed using protein family interactions from the iPFam database [Finnet al., 2005] and protein domain interactions from 3DID database [Stein et al.,2011]. For a pair, the first feature counts how many of all the possible interac-tions between the PFam families of the two proteins are present in iPFam. Thesecond feature counts how many of the interactions between the domain sets ofa protein pair are present as domain-domain interactions in 3DID.
6. Interolog based features: This feature uses known interactions between pro-teins from other organisms to infer new interactions. It was derived using the
25

FEATURE NAME
(Count)DESCRIPTION
Gene Ontologya
(≈177 million)
Computed between GO terms of p and h. Let S = set of all GO terms,Sp = set of GO terms for protein ‘p’. We set the entries of S × Scorresponding to all pairs of GO terms from Sp × Sh to the similar-ity between the GO term pairs. Similarity between two individualGO-terms was computed using G-Sesame. Total number of features=|S| · |S|
Network-based(3)
Uses three graph properties of h in the human protein interaction net-work: (1) ‘degree’ = number of neighbours of h; (2) ‘clustering coeffi-cient’ = ratio of edges present amongst neighbours of h to all possibleedges between them; (3) ‘centrality’ = fraction of shortest paths in thenetwork that pass through h
Gene Expression(7)
Derived using the gene of the human protein h. Uses three GEOdatasets: GDS77, GDS78, GDS80 reporting differential gene expres-sion of human genes infected by Salmonella, under 7 different controlconditions.
Interologs (1) Number of protein pairs from other species that are interologs of thegiven pair <p, h>.
Sequence n-grams(39200)
Used the “conjoint triad model” [Shen et al., 2007] to get n-gram fea-tures on the protein sequence for n=2,3,4,5. The amino-acid sequenceis first converted to class-sequence and n-grams are computed sepa-rately for p and h and then concatenated to give a single feature vector(similar to [Dyer et al., 2011]) of size = 2(72 + 73 + 74 + 75).
Pfaminteractions (1)
Counts the fraction of all possible interactions between the Pfam fam-ilies of p and h, that are listed as known interactions in the iPfamdatabase [Finn et al., 2005]
Domaininteractions (1)
Similar to the above feature, computes the fraction of all possibledomain-domain interactions between p and h that are present in thedomain interactions database 3DID [Stein et al., 2011].
Table 2.1: Feature Set: summary of the various categories of features and the num-ber of features in each category. h represents the host protein, and p represents thepathogen protein in a given protein pair <p, h>.
asparse features, i.e only some of the millions of features are active in a single protein-pair
interologs information from the BIANA database [Garcia et al., 2010]. For agiven pair ‘x’, if ‘xhom’ a homologous protein pair involving any other organ-isms, BIANA uses the databases: BIND, DIP, IntAct to check if xhom is an inter-acting pair. If yes, then x is an inferred interacting pair. For every pair ‘x’, thisfeature counts the number of homologous protein pairs xhom that are interactingas per BIANA.
Table 2.1 shows a summary of the various features used in the predictive modelswe discuss in subsequent chapters.
26

2.4 The curse of missing negatives
Like many other problems in computational biology, PPI prediction suffers from the‘curse of missing negatives’ – i.e we only have access to the positives. Most machinelearning methods need a negative class (set of non-interactions) in order to identifythe special characteristics of the positives (i.e interactions). However, there is no ex-perimental evidence about proteins that do not interact, as it is difficult to design suchan experiment that will rule out an interaction under all control conditions. There doexist protein domains that are known to not interact with each other, due to theirconflicting tendencies to react with water (a hydrophobic domain is unlikely to comeinto contact with a hydrophyllic domain). Such negative interactions between proteindomains have been catalogued and assembled in databases such as Negatome Blohmet al. [2013]. Although, each protein has several different domains which makes ithard to use such domain-level information to infer non-interaction at the protein-level.
To construct the negative class, we use a technique commonly used in PPI pre-diction literature. A set of random pairs of proteins is sampled from the set of allpossible host-pathogen protein pairs, to serve as the negative class. The number ofrandom pairs is chosen based on what we expect the interaction ratio to be. We chosea ratio of 1:100 meaning that we expect 1 out of every 100 random host-pathogen pro-tein pairs to interact with each other. In general, there is no basis for choosing a moremeaningful ratio, as there are few known interactions. We rely on previous work onbetter studied organisms, where a ratio of 1:100 was used, based on the number ofknown interactions. Further, prior studies [Tastan et al., 2009, Dyer et al., 2007, 2011]also use a similar ratio. This random selection strategy is likely to introduce about1% false negatives into the training set, which is low enough to justify our choice ofthis heuristic. This ratio can be thought of as a parameter that can be changed as ourknowledge of the size and nature of the host-pathogen interactome improves.
The ratio, called class skew is an important factor in any machine learning method.The choice of this parameter determines the properties of the resultant model. A verybalanced class skew of 1:1 will result in a model that is over-predictive i.e has a veryhigh false positive rate when applied on the target task. On the other hand, a veryskewed setting of 1:1000 could give a lower false positive rate but is likely to havea poor recall as compared to models with lower class skews. This parameter thusoffers a trade-off between the precision and recall of the resultant model. Our choiceof a class ratio of 1:100 will result in a higher recall as compared to models trainedon higher class skews. It will however, have some false positives. From a statisticalperspective, a model trained with a high class skew such as 1:1000 will capture thedistribution of the negatives since they hugely outnumber the positives. Since thenegative class examples are not true negatives, the goodness of a model which de-pends mostly on noisy negatives is debatable. Computationally, the time required fortraining a model increases as we increase the number of examples. In the case of ahigh class skew such as 1:1000, there will be thousand times as many examples as thenumber of positives.
27

2.5 Evaluating PPI prediction methods
Our criteria to evaluate PPI prediction methods, do not use accuracy which measuresthe performance on both the classes. Since our datasets are highly imbalanced witha large number of negative samples1, a naıve classifier that always says “no” wouldstill have a very high accuracy. We instead use precision and recall computed on theinteracting pairs (positive class). These quantities are defined as follows:
Precision(P) =true positives
predicted positives
Recall(R) =true positives
total true positives in dataF-score = 2PR
P+R
We also report the area under the precision recall curve (AUC-PR). AUC-PR hasbeen shown to give a more informative picture of an algorithm’s performance thanROC curves in high class imbalance datasetsDavis and Goadrich [2006] such as ours.Note that the AUC-PR of a random classifier model on a dataset with class skew 1:100is ≈ 0.01.
2.6 Motivation for multitask approaches
For a given disease, very little is known about PPIs between the pathogen and hostproteins. However, such PPI data is available across many diseases, which leads usto ask the question: Can we model host-pathogen PPIs better by leveraging data acrossmultiple diseases? This is of particular interest for lesser known disease where the datais really scarce. Figure 2.2 illustrates this: while there are many bacteria with very fewPPIs, we notice that there are PPIs from other closely related bacteria which can beexploited. Combining information from many pathogens will also allow us to learnmodels that generalize better across disease by modeling global phenomena relatedto infection. Newly arising diseases where no data is available can also be modeled,thereby allowing us to derive important initial understanding about them.
1The positive:negative class ratio is 1:100
28

Chapter 3
Multi-Task Pathway-basedLearning (MTPL)
To integrate interactions from several tasks (i.e diseases), we propose a method [Kshir-sagar et al., 2013] that exploits the similarity in the infection process across the dis-eases. In particular, we use the biological hypothesis that similar pathogens target thesame critical biological processes in the host, in defining a common structure acrossthe tasks. In this work we consider host-pathogen PPI where the host is fixed and thepathogens are various bacterial species (see Figure 3.2(A)). The host organism thatwe consider is human and the bacterial species are: Yersinia pestis, Francisella tularen-sis, Salmonella typhimurium, Escherichia coli and Bacillus anthracis. Figure 3.1 lists theirvarious characteristics.
Some recent work on infectious diseases has alluded to the hypothesis that differ-ent pathogens target essentially the same critical biological processes in the human body. Theanalysis by Chen et al. [2012b] suggests that HIV infection shares common molecularmechanisms with certain signaling pathways and cancers. Dyer et al. [2008] studybacterial and viral interactions with human genes and find infection mechanismscommon to multiple pathogens. Jubelin et al. [2010] show how various bacterial cy-clomodulins target the host cell cycle. The study by Mukhtar et al. [2011a] on plantpathogens, in particular Arabidopsis concludes that pathogens from different king-doms deploy independently evolved virulence proteins that interact with a limitedset of highly connected cellular hubs to facilitate their diverse life cycle strategies.Figure 3.2(B) illustrates an example depicting the commonality in various bacterialspecies, where they are targetting the same biological pathways in their human host.
This biological hypothesis which we hence-forth call the commonality hypothesis isexploited here to jointly learn PPI models for multiple bacterial species. We trans-late the hypothesis into a prior that will bias the learned models. We use a multi-task learning based approach, where each ‘task’ represents the protein interactionsof one bacterial species with human. Our supervised learning based method jointlyoptimizes the prediction error over all tasks combined with a regularizer term thatcouples together all the tasks. The regularizer is a difference of histograms, with eachhistogram describing the distribution of host processes targeted by the various dis-eases. We use a convex concave procedure (CCCP) based algorithm to optimize thisnon-convex function. Our results indicate that introducing this ‘bias’ based on thebiologically-derived hypothesis results in better predictive models.
29

Bacteria Firmicutes Bacilli
Bacillales Bacillaceae
Bacillus anthracis Proteobacteria Gammaproteobacteria
Enterobacteriales Enterobacteriaceae
Escherichia Escherichia coli
Salmonella Salmonella enterica
Yersinia Yersinia pes8s
Thiotrichales Francisella tularensis
__
__
__
__
__
__
__ Salmonella typhimurium
(Posi%ve; Anthrax)
GramStain Diseases
caused
(Nega%ve; Gastroenteri%s)
(Nega%ve; Gastroenteri%s, Typhoid)
(Nega%ve; Bubonic plague)
(Nega%ve; Acute pneumonia)
Figure 3.1: Genealogy of the bacterial species (highlighted in blue), for which wedevelop PPI prediction models in this chapter. The gram stain and the diseases causedby each bacterial species are also shown in paranthesis.
3.1 Related work
Most of the prior work in PPI prediction has focused on building models separatelyfor individual organisms [Chen and Liu, 2005, Wu et al., 2006, Singh et al., 2006, Qiet al., 2006] or on building a model specific to a disease in the case of host-pathogenPPI prediction [Tastan et al., 2009, Qi et al., 2009, Dyer et al., 2007, Kshirsagar et al.,2012]. The use of PPI data from several organisms has predominantly been in theform of (1) features derived from various PPI datasets (2) use of common structuralproperties of proteins across organisms [Wang et al., 2007] or (3) methods that narrowdown predicted interactions in the organism of interest [Garcia et al., 2010]. Someof these methods use the concepts of “homologs”, “orthologs” and “interologs” todefine a similarity measure between PPIs from various organisms [Garcia et al., 2010].
There has been little work on combining PPI datasets with the goal of improv-ing prediction performance for multiple organisms. Qi et al. [2010] proposed a semi-supervised multi-task framework to predict PPIs from partially labeled reference sets.The basic idea is to perform multitask learning on a supervised classification taskand a semi-supervised auxiliary task via a regularization term. Another line of workin PPI prediction [Xu et al., 2010] uses the Collective Matrix Factorization (CMF)approach proposed by Singh and Gordon [2008]. The CMF method learns models
30

pathway-‐1
F. tularensis
Y. pes/s
B. anthracis
Human
pathway-‐2
pathway-‐3
Y. pes/s
F. tularensis
B. anthracis
Human
(A) (B)
S. typhi S. typhi
Figure 3.2: (A) Host-pathogen protein-protein interaction (PPI) prediction where thehost is human and the pathogens are bacteria. (B) An example depicting the com-monality in the bacterial attack of human proteins. Pathway-1 and pathway-3 (high-lighted) represent critical processes targeted by all bacterial species.
for multiple networks by simultaneously factorizing several adjacency matrices andsharing parameters amongst the factors. Xu et al. [2010] use these ideas in their trans-fer learning setting, where the source network is a relatively dense interaction net-work of proteins and the objective is to infer PPI edges in a relatively sparse targetnetwork. To compute similarities between the nodes in the source and target net-works, they use protein sequences and the topological structures of the interactionnetworks.
3.2 Approach
Multi-task learning is a family of machine learning methods that addresses the issueof building models using data from multiple problem domains (i.e ‘tasks’) by exploit-ing the similarity between them. The goal is to achieve performance benefits for allthe tasks involved. This paradigm of building joint models has been applied success-fully in many areas including text-mining, computer vision etc. Since bioinformaticsdatasets often represent an organism, a natural notion of a ‘task’ is an ‘organism’ – forexample, Widmer et al. [2010] use a multi-task learning approach for splice-site pre-diction across many organisms. They use phylogenetic trees to incorporate similaritybetween organisms (i.e tasks). For a survey of multi-task learning in computationalbiology, see Xu and Yang [2011].
Our multi-task learning method is based on the task regularization framework,which formulates the multi-task learning problem as an objective function with twoterms: an empirical loss term on the training data of all tasks, and a regularizationterm that encodes the relationships between tasks. Equation (3.1) shows the generalform of such an objective, the term R being the regularizer raised to the power p andwith a q-norm. Evgeniou and Pontil [2004] introduced a popular regularizer in this
31

framework that penalizes divergence of a task’s parameters from the mean parametercomputed over all tasks.
L =∑
i∈tasksLoss (taski) + λ ‖R‖pq (3.1)
We optimize this function by modifying the regularizer R to encode the biologicalhypothesis. Our approach differs greatly from prior work because we propose a tech-nique to translate a problem-relevant biological hypothesis into a task-regularizationbased approach rather than applying existing general formalisms on a dataset. Ourtasks try to capture a naturally occurring phenomenon. While our framework is de-veloped in the context of a specific hypothesis, we also illustrate the incorporation ofother hypotheses with an example. The key contributions of our work are:
• we present a novel way of combining experimental PPI data coming from sev-eral organisms
• we incorporate domain knowledge in designing a prior that causes the learnedmodels to exhibit the requisite common structure across the tasks
• to optimize the resulting non-convex objective function, we implement a con-cave convex procedure based method
3.3 Datasets and features
For S. typhi we used the list of 62 interacting protein pairs reported in Schleker et al.[2012], which were obtained by the authors by manual literature curation. Theseinteractions come from small-scale experiments. The other three PPI interactionsdatasets were obtained from the PHISTO database. Most of the reported interactionsfor these three bacterial species come from a single high-throughput experimentalstudy [Dyer et al., 2010]. While F. tularensis, S. typhi and Y. pestis are gram-negativegamma-protobacteria, B. anthracis is a gram-positive bacteria. The number of uniqueproteins in each bacterial species, the sizes of all datasets and the number of all pos-sible host-pathogen protein-pairs are listed in Table 3.1.Feature setFor each protein-pair, we compute features, some of which use both proteins in thepair, while others are based on either the host protein or the pathogen protein. The fol-lowing attributes of proteins were obtained from public databases: protein sequencesfrom Uniprot [UniProt Consortium, 2011], gene ontology from GO database [Ash-burner et al., 2000], gene expression from GEO [Barrett et al., 2011]. The featuresderived for each task (which we found to be useful) are listed in Table 3.2. In §2.3 wedescribe the features in detail.
Our features define a high dimensional and sparse space (the model size is listedin Table 3.1). Since our features are derived by integrating several databases, some ofwhich are not complete, there are many examples and features with missing values.In our current work we eliminate all examples with more than 10% missing features.For the rest we use mean-value based feature imputation. Handling missing dataeffectively is an important aspect of the PPI prediction problem, however it is not thefocus of this work. The remaining examples after elimination and imputation are alsoshown in Table 3.1.
32

Bacillus
anthracis
Francisella
tularensis
Yersinia
pestis
Salmonella
typhimuriumE. coli
Total no. of bacte-rial proteinsa 2321 1086 4600 3592 4003
No. of human-bacterial proteinpairsb
59.4 M 27.8 M 117.7 M 87.7 M 101 M
No. of known PPI 3073 1383 4059 62 32
No. of PPI with nomissing features 655 491 839 62 32
Size of trainingdata with 1:100class ratio
66155 49591 84739 6262 3232
Model size 694 k 469 k 886 k 349 k 128 k
Table 3.1: Characteristics of the datasets per task. Each task is human-X , where Xis the bacterial species (for brevity we only list the bacterial species involved). Thenumber of bacterial proteins (size of proteome), the number of PPI and other statisticsare shown.
aWe only consider the ‘reviewed’ proteins set from UniprotKBbNote: total no. of human proteins: 25596. ‘M’: million
TASK FEATURES USED
B. anthracis Protein sequence k-mers, Gene Ontology (GO) co-occurance fea-tures, Gene expression features, human PPI network features
F. tularensis Protein sequence k-mers, Gene Ontology (GO) co-occurance fea-tures, Gene expression features, human PPI network features
Y. pestis Protein sequence k-mers, Gene Ontology (GO) co-occurance fea-tures, Gene expression features, human PPI network features
S. typhimurium Protein sequence k-mers, Gene Ontology (GO) co-occurance fea-tures, Gene expression features, human PPI network features, In-terolog features, Domain interaction features, PFam interactionfeatures
E. coli Protein sequence k-mers, Gene Ontology (GO) co-occurance fea-tures, Gene expression features, human PPI network features
Table 3.2: Features per task. Each task is human-X PPI, where X is the bacterialspecies (for brevity we only list the bacterial species involved). The details of eachfeature type are in §2.3.
33

Negative class examples The interactions listed in the table form the positive class.Since there is no experimental evidence about proteins that do not interact, we con-struct the “non-interacting” (i.e negative) class using a technique commonly used inPPI prediction literature. Please refer to Section §2.4 for details.
Analysing the known interactions
We analyse the known host-pathogen interactions from our datasets. This analysisalso motivates our choice of a multi-task approach that uses a pathway-based simi-larity across tasks. The known PPIs are compared across datasets in two ways: (a)pathway enrichment and (b) presence of interologs.
(a) The human proteins involved in each interaction dataset are used to obtain thehuman pathways that are enriched. We use Fisher’s test (based on the hypergeomet-ric distribution) to compute the p-value of each pathway. We plot these p-values foreach pathway, and for each dataset in the form of a heat-map shown in Figure 3.3.The heatmap shows how there are several commonly enriched pathways across thedatasets (the black vertical lines spanning all 4 rows). It also shows the difference inthe enrichment for the S. typhi dataset which comes from small-scale PPI experiments.
Pathways
500 1000 1500 2000
B. anthracis
F. tularensis
Y. pestis
S. typhi
0
0.2
0.4
0.6
0.8
1
Figure 3.3: Heatmap showing pathways enriched in each bacterial-human PPI inter-actions dataset. The horizontal axis represents the pathways (about 2100 of them) andthe vertical axis represents the 4 datasets. Each entry in the heat-map represents the p-value of a pathway w.r.t one dataset. Darker values represent more enrichment. Theblack columns that span across all 4 rows show the commonly enriched pathways.
(b) We analyse the similarity between the PPIs from various datasets. A naturalway to determine similarity is to check if proteins known to interact in one datasethave homologous proteins that are also interacting in another dataset. Such pairs ofproteins, also called “interologs” are defined as a quadruple of proteins A,B,A′, B′,where A ↔ B (interaction) and A′ ↔ B′. Further, A, A′ are homologs and B, B′ arealso homologs. The number of such interologs existing between the four datasets isshown in Table 3.3. To compute homologs of a protein, we used BLASTP sequencealignment with an e-value cut off of 0.1. As evident from Table 3.3, there are veryfew interologs across the bacterial PPIs. None of the high-throughput datasets havean interolog in the small-scale S. typhi dataset. This seems to indicate that interolog-based approaches to compute task-similarity are not relevant here. The phenomenon
34
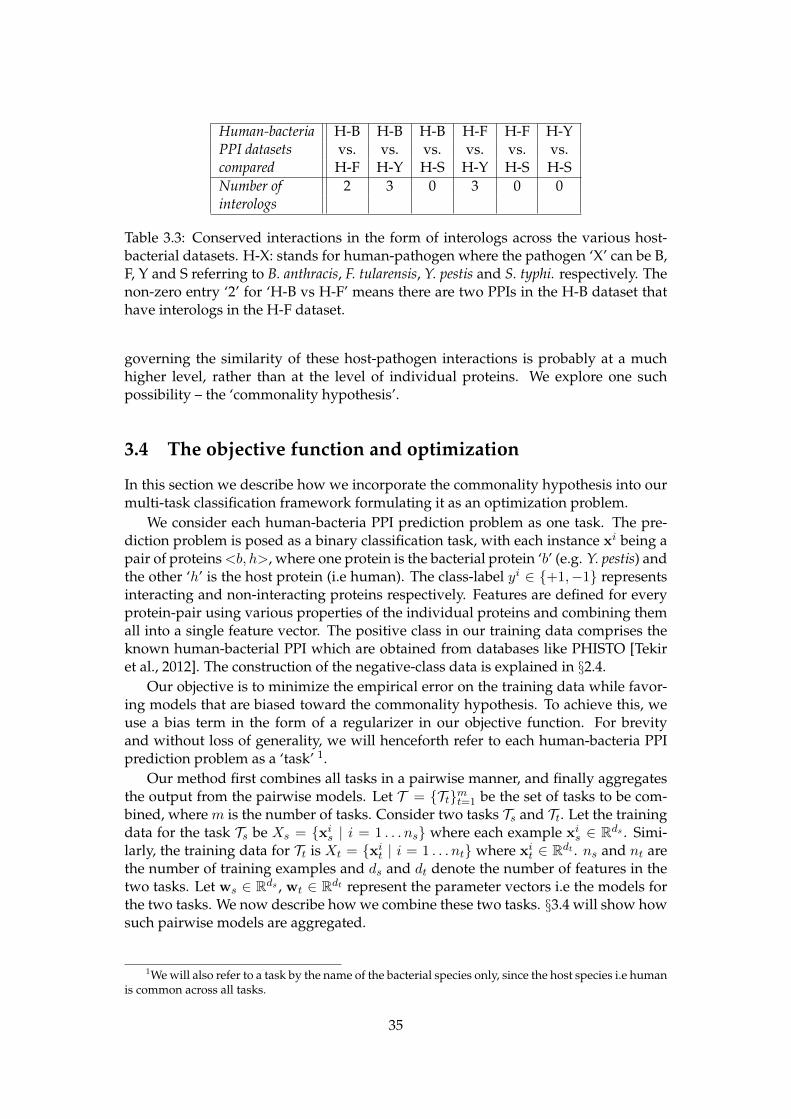
Human-bacteria H-B H-B H-B H-F H-F H-YPPI datasets vs. vs. vs. vs. vs. vs.compared H-F H-Y H-S H-Y H-S H-SNumber of 2 3 0 3 0 0interologs
Table 3.3: Conserved interactions in the form of interologs across the various host-bacterial datasets. H-X: stands for human-pathogen where the pathogen ‘X’ can be B,F, Y and S referring to B. anthracis, F. tularensis, Y. pestis and S. typhi. respectively. Thenon-zero entry ‘2’ for ‘H-B vs H-F’ means there are two PPIs in the H-B dataset thathave interologs in the H-F dataset.
governing the similarity of these host-pathogen interactions is probably at a muchhigher level, rather than at the level of individual proteins. We explore one suchpossibility – the ‘commonality hypothesis’.
3.4 The objective function and optimization
In this section we describe how we incorporate the commonality hypothesis into ourmulti-task classification framework formulating it as an optimization problem.
We consider each human-bacteria PPI prediction problem as one task. The pre-diction problem is posed as a binary classification task, with each instance xi being apair of proteins<b, h>, where one protein is the bacterial protein ‘b’ (e.g. Y. pestis) andthe other ‘h’ is the host protein (i.e human). The class-label yi ∈ +1,−1 representsinteracting and non-interacting proteins respectively. Features are defined for everyprotein-pair using various properties of the individual proteins and combining themall into a single feature vector. The positive class in our training data comprises theknown human-bacterial PPI which are obtained from databases like PHISTO [Tekiret al., 2012]. The construction of the negative-class data is explained in §2.4.
Our objective is to minimize the empirical error on the training data while favor-ing models that are biased toward the commonality hypothesis. To achieve this, weuse a bias term in the form of a regularizer in our objective function. For brevityand without loss of generality, we will henceforth refer to each human-bacteria PPIprediction problem as a ‘task’ 1.
Our method first combines all tasks in a pairwise manner, and finally aggregatesthe output from the pairwise models. Let T = Ttmt=1 be the set of tasks to be com-bined, where m is the number of tasks. Consider two tasks Ts and Tt. Let the trainingdata for the task Ts be Xs = xis | i = 1 . . . ns where each example xis ∈ Rds . Simi-larly, the training data for Tt is Xt = xit | i = 1 . . . nt where xit ∈ Rdt . ns and nt arethe number of training examples and ds and dt denote the number of features in thetwo tasks. Let ws ∈ Rds , wt ∈ Rdt represent the parameter vectors i.e the models forthe two tasks. We now describe how we combine these two tasks. §3.4 will show howsuch pairwise models are aggregated.
1We will also refer to a task by the name of the bacterial species only, since the host species i.e humanis common across all tasks.
35

Figure 3.4: Part of the “glucose transport pathway” in human. Grey nodes representthe human proteins (genes) involved. Edges represent causality in the process. Thispathway involves the transport of glucose from outside the cell to various compo-nents inside the cell.
The pathway-based objective : Biologists often represent the set of human proteinsinvolved in a particular biological process by a graph called a “biological pathway”.One such example, the “glucose transport pathway” in human is shown in Figure3.4. In order to use this pathway construct, we revise our hypothesis to: proteinsfrom different bacterial species are likely to interact with human proteins from thesame biological pathway. Figure 3.2(B) illustrates an example where this hypothesisholds. The pathway information for each human protein can be obtained from path-way databases like Reactome [Matthews et al., 2008] and PID [Schaefer et al., 2009].While pathways are generally represented as graphs, for our current work we do notuse the edges. We treat a pathway as a set of proteins – a human protein h can be amember of several pathways depending on the biological processes it is involved in.
Let N be the total number of pathways in human. For a protein-pair i = <b, h>,let pi ∈ 0, 1N be the binary ‘pathway vector’ indicating the pathway membershipof h.
The commonality hypothesis suggests that the pathway memberships of humanproteins from interactions should be similar across tasks. We define a pathway-summary function S, which aggregates all pathway vectors for a given task Ts. Sinceour hypothesis is about interactions, we only consider pathway vectors of positive ex-amples. Let X+
s , X+t represent the set of positive examples from tasks Ts and Tt; let n+
s,n+t be their sizes. In Figure 3.5 we depict the aggregation done by S. Mathematically,
we have
S(Ts) =1
n+s
∑i∈X+
s
pis Ipos(wᵀsx
is) (3.2)
where pis is the pathway vector for example i, and Ipos(z) = I(z > 0). S sums upthe pathway vectors of examples predicted to be positive. We normalize using n+
s tocompensate for the different dataset sizes across tasks.
Let Ps = pis | i = 1 . . . n+s be a matrix containing all pathway vectors for positive
examples from task Ts. Analogously, Pt ∈ 0, 1N×n+t is a matrix for the positive ex-
amples from task Tt. Matrices Ps and Pt are constant matrices and are known apriori.Let S(Ts) and S(Tt) be the pathway summaries of the tasks. We want to penalize thedissimilarity between these summaries. Our objective function thus has the following
36

general form:
L(ws,wt) = l(ws) + l(wt) + λ ‖R‖22 + σ (‖ws‖22 + ‖wt‖22)
where R = S(Ts)− S(Tt).(3.3)
Here l(ws) and l(wt) can be any convex loss functions computed over the two tasks.We use logistic loss in our work based on prior experience with PPI datasets. Thelast two `2 norms over the parameter vectors ws and wt control over-fitting. Theparameters λ and σ take positive values.
.
.
.
.
.
1 0 1 1 0 0 0
1 1 0 0 0 1 0
P
.
.
.
.
Set of predicted interac/ons from given input X
Σ
S (T1 ) = 0
10
20
30
40
1 2 3 4 5 6 7
X +
pi
p1
.
.
.
.
pathway vectors for each example
summary func/on
pathways
Figure 3.5: A schematic illustrating the pathway summarizing function S for a taskT1. On the left are the examples from the input predicted to be positive, indicated byX+. The matrix P has the pathway vectors for each example in X+. The summaryfunction aggregates the pathway vectors to get the distribution.
The indicator function Ipos is non-differentiable. So we approximate Ipos with theexponential function which is a convex upper bound of the indicator function andwill make optimization easier. Let φ(z) = ez/C , where C is a positive constant. Thisfunction, for various values of C has been plot in Figure 3.6. Small positive values ofz = wᵀxi indicate positive-class predictions that are closer to the decision boundaryof the classifier. Examples predicted to be positive with a high confidence have a largez. With varying values of C, the function φ gives varying importance to predictionsbased on their classifier confidence ‘z’. Negative values of z which correspond toexamples predicted to be negative, are given close to zero importance by φ. The choiceof an appropriateC is important so as to ensure the proper behaviour of the summaryfunction S. A steeply increasing curve (C=1) is undesirable as it will assign too muchweight to the summary from those examples. We chose a moderate value of C=30 forour experiments.
Replacing Ipos by φ in equation 3.2, our summary function S becomes:
S(Ts) =1
n+s
∑i∈X+
s
pis φ(wᵀsx
is) (3.4)
Putting everything together in equation 3.3, our objective with the logistic loss
37

0 50 100
0
5
10
15
z
ez/C
C = 10
C = 30
C = 50
C = 80
Ipos
Figure 3.6: The exponential function ez/C for different values of C.
terms, the pathway summary function and the `2 regularizer terms has the form:
L(ws,wt) =
ns∑i=1
log (1 + e−wᵀsx
isy
is) +
nt∑j=1
log (1 + e−wᵀt x
jty
jt ) +
λ
∥∥∥∥∥∥ 1
n+s
∑i∈X+
s
pis φ(wᵀsx
is)−
1
n+t
∑j∈X+
t
pjt φ(wᵀt x
jt )
∥∥∥∥∥∥2
2
+R`2(ws,wt)
(3.5)
where R`2(ws,wt) = σ (‖ws‖22 + ‖wt‖22)
Solving the optimization problem
The objective in equation (3.5) is non-convex, and with some algebraic simplificationswe can reduce it to a difference of convex functions (DC). To optimize this function,we implement the CCCP (Concave Convex procedure) algorithm which was origi-nally introduced by Yuille and Rangarajan [2003]. We tried to optimize it directlyusing L-BFGS, but found that the objective does not decrease consistently.
Below, we show the reduction to difference of convex functions. The first two log-loss terms (we abbreviate them henceforth as `(ws,wt)) and the last R`2 term are allconvex and do not pose any problem with optimization.
Proposition 1. The objective (3.5) is a difference of convex functions.
L(ws,wt) = F (ws,wt)−G(ws,wt) (3.6)
Proof. Expanding the pathway vectors pis and pjt and rewriting equation (3.5) we get:
L = `(ws,wt) +R`2(ws,wt) + λN∑k=1
(1
n+s
∑i∈X+
s
pkis φ(wᵀsx
is)−
1
n+t
∑j∈X+
t
pkjt φ(wᵀt x
jt )
)2
L = `(ws,wt) +R`2(ws,wt) + λ
N∑k=1
(fk − gk)2, where
fk =1
n+s
∑i∈X+
s
pkis φ(wᵀsx
is) and gk =
1
n+t
∑j∈X+
t
pkjt φ(wᵀt x
jt ).
(3.7)Note that fk and gk are non-negative convex functions. This follows because: φ(z) =ez/C is a positive convex function and the matrices Ps and Pt are non-negative by
38

construction. fk and gk are both thus positive linear combinations of convex functionsand hence convex. We now decompose the squared term in equation (3.7) as follows.
N∑k=1
(fk − gk)2 =N∑k=1
2(f2k + g2
k)−N∑k=1
(fk + gk)2 (3.8)
We further observe that f2k is convex. To derive this, we use the following propo-
sition: a composition of a monotonically increasing convex function and a convexfunction is still convex. The square function h(z) = z2 is a monotonically increasingfunction for z ≥ 0, thus the composition with fk (i.e h(fk)) is also convex by the pos-itivity of fk. Analogously, g2
k is also convex. Further, (fk + gk)2 is also convex by the
same argument. Substituting (3.8) back into equation (3.7) we get our result.
L =
[`(ws,wt) +R`2(ws,wt) + λ
N∑k=1
2(f2k + g2
k)
]−[λ
N∑k=1
(fk + gk)2
]L = F (ws,wt)−G(ws,wt)
(3.9)
To optimize this function, we use a CCCP (Concave Convex procedure) algorithm[Yuille and Rangarajan, 2003], similar to the approach from Yu and Joachims [2009]used for learning structural SVMs. The idea is to compute a local upper bound onthe concave function (−G) and instead of optimizing L from equation (4) directly, usean approximation based on the upper bound of −G. Equation (7) shows this func-tion Lapprox. Let w represent the concatenation of the two parameter vectors ws andwt. Let wk be the k-th iterate. We have from Taylor’s first order approximation that−G(w) ≤ −G(wk) + (w − wk)ᵀ∇G for all w. This allows us to obtain the follow-ing approximation which we get by substituting the above bound in place of −G inequation (3.6):
minw
Lapprox(w) = minw
[F (w)−G(wk) + (w −wk)ᵀ∇G
]= min
w
[F (w) + wᵀ∇G
], (3.10)
since wk is a constant. The optimization problem in equation (3.10) is now convexand can be solved using conventional techniques like L-BFGS, conjugate gradient etc.The outline of our CCCP based procedure is shown in Listing 1.
Yuille and Rangarajan [2003] show that such a CCCP based algorithm is guaran-teed to decrease the objective function at every iteration and to converge to a localminimum or saddle point. We observe a similar behaviour in our experiments. Com-putationally, this algorithm is efficient since the regularizer works on a subset of thedata - only the positive examples which are a small fraction of the complete trainingdata.
Stopping criteria: The convergence criterion for algorithm 1 is: δ < τ , where τ isa threshold. We used τ = 1 in our experiments. Smaller values required a verylong time to convergence. The inner optimization (line # 5) which uses L-BFGS hada convergence threshold of 0.0001. This step took more iterations initially and feweriterations getting closer to convergence.
39

Algorithm 1: CCCP procedure1: Initialize w = w0
2: repeat3: Compute∇G using wk
4: Compute current value Lapprox5: Solve wk+1 = argmin
w
[F (w) + wᵀ∇G
]6: Set k = k + 17: Compute new value L
′approx
8: δ = Lapprox − L′approx
9: until δ < τ
Combining pairwise models
In the previous sections, we described how we combine two tasks. In particular,equation (3.5) involves pairwise learning which results in two models ws and wt.Since our current framework can combine only two tasks at a time, for m tasks weperform
(m2
)pairwise learning experiments and then combine their outputs. Each
task will thus have m−1 models as a result of pairing up with each of the other tasks.Let the set of models for task Ts beMs = ws1 ,ws2 . . .wsm−1. We treatMs as an
ensemble of models for this task and aggregate the output labels from all models toget the final labels on the test data. Let the output labels from each model for a giventest instance x be Ox = o1, o2 . . . om−1. Then the final output label y is computed bytaking a vote and checking if it crosses a threshold:
y =
1 if
(∑ojI(oj = 1)
)≥ v
−1 otherwise(3.11)
where v is a vote-threshold that should be crossed in order for the label to be positive.In our experiments, we found that the predictions for Ts from all models inMs over-lapped greatly. Hence we used v = 1 which implies that x is an interaction if any oneof our 4 tasks labels it as such.
3.5 Experiments
We use 10 fold cross-validation (CV) to evaluate the Precision, Recall and F-score ofall algorithms (refer to §2.5). The baselines that we compare against are briefly de-scribed below.
Single Task Learning (STL): We train models independently on each task using twostandard classifiers: Support Vector Machines and Logistic regression with `1 and `2regularization. We used LibLinear [Fan et al., 2008] for these experiments and foundthat logistic regression with `1 regularization performs the best across all tasks. Forconciseness, we report only the best model’s performance.
STL with pathway features (STL Path.): This baseline incorporates the pathway in-formation from the pathway vectors pi as features. For each example i, the featurevector is appended by the pathway vector pi. While our method uses the pathway
40

vectors only for the positive class examples (via the matrices Ps and Pt), this baselineuses the pathway information for all examples via features. The performance of thisbaseline will indicate whether using raw pathway information without incorporatingany biologically relevant coupling does well. We learn independent models for eachtask as before, and find that logistic regression with `1 regularization does the best(only these results are reported).
Coupled models: This baseline was implemented so as to couple the regularizer pa-rameter across two tasks thereby keeping the basic framework similar to that in ourtechnique. To achieve this we optimize the function in equation (3.12) and use theL-BFGS implementation from Mallet. Note that the previous baseline has separateregularization parameters for each task.
L =
ns∑i=1
log (1 + e−wᵀsx
isy
is) +
nt∑j=1
log (1 + e−wᵀt x
jty
jt ) + σ(‖ws‖22 + ‖wt‖22) (3.12)
Mean MTL: This is a logistic regression-based implementation of the multi-task SVMmodel proposed by Evgeniou and Pontil [2004]. The important feature of this work isthe use of a regularizer that penalizes the difference between a model and the “mean”model formed by averaging over models from all m tasks. In the original paper, theloss functions l(wi) were all hinge-loss. Since we find that logistic-regression doesbetter on our datasets, we replaced the original hinge loss function by logistic loss.The objective we use is shown in equation (3.13).
L =m∑i=1
l(wi) + λm∑i=1
∥∥∥∥∥∥wi −1
m
∑j
wj
∥∥∥∥∥∥2
2
+ σm∑i=1
‖wi‖22 (3.13)
L1/L2 regularization: Another way to combine tasks using their common features isby minimizing the `1/`2 norm over the feature matrix W = [w1 . . .wm]. The sparsityconstraints due to the `1 norm decouples the rows of W allowing the selection of asubset of the features to regress upon. The `2 norm couples together the columns (i.ethe wis), as a consequence of which coefficients for a particular feature jointly remainnon-zero across all m tasks.
L =m∑i=1
l(wi) + λ ‖W‖`1/`2 (3.14)
where W = (wij) with 1≤i≤d, 1≤j≤m. The rows represent the d common featuresacross all tasks. The columns representing the m task-specific parameter vectors wi.
The term ‖W‖`1/`2 =
d∑i=1
‖~wi.‖2 is the block `1/`2 norm. The regularization parame-
ter λ controls the enforcement of the `1/`2 group-structure. The parameter range thatgave the best performance on the held-out data was [10−4, 10−7]. This was used tocompute the performance on the test data.
Multi-task pathway based learning (MTPL): This refers to our technique, whichminimizes the sum of logistic loss over the two tasks with an `2 regularization pe-nalizing the difference between the pathway summaries. We train two tasks at a time
41

METHOD B. anthracis F. tularensis Y. pestis S. typhi
STL 27.8 ± 4.0 25.7 ± 5.4 28.8 ± 4.0 72.5 ± 11.4STL PATH. 26.5 ± 4.7 26.1 ± 6.9 26.7 ± 4.3 69.1 ± 12.7COUPLED 27.0 ± 3.9 25.5 ± 5.0 27.9 ± 3.4 69.8 ± 12.4MEAN MTL 25.2 ± 4.9 26.7 ± 4.0 27.5 ± 6.3 69.4 ± 12.1L1/L2 REG. 31.2 ± 3.7 30.6 ± 6.7 32.0 ± 3.9 73.1 ± 16.9MTPL 32.0 ± 3.9 30.1 ± 5.8 32.1 ± 2.5 75.8 ± 12.1
Table 3.4: Averaged 10 fold cross-validation performance for all methods for a posi-tive:negative class ratio of 1:100. Accuracy is reported as the F1 measure computedon the positive class. The standard deviation over the 10 folds is also reported.
and compute the performance for each task. Since we have four tasks, there are sixsuch pairwise learning experiments in all. While evaluating performance during 10fold CV, we obtain the F1 on one fold of a task Tt by averaging the F1 across all pair-wise learning experiments that involve Tt (see Section 3.4 for details). The final CVperformance reported in our results is an average over 10 folds.
Hyper-parameter tuning
We followed an identical procedure for all algorithms. For the 10 fold CV experimentswe train on eight folds, use one fold as held-out and another as test. The optimalparameters (i.e the best model) was obtained by parameter tuning on the held-outfold. The test fold was used to evaluate this best model - these results are reportedin Section 3.6. The range of values we tried during the tuning of the regularizationparameter (λ) were: 150 to 10−4. For σ - the parameter controlling overfitting inMTPL, we used a fixed value of σ = 1. For MeanMTL we tune both λ and σ. Tohandle the high class imbalance in our data, we used a weight-parameter Wpos toincrease the weight of the positive examples in the logistic loss terms of our function.We tried three values and found Wpos = 100 performed the best on training data.
3.6 Results and Discussion
Overall performance
Table 3.4 reports for each bacterial species, the average F1 along with the standarddeviation for the 10 fold cross validation (CV) experiments. The performance of allbaselines is very similar, and our method outperforms the best of the baselines by amargin of 4 points for B. anthracis, 3.4 points for F. tularensis and 3.2 points for Y. pestisand 3.3 for S. typhi. The overall performance of all methods on this dataset is twice asgood as that on the others. We believe that the difference in the nature of the datasetsmight explain the above observations. While the S. typhi dataset comprises small-scale interaction studies, the other datasets come from high-throughput experiments.Due to its smaller size it has less variance making it an easier task. This dataset is alsolikely to be a biased sample of interactions, as it comes from focused studies targetingselect proteins.
42

The coupled learner (Coupled) performs slightly worse than STL. This is explainedby the fact that STL has more flexibility in setting the regularization parameter foreach task separately which is not the case in Coupled. It is interesting to note thatthe independent models that use the pathway matrices Ps and Pt as features (i.e STLPath) show a slightly worse performance than STL that does not use them. This seemsto suggest that the cross-task pathway similarity structure that we enforce using ourregularizer has more information than simply the pathway membership of proteinsused as features.
Precision Recall curves from 10 fold CV results
We plot the recall vs the precision obtained by our method, MTPL on the 4 tasks inFigure 3.7. We used the results from the 10 fold CV experiments. The classifier scorefor each test instance was aggregated from the various pairwise models a mannersimilar to what is explained in §3.4. Let the classifier scores (i.e wᵀx) from each modelfor a given test instance x be s1, s2 . . . sm−1. The aggregated multi-task classifierscore of x is given by:
s(x) =
maxi
si, if(∑
i I(si ≥ 0))≥ 1
mini
si, otherwise(3.15)
The classifier threshold was then varied and the precision (P), recall (R) were com-puted for each threshold. The final curve was obtained by aggregating the P-R curvesfrom each of the ten folds.
0 10 20 30 40 50 60 70 80 90 1000
10
20
30
40
50
60
70
80
90
100
Recall
Pre
cis
ion
B. anthracis
F. tularensis
Y. pestis
S. typhi
Figure 3.7: Precision-Recall curves for MTPL for all tasks
43

PAIRWISE MODEL PERFORMANCE OF MTPL
PAIRWISE TASKS F1TASK-1, TASK-2 TASK-1 TASK-2
B. anthracis, F. tularensis 31.4 30.1B. anthracis, S. typhi 32.0 76.3B. anthracis, Y. pestis 31.6 32.0F. tularensis, S. typhi 30.3 73.0F. tularensis, Y. pestis 30.0 32.1S. typhi, Y. pestis 74.2 32.3
Table 3.5: F1 computed during 10 fold cross-validation of various pairwise modelsfrom MTPL. Positive : negative class ratio was 1:100. The best F1 achieved for eachtask (i.e for each bacterial species) is shown in bold. For example, B. anthracis has thebest performance of 32 when it is coupled with S. typhi.
Pairwise performance of tasks in MTPL
The previous section gave a summary of the aggregated performance of MTPL forevery task. Here we present the performance of every pairwise learning experimentof MTPL in Table 5. This gives an idea of how various tasks benefit from being pairedup with other tasks.
For each task, we check the task-pairing that gave the best performance (best F1for each task is shown in bold). For instance, the best F1 of 32.3 for Y. pestis wasobtained in the pairwise model learned with S. typhi. It is evident that coupling amodel with one additional task seems to improve the performance over the baseline.
Feature importance across tasks
To get an understanding of inter-task model similarity, we compared the parametervectors ‘w’ of all tasks with each other (each w was learned on the entire trainingdata). Since the number of features is very large, we computed the cosine similaritybetween them. Note that we only use features which are common across tasks for thiscomparison. Gene expression features for instance were not used as they vary withregards to the number of expression time-points, the experiment protocol etc.
We found that the feature weights vary greatly across models – the cosine simi-larity ranges between 0.1 to 0.13. We also analyzed which features had the highestabsolute weight. We found that the node-degree feature (computed using the humanPPI graph) has a very high positive weight across all tasks. Gene expression featureshave large negative weights across all tasks. In general, the GO and protein sequencebased n-gram features have very different weights across tasks.
This seems to imply that having similar parameter values across models is notparticularly important for this multi-task problem. This explains why one of ourbaselines: the Mean-MTL method which penalizes differences between parametervectors, does not perform very well. Instead, regularization using the pathway sum-
44

maries seems key in giving a better performance.
Sparsity of weights: We use `2 regularization in our optimization function, whichdoes not produce very sparse weight vectors. We observe that about 50% of the fea-tures have 0 weight in all tasks. About 75 - 80% of the features have small weights inthe range of (0.001, -0.001).
Analysis of predictions
The F1 measure gave us a quantitative idea of the performance of each method ontraining data. In this section, we present a qualitative analysis of the new interactionsthat our models predict. We first construct, for each task ‘Tt’, a random set Rt of pro-tein pairs that is disjoint from the training dataset. We train the pairwise models onthe training data and obtain predictions on Rt. The method described in Section 3.4is used to aggregate predictions from all pairwise models. The subset of Rt labeled as‘positive’ is used for the analysis described below.
Enriched human pathways : We perform enrichment analysis on the human path-ways from the positive predictions of MTPL. We use Fisher’s exact test with thehyper-geometric distribution. We intersect the top enriched pathways that satisfy p-value≤ 1e-07 from each task to get the commonly enriched pathways. The sizes of thevarious intersections are shown in Figure 3.8. 17 pathways are commonly enrichedacross all four tasks. 104 pathways are enriched across the three high-throughputdatasets - which is a significant fraction of the total number of pathways considered.This result indicates that the bias produced by our regularizer does produce predic-tions satisfying the commonality hypothesis.
Figure 3.8: The intersection of enriched human pathways from predicted interactions.The total number of enriched pathways for each bacterial species are: B. anthracis: 250,F. tularensis: 164, Y. pestis: 400 and S. typhi.: 40. The size of the intersection between alltasks’ enriched pathways is: 17. The size of this intersection for the high-throughputdatasets (excluding S. typhi) is much larger: 104.
Comparing enriched pathways: gold-standard vs. predicted
We also analyze the overlap between the pathways enriched in the gold-standardpositives and those enriched in the predictions. See Figure 3.9. For both enrichmentcomputation, the human genes from the interactions are considered. We used Fisher’s
45
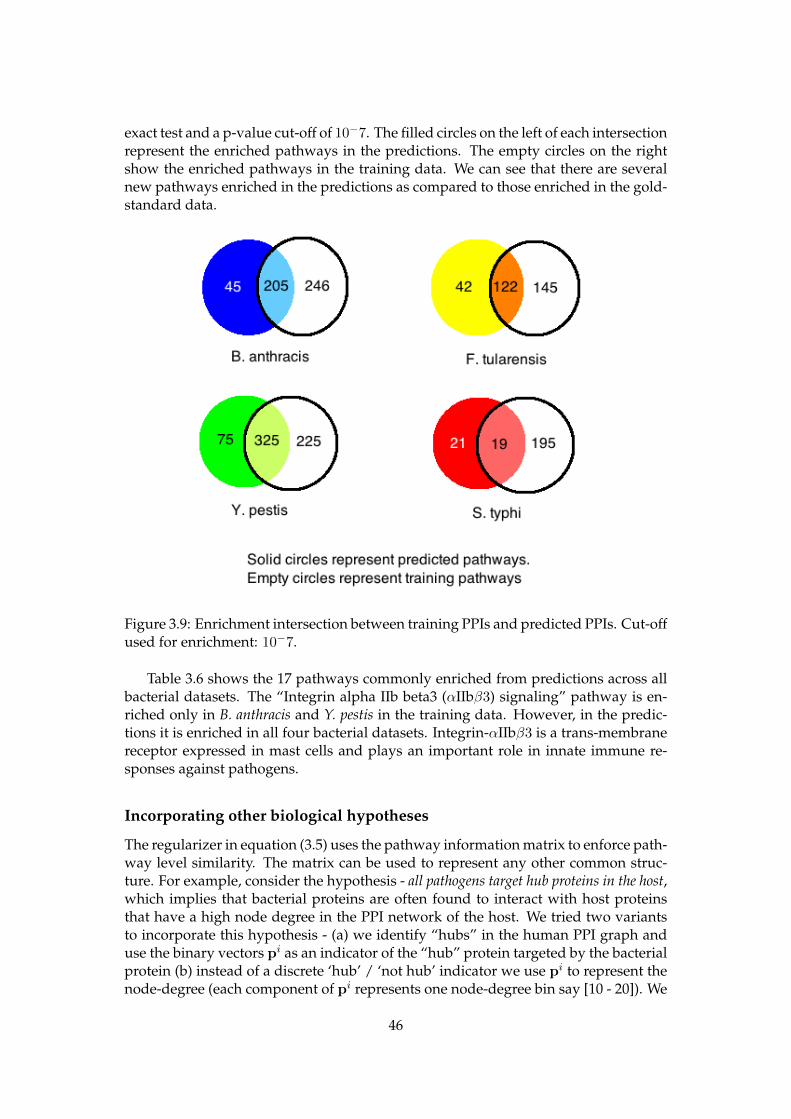
exact test and a p-value cut-off of 10−7. The filled circles on the left of each intersectionrepresent the enriched pathways in the predictions. The empty circles on the rightshow the enriched pathways in the training data. We can see that there are severalnew pathways enriched in the predictions as compared to those enriched in the gold-standard data.
Figure 3.9: Enrichment intersection between training PPIs and predicted PPIs. Cut-offused for enrichment: 10−7.
Table 3.6 shows the 17 pathways commonly enriched from predictions across allbacterial datasets. The “Integrin alpha IIb beta3 (αIIbβ3) signaling” pathway is en-riched only in B. anthracis and Y. pestis in the training data. However, in the predic-tions it is enriched in all four bacterial datasets. Integrin-αIIbβ3 is a trans-membranereceptor expressed in mast cells and plays an important role in innate immune re-sponses against pathogens.
Incorporating other biological hypotheses
The regularizer in equation (3.5) uses the pathway information matrix to enforce path-way level similarity. The matrix can be used to represent any other common struc-ture. For example, consider the hypothesis - all pathogens target hub proteins in the host,which implies that bacterial proteins are often found to interact with host proteinsthat have a high node degree in the PPI network of the host. We tried two variantsto incorporate this hypothesis - (a) we identify “hubs” in the human PPI graph anduse the binary vectors pi as an indicator of the “hub” protein targeted by the bacterialprotein (b) instead of a discrete ‘hub’ / ‘not hub’ indicator we use pi to represent thenode-degree (each component of pi represents one node-degree bin say [10 - 20]). We
46

Adaptive Immune SystemDevelopmental BiologyE-cadherin signaling eventsE-cadherin signaling in the nascent adherens junctionGlypican pathwayImmune SystemIntegrin alphaIIb beta3 signalingIntegrin cell surface interactionsL1CAM interactionsN-cadherin signaling eventsPlatelet activation, signaling and aggregationPlatelet Aggregation (Plug Formation)Posttranslational regulation of adherens junction stability and dissassemblySignalling by NGFSignal TransductionStabilization and expansion of the E-cadherin adherens junctionTNF alpha/NF-kB
Table 3.6: The 17 commonly enriched pathways in the predicted interactions fromMTPL.
found that using (a) gives us an improvement of upto 2.5 F points over the baselinemethods.
3.7 Unified multi-task pathway objective (U-MTPL)
The method presented in the previous sections integrates multiple tasks in a pairwisemanner, and does not scale well while integrating several PPI datasets as we have tosolve one optimization problem per task pair. For m tasks this means O(m2) pairwiseregularization problems to solve. The most straightforward way of extending equa-tion 3.3 to learning m tasks simultaneously involves loss terms for each of the tasksand m(m− 1) regularizer terms. Let wt represent the parameters of task Tt, and T isthe set of all tasks. The unified objective can then be expressed as:
L(w1,w2 . . .wm) =m∑t=1
l(wt) +∑Ts,Tt∈T
λst ‖S(Ts)− S(Tt)‖22 + σm∑t=1
‖wt‖22 (3.16)
The summary function S(Tt) is as defined in equation 3.4. Here, λst is the hyper-parameter controlling how tightly the two corresponding tasks should be coupledtogether. Task pairs that are very similar to each other should have a higher value forλst.
This formulation has the advantage of learning all parameters simultaneously anddoes not require the final model-aggregation step that the pairwise model needs (Sec-tion 3.4). The drawback is the growth of the hyper-parameter space. There are O(m2)hyper-parameters: λst, and searching for the best combination of these task-pair sim-ilarities requires a search over a grid in Rm
2.
47

METHOD B. anthracis F. tularensis Y. pestis S. typhiINDEP. 27.8± 4 25.7± 5.4 28.8± 4 72.5 ± 11.4MEAN MTL 25.2 ±4.9 26.7±4 27.5±6.3 69.4±12.1L1/L2 REG. 31.2 ±3.9 30.6 ±7.1 31.9 ±4 73 ± 17.8MTPL 32 ±3.9 30.1± 5.8 32.1 ± 2.5 75.8 ± 12.1U-MTPL 31.7 ±4 30.1±6.6 32.5 ±3 76.1 ± 11.6U-MTPL PHY. 31.7 ±4.2 29.6±7.5 31.9 ±3 76.4 ±12
Table 3.7: Performance on four tasks. Averaged F-score from a 10 fold cross-validation. The standard deviation over the 10 folds is also reported.
METHOD B. anthracis F. tularensis Y. pestis S. typhi E. coli
STL 27.8 ± 4.0 25.7 ± 5.4 28.8 ± 4.0 72.5 ± 11.4 73.7 ± 18.1L1/L2 REG. 30.8 ± 3.9 30.1 ± 5.9 32.2 ± 3.5 71.0 ± 16.9 79.2 ± 14.5MTPL 31.4 ± 3.6 29.4 ± 6.6 31.7 ± 3.4 70.9 ± 22.5 73.4 ± 16.5U-MTPL 30.6 ± 3.2 29.0 ± 5.4 30.0 ± 3.4 70.7 ± 14.0 72.4 ± 16.0U-MTPL PHY. 32.1 ± 3.5 30.3 ± 7.0 32.2 ± 3.6 74.8 ± 13.9 75.7 ± 18.0
Table 3.8: Averaged 10 fold cross-validation performance for all methods for a posi-tive:negative class ratio of 1:100. Accuracy is reported as the F1 measure computedon the positive class. The standard deviation over the 10 folds is also reported.
Tuning the hyper-parameters
The function in equation 3.16 is highly non-convex and has many local minima. Do-ing a complete grid-search over Rm
2is very expensive, so we use some local search
strategies to tune the hyper-parameters. The range of values for a single λst wasr = [10−6, 100]. The task-similarity parameters can be considered to be a symmetricmatrix Λ ∈ Rm×m. We first randomly sample 50 matrices from Rm×mr and pick thetop five models (that have the best F-score on the held-out data). Using these fivematrices as starting points, we do a local search, by gradually varying some of thelambdas to find other good matrices. This strategy gives us a better sampling of thehyper-parameter space, biased towards settings with a good held-out performance.
Since we know the task relationships via the phylogenetic tree connecting the var-ious bacteria, we can use it to set the parameters as follows: λst = 1
dist(s,t) , where‘dist(s,t)’ is the hop distance between the tasks s and t.
Experiments
We show results in two settings: the first setting has the same four tasks that wereused to evaluate MTPL and another setting where introduce a fifth task: E. coli-humanPPI prediction. We evaluate the unified model U-MTPL as before and compare itwith the baselines. The joint learning method, ‘U-MTPL phy’ uses the phylogenetic-similarity between two species to fix the value of λst. This does not require any hyper-parameter tuning and involves running a single optimization. This makes it the mostcomputationally efficient of all the methods that we consider.
Table 3.7 shows the averaged F-score from a 10 fold CV experiment for the first
48

setting with four tasks. The F-scores upon addition of the E. coli task are shown inTable 3.8. Overall, we find that the performance of all methods reduces slightly go-ing from four tasks to five tasks. The drop in performance is biggest for SalmonellaTyphimurium. The L1/L2 regularization does much better on the E. coli task than U-MTPL.
3.8 Co-immunoprecipitation (co-ip) studies: validation ofpredicted Salmonella interactions
Several experimental techniques have been developed to identify protein-protein in-teractions. Generally, these use a “bait” protein of interest to search a pool of cellularproteins for an interacting partner, coupled with some form of mechanism to detectthe partner proteins. The bait protein or antigen is the pathogen (i.e bacterial) pro-tein. Figure 3.10 shows the details of this procedure and explains each step. At a highlevel, interactions that exist between two proteins inside a cell, remain intact when thecell is lysed (i.e dissolved) under nondenaturing conditions. By immunoprecipitatingprotein A, we can precipitate protein B as well, wherever it is stably interacting withA (hence the name “co-ip”). Co-immunoprecipitated proteins are finally detected bywestern blotting.
In the co-ip experiments performed by our collaborators, the HT29 human epithe-lial cell line was used. The goal was to validate interactions with Salmonella effectorproteins only. Out of a total of 84 effectors, 32 were picked based on the highly rank-ing PPIs from the model. From these, they were able to successfully set-up the co-ipprotocol for 10 effectors. Each experiment thus investigates possible interactions be-tween 10 Salmonella proteins and ≈ 25000 human proteins. Three such screens (i.ereplicates) were performed, with the same protocols being followed in all screens. Atotal of 7414 potential PPIs were obtained over the three screens (i.e these PPIs ap-peared in at least one screen). The overlap between all three screens was very small:5 PPIs. Hence, we present results on the set of 7414 PPIs. Overall we would liketo caution the interpretation of these results from the pulldown experiments. Theseare to be considered less reliable and more of a ‘silver standard’ set, the reason beingthat none of the gold standard PPIs were found to be interacting in our pulldownexperiments.
We check how many of these were predicted by our model, and we compare thisnumber to the results from five other prediction models:
• Single task learning (STL): the per task independent model described in §3.5
• Group lasso: the `1/`2 regularization model, also discussed in §3.5
• BIANA: the interologs based model from Garcia-Garcia et al. [2012]
• iLoops2 [Planas-Iglesias et al., 2013] A method that uses local structural featureswith a Random Forest classifier to predict interactions
• U-MTPL: our unified multitask learning pathway based learning objective from§3.7
2http://sbi.imim.es/iLoops.php
49
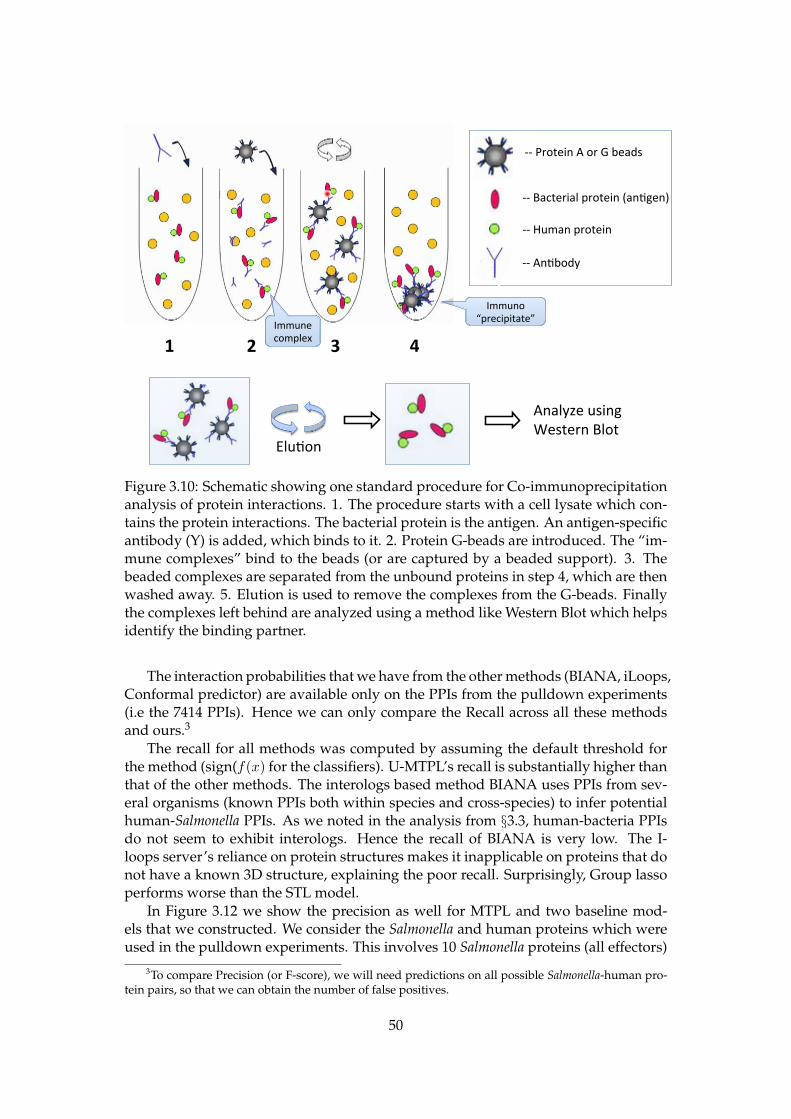
-‐-‐ Protein A or G beads
Immuno “precipitate”
-‐-‐ Bacterial protein (an:gen)
-‐-‐ Human protein
-‐-‐ An:body
Immune complex 1 2 3 4
Elu:on
Analyze using Western Blot
Figure 3.10: Schematic showing one standard procedure for Co-immunoprecipitationanalysis of protein interactions. 1. The procedure starts with a cell lysate which con-tains the protein interactions. The bacterial protein is the antigen. An antigen-specificantibody (Y) is added, which binds to it. 2. Protein G-beads are introduced. The “im-mune complexes” bind to the beads (or are captured by a beaded support). 3. Thebeaded complexes are separated from the unbound proteins in step 4, which are thenwashed away. 5. Elution is used to remove the complexes from the G-beads. Finallythe complexes left behind are analyzed using a method like Western Blot which helpsidentify the binding partner.
The interaction probabilities that we have from the other methods (BIANA, iLoops,Conformal predictor) are available only on the PPIs from the pulldown experiments(i.e the 7414 PPIs). Hence we can only compare the Recall across all these methodsand ours.3
The recall for all methods was computed by assuming the default threshold forthe method (sign(f(x) for the classifiers). U-MTPL’s recall is substantially higher thanthat of the other methods. The interologs based method BIANA uses PPIs from sev-eral organisms (known PPIs both within species and cross-species) to infer potentialhuman-Salmonella PPIs. As we noted in the analysis from §3.3, human-bacteria PPIsdo not seem to exhibit interologs. Hence the recall of BIANA is very low. The I-loops server’s reliance on protein structures makes it inapplicable on proteins that donot have a known 3D structure, explaining the poor recall. Surprisingly, Group lassoperforms worse than the STL model.
In Figure 3.12 we show the precision as well for MTPL and two baseline mod-els that we constructed. We consider the Salmonella and human proteins which wereused in the pulldown experiments. This involves 10 Salmonella proteins (all effectors)
3To compare Precision (or F-score), we will need predictions on all possible Salmonella-human pro-tein pairs, so that we can obtain the number of false positives.
50

1.24 7 1.83
20.6 16.95
83.45
0
20
40
60
80
100
BIANA
(interologs) I-‐Loops
(structure) Conformal predictor
STL Group lasso
U-‐MTPL
Recall
Models from other collaborators
Figure 3.11: Recall on the 7414 PPIs from the co-immunoprecipitation experiments.
Number of true Methodspositives in top STL Group Lasso MTPL
2000 147 143 1325000 429 375 329
10000 930 793 70620000 1907 1641 158950000 4460 4419 474770000 6622 6553 6720
Table 3.9: The number of positives retrieved by each method in their top predictions.
and the HT29 human cell line. For human proteins we consider the 24000 ‘reviewed’proteins from UniprotKB. The precision was computed by considering the false pos-itives over this set. We notice that STL has a higher precision at lower recall valueswhereas MTPL has a higher precision at higher recall. We look at this performance infurther detail in Table 3.8, where we list the number of positives reported in the topranking predictions of each method. For instance the first row tells how many pull-down interactions were present in the top 2000 predictions (sorted by the classifierscore / probability). Interestingly, STL has the best numbers in the initial rows andMTPL has better numbers in later rows, which is consistent with what we observe inthe P-R curve.
3.9 Conclusion
We presented a method that uses biological knowledge in jointly learning multiplePPI prediction tasks. Using a task regularization based multi-task learning technique,we were able to encode a biological hypothesis into the optimization framework ef-fectively thus enabling the commonality hypothesis to be tested. Our PPI prediction
51

0
0.1
0.2
0 0.2 0.4 0.6 0.8 1
Precision
Recall
STL
L12
MTPL
Figure 3.12: Precision-Recall curve for MTPL and two of our baselines on the 7414PPIs from the co-immunoprecipitation experiments. The precision was computedw.r.t the set of all protein pairs investigated by the pulldown experiment.
results indicate that the tasks benefit from multitask learning as we see that the MTLmethods outperform the STL baseline.
We validate the predictions from our model, via co-immunoprecipitation (pull-down) experiments. The higher recall we obtain clearly shows the improved cover-age we get by incorporating PPI data from several pathogens. We also show howour model can be used to incorporate another hypothesis regarding host-pathogenPPI prediction. Our model has applications in other prediction problems such as:gene-gene interaction prediction across several organisms, gene-disease associationprediction across diseases.
52

Chapter 4
Multitask matrix completion
In Chapter §3 we saw how the similarity in biological pathways was incorporated intoa MTL framework. While we were able to obtain good performance on the tasks weconsidered, the MTPL method has the disadvantage of not being general enough toapply on problems arising in other areas. Here, we look at an alternate representationof the PPI prediction problem that allows us to explore a whole different mechanismto share information across tasks. The methods we develop here are very general andapplicable to many applications that involve graphs and link prediction.
An elegant way to formulate the PPI prediction problem is via a graph completionbased framework, where we have several bipartite graphs over multiple hosts andpathogens as illustrated in Figure 4.1. Nodes in the graphs represent host proteins(circles) and pathogen proteins (triangles), with edges between them representinginteractions (host protein interacts pathogen protein). Given some observed edges (in-teractions obtained from laboratory based experiments), we wish to predict the otheredges in the graphs. Such bipartite graphs arise in a plethora of problems includ-ing: recommendation systems (user prefers movie), citation networks (author cites
paper), disease-gene networks (gene influences disease) etc. In our problem, each bi-partite graph G can be represented using a matrix M , whose the rows correspond topathogen proteins and columns correspond to host proteins. The matrix entry Mij
encodes the edge between host protein i and pathogen protein j from the graph, withMij = 1 for the observed interactions. Thus, the graph completion problem can bemathematically modeled as a matrix completion problem [Candes and Recht, 2008].Traditional approaches towards matrix completion rely on the assumption that theunderlying function that generated the matrix can be decomposed into a small num-ber of ‘latent’ factors. The solution based on this assumption involves finding a low-rank matrix factorization for M , mathematically expressed as: finding U and V suchthat M ≈ UV T . Here the parameters U and V are called the factor matrices andrepresent the latent properties of the host and pathogen proteins respectively. In therecommendation systems example, the ‘low rank’ structure suggests that movies canbe grouped into a small number of latent ‘genres’. In the case of proteins these la-tent properties could correspond to various biological functions of proteins or encodeinteraction propensities.
Most of the prior work on host-pathogen PPI prediction has modeled each bipar-tite graph separately, and hence cannot exploit the similarities in the edges across thevarious graphs. Here we present a multitask matrix completion method that jointlymodels several bipartite graphs by sharing information across them. From the mul-
53

Ebola
Influenza
Hepa//s
Human
Mouse
Figure 4.1: Multiple bipartite graphswith different types of nodes: on theleft are proteins from host speciesand on the right virus species’ pro-teins. Edges represent protein inter-actions. Each bipartite graph is onetask.
Pathogen→ Influ. A Hep. C Ebola
No. of HP PPIs(positives) 848 981 90
no. unique virusproteins in PPIs 54 151 2
no. unique humanproteins in PPIs 362 385 88
Density (%) ofobs. graph‡
.006 .020 .038
total # of proteinsin the virus 542 163 150
No. of negatives 84800 98100 9000HP PPI: host-pathogen protein protein interactions‡: considering all proteins in the two organisms involved.Note: the total number of human proteins is ≈ 26000.
Table 4.1: Tasks and their sizes. Each columncorresponds to one bipartite graph betweenhuman proteins and the pathogen indicated inthe column header. All pathogens are singlestranded RNA viruses. Row 4 shows that eachof our graphs is extremely sparse.
titask perspective, a task is the graph between one host and one pathogen (can alsobe seen as interactions relevant to one disease). We focus on the setting where wehave a single host species (human) and several related viruses, where we hope togain from the fact that similar viruses will have similar strategies to infect and hijackbiological processes in the human body. Such opportunities for sharing arise in otherapplications as well: for instance, predicting user preferences in movies may informpreferences in selection of books, or vice-versa, as movies and books are semanticallyrelated. Multitask learning based models that incorporate and exploit these correla-tions should benefit from the additional information.
Our multitask matrix completion based model is motivated by the following bio-logical intuition governing protein interactions across diseases.
1. An interaction depends on the structural properties of the proteins, which areconserved across similar viruses as they have evolved from common ancestors.Our model thus needs a component to capture these latent similarities, which isshared across tasks.
2. In addition to the shared properties discussed above, each pathogen has alsoevolved specialized mechanisms to target host proteins. These are unique tothe pathogen and can be expressed using a task-specific parameter in the model.
To incorporate the above ideas, we assume that the interactions matrix M is gen-erated from two components. The first component low-rank latent factors over thehuman and virus proteins, with these latent factors jointly learned over all tasks. Thesecond component involves task specific parameter, on which we additionally im-pose a sparsity constraint as we do not want this parameter to overfit the data. Sec-tion 4.4 discusses our model in detail. We trade-off the relative importance of the two
54

components using task-specific hyperparameters. Our model can thus learn what isconserved and what is different across pathogens, rather than having to specify itmanually.
The key challenges in inducing such a model are:
• In addition to the interactions from each graph, it should exploit informationavailable in the form of features.
• Exploiting features is particularly crucial since the graph G is often extremelysparse, i.e there are a large number of nodes and very few edges are observed.There will be proteins (i.e nodes) that are not involved in any known interac-tions – called the cold start problem in the recommendation systems community.The model should be able to predict the existence of links (or their absence)between such prior ‘unseen’ node pairs. This is of particular significance ingraphs that capture biological phenomena. For instance, the host-pathogen PPInetwork of human-Ebola virus (column-3, Table 4.1) has ≈ 90 observed edges(equivalent to 0.038% of the network) which involve only 2 distinct virus pro-teins. Any biologist studying virus-human interactions will be interested inknowing more about the hundreds of other virus proteins (which have yet un-known interactions).
• A side-effect of having scarce data is the availability of a large number of un-labeled examples, i.e pairs of nodes with no edge between them. These unla-beled examples can contain information about the graph as a whole, and a goodmodel should be able to use them.
The model we develop addresses these challenges, and has the following merits.
1. Our multitask extension of the matrix completion model from [Abernethy et al.,2009] is novel
2. Unlike most prior approaches (see Section 4.1 for details), our model exploitsnode-based features which allows us to deal with the ‘cold start’ problem (gen-erating predictions on unseen nodes)
3. We apply the model to an important, real-world problem – prediction of inter-actions in disease-relevant host-pathogen protein networks, for multiple relateddiseases. We demonstrate the superior performance of our model over priorstate-of-art multitask models
4. We use unlabeled data to initialize the parameters of our model, which servesas a prior. This gives us a modest boost in prediction performance
4.1 Prior work
Most of the prior work in PPI prediction has focussed on building models separatelyfor individual organisms [Chen and Liu, 2005, Wu et al., 2006, Singh et al., 2006, Qiet al., 2006] or on building a model specific to a disease in the case of host-pathogenPPI prediction [Tastan et al., 2009, Qi et al., 2009, Dyer et al., 2007, 2011, Kshirsagaret al., 2012]. There has been little work on combining PPI datasets with the goal ofimproving prediction performance for multiple organisms. Qi et al. [2010] proposed
55

a semi-supervised multi-task framework to predict PPIs from partially labeled refer-ence sets. Kshirsagar et al. [2013] proposed a task regularization based frameworkcalled MTPL that incorporates the similarity in biological pathways targeted by var-ious diseases to couple multiple tasks together. Matrix factorization based protein-protein interaction (PPI) prediction has seen very little work, mainly due to the ex-tremely sparse nature of these datasets which makes it very difficult to get reliablepredictors. Xu et al. [2010] use a CMF-based approach in a multi-task learning settingfor within species PPI prediction. The methods used in all prior work on PPI pre-diction do not explicitly model the features of the proteins and cannot be applied onproteins which have no known interactions available. Our work addresses both theseissues in using a formulation of the matrix completion problem originally proposedin the work by Abernethy et al. [2009].
A majority of the prior work in the relevant areas of collaborative filtering andlink prediction includes single relation models that use neighbourhood based predic-tion [Sarwar et al., 2001], matrix factorization based approaches [Koren et al., 2009,Menon and Elkan, 2011] and bayesian approaches using graphical models [Jin et al.,2002, Phung et al., 2009]. The matrix factorization based methods have been morepopular than the other methods. There have also been multitask approaches on linkprediction [Zhang et al., 2012, Cao et al., 2010, Li et al., 2009, Singh and Gordon, 2008].Li [2011] presents a survey on multitask/transfer methods in collaborative filtering.The multi-relational learning literature [Xu et al., 2009] and the work on link predic-tion in heterogenous networks is not relevant as their setting involves different typesof relationships between the same set of nodes. Menon and Elkan [2011] propose asingle-graph model that combines linear and bilinear features, latent parameters onthe nodes and several other parameters into a function that minimizes a ranking loss.In the matrix decomposition literature, Abernethy et al. [2009] proposed an approachwhere they cast the problem of matrix completion in terms of the abstract problem oflearning linear operators. Their framework allows the incorporation of features andkernels. We extend their bilinear model for the multitask setting. There has been alot of work on other low-rank models for multitask learning [Ando and Zhang, 2005,Ji and Ye, 2009, Chen et al., 2012a, 2013] that try to capture the task relationship via ashared low-rank structure over the model parameters.
4.2 Datasets and features
We use three human-virus PPI datasets from the PHISTO [Tekir et al., 2012] database,the characteristics of which are summarized in Table 4.1. The Influenza A task includesvarious strains of flu: H1N1, H3N2, H5N1 etc. Similarly, the Hepatitis task includesvarious sub-strains of the virus. All three are single-strand RNA viruses, with Hep-atitis being a positive-strand ssRNA whereas Influenza and Ebola are negative-strandviruses. The phylogenetic tree that shows the connections between these viruses isshown in Figure 4.2. The density of the known interactions is quite small when con-sidering the entire proteome (i.e all known proteins) of the host and pathogen species(row-4 in Table 4.1).
We use protein sequence based n-grams as features with n=2,3 and 4 for both hu-man and viral proteins. The features which have been successfully applied in priorwork [Dyer et al., 2011, Kshirsagar et al., 2013] also incorporate the properties of in-
56

Viruses Retro-‐transcribing viruses
Retroviridae Orthoretrovirinae
Len6virus Primate len6virus group
Human immunodeficiency virus
ssRNA viruses ssRNA nega6ve-‐strand viruses
Orthomyxoviridae Influenzavirus A
Mononegavirales Filoviridae
Ebolavirus ssRNA posi6ve-‐strand viruses, no DNA stage
Flaviviridae Hepacivirus
Hepa66s C virus
__
__ __
__
__
__
Figure 4.2: Genealogy of the viruses that we consider in this work.
dividual amino-acids such as charge, hydrophobicity etc. The number of features is≈3000. Please refer to §2.3 for a detailed description of the protein sequence features.
4.3 Bilinear low-rank matrix decomposition
In this section, we present the matrix decomposition model [Abernethy et al., 2009]that we extend for the multitask scenario. In the context of our problem, at a highlevel, this model states that – protein interactions can be expressed as dot products offeatures in a lower dimensional subspace.
Let Gt be a bipartite graph connecting nodes of type υ with nodes of type ς . Letthere be mt nodes of type υ and nt nodes of type ς . We denote by M ∈ Rmt×nt , thematrix representing the edges in Gt. Let the set of observed edges be Ω. Let X and Ybe the feature spaces for the node types υ and ς respectively. For the sake of notationalconvenience we assume that the two feature spaces have the same dimension dt 1. Letxi ∈ X denote the feature vector for a node i of type υ and yj ∈ Y be the feature vectorfor node j of type ς . The goal of the general matrix completion problem is to learn afunction f : X × Y → R that also explains the observed entries in the matrix M . Weassume that the function f is bilinear on X × Y and takes the following form:
f(xi,yj) = xᵀiHyj = xᵀ
iUVᵀyj (4.1)
The factor H ∈ Rdt×dt maps the two feature spaces X and Y . This model as-sumes that H has a low-rank factorization given by H = UV ᵀ, where U ∈ Rdt×k
1the dimensions being different does not influence the method or the optimization in any way
57

and V ∈ Rdt×k. The factors U and V project the two feature spaces to a commonlower-dimensional subspace of dimension k. While the dimensionality of the featurespaces X and Y may be very large, the latent lower dimensional subspace is sufficientto capture all the information pertinent to interactions. To predict whether two newnodes (i.e nodes with no observed edges) with features pi and qj interact, we simplyneed to compute the product: piUV
ᵀqj . This enables the model to avoid the coldstart problem that many prior models suffer from. The objective function to learn theparameters of this model has two main terms: (1) a data-fitting term, which imposesa penalty for deviating from the observed entries in Ω and (2) a low-rank enforcingterm on the matrix H .
The first term can be any loss function such as squared error, logistic-loss, hingeloss. We tried both squared error and logistic-loss and found the performance to besimilar. The squared error function has the advantage of being amenable to adaptivestep-size based optimization which results in a much faster convergence. The low-rank constraint on H (mentioned in (2) above) is NP-hard to solve and it is standardpractice to replace it with either the trace-norm or the nuclear norm. Minimizing thetrace norm (i.e. sum of singular values) of H = UV ᵀ, is equivalent to minimizing‖U‖2F + ‖V ‖2F . This choice makes the overall function easier to optimize:
L(U, V ) =∑
(i,j)∈Ω
cij `(Mij ,xᵀiUV
ᵀyj)+λ(‖U‖2F +‖V ‖2F ) where `(a, b) = (a−b)2 (4.2)
The constant cij is the weight/cost associated with the edge (i, j) which allows usto penalize the error on individual instances independently. The parameter λ controlsthe trade-off between the loss term and the regularizer. The function in equation(4.2)is non-convex. To optimize this function a common procedure called alternating min-imization (or alternating least squares) is used, which is similar to block coordinatedescent. At every iteration in the optimization, it fixes one of the two parameters andoptimizes w.r.t the other.
4.4 The bilinear sparse low-rank multitask model(BSL-MTL)
In the previous section, we described the bilinear low-rank model for matrix comple-tion. Note that in order to capture linear functions over the features, we introduce aconstant feature for every protein (i.e [xi1]). We now discuss the multitask extensionsthat we propose. Let Gt where t = 1 . . . T be the set of T bipartite graphs and thecorresponding matrices be Mt. Each matrix Mt has rows corresponding to nodetype υt and columns corresponding to the node type ςt. The feature vectors for indi-vidual nodes of the two types be represented by xti and ytj respectively. Let Ωt bethe set of observed links in the graph Gt. Our goal is to learn individual link predic-tion functions ft for each graph. In order to exploit the relatedness of the T bipartitegraphs, we make some assumptions on how they share information. We assume thateach matrix Mt has a low-rank decomposition that is shared across all graphs and asparse component that is specific to the task t. That is,
ft(xti,ytj) = xᵀtiHytj , where H = UV ᵀ + St (4.3)
As before, the shared factors U and V are both Rdt×k (where the common dimen-sionality dt of the two node types is assumed for convenience). The matrix St ∈ Rdt×dt
58

is a sparse matrix. The objective function for the multitask model is given by:
L(U, V, St) =1
N
T∑t=1
∑(i,j)∈Ωt
ctij(Mtij − xᵀ
ti(UVᵀ + St)ytj
)2+ λ(‖U‖2F + ‖V ‖2F ) +
T∑t=1
σt‖St‖1
(4.4)Here N =
∑t |Ωt|, is the total number of training examples from all tasks. To
enforce the sparsity of St we apply an `1 norm. In our experiments, we tried both `1and `2 norms and found that the `1 norm works better.
Optimization
The function L(U, V, St) is non-convex. However, it is convex in every one of theparameters (i.e when the other parameters are fixed) and a block coordinate descentmethod called alternating least squares (ALS) is commonly used to optimize suchfunctions. To speed up convergence we use an adaptive step size. The detailed opti-mization procedure is listed in Algorithm 2.
Algorithm 2: AltMin algorithm1: Input:k : number of latent factorsΓ: pairs of entities for initializationFor every task t,xti, ytj: feature vectors from the two entity typesΩt: the observed entries of the matrix Mt
2: Initialization:3: An iteration r, let Sr represent Sr
t Tt=1
4: S0 ← 05: U0 ← top-k left singular vectors and V 0 ← top-k right singular vectors from the SVD of∑
(p,q)∈Γ
xpyᵀq
6: L0 : initial loss7: repeat8: Ur+1 ← argmin
UL(U, V r,Sr)
9: V r+1 ← argminV
L(Ur+1, V,Sr)
10: For each task tSr+1t ← argmin
St
L(Ur+1, V r+1,Sr−t)
11: Compute Lr+1 and let δ ← (Lr − Lr+1)/Lr
12: until δ < τ
Convergence: The ALS algorithm is guaranteed to converge only to a local minimum.There is work showing convergence guarantees to global optima for related simplerproblems, however the assumptions on the matrix and the parameter structure arenot very practical and it is difficult to verify whether they hold for our setting.
Initialization of U and V : We tried random initialization (where we randomly setthe values to lie in [0 1]), and also the following strategies that initialize: U0 ←top-k left singular vectors, and V 0 ← top-k right singular vectors from the SVD of
59
∑(i,j)∈Γ
mijxiyᵀj . We set Γ to (a) training examples, or (b) a random sample of 10000 un-
labeled data from all tasks. We found that using the unlabeled data for initializationgives us a better performance
Handling the ‘curse of missing negatives’
For the MC algorithm to work in practice the matrix entries Mij should representinteraction scores (range [0 1]) or take binary values (1s for positives and 0s for neg-atives). Our experiments with PPI probabilities (obtained using the MINT-scoringalgorithm) gave bad models. The binary matrix setting requires some observed 0s.However non-interactions are not available as they cannot be verified experimentallyfor various reasons. Hence we derived a set of ‘probable negatives’ using a heuristicoften used in PPI prediction work [Qi et al., 2006, 2009, Dyer et al., 2007, 2011, Kshir-sagar et al., 2013]. We pair up all virus proteins with all human proteins and sample arandom set to be negatives. This heuristic works in practice as the interaction ratio (i.enumber of positives in a large random set of protein pairs) is expected to be very low:≈ 1/100 to 1/500. That is, the probability that our negatives contain true positives isnegligible.
High class imbalance
We incorporate the prior on the interaction ratio by setting the size of our randomlysampled negatives set equal to 100 times the number of gold standard positives.
4.5 Experimental setup
Our baselines include recent low-rank and sparse models, conventional multitaskmethods and prior work on HP PPI prediction. For a uniform comparison we usedleast squared loss in all the methods. The MALSAR package was used to implementsome of the models. For the baselines wherever appropriate, we concatenated thefeatures of the two node types into a single feature vector. Let W ∈ RT×dt be thematrix with the task-specific weight vectors wt.
• Single task (STL): We used ridge regression with `2 regularization (which per-formed better than `1)
• MMTL: The mean regularized multitask learning model [Evgeniou and Pontil,2004]
• Dirty model: This model [Jalali et al., 2010] assumes that W = P +Q, where Penforces group sparsity and Q is to control for element-wise sparsity. It uses theregularizer ρ1‖P‖1,∞ + ρ2‖Q‖1
• Low rank model: A low-rank structure is enforced on W by minimizing thenuclear norm ‖W‖∗
• Sparse + low-rank: This model [Chen et al., 2012a] is the closest to our work,with two main distinctions: the linear dependence over the features and themanner in which the low-rank assumption is incorporated. W is assumed to
60

have the decomposition: W = P + Q, where P is sparse and Q has a low-rankstructure
• IMC: This is the link-prediction model from Section 4.3, where data from alltasks is combined without incorporating any task relationships. This model hasbeen used in prior work [Natarajan and Dhillon, 2014] for gene-disease associa-tion prediction. U and V are shared by all tasks. We use the same initializationfor this method as we do for our model. A comparison to this model tells ushow much we gain from the task-specific sparsity component St
• MTPL: The biologically inspired pathway regularizer from Kshirsagar et al.[2013] (Chapter 3) is used to capture task similarity
• BSL-MTL: Bilinear sparse low-rank multitask learning, the method developedin this chapter
Evaluation setup
We compare all the methods in two settings, where a small proportion of the availablelabeled data is randomly sampled and used to train a model which is then evaluatedon the remaining data. For the first setting we randomly split the labeled data fromeach task into 10% training and 90% test, such that the class-skew of 1:100 is main-tained in both splits (i.e stratified splits). The second setting uses a 30% training, 70%test split. In each setting we generate ten random splits and average the performanceover the ten runs.Parameter tuning: We tune the hyper-parameters using a 3 fold CV on the trainingsplit. To tune the regularization parameters from all baselines, we searched over thefollowing range (or grid, depending on the method) of values: [100, ...10−3]. To ad-dress the class-skew we also try assigning a higher weight to the positives. For ourmodel, we tried k: 5, ... 100 and λ=1...10−3. For each task t, σt was varied overthe values 10−3, ...10−6. The optimal setting was: k = 10, λ = 0.01, σebola = 10−5,σflu = σhepc = 10−6.
4.6 Results
We report the area under the precision recall curve (AUC-PR) along with the standarddeviation in Table 4.2. AUC-PR has been shown to give a more informative picture ofan algorithm’s performance than ROC curves in high class imbalance datasets [Davisand Goadrich, 2006] such as ours. Note that the AUC-PR of a random classifier modelis ≈ 0.01.
The first row (STL) is the single-task baseline and all others are multitask mod-els. In general, we notice that multitask learning benefits all tasks. The first threecolumns show the results in the 10% setting. The number of training positive exam-ples from each task are 8 for Ebola, 85 for Influenza and 98 for Hepatitis-C. Our model(last row) has significant gains for Influenza (1.4 times better than the next best) andmodest improvements for the other tasks. The variance in the performance is highfor the Ebola task (column 1) owing to the small number of positives in the trainingsplits (8 positives). The most benefits for our model are seen in the 30% setting for alltasks, with improvements of 39%, 3% and 12% on the Ebola, Hepatitis and Influenza
61

10% training 30% trainingEbola Hep-C Influenza Ebola Hep-C Influenza
STL 0.189±.09 0.702±.08 0.286±.02 0.130±.03 0.802±.03 0.428±.03MMTL 0.113±.04 0.767±.03 0.321±.02 0.129±.02 0.802±.04 0.430±.03Trace-norm 0.199±.11 0.767±.03 0.318±.02 0.207±.02 0.808±.02 0.409±.03Sparse,low-rank 0.144±.07 0.767±.02 0.318±.02 0.153±.02 0.814±.01 0.414±.03Dirty model 0.074±.03 0.767±.04 0.324±.02 0.165±.02 0.813±.03 0.412±.03MTPL 0.217±.08 0.695±.02 0.345±.02 0.260±.05 0.713±.01 0.496±.03IMC 0.087±.04 0.779±.02 0.362±.01 0.122±.02 0.801±.01 0.410±.03
BSL-MTL 0.233±.10 0.807±.02 0.486±.02 0.361±.03 0.842±.01 0.560±.02
Table 4.2: Area Under the Precision-Recall curve for each task in the two settings.X% training indicates the fraction of the labeled data used for training and tuningthe model with the rest (100-X)% used as test data. We report the average AUC-PRover 10 random train-test splits (stratified splits that maintain the class-skew of 1:100).The standard deviation is also shown. The performance of the best baseline and theoverall best method (BSL-MTL) is highlighted in bold.
tasks respectively. Here, we see great improvements in the data-poor task, Ebola. Thetwo closely related tasks, Influenza and Ebola benefit a lot more than the slightly dis-tant Influenza (see Figure 4.2). This is consistent with the expectations for multi-tasklearning, where weakly-performing tasks are lifted more than strongly-performingtasks by borrowing from other related tasks.
Biological significance of the model
The model parameters U , V and S contain a lot of rich information which can be usedto further understand host-pathogen interactions. Note that our features are derivedfrom protein amino acid sequences which allows the following possibilities to inter-pret the parameters.
Clustering proteins based on interaction propensities: We analyze the proteins byprojecting them using the model parameters U and V into a lower dimensional sub-space (i.e computingXUᵀ and Y V ᵀ to get projections of the virus and human proteinsresp.). The principal component analysis (PCA) of this lower dimensional represen-tation is compared with PCA in the original feature space (protein sequence features).The two plots are shown in Figure 4.3 for the virus proteins. Firstly, the projected datahas a much better separation than the original data. Secondly, the bottom plot tells usthat Hepatitis-C and Influenza have many proteins with similar binding tendencies,and that these behave differently than most proteins from Ebola virus. This observa-tion is not obvious in the PCA of the original feature space (top plot), where proteinswith similar sequences cluster together. We further analyze clusters of proteins fromthe projected data using Gene Ontology (GO) annotations.
Sequence motifs from virus proteins: In Figure 4.4, we show sequence motifs derivedfrom the top 100 k-mers that contribute to interactions. The shared k-mers that wereused to generate the motif in the top plot were derived from UV ᵀ. The task-specific
62

−5 0 5 10 15
−10
−5
0
5
10
First principal component
Se
co
nd
prin
cip
al co
mp
on
en
t
Influenza
Hepatitis−C
Ebola
0 1 2 3
−1.5
−1
−0.5
0
0.5
1
First principal component
Se
co
nd
prin
cip
al co
mp
on
en
t
Influenza
Hepatitis−C
Ebola
Figure 4.3: Principal component analy-sis of virus proteins in the original fea-ture space (top) and projected subspace(bottom). Shape of the points indicateswhich virus that protein comes from.The first two principal components areshown.
Created by Seq2Logo
0.0
0.05
0.1
-0.05
Bits
1
W
GPDERK
S
TH
NC
MYQ
F
IALV
2
W
H
DSMTYKRE
C
Q
PNIF
VGA
L3
M
KYPRTS
C
I
E
W
F
H
VQ
NDG
LA
Created by Seq2Logo
0.0
0.1
0.2
0.3
-0.1
Bits
1
Y
MIFSPT
W
C
H
LRQ
NVDKEGA
2
V
FDLIPW
C
HM
YQTANRGKES
3
LTVGA
F
M
W
C
HY
PISQ
NDREK
4
Y
MLIFDTSP
W
C
H
VQ
NERKGA
Figure 4.4: Sequence motifs that con-tribute significantly to interactions acrossall viruses (top) and that is specific toEbola virus (bottom). See Section 4.6 fordetails.
k-mers for the Ebola virus (bottom plot) were obtained from the matrix St (t=ebola).Knowledge of these pathogen-specific k-mers can help in design of drugs to targetspecific pathogens. We observe that the shared motif (top) is dominated by positivelycharged and hydrophilic amino acids (blue in colour), whereas the Ebola specific mo-tif has mostly hydrophobic residues (black). We found experimental evidence for thesignificance of the Ebola motif: the pattern PPAP is part of a well-studied epitope inthe Immune Epitope database [Vita et al., 2015] (epitope id: 66946). Using higher di-mensional k-mers (where k=7, 8, 9) as features in our model is likely to produce suchepitopes which can then be verified by biochemical peptide interaction assays. Ourmodel thus has applications in epitope prediction as well, where conventional meth-ods consist of scanning all possible k-mers from protein sequences to identify likelyepitopes.
Novel interactions and interaction interfaces: The top four Ebola-human PPI are allpredictions for the Ebola envelope glycoprotein (GP) with four different human pro-teins (Note: GP is not in the gold standard PPIs). We found evidence in publishedliterature [Nanbo et al., 2010] for the critical role played by GP in virus docking and
1an epitope is a very short sequence from the virus that bind to human antibodies
63
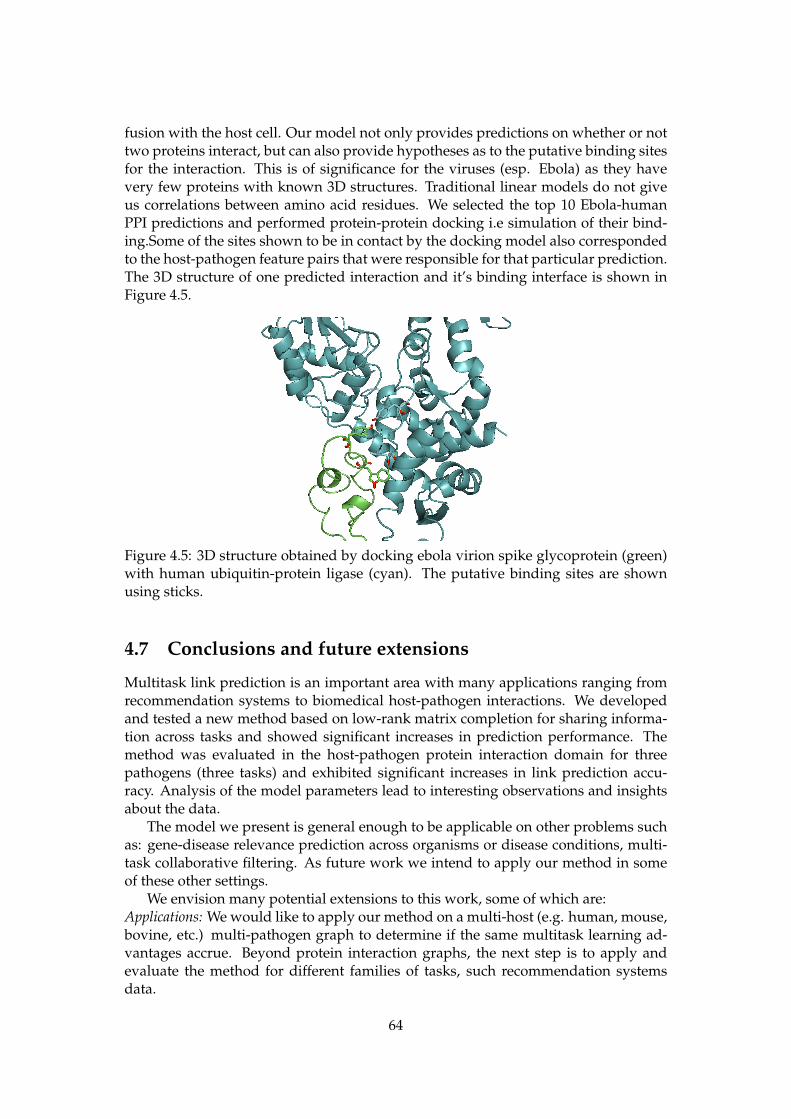
fusion with the host cell. Our model not only provides predictions on whether or nottwo proteins interact, but can also provide hypotheses as to the putative binding sitesfor the interaction. This is of significance for the viruses (esp. Ebola) as they havevery few proteins with known 3D structures. Traditional linear models do not giveus correlations between amino acid residues. We selected the top 10 Ebola-humanPPI predictions and performed protein-protein docking i.e simulation of their bind-ing.Some of the sites shown to be in contact by the docking model also correspondedto the host-pathogen feature pairs that were responsible for that particular prediction.The 3D structure of one predicted interaction and it’s binding interface is shown inFigure 4.5.
Figure 4.5: 3D structure obtained by docking ebola virion spike glycoprotein (green)with human ubiquitin-protein ligase (cyan). The putative binding sites are shownusing sticks.
4.7 Conclusions and future extensions
Multitask link prediction is an important area with many applications ranging fromrecommendation systems to biomedical host-pathogen interactions. We developedand tested a new method based on low-rank matrix completion for sharing informa-tion across tasks and showed significant increases in prediction performance. Themethod was evaluated in the host-pathogen protein interaction domain for threepathogens (three tasks) and exhibited significant increases in link prediction accu-racy. Analysis of the model parameters lead to interesting observations and insightsabout the data.
The model we present is general enough to be applicable on other problems suchas: gene-disease relevance prediction across organisms or disease conditions, multi-task collaborative filtering. As future work we intend to apply our method in someof these other settings.
We envision many potential extensions to this work, some of which are:Applications: We would like to apply our method on a multi-host (e.g. human, mouse,bovine, etc.) multi-pathogen graph to determine if the same multitask learning ad-vantages accrue. Beyond protein interaction graphs, the next step is to apply andevaluate the method for different families of tasks, such recommendation systemsdata.
64

Multiple levels: Task hierarchies can be exploited by our model by incorporating ad-ditional components to reflect the hierarchical relationships. Multiple link types: Weinvestigated one type of link, namely interaction links, but there can be different typesof related links, such as between people and scientific articles (e.g. authorship, cita-tion, has-read, dislikes, etc.). It will be interesting to incorporate these into our mod-els. The multiple tasks here are predictions in different but correlated link spaces:authorship + citation = self-citation, citation is correlated with has-read, citation is anti-correlated with dislikes, but not totally, e.g. if contrasting one’s work with a lesspreferred alternative.
The model can also be further extended to incorporate complex task relationshipsavailable in the form of a hierarchy. Starting at the leaf-nodes of such a hierarchy,every subtree of sibling tasks will share parameters. Let Tsib be one such subtree ofsibling tasks where each task’s link matrix is expressed as a function of a shared low-rank component UsibV T
sib and a task-specific component. Task-relationships of Tsibwith other subtrees in the hierarchy and with higher level nodes will be expressedvia additional shared parameters. These higher level relationships will again be ex-pressed via low-rank components which are common to several subtrees. LetUancestorand Vancestor be the matrices representing the shared low-rank component at a higherlevel of the hierarchy. Then, the link matrix of a task T ∈ Tsib can be written as:X(UancestorV
Tancestor +UsibV
Tsib+ST )Y T . In this manner, as we go higher and higher in
the hierarchy we add low-rank components in the equation explaining the link ma-trices of the tasks. In order to avoid too many parameters we can restrict the extentto which information is shared by only introducing new parameters every alternatelevel as we go higher up in the hierarchy. Another possibility is not sharing any pa-rameters at the top-most levels of the tree.
Overall, we feel that multitask learning in link prediction is still in the early stagesof research and hope this contribution will stimulate further work.
65


Chapter 5
Transfer learning models for newhosts and pathogens
Understanding the workings of plant responses to pathogens is an important fun-damental questions that also has enormous economic importance due to the role ofpathogens in food production and processing. While “classical” plant pathogenscause crop losses during production by impacting on plant health, processing ofplant-based food can lead to contamination by opportunistic pathogens. It is be-coming increasingly supported by experimental evidence that some human bacterialpathogens can colonize plants and cause disease [Kirzinger et al., 2011]. Salmonella isone of these bacterial species with extremely broad host range that infects not only an-imals, but also plants [Hernandez-Reyes and Schikora, 2013]. Evidence increases thatSalmonella can utilize plants as alternative host and can be considered as a bona fideplant pathogen. In this respect it has been reported that (a) Salmonella actively invadesplant cells, proliferates there and can cause disease symptoms [Schikora et al., 2008,Berger et al., 2011] (b) the plant recognizes Salmonella and plant defense responsesare activated [Iniguez et al., 2005, Schikora et al., 2008] and (c) that functional TypeThree Secretion Systems (TTSS) 1 and 2 are important for Salmonella pathogenicityin plants with respect to bacterial proliferation and suppression of plant defense re-sponses [Iniguez et al., 2005, Schikora et al., 2011, Shirron and Yaron, 2011]. SalmonellaTTSS-1 and 2 encode proteins, so called effectors, which are known to be translocatedinto the animal host cell in order to manipulate host cell mechanisms mainly via PPIs[Schleker et al., 2012]. Hence, it may be assumed that Salmonella utilizes the same pro-teins during its communication with animals and plant. However, the details of thiscommunication are not known. A critical component of the communication betweenany host and its pathogen are PPIs. However, the infection of plants by Salmonellais only a nascent field, so there are no known PPIs for Salmonella with any plantreported yet. Even for the well established pathogen-host pair, Salmonella-human,relatively few interactions are known [Schleker et al., 2012]. Only 62 interactions be-tween Salmonella and mostly human proteins (some Salmonella interactions involveother mammalian species, such as mouse and rat) are known to date. Because thereexists no plant-Salmonella interactions data, we need to rely on computational meth-ods to predict them.
In our work [Kshirsagar et al., 2015a], we describe techniques to build compu-tational models to predict interactions between the model plant, A. thaliana, and S.Typhimurium. Since there is no labeled data of this host-pathogen pair available,
67

we aim to transfer knowledge from known host-pathogen PPI data of other organ-isms. We use various statistical methods to build models for predicting host-pathogenPPIs. In each case, we cast the PPI prediction problem as a binary classification task,where given two proteins the goal is to learn a function that predicts whether thepair would interact or not. We derive features on every protein pair using proteinsequence data. Each host-pathogen PPI prediction problem is considered as one task.Figure 5.1 shows our problem setting. The upper host-pathogen task with Salmonellaas pathogen and human as the host is the source task. The lower task is the target task.The arrow shows the direction of knowledge transfer.
In order to transfer knowledge from one organism to another, we need to utilizesome measure of similarity between them. This similarity can be defined betweensmaller units such as individual proteins or genes from the organisms or higher levelunits. The higher the similarity, the greater the information transfer between them.Hence the notion of similarity is very critical to the results we obtain from such atransfer based method and should be biologically motivated. Our methods enablethe transfer of knowledge using the following mechanisms:
• We use the structural similarity between the individual proteins of the two hostsmeasured using protein sequence alignment. This follows from the biologicalintuition that structurally similar proteins in two different organisms are verylikely to have similar functions. Hence a pathogen that wants to disrupt a spe-cific function will target structurally similar proteins in different hosts.
• Interactome-level similarity, comparing the human PPI graph with the plant PPIgraph. Any biological process in an organism involves the participation of sev-eral proteins and more importantly the interactions between these. By compar-ing the interactomes of different hosts, we are comparing them at the biologicalprocess-level. The components of the two graphs that are highly similar willmost likely correspond to similar processes in the two organisms.
• Distributional similarity between the protein pairs: here, we identify which ofthe human-Salmonella protein pairs are the most similar (hence most relevant) tothe plant-Salmonella protein pairs. This similarity is computed using the featuresof the protein-pairs. Since it is distributional similarity, it involves a comparisonover all protein pairs from both organisms. Only the most relevant human-Salmonella protein pairs are used to build a model.
The main contributions of this work are:
1. We present methods that combine known PPIs from various sources to build amodel for a new task
2. We evaluate our methods quantitatively and our results show the benefits inperformance that are possible if we incorporate the similarity information dis-cussed in the previous paragraphs
3. We present the first machine learning based predictions for plant-SalmonellaPPIs
In the rest of this chapter, we start by describing the host-pathogen PPI datasets weuse in §5.1, followed by a detailed description of our methods in §5.2 and a quantita-tive and qualitative analysis of the results in §5.4.
68

Salmonella
Source host
Target host Salmonella
transfer
known interac2on
predicted interac2on
Figure 5.1: Transfer of PPIs from the source host (for ex: human) to another host, thetarget host (for example Arabidopsis), for the common pathogen, Salmonella.
5.1 Source tasks
As source tasks we used the known PPIs between various other hosts and pathogens.Many of these interactions were obtained from the PHISTO [Tekir et al., 2012] databasewhich reports literature-curated known interactions. For PPIs between human andSalmonella we use the manually literature-curated interactions reported in Schlekeret al. [2012]. Please note that all of these interactions come from biochemical and bio-physical experiments. The details of the dataset used in each approach are shownin Table 5.1 and they are available for download from http://www.cs.cmu.edu/
˜mkshirsa/data/frontiers2014/data.zip . Our first approach is a rule-basedapproach and it uses human-Salmonella PPIs from two sources: the 62 experimentallygenerated PPIs reported in Schleker et al. [2012] and the predicted PPIs from Kshir-sagar et al. [2012]. Please note that this is the only method that uses any predictedPPIs as “ground truth”. All other methods discussed in subsequent sections do notuse any predicted PPIs as source. They use only PPIs validated experimentally bybiochemical and biophysical methods.
Salmonella species/strains considered: The source data that we use for human-Salmonellafrom Schleker et al. [2012] comes from two different strains: Salmonella Typhimuriumstrain LT2 and Salmonella Typhimurium strain SL 1344. One of our three approaches(row-1 of Table 5.1) uses human-Salmonella predicted PPIs. These predicted PPIsfrom Kshirsagar et al. [2012] contain Salmonella proteins from two additional strains:Salmonella enteritidis PT4 and Salmonella Typhi. From henceforth, for the sake ofbrevity, we will refer to proteins from all strains as Salmonella proteins. For Salmonellaproteins, we used the UniprotKB database [UniProt Consortium, 2011] to obtain allproteins from the various strains. For Arabidopsis thaliana proteins, we used the TAIRdatabase [Lamesch et al., 2012].
5.2 Methods
In the previous section, we described the dataset used in our various approaches. Wenow describe the details of the methods we use.
69

APPROACH(ES) SOURCE TASK(S)NUMBER DATASET
FEATURE SETOF PPI CITATION
1: Homologybased
human-Salmonella(known PPI)
62 Schleker et al.
[2012]No feature set.
Heuristics are usedto infer interactions
human-Salmonella(predictions)
190,868 Kshirsagar et al.
[2012]?
2: T-SVM# human-Salmonella(known PPI)
62Schleker et al.
[2012]
(a) Protein sequence k-mers (b) Gene expres-sion from GEO (c) GOterm similarity
3: KMM†-SVM
human-Salmonella(known PPI)
62 Schleker et al.
[2012]
Protein sequencek-mers
human-F. tularensis 1380human-E. coli 32plant-A. tumefaciens 22 PHISTOplant-E. coli 15plant-P. syringae 13plant-Synechocyctis 23
? This source reports predicted PPIs, while the others are all experimentally validated† KMM: Kernel Mean Matching# SVM: Support Vector MachineGO: Gene Ontology
Table 5.1: Datasets used in the various approaches, their sizes and the appropriatecitations
S H
S A
homolog ortholog
known interac3on
predicted interac3on
Gold standard Salmonella-‐Human PPI
Orthologous Salmonella-‐Arabidopsis PPI
(62 pairs)
(25 predicted pairs)
1
2
Figure 5.2: Approach-1 (a) Ortholog based protein interaction inference. ‘S1’ repre-sents a Salmonella protein and S2 is the homolog of S1 or S1 itself. H represents ahuman protein and A represents an Arabidopsis protein that is an ortholog of the hu-man protein.
70

Approach-1 : Homology based transfer
In this approach, we use the sequence similarity between the plant and human proteinsequences to infer new interactions. We use two techniques to predict interactions be-tween plant and Salmonella proteins. The first technique uses plant-human orthologsand the second is based on plant-human homology (sequence alignment scores). Bothtechniques use two sources of interactions: true PPIs from Schleker et al. [2012] andpredicted PPIs from Kshirsagar et al. [2012]. Please note that this is the only methodthat uses any predicted PPIs as “ground truth”.
Homologs and Orthologs (definition): Homologous pairs of genes are related by descentfrom a common ancestral DNA sequence. These can be either orthologs: genes thatevolved from a common ancestral gene by speciation or paralogs: genes separated bythe event of genetic duplication. We obtained orthologs from the InParanoid database[Ostlund et al., 2010]. To find homologous pairs of proteins, we used BLAST sequencealignment with an e-value threshold of 0.01.(a) Host ortholog based predictions: We start with the known human-Salmonella
PPIs. For each interaction, we search for an ortholog of the human protein inArabidopsis. If one exists, we infer an interaction between the Salmonella and theArabidopsis protein. This is similar to finding interologs, with the exception thatwe restrict ourselves to orthologs of the host protein rather than considering allpossible homologs of both the host and pathogen proteins. Figure 5.2 illustratesthis simple heuristic. There are 62 human-Salmonella PPIs in our dataset. Usingthis ortholog based inference for the host proteins, we obtained a total of 25 plant-Salmonella PPIs as some of the human proteins did not have any plant orthologs.The orthologous Arabidopsis proteins for the human proteins were obtained fromthe InParanoid database [Ostlund et al., 2010].
(b) Host graph alignment based predictions: This method uses homologs betweenthe human and plant proteins. Since the set of known PPIs is very small (62 in-teractions), here we use them to generate ‘bootstrap’ interactions. The known 62PPIs are used to build a classifier using the method published in Kshirsagar et al.[2012] to generate a total of 190,868 human-Salmonella PPI predictions. These pre-dicted PPIs form the ‘bootstrap’ PPIs and will be used in a graph-based transferapproach. In this graph-based transfer method, we first align the PPI graphs ofthe two host organisms using NetworkBlast [Sharan et al., 2005]. The humanPPI network was obtained from the HPRD database [Prasad et al., 2009] and theplant-plant PPIs from TAIR database [Lamesch et al., 2012]. The algorithm alignsthe human PPI graph with the plant PPI graph using the pairs of homologousproteins between the two organisms. To find the homologous proteins, we usedBLAST sequence alignment with an e-value threshold of 0.01. Next, we use Net-workBlast to find the graph components that are the most similar across the twographs. We call them the ‘enriched components’. By comparing the interactomesof the two hosts, we are comparing them at the biological process-level. The com-ponents of the two graphs that are highly similar will most likely correspond tosimilar processes in the two organisms. NetworkBlast finds a total of 2329 en-riched protein complex pairs between the two host organisms. Figure 5.3 showsone such enriched protein complex pair: the complex on the left is from Arabidop-sis and the one on the right is from human. Using these we determine the plant
71

Arabidopsis protein complex
Human protein complex
Homology edges
PPI edges
sipA
bootstrap interac7on inferred
plant-‐Salmonella interac7on
Figure 5.3: Approach-1(b) Graph based interaction transfer. The big circles showthe two protein complexes found to be enriched by Network Blast : the Arabidopsisprotein complex on the left, and the human protein complex on the right. The edgeswithin a protein complex are the PPIs within the host organism. The edges connectingthe two protein complexes (i.e the two circles) are the homology edges. The solid lineconnecting sipA with a human protein node is a bootstrap interaction. We use this toinfer the new plant-Salmonella interaction indicated by the dotted line.
proteins that are the most likely targets for the different Salmonella proteins asshown in the Figure 5.3.
For each PPI between a human protein from an enriched protein complex, we in-fer an equivalent PPI between the corresponding plant protein and the Salmonellaprotein (example, sipA in the figure). This filtering procedure gives us a finalof 23,664 plant-Salmonella PPIs. The biological relevance for using the enrichedgraph components lies in the premise that clusters of similarly interacting pro-teins across the two organisms will represent biological processes that have beenconserved in the two organisms. Hence, the proteins in these components are alsolikely to be conserved as pathogen targets.
Approach-2: Transductive Learning
This method considers the target task i.e plant proteins while building a model. Itprovides a way of incorporating the target task information during model construc-tion. Conventional inductive learning approaches such as the Support Vector Ma-chine classifier use only the training examples to build a model. Transductive learn-ing approaches also use the distribution of the unlabeled test examples. They jointlylearn the labels on the test examples while minimizing the error on the labeled train-ing examples. This often results in a good performance, as the classifier has addi-tional information about the unseen test data. In our work here, we use transductivelearning for transfer learning in particular the Transductive Support Vector Machine
72

algorithm (T-SVM) [Joachims, 1999]. The training examples are the source task ex-amples, i.e human-Salmonella protein interactions. We use the target task examples asthe test data.
Training negatives: Since there are 62 known PPIs in the source task, we sample aset of random 6200 human-Salmonella protein pairs to maintain the positive:negativeclass ratio at 1:100.
Figure 5.4 depicts this setting. This method thus builds a model by using datafrom both hosts. The optimization function of T-SVM jointly minimizes the trainingerror on the known human-pathogen interactions and the label assignments on theunknown plant-pathogen interactions. The set of target examples can not be usedentirely as it is very large and makes the T-SVM algorithm very computationally ex-pensive. Hence we randomly sample 1 percent of the target dataset. For the T-SVMbased algorithm to be effective, the kernel function that is used to compute the simi-larity between examples matters a lot. We use a homology-based kernel function thatincorporates the BLAST similarity score between the proteins. Let xis be the feature-vector representing a source task example: the protein pair < ss, hs > where ss isthe Salmonella protein (i.e the pathogen protein) and hs is the host protein. Let thetarget task example be the protein pair < st, at > where at is the Arabidopsis protein;and the corresponding feature vector be xkt . The kernel function k that computes thesimilarity between the given two pairs of proteins (i.e their feature vectors) is definedas shown below.
k(xis, xkt ) = sim(ps, pt) + sim(hs, at) (5.1)
k(xis, xjs) = dot(xis, x
js) (5.2)
k(xit, xjt ) = dot(xit, x
jt ) (5.3)
where sim(m,n) = normalized-BLAST-score(m,n) (5.4)
Equation (5.1) is used in the case where the two protein pairs come from differ-ent tasks. We use homology-distance between the pathogen proteins and the hostproteins to compute the kernel. The homology distance itself is simply the BLASTprotein sequence alignment score. Equation (5.2) and Equation (5.3) show the com-putation when the examples both come from the same task. Here we simply takethe dot product of the two feature vectors. This kernel is symmetric. The similar-ity between two sequences sim(m,n) is computed using the bit-score from BLASTsequence alignment, normalized using the sequence length of the larger protein. Weused the SVMlight package [Joachims, 2008] and incorporated our kernel function intoit. The parameter tuning for T-SVM (the regularization parameter C) was done usingcross validation on the PPIs where we have the true labels. We found C = 0.1 was thebest setting. This best model is subsequently used to generate predictions on all Ara-bidopsis-Salmonella protein-pairs. The model outputs a score indicating the distancefrom the classifier hyperplane. A positive score indicates that the protein-pair is onthe positive side of the hyperplane and hence closer to the known interacting protein-pairs. All such protein-pairs will be considered as potential interactions predicted bythis model.
73

+
+
+
+
+ posi've Salmonella-‐Human PPI nega've Salmonella-‐Human PPI unlabeled Arabidopsis-‐Human PPI
SVM classifier Transduc've SVM (TSVM) classifier
_
_ _ _
_ _
_ _ _
_
Figure 5.4: Transductive Support Vector Machine (SVM) for transfer learning. Thefirst panel shows the conventional SVM classifier. The second panel shows T-SVMwith circles representing unlabeled examples. We use examples from the target taski.e Arabidopsis-Salmonella protein pairs as the unlabeled examples to influence the clas-sifier boundary.
Approach-3: Kernel Mean Matching
Our transfer learning scenario here consist of the following setting: multiple ‘source’tasks with small amounts of labeled data, a single ‘target’ task with no labeled data.The first challenge is to pick the best instances from the source tasks, such that theresultant model when applied on the target task generates high confidence predic-tions. Towards this, we use the instance reweighting technique Kernel Mean Match-ing (KMM). The reweighted source task instances are used to build a kernelized sup-port vector machine (SVM) model, which is applied on the target task data to get thepredicted PPIs. This brings forth the second challenge - selecting appropriate hyper-parameters while building a model for a task with no labeled data. For simplicity wealso use the same set of features across all tasks (protein sequence features). How-ever the data distribution will be different across tasks due to the different organismsinvolved.
This approach is based on instance-transfer where the goal is to pick from eachof the source tasks, the most relevant instances w.r.t the target task. We use a two-step process: (1) the first step does the instance weighting on the source tasks. (2)the second step uses the reweighted instance to build several SVM classifier models– one model for each hyper-parameter setting. To deal with the second challenge, wepresent two heuristic methods to select the best set of hyperparameters.
Step-1: Instance reweighting
The similarity between the source and target data can be expressed using the similar-ity in their distributions PS(x, y) and Pt(x, y). Here PS represents the joint distribu-tion of all source tasks. Since we do not have access to the labels y on the target, wemake a simplifying assumption that there is only a covariate shift between the sourceand target tasks - i.e the conditional distribution P (y|x) is the same for both tasks.Mathematically, PS(x,y)
Pt(x,y) = PS(x)Pt(x) = r(x). Many methods have been proposed for es-
timating the ratio r. Sugiyama et al. [2008] proposed an algorithm Kullback-LeiblerImportance Estimation Procedure (KLIEP) to estimate r directly without estimatingthe densities of the two distributions.
74

We use the nonparametric Kernel Mean Matching (KMM) [Huang et al., 2007],which was originally developed to handle the problem of covariate shift between thetraining and test data distributions. KMM reweighs the training data instances suchthat the means of the training and test data distributions are close in a reproducingkernel Hilbert space (RKHS). This approach does not require distribution estimation.Let xSi ∼ PS and nS be the number of source instances from all source tasks. Letxti ∼ Pt and nt be the number of target instances. Let βi represent the “importance”of the source instances. KMM uses a function based on the maximum mean discrepancystatistic (MMD). In the form written below, it minimizes the difference between theempirical means of the joint source and target distributions.
minβ
∥∥∥∥∥∥ 1
nS
nS∑i=1
βiΦ(xSi )− 1
nt
nt∑j=1
Φ(xtj)
∥∥∥∥∥∥2
(5.5)
⇔ minβ
1
n2S
βTKβ − 2
n2S
κTβ + C (5.6)
subject to βi ∈ [0, B] and∑i
βi ≤ nS (5.7)
where Ki,j = k(xSi , xSj ) and κi =
nSnt
nt∑j=1
k(xSi , xtj) (5.8)
K is the kernel matrix over all the source examples. The function (1) is a quadraticprogram and can be efficiently solved using sequential minimal optimization (SMO),projected gradient based methods. We use the KMM implementation from the Shogun[Sonnenburg et al., 2010] package.
Selecting an appropriate set of source and target instances:Using all instances in the optimization problem in equation (1) is infeasible for tworeasons. The optimization involves the computation of the gram matrix K of O(n2)where n is the number of instances. Typically the total number of protein-proteinpairs between a host-pathogen are of the order of 100 million. Secondly, the totalnumber of labeled source instances is quite small (≈ 1500). This set is likely to getunderweighted (i.e βi ≈ 0) if there are too many unlabeled source instances. To rep-resent the source’s empirical mean, in addition to the labeled instances we randomlysample four times as many unlabeled instances. For the target, we randomly samplednS instances.
Step-2: Model learning
Once we have the optimal set of source instances, we can train a Kernel-SVM modelusing these. Along with the first step, we thus call this two step process KMM-SVM.We pick a kernel-based learning algorithm since we plan to extend our work to dealwith different feature spaces across the tasks. In such a scenario, the only mechanismto operate on the target data is via similarities, i.e the kernel. The dual formulationfor the weighted version of SVM solves the following problem, where the weights βiwere obtained in Step-1.
75

minα
nS∑i=1
αi −1
2
∑i,j
αiαjyiyjK(xSi , xSj ) (5.9)
subject to∑i
αiyi = 0 and βiC ≥ αi ≥ 0 (5.10)
Model selection
Parameter tuning and selecting the best model in the absence of labeled data is a veryhard problem. The model built on the source data cannot be tuned using cross valida-tion on the source data because doing so will optimize it for the source distribution.Hence we developed two heuristic approaches to select the best hyperparameters.The first one uses the expected class-skew on the target task while the second usesreweighted cross-validation.Class-skew based parameter selection:We first built several models by doing a grid-search on the classifier hyper-parameters.There are 3 parameters to tune for the Kernel-SVM: the kernel width γ, the cost pa-rameter C, the weight parameter for the positive class w+. The total number of pa-rameter combinations in our grid-search were 50. We thus had 50 models trained onthe reweighted source data obtained after KMM in Step-1 (Section 5.2). We appliedeach model on the target data and computed the predicted class-skew rpred using thepredicted class labels. The expected class skew based on our understanding of thePPI experimental literature is roughly 1:100 (= rtrue). We ranked all 50 models on thestatistic |rpred − rtrue|. The top k models were selected based on this criteria and aweighted voting ensemble was built using them. This ensemble was used to get thefinal class label on the target data. We used k=5.Aggregating the models and assigning interaction scores:In our experiments, we used k=5 to pick the best models w.r.t the ranking statisticdescribed above. Note that each model gives us a classifier score for every protein-pair in the test data, which can be considered to be the probability of interaction.For k=5, we have five scores for each test protein-pair. These scores were aggregatedusing two criteria:
(a) the majority vote over the five models where each model votes ‘yes’ if the outputprobability score is greater than or equal to 0.5
(b) the averaged of all five probability scores
Spectrum RBF kernel
We used a variant of the spectrum kernel, based on the features used by Dyer et al.[2011] for HIV-human PPI prediction. The kernel uses the n-mers of a given input
sequence and is defined as: knsp(x, x′) = exp−‖φnsp(x)−φnsp(x′)‖2
σ2 , where x, x′ are twosequences over an alphabet Σ. Instead of using the 20 amino acids as the alphabetΣ, we used a classification of the amino-acids. There are seven classes based on theelectrostatic and hydrophobic properties of proteins, i.e |Σ|=7. Here φnsp transforms asequence s into a |Σ|n-dimensional feature-space. One dimension of φnsp correspondsto the normalized frequency of one of the 7n possible strings in s. We use n=2,3,4,5.
76

Features
The features used in each approach are shown in Table 5.1 and discussed in detail in§2.3.
5.3 Negative examples
The PPI datasets from the publicly available databases give us only positive examples.We construct a set of negatives, using a heuristic often used in the PPI predictionliterature. Please refer to §2.4 for background and a detailed discussion on negativeexamples and the approach we take to generate them. Note that the rest of this sectionassumes that you have perused §2.4.
The homology-based transfer method does not directly use any negative exam-ples/ interaction ratios. In the case of T-SVM, while training the transductive model,we use negative examples from the source task. In the case of KMM-SVM, the dataused to build the model comes from the source tasks, where negative examples fromeach source task are used. Next, during the model selection phase we pick the bestmodels based on the interaction ratio of the model over the predictions on the targettask (See Section 5.2 for details). No explicit negative examples are used in this part;the interaction ratio is simply used to pick the best model.
We initially chose a positive:negative class ratio of 1:100 meaning that we expect1 in every 100 random bacteria-human protein pairs to interact with each other. Thishas been a common practice in host-pathogen PPI prediction in the past [Dyer et al.,2007, Tastan et al., 2009, Dyer et al., 2011]. Recently published work [Mukhtar et al.,2011b] involving a yeast-2-hybrid study on plant-bacterial PPIs suggests a higher in-teraction ratio of around 1:1000. Our choice of 1:100 as the class-skew is an overes-timate when considering interactions with all Salmonella genes, but if we restrict thebinding partners to only the so-called Salmonella effector proteins, the ratio we useis reasonable. (There are ≈85 known Salmonella effector genes). Further, a ratio of1:1000 makes it very slow to train the Kernel-SVM and the Transductive SVM mod-els. Nonetheless, we also calculated the predictions for a higher skew of 1:500. Theresults are described in §5.4.Code: The executable files from the packages used to build our methods, and thescripts that we used to run these can be downloaded here: http://www.cs.cmu.edu/˜mkshirsa/data/frontiers2014/code.zip
5.4 Results and Discussion
A quantitative evaluation on the target task i.e plant-Salmonella is currently not fea-sible as there is no known PPI data. Hence for the purpose of evaluation, we usedsome of the PPI datasets as ‘sources’ for building a model and one as the ‘target’. Weevaluate the machine-learning based methods in two settings of transfer: pathogen-level transfer, where the host is fixed to be human and the pathogen is one of variousbacterial species. The second setting host-level transfer, is more relevant and refers tothe case where the pathogen is fixed to be Salmonella and we modify the host species.Since there are few known PPIs involving Salmonella, we are only able to experimentwith mouse as an alternate host. There are 14 known mouse-Salmonella PPIs. Inter-estingly they involve mouse proteins whose human homologs also interact with the
77

same Salmonella proteins - i.e these 14 PPIs have interologs in the human-Salmonelladataset.
The source tasks (i.e training data) and target task (i.e test datasets) are shown inthe Table 5.2. Parameters for all methods are tuned using a class-skew based modelselection similar to the one described in Section 5.2 for the KMM-SVM method. Wecompare the following machine-learning based methods:
• Inductive Kernel-SVM (Baseline): This model assumes that the source and tar-get distributions are identical. All source data is pooled together and used tobuild a single model. For the kernel we used the RBF-spectrum kernel
• Transductive SVM (T-SVM): This is the method described in §5.2
• KMM-SVM: This method is discussed in §5.2
HOST-LEVEL TRANSFER
Source task(s)(training data)
Target task(test data)
Method P† R† F1†
Salmonella-human Salmonella-mouseBaseline 42.8 93.7 58.8T-SVM 45.4 93.7 61.2KMM-SVM 51.7 93.7 66.7
Salmonella-mouse Salmonella-humanBaseline 95.4 33.8 50.0T-SVM 67.5 43.5 52.9KMM-SVM 100.0 35.5 52.0
PATHOGEN-LEVEL TRANSFER
Source task(s)(training data)
Target task(test data)
Method P† R† F1†
Francisella-human,Salmonella-human
Baseline 17.8 12.9 14.9E.coli-human T-SVM 15.0 14.5 14.7
KMM-SVM 25.7 16.1 19.9Francisella-human,
E.coli-humanBaseline 12.9 12.5 12.7
Salmonella-human T-SVM 10.4 15.6 12.5KMM-SVM 15.9 21.9 18.4
†- computed using the default classifier threshold: 0.5The positive:negative class ratio in all datasets was 1:100The performance of a random classifier would be F-score=1
Table 5.2: Performance of the machine learning based methods on various transfersettings. We compare them with a simple baseline: inductive kernel-SVM. We reportprecision (P), recall (R) and f-score (F1). The data that was used to build each of themodels is shown in the first column. The second column shows the target task – thedata on which we evaluate the model. The numbers in bold font indicate the highestperformance in that column (i.e for that metric).
78

The host-level transfer performance is shown in the first two rows of Table 5.2. TheKMM-SVM based method performs much better while transferring from Salmonella-human to Salmonella-mouse. The recall is very high at 93.7 since the mouse-pathogenPPIs are interologs of the human-pathogen PPIs. The precision is not as high as someadditional positives are predicted and we found that they had a high classifier score.These ‘false positives’ are likely to be true interactions. For the reverse setting, T-SVMdoes slightly better than the KMM-SVM and 2 points higher than the baseline. Notethat here, the source data is very small in size with only 14 PPIs. In the pathogen-leveltransfer, on the Salmonella-human target task, the F1 of the KMM-SVM method is thehighest at 19.9 and is 5 points better than the other two methods. On the E.coli-humantask, the performance is 18.4 which is 5.7 points better than the other methods.
A very interesting observation to make from the table is, the performance on thetarget task: Salmonella-human in the two settings. In the host-level transfer, the F1is 52 whereas in the pathogen-level transfer it is much lower at 19.9. The hosts hu-man and mouse are much more similar than the group of bacterial species namely:Salmonella, E. coli and F. tularensis. The source tasks are indeed very critical in deter-mining the performance on the target.
Analysis
We apply the models trained using the procedures from previous sections on Ara-bidopsis-Salmonella protein-pairs to get predictions for potential interactions. The ho-mology based approach does not assign any confidence scores to the predictionswhile both T-SVM and KMM-SVM allow us to obtain a score for every predictedinteraction. All predictions from T-SVM with a positive score (>0) are considered tobe interacting. For the KMM-SVM method, we filter the predictions using a thresholdof 0.7 on the averaged probability-score. (See Section 5.2 for details on the probabilityscore computation for the KMM-SVM method). We chose this threshold of 0.7 sinceall positives in our training data are assigned a score ≥0.7 by the classifier model.The full lists of predicted interactions from all three approaches are available at thefollowing link: http://www.cs.cmu.edu/˜mkshirsa/data/frontiers2014/predictions.zip.
The total number of PPI predictions based on the score thresholds described aboveare: 106,807 for homology-based, 1088 for T-SVM and 163,644 from KMM-SVM. Hun-dreds of thousands of interacting pairs may not be likely and we therefore expect thatmany of the predictions are likely to be false positives (FPs). We would like to empha-size that, by ranking the predictions on the classifier scores and picking only the topfew we are likely to filter out most of the false positives, since the machine learningmodels are expected to score FPs lower than the true positives. The threshold of 0.7for KMM-SVM was chosen just to ensure consistency with the threshold that we ob-served in the training data (i.e in the known interactions). If one considers say the top10% of the predictions from the KMM-SVM method, we have 1636 PPIs over ≈1300unique Arabidopsis proteins and 5 Salmonella proteins. Choosing by thresholding theprediction score is one way to select potential interactions for further scrutiny. An-other approach is to analyze the predictions based on the biological functions one isinterested in. To demonstrate the type of biological functions that are represented inthe predictions, we performed GO term enrichment analysis of the Arabidopsis pro-teins involved in the predictions. We can then look at Arabidopsis genes with the most
79

4305
189 KMM-‐SVM Homology based
T-‐SVM
Approach Homology T-‐SVM KMM-‐SVM
# predicted interac3ons
106,807 1088 163,644
# PPIs involving effectors
72461
718
163,397
# unique arabidopsis
genes
1107
92
25124
# unique Salmonella
genes
221
34
31
Figure 5.5: Overlap amongst the novel PPI predictions from each approach. All pre-dictions from the homology based approach and the T-SVM are shown. For theKMM-SVM method, we filter the predictions using a threshold of 0.7 on the inter-action probability reported by the classifier. We picked this threshold based on theinteraction probabilities reported on the known interactions.
enriched GO terms and what their predicted Salmonella partners are.A Venn diagram depicting the overlap between the predicted pairs of proteins in-
teracting according to the three approaches is shown in Figure 5.5. The PPIs reportedby each approach are quite different from the others. Only 189 are shared betweenT-SVM and KMM-SVM and 4305 between the homology approach and KMM-SVM.No overlap was found between the homology approach and the T-SVM approaches.These relatively small overlaps are due to the different input sources (tasks) usedby each approach. Further, the machine-learning based approaches KMM-SVM andT-SVM use a discriminative model which employs negative examples whereas theheuristics based approach does not use any such negative data and hence has a smalloverlap with the other two. The two machine-learning based approaches differ dueto the use of different kernels. The KMM-SVM approach is the only approach thatshows overlap in predictions to both, the heuristics and the T-SVM approaches.
Because the ratio of 1 positive to 100 negative pairs likely overestimates the num-ber of interactions, we next changed this ratio to 1:500 and generated a new model. Asexpected, a much smaller number of pairs are predicted namely, 6035. This is a moremanageable list and the predictions of the new model are provided at http://www.cs.cmu.edu/˜mkshirsa/data/frontiers2014/predictions_class_skew_500.txt.
Qualitative analysis of predicted interactions
As with any predictions, experimental validation is ultimately needed to verify them.The choice depends on the interest of the experimentalist. Here we have chosen fordiscussion a few predictions that are interesting to us, but we encourage the reader tolook at the list of predictions for others of potential biological interest.
We calculated Gene Ontology (GO) enrichment in the Arabidopsis proteins pre-dicted to be targeted by the Salmonella proteins. We are interested in analyzing thecharacteristics of the plant proteins predicted to be the most popular targets for patho-genesis. We defined the ‘popular targets’ using the following criteria: (a) the Arabidop-sis protein is predicted to be targeted by at least 3 Salmonella effectors with a proba-
80

bility greater than 0.9 and (b) the GO term annotations of the Arabidopsis protein aresignificantly enriched (with a p-value of <0.001 as obtained by GO enrichment anal-ysis using FuncAssociate [Berriz et al., 2003]). There are a total of 5247 Arabidopsisproteins satisfying these criteria. In Table 5.5, we show 20 Arabidopsis genes selectedrandomly from this set of highly targeted Arabidopsis proteins. In Table 5.3, we showthe list of all enriched GO terms.
For each gene we show the description and the enriched GO annotations. Amongthe presented Arabidopsis proteins, nearly one third are transcription factors. Thesefunction e.g. in hormone-mediated signalling pathways. It has been reported thatjasmonic acid and ethylene signaling pathways are involved in plant defense re-sponse against Salmonella [Schikora et al., 2008]. Other examples that highlight therole of transcription factors in plant-pathogen interaction are e.g. that a Xanthomonaseffector protein targets an ethylene responsive transcription factor (ERF) in tomatoto inhibit ethylene induced transcription [Kim et al., 2013] and systemic immunityin barley induced by Xanthomonas and Pseudomonas bacteria may involve WRKY andERF-like transcription factors [Dey et al., 2014]. Further, actin-11 and actin-relatedproteins involved in actin polymerization and depolymerization are obtained. It iswell known that Salmonella translocates effectors into the mammalian host cell in or-der to interact with actin and e.g. modify the cell cytoskeleton to allow bacterial entry(for review see Schleker et al. [2012]). Our analysis revealed growth regulating factor1 (GRF1)-interacting factor 2, a transcriptional co-activator which is part of a regu-latory complex with GRF1 and microRNA (miRNA) 396. MiRNAs are involved inplant disease resistance to bacteria and miRNA396 has been shown to be upregulatedin plants upon flg22 treatment [Li et al., 2010]. Liu et al. [2014] reported that putativeGRF1 targets in Arabidopsis are heavily involved in biosynthetic and metabolic path-ways, e.g. phenylpropanoid, amino acids and lignin biosynthesis as well as planthormone signal transduction indicating the role of GRF1 in plant defense mecha-nisms. Other examples of predicted interactions and more details of their possiblerelevance in Salmonella-plant interplay are discussed in the our other work [Schlekeret al., 2015].
Conclusions and Future work
In this section, we addressed the challenge of predicting the Salmonella-Arabidopsisinteractome in the absence of any experimentally known interactions. Previous workin this area was based purely on homology between human and Arabidopsis proteinsand was therefore limited to proteins that do display sequence similarity. Due to thelarge divergence between the two organisms, this approach neglects a large fraction ofpotential Arabidopsis targets. We therefore presented here three different sophisticatedcomputational and machine learning methods to predict hereto unknown Salmonella-plant interactions from a relatively small list of known Salmonella-human interactions.This is a very challenging task because it is not possible to quantitatively validate thepredictions. Nonetheless, the predictions provide a gold-mine for discovery becausethey provide experimentally testable hypotheses on the communication mechanismsbetween plant and Salmonella without restriction to known effectors in the pathogenor sequences of similarity to those observed in better studied eukaryotic organisms.With these advantages comes a set of limitations to be aware of.
Since machine learning methods need some known interactions to evaluate the
81

models on, and to pick the best set of predictions, their application in this currentcontext has limitations. For example, we can obtain different predictions from ourmethods by varying the parameters, especially the class skew (we studied the ratios1:100 and 1:500). Because there are currently no known Salmonella-plant interactions,we are not able to quantify which of these sets of predictions is more reliable. Aug-menting the predictions with some other biological information from the target taskcan help in picking the most plausible PPIs. This is a direction for future research.Further,
1. The interactome predicted by each method is not the true interactome, but is aset of predictions. There will be false positive and false negative interactions.Thus, each individual prediction has to be considered a hypothesis not a fact.
2. In line with point 1 above, the size of the predicted interactomes does not nec-essarily relate to the true interactome. We dont know how many interactionsto expect. Our different predictions vary greatly in size, with one method pre-dicting only one thousand interactions, while others predict more than 100,000interactions. While it is more likely that smaller numbers of interactions aremore likely, it does not mean that this method is inherently better than the othermethods.
3. The size of the predicted interactions list also depends on a critical parame-ter, the positive to negative class ratio. This parameter is important but it istuneable, so the methods validity is not dependent on its choice. However, itis important to appreciate that the predictions will differ greatly when this pa-rameter is changed. Thus, biological insight in choosing predictions to validatestill needs to be applied, regardless of the prior choice of ratio in generating themodel.
These general limitations in the context of the specific results of the models pre-sented here translate to the following issues: The data presented for the KMM-SVMmodel indicate that 163,644 PPIs are predicted (Figure 5.5). This is of the same or-der of magnitude as the number of false positives that would be predicted, given thereported false positive rate of the method that indicate ≈180,000 false positive PPIswould be expected. This raises the possibility that the bulk of the predictions maybe false positives. The data presented for the KMM-SVM model also indicates that25,124 distinct Arabidopsis genes participate in PPIs with 31 distinct Salmonella genes(Figure 5.5). This implies that 91% of the Arabidopsis protein-coding gene complement(TAIR10: 27,416 genes - http://www.arabidopsis.org/portals/genAnnotation/gene_structural_annotation/annotation_data.jsp) enters into productiveinteraction with only 31 Salmonella proteins. It also implies that, on average, each in-teracting Salmonella protein is capable of productive interaction with over 5,000 Ara-bidopsis proteins. It is unlikely that this is the case, again suggesting that a large num-ber of false positives have to be expected.
82

GO term Description
GO:0003676 nucleic acid bindingGO:0003677 DNA bindingGO:0003700 sequence-specific DNA binding TF activityGO:0003723 RNA bindingGO:0003735 structural constituent of ribosomeGO:0003755 peptidyl-prolyl cis-trans isomerase activityGO:0003779 actin bindingGO:0003899 DNA-directed RNA polymerase activityGO:0004298 threonine-type endopeptidase activityGO:0004693 cyclin-dependent protein serine/threonine kinase activityGO:0004842 ubiquitin-protein transferase activityGO:0004871 signal transducer activityGO:0005484 SNAP receptor activityGO:0005507 copper ion bindingGO:0005509 calcium ion bindingGO:0005515 protein bindingGO:0005525 GTP bindingGO:0005576 extracellular regionGO:0005622 intracellular regionGO:0005634 nuclear envelopeGO:0005839 proteasome core complexGO:0005840 ribosomeGO:0006351 transcription, DNA-templatedGO:0006355 regulation of transcription, DNA-templatedGO:0006412 translationGO:0006413 translational initiationGO:0006457 protein foldingGO:0006511 ubiquitin-dependent protein catabolic processGO:0007264 small GTPase mediated signal transductionGO:0007267 cell-cell signalingGO:0008270 zinc ion bindingGO:0008794 arsenate reductase (glutaredoxin) activityGO:0009408 response to heatGO:0009409 response to coldGO:0009414 response to water deprivationGO:0009570 chloroplast stromaGO:0009579 thylakoidGO:0009651 response to salt stressGO:0009733 response to auxinGO:0008233 peptidase activity
Table 5.3: List of all enriched GO terms obtained by applying enrichment analysis toolFuncAssociate (Berriz et al. [2003]) on the set of highly targeted Arabidopsis proteins(i.e Arabidopsis proteins predicted to interact with at least 3 Salmonella effectors). Theshown terms had a p-value less than 0.001.
83

GO term Description
GO:0009737 response to abscisic acidGO:0009739 response to gibberellinGO:0009751 response to salicylic acidGO:0009753 response to jasmonic acidGO:0009828 plant-type cell wall looseningGO:0009873 ethylene mediated signaling pathwayGO:0010200 response to chitinGO:0015031 protein transportGO:0015035 protein disulfide oxidoreductase activityGO:0016491 oxidoreductase activityGO:0016607 nuclear speckGO:0016762 xyloglucan:xyloglucosyl transferase activityGO:0022626 cytosolic ribosomeGO:0022627 cytosolic small ribosomal subunitGO:0042254 ribosome biogenesisGO:0042742 defense response to bacteriumGO:0043565 sequence-specific DNA bindingGO:0045454 cell redox homeostasisGO:0045892 negative regulation of transcription, DNA-templatedGO:0045893 positive regulation of transcription, DNA-templatedGO:0046686 response to cadmium ionGO:0046872 metal ion bindingGO:0051726 regulation of cell cycle
Table 5.4: Table 5.3 continued from above ...
84

Arabidopsis(TAIR id)
Protein name/gene Enriched Gene Ontology annotations Corresp. GOterms
AT1G01030 B3 domain containingtranscription factor
sequence-specific DNA bindingtranscription factor activity ; regulation oftranscription, DNA-templated
GO:0003700GO:0006355
AT1G06160 Ethylene-responsivetranscription factor ERF094
DNA binding ; sequence-specific DNAbinding transcription factor activity ;regulation of transcription fromRNA-polymerase II promoter ; response tojasmonic acid stimulus
GO:0003677GO:0003700GO:0006355GO:0009753
AT1G01060 Myb-related putativetranscription factor
response to cadmium ion ; response to saltstress ; response to auxin stimulus ;response to cold
GO:0046686GO:0009651GO:0009733GO:0009409
AT1G13180 Actin-related protein 3 actin binding GO:0003779AT2G40220 Ethylene-responsive
transcription factor ABI4.Protein glucose insensitive6
DNA binding ; response to waterdeprivation ; positive regulation oftranscription, DNA-dependent ;sequence-specific DNA binding
GO:0003677GO:0009414GO:0045893GO:0043565
AT2G46400 Putative WRKYtranscription factor 46
response to chitin GO:0010200
AT1G01080 Ribonucleoprotein,putative
nucleic acid binding ; RNA binding GO:0003676GO:0003723
AT3G12110 Actin-11 chloroplast stroma GO:0009570AT3G56400 Probable WRKY
transcription factor 70response to salicylic acid stimulus ;sequence-specific DNA bindingtranscription factor activity ; protein aminoacid binding
GO:0009751GO:0003700GO:0005515
AT1G01090 Pyruvate dehydrogenaseE1 component subunitalpha-3, chloroplastic
chloroplast stroma GO:0009570
AT4G09570 Ca-dependent proteinkinase 4
protein amino acid binding GO:0005515
AT1G01150 Homeodomain-like proteinwith RING-type zinc fingerdomain
zinc ion binding ; regulation oftranscription, DNA-templated
GO:0008270GO:0006355
AT4G18170 Probable WRKYtranscription factor 28
regulation of transcription, DNA-templated; sequence- specific DNA bindingtranscription factor activity
GO:0006355GO:0003700
AT1G01160 GRF1-interacting factor 2 protein amino acid binding GO:0005515AT1G01200 Ras-related protein RABA3 GTP binding; small GTPase mediated signal
transduction ; protein transportGO:0005525GO:0007264GO:0015031
AT5G47220 Ethylene-responsivetranscription factor 2
positive regulation of transcription,DNA-dependent ; ethylene mediatedsignaling pathway
GO:0045893GO:0009873
AT1G01250 Ethylene-responsive TFERF023
sequence-specific DNA bindingtranscription factor activity ; nuclearenvelope
GO:0003700GO:0005634
AT1G01350 Zinc finger CCCHdomain-containing protein1
nucleic acid binding ; zinc ion binding GO:0003676GO:0008270
AT1G01370 Histone H3-likecentromeric protein HTR12
DNA binding ; protein amino acid binding GO:0003677GO:0005515
Table 5.5: GO terms that were enriched in the most targetted Arabidopsis proteinsin our predictions. To get this list, we performed a GO enrichment analysis usingthe FuncAssociate [Berriz et al., 2003]. We then procure the set of Arabidopsis geneswhich correspond to the enriched GO terms; i.e GO terms with a p-value of < 0.001.We further filter this set to include only those Arabidopsis genes predicted to interactwith at least 3 Salmonella effector proteins. In this table, we show around 20 suchArabidopsis genes for the lack of space. The remaining are available via the downloadlink.
85


Chapter 6
Frame-Semantic Role Labeling withHeterogeneous Annotations
Semantic role labeling (SRL) is a task in natural language processing concerned withthe computational detection of meaning in sentences. This sentence-level semanticanalysis of text characterizes events and relations in the sentence. The predicate (typ-ically a verb) establishes “what” took place, and other sentence components expressthe participants in the event, as well as further event properties. Consider the sen-tence:
Christopher Nolan directed the movie Batman Begins for Warner Bros in 2005.
The verb direct is the predicate connecting the ‘who’: ‘Christopher Nolan’ with the‘what’: ‘the movie Batman Begins’ and ‘when’: ‘2005’. Each of these constituents hasa role indicating their semantic meaning in the context of the sentence and the predi-cate. ‘Christopher Nolan’ is the Artist, ‘the movie Batman Begins’ is the Production,‘Warner Bros’ is the Studio and ‘2005’ is the Time. The predicate itself is also as-signed a label to disambiguate its’ sense in the sentence. For instance, direct couldalso appear in the sense of ‘aim’ or ‘target’: Let me direct your attention to this thesis’sappendix.
Recently, several corpora have been manually annotated with semantic roles re-sulting in resources such as FrameNet [Baker et al., 1998, Fillmore and Baker, 2009]1, PropBank [Palmer et al., 2005], NomBank. These have enabled the development ofstatistical approaches for SRL and it has become a well-defined task with a substantialbody of work and comparative evaluation. The roles and predicates from SRL can beused in many downstream applications such as question answering, summarizationof text, translation of sentences, information retrieval and extraction (search engines),dialogue systems etc.
The use of SRL systems in real-world applications has thus far been limited, mainlydue to their limited coverage of semantics. The high cost of semantic structure anno-tation is one of the major obstacles to obtaining a broad coverage. The annotateddatasets that exist are often small, hindering the accuracy and domain robustness ofmodels trained on them. However, low-resource tasks may benefit from exploitingout-of-domain annotated data, as well as data with different (but related) forms of an-notation, for additional training data or features.
1http://framenet.icsi.berkeley.edu
87

do you want me to hold off until I finish July and August ?
Experiencer
Event
End_pointAgent
ACTIVITY_FINISH: complete.v conclude.v finish.v …HOLDING_OFF_ON: hold off.v wait.v
DESIRING: eager.a hope.n hope.v interested.a itch.v want.v wish.n wish.v …Focal_participant
Agent
Desirable_action: ∅
Activity
A1
A1
A0 A1 finish-v-01
stay-v-01
want-v-01
A3
A0
FrameNet
the people really want us to stay the course and finish the job .PropBank
AM-ADV
Figure 6.1: Part of a sentence from FrameNet full-text annotation. 3 frames and theirarguments are shown: DESIRING is evoked by want, ACTIVITY FINISH by finish, andHOLDING OFF ON by hold off. Thin horizontal lines representing argument spans arelabeled with role names. (Not shown: July and August evoke CALENDRIC UNIT andfill its Unit role.)
In this work [Kshirsagar et al., 2015b], we address the argument identification (aform of SRL), which is a subtask of frame-semantic parsing. Given a sentence, frame-semantic parsing methods [Gildea and Jurafsky, 2002, Das et al., 2014] find and mapthe predicates to the frames they evoke, and for each frame, find and label its ar-gument phrases with frame-specific roles. An example appears in figure 6.1, whichwill be explained in detail in §6.1. This task is challenging because there are only afew thousand fully annotated sentences for supervised training. Our contribution ad-dresses the paucity of annotated data for training using standard domain adaptationtechniques. We exploit three annotation sources:
• the frame-to-frame relations in FrameNet, by using hierarchical features to sharestatistical strength among related roles (§6.2),
• FrameNet’s corpus of partially-annotated exemplar sentences, by using “frus-tratingly easy” domain adaptation (§6.2), and
• a PropBank-style SRL system, by using guide features (§6.2).2
These expansions of the training corpus and the feature set for supervised argumentidentification are integrated into SEMAFOR [Das et al., 2014], the leading open-sourceframe-semantic parser for English. We observe a 4% F1 improvement in argumentidentification on the FrameNet test set, leading to a 1% F1 improvement on the fullframe-semantic parsing task. Our code and models are available at http://www.ark.cs.cmu.edu/SEMAFOR/.
6.1 FrameNet
FrameNet represents events, scenarios, and relationships with an inventory of frames(such as SHOPPING and SCARCITY). Each frame is associated with a set of roles (orframe elements) called to mind in order to understand the scenario, and lexical pred-icates (verbs, nouns, adjectives, and adverbs) capable of evoking the scenario. Forexample, the BODY MOVEMENT frame has Agent and Body part as its core roles, and
2Preliminary experiments training on PropBank annotations mapped to FrameNet via SemLink1.2.2c [Bonial et al., 2013] hurt performance, likely due to errors and coverage gaps in the mappings.
88

do you want me to hold off until I finish July and August ?
Experiencer
Event
End_pointAgent
ACTIVITY_FINISH: complete.v conclude.v finish.v …HOLDING_OFF_ON: hold off.v wait.v
DESIRING: eager.a hope.n hope.v interested.a itch.v want.v wish.n wish.v …Focal_participant
Agent
Desirable_action: ∅
Activity
A1
A1
A0 A1 finish-v-01
stay-v-01
want-v-01
A3
A0
FrameNet
the people really want us to stay the course and finish the job .PropBank
AM-ADV
Figure 6.2: A PropBank-annotated sentence from OntoNotes [Hovy et al., 2006]. ThePB lexicon defines rolesets (verb sense–specific frames) and their core roles: e.g.,finish-v-01 ‘cause to stop’, A0 ‘intentional agent’, A1 ‘thing finishing’, and A2‘explicit instrument, thing finished with’. (finish-v-03, by contrast, means ‘applya finish, as to wood’.) Clear similarities to the FrameNet annotations in figure 6.1 areevident, though PB uses lexical frames rather than deep frames and makes some dif-ferent decisions about roles (e.g., want-v-01 has no analogue to Focal participant).
lexical entries including verbs such as bend, blink, crane, and curtsy, plus the nounuse of curtsy. In FrameNet 1.5, there are over 1,000 frames and 12,000 lexical predi-cates.
Hierarchy
The FrameNet lexicon is organized as a network, with several kinds of frame-to-frame relations linking pairs of frames and (subsets of) their arguments [Ruppen-hofer et al., 2010]. In this work, we consider two kinds of frame-to-frame relations:
Inheritance: E.g., ROBBERY inherits from COMMITTING CRIME, which inherits fromMISDEED. Crucially, roles in inheriting frames are mapped to corresponding rolesin inherited frames: ROBBERY.Perpetrator links to COMMITTING CRIME.Perpetrator,which links to MISDEED.Wrongdoer, and so forth. Another example is: PUNCTUAL PERCEPTION
(e.g., glimpse.v) inherits from PERCEPTION EXPERIENCE (e.g., see.v), which inheritsfrom PERCEPTION. Other frames inheriting from PERCEPTION include SENSATION
(e.g., sight.n) and BECOMING AWARE (e.g., notice.v). PUNCTUAL PERCEPTION.Perceiverlinks to PERCEPTION EXPERIENCE.Perceiver passive, which links to PERCEPTION.Perceiver,which links to SENSATION.Perceiver passive and BECOMING AWARE.Cognizer.
Subframe: This indicates a subevent within a complex event. E.g., the CRIMINAL PROCESS
frame groups together subframes ARREST, ARRAIGNMENT and TRIAL. CRIMINAL PROCESS.Defendant,for instance, is mapped to ARREST.Suspect, TRIAL.Defendant, and SENTENCING.Convict.
We say that a parent of a role is one that has either the Inheritance or Subframerelation to it. There are 4,138 Inheritance and 589 Subframe links among role typesin FrameNet 1.5.
Related work
Prior work has considered various ways of grouping role labels together in order toshare statistical strength. Matsubayashi et al. [2009] observed small gains from usingthe Inheritance relationships and also from grouping by the role name (SEMAFORalready incorporates such features). Johansson [2012] reports improvements in SRLfor Swedish, by exploiting relationships between both frames and roles. Baldewein
89

Full-Text Exemplarstrain test train test
Sentences 2,780 2,420 137,515 4,132Frames 15,019 4,458 137,515 4,132Overt argu-ments
25,918 7,210 278,985 8,417
TYPES
Frames 642 470 862 562Roles 2,644 1,420 4,821 1,224Unseen frames vs. train: 46 0Roles in unseen frames vs. train: 178 0Unseen roles vs. train: 289 38Unseen roles vs. combined train: 103 32
Table 6.1: Characteristics of the training and test data. (These statistics exclude thedevelopment set, which contains 4,463 frames over 746 sentences.)
et al. [2004] learn latent clusters of roles and role-fillers, reporting mixed results. Ourapproach is described in §6.2.
Annotations
Statistics for the annotations appear in table 6.1.Full-text (FT): This portion of the FrameNet corpus consists of documents and hasabout 5,000 sentences for which annotators assigned frames and arguments to asmany words as possible. Beginning with the SemEval-2007 shared task on FrameNetanalysis, frame-semantic parsers have been trained and evaluated on the full-text data[Baker et al., 2007, Das et al., 2014].3 The full-text documents represent a mix of genres,prominently including travel guides and bureaucratic reports about weapons stock-piles.Exemplars: To document a given predicate, lexicographers manually select corpusexamples and annotate them only with respect to the predicate in question. These singly-annotated sentences from FrameNet are called lexicographic exemplars. There areover 140,000 sentences containing argument annotations and relative to the FT dataset,these contain an order of magnitude more frame annotations and over two orders ofmagnitude more sentences. As these were manually selected, the rate of overt ar-guments per frame is noticeably higher than in the FT data. The exemplars formedthe basis of early studies of frame-semantic role labeling [e.g., Gildea and Jurafsky,2002, Thompson et al., 2003, Fleischman et al., 2003, Litkowski, 2004, Kwon et al.,2004]. Exemplars have not yet been exploited successfully to improve role labelingperformance on the more realistic FT task.4
3Though these were annotated at the document level, and train/development/test splits are by doc-ument, the frame-semantic parsing is currently restricted to the sentence level.
4Das and Smith [2011, 2012] investigated semi-supervised techniques using the exemplars andWordNet for frame identification. Hermann et al. [2014] also improve frame identification by mappingframes and predicates into the same continuous vector space, allowing statistical sharing.
90

PropBank
PropBank [PB; Palmer et al., 2005] is a lexicon and corpus of predicate–argumentstructures that takes a shallower approach than FrameNet. FrameNet frames clus-ter lexical predicates that evoke similar kinds of scenarios In comparison, PropBankframes are purely lexical and there are no formal relations between different predi-cates or their roles. PropBank’s sense distinctions are generally coarser-grained thanFrameNet’s. Moreover, FrameNet lexical entries cover many different parts of speech,while PropBank focuses on verbs and (as of recently) eventive noun and adjectivepredicates. An example with PB annotations is shown in figure 6.2.
6.2 Model
We use the model from SEMAFOR [Das et al., 2014], detailed in §6.2, as a startingpoint. We experiment with techniques that augment the model’s training data (§6.2)and feature set (§6.2, §6.2).
Baseline
In SEMAFOR, the argument identification task is treated as a structured predictionproblem. Let the classification input be a dependency-parsed sentence x, the token(s)p constituting the predicate in question, and the frame f evoked by p (as determinedby frame identification). We use the heuristic procedure described by [Das et al.,2014] for extracting candidate argument spans for the predicate; call this spans(x, p, f).spans always includes a special span denoting an empty or non-overt role, denoted ∅.For each candidate argument a ∈ spans(x, p, f) and each role r, a binary feature vectorφ(a,x, p, f, r) is extracted. We use the feature extractors from [Das et al., 2014] as abaseline, adding additional ones in our experiments (§6.2–§6.2). Each a is given areal-valued score by a linear model:
scorew(a | x, p, f, r) = w>φ(a,x, p, f, r) (6.1)
The model parameters w are learned from data (§6.3).Prediction requires choosing a joint assignment of all arguments of a frame, re-
specting the constraints that a role may be assigned to at most one span, and spans ofovert arguments must not overlap. Beam search, with a beam size of 100, is used tofind this argmax.5
Hierarchy Features
We experiment with features shared between related roles of related frames in or-der to capture statistical generalizations about the kinds of arguments seen in thoseroles. Our hypothesis is that this will be beneficial given the small number of trainingexamples for individual roles.
All roles that have a common parent based on the Inheritance and Subframerelations will share a set of features in common. Specifically, for each base feature φ
5Recent work has improved upon global decoding techniques [Das et al., 2012, Tackstrom et al.,2015]. We expect such improvements to be complementary to the gains due to the added features anddata reported here.
91

which is conjoined with the role r in the baseline model (φ ∧ ”role=r”), and for eachparent r′ of r, we add a new copy of the feature that is the base feature conjoined withthe parent role, (φ ∧ ”parent role=r′”). We experimented with using more than onelevel of the hierarchy (e.g., grandparents), but the additional levels did not improveperformance.
Domain Adaptation and Exemplars
Daume [2007] proposed a feature augmentation approach that is now widely usedin supervised domain adaptation scenarios. We use a variant of this approach. LetDex denote the exemplars training data, andDft denote the full text training data. Forevery feature φ(a,x, p, f, r) in the base model, we add a new feature φft(·) that firesonly if φ(·) fires and x ∈ Dft. The intuition is that each base feature contributes both a“general” weight and a “domain-specific” weight to the model; thus, it can exhibit ageneral preference for specific roles, but this general preference can be fine-tuned forthe domain. Regularization encourages the model to use the general version over thedomain-specific, if possible.
Guide Features
Another approach to domain adaptation is to train a supervised model on a sourcedomain, make predictions using that model on the target domain, then use thosepredictions as additional features while training a new model on the target domain.The source domain model is effectively a form of preprocessing, and the features fromits output are known as guide features [Johansson, 2013, Kong et al., 2014].6
In our case, the full text data is our target domain, and PropBank and the ex-emplars data are our source domains, respectively. For PropBank, we run the SRLsystem of Illinois Curator 1.1.4 [Punyakanok et al., 2008]7 on verbs in the full-textdata. For the exemplars, we train baseline SEMAFOR on the exemplars and run it onthe full-text data.
We use two types of guide features: one encodes the role label predicted by thesource model, and the other indicates that a span a was assigned some role. For theexemplars, we use an additional feature to indicate that the predicted role matchesthe role being filled.
6.3 Learning
Following SEMAFOR, we train using a local objective, treating each role and spanpair as an independent training instance. We have made two modifications to train-ing which had negligible impact on full-text accuracy, but decreased training timesignificantly:8
6This is related to the technique of model stacking, where successively richer models are trainedby cross-validation on the same dataset [e.g., Cohen and Carvalho, 2005, Nivre and McDonald, 2008,Martins et al., 2008].
7http://cogcomp.cs.illinois.edu/page/software_view/SRL8With SEMAFOR’s original features and training data, the result of the above changes is that full-text
F1 decreases from 59.3% to 59.1%, while training time (running optimization to convergence) decreasesfrom 729 minutes to 82 minutes.
92

• We use the online optimization method AdaDelta [Zeiler, 2012] with minibatches,instead of the batch method L-BFGS [Liu and Nocedal, 1989]. We use mini-batches of size 4,000 on the full text data, and 40,000 on the exemplar data.
• We minimize squared structured hinge loss instead of a log-linear loss.
Let ((x, p, f, r), a) be the ith training example. Then the squared hinge loss isgiven by Lw(i) =(
maxa′
w>φ(a′,x, p, f, r)
+1a′ 6= a
−w>φ(a,x, p, f, r)
)2
We learn w by minimizing the `2-regularized average loss on the dataset:
w∗ = argminw
1
N
N∑i=1
Lw(i) +1
2λ‖w‖22 (6.2)
6.4 Experimental Setup
We use the same FrameNet 1.5 data and train/test splits as Das et al. [2014]. Auto-matic syntactic dependency parses from MSTParserStacked [Martins et al., 2008] areused, as in Das et al. [2014].
Preprocessing. Out of 145,838 exemplar sentences, we removed 4,191 sentences whichhad no role annotations (under the assumption that these are likely to be incompleteannotations). We removed sentences that appeared in the full-text data. We alsomerged spans which were adjacent and had the same role label.
Hyperparameter tuning. We determined the stopping criterion and the `2 regular-ization parameter λ by tuning on the FT development set, searching over the follow-ing values for λ: 10−5, 10−7, 10−9, 10−12.
Evaluation. A complete frame-semantic parsing system involves frame identifica-tion and argument identification. We perform two evaluations: one assuming gold-standard frames are given, to evaluate argument identification alone; and one usingthe output of the system described by Hermann et al. [2014], the current state-of-the-art in frame identification, to demonstrate that our improvements are retained whenincorporated into a full system.
6.5 Results
Argument Identification. We present precision, recall, and F1-measure microaver-aged across the test instances in table 6.2, for all approaches. The evaluation usedin Das et al. [2014] assesses both frames and arguments; since our focus is on SRL,we only report performance for arguments, rendering our scores more interpretable.Under our argument-only evaluation, the system of Das et al. [2014] gets 59.3% F1.
The first block shows baseline performance. The next block shows the benefit ofFrameNet hierarchy features (+1.2% F1). The third block shows that using exemplars
93

Training Configuration Model P R F1
(Features) Size (%) (%) (%)
FT (Baseline) 1.1 65.6 53.8 59.1
FT (Hierarchy) 1.9 67.2 54.8 60.4
Exemplarsguide−−−→ FT 1.2 65.2 55.9 60.2
FT+Exemplars (Basic) 5.0 66.0 58.2 61.9FT+Exemplars (DA) 5.8 65.7 59.0 62.2
PB-SRLguide−−−→ FT 1.2 65.0 54.8 59.5
Combining the best methods
PB-SRLguide−−−→ FT+Exemplars 5.5 67.4 58.8 62.8
FT+Exemplars (Hierarchy) 9.3 66.0 60.4 63.1
Table 6.2: Argument identification results on the full-text test set. Model size is inmillions of features.
as training data, especially with domain adaptation, is preferable to using them asguide features (2.8% F1 vs. 0.9% F1). PropBank SRL as guide features offers a small(0.4% F1) gain.
0 200 400 600 800 1000 1200 1400
050
100
150
Frame Element, ordered by test set frequency
Test
Exa
mpl
es
Figure 6.3: Frequency of each role appearing in the test set.
The last two rows of table 6.2 show the performance upon combining the bestapproaches. Both use full-text and exemplars for training; the first uses PropBankSRL as guide features, and the second adds hierarchy features. The best result is thelatter, gaining 3.95% F1 over the baseline.
Role-level evaluation. Figure 6.4 shows F1 per frame element, for the baseline andthe three best models. Each x-axis value is one role, sorted by decreasing frequency
94

0 200 400 600 800 1000 1200 1400
0.0
0.2
0.4
0.6
0.8
Frame Element, ordered by test set frequency
F1
Baseline (FT)FT + ExemplarsFT + Exemplars + PBFT + Exemplars + Siblings
Figure 6.4: F1 for each role appearing in the test set, ranked by frequency. F1 valueshave been smoothed with loess, with a smoothing parameter of 0.2. “Siblings”refers to hierarchy features.
(the distribution of role frequencies is shown in figure 6.3). For frequent roles, perfor-mance is similar; our models achieve gains on rarer roles.
Full system. When using the frame output of Hermann et al. [2014], F1 improvesby 1.1%, from 66.8% for the baseline, to 67.9% for our combined model (from the lastrow in table 6.2).
6.6 Conclusion
We have empirically shown that auxiliary semantic resources can benefit the chal-lenging task of frame-semantic role labeling. The significant gains come from theFrameNet exemplars and the FrameNet hierarchy, with some signs that the PropBankscheme can be leveraged as well.
We are optimistic that future improvements to lexical semantic resources, such ascrowdsourced lexical expansion of FrameNet [Pavlick et al., 2015] as well as ongo-ing/planned changes for PropBank [Bonial et al., 2014] and SemLink [Bonial et al.,2013], will lead to further gains in this task. Moreover, the techniques discussed herecould be further explored using semi-automatic mappings between lexical resources[such as UBY; Gurevych et al., 2012], and correspondingly, this task could be used toextrinsically validate those mappings.
Ours is not the only study to show benefit from heterogeneous annotations forsemantic analysis tasks. Feizabadi and Pado [2015], for example, successfully applied
95

similar techniques for SRL of implicit arguments.9 Ultimately, given the diversity ofsemantic resources, we expect that learning from heterogeneous annotations in dif-ferent corpora will be necessary to build automatic semantic analyzers that are bothaccurate and robust.
9They applied frustratingly easy domain adaptation to learn from FrameNet along with a PropBank-like dataset of nominal frames.
96
Chapter 7
Conclusion
In this chapter we will review and summarize the developments of the previous sec-tions, reiterating the main themes and contributions of this thesis. We will also out-line some of the immediate and not so immediate directions for future work, thatare borne out of this thesis. We start with a recap of the previous sections, beforepresenting a rough roadmap for future.
7.1 Summary and key contributions
With all the techniques and results in place now, we can step back and ask how theyhelp address the key questions raised in the beginning of this thesis. We begin withthe various techniques developed to address the host-pathogen PPI prediction prob-lem. Prior to this thesis, bulk of the work in area had focused on picking one specifichost-pathogen pair of interest, host being typically human, and either applying ex-isting machine learning techniques to the problem, or developing better techniquestailored to the problem. Since the labeled examples for such a development are typi-cally drawn from previous lab studies recorded in databases, this naturally restrictedthe development of computational models to pathogens that are already relativelywell-studied. This thesis takes important steps in eliminating this crucial bottleneckin designing computational models for host-pathogen PPI prediction through the de-velopment of a series of multitask learning models.
In Chapter §3, we presented a novel multitask learning method that encodes aspecific biologically motivated hypothesis–namely similar pathogens target similarprocesses in a host. A key challenge in this work was to take this high-level intuition,and encode it into a mathematical formulation that is also computationally tractable.We design the MTPL-regularization framework which is able to achieve this goal.The regularizer lends itself to fairly efficient optimization using the Convex-ConcaveProcedure algorithm. This enables us to develop predictive models not only for well-studied pathogens such as Y. Pestis and B. Anthracis, but also S. Typhimurium andE. Coli for which the labeled data is extremely scarce. By leveraging the MTPL hy-pothesis, our models nevertheless perform quite well on these tasks with scarce data,significantly improving upon several strong baselines which either ignore the task-relatedness or use generic machine learning methods not necessarily motivated byany biological insights. With our collaborators, we further validated the accuracy ofour predictions via laboratory based experiments.
97

In Chapter §4, we take an alternative viewpoint towards the same problem, in-stead viewing it as a multitask link prediction problem across several related net-works. We build on the recent successes of matrix completion approaches based onlow-rank matrix factorization for this setup. We propose a bilinear predictive modelthat encodes task-relatedness through a shared low-rank weight matrix. To allowfor deviations from this shared model, we also provide each task with an additionalsparse weight matrix. Once again, we test the model across a set of tasks where eachtask is individually extremely data-poor. Despite this, our method substantially out-performs a number of baselines, including our MTPL technique. While being pre-dictively strong, the model also has some appealing properties that can be used todevelop hypotheses regarding how various biological aspects influence the interac-tions. Specifically, the shared low-rank component can be seen as discovering a latentfeature space, where similar host and pathogen proteins tend to interact. It is thenintuitive to try and understand the properties of two proteins that result in proxim-ity in this latent feature space. Further, the sparse component leads us to sequencelevel properties that are specific to each pathogen. A detailed analysis of these hasthe potential to reveal new pathogen specific mechanisms.
While the previous chapters focus on human-pathogen interactions, a problem ofnatural interest, Chapter §5 aims to discover host-pathogen interactions where thehost is the plant Arabidopsis thaliana and the pathogen of interest is S. Typhimurium.Since we have no previous known PPI predictions for A. thaliana, this rules out mostexisting supervised machine learning tehcniques. Nevertheless, we have labeled ex-amples when the host is human, which naturally motivates a transfer learning ap-proach. We apply the technique of Kernel Mean Matching, which intuitively finds hu-man proteins most similar to those of A. thaliana, and then learns a predictive modelbased on the PPI interactions involving these human proteins. In our quantitativeevaluation, we find that this approach works extremely well relative to several base-lines.
In the last chapter (Chapter §6), we present a transfer learning setting from a dif-ferent application area: natural language processing. In the semantic parsing prob-lem that we consider, the tasks arise as a result of a variation in representations, adifference in distribution of labels and features. To leverage information from thesedisparate resources, we use known feature augmentation based approaches. Thesework by incorporating data from other resources in the form of additional features.Our results show that combining information improves the coverage of our semantic-role-labeling model, resulting in state-of-the-art performance on this task.
7.2 Future research directions
Many of the applications considered in this thesis were in the context of host-pathogenPPI prediction, however the built models and the lessons learned can be applied inother applications. In particular, the multitask matrix completion model that we de-velop in Chapter §4 can be applied to the semantic parsing problem presented inChapter §6. The semantic role labeling problem can be cast as a link prediction prob-lem, where we wish to predict links between arguments and their semantic roles.Given the span of an argument (where rows of the matrix represent spans) the entriesof the matrix indicate which semantic role/roles (the columns represent the variousroles), it is most likely to belong to. The features for the rows (i.e spans) would be
98

the part-of-speech tags, the dependency parse information, context information. Forthe columns (i.e the roles) an indicator feature vector can encode the specific role.We can further incorporate the role’s relationship to other closely related roles. Themain challenges in adapting our method to this problem are: the number of rows willbe very large. This is because the possible contexts in which all the roles appear arepotentially unlimited. Besides scaling the algorithms to work in this setting we alsoneed to develop approaches to reduce the number of rows. One possibility is to usetemplates for the spans, with one template representing a set of very similar spans.This will collapse multiple spans into a single row, but it brings up another challenge:generating features at a template-level that are yet specific to the span seen.
Some other examples of applications arising in biological data that can benefitfrom some of the methods that we develop in this thesis are:
• Biomarkers for disease prediction: Bio-fluids such as urine which can be collectednon-invasively have become attractive biomarkers for early diagnosis of dis-eases. Capillary-electrophoresis coupled to mass spectrometry (CE-MS) hasbeen used to identify the proteins and peptides present in urine - this data hasbeen used in supervised machine learning models [Kuznetsova et al., 2012] tofind patterns which correlate with disease conditions. Each of these studies re-quired the collection of many samples over an extended period of time. Bycombining information across similar disease conditions (for example: coronaryartery disease, hypertensivity etc), it will be possible to obtain good models withfew samples and for several diseases.
• Cancer is considered a heterogeneous disease specific to cell type and tissueorigin. However, most cancers share a common pathogenesis and may sharecommon mechanisms [Stratton et al., 2009]. Multi-tasking learning methods canthus be used to predict core cancer genes important for many cancers, cancertype and stage classification using tissue sample data.
In the general multitask learning direction, the following directions seem promis-ing.
• Multi-source, multitask learning: Often the data in every task can come from a va-riety of sources each of which has its own characteristics such as distributionalskew, noise etc. For instance, protein interactions broadly come from small-scale experiments (more reliable) or high-throughput studies (more noisy). Thecurrent models do not account for this explicitly. This is true of crowd-sourcingdatasets as well. Information can be shared more easily across similar sourcesfrom different tasks.
• Task clustering using natural language text: Currently, the design of multitasklearning models is limited to experts who have a good knowledge of the learn-ing algorithms, the data distributions. The approaches towards learning modelson new tasks (with little or no labeled data available), use feature distributions,problem structure or unlabeled data to cluster the new task with existing tasks.It will be interesting if a non-expert is able to achieve this clustering withouthaving to generate features and structural information by merely specifying anatural language description of the new task.
99


Bibliography
J. Abernethy, F. Bach, T. Evgeniou, and J. P. Vert. A new approach to collaborative fil-tering: Operator estimation with spectral regularization. Journal of Machine LearningResearch (JMLR), 2009.
Arvind Agarwal, Samuel Gerber, and Hal Daume. Learning multiple tasks usingmanifold regularization. In Advances in neural information processing systems, pages46–54, 2010.
Greg M Allenby and Peter E Rossi. Marketing models of consumer heterogeneity.Journal of Econometrics, 89(1):57–78, 1998.
Rie Kubota Ando and Tong Zhang. A framework for learning predictive structuresfrom multiple tasks and unlabeled data. The Journal of Machine Learning Research, 6:1817–1853, 2005.
A. Argyriou, T. Evgeniou, and M. Pontil. Convex multi-task feature learning. MachineLearning, 2008.
M. Ashburner et al. Gene ontology: tool for the unification of biology. Nat. Genet., 25(1):25–9, 2000. http://www.geneontology.org/.
Collin Baker, Michael Ellsworth, and Katrin Erk. SemEval-2007 Task 19: frame seman-tic structure extraction. In Proc. of SemEval, pages 99–104, Prague, Czech Republic,June 2007.
Collin F. Baker, Charles J. Fillmore, and John B. Lowe. The Berkeley FrameNet project.In Proc. of COLING-ACL, pages 86–90, Montreal, Quebec, Canada, August 1998.URL http://framenet.icsi.berkeley.edu.
Bart Bakker and Tom Heskes. Task clustering and gating for bayesian multitask learn-ing. The Journal of Machine Learning Research, 4:83–99, 2003.
Ulrike Baldewein, Katrin Erk, Sebastian Pado, and Detlef Prescher. Semantic rolelabelling with similarity-based generalization using EM-based clustering. In RadaMihalcea and Phil Edmonds, editors, Proc. of SENSEVAL-3, the Third InternationalWorkshop on the Evaluation of Systems for the Semantic Analysis of Text, pages 64–68,Barcelona, Spain, July 2004.
T. Barrett, D.B. Troup, S.E. Wilhite, et al. Ncbi geo: archive for functional genomicsdata sets 10 years on. Nucleic Acids Res., 39(Database issue):D1005–10, 2011.
Jonathan Baxter. A model of inductive bias learning. J. Artif. Intell. Res.(JAIR), 12:149–198, 2000.
101

Shai Ben-David, John Blitzer, Koby Crammer, Fernando Pereira, et al. Analysis ofrepresentations for domain adaptation. Advances in neural information processingsystems (NIPS), 19:137, 2007.
Shai Ben-David, John Blitzer, Koby Crammer, Alex Kulesza, Fernando Pereira, andJennifer Wortman Vaughan. A theory of learning from different domains. Machinelearning, 79(1-2):151–175, 2010.
Cedric N Berger, Derek J Brown, Robert K Shaw, Florencia Minuzzi, Bart Feys, andGad Frankel. Salmonella enterica strains belonging to o serogroup 1, 3, 19 inducechlorosis and wilting of arabidopsis thaliana leaves. Environmental microbiology, 13(5):1299–1308, 2011.
G.F. Berriz, O.D. King, B. Bryant, et al. Characterizing gene sets with funcassociate.Bioinf., 19(18):2502–04, 2003. http://llama.mshri.on.ca/funcassociate/.
John Blitzer, Ryan McDonald, and Fernando Pereira. Domain adaptation with struc-tural correspondence learning. In Proceedings of the 2006 conference on empirical meth-ods in natural language processing, pages 120–128. Association for ComputationalLinguistics, 2006.
Philipp Blohm, Goar Frishman, Pawel Smialowski, Florian Goebels, BenediktWachinger, Andreas Ruepp, and Dmitrij Frishman. Negatome 2.0: a database ofnon-interacting proteins derived by literature mining, manual annotation and pro-tein structure analysis. Nucleic acids research, page gkt1079, 2013.
Claire Bonial, Kevin Stowe, and Martha Palmer. Renewing and revising SemLink. InProc. of the 2nd Workshop on Linked Data in Linguistics (LDL-2013): Representing andlinking lexicons, terminologies and other language data, pages 9–17, Pisa, Italy, Septem-ber 2013.
Claire Bonial, Julia Bonn, Kathryn Conger, Jena D. Hwang, and Martha Palmer. Prop-Bank: semantics of new predicate types. In Nicoletta Calzolari, Khalid Choukri,Thierry Declerck, Hrafn Loftsson, Bente Maegaard, Joseph Mariani, AsuncionMoreno, Jan Odijk, and Stelios Piperidis, editors, Proc. of LREC, pages 3013–3019,Reykjavık, Iceland, May 2014.
Edwin V Bonilla, Kian M Chai, and Christopher Williams. Multi-task gaussian pro-cess prediction. In Advances in neural information processing systems, pages 153–160,2007.
Antoine Bordes, Xavier Glorot, Jason Weston, and Yoshua Bengio. Joint learning ofwords and meaning representations for open-text semantic parsing. In InternationalConference on Artificial Intelligence and Statistics, pages 127–135, 2012.
Leon Bottou. From machine learning to machine reasoning. Machine learning, 94(2):133–149, 2014.
E. Candes and B. Recht. Exact matrix completion via convex optimization. Founda-tions of Computational Mathematics, 2008.
Bin Cao, Nathan N. Liu, and Qiang Yang. Transfer learning for collective link predic-tion in multiple heterogenous domains. ICML, 2010.
102

Rich Caruana. Multitask learning. Machine learning, 28(1):41–75, 1997.
Jianhui Chen, Ji Liu, and Jieping Ye. Learning incoherent sparse and low-rank pat-terns from multiple tasks. ACM Transactions on Knowledge Discovery from Data(TKDD), 5(4):22, 2012a.
Jianhui Chen, Lei Tang, Jun Liu, and Jieping Ye. A convex formulation for learn-ing a shared predictive structure from multiple tasks. Pattern Analysis and MachineIntelligence, IEEE Transactions on, 35(5):1025–1038, 2013.
K. C. Chen, T. Y. Wang, and C. H. Chan. Associations between hiv and human path-ways revealed by protein-protein interactions and correlated gene expression pro-files. PLOS One, 2012b.
X.W. Chen and M. Liu. Prediction of protein-protein interactions using random deci-sion forest framework. Bioinformatics, 21(24):4394–400, 2005.
William W. Cohen and Vitor R. Carvalho. Stacked sequential learning. In Proc. ofIJCAI, pages 671–676, Edinburgh, Scotland, UK, 2005.
Ronan Collobert, Jason Weston, Leon Bottou, Michael Karlen, Koray Kavukcuoglu,and Pavel Kuksa. Natural language processing (almost) from scratch. The Journalof Machine Learning Research, 12:2493–2537, 2011.
Corinna Cortes, Mehryar Mohri, Michael Riley, and Afshin Rostamizadeh. Sampleselection bias correction theory. In Algorithmic learning theory, pages 38–53. Springer,2008.
Koby Crammer, Michael Kearns, and Jennifer Wortman. Learning from multiplesources. The Journal of Machine Learning Research (JMLR), 9:1757–1774, 2008.
Dipanjan Das and Noah A. Smith. Semi-supervised frame-semantic parsing for un-known predicates. In Proc. of ACL-HLT, pages 1435–1444, Portland, Oregon, USA,June 2011.
Dipanjan Das and Noah A. Smith. Graph-based lexicon expansion with sparsity-inducing penalties. In Proc. of NAACL-HLT, pages 677–687, Montreal, Canada, June2012.
Dipanjan Das, Andre F. T. Martins, and Noah A. Smith. An exact dual decompositionalgorithm for shallow semantic parsing with constraints. In Proc. of *SEM, pages209–217, Montreal, Canada, June 2012.
Dipanjan Das, Desai Chen, Andre F. T. Martins, Nathan Schneider, and Noah A.Smith. Frame-semantic parsing. Computational Linguistics, 40(1):9–56, March 2014.URL http://www.ark.cs.cmu.edu/SEMAFOR.
Hal Daume, III. Frustratingly easy domain adaptation. In Proc. of ACL, pages 256–263,Prague, Czech Republic, June 2007.
Jesse Davis and Mark Goadrich. The relationship between precision-recall and roccurves. Proceedings of the 23rd international conference on Machine learning, pages233–240, 2006.
103
Sanjukta Dey, Marion Wenig, Gregor Langen, Sapna Sharma, Karl Kugler, ClaudiaKnappe, Bettina Hause, Marlies Bichlmeier, Va liollah Babaeizad, Jafargholi Imani,et al. Bacteria-triggered systemic immunity in barley appears to be associated withwrky and ethylene responsive factors but not with salicylic acid. Plant physiology,166(4):pp–114, 2014.
T. Driscoll, Dyer M. D., Murali T. M., and Sobral B. W. Pig–the pathogen interactiongateway. Nucleic Acids Res., 37:D647–50, 2009.
Z. Du, L. Li, Chin-Fu Chen, P. S. Yu, and J. Z. Wang. G-sesame: web tools for go termbased gene similarity analysis and knowledge discovery. Nucleic Acids Research, 37(Web Server issue):W345–9, 2009.
M.D. Dyer, T.M. Murali, and B.W. Sobral. Computational prediction of host-pathogenprotein-protein interactions. Bioinformatics, 23(13):i159–66, 2007.
M.D. Dyer, T.M. Murali, and B.W. Sobral. The landscape of human proteins interact-ing with viruses and other pathogens. PLOS Pathogens, 4(2):e32, 2008.
M.D. Dyer et al. The human-bacterial pathogen protein interaction networks of bacil-lus anthracis, francisella tularensis, and yersinia pestis. PLOS One, 5(8), 2010.
M.D. Dyer et al. Supervised learning and prediction of physical interactions betweenhuman and hiv proteins. Infect., Genetics and Evol., 11:917–923, 2011.
T. Evgeniou and M. Pontil. Regularized multi-task learning. ACM SIGKDD, 2004.
R.E. Fan et al. Liblinear: A library for large linear classification. JMLR, 9, 2008. Soft-ware available at http://www.csie.ntu.edu.tw/˜cjlin/liblinear.
Wei Fan, Ian Davidson, Bianca Zadrozny, and Philip S Yu. An improved categoriza-tion of classifier’s sensitivity on sample selection bias. In Data Mining, Fifth IEEEInternational Conference on, pages 4–pp. IEEE, 2005.
Parvin Sadat Feizabadi and Sebastian Pado. Combining seemingly incompatible cor-pora for implicit semantic role labeling. In Proc. of *SEM, pages 40–50, Denver,Colorado, USA, June 2015.
Charles J. Fillmore and Collin Baker. A frames approach to semantic analysis. InBernd Heine and Heiko Narrog, editors, The Oxford Handbook of Linguistic Analysis,pages 791–816. Oxford University Press, Oxford, UK, December 2009.
R.D. Finn et al. ipfam: visualization of protein–protein interactions in pdb at domainand amino acid resolutions. Bioinf., 21(3):410–2, 2005.
R.D. Finn et al. The pfam protein families database. Nucl. Acids Res., 38:D211–22,2010.
Michael Fleischman, Namhee Kwon, and Eduard Hovy. Maximum entropy modelsfor FrameNet classification. In Michael Collins and Mark Steedman, editors, Proc.of EMNLP, pages 49–56, 2003.
J. Garcia, E. Guney, et al. Biana: a software framework for compiling biological inter-actions and analyzing networks. BMC Bioinformatics, 11:56, 2010.
104

Javier Garcia-Garcia, Sylvia Schleker, Judith Klein-Seetharaman, and Baldo Oliva.Bips: Biana interolog prediction server. a tool for protein–protein interaction in-ference. Nucleic acids research, 40(W1):W147–W151, 2012.
Daniel Gildea and Daniel Jurafsky. Automatic labeling of semantic roles. Computa-tional Linguistics, 28(3):245–288, 2002.
Iryna Gurevych, Judith Eckle-Kohler, Silvana Hartmann, Michael Matuschek, Chris-tian M. Meyer, and Christian Wirth. UBY - a large-scale unified lexical-semanticresource based on LMF. In Proc. of EACL, pages 580–590, Avignon, France, April2012.
Karl Moritz Hermann, Dipanjan Das, Jason Weston, and Kuzman Ganchev. Semanticframe identification with distributed word representations. In Proc. of ACL, pages1448–1458, Baltimore, Maryland, USA, June 2014.
C. Hernandez-Reyes and A. Schikora. Salmonella, a cross-kingdom pathogen infect-ing humans and plants. FEMS Microbiology Letters, 343:1–7, 2013.
Eduard Hovy, Mitchell Marcus, Martha Palmer, Lance Ramshaw, and RalphWeischedel. OntoNotes: the 90% solution. In Proc. of HLT-NAACL, pages 57–60,New York City, USA, June 2006.
J. Huang, A. Smola, A. Gretton, K.M. Borgwardt, and B. Scholkopf. Correcting sampleselection bias by unlabeled data. NIPS, 2007.
A.L. Iniguez, Y.M. Dong, H.D. Carter, B.M.M. Ahmer, J.M. Stone, and E.W. Triplett.Regulation of enteric endophytic bacterial colonization by plant defenses. MolecularPlant-Microbe Interactions, 18:169–178, 2005.
Laurent Jacob, Jean-philippe Vert, and Francis R Bach. Clustered multi-task learning:A convex formulation. In Advances in neural information processing systems (NIPS),pages 745–752, 2009.
Ali Jalali, Sujay Sanghavi, Chao Ruan, and Pradeep K Ravikumar. A dirty model formulti-task learning. Advances in Neural Information Processing Systems, pages 964–972, 2010.
Nathalie Japkowicz and Shaju Stephen. The class imbalance problem: A systematicstudy. Intelligent data analysis, 6(5):429–449, 2002.
Shuiwang Ji and Jieping Ye. An accelerated gradient method for trace norm minimiza-tion. In Proceedings of the 26th Annual International Conference on Machine Learning,pages 457–464. ACM, 2009.
Jing Jiang and ChengXiang Zhai. Instance weighting for domain adaptation in nlp.In ACL, volume 7, pages 264–271, 2007.
Rong Jin, Luo Si, and ChengXiang Zhai. Preference-based graphic models for collab-orative filtering. In UAI, pages 329–336, 2002.
Thorsten Joachims. Transductive inference for text classification using support vectormachines. ICML, 99:200–209, 1999.
105

Thorsten Joachims. Svmlight, 2008. http://svmlight.joachims.org/.
Richard Johansson. Non-atomic classification to improve a semantic role labeler for alow-resource language. In Proceedings of the Sixth International Workshop on SemanticEvaluation, pages 95–99. Association for Computational Linguistics (ACL), 2012.
Richard Johansson. Training parsers on incompatible treebanks. In Proc. of NAACL-HLT, pages 127–137, Atlanta, Georgia, USA, June 2013.
Gregory Jubelin, Frederic Taieb, et al. Pathogenic bacteria target nedd8-conjugatedcullins to hijack host-cell signaling pathways. PLOS Pathogens, 2010.
J.G. Kim, W. Stork, and M.B. Mudgett. Xanthomonas type iii effector xopd desumoy-lates tomato transcription factor slerf4 to suppress ethylene responses and promotepathogen growth. Cell Host Microbe, 13(2):143–54, 2013.
M. W. B. Kirzinger, G. Nadarasah, and J. Stavrinides. Insights into cross-kingdomplant pathogenic bacteria. Genes, 2:980–997, 2011.
Lingpeng Kong, Nathan Schneider, Swabha Swayamdipta, Archna Bhatia, ChrisDyer, and Noah A. Smith. A dependency parser for tweets. In Proc. of EMNLP,pages 1001–1012, Doha, Qatar, October 2014.
Yehuda Koren, Robert Bell, and Chris Volinsky. Matrix factorization techniques forrecommender systems. Computer, (8):30–37, 2009.
M. Kshirsagar, J. G. Carbonell, and J. Klein-Seetharaman. Techniques to cope withmissing data in host-pathogen protein interaction prediction. Bioinformatics, 2012.
M. Kshirsagar, J. G. Carbonell, and J. Klein-Seetharaman. Multi-task learning for host-pathogen protein interactions. Bioinformatics, 2013.
M. Kshirsagar, S. Schleker, J. Carbonell, and J. Klein-Seetharaman. Techniques fortransferring host-pathogen protein interactions knowledge to new tasks. Frontiersin Microbiology, 6(36), 2015a.
M. Kshirsagar, S. Thomson, N. Schneider, J. Carbonell, N. Smith, and C. Dyer. Frame-semantic role labeling with heterogeneous annotations. Assoc. for ComputationalLinguistics (ACL), 2015b.
Abhishek Kumar and Hal Daume III. Learning task grouping and overlap in multi-task learning. 2012.
R. Kumar and B. Nanduri. Hpidb–a unified resource for host-pathogen interactions.BMC Bioinf., 2010.
T. Kuznetsova, H. Mischak, W. Mullen, and J.A. Staessen. Urinary proteome analysisin hypertensive patients with left ventricular diastolic dysfunction. European HeartJournal, 2012.
Namhee Kwon, Michael Fleischman, and Eduard Hovy. FrameNet-based seman-tic parsing using maximum entropy models. In Proc. of Coling, pages 1233–1239,Geneva, Switzerland, August 2004.
106

Philippe Lamesch, Tanya Z Berardini, Donghui Li, David Swarbreck, ChristopherWilks, Rajkumar Sasidharan, Robert Muller, Kate Dreher, Debbie L Alexander, Mar-garita Garcia-Hernandez, et al. The arabidopsis information resource (tair): im-proved gene annotation and new tools. Nucleic acids research, 40(D1):D1202–D1210,2012.
Bin Li. Cross-domain collaborative filtering: A brief survey. In Tools with Artificial In-telligence (ICTAI), 2011 23rd IEEE International Conference on, pages 1085–1086. IEEE,2011.
Bin Li, Qiang Yang, and Xiangyang Xue. Transfer learning for collaborative filteringvia a rating-matrix generative model. In International Conference on Machine Learn-ing, pages 617–624. ACM, 2009.
Yan Li, QingQing Zhang, Jiangguang Zhang, Liang Wu, Yijun Qi, and Jian-Min Zhou.Identification of micrornas involved in pathogen-associated molecular pattern-triggered plant innate immunity. Plant physiology, 152(4):2222–2231, 2010.
Ken Litkowski. SENSEVAL-3 task: Automatic labeling of semantic roles. In RadaMihalcea and Phil Edmonds, editors, Proc. of SENSEVAL-3, the Third InternationalWorkshop on the Evaluation of Systems for the Semantic Analysis of Text, pages 9–12,Barcelona, Spain, July 2004.
Dong C. Liu and Jorge Nocedal. On the Limited Memory BFGS Method for LargeScale Optimization. Math. Program., 45(3):503–528, December 1989.
Jinyi Liu, J Hollis Rice, Nana Chen, Thomas J Baum, and Tarek Hewezi. Synchro-nization of developmental processes and defense signaling by growth regulatingtranscription factors. PloS one, 9(5):e98477, 2014.
Jun Liu, Shuiwang Ji, and Jieping Ye. Multi-task feature learning via efficient l2,1-norm minimization. In Proceedings of the twenty-fifth conference on uncertainty in arti-ficial intelligence (UAI), pages 339–348, 2009.
Yishay Mansour, Mehryar Mohri, and Afshin Rostamizadeh. Multiple source adap-tation and the renyi divergence. In Proceedings of the Twenty-Fifth Conference on Un-certainty in Artificial Intelligence, pages 367–374. AUAI Press, 2009.
Andre F. T. Martins, Dipanjan Das, Noah A. Smith, and Eric P. Xing. Stacking de-pendency parsers. In Proc. of EMNLP, pages 157–166, Honolulu, Hawaii, October2008.
Yuichiroh Matsubayashi, Naoaki Okazaki, and Jun’ichi Tsujii. A comparative studyon generalization of semantic roles in FrameNet. In Proc. of ACL-IJCNLP, pages19–27, Suntec, Singapore, August 2009.
L. Matthews, G. Gopinath, M. Gillespie, et al. Reactome knowledgebase of biologicalpathways and processes. Nucleic Acids Res., 2008.
Andreas Maurer. Bounds for linear multi-task learning. The Journal of Machine Learn-ing Research, 7:117–139, 2006.
107

Andreas Maurer, Massi Pontil, and Bernardino Romera-Paredes. Sparse coding formultitask and transfer learning. In Proceedings of the 30th International Conference onMachine Learning (ICML), pages 343–351, 2013.
A. K. Menon and C. Elkan. Link prediction via matrix factorization. ECML, 2011.
Tom M Mitchell. The need for biases in learning generalizations. Department of ComputerScience, Laboratory for Computer Science Research, Rutgers Univ., 1980.
M. Shahid Mukhtar, Anne-Ruxandra Carvunis, M. Dreze, et al. Independentlyevolved virulence effectors converge onto hubs in a plant immune system network.Science, 333(6042):596–601, 2011a.
M Shahid Mukhtar, Anne-Ruxandra Carvunis, Matija Dreze, Petra Epple, Jens Stein-brenner, Jonathan Moore, Murat Tasan, Mary Galli, Tong Hao, Marc T Nishimura,et al. Independently evolved virulence effectors converge onto hubs in a plant im-mune system network. science, 333(6042):596–601, 2011b.
Asuka Nanbo, Masaki Imai, Shinji Watanabe, et al. Ebolavirus is internalized intohost cells via macropinocytosis in a viral glycoprotein-dependent manner. PLoSpathogens, 6(9):e1001121, 2010.
Nagarajan Natarajan and Inderjit S. Dhillon. Inductive matrix completion for predict-ing genedisease associations. Bioinformatics, 2014.
Joakim Nivre and Ryan McDonald. Integrating graph-based and transition-baseddependency parsers. In Proc. of ACL-HLT, pages 950–958, Columbus, Ohio, USA,June 2008.
G. Ostlund, T. Schmitt, K. Forslund, T. Kostler, D.N. Messina, S. Roopra, O. Frings,and ELL. Sonnhammer. Inparanoid 7: new algorithms and tools for eukaryoticorthology analysis. Nucleic Acids Res., 38:D196–D203, 2010.
Martha Palmer, Daniel Gildea, and Paul Kingsbury. The Proposition Bank: an anno-tated corpus of semantic roles. Computational Linguistics, 31(1):71–106, March 2005.
Ellie Pavlick, Travis Wolfe, Pushpendre Rastogi, Chris Callison-Burch, Mark Drezde,and Benjamin Van Durme. FrameNet+: Fast paraphrastic tripling of FrameNet. InProc. of ACL-IJCNLP, Beijing, China, July 2015.
Anastasia Pentina and Christoph H Lampert. A pac-bayesian bound for lifelonglearning. ICML, 2014.
Dinh Q Phung, Svetha Venkatesh, et al. Ordinal boltzmann machines for collaborativefiltering. In UAI, pages 548–556. AUAI Press, 2009.
Joan Planas-Iglesias, Manuel A Marin-Lopez, Jaume Bonet, Javier Garcia-Garcia, andBaldo Oliva. iloops: a protein–protein interaction prediction server based on struc-tural features. Bioinformatics, 29(18):2360–2362, 2013.
T.S.K. Prasad et al. Human protein reference database - 2009 update. Nucl. Acids Res.,3(Database issue):D767–72, 2009.
108

Vasin Punyakanok, Dan Roth, and Wen-tau Yih. The importance of syntacticparsing and inference in semantic role labeling. Computational Linguistics, 34(2):257–287, 2008. URL http://cogcomp.cs.illinois.edu/page/software_view/SRL.
Y. Qi, H.K. Dhiman, Z. Bar-Joseph, et al. Systematic prediction of human membranereceptor interactions. Proteomics, 23(9):5243–55, 2009.
Y. Qi, O. Tastan, J. G. Carbonell, J. Klein-Seetharaman, and J. Weston. Semi-supervisedmulti-task learning for predicting interactions between hiv-1 and human proteins.Bioinformatics, 2010.
Y. Qi et al. Evaluation of different biological data and computational classificationmethods for use in protein interaction prediction. Proteins, 63(3):490–500, 2006.
Rajat Raina, Andrew Y Ng, and Daphne Koller. Constructing informative priors us-ing transfer learning. In Proceedings of the 23rd international conference on Machinelearning, pages 713–720. ACM, 2006.
Josef Ruppenhofer, Michael Ellsworth, Miriam R. L. Petruck, Christopher R. Johnson,and Jan Scheffczyk. FrameNet II: extended theory and practice, September 2010.URL https://framenet2.icsi.berkeley.edu/docs/r1.5/book.pdf.
Badrul Sarwar, George Karypis, Joseph Konstan, and John Riedl. Item-based collabo-rative filtering recommendation algorithms. In WWW, pages 285–295. ACM, 2001.
C. F. Schaefer, K. Anthony, S. Krupa, et al. Pid: The pathway interaction database.Nucleic Acids Res., 2009.
A. Schikora, I. Virlogeux-Payant, E. Bueso, A.V. Garcia, T. Nilau, A. Charrier, S. Pel-letier, P. Menanteau, M. Baccarini, P. Velge, and H. Hirt. Conservation of salmonellainfection mechanisms in plants and animals. PLoS One, 6(e24112), 2011.
Adam Schikora, Alessandro Carreri, Emmanuelle Charpentier, and Heribert Hirt. Thedark side of the salad: Salmonella typhimurium overcomes the innate immuneresponse of arabidopsis thaliana and shows an endopathogenic lifestyle. PLoS One,3(5):e2279, 2008.
S. Schleker, J. Sun, B. Raghavan, et al. The current salmonella-host interactome. Pro-teomics Clin Appl., 6(1-2):117–33, 2012.
S. Schleker, M. Kshirsagar, and J. Klein-Seetharaman. Comparing human-salmonellawith plant-salmonella protein-protein interaction predictions. Frontiers in Microbi-ology, 6(45), 2015.
Anton Schwaighofer, Volker Tresp, and Kai Yu. Learning gaussian process kernelsvia hierarchical bayes. In Advances in Neural Information Processing Systems, pages1209–1216, 2004.
R. Sharan, S. Suthram, R.M. Kelley, T. Kuhn, S. McCuine, P. Uetz, T. Sittler, R.M. Karp,and T. Ideker. Conserved patterns of protein interaction in multiple species. Proc.Natl. Academy Sciences (PNAS), 2005.
109

Juwen Shen, Jian Zhang, Xiaomin Luo, Weiliang Zhu, Kunqian Yu, Kaixian Chen,Yixue Li, and Hualiang Jiang. Predicting protein–protein interactions based onlyon sequences information. Proceedings of the National Academy of Sciences, 104(11):4337–4341, 2007.
Natali Shirron and Sima Yaron. Active suppression of early immune response intobacco by the human pathogen salmonella typhimurium. PLoS One, 6(4):e18855,2011.
A. P. Singh and G. J. Gordon. Relational learning via collective matrix factorization.KDD, 2008.
R. Singh, J. Xu, and B. Berger. Struct2net: Integrating structure into protein-proteininteraction prediction. Pacific Symposium on Biocomputing, 2006.
Soren Sonnenburg, Gunnar Ratsch, Sebastian Henschel, Christian Widmer, JonasBehr, Alexander Zien, Fabio de Bona, Alexander Binder, Christian Gehl, andVojtech Franc. The shogun machine learning toolbox. The Journal of Machine Learn-ing Research, 11:1799–1802, 2010. http://www.shogun-toolbox.org.
A. Stein et al. 3did: identification & classification of domain-based interactions ofknown 3d structure. Nuc. Acids Res., 39:D718–23, 2011.
Michael R Stratton, Peter J Campbell, and P Andrew Futreal. The cancer genome.Nature, 458(7239):719–724, 2009.
M. Sugiyama, S. Nakajima, H. Kashima, P.V. Buenau, and M. Kawanabe. Directimportance estimation with model selection and its application to covariate shiftadaptation. NIPS, 2008.
Oscar Tackstrom, Kuzman Ganchev, and Dipanjan Das. Efficient inference and struc-tured learning for semantic role labeling. Transactions of the Association for Computa-tional Linguistics, 3:29–41, January 2015.
O. Tastan et al. Prediction of interactions between hiv-1 and human proteins by in-formation integration. Pac. Symp. Biocomput., (14):516–527, 2009.
S. D. Tekir, Ali S., Tunahan C., and Kutlu O. U. Infection strategies of bacterial andviral pathogens through pathogen-host protein protein interactions. Frontiers inMicrobial Immunology, 2012.
Cynthia A. Thompson, Roger Levy, and Christopher D. Manning. A generative modelfor semantic role labeling. In Machine Learning: ECML 2003, pages 397–408, 2003.
Sebastian Thrun. Is learning the n-th thing any easier than learning the first? Advancesin neural information processing systems, pages 640–646, 1996.
Sebastian Thrun and Lorien Pratt. Learning to learn: Introduction and overview. InLearning to learn, pages 3–17. Springer, 1998.
P. Uetz, Y. A. Dong, et al. Herpesviral protein networks and their interaction with thehuman proteome. Science, (311):239–242, 2006.
110

Selen Uguroglu and Jaime Carbonell. Feature selection for transfer learning. In Ma-chine Learning and Knowledge Discovery in Databases (ECML-PKDD), pages 430–442.Springer, 2011.
UniProt Consortium. Ongoing and future developments at the universal protein re-source. Nucl. Acids Res., 39:D214–D219, 2011.
Vladimir Naumovich Vapnik. Statistical learning theory, volume 1. Wiley New York,1998.
Randi Vita, James A Overton, Jason A Greenbaum, et al. The immune epitopedatabase (iedb) 3.0. Nucleic acids research, 43(D1):D405–D412, 2015.
R.-S. Wang, Y. Wang, et al. Analysis on multi-domain cooperation for predictingprotein-protein interactions. BMC Bioinformatics, 2007.
Xuezhi Wang and Jeff Schneider. Flexible transfer learning under support and modelshift. In Advances in Neural Information Processing Systems (NIPS), pages 1898–1906,2014.
C. Widmer, J. Leiva, Y. Altun, and G. Ratsch. Leveraging sequence classification bytaxonomy-based multitask learning. RECOMB, 2010.
R. Winnenburg, M. Urban, A. Beacham, et al. Phi-base update: additions to thepathogen host interaction database. Nucleic Acids Res, 2008.
Pengcheng Wu and Thomas G Dietterich. Improving svm accuracy by training onauxiliary data sources. In Proceedings of the twenty-first international conference onMachine learning, page 110. ACM, 2004.
X. Wu, L. Zhu, J. Guo, et al. Prediction of yeast protein-protein interaction network:insights from the gene ontology and annotations. Nucleic Acids Res., 34(7):2137–50,2006.
Q. Xu, E. W. Xiang, and Q. Yang. Protein-protein interaction prediction via collectivematrix factorization. International Conference on Bioinformatics and Biomedicine, 2010.
Qian Xu and Qiang Yang. A survey of transfer and multitask learning in bioinformat-ics. Journal of Computing Science and Engineering, 5(3):257–268, 2011.
Zhao Xu, Kristian Kersting, and Volker Tresp. Multi-relational learning with gaussianprocesses. IJCAI, 2009.
John Yu and T. Joachims. Learning structural svms with latent variables. ICML, 2009.
Yang Yu and Zhi-Hua Zhou. A framework for modeling positive class expansion withsingle snapshot. In Advances in Knowledge Discovery and Data Mining (KDD), pages429–440. Springer, 2008.
Xiao-Tong Yuan, Xiaobai Liu, and Shuicheng Yan. Visual classification with multitaskjoint sparse representation. Image Processing, IEEE Transactions on, 21(10):4349–4360,2012.
111

A. Yuille and A. Rangarajan. The concave-convex procedure. Neural Computation,2003.
Matthew Zeiler. ADADELTA: An Adaptive Learning Rate Method. CoRR,abs/1212.5701, 2012. URL http://dblp.uni-trier.de/rec/bibtex/journals/corr/abs-1212-5701.
Kun Zhang, Krikamol Muandet, Zhikun Wang, et al. Domain adaptation under targetand conditional shift. In Proceedings of the 30th International Conference on MachineLearning (ICML), pages 819–827, 2013.
Yi Zhang and Jeff G Schneider. Learning multiple tasks with a sparse matrix-normalpenalty. In Advances in Neural Information Processing Systems (NIPS), pages 2550–2558, 2010.
Yu Zhang, Bin Cao, and Dit-Yan Yeung. Multi-domain collaborative filtering. arXivpreprint arXiv:1203.3535, 2012.
112
Related Documents