COM-T Consolidated Strategic Plan FY 2022

Welcome message from author
This document is posted to help you gain knowledge. Please leave a comment to let me know what you think about it! Share it to your friends and learn new things together.
Transcript
COM-T Consolidated Strategic Plan
FY 2022

ImpetusBased on 12-month assessment: December 2019 – November 2020
Situational Analysis• Decade of ‘revolving-door’ leadership changes• Several ‘strategic plans’• Banner affiliation in 6th year• 18 months of ‘interim dean’• 7 ‘interim’ chairs• COVID
Strengths• Significant increase in NIH funding and Blue Ridge rankings• Positive changes in senior UArizona and UAHS senior leadership
Opportunities• Operational versus Strategic institutional mindset• Possibilities for better accountability, alignment, faculty engagement, data transparency, fiscal transparency and discipline,
blurred mission area leadership• Need for unifying strategic vision and direction
Framework (Anatomy) for a Strategic Plan - I‘A unit-specific, mission-driven, metric-based, directional, target-focused, tactical, consolidated strategic plan’
• ‘Unit-specific’: while ‘the plan’ constitutes a college-wide strategic planning initiative, it involves 29 academic units that
include 3 different unit types: Clinical Departments, Basic Science (non-clinical) Departments, and Centers.
• ‘Mission-driven’: The COM-T mission statement is ‘advancing health and wellness of our community and beyond, while
embracing diversity, in the pursuit of excellence through innovation in our tripartite mission: education, research, and patient
care’. Our 7 mission areas include the Tripartite mission (Education, Research, Patient Care) and an additional 4 mission areas
(Faculty Affairs, Diversity, Equity and Inclusion (DEI), Financial Sustainability, and Development) essential to support the
Tripartite mission.
• ‘Metric-based’: for each mission area, individual vision elements were developed. Specific metrics were selected based on 3
criteria – mapping to specific vision elements within each mission area, validated and readily available, and frequently
published (i.e., at least annually). ‘Current state’ data and data source(s) were identified for each metric.
• ‘Directional’: the overall direction was defined as a ‘future state’, consisting of a 3-year annualized metric-based projection
each mission area. The plan calls for ‘rolling’ 3-year projections with planned reassessments every 6 months, informing
discussions around accountability between unit leaders and the faculty, as well as between unit leaders and the dean, with a
potential resetting of targets and tactics as needed.
Framework (Anatomy) for a Strategic Plan - II
‘A unit-specific, mission-driven, metric-based, directional, target-focused, tactical, consolidated strategic plan’
• ‘Target-focused’: Initial targets for 1, 2, and 3-years (FY22-24) were defined for each metric, mapping to vision elements
within each mission area, that were designed to be ambitious but realistic. Unit leaders and faculty will not be held directly
accountable for the actual set targets, but instead, if targets are not being met, for understanding either what barriers exist,
or alternatively why targets were not achievable.
• ‘Tactical’: each directional target requires a set of tactics needed to achieve the target. Tactics may include leveraging
available unit resources (resetting priorities and/or repurposing assets), or alternatively seeking and obtaining additional
resources from within COM-T, UAHS strategic plan, extramural grants, development funds, etc. towards programmatic
initiatives.
• ‘Consolidated’: while there are significant differences both within and between the different types of academic units with
respect to each of the mission areas, a set of unifying vision elements and metrics were selected for each of the mission
areas, designed to align the directionality of targets and tactics into a consolidated set of action plans
• ‘Strategic plan’: the premise of the plan is to execute on a set of tactics designed to achieve a strategic vision, advancing
COM-T’s activities towards fulfilling its mission statement.
29 College of Medicine – Tucson Academic Units
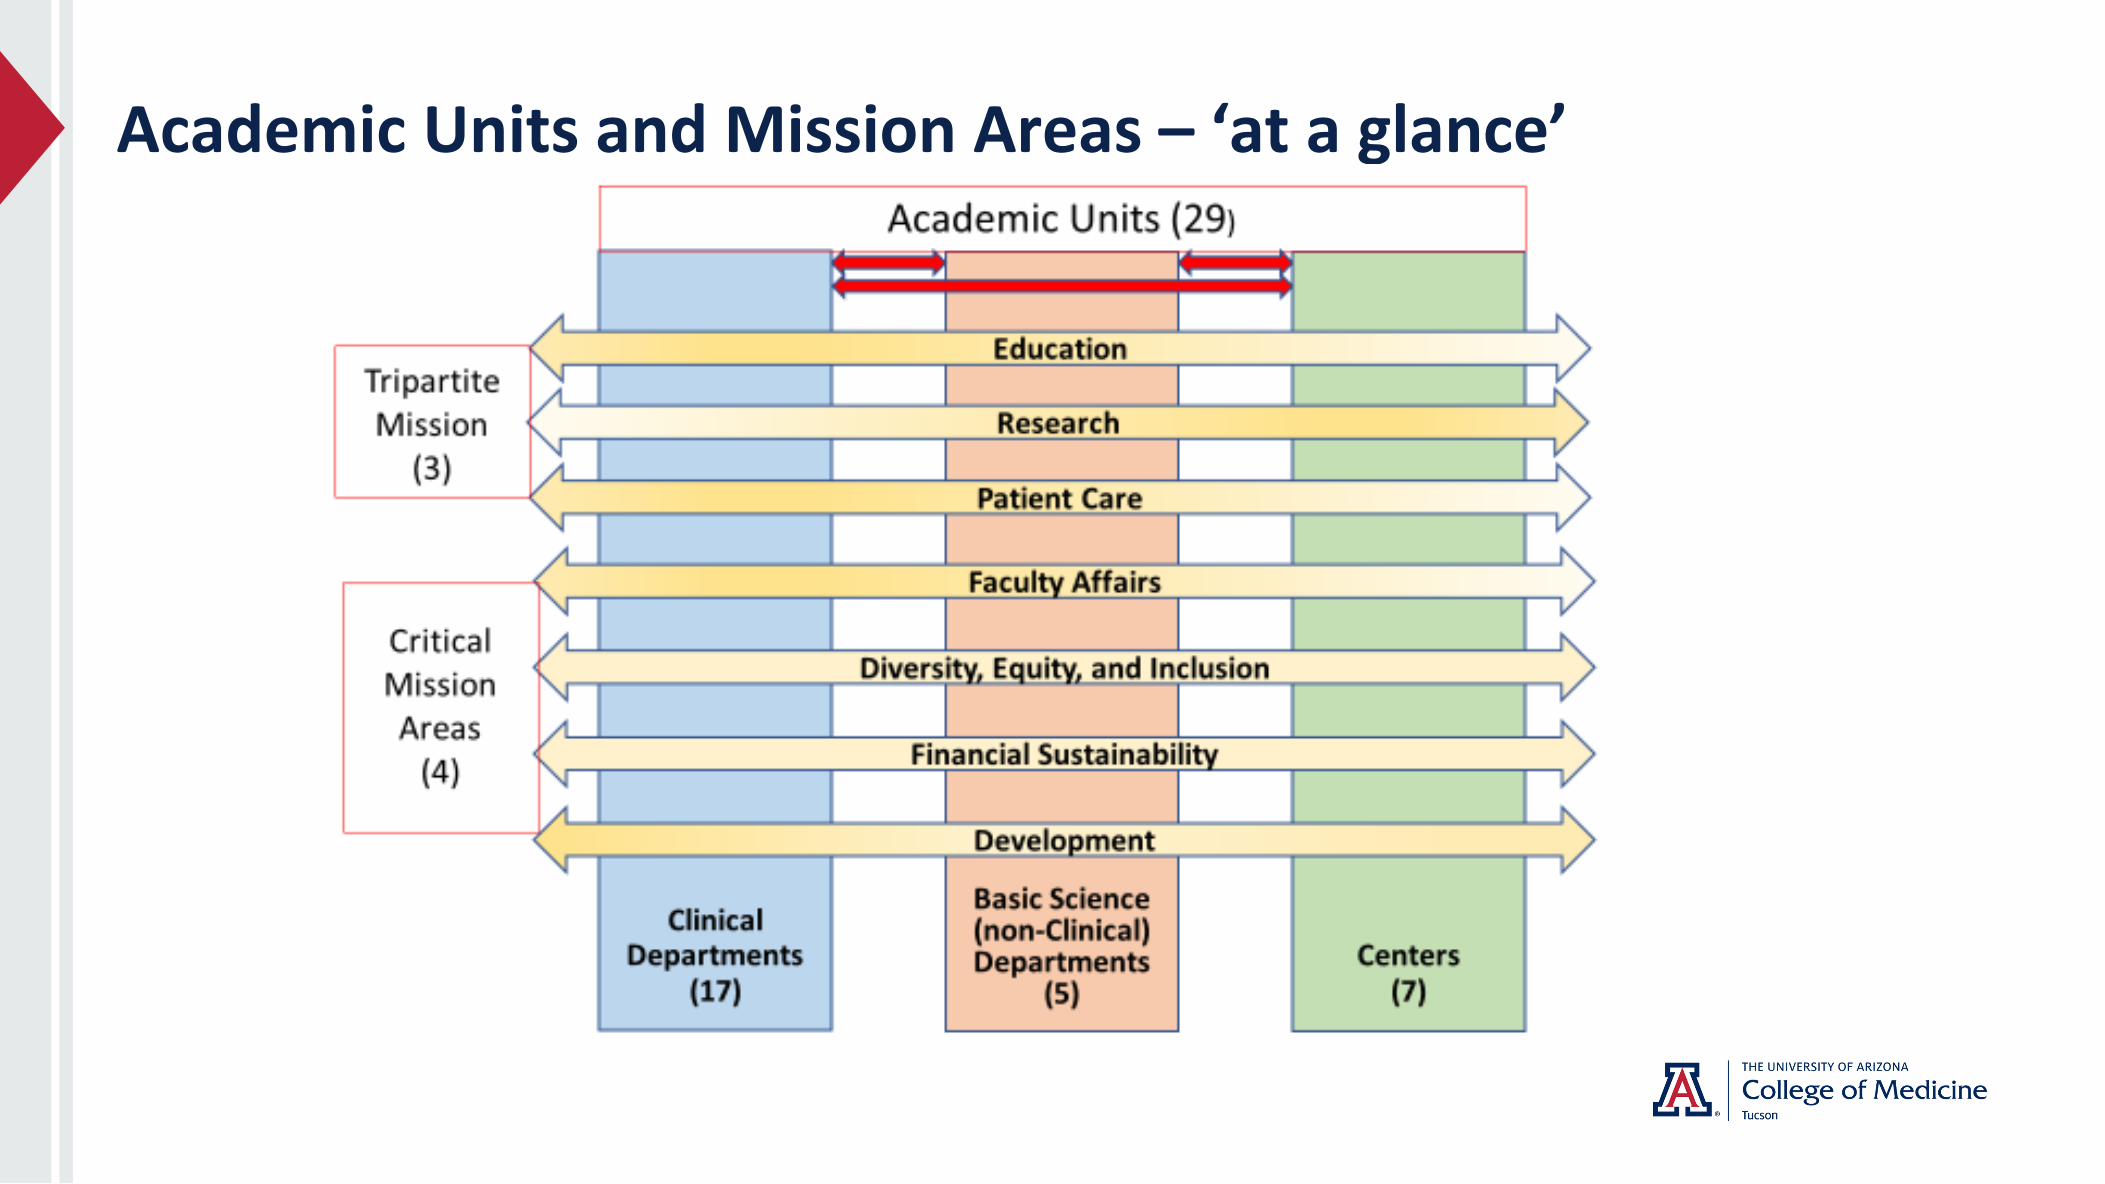
Academic Units and Mission Areas – ‘at a glance’
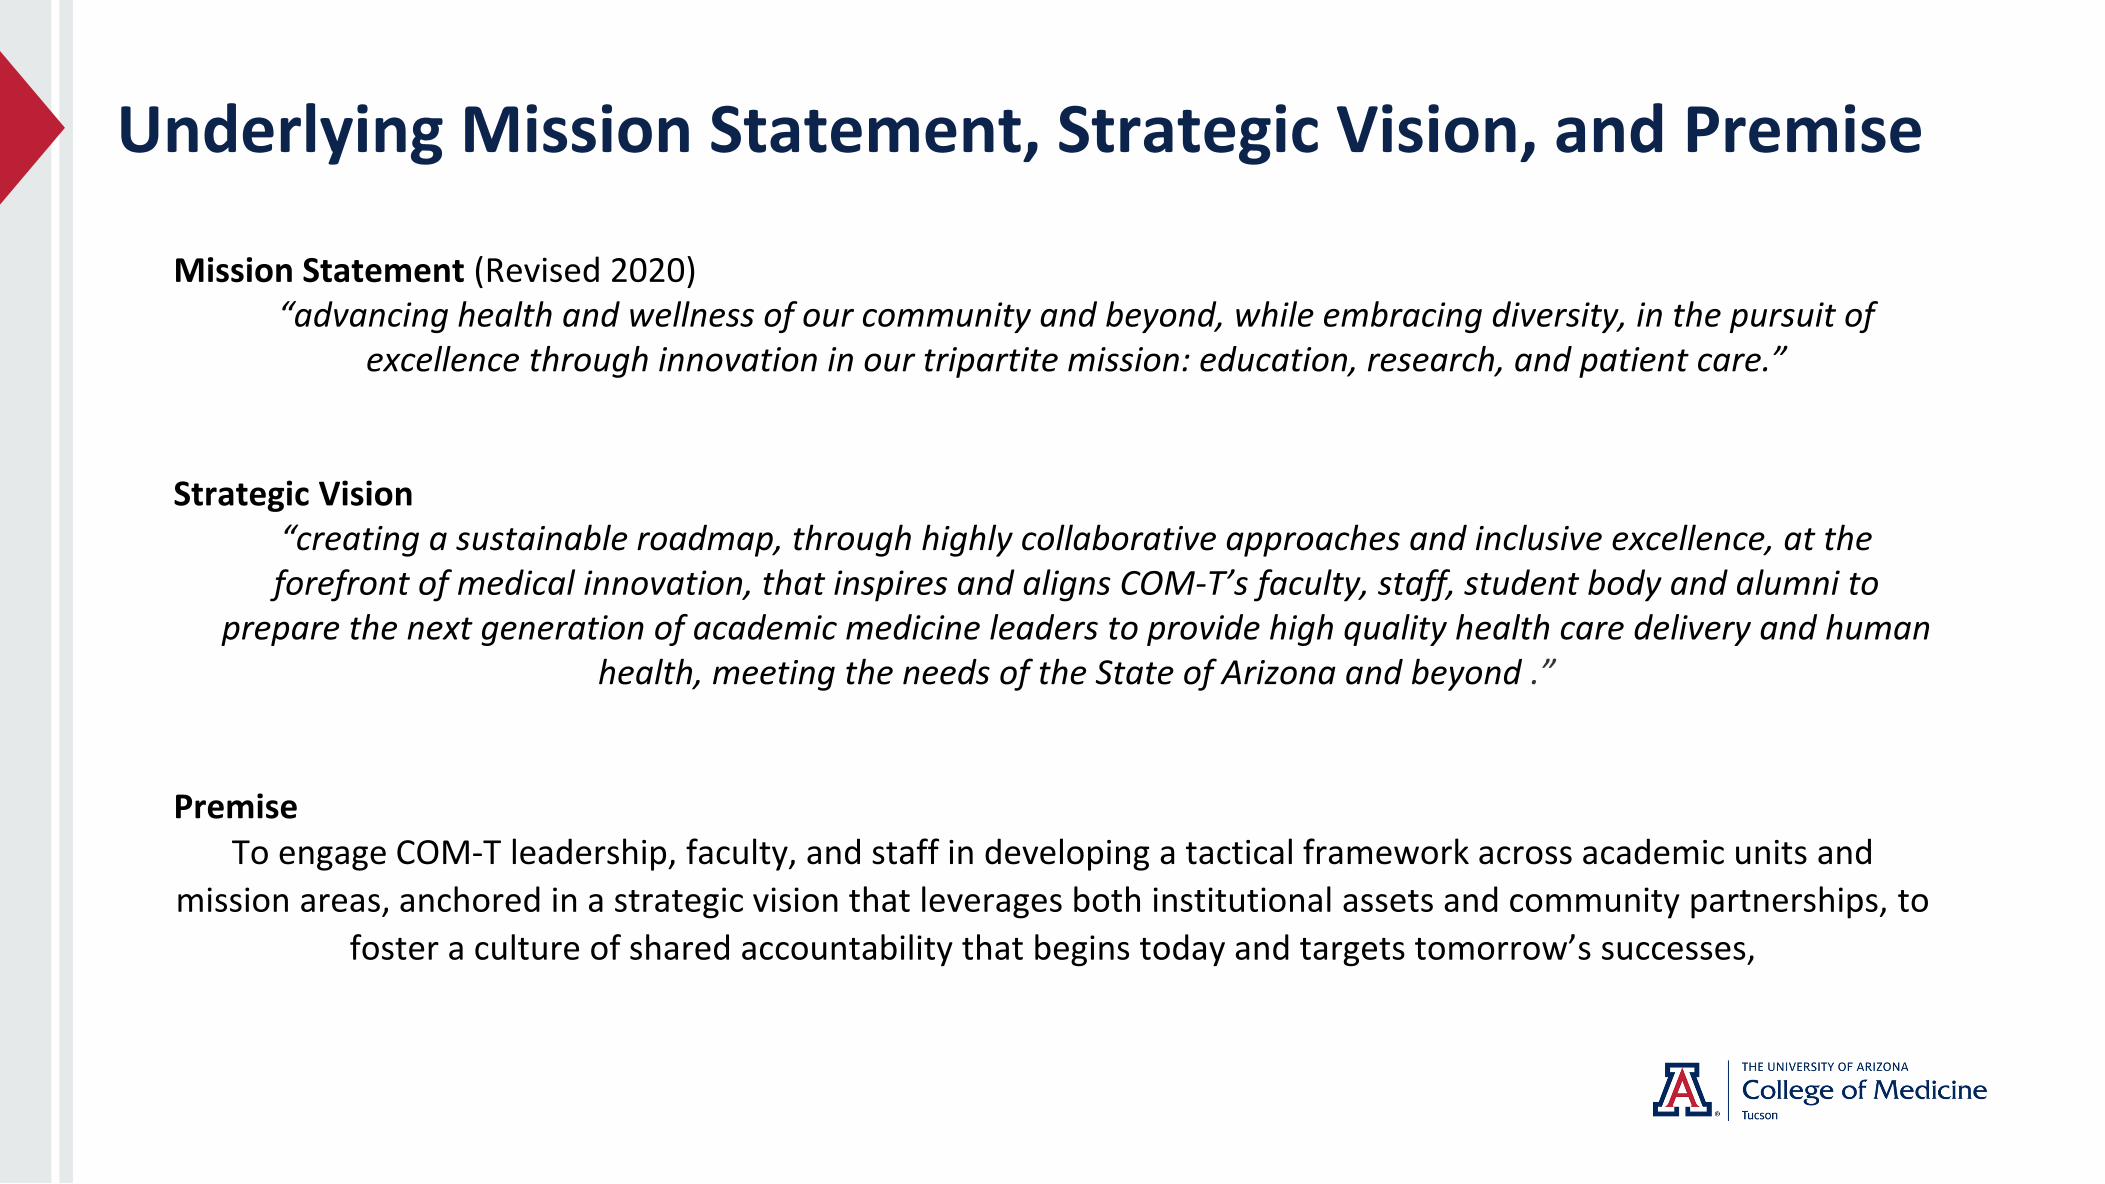
Underlying Mission Statement, Strategic Vision, and Premise
Mission Statement (Revised 2020)“advancing health and wellness of our community and beyond, while embracing diversity, in the pursuit of
excellence through innovation in our tripartite mission: education, research, and patient care.”
Strategic Vision“creating a sustainable roadmap, through highly collaborative approaches and inclusive excellence, at the forefront of medical innovation, that inspires and aligns COM-T’s faculty, staff, student body and alumni to
prepare the next generation of academic medicine leaders to provide high quality health care delivery and human health, meeting the needs of the State of Arizona and beyond .”
PremiseTo engage COM-T leadership, faculty, and staff in developing a tactical framework across academic units and
mission areas, anchored in a strategic vision that leverages both institutional assets and community partnerships, to
foster a culture of shared accountability that begins today and targets tomorrow’s successes,
The Plan ‘at a glance’ Vision and Anticipated 3-year milestones/outcomes - I
1. Education:
“a modern and integrated curriculum plan that prioritizes the intellectual, professional, and personal development of a diverse group of students and trainees, preparing them as health providers, scientists, and educators, and as future leaders in academic medicine in the context of the related workforce needs of the state of Arizona and beyond.”
• New admission pathways: successful first APME class matriculation with low attrition, successful progression of first Bachelor’s degree in Medicine class with >1,000 students enrolled student at year 3; P-MAP program (continue enrolling matriculating 10 students/yr); HEAP (continue enrolling 10 students/yr and monitor leakiness from APME);
• LCME: successful full 8 years re-accreditation; GPA/Sc GPA/MCAT 3.73/3.6/510; URiM >30%;
• GQ scores: 50-75%ile basic science preparation, satisfaction with education 95% over median, with student affairs >75%ile, development as a person >75% over median, as future physician >75%ile, career advising >75%ile, confident to begin residency>90%, >75%ile, student mistreatment <40%, % reporting on mistreatment >40%; clerkship scores above median, delay in USMLE Step 1 <5, Step 1 pass rate >95% (3-year average), Step 2 CK pass rate >95% (3-year average) and >98% above median scores;
• MD PHD program: MSTP T32 NIH funding; students under MSTP 3, increase F-awards to 7;
• GME: match rate pre-SOAP >95% and exceeding national median; ACGME survey regarding balance above national average, retention COM-T/P 30%.
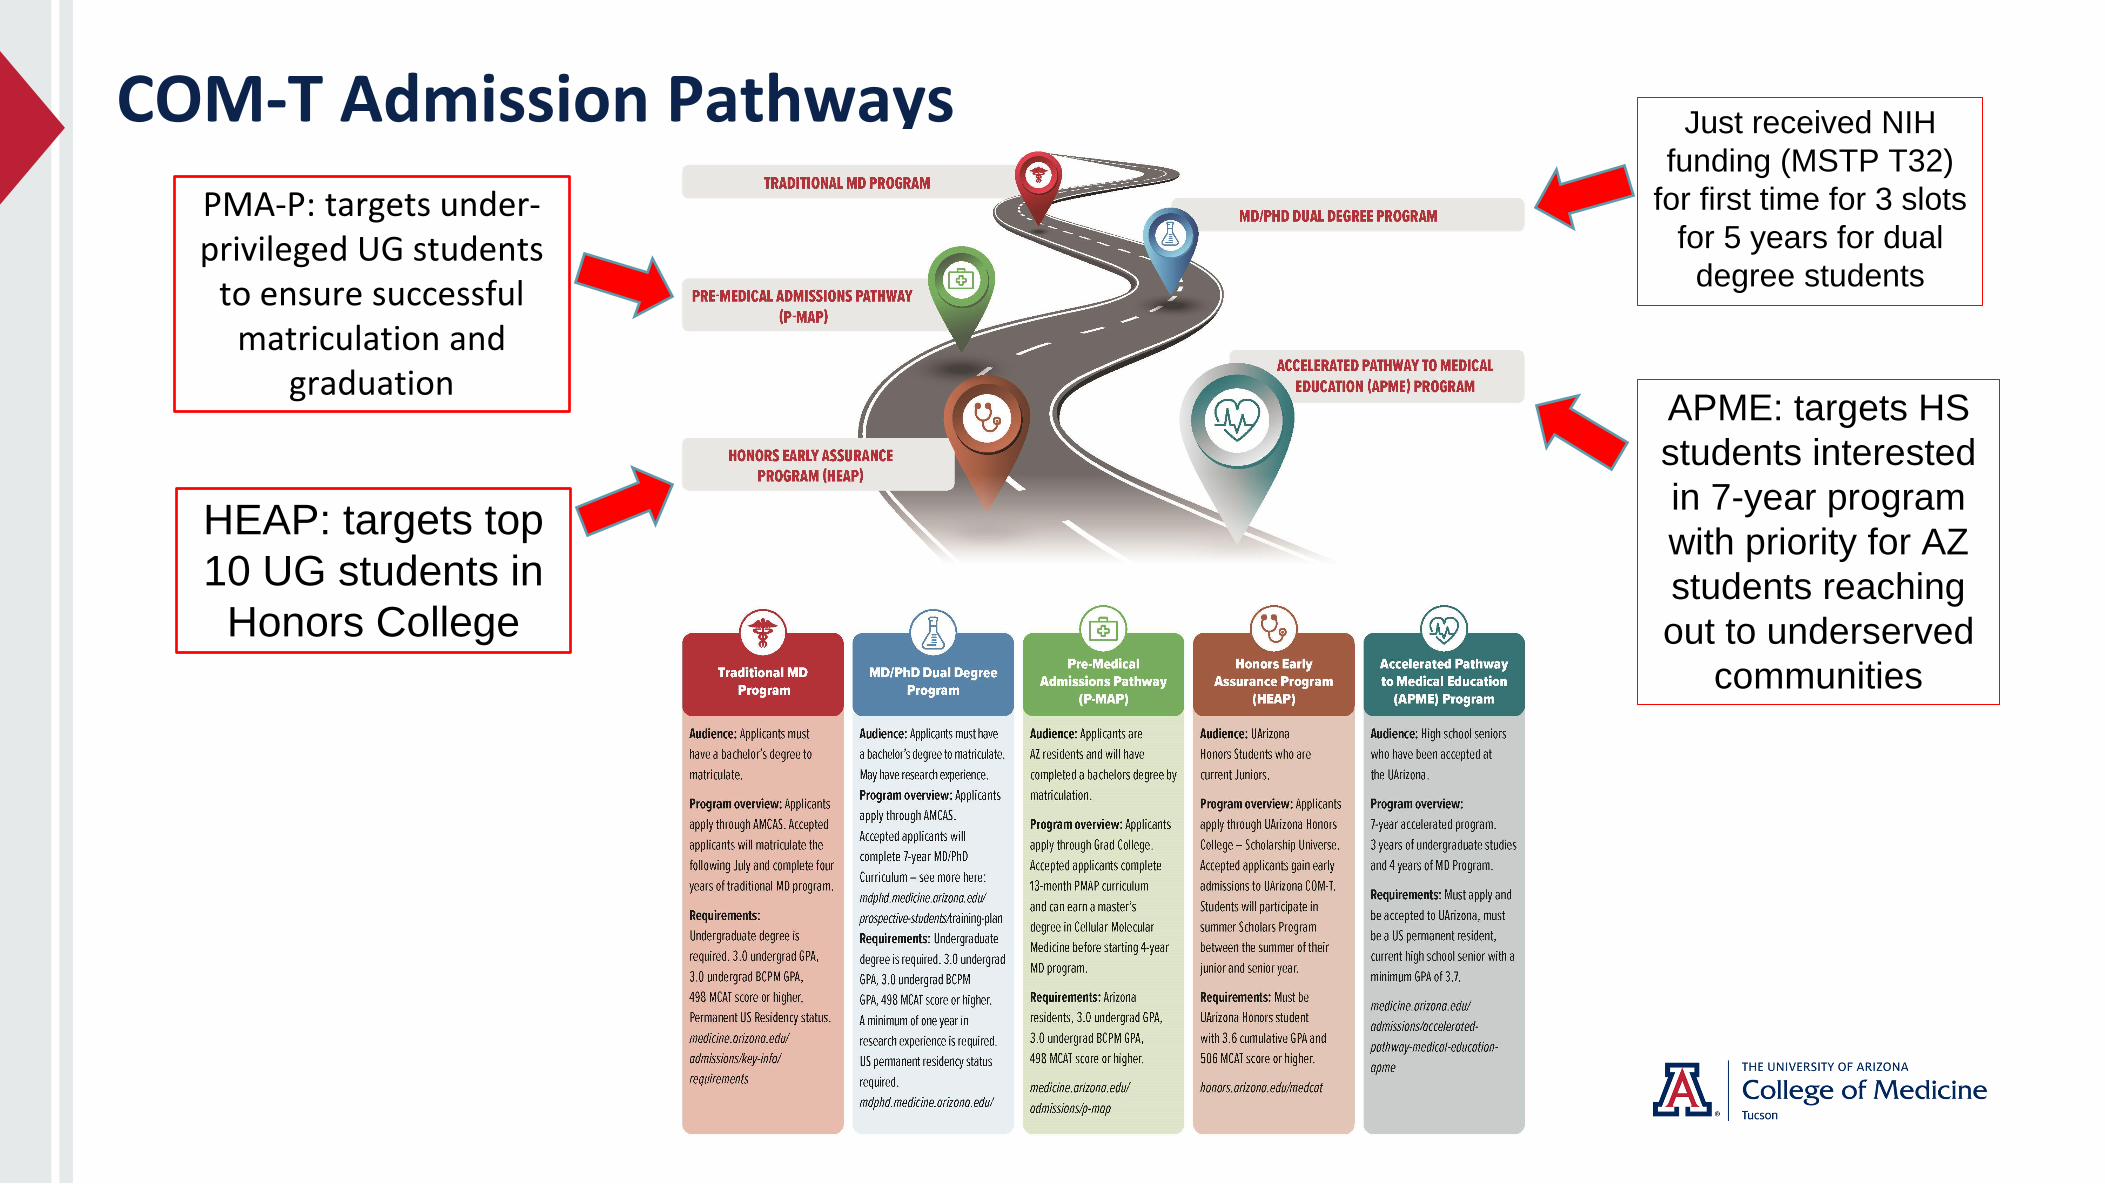
COM-T Admission Pathways
PMA-P: targets under-privileged UG students
to ensure successful matriculation and
graduation
HEAP: targets top
10 UG students in
Honors College
Just received NIH
funding (MSTP T32)
for first time for 3 slots
for 5 years for dual
degree students
APME: targets HS
students interested
in 7-year program
with priority for AZ
students reaching
out to underserved
communities
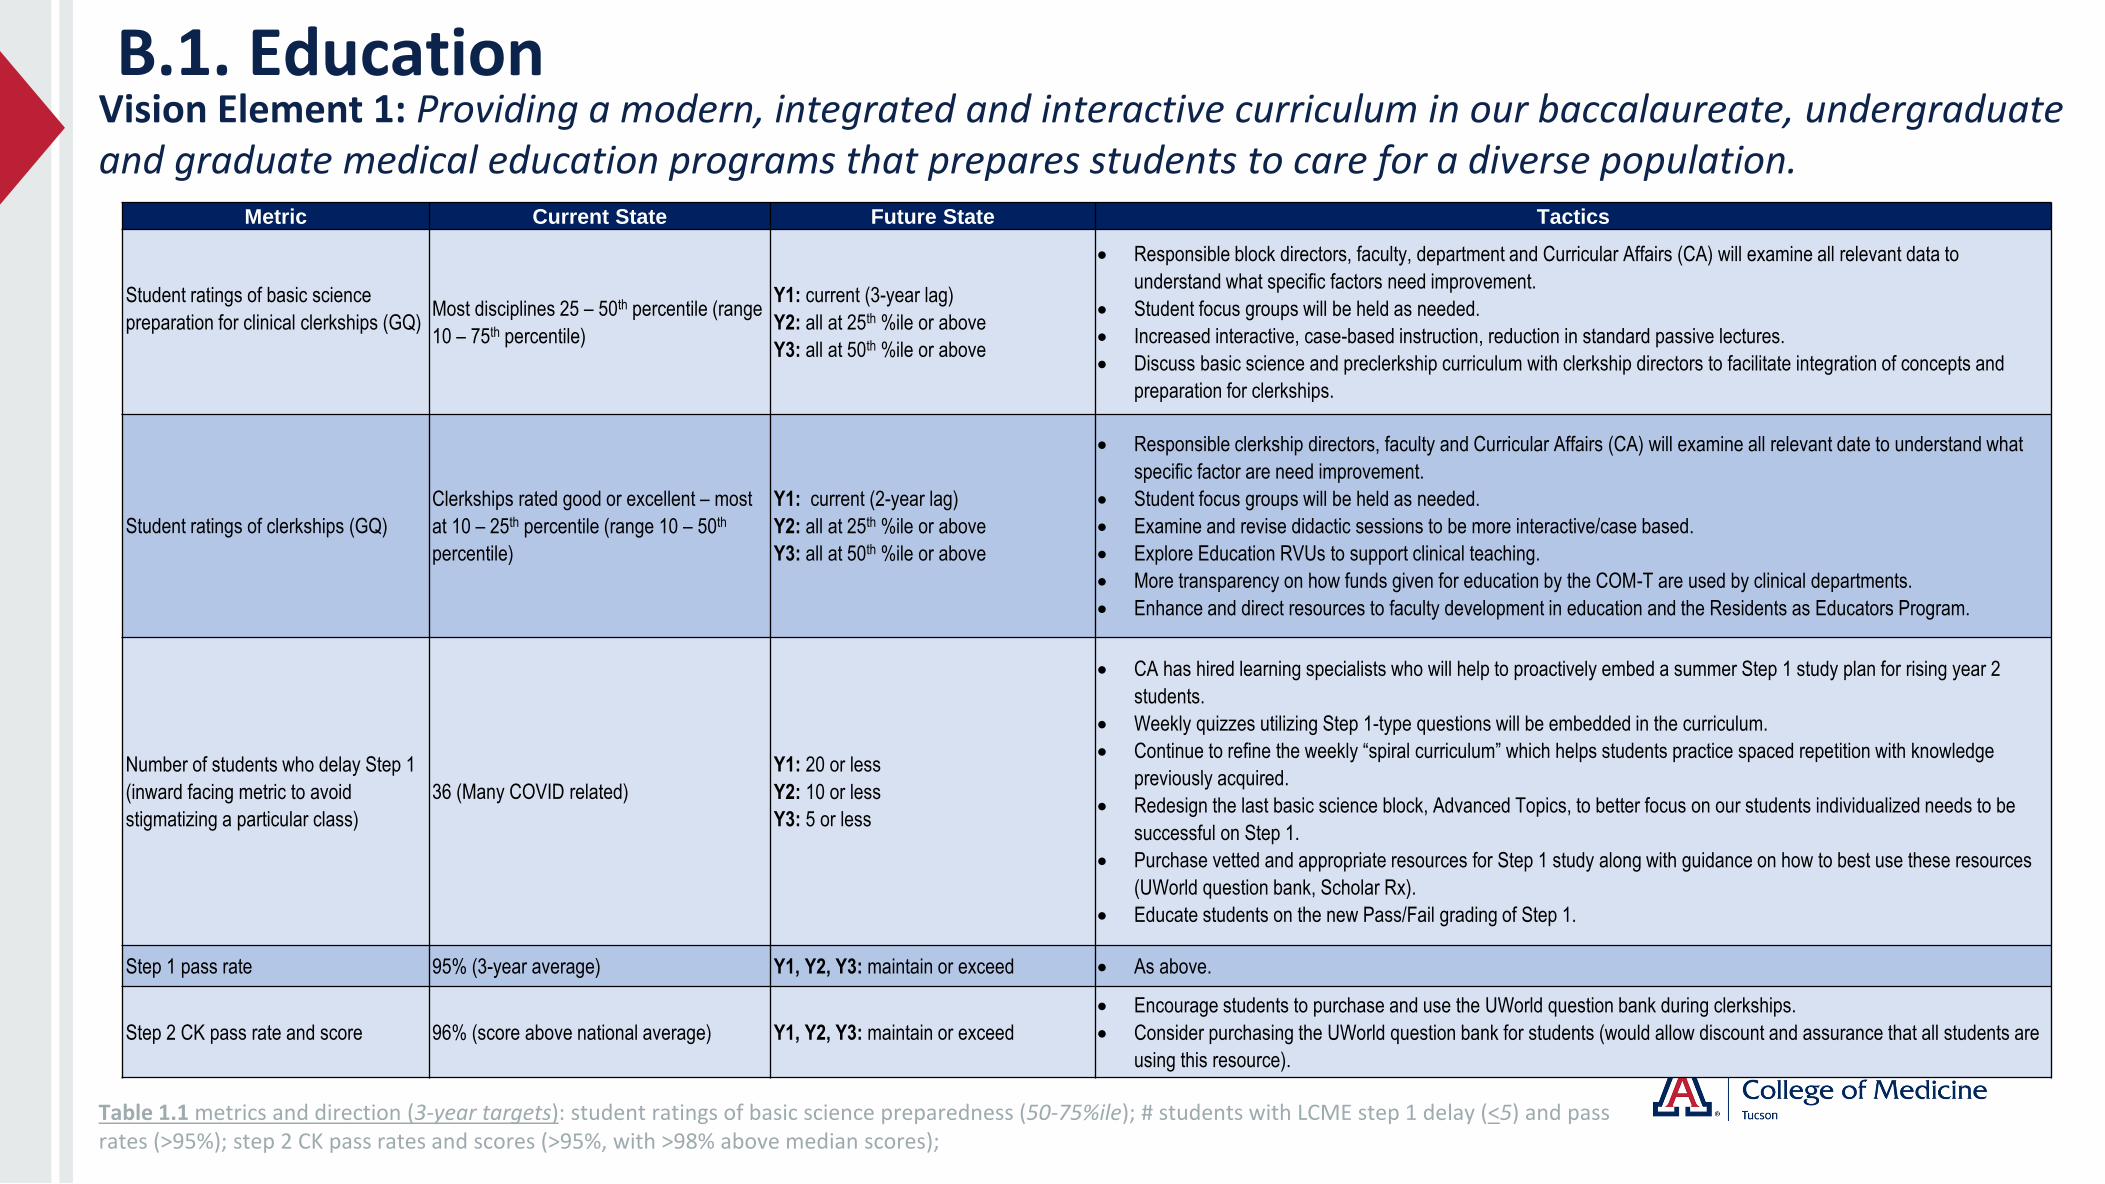
B.1. EducationVision Element 1: Providing a modern, integrated and interactive curriculum in our baccalaureate, undergraduate and graduate medical education programs that prepares students to care for a diverse population.
Table 1.1 metrics and direction (3-year targets): student ratings of basic science preparedness (50-75%ile); # students with LCME step 1 delay (<5) and pass rates (>95%); step 2 CK pass rates and scores (>95%, with >98% above median scores);
Metric Current State Future State Tactics
Student ratings of basic science
preparation for clinical clerkships (GQ)Most disciplines 25 – 50th percentile (range
10 – 75th percentile)
Y1: current (3-year lag)
Y2: all at 25th %ile or above
Y3: all at 50th %ile or above
• Responsible block directors, faculty, department and Curricular Affairs (CA) will examine all relevant data to
understand what specific factors need improvement.
• Student focus groups will be held as needed.
• Increased interactive, case-based instruction, reduction in standard passive lectures.
• Discuss basic science and preclerkship curriculum with clerkship directors to facilitate integration of concepts and
preparation for clerkships.
Student ratings of clerkships (GQ)
Clerkships rated good or excellent – most
at 10 – 25th percentile (range 10 – 50th
percentile)
Y1: current (2-year lag)
Y2: all at 25th %ile or above
Y3: all at 50th %ile or above
• Responsible clerkship directors, faculty and Curricular Affairs (CA) will examine all relevant date to understand what
specific factor are need improvement.
• Student focus groups will be held as needed.
• Examine and revise didactic sessions to be more interactive/case based.
• Explore Education RVUs to support clinical teaching.
• More transparency on how funds given for education by the COM-T are used by clinical departments.
• Enhance and direct resources to faculty development in education and the Residents as Educators Program.
Number of students who delay Step 1
(inward facing metric to avoid
stigmatizing a particular class)
36 (Many COVID related)
Y1: 20 or less
Y2: 10 or less
Y3: 5 or less
• CA has hired learning specialists who will help to proactively embed a summer Step 1 study plan for rising year 2
students.
• Weekly quizzes utilizing Step 1-type questions will be embedded in the curriculum.
• Continue to refine the weekly “spiral curriculum” which helps students practice spaced repetition with knowledge
previously acquired.
• Redesign the last basic science block, Advanced Topics, to better focus on our students individualized needs to be
successful on Step 1.
• Purchase vetted and appropriate resources for Step 1 study along with guidance on how to best use these resources
(UWorld question bank, Scholar Rx).
• Educate students on the new Pass/Fail grading of Step 1.
Step 1 pass rate 95% (3-year average) Y1, Y2, Y3: maintain or exceed • As above.
Step 2 CK pass rate and score 96% (score above national average) Y1, Y2, Y3: maintain or exceed
• Encourage students to purchase and use the UWorld question bank during clerkships.
• Consider purchasing the UWorld question bank for students (would allow discount and assurance that all students are
using this resource).
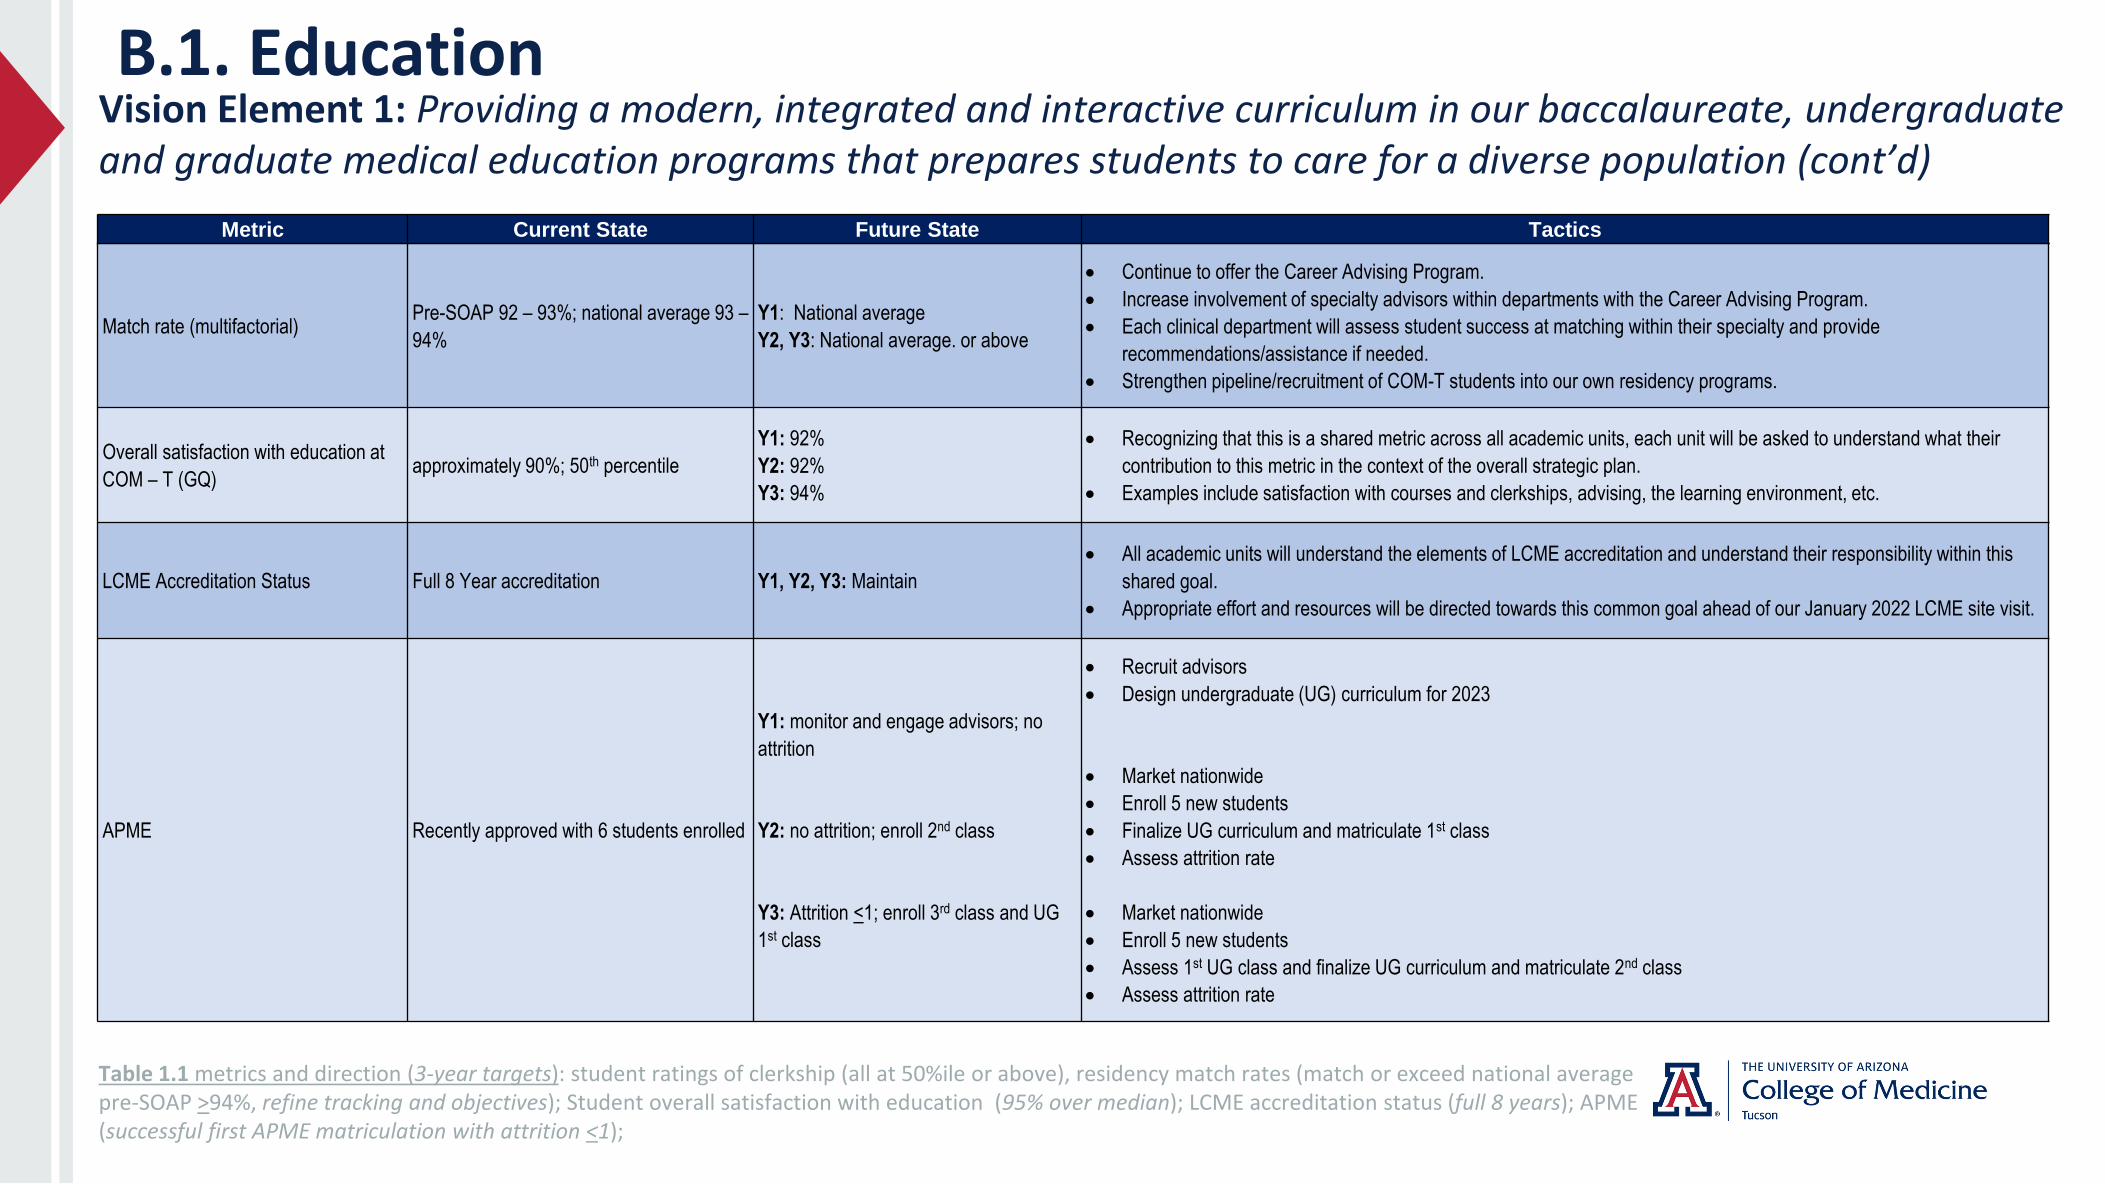
B.1. EducationVision Element 1: Providing a modern, integrated and interactive curriculum in our baccalaureate, undergraduate and graduate medical education programs that prepares students to care for a diverse population (cont’d)
Table 1.1 metrics and direction (3-year targets): student ratings of clerkship (all at 50%ile or above), residency match rates (match or exceed national average pre-SOAP >94%, refine tracking and objectives); Student overall satisfaction with education (95% over median); LCME accreditation status (full 8 years); APME (successful first APME matriculation with attrition <1);
Match rate (multifactorial)Pre-SOAP 92 – 93%; national average 93 –
94%
Y1: National average
Y2, Y3: National average. or above
• Continue to offer the Career Advising Program.
• Increase involvement of specialty advisors within departments with the Career Advising Program.
• Each clinical department will assess student success at matching within their specialty and provide
recommendations/assistance if needed.
• Strengthen pipeline/recruitment of COM-T students into our own residency programs.
Overall satisfaction with education at
COM – T (GQ)approximately 90%; 50th percentile
Y1: 92%
Y2: 92%
Y3: 94%
• Recognizing that this is a shared metric across all academic units, each unit will be asked to understand what their
contribution to this metric in the context of the overall strategic plan.
• Examples include satisfaction with courses and clerkships, advising, the learning environment, etc.
LCME Accreditation Status Full 8 Year accreditation Y1, Y2, Y3: Maintain
• All academic units will understand the elements of LCME accreditation and understand their responsibility within this
shared goal.
• Appropriate effort and resources will be directed towards this common goal ahead of our January 2022 LCME site visit.
APME Recently approved with 6 students enrolled
Y1: monitor and engage advisors; no
attrition
Y2: no attrition; enroll 2nd class
Y3: Attrition <1; enroll 3rd class and UG
1st class
• Recruit advisors
• Design undergraduate (UG) curriculum for 2023
• Market nationwide
• Enroll 5 new students
• Finalize UG curriculum and matriculate 1st class
• Assess attrition rate
• Market nationwide
• Enroll 5 new students
• Assess 1st UG class and finalize UG curriculum and matriculate 2nd class
• Assess attrition rate
Metric Current State Future State Tactics
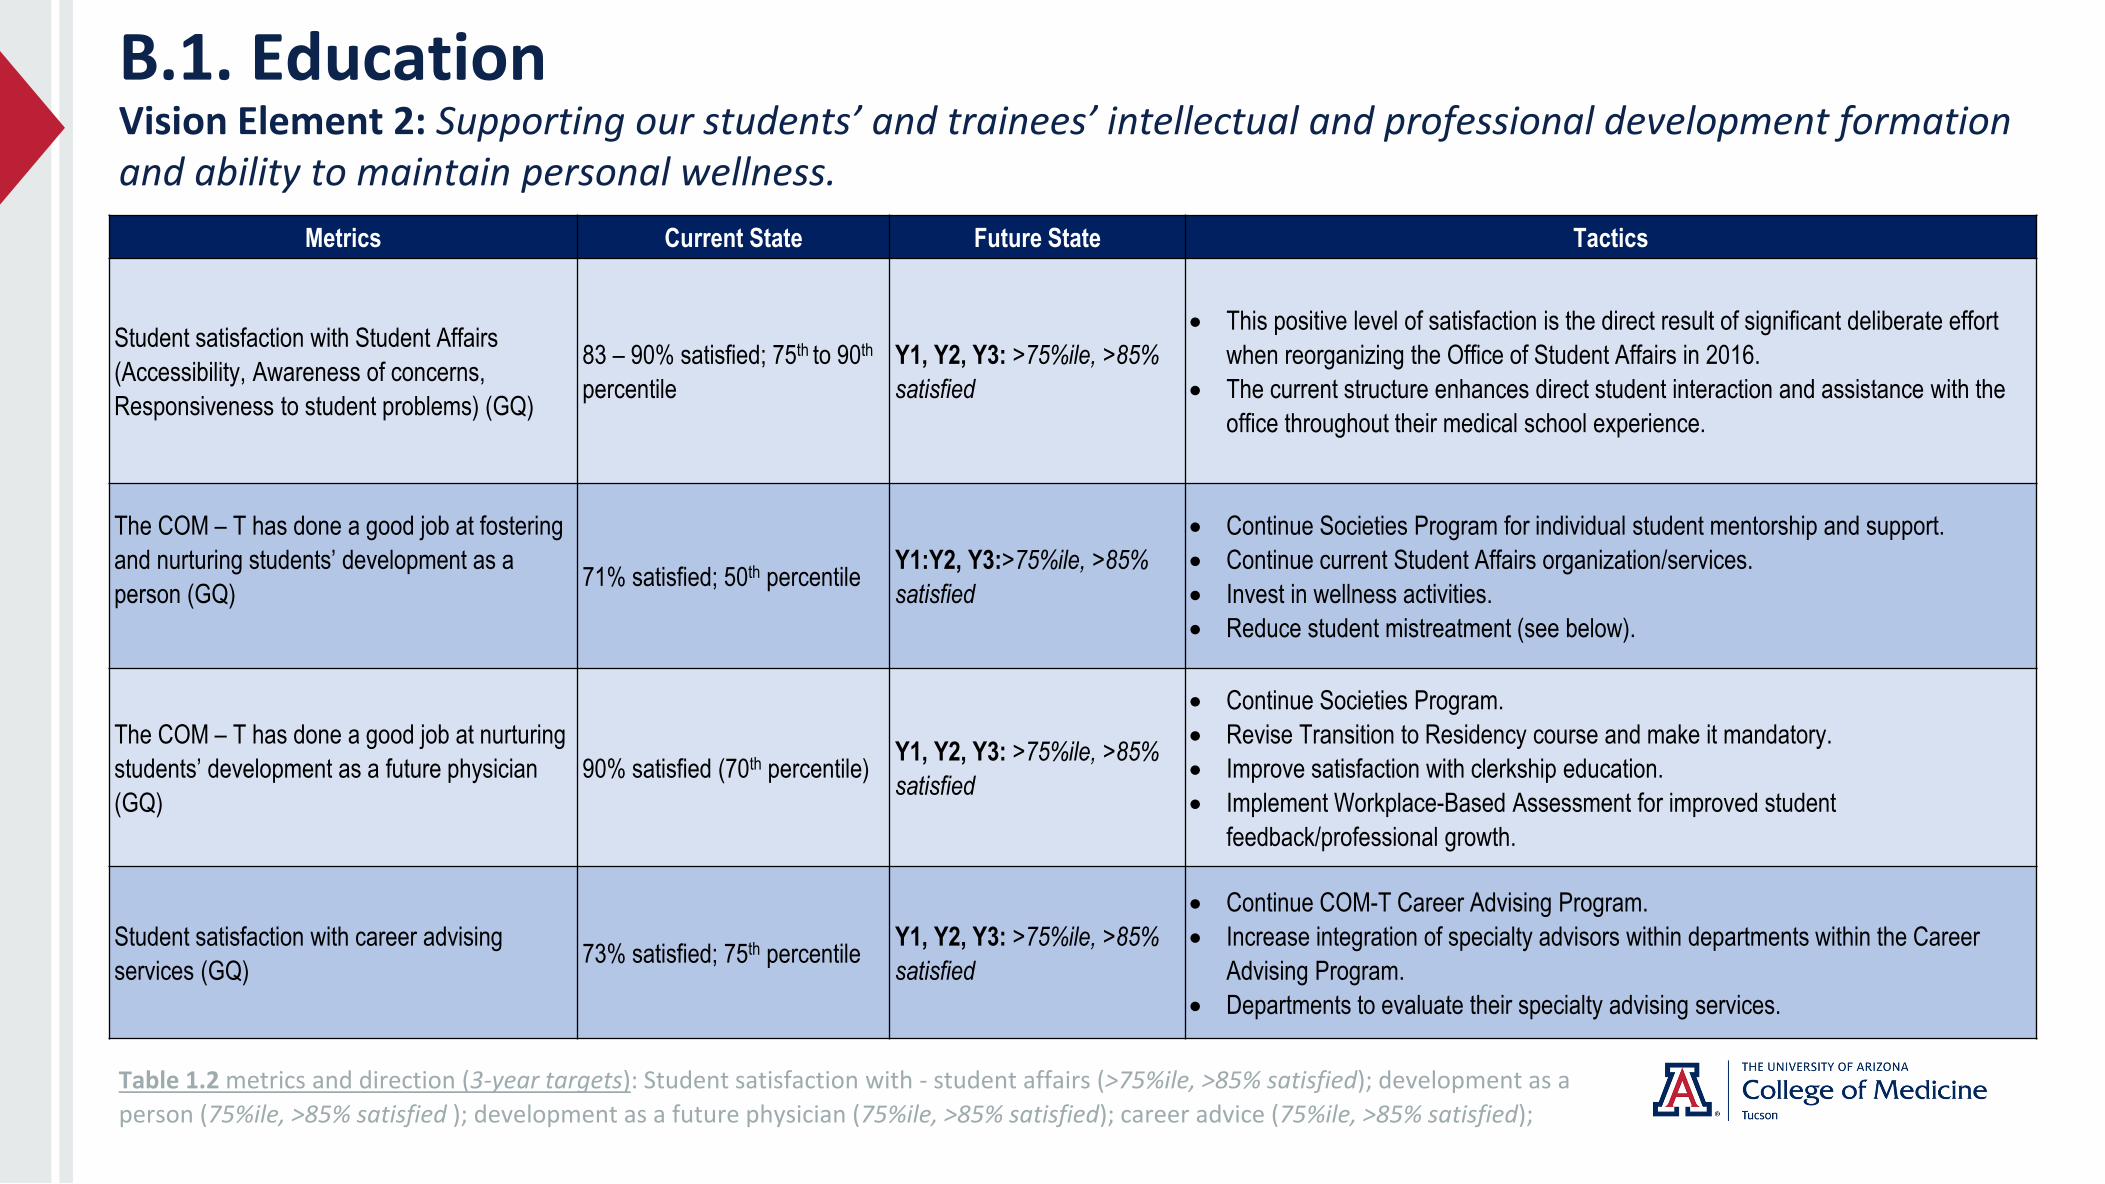
B.1. EducationVision Element 2: Supporting our students’ and trainees’ intellectual and professional development formation and ability to maintain personal wellness.
Table 1.2 metrics and direction (3-year targets): Student satisfaction with - student affairs (>75%ile, >85% satisfied); development as a
person (75%ile, >85% satisfied ); development as a future physician (75%ile, >85% satisfied); career advice (75%ile, >85% satisfied);
Metrics Current State Future State Tactics
Student satisfaction with Student Affairs
(Accessibility, Awareness of concerns,
Responsiveness to student problems) (GQ)
83 – 90% satisfied; 75th to 90th
percentile
Y1, Y2, Y3: >75%ile, >85%
satisfied
• This positive level of satisfaction is the direct result of significant deliberate effort
when reorganizing the Office of Student Affairs in 2016.
• The current structure enhances direct student interaction and assistance with the
office throughout their medical school experience.
The COM – T has done a good job at fostering
and nurturing students’ development as a
person (GQ)71% satisfied; 50th percentile
Y1:Y2, Y3:>75%ile, >85%
satisfied
• Continue Societies Program for individual student mentorship and support.
• Continue current Student Affairs organization/services.
• Invest in wellness activities.
• Reduce student mistreatment (see below).
The COM – T has done a good job at nurturing
students’ development as a future physician
(GQ)
90% satisfied (70th percentile)Y1, Y2, Y3: >75%ile, >85%
satisfied
• Continue Societies Program.
• Revise Transition to Residency course and make it mandatory.
• Improve satisfaction with clerkship education.
• Implement Workplace-Based Assessment for improved student
feedback/professional growth.
Student satisfaction with career advising
services (GQ)73% satisfied; 75th percentile
Y1, Y2, Y3: >75%ile, >85%
satisfied
• Continue COM-T Career Advising Program.
• Increase integration of specialty advisors within departments within the Career
Advising Program.
• Departments to evaluate their specialty advising services.
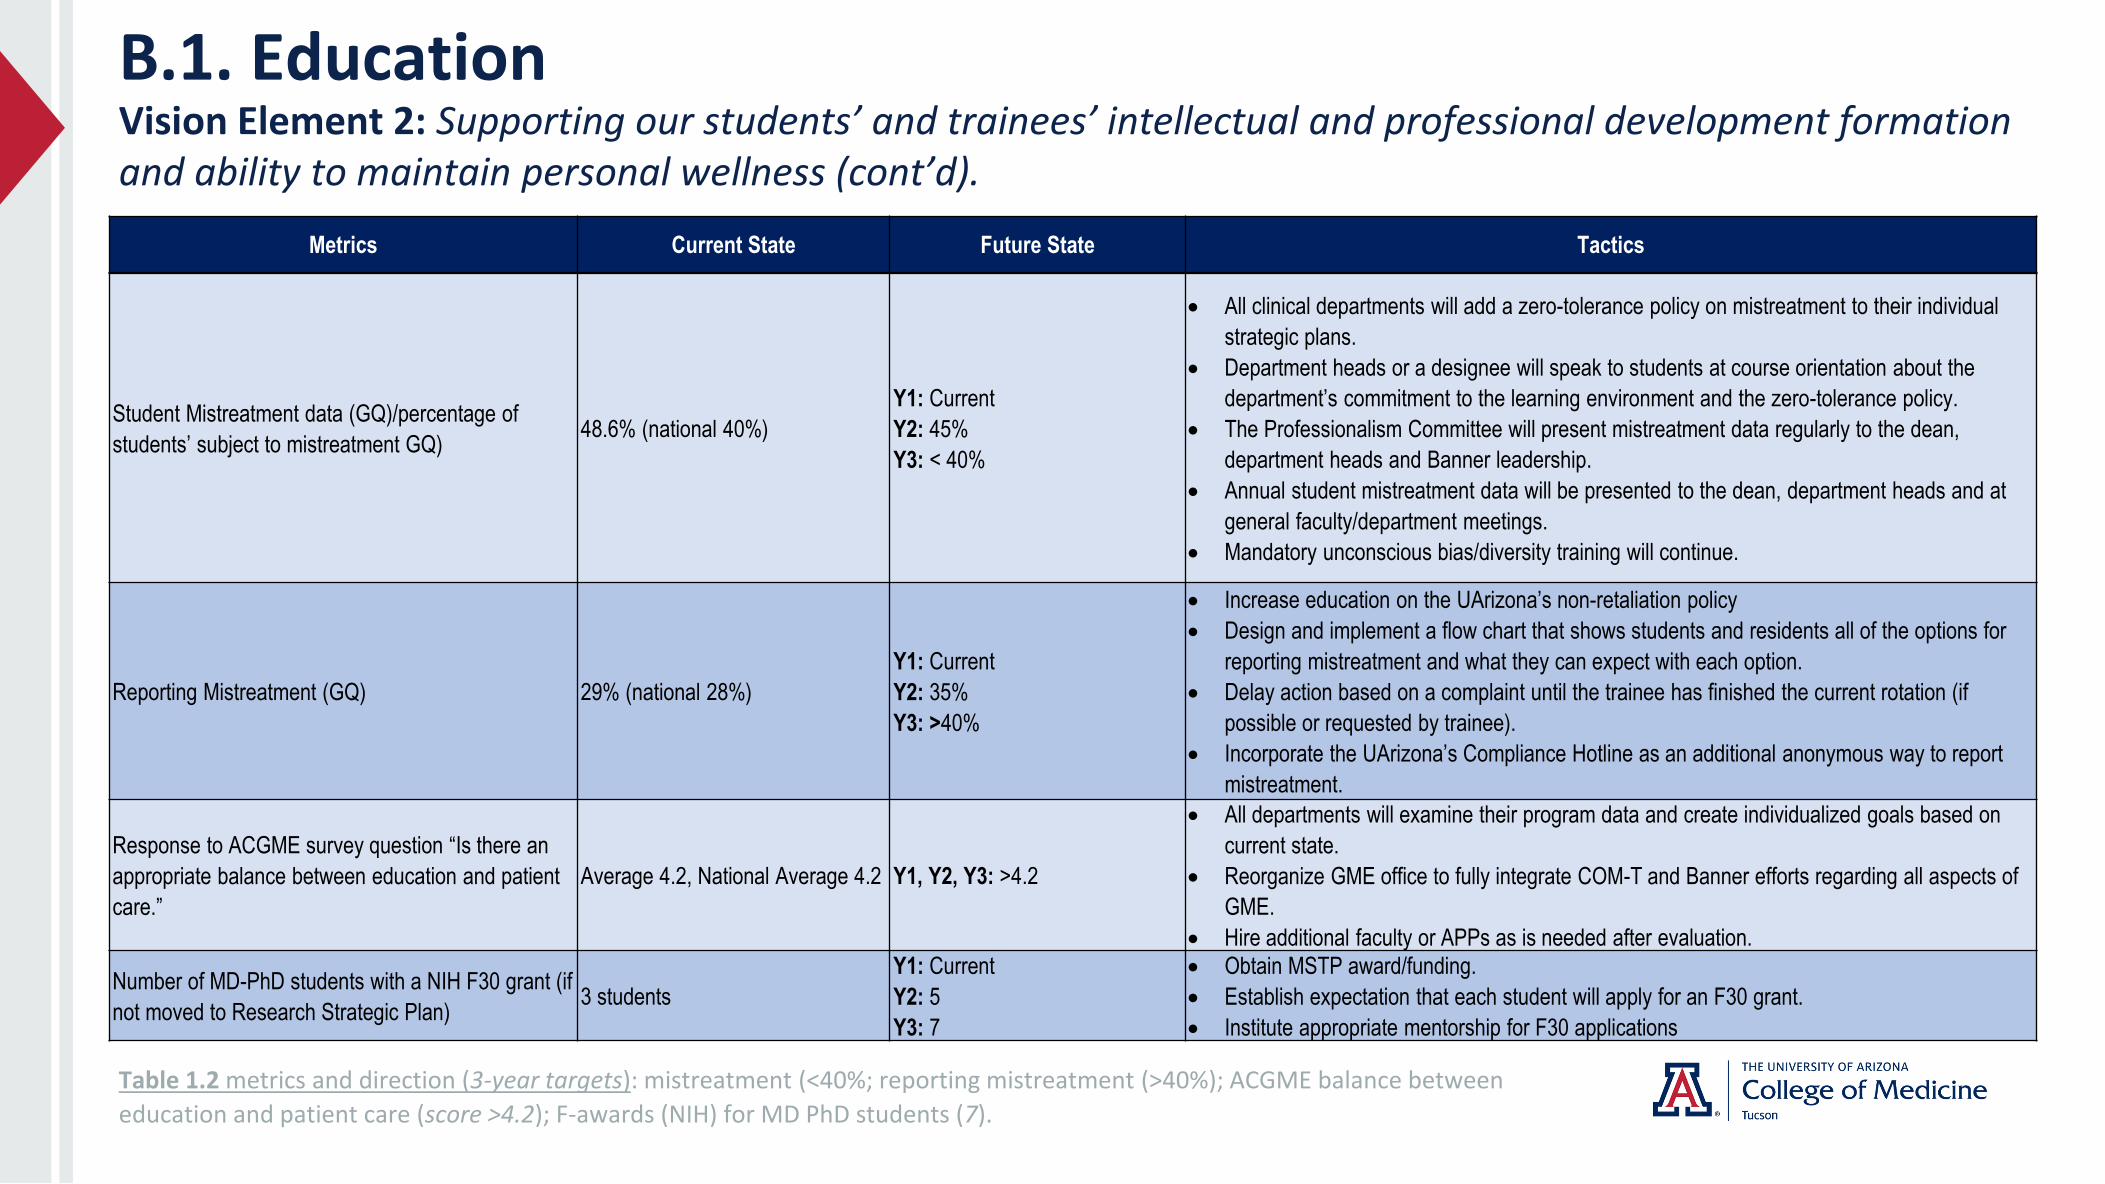
B.1. EducationVision Element 2: Supporting our students’ and trainees’ intellectual and professional development formation and ability to maintain personal wellness (cont’d).
Table 1.2 metrics and direction (3-year targets): mistreatment (<40%; reporting mistreatment (>40%); ACGME balance between
education and patient care (score >4.2); F-awards (NIH) for MD PhD students (7).
Student Mistreatment data (GQ)/percentage of
students’ subject to mistreatment GQ)48.6% (national 40%)
Y1: Current
Y2: 45%
Y3: < 40%
• All clinical departments will add a zero-tolerance policy on mistreatment to their individual
strategic plans.
• Department heads or a designee will speak to students at course orientation about the
department’s commitment to the learning environment and the zero-tolerance policy.
• The Professionalism Committee will present mistreatment data regularly to the dean,
department heads and Banner leadership.
• Annual student mistreatment data will be presented to the dean, department heads and at
general faculty/department meetings.
• Mandatory unconscious bias/diversity training will continue.
Reporting Mistreatment (GQ) 29% (national 28%)
Y1: Current
Y2: 35%
Y3: >40%
• Increase education on the UArizona’s non-retaliation policy
• Design and implement a flow chart that shows students and residents all of the options for
reporting mistreatment and what they can expect with each option.
• Delay action based on a complaint until the trainee has finished the current rotation (if
possible or requested by trainee).
• Incorporate the UArizona’s Compliance Hotline as an additional anonymous way to report
mistreatment.
Response to ACGME survey question “Is there an
appropriate balance between education and patient
care.”
Average 4.2, National Average 4.2 Y1, Y2, Y3: >4.2
• All departments will examine their program data and create individualized goals based on
current state.
• Reorganize GME office to fully integrate COM-T and Banner efforts regarding all aspects of
GME.
• Hire additional faculty or APPs as is needed after evaluation.
Number of MD-PhD students with a NIH F30 grant (if
not moved to Research Strategic Plan)3 students
Y1: Current
Y2: 5
Y3: 7
• Obtain MSTP award/funding.
• Establish expectation that each student will apply for an F30 grant.
• Institute appropriate mentorship for F30 applications
Metrics Current State Future State Tactics

B.1. EducationVision Element 3: Creating highly desirable graduate medical education (GME) programs such that our own students seek training in our programs.
Table 1.3 metrics and direction (3-year targets): Resident satisfaction - balancing education and patient care - ACGME resident survey (>4.4); retention of students into GME – residencies (>30%).
Metric Current State Future State Tactics
Overall average on the
ACGME Resident
Survey at or above the
national average.
Compliance at 4.4 (on a 5-
point Likert scale) which is
at National average
Y1, Y2, Y3: Maintain
compliance at or above
national average
• All departments will examine their program data and create individualized goals
based on current state.
• Resident focus groups will be conducted as needed.
• Funding for resident education and travel/conferences will be standardized
across programs.
UA COM-T retention of
COMT/P students in
our GME
25% of COMT/P students
are retained in our COMT
GME programs
Y1: retain 28%
Y2: retain 30%
Y3: retain 30%
• All relevant clinical departments will create a goal for COM-T student
recruitment.
• All relevant clinical departments will participate in the Career Advising Program
and host events for interested students to explore the specialty and the specific
residency program.
• The COM-T GME office will work with the Office of Student Affairs and the
departments to identify additional strategies to enhance recruitment of COM-T
students.
• All relevant clinical departments will examine their specialty advisor program as
above.
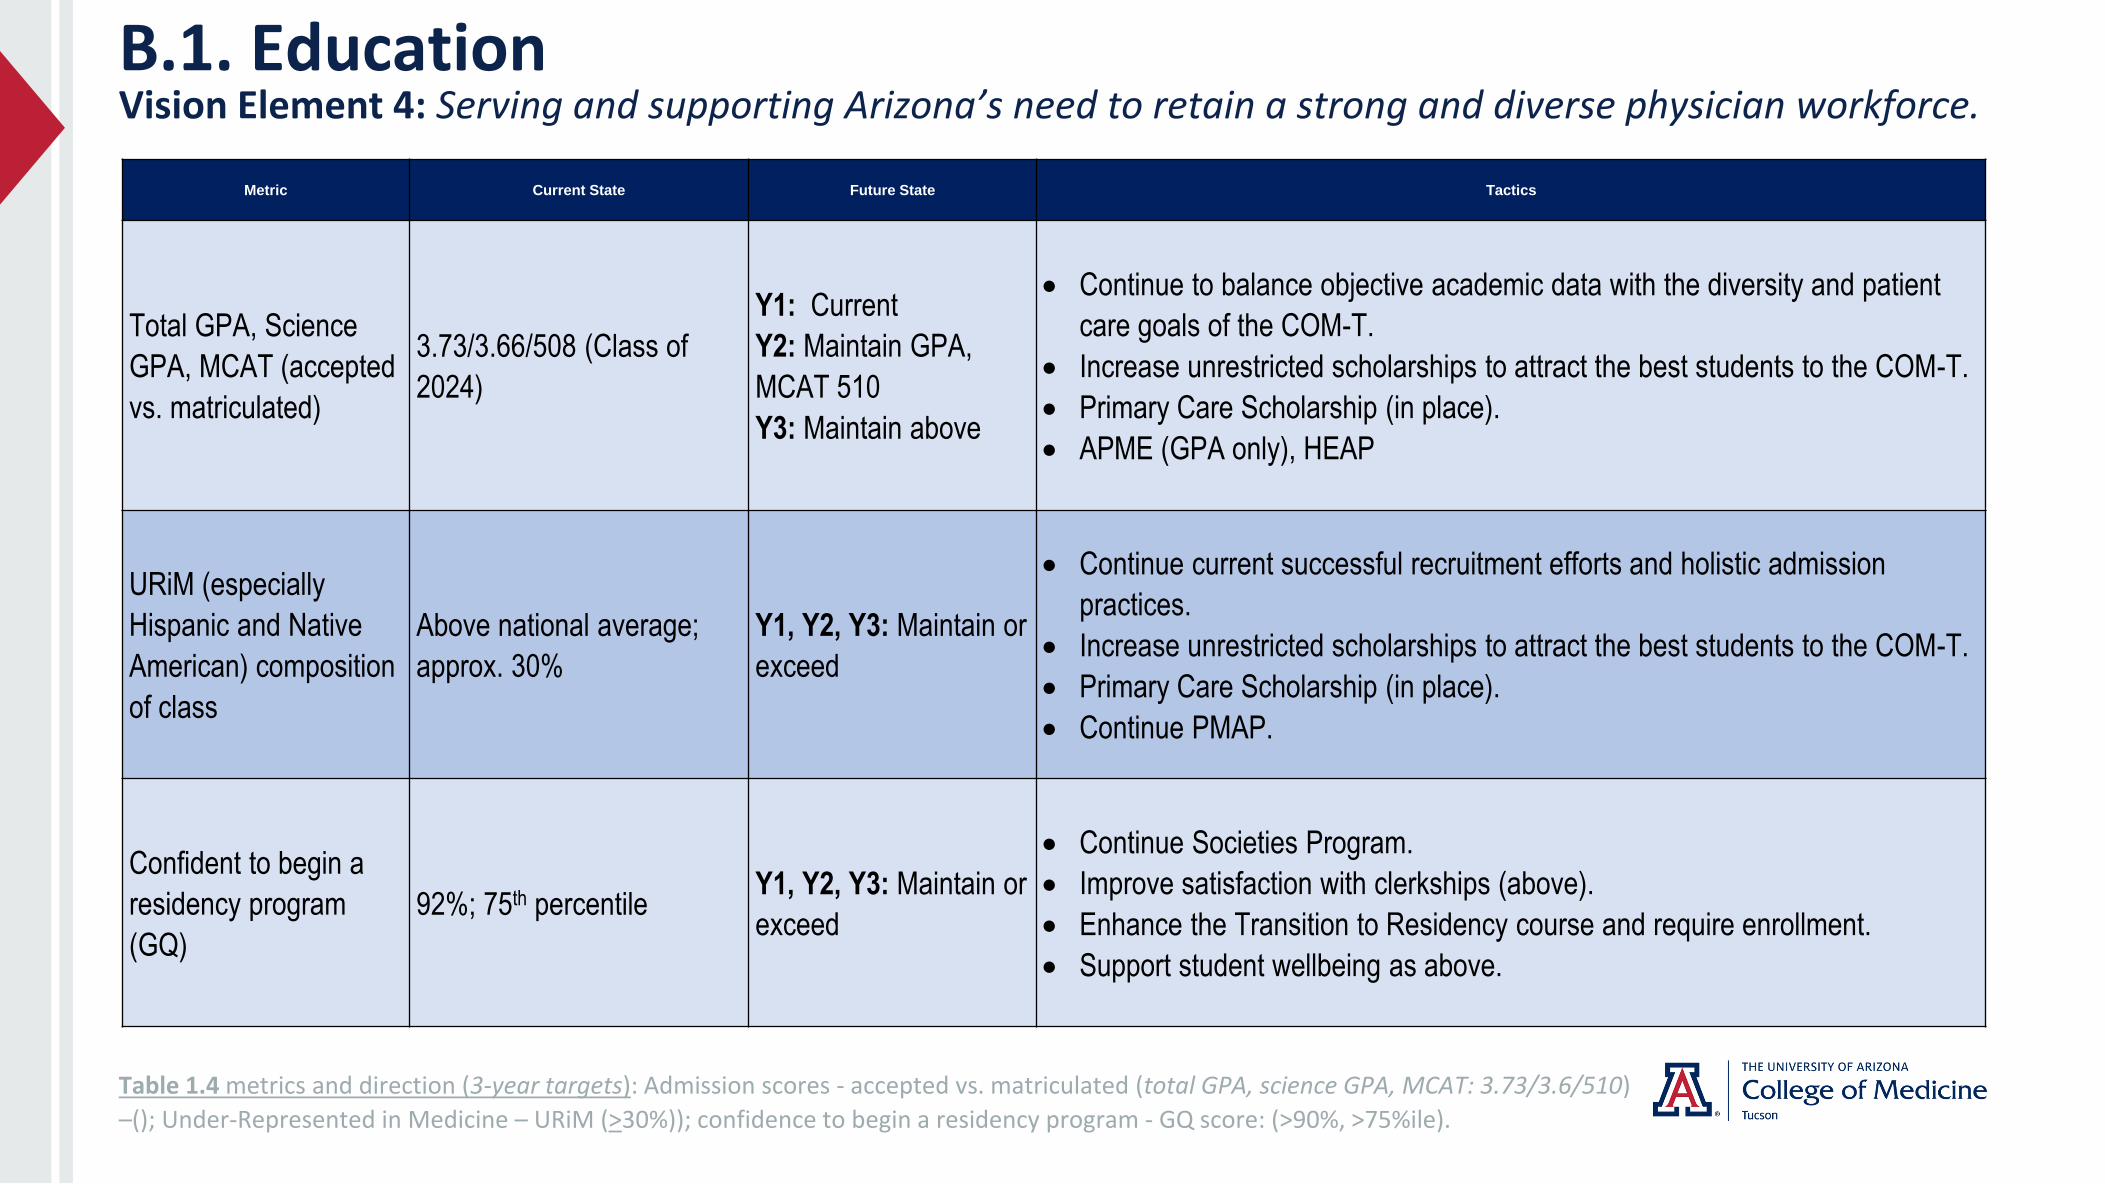
B.1. EducationVision Element 4: Serving and supporting Arizona’s need to retain a strong and diverse physician workforce.
Table 1.4 metrics and direction (3-year targets): Admission scores - accepted vs. matriculated (total GPA, science GPA, MCAT: 3.73/3.6/510)
–(); Under-Represented in Medicine – URiM (>30%)); confidence to begin a residency program - GQ score: (>90%, >75%ile).
Metric Current State Future State Tactics
Total GPA, Science
GPA, MCAT (accepted
vs. matriculated)
3.73/3.66/508 (Class of
2024)
Y1: Current
Y2: Maintain GPA,
MCAT 510
Y3: Maintain above
• Continue to balance objective academic data with the diversity and patient
care goals of the COM-T.
• Increase unrestricted scholarships to attract the best students to the COM-T.
• Primary Care Scholarship (in place).
• APME (GPA only), HEAP
URiM (especially
Hispanic and Native
American) composition
of class
Above national average;
approx. 30%
Y1, Y2, Y3: Maintain or
exceed
• Continue current successful recruitment efforts and holistic admission
practices.
• Increase unrestricted scholarships to attract the best students to the COM-T.
• Primary Care Scholarship (in place).
• Continue PMAP.
Confident to begin a
residency program
(GQ)
92%; 75th percentileY1, Y2, Y3: Maintain or
exceed
• Continue Societies Program.
• Improve satisfaction with clerkships (above).
• Enhance the Transition to Residency course and require enrollment.
• Support student wellbeing as above.
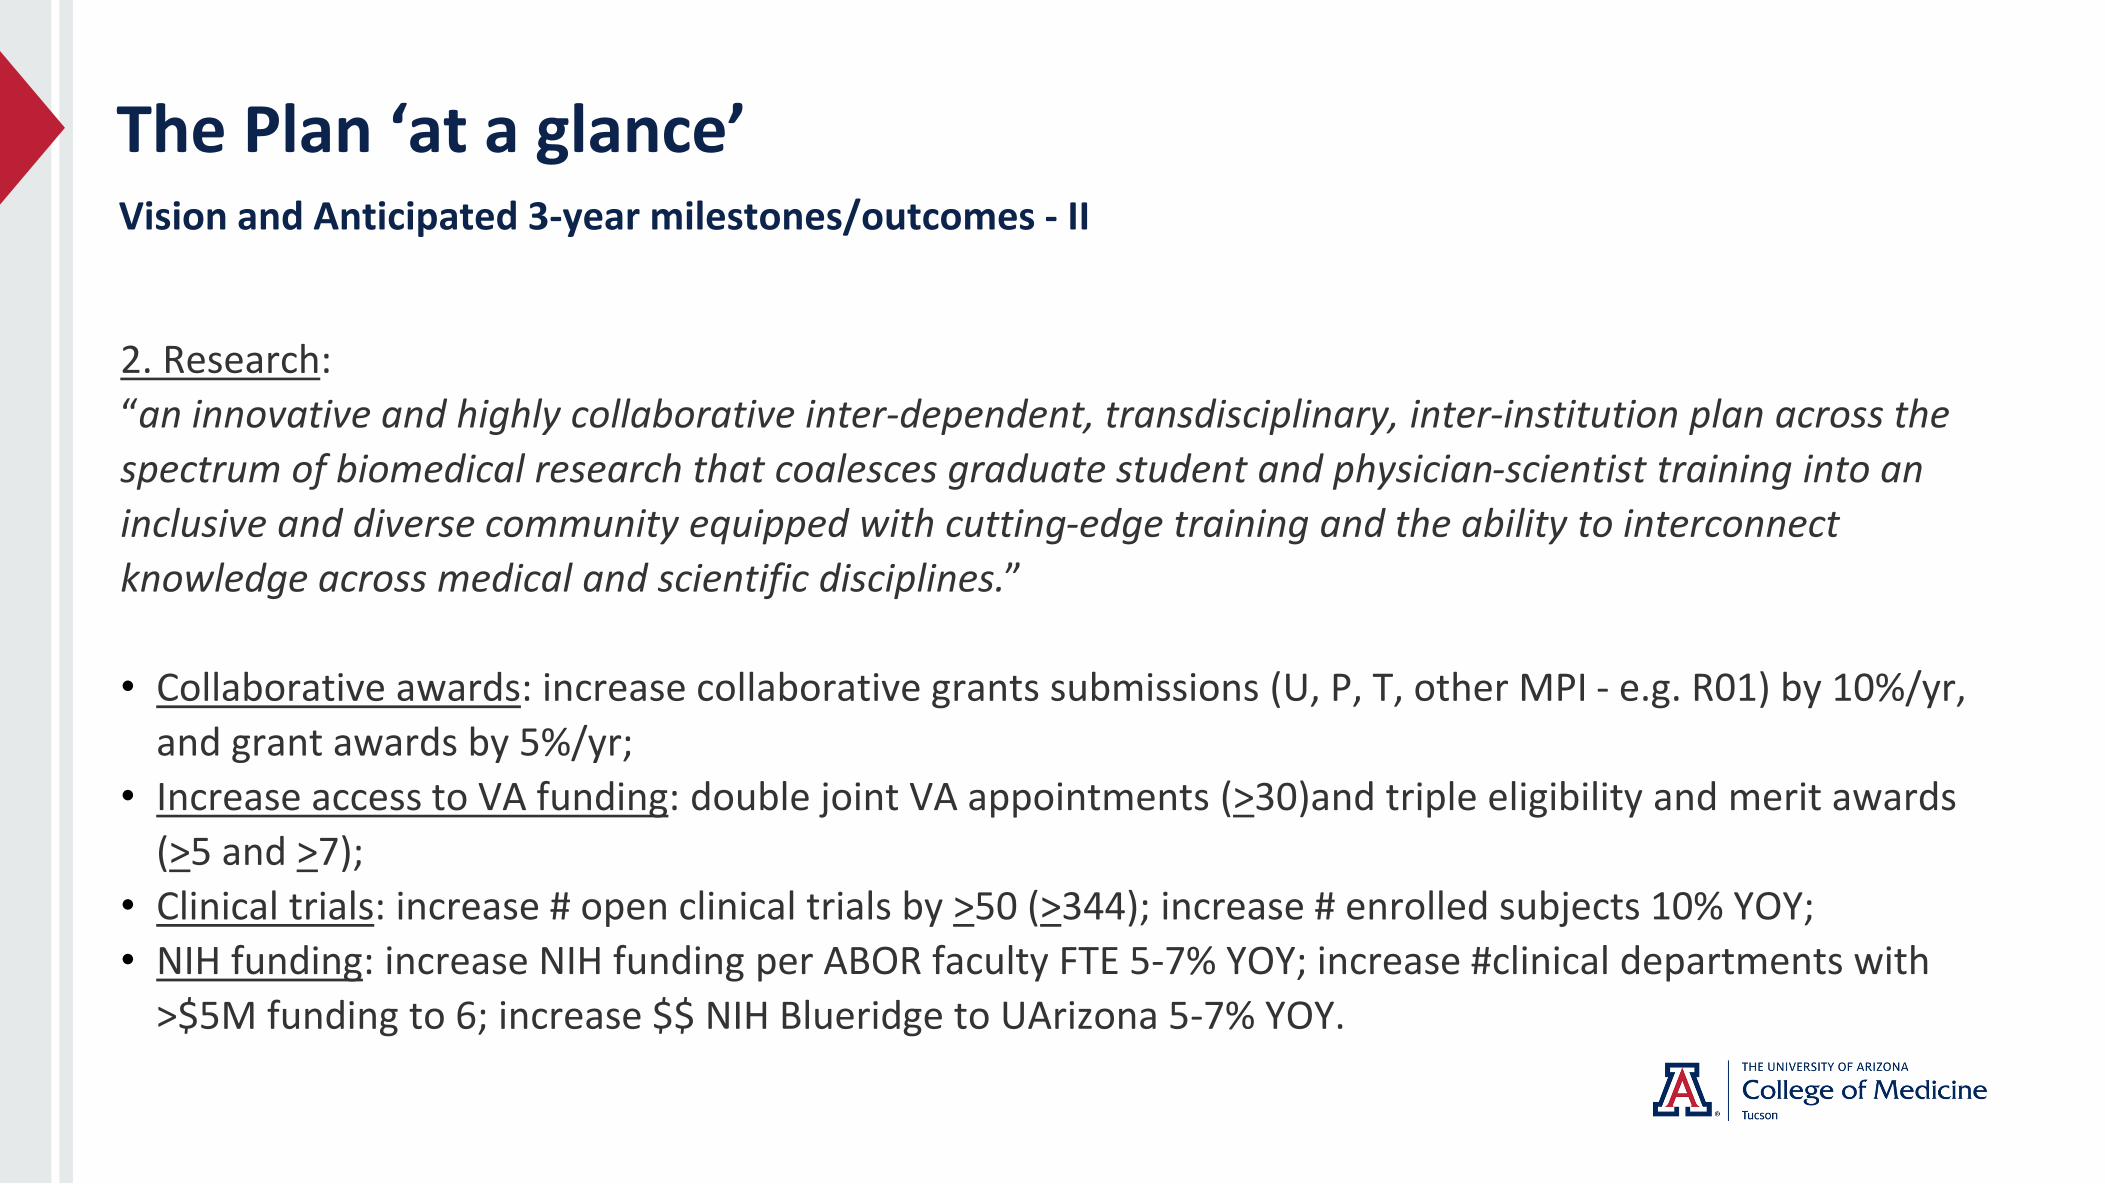
The Plan ‘at a glance’Vision and Anticipated 3-year milestones/outcomes - II
2. Research:
“an innovative and highly collaborative inter-dependent, transdisciplinary, inter-institution plan across the
spectrum of biomedical research that coalesces graduate student and physician-scientist training into an
inclusive and diverse community equipped with cutting-edge training and the ability to interconnect
knowledge across medical and scientific disciplines.”
• Collaborative awards: increase collaborative grants submissions (U, P, T, other MPI - e.g. R01) by 10%/yr,
and grant awards by 5%/yr;
• Increase access to VA funding: double joint VA appointments (>30)and triple eligibility and merit awards
(>5 and >7);
• Clinical trials: increase # open clinical trials by >50 (>344); increase # enrolled subjects 10% YOY;
• NIH funding: increase NIH funding per ABOR faculty FTE 5-7% YOY; increase #clinical departments with
>$5M funding to 6; increase $$ NIH Blueridge to UArizona 5-7% YOY.
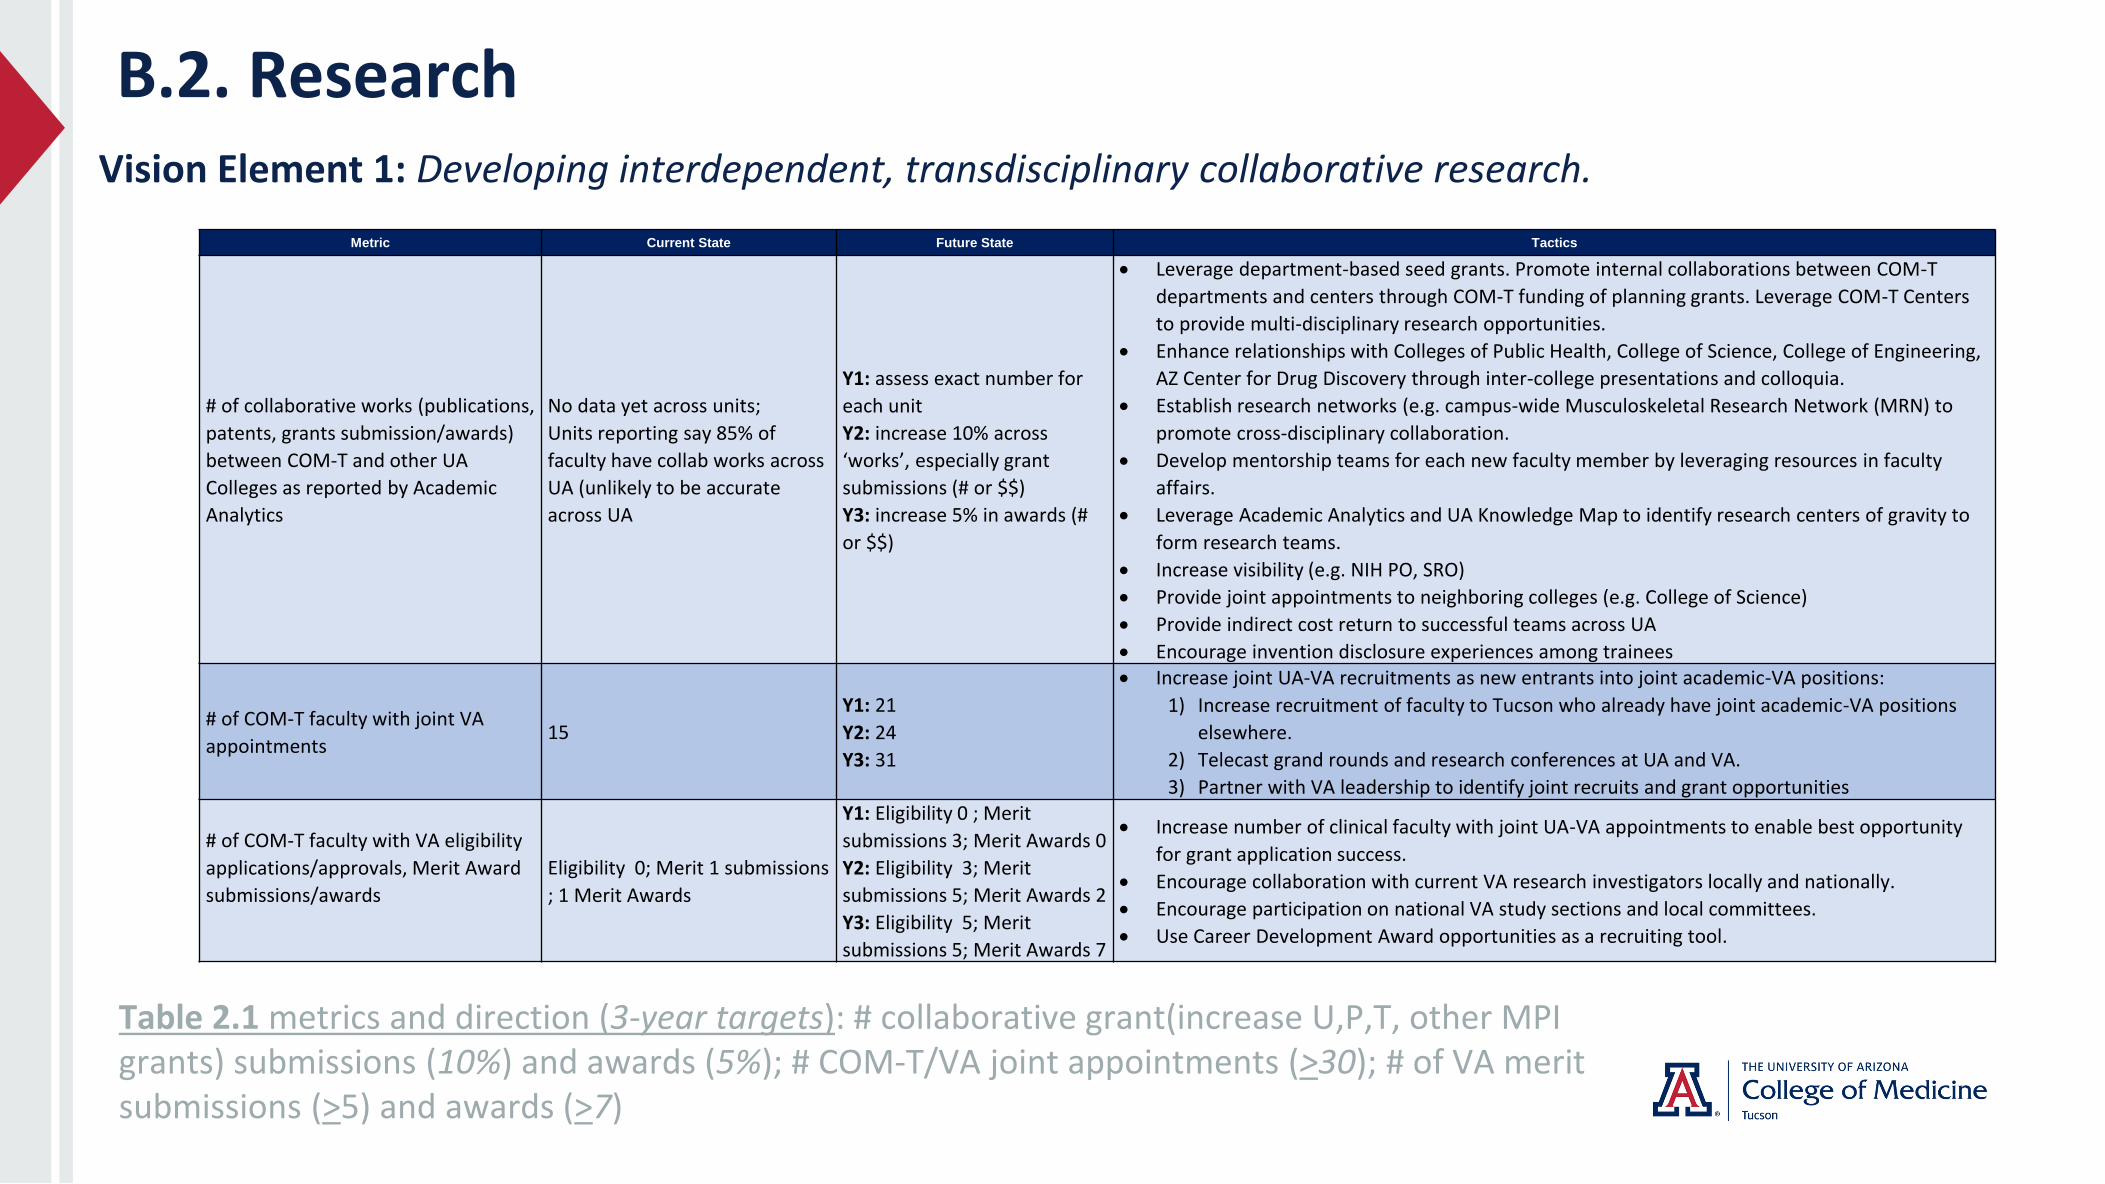
B.2. ResearchVision Element 1: Developing interdependent, transdisciplinary collaborative research.
Table 2.1 metrics and direction (3-year targets): # collaborative grant(increase U,P,T, other MPI grants) submissions (10%) and awards (5%); # COM-T/VA joint appointments (>30); # of VA merit submissions (>5) and awards (>7)
Metric Current State Future State Tactics
# of collaborative works (publications,
patents, grants submission/awards)
between COM-T and other UA
Colleges as reported by Academic
Analytics
No data yet across units;
Units reporting say 85% of
faculty have collab works across
UA (unlikely to be accurate
across UA
Y1: assess exact number for
each unit
Y2: increase 10% across
‘works’, especially grant
submissions (# or $$)
Y3: increase 5% in awards (#
or $$)
• Leverage department-based seed grants. Promote internal collaborations between COM-T
departments and centers through COM-T funding of planning grants. Leverage COM-T Centers
to provide multi-disciplinary research opportunities.
• Enhance relationships with Colleges of Public Health, College of Science, College of Engineering,
AZ Center for Drug Discovery through inter-college presentations and colloquia.
• Establish research networks (e.g. campus-wide Musculoskeletal Research Network (MRN) to
promote cross-disciplinary collaboration.
• Develop mentorship teams for each new faculty member by leveraging resources in faculty
affairs.
• Leverage Academic Analytics and UA Knowledge Map to identify research centers of gravity to
form research teams.
• Increase visibility (e.g. NIH PO, SRO)
• Provide joint appointments to neighboring colleges (e.g. College of Science)
• Provide indirect cost return to successful teams across UA
• Encourage invention disclosure experiences among trainees
# of COM-T faculty with joint VA
appointments15
Y1: 21
Y2: 24
Y3: 31
• Increase joint UA-VA recruitments as new entrants into joint academic-VA positions:
1) Increase recruitment of faculty to Tucson who already have joint academic-VA positions
elsewhere.
2) Telecast grand rounds and research conferences at UA and VA.
3) Partner with VA leadership to identify joint recruits and grant opportunities
# of COM-T faculty with VA eligibility
applications/approvals, Merit Award
submissions/awards
Eligibility 0; Merit 1 submissions
; 1 Merit Awards
Y1: Eligibility 0 ; Merit
submissions 3; Merit Awards 0
Y2: Eligibility 3; Merit
submissions 5; Merit Awards 2
Y3: Eligibility 5; Merit
submissions 5; Merit Awards 7
• Increase number of clinical faculty with joint UA-VA appointments to enable best opportunity
for grant application success.
• Encourage collaboration with current VA research investigators locally and nationally.
• Encourage participation on national VA study sections and local committees.
• Use Career Development Award opportunities as a recruiting tool.
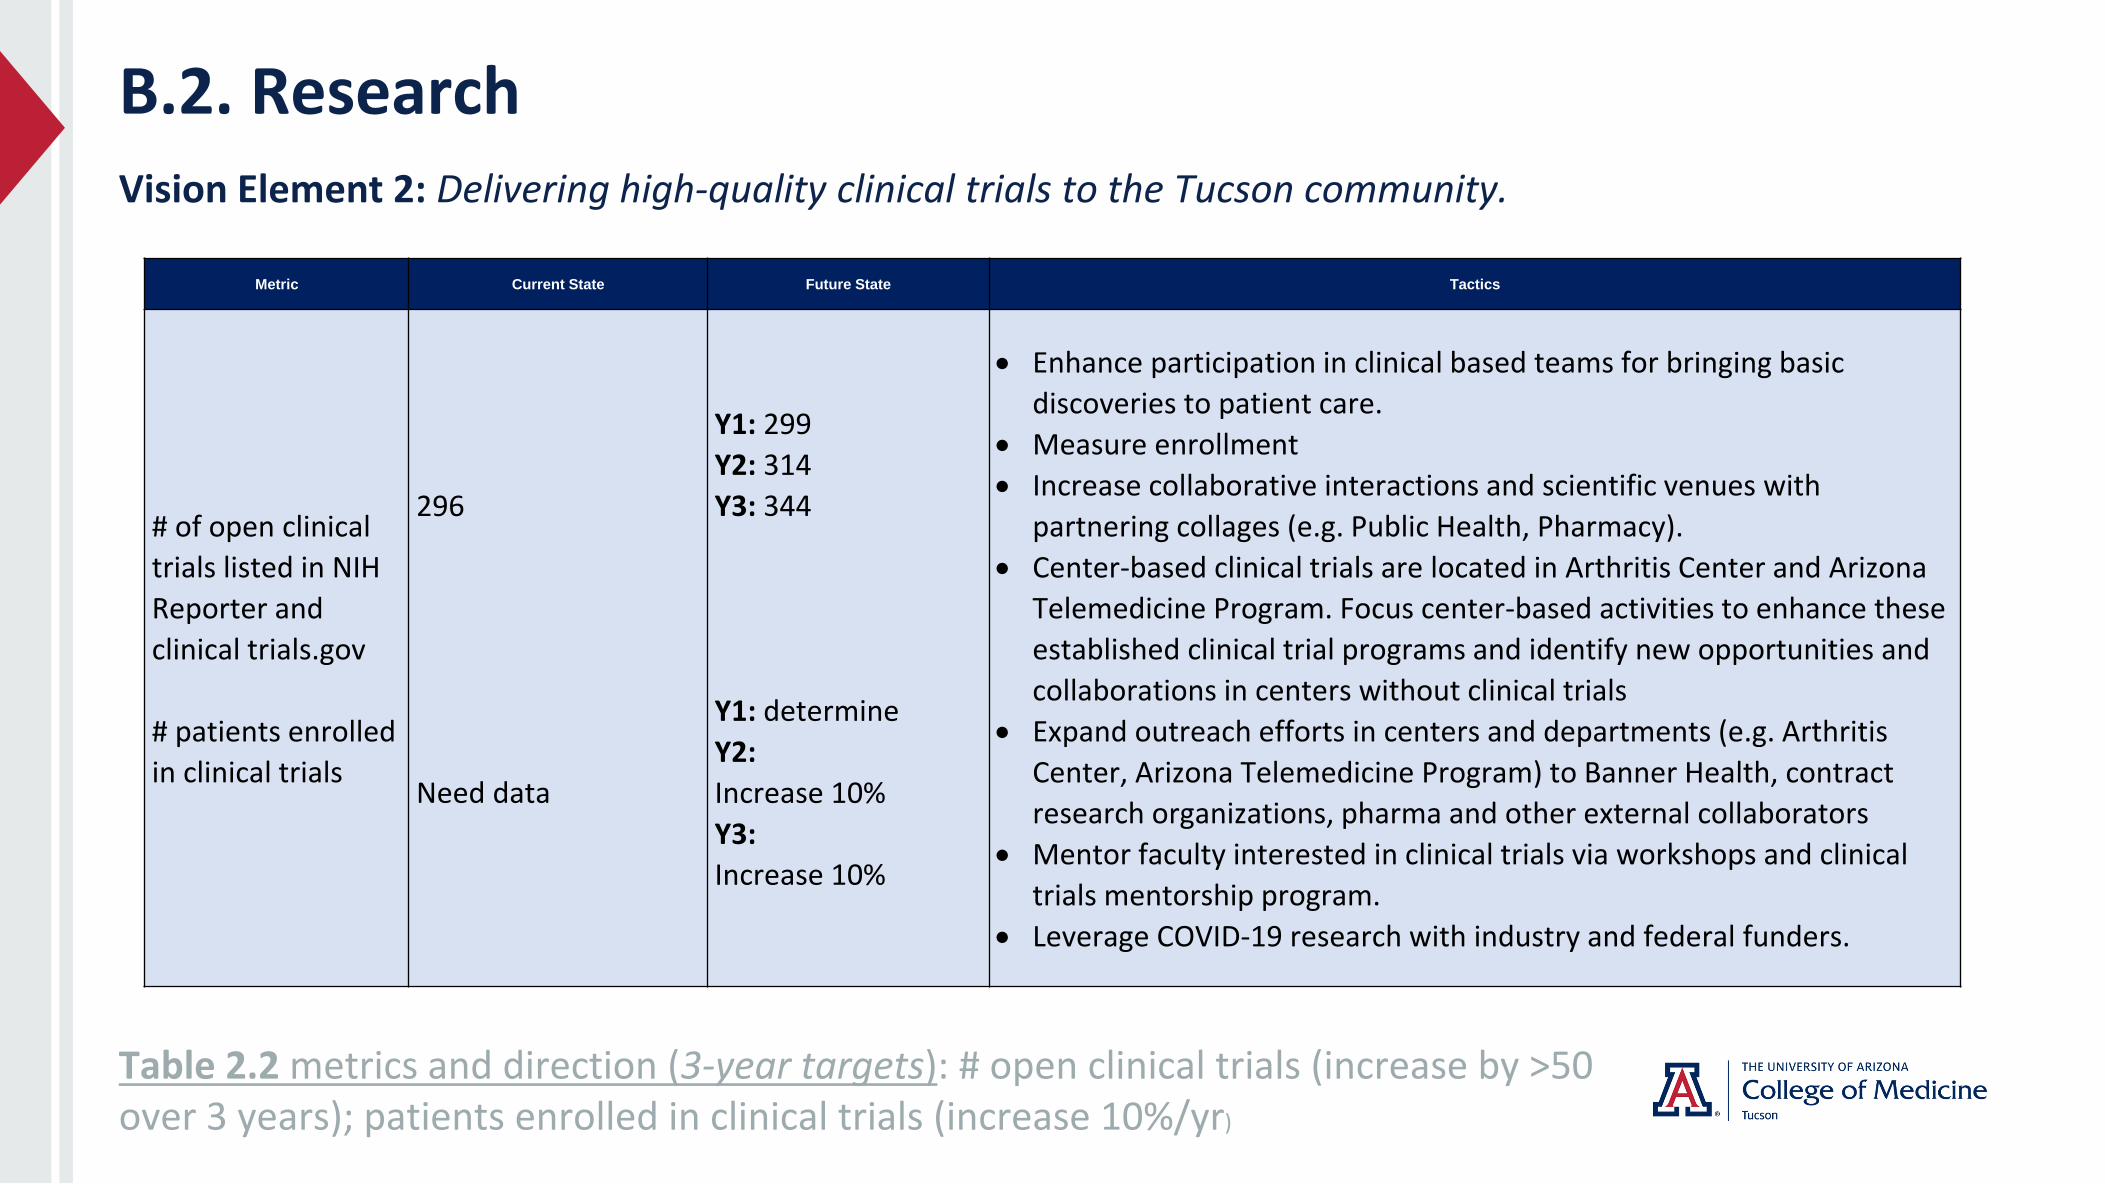
B.2. ResearchVision Element 2: Delivering high-quality clinical trials to the Tucson community.
Table 2.2 metrics and direction (3-year targets): # open clinical trials (increase by >50 over 3 years); patients enrolled in clinical trials (increase 10%/yr)
Metric Current State Future State Tactics
# of open clinical
trials listed in NIH
Reporter and
clinical trials.gov
# patients enrolled
in clinical trials
296
Need data
Y1: 299
Y2: 314
Y3: 344
Y1: determine
Y2:
Increase 10%
Y3:
Increase 10%
• Enhance participation in clinical based teams for bringing basic
discoveries to patient care.
• Measure enrollment
• Increase collaborative interactions and scientific venues with
partnering collages (e.g. Public Health, Pharmacy).
• Center-based clinical trials are located in Arthritis Center and Arizona
Telemedicine Program. Focus center-based activities to enhance these
established clinical trial programs and identify new opportunities and
collaborations in centers without clinical trials
• Expand outreach efforts in centers and departments (e.g. Arthritis
Center, Arizona Telemedicine Program) to Banner Health, contract
research organizations, pharma and other external collaborators
• Mentor faculty interested in clinical trials via workshops and clinical
trials mentorship program.
• Leverage COVID-19 research with industry and federal funders.
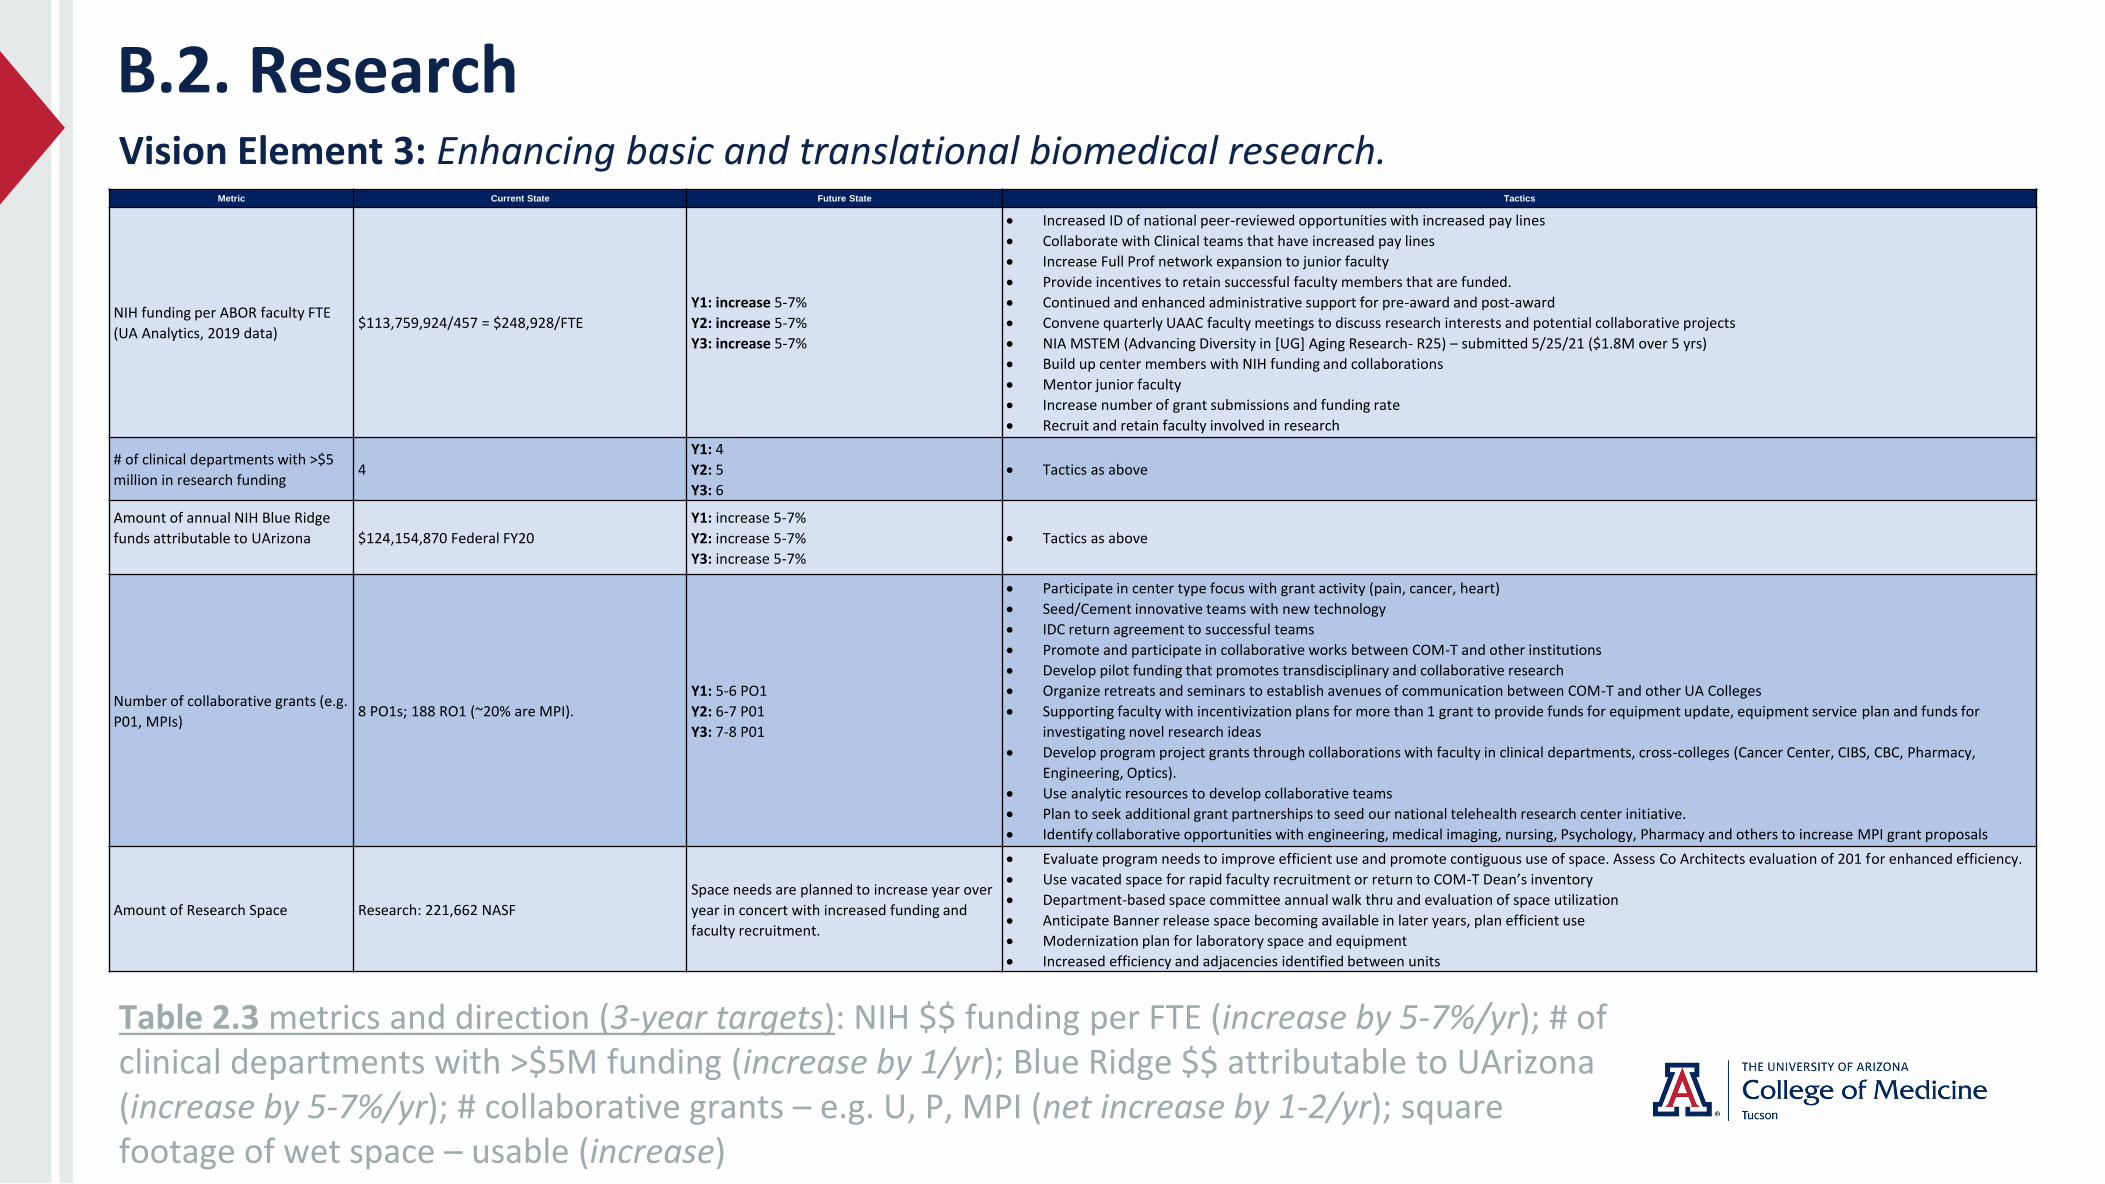
B.2. ResearchVision Element 3: Enhancing basic and translational biomedical research.
Table 2.3 metrics and direction (3-year targets): NIH $$ funding per FTE (increase by 5-7%/yr); # of clinical departments with >$5M funding (increase by 1/yr); Blue Ridge $$ attributable to UArizona(increase by 5-7%/yr); # collaborative grants – e.g. U, P, MPI (net increase by 1-2/yr); square footage of wet space – usable (increase)
Metric Current State Future State Tactics
NIH funding per ABOR faculty FTE
(UA Analytics, 2019 data)$113,759,924/457 = $248,928/FTE
Y1: increase 5-7%
Y2: increase 5-7%
Y3: increase 5-7%
• Increased ID of national peer-reviewed opportunities with increased pay lines
• Collaborate with Clinical teams that have increased pay lines
• Increase Full Prof network expansion to junior faculty
• Provide incentives to retain successful faculty members that are funded.
• Continued and enhanced administrative support for pre-award and post-award
• Convene quarterly UAAC faculty meetings to discuss research interests and potential collaborative projects
• NIA MSTEM (Advancing Diversity in [UG] Aging Research- R25) – submitted 5/25/21 ($1.8M over 5 yrs)
• Build up center members with NIH funding and collaborations
• Mentor junior faculty
• Increase number of grant submissions and funding rate
• Recruit and retain faculty involved in research
# of clinical departments with >$5
million in research funding4
Y1: 4
Y2: 5
Y3: 6
• Tactics as above
Amount of annual NIH Blue Ridge
funds attributable to UArizona $124,154,870 Federal FY20
Y1: increase 5-7%
Y2: increase 5-7%
Y3: increase 5-7%
• Tactics as above
Number of collaborative grants (e.g.
P01, MPIs) 8 PO1s; 188 RO1 (~20% are MPI).
Y1: 5-6 PO1
Y2: 6-7 P01
Y3: 7-8 P01
• Participate in center type focus with grant activity (pain, cancer, heart)
• Seed/Cement innovative teams with new technology
• IDC return agreement to successful teams
• Promote and participate in collaborative works between COM-T and other institutions
• Develop pilot funding that promotes transdisciplinary and collaborative research
• Organize retreats and seminars to establish avenues of communication between COM-T and other UA Colleges
• Supporting faculty with incentivization plans for more than 1 grant to provide funds for equipment update, equipment service plan and funds for
investigating novel research ideas
• Develop program project grants through collaborations with faculty in clinical departments, cross-colleges (Cancer Center, CIBS, CBC, Pharmacy,
Engineering, Optics).
• Use analytic resources to develop collaborative teams
• Plan to seek additional grant partnerships to seed our national telehealth research center initiative.
• Identify collaborative opportunities with engineering, medical imaging, nursing, Psychology, Pharmacy and others to increase MPI grant proposals
Amount of Research Space Research: 221,662 NASF
Space needs are planned to increase year over
year in concert with increased funding and
faculty recruitment.
• Evaluate program needs to improve efficient use and promote contiguous use of space. Assess Co Architects evaluation of 201 for enhanced efficiency.
• Use vacated space for rapid faculty recruitment or return to COM-T Dean’s inventory
• Department-based space committee annual walk thru and evaluation of space utilization
• Anticipate Banner release space becoming available in later years, plan efficient use
• Modernization plan for laboratory space and equipment
• Increased efficiency and adjacencies identified between units
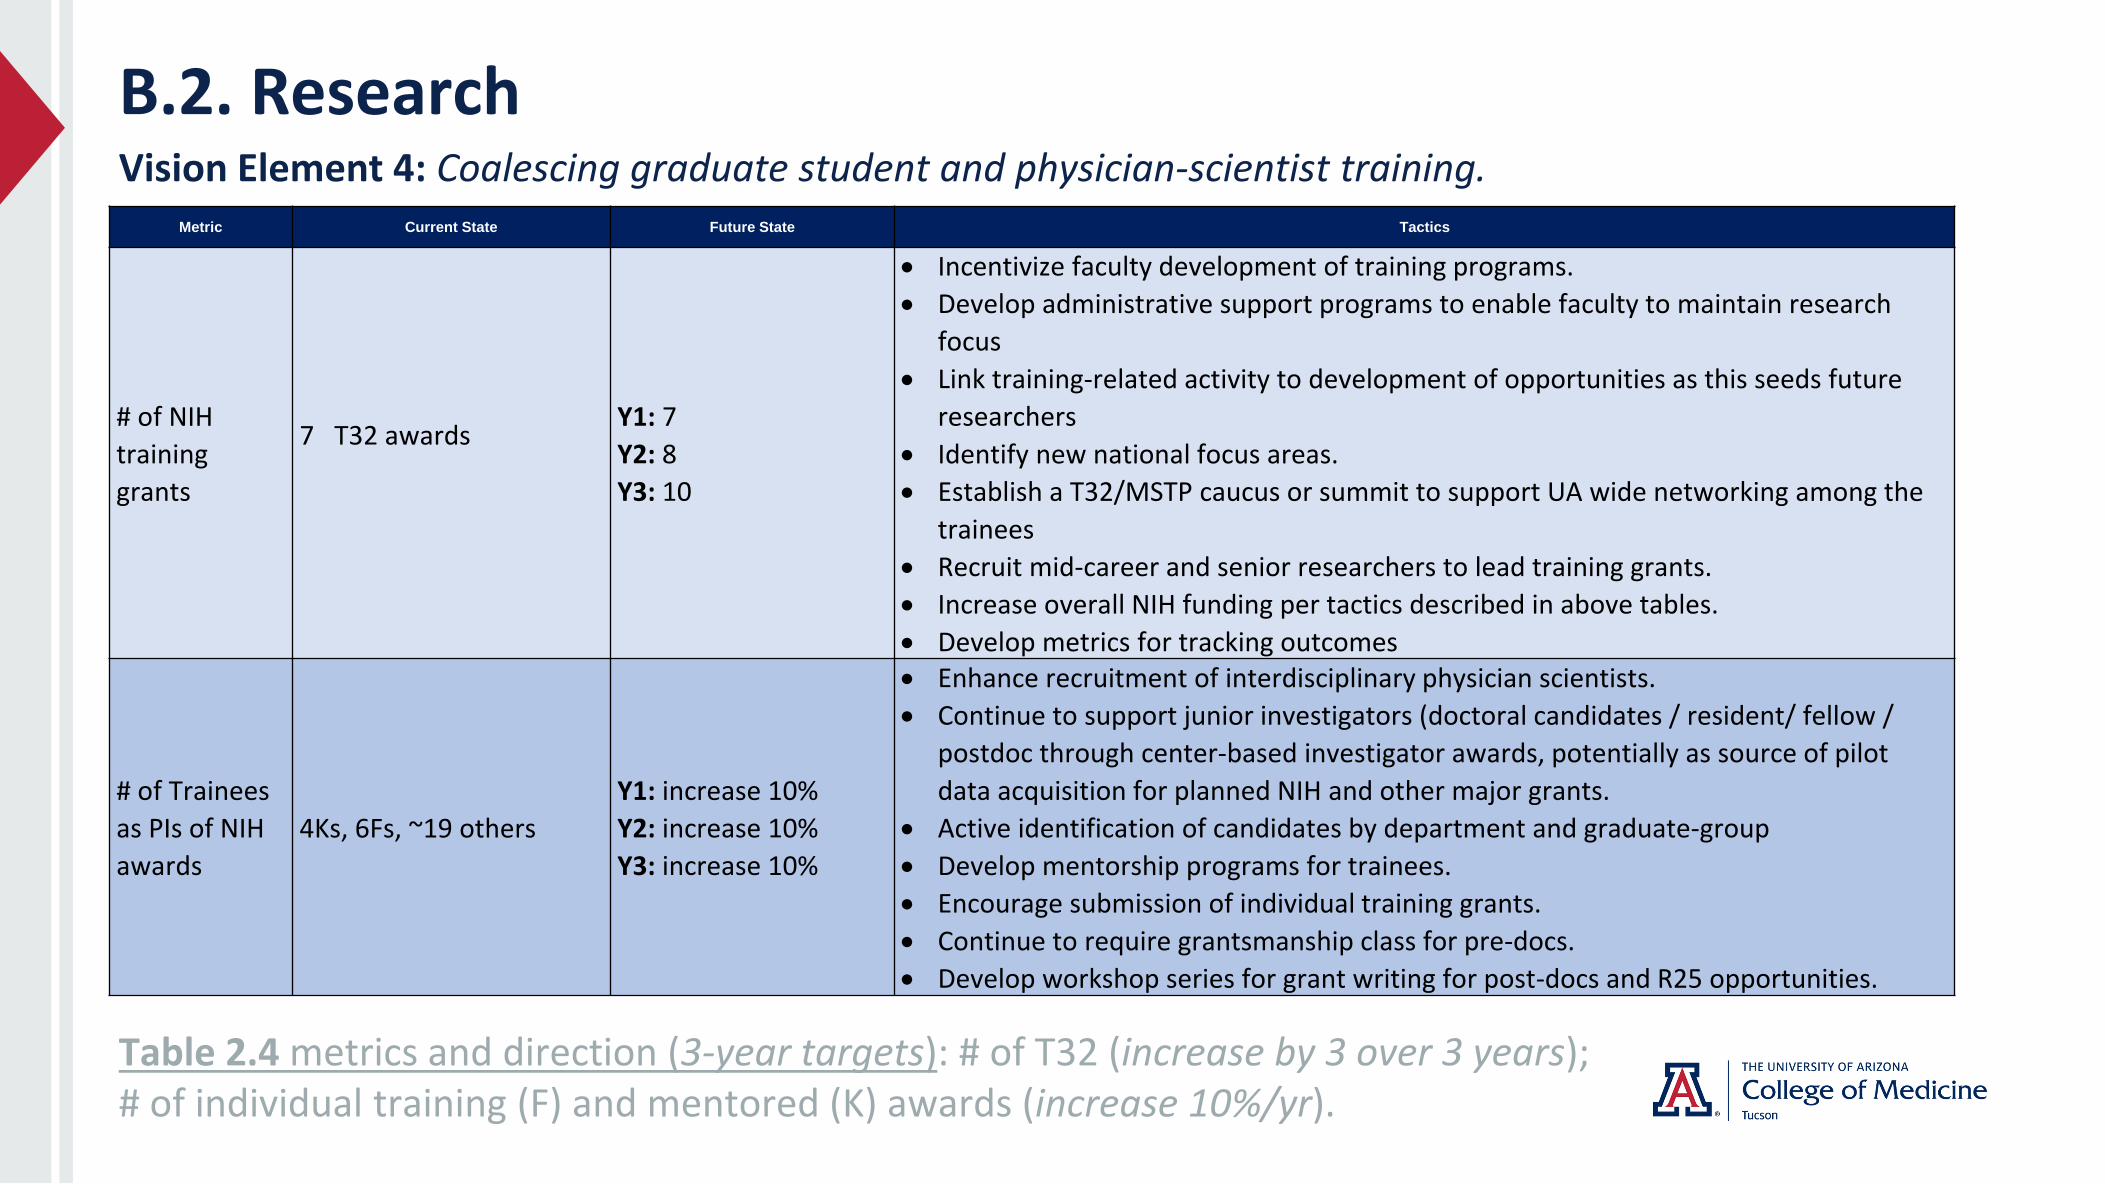
B.2. ResearchVision Element 4: Coalescing graduate student and physician-scientist training.
Table 2.4 metrics and direction (3-year targets): # of T32 (increase by 3 over 3 years); # of individual training (F) and mentored (K) awards (increase 10%/yr).
Metric Current State Future State Tactics
# of NIH
training
grants
7 T32 awardsY1: 7
Y2: 8
Y3: 10
• Incentivize faculty development of training programs.
• Develop administrative support programs to enable faculty to maintain research
focus
• Link training-related activity to development of opportunities as this seeds future
researchers
• Identify new national focus areas.
• Establish a T32/MSTP caucus or summit to support UA wide networking among the
trainees
• Recruit mid-career and senior researchers to lead training grants.
• Increase overall NIH funding per tactics described in above tables.
• Develop metrics for tracking outcomes
# of Trainees
as PIs of NIH
awards
4Ks, 6Fs, ~19 others
Y1: increase 10%
Y2: increase 10%
Y3: increase 10%
• Enhance recruitment of interdisciplinary physician scientists.
• Continue to support junior investigators (doctoral candidates / resident/ fellow /
postdoc through center-based investigator awards, potentially as source of pilot
data acquisition for planned NIH and other major grants.
• Active identification of candidates by department and graduate-group
• Develop mentorship programs for trainees.
• Encourage submission of individual training grants.
• Continue to require grantsmanship class for pre-docs.
• Develop workshop series for grant writing for post-docs and R25 opportunities.
The Plan ‘at a glance’Vision and Anticipated 3-year milestones/outcomes - III
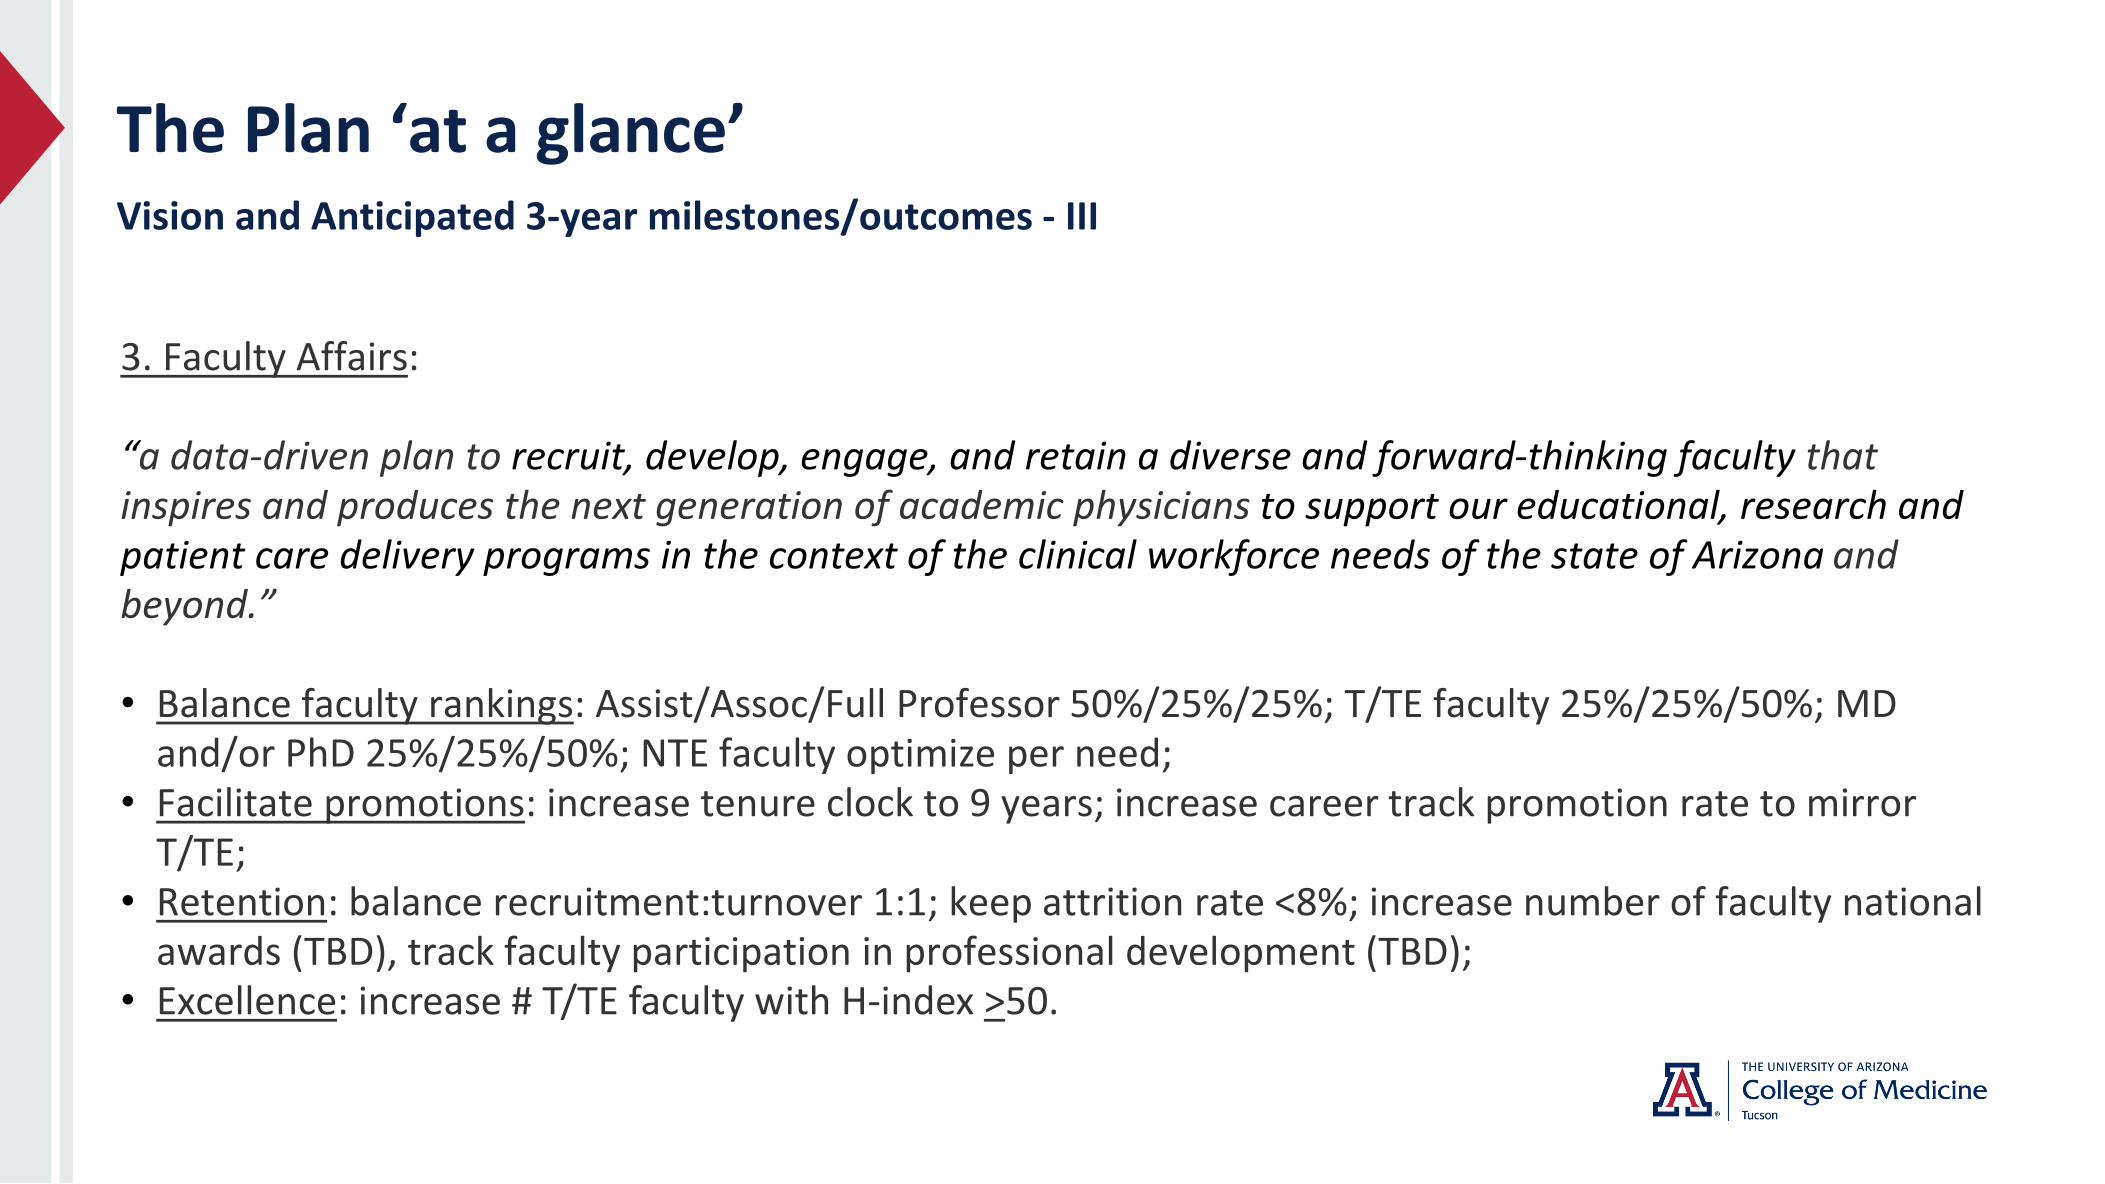
3. Faculty Affairs:
“a data-driven plan to recruit, develop, engage, and retain a diverse and forward-thinking faculty that inspires and produces the next generation of academic physicians to support our educational, research and patient care delivery programs in the context of the clinical workforce needs of the state of Arizona and beyond.”
• Balance faculty rankings: Assist/Assoc/Full Professor 50%/25%/25%; T/TE faculty 25%/25%/50%; MD and/or PhD 25%/25%/50%; NTE faculty optimize per need;
• Facilitate promotions: increase tenure clock to 9 years; increase career track promotion rate to mirror T/TE;
• Retention: balance recruitment:turnover 1:1; keep attrition rate <8%; increase number of faculty national awards (TBD), track faculty participation in professional development (TBD);
• Excellence: increase # T/TE faculty with H-index >50.
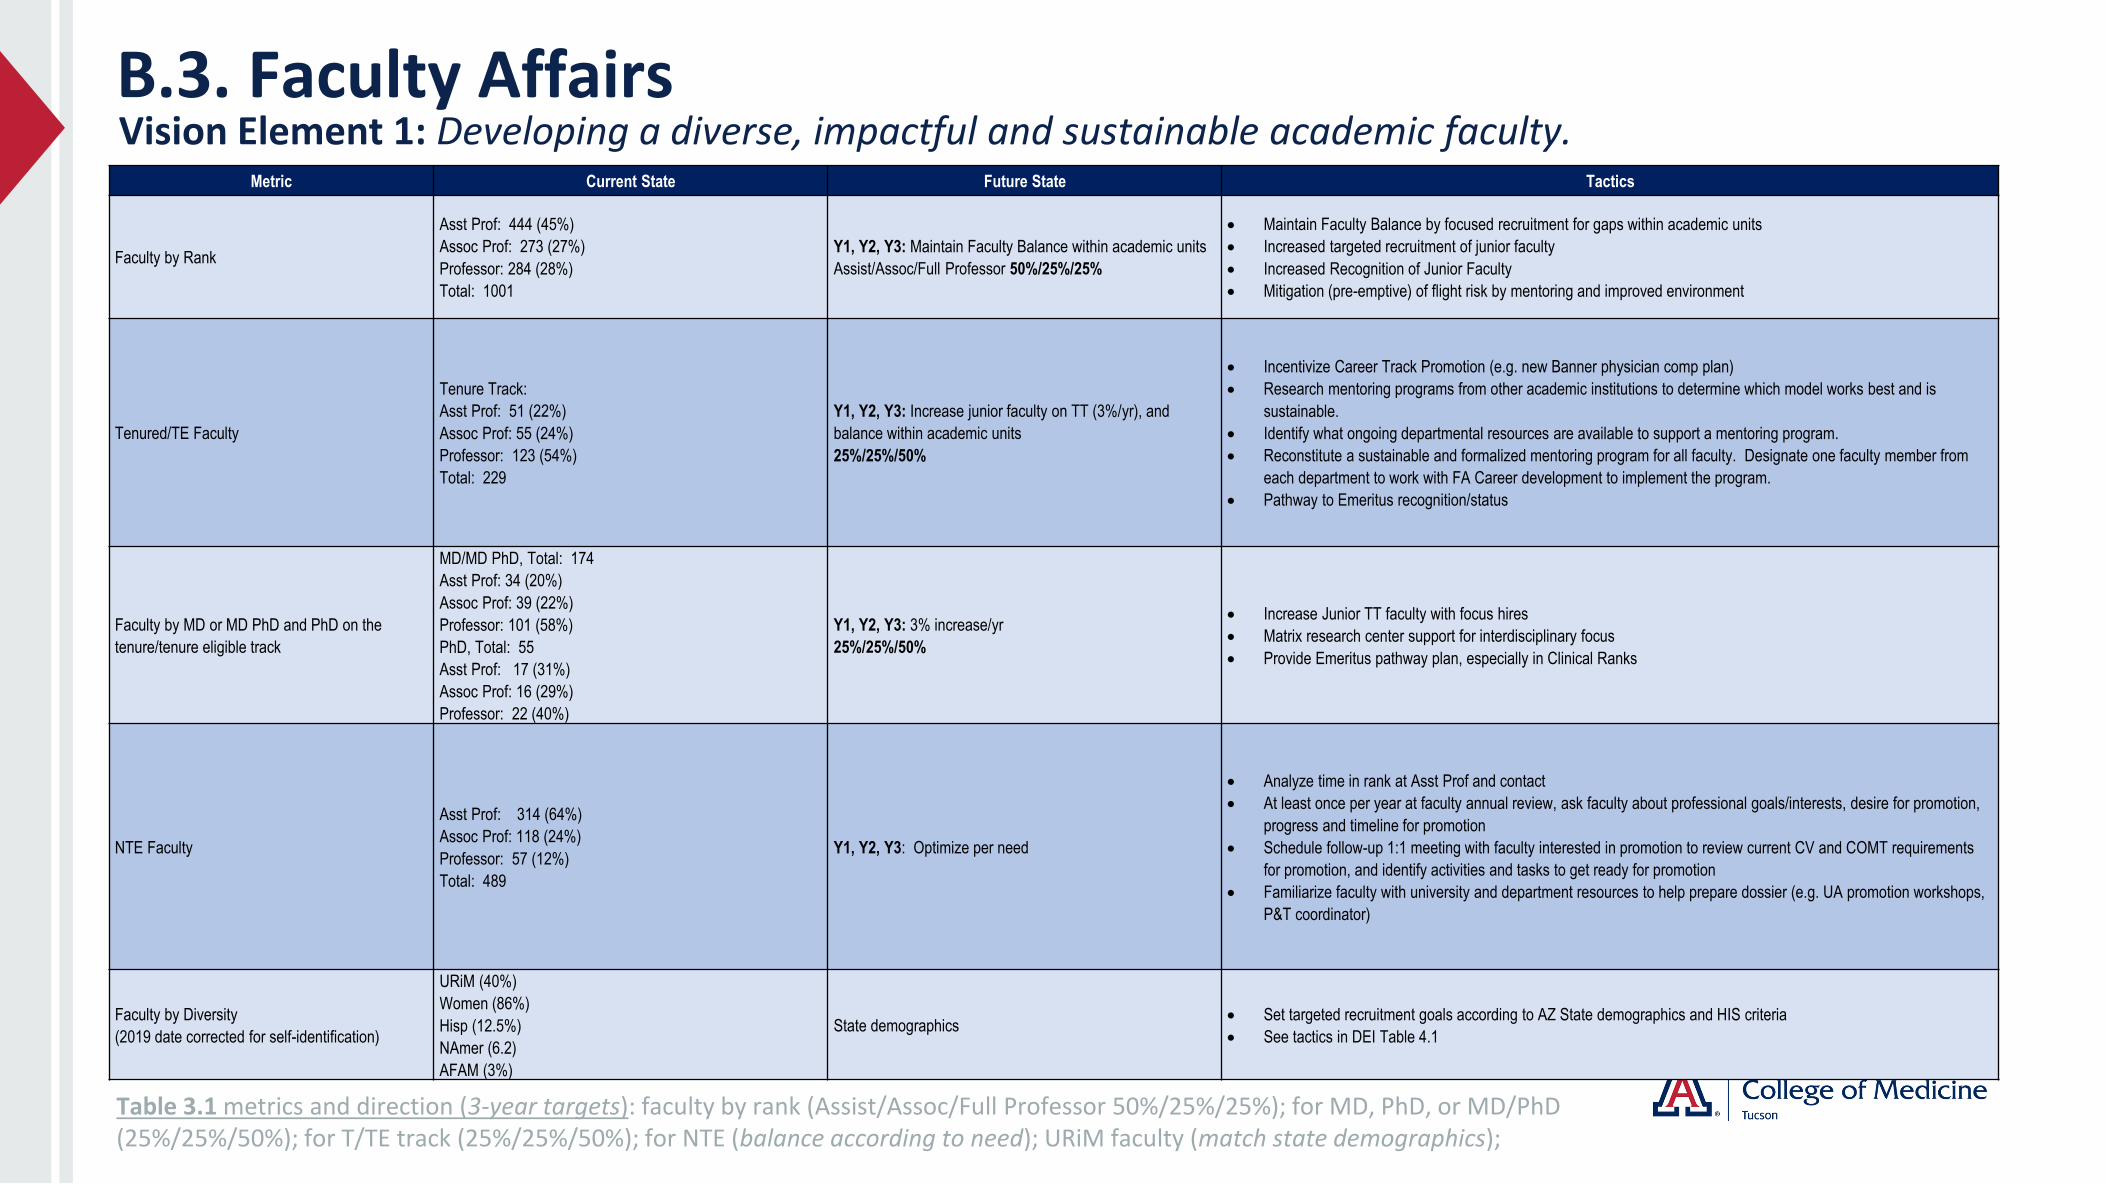
B.3. Faculty AffairsVision Element 1: Developing a diverse, impactful and sustainable academic faculty.
Table 3.1 metrics and direction (3-year targets): faculty by rank (Assist/Assoc/Full Professor 50%/25%/25%); for MD, PhD, or MD/PhD (25%/25%/50%); for T/TE track (25%/25%/50%); for NTE (balance according to need); URiM faculty (match state demographics);
Metric Current State Future State Tactics
Faculty by Rank
Asst Prof: 444 (45%)
Assoc Prof: 273 (27%)
Professor: 284 (28%)
Total: 1001
Y1, Y2, Y3: Maintain Faculty Balance within academic units
Assist/Assoc/Full Professor 50%/25%/25%
• Maintain Faculty Balance by focused recruitment for gaps within academic units
• Increased targeted recruitment of junior faculty
• Increased Recognition of Junior Faculty
• Mitigation (pre-emptive) of flight risk by mentoring and improved environment
Tenured/TE Faculty
Tenure Track:
Asst Prof: 51 (22%)
Assoc Prof: 55 (24%)
Professor: 123 (54%)
Total: 229
Y1, Y2, Y3: Increase junior faculty on TT (3%/yr), and
balance within academic units
25%/25%/50%
• Incentivize Career Track Promotion (e.g. new Banner physician comp plan)
• Research mentoring programs from other academic institutions to determine which model works best and is
sustainable.
• Identify what ongoing departmental resources are available to support a mentoring program.
• Reconstitute a sustainable and formalized mentoring program for all faculty. Designate one faculty member from
each department to work with FA Career development to implement the program.
• Pathway to Emeritus recognition/status
Faculty by MD or MD PhD and PhD on the
tenure/tenure eligible track
MD/MD PhD, Total: 174
Asst Prof: 34 (20%)
Assoc Prof: 39 (22%)
Professor: 101 (58%)
PhD, Total: 55
Asst Prof: 17 (31%)
Assoc Prof: 16 (29%)
Professor: 22 (40%)
Y1, Y2, Y3: 3% increase/yr
25%/25%/50%
• Increase Junior TT faculty with focus hires
• Matrix research center support for interdisciplinary focus
• Provide Emeritus pathway plan, especially in Clinical Ranks
NTE Faculty
Asst Prof: 314 (64%)
Assoc Prof: 118 (24%)
Professor: 57 (12%)
Total: 489
Y1, Y2, Y3: Optimize per need
• Analyze time in rank at Asst Prof and contact
• At least once per year at faculty annual review, ask faculty about professional goals/interests, desire for promotion,
progress and timeline for promotion
• Schedule follow-up 1:1 meeting with faculty interested in promotion to review current CV and COMT requirements
for promotion, and identify activities and tasks to get ready for promotion
• Familiarize faculty with university and department resources to help prepare dossier (e.g. UA promotion workshops,
P&T coordinator)
Faculty by Diversity
(2019 date corrected for self-identification)
URiM (40%)
Women (86%)
Hisp (12.5%)
NAmer (6.2)
AFAM (3%)
State demographics• Set targeted recruitment goals according to AZ State demographics and HIS criteria
• See tactics in DEI Table 4.1
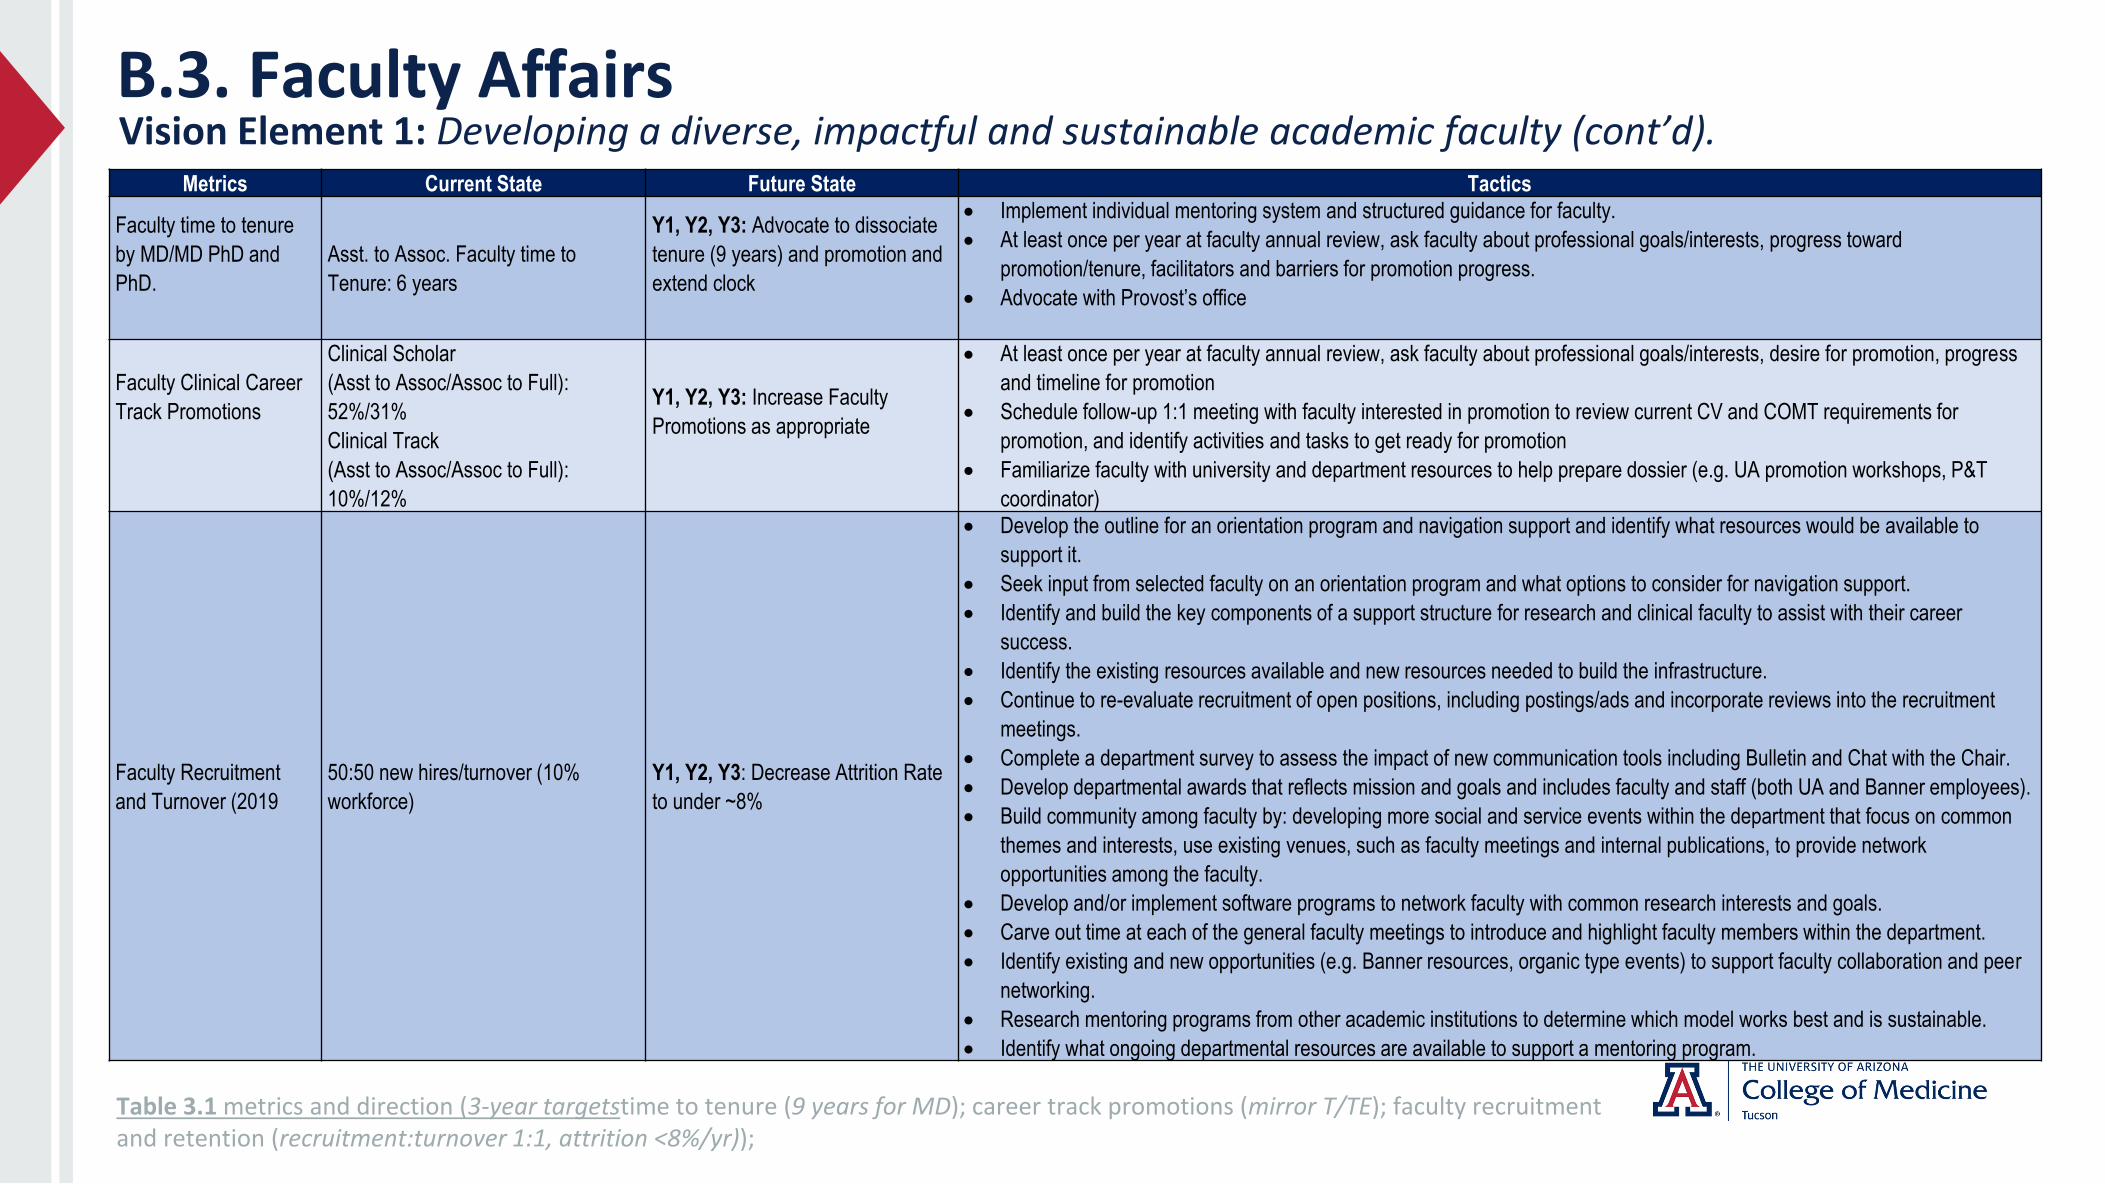
B.3. Faculty AffairsVision Element 1: Developing a diverse, impactful and sustainable academic faculty (cont’d).
Table 3.1 metrics and direction (3-year targetstime to tenure (9 years for MD); career track promotions (mirror T/TE); faculty recruitment and retention (recruitment:turnover 1:1, attrition <8%/yr));
Metrics Current State Future State Tactics
Faculty time to tenure
by MD/MD PhD and
PhD.
Asst. to Assoc. Faculty time to
Tenure: 6 years
Y1, Y2, Y3: Advocate to dissociate
tenure (9 years) and promotion and
extend clock
• Implement individual mentoring system and structured guidance for faculty.
• At least once per year at faculty annual review, ask faculty about professional goals/interests, progress toward
promotion/tenure, facilitators and barriers for promotion progress.
• Advocate with Provost’s office
Faculty Clinical Career
Track Promotions
Clinical Scholar
(Asst to Assoc/Assoc to Full):
52%/31%
Clinical Track
(Asst to Assoc/Assoc to Full):
10%/12%
Y1, Y2, Y3: Increase Faculty
Promotions as appropriate
• At least once per year at faculty annual review, ask faculty about professional goals/interests, desire for promotion, progress
and timeline for promotion
• Schedule follow-up 1:1 meeting with faculty interested in promotion to review current CV and COMT requirements for
promotion, and identify activities and tasks to get ready for promotion
• Familiarize faculty with university and department resources to help prepare dossier (e.g. UA promotion workshops, P&T
coordinator)
Faculty Recruitment
and Turnover (2019
50:50 new hires/turnover (10%
workforce)
Y1, Y2, Y3: Decrease Attrition Rate
to under ~8%
• Develop the outline for an orientation program and navigation support and identify what resources would be available to
support it.
• Seek input from selected faculty on an orientation program and what options to consider for navigation support.
• Identify and build the key components of a support structure for research and clinical faculty to assist with their career
success.
• Identify the existing resources available and new resources needed to build the infrastructure.
• Continue to re-evaluate recruitment of open positions, including postings/ads and incorporate reviews into the recruitment
meetings.
• Complete a department survey to assess the impact of new communication tools including Bulletin and Chat with the Chair.
• Develop departmental awards that reflects mission and goals and includes faculty and staff (both UA and Banner employees).
• Build community among faculty by: developing more social and service events within the department that focus on common
themes and interests, use existing venues, such as faculty meetings and internal publications, to provide network
opportunities among the faculty.
• Develop and/or implement software programs to network faculty with common research interests and goals.
• Carve out time at each of the general faculty meetings to introduce and highlight faculty members within the department.
• Identify existing and new opportunities (e.g. Banner resources, organic type events) to support faculty collaboration and peer
networking.
• Research mentoring programs from other academic institutions to determine which model works best and is sustainable.
• Identify what ongoing departmental resources are available to support a mentoring program.

B.3. Faculty AffairsVision Element 1: Developing a diverse, impactful and sustainable academic faculty (cont’d).
Table 3.1 metrics and direction (3-year targets): faculty recognition and awards (increase); faculty impact scores (H-index >50 for T/TE); faculty career development (optimize and measure).
Focus Current State Future State Tactics
TE Faculty and National
Research Awards
No Data across units
(See unit-specific and unit-type-
specific data)
Y1, Y2, Y3:
See unit-specific and unit-type-
specific data
• Increase faculty and leadership awareness of the various awards and their criteria to
intentionally identify, support, and promote faculty to apply for these awards.
• Establish a mechanism via nominations committee or other means to assure that annually the
COM-T nominates worthy faculty for prestigious national awards.
The range and number of
faculty with high impact
scores (H-index or
equivalent)
Range: 34-39
(See unit-specific and unit-type-
specific data)
Y1: 3% increase
Y2: 3% increase
Y3: 3% increase
• Utilize senior faculty for targeting high impact journals for submissions
• Engage national network of scientists in focus areas of excellence
• Faculty success story information and process disseminated to others
Number of prestigious
awards (e.g. AAMC,
ACGME, Insight into
Diversity; NIH Study
Section Service)
No Data across units
(See unit-specific and unit-type-
specific data)
Y1, Y2, Y3:
See unit-specific and unit-type-
specific data
• Increase faculty and leadership awareness of the various awards and their criteria to
intentionally identify, support, and promote faculty to apply for these awards.
• See bullet above
• Increase awareness of national recognition opportunities
Faculty Sustained Career
Development
No Data across units
(See unit-specific and unit-type-
specific data)
Y1, Y2, Y3: 80% Faculty
Engagement in Career
Development
• Advertise and promote faculty awareness and participation in faculty development
programming.
• Nominate and encourage faculty to participate in COMT, UA, and other organizational faculty
development programs, e.g. Learning to Lead; ELAM, UA ALI, Leadership Development;
Peer-advancement Societies; Career Development Workshops; Faculty Development
Champions in all Departments; Writing Groups
Career development
activities and analysis of
outcomes
No Data across units
(See unit-specific and unit-type-
specific data)
Y1, Y2, Y3:
See unit-specific and unit-type-
specific data
• Start tracking faculty participation in faculty development activities as part of their annual
review.
The Plan ‘at a glance’Vision and Anticipated 3-year milestones/outcomes - IV
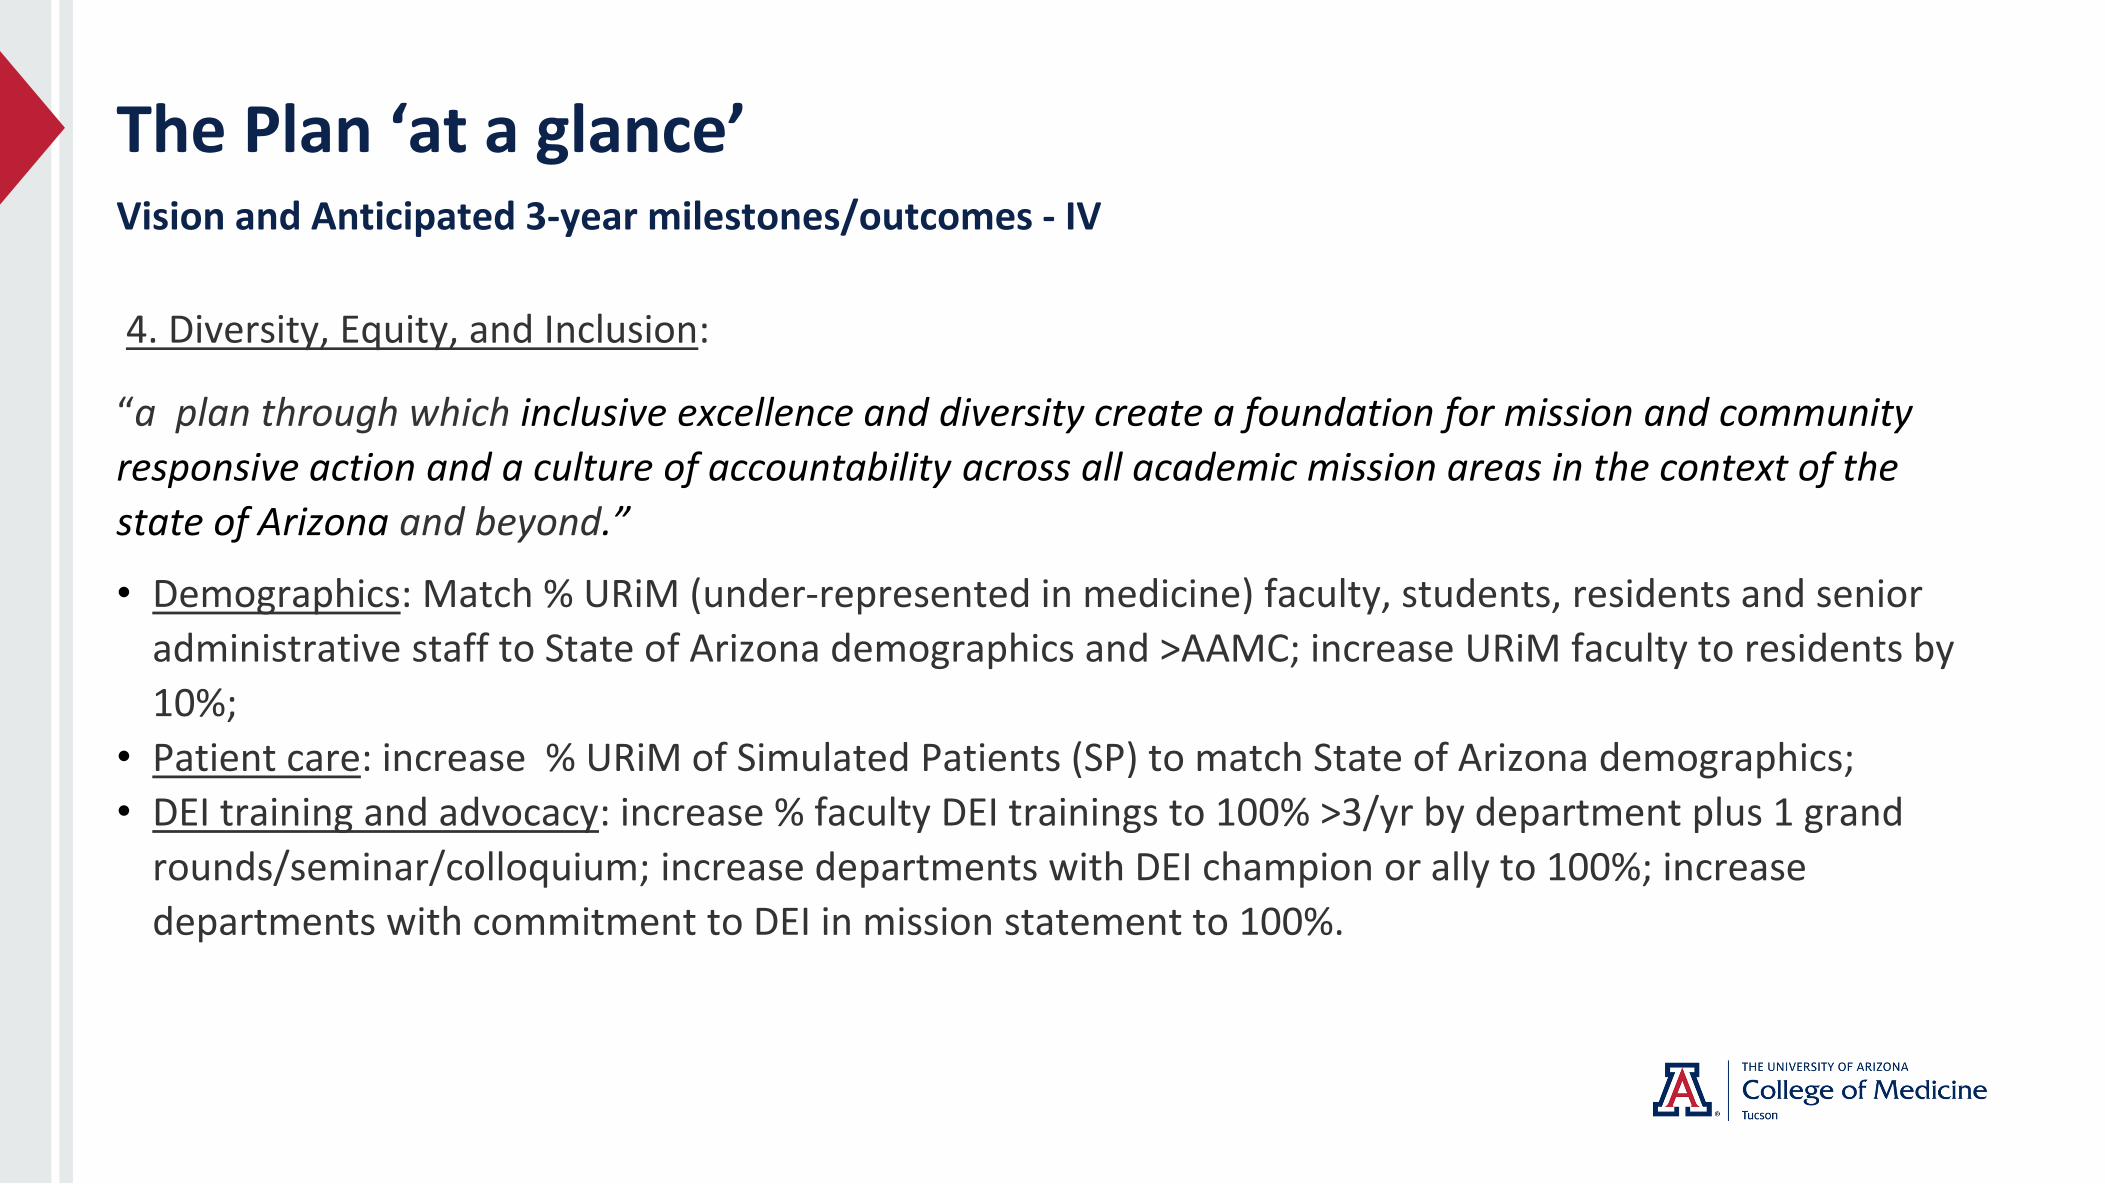
4. Diversity, Equity, and Inclusion:
“a plan through which inclusive excellence and diversity create a foundation for mission and community
responsive action and a culture of accountability across all academic mission areas in the context of the
state of Arizona and beyond.”
• Demographics: Match % URiM (under-represented in medicine) faculty, students, residents and senior
administrative staff to State of Arizona demographics and >AAMC; increase URiM faculty to residents by
10%;
• Patient care: increase % URiM of Simulated Patients (SP) to match State of Arizona demographics;
• DEI training and advocacy: increase % faculty DEI trainings to 100% >3/yr by department plus 1 grand
rounds/seminar/colloquium; increase departments with DEI champion or ally to 100%; increase
departments with commitment to DEI in mission statement to 100%.
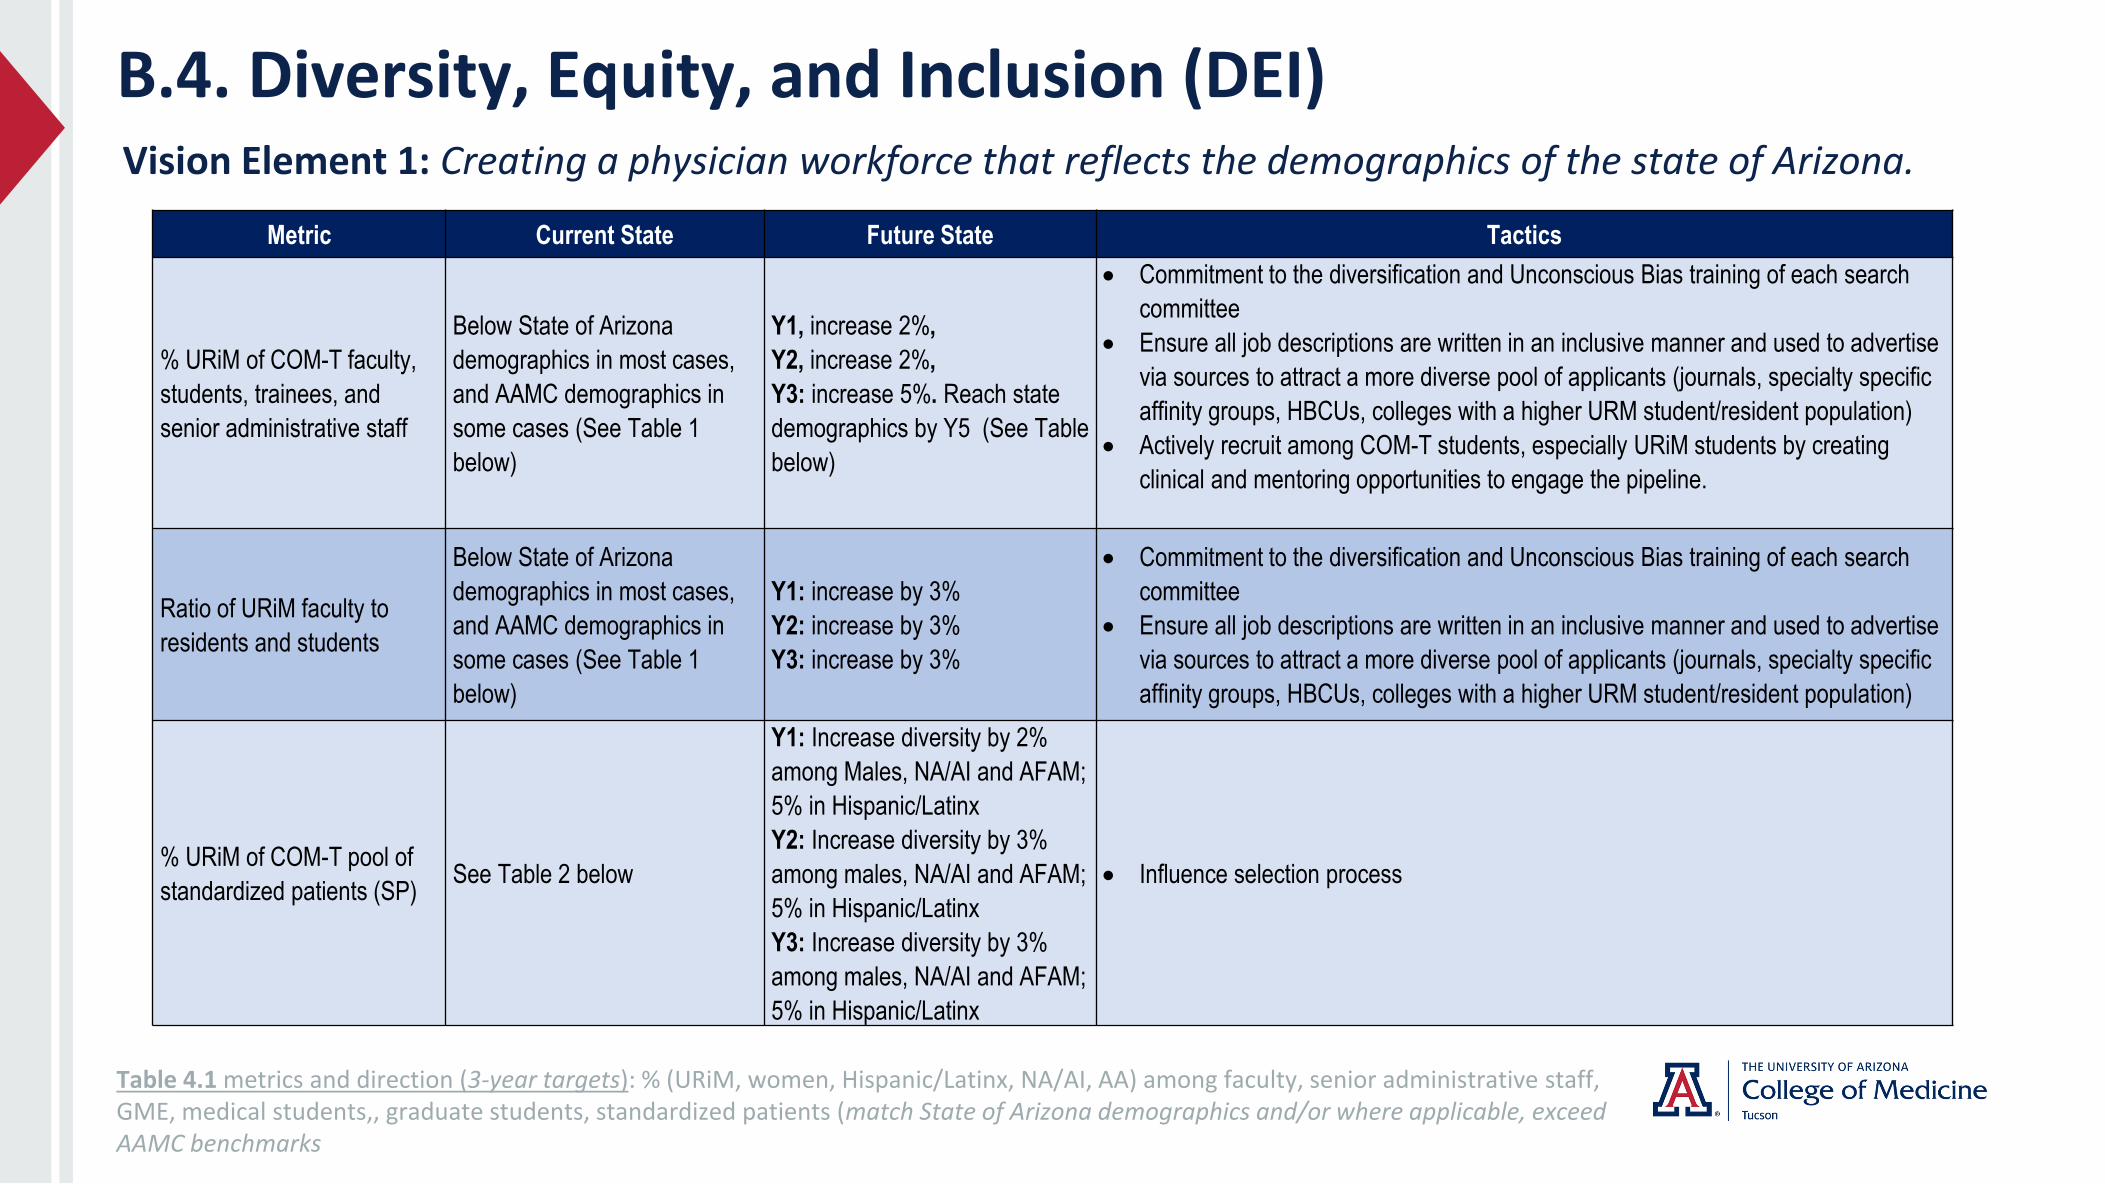
B.4. Diversity, Equity, and Inclusion (DEI)Vision Element 1: Creating a physician workforce that reflects the demographics of the state of Arizona.
Table 4.1 metrics and direction (3-year targets): % (URiM, women, Hispanic/Latinx, NA/AI, AA) among faculty, senior administrative staff, GME, medical students,, graduate students, standardized patients (match State of Arizona demographics and/or where applicable, exceed AAMC benchmarks
Metric Current State Future State Tactics
% URiM of COM-T faculty,
students, trainees, and
senior administrative staff
Below State of Arizona
demographics in most cases,
and AAMC demographics in
some cases (See Table 1
below)
Y1, increase 2%,
Y2, increase 2%,
Y3: increase 5%. Reach state
demographics by Y5 (See Table
below)
• Commitment to the diversification and Unconscious Bias training of each search
committee
• Ensure all job descriptions are written in an inclusive manner and used to advertise
via sources to attract a more diverse pool of applicants (journals, specialty specific
affinity groups, HBCUs, colleges with a higher URM student/resident population)
• Actively recruit among COM-T students, especially URiM students by creating
clinical and mentoring opportunities to engage the pipeline.
Ratio of URiM faculty to
residents and students
Below State of Arizona
demographics in most cases,
and AAMC demographics in
some cases (See Table 1
below)
Y1: increase by 3%
Y2: increase by 3%
Y3: increase by 3%
• Commitment to the diversification and Unconscious Bias training of each search
committee
• Ensure all job descriptions are written in an inclusive manner and used to advertise
via sources to attract a more diverse pool of applicants (journals, specialty specific
affinity groups, HBCUs, colleges with a higher URM student/resident population)
% URiM of COM-T pool of
standardized patients (SP)See Table 2 below
Y1: Increase diversity by 2%
among Males, NA/AI and AFAM;
5% in Hispanic/Latinx
Y2: Increase diversity by 3%
among males, NA/AI and AFAM;
5% in Hispanic/Latinx
Y3: Increase diversity by 3%
among males, NA/AI and AFAM;
5% in Hispanic/Latinx
• Influence selection process
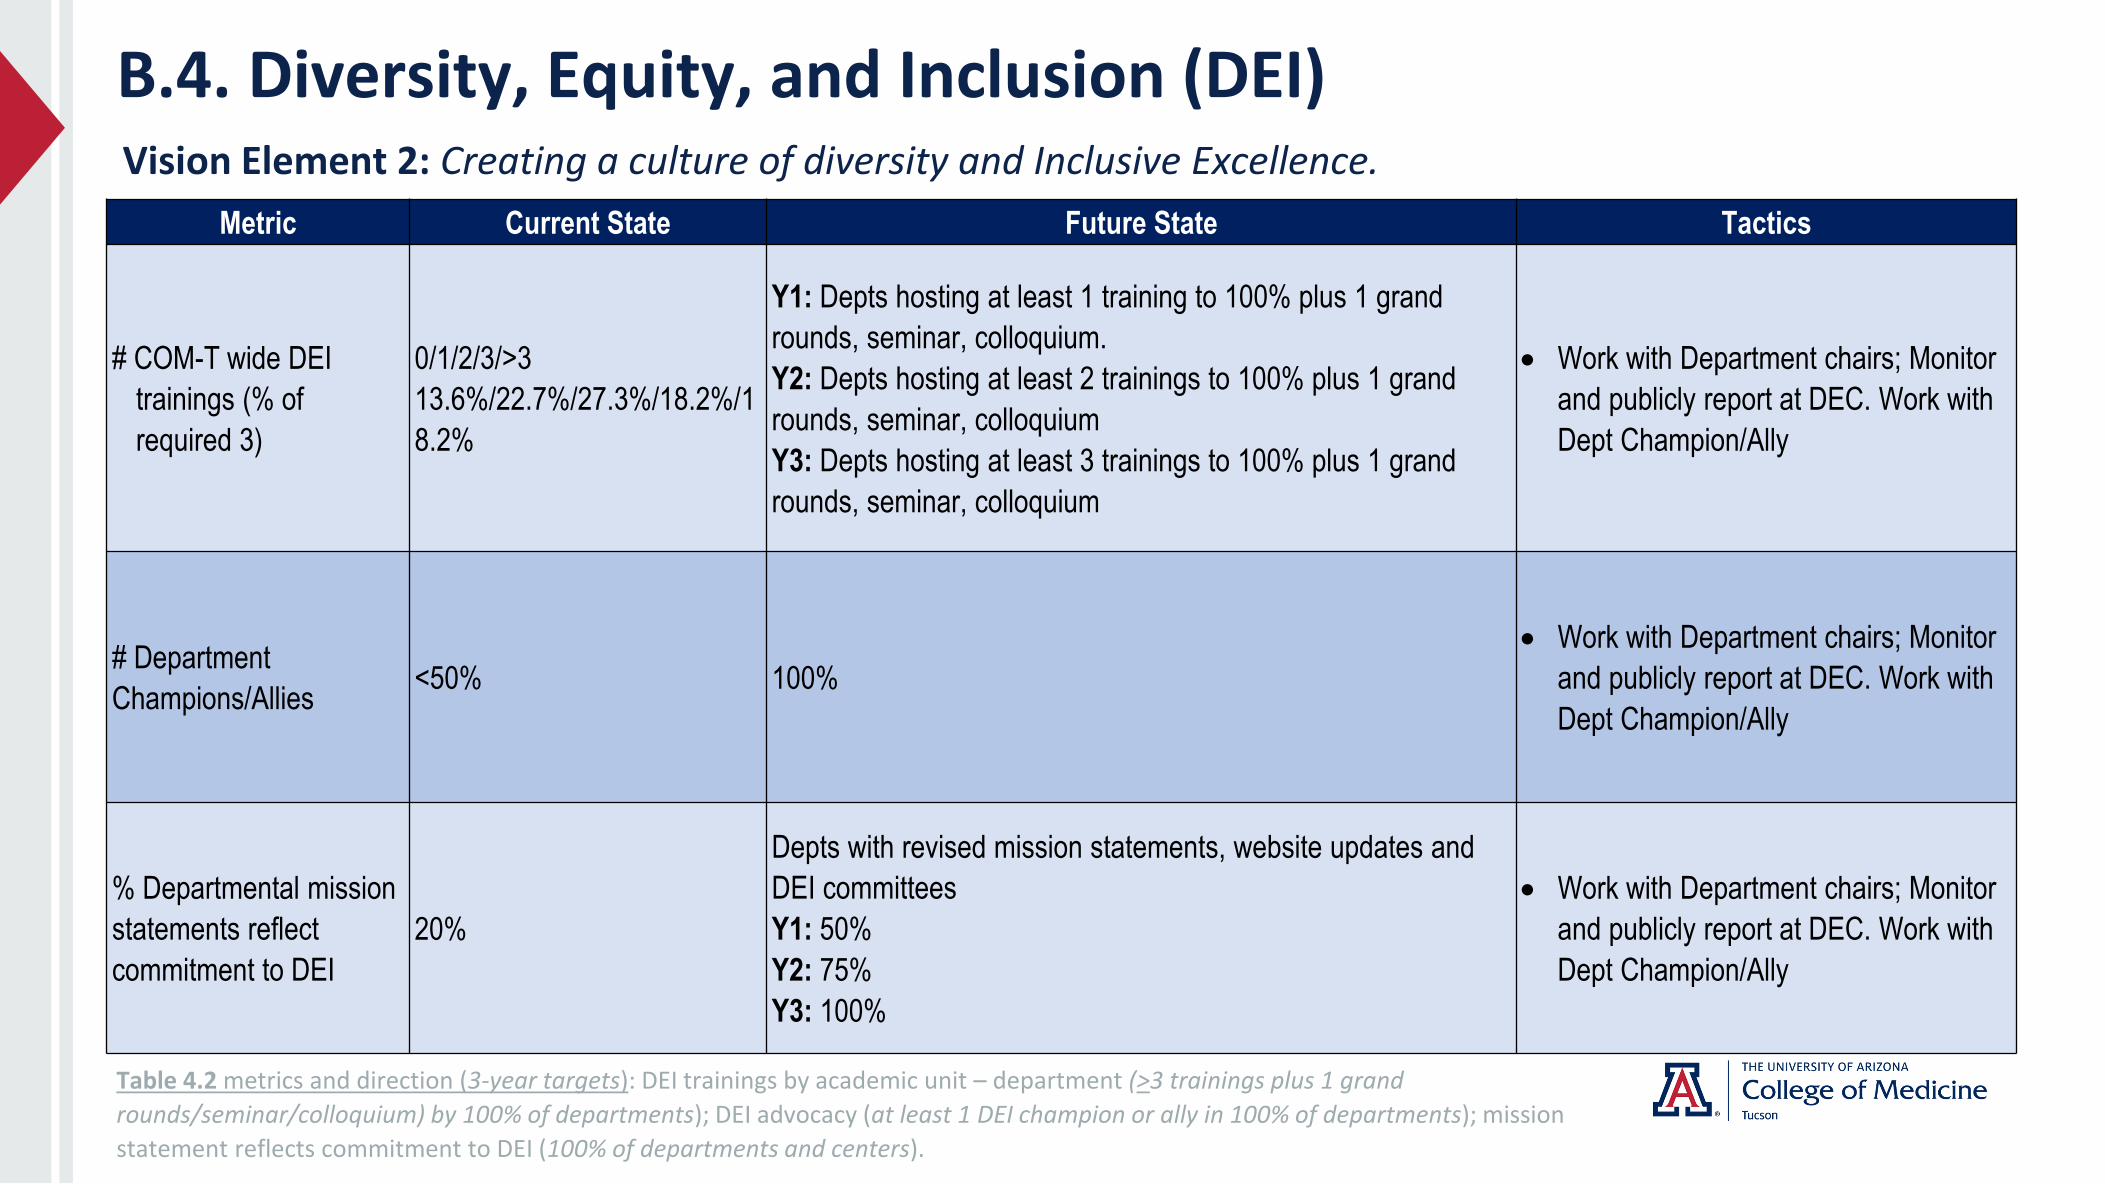
B.4. Diversity, Equity, and Inclusion (DEI)Vision Element 2: Creating a culture of diversity and Inclusive Excellence.
Table 4.2 metrics and direction (3-year targets): DEI trainings by academic unit – department (>3 trainings plus 1 grand
rounds/seminar/colloquium) by 100% of departments); DEI advocacy (at least 1 DEI champion or ally in 100% of departments); mission
statement reflects commitment to DEI (100% of departments and centers).
Metric Current State Future State Tactics
# COM-T wide DEI
trainings (% of
required 3)
0/1/2/3/>3
13.6%/22.7%/27.3%/18.2%/1
8.2%
Y1: Depts hosting at least 1 training to 100% plus 1 grand
rounds, seminar, colloquium.
Y2: Depts hosting at least 2 trainings to 100% plus 1 grand
rounds, seminar, colloquium
Y3: Depts hosting at least 3 trainings to 100% plus 1 grand
rounds, seminar, colloquium
• Work with Department chairs; Monitor
and publicly report at DEC. Work with
Dept Champion/Ally
# Department
Champions/Allies<50% 100%
• Work with Department chairs; Monitor
and publicly report at DEC. Work with
Dept Champion/Ally
% Departmental mission
statements reflect
commitment to DEI
20%
Depts with revised mission statements, website updates and
DEI committees
Y1: 50%
Y2: 75%
Y3: 100%
• Work with Department chairs; Monitor
and publicly report at DEC. Work with
Dept Champion/Ally
The Plan ‘at a glance’Vision and Anticipated 3-year milestones/outcomes - V
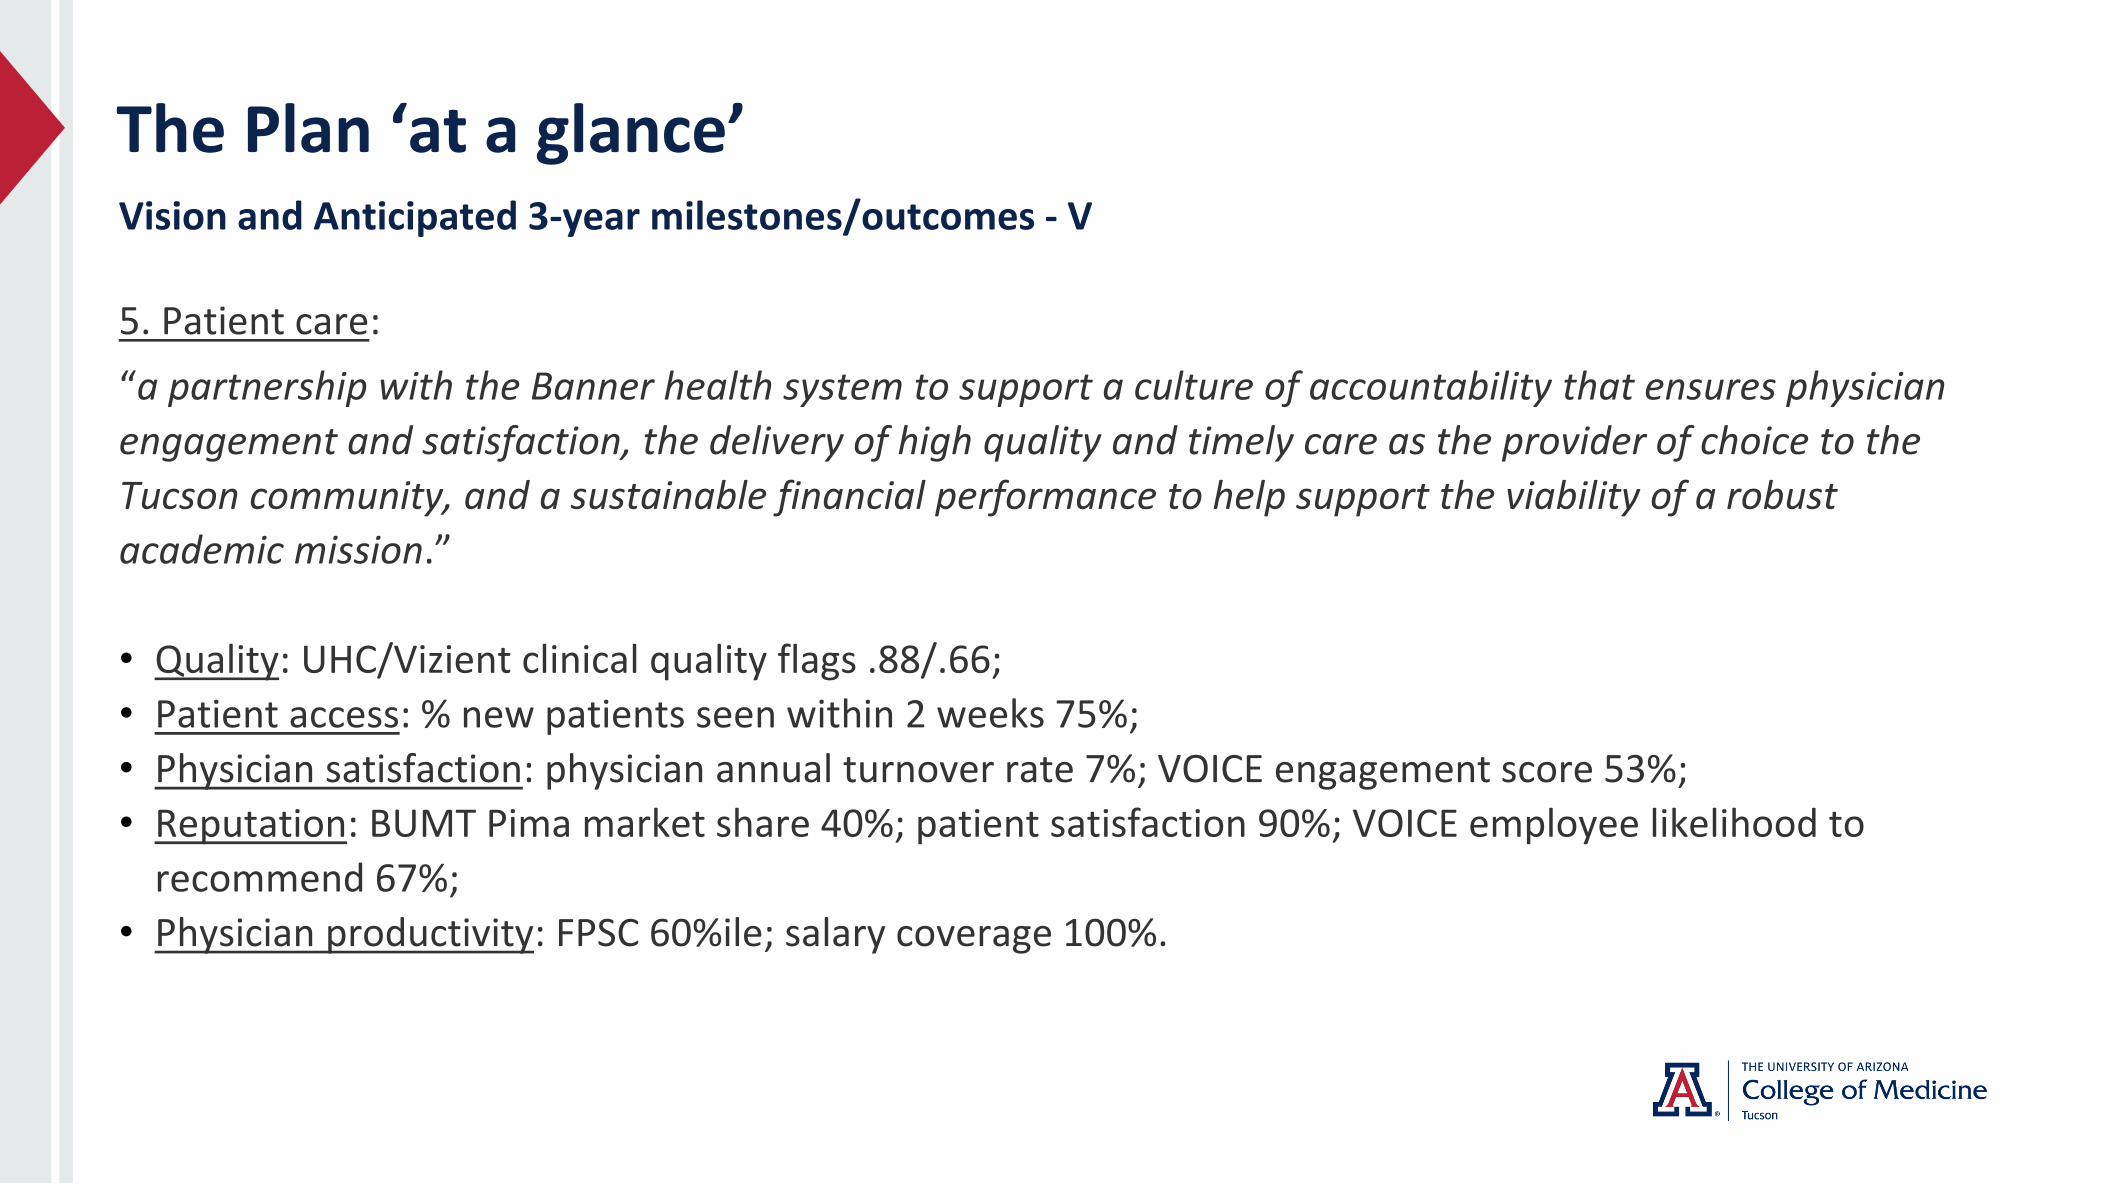
5. Patient care:
“a partnership with the Banner health system to support a culture of accountability that ensures physician
engagement and satisfaction, the delivery of high quality and timely care as the provider of choice to the
Tucson community, and a sustainable financial performance to help support the viability of a robust
academic mission.”
• Quality: UHC/Vizient clinical quality flags .88/.66;
• Patient access: % new patients seen within 2 weeks 75%;
• Physician satisfaction: physician annual turnover rate 7%; VOICE engagement score 53%;
• Reputation: BUMT Pima market share 40%; patient satisfaction 90%; VOICE employee likelihood to
recommend 67%;
• Physician productivity: FPSC 60%ile; salary coverage 100%.

B.5. Patient CareVision Element 1: Delivering high quality and timely clinical care in the Tucson community.
Table 5.1 metrics and direction (3-year targets): UHC/Vizient clinical quality flags: total inpatient obs/exp ratio (.88/.66); % new patients seen within 2 weeks (75%).
Metric Current State Future State Tactics
UHC/Vizient clinical quality
flags: Total Inpatient
Obs/Exp Ratio
BUMC-T .97
BUMC-S .72
Y1: .94; .70
Y2: .91; .68
Y3: .88; .66
• Improve current reporting and coding
mechanisms, including early identification of
vulnerable patients and referral to appropriate
service (i.e. palliative care)
• Quality assurance and performance improvement
programs
% new patients seen
within 2 weeks60.9%
Y1: 65%
Y2: 70%
Y3: 75%
• Active management of scheduling processes and
optimization of clinical space and locations
• Active review of open slots and creating new slots
to manage a no-show rate
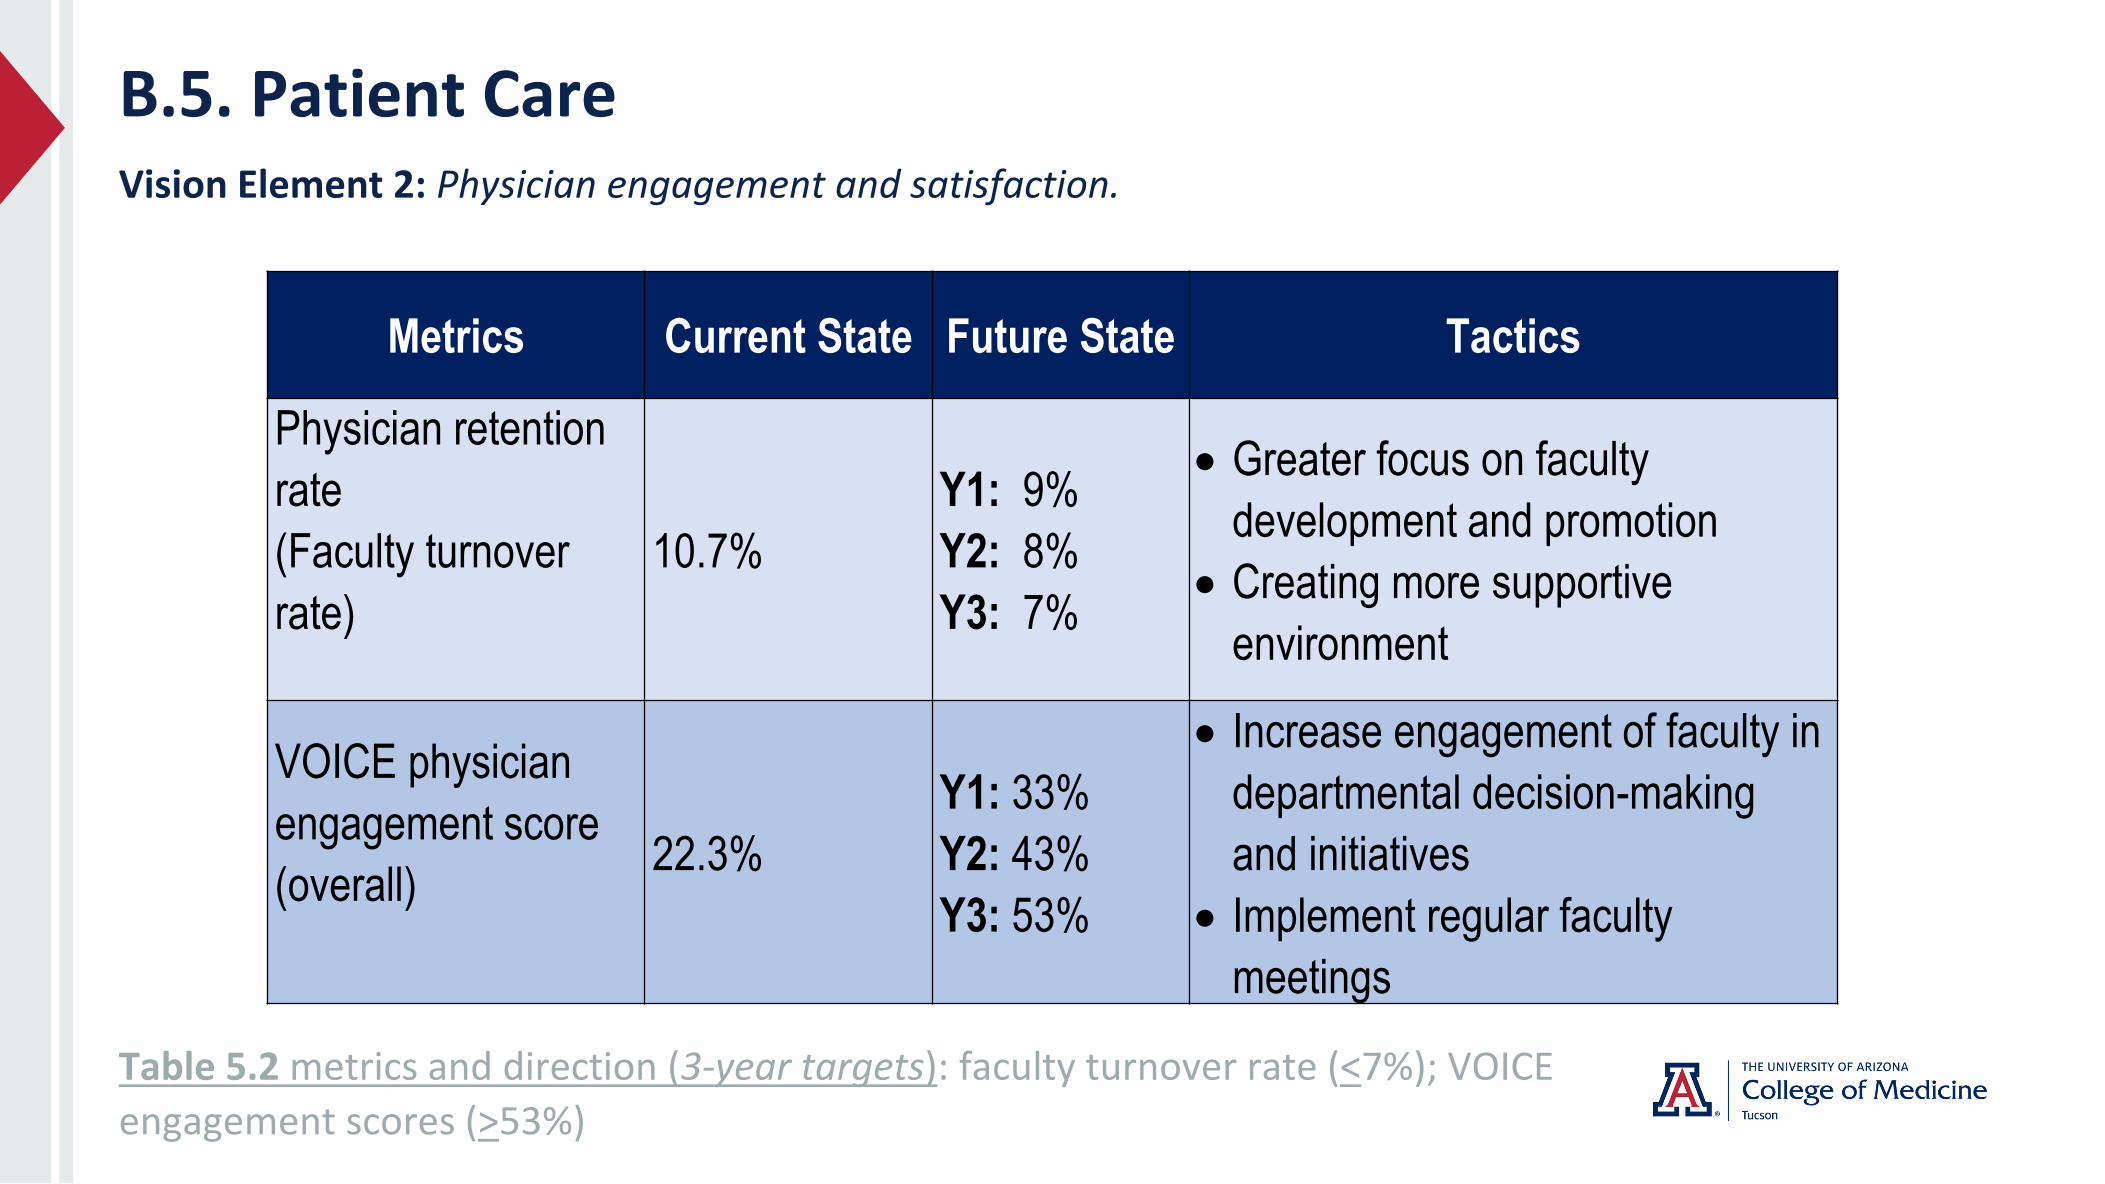
B.5. Patient CareVision Element 2: Physician engagement and satisfaction.
Table 5.2 metrics and direction (3-year targets): faculty turnover rate (<7%); VOICE
engagement scores (>53%)
Metrics Current State Future State Tactics
Physician retention
rate
(Faculty turnover
rate)
10.7%
Y1: 9%
Y2: 8%
Y3: 7%
• Greater focus on faculty
development and promotion
• Creating more supportive
environment
VOICE physician
engagement score
(overall)22.3%
Y1: 33%
Y2: 43%
Y3: 53%
• Increase engagement of faculty in
departmental decision-making
and initiatives
• Implement regular faculty
meetings
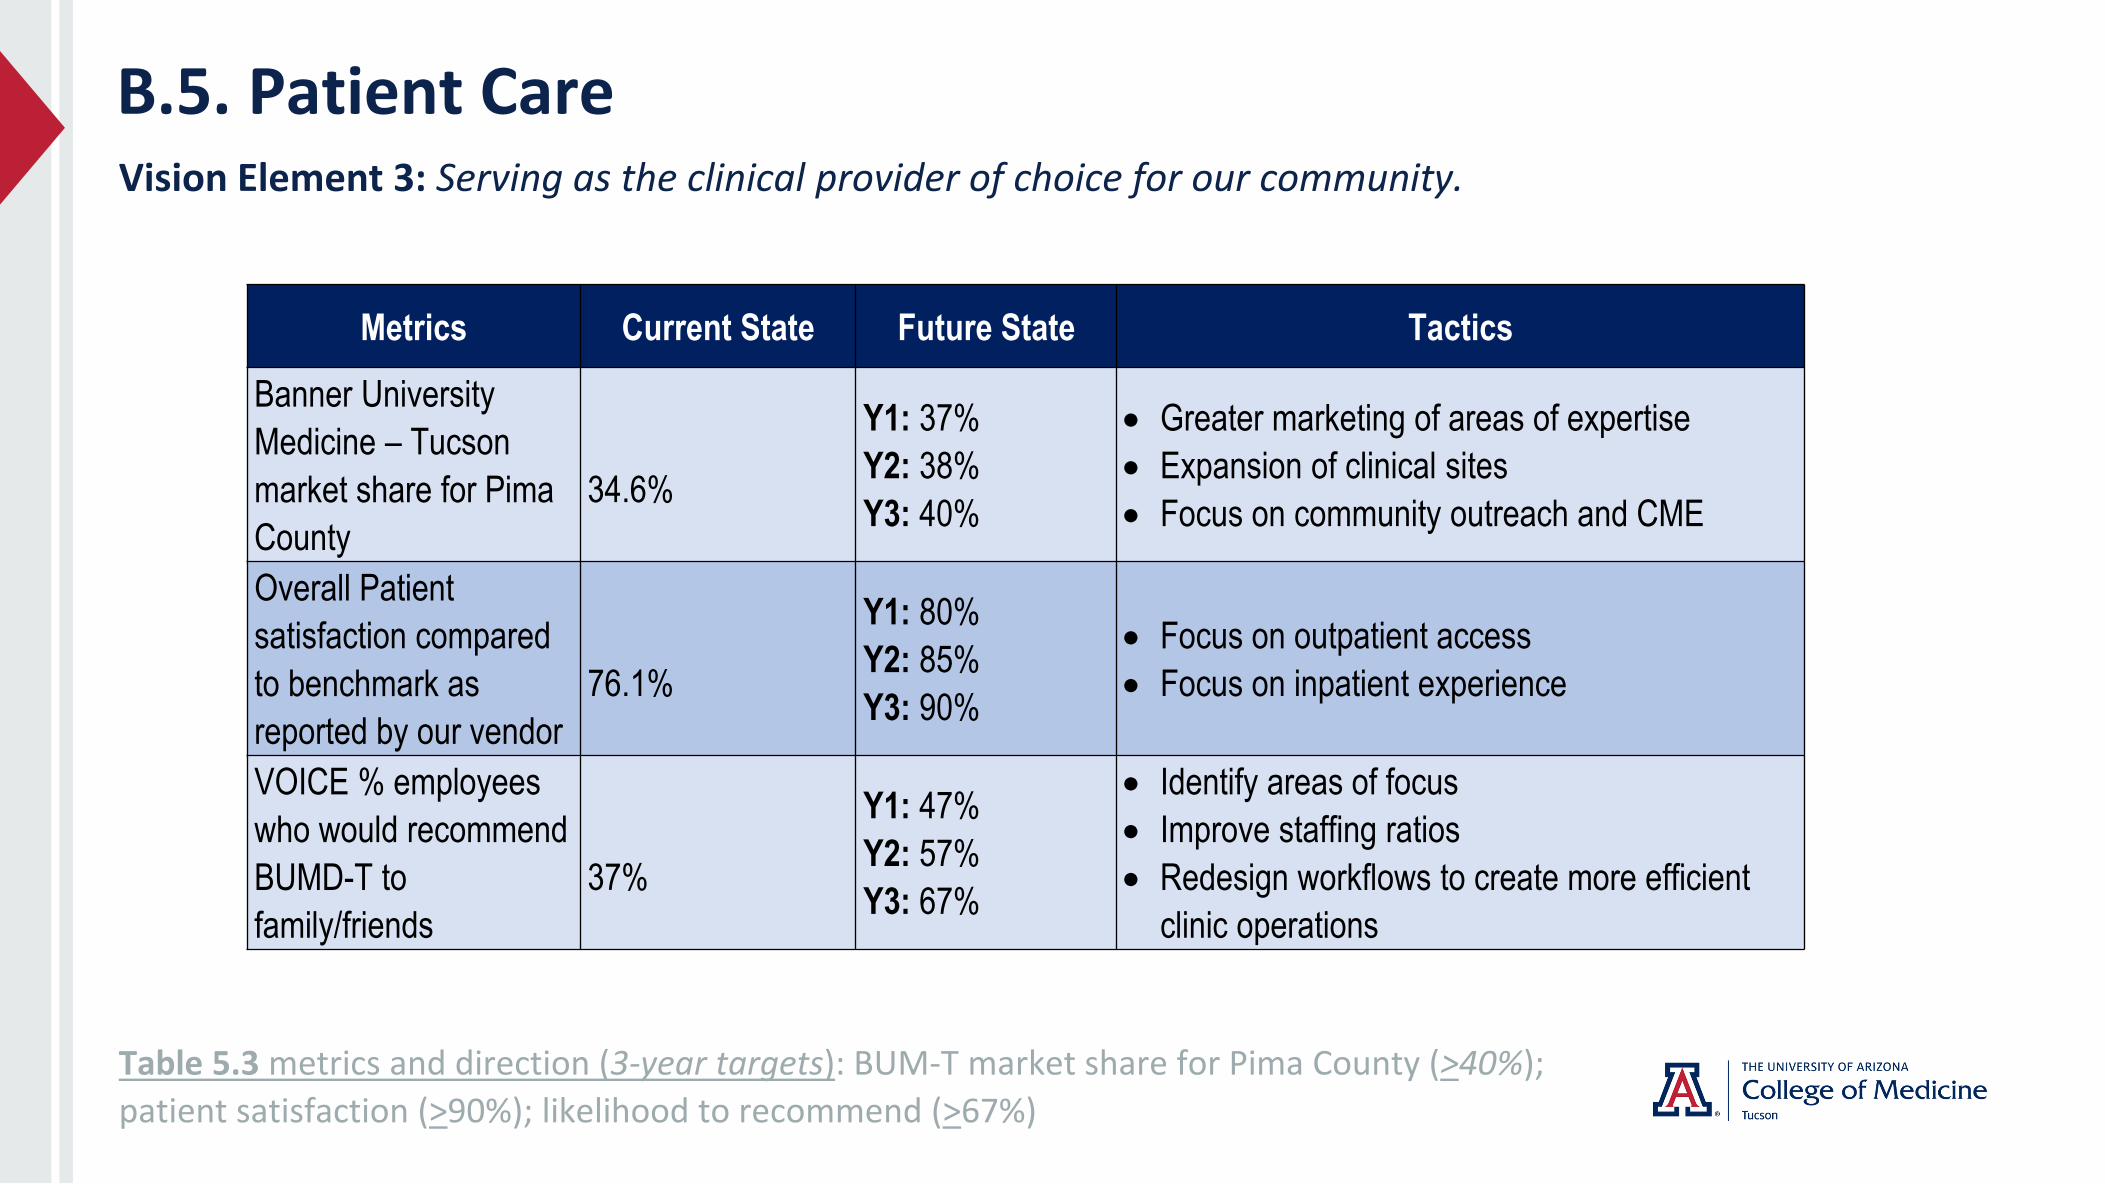
B.5. Patient CareVision Element 3: Serving as the clinical provider of choice for our community.
Table 5.3 metrics and direction (3-year targets): BUM-T market share for Pima County (>40%);
patient satisfaction (>90%); likelihood to recommend (>67%)
Metrics Current State Future State Tactics
Banner University
Medicine – Tucson
market share for Pima
County
34.6%
Y1: 37%
Y2: 38%
Y3: 40%
• Greater marketing of areas of expertise
• Expansion of clinical sites
• Focus on community outreach and CME
Overall Patient
satisfaction compared
to benchmark as
reported by our vendor
76.1%
Y1: 80%
Y2: 85%
Y3: 90%
• Focus on outpatient access
• Focus on inpatient experience
VOICE % employees
who would recommend
BUMD-T to
family/friends
37%
Y1: 47%
Y2: 57%
Y3: 67%
• Identify areas of focus
• Improve staffing ratios
• Redesign workflows to create more efficient
clinic operations
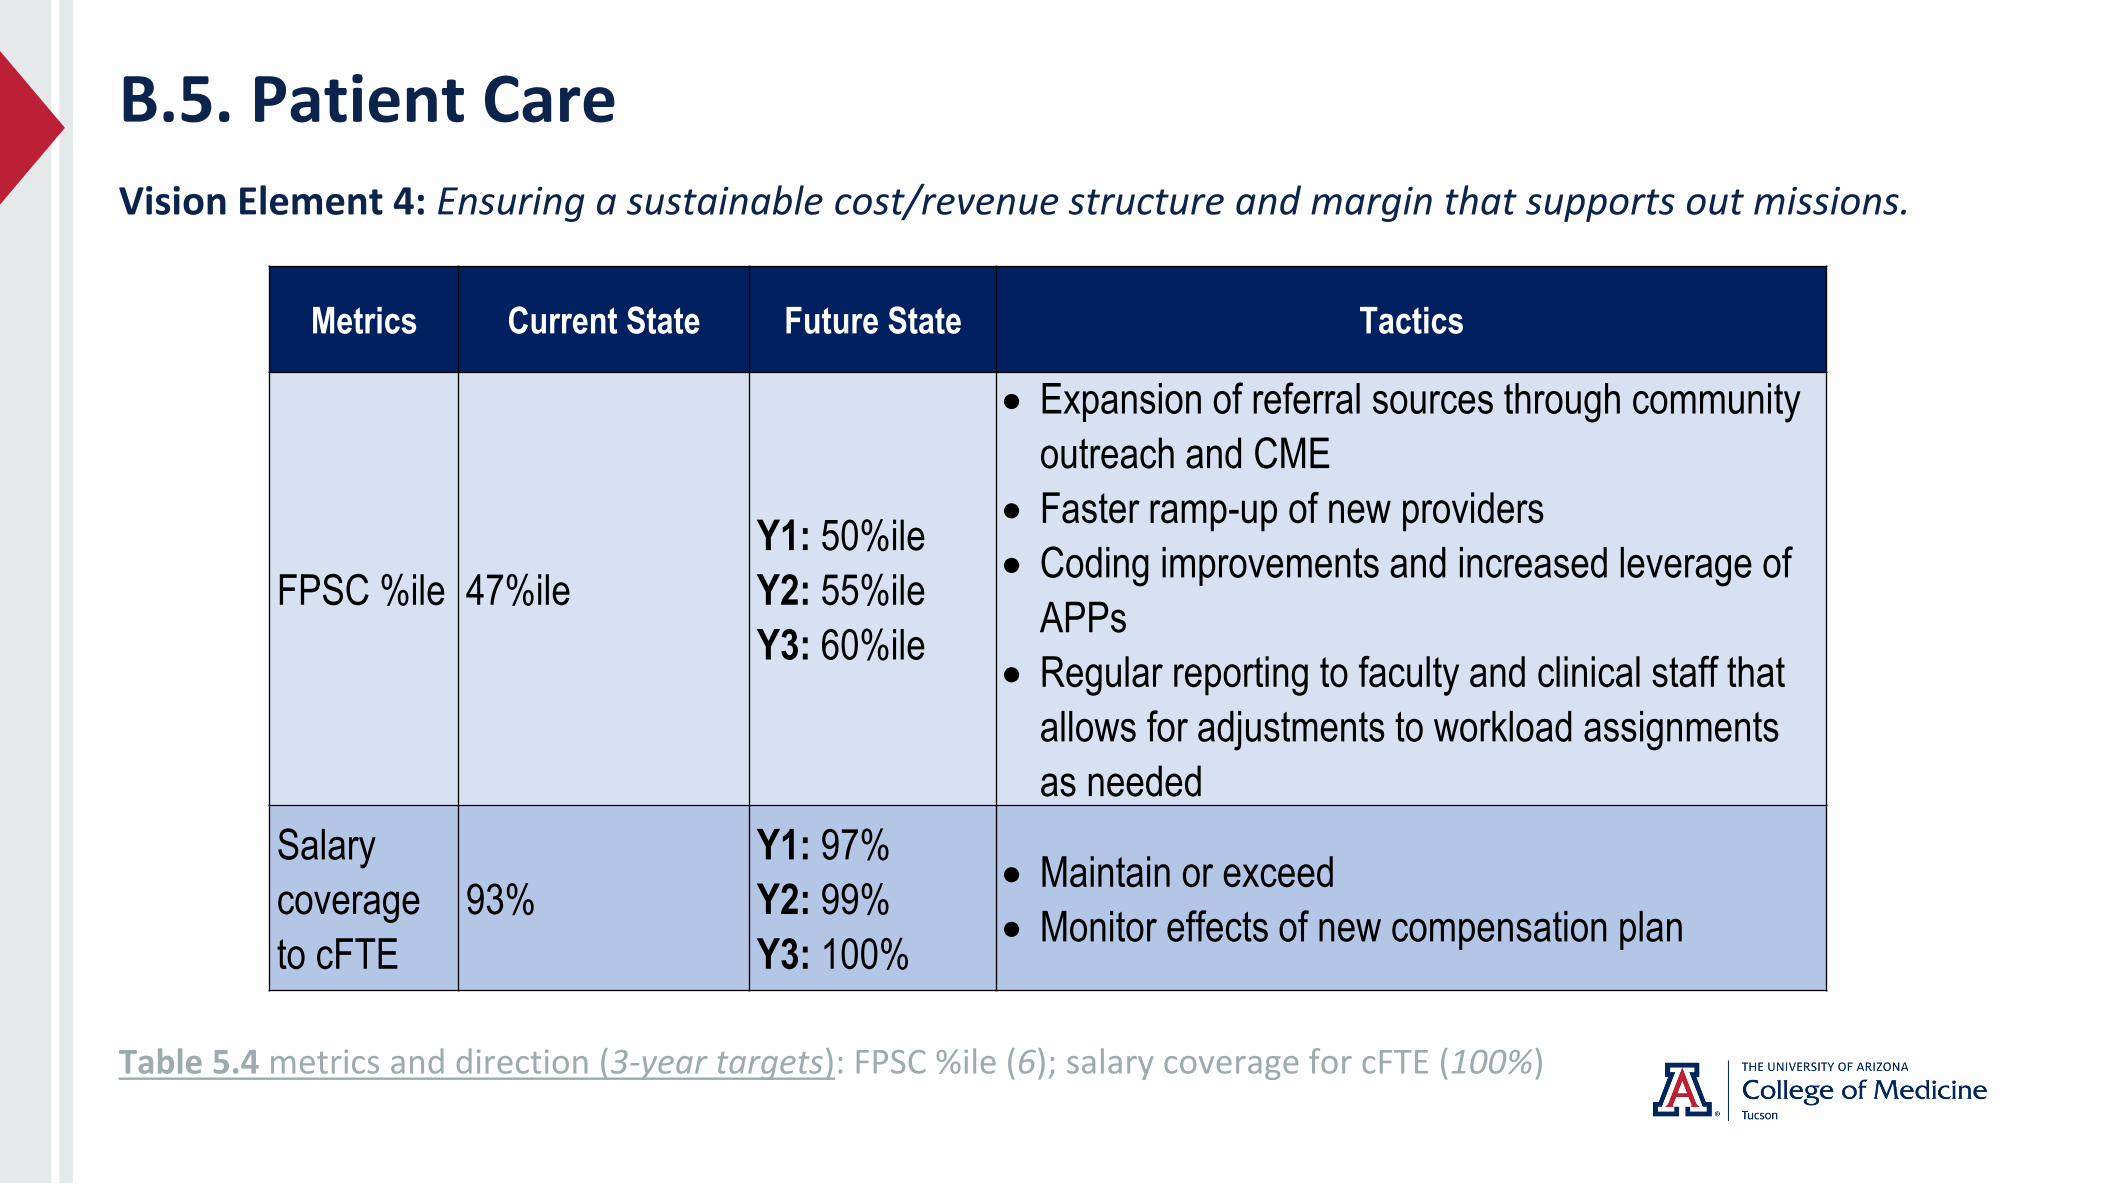
B.5. Patient Care
Vision Element 4: Ensuring a sustainable cost/revenue structure and margin that supports out missions.
Table 5.4 metrics and direction (3-year targets): FPSC %ile (6); salary coverage for cFTE (100%)
Metrics Current State Future State Tactics
FPSC %ile 47%ile
Y1: 50%ile
Y2: 55%ile
Y3: 60%ile
• Expansion of referral sources through community
outreach and CME
• Faster ramp-up of new providers
• Coding improvements and increased leverage of
APPs
• Regular reporting to faculty and clinical staff that
allows for adjustments to workload assignments
as needed
Salary
coverage
to cFTE
93%
Y1: 97%
Y2: 99%
Y3: 100%
• Maintain or exceed
• Monitor effects of new compensation plan

The Plan ‘at a glance’Vision and Anticipated 3-year milestones/outcomes - VI
6. Financial sustainability (COM-T):
“a culture of financial responsibility to ensure sustainability, allowing for growth and re-investment in COM-
T’s academic mission.”
• Financials: expense/revenue 95%; reserves 6 months;
• Reliance on state funds: state funds expenditures 10%;
• Teaching revenue: teaching effort 11% increase online teaching significantly;
• Research productivity: research expenditures 45%; research effort 36%;
• Reinvestment: unfunded effort 10%.
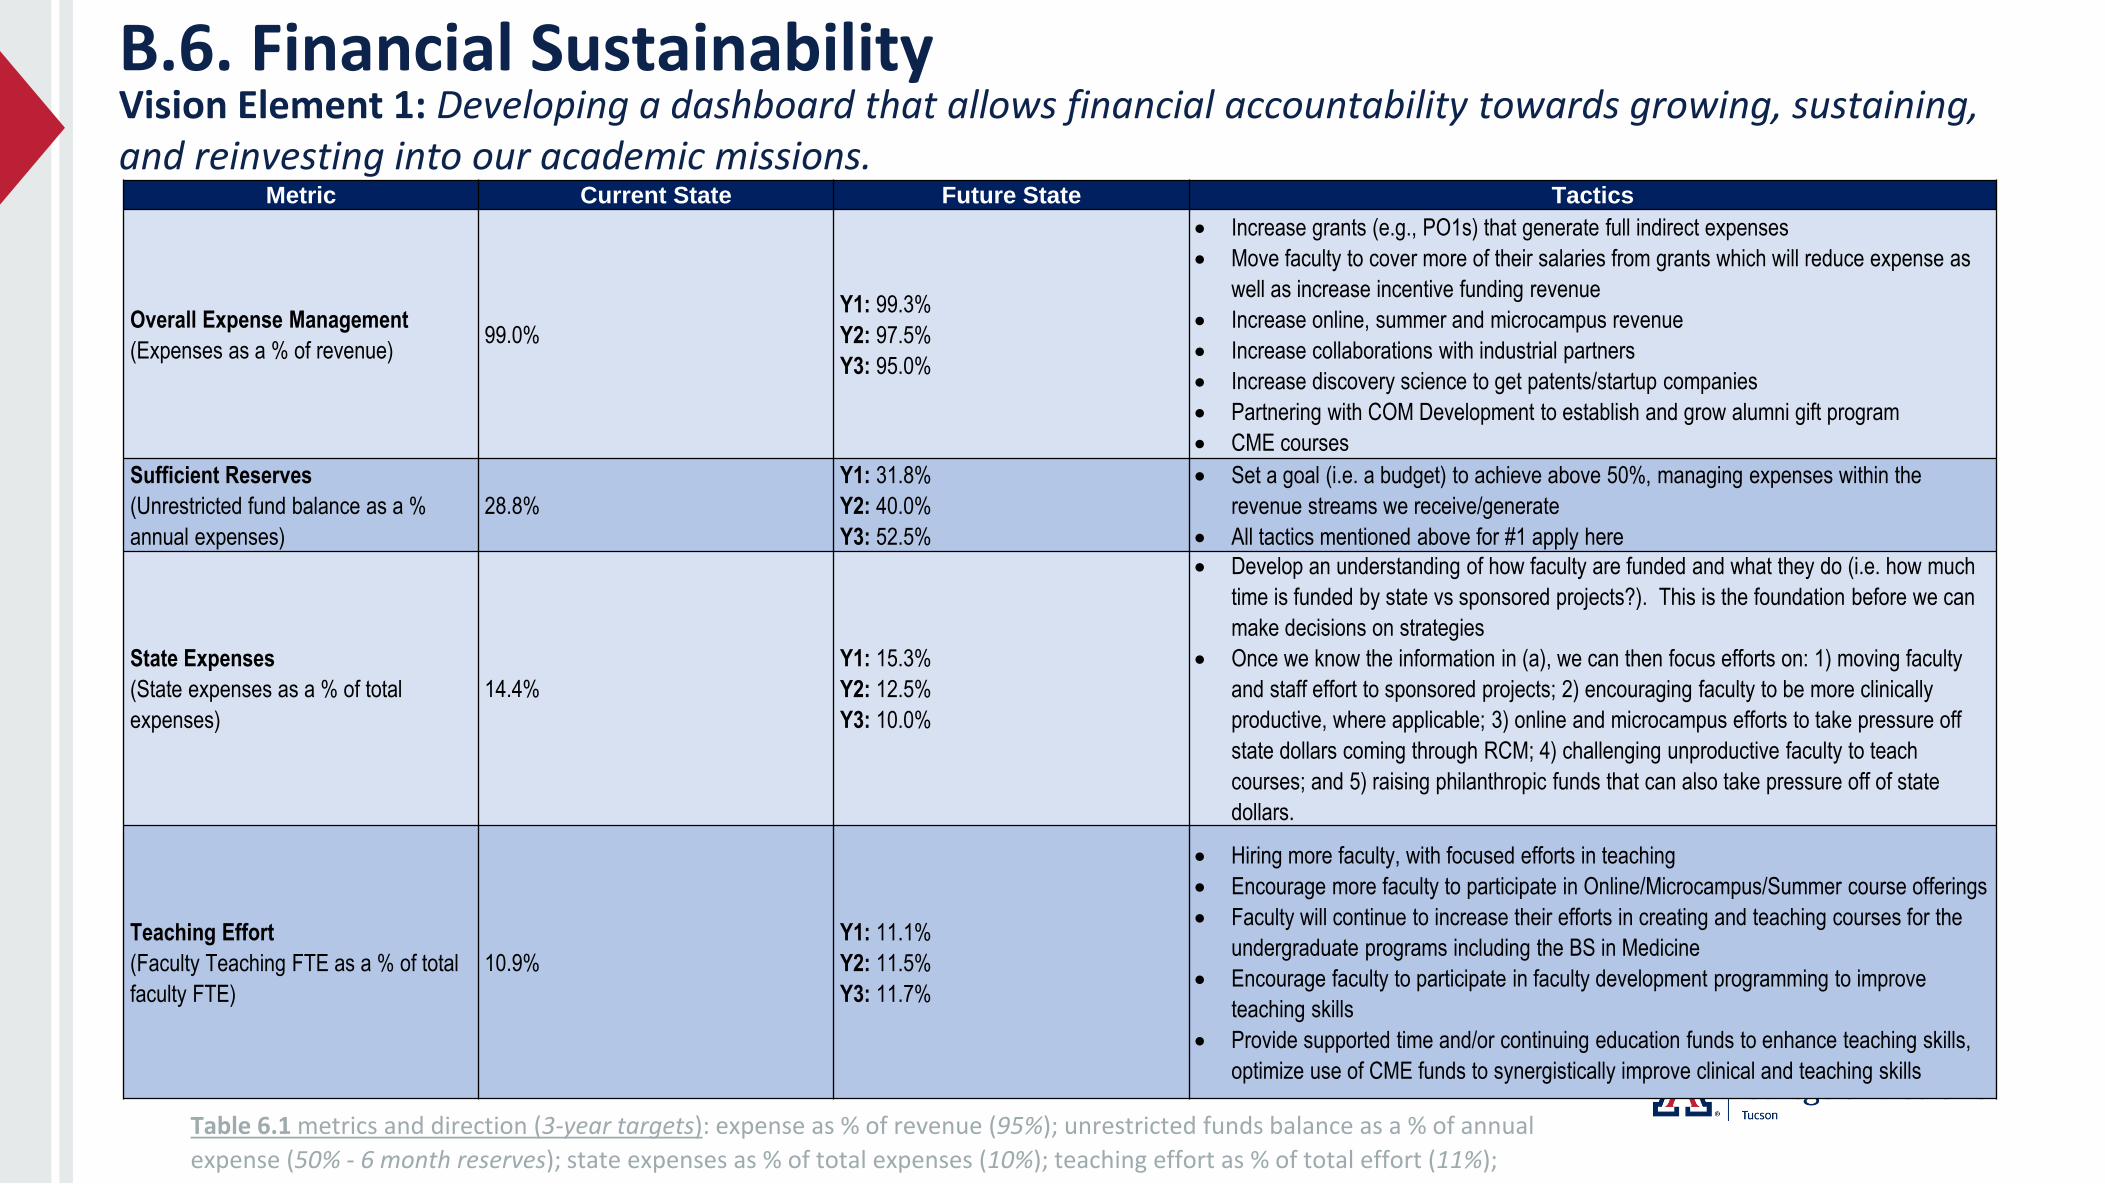
B.6. Financial SustainabilityVision Element 1: Developing a dashboard that allows financial accountability towards growing, sustaining, and reinvesting into our academic missions.
Table 6.1 metrics and direction (3-year targets): expense as % of revenue (95%); unrestricted funds balance as a % of annual
expense (50% - 6 month reserves); state expenses as % of total expenses (10%); teaching effort as % of total effort (11%);
Metric Current State Future State Tactics
Overall Expense Management
(Expenses as a % of revenue)99.0%
Y1: 99.3%
Y2: 97.5%
Y3: 95.0%
• Increase grants (e.g., PO1s) that generate full indirect expenses
• Move faculty to cover more of their salaries from grants which will reduce expense as
well as increase incentive funding revenue
• Increase online, summer and microcampus revenue
• Increase collaborations with industrial partners
• Increase discovery science to get patents/startup companies
• Partnering with COM Development to establish and grow alumni gift program
• CME courses
Sufficient Reserves
(Unrestricted fund balance as a %
annual expenses)
28.8%
Y1: 31.8%
Y2: 40.0%
Y3: 52.5%
• Set a goal (i.e. a budget) to achieve above 50%, managing expenses within the
revenue streams we receive/generate
• All tactics mentioned above for #1 apply here
State Expenses
(State expenses as a % of total
expenses)
14.4%
Y1: 15.3%
Y2: 12.5%
Y3: 10.0%
• Develop an understanding of how faculty are funded and what they do (i.e. how much
time is funded by state vs sponsored projects?). This is the foundation before we can
make decisions on strategies
• Once we know the information in (a), we can then focus efforts on: 1) moving faculty
and staff effort to sponsored projects; 2) encouraging faculty to be more clinically
productive, where applicable; 3) online and microcampus efforts to take pressure off
state dollars coming through RCM; 4) challenging unproductive faculty to teach
courses; and 5) raising philanthropic funds that can also take pressure off of state
dollars.
Teaching Effort
(Faculty Teaching FTE as a % of total
faculty FTE)
10.9%
Y1: 11.1%
Y2: 11.5%
Y3: 11.7%
• Hiring more faculty, with focused efforts in teaching
• Encourage more faculty to participate in Online/Microcampus/Summer course offerings
• Faculty will continue to increase their efforts in creating and teaching courses for the
undergraduate programs including the BS in Medicine
• Encourage faculty to participate in faculty development programming to improve
teaching skills
• Provide supported time and/or continuing education funds to enhance teaching skills,
optimize use of CME funds to synergistically improve clinical and teaching skills
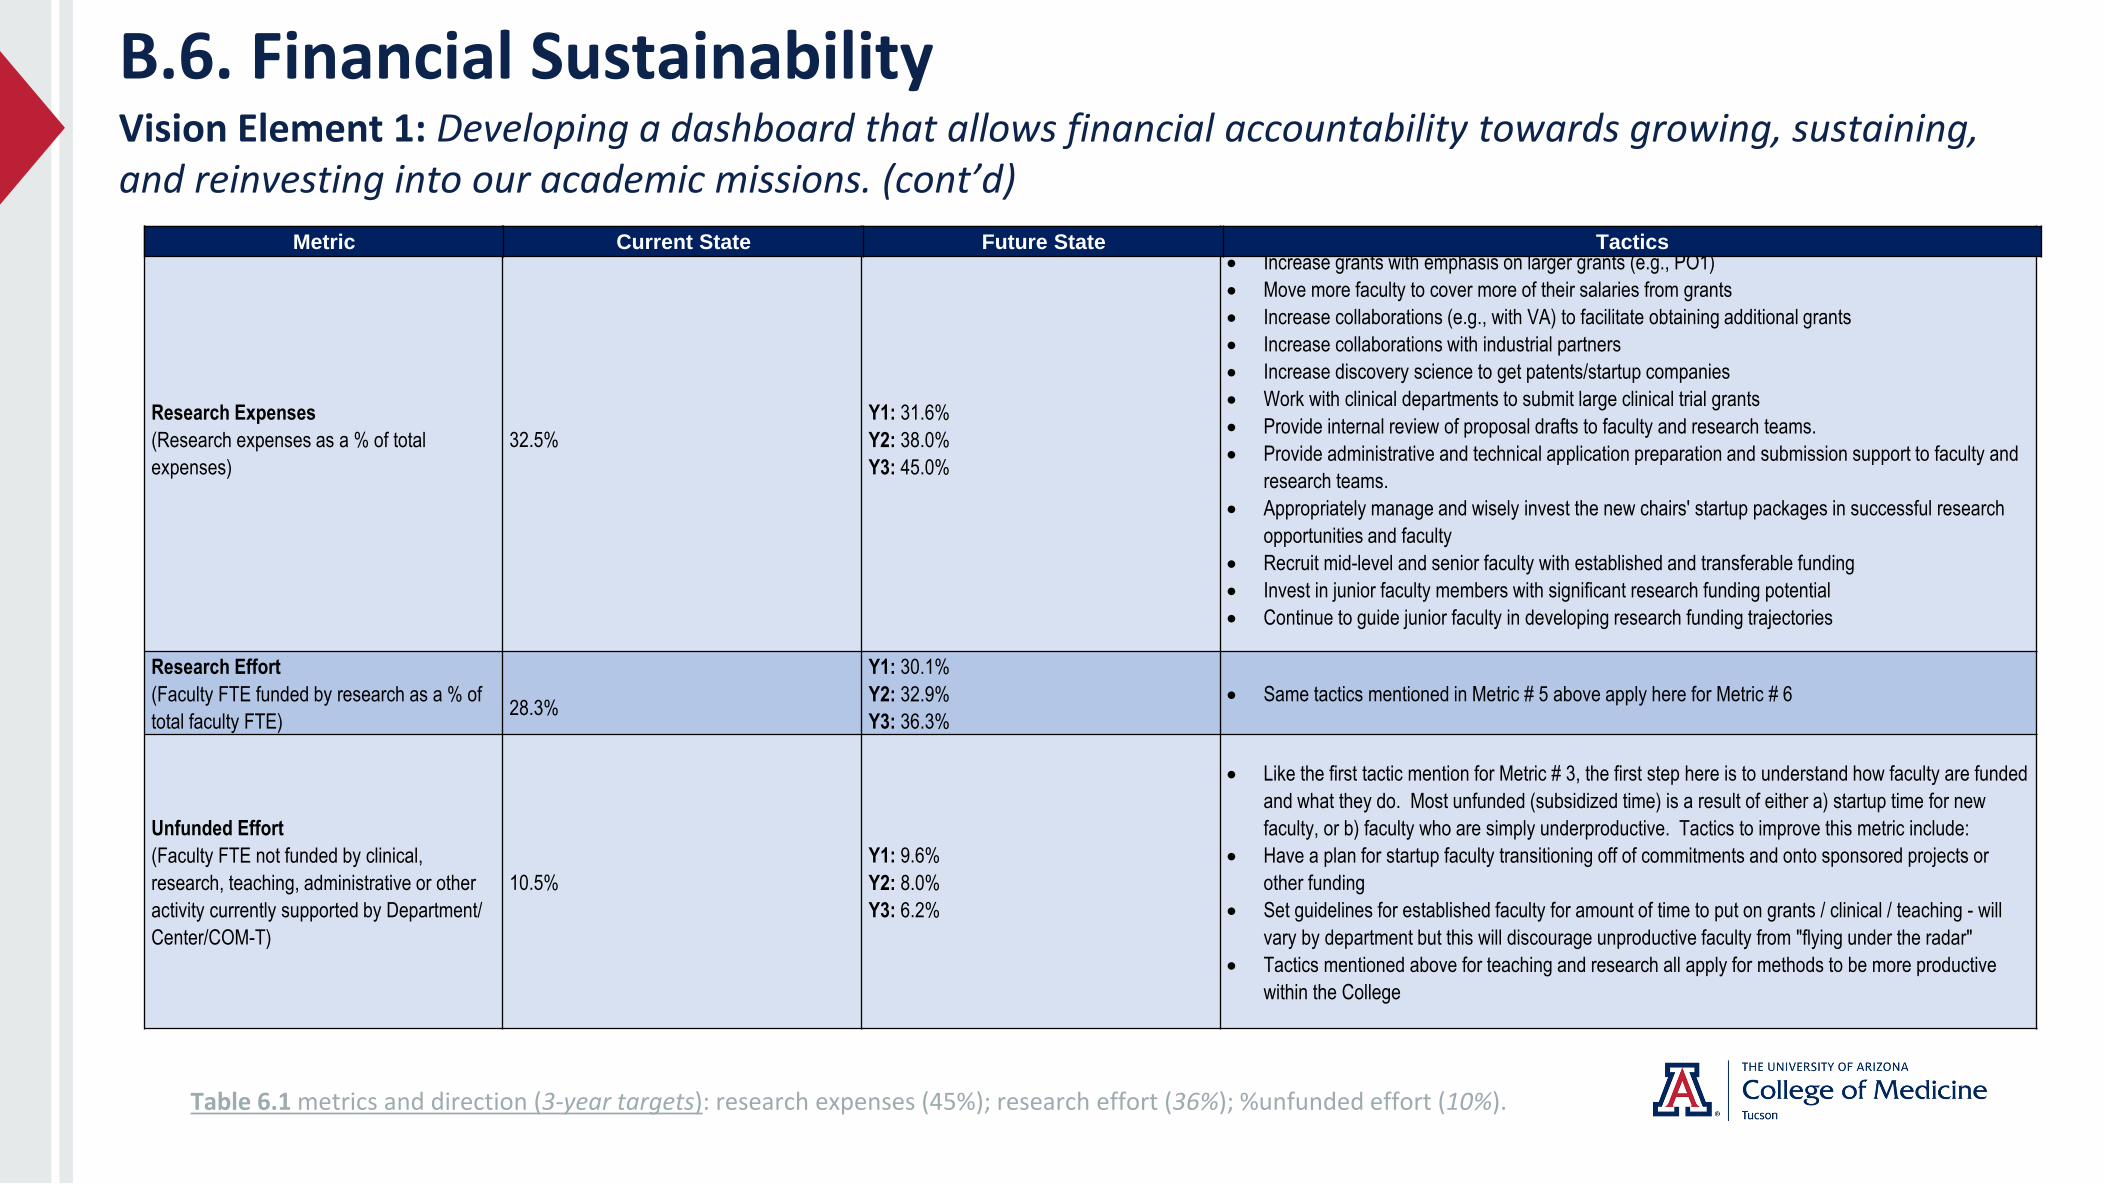
B.6. Financial SustainabilityVision Element 1: Developing a dashboard that allows financial accountability towards growing, sustaining, and reinvesting into our academic missions. (cont’d)
Research Expenses
(Research expenses as a % of total
expenses)
32.5%
Y1: 31.6%
Y2: 38.0%
Y3: 45.0%
• Increase grants with emphasis on larger grants (e.g., PO1)
• Move more faculty to cover more of their salaries from grants
• Increase collaborations (e.g., with VA) to facilitate obtaining additional grants
• Increase collaborations with industrial partners
• Increase discovery science to get patents/startup companies
• Work with clinical departments to submit large clinical trial grants
• Provide internal review of proposal drafts to faculty and research teams.
• Provide administrative and technical application preparation and submission support to faculty and
research teams.
• Appropriately manage and wisely invest the new chairs' startup packages in successful research
opportunities and faculty
• Recruit mid-level and senior faculty with established and transferable funding
• Invest in junior faculty members with significant research funding potential
• Continue to guide junior faculty in developing research funding trajectories
Research Effort
(Faculty FTE funded by research as a % of
total faculty FTE)28.3%
Y1: 30.1%
Y2: 32.9%
Y3: 36.3%
• Same tactics mentioned in Metric # 5 above apply here for Metric # 6
Unfunded Effort
(Faculty FTE not funded by clinical,
research, teaching, administrative or other
activity currently supported by Department/
Center/COM-T)
10.5%
Y1: 9.6%
Y2: 8.0%
Y3: 6.2%
• Like the first tactic mention for Metric # 3, the first step here is to understand how faculty are funded
and what they do. Most unfunded (subsidized time) is a result of either a) startup time for new
faculty, or b) faculty who are simply underproductive. Tactics to improve this metric include:
• Have a plan for startup faculty transitioning off of commitments and onto sponsored projects or
other funding
• Set guidelines for established faculty for amount of time to put on grants / clinical / teaching - will
vary by department but this will discourage unproductive faculty from "flying under the radar"
• Tactics mentioned above for teaching and research all apply for methods to be more productive
within the College
Metric Current State Future State Tactics
Table 6.1 metrics and direction (3-year targets): research expenses (45%); research effort (36%); %unfunded effort (10%).

The Plan ‘at a glance’Vision and Anticipated 3-year milestones/outcomes - VII
7. Development:
“a culture of seeking and tracking philanthropic opportunities and responsiveness to optimize philanthropic
support for COM-T’s tripartite mission.”
• Referrals: increase referrals 60%;
• Effectiveness: increase number of donors 30%;
• Funding: increase average annualized gift size 30%;
• Efficiency: decrease turn-around time to 4 days;
• Opportunity: # shovel-ready 1- page proposals (new initiative) – 5% of FTE per department; increase #
events 30% (e.g. investitures)
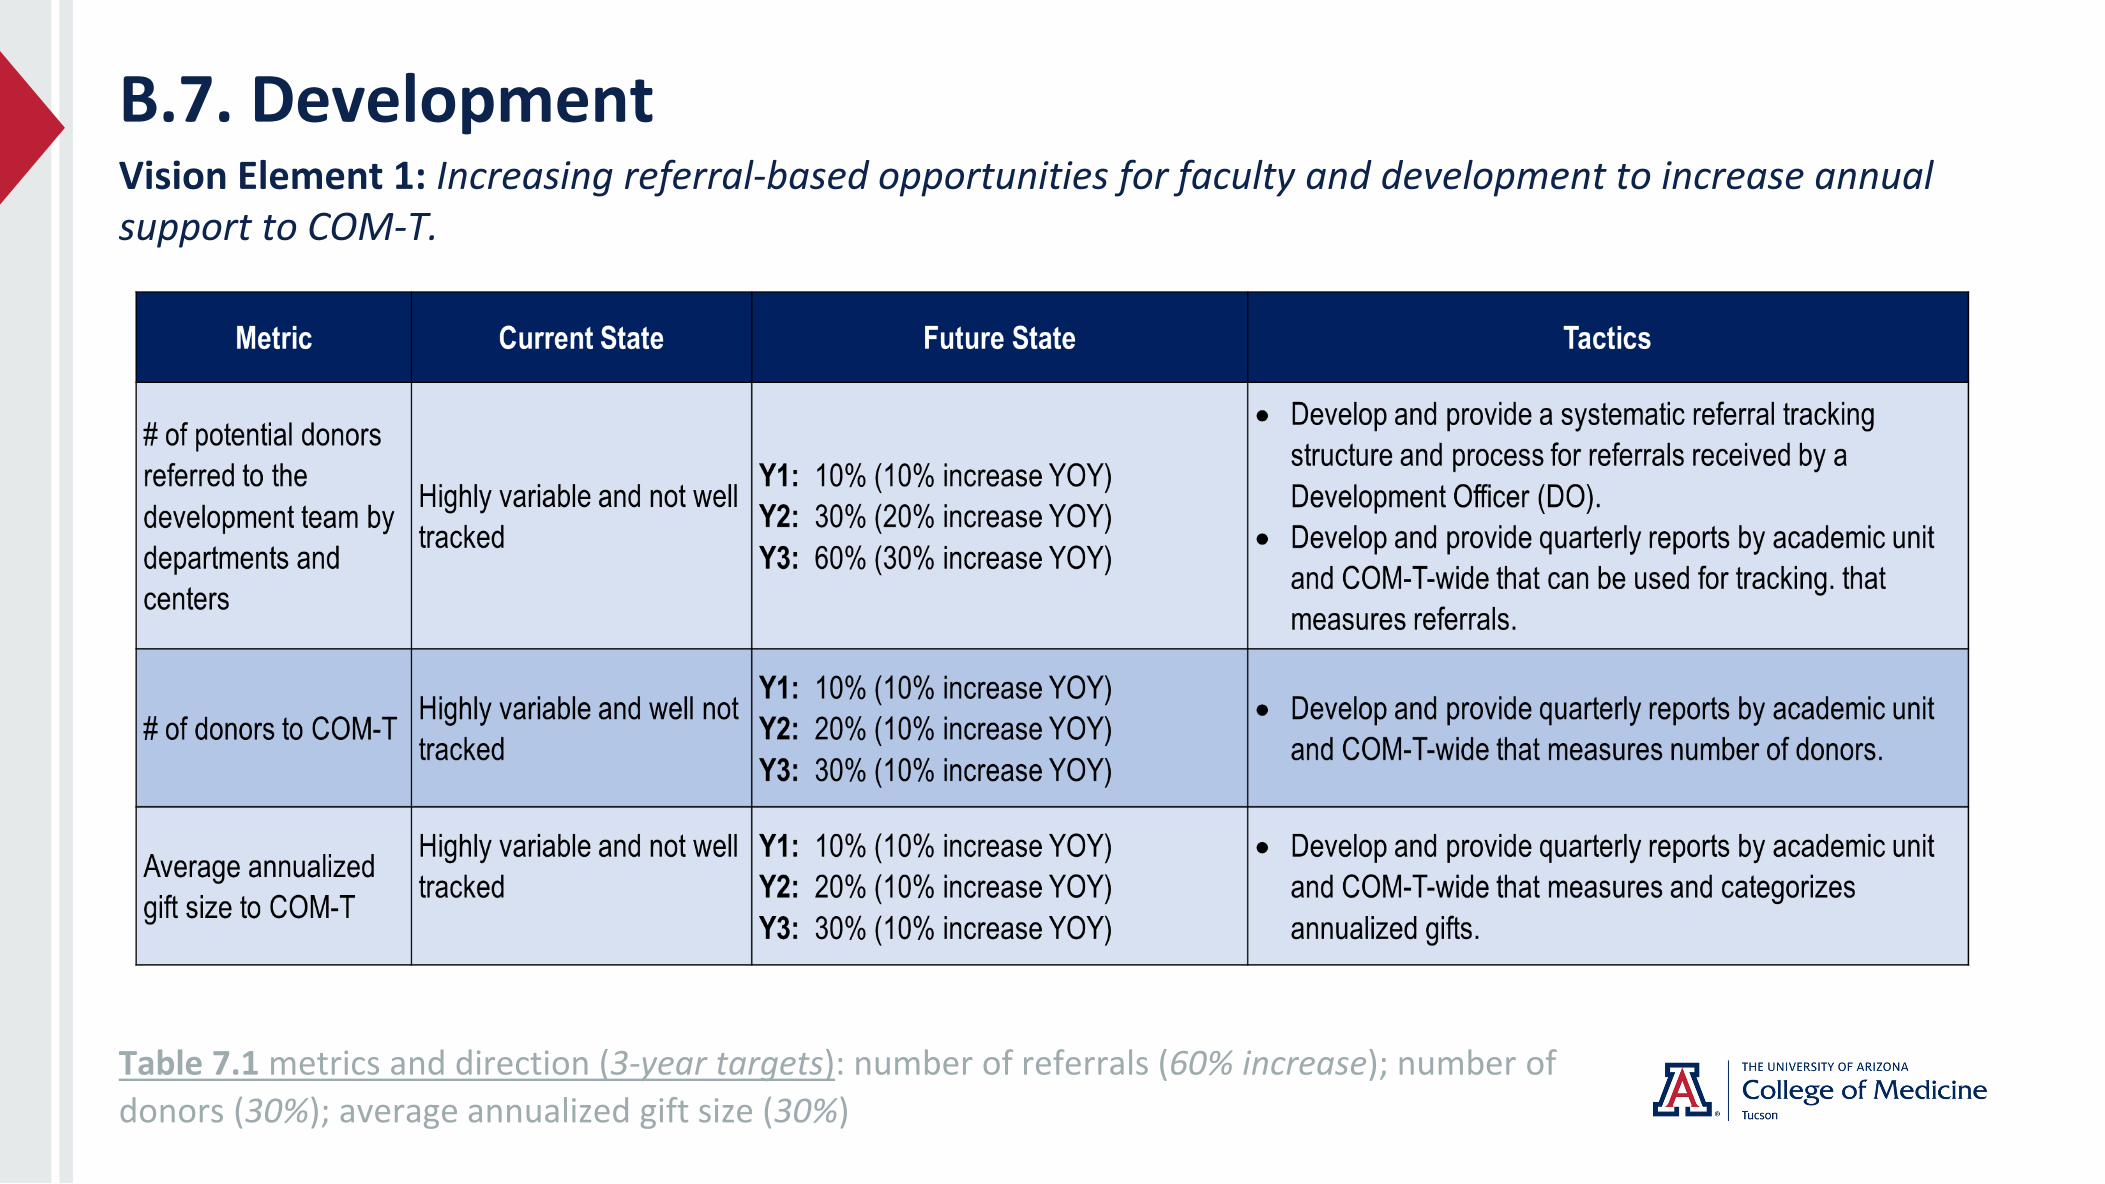
B.7. DevelopmentVision Element 1: Increasing referral-based opportunities for faculty and development to increase annual support to COM-T.
Table 7.1 metrics and direction (3-year targets): number of referrals (60% increase); number of
donors (30%); average annualized gift size (30%)
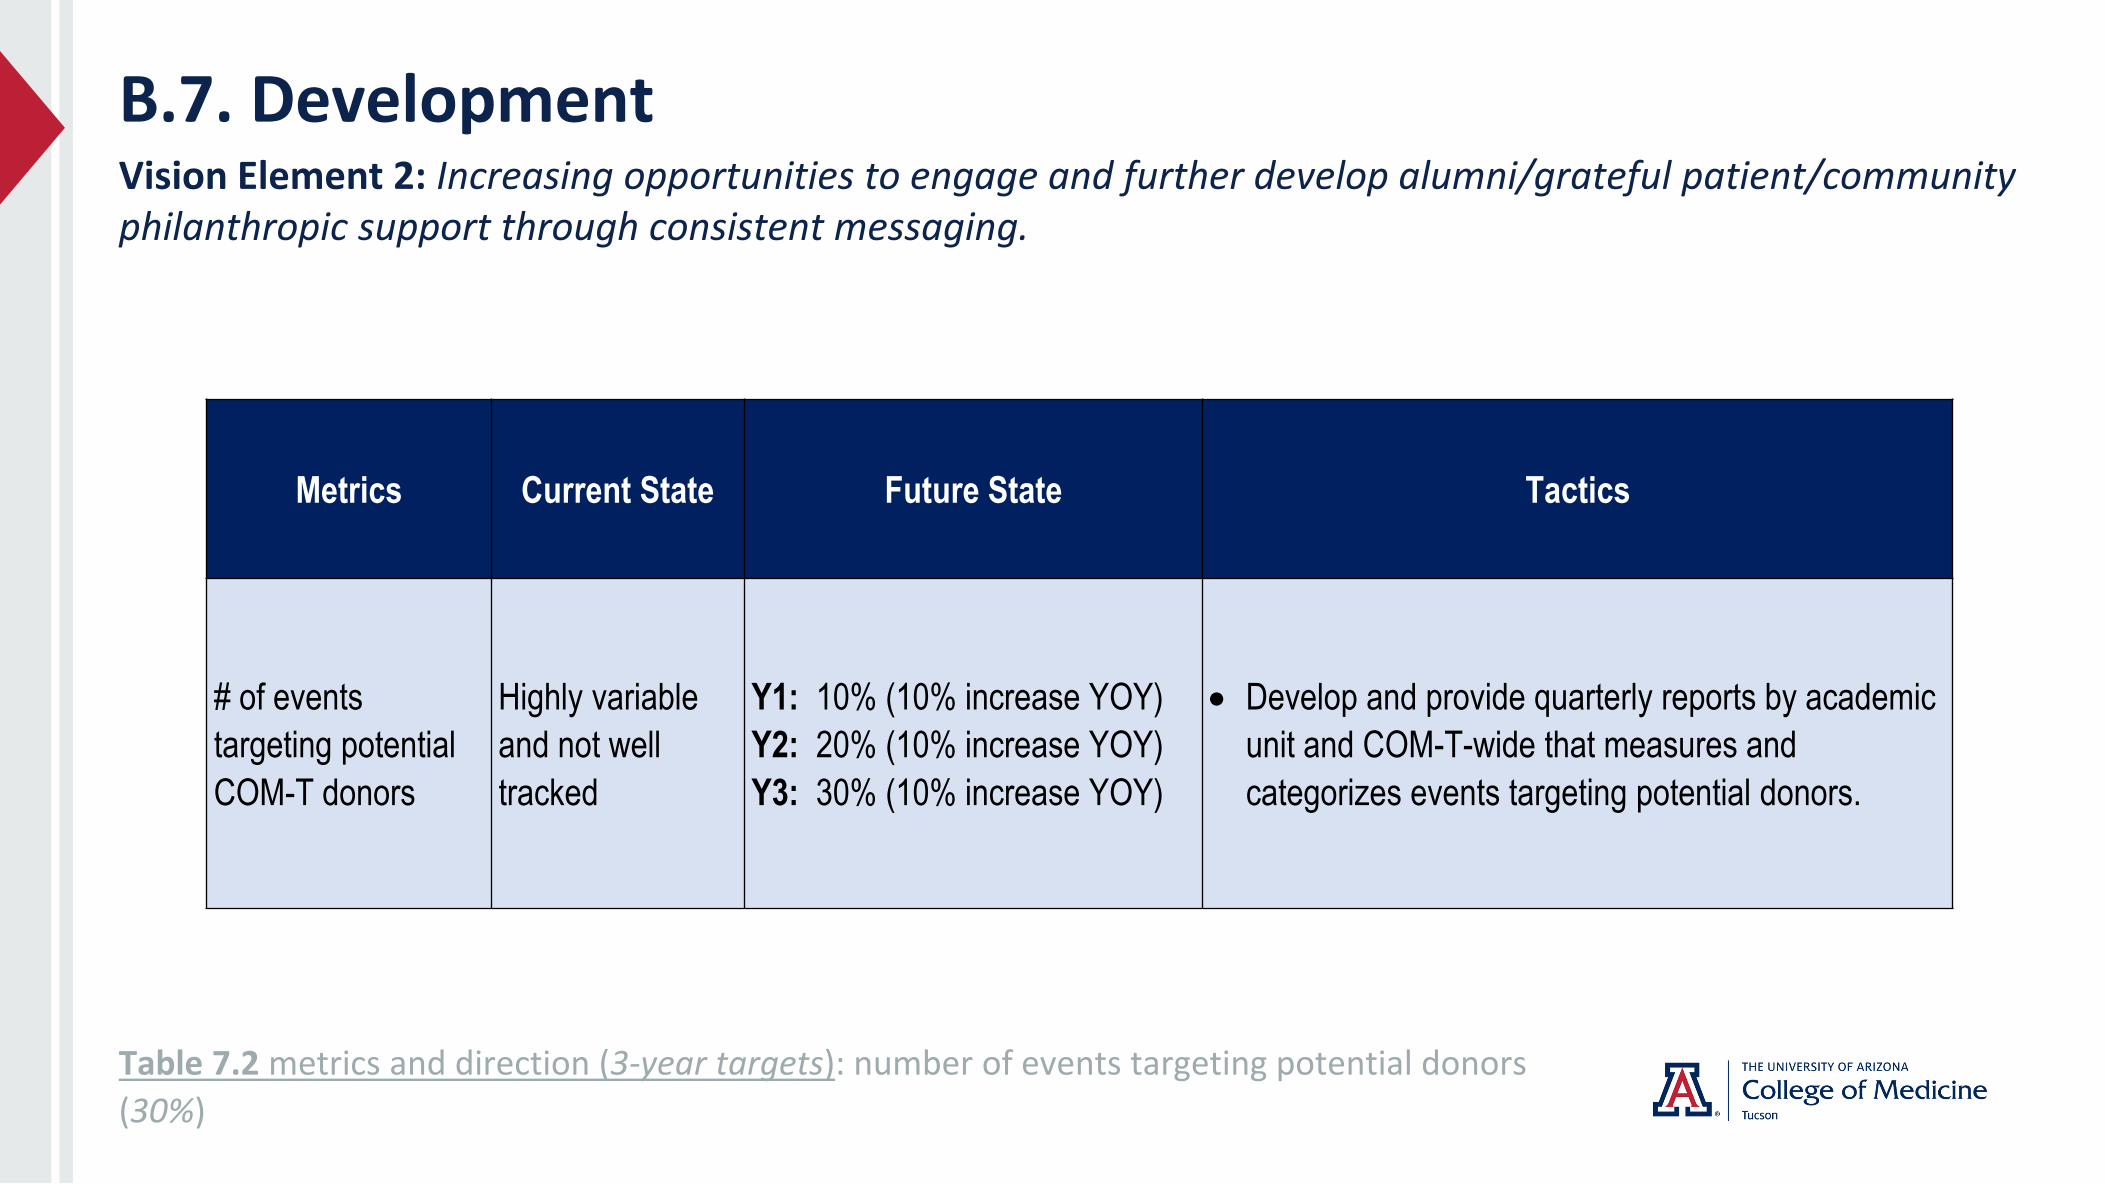
B.7. DevelopmentVision Element 2: Increasing opportunities to engage and further develop alumni/grateful patient/community philanthropic support through consistent messaging.
Table 7.2 metrics and direction (3-year targets): number of events targeting potential donors
(30%)
Metrics Current State Future State Tactics
# of events
targeting potential
COM-T donors
Highly variable
and not well
tracked
Y1: 10% (10% increase YOY)
Y2: 20% (10% increase YOY)
Y3: 30% (10% increase YOY)
• Develop and provide quarterly reports by academic
unit and COM-T-wide that measures and
categorizes events targeting potential donors.

B.7. DevelopmentVision Element 3: Increasing responsiveness and success of development team to departments/centers for referrals through development of database.
Table 7.3 metrics and directions: # days between referral and contact by DO (< 4 days); # of ‘shelf-
ready’ 1-page proposals related to grant applications (increase by 50% YOY).
Metrics Current State Future State Tactics
# of days between
referral of potential
donor by academic unit
to DO, and contact
between DO and
potential donor
Highly variable and not
well tracked
Y1: 10 days
Y2: 7 days
Y3: 4 days
• Develop and provide a systematic referral tracking structure and
process for referrals received by DO.
• Develop and provide quarterly reports by academic unit and
COM-T-wide that can be used for tracking that measures time to
contact.
# of ‘shelf-ready’ 1-
page proposals related
to grant applications
New initiative – no
current data
Y1: # equivalent to 5%
of # of faculty per
academic unit
Y2: 50% increase
Y3: 50% increase
• DO: Develop and provide an inventory (curated repository) of 1-
page proposals by clinical or research area that can be rapidly
accessed when a potential donor expresses interest and/or
passion for a particular clinical or research area.
• Academic unit leader: solicit faculty members to provide 1-page
proposal in lay terms that summarizes the rationale, background,
significance, and approach as well as an approximate budget
that can be accessed by the DO.

The Process – ‘at a glance’
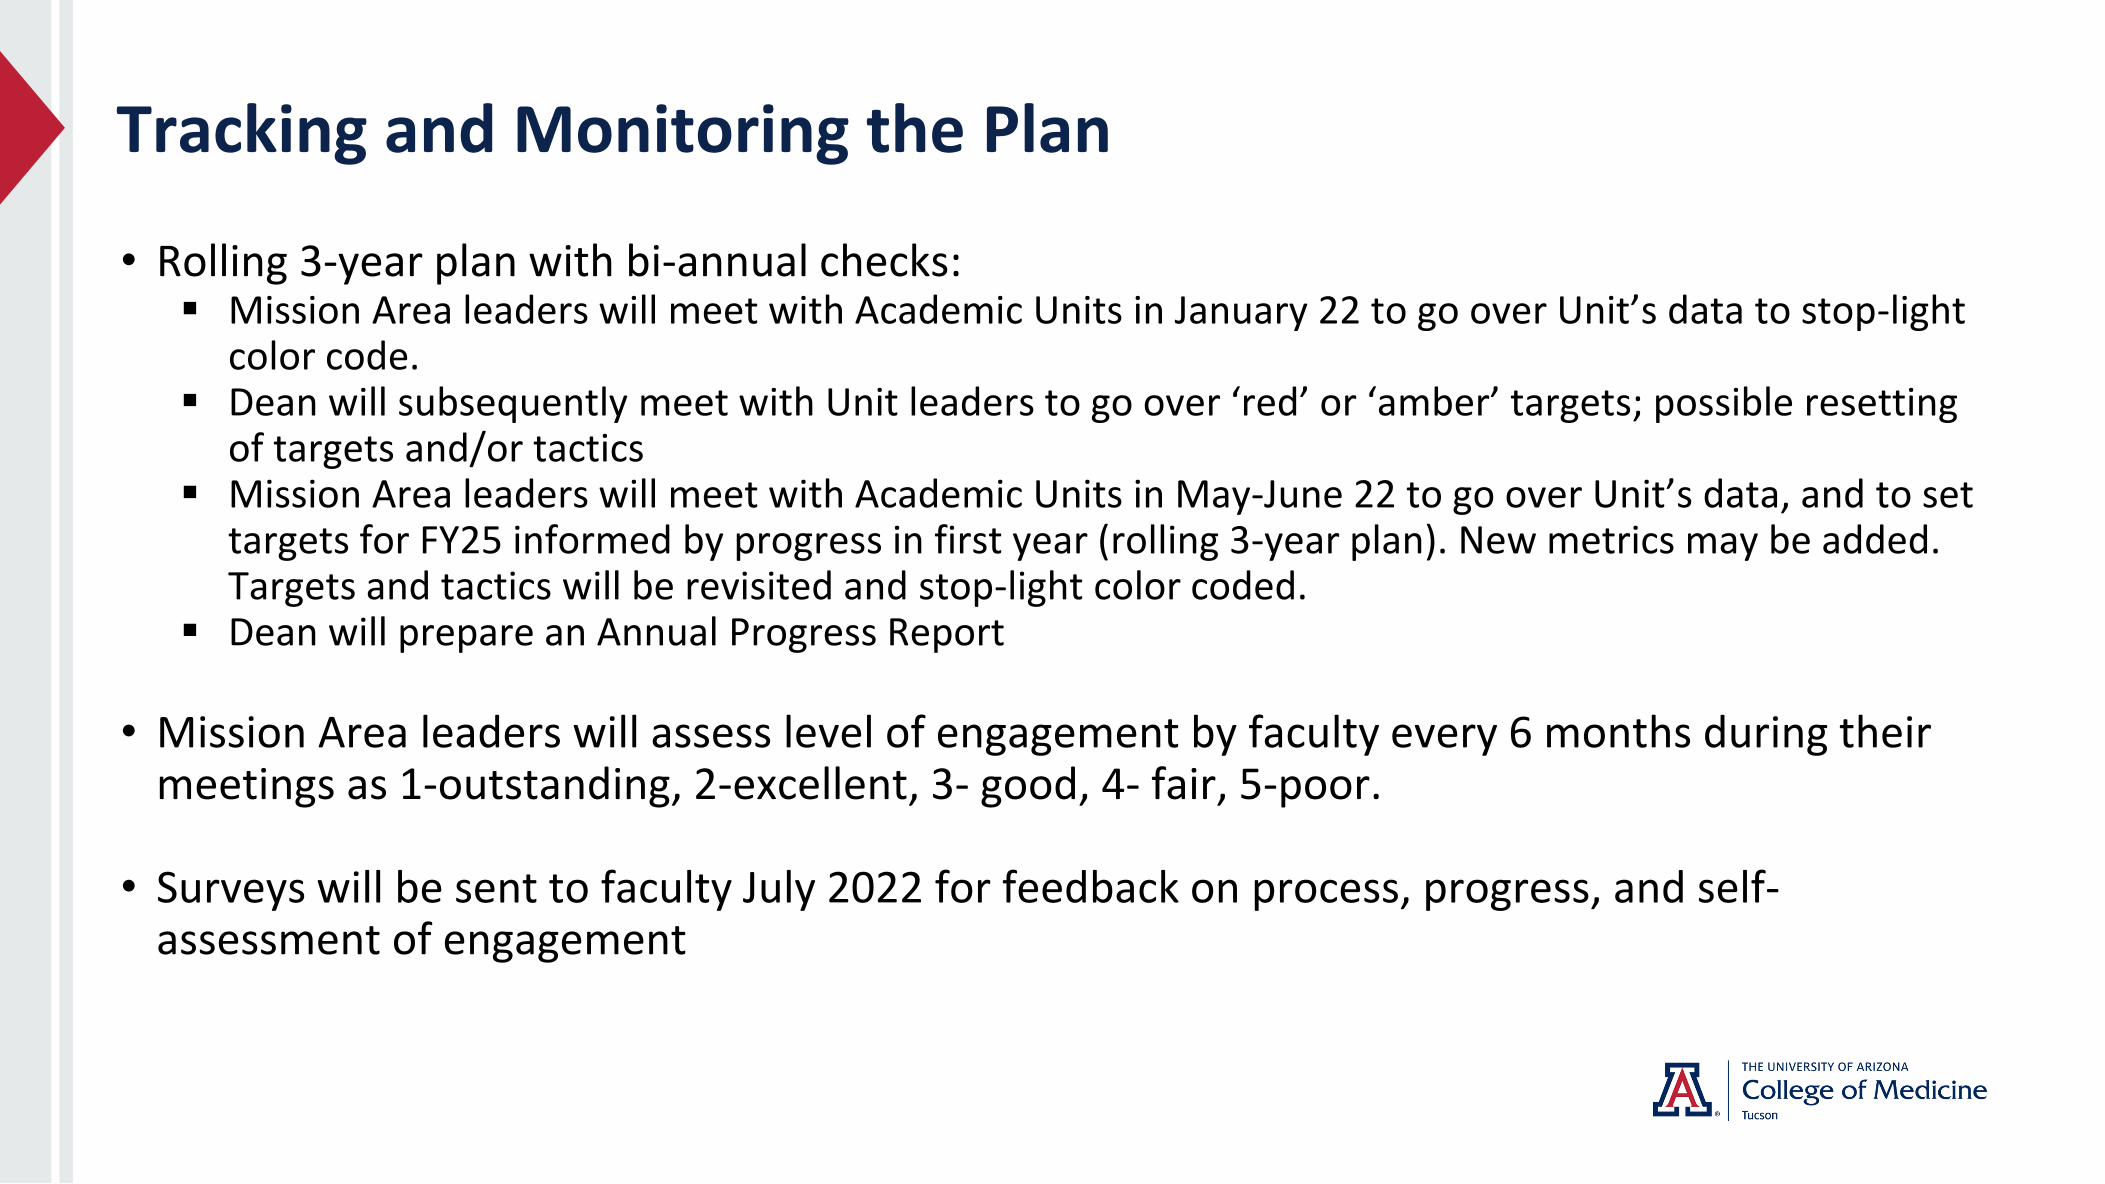
Tracking and Monitoring the Plan
• Rolling 3-year plan with bi-annual checks:▪ Mission Area leaders will meet with Academic Units in January 22 to go over Unit’s data to stop-light
color code.▪ Dean will subsequently meet with Unit leaders to go over ‘red’ or ‘amber’ targets; possible resetting
of targets and/or tactics▪ Mission Area leaders will meet with Academic Units in May-June 22 to go over Unit’s data, and to set
targets for FY25 informed by progress in first year (rolling 3-year plan). New metrics may be added. Targets and tactics will be revisited and stop-light color coded.
▪ Dean will prepare an Annual Progress Report
• Mission Area leaders will assess level of engagement by faculty every 6 months during their meetings as 1-outstanding, 2-excellent, 3- good, 4- fair, 5-poor.
• Surveys will be sent to faculty July 2022 for feedback on process, progress, and self-assessment of engagement
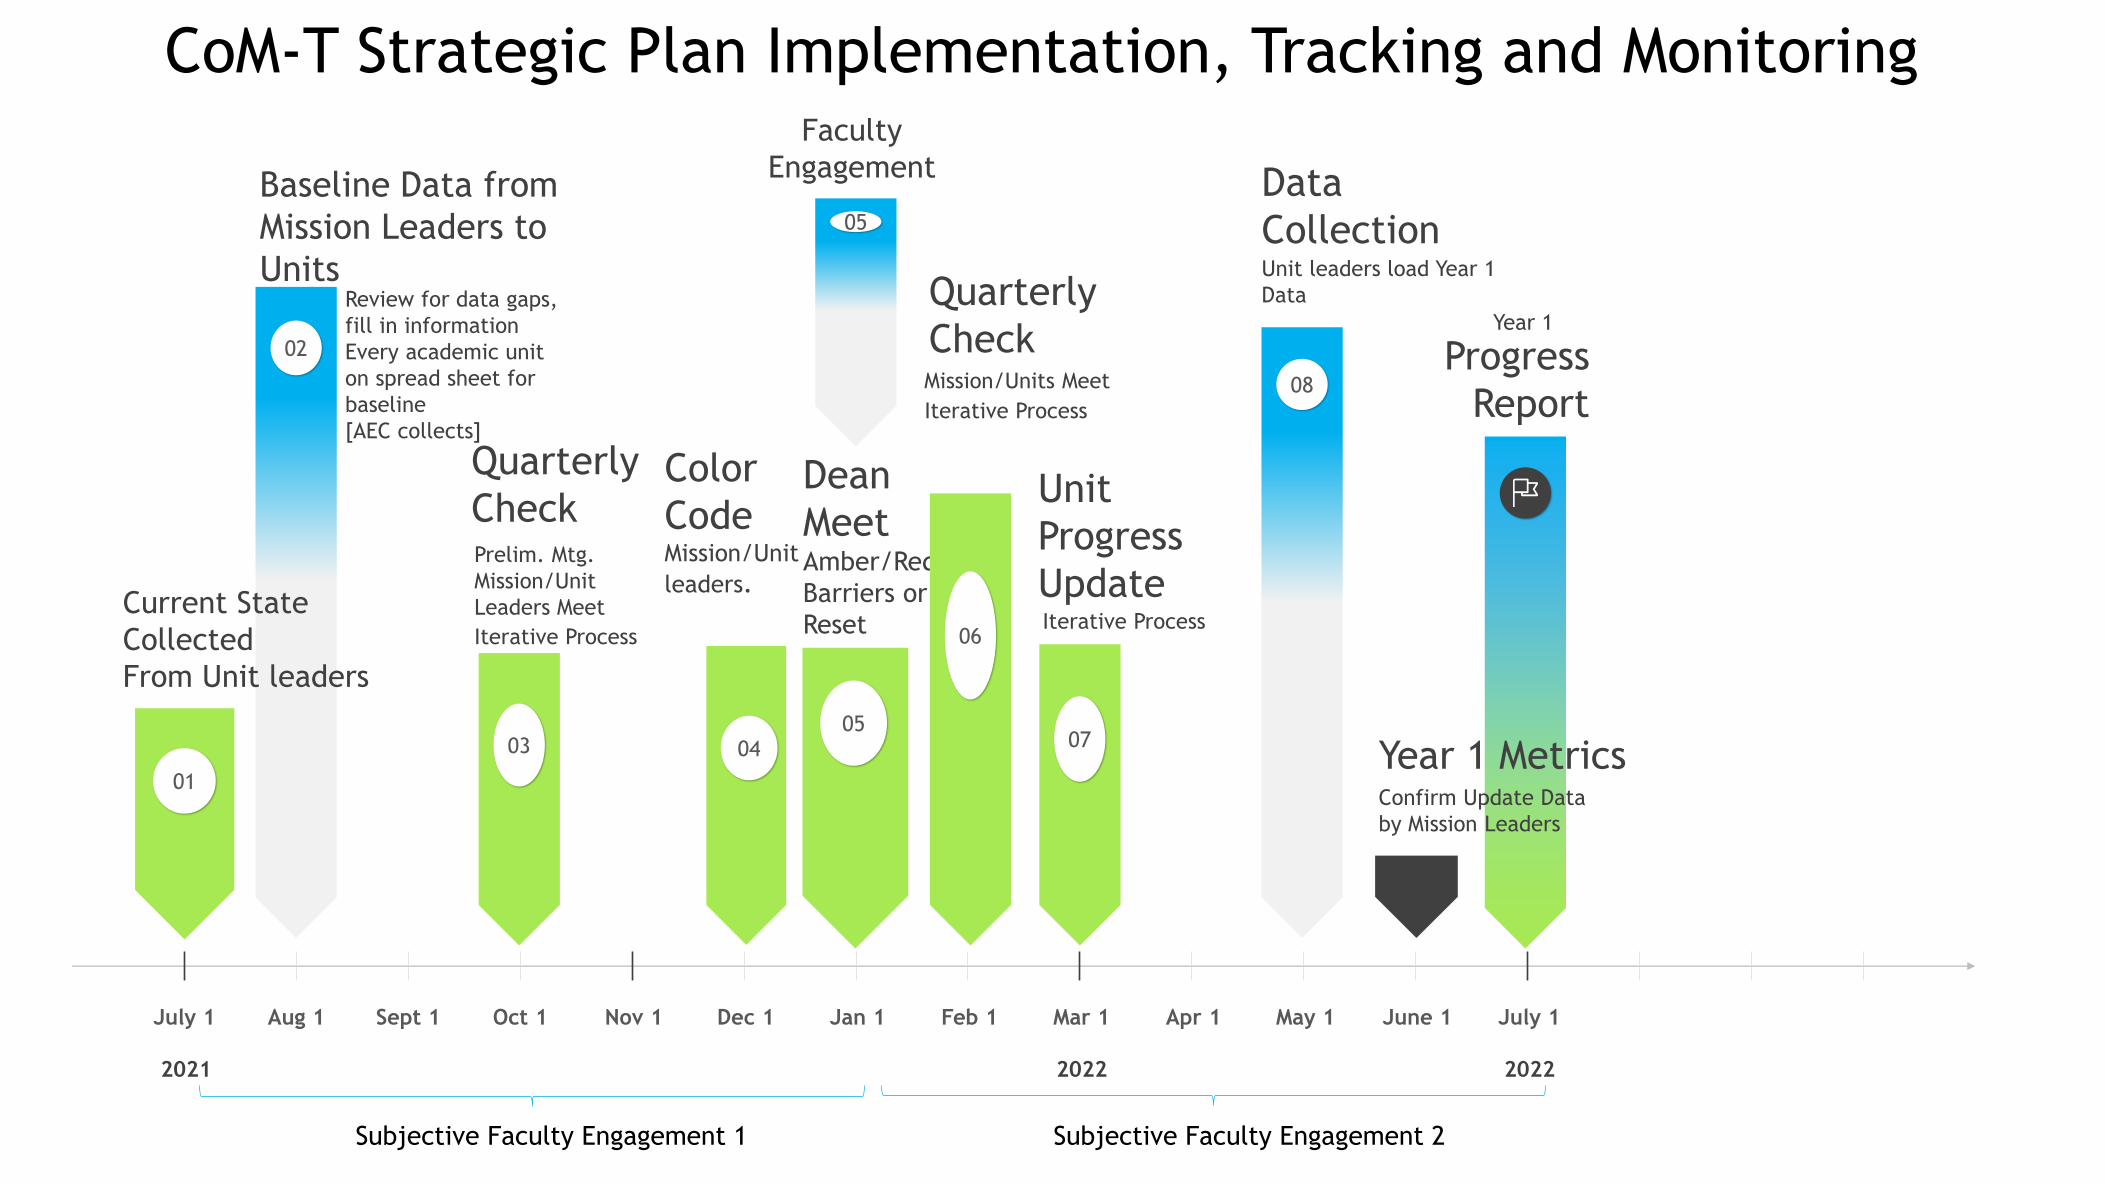
CoM-T Strategic Plan Implementation, Tracking and Monitoring
July 1 Aug 1 Sept 1 Oct 1 Nov 1 Dec 1 Jan 1 Feb 1 Mar 1 Apr 1 May 1 June 1 July 1
2021 2022 2022
02
Baseline Data from
Mission Leaders to
UnitsReview for data gaps,
fill in information
Every academic unit
on spread sheet for
baseline
[AEC collects]
01
Current State
Collected
From Unit leaders
03
Quarterly
CheckPrelim. Mtg.
Mission/Unit
Leaders Meet
Iterative Process
Faculty
Engagement
05
05
08
Data
CollectionUnit leaders load Year 1
Data
07
Unit
Progress
UpdateIterative Process
Progress
Report
Year 1
Year 1 MetricsConfirm Update Data
by Mission Leaders
04
Color
Code Mission/Unit
leaders.
Subjective Faculty Engagement 1
Dean
Meet Amber/Red
Barriers or
Reset
Subjective Faculty Engagement 2
06
Quarterly
CheckMission/Units Meet
Iterative Process
QUESTIONS & DISCUSSION
Related Documents


