Clean and reliable water supplies are essenal to our way of life. All of us—agricultural producers, urbanites, environmentalists, and recreaonalists—depend on it for quality of life, a vibrant economy, and a healthy environment. These are the reasons we call Colorado home, the qualies that aract new Colorado residents, and the drivers of the Colorado Water Plan. Colorado’s water supplies are highly variable, and our demands are growing. Throughout Colorado’s history, and increasingly in recent decades, we have experienced severe drought condions, extreme flooding events, populaon booms, and economic recessions. These extremes oſten reflect larger shiſts that highlight the importance of resilience in our water supplies and thoughul, collaborave planning—the heart of the Colorado Water Plan (Water Plan). The Water Plan provides a framework for developing resilient responses to our water-related challenges. It arculates a vision for collaborave and balanced water soluons led by the Colorado Water Conservaon Board (CWCB) and our grassroots basin roundtable structure. This vision recognizes the evolving nature of water resource planning and implementaon. Following the launch of the Water Plan and Basin Implementaon Plans (BIP) in 2015, the CWCB iniated the process of updang the underlying water supply and demand analyses in 2016, culminang in this report. The work began with the input of Technical Advisory Groups (TAG)—a group of representaves from across the state who provided experse and advice on methods for the next phase of analysis. The resulng “Technical Update” (formerly known as the Statewide Water Supply Iniave or SWSI) establishes a new approach to statewide water analysis and data sharing. The Technical Update and its related insights and tools build on a nearly 15-year legacy of CWCB water supply planning iniaves that began with the first SWSI in 2004. It also leverages a 27-year investment in statewide water modeling efforts, which began in 1992. To that end, this Technical Update provides a significant improvement in the scope, science, and approach to water supply planning (in SWSI I, SWSI II, and SWSI 2010). This approach posions Colorado for a streamlined and robust evaluaon of its future water needs. ANALYSIS & TECHNICAL UPDATE TO THE WATER PLAN COLORADO [EXECUTIVE SUMMARY] Colorado Water Plan Analysis and Technical Update xvi

Welcome message from author
This document is posted to help you gain knowledge. Please leave a comment to let me know what you think about it! Share it to your friends and learn new things together.
Transcript

Clean and reliable water supplies are essential to our way of life. All of us—agricultural producers, urbanites, environmentalists, and recreationalists—depend on it for quality of life, a vibrant economy, and a healthy environment. These are the reasons we call Colorado home, the qualities that attract new Colorado residents, and the drivers of the Colorado Water Plan.
Colorado’s water supplies are highly variable, and our demands are growing. Throughout Colorado’s history, and increasingly in recent decades, we have experienced severe drought conditions, extreme flooding events, population booms, and economic recessions. These extremes often reflect larger shifts that highlight the importance of resilience in our water supplies and thoughtful, collaborative planning—the heart of the Colorado Water Plan (Water Plan).
The Water Plan provides a framework for developing resilient responses to our water-related challenges. It articulates a vision for collaborative and balanced water solutions led by the Colorado Water Conservation Board (CWCB) and our grassroots basin roundtable structure. This vision recognizes the evolving nature of water resource planning and implementation.
Following the launch of the Water Plan and Basin Implementation Plans (BIP) in 2015, the CWCB initiated the process of updating the underlying water supply and demand analyses in 2016, culminating in this report. The work began with the input of Technical Advisory Groups (TAG)—a group of representatives from across the state who provided expertise and advice on methods for the next phase of analysis. The resulting “Technical Update” (formerly known as the Statewide Water Supply Initiative or SWSI) establishes a new approach to statewide water analysis and data sharing.
The Technical Update and its related insights and tools build on a nearly 15-year legacy of CWCB water supply planning initiatives that began with the first SWSI in 2004. It also leverages a 27-year investment in statewide water modeling efforts, which began in 1992. To that end, this Technical Update provides a significant improvement in the scope, science, and approach to water supply planning (in SWSI I, SWSI II, and SWSI 2010). This approach positions Colorado for a streamlined and robust evaluation of its future water needs.
ANALYSIS & TECHNICAL UPDATE TO THE
WATER PLANCOLORADO
[EXECUTIVE SUMMARY]
C o l o r a d o Wa t e r P l a n A n a l y s i s a n d Te c h n i c a l U p d a t e x v i

C o l o r a d o Wa t e r P l a n A n a l y s i s a n d Te c h n i c a l U p d a t e x v i i
The Colorado Water Plan set an adaptive management framework for future water planning activities and described five planning scenarios under which demands, supplies, and gaps were to be estimated. The scenarios included new considerations, such as climate change, that were not a part of prior SWSIs. In addition, the CWCB has continued to work with the Division of Water Resources to develop and refine consumptive use and surface water allocation models that were not ready for use in earlier analyses. As a result of these factors, the Technical Update takes a different and more robust approach to estimating future gaps.
1 CHANGES IN THE APPROACH
The new methodology provides basin roundtables with datasets and tools that can be used to develop enhanced implementation strategies to meet Colorado’s water needs.
The Technical Update estimates future available water supplies and gaps under the five planning scenarios described in the Water Plan. Previous SWSIs were conducted prior to the Water Plan and, therefore, did not consider the scenarios. The scenarios incorporate water supply and demand drivers associated with the potential effects of climate change, population growth, and other factors.
In their BIPs, the basin roundtables cataloged various projects and methods to mitigate future water supply gaps. The Technical Update focuses on developing tools and more detailed datasets to help basin roundtables update their portfolios of projects and methods for meeting future water needs in a targeted manner, with forthcoming updates to their BIPs.
New analysis tools and datasets have been developed since SWSI 2010. Consumptive use and surface water allocation models developed through Colorado’s Decision Support Systems (CDSS) are now available in most river basins. The CDSS tools allow the evaluation of water availability gaps under a variety of hydrologic conditions. Municipal water demand and conservation data are available via HB10-1051 reporting. The availability of these new tools and datasets allows for a more robust approach to assessing future water availability and potential gaps.
New Analysis Needs
New Planning Process
New Models and Data Sets
REFINED OBJECTIVESGiven the new planning concepts described above, the overall objectives of the Technical Update are to:
1. Update and recharacterize future gaps
2. Evaluate environmental and recreational issues with new tools
3. Create user-friendly standardized tools, basin datasets, and information
x v i i i C o l o r a d o Wa t e r P l a n A n a l y s i s a n d Te c h n i c a l U p d a t e
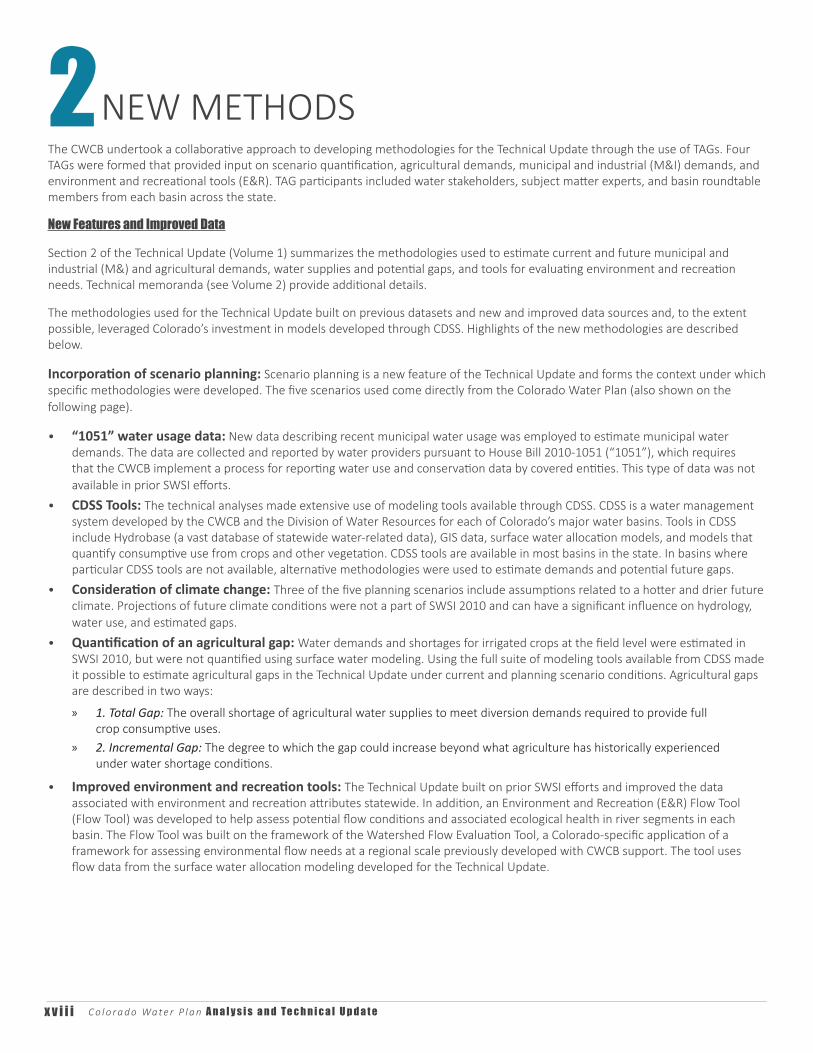
The CWCB undertook a collaborative approach to developing methodologies for the Technical Update through the use of TAGs. Four TAGs were formed that provided input on scenario quantification, agricultural demands, municipal and industrial (M&I) demands, and environment and recreational tools (E&R). TAG participants included water stakeholders, subject matter experts, and basin roundtable members from each basin across the state.
New Features and Improved Data
Section 2 of the Technical Update (Volume 1) summarizes the methodologies used to estimate current and future municipal and industrial (M&) and agricultural demands, water supplies and potential gaps, and tools for evaluating environment and recreation needs. Technical memoranda (see Volume 2) provide additional details.
The methodologies used for the Technical Update built on previous datasets and new and improved data sources and, to the extent possible, leveraged Colorado’s investment in models developed through CDSS. Highlights of the new methodologies are described below.
Incorporation of scenario planning: Scenario planning is a new feature of the Technical Update and forms the context under which specific methodologies were developed. The five scenarios used come directly from the Colorado Water Plan (also shown on the following page).
• “1051” water usage data: New data describing recent municipal water usage was employed to estimate municipal water demands. The data are collected and reported by water providers pursuant to House Bill 2010-1051 (“1051”), which requires that the CWCB implement a process for reporting water use and conservation data by covered entities. This type of data was not available in prior SWSI efforts.
• CDSS Tools: The technical analyses made extensive use of modeling tools available through CDSS. CDSS is a water management system developed by the CWCB and the Division of Water Resources for each of Colorado’s major water basins. Tools in CDSS include Hydrobase (a vast database of statewide water-related data), GIS data, surface water allocation models, and models that quantify consumptive use from crops and other vegetation. CDSS tools are available in most basins in the state. In basins where particular CDSS tools are not available, alternative methodologies were used to estimate demands and potential future gaps.
• Consideration of climate change: Three of the five planning scenarios include assumptions related to a hotter and drier future climate. Projections of future climate conditions were not a part of SWSI 2010 and can have a significant influence on hydrology, water use, and estimated gaps.
• Quantification of an agricultural gap: Water demands and shortages for irrigated crops at the field level were estimated in SWSI 2010, but were not quantified using surface water modeling. Using the full suite of modeling tools available from CDSS made it possible to estimate agricultural gaps in the Technical Update under current and planning scenario conditions. Agricultural gaps are described in two ways:
» 1. Total Gap: The overall shortage of agricultural water supplies to meet diversion demands required to provide full crop consumptive uses.
» 2. Incremental Gap: The degree to which the gap could increase beyond what agriculture has historically experienced under water shortage conditions.
• Improved environment and recreation tools: The Technical Update built on prior SWSI efforts and improved the data associated with environment and recreation attributes statewide. In addition, an Environment and Recreation (E&R) Flow Tool (Flow Tool) was developed to help assess potential flow conditions and associated ecological health in river segments in each basin. The Flow Tool was built on the framework of the Watershed Flow Evaluation Tool, a Colorado-specific application of a framework for assessing environmental flow needs at a regional scale previously developed with CWCB support. The tool uses flow data from the surface water allocation modeling developed for the Technical Update.
2 NEW METHODS

C o l o r a d o Wa t e r P l a n A n a l y s i s a n d Te c h n i c a l U p d a t e x i x
Figure ES.1 CWP Planning Scenarios Key Drivers Graphical Summary
A. Business as Usual B. Weak Economy C. Cooperative Growth D. Adaptive Innovation E. Hot GrowthRecent trends continue into the future. Few unanticipated events occur. The economy goes through regular economic cycles but grows over time. By 2050, Colorado’s population is expected to be close to 9 million. Single-family homes dominate, but there is a slow increase of denser developments in large urban areas. Social values and regulations remain the same, but streamflows and water supplies show increased stress. Regulations are not well coordinated and create increasing uncertainty for local planners and water managers. Willingness to pay for social and environmental mitigation of new water development slowly increases. Municipal water conservation efforts slowly increase. Oil-shale development continues to be researched as an option. Large portions of agricultural land around cities are developed by 2050. Transfer of water from agriculture to urban uses continues. Efforts to mitigate the effects of the transfers slowly increase. Agricultural economics continue to be viable, but agricultural water use continues to decline. The climate is similar to the observed conditions of the 20th century.
The world’s economy struggles, and the state’s economy is slow to improve. Population growth is lower than currently projected, which is slowing the conversion of agricultural land to housing. The maintenance of infrastructure, including water facilities, becomes difficult to fund. Many sectors of the state’s economy, including most water users and water-dependent businesses, begin to struggle financially. There is little change in social values, levels of water conservation, urban land use patterns, and environmental regulations. Regulations are not well coordinated and create increasing uncertainty for local planners and water managers. Willingness to pay for social and environmental mitigation decreases due to economic concerns. Greenhouse gas emissions do not grow as much as currently projected, and the climate is similar to the 20th century observed conditions.
Environmental stewardship becomes the norm. Broad alliances form to provide for more integrated and efficient planning and development. Population growth is consistent with current forecasts. Mass transportation planning concentrates more development in urban centers and in mountain resort communities, thereby slowing the loss of agricultural land and reducing the strain on natural resources compared to traditional development. Coloradans embrace water and energy conservation. New water-saving technologies emerge. Eco-tourism thrives. Water development controls are more restrictive and require both high water-use efficiency and environmental and recreational benefits. Environmental regulations are more protective, and include efforts to re-operate water supply projects to reduce effects. Demand for more water-efficient foods reduces water use. There is a moderate warming of the climate, which results in increased water use in all sectors, in turn affecting streamflows and supplies. This dynamic reinforces the social value of widespread water efficiency and increased environmental protection.
A much warmer climate causes major environmental problems globally and locally. Social attitudes shift to a shared responsibility to address problems. Technological innovation becomes the dominant solution. Strong investments in research lead to breakthrough efficiencies in the use of natural resources, including water. Renewable and clean energy become dominant. Colorado is a research hub and has a strong economy. The relatively cooler weather in Colorado (due to its higher elevation) and the high-tech job market cause population to grow faster than currently projected. The warmer climate increases demand for irrigation water in agriculture and municipal uses, but innovative technology mitigates the increased demand. The warmer climate reduces global food production, which increases the market for local agriculture and food imports to Colorado. More food is bought locally, which increases local food prices and reduces the loss of agricultural land to urban development. Higher water efficiency helps maintain streamflows, even as water supplies decline. Regulations are well defined, and permitting outcomes are predictable and expedited. The environment declines and shifts to becoming habitat for warmer-weather species. Droughts and floods become more extreme. More compact urban development occurs through innovations in mass transit.
A vibrant economy fuels population growth and development throughout the state. Regulations are relaxed in favor of flexibility to promote and pursue business development. A much warmer global climate brings more people to Colorado with its relatively cooler climate. Families prefer low-density housing, and many seek rural properties, ranchettes, and mountain living. Agricultural and other open lands are rapidly developed. A hotter climate decreases global food production. Worldwide demand for agricultural products rises, which greatly increases food prices. Hot and dry conditions lead to a decline in streamflows and water supplies. The environment degrades and shifts to becoming habitat for species adapted to warmer waters and climate. Droughts and floods become more extreme. Communities struggle unilaterally to provide services needed to accommodate rapid business and population growth. Fossil fuel is the dominant energy source, and there is large production of oil shale, coal, natural gas, and oil in the state.
A Business as Usual B Weak Economy C Cooperative Growth D Adaptive Innovation E Hot Growth
Wat
erSu
pply
Wat
erSu
pply
Wat
erSu
pply
Wat
erSu
pply
Wat
erSu
pply
Clim
ate
Stat
us
Clim
ate
Stat
us
Clim
ate
Stat
us
Clim
ate
Stat
us
Clim
ate
Stat
us
Soci
al
Valu
es
Soci
al
Valu
es So
cial
Va
lues
Soci
al
Valu
es
Soci
al
Valu
es
Agri.
Nee
ds
Agri.
Nee
ds
Agri.
Nee
ds
Agri.
Nee
ds
Agri.
Nee
ds
M&
IN
eeds
M&
IN
eeds
M&
IN
eeds
M&
IN
eeds
M&
IN
eeds

x x C o l o r a d o Wa t e r P l a n A n a l y s i s a n d Te c h n i c a l U p d a t e
Statewide gaps may vary substantially, depending on future climate conditions and population increases, which underscores the need to take an adaptive approach to developing water management strategies and projects and methods to fill potential future gaps (see figure ES.2).
• Agriculture currently experiences a gap, and it is projected to increase statewide. Increases may be modest under the Business as Usual and Weak Economy scenarios but may be more substantial under scenarios that assume a hotter and drier future climate (the Cooperative Growth, Adaptive Innovation, and Hot Growth scenarios) due to decreasing supply and increasing crop irrigation requirements.
• M&I users do not currently experience a gap, but a growing population and potential impacts from climate change are projected to create gaps. Projected M&I gaps vary based on assumptions regarding future population and climate conditions but may be reduced by conservation measures.
• E&R gaps were not directly quantified but tools were developed to help evaluate potential risks that impact aquatic habitat, species and boating due to flow conditions. These potential future risks are documented in various sections of the Technical Update but are not a part of the gap estimates below.
3 REVISITING THE GAPS
Figure ES.2 Summary of Statewide Gap Estimates by Planning Scenario
THE TECHNICAL UPDATECOMPARING THE 2015 WATER PLAN GAP NUMBERS TO GAPS IN
SIMILAR GAPS. ABSENT PROJECTS. LOWER POPULATION. LOWER DEMANDS.
0
500,000
1,000,000
1,500,000
2,000,000
2,500,000
3,000,000
3,500,000
4,000,000
4,500,000
Baseline Business as Usual Weak Economy CooperativeGrowth
AdaptiveInnovation
Hot Growth
Acre
-feet
per
Yea
r
Baseline Ag Gap
Incremental Ag Gap
M&I Gap

Gaps Across Scenarios
THE TECHNICAL UPDATECOMPARING THE 2015 WATER PLAN GAP NUMBERS TO GAPS IN
Gaps Absent Projects
Gaps: Max, Average & Incremental Gaps are shown in a manner that reflects the difference in how M&I and agriculture plan in any given year. Feedback on earlier studies suggested that agriculture gaps may have been overstated because many agricultural producers live with annual shortages (especially in over-appropriated basins).
To address this, agricultural gaps are expressed in terms of averageand incremental gaps—the degree to which gaps may increase in the future. Maximum agricultural gaps can also be found in the Technical Update results. At the same time, M&I gaps are primarily expressed in terms of maximums, which is consistent with firm yield planning.
Gap Mitigation
Gap Influences
190,000 - 630,000 AFY 2050 M&I GAP
250,000 - 750,000 AFY 2050 M&I GAP
23,000 - 1,053,000 AFY 2050 INCREMENTAL AG GAP
1,722,000 AFY 2050 AG SHORTAGE
GAPS SHOWN IN THE 2015 WATER PLAN
12
5
3
4
Gap projections in the Technical Update do not include estimates of basin-identified project yields. This is primarily due to a lack of specific project data that would allow projects to be modeled. Forthcoming basin plan updates will reevaluate projects and consider strategies to address gaps.
Unlike past projections that estimated high, medium and low gaps at 2050, the Technical Update identifies 2050 gaps for each of the Water Plan's five scenarios.
Some of the main drivers (population, climate) and assumptions (storage operations) heavily influence the gaps in the Technical Update. Population projections, while lower than in previous analyses, remain a major driver of demands. Climate change is included in three of the five scenarios, which drives irrigation, streamflow and storage timing. Modeled storage operations maximize the use of stored water to meet demands and lower gaps.
When basins reevaluate plans it will be important to evaluate core projects that represent low-regret actions to meet future needs under any scenario. The Adaptive Innovation scenario, for example, illustrates how adaptive actions (e.g. efficiency) can help offset impacts from climate change and population growth.
SIMILAR GAPS. ABSENT PROJECTS. LOWER POPULATION. LOWER DEMANDS.
SIGN OF SUCCESSThe statewide baseline per capita systemwide municipal demand has decreased from 172 gpcd ito nearly 164 gpcd. That represents about a 5 percent reduction in demands between 2008 and 2015.
SIGN OF CONCERNScenarios with moderate and significant climate impacts show shifts to earlier runoff seasons which will likely impact storage, irrigation, and streamflows.
GAPS SHOWN IN THE 2019 TECHNICAL UPDATE
The Colorado Water Plan identifies that up to 700,000 acres of agriculture could come out of production if agricultural transfers (“buy and dry”) are exclusively used to meet future M&I demands. Because the Technical Update did not quantify basin projects, roundtables will evaluate how gaps should be met in the forthcoming basin plan updates. The Technical Update indicates that where municipal boundaries expand, agriculture is likely to be lost. This urbanization could result in the loss of more than 152,400 irrigated acres. Additionally, stakeholders identified that planned agricultural to M&I water transfers could result in a loss of up to 76,000 acres of agriculture in the South Platte and Arkansas basins alone.
AGRICULTURAL IMPACTS !
C o l o r a d o Wa t e r P l a n A n a l y s i s a n d Te c h n i c a l U p d a t e x x i
0
500,000
1,000,000
1,500,000
2,000,000
2,500,000
3,000,000
3,500,000
4,000,000
4,500,000
Baseline Business as Usual Weak Economy CooperativeGrowth
AdaptiveInnovation
Hot Growth
Acre
-feet
per
Yea
r
Baseline Ag Gap
Incremental Ag Gap
M&I Gap

x x i i C o l o r a d o Wa t e r P l a n A n a l y s i s a n d Te c h n i c a l U p d a t e
Agricultural Environmental and Recreational Municipal and Industrial
• Agriculture currently experiences gaps, and gaps may increase in the future if climate conditions are hotter (which increases irrigation water demand) and supplies diminish (due to drier hydrology).
• Irrigated acreage is projected to decrease in most basins due to urbanization, planned agricultural- to-municipal water transfers, and groundwater sustainability issues.
• Gaps under the Adaptive Innovation scenario are significantly less than Hot Growth despite similar assumptions related to future climate conditions, which demonstrates the potential benefits of higher system efficiencies and emerging technologies that could reduce consumptive use; however, in return flow driven systems, conservation in one area could impact water supplies downstream, so thoughtful approaches are necessary.
• Climate change and its impact on streamflow will be a primary driver of risk to E&R assets.
• Projected future stream flow hydro- graphs in most locations across the state show earlier peaks and potentially drier conditions in the late summer months under scenarios with climate change.
• Drier conditions in late summer months could increase risk to coldwater and warmwater fish due to higher water temperatures and reduced habitat. The degree of increased risk is related to the level of stream flow decline.
• Instream flow rights and recreational in-channel diversion water rights may be met less often in climate-impacted scenarios.
• Municipal and industrial users do not currently experience a gap, but increasing population and potentially hotter and drier future climate conditions will create a need for additional supply despite efforts to conserve water.
• Conservation efforts, however, can create significant future benefits in lowering the gap, as demonstrated by comparing the Adaptive Innovation and Hot Growth scenarios (which have similar assumptions on population and climate).
4 KEY RESULTSThe Technical Update generated a rich dataset throughout Colorado that describes agricultural and M&I water demands, potential gaps, and available water supply under current conditions and under each of the five planning scenarios. The data and results are provided for basin roundtables and others to use for water planning purposes.
Key results and findings of the Technical Update pertaining to statewide agricultural and M&I demands and gaps, as well as findings related to environment and recreation attributes in potential future conditions, are summarized below.
Summary of Key Statewide Results
BASIN MODELING
CDSS surface water allocation models (StateMod) were used in basins where they are available to evaluate streamflows and gaps. Baseline data sets were used to assess available water supplies under current conditions; these data sets were modified to estimate future water supplies in the planning scenarious. In basins where the CDSS program has not been fully implemented, the methodology was modified using available tools and water supply information, such as historical streamflow data.
CDSS Basins with Baseline and Historical StateMod Datasets
CDSS Basins with only Historical StateMod Datasets
CDSS Basins with no CDSS StateMod Datasets
Figure ES.3 Map of CDSS Model Availability by Basin

[An overview of each of these areas is provided on the following pages.]
C o l o r a d o Wa t e r P l a n A n a l y s i s a n d Te c h n i c a l U p d a t e x x i i i

Agricultural Diversion DemandsAgricultur diversion demand represents the amount of water that would need to be diverted or pumped to meet the full crop irrigation water requirement (IWR) or full crop consumptive use. The diversion demand does not reflect historical irrigation supplies because irrigators often operate under water short conditions and do not have enough supply to fully irrigate their crops.
Current statewide total agricultural diversion demand is approximately 13 million acre-feet (AF), with more than 80 percent of that demand attributable to surface water supplies (though groundwater is the primary source of supply in some basins). The South Platte, Arkansas, Gunnison, and Rio Grande basins have the highest demands for irrigation diversions.
Future agricultural diversion demands will be affected by urbanization, planned agricultural projects that add irrigated acreage, aquifer sustainability, and climate change. Emerging technologies that increase system efficiency and/or reduce crop consumptive use of water may reduce water supply shortages and potentially reduce the amount of water diverted or pumped.
Future statewide agricultural diversion demand estimates range from 10 million AF in the Adaptive Innovation scenario to 13.5 million AF in the Hot Growth scenario. Urbanization, transfers of agricultural water to municipalities, and declining aquifer levels are projected to cause reductions in irrigated lands across the state (in some basins more than others), leading to reduced overall diversion demand compared to current demand. In scenarios that assume a hotter and drier climate, the impact of acreage loss on diversion demand could be offset by higher crop water requirements, which could lead to an overall increase in demands (see the Cooperative Growth and Hot Growth scenarios). The Adaptive Innovation scenario has the lowest statewide agricultural diversion demand due to assumptions of higher system efficiencies and emerging technologies that reduce crop water demands.
Figure ES.4 Current Average Annual Agricultural Diversion Demand by Basin
Figure ES.5 Future Statewide Average Annual Agricultural Diversion Demand Estimates for Planning Scenarios
0
500,000
1,000,000
1,500,000
2,000,000
2,500,000
3,000,000
Arkansas Colorado Gunnison NorthPlatte
RepublicanRio Grande SouthPlatte
Southwest White YampaAn
nual
Dem
and
(acr
e-fe
et)
Wet Year Demand
Average Year Demand
Dry Year Demand
Average IWR
0
2,000,000
4,000,000
6,000,000
8,000,000
10,000,000
12,000,000
14,000,000
16,000,000
Current Business asUsual
WeakEconomy
CooperativeGrowth
AdaptiveInnovation
Hot Growth
Acre
-Fee
t
Average IWR Wet Year Demand Average Year Demand Dry Year Demand
C o l o r a d o Wa t e r P l a n A n a l y s i s a n d Te c h n i c a l U p d a t e x x i v

C o l o r a d o Wa t e r P l a n A n a l y s i s a n d Te c h n i c a l U p d a t e x x v
Agricultural diversion demands statewide are projected to decrease in three of the five scenarios by up to 9 percent compared to current conditions. In Adaptive Innovation, decreased demand from loss of irrigated lands will be offset, in part, by climate-driven irrigation demand increases; however, increased efficiency and decreased consumptive use show a 20 percent reduction in diversion demands. In Hot Growth, irrigated lands are projected to be lost, but climate change could more than offset that loss, resulting in an overall 5 percent increase in diversion demands.
Demand for groundwater is approximately 19 percent of the overall demand. Groundwater demands occur primarily in the Arkansas, Republican, Rio Grande, and South Platte basins where irrigation from wells is prominent.
Based on known agricultural water transfers currently in water court or deemed to be highly likely by agricultural stakeholders, the estimates of planned buy and dry gransfers in the Technical Update (33,000 - 76,000 acres) are almost three times higher on the upper end than the data that informed the Water Plan (26,200 acres).
On average, approximately 80 percent of the overall agricultural diversion demand is currently met (and 20 percent is unmet) on a statewide basis, though this varies in each basin.
TECHNICAL UPDATE / AGRICULTURAL FINDINGS
20%
3 X19%
In all basins where significant agriculture comes out of production, diversion demands will go down due to the decrease in irrigation even as the plant demand for irrigation (were those lands to be irrigated) increases.
UNMETDEMAND
The Colorado Water Plan identifies that up to 700,000 acres of agriculture could come out of production if agricultural transfers (buy and dry) are used to meet future M&I demands. Because the Technical Update did not re-quantify basin projects, roundtables will need to evaluate how gaps could and should be met when updating projects (and project data). The Technical Update does indicate that where municipal boundaries expand, agriculture is likely to be lost. This urbanization could result in the loss of 152,400 irrigated acres.
700K ACRE LOSSSTILL POSSIBLE

M&I Diversion DemandsCurrent and future diversion demands for municipal water users are driven by population and water usage rates. Population estimates were based on State Demography Office (SDO) projections and adjusted upward or downward (depending on the scenario) based on historical growth statistics. The current population statewide is 5.7 million people and is projected to grow to 8.5 million by the year 2050 according to the SDO. High and low statewide projections developed for the Technical Update range from 7.7 million to 9.3 million people.
The statewide baseline per capita systemwide demand has decreased from 172 gallons per capita per day (gallons per capita per day) in SWSI 2010 to approximately 164 gpcd, which is nearly a 5 percent reduction in demand between 2008 and 2015. The reduction is associated with improved data availability, conservation efforts, and ongoing behavioral changes. Projected future per capita demands vary from 143 to 169 gpcd (see Figure ES.6), depending on the scenario. Scenario assumptions can create offsetting factors. For example, projected decreases in outdoor demand resulting from implementation of conservation measures in some scenarios was offset by increases in outdoor demand due to climate change.
Total statewide municipal diversion demands are shown in Figure ES.7, along with population projections. In general, overall municipal demands are projected to increase and generally in proportion to population increases; however, in Adaptive Innovation, projected municipal demands are similar to the Business as Usual demands despite the increased population projections and hotter and drier climate assumed for Adaptive Innovation, which demonstrates the potential benefits of increased water conservation measures.
Statewide baseline SSI water demands are comprised of four major industrial uses. Baseline and projected SSI demands for all planning scenarios were calculated. With the exception of Hot Growth, the updated projections for all planning scenarios were below SWSI 2010 estimates, primarily due to changes in assumptions for thermoelectric demands related to regulations that require an increase in power generation from renewable sources.
Figure ES.6 Statewide per Capita Demand for Five Planning Scenarios
Figure ES.7 Statewide Baseline and Projected Population and Municipal Demands
51.8 45.4 46.0 40.4 36.5 44.1
32.0 31.6 30.7
29.4 29.3
32.8
34.4 34.9 33.6
34.2 34.2
42.5
25.7 26.0 25.3
25.3 25.1
31.1
19.7 18.8 19.7
19.0 18.1
18.9
163.7 156.8 155.2
148.2 143.2
169.4
-
20.0
40.0
60.0
80.0
100.0
120.0
140.0
160.0
180.0
Baseline(2015)
Business asUsual
WeakEconomy
CooperativeGrowth
AdaptiveInnovation
Hot Growth
Per C
apita
Dem
and
(gpc
d)
Residential Indoor Non-Residential IndoorResidential Outdoor Non-Residential Outdoor
-
1,000,000
2,000,000
3,000,000
4,000,000
5,000,000
6,000,000
7,000,000
8,000,000
9,000,000
10,000,000
-
200,000
400,000
600,000
800,000
1,000,000
1,200,000
1,400,000
1,600,000
1,800,000
2,000,000
Baseline(2015)
Business asUsual
WeakEconomy
CooperativeGrowth
AdaptiveInnovation
Hot GrowthPo
pula
tion
Aver
age
Annu
al D
eman
d (A
FY)
Systemwide Population
C o l o r a d o Wa t e r P l a n A n a l y s i s a n d Te c h n i c a l U p d a t e x x v i

C o l o r a d o Wa t e r P l a n A n a l y s i s a n d Te c h n i c a l U p d a t e x x v i i
5%
M&I demands comprise approximately 10 percent of the combined agricultural and M&I statewide demands that are currently met with existing water supplies and projects.
Per capita baseline system demand has decreased from 172 to 164 gpcd—a 5 percent reduction in demands between 2008 - 2015.
Adaptive Innovation shows a 13 percent decrease in gpcd (from 164 to 143 gpcd) compared to current conditions. Total municipal demand in Adaptive Innovation tracks closely with Business As Usual. This highlights how social values that prioritize water conservation and water saving technologies could help mitigate impacts from climate and population.
While per capita usage is expected to decrease in all but Hot Growth, overall statewide M&I water demand is projected to increase from 35 percent in Weak Economy to 77 percent in Hot Growth over current demands. Even at that highest level, it is still lower than Water Plan due to the revised population projections, which are lower than previously estimated.
TECHNICAL UPDATE / M&I FINDINGS
35% +
10%
Current population (5.4 million) is 5 percent less than the Water Plan's projected 2015 levels. The State Demography Office estimates that Colorado will grow to 8.5 million by 2050.
On average, SSI demands account for 13 percent of the total M&I demands. This includes snowmaking; and thermoelectric, energy development, and large industrial users.
13%

Environment and RecreationThe Colorado Environment and Recreation Flow Tool (Flow Tool) helps basin roundtables refine, categorize, and prioritize their portfolio of E&R projects and methods through an improved understanding of flow needs and potential flow impairments, both existing and projected. The Flow Tool uses hydrologic data from CDSS, additional modeled hydrologic data for various planning scenarios, and established flow-ecology relationships to assess risks to flows and E&R attribute categories at preselected gages across the state. The Flow Tool is a high-level tool that is intended to provide guidance during Stream Management Plan development and BIP development.
The Flow Tool estimates the response of E&R attributes in rivers under various hydrologic scenarios. The flow-ecology relationships in the Flow Tool were first developed as part of the Watershed Flow Evaluation Tool and were patterned after similar relationships that have been developed across the globe to inform water management. Flow-ecology science quantifies the relationship between specific flow statistics (e.g., average magnitude of peak flow, the ratio of flow in August and September to mean annual flow) and the risk status (low to very high) for environmental attributes under the flow scenario being analyzed. Data-derived relationships have been developed for riparian/wetland plants (cottonwoods), coldwater fish (trout), warmwater fish (bluehead sucker, flannelmouth sucker, and roundtail chub), and Plains fish. Other metrics were developed with basic, well-established relationships between hydrology and stream ecology. Relationships for recreational boating were also developed with stakeholders during Watershed Flow Evaluation Tool development.
The Flow Tool incorporates data from 54 nodes in the water supply and gap analysis; the tool visualizes changes in flow regime and risks to E&R attributes under existing and future conditions associated with the five planning scenarios.
Figure ES.8 Gages Included in the Flow Tool
TECHNICAL UPDATE / E&R FINDINGS
C o l o r a d o Wa t e r P l a n A n a l y s i s a n d Te c h n i c a l U p d a t e x x v i i i

C o l o r a d o Wa t e r P l a n A n a l y s i s a n d Te c h n i c a l U p d a t e x x i x
Projected future streamflow hydrographs in most locations across the state show potentially drier conditions in the late summer months under scenarios with climate change that suggest air temperatures could increase by 3.78°F to 4.15°F by 2050.
Peak runoff may shift as much as one month earlier, which could lead to drier conditions in summer months and produce multiple implications for storage, irrigation and streamflow.
The Flow Tool created as part of the Technical Update was designed to compare modeling outputs from the five planning scenarios against baseline (existing) and naturalized (unimpaired) flow conditions. Key outputs include a comparison of monthly flow regimes relative to ecological-flow indicators, building off past stakeholder-driven efforts in Colorado.
TECHNICAL UPDATE / E&R FINDINGS
Instream Flow (ISF) and recreational in-channel diversions (RICD) water rights may be met less often in climate-impacted scenarios that see more consistent temperature increases and more variable precipitation and runoff conditions.
1 MONTH
In mountainous regions with infrastructure, risks to E&R assets may vary. Streams that are already depleted may see increased risks in scenarios with climate change; however, some streams may be sustained by reservoir releases, which will help moderate risks in scenarios with climate change.
Under climate change scenarios, runoff and peak flows may occur earlier, and result in possible mismatches between peak flow timing and species’ needs. Drier conditions in late summer months could increase risk to coldwater and warmwater fish due to higher water temperatures and reduced habitat.

The Technical Update developed a variety of high-level analyses on the topics of public perceptions, alternative transfer methods (ATM), water reuse, storage opportunities, and economic impacts. The intent of these analyses was to provide insight into various issues that will be valuable for basin roundtables as they update their BIPs and consider solutions to address potential future gaps. Findings from these analyses are included in Section 5 of the Technical Update (Volume 1).
The Technical Update also developed several tools for basin roundtables to use when updating their BIPs. During the Technical Update, several types of data from existing BIPs were reviewed that indicated the need to improve the completeness and uniformity of basin project information. In addition, the Technical Update included the development of tools like a Project Cost Estimating Tool and E&R Flow Tool.
A list of recommendations aims to allow basins flexibility in the BIP update process to tailor approaches to best suit basin goals while at the same time providing a framework for standardization across the BIP updates. This iterative process is meant to support statewide water supply planning, cross-basin dialogue, project funding, enhanced future supply analyses, revised basin goals, and updated project lists.
5 INSIGHTS, TOOLS & RECOMMENDATIONS
Integrating Technical Update findings with the BIPs, project lists and, ultimately, the Colorado Water Plan update ensures state water planning will continue to be informed by the best available data.
C o l o r a d o Wa t e r P l a n A n a l y s i s a n d Te c h n i c a l U p d a t e x x x

C o l o r a d o Wa t e r P l a n A n a l y s i s a n d Te c h n i c a l U p d a t e x x x i
Related Documents