Colorado Learning Difficulties Questionnaire:Validation of a parent-report screening measure Erik G. Willcutt Department of Psychology and Neuroscience, University of Colorado, Boulder Richard Boada Department of Neurology, University of Colorado at Denver and Health Sciences Center, and Department of Psychology, University of Denver Margaret W. Riddle Department of Psychology, University of Denver Nomita Chhabildas and John C. DeFries Department of Psychology and Neuroscience, University of Colorado, Boulder Bruce F. Pennington University of Denver Abstract This study evaluated the internal structure and convergent and discriminant evidence for the Colorado Learning Difficulties Questionnaire (CLDQ), a 20-item parent-report rating scale that was developed to provide a brief screening measure for learning difficulties. CLDQ ratings were obtained from parents of children in two large community samples and two samples from clinics that specialize in the assessment of learning disabilities and related disorders (total N = 8,004). Exploratory and confirmatory factor analyses revealed five correlated but separable dimensions that were labeled reading, math, social cognition, social anxiety, and spatial difficulties. Results revealed strong convergent and discriminant evidence for the CLDQ Reading scale, suggesting that this scale may provide a useful method to screen for reading difficulties in both research studies and clinical settings. Results are also promising for the other four CLDQ scales, but additional research is needed to refine each of these measures. Keywords reading; math; learning; rating scale; screening Learning disorders (LDs) are defined by significant academic underachievement that is unexpected based on an individual's age, cognitive ability, and education (e.g., American Psychiatric Association, 2000). The fourth edition of the Diagnostic and Statistical Manual of Mental Disorders (DSM-IV; American Psychiatric Association, 2000) provides diagnostic criteria for Reading Disorder (RD), Math Disorder (MD), and Disorder of Point of Contact: Correspondence concerning this article should be addressed to Erik Willcutt, Department of Psychology and Neuroscience, UCB 345, University of Colorado, Boulder, 80309. [email protected].. Publisher's Disclaimer: The following manuscript is the final accepted manuscript. It has not been subjected to the final copyediting, fact-checking, and proofreading required for formal publication. It is not the definitive, publisher-authenticated version. The American Psychological Association and its Council of Editors disclaim any responsibility or liabilities for errors or omissions of this manuscript version, any version derived from this manuscript by NIH, or other third parties. The published version is available at www.apa.org/ pubs/journals/pas NIH Public Access Author Manuscript Psychol Assess. Author manuscript; available in PMC 2012 September 1. Published in final edited form as: Psychol Assess. 2011 September ; 23(3): 778–791. doi:10.1037/a0023290. NIH-PA Author Manuscript NIH-PA Author Manuscript NIH-PA Author Manuscript

Welcome message from author
This document is posted to help you gain knowledge. Please leave a comment to let me know what you think about it! Share it to your friends and learn new things together.
Transcript
Colorado Learning Difficulties Questionnaire:Validation of aparent-report screening measure
Erik G. WillcuttDepartment of Psychology and Neuroscience, University of Colorado, Boulder
Richard BoadaDepartment of Neurology, University of Colorado at Denver and Health Sciences Center, andDepartment of Psychology, University of Denver
Margaret W. RiddleDepartment of Psychology, University of Denver
Nomita Chhabildas and John C. DeFriesDepartment of Psychology and Neuroscience, University of Colorado, Boulder
Bruce F. PenningtonUniversity of Denver
AbstractThis study evaluated the internal structure and convergent and discriminant evidence for theColorado Learning Difficulties Questionnaire (CLDQ), a 20-item parent-report rating scale thatwas developed to provide a brief screening measure for learning difficulties. CLDQ ratings wereobtained from parents of children in two large community samples and two samples from clinicsthat specialize in the assessment of learning disabilities and related disorders (total N = 8,004).Exploratory and confirmatory factor analyses revealed five correlated but separable dimensionsthat were labeled reading, math, social cognition, social anxiety, and spatial difficulties. Resultsrevealed strong convergent and discriminant evidence for the CLDQ Reading scale, suggestingthat this scale may provide a useful method to screen for reading difficulties in both researchstudies and clinical settings. Results are also promising for the other four CLDQ scales, butadditional research is needed to refine each of these measures.
Keywordsreading; math; learning; rating scale; screening
Learning disorders (LDs) are defined by significant academic underachievement that isunexpected based on an individual's age, cognitive ability, and education (e.g., AmericanPsychiatric Association, 2000). The fourth edition of the Diagnostic and Statistical Manualof Mental Disorders (DSM-IV; American Psychiatric Association, 2000) providesdiagnostic criteria for Reading Disorder (RD), Math Disorder (MD), and Disorder of
Point of Contact: Correspondence concerning this article should be addressed to Erik Willcutt, Department of Psychology andNeuroscience, UCB 345, University of Colorado, Boulder, 80309. [email protected]'s Disclaimer: The following manuscript is the final accepted manuscript. It has not been subjected to the final copyediting,fact-checking, and proofreading required for formal publication. It is not the definitive, publisher-authenticated version. The AmericanPsychological Association and its Council of Editors disclaim any responsibility or liabilities for errors or omissions of this manuscriptversion, any version derived from this manuscript by NIH, or other third parties. The published version is available at www.apa.org/pubs/journals/pas
NIH Public AccessAuthor ManuscriptPsychol Assess. Author manuscript; available in PMC 2012 September 1.
Published in final edited form as:Psychol Assess. 2011 September ; 23(3): 778–791. doi:10.1037/a0023290.
NIH
-PA Author Manuscript
NIH
-PA Author Manuscript
NIH
-PA Author Manuscript
Written Expression. In addition to these DSM-IV categories, other authors described non-verbal learning disability (NVLD), a syndrome characterized by specific difficulties inmathematics and spatial functioning, along with impairments in social cognition similar tothe difficulties exhibited by individuals with pervasive developmental disorders (PDD; e.g.,Klin, Volkmar, Sparrow, Cicchetti, & Rourke, 1995; Rourke, 1989).
LDs are associated with a range of negative outcomes and significant publich health costs.Prevalence estimates suggest that 5–15% of the population meet criteria for at least one LD(e.g., American Psychiatric Association, 2000; Gross-Tsur, Manor, & Shalev, 1996; Rutteret al., 2004; Shaywitz, Shaywitz, Fletcher, & Escobar, 1990), and over half of all studentswho receive special education services are identified due to an LD (e.g., Schnoes, Reid,Wagner, & Marder, 2006). Studies that compared groups with and without an LD found thatindividuals with an LD experience greater academic difficulties, report lower motivation andgreater frustration and distress in school, are more likely to drop out of high school prior tograduation, and reach lower levels of educational and occupational attainment as adults(e.g., Boetsch, Green, & Pennington, 1996; Daniel et al., 2006; Goldston et al., 2007;McGee, Prior, Willams, Smart, & Sanson, 2002; Willcutt et al., 2007). LDs also co-occurmore often than expected by chance with one another and with other disorders such asattention-deficit/hyperactivity disorder (ADHD), conduct disorder, anxiety disorders, anddepression (Antshel & Khan, 2008; Daniel et al., 2006; Maughan, Rowe, Loeber, &Stouthamer-Loeber, 2003; McGee et al., 2002; Semrud-Clikeman et al., 1992; Trzesniewski,Moffitt, Caspi, Taylor, & Maughan, 2006; Willcutt et al., 2007; Willcutt & Pennington,2000a; Willcutt & Pennington, 2000b).
The high prevalence of LDs and their frequent co-occurrence with other disorders suggeststhat LD assessment measures should be systematically included in clinical assessmentbatteries and research studies focusing on developmental disorders. However, a full LDassessment requires the administration of standardized tests of academic achievement andcognitive ability by a trained examiner in a one-on-one testing session that typically lastsseveral hours. It is not feasible to complete such an extensive evaluation as part of manyclinical assessments and research studies, particularly if comorbid learning difficulties arenot the primary referral question for a clinical assessment or are a secondary aim of a studyfocusing on a related but separate topic.
Similar challenges are faced by clinicians or researchers who wish to screen systematicallyfor a range of psychopathology as part of a standard clinical assessment battery or researchprotocol, as it is often unrealistic to devote the time necessary to obtain a comprehensiveassessment of all relevant disorders. To address this issue, several screening measures fordevelopmental psychopathology have been developed, such as the Achenbach System ofEmpirically Based Assessment (ASEBA; Achenbach & Rescorla, 2001), the BehaviorAssessment System for Children (BASC; Reynolds & Kamphaus, 2004), the Conners RatingScales (e.g., Conners, Sitarenios, Parker, & Epstein, 1998) and the Early ChildhoodInventory (ECI), Child Symptom Inventory (CSI), and Adolescent Symptom Inventory(ASI) developed by Gadow and colleagues (e.g., Gadow & Sprafkin, 1997a; Gadow &Sprafkin, 1997b; Gadow & Sprafkin, 1998). Each of these measures can be completedquickly by parents or teachers to screen efficiently for a broad range of psychopathology,and all are used widely in both research studies and clinical practice. Scores from thesemeasures do not replace diagnostic interviews, and are not intended to provide clinicaldiagnoses or to guide treatment planning in isolation. Instead, these norm-referenced ratingscales provide reliable and valid indicators of areas in which an individual appears to beexperiencing significant difficulty in comparison to others the same age, and these areas canthen be targeted directly for more intensive evaluation.
Willcutt et al. Page 2
Psychol Assess. Author manuscript; available in PMC 2012 September 1.
NIH
-PA Author Manuscript
NIH
-PA Author Manuscript
NIH
-PA Author Manuscript
In contrast to these well-validated screening measures for psychopathology, to ourknowledge there are no scales designed to screen for specific learning disorders and relateddevelopmental difficulties. In this manuscript we describe the development of the ColoradoLearning Difficulties Questionnaire (CLDQ), a parent-report rating scale that may provide auseful screening instrument for use in clinical settings and research studies. The CLDQ wasdesigned to assess specific dimensions of functioning that are most often impaired inchildren with learning difficulties, including reading, math, social cognition, spatialfunctioning, and memory. Data from four large samples (total N =8,004) were used toevaluate the internal structure and convergent and discriminant evidence for the CLDQscales. Specific goals were as follows:
1. To assess the number of dimensions of learning difficulties assessed by the CLDQ,initial exploratory factor analyses (EFA) were completed in each sample, and asubsequent multigroup confirmatory factor analysis was used to test whether thefactor structure could be equated across the four samples. We hypothesized thatthese analyses would identify separable dimensions of reading, math, spatialfunctioning, social cognition, and memory.
2. The inter-rater reliability of each CLDQ scale was evaluated by examiningcorrelations between maternal and paternal ratings, and estimates of test-retestreliability were obtained from maternal ratings completed approximately one yearapart.
3. The four datasets included a range of external measures of each of the constructsassessed by the CLDQ. Convergent and discriminant evidence for the CLDQ scaleswas evaluated by testing whether correlations were significantly higher betweeneach scale and external measures of the same construct than measures of otherconstructs.
4. CLDQ scores of groups with RD, MD, NVLD, and other developmental disorderswere compared to test whether predicted associations were observed between eachCLDQ scale and specific disorders. We expected that individuals with RD wouldexhibit higher elevations on a CLDQ Reading scale than any other scale thatemerged in factor analyses of the CLDQ, whereas individuals with MD wouldexhibit the most pronounced elevations on a Math scale. Groups with NVLD wereexpected to score highest on on a CLDQ scale measuring spatial difficulties, andgroups with NVLD or a pervasive developmental disorder (PDD) were expected toexhibit the most pronounced impairment on a CLDQ scale measuring socialcognition.
MethodParticipants
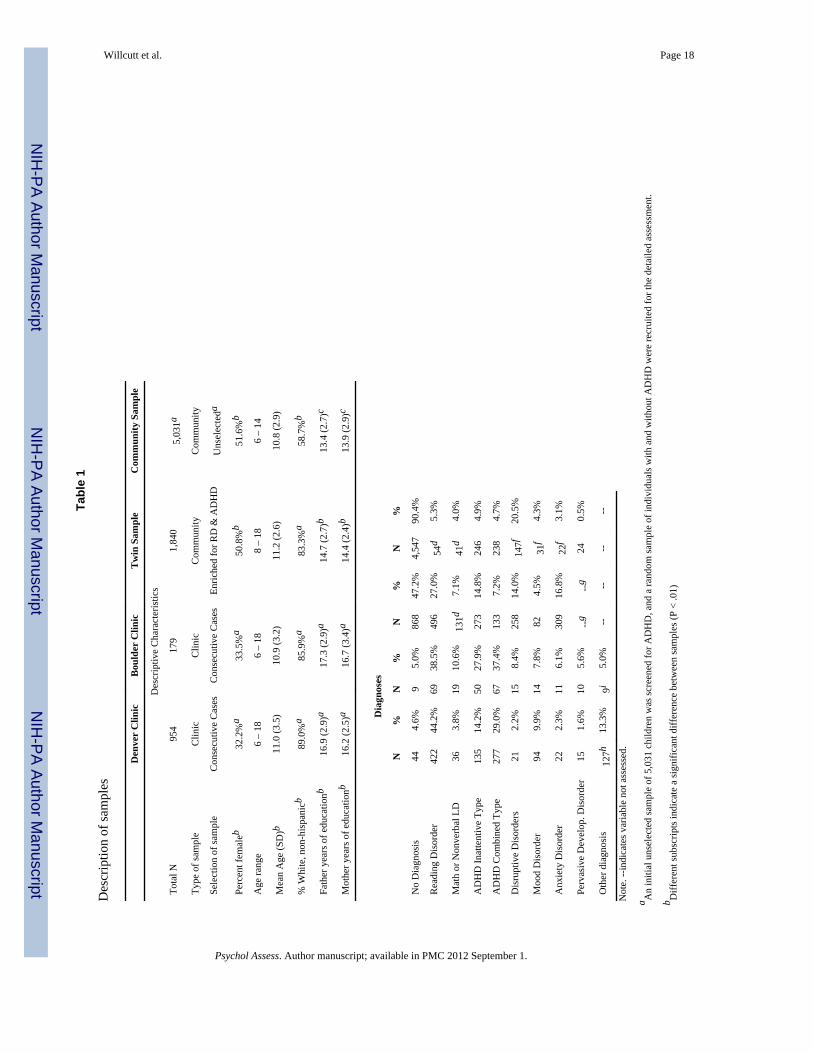
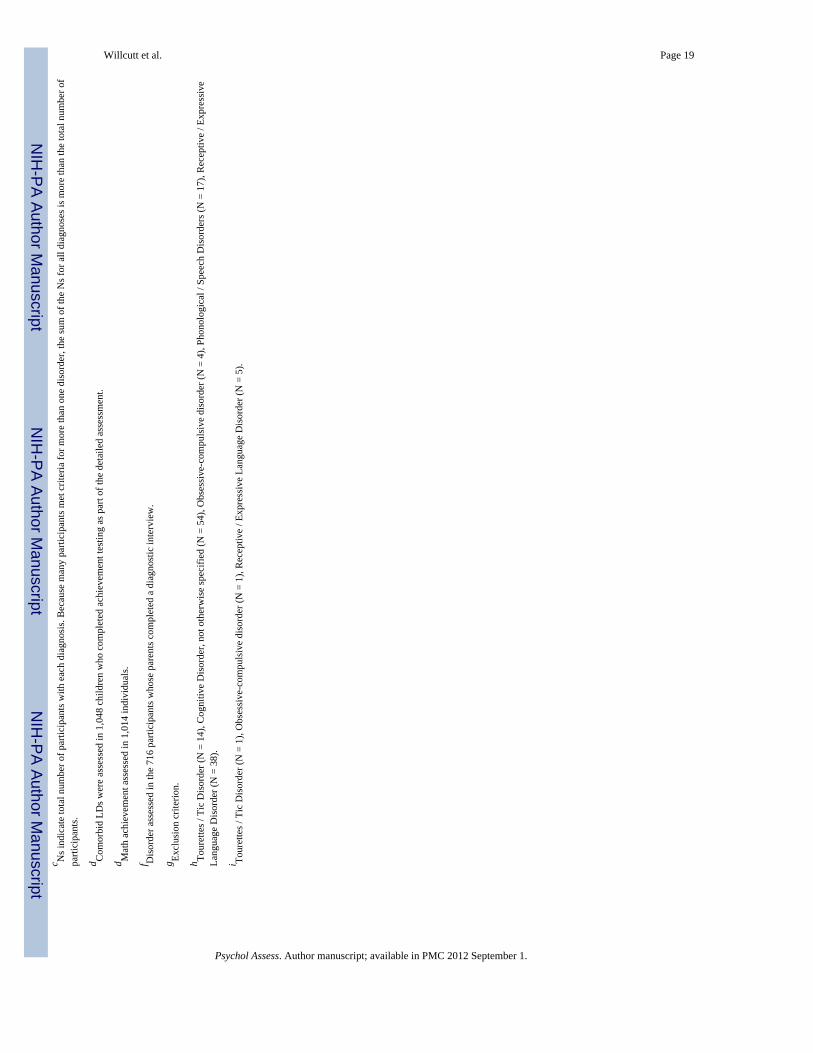
Parents of children and adolescents in two clinic samples and two community samplescompleted the CLDQ as part of a larger packet of questionnaires. Descriptive characteristicsof the samples are summarized in Table 1.
University of Denver Developmental Neuropsychology Clinic—This sampleincludes 954 consecutive referrals to a University clinic specializing in neuropsychologicalassessments of children and adolescents. Although the most frequent referral questions areRD and ADHD, the sample included cases with a range of developmental disorders (Table1).
Willcutt et al. Page 3
Psychol Assess. Author manuscript; available in PMC 2012 September 1.
NIH
-PA Author Manuscript
NIH
-PA Author Manuscript
NIH
-PA Author Manuscript
University of Colorado at Boulder Attention, Behavior, and Learning Clinic—This second clinic-referred sample includes 179 consecutive referrals between 6 and 18years old. The Boulder clinic specializes in the assessment of ADHD and learningdisabilities, but also sees cases with a range of referral concerns (Table 1).
Twin sample—Parents completed the CLDQ as part of the Colorado Learning DisabilitiesResearch Center twin study (CLDRC), an ongoing study of the etiology of learning andattentional difficulties (e.g., DeFries et al., 1997; Willcutt, Pennington, Olson, Chhabildas,& Hulslander, 2005). Based on an initial screening of over 4,000 twin pairs, pairs between 8and 18 years old were recruited if at least one of the twins met criteria for reading disabilityor DSM-IV ADHD (N = 972), and a matched comparison sample of twin pairs without RDor ADHD was recruited from the same schools (N = 868; see Willcutt et al., 2005 for a fulldescription of the recruitment procedures). Each member of the pair then completed adetailed assessment battery that included measures of general cognitive ability, reading andmath achievement, social functioning, and internalizing and externalizing psychopathology.Because more mothers (96%) than fathers (78%) completed the CLDQ, maternal ratingswere used for all analyses except tests of inter-rater reliability, which examined thecorrelation between ratings by the two parents.
Community screening sample—As part of a larger study of the DSM-IV ADHDsubtypes, parents of all children attending schools in five local public school districts wereinvited to participate in the first phase of the study by completing an initial screeningquestionnaire that included the CLDQ (N = 5,031 completed the questionnaire). A subset offamilies of children with and without DSM-IV ADHD were then invited to participate in amore extensive individual testing session that included the measures of intelligence andacademic achievement that were used to evaluate the convergent and discriminant evidencefor the CLDQ scores. The individual assessment was completed by 502 participants withADHD, 532 of their biological siblings, and a comparison sample of 530 children withoutADHD matched to the ADHD sample on age, sex, ethnicity, socioeconomic status, andschool.
Inclusion criteria—In addition to the inclusion criteria applied as part of each individualstudy, several additional criteria were required for a case to be included in the currentanalyses. In the clinic samples, the CLDQ was typically not administered to parents ofindividuals older than 18 years of age, and most parents of children younger than 6 years oldwere unable to answer several items that were not yet developmentally typical (e.g.,difficulty with spelling or handwriting). Therefore, analyses of the clinic samples wererestricted to individuals between 6 and 18 years old. In all samples a small subset of parentsfailed to complete three or more of the items on the final 20-item CLDQ scale (0.1 – 0.6%of all questionnaires across studies). In addition, two parents of children in the Denver clinicsample (0.2%), two parents from the twin study (0.1%), and four parents of children in thecommunity screening sample (0.1%) circled multiple answers for several CLDQ items.These cases (0.1 – 0.7% of all individuals) were excluded from all analyses and are notincluded in the samples described in Table 1.
Development of the CLDQThe initial item pool—The CLDQ was initially developed to quantify the presentingconcerns of parents when they brought their child for a psychoeducational orneuropsychological evaluation at the Denver clinic. The scale was included as part of adevelopmental and family history questionnaire completed by all parents at the beginning ofeach assessment. Items on the initial CLDQ were designed to assess functioning in eightdomains: reading, math, attention / hyperactivity, anxiety, depression, social functioning,
Willcutt et al. Page 4
Psychol Assess. Author manuscript; available in PMC 2012 September 1.
NIH
-PA Author Manuscript
NIH
-PA Author Manuscript
NIH
-PA Author Manuscript
spatial ability, and memory. Parents answered each question on a five-point Likert scalewith the following anchors: (1) never / not at all, (2) rarely / a little, (3) sometimes, (4)frequently / quite a lot, and (5) always / a great deal.
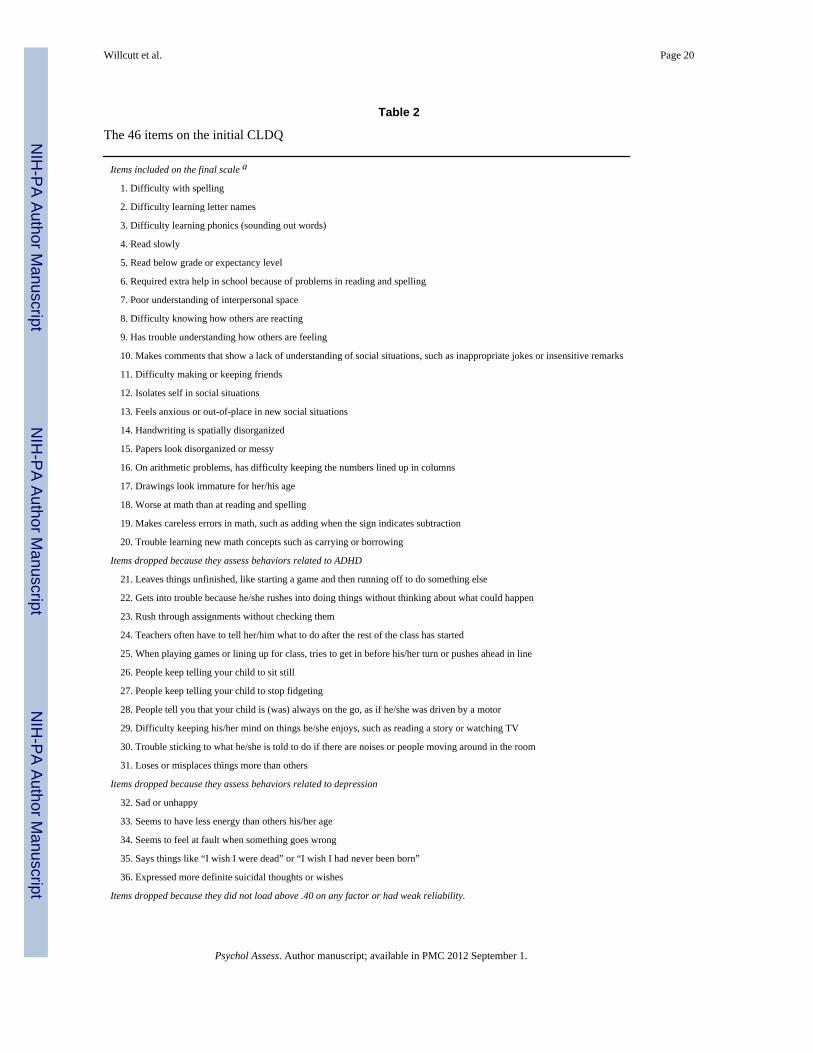
The 46 items on the initial questionnaire are listed in Table 2. Parents of children in theDenver clinic sample and the twin sample completed the full 46-item scale. Over half ofthese items were dropped for theoretical reasons or due to weak psychometriccharacteristics, leaving a final 20-item scale that was completed by parents of thecommunity sample and Boulder clinic sample. In the remainder of this section we brieflydescribe the rationale for the exclusion of the other 26 questions from the original pool ofitems.
Elimination of ADHD and depression items—At the time the scale was developed,standardized measures were not available to screen for symptoms of ADHD or depression.Therefore, the original scale included 11 items that assessed behaviors related to ADHD and5 items designed to assess depression (items 21 – 36 in Table 2). Since that time, morecomprehensive ADHD and depression screening instruments have been published (e.g.,Barkley & Murphy, 1998;DuPaul, Power, Anastopoulos, & Reid, 1998;Gadow & Sprafkin,1997a;Kovacs, 1988), and preliminary analyses of the CLDQ indicated that thepsychometric properties of ADHD and depression composites based on CLDQ items wereweaker than the characteristics of the existing scales. Therefore, the 16 ADHD anddepression items from the original CLDQ were dropped from the current version of thescale. Initial factor analyses including these items indicated that all ADHD and depressionitems on the CLDQ loaded on factors separate from the final factors described in this report,and the overall factor structure of the remaining items remained the same whether or not theADHD and depression items were included in the analysis.
Exclusion of additional items—After removing the items designed to assess ADHDand depression, the psychometric characteristics of the remaining items were examinedcarefully. Nine items did not load on any of the factors in initial factor analyses (all loadings< .40), and several of these items also had low inter-rater and test-retest reliability (items 37– 46 in table 2). Therefore, these items were also dropped from the final version of the scaledescribed in this paper.
Internal structure of the final scale—An initial exploratory factor analysis (EFA) wasconducted separately in each sample. Principal axis extraction and direct oblimin rotationwere used to extract factors with eigenvalues greater than one. The direct oblimin rotationwas used because it is an oblique rotation that permits the obtained factors to correlate, andtherefore requires fewer a priori assumptions about the relations among the variables than anorthogonal method of rotation. However, the same number of factors and similar factorloadings were obtained when a principal components analysis with varimax rotation wasconducted, suggesting that the results are robust across different methods of factor extractionand rotation.
A five-factor solution best explained the data in all four samples (Table 3). The factors werelabeled Reading, Math, Social Cognition, Social Anxiety, and Spatial. All 20 items loadedhighest on their primary factor in all samples, and only the item assessing friendshipdifficulties cross-loaded on any other factor (it loaded on both the Social Anxiety and SocialCognition factors in the Denver clinic sample and the twin sample).
After conducting the EFAs to obtain an initial appraisal of the structure of the CLDQ in eachsample, a confirmatory factor analysis (CFA) model was fitted to test directly whether thefactor structure could be equated across the four samples. The item loadings and factor
Willcutt et al. Page 5
Psychol Assess. Author manuscript; available in PMC 2012 September 1.
NIH
-PA Author Manuscript
NIH
-PA Author Manuscript
NIH
-PA Author Manuscript
covariances were constrained to be equal in all samples, whereas the means and variances ofthe CLDQ items were not equated because these parameters were expected to differ incommunity and clinic samples. Due to the large samples included in the analysis, the fit ofthe CFA model was evaluated with the comparative fit index (CFI; Bentler, 1990) and rootmean square error of approximation (RMSEA; Browne & Cudeck, 1993), two fit indicesthat are less sensitive to sample size than other fit indices such as ×2 (e.g., Fan, Thompson,& Wang, 1999). Although cutoffs used to assess goodness-of-fit are based primarily onconvention (e.g., Chen, Curran, Bollen, Kirby, & Paxton, 2008), widely-used thresholds forgood model fit are RMSEA less than or equal to .05 and CFI greater than .90 (e.g.,Schumacker & Lomax, 2004). The fit of the constrained model was adequate based on bothof these indices (CFI = .931; RMSEA = .042, 95% CI [.041, .043]), and only slightly worsethan the fit of a model in which the item loadings and factor covariances were unconstrained(CFI = .940; RMSEA = .041), providing additional support for the hypothesis that theinternal structure of the CLDQ is similar in the four samples.
Reliability of the CLDQ scales—Based on the results of the EFA and CFA, five CLDQscale scores were calculated by computing the mean of the items that loaded on each factor.Inter-rater reliability was assessed by the correlation between mother and father ratings inthe twin sample, and test-retest reliability was assessed over an interval of approximatelyone year in a subset of the community sample who returned for a follow-up assessment aspart of the larger study (N = 554). Estimates of internal consistency and reliability were highfor the Reading scale items and composite score and moderate for the other four scales(Tables 3 and 4).
Measures to evaluate the convergent and discriminant evidence of the CLDQ scoresBecause none of the study protocols were designed to evaluate the CLDQ, the specificmeasures available to evaluate the convergent and discriminant evidence for each CLDQscale varied across samples. Nonetheless, each of the samples included at least one measurerelevant to each of the five CLDQ domains, and most samples included two or moremeasures of each construct (Table 5). Due to space constraints it is not possible to describeall of these external measures in detail. Therefore, in the remainder of this section we brieflydescribe each test or scale, and provide references for additional information about themeasures in the notes for Table 5.
Reading and math achievement—Measures of single-word reading, readingcomprehension, math calculations, and math word problems were obtained from theWoodcock-Johnson Tests of Achievement, the Peabody Individual Achievement Test, theGray Oral Reading Test, and the Wide Range Achievement Test, all of which are widely-used standardized measures of academic achievement.
Social functioning—The Behavior Assessment System for Children (BASC) andAchenbach System of Empirically Based Assessment (ASEBA) are nationally-normedparent and teacher rating scales that include measures of social functioning. The sociometricrating scale developed by Dishion (1990) asks the child's teacher to estimate the proportionof students in the class who like, dislike, or ignore the child.
Spatial functioning—All four studies administered the Block Design subtest from one ofthe Wechsler Intelligence Scales, and participants in three of the four samples alsocompleted the Rey-Osterreith Complex Figure Test (ROCFT), a task which requires theparticipant to copy a complex figure. A subset of the Denver clinic sample completed theDevelopmental Test of Visual-Motor Integration (DTVMI), a standardized measure thatrequires the participant to copy a series of increasingly complex designs. Finally, the twin
Willcutt et al. Page 6
Psychol Assess. Author manuscript; available in PMC 2012 September 1.
NIH
-PA Author Manuscript
NIH
-PA Author Manuscript
NIH
-PA Author Manuscript
study included Primary Mental Abilities (PMA) Spatial Relations subtest, a test that requiresthe participant to select from five choices the figure that is a clockwise rotation of a targetfigure.
Psychopathology—Measures of several dimensions of psychopathology that frequentlyco-occur with learning difficulties were analyzed to further evaluate the discriminantevidence for the CLDQ scales. Although different measures were used to assess ADHD inthe four samples, each of these measures provides composite scores derived from parent andteacher ratings of DSM-IV inattention and hyperactivity-impulsivity symptoms. Parents andteachers also completed the internalizing and externalizing scales on the ASEBA or BASC,and parents rated symptoms of generalized anxiety disorder (GAD), separation anxietydisorder (SAD), major depressive disorder (MDD), and pervasive developmental disorderon the Adolescent Symptom Inventory (ASI), Child Symptom Inventory (CSI), orDiagnostic Interview for Children and Adolescents (DICA-IV).
Data preparation and consolidationData Adjustments—The distribution of each variable was assessed for significantdeviation from normality, and an appropriate transformation was applied to approximate anormal distribution for variables with skewness or kurtosis greater than one. No scores onthe CLDQ or the measures used for external validation met our a priori criteria for outlyingvalues (more than three SD below the mean and more than 0.5 SD beyond the next mostextreme score).
There were small but significant correlations between age and the CLDQ Reading scale, r =−.08; 95% CI [−.11, −.06], Math scale, r = −.09; 95% CI [−.14, −.04], and Spatial scale, r =−.07; 95% CI [−.11, −.03], and several of the external measures (r =.06–.13). Therefore, anage-adjusted score was created for each measure by regressing the variable onto age andcomputing the residual score. To test further for potential differences in results as a functionof age, primary analyses were also conducted separately in subsets of each sample dividedby age (younger than 11 years old, 11 – 13 years old, and older than 13 years old). Althoughsome of these analyses were constrained by small sample sizes, the pattern of results wasextremely similar in all age groups. Therefore, results are reported for the full samples(results for the separate age groups are available from the lead author).
Creation of composites for the constructs used for external validation—Because initial analyses revealed that the pattern of results was nearly always similar whenmultiple measures of an external construct were analyzed separately, composite scores werecreated for several of the constructs that were assessed by multiple measures. Eachcomposite score is the mean of age-regressed standardized scores on all measures of theconstruct that were administered in a particular sample. The reading composite is the meanof the measures of single-word reading and reading comprehension, and the math compositeis the mean of the measures of math calculations and word problems. The social isolationcomposite includes the ratings of withdrawn behavior and the extent to which the individualis ignored by peers, the social rejection composite is the mean of the Social Problems scaleand the teacher rating of the proportion of peers who dislike the participant, and the socialstrengths composite is the mean of the measures of social skills and teacher ratings of theproportion of peers who like the individual. The anxiety composite is the mean of theASEBA / BASC scale and parent ratings of GAD and SAD. The spatial composite includesBlock Design, the copy trial from the ROCFT, the DTVMI, and PMA Spatial Relations.
Willcutt et al. Page 7
Psychol Assess. Author manuscript; available in PMC 2012 September 1.
NIH
-PA Author Manuscript
NIH
-PA Author Manuscript
NIH
-PA Author Manuscript
Data analysesCorrections for non-independence in the twin sample—Phenotypic analyses oftwin data must account for the fact that the two twins in a pair are not completelyindependent. Therefore, a multilevel approach was used that considered nesting of twinswithin families (Muthen & Muthen, 2009) to provide valid estimates of populationparameters, measures of association between variables, and tests of significance.
Meta-analytic procedures to calculate overall effect sizes across samples—Tosimplify interpretation and minimize the number of statistical tests, meta-analytic procedureswere used to compute a single summary statistic and confidence interval to describe therelation between each CLDQ scale and the composite measure of each external construct. Inthe first step of this procedure a separate effect size is calculated for each sample (r forcorrelational analyses of continuous measures and Cohen's d (1988) for comparisonsbetween means of the clinical groups). If the effect sizes in the four samples arehomogenous, an overall effect can be calculated using a fixed effects model that weightseach individual effect size by the corresponding sample size (e.g., Hedges & Olkin, 1985). Ifthere is significant heterogeneity among the samples, however, the confidence intervalobtained from the fixed effects model may be underestimated (e.g., Higgins & Thompson,2002).
We tested for significant heterogeneity among the samples by calculating Q, an estimate ofthe variability of individual effect sizes around the overall estimated effect size(DerSimonian & Laird, 1986). Although Q was not significant for most analyses, significantheterogeneity (P < .05) was observed for three effects (correlations between both inattentionand hyperactivity-impulsivity and CLDQ Social Cognition, along with mean differencesbetween groups with and without RD on the CLDQ Reading scale), and estimates ofheterogeneity approached significance in several additional analyses (P < .10). Therefore,the random effects model described by DerSimonian and Laird (1986) was used to estimateeach overall effect size and corresponding confidence interval (rw for dimensional analysesand dw for comparisons of group means). The random effects model is a more conservativeapproach that adjusts for heterogeneity by weighting each effect size by both the inversevariance of that sample and an additional weight based on Q. If Q is low the additionalweight becomes zero, and the fixed effects and random effects models yield identical results.
Analytic plan—The EFA and CFA described previously support the internal structure ofthe CLDQ scales. Convergent evidence for each CLDQ scale was first evaluated by testingif scores on the scale were significantly correlated with independent measures of the sametheoretical construct (for example, if the CLDQ reading scale was correlated withperformance on standardized measures of reading achievement). In addition, CLDQ scoresin the clinical groups were compared to the population mean estimated from the communityscreening sample to test if scores on each CLDQ scale were significantly elevated in groupsthat are known to have a specific weakness in that domain of functioning (e.g., math scoresin groups with MD). Discriminant evidence for the scales was then evaluated by testing forthe predicted differential associations between the CLDQ scales and the external measuresand clinical disorders.
ResultsScores on all five CLDQ scales were significantly correlated with nearly all externalmeasures (Table 6), and ratings of all clinical groups were significantly higher than theestimated population mean on all CLDQ scales (Table 7). These results clearly indicate thatthe CLDQ is sensitive to clinical status, providing preliminary convergent evidence for the
Willcutt et al. Page 8
Psychol Assess. Author manuscript; available in PMC 2012 September 1.
NIH
-PA Author Manuscript
NIH
-PA Author Manuscript
NIH
-PA Author Manuscript

CLDQ scales. On the other hand, the ubiquitous associations between all CLDQ scales andall external measures and clinical diagnoses underscore the need to examine carefully thediscriminant evidence for each CLDQ scale.
Reading scaleThe CLDQ Reading scale was highly correlated with composite measures of readingachievement in all four samples (rw = .64), and nonoverlapping confidence intervalsindicated that these correlations were significantly higher than the correlations between theReading scale and all other domains of functioning (Table 6). Similarly, the effect size of thedifference between the RD group and the estimated population mean was large (dw = 1.81;Table 7), substantially higher than the moderate effect sizes obtained for the RD group onthe other CLDQ scales (dw = .31 −.82), and significantly higher than the means of groupswith other disorders. These results provide strong convergent and discriminant support forthe CLDQ Reading scale.
Math scaleMeasures of math achievement were more highly correlated with the CLDQ Math Scalethan the other four CLDQ scales (Table 6), although the magnitudes of these correlations arelower than the correlations between the CLDQ Reading scale and the reading achievementcomposites. Similarly, groups with MD or NVLD scored significantly higher on the Mathscale than any other clinical group (Table 7), and in the group with MD the effect size on theMath scale was significantly larger than the effect on any other CLDQ scale.
Social Cognition scaleAs predicted, the Social Cognition scale was more highly correlated with weak social skills,social rejection, and symptoms of PDD than any other CLDQ scale, but correlations werealso unexpectedly high between the Social Cognition scale and measures of externalizingsymptoms (Table 6). Group comparisons indicated that groups with a PDD scoredsignificantly higher on the Social Cognition scale than any of the other clinical groups, andwere more impaired on the scale than any of the other CLDQ scales (Table 7).
Social Anxiety scaleBecause this scale unexpectedly separated from the Social Cognition scale in the factoranalysis, the discriminant evidence for these scales was carefully examined. The CLDQSocial Anxiety scale was most strongly associated with parent and teacher ratings of anxietyand social isolation (Tables 6), providing convergent evidence for the Social Anxiety scale.In contrast to the stronger associations between the Social Cognition scale and symptoms ofPDD and externalizing disortders, CLDQ Social Anxiety scores were more stronglyassociated with social isolation, withdrawn behaviors, and anxiety disorders (Tables 6 and7).
Spatial scaleThe CLDQ Spatial scale was more highly correlated with the external measures of spatialfunctioning than the Reading, Social Cognition, or Social Anxiety scales (Table 6), but thisassociation was similar in magnitude to the correlation between the CLDQ Math Scale andthe spatial composite. Further, the correlation between the CLDQ Spatial scale and theexternal measures of spatial functioning was significantly lower than the correlation betweenthe Spatial scale and inattention, and was similar to the correlations between the Spatialscale and measures of hyperactivity-impulsivity symptoms and math achievement. Thestrongest discriminant evidence for the CLDQ Spatial scale was provided by the large effectsize in the group with NVLD (Table 7). However, consistent with the results of the
Willcutt et al. Page 9
Psychol Assess. Author manuscript; available in PMC 2012 September 1.
NIH
-PA Author Manuscript
NIH
-PA Author Manuscript
NIH
-PA Author Manuscript
dimensional analyses, the mean of the group with NVLD was not significantly differentfrom the means of groups with PDD, MD, or ADHD Combined Type.
DiscussionThis study used four existing samples (total N = 8,004) to validate the Colorado LearningDifficulties Questionnaire (CLDQ), a parent-report rating scale designed to screen forlearning difficulties in children and adolescents. To the best of our knowledge, the CLDQ isthe first parent rating scale designed to assess multiple dimensions of learning difficulties inchildren and adolescents. Exploratory factor analyses of the CLDQ identified five factors inall four samples, and confirmatory factor analyses indicated that the factor loadings could beequated across samples. In this section we first examine the convergent and discriminantevidence for five CLDQ scales based on the observed factors, then discuss key limitations ofthe study and areas in which additional studies are needed.
Convergent and discriminant evidence for CLDQ scoresCLDQ Reading scale—Evidence of validity based on internal structure and relations withkey external variables is strongest for the CLDQ Reading scale. Factor analyses in all foursamples indicated that the six reading-related items loaded strongly on a single factor anddid not cross-load on any other factor, and a composite score based on these six items hadadequate inter-rater and test-retest reliability. Convergent evidence for the CLDQ Readingscale is provided by significant correlations with standardized measures of readingachievement (overall r = .64). In addition, individuals who met diagnostic criteria for RDscored significantly higher on the Reading scale than on any other CLDQ scale, and themean of the group with RD was significantly higher than the means of groups with any otherdisorder. These results provide strong convergent and discriminant evidence for the CLDQReading scale.
Results from two large population-based twin studies illustrate the potential utility of theCLDQ Reading scale for research purposes (Hay, Martin, Piek, Levy, & Sheikhi, 2005;Paloyelis, Rijsdijk, Wood, Asherson, & Kuntsi, in press). Because practical constraintsprecluded the use of individually-administered measures of reading achievement, parentratings on the CLDQ Reading scale were obtained as part of a larger battery ofquestionnaires. Results from both studies provided additional support for the internalstructure of the CLDQ Reading scale, and behavioral genetic analyses in each sampleindicated that the etiology of individual differences in reading was similar to the resultsobtained by previous twin studies that administered standardized measures of readingachievement (e.g., Bates et al., 2007; Byrne et al., 2007; Petrill et al., 2007). These resultssuggest that the CLDQ Reading scale may provide a useful research tool to screen forreading difficulties when it is not feasible to administer standardized reading achievementtests.
CLDQ Math scale—Factor analyses in all four samples yielded a math factor, and theCLDQ Math scale was more strongly associated with MD and standardized measures ofmath achievement than any other CLDQ scale. However, estimates of internal consistencyand reliability were lower for the CLDQ Math scale than the Reading scale. These weakerpsychometric characteristics may be at least partially explained by the small number ofitems on the Math scale. In addition, the items on the current Math scale are relativelygeneral, and do not directly assess specific aspects of math performance such as wordproblems or knowledge of math facts. To address both of these caveats we are currentlytesting the utility of additional math items in several of the samples. Initial results from thefirst 70 cases with the new items in the Boulder clinic sample suggest that the addition of
Willcutt et al. Page 10
Psychol Assess. Author manuscript; available in PMC 2012 September 1.
NIH
-PA Author Manuscript
NIH
-PA Author Manuscript
NIH
-PA Author Manuscript
two specific items (difficulty learning early math facts and difficulty with math wordproblems) may significantly improve the reliability and predictive power of the currentCLDQ Math scale, although a larger sample will be required to fully evaluate the expandedscale. Overall, these results support the validity of scores on the current CLDQ Math scale,but suggest that these additional items may further strengthen the scale and increase itsutility for clinical and research purposes.
CLDQ Social Cognition and Social Anxiety scales—Based on previous studies ofPDD and NVLD (Hartman, Luteijn, Serra, & Minderaa, 2006; Petti, Voelker, Shore, &Hayman-Abello, 2003; Rourke, 1989), we anticipated that social difficulties would be animportant component of the profile of weaknesses exhibited by some children with learningdifficulties. The current results support this overall hypothesis, but several findings suggestthat it may be useful to examine more specific components of social dysfunction. Factoranalyses in all four samples identified a factor characterized by anxiety induced byinterpersonal interactions, along with a second factor that included items that reflected weaksocial awareness or inadequate understanding of social expectations.
Analyses of the external measures provided additional support for the distinction betweenthe CLDQ Social Cognition and Social Anxiety scales. The Social Cognition scale was morestrongly related to PDD symptoms, externalizing behavior, rejection by peers, and poorsocial skills than the Social Anxiety scale, whereas the Social Anxiety scale was morestrongly associated with social isolation and symptoms of anxiety disorders. Hartman et al.(2006) reported similar results in a study of the Children's Social Behavior Questionnaire(CSBQ; Luteijn, Luteijn, Jackson, Volkmar, & Minderaa, 2000; Luteijn, Jackson, Volkmar,& Minderaa, 1998), a measure designed to assess dimensions of social behavior that areassociated with PDD. In their study, a group with PDD scored significantly higher on theCSBQ Social Understanding subscale than a group with an internalizing disorder and acontrol group without a diagnosis, whereas the group with an internalizing disorder did notdiffer significantly from the control group on the Social Understanding scale.
The practical utility of the current CLDQ Social Cognition and Social Anxiety scales islikely to be constrained by psychometric weaknesses. Both scales had lower reliability thanthe other CLDQ scales, and the final Social Anxiety scale included only three items, one ofwhich cross-loaded with the social cognition items in two of the four factor analyses.Nonetheless, these results suggest that additional research is needed to identify the specificdimensions of social functioning that are impaired in children with LDs or other relateddevelopmental difficulties. We are currently testing if the inclusion of additional putativesocial anxiety and social cognition items further improves the reliability and discriminantevidence for these scales.
CLDQ Spatial scale—Scores on the Spatial scale were significantly associated withexternal measures of spatial functioning, and were significantly elevated in individuals withNVLD. However, correlations of similar magnitude were also observed between the CLDQSpatial scale and measures of math and ADHD symptoms, and the mean of the group withNVLD was not significantly different from the mean of groups with ADHD, PDD, or MD.Therefore, the CLDQ Spatial scale appears to be a useful indicator of the spatial difficultiesexhibited by individuals with NVLD, ADHD, and other developmental disorders (Forrest,2004), but it has weaker discriminant evidence than the other scales on the CLDQ.
Clinical utility of the CLDQ scalesTo assess the utility of the CLDQ as a screening measure for clinical purposes we arecontinuing to collect the CLDQ as part of clinical assessments and several ongoing research
Willcutt et al. Page 11
Psychol Assess. Author manuscript; available in PMC 2012 September 1.
NIH
-PA Author Manuscript
NIH
-PA Author Manuscript
NIH
-PA Author Manuscript
studies. As the samples with each specific disorder become sufficiently large, we will beable to test the concordance between categorical cutoff scores on the CLDQ scales andclinical diagnoses of RD, MD, NVLD, and PDD. Preliminary analyses of the current clinicsamples suggest that cutoff scores on the CLDQ Reading and Math scales may havesufficient positive and negative predictive power for RD and MD to be clinically useful, andthe Social Cognition scale may help to identify individuals with a potential weakness insocial functioning that should be assessed in more detail during the assessment.
Although these preliminary results are encouraging, it is important to emphasize that nomatter what the final outcome of these future analyses, it will never be appropriate forclinicians to use the CLDQ in isolation to make categorical diagnostic or treatment decisionsregarding a specific individual. Instead, by providing an efficient tool to screen for learningdifficulties at the beginning of an evaluation, the CLDQ may inform clinical decisionsregarding the focus of the assessment, and provide useful supplementary information forcase formulation.
Limitations and future directionsA primary strength of the current study is the use of four large samples ascertained indifferent ways for different purposes. Each sample included a large battery of measures thatwere used to evaluate the convergent and discriminant evidence for scores on each CLDQscale. The sample size for most analyses was sufficiently large to provide high power todetect associations between CLDQ scales and key external measures, and also to testwhether the magnitude of these associations differed among the CLDQ scales. Findingswere generally robust despite potentially important differences between samples inascertainment, socioeconomic status, ethnicity, age, and the specific battery of externalmeasures completed by the participants. Despite these strengths, this study design also hasseveral inherent weaknesses that should be considered carefully when interpreting thecurrent results and their implications for future research clinical use.
Samples of convenience with missing measures of some constructs—One ofthe most important limitations of the current study is the fact that none of these sampleswere recruited for the purpose of evaluating the CLDQ. Because most individuals in theclinic samples were referred for an assessment of ADHD, RD, or other specific learningdifficulties, nearly all participants in all four samples completed a standard battery thatincluded measures of intelligence, academic achievement, internalizing and externalizingpsychopathology, and social functioning. In contrast, measures of spatial functioning weresystematically omitted for some cases in the clinic samples if the referral question andresults of other testing did not suggest that spatial difficulties were a specific area ofconcern.
Two sets of secondary analyses were conducted to test whether the omission of spatialmeasures from this subset of cases biased analyses of the associations between thesemeasures and the CLDQ Spatial scale. The first set of analyses directly compared the subsetof the clinic samples that completed the spatial measures (N = 589) to the group that did notcomplete these tasks (N = 482). The CLDQ Spatial score of the group was significantlyhigher in the group that completed the spatial measures, but the effect size was small (d = .19), and the two groups did not differ on the other four CLDQ scales or any other externalmeasures. The second set of analyses compared results in the four samples to test if adifferent pattern emerged in the clinic and community samples. Correlations between theCLDQ Spatial scale and the external measures of spatial functioning were nearly identical inall samples (r = .27 – .32).
Willcutt et al. Page 12
Psychol Assess. Author manuscript; available in PMC 2012 September 1.
NIH
-PA Author Manuscript
NIH
-PA Author Manuscript
NIH
-PA Author Manuscript
Taken together, these results suggest that the omission of the spatial measures from a subsetof the cases in the clinic samples had minimal impact on the overall pattern of results.Nonetheless, future studies of clinic samples could provide a useful extension of the currentresearch by administering a standard test battery to all participants that includes multiplemeasures of each of the constructs assessed by the CLDQ.
Skewed scores and restricted range on the CLDQ scales or external variables—A second concern related to the use of samples of convenience is the possibility that thedistribution of some measures might violate statistical assumptions of normality. Forexample, low scores on a CLDQ scale could be underrepresented in a clinic sample if mostcases seen by the clinic have difficulties related to a specific scale (e.g., CLDQ Readingscores in a clinic sample with a high proportion of RD cases). However, skewness andkurtosis were within normal limits (i.e., absolute value less than 1) for all CLDQ scales andexternal measures in the clinic samples, suggesting that correlations were not attenuated by arestricted range of scores. Distributions of CLDQ scores in the community samples werecharacterized by mild positive skew due to the large number of individuals with no learningdifficulties (skewness = 1.1 – 1.6), but skewness was adequately reduced after the data weresuitably transformed. Most importantly, the pattern of results was extremely similar in thefour samples for all primary analyses, suggesting that any violations of statisticalassumptions did not have a major impact on the results.
Use of the questionnaire for case formulation in the clinic samples—Althoughthe final clinical diagnosis was based primarily on other information obtained during theassessment, parent ratings on the CLDQ were one component of the clinical data used forcase formulation in the Denver clinic sample (in the Boulder clinic the CLDQ was includedsolely for research purposes to avoid this potential confound). If high ratings on the CLDQstrongly influenced the final diagnosis that a child received in the Denver sample, the meanCLDQ score of groups with specific diagnoses could be biased upward. Consistent with thishypothesis, the effect size for the RD group on the CLDQ Reading scale was higher in theDenver Clinic sample (dw = 1.92) than the community samples (dw = 1.64). However, theCLDQ Reading score in the Boulder Clinic sample (dw = 2.08) was even higher than thescore in the Denver clinic. Further, even in the community samples the effect size for theRD group was substantially larger on the CLDQ Reading scale than any other CLDQ scale,and there were no other significant differences between the clinical and community samplesfor any other comparison. Overall, this pattern of results suggests that although the means ofthe RD group on the CLDQ Reading scale were significantly higher in the clinic samples,this difference was not a specific consequence of the use of CLDQ scores as part of theoverall case formulation.
Small item pool for some constructs—The initial item pool for the CLDQ wasdeveloped to screen for a range of common parental concerns as part of a lengthydevelopmental history questionnaire completed by parents at the beginning of their child'sassessment. Therefore, it was not feasible to ask parents to complete the large number ofitems (i.e., 200 – 300) that are often included in an initial pool of items when the primarygoal of a study is the development and validation of a new measure (e.g., Achenbach &Rescorla, 2001; Lahey et al., 2004; Reynolds & Kamphaus, 2004). Due to the relativelysmall size of the initial item pool (46 items) and the exclusion of over half of the initialitems for theoretical and psychometric reasons, the CLDQ Math and Social Anxiety Scalesincluded only three items. As noted previously, additional items are currently beingevaluated to evaluate whether their inclusion improves the internal structure and convergentand discriminant evidence for these scales.
Willcutt et al. Page 13
Psychol Assess. Author manuscript; available in PMC 2012 September 1.
NIH
-PA Author Manuscript
NIH
-PA Author Manuscript
NIH
-PA Author Manuscript
Relevant constructs not measured by the CLDQ—The CLDQ does not assessseveral domains that are often correlated with learning difficulties, including written andspoken language, motor skills, and processing speed (e.g., Bishop & Snowling, 2004;Pitcher, Piek, & Barrett, 2002; Shanahan et al., 2006). In addition, although several items onthe initial scale were designed to measure memory difficulties, these items were droppedfrom the final scale due to weak psychometric characteristics or absence of loadings above .40 on any factor in the EFA.
Small samples with some clinical disorders—The two community samples wererecruited for studies of RD, ADHD, or both disorders. The assessment clinics received amore diverse range of referral questions, but a majority of the evaluations also focused onquestions regarding RD, ADHD, and related disorders. Therefore, in comparison to thesamples with RD or ADHD, a smaller number of participants met criteria for less commondisorders such as MD, NVLD, and PDD. Moreover, sample sizes were too small to examinepotentially important distinctions between disorders within these broad diagnostic clusters,such as Autistic Disorder versus Asperger's Disorder. Future studies of the relation betweenCLDQ scales and larger samples of individuals with these disorders would provide a usefulextension of the present results.
ConclusionsExploratory and confirmatory factor analyses of the Colorado Learning DifficultiesQuestionnaire (CLDQ) revealed five correlated but separable dimensions of learningdifficulties in children and adolescents. Results provide strong convergent and discriminantevidence for scores on a 6-item Reading scale, and suggest that this scale may provide auseful screening measure for reading difficulties in both research and clinical settings.Results are also promising for scales that assess math, social anxiety, social cognition, andspatial difficulties, but additional research is needed to address specific weaknessesidentified in each of these scales.
AcknowledgmentsThis research was supported by grants from the National Institute of Child Health and Human Development (P50HD27802) and the National Institute of Mental Health (R01 MH 62120, R01 MH 63941, and R01 MH 70037), andby annual Outreach grants from the University of Colorado, Boulder from 2004 – 2010. The authors were alsosupported by NIH grants R01 HD 47264, R01 DC 05190, R01 HD38526 during the preparation of this report.
ReferencesAchenbach, TM.; Rescorla, LA. Manual for ASEBA School-age Forms and Profiles. University of
Vermont Research Center for Children, Youth, and Families; Burlington, VT: 2001.American Psychiatric Association. Diagnostic and Statistical Manual of Mental Disorders, Fourth
Edition, Text Revision. American Psychiatric Association; Washington, DC: 2000.Antshel KM, Khan FM. Is There an Increased Familial Prevalence of Psychopathology in Children
With Nonverbal Learning Disorders? Journal of Learning Disabilities. 2008; 41:208–217. [PubMed:18434288]
Barkley, RA.; Murphy, K. Attention-deficit hyperactivity disorder: A clinical workbook. 2nd ed..Guilford Press; New York, NY: 1998.
Bates TC, Castles A, Luciano M, Wright MJ, Coltheart M, Martin NG. Genetic and environmentalbases of reading and spelling: A unified genetic dual route model. Reading and Writing. 2007;20:147–171.
Beery, KE.; Buktenica, NA. Beery-Buktenica Developmental Test of Visual-Motor Integration, FourthEdition. Modern Curriculum Press; Parsippany,NJ: 1997.
Willcutt et al. Page 14
Psychol Assess. Author manuscript; available in PMC 2012 September 1.
NIH
-PA Author Manuscript
NIH
-PA Author Manuscript
NIH
-PA Author Manuscript
Bentler PM. Comparative Fit Indexes in Structural Models. Psychological Bulletin. 1990; 107:238–246. [PubMed: 2320703]
Bishop DVM, Snowling MJ. Developmental dyslexia and specific language impairment: Same ordifferent? Psychological Bulletin. 2004; 130:858–886. [PubMed: 15535741]
Boetsch EA, Green PA, Pennington BF. Psychosocial correlates of dyslexia across the life span.Development and Psychopathology. 1996; 8:539–562.
Browne, MW.; Cudeck, R. Alternative ways of assessing model fit. In: Bollen, KA.; Long, JS., editors.Testing structural equation models. Sage; Newbury Park, CA: 1993. p. 136-162.
Byrne B, Samuelsson S, Wadsworth SJ, Hulslander J, Corley R, DeFries JC, et al. Longitudinal twinstudy of early literacy development: preschool through grade 1. Reading and Writing. 2007;20:77–102.
Chen F, Curran PJ, Bollen KA, Kirby J, Paxton P. An empirical evaluation of the use of fixed cutoffpoints in RMSEA test statistic in structural equation models. Sociological Methods and Research.2008; 36:462–494. [PubMed: 19756246]
Conners CK, Sitarenios G, Parker JD, Epstein JN. Revision and restandardization of the ConnersTeacher Rating Scale (CTRS-R): factor structure, reliability, and criterion validity. Journal ofAbnormal Child Psychology. 1998; 26:279–291. [PubMed: 9700520]
Daniel SS, Walsh AK, Goldston DB, Arnold EM, Reboussin BA, Wood FB. Suicidality, schooldropout, and reading problems among adolescents. Journal of Learning Disabilities. 2006; 39:507–514. [PubMed: 17165618]
DeFries JC, Filipek PA, Fulker DW, Olson RK, Pennington BF, Smith SD, et al. Colorado LearningDisabilities Research Center. Learning Disabilities: A Multidisciplinary Journal. 1997; 8:7–19.
DerSimonian R, Laird N. Metaanalysis in Clinical-Trials. Controlled Clinical Trials. 1986; 7:177–188.[PubMed: 3802833]
Dishion, T. The peer context of troublesome child and adolescent behavior. In: Leone, PE., editor.Understanding troubled and troubling youth. Sage; Newbury Park, CA: 1990.
Dunn, LM.; Markwardt, FC. Examiner's Manual: Peabody Individual Achievement Test. AmericanGuidance Service; Circle Pines, MN: 1970.
DuPaul, GJ.; Power, TP.; Anastopoulos, AD.; Reid, R. ADHD Rating Scale - IV. Guilford Press; NewYork: 1998.
Fan XB, Thompson B, Wang L. Effects of sample size, estimation method, and model specification onstructural equation modeling fit indexes. Structural Equation Modeling. 1999; 6:56–83.
Forrest BJ. The utility of math difficulties, internalized psychopathology, and visual-spatial deficits toidentify children with the nonverbal learning disability syndrome: Evidence for a visualspatialdisability. Child Neuropsychology. 2004; 10:129–146. [PubMed: 15590491]
Gadow, KD.; Sprafkin, J. Childhood Symptom Inventory 4: Norms Manual. Checkmate Plus; StonyBrook, NY: 1997a.
Gadow, KD.; Sprafkin, J. Early Childhood Inventory 4: Norms Manual. Checkmate Plus; StonyBrook, NY: 1997b.
Gadow, KD.; Sprafkin, J. Adolescent Symptom Inventory 4: Norms Manual. Checkmate Plus; StonyBrook, NY: 1998.
Goldston DB, Walsh A, Mayfield AE, Reboussin B, Sergent DS, Erkanli A, et al. Reading problems,psychiatric disorders, and functional impairment from mid- to late adolescence. Journal of theAmerican Academy of Child and Adolescent Psychiatry. 2007; 46:25–32. [PubMed: 17195726]
Gross-Tsur V, Manor O, Shalev RS. Developmental dyscalculia: prevalence and demographicfeatures. Developmental Medicine and Child Neurology. 1996; 38:25–33. [PubMed: 8606013]
Hartman CA, Luteijn E, Serra M, Minderaa R. Refinement of the children's social behaviorquestionnaire (CSBQ): An instrument that describes the diverse problems seen in milder forms ofPDD. Journal of Autism and Developmental Disorders. 2006; 36:325–342. [PubMed: 16617405]
Hay D, Martin N, Piek J, Levy F, Sheikhi A. A parent-report approach to the genetics of therelationship between ADHD and reading problems. Behavior Genetics. 2005; 35:805.
Hedges, LV.; Olkin, I. Statistical methods for meta-analysis. Academic Press; Orlando, FL: 1985.
Willcutt et al. Page 15
Psychol Assess. Author manuscript; available in PMC 2012 September 1.
NIH
-PA Author Manuscript
NIH
-PA Author Manuscript
NIH
-PA Author Manuscript
Higgins JPT, Thompson SG. Quantifying heterogeneity in a meta-analysis. Statistics in Medicine.2002; 21:1539–1558. [PubMed: 12111919]
Jastak, S.; Wilkinson, GS. Wide Range Achievement Test, Revised: Administration Manual.Wilmington, DE: 1984.
Klin A, Volkmar FR, Sparrow SS, Cicchetti DV, Rourke BP. Validity and NeuropsychologicalCharacterization of Asperger Syndrome - Convergence with Nonverbal Learning-DisabilitiesSyndrome. Journal of Child Psychology and Psychiatry and Allied Disciplines. 1995; 36:1127–1140.
Kovacs, M. The Children's Depression Inventory. Multi-health Systems, Inc.; New York: 1988.Lahey BB, Applegate B, Waldman ID, Loft JD, Hankin BL, Rick J. The structure of child and
adolescent psychopathology: generating new hypotheses. Journal of Abnormal Psychology. 2004;113:358–385. [PubMed: 15311983]
Luteijn E, Luteijn F, Jackson S, Volkmar F, Minderaa R. The children's Social Behavior Questionnairefor milder variants of PDD problems: evaluation of the psychometric characteristics. Journal ofAutism and Developmental Disorders. 2000; 30:317–330. [PubMed: 11039858]
Luteijn EEF, Jackson SAE, Volkmar FR, Minderaa RB. Brief report: The development of theChildren's Social Behavior Questionnaire: Preliminary data. Journal of Autism and DevelopmentalDisorders. 1998; 28:559–565. [PubMed: 9932242]
Maughan B, Rowe R, Loeber R, Stouthamer-Loeber M. Reading problems and depressed mood.Journal of Abnormal Child Psychology. 2003; 31:219–229. [PubMed: 12735404]
McGee R, Prior M, Willams S, Smart D, Sanson A. The long-term significance of teacher-ratedhyperactivity and reading ability in childhood: findings from two longitudinal studies. Journal ofChild Psychology and Psychiatry. 2002; 43:1004–1017. [PubMed: 12455922]
Meyers, JE.; Meyers, KR. Rey Complex Figure Test and Recognition Trial. Psychological AssessmentResources; Odessa, FL: 1995.
Muthen, LK.; Muthen, BO. Mplus User's Guide: Fourth Edition. Muthen and Muthen; Los Angeles,CA: 2009.
Paloyelis Y, Rijsdijk F, Wood AC, Asherson P, Kuntsi J. The genetic association between ADHDsymptoms and reading difficulties: The role of inattentiveness and IQ. Journal of Abnormal ChildPsychology. in press.
Petrill SA, Deater-Deckard K, Thompson LA, Schatschneider C, Dethorne LS, Vandenbergh DJ.Longitudinal genetic analysis of early reading: The Western Reserve Reading Project. Readingand Writing. 2007; 20:127–146. [PubMed: 19829751]
Petti VL, Voelker SL, Shore DL, Hayman-Abello SE. Perception of nonverbal emotion cues bychildren with nonverbal learning disabilities. Journal of Developmental and Physical Disabilities.2003; 15:23–36.
Pitcher TM, Piek JP, Barrett NC. Timing and force control in boys with attention deficit hyperactivitydisorder: subtype differences and the effect of comorbid developmental coordination disorder.Human Movement Science. 2002; 21:919–945. [PubMed: 12620726]
Reich, W.; Welner, Z.; Herjanic, B. Diagnostic Interview for Children and Adolescents - IV. Multi-Health System, Inc.; North Towanda Falls, NY: 1997.
Rey A. L'examen psychologique dans les cas d'encephalopathie tramatique. Archives of Psychology.1941; 28:286–340.
Reynolds, CR.; Kamphaus, RW. Behavior Assessment System for Children. American GuidanceService; Circle Pines, MN: 1992.
Reynolds, CR.; Kamphaus, RW. Behavior Assessment System for Children, Second Edition.American Guidance Service; Circle Pines, MN: 2004.
Rourke, BP. Nonverbal Learning Disabilities: The Syndrome and the Model. Guilford; New York:1989.
Rutter M, Caspi A, Fergusson D, Horwood LJ, Goodman R, Maughan B, et al. Sex differences indevelopmental reading disability - New findings from 4 epidemiological studies. Journal of theAmerican Medical Association. 2004; 291:2007–2012. [PubMed: 15113820]
Schnoes C, Reid R, Wagner M, Marder C. ADHD among students receiving special educationservices: A national survey. Exceptional Children. 2006; 72:483–496.
Willcutt et al. Page 16
Psychol Assess. Author manuscript; available in PMC 2012 September 1.
NIH
-PA Author Manuscript
NIH
-PA Author Manuscript
NIH
-PA Author Manuscript
Schumacker, RE.; Lomax, RG. A beginner's guide to structural equation modeling, second edition.Lawrence Erlbaum Associates; Mahwah,NJ: 2004.
Semrud-Clikeman M, Biederman J, Sprich-Buckminster S, Lehman BK, Faraone SV, Norman D.Comorbidity between ADDH and learning disability: a review and report in a clinically referredsample. Journal of the American Academy of Child and Adolescent Psychiatry. 1992; 31:439–448.[PubMed: 1592775]
Shanahan MA, Pennington BF, Yerys BE, Scott A, Boada R, Willcutt EG, et al. Processing speeddeficits in attention deficit/hyperactivity disorder and reading disability. Journal of AbnormalChild Psychology. 2006; 34:585–602. [PubMed: 16850284]
Shaywitz SE, Shaywitz BA, Fletcher JM, Escobar MD. Prevalence of reading disability in boys andgirls. Results of the Connecticut Longitudinal Study. Journal of the American MedicalAssociation. 1990; 264:998–1002. [PubMed: 2376893]
Thurstone, TG. Examiners' manual: Primary Mental Abilities. Science Research Associates; Chicago,IL: 1963.
Trzesniewski KH, Moffitt TE, Caspi A, Taylor A, Maughan B. Revisiting the association betweenreading achievement and antisocial behavior: new evidence of an environmental explanation froma twin study. Child Development. 2006; 77:72–88. [PubMed: 16460526]
Wechsler, D. Manual for the Wechsler Intelligence Scale for Children, Revised. The PsychologicalCorporation; New York, NY: 1974.
Wechsler, D. Manual for the Wechsler Intelligence Scale for Children, Third Edition. ThePsychological Corporation; San Antonio,TX: 1991.
Wechsler, D. Manual for the Wechsler Intelligence Scale for Children, Fourth Edition. ThePsychological Corporation; San Antonio,TX: 2003.
Wiederhold, JL.; Bryant, BR. Gray Oral Reading Test - Third Edition. Pro-Ed; Austin, TX: 1993.Wiederhold, JL.; Bryant, BR. Gray Oral Reading Test - Fourth Edition. Pro-Ed; Austin, TX: 2001.Wilkinson, GS. Examiner's Manual: Wide Range Achievement Test - 3. Jastak Associates - Wide
Range, Inc.; Wilmington, DE: 1993.Willcutt EG, Betjemann RS, Pennington BF, Olson RK, DeFries JC, Wadsworth SJ. Longitudinal
study of reading disability and attention-deficit/hyperactivity disorder: Implications for education.Mind, Brain, and Education. 2007; 4:181–192.
Willcutt EG, Pennington BF. Comorbidity of reading disability and attention-deficit/hyperactivitydisorder: differences by gender and subtype. Journal of Learning Disabilities. 2000a; 33:179–191.[PubMed: 15505947]
Willcutt EG, Pennington BF. Psychiatric comorbidity in children and adolescents with readingdisability. Journal of Child Psychology and Psychiatry. 2000b; 41:1039–1048. [PubMed:11099120]
Willcutt EG, Pennington BF, Olson RK, Chhabildas N, Hulslander J. Neuropsychological analyses ofcomorbidity between reading disability and attention deficit hyperactivity disorder: in search of thecommon deficit. Developmental Neuropsychology. 2005; 27:35–78. [PubMed: 15737942]
Woodcock, RW.; Johnson, MB. Manual for the Woodcock-Johnson Psycho-educational Battery -Revised (WJ-R). Riverside Publishing Company; Chicago, IL: 1990.
Woodcock, RW.; McGrew, KS.; Mather, N. Woodcock-Johnson III Tests of Achievement. RiversidePublishing; Itasca,IL: 2001.
Willcutt et al. Page 17
Psychol Assess. Author manuscript; available in PMC 2012 September 1.
NIH
-PA Author Manuscript
NIH
-PA Author Manuscript
NIH
-PA Author Manuscript
NIH
-PA Author Manuscript
NIH
-PA Author Manuscript
NIH
-PA Author Manuscript
Willcutt et al. Page 18
Tabl
e 1
Des
crip
tion
of sa
mpl
es
Den
ver
Clin
icB
ould
er C
linic
Tw
in S
ampl
eC
omm
unity
Sam
ple
Des
crip
tive
Cha
ract
eris
tics
Tota
l N95
417
91,
840
5,03
1a
Type
of s
ampl
eC
linic
Clin
icC
omm
unity
Com
mun
ity
Sele
ctio
n of
sam
ple
Con
secu
tive
Cas
esC
onse
cutiv
e C
ases
Enric
hed
for R
D &
AD
HD
Uns
elec
teda
Perc
ent f
emal
eb32
.2%
a33
.5%
a50
.8%
b51
.6%
b
Age
rang
e6
– 18
6 –
188
– 18
6 –
14
Mea
n A
ge (S
D)b
11.0
(3.5
)10
.9 (3
.2)
11.2
(2.6
)10
.8 (2
.9)
% W
hite
, non
-his
pani
cb89
.0%
a85
.9%
a83
.3%
a58
.7%
b
Fath
er y
ears
of e
duca
tionb
16.9
(2.9
)a17
.3 (2
.9)a
14.7
(2.7
)b13
.4 (2
.7)c
Mot
her y
ears
of e
duca
tionb
16.2
(2.5
)a16
.7 (3
.4)a
14.4
(2.4
)b13
.9 (2
.9)c
Dia
gnos
es
N%
N%
N%
N%
No
Dia
gnos
is44
4.6%
95.
0%86
847
.2%
4,54
790
.4%
Rea
ding
Dis
orde
r42
244
.2%
6938
.5%
496
27.0
%54
d5.
3%
Mat
h or
Non
verb
al L
D36
3.8%
1910
.6%
131d
7.1%
41d
4.0%
AD
HD
Inat
tent
ive
Type
135
14.2
%50
27.9
%27
314
.8%
246
4.9%
AD
HD
Com
bine
d Ty
pe27
729
.0%
6737
.4%
133
7.2%
238
4.7%
Dis
rupt
ive
Dis
orde
rs21
2.2%
158.
4%25
814
.0%
147f
20.5
%
Moo
d D
isor
der
949.
9%14
7.8%
824.
5%31
f4.
3%
Anx
iety
Dis
orde
r22
2.3%
116.
1%30
916
.8%
22f
3.1%
Perv
asiv
e D
evel
op. D
isor
der
151.
6%10
5.6%
--g
--g
240.
5%
Oth
er d
iagn
osis
127h
13.3
%9i
5.0%
----
----
Not
e. --
indi
cate
s var
iabl
e no
t ass
esse
d.
a An
initi
al u
nsel
ecte
d sa
mpl
e of
5,0
31 c
hild
ren
was
scre
ened
for A
DH
D, a
nd a
rand
om sa
mpl
e of
indi
vidu
als w
ith a
nd w
ithou
t AD
HD
wer
e re
crui
ted
for t
he d
etai
led
asse
ssm
ent.
b Diff
eren
t sub
scrip
ts in
dica
te a
sign
ifica
nt d
iffer
ence
bet
wee
n sa
mpl
es (P
< .0
1)
Psychol Assess. Author manuscript; available in PMC 2012 September 1.
NIH
-PA Author Manuscript
NIH
-PA Author Manuscript
NIH
-PA Author Manuscript
Willcutt et al. Page 19c N
s ind
icat
e to
tal n
umbe
r of p
artic
ipan
ts w
ith e
ach
diag
nosi
s. B
ecau
se m
any
parti
cipa
nts m
et c
riter
ia fo
r mor
e th
an o
ne d
isor
der,
the
sum
of t
he N
s for
all
diag
nose
s is m
ore
than
the
tota
l num
ber o
fpa
rtici
pant
s.
d Com
orbi
d LD
s wer
e as
sess
ed in
1,0
48 c
hild
ren
who
com
plet
ed a
chie
vem
ent t
estin
g as
par
t of t
he d
etai
led
asse
ssm
ent.
d Mat
h ac
hiev
emen
t ass
esse
d in
1,0
14 in
divi
dual
s.
f Dis
orde
r ass
esse
d in
the
716
parti
cipa
nts w
hose
par
ents
com
plet
ed a
dia
gnos
tic in
terv
iew
.
g Excl
usio
n cr
iterio
n.
h Tour
ette
s / T
ic D
isor
der (
N =
14)
, Cog
nitiv
e D
isor
der,
not o
ther
wis
e sp
ecifi
ed (N
= 5
4), O
bses
sive
-com
puls
ive
diso
rder
(N =
4),
Phon
olog
ical
/ Sp
eech
Dis
orde
rs (N
= 1
7), R
ecep
tive
/ Exp
ress
ive
Lang
uage
Dis
orde
r (N
= 3
8).
i Tour
ette
s / T
ic D
isor
der (
N =
1),
Obs
essi
ve-c
ompu
lsiv
e di
sord
er (N
= 1
), R
ecep
tive
/ Exp
ress
ive
Lang
uage
Dis
orde
r (N
= 5
).
Psychol Assess. Author manuscript; available in PMC 2012 September 1.
NIH
-PA Author Manuscript
NIH
-PA Author Manuscript
NIH
-PA Author Manuscript
Willcutt et al. Page 20
Table 2
The 46 items on the initial CLDQ
Items included on the final scale a
1. Difficulty with spelling
2. Difficulty learning letter names
3. Difficulty learning phonics (sounding out words)
4. Read slowly
5. Read below grade or expectancy level
6. Required extra help in school because of problems in reading and spelling
7. Poor understanding of interpersonal space
8. Difficulty knowing how others are reacting
9. Has trouble understanding how others are feeling
10. Makes comments that show a lack of understanding of social situations, such as inappropriate jokes or insensitive remarks
11. Difficulty making or keeping friends
12. Isolates self in social situations
13. Feels anxious or out-of-place in new social situations
14. Handwriting is spatially disorganized
15. Papers look disorganized or messy
16. On arithmetic problems, has difficulty keeping the numbers lined up in columns
17. Drawings look immature for her/his age
18. Worse at math than at reading and spelling
19. Makes careless errors in math, such as adding when the sign indicates subtraction
20. Trouble learning new math concepts such as carrying or borrowing
Items dropped because they assess behaviors related to ADHD
21. Leaves things unfinished, like starting a game and then running off to do something else
22. Gets into trouble because he/she rushes into doing things without thinking about what could happen
23. Rush through assignments without checking them
24. Teachers often have to tell her/him what to do after the rest of the class has started
25. When playing games or lining up for class, tries to get in before his/her turn or pushes ahead in line
26. People keep telling your child to sit still
27. People keep telling your child to stop fidgeting
28. People tell you that your child is (was) always on the go, as if he/she was driven by a motor
29. Difficulty keeping his/her mind on things he/she enjoys, such as reading a story or watching TV
30. Trouble sticking to what he/she is told to do if there are noises or people moving around in the room
31. Loses or misplaces things more than others
Items dropped because they assess behaviors related to depression
32. Sad or unhappy
33. Seems to have less energy than others his/her age
34. Seems to feel at fault when something goes wrong
35. Says things like “I wish I were dead” or “I wish I had never been born”
36. Expressed more definite suicidal thoughts or wishes
Items dropped because they did not load above .40 on any factor or had weak reliability.
Psychol Assess. Author manuscript; available in PMC 2012 September 1.
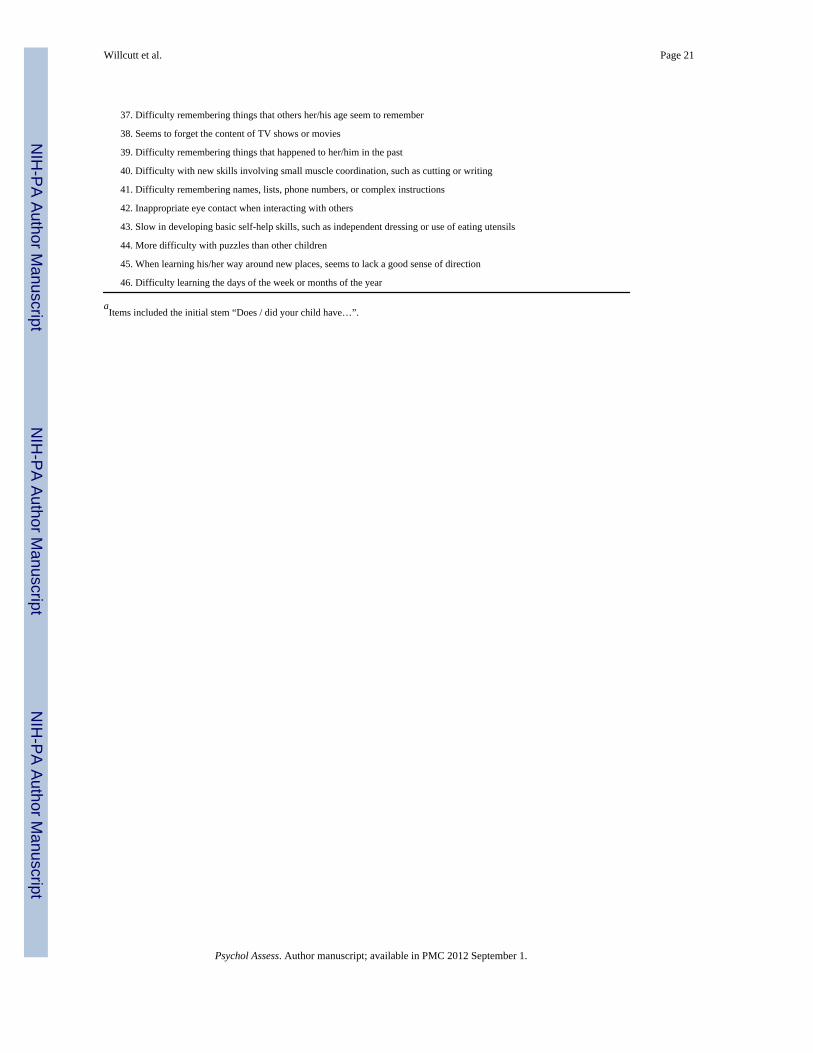
NIH
-PA Author Manuscript
NIH
-PA Author Manuscript
NIH
-PA Author Manuscript
Willcutt et al. Page 21
37. Difficulty remembering things that others her/his age seem to remember
38. Seems to forget the content of TV shows or movies
39. Difficulty remembering things that happened to her/him in the past
40. Difficulty with new skills involving small muscle coordination, such as cutting or writing
41. Difficulty remembering names, lists, phone numbers, or complex instructions
42. Inappropriate eye contact when interacting with others
43. Slow in developing basic self-help skills, such as independent dressing or use of eating utensils
44. More difficulty with puzzles than other children
45. When learning his/her way around new places, seems to lack a good sense of direction
46. Difficulty learning the days of the week or months of the year
aItems included the initial stem “Does / did your child have…”.
Psychol Assess. Author manuscript; available in PMC 2012 September 1.
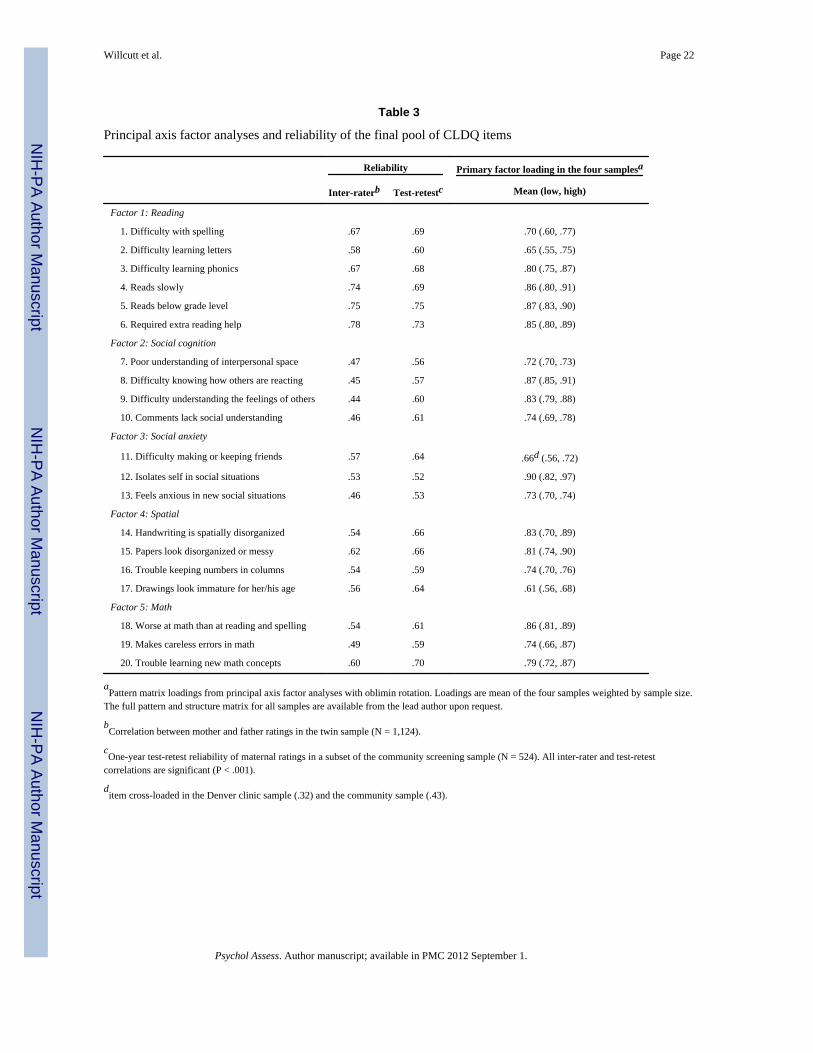
NIH
-PA Author Manuscript
NIH
-PA Author Manuscript
NIH
-PA Author Manuscript
Willcutt et al. Page 22
Table 3
Principal axis factor analyses and reliability of the final pool of CLDQ items
Reliability Primary factor loading in the four samplesa
Inter-raterb Test-retestc Mean (low, high)
Factor 1: Reading
1. Difficulty with spelling .67 .69 .70 (.60, .77)
2. Difficulty learning letters .58 .60 .65 (.55, .75)
3. Difficulty learning phonics .67 .68 .80 (.75, .87)
4. Reads slowly .74 .69 .86 (.80, .91)
5. Reads below grade level .75 .75 .87 (.83, .90)
6. Required extra reading help .78 .73 .85 (.80, .89)
Factor 2: Social cognition
7. Poor understanding of interpersonal space .47 .56 .72 (.70, .73)
8. Difficulty knowing how others are reacting .45 .57 .87 (.85, .91)
9. Difficulty understanding the feelings of others .44 .60 .83 (.79, .88)
10. Comments lack social understanding .46 .61 .74 (.69, .78)
Factor 3: Social anxiety
11. Difficulty making or keeping friends .57 .64 .66d (.56, .72)
12. Isolates self in social situations .53 .52 .90 (.82, .97)
13. Feels anxious in new social situations .46 .53 .73 (.70, .74)
Factor 4: Spatial
14. Handwriting is spatially disorganized .54 .66 .83 (.70, .89)
15. Papers look disorganized or messy .62 .66 .81 (.74, .90)
16. Trouble keeping numbers in columns .54 .59 .74 (.70, .76)
17. Drawings look immature for her/his age .56 .64 .61 (.56, .68)
Factor 5: Math
18. Worse at math than at reading and spelling .54 .61 .86 (.81, .89)
19. Makes careless errors in math .49 .59 .74 (.66, .87)
20. Trouble learning new math concepts .60 .70 .79 (.72, .87)
aPattern matrix loadings from principal axis factor analyses with oblimin rotation. Loadings are mean of the four samples weighted by sample size.
The full pattern and structure matrix for all samples are available from the lead author upon request.
bCorrelation between mother and father ratings in the twin sample (N = 1,124).
cOne-year test-retest reliability of maternal ratings in a subset of the community screening sample (N = 524). All inter-rater and test-retest
correlations are significant (P < .001).
ditem cross-loaded in the Denver clinic sample (.32) and the community sample (.43).
Psychol Assess. Author manuscript; available in PMC 2012 September 1.
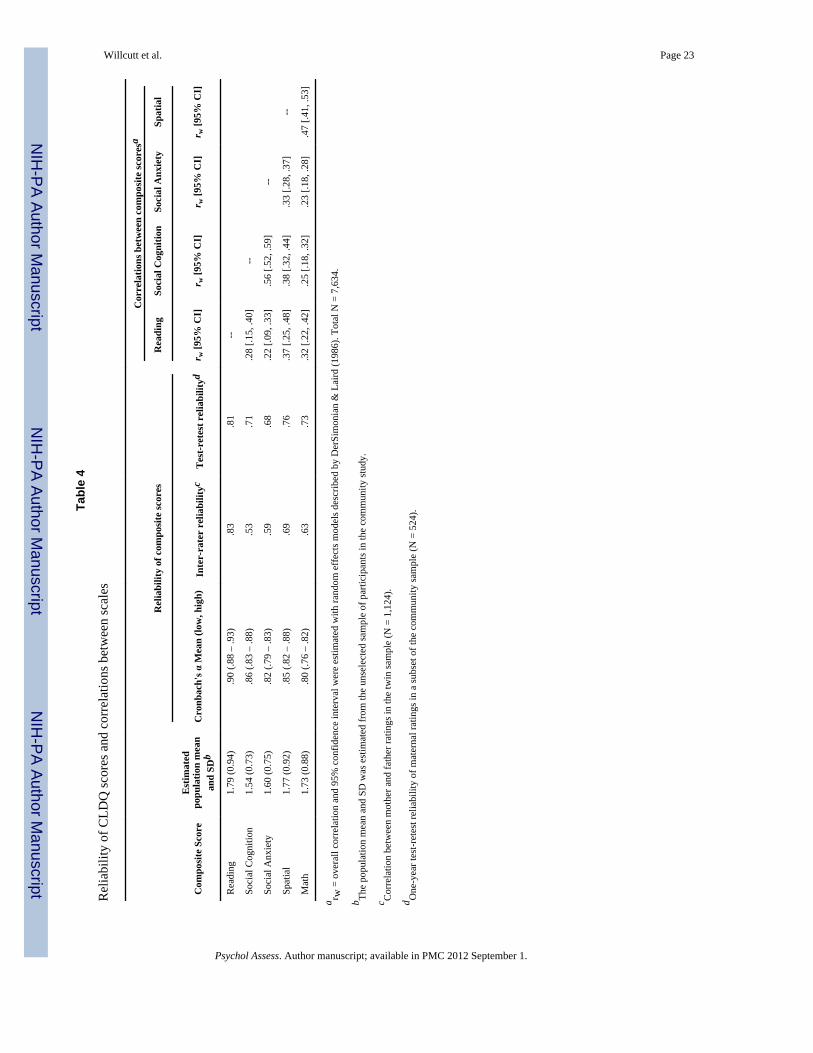
NIH
-PA Author Manuscript
NIH
-PA Author Manuscript
NIH
-PA Author Manuscript
Willcutt et al. Page 23
Tabl
e 4
Rel
iabi
lity
of C
LDQ
scor
es a
nd c
orre
latio
ns b
etw
een
scal
es
Cor
rela
tions
bet
wee
n co
mpo
site
scor
esa
Rel
iabi
lity
of c
ompo
site
scor
esR
eadi
ngSo
cial
Cog
nitio
nSo
cial
Anx
iety
Spat
ial
Com
posi
te S
core
Est
imat
edpo
pula
tion
mea
nan
d SD
bC
ronb
ach'
s α M
ean
(low
, hig
h)In
ter-
rate
r re
liabi
lityc
Tes
t-ret
est r
elia
bilit
ydr w
[95%
CI]
r w [9
5% C
I]r w
[95%
CI]
r w [9
5% C
I]
Rea
ding
1.79
(0.9
4).9
0 (.8
8 –
.93)
.83
.81
--
Soci
al C
ogni
tion
1.54
(0.7
3).8
6 (.8
3 –
.88)
.53
.71
.28
[.15,
.40]
--
Soci
al A
nxie
ty1.
60 (0
.75)
.82
(.79
– .8
3).5
9.6
8.2
2 [.0
9, .3
3].5
6 [.5
2, .5
9]--
Spat
ial
1.77
(0.9
2).8
5 (.8
2 –
.88)
.69
.76
.37
[.25,
.48]
.38
[.32,
.44]
.33
[.28,
.37]
--
Mat
h1.
73 (0
.88)
.80
(.76
– .8
2).6
3.7
3.3
2 [.2
2, .4
2].2
5 [.1
8, .3
2].2
3 [.1
8, .2
8].4
7 [.4
1, .5
3]
a r w =
ove
rall
corr
elat
ion
and
95%
con
fiden
ce in
terv
al w
ere
estim
ated
with
rand
om e
ffec
ts m
odel
s des
crib
ed b
y D
erSi
mon
ian
& L
aird
(198
6). T
otal
N =
7,6
34.
b The
popu
latio
n m
ean
and
SD w
as e
stim
ated
from
the
unse
lect
ed sa
mpl
e of
par
ticip
ants
in th
e co
mm
unity
stud
y.
c Cor
rela
tion
betw
een
mot
her a
nd fa
ther
ratin
gs in
the
twin
sam
ple
(N =
1,1
24).
d One
-yea
r tes
t-ret
est r
elia
bilit
y of
mat
erna
l rat
ings
in a
subs
et o
f the
com
mun
ity sa
mpl
e (N
= 5
24).
Psychol Assess. Author manuscript; available in PMC 2012 September 1.
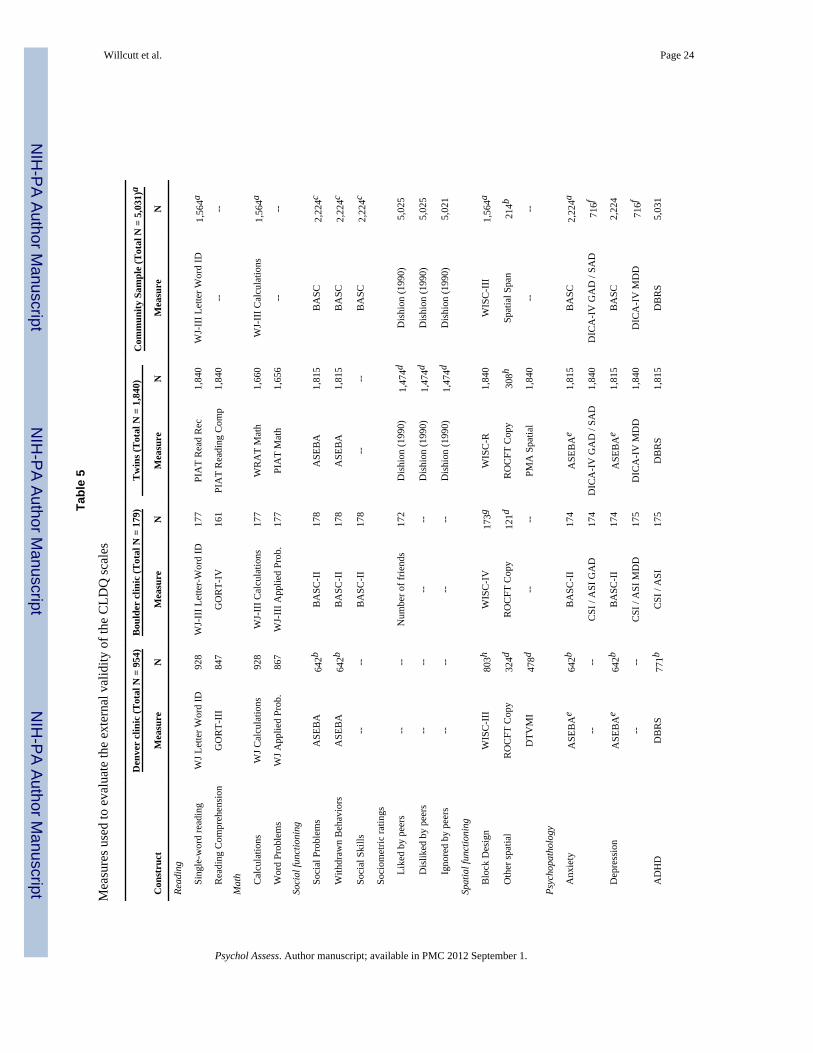
NIH
-PA Author Manuscript
NIH
-PA Author Manuscript
NIH
-PA Author Manuscript
Willcutt et al. Page 24
Tabl
e 5
Mea
sure
s use
d to
eva
luat
e th
e ex
tern
al v
alid
ity o
f the
CLD
Q sc
ales
Den
ver
clin
ic (T
otal
N =
954
)B
ould
er c
linic
(Tot
al N
= 1
79)
Tw
ins (
Tot
al N
= 1
,840
)C
omm
unity
Sam
ple
(Tot
al N
= 5
,031
)a
Con
stru
ctM
easu
reN
Mea
sure
NM
easu
reN
Mea
sure
N
Read
ing
Si
ngle
-wor
d re
adin
gW
J Let
ter W
ord
ID92
8W
J-II
I Let
ter-
Wor
d ID
177
PIA
T R
ead
Rec
1,84
0W
J-II
I Let
ter W
ord
ID1,
564a
R
eadi
ng C
ompr
ehen
sion
GO
RT-
III
847
GO
RT-
IV16
1PI
AT
Rea
ding
Com
p1,
840
----
Mat
h
C
alcu
latio
nsW
J Cal
cula
tions
928
WJ-
III C
alcu
latio
ns17
7W
RA
T M
ath
1,66
0W
J-II
I Cal
cula
tions
1,56
4a
W
ord
Prob
lem
sW
J App
lied
Prob
.86
7W
J-II
I App
lied
Prob
.17
7PI
AT
Mat
h1,
656
----
Soci
al fu
nctio
ning
So
cial
Pro
blem
sA
SEB
A64
2bB
ASC
-II
178
ASE
BA
1,81
5B
ASC
2,22
4c
W
ithdr
awn
Beh
avio
rsA
SEB
A64
2bB
ASC
-II
178
ASE
BA
1,81
5B
ASC
2,22
4c
So
cial
Ski
lls--
--B
ASC
-II
178
----
BA
SC2,
224c
So
ciom
etric
ratin
gs
Like
d by
pee
rs--
--N
umbe
r of f
riend
s17
2D
ishi
on (1
990)
1,47
4dD
ishi
on (1
990)
5,02
5
Dis
liked
by
peer
s--
----
--D
ishi
on (1
990)
1,47
4dD
ishi
on (1
990)
5,02
5
Igno
red
by p
eers
----
----
Dis
hion
(199
0)1,
474d
Dis
hion
(199
0)5,
021
Spat
ial f
unct
ioni
ng
B
lock
Des
ign
WIS
C-I
II80
3hW
ISC
-IV
173g
WIS
C-R
1,84
0W
ISC
-III
1,56
4a
O
ther
spat
ial
RO
CFT
Cop
y32
4dR
OC
FT C
opy
121d
RO
CFT
Cop
y30
8hSp
atia
l Spa
n21
4b
DTV
MI
478d
----
PMA
Spa
tial
1,84
0--
--
Psyc
hopa
thol
ogy
A
nxie
tyA
SEB
Ae
642b
BA
SC-I
I17
4A
SEB
Ae
1,81
5B
ASC
2,22
4a
----
CSI
/ A
SI G
AD
174
DIC
A-I
V G
AD
/ SA
D1,
840
DIC
A-I
V G
AD
/ SA
D71
6f
D
epre
ssio
nA
SEB
Ae
642b
BA
SC-I
I17
4A
SEB
Ae
1,81
5B
ASC
2,22
4
----
CSI
/ A
SI M
DD
175
DIC
A-I
V M
DD
1,84
0D
ICA
-IV
MD
D71
6f
A
DH
DD
BR
S77
1bC
SI /
ASI
175
DB
RS
1,81
5D
BR
S5,
031
Psychol Assess. Author manuscript; available in PMC 2012 September 1.
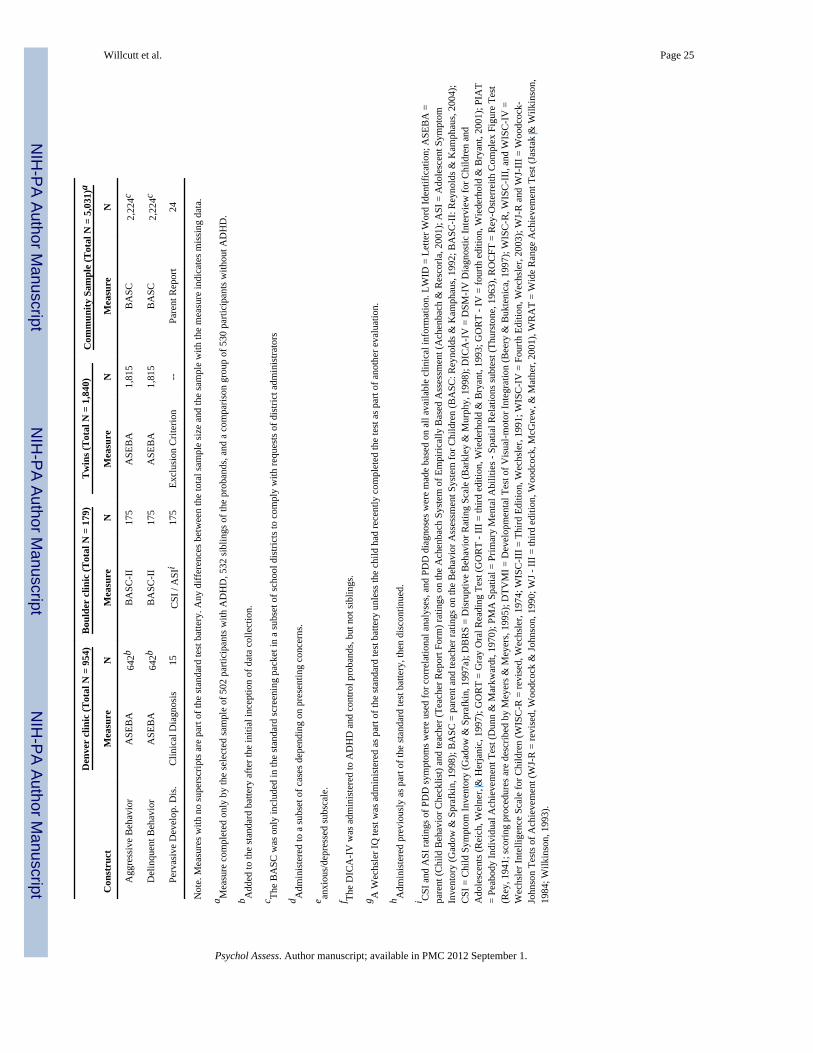
NIH
-PA Author Manuscript
NIH
-PA Author Manuscript
NIH
-PA Author Manuscript
Willcutt et al. Page 25
Den
ver
clin
ic (T
otal
N =
954
)B
ould
er c
linic
(Tot
al N
= 1
79)
Tw
ins (
Tot
al N
= 1
,840
)C
omm
unity
Sam
ple
(Tot
al N
= 5
,031
)a
Con
stru
ctM
easu
reN
Mea
sure
NM
easu
reN
Mea
sure
N
A
ggre
ssiv
e B
ehav
ior
ASE
BA
642b
BA
SC-I
I17
5A
SEB
A1,
815
BA
SC2,
224c
D
elin
quen
t Beh
avio
rA
SEB
A64
2bB
ASC
-II
175
ASE
BA
1,81
5B
ASC
2,22
4c
Pe
rvas
ive
Dev
elop
. Dis
.C
linic
al D
iagn
osis
15C
SI /
ASI
i17
5Ex
clus
ion
Crit
erio
n--
Pare
nt R
epor
t24
Not
e. M
easu
res w
ith n
o su
pers
crip
ts a
re p
art o
f the
stan
dard
test
bat
tery
. Any
diff
eren
ces b
etw
een
the
tota
l sam
ple
size
and
the
sam
ple
with
the
mea
sure
indi
cate
s mis
sing
dat
a.
a Mea
sure
com
plet
ed o
nly
by th
e se
lect
ed sa
mpl
e of
502
par
ticip
ants
with
AD
HD
, 532
sibl
ings
of t
he p
roba
nds,
and
a co
mpa
rison
gro
up o
f 530
par
ticip
ants
with
out A
DH
D.
b Add
ed to
the
stan
dard
bat
tery
afte
r the
initi
al in
cept
ion
of d
ata
colle
ctio
n.
c The
BA
SC w
as o
nly
incl
uded
in th
e st
anda
rd sc
reen
ing
pack
et in
a su
bset
of s
choo
l dis
trict
s to
com
ply
with
requ
ests
of d
istri
ct a
dmin
istra
tors
d Adm
inis
tere
d to
a su
bset
of c
ases
dep
endi
ng o
n pr
esen
ting
conc
erns
.
e anxi
ous/
depr
esse
d su
bsca
le.
f The
DIC
A-I
V w
as a
dmin
iste
red
to A
DH
D a
nd c
ontro
l pro
band
s, bu
t not
sibl
ings
.
g A W
echs
ler I
Q te
st w
as a
dmin
iste
red
as p
art o
f the
stan
dard
test
bat
tery
unl
ess t
he c
hild
had
rece
ntly
com
plet
ed th
e te
st a
s par
t of a
noth
er e
valu
atio
n.
h Adm
inis
tere
d pr
evio
usly
as p
art o
f the
stan
dard
test
bat
tery
, the
n di
scon
tinue
d.
i CSI
and
ASI
ratin
gs o
f PD
D sy
mpt
oms w
ere
used
for c
orre
latio
nal a
naly
ses,
and
PDD
dia
gnos
es w
ere
mad
e ba
sed
on a
ll av
aila
ble
clin
ical
info
rmat
ion.
LW
ID =
Let
ter W
ord
Iden
tific
atio
n; A
SEB
A =
pare
nt (C
hild
Beh
avio
r Che
cklis
t) an
d te
ache
r (Te
ache
r Rep
ort F
orm
) rat
ings
on
the
Ach
enba
ch S
yste
m o
f Em
piric
ally
Bas
ed A
sses
smen
t (A
chen
bach
& R
esco
rla, 2
001)
; ASI
= A
dole
scen
t Sym
ptom
Inve
ntor
y (G
adow
& S
praf
kin,
199
8); B
ASC
= p
aren
t and
teac
her r
atin
gs o
n th
e B
ehav
ior A
sses
smen
t Sys
tem
for C
hild
ren
(BA
SC: R
eyno
lds &
Kam
phau
s, 19
92; B
ASC
-II:
Rey
nold
s & K
amph
aus,
2004
);C
SI =
Chi
ld S
ympt
om In
vent
ory
(Gad
ow &
Spr
afki
n, 1
997a
); D
BR
S =
Dis
rupt
ive
Beh
avio
r Rat
ing
Scal
e (B
arkl
ey &
Mur
phy,
199
8); D
ICA
-IV
= D
SM-I
V D
iagn
ostic
Inte
rvie
w fo
r Chi
ldre
n an
dA
dole
scen
ts (R
eich
, Wel
ner,
& H
erja
nic,
199
7); G
OR
T =
Gra
y O
ral R
eadi
ng T
est (
GO
RT
- III
= th
ird e
ditio
n, W
iede
rhol
d &
Bry
ant,
1993
; GO
RT
- IV
= fo
urth
edi
tion,
Wie
derh
old
& B
ryan
t, 20
01);
PIA
T=
Peab
ody
Indi
vidu
al A
chie
vem
ent T
est (
Dun
n &
Mar
kwar
dt, 1
970)
; PM
A S
patia
l = P
rimar
y M
enta
l Abi
litie
s - S
patia
l Rel
atio
ns su
btes
t (Th
urst
one,
196
3), R
OC
FT =
Rey
-Ost
erre
ith C
ompl
ex F
igur
e Te
st(R
ey, 1
941;
scor
ing
proc
edur
es a
re d
escr
ibed
by
Mey
ers &
Mey
ers,
1995
); D
TVM
I = D
evel
opm
enta
l Tes
t of V
isua
l-mot
or In
tegr
atio
n (B
eery
& B
ukte
nica
, 199
7); W
ISC
-R, W
ISC
-III
, and
WIS
C-I
V =
Wec
hsle
r Int
ellig
ence
Sca
le fo
r Chi
ldre
n (W
ISC
-R =
revi
sed,
Wec
hsle
r, 19
74; W
ISC
-III
= T
hird
Edi
tion,
Wec
hsle
r, 19
91; W
ISC
-IV
= F
ourth
Edi
tion,
Wec
hsle
r, 20
03);
WJ-
R a
nd W
J-II
I = W
oodc
ock-
John
son
Test
s of A
chie
vem
ent (
WJ-
R =
revi
sed,
Woo
dcoc
k &
John
son,
199
0; W
J - II
I = th
ird e
ditio
n, W
oodc
ock,
McG
rew
, & M
athe
r, 20
01),
WR
AT
= W
ide
Ran
ge A
chie
vem
ent T
est (
Jast
ak &
Wilk
inso
n,19
84; W
ilkin
son,
199
3).
Psychol Assess. Author manuscript; available in PMC 2012 September 1.
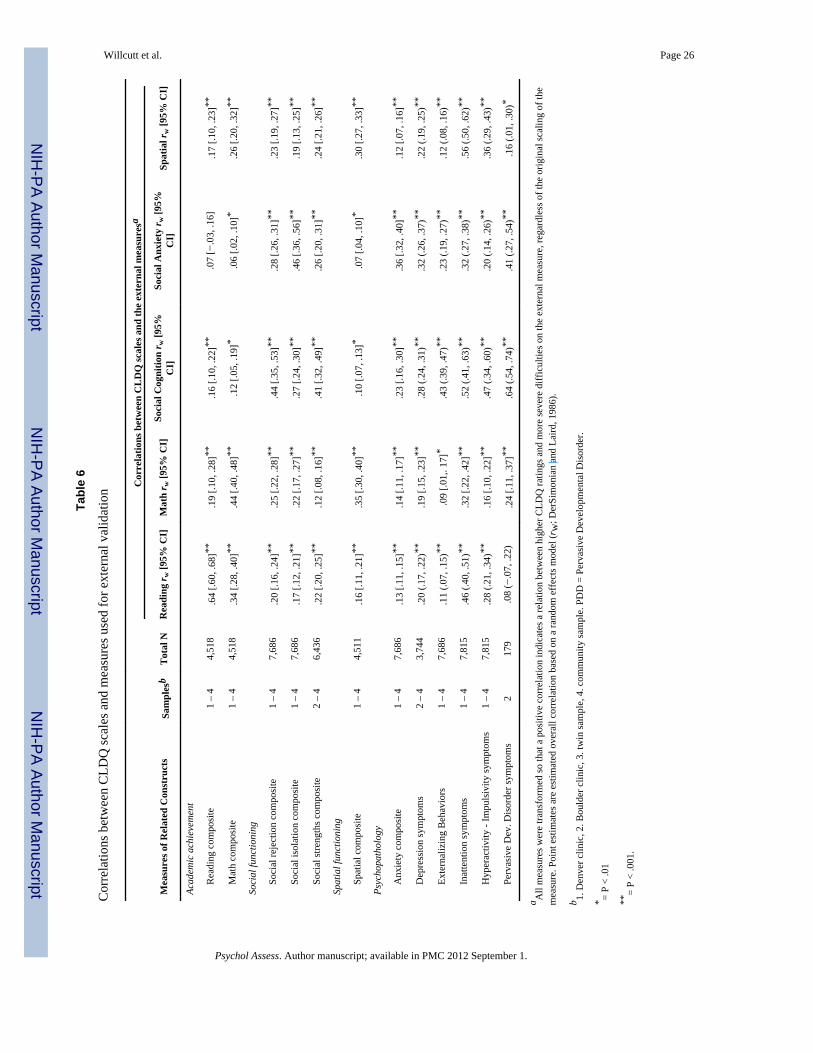
NIH
-PA Author Manuscript
NIH
-PA Author Manuscript
NIH
-PA Author Manuscript
Willcutt et al. Page 26
Tabl
e 6
Cor
rela
tions
bet
wee
n C
LDQ
scal
es a
nd m
easu
res u
sed
for e
xter
nal v
alid
atio
n Cor
rela
tions
bet
wee
n C
LD
Q sc
ales
and
the
exte
rnal
mea
sure
sa
Mea
sure
s of R
elat
ed C
onst
ruct
sSa
mpl
esb
Tot
al N
Rea
ding
r w [9
5% C
I]M
ath
r w [9
5% C
I]So
cial
Cog
nitio
n r w
[95%
CI]
Soci
al A
nxie
ty r w
[95%
CI]
Spat
ial r
w [9
5% C
I]
Acad
emic
ach
ieve
men
t
R
eadi
ng c
ompo
site
1 –
44,
518
.64
[.60,
.68]
**.1
9 [.1
0, .2
8]**
.16
[.10,
.22]
**.0
7 [−
.03,
.16]
.17
[.10,
.23]
**
M
ath
com
posi
te1
– 4
4,51
8.3
4 [.2
8, .4
0]**
.44
[.40,
.48]
**.1
2 [.0
5, .1
9]*
.06
[.02,
.10]
*.2
6 [.2
0, .3
2]**
Soci
al fu
nctio
ning
So
cial
reje
ctio
n co
mpo
site
1 –
47,
686
.20
[.16,
.24]
**.2
5 [.2
2, .2
8]**
.44
[.35,
.53]
**.2
8 [.2
6, .3
1]**
.23
[.19,
.27]
**
So
cial
isol
atio
n co
mpo
site
1 –
47,
686
.17
[.12,
.21]
**.2
2 [.1
7, .2
7]**
.27
[.24,
.30]
**.4
6 [.3
6, .5
6]**
.19
[.13,
.25]
**
So
cial
stre
ngth
s com
posi
te2
– 4
6,43
6.2
2 [.2
0, .2
5]**
.12
[.08,
.16]
**.4
1 [.3
2, .4
9]**
.26
[.20,
.31]
**.2
4 [.2
1, .2
6]**
Spat
ial f
unct
ioni
ng
Sp
atia
l com
posi
te1
– 4
4,51
1.1
6 [.1
1, .2
1]**
.35
[.30,
.40]
**.1
0 [.0
7, .1
3]*
.07
[.04,
.10]
*.3
0 [.2
7, .3
3]**
Psyc
hopa
thol
ogy
A
nxie
ty c
ompo
site
1 –
47,
686
.13
[.11,
.15]
**.1
4 [.1
1, .1
7]**
.23
[.16,
.30]
**.3
6 [.3
2, .4
0]**
.12
[.07,
.16]
**
D
epre
ssio
n sy
mpt
oms
2 –
43,
744
.20
(.17,
.22)
**.1
9 [.1
5, .2
3]**
.28
(.24,
.31)
**.3
2 (.2
6, .3
7)**
.22
(.19,
.25)
**
Ex
tern
aliz
ing
Beh
avio
rs1
– 4
7,68
6.1
1 (.0
7, .1
5)**
.09
[.01,
. 17]
*.4
3 (.3
9, .4
7)**
.23
(.19,
.27)
**.1
2 (.0
8, .1
6)**
In
atte
ntio
n sy
mpt
oms
1 –
47,
815
.46
(.40,
.51)
**.3
2 [.2
2, .4
2]**
.52
(.41,
.63)
**.3
2 (.2
7, .3
8)**
.56
(.50,
.62)
**
H
yper
activ
ity -
Impu
lsiv
ity sy
mpt
oms
1 –
47,
815
.28
(.21,
.34)
**.1
6 [.1
0, .2
2]**
.47
(.34,
.60)
**.2
0 (.1
4, .2
6)**
.36
(.29,
.43)
**
Pe
rvas
ive
Dev
. Dis
orde
r sym
ptom
s2
179
.08
(−.0
7, .2
2).2
4 [.1
1, .3
7]**
.64
(.54,
.74)
**.4
1 (.2
7, .5
4)**
.16
(.01,
.30)
*
a All
mea
sure
s wer
e tra
nsfo
rmed
so th
at a
pos
itive
cor
rela
tion
indi
cate
s a re
latio
n be
twee
n hi
gher
CLD
Q ra
tings
and
mor
e se
vere
diff
icul
ties o
n th
e ex
tern
al m
easu
re, r
egar
dles
s of t
he o
rigin
al sc
alin
g of
the
mea
sure
. Poi
nt e
stim
ates
are
est
imat
ed o
vera
ll co
rrel
atio
n ba
sed
on a
rand
om e
ffec
ts m
odel
(rw
; Der
Sim
onia
n an
d La
ird, 1
986)
.
b 1. D
enve
r clin
ic, 2
. Bou
lder
clin
ic, 3
. tw
in sa
mpl
e, 4
. com
mun
ity sa
mpl
e. P
DD
= P
erva
sive
Dev
elop
men
tal D
isor
der.
* = P
< .0
1
**=
P <
.001
.
Psychol Assess. Author manuscript; available in PMC 2012 September 1.
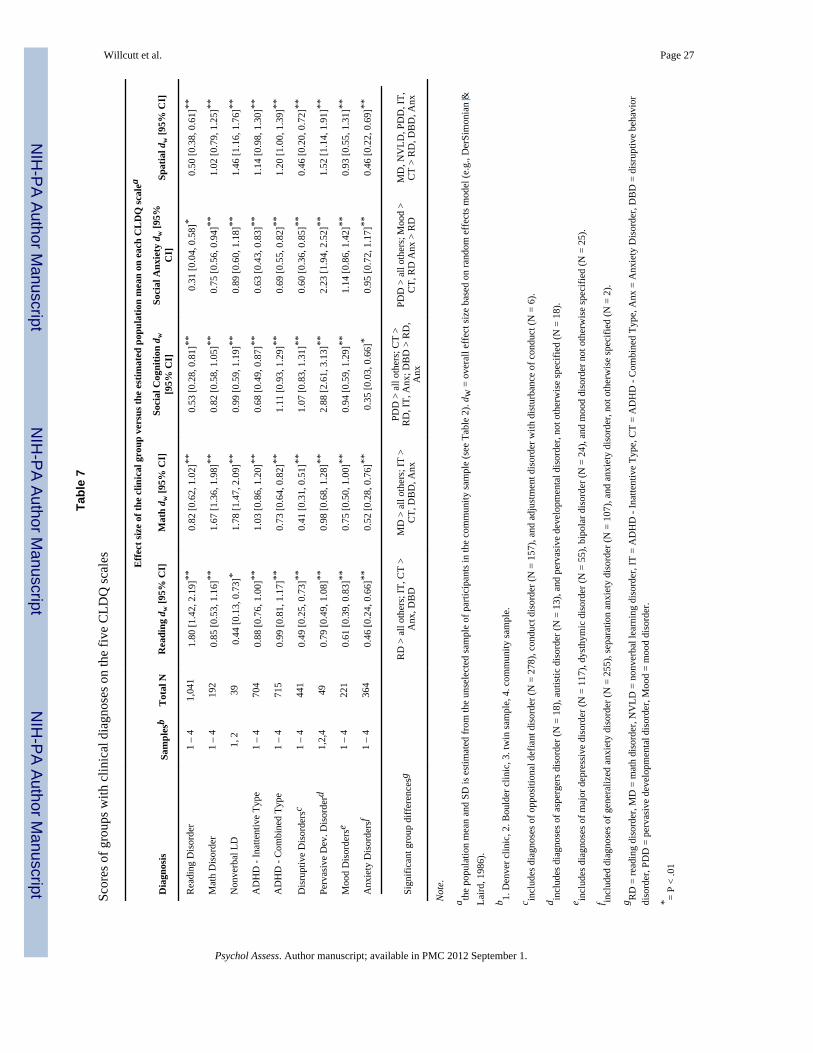
NIH
-PA Author Manuscript
NIH
-PA Author Manuscript
NIH
-PA Author Manuscript
Willcutt et al. Page 27
Tabl
e 7
Scor
es o
f gro
ups w
ith c
linic
al d
iagn
oses
on
the
five
CLD
Q sc
ales Effe
ct si
ze o
f the
clin
ical
gro
up v
ersu
s the
est
imat
ed p
opul
atio
n m
ean
on e
ach
CL
DQ
scal
ea
Dia
gnos
isSa
mpl
esb
Tot
al N
Rea
ding
dw
[95%
CI]
Mat
h d w
[95%
CI]
Soci
al C
ogni
tion
d w[9
5% C
I]So
cial
Anx
iety
dw
[95%
CI]
Spat
ial d
w [9
5% C
I]
Rea
ding
Dis
orde
r1
– 4
1,04
11.
80 [1
.42,
2.1
9]**
0.82
[0.6
2, 1
.02]
**0.
53 [0
.28,
0.8
1]**
0.31
[0.0
4, 0
.58]
*0.
50 [0
.38,
0.6
1]**
Mat
h D
isor
der
1 –
419
20.
85 [0
.53,
1.1
6]**
1.67
[1.3
6, 1
.98]
**0.
82 [0
.58,
1.0
5]**
0.75
[0.5
6, 0
.94]
**1.
02 [0
.79,
1.2
5]**
Non
verb
al L
D1,
239
0.44
[0.1
3, 0
.73]
*1.
78 [1
.47,
2.0
9]**
0.99
[0.5
9, 1
.19]
**0.
89 [0
.60,
1.1
8]**
1.46
[1.1
6, 1
.76]
**
AD
HD
- In
atte
ntiv
e Ty
pe1
– 4
704
0.88
[0.7
6, 1
.00]
**1.
03 [0
.86,
1.2
0]**
0.68
[0.4
9, 0
.87]
**0.
63 [0
.43,
0.8
3]**
1.14
[0.9
8, 1
.30]
**
AD
HD
- C
ombi
ned
Type
1 –
471
50.
99 [0
.81,
1.1
7]**
0.73
[0.6
4, 0
.82]
**1.
11 [0
.93,
1.2
9]**
0.69
[0.5
5, 0
.82]
**1.
20 [1
.00,
1.3
9]**
Dis
rupt
ive
Dis
orde
rsc
1 –
444
10.
49 [0
.25,
0.7
3]**
0.41
[0.3
1, 0
.51]
**1.
07 [0
.83,
1.3
1]**
0.60
[0.3
6, 0
.85]
**0.
46 [0
.20,
0.7
2]**
Perv
asiv
e D
ev. D
isor
derd
1,2,
449
0.79
[0.4
9, 1
.08]
**0.
98 [0
.68,
1.2
8]**
2.88
[2.6
1, 3
.13]
**2.
23 [1
.94,
2.5
2]**
1.52
[1.1
4, 1
.91]
**
Moo
d D
isor
ders
e1
– 4
221
0.61
[0.3
9, 0
.83]
**0.
75 [0
.50,
1.0
0]**
0.94
[0.5
9, 1
.29]
**1.
14 [0
.86,
1.4
2]**
0.93
[0.5
5, 1
.31]
**
Anx
iety
Dis
orde
rsf
1 –
436
40.
46 [0
.24,
0.6
6]**
0.52
[0.2
8, 0
.76]
**0.
35 [0
.03,
0.6
6]*
0.95
[0.7
2, 1
.17]
**0.
46 [0
.22,
0.6
9]**
Sign
ifica
nt g
roup
diff
eren
cesg
RD
> a
ll ot
hers
; IT,
CT
>A
nx, D
BD
MD
> a
ll ot
hers
; IT
>C
T, D
BD
, Anx
PDD
> a
ll ot
hers
; CT
>R
D, I
T, A
nx; D
BD
> R
D,
Anx
PDD
> a
ll ot
hers
; Moo
d >
CT,
RD
Anx
> R
DM
D, N
VLD
, PD
D, I
T,C
T >
RD
, DB
D, A
nx
Not
e.
a the
popu
latio
n m
ean
and
SD is
est
imat
ed fr
om th
e un
sele
cted
sam
ple
of p
artic
ipan
ts in
the
com
mun
ity sa
mpl
e (s
ee T
able
2).
d w =
ove
rall
effe
ct si
ze b
ased
on
rand
om e
ffec
ts m
odel
(e.g
., D
erSi
mon
ian
&La
ird, 1
986)
.
b 1. D
enve
r clin
ic, 2
. Bou
lder
clin
ic, 3
. tw
in sa
mpl
e, 4
. com
mun
ity sa
mpl
e.
c incl
udes
dia
gnos
es o
f opp
ositi
onal
def
iant
dis
orde
r (N
= 2
78),
cond
uct d
isor
der (
N =
157
), an
d ad
just
men
t dis
orde
r with
dis
turb
ance
of c
ondu
ct (N
= 6
).
d incl
udes
dia
gnos
es o
f asp
erge
rs d
isor
der (
N =
18)
, aut
istic
dis
orde
r (N
= 1
3), a
nd p
erva
sive
dev
elop
men
tal d
isor
der,
not o
ther
wis
e sp
ecifi
ed (N
= 1
8).
e incl
udes
dia
gnos
es o
f maj
or d
epre
ssiv
e di
sord
er (N
= 1
17),
dyst
hym
ic d
isor
der (
N =
55)
, bip
olar
dis
orde
r (N
= 2
4), a
nd m
ood
diso
rder
not
oth
erw
ise
spec
ified
(N =
25)
.
f incl
uded
dia
gnos
es o
f gen
eral
ized
anx
iety
dis
orde
r (N
= 2
55),
sepa
ratio
n an
xiet
y di
sord
er (N
= 1
07),
and
anxi
ety
diso
rder
, not
oth
erw
ise
spec
ified
(N =
2).
g RD
= re
adin
g di
sord
er, M
D =
mat
h di
sord
er, N
VLD
= n
onve
rbal
lear
ning
dis
orde
r, IT
= A
DH
D -
Inat
tent
ive
Type
, CT
= A
DH
D -
Com
bine
d Ty
pe, A
nx =
Anx
iety
Dis
orde
r, D
BD
= d
isru
ptiv
e be
havi
ordi
sord
er, P
DD
= p
erva
sive
dev
elop
men
tal d
isor
der,
Moo
d =
moo
d di
sord
er.
* = P
< .0
1
Psychol Assess. Author manuscript; available in PMC 2012 September 1.
NIH
-PA Author Manuscript
NIH
-PA Author Manuscript
NIH
-PA Author Manuscript
Willcutt et al. Page 28**
= P
< .0
01.
Psychol Assess. Author manuscript; available in PMC 2012 September 1.
Related Documents


