1 2018 DOE SSL R&D Workshop Color Quality Metrics and Spectral Design of SSL Sources Yoshi Ohno (CIE President) NIST Fellow, Sensor Science Division National Institute of Standards and Technology, USA

Welcome message from author
This document is posted to help you gain knowledge. Please leave a comment to let me know what you think about it! Share it to your friends and learn new things together.
Transcript
1 2018 DOE SSL R&D Workshop
Color Quality Metrics and Spectral
Design of SSL Sources
Yoshi Ohno
(CIE President)
NIST Fellow, Sensor Science Division National Institute of Standards and Technology, USA

2 2018 DOE SSL R&D Workshop
Topics
• Color Quality Metrics update (TM-30 Rf, CIE Rf)
• Color fidelity and color preference
• Broadband and narrowband
• New research at NIST on color quality
• White light chromaticity
3 2018 DOE SSL R&D Workshop
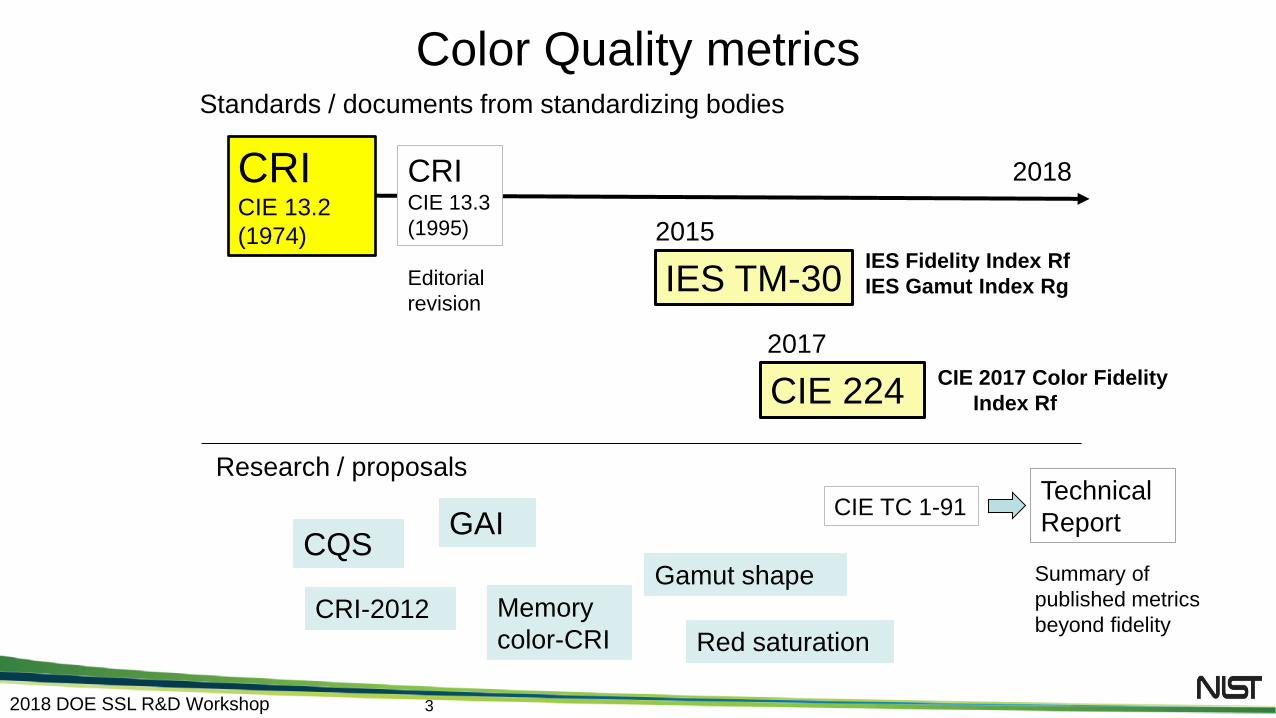
CRI CIE 13.2
(1974)
Color Quality metrics
CRI CIE 13.3
(1995)
Editorial
revision
CIE 224 CIE 2017 Color Fidelity
Index Rf
Technical
Report
Summary of
published metrics
beyond fidelity
IES TM-30 IES Fidelity Index Rf
IES Gamut Index Rg
2018
2015
2017
CIE TC 1-91
Research / proposals
Memory
color-CRI
GAI CQS
CRI-2012
Gamut shape
Red saturation
Standards / documents from standardizing bodies
4 2018 DOE SSL R&D Workshop
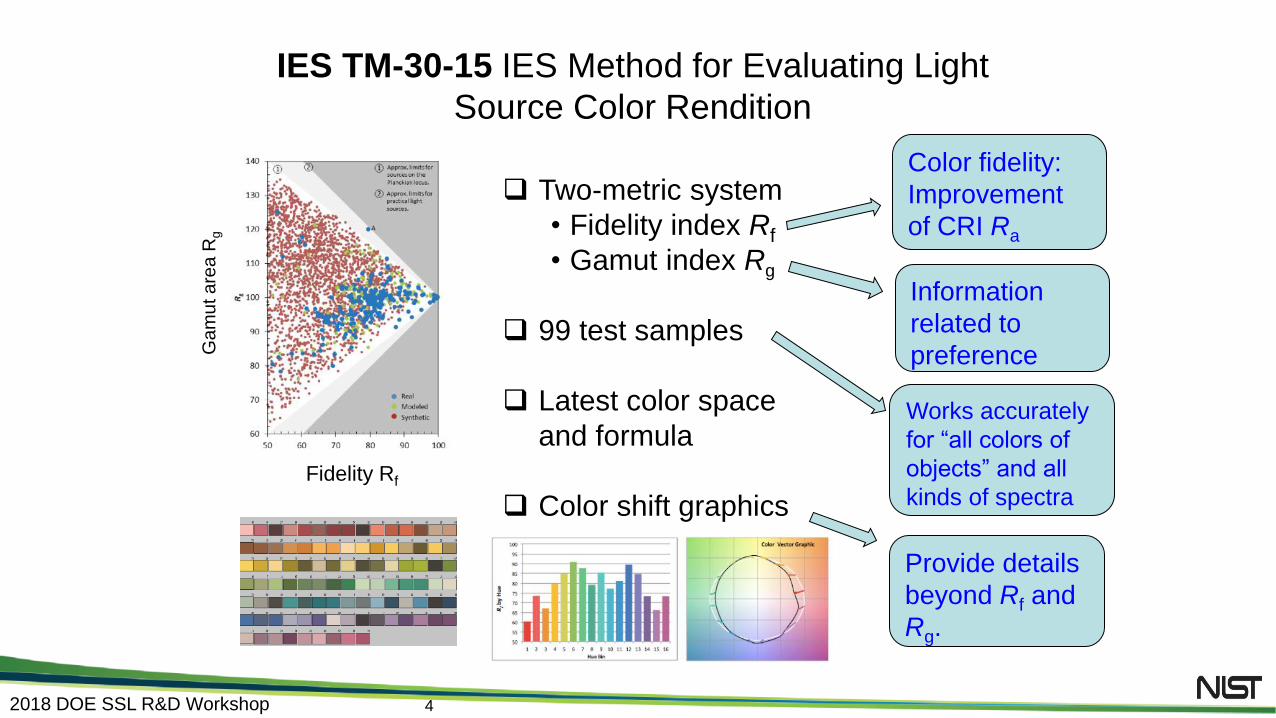
Two-metric system
• Fidelity index Rf
• Gamut index Rg
99 test samples
Latest color space
and formula
Color shift graphics
IES TM-30-15 IES Method for Evaluating Light
Source Color Rendition
Color fidelity:
Improvement
of CRI Ra
Information
related to
preference
Works accurately
for “all colors of
objects” and all
kinds of spectra
Provide details
beyond Rf and
Rg.
Ga
mu
t a
rea
Rg
Fidelity Rf

5 2018 DOE SSL R&D Workshop
TM-30 cannot replace CRI. Why?
• A regional standard cannot replace an international standard
(unless it is adopted internationally).
• TM-30 is not a standard. It is issued for evaluation
(IES position statement PS0815 Color Rendering Index)
Technically,
• TM-30 has two numbers, Rf and Rg. One number is needed to
replace CRI Ra.
• Can Fidelity Index Rf (only) replace CRI Ra ?
6 2018 DOE SSL R&D Workshop
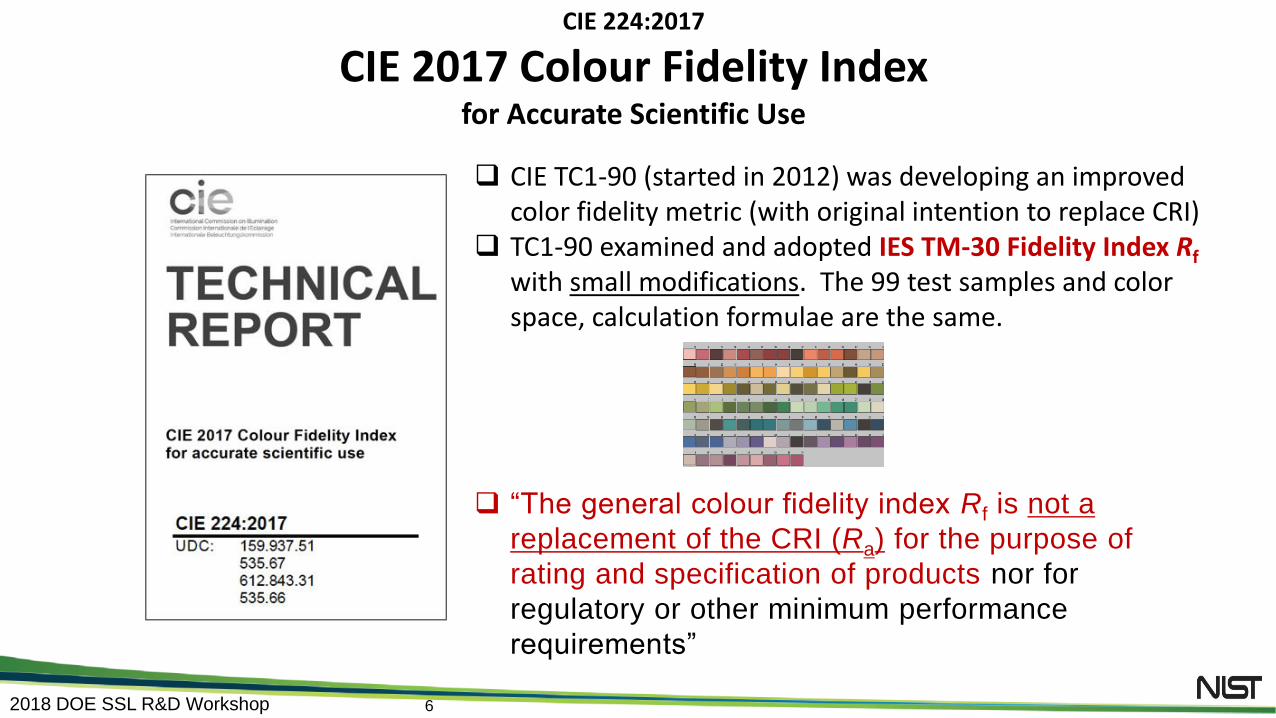
CIE TC1-90 (started in 2012) was developing an improved
color fidelity metric (with original intention to replace CRI) TC1-90 examined and adopted IES TM-30 Fidelity Index Rf
with small modifications. The 99 test samples and color space, calculation formulae are the same.
“The general colour fidelity index Rf is not a
replacement of the CRI (Ra) for the purpose of
rating and specification of products nor for
regulatory or other minimum performance
requirements”
CIE 224:2017
CIE 2017 Colour Fidelity Index for Accurate Scientific Use

7 2018 DOE SSL R&D Workshop
Average scores of Ra and
Rf are equal
(Ra=Rf=75.1)
for F1 to F12 (fluorescent
lamp illuminants) in CIE
15:2004.
A modification of TM-30 Rf (scaling factor)
TM-30: Scaling factor

8 2018 DOE SSL R&D Workshop
Average scores of Ra and Rf
are equal (Ra=Rf=80.8)
for 187 lamp spectra (Ra>60)
in the SPD Library of IES TM-
30-15 calculation tool,
consisting of
36 fluorescent lamps,
14 HID lamps,
129 LED phosphor type,
8 LED hybrid lamps
(not including RGB(A))
6.73
60
65
70
75
80
85
90
95
100
60.0 70.0 80.0 90.0 100.0
Rf
Ra
CIE 224 CIE 224 Scaling Factor
A modification of TM-30 Rf (scaling factor)
9 2018 DOE SSL R&D Workshop
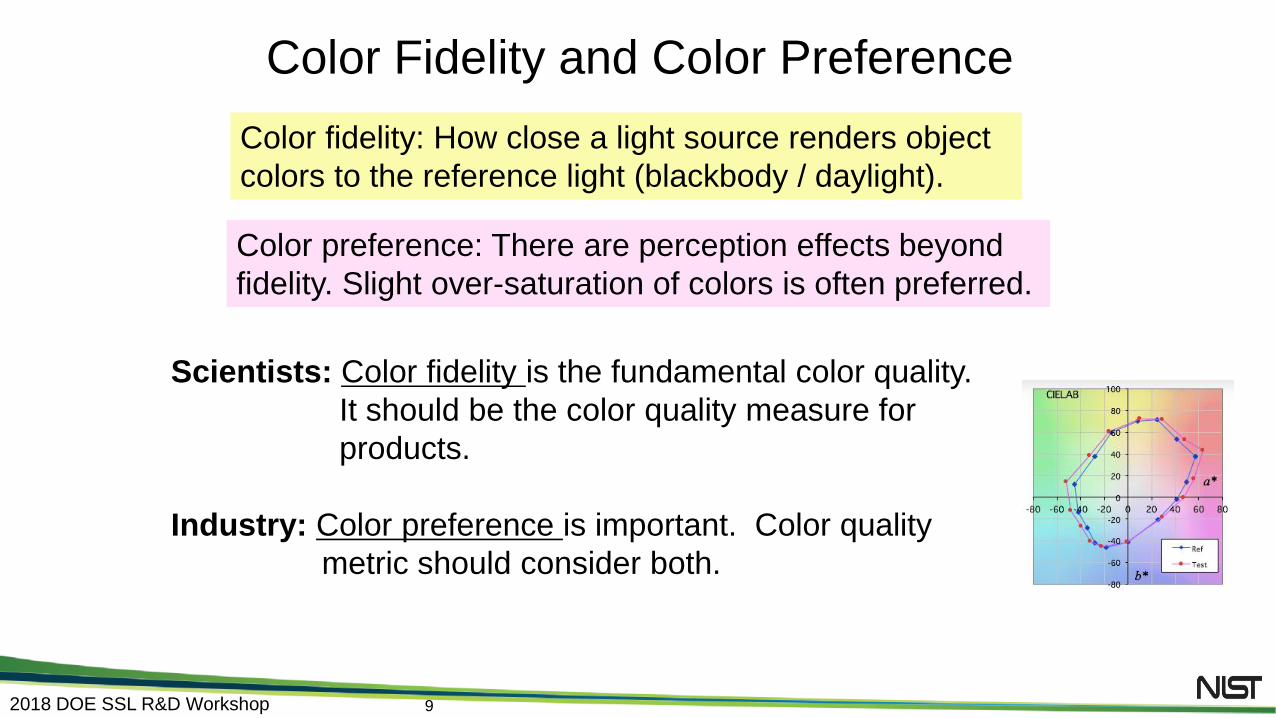
Color Fidelity and Color Preference
Color fidelity: How close a light source renders object
colors to the reference light (blackbody / daylight).
Color preference: There are perception effects beyond
fidelity. Slight over-saturation of colors is often preferred.
Scientists: Color fidelity is the fundamental color quality.
It should be the color quality measure for
products.
Industry: Color preference is important. Color quality
metric should consider both.

10 2018 DOE SSL R&D Workshop
Most saturated
Most de-saturated -80
-60
-40
-20
0
20
40
60
80
100
-80 -60 -40 -20 0 20 40 60 80
a*
CIELAB
b*
DC*ab = -16
DC*ab = 16
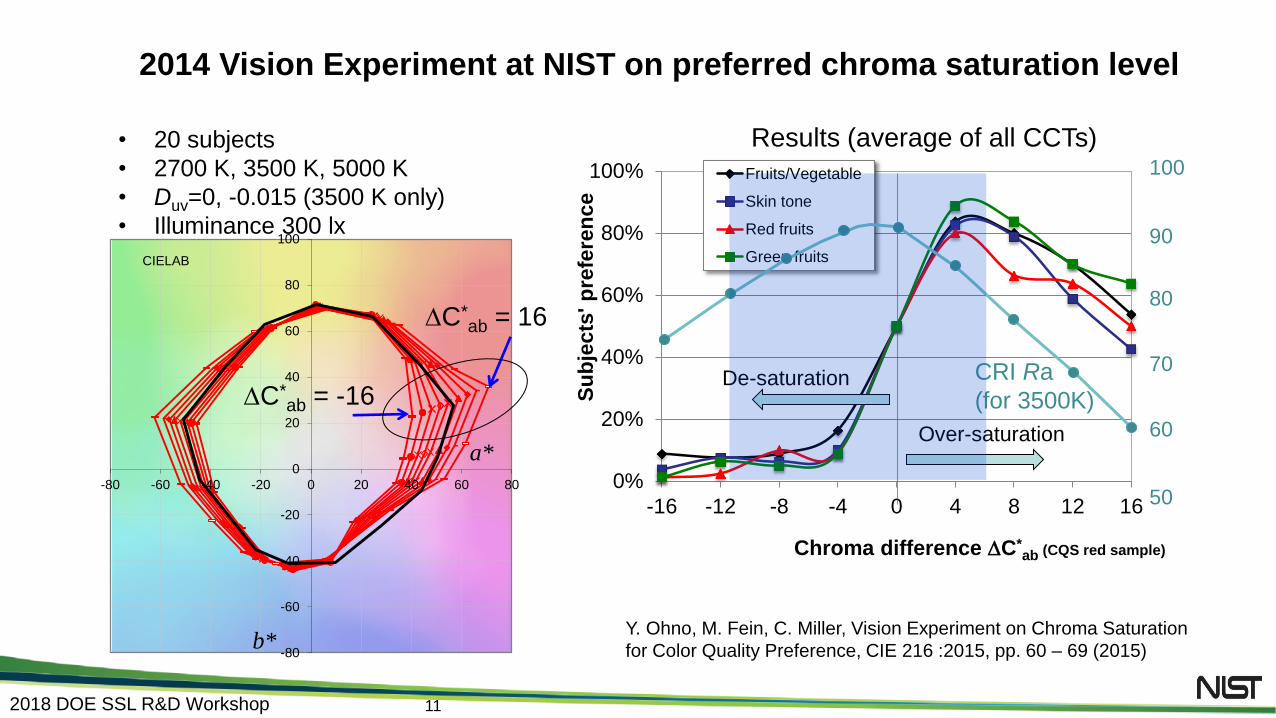
2014 Vision Experiment at NIST on preferred chroma saturation level
• 20 subjects
• 2700 K, 3500 K, 5000 K
• Duv=0, -0.015 (3500 K only)
• Illuminance 300 lx
11 2018 DOE SSL R&D Workshop
-80
-60
-40
-20
0
20
40
60
80
100
-80 -60 -40 -20 0 20 40 60 80
a*
CIELAB
b*
DC*ab = -16
DC*ab = 16
• 20 subjects
• 2700 K, 3500 K, 5000 K
• Duv=0, -0.015 (3500 K only)
• Illuminance 300 lx
0%
20%
40%
60%
80%
100%
-16 -12 -8 -4 0 4 8 12 16
Su
bje
cts
' p
refe
ren
ce
Chroma difference DC*ab (CQS red sample)
Fruits/Vegetable
Skin tone
Red fruits
Green fruits
Y. Ohno, M. Fein, C. Miller, Vision Experiment on Chroma Saturation
for Color Quality Preference, CIE 216 :2015, pp. 60 – 69 (2015)
Results (average of all CCTs)
Over-saturation
De-saturation CRI Ra
(for 3500K)
100
90
80
70
60
50
2014 Vision Experiment at NIST on preferred chroma saturation level

12 2018 DOE SSL R&D Workshop
Broadband and Narrowband
* Narrowband spectrum is theoretically more energy efficient
p-c White
+ Red phosphor
LER= 310 lm/W LER= 375 lm/W LER= 382 lm/W
p-c White
+ Red chip RGBA simulation Lot of
developments for
narrow-band
emitters
• narrow-band
phosphors
• Quantum dots
• Nano crystals

13 2018 DOE SSL R&D Workshop
60.0
65.0
70.0
75.0
80.0
85.0
90.0
95.0
100.0
60 70 80 90 100
CIE
Rf
Ra
125 CQS SPD set
OthersPhosphor LEDTri-phosphor FL
Differences between CIE Rf and CRI Ra scores
12
19
101
72
Over-saturation in
red penalized by
CRI
Narrow-band
sources penalized
by Rf
These differences
not well understood

14 2018 DOE SSL R&D Workshop
Broadband and Narrowband
99 test color samples (TM-30) represent all
kinds of object colors. New fidelity index
requires broader band spectra and deeper
red than in CRI.
CRI 8 samples represent typical daily life
objects : less sensitive to spectra in deep red
region.
0.0
0.1
0.2
0.3
0.4
0.5
0.6
0.7
0.8
0.9
1.0
400 450 500 550 600 650 700
Reflectancefactor
Wavelength(nm)
CRI 8 samples
99 test samples of TM-30 • Narrow-band sources are penalized under
new color fidelity index (IES or CIE).
• To get the same score on new fidelity
index, more energy is needed.
15 2018 DOE SSL R&D Workshop
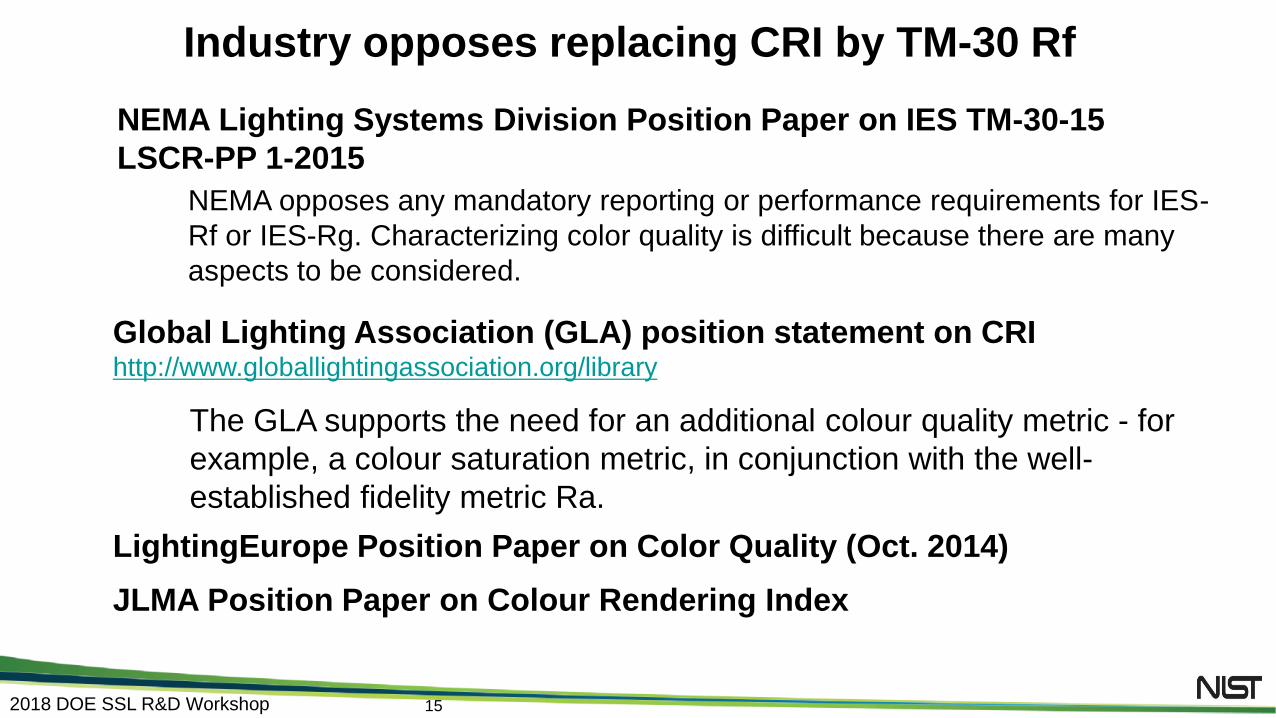
Industry opposes replacing CRI by TM-30 Rf
Global Lighting Association (GLA) position statement on CRI http://www.globallightingassociation.org/library
The GLA supports the need for an additional colour quality metric - for
example, a colour saturation metric, in conjunction with the well-
established fidelity metric Ra.
JLMA Position Paper on Colour Rendering Index
NEMA Lighting Systems Division Position Paper on IES TM-30-15
LSCR-PP 1-2015
NEMA opposes any mandatory reporting or performance requirements for IES-
Rf or IES-Rg. Characterizing color quality is difficult because there are many
aspects to be considered.
LightingEurope Position Paper on Color Quality (Oct. 2014)

16 2018 DOE SSL R&D Workshop
Overall Color Quality
Color Fidelity (CIE 224) Color perception/
preference
What we need – Evaluation of overall color quality
A formula to
replace CRI Ra
CRI
Inaccuracies of CRI
as fidelity metric
CIE’s goal
Develop a set of color
quality metrics that allow
evaluation of overall color
quality of light sources,
which can replace CRI.

17 2018 DOE SSL R&D Workshop
2700 K
Planck
D65
(6500 K)
CAM02UCS
used in CIE and IES Rf
Differences in Color Space Plots of
15 CQS
samples. W*U*V*
used in CRI
CIELAB (Current CIE standard)
Used in CQS

18 2018 DOE SSL R&D Workshop
Gamut area is not sufficient
IES Rg=100
CIE Rf=77
Different gamut shapes with same gamut area
Perceived color quality
of these two lights are
significantly different. IES Rg=100
CIE Rf=77
This looks better
Also available:
Royer M et al, Human
perceptions of colour
rendition vary with
average fidelity,
average gamut, and
gamut shape. Light
Res. Technol. 2016.

19 2018 DOE SSL R&D Workshop
2016 NIST Experiment on color saturation preference in different hues
11 different gamut shapes
19 subjects evaluate preference in light pairs
(Collaboration with Ulsan National Institute of Science and Technology, Korea)
Y. Ohno, S. Oh, Y. Kwak, Vision Experiment on Chroma Saturation
Preference in Different Hues, Proc. CIE 2017 Midterm Jeju, Korea (2017)
(Numbers) are
DC*ab from the
reference.
20 2018 DOE SSL R&D Workshop
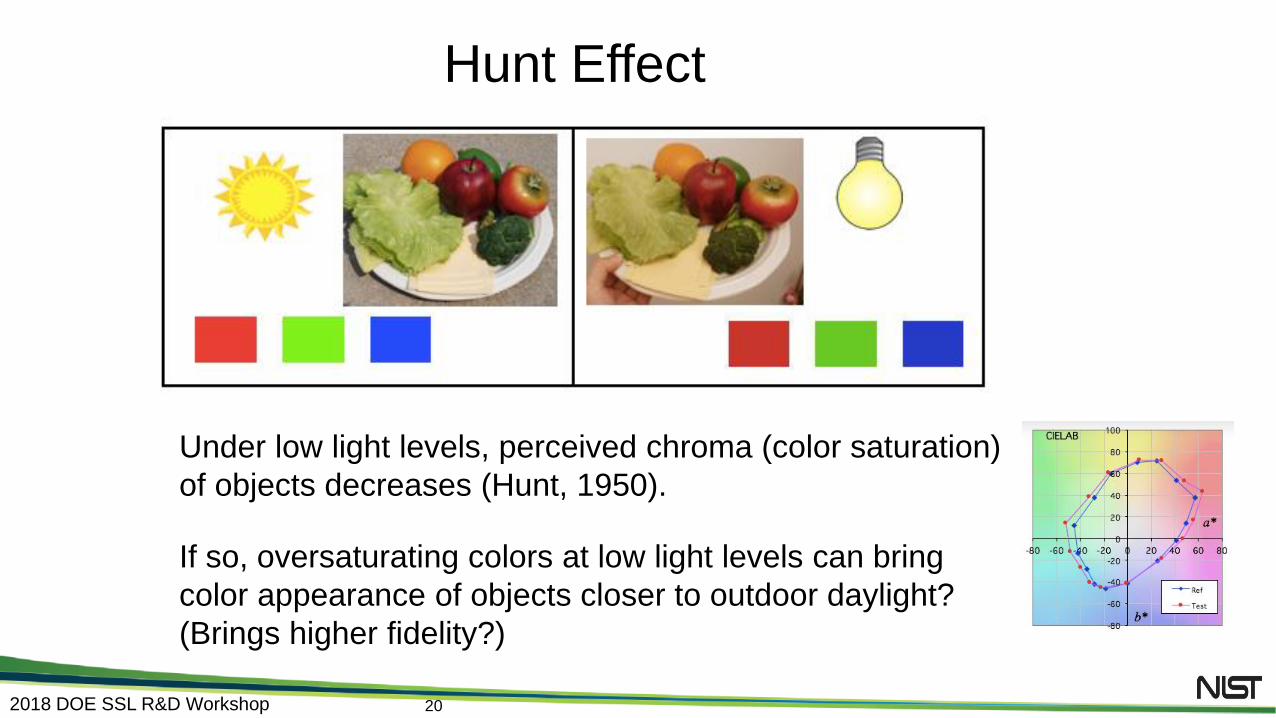
Hunt Effect
Under low light levels, perceived chroma (color saturation)
of objects decreases (Hunt, 1950).
If so, oversaturating colors at low light levels can bring
color appearance of objects closer to outdoor daylight?
(Brings higher fidelity?)

21 2018 DOE SSL R&D Workshop
2017 NIST Experiment on Hunt Effect
• 24 subjects
• Saturation preference
experiment at 100 lx
and 1000 lx
• Which light looks “more
natural”
Presented at CIE USNC CNC Joint meeting, NIST, Oct 3-4, 2017.
Mix
Skin
100 lx 1000 lx
Results: Perceived naturalness
compared to Neutral
NIST Spectrally
Tunable Lighting
Facility

22 2018 DOE SSL R&D Workshop
Experiment on
perceived white point
by LRC (2013)
Experiment on preferred
lighting by NRC, Canada
(2013)
NIST vision experiment
in 2013 & 2015
Dikel et al, ”Preferred Chromaticity of Color-
Tunable LED Lighting”, LEUKOS, 10:2, 101-
115, DOI: 10.1080/15502724.2013.855614
(2013).
Ohno, Y., Fein, M., Vision Experiment on
Acceptable and Preferred White Light
Chromaticity for Lighting, CIE x039:2014,
pp. 192-199 (2014).
M. S. Rea,* J. P. Freyssinier, “White
Lighting”, CR&A, 30-2, 82-92, 2013.
White Light Chromaticity – Preference to below blackbody–
Perz, M.1, Baselmans, R.1,
Sekulovski, Perception of Illumination
Whiteness, CIE x043:2017, pp.1-7
(2017)
Experiment of
whiteness done by
Philips Eindhoven

23 2018 DOE SSL R&D Workshop 23
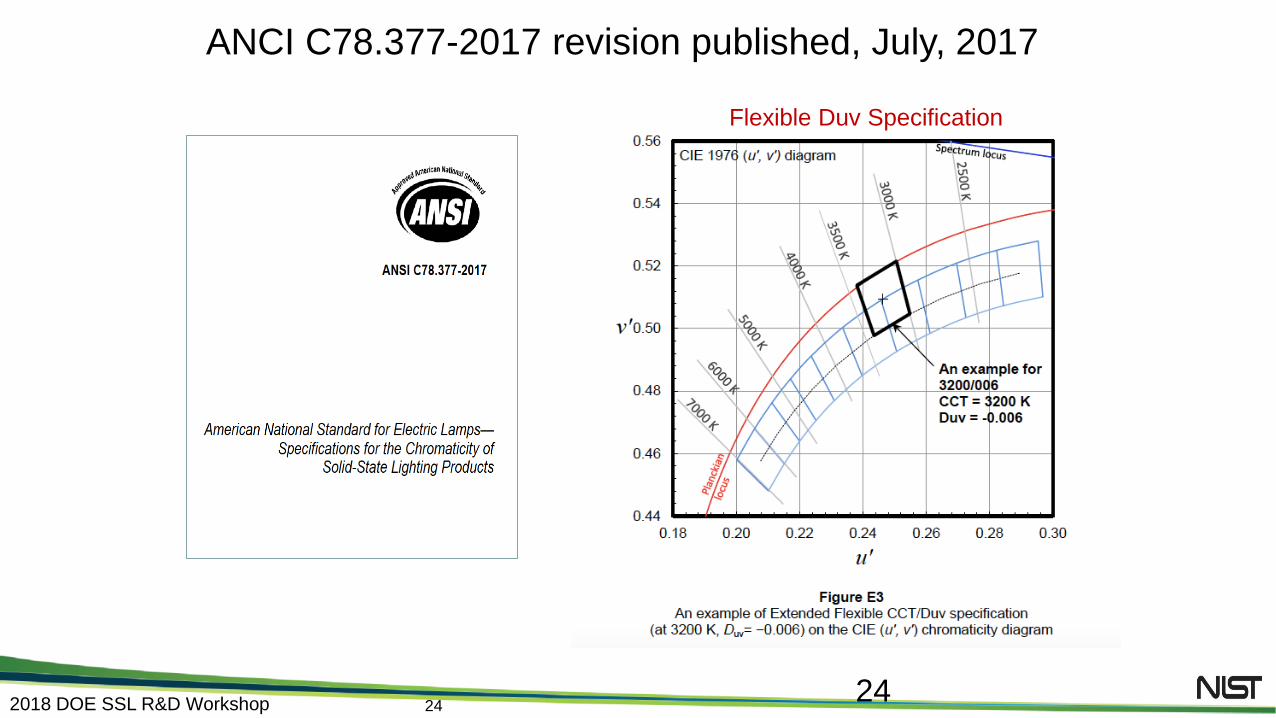
ANCI C78.377-2017 revision published, July, 2017
Extended
Specification
Basic Specification
24 2018 DOE SSL R&D Workshop 24
ANCI C78.377-2017 revision published, July, 2017
Extended
Specification
Basic Specification
Flexible Duv Specification
25 2018 DOE SSL R&D Workshop
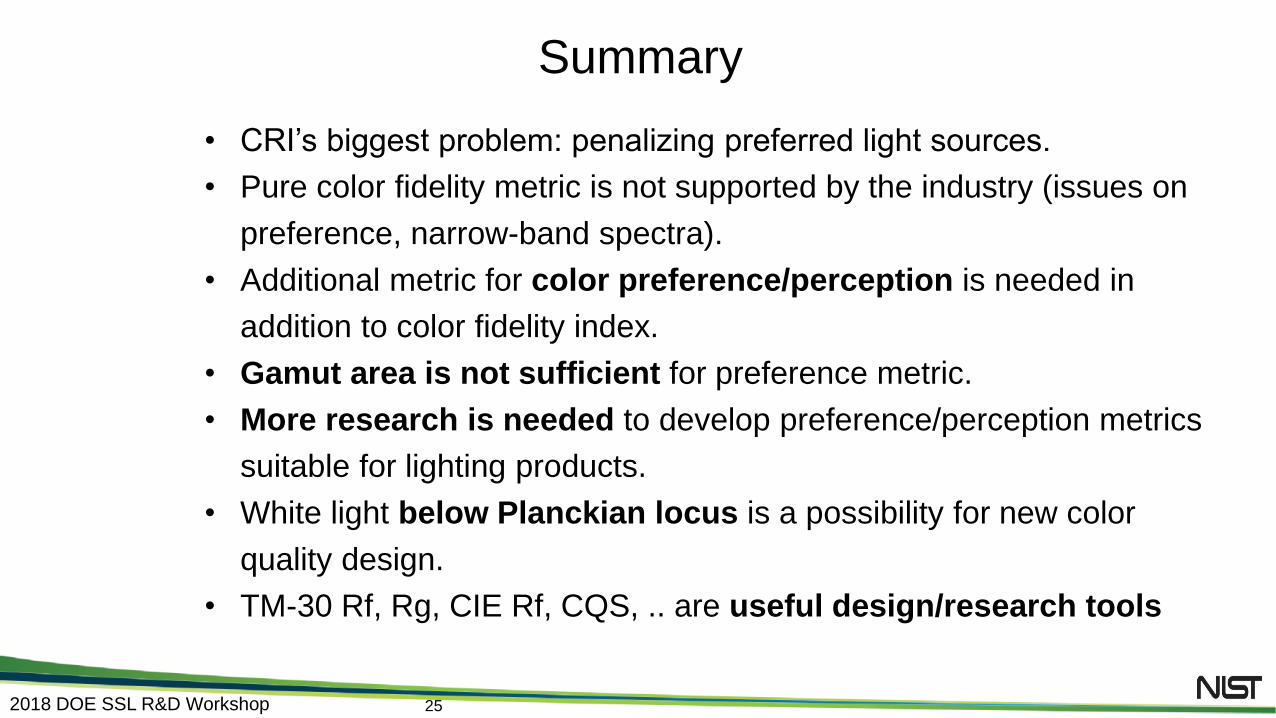
Summary
• CRI’s biggest problem: penalizing preferred light sources.
• Pure color fidelity metric is not supported by the industry (issues on
preference, narrow-band spectra).
• Additional metric for color preference/perception is needed in
addition to color fidelity index.
• Gamut area is not sufficient for preference metric.
• More research is needed to develop preference/perception metrics
suitable for lighting products.
• White light below Planckian locus is a possibility for new color
quality design.
• TM-30 Rf, Rg, CIE Rf, CQS, .. are useful design/research tools
Related Documents


![KORUS업무포털사용자등록및로그인가이드 - Kangwon · II - 2 SSL VPN 계정신청(최초1회) - 서식참조 I. SSL VPN 접속 [ SSL VPN 사용자ID 신청리스트]](https://static.cupdf.com/doc/110x72/5f06912d7e708231d418a10a/koruseeeeeoeeeeoe-kangwon-ii-2-ssl-vpn-eoe1oe.jpg)

