Color in image and video Mr.Nael Aburas

Color in image and video Mr.Nael Aburas. outline Color Science Color Models in Images Color Models in Video.
Dec 31, 2015
Welcome message from author
This document is posted to help you gain knowledge. Please leave a comment to let me know what you think about it! Share it to your friends and learn new things together.
Transcript

Color in image and video
Mr.Nael Aburas

outline Color Science Color Models in Images Color Models in Video

Color Science Light and Spectra
Light is an electromagnetic wave. Its color is characterized by the wavelength content of the light. Laser light consists of a single wavelength: e.g., a ruby laser
produces a bright, scarlet-red beam. Most light sources produce contributions over many
wavelengths. However, humans cannot detect all light, just contributions that
fall in the “visible wavelengths”. Short wavelengths produce a blue sensation, long wavelengths
produce a red one.
Spectrophotometer: device used to measure visible light, by reflecting light from a diffraction grating (a ruled surface) that spreads out the different wavelengths.

Color Science Figure 4.1 shows the phenomenon that white light
contains all the colors of a rainbow.
Visible light is an electromagnetic wave in the range 400 nm to 700 nm (where nm stands for nanometer, 10−9 meters).

Color Science Fig. 4.2 shows the relative power in each
wavelength interval for typical outdoor light on a sunny day. This type of curve is called a Spectral Power Distribution (SPD) or a spectrum.
The symbol for wavelength is λ. This curve is called E(λ).

Human Vision The eye works like a camera, with the lens focusing an
image onto the retina (upside-down and left-right reversed).
The retina consists of an array of rods and three kinds of cones.
The rods come into play when light levels are low and produce a image in shades of gray (“all cats are gray at night!”).
For higher light levels, the cones each produce a signal. Because of their differing pigments, the three kinds of cones are most sensitive to red (R), green (G), and blue (B) light.
It seems likely that the brain makes use of differences R-G, G-B, and B-R, as well as combining all of R, G, and B into a high-light-level achromatic channel.

Spectral Sensitivity of the Eye The eye is most sensitive to light in the middle of
the visible spectrum. The sensitivity of our receptors is also a function of
wavelength (Fig. 4.3below). The Blue receptor sensitivity is not shown to scale
because it is much smaller than the curves for Red or Green — Blue is a late addition, in evolution.
Statistically, Blue is the favorite color of humans, regardless of nationality — perhaps for this reason: Blue is a latecomer and thus is a bit surprising!
Fig. 4.3 shows the overall sensitivity as a dashed line — this important curve is called the luminous-efficiency function.
It is usually denoted V (λ) and is formed as the sum of the response curves for Red, Green, and Blue.

Spectral Sensitivity of the Eye The rod sensitivity curve looks like the
luminous-efficiency function V (λ) but is shifted to the red end of the spectrum.
The achromatic channel produced by the cones is approximately proportional to 2R+G+B/20.

Spectral Sensitivity of the Eye
The response in each color channel in the eye is proportional to the number of neurons firing.
A laser light at wavelength λ would result in a certain number of neurons firing. An SPD is a combination of single-frequency lights (like “lasers”), so we add up the cone responses for all wavelengths, weighted by the eye’s relative response at that wavelength.

Image Formation Surfaces reflect different amounts of light at
different wavelengths, and dark surfaces reflect less energy than light surfaces.
Fig. 4.4 shows the surface spectral reflectance from (1) orange sneakers and (2) faded blue jeans. The reflectance function is denoted S(λ).
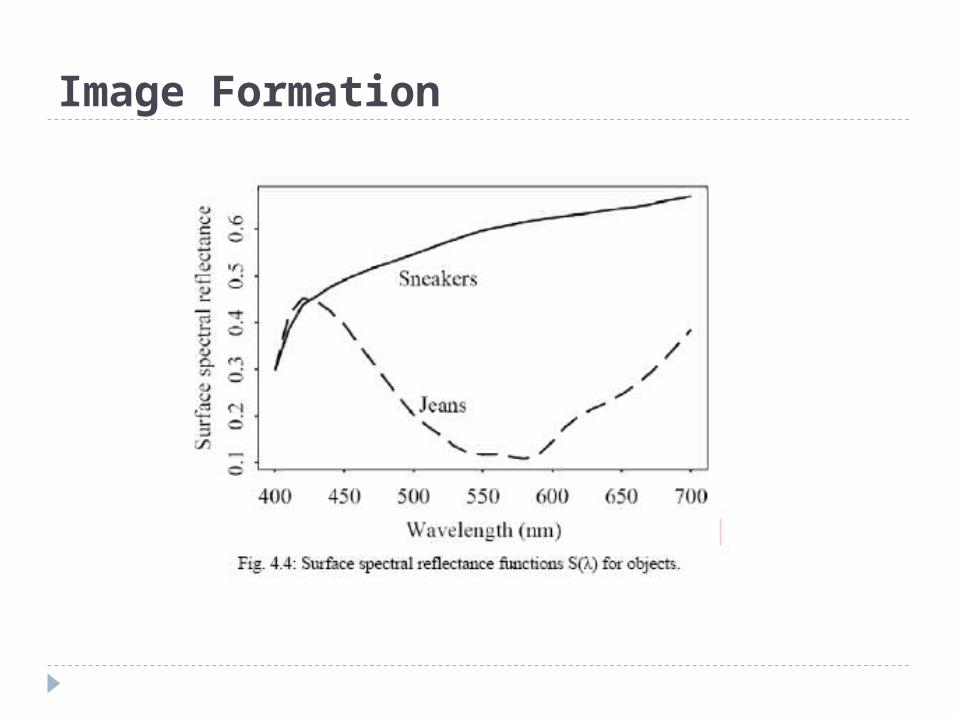
Image Formation

Image Formation Image formation is thus:1.Light from the illuminant with SPD E(λ)
impinges on a surface, with surface spectral reflectance function S(λ), is reflected, and then is filtered by the eye’s cone functions q (λ).
2.Reflection is shown in Fig. 4.5 below
3.The function C(λ) is called the color signal and consists of the product of E(λ), the illuminant, times S(λ), the reflectance:
C(λ) = E(λ) S(λ).

Camera Systems Camera systems are made in a similar fashion; a
studio quality camera has three signals produced at each pixel location (corresponding to a retinal position).
Analog signals are converted to digital, truncated to integers, and stored. If the precision used is 8-bit, then the maximum value for any of R,G,B is 255, and the minimum is 0.
However, the light entering the eye of the computer user is that which is emitted by the screen—the screen is essentially a self-luminous source. Therefore we need to know the light E(λ) entering the eye.
Related Documents