COLOR CODING AND LABELING 1 Running Head: Color Coding and Labeling Learning about Probability from Text and Tables: Do Color Coding and Labeling through an Interactive-User Interface Help? Virginia Clinton University of North Dakota Kinga Morsanyi Queen’s University Belfast Martha W. Alibali & Mitchell J. Nathan University of Wisconsin—Madiso Author Note Address correspondence to Virginia Clinton, University of North Dakota, 231 Centennial St., Grand Forks, ND, 58202, [email protected], phone 1 (701) 777-3920, and fax 1 (701) 777-3454. This research was supported by the Institute of Education Sciences, U.S. Department of Education, through Grant R305C100024 to the University of Wisconsin--Madison. The opinions expressed are those of the authors and do not represent views of the Institute or the U.S. Department of Education.

Welcome message from author
This document is posted to help you gain knowledge. Please leave a comment to let me know what you think about it! Share it to your friends and learn new things together.
Transcript

COLORCODINGANDLABELING
1
RunningHead:ColorCodingandLabelingLearningaboutProbabilityfromTextandTables:DoColorCodingandLabelingthrough
anInteractive-UserInterfaceHelp?
VirginiaClinton
UniversityofNorthDakota
KingaMorsanyi
Queen’sUniversityBelfast
MarthaW.Alibali&MitchellJ.Nathan
UniversityofWisconsin—Madiso
AuthorNote AddresscorrespondencetoVirginiaClinton,UniversityofNorthDakota,231
CentennialSt.,GrandForks,ND,58202,[email protected],phone1(701)777-3920,
andfax1(701)777-3454.
This research was supported by the Institute of Education Sciences, U.S. Department of
Education, through Grant R305C100024 to the University of Wisconsin--Madison. The opinions
expressed are those of the authors and do not represent views of the Institute or the U.S.
DepartmentofEducation.

COLORCODINGANDLABELING
2
Pleaseciteasthefollowing:
Clinton,V.,Morsanyi,K.,Alibali,M.W.,&Nathan,M.J.(2016).LearningaboutProbabilityfromTextandTables:DoColorCodingandLabelingthroughanInteractive-userInterfaceHelp?AppliedCognitivePsychology,30(3),440-453..doi:10.1002/acp.3223
COLORCODINGANDLABELING
3
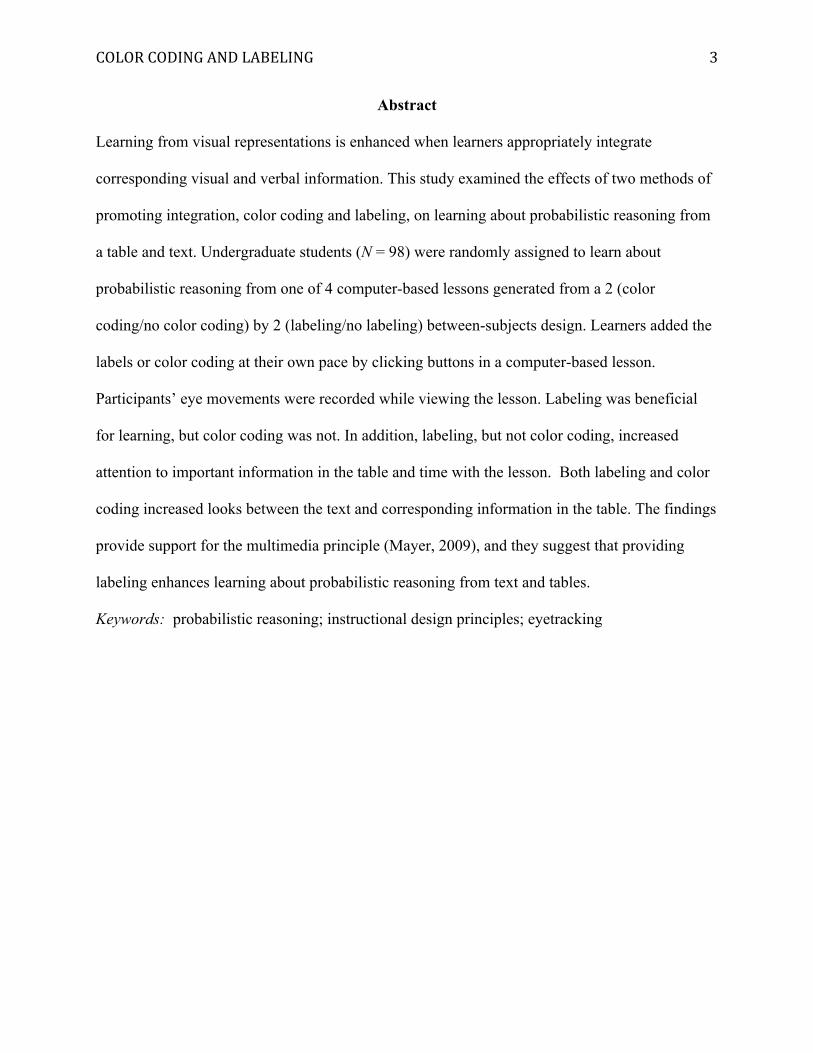
Abstract Learning from visual representations is enhanced when learners appropriately integrate
corresponding visual and verbal information. This study examined the effects of two methods of
promoting integration, color coding and labeling, on learning about probabilistic reasoning from
a table and text. Undergraduate students (N = 98) were randomly assigned to learn about
probabilistic reasoning from one of 4 computer-based lessons generated from a 2 (color
coding/no color coding) by 2 (labeling/no labeling) between-subjects design. Learners added the
labels or color coding at their own pace by clicking buttons in a computer-based lesson.
Participants’ eye movements were recorded while viewing the lesson. Labeling was beneficial
for learning, but color coding was not. In addition, labeling, but not color coding, increased
attention to important information in the table and time with the lesson. Both labeling and color
coding increased looks between the text and corresponding information in the table. The findings
provide support for the multimedia principle (Mayer, 2009), and they suggest that providing
labeling enhances learning about probabilistic reasoning from text and tables.
Keywords: probabilistic reasoning; instructional design principles; eyetracking
COLORCODINGANDLABELING
4
Learning about Probability from Text and Tables:
Do Color Coding and Labeling Help?
Many people struggle with probabilistic reasoning, especially when calculating posterior
probability (Evans, Handley, Perham, Over & Thompson, 2000; Kahneman & Tversky, 1973;
Stanovich & West, 1998). Posterior probability judgments require the evaluation of a hypothesis
after being presented with relevant data. Such calculations can be used, for example, to judge the
probability that a person who tested positive for a disease, actually has the disease. In order to
make a correct judgment about this problem, people have to consider three pieces of information:
(a) the true positive rate: the probability of the test giving a positive result when the person
actually has the disease; (b) the false positive rate: the probability of the test giving a positive
result when the person does not have the disease; and (c) the base rate/prevalence: the probability
that a randomly chosen person from the population has the disease. People often fail to integrate
these three pieces of information appropriately, and, thus, they often generate incorrect
responses. Because of the complexity of probabilistic reasoning, teaching probabilistic reasoning
is also quite challenging (Garfield & Ben-Zvi, 2008). Given the ubiquity of test results in modern
society, it is important to understand this type of probabilistic reasoning (Hoffrage, Kurzenhäuser,
& Gigerenzer, 2005; Kurzenhäuser & Hertwig, 2006) and to develop effective ways to instruct
people about it.
Visual representations, such as tables and diagrams, have been found to be beneficial in
instruction on calculating posterior probability (Kurzenhäuser & Hoffrage, 2002; Sedlmeier &
Gigerenzer, 2001). However, learners do not always use visual representations effectively, and
they often fail to adequately integrate visual information with corresponding verbal information
(Seufert, 2003). Thus, learners may benefit from instructional design techniques that support
COLORCODINGANDLABELING
5
their integrating corresponding ideas in visual and verbal representations (de Koning, Tabbers,
Rikers, & Paas, 2009). The purpose of this study is to test the effects of two such instructional
design techniques, color coding and labeling, on learning from a computer-based lesson about
posterior probability.
Theoretical Background
According to the multimedia principle (Mayer, 2002, 2009), visual representations
enhance learning because of the connections they afford with verbal information in text or
speech (Mayer, 2002, 2005, 2009). When using materials with both verbal and visual
information, learners create a verbal mental model based on information presented in text or
speech, as well as a visual mental model based on information presented in the visuals (Mayer,
2009). When learners select and integrate corresponding information in the verbal and visual
representations, connections are made between the two mental models (Mayer, 1999). Thus, in
the case of a posterior probability lesson presented with text and visuals, learners can integrate
verbal descriptions of how posterior probability works with a relevant visual representation. For
example, a learner could select the verbal description of a true positive as well as the visual
portraying a true positive in a hypothetical data set. Then, the learner could integrate the
information regarding true positives in the two representations. This integration of verbal and
visual information may increase comprehension of the material, which in turn may increase
learning (Schnotz, 2002). However, in order for this integration to occur, it is important that l
COLORCODINGANDLABELING
6
earners properly attend to and connect the corresponding information in verbal and visual
representations (de Koning et al., 2009; Mayer, 2003).
Integrating corresponding information in different representations can be especially
challenging in written lessons because of the split attention effect, in which a learner’s visual
attention is divided between the two representations (Chandler & Sweller, 1991, 1992). Simply
put, learners cannot look at both the visual representation and the text at the same time, making
integrating different sources of information cognitively demanding. In an oral lesson, learners
can listen to the verbal information and view the visual representation simultaneously (Mousavi,
Low & Sweller, 1995; Moreno & Mayer, 1999). Furthermore, instructors can guide connections
between corresponding verbal and visual information through gesture (Alibali et al., 2014;
Nathan & Alibali, 2011). However, when learners independently read a written lesson, they may
have difficulty connecting the information in text with the information in the visual
representation because of the split attention effect (Low & Sweller, 2005). Learners must
maintain information from one representation in working memory while searching for
corresponding information in the other representation (Kalyuga, Chandler, & Sweller, 1999). For
this reason, when learners need attend to both a visual representation and the corresponding
written text, they may benefit from support for making connections between the visual
representation and the text.
Lessons with text and visual information may be more effective if they include supports
for making connections. Two such techniques that have been found to be effective in past
research based on science lessons are color coding and labeling (Florax & Ploetzner, 2010;
Ozcelik, Karakus, Kursun, & Cagiltay, 2009). Color coding and labeling can assist learners both
COLORCODINGANDLABELING
7
in selecting important information and in integrating corresponding information in visual
representations and text.
Color coding involves presenting corresponding information in the same color, but one
that contrasts with the surrounding information. Previous research findings have indicated that
color coding corresponding information in text and visual representations increased learning
(Kalyuga et al., 1999; Keller, Gerjets, Scheiter, & Garsoffky, 2006). This is likely because color
provides a visual contrast that may signal the learner that information is important or related,
thereby assisting in selecting and attending to important information (Schnotz & Lowe, 2008;
Tabbers, Martens, & van Merriënboer, 2004). Selecting and attending to important components
of visual representations is critical for learning, because learners must first identify and process
relevant information in the visual representations before they can integrate the information in the
visual representation with the text (Mayer, 1996). Moreover, the use of shared color can guide
connections between verbal and visual representations (Ozcelik et al., 2009; Ozcelik, Arslan-Ari,
Cagiltay, 2010). This is because learners can use the shared color to quickly identify information
that should be connected (Cook, 2006; Patrick, Carter, & Wiebe, 2005). Learners can then focus
more cognitive resources on understanding the material, which can lead to better learning
(Mayer, 2009).
Labeling, which involves adding text to visual representations, can also help learners
select and integrate information in different representations. Like color coding, labels can signal
the learner that information is important or relevant. Through this signaling, learners can use
labels to help them select and attend to important components of visual representations (Florax &
Ploetzner, 2010; Johnson & Mayer, 2012). In addition, because a label is comprised of text,
labeling allows for text to be in close proximity to corresponding visual information, thereby
COLORCODINGANDLABELING
8
making verbal and visual representations more spatially contiguous, which cues the learner that
the information from the two representations should be connected (Holsanova, Holmberg, &
Holmquist, 2009). Furthermore, the spatial contiguity of corresponding verbal and visual
information provided by labels may assist learners in connecting the words in the label with
those same words in the main body of text. This may ease visual searches for information
(Johnson & Mayer, 2012). In these ways, labeling can guide the integration of corresponding
information in the text and visual representations (Mason, Pluchino, & Tornatora, 2013b). As
with color coding, labeling decreases the cognitive resources needed for selecting important
information and making connections, which increases the availability of cognitive resources for
learning.
Instructional design techniques such as color coding and labeling have typically been
examined in isolation (Florax & Ploetzner, 2010; Mason et al., 2013b; Ozcelik et al., 2009,
2010). That is, learning from a lesson with one of these techniques has usually been compared to
learning from a lesson without that specific technique (however, see Jamet, Gavota, & Quaireau,
2008, for an exception). It is possible that using two instructional design techniques
simultaneously may be particularly beneficial because each adds distinct benefits; that is, color
coding and labeling signal important information and guide integration in different ways. Indeed,
the use of two instructional design techniques (e.g., color coding and presenting information step
by step) in oral presentations was found to be particularly helpful for retention of lesson
information (Jamet et al., 2008). However, no research to date has addressed the possibility that a
combination of color coding and labeling could lead to greater learning from written lessons than
either technique on its own. It is possible that combining color coding and labeling could be
especially beneficial because leaners would have two techniques designed to enhance the
COLORCODINGANDLABELING
9
selection of important information and integration of text and visuals, and these effects could be
additive. Conversely, it is possible that color coding and labeling serve such similar functions
that combining them may not yield any additional benefit. Without testing the combination, it is
uncertain whether optimal design of instructional materials should involve labels only, color
coding only, or the combination of both.
Color coding and labeling may be particularly effective when implemented in computer-
based lessons because, unlike traditional lessons on paper, computer-based lessons can have
interfaces that permit (or require) learners to add the color coding and labeling themselves (see
Najjar, 1998). Labeling and color coding can be added by having learners click on buttons to
make labels and color codes appear. This approach may maximize the benefits of labeling and
color coding because it affords the opportunity to show a single label or color code at a time.
With only one cue at a time, learners can better focus their attention on the color coded and/or
labeled areas (O'Byrne, Patry, & Carnegie, 2008). Indeed, the benefits of labeling appear to be
enhanced if learners interacted with a computer interface to reveal each of the labels (Evans &
Gibbons, 2007). Furthermore, this design permits learners to view the labels and color codes at
their own pace, and to review them multiple times if necessary, which also may promote learning
(Boucheix & Guignard, 2005; Mayer & Chandler, 2001).
Need for Cognition
Past research findings indicate that performance on probabilistic reasoning tasks is
associated with a thinking disposition known as need for cognition. Need for cognition is the
tendency for an individual to engage in and enjoy effortful cognitive activities (Cacioppo &
Petty, 1982). Individuals with high levels of need for cognition are more likely to process and
systematize information, sorting out the irrelevant from the important, than individuals with low
COLORCODINGANDLABELING
10
levels of need for cognition (Cacioppo & Petty, 1984; for a review on need for cognition, see
Cacioppo, Petty, Feinstein, & Jarvis, 1996). Additionally, individuals with high levels of need
for cognition engage in cognitively challenging activities without external motivation (Heijltjes,
van Gog, Leppink, & Paas, 2014), whereas individuals with low levels of need for cognition
prefer to engage in effortful cognitive tasks only when they have a good reason to do so
(Haugtvedt, Petty, & Cacioppo, 1992). Because need for cognition is associated with enjoyment
of complex and effortful cognitive tasks, it has been found to be positively related to logical
reasoning (e.g., Smith & Levin, 1996; Jarvis & Petty, 1996). Moreover, in educational contexts,
need for cognition is positively associated with academic achievement (see Sadowski & Gulgoz,
1992).
Researchers have shown that need for cognition is positively related to performance on
probabilistic reasoning tasks (Kokis et al., 2002; West, Toplak & Stanovich, 2008). This is likely
because need for cognition is positively associated with an inclination to think deeply about
problems (Morsanyi, Primi, Chiesi, & Handley, 2009). For these reasons, we also considered
individual differences in need for cognition in examining the effectiveness of lessons on
probabilistic reasoning.
The Current Study
The purpose of the current study is to investigate the effects of color coding and labeling,
previously found to be effective in learning from multiple representations in science lessons, on
learning about posterior probability from a table and text. Posterior probability was a suitable
topic for investigating this issue because it is frequently challenging for undergraduate students
to integrate all of the relevant information (Kahnman & Tversky, 1973; Morsanyi, Handley &
Serpell, 2013). Therefore, support from color coding and labeling may be particularly helpful.
COLORCODINGANDLABELING
11
Tables were chosen as a visual because they are commonly used when teaching posterior
probability (Steckelberg, Balgenorth, Berger, Muhlhaüser, 2004). As our primary research
question, we asked whether color coding and labeling would promote learning about posterior
probability. Based on previous findings (e.g., Boucheix & Lowe, 2010; Catrambone, 1994, 1996;
de Koning et al., 2010; Florax & Ploetzner, 2010; Johnson & Mayer, 2012; Mason et al., 2013b;
Ozcelik et al, 2009, 2010), we expected that both color coding and labeling would increase
learning about posterior probability. However, we were uncertain as to which would be more
effective given that both have been shown to be beneficial and they had not been previously
compared to each other. It is also possible that a combination of color coding and labeling would
yield the greatest increases in learning. A combination of color coding and labeling would
provide two forms of guidance while learning, which could be beneficial for a complex topic
such as posterior probability.
As our secondary research question, we examined how color coding and labeling affected
learners’ processing of the lesson, in other words, what learners did while reading the lesson. To
test the effects of color coding and labeling on the processing of the lesson, we used eyetracking.
According to the eye-mind hypothesis, the eye fixates (i.e., pauses) on what the mind is
processing (Just & Carpenter, 1980). In this way, eye movements can be used to infer how
information is processed (Rayner, 1998). We were specifically interested in how labeling and
color coding affected attention to important areas of a text, integration of relevant information in
text and tables, and the time spent processing the lesson.
Color coding and labeling are thought to assist learners in selecting important information
(Ozcelik et al., 2009; Mayer & Johnson, 2008). This selection of important information would
likely yield an increase in attention to that information (Mayer, 2014). Eyetracking measures can
COLORCODINGANDLABELING
12
yield information about how much a learner attends to a particular section of a lesson. The
eyetracking measure of total fixation time is the summed duration of fixations on a particular
area and is indicative of attention to that area (Johnson & Mayer, 2012; Rayner, 1977). Color
coding has been previously shown to increase attention to color coded areas of a visual
representation (Ozcelik et al., 2009). Labeling has not been found to increase attention as
indicated by total fixation time on visual representation as a whole (Johnson & Mayer, 2012;
Mason et al., 2013b). However, these studies (Johnson & Mayer, 2012; Mason et al., 2013b) did
not examine whether labeling increased attention to specific areas of a visual representation.
Given that labeling is thought to increase attention to specific areas of a visual representation
(Florax & Ploetzner, 2010), it is likely that total fixation time would be longer if an area of a
visual representation is labeled. In addition, the combined use of color coding and labeling could
increase attention to specific areas of a visual representation. Both the color contrast and label
could signal to learners that a particular area of a visual representation is important, leading to
increased attention to that area, relative to color coding alone or labeling alone.
Eyetracking can also be useful for examining how learners integrate information from
visual representations and text. Learners may look to and from different representations as they
attempt to align and integrate relevant information (Mason, Tornatora, & Pluchino, 2013c).
Previous research findings have indicated that color coding can assist in integrating
corresponding information between text and diagrams (Ozcelik et al., 2009). In addition, labeling
has been found to increase looks between text and corresponding information in a diagram
(Johnson & Mayer, 2012; Mason et al., 2013b). Therefore, based on previous research (Ozcelik
et al., 2009, 2010; Mason et al., 2013b), we expected that both color coding and labeling would
increase looks from the text to relevant information in the table and vice versa.
COLORCODINGANDLABELING
13
We were also interested in how color coding and labeling influenced the time spent with
the lesson. Given that color coding and labeling add information to the lesson, it is logical that
these instructional design techniques could increase the amount of time spent on the lesson (e.g.,
Johnson & Mayer, 2012). This increased time with the lesson could explain any observed
learning benefits due to instructional design techniques.
If differences as a function of color coding and labeling are found, both in performance
and in in how the lessons are processed in terms of integration, attention, and time on task, it is
possible that observed differences in performance could be due to the observed differences in
processing. To address this issue, we also examined relationships between the processing of the
lesson (integration, attention, and time with the lesson) and performance.
We also assessed participants’ need for cognition. As described above, findings from
previous studies (Klaczynski, 2014; Kokis et al., 2002; Morsanyi et al., 2009) have shown that
need for cognition is related to probabilistic reasoning skills. Therefore, we expected that need
for cognition would be related to participants’ ability to compute posterior probabilities after our
training sessions. Despite random assignment, there were pre-existing differences in need for
cognition between the labeling and no labeling conditions, so we controlled for the statistical
effects of need for cognition in addressing each of these research questions.
Methods
Participants
Undergraduate students (N = 103) participated for extra credit in a psychology course.
Eyetracking data were not recorded for 2 participants due to apparatus malfunction. In addition,
3 participants did not complete all of the necessary measures. Of the remaining 98 participants,
63% were female and 36% were male, and their average age was 18.92 years (SD = 1.68 years; 2

COLORCODINGANDLABELING
14
participants did not report age). Per self-report, 2% of participants were African American, 5%
were Asian, 3% were Hispanic or Latino, 86% were Caucasian, 1% were Native American, and
3% were biracial. All participants reported being native speakers of English and all had normal
or corrected-to-normal vision.
Materials
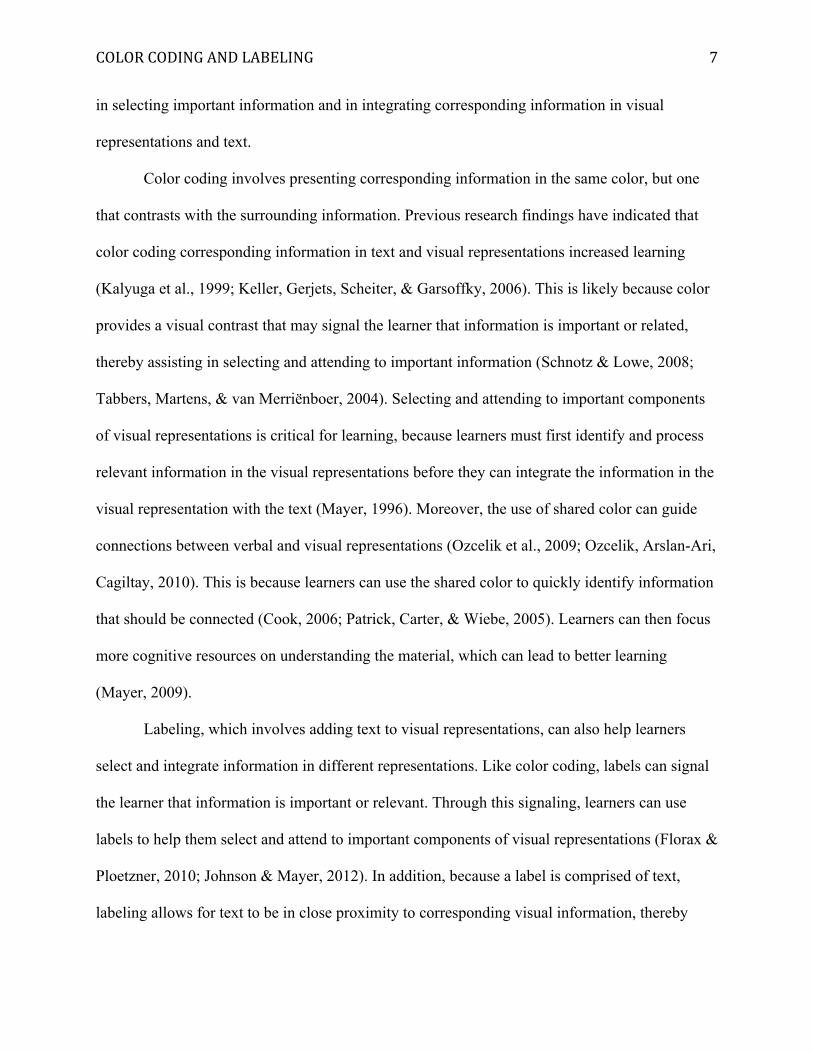
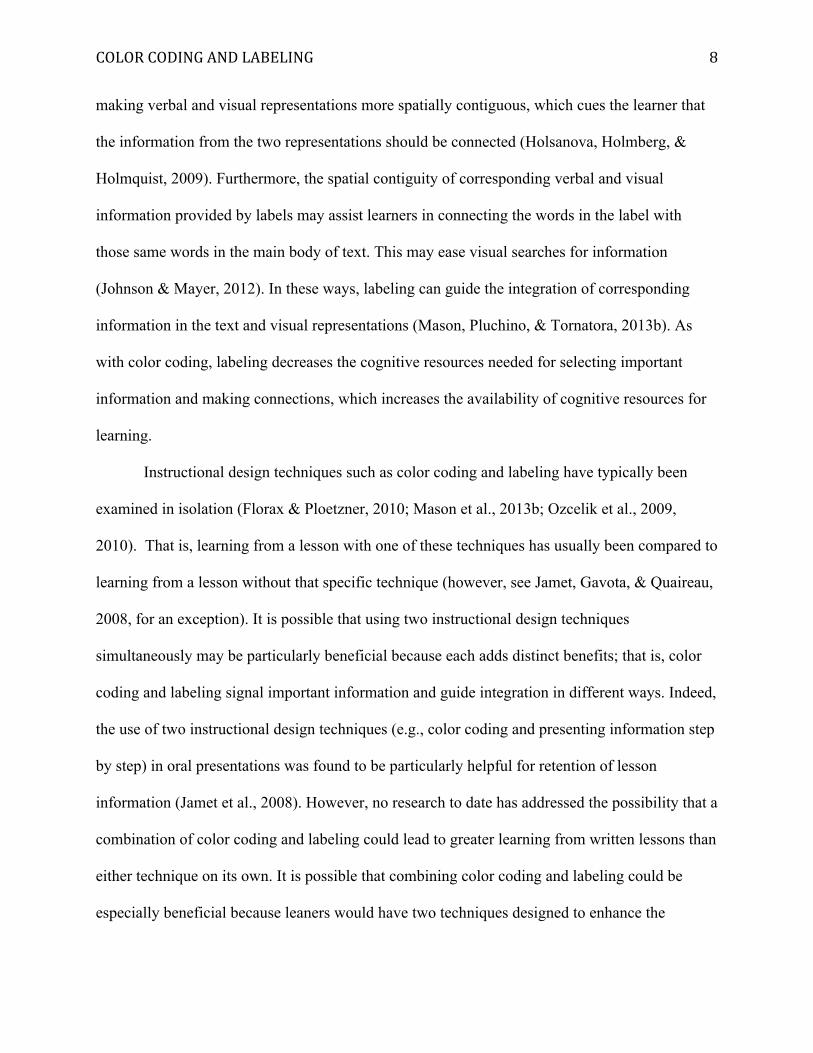
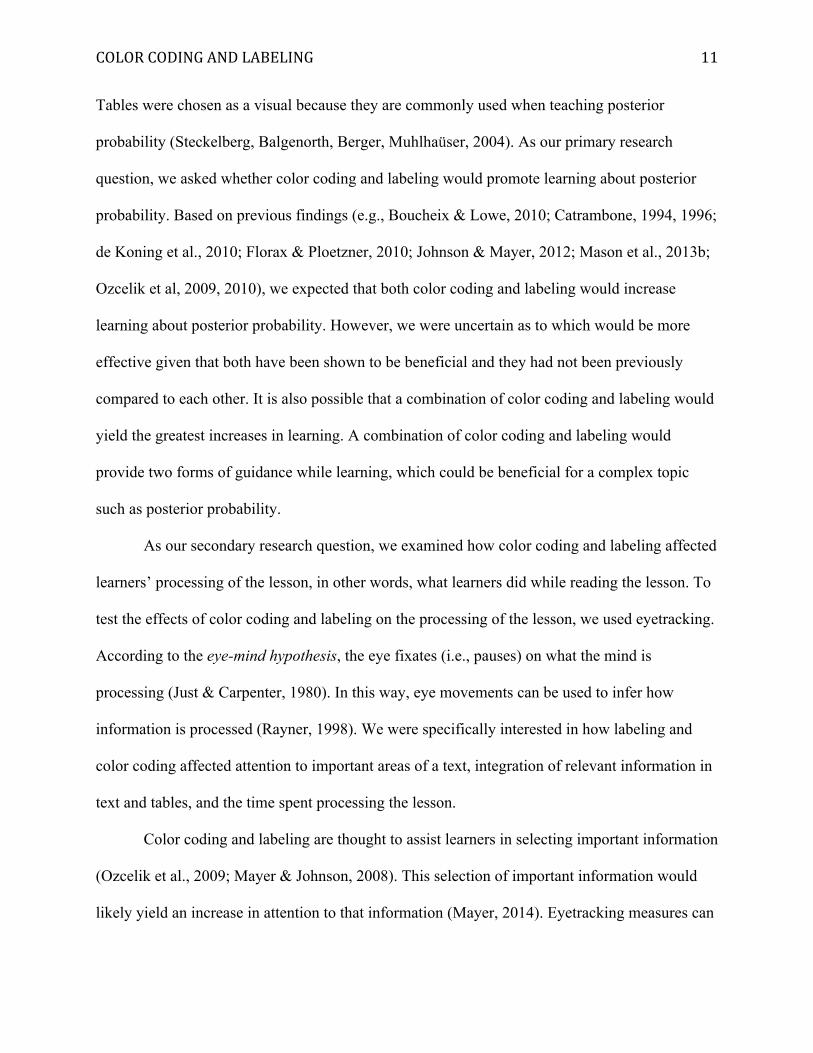
Each participant saw two pages of a website with material adapted from Gigerenzer,
Gaissmaier, Kurz-Milcke, Schwartz, and Woloshin (2007). The first page had only text and
introduced posterior probability as a means to accurately interpret test results. The second page
had text as well as a table with frequency information. There were four versions of the second
page of the website, reflecting a 2 (color coding/no color coding) by 2 (labeling/no labeling)
design: color coding and labeling, color coding and no labeling, labeling and no color coding,
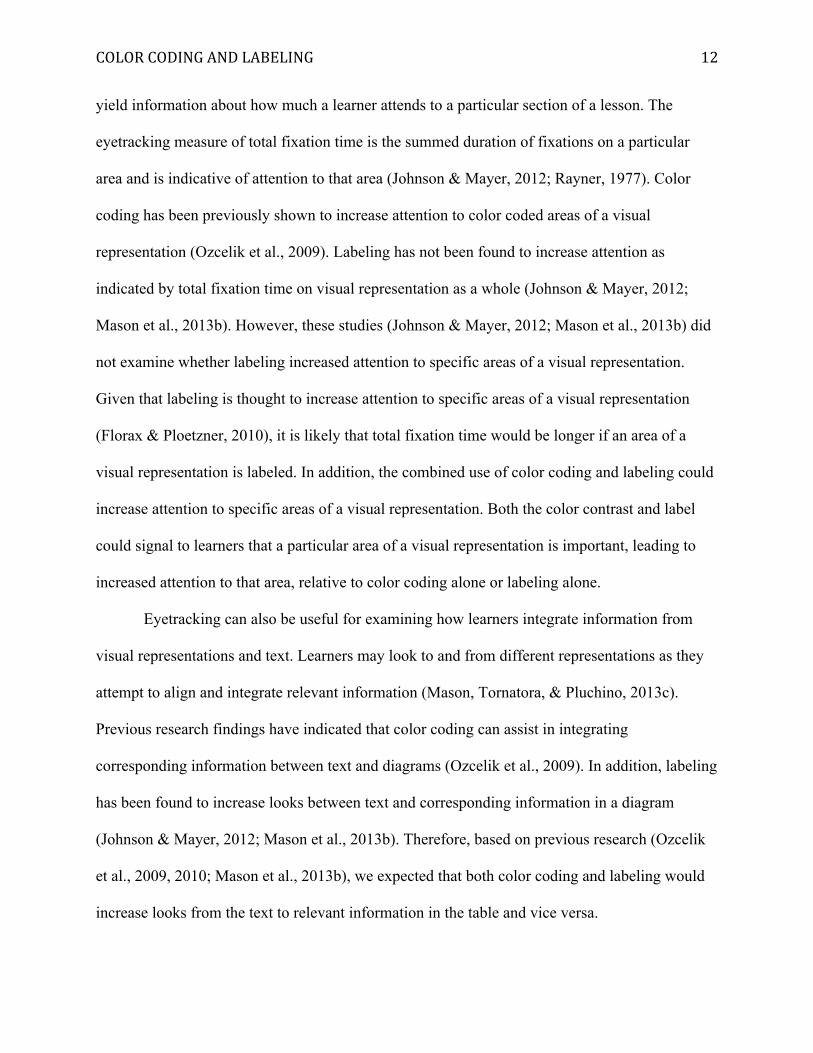
and no color coding or labeling (control). Four of the sentences in the color coding and/or
labeling conditions had buttons for participants to click to add color coding and/or labeling
(depending on the condition). If a participant was in the control condition, there were no buttons
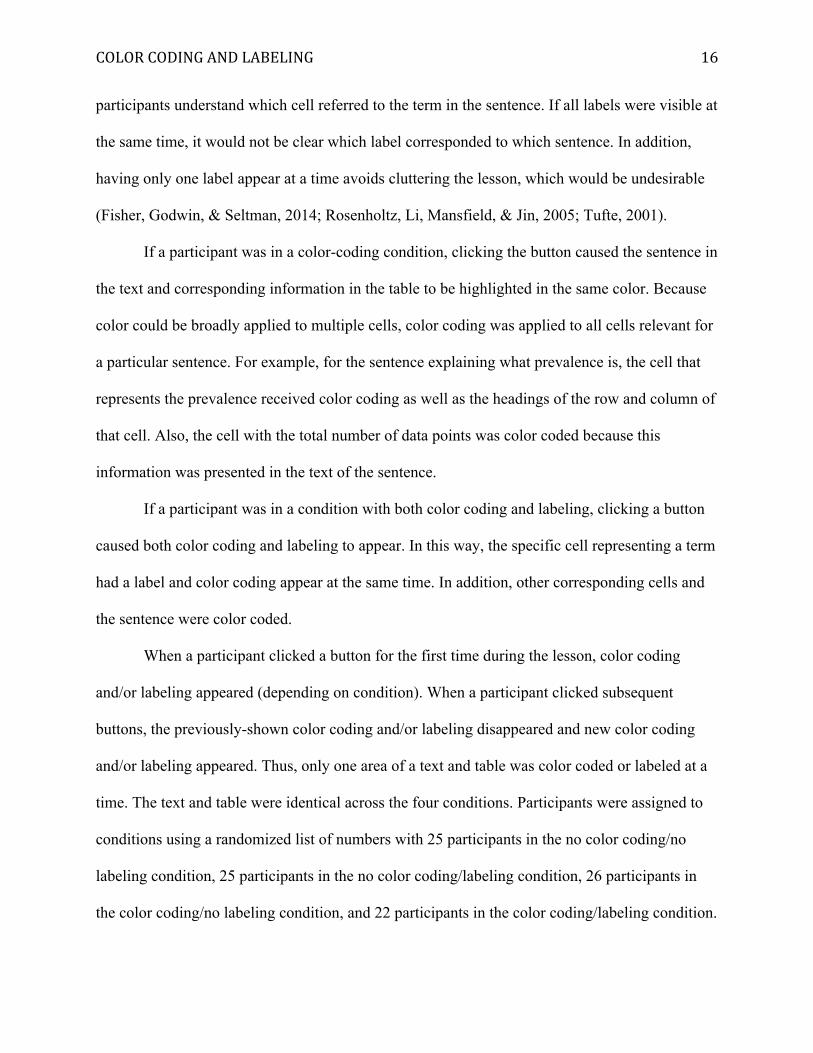
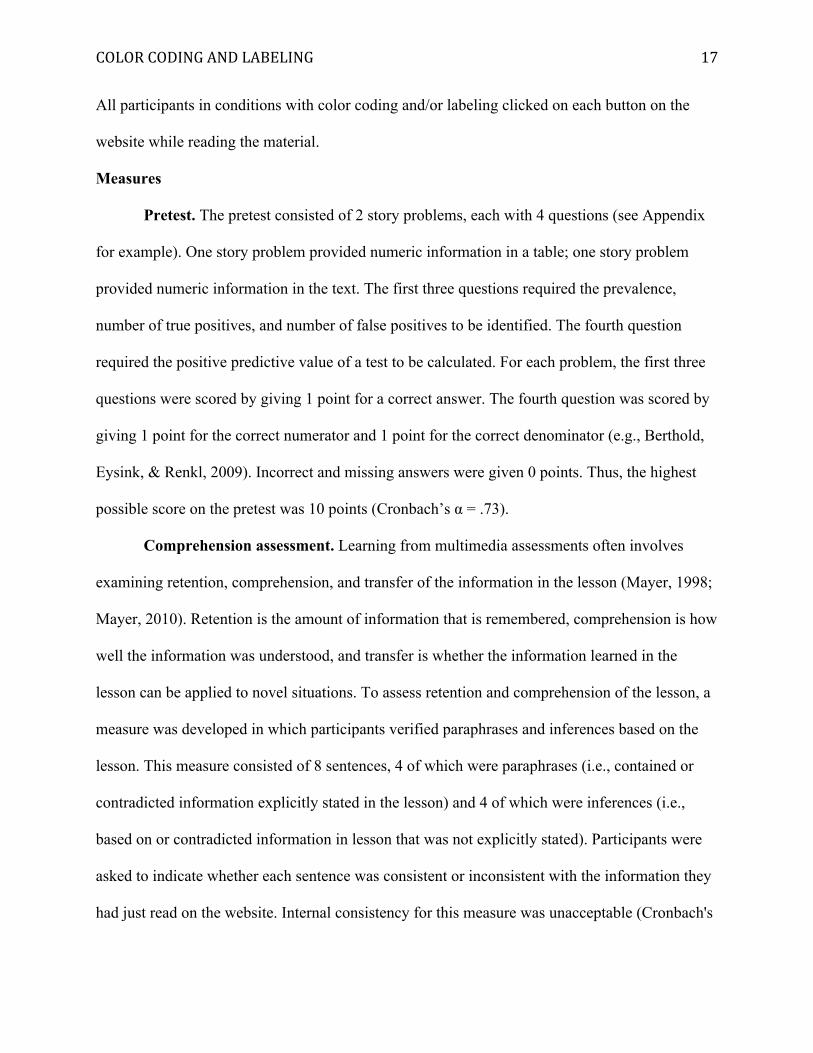
as there was no color coding or labeling to add. See Figure 1 and Figure 2 for examples of the
website conditions.
COLORCODINGANDLABELING
15
Figure 1. Website without color coding or labeling
Figure 2. Website with color coding and labeling
If a participant was in a labeling condition, clicking the button caused a call-out box to
appear in the table with an important term next to the cell representing the term. The term in a
particular label was used in the sentence next to that button. Only one label appeared at a time.
The presentation of only one label at a time after clicking a button was intended to help
COLORCODINGANDLABELING
16
participants understand which cell referred to the term in the sentence. If all labels were visible at
the same time, it would not be clear which label corresponded to which sentence. In addition,
having only one label appear at a time avoids cluttering the lesson, which would be undesirable
(Fisher, Godwin, & Seltman, 2014; Rosenholtz, Li, Mansfield, & Jin, 2005; Tufte, 2001).
If a participant was in a color-coding condition, clicking the button caused the sentence in
the text and corresponding information in the table to be highlighted in the same color. Because
color could be broadly applied to multiple cells, color coding was applied to all cells relevant for
a particular sentence. For example, for the sentence explaining what prevalence is, the cell that
represents the prevalence received color coding as well as the headings of the row and column of
that cell. Also, the cell with the total number of data points was color coded because this
information was presented in the text of the sentence.
If a participant was in a condition with both color coding and labeling, clicking a button
caused both color coding and labeling to appear. In this way, the specific cell representing a term
had a label and color coding appear at the same time. In addition, other corresponding cells and
the sentence were color coded.
When a participant clicked a button for the first time during the lesson, color coding
and/or labeling appeared (depending on condition). When a participant clicked subsequent
buttons, the previously-shown color coding and/or labeling disappeared and new color coding
and/or labeling appeared. Thus, only one area of a text and table was color coded or labeled at a
time. The text and table were identical across the four conditions. Participants were assigned to
conditions using a randomized list of numbers with 25 participants in the no color coding/no
labeling condition, 25 participants in the no color coding/labeling condition, 26 participants in
the color coding/no labeling condition, and 22 participants in the color coding/labeling condition.
COLORCODINGANDLABELING
17
All participants in conditions with color coding and/or labeling clicked on each button on the
website while reading the material.
Measures
Pretest. The pretest consisted of 2 story problems, each with 4 questions (see Appendix
for example). One story problem provided numeric information in a table; one story problem
provided numeric information in the text. The first three questions required the prevalence,
number of true positives, and number of false positives to be identified. The fourth question
required the positive predictive value of a test to be calculated. For each problem, the first three
questions were scored by giving 1 point for a correct answer. The fourth question was scored by
giving 1 point for the correct numerator and 1 point for the correct denominator (e.g., Berthold,
Eysink, & Renkl, 2009). Incorrect and missing answers were given 0 points. Thus, the highest
possible score on the pretest was 10 points (Cronbach’s α = .73).
Comprehension assessment. Learning from multimedia assessments often involves
examining retention, comprehension, and transfer of the information in the lesson (Mayer, 1998;
Mayer, 2010). Retention is the amount of information that is remembered, comprehension is how
well the information was understood, and transfer is whether the information learned in the
lesson can be applied to novel situations. To assess retention and comprehension of the lesson, a
measure was developed in which participants verified paraphrases and inferences based on the
lesson. This measure consisted of 8 sentences, 4 of which were paraphrases (i.e., contained or
contradicted information explicitly stated in the lesson) and 4 of which were inferences (i.e.,
based on or contradicted information in lesson that was not explicitly stated). Participants were
asked to indicate whether each sentence was consistent or inconsistent with the information they
had just read on the website. Internal consistency for this measure was unacceptable (Cronbach's
COLORCODINGANDLABELING
18
α = .32 for the entire measure; Cronbach's α = .19 for the paraphrase submeasure, and Cronbach's
α = .25 for the inference submeasure); therefore, we did not use this measure in analyses and it is
not discussed further.
Posttest. The posttest was similar in design to the pretest. It consisted of 4 story
problems, each with 4 questions. The posttest was designed to assess transfer of the learned
information (Mayer, 1998). Two story problems provided numeric information in a table; two
story problems provided numeric information in the text. The posttest was scored in the same
manner as the pretest. The highest possible score on the posttest was 20 points (Cronbach’s α =
.86).
Need for cognition. The Need for Cognition scale consisted of an 18-item scale from
Cacioppo, Petty, and Kao (1984). For each item, participants indicated on a Likert scale how
characteristic each item was of them. Examples of these items are “The notion of thinking
abstractly is appealing to me” and “I would prefer complex to simple problems.” Reverse scoring
was used on 9 items. The need for cognition score was determined by adding participants’
responses to the items (Cronbach’s α = .73).
Eyetracking. The text and tables were divided into areas of interest (AOIs) for
eyetracking analyses. Each sentence of the text was a separate AOI, and each cell of the table
was a separate AOI. The four sentences that directly corresponded to cells in the table were used
to examine looks from the text to the target cells in the table (and vice versa). The four cells to
which labels were added in the labeling conditions (i.e., target areas for labeling) were used to
examine the effects of labeling on attention to these cells and integration between these cells and
relevant sentences. The ten cells to which color coding was added in the color coding conditions
COLORCODINGANDLABELING
19
(i.e., target areas for color coding) were used to examine the effects of color coding on attention
to these cells and integration between these cells and relevant sentences.
Fixations less than 50 milliseconds (i.e., microfixations) were deleted prior to all
eyetracking data analyses (see similar analyses in Mason, Pluchino, & Tornatora, & Ariasi,
2013a). This is because learners need to fixate on information for a minimum of 50 milliseconds
to be able to engage in cognitive processing (Rayner, 2009).
Apparatus
An EyeLink 1000 Desk-Mounted System, manufactured by SR Research Ltd. (Toronto,
Ontario, Canada), was used to collect eye movement data. The EyeLink 1000 eye tracker uses an
infra-red video camera for monocular tracking, and the video camera was focused on the
participants’ pupils. The video camera sampled real-time fixations at a 1000 Hz sampling rate.
Head position was stabilized with a chin and forehead rest 70 cm from the computer monitor
displaying the lesson. Pupil diameter was recorded with centroid pupil tracking.
Procedure
After providing informed consent, participants were given the pretest. Participants were
instructed to answer the questions if they knew the answers, but not to guess if they were unsure.
After the pretest, the eyetracker was calibrated for each participant. During calibration,
participants gazed at a dot that appeared at 5 different points on the screen. This process was
repeated until the on-screen gaze position error was less than .5˚ of the visual angle from the
target for each eye. The calibration process took between 2-5 minutes. Then participants were
instructed to read the information at their own pace and to be sure to understand what they were
reading because they would be asked to answer questions about it afterwards. If the participants
were in a condition with color coding and/or labeling, they were instructed to click on the
COLORCODINGANDLABELING
20
buttons before each sentence prior to reading that sentence. The participants read the website
silently at their own pace. Popup calibration was used to record eye movements as participants
viewed the website. Popup calibration is software that allows for eye movements to be recorded
while participants view anything on a computer screen. After reading, participants completed a
distractor task of 21 simple multiplication and division problems, to prevent rehearsal of the
material from the lesson. Then, they were given the posttest with instructions similar to the
pretest. Following Kühl, Eitel, Damnik, and Körndle (2014), participants completed the Need
for Cognition scale after the posttest (Cacioppo et al., 1984). Finally, they were debriefed and
thanked for their participation.
Results
For all analyses, we set the Type I error rate at α = .05.
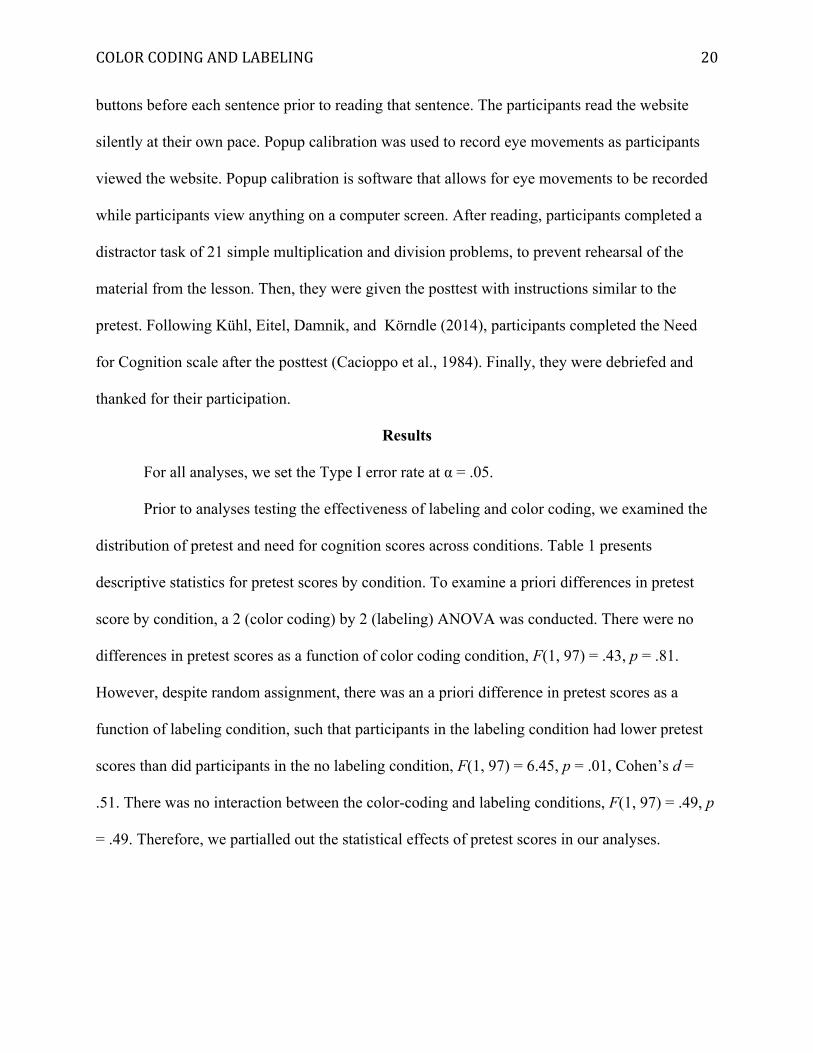
Prior to analyses testing the effectiveness of labeling and color coding, we examined the
distribution of pretest and need for cognition scores across conditions. Table 1 presents
descriptive statistics for pretest scores by condition. To examine a priori differences in pretest
score by condition, a 2 (color coding) by 2 (labeling) ANOVA was conducted. There were no
differences in pretest scores as a function of color coding condition, F(1, 97) = .43, p = .81.
However, despite random assignment, there was an a priori difference in pretest scores as a
function of labeling condition, such that participants in the labeling condition had lower pretest
scores than did participants in the no labeling condition, F(1, 97) = 6.45, p = .01, Cohen’s d =
.51. There was no interaction between the color-coding and labeling conditions, F(1, 97) = .49, p
= .49. Therefore, we partialled out the statistical effects of pretest scores in our analyses.
COLORCODINGANDLABELING
21
Table 1 Descriptive statistics of pretest scores by condition Color Coding No Color Coding Total M(SE) M(SE) M(SE) Labeling 3.95(.59) 3.56(.54) 3.76(.40) No Labeling 5.07(.52) 5.20(.54) 5.14(.37)
Total 4.51(.39) 4.38(.38)
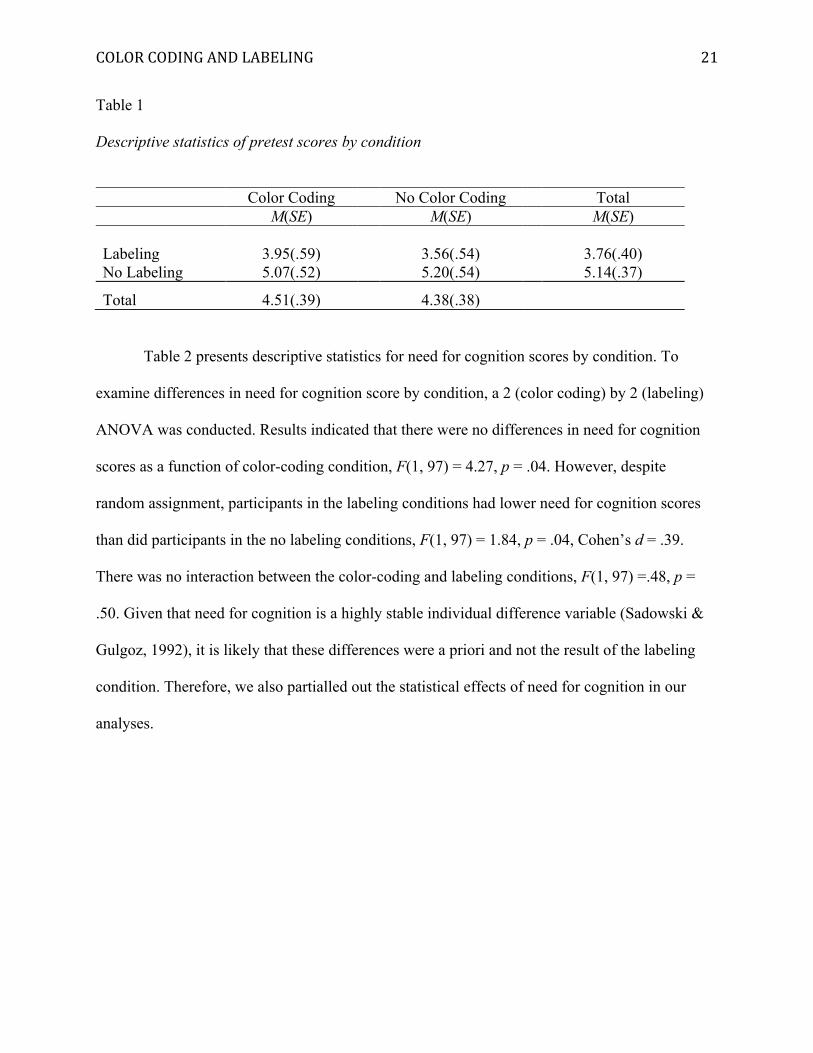
Table 2 presents descriptive statistics for need for cognition scores by condition. To
examine differences in need for cognition score by condition, a 2 (color coding) by 2 (labeling)
ANOVA was conducted. Results indicated that there were no differences in need for cognition
scores as a function of color-coding condition, F(1, 97) = 4.27, p = .04. However, despite
random assignment, participants in the labeling conditions had lower need for cognition scores
than did participants in the no labeling conditions, F(1, 97) = 1.84, p = .04, Cohen’s d = .39.
There was no interaction between the color-coding and labeling conditions, F(1, 97) =.48, p =
.50. Given that need for cognition is a highly stable individual difference variable (Sadowski &
Gulgoz, 1992), it is likely that these differences were a priori and not the result of the labeling
condition. Therefore, we also partialled out the statistical effects of need for cognition in our
analyses.
COLORCODINGANDLABELING
22
Table 2 Descriptive statistics of need for cognition scores by condition Color Coding No Color Coding Total M(SE) M(SE) M(SE) Labeling 55.52(1.74) 59.00(1.60) 57.26(1.18) No Labeling 60.26(1.54) 60.96(1.60) 60.61(1.11)
Total 57.89(1.16) 59.98(1.13)
Did color coding and labeling promote learning from the lessons?
We hypothesized that both labeling and color coding would increase learning. To test this
hypothesis, we conducted a 2 (color coding) by 2 (labeling) between subjects ANCOVA with
posttest scores as the dependent variable, and pretest scores and need for cognition scores as
covariates. Surprisingly, pretest score was not significant as a covariate, F(1, 95) = 2.76, p = .10,
η2 = .02. As expected, need for cognition was strongly associated with posttest scores, F(1, 95) =
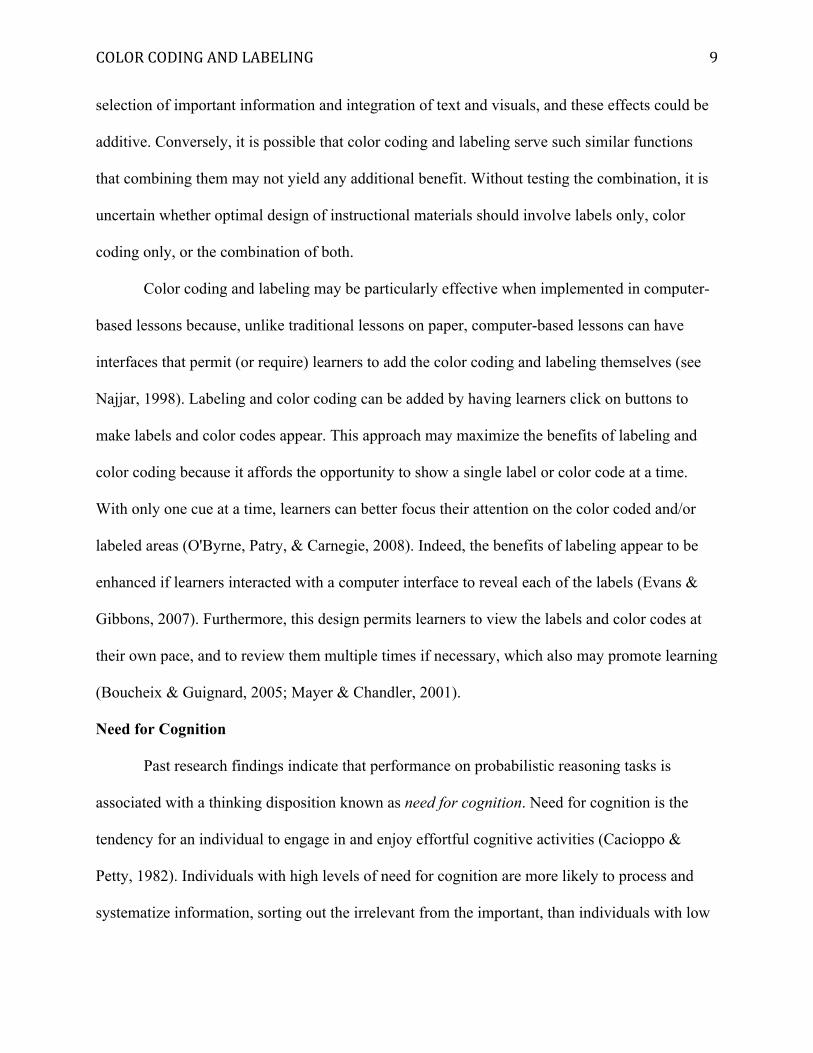
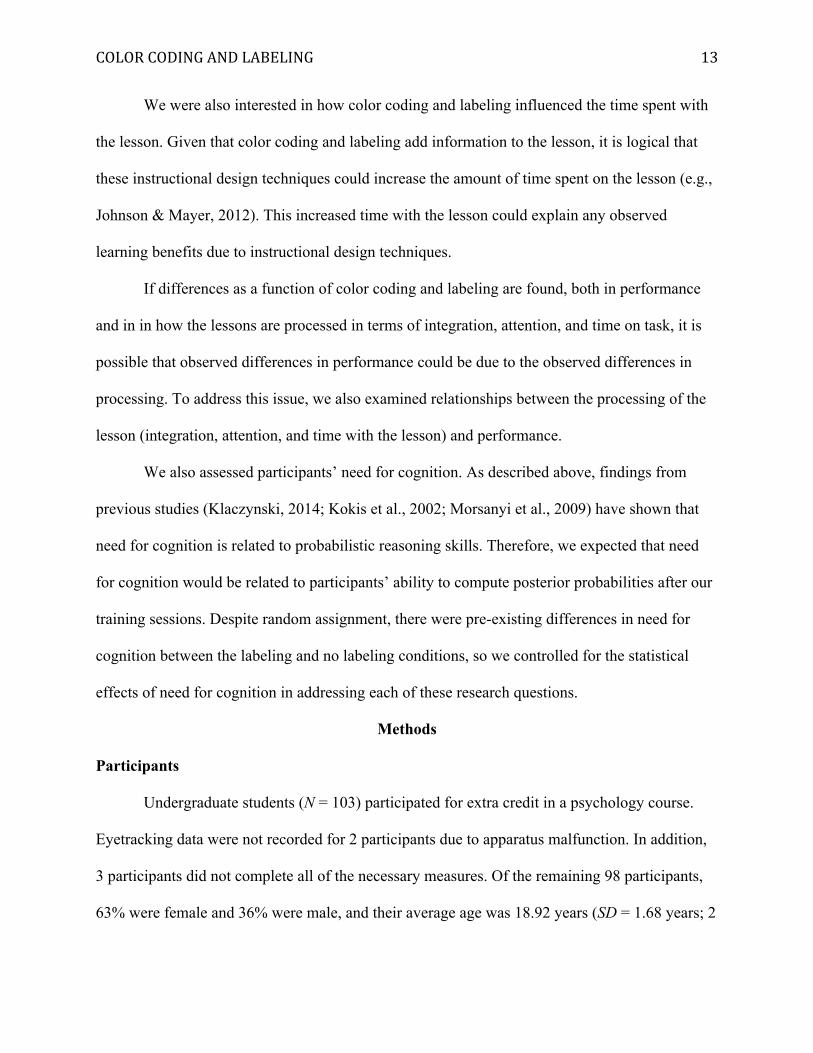
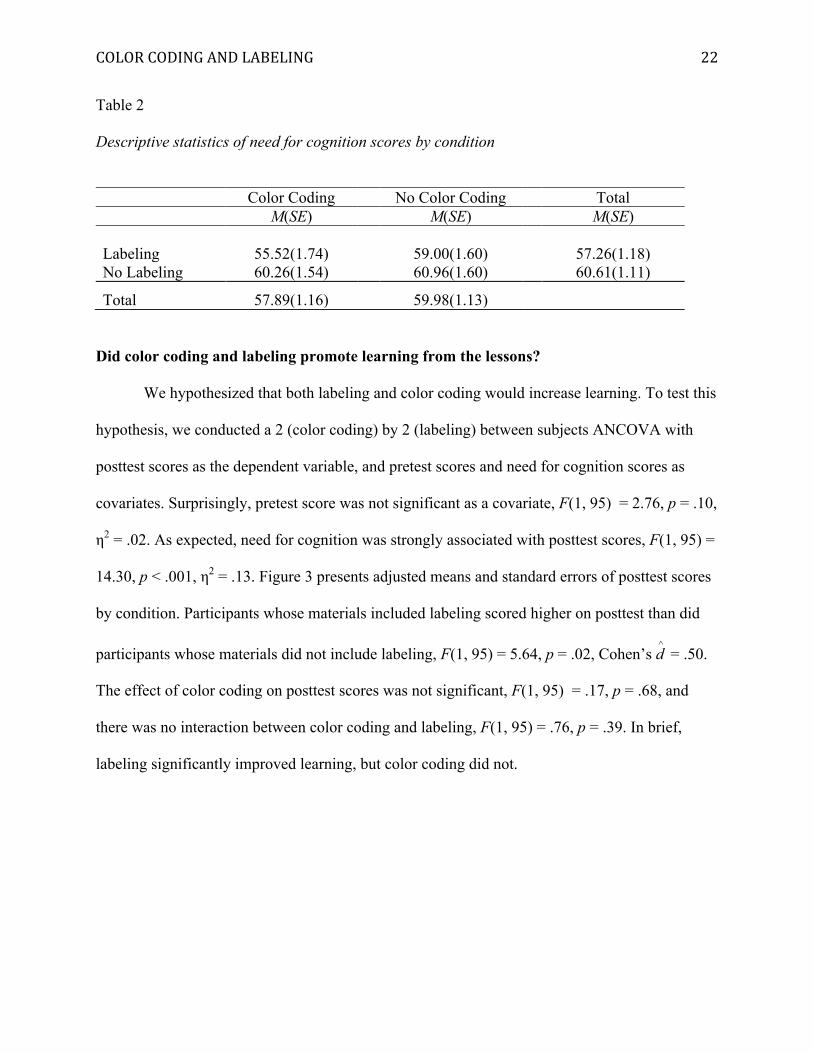
14.30, p < .001, η2 = .13. Figure 3 presents adjusted means and standard errors of posttest scores
by condition. Participants whose materials included labeling scored higher on posttest than did
participants whose materials did not include labeling, F(1, 95) = 5.64, p = .02, Cohen’s d^ = .50.
The effect of color coding on posttest scores was not significant, F(1, 95) = .17, p = .68, and
there was no interaction between color coding and labeling, F(1, 95) = .76, p = .39. In brief,
labeling significantly improved learning, but color coding did not.
COLORCODINGANDLABELING
23
Figure 3. Average posttest score in each condition (means and +/- 1 standard error bars
adjusted for covariates of pretest score and need for cognition score)
Did color coding or labeling increase attention to target areas of the table?
Because our eyetracking variables provide multiple data points for each participant, we
used mixed effects models (e.g., see Snijders & Bosker, 2012 for more information),
implemented using the package lme4 in the R statistical software (Bates, 2010; Bates, Maechler,
& Bolker, 2012). Specifically, we used a mixed effects model with color coding and labeling as
fixed factors (both centered at zero), AOI and participant as random factors, and eyetracking
variables as the dependent variables. We also included fixed effects for the covariates of need for
cognition and pretest score (both z-scored). We report Type III Wald chi-square tests of the
parameter estimates against 0. For tests with Poisson distributions, lme4 provides Wald z. For
tests with Gaussian distributions, lme4 provides Wald t.
02468101214161820
Labeling No Labeling Labeling No Labeling
Color Coding No Color Coding
Post
test
sco
re
COLORCODINGANDLABELING
24
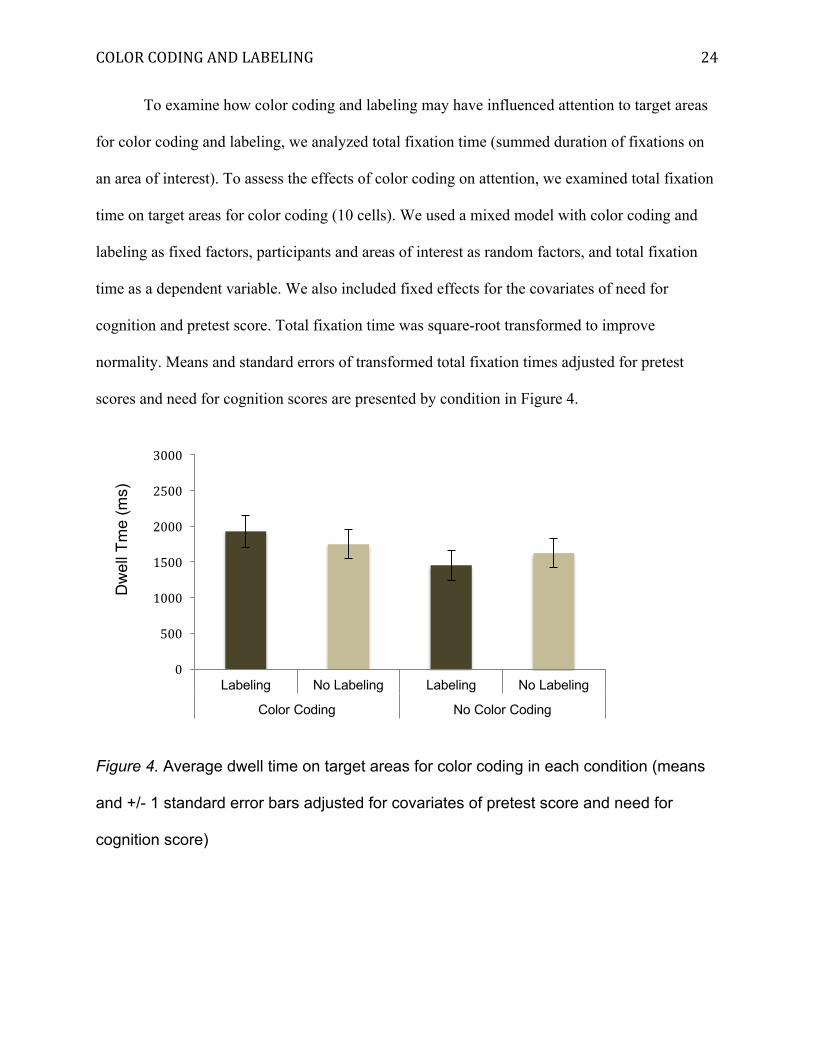
To examine how color coding and labeling may have influenced attention to target areas
for color coding and labeling, we analyzed total fixation time (summed duration of fixations on
an area of interest). To assess the effects of color coding on attention, we examined total fixation
time on target areas for color coding (10 cells). We used a mixed model with color coding and
labeling as fixed factors, participants and areas of interest as random factors, and total fixation
time as a dependent variable. We also included fixed effects for the covariates of need for
cognition and pretest score. Total fixation time was square-root transformed to improve
normality. Means and standard errors of transformed total fixation times adjusted for pretest
scores and need for cognition scores are presented by condition in Figure 4.
Figure 4. Average dwell time on target areas for color coding in each condition (means
and +/- 1 standard error bars adjusted for covariates of pretest score and need for
cognition score)
0
500
1000
1500
2000
2500
3000
Labeling No Labeling Labeling No Labeling
Color Coding No Color Coding
Dw
ell T
me
(ms)
COLORCODINGANDLABELING
25
We had expected that color coding would increase attention to target areas for color
coding. However, color coding did not significantly increase total fixation time on target areas
for color coding, b = 3.95, Wald t = 1.52, Wald χ2(1, N = 98) = 2.32, p = .12. Labeling also did
not increase total fixation time on target areas for color coding, b = -.71, Wald t = -.27, Wald
χ2(1, N = 98) = .07, p = .79. The interaction between color coding and labeling also was not
significant, b = 2.54, Wald t = .49, Wald χ2(1, N = 98) = .24, p = .62. Pretest score was not a
significant predictor, b = -1.65, Wald t = -1.24, Wald χ2(1, N = 98) = 3.47, p = .22, neither was
need for cognition, b = -2.50, Wald t = -1.86, Wald χ2(1, N = 98) = 3.47, p = .06.
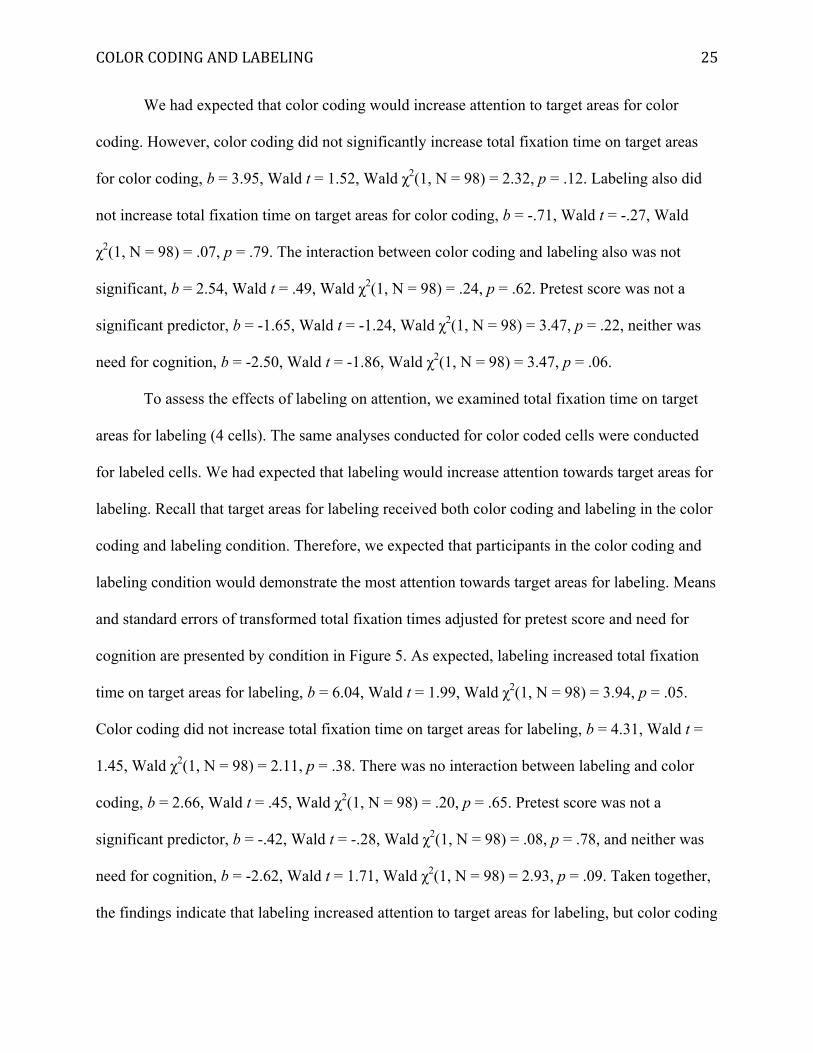
To assess the effects of labeling on attention, we examined total fixation time on target
areas for labeling (4 cells). The same analyses conducted for color coded cells were conducted
for labeled cells. We had expected that labeling would increase attention towards target areas for
labeling. Recall that target areas for labeling received both color coding and labeling in the color
coding and labeling condition. Therefore, we expected that participants in the color coding and
labeling condition would demonstrate the most attention towards target areas for labeling. Means
and standard errors of transformed total fixation times adjusted for pretest score and need for
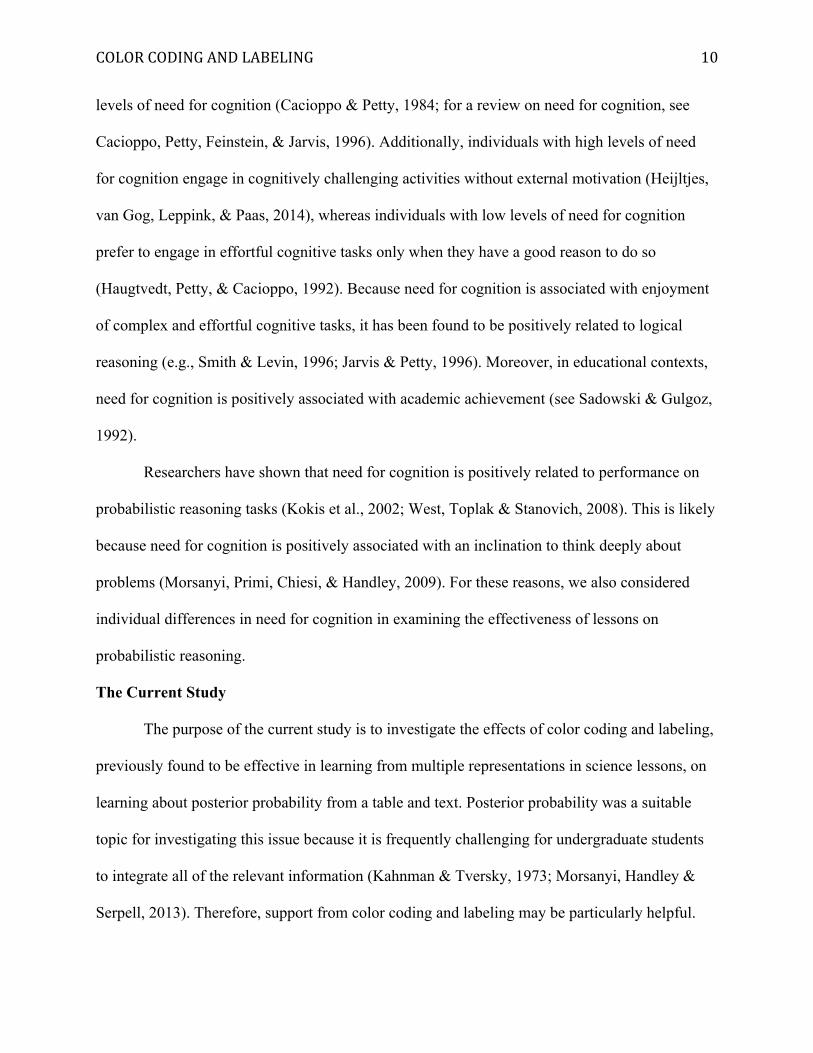
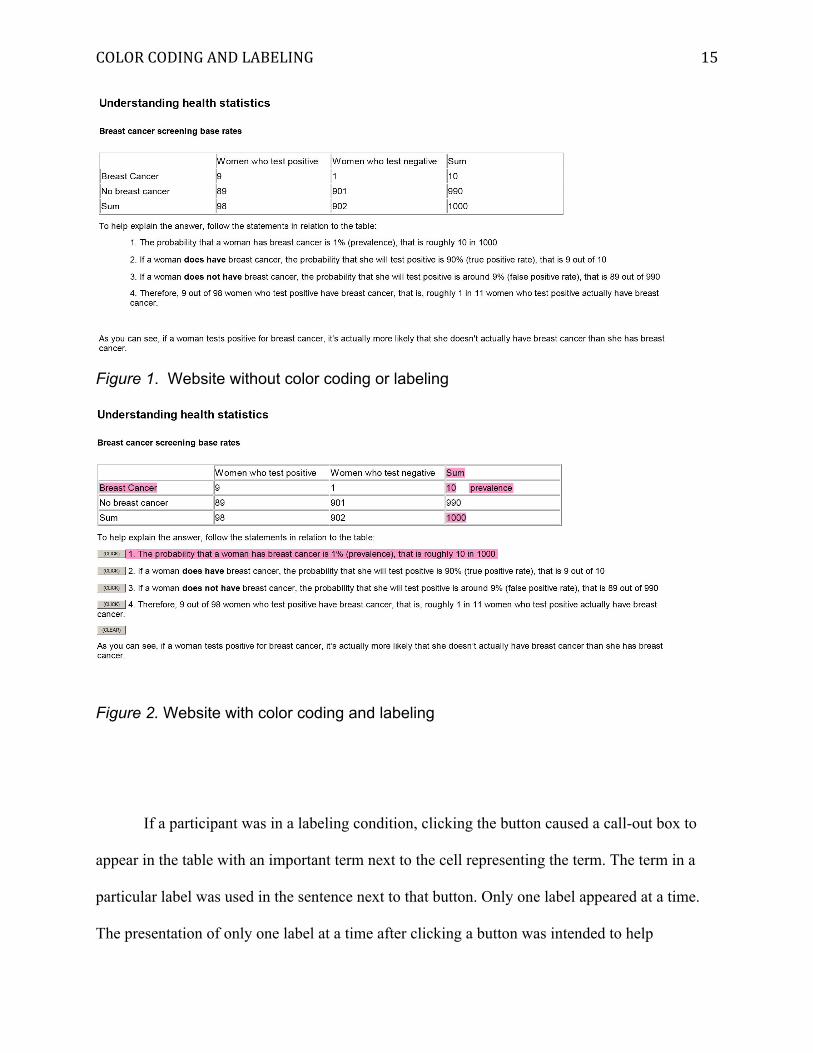
cognition are presented by condition in Figure 5. As expected, labeling increased total fixation
time on target areas for labeling, b = 6.04, Wald t = 1.99, Wald χ2(1, N = 98) = 3.94, p = .05.
Color coding did not increase total fixation time on target areas for labeling, b = 4.31, Wald t =
1.45, Wald χ2(1, N = 98) = 2.11, p = .38. There was no interaction between labeling and color
coding, b = 2.66, Wald t = .45, Wald χ2(1, N = 98) = .20, p = .65. Pretest score was not a
significant predictor, b = -.42, Wald t = -.28, Wald χ2(1, N = 98) = .08, p = .78, and neither was
need for cognition, b = -2.62, Wald t = 1.71, Wald χ2(1, N = 98) = 2.93, p = .09. Taken together,
the findings indicate that labeling increased attention to target areas for labeling, but color coding
COLORCODINGANDLABELING
26
did not affect attention to target areas for color coding. Further, there is no evidence that a
combination of color coding and labeling enhanced attention to target areas for labeling.
Figure 5. Dwell time for target areas for labeling in each condition (means and +/- 1
standard error bars adjusted for covariates of pretest score and need for cognition
score)
Did color coding and labeling influence participants’ looks between relevant areas of the
text and table?
To better understand how color coding and labeling may have influenced the process of
integrating corresponding ideas in the text and table, we analyzed eye movements. To examine
potential effects of color coding on integration, we combined two measures: the number of looks
from the sentences to relevant target areas for color coding and the number of looks from target
areas for color coding to the relevant sentences (see Mason et al., 2013c for similar
methodology). We hypothesized that color coding would increase looks between the relevant
sentences and the target areas for color coding.
0
500
1000
1500
2000
2500
3000
Labeling No Labeling Labeling No Labeling
Color Coding No Color Coding
Dw
ell t
ime
(ms)
COLORCODINGANDLABELING
27
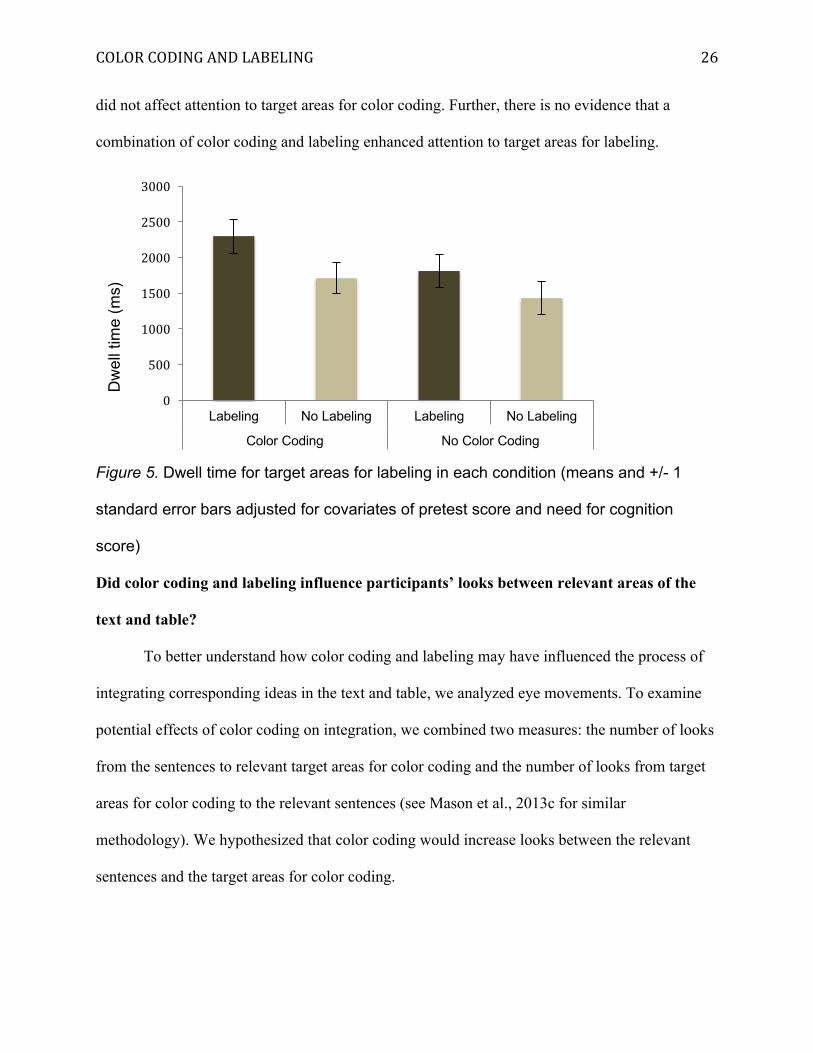
To test this hypothesis, we conducted a mixed effects model with color coding and
labeling as fixed factors, participant and AOI as random factors, pretest score and need for
cognition as covariates, and both the number of looks from the sentence to relevant target area
for color coding and the number of looks between the target area for color coding to the relevant
sentence as the dependent variable (Poisson distribution). Means and standard errors of looks
between sentences and relevant target areas for color coding adjusted for pretest score and need
for cognition are presented by condition in Figure 6.
Figure 6. Average looks between sentences and relevant target areas for color coding
in each condition (means and +/- 1 standard error bars adjusted for covariates of pretest
score and need for cognition score)
Consistent with expectations, color coding increased the number of looks between
sentences to relevant target areas for color coding, b = .30, Wald z = 1.98, Wald χ2(1, N = 98) =
3.92, p = .05. Also, labeling had an almost significant effect on increasing the number of looks
0
0.2
0.4
0.6
0.8
1
Labeling No Labeling Labeling No Labeling
Color Coding No Color Coding
Num
ber o
f Loo
ks
COLORCODINGANDLABELING
28
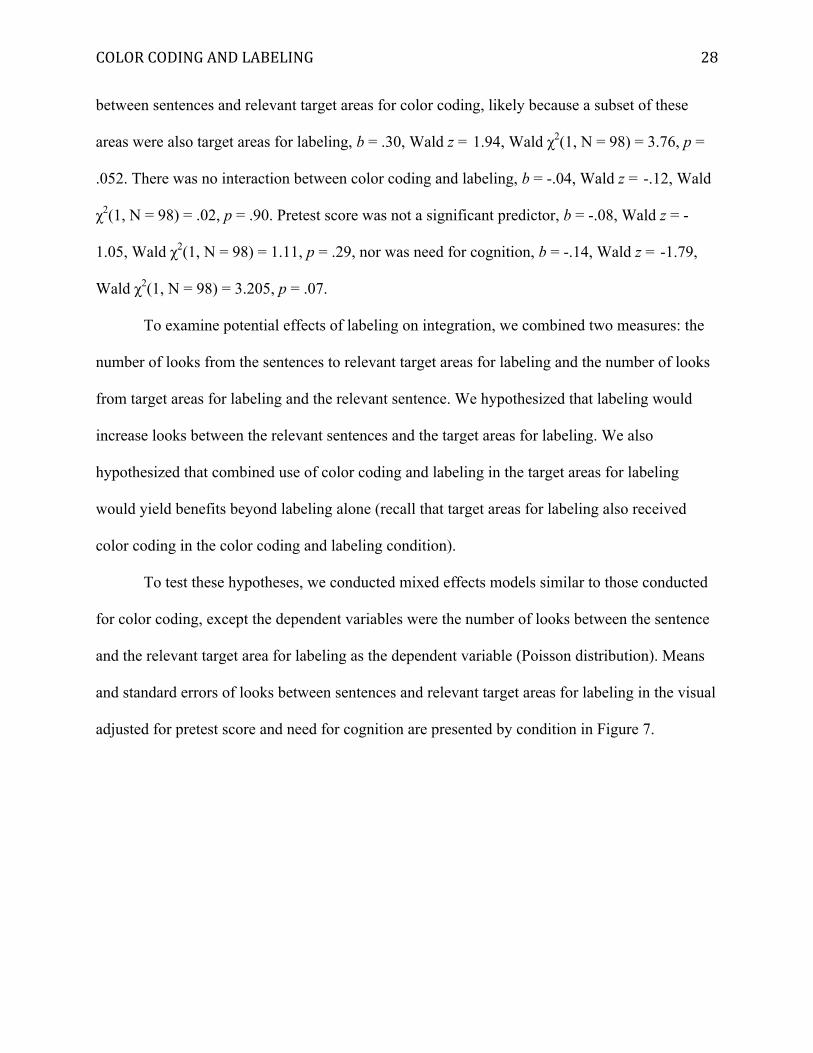
between sentences and relevant target areas for color coding, likely because a subset of these
areas were also target areas for labeling, b = .30, Wald z = 1.94, Wald χ2(1, N = 98) = 3.76, p =
.052. There was no interaction between color coding and labeling, b = -.04, Wald z = -.12, Wald
χ2(1, N = 98) = .02, p = .90. Pretest score was not a significant predictor, b = -.08, Wald z = -
1.05, Wald χ2(1, N = 98) = 1.11, p = .29, nor was need for cognition, b = -.14, Wald z = -1.79,
Wald χ2(1, N = 98) = 3.205, p = .07.
To examine potential effects of labeling on integration, we combined two measures: the
number of looks from the sentences to relevant target areas for labeling and the number of looks
from target areas for labeling and the relevant sentence. We hypothesized that labeling would
increase looks between the relevant sentences and the target areas for labeling. We also
hypothesized that combined use of color coding and labeling in the target areas for labeling
would yield benefits beyond labeling alone (recall that target areas for labeling also received
color coding in the color coding and labeling condition).
To test these hypotheses, we conducted mixed effects models similar to those conducted
for color coding, except the dependent variables were the number of looks between the sentence
and the relevant target area for labeling as the dependent variable (Poisson distribution). Means
and standard errors of looks between sentences and relevant target areas for labeling in the visual
adjusted for pretest score and need for cognition are presented by condition in Figure 7.
COLORCODINGANDLABELING
29
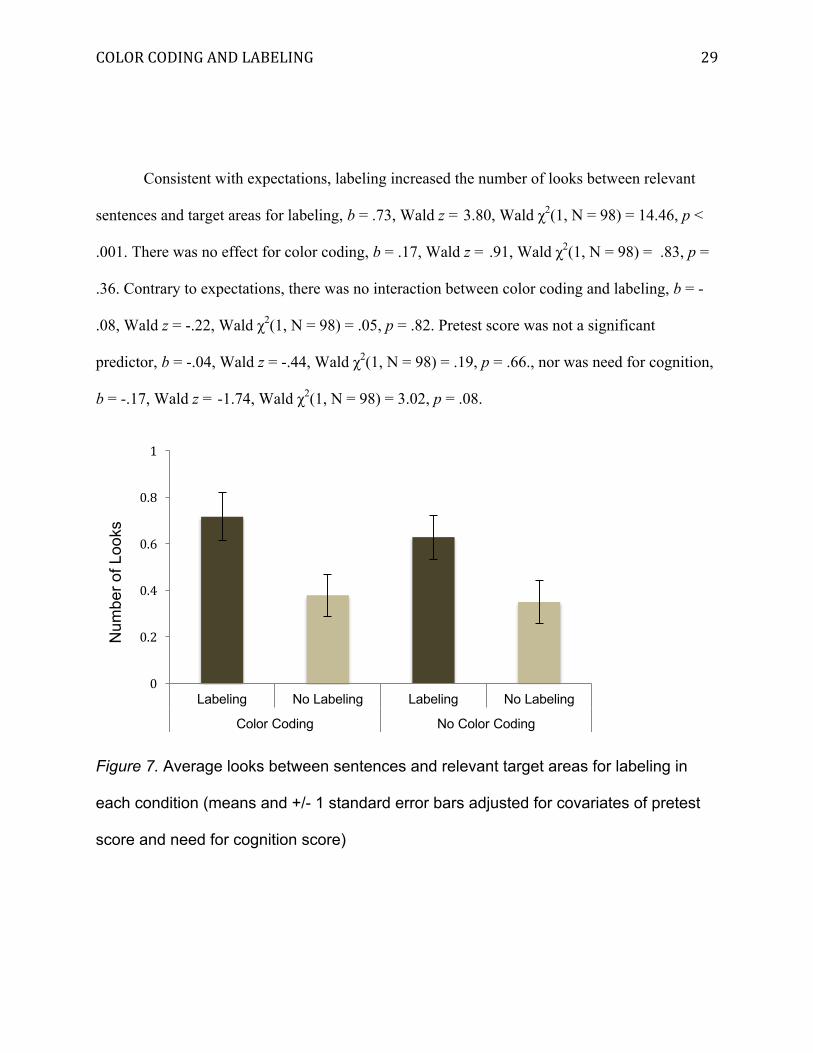
Consistent with expectations, labeling increased the number of looks between relevant
sentences and target areas for labeling, b = .73, Wald z = 3.80, Wald χ2(1, N = 98) = 14.46, p <
.001. There was no effect for color coding, b = .17, Wald z = .91, Wald χ2(1, N = 98) = .83, p =
.36. Contrary to expectations, there was no interaction between color coding and labeling, b = -
.08, Wald z = -.22, Wald χ2(1, N = 98) = .05, p = .82. Pretest score was not a significant
predictor, b = -.04, Wald z = -.44, Wald χ2(1, N = 98) = .19, p = .66., nor was need for cognition,
b = -.17, Wald z = -1.74, Wald χ2(1, N = 98) = 3.02, p = .08.
Figure 7. Average looks between sentences and relevant target areas for labeling in
each condition (means and +/- 1 standard error bars adjusted for covariates of pretest
score and need for cognition score)
Num
ber o
f Loo
ks
0
0.2
0.4
0.6
0.8
1
Labeling No Labeling Labeling No Labeling
Color Coding No Color Coding
COLORCODINGANDLABELING
30
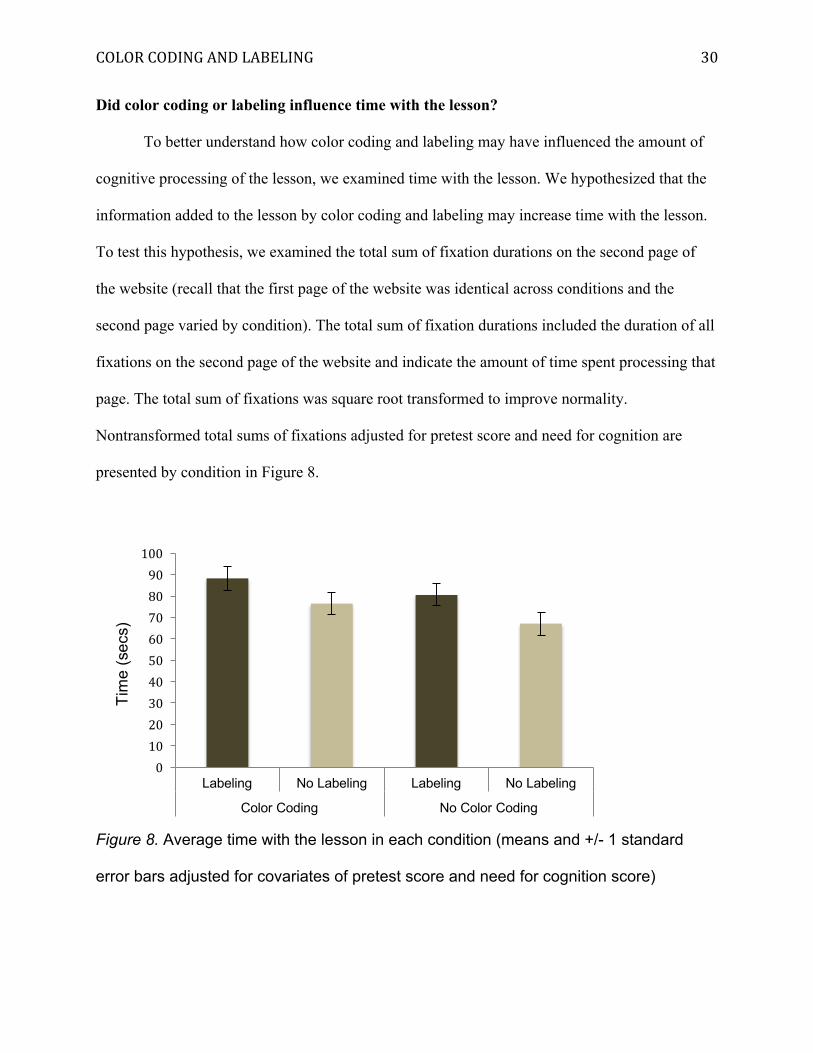
Did color coding or labeling influence time with the lesson?
To better understand how color coding and labeling may have influenced the amount of
cognitive processing of the lesson, we examined time with the lesson. We hypothesized that the
information added to the lesson by color coding and labeling may increase time with the lesson.
To test this hypothesis, we examined the total sum of fixation durations on the second page of
the website (recall that the first page of the website was identical across conditions and the
second page varied by condition). The total sum of fixation durations included the duration of all
fixations on the second page of the website and indicate the amount of time spent processing that
page. The total sum of fixations was square root transformed to improve normality.
Nontransformed total sums of fixations adjusted for pretest score and need for cognition are
presented by condition in Figure 8.
Figure 8. Average time with the lesson in each condition (means and +/- 1 standard
error bars adjusted for covariates of pretest score and need for cognition score)
0102030405060708090100
Labeling No Labeling Labeling No Labeling
Color Coding No Color Coding
Tim
e (s
ecs)
COLORCODINGANDLABELING
31
Because each participant only had one total sum of fixation durations measure, mixed
effects modeling was not possible. Instead, a general linear model was used with total sum of
fixations as the dependent variable, color coding and labeling as independent variables, and
pretest score and need for cognition as covariates. Consistent with hypotheses, labeling increased
the total sum of fixation durations, b = 26.31, χ2(1, N = 98) = 7.84, t = 2.8, p = .01. There was no
effect of color coding, b = 12.343, χ2(1, N = 98) = 1.72, t = 2.80, p = .19. There was no
interaction between labeling and color coding, b = -6.97, χ2(1, N = 98) = .14, t = -.38, p = .71.
Pretest score was not a significant predictor, b = -5.87, χ2(1, N = 98) = 1.54, t = -1.24, p = .22,
nor was need for cognition, b = -2.11, χ2(1, N = 98) = .19, t = -.44, p = .66.
What are the relationships between the processing of the lesson and performance on the
lesson?
It is possible that how the lesson was processed in terms of attention, integration, and
time with the lesson relates to performance. To examine this possibility, we conducted a series of
general linear models with the eyetracking variables in which an effect of labeling was noted as
the predictor variable (i.e., fixation duration on target areas for labeling, looks from the text to
relevant cells in the table, looks from the labeled cells to relevant sentences, and total sum of
fixation duration on the lesson, all z-scored) and posttest score as the dependent variable. To be
consistent with previous analyses, need for cognition and pretest were included as covariates.
Standardized beta coefficients are reported. There was no effect of fixation duration on target
areas for labeling and posttest scores, b = -.02, χ2(1, N = 98) = .27, t = -.52, p = .61. Pretest was
not a significant predictor of posttest scores, b = .47, χ2(1, N = 98) = .97, t = .99, p = .33, but
need for cognition was b = 1.52, χ2(1, N = 98) = 9.86, t = 3.14, p = .002; For looks between the
text to relevant cells in the table, there was no effect on posttest scores, b = -.05, χ2(1, N = 98) =
COLORCODINGANDLABELING
32
.04, t = -.2, p = .84. Pretest was not a significant predictor of posttest score, b = .47, χ2(1, N = 98)
= .1.01, t = 1.01, p = .32, but need for cognition was, b = 1.57, χ2(1, N = 98) = 11.00, t = 3.32, p
= .001. There was no effect of total fixation time on the lesson on posttest score, b = .17, χ2(1, N
= 98) = .14, t = .38, p = .71. Pretest was not a significant predictor of posttest score, b = .50, χ2(1,
N = 98) = 1.14, t = 1.07, p = .29, but need for cognition was, b = 1.60, χ2(1, N = 98) = .11.92, t =
3.45, p < .001. Therefore, it does not appear that the benefits of labeling on learning performance
are related to the influence of labeling on these measures of the learning process.
Discussion
This study examined the effects of color coding and labeling on learning from computer-
based written lessons on posterior probability. We asked whether color coding and labeling
would increase learning about posterior probability. Based on the multimedia principle and on
previous research findings, we expected that both color coding and labeling would promote
learning (Florax & Ploetzner, 2010; Mayer, 2009; Ozcelik et al., 2009, 2010). In addition, we
expected that a combination of color coding and labeling might be more beneficial for learning
than either color coding or labeling alone, as learners would benefit from two forms of guidance.
We found that labeling increased learning, but color coding did not. Further, there was no
increased benefit of labeling if there was color coding as well.
Performance
As expected, labeling benefited learning, which is consistent with findings in the previous
literature (Florax & Ploetzner, 2010; Johnson & Mayer, 2012; Mason et al., 2013b). Given that
the label consists of text, labeling can increase the spatial contiguity of relevant information in
visual and verbal representations, allowing learners to focus their cognitive resources on the
lesson content (Mayer, 2009). The finding that labeling can enhance learning about posterior
COLORCODINGANDLABELING
33
probabilities is valuable, as posterior probability is a challenging topic for many people (e.g.,
Gilovich, Griffin, & Kahneman, 2002).
Based on previous findings (Ozcelik et al., 2009; Kalyuga et al., 1999; Keller et al.,
2006), we had anticipated that color coding would have benefited learning. Our findings did not
reveal any significant benefits. We suggest four possible reasons for the pattern of findings
regarding learning. The first is that learners may need more guidance on how to connect the text
and table than was provided by the color coding, especially for a topic in which college students
typically have little background knowledge, such as posterior probability (Evans et al., 2000;
Morsanyi et al., 2013). Previous findings have indicated that color coding may not adequately
guide learners with low levels of background knowledge to make the connections necessary to
understand the concepts in a lesson (Patrick, Carter, & Wiebe, 2005). The second possibility is
that the processing of written lessons with visual representations may be driven primarily by text
(Hegarty & Just, 1993). If learners rely on text to understand the lesson, then it follows that
labeling, which is comprised of text, may be most effective in guiding the integration of ideas in
different representations. The use of text to guide integration and learning would explain why the
learners in this study benefited from labeling, but not from color coding.
Our third and fourth reasons for the null effects of color coding relate to the type of visual
used and how color coding were applied. Previous work on color coding has used visuals that are
dense, detailed depictions of scientific concepts, such as neurotransmitters or DNA strands
(Ozcelik et al., 2009; 2010; Patrick et al, 2005). Because dense visuals contain a great deal of
information to process, learners may find color coding helpful in identifying which information
is important and relevant to the text out of all the details in the visual (Clark & Lyons, 2010). In
contrast, the visual used in this study (a table) is fairly simple and sparse. Although the
COLORCODINGANDLABELING
34
information was complex, learners may have not found the color coding helpful with such a
basic visual. It may not have been difficult to determine which information in the table was
relevant to the text given that tables are not as detailed as other visuals (see Butcher & Aleven,
2013, for similar null findings on color coding with a simple visual). A fourth possibility is that
we may have implemented color coding in an ineffective way. We color coded full sentences and
sets of table cells; this may have posed a large working memory demand on participants
attempting to integrate all of the different sources of information. In addition, the broad use of
color coding may have inadvertently made it more difficult to determine what information was
most relevant to the text. A version in which single words and single cells are color coded might
be more effective (and may be more similar to the labeling that we used).
We had also expected that color coding and labeling might yield more benefit for
learning than either instructional design technique alone. This is because the use of two different
instructional design techniques would provide two forms of guidance on selecting important
information and integrating relevant information. If there was no additive benefit of color coding
and labeling, a comparison of which technique was more beneficial would be informative in
instructional design. We noted that only labeling benefited learning, and there was no evidence
of an enhanced benefit with the addition of color coding. Regardless of the reasons for the
observed lack of benefits from color coding, our findings indicate that labeling is more effective
than color coding in promoting learning from simple visuals.
Learning process
One of the proposed benefits for instructional design techniques such as color coding and
labeling is that they assist learners in selecting important information (Mayer, 2009). If color
coding and labeling helped learners select important information, one would expect an increase
COLORCODINGANDLABELING
35
in visual attention as indicated by total fixation duration (i.e., the amount of time spent gazing on
an area; Ozcelik et al., 2010). We found that labeling increased visual attention towards the
target areas of the visual for labeling; however color coding did not have the same effect. We
propose two possible explanations for the effect of labeling, but lack of effect for color coding.
One is that labeling also added information to the target areas of the visual. Given that the visual
was relatively simple and clear coupled with the finding that color coding did not affect
attention, it is possible that labeling increased attention to the target areas because of the addition
of information rather than improved selection of information. The second explanation is that
color coding was applied more broadly than labeling. It is possible that the broad application of
color coding to multiple cells in the table diffused the effect for selection.
We were also interested in the effects of color coding and labeling on guiding the
integration of corresponding information in different representations, as indicated by looks
between the text and corresponding information in the table (Mason et al., 2013c). Based on
previous findings, we expected that both color coding and labeling would increase looks between
sentences and corresponding information in the table (Mason et al., 2013b; Ozcelik et al., 2010).
Indeed, our findings indicated that both color coding and labeling increased looks between the
text and corresponding information in the table. These looks between relevant information in
different representations may have enhanced integration of corresponding ideas in different
representations in the lesson.
We also examined whether the instructional design techniques influenced how much time
learners spent with the lesson. We anticipated that the instructional design techniques would
increase time spent with the lesson given that they add information and simple interactivity.
Similar to other findings in this study, we found that labeling increased time with the lesson, but
COLORCODINGANDLABELING
36
color coding did not. In this way, it appeared that labeling increased the amount of engagement
with the lesson, as indicated by the time spent on the lesson, but color coding did not. However,
time with the lesson was not related to learning from the lesson, as discussed next.
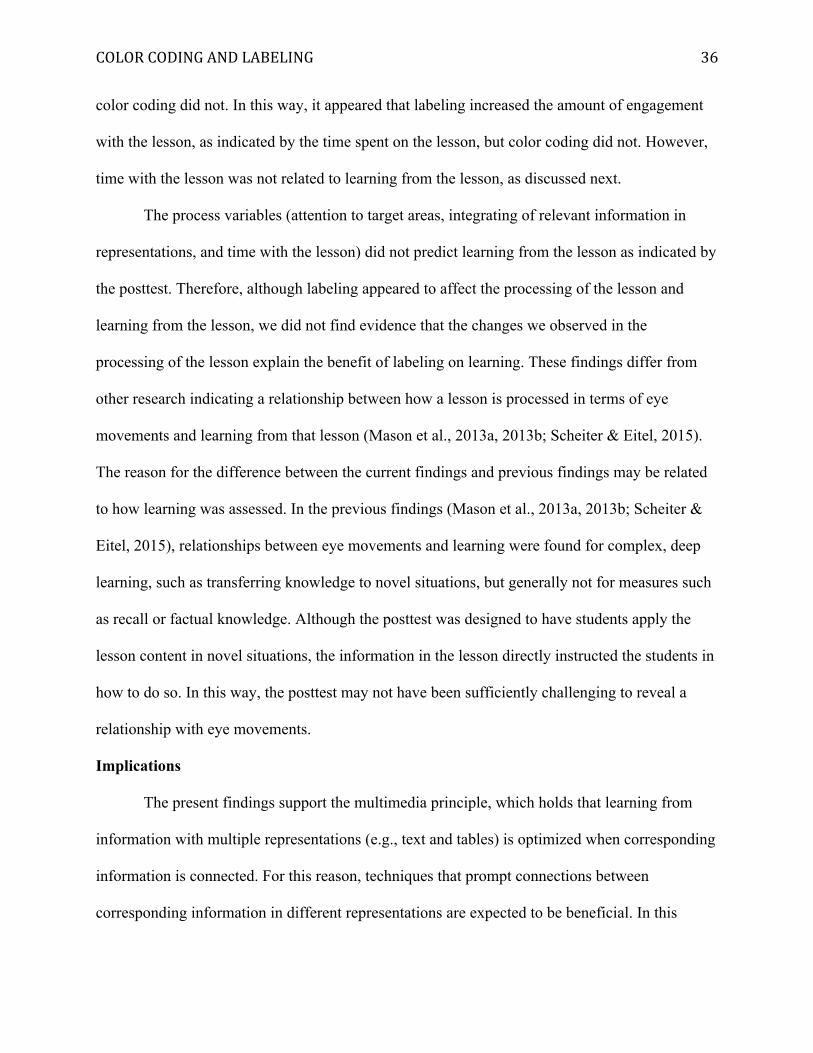
The process variables (attention to target areas, integrating of relevant information in
representations, and time with the lesson) did not predict learning from the lesson as indicated by
the posttest. Therefore, although labeling appeared to affect the processing of the lesson and
learning from the lesson, we did not find evidence that the changes we observed in the
processing of the lesson explain the benefit of labeling on learning. These findings differ from
other research indicating a relationship between how a lesson is processed in terms of eye
movements and learning from that lesson (Mason et al., 2013a, 2013b; Scheiter & Eitel, 2015).
The reason for the difference between the current findings and previous findings may be related
to how learning was assessed. In the previous findings (Mason et al., 2013a, 2013b; Scheiter &
Eitel, 2015), relationships between eye movements and learning were found for complex, deep
learning, such as transferring knowledge to novel situations, but generally not for measures such
as recall or factual knowledge. Although the posttest was designed to have students apply the
lesson content in novel situations, the information in the lesson directly instructed the students in
how to do so. In this way, the posttest may not have been sufficiently challenging to reveal a
relationship with eye movements.
Implications
The present findings support the multimedia principle, which holds that learning from
information with multiple representations (e.g., text and tables) is optimized when corresponding
information is connected. For this reason, techniques that prompt connections between
corresponding information in different representations are expected to be beneficial. In this
COLORCODINGANDLABELING
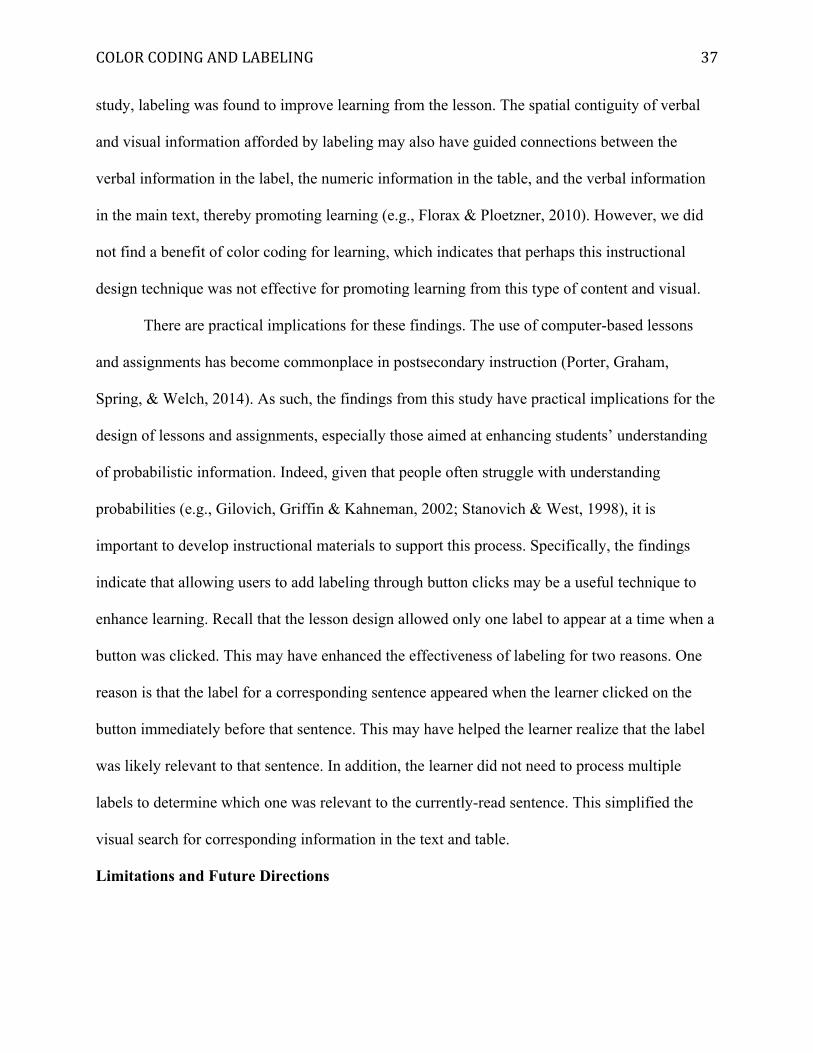
37
study, labeling was found to improve learning from the lesson. The spatial contiguity of verbal
and visual information afforded by labeling may also have guided connections between the
verbal information in the label, the numeric information in the table, and the verbal information
in the main text, thereby promoting learning (e.g., Florax & Ploetzner, 2010). However, we did
not find a benefit of color coding for learning, which indicates that perhaps this instructional
design technique was not effective for promoting learning from this type of content and visual.
There are practical implications for these findings. The use of computer-based lessons
and assignments has become commonplace in postsecondary instruction (Porter, Graham,
Spring, & Welch, 2014). As such, the findings from this study have practical implications for the
design of lessons and assignments, especially those aimed at enhancing students’ understanding
of probabilistic information. Indeed, given that people often struggle with understanding
probabilities (e.g., Gilovich, Griffin & Kahneman, 2002; Stanovich & West, 1998), it is
important to develop instructional materials to support this process. Specifically, the findings
indicate that allowing users to add labeling through button clicks may be a useful technique to
enhance learning. Recall that the lesson design allowed only one label to appear at a time when a
button was clicked. This may have enhanced the effectiveness of labeling for two reasons. One
reason is that the label for a corresponding sentence appeared when the learner clicked on the
button immediately before that sentence. This may have helped the learner realize that the label
was likely relevant to that sentence. In addition, the learner did not need to process multiple
labels to determine which one was relevant to the currently-read sentence. This simplified the
visual search for corresponding information in the text and table.
Limitations and Future Directions
COLORCODINGANDLABELING
38
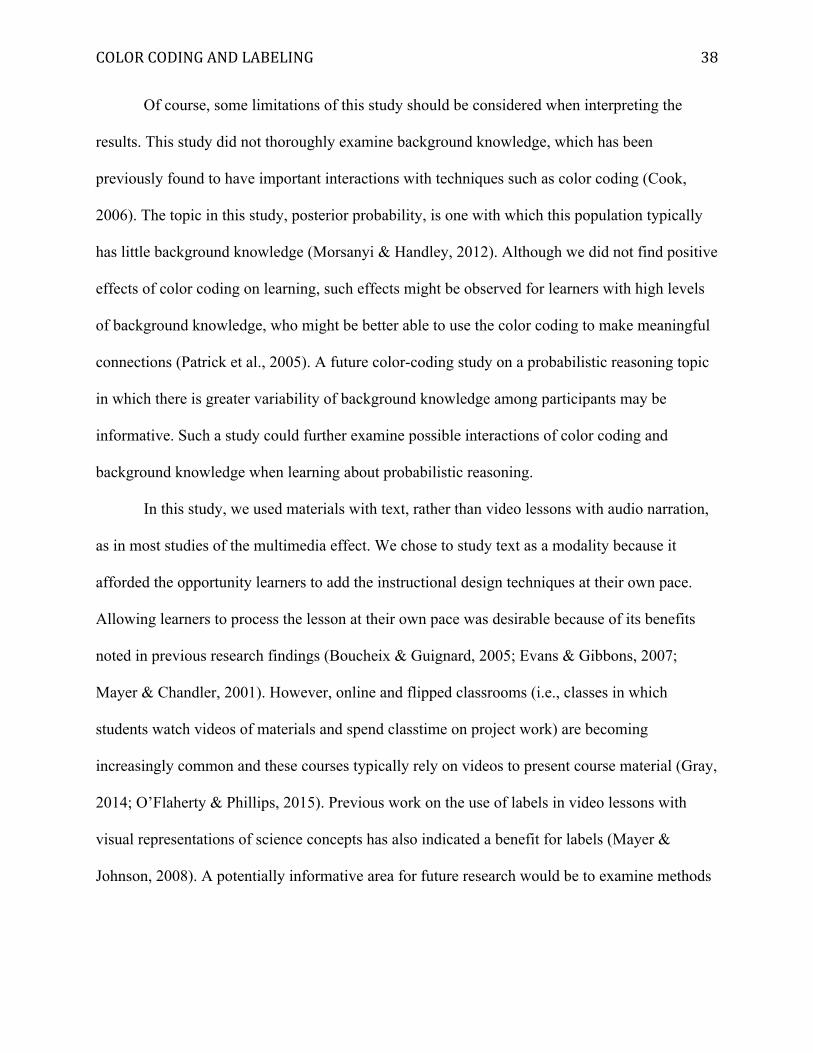
Of course, some limitations of this study should be considered when interpreting the
results. This study did not thoroughly examine background knowledge, which has been
previously found to have important interactions with techniques such as color coding (Cook,
2006). The topic in this study, posterior probability, is one with which this population typically
has little background knowledge (Morsanyi & Handley, 2012). Although we did not find positive
effects of color coding on learning, such effects might be observed for learners with high levels
of background knowledge, who might be better able to use the color coding to make meaningful
connections (Patrick et al., 2005). A future color-coding study on a probabilistic reasoning topic
in which there is greater variability of background knowledge among participants may be
informative. Such a study could further examine possible interactions of color coding and
background knowledge when learning about probabilistic reasoning.
In this study, we used materials with text, rather than video lessons with audio narration,
as in most studies of the multimedia effect. We chose to study text as a modality because it
afforded the opportunity learners to add the instructional design techniques at their own pace.
Allowing learners to process the lesson at their own pace was desirable because of its benefits
noted in previous research findings (Boucheix & Guignard, 2005; Evans & Gibbons, 2007;
Mayer & Chandler, 2001). However, online and flipped classrooms (i.e., classes in which
students watch videos of materials and spend classtime on project work) are becoming
increasingly common and these courses typically rely on videos to present course material (Gray,
2014; O’Flaherty & Phillips, 2015). Previous work on the use of labels in video lessons with
visual representations of science concepts has also indicated a benefit for labels (Mayer &
Johnson, 2008). A potentially informative area for future research would be to examine methods
COLORCODINGANDLABELING
39
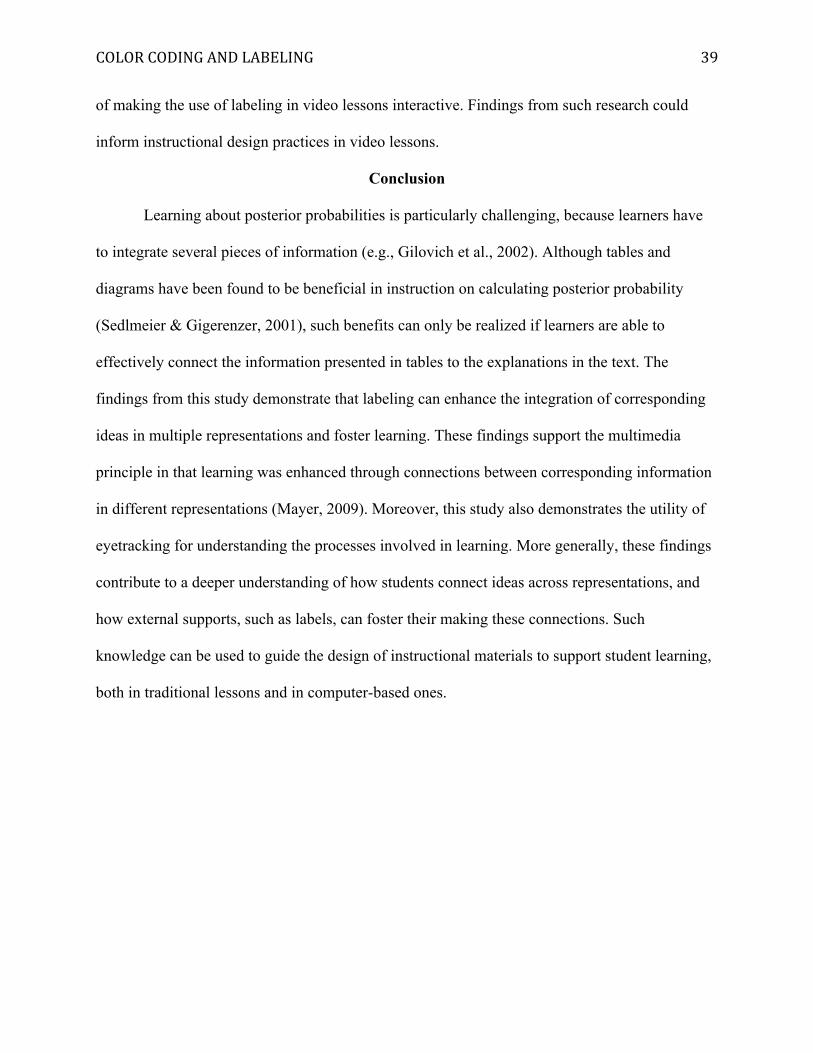
of making the use of labeling in video lessons interactive. Findings from such research could
inform instructional design practices in video lessons.
Conclusion
Learning about posterior probabilities is particularly challenging, because learners have
to integrate several pieces of information (e.g., Gilovich et al., 2002). Although tables and
diagrams have been found to be beneficial in instruction on calculating posterior probability
(Sedlmeier & Gigerenzer, 2001), such benefits can only be realized if learners are able to
effectively connect the information presented in tables to the explanations in the text. The
findings from this study demonstrate that labeling can enhance the integration of corresponding
ideas in multiple representations and foster learning. These findings support the multimedia
principle in that learning was enhanced through connections between corresponding information
in different representations (Mayer, 2009). Moreover, this study also demonstrates the utility of
eyetracking for understanding the processes involved in learning. More generally, these findings
contribute to a deeper understanding of how students connect ideas across representations, and
how external supports, such as labels, can foster their making these connections. Such
knowledge can be used to guide the design of instructional materials to support student learning,
both in traditional lessons and in computer-based ones.
COLORCODINGANDLABELING
40
References
Alibali, M. W., Nathan, M. J., Wolfgram, M. S., Church, R. B., Johnson, C. V., Jacobs, S. A., &
Knuth, E. J. (2014). How teachers link ideas in mathematics instruction using speech and
gesture: A corpus analysis. Cognition and Instruction, 32(1), 65-100. doi:
10.1080/07370008.2013.858161
Bates, D. M. (2010). lme4: Mixed-effects modeling with R. URL http://lme4. r-forge. r-project.
org/book.
Bates, D., Maechler, M., & Bolker, B. (2012). lme4: Linear mixed-effects models using S4
classes.
Berthold, K., Eysink, T. H., & Renkl, A. (2009). Assisting self-explanation prompts are more
effective than open prompts when learning with multiple representations. Instructional
Science, 37(4), 345-363. doi: 10.1007/s11251-008-9051-z
Boucheix, J. M., & Guignard, H. (2005). What animated illustrations conditions can improve
technical document comprehension in young students? Format, signaling and control of
the presentation. European Journal of Psychology of Education, 20(4), 369-388. doi:
10.1007/BF03173563
Boucheix, J. M., & Lowe, R. K. (2010). An eye tracking comparison of external pointing cues
and internal continuous cues in learning with complex animations. Learning and
instruction, 20(2), 123-135. doi: 10.1016/j.learninstruc.2009.02.015
Butcher, K. R., & Aleven, V. (2013). Using student interactions to foster rule–diagram mapping
during problem solving in an intelligent tutoring system. Journal of Educational
Psychology, 105(4), 988. doi: 10.1037/a0031756
COLORCODINGANDLABELING
41
Cacioppo, J. T., & Petty, R. E. (1982). The need for cognition. Journal of Personality and Social
Psychology, 42(1), 116-131. doi:10.1037/0022-3514.42.1.116
Cacioppo, J. T., Petty, R. E., Feinstein, J. A., & Jarvis, W. B. G. (1996). Dispositional
differences in cognitive motivation: The life and times of individuals varying in need for
cognition. Psychological Bulletin, 119(2), 197. doi: 10.1037/0033-2909.119.2.197
Cacioppo, J. T., Petty, R. E., & Feng Kao, C. (1984). The efficient assessment of need for
cognition. Journal of Personality Assessment, 48(3), 306-307. doi:
10.1207/s15327752jpa4803_13
Catrambone, R. (1994). The effects of labels in example on problem solving transfer. In
Proceedings of the sixteenth annual conference of the Cognitive Science Society (pp. 159-
164).
Catrambone, R. (1996). Generalizing solution procedures learned from examples. Journal of
Experimental Psychology: Learning, Memory, and Cognition, 22(4), 1020. doi:
10.1037/0278-7393.22.4.1020
Chandler, P., & Sweller, J. (1991). Cognitive load theory and the format of
instruction. Cognition and instruction, 8(4), 293-332. doi: 10.1207/s1532690xci0804_2
Chandler, P., & Sweller, J. (1992). The split-attention effect as a factor in the design of
instruction. British Journal of Educational Psychology, 62(2), 233-246. doi:
10.1111/j.2044-8279.1992.tb01017.x
Clark, R. C., & Lyons, C. (2010). Graphics for learning: Proven guidelines for planning,
designing, and evaluating visuals in training materials (2nd ed.). Washington D.C.:
Pfeiffer & Co.
COLORCODINGANDLABELING
42
Cook, M. P. (2006). Visual representations in science education: The influence of prior
knowledge and cognitive load theory on instructional design principles. Science
Education, 90(6), 1073-1091. doi: 10.1002/sce.20164
de Koning, B. B., Tabbers, H. K., Rikers, R. M., & Paas, F. (2009). Towards a framework for
attention cueing in instructional animations: Guidelines for research and
design. Educational Psychology Review, 21(2), 113-140. doi: 10.1007/s10648-009-9098-
7
de Koning, B. B., Tabbers, H. K., Rikers, R. M., & Paas, F. (2010). Attention guidance in
learning from a complex animation: Seeing is understanding?.Learning and
Instruction, 20(2), 111-122. doi: 10.1016/j.learninstruc.2009.02.010
Evans, C., & Gibbons, N. J. (2007). The interactivity effect in multimedia
learning. Computers & Education, 49(4), 1147-1160. doi:
doi:10.1016/j.compedu.2006.01.008
Evans, J. S. B., Handley, S. J., Perham, N., Over, D. E., & Thompson, V. A. (2000). Frequency
versus probability formats in statistical word problems.Cognition, 77(3), 197-213. doi:
10.1016/S0010-0277(00)00098-6
Fisher, A. V., Godwin, K. E., & Seltman, H. (2014). Visual environment, attention allocation,
and learning in young children when too much of a good thing may be bad.
Psychological Science, 25(7), 1362-1370. doi: 10.1177/0956797614533801
Florax, M., & Ploetzner, R. (2010). What contributes to the split-attention effect? The role of text
segmentation, picture labelling, and spatial proximity. Learning and Instruction, 20(3),
216-224. doi: 10.1016/j.learninstruc.2009.02.021
COLORCODINGANDLABELING
43
Garfield, J. B., & Ben-Zvi, D. (2008). Developing students’ statistical reasoning: Connecting
Research and Teaching Practice. The Netherlands: Springer.
Gigerenzer, G., Gaissmaier, W., Kurz-Milcke, E., Schwartz, L. M., & Woloshin, S. (2007).
Helping doctors and patients make sense of health statistics. Psychological Science in the
Public Interest, 8(2), 53-96. doi: 10.1111/j.1539-6053.2008.00033.x
Gilovich, T., Griffin D., & Kahneman, D. (Eds.). (2002). Heuristics and biases: The psychology
of intuitive judgment. Cambridge, UK: Cambridge University Press.
Gray, D. (2014). Barriers to online postsecondary education crumble: Enrollment in traditional
face-to-face courses declines as enrollment in online courses increases. Contemporary
Issues in Education Research (CIER), 6(3), 345-348. Retrieved from
http://www.cluteinstitute.com/ojs/index.php/CIER/article/view/8537
Haugtvedt, C. P., Petty, R. E., & Cacioppo, J. T. (1992). Need for cognition and advertising:
Understanding the role of personality variables in consumer behavior. Journal of
Consumer Psychology, 1(3), 239-260. doi: 10.1016/S1057-7408(08)80038-1
Hegarty, M., & Just, M. A. (1993). Constructing mental models of machines from text and
diagrams. Journal of memory and language, 32(6), 717-742. doi:
10.1006/jmla.1993.1036
Heijltjes, A., Van Gog, T., Leppink, J., & Paas, F. (2014). Improving critical thinking: Effects of
dispositions and instructions on economics students' reasoning skills. Learning and
Instruction, 29, 31-42. doi: 10.1016/j.learninstruc.2013.07.003
Hoffrage, U., Kurzenhauser, S., & Gigerenzer, G. (2005). Understanding the results of medical
tests: Why the representation of statistical information matters. In R. Bibace, J. D. Laird,
K. L. Noller, & J. Valsiner (Eds.), Science and medicine in dialogue: thinking through
COLORCODINGANDLABELING
44
particulars and universals (pp. 83-98). Westport: Praeger Publishers/Greenwood
Publishing Group.
Holsanova, J., Holmberg, N., & Holmqvist, K. (2009). Reading information graphics: The role of
spatial contiguity and dual attentional guidance. Applied Cognitive Psychology, 23(9),
1215-1226. doi: 10.1002/acp.1525
Jamet, E., Gavota, M., & Quaireau, C. (2008). Attention guiding in multimedia learning.
Learning and instruction, 18(2), 135-145. doi: 10.1016/j.learninstruc.2007.01.011
Jarvis, W. B. G., & Petty, R. E. (1996). The need to evaluate. Journal of Personality and Social
Psychology, 70(1), 172. doi: 10.1037/0022-3514.70.1.172
Johnson, C. I., & Mayer, R. E. (2012). An eye movement analysis of the spatial contiguity effect
in multimedia learning. Journal of Experimental Psychology: Applied, 18(2), 178. doi:
10.1037/a0026923
Just, M. A., & Carpenter, P. A. (1980). A theory of reading: from eye fixations to
comprehension. Psychological Review, 87(4), 329. doi: 10.1037/0033-295X.87.4.329
Kahneman, D., & Tversky, A. (1973). On the psychology of prediction.Psychological
review, 80(4), 237. doi: 10.1037/h0034747
Kalyuga, S., Chandler, P., & Sweller, J. (1999). Managing split-attention and redundancy in
multimedia instruction. Applied Cognitive Psychology, 13(4), 351-371.
Keller, T., Gerjets, P., Scheiter, K., & Garsoffky, B. (2006). Information visualizations for
knowledge acquisition: The impact of dimensionality and color coding. Computers in
Human Behavior, 22(1), 43-65. doi: 10.1016/j.chb.2005.01.006
COLORCODINGANDLABELING
45
Klaczynski, P. A. (2014). Heuristics and biases: interactions among numeracy, ability, and
reflectiveness predict normative responding. Frontiers in Psychology, 5, 665. doi:
10.3389/fpsyg.2014.00665
Kokis, J. V., Macpherson, R., Toplak, M. E., West, R. F., & Stanovich, K. E. (2002). Heuristic
and analytic processing: Age trends and associations with cognitive ability and cognitive
styles. Journal of Experimental Child Psychology, 83(1), 26-52. doi: 0.1016/S0022-
0965(02)00121-2
Kühl, T., Eitel, A., Damnik, G., & Körndle, H. (2014). The impact of disfluency, pacing, and
students’ need for cognition on learning with multimedia. Computers in Human
Behavior, 35, 189-198. doi: 10.1016/j.chb.2014.03.004
Kurzenhäuser, S., & Hertwig, R. (2006). How to foster citizens’ statistical reasoning:
implications for genetic counseling. Public Health Genomics, 9(3), 197-203.
Kurzenhäuser, S., & Hoffrage, U. (2002). Teaching Bayesian reasoning: An evaluation of a
classroom tutorial for medical students. Medical Teacher, 24(5), 516-521. doi:
10.1080/0142159021000012540
Low, R., & Sweller, J. (2005). The modality principle in multimedia learning. In R. Mayer
(Ed.), Cambridge handbook of multimedia learning (pp. 147–158). New York:
Cambridge University Press.
Mason, L., Pluchino, P., Tornatora, M. C., & Ariasi, N. (2013a). An eye-tracking study of
learning from science text with concrete and abstract illustrations. The Journal of
Experimental Education, 81(3), 356-384. doi: 10.1080/00220973.2012.727885
COLORCODINGANDLABELING
46
Mason, L., Pluchino, P., & Tornatora, M. C. (2013b). Effects of picture labeling on science text
processing and learning: Evidence from eye movements. Reading Research
Quarterly, 48(2), 199-214.
Mason, L., Tornatora, M. C., & Pluchino, P. (2013c). Do fourth graders integrate text and picture
in processing and learning from an illustrated science text? Evidence from eye-movement
patterns. Computers & Education, 60(1), 95-109. doi: 10.1016/j.compedu.2012.07.011
Mayer, R. E. (1996). Learning strategies for making sense out of expository text: The SOI model
for guiding three cognitive processes in knowledge construction. Educational Psychology
Review, 8(4), 357-371. doi: 10.1007/BF01463939
Mayer, R. E. (1998). Cognitive, metacognitive, and motivational aspects of problem
solving. Instructional science, 26(1-2), 49-63. doi: 10.1023/A:1003088013286
Mayer, R. E. (1999). Designing instruction for constructivist learning. In C.M. Reigeluth (Eds.)
Instructional-design theories and models: A new paradigm of instructional theory, (Vol.
2, pp. 141-159). Mahwah, NJ: Lawrence Erlbaum Associates.
Mayer, R. E. (2002). Multimedia learning. Psychology of Learning and Motivation, 41, 85-139.
doi: 10.1016/S0079-7421(02)80005-6
Mayer, R. E. (2003). The promise of multimedia learning: using the same instructional design
methods across different media. Learning and Instruction,13(2), 125-139. doi:
10.1016/S0959-4752(02)00016-6
Mayer, R. E. (2005). Cognitive theory of multimedia learning. The Cambridge handbook of
Multimedia Learning, 31-48.
Mayer, R.E. (2009). Multimedia learning, Second Edition. New York, NY: Cambridge
University Press.
COLORCODINGANDLABELING
47
Mayer, R. E. (2014). Cognitive theory of multimedia learning. In R. E. Mayer (Ed.), The
Cambridge handbook of multimedia learning (2nd ed., pp. 43–71). New York:
Cambridge University Press.
Mayer, R. E., & Chandler, P. (2001). When learning is just a click away: Does simple user
interaction foster deeper understanding of multimedia messages? Journal of Educational
psychology, 93(2), 390. doi: 10.1037/0022-0663.93.2.390
Mayer, R. E., & Johnson, C. I. (2008). Revising the redundancy principle in multimedia
learning. Journal of Educational Psychology, 100(2), 380. doi: 10.1037/0022-
0663.100.2.380
Moreno, R., & Mayer, R. E. (1999). Cognitive principles of multimedia learning: The role of
modality and contiguity. Journal of Educational Psychology, 91(2), 358. doi:
10.1037/0022-0663.91.2.358
Morsanyi, K., & Handley, S. (2012). Does thinking make you biased? The case of the engineers
and lawyer problem. In N. Miyake, D. Peebles, R.P. Cooper (Eds.) Proceedings of the
34th Annual Conference of the Cognitive Science Society (pp. 2049–2054) Austin, TX:
Cognitive Science Society.
Morsanyi, K., Handley, S.J. & Serpell, S. (2013). Making heads or tails of probability. An
experiment with random generators. British Journal of Educational Psychology, 83, 379-
395. doi: 10.1111/j.2044-8279.2012.02067.x
Morsanyi, K., Primi, C., Chiesi, F., & Handley, S. (2009). The effects and side-effects of
statistics education: Psychology students’(mis-) conceptions of
probability. Contemporary Educational Psychology, 34(3), 210-220. doi:
10.1016/j.cedpsych.2009.05.001
COLORCODINGANDLABELING
48
Mousavi, S. Y., Low, R., & Sweller, J. (1995). Reducing cognitive load by mixing auditory and
visual presentation modes. Journal of Educational Psychology,87(2), 319. doi:
10.1037/0022-0663.87.2.319
Najjar, L. J. (1998). Principles of educational multimedia user interface design. Human Factors:
The Journal of the Human Factors and Ergonomics Society,40(2), 311-323. doi:
10.1518/001872098779480505
Nathan, M. J., & Alibali, M. W. (2011). How gesture use enables intersubjectivity in the
classroom. In G. Stam & M. Ishino (Eds.), Integrating gestures: The interdisciplinary
nature of gesture (pp. 257–266). Amsterdam: John Benjamins.
O'Byrne, P. J., Patry, A., & Carnegie, J. A. (2008). The development of interactive online
learning tools for the study of anatomy. Medical Teacher, 30(8), 260-271. doi:
10.1080/01421590802232818
O'Flaherty, J., & Phillips, C. (2015). The use of flipped classrooms in higher education: A
scoping review. The Internet and Higher Education, 25, 85-95. doi:
10.1016/j.iheduc.2015.02.002
Ozcelik, E., Arslan-Ari, I., & Cagiltay, K. (2010). Why does signaling enhance multimedia
learning? Evidence from eye movements. Computers in Human Behavior, 26(1), 110-
117. doi: 10.1016/j.chb.2009.09.001
Ozcelik, E., Karakus, T., Kursun, E., & Cagiltay, K. (2009). An eye-tracking study of
how color coding affects multimedia learning. Computers & Education, 53(2), 445-453.
doi:10.1016/j.compedu.2009.03.002
COLORCODINGANDLABELING
49
Patrick, M. D., Carter, G., & Wiebe, E. N. (2005). Visual representations of DNA replication:
Middle grades students’ perceptions and interpretations. Journal of Science Education
and Technology, 14(3), 353-365. doi: 10.1007/s10956-005-7200-6
Porter, W. W., Graham, C. R., Spring, K. A., & Welch, K. R. (2014). Blended learning in higher
education: Institutional adoption and implementation. Computers & Education, 75, 185-
195.
Rayner, K. (1977). Visual attention in reading: Eye movements reflect cognitive
processes. Memory & Cognition, 5(4), 443-448. doi: 10.3758/BF03197383
Rayner, K. (1998). Eye movements in reading and information processing: 20 years of
research. Psychological Bulletin, 124(3), 372. doi: 10.1037/0033-2909.124.3.372
Rayner, K. (2009). Eye movements and attention in reading, scene perception, and visual search.
Quarterly Journal of Experimental Psychology, 62(8), 1457–1506.
doi:10.1080/17470210902816461
Rosenholtz, R., Y. Li, J. Mansfield, Z. Jin. 2005. Feature congestion: A measure of display
clutter. Proc. SIGCHI Conf. Human Factors Comput. Systems. ACM Press, New York,
761–767.
Sadowski, C.J., & Gulgoz, S. (1992). Internal consistency and test-retest reliability of the Need
for Cognition scale. Perceptual and Motor Skills, 74, 610. doi:
10.2466/pms.1992.74.2.610
Schnotz, W. (2002). Commentary: Towards an integrated view of learning from text and visual
displays. Educational Psychology Review, 14(1), 101-120. doi:
10.1023/A:1013136727916
COLORCODINGANDLABELING
50
Schnotz, W. & Lowe, R.K. (2008). A unified view of learning from animated and static graphics.
In R.K. Lowe & W. Schnotz (Eds.), Learning with animation: Research implications for
design (pp. 304-356). New York: Cambridge University Press.
Scheiter, K., & Eitel, A. (2015). Signals foster multimedia learning by supporting integration of
highlighted text and diagram elements. Learning and Instruction,36, 11-26. doi:
10.1016/j.learninstruc.2014.11.002
Sedlmeier, P., & Gigerenzer, G. (2001). Teaching Bayesian reasoning in less than two
hours. Journal of Experimental Psychology: General, 130(3), 380. doi: 10.1037/0096-
3445.130.3.380
Seufert, T. (2003). Supporting coherence formation in learning from multiple
representations. Learning and Instruction, 13(2), 227-237. doi: 10.1016/S0959-
4752(02)00022-1Smith, S. M., & Levin, I. P. (1996). Need for cognition and choice
framing effects. Journal of Behavioral Decision Making, 9(4), 283-290. doi:
10.1002/(SICI)1099-0771
Snijders, T. & Bosker, R. (2012), Multilevel Analysis: An Introduction to Basic and Applied
Multilevel Analysis, 2nd edition. London: Sage.
Stanovich, K. E., & West, R. F. (1998). Who uses base rates and P (D/∼ H)? An analysis of
individual differences. Memory & Cognition, 26(1), 161-179. doi: 10.3758/BF03211379
Steckelberg, A., Balgenorth, A., Berger, J., & Mühlhauser, I. (2004). Explaining computation of
predictive values: 2× 2 table versus frequency tree. A randomized controlled trial
[ISRCTN74278823]. BMC medical education, 4(1), 13. doi: 10.1186/1472-6920-4-13
COLORCODINGANDLABELING
51
Tabbers,H.,Martens,R.,&vanMerrienboer,J.J.G.(2004).Multimediainstructionsand
cognitiveloadtheory:Effectsofmodalityandcueing.BritishJournalofEducational
Psychology,74,71-81.
Tufte, E. (2001). The visual display of quantitative information. Cheshire, CT: Graphics.
West, R. F., Toplak, M. E., & Stanovich, K. E. (2008). Heuristics and biases as measures of
critical thinking: Associations with cognitive ability and thinking dispositions. Journal of
Educational Psychology, 100(4), 930. doi: 10.1037/a0012842

COLORCODINGANDLABELING
52
Appendix
Problem from pretest
Answer the questions as best you can. If you don’t know an answer, please don’t guess! Just leave it blank and move onto the next question. Give proportion answers as a fraction. Problem 1: Imagine you are an obstetrician. One of your pregnant patients gets the serum test to screen her fetus for Down syndrome. The test is a very good one, but not perfect. Based on your clinic records from 10,000 previous patients, answer the questions below. Serum test indicates
Down syndrome Serum test does not indicate Down syndrome
Sum
With Down syndrome
90 10 100
Without Down syndrome
99 9,801 9,900
Sum 189 9, 811
10,000
What is the prevalence of Down syndrome? What is the number of true positives for Down syndrome? What is the number of false positives for Down syndrome? What is the proportion of fetuses with serum tests indicating Down syndrome who actually have Down syndrome?
Related Documents