
Welcome message from author
This document is posted to help you gain knowledge. Please leave a comment to let me know what you think about it! Share it to your friends and learn new things together.
Transcript


Color Atlas ofBiochemistrySecond edition, revised and enlarged
Jan KoolmanProfessorPhilipps University MarburgInstitute of Physiologic ChemistryMarburg, Germany
Klaus-Heinrich RoehmProfessorPhilipps University MarburgInstitute of Physiologic ChemistryMarburg, Germany
215 color plates by Juergen Wirth
ThiemeStuttgart · New York
All rights reserved. Usage subject to terms and conditions of license.Koolman, Color Atlas of Biochemistry, 2nd edition © 2005 Thieme

IV
Library of Congress Cataloging-in-Publication Data
This book is an authorized and updated trans-lation of the 3rd German edition publishedand copyrighted 2003 by Georg Thieme Ver-lag, Stuttgart, Germany. Title of the Germanedition: Taschenatlas der Biochemie
Illustrator: Juergen Wirth, Professor of VisualCommunication, University of Applied Scien-ces, Darmstadt, Germany
Translator: Michael Robertson, BA DPhil,Augsburg, Germany
1st Dutch edition 20041st English edition 19961st French edition 19942nd French edition 19993rd French edition 20041st German edition 19942nd German edition 19971st Greek edition 19991st Indonesian edition 20021st Italian edition 19971st Japanese edition 19961st Portuguese edition 20041st Russian edition 20001st Spanish edition 2004
© 2005 Georg Thieme VerlagRüdigerstrasse 14, 70469 Stuttgart,Germanyhttp://www.thieme.deThieme New York, 333 Seventh Avenue,New York, NY 10001 USAhttp://www.thieme.com
Cover design: Cyclus, StuttgartCover drawing: CAP cAMP bound to DNATypesetting by primustype Hurler GmbH,NotzingenPrinted in Germany by Appl, Wemding
ISBN 3-13-100372-3 (GTV)ISBN 1-58890-247-1 (TNY)
Important note: Medicine is an ever-changingscience undergoing continual development.Research and clinical experience are continu-ally expanding our knowledge, in particularour knowledge of proper treatment and drugtherapy. Insofar as this book mentions anydosage or application, readers may rest as-sured that the authors, editors, and publishershave made every effort to ensure that suchreferences are in accordance with the state ofknowledge at the time of production of thebook. Nevertheless, this does not involve, im-ply, or express any guarantee or responsibilityon the part of the publishers in respect to anydosage instructions and forms of applicationsstated in the book. Every user is requested toexamine carefully the manufacturers’ leafletsaccompanying each drug and to check, if nec-essary in consultation with a physician orspecialist, whether the dosage schedulesmentioned therein or the contraindicationsstated by the manufacturers differ from thestatements made in the present book. Suchexamination is particularly important withdrugs that are either rarely used or havebeen newly released on the market. Everydosage schedule or every form of applicationused is entirely at the user’s own risk andresponsibility. The authors and publishers re-quest every user to report to the publishersany discrepancies or inaccuracies noticed. Iferrors in this work are found after publication,errata will be posted at www.thieme.com onthe product description page.
Some of the product names, patents, and reg-istered designs referred to in this book are infact registered trademarks or proprietarynames even though specific reference to thisfact is not always made in the text. Therefore,the appearance of a name without designa-tion as proprietary is not to be construed as arepresentation by the publisher that it is inthe public domain.This book, including all parts thereof, is legallyprotected by copyright. Any use, exploitation,or commercialization outside the narrow lim-its set by copyright legislation, without thepublisher’s consent, is illegal and liable toprosecution. This applies in particular to pho-tostat reproduction, copying, mimeograph-ing, preparation of microfilms, and electronicdata processing and storage.
All rights reserved. Usage subject to terms and conditions of license.Koolman, Color Atlas of Biochemistry, 2nd edition © 2005 Thieme

V
About the Authors
Jan Koolman (left) was born in Lübeck, Ger-many, and grew up with the sea wind blowingoff the Baltic. The high school he attended inthe Hanseatic city of Lübeck was one thatfocused on providing a classical education,which left its mark on him. From 1963 to1969, he studied biochemistry at the Univer-sity of Tübingen. He then took his doctorate(in the discipline of chemistry) at the Univer-sity of Marburg, under the supervision of bio-chemist Peter Karlson. In Marburg, he beganto study the biochemistry of insects and otherinvertebrates. He took his postdoctoral de-gree in 1977 in the field of human medicine,and was appointed Honorary Professor in1984. His field of study today is biochemicalendocrinology. His other interests include ed-ucational methods in biochemistry. He is cur-rently Dean of Studies in the Department ofMedicine in Marburg; he is married to an artteacher.Klaus-Heinrich Röhm (right) comes fromStuttgart, Germany. After graduating fromthe School of Protestant Theology in Urach—another institution specializing in classicalstudies—and following a period working inthe field of physics, he took a diploma in bio-chemistry at the University of Tübingen,where the two authors first met. Since 1970,he has also worked in the Department ofMedicine at the University of Marburg. He
took his doctorate under the supervision ofFriedhelm Schneider, and his postdoctoral de-gree in 1980 was in the Department of Chem-istry. He has been an Honorary Professor since1986. His research group is concerned withthe structure and function of enzymes in-volved in amino acid metabolism. He is mar-ried to a biologist and has two children.Jürgen Wirth (center) studied in Berlin and atthe College of Design in Offenbach, Germany.His studies focused on free graphics and illus-tration, and his diploma topic was “The devel-opment and function of scientific illustration.”From 1963 to 1977, Jürgen Wirth was involvedin designing the exhibition space in theSenckenberg Museum of Natural History inFrankfurt am Main, while at the same timeworking as a freelance associate with severalpublishing companies, providing illustrationsfor schoolbooks, non-fiction titles, and scien-tific publications. He has received severalawards for book illustration and design. In1978, he was appointed to a professorship atthe College of Design in Schwäbisch Gmünd,Germany, and in 1986 he became Professor ofDesign at the Academy of Design in Darm-stadt, Germany. His specialist fields includescientific graphics/information graphics andillustration methods. He is married and hasthree children.
All rights reserved. Usage subject to terms and conditions of license.Koolman, Color Atlas of Biochemistry, 2nd edition © 2005 Thieme

VI
Preface
Biochemistry is a dynamic, rapidly growingfield, and the goal of this color atlas is toillustrate this fact visually. The precise boun-daries between biochemistry and relatedfields, such as cell biology, anatomy, physiol-ogy, genetics, and pharmacology, are dif cultto define and, in many cases, arbitrary. Thisoverlap is not coincidental. The object beingstudied is often the same—a nerve cell or amitochondrion, for example—and only thepoint of view differs.For a considerable period of its history, bio-chemistry was strongly influenced by chem-istry and concentrated on investigating met-abolic conversions and energy transfers. Ex-plaining the composition, structure, and me-tabolism of biologically important moleculeshas always been in the foreground. However,new aspects inherited from biochemistry’sother parent, the biological sciences, arenow increasingly being added: the relation-ship between chemical structure and biolog-ical function, the pathways of informationtransfer, observance of the ways in whichbiomolecules are spatially and temporally dis-tributed in cells and organisms, and an aware-ness of evolution as a biochemical process.These new aspects of biochemistry are boundto become more and more important.Owing to space limitations, we have concen-trated here on the biochemistry of humansand mammals, although the biochemistry ofother animals, plants, and microorganisms isno less interesting. In selecting the materialfor this book, we have put the emphasis onsubjects relevant to students of human med-icine. The main purpose of the atlas is to serveas an overview and to provide visual informa-tion quickly and ef ciently. Referring to text-books can easily fill any gaps. For readersencountering biochemistry for the first time,some of the plates may look rather complex. Itmust be emphasized, therefore, that the atlasis not intended as a substitute for a compre-hensive textbook of biochemistry.As the subject matter is often dif cult to vis-ualize, symbols, models, and other graphic
elements had to be found that make compli-cated phenomena appear tangible. Thegraphics were designed conservatively, theaim being to avoid illustrations that mightlook too spectacular or exaggerated. Ourgoal was to achieve a visual and aestheticway of representing scientific facts that wouldbe simple and at the same time effective forteaching purposes. Use of graphics softwarehelped to maintain consistency in the use ofshapes, colors, dimensions, and labels, in par-ticular. Formulae and other repetitive ele-ments and structures could be handled easilyand precisely with the assistance of the com-puter.Color-coding has been used throughout to aidthe reader, and the key to this is given in twospecial color plates on the front and rear in-side covers. For example, in molecular modelseach of the more important atoms has a par-ticular color: gray for carbon, white for hydro-gen, blue for nitrogen, red for oxygen, and soon. The different classes of biomolecules arealso distinguished by color: proteins are al-ways shown in brown tones, carbohydrates inviolet, lipids in yellow, DNA in blue, and RNAin green. In addition, specific symbols areused for the important coenzymes, such asATP and NAD+. The compartments in whichbiochemical processes take place are color-coded as well. For example, the cytoplasm isshown in yellow, while the extracellular spaceis shaded in blue. Arrows indicating a chem-ical reaction are always black and those rep-resenting a transport process are gray.In terms of the visual clarity of its presenta-tion, biochemistry has still to catch up withanatomy and physiology. In this book, wesometimes use simplified ball-and-stick mod-els instead of the classical chemical formulae.In addition, a number of compounds are rep-resented by space-filling models. In thesecases, we have tried to be as realistic as pos-sible. The models of small molecules arebased on conformations calculated by com-puter-based molecular modeling. In illustrat-ing macromolecules, we used structural infor-
All rights reserved. Usage subject to terms and conditions of license.Koolman, Color Atlas of Biochemistry, 2nd edition © 2005 Thieme

VIIPreface
mation obtained by X-ray crystallographythat is stored in the Protein Data Bank. Innaming enzymes, we have followed the of -cial nomenclature recommended by theIUBMB. For quick identification, EC numbers(in italics) are included with enzyme names.To help students assess the relevance of thematerial (while preparing for an examination,for example), we have included symbols onthe text pages next to the section headings toindicate how important each topic is. A filledcircle stands for “basic knowledge,” a half-filled circle indicates “standard knowledge,”and an empty circle stands for “in-depthknowledge.” Of course, this classificationonly reflects our subjective views.This second edition was carefully revised anda significant number of new plates wereadded to cover new developments.
We are grateful to many readers for theircomments and valuable criticisms during thepreparation of this book. Of course, we wouldalso welcome further comments and sugges-tions from our readers.
August 2004
Jan Koolman,Klaus-Heinrich RöhmMarburg
Jürgen WirthDarmstadt
All rights reserved. Usage subject to terms and conditions of license.Koolman, Color Atlas of Biochemistry, 2nd edition © 2005 Thieme

Contents
Introduction . . . . . . . . . . . . . . . . . . . . 1
BasicsChemistryPeriodic table. . . . . . . . . . . . . . . . . . . . 2Bonds . . . . . . . . . . . . . . . . . . . . . . . . . 4Molecular structure . . . . . . . . . . . . . . . 6Isomerism . . . . . . . . . . . . . . . . . . . . . . 8Biomolecules I . . . . . . . . . . . . . . . . . . . 10Biomolecules II . . . . . . . . . . . . . . . . . . 12Chemical reactions. . . . . . . . . . . . . . . . 14
Physical ChemistryEnergetics . . . . . . . . . . . . . . . . . . . . . . 16Equilibriums . . . . . . . . . . . . . . . . . . . . 18Enthalpy and entropy. . . . . . . . . . . . . . 20Reaction kinetics . . . . . . . . . . . . . . . . . 22Catalysis . . . . . . . . . . . . . . . . . . . . . . . 24Water as a solvent . . . . . . . . . . . . . . . . 26Hydrophobic interactions . . . . . . . . . . . 28Acids and bases . . . . . . . . . . . . . . . . . . 30Redox processes. . . . . . . . . . . . . . . . . . 32
BiomoleculesCarbohydratesOverview. . . . . . . . . . . . . . . . . . . . . . . 34Chemistry of sugars . . . . . . . . . . . . . . . 36Monosaccharides and disaccharides . . . 38Polysaccharides: overview . . . . . . . . . . 40Plant polysaccharides. . . . . . . . . . . . . . 42Glycosaminoglycans and glycoproteins . 44
LipidsOverview. . . . . . . . . . . . . . . . . . . . . . . 46Fatty acids and fats . . . . . . . . . . . . . . . 48Phospholipids and glycolipids . . . . . . . 50Isoprenoids . . . . . . . . . . . . . . . . . . . . . 52Steroid structure . . . . . . . . . . . . . . . . . 54Steroids: overview . . . . . . . . . . . . . . . . 56
Amino AcidsChemistry and properties. . . . . . . . . . . 58Proteinogenic amino acids . . . . . . . . . . 60Non-proteinogenic amino acids . . . . . . 62
Peptides and ProteinsOverview. . . . . . . . . . . . . . . . . . . . . . . 64Peptide bonds . . . . . . . . . . . . . . . . . . . 66Secondary structures . . . . . . . . . . . . . . 68
Structural proteins . . . . . . . . . . . . . . . . 70Globular proteins . . . . . . . . . . . . . . . . . 72Protein folding . . . . . . . . . . . . . . . . . . . 74Molecular models: insulin. . . . . . . . . . . 76Isolation and analysis of proteins . . . . . 78
Nucleotides and Nucleic AcidsBases and nucleotides. . . . . . . . . . . . . . 80RNA . . . . . . . . . . . . . . . . . . . . . . . . . . . 82DNA . . . . . . . . . . . . . . . . . . . . . . . . . . . 84Molecular models: DNA and RNA . . . . . 86
MetabolismEnzymesBasics. . . . . . . . . . . . . . . . . . . . . . . . . . 88Enzyme catalysis . . . . . . . . . . . . . . . . . 90Enzyme kinetics I . . . . . . . . . . . . . . . . . 92Enzyme kinetics II . . . . . . . . . . . . . . . . 94Inhibitors . . . . . . . . . . . . . . . . . . . . . . . 96Lactate dehydrogenase: structure . . . . . 98Lactate dehydrogenase: mechanism . . . 100Enzymatic analysis . . . . . . . . . . . . . . . . 102Coenzymes 1 . . . . . . . . . . . . . . . . . . . . 104Coenzymes 2 . . . . . . . . . . . . . . . . . . . . 106Coenzymes 3 . . . . . . . . . . . . . . . . . . . . 108Activated metabolites . . . . . . . . . . . . . . 110
Metabolic RegulationIntermediary metabolism . . . . . . . . . . . 112Regulatory mechanisms . . . . . . . . . . . . 114Allosteric regulation . . . . . . . . . . . . . . . 116Transcription control . . . . . . . . . . . . . . 118Hormonal control . . . . . . . . . . . . . . . . . 120
Energy MetabolismATP . . . . . . . . . . . . . . . . . . . . . . . . . . . 122Energetic coupling . . . . . . . . . . . . . . . . 124Energy conservation at membranes. . . . 126Photosynthesis: light reactions . . . . . . . 128Photosynthesis: dark reactions . . . . . . . 130Molecular models: membrane proteins . 132Oxoacid dehydrogenases. . . . . . . . . . . . 134Tricarboxylic acid cycle: reactions . . . . . 136Tricarboxylic acid cycle: functions . . . . . 138Respiratory chain . . . . . . . . . . . . . . . . . 140ATP synthesis . . . . . . . . . . . . . . . . . . . . 142Regulation . . . . . . . . . . . . . . . . . . . . . . 144Respiration and fermentation . . . . . . . . 146Fermentations . . . . . . . . . . . . . . . . . . . 148
VIII
All rights reserved. Usage subject to terms and conditions of license.Koolman, Color Atlas of Biochemistry, 2nd edition © 2005 Thieme

Carbohydrate MetabolismGlycolysis . . . . . . . . . . . . . . . . . . . . . . . 150Pentose phosphate pathway . . . . . . . . . 152Gluconeogenesis. . . . . . . . . . . . . . . . . . 154Glycogen metabolism . . . . . . . . . . . . . . 156Regulation . . . . . . . . . . . . . . . . . . . . . . 158Diabetes mellitus . . . . . . . . . . . . . . . . . 160
Lipid MetabolismOverview . . . . . . . . . . . . . . . . . . . . . . . 162Fatty acid degradation . . . . . . . . . . . . . 164Minor pathways of fatty aciddegradation . . . . . . . . . . . . . . . . . . . . . 166Fatty acid synthesis . . . . . . . . . . . . . . . 168Biosynthesis of complex lipids . . . . . . . 170Biosynthesis of cholesterol . . . . . . . . . . 172
Protein MetabolismProtein metabolism: overview . . . . . . . 174Proteolysis . . . . . . . . . . . . . . . . . . . . . . 176Transamination and deamination . . . . . 178Amino acid degradation . . . . . . . . . . . . 180Urea cycle . . . . . . . . . . . . . . . . . . . . . . 182Amino acid biosynthesis . . . . . . . . . . . . 184
Nucleotide MetabolismNucleotide degradation. . . . . . . . . . . . . 186Purine and pyrimidine biosynthesis . . . 188Nucleotide biosynthesis . . . . . . . . . . . . 190
Porphyrin MetabolismHeme biosynthesis . . . . . . . . . . . . . . . . 192Heme degradation . . . . . . . . . . . . . . . . 194
OrganellesBasicsStructure of cells . . . . . . . . . . . . . . . . . 196Cell fractionation . . . . . . . . . . . . . . . . . 198Centrifugation . . . . . . . . . . . . . . . . . . . 200Cell components and cytoplasm . . . . . . 202
CytoskeletonComponents . . . . . . . . . . . . . . . . . . . . . 204Structure and functions . . . . . . . . . . . . 206
Nucleus . . . . . . . . . . . . . . . . . . . . . . . . 208
MitochondriaStructure and functions . . . . . . . . . . . . 210Transport systems . . . . . . . . . . . . . . . . 212
Biological MembranesStructure and components . . . . . . . . . . 214Functions and composition . . . . . . . . . . 216Transport processes . . . . . . . . . . . . . . . 218Transport proteins . . . . . . . . . . . . . . . . 220Ion channels. . . . . . . . . . . . . . . . . . . . . 222Membrane receptors . . . . . . . . . . . . . . 224
Endoplasmic Reticulum and Golgi ApparatusER: structure and function. . . . . . . . . . 226Protein sorting . . . . . . . . . . . . . . . . . . 228Protein synthesis and maturation . . . . 230Protein maturation . . . . . . . . . . . . . . . 232
Lysosomes. . . . . . . . . . . . . . . . . . . . . . 234
Molecular GeneticsOverview . . . . . . . . . . . . . . . . . . . . . . 236Genome . . . . . . . . . . . . . . . . . . . . . . . 238Replication . . . . . . . . . . . . . . . . . . . . . 240Transcription. . . . . . . . . . . . . . . . . . . . 242Transcriptional control . . . . . . . . . . . . 244RNA maturation . . . . . . . . . . . . . . . . . 246Amino acid activation . . . . . . . . . . . . . 248Translation I: initiation . . . . . . . . . . . . 250Translation II: elongation andtermination. . . . . . . . . . . . . . . . . . . . . 252Antibiotics . . . . . . . . . . . . . . . . . . . . . 254Mutation and repair . . . . . . . . . . . . . . 256
Genetic engineeringDNA cloning . . . . . . . . . . . . . . . . . . . . 258DNA sequencing . . . . . . . . . . . . . . . . . 260PCR and protein expression . . . . . . . . . 262Genetic engineering in medicine . . . . . 264
Tissues and organsDigestionOverview . . . . . . . . . . . . . . . . . . . . . . 266Digestive secretions. . . . . . . . . . . . . . . 268Digestive processes . . . . . . . . . . . . . . . 270Resorption . . . . . . . . . . . . . . . . . . . . . 272
BloodComposition and functions . . . . . . . . . 274Plasma proteins. . . . . . . . . . . . . . . . . . 276Lipoproteins . . . . . . . . . . . . . . . . . . . . 278Hemoglobin . . . . . . . . . . . . . . . . . . . . 280Gas transport . . . . . . . . . . . . . . . . . . . 282Erythrocyte metabolism . . . . . . . . . . . 284Iron metabolism . . . . . . . . . . . . . . . . . 286Acid–base balance . . . . . . . . . . . . . . . . 288Blood clotting . . . . . . . . . . . . . . . . . . . 290Fibrinolysis, blood groups . . . . . . . . . . 292
Immune systemImmune response . . . . . . . . . . . . . . . . 294T-cell activation. . . . . . . . . . . . . . . . . . 296Complement system . . . . . . . . . . . . . . 298Antibodies . . . . . . . . . . . . . . . . . . . . . 300Antibody biosynthesis . . . . . . . . . . . . . 302Monoclonal antibodies, immunoassay . 304
IXContents
All rights reserved. Usage subject to terms and conditions of license.Koolman, Color Atlas of Biochemistry, 2nd edition © 2005 Thieme

LiverFunctions. . . . . . . . . . . . . . . . . . . . . . . 306Buffer function in organ metabolism . . 308Carbohydrate metabolism . . . . . . . . . . 310Lipid metabolism . . . . . . . . . . . . . . . . . 312Bile acids . . . . . . . . . . . . . . . . . . . . . . . 314Biotransformations . . . . . . . . . . . . . . . 316Cytochrome P450 systems . . . . . . . . . . 318Ethanol metabolism . . . . . . . . . . . . . . . 320
KidneyFunctions. . . . . . . . . . . . . . . . . . . . . . . 322Urine. . . . . . . . . . . . . . . . . . . . . . . . . . 324Functions in the acid–base balance. . . . 326Electrolyte and water recycling . . . . . . 328Renal hormones. . . . . . . . . . . . . . . . . . 330
MuscleMuscle contraction . . . . . . . . . . . . . . . 332Control of muscle contraction. . . . . . . . 334Muscle metabolism I . . . . . . . . . . . . . . 336Muscle metabolism II . . . . . . . . . . . . . . 338
Connective tissueBone and teeth . . . . . . . . . . . . . . . . . . 340Calcium metabolism . . . . . . . . . . . . . . 342Collagens . . . . . . . . . . . . . . . . . . . . . . . 344Extracellular matrix . . . . . . . . . . . . . . . 346
Brain and Sensory OrgansSignal transmission in the CNS . . . . . . . 348Resting potential and action potential. . 350Neurotransmitters . . . . . . . . . . . . . . . . 352Receptors for neurotransmitters . . . . . . 354Metabolism . . . . . . . . . . . . . . . . . . . . . 356Sight . . . . . . . . . . . . . . . . . . . . . . . . . . 358
NutritionNutrientsOrganic substances . . . . . . . . . . . . . . . 360Minerals and trace elements . . . . . . . . 362
VitaminsLipid-soluble vitamins . . . . . . . . . . . . . 364Water-soluble vitamins I . . . . . . . . . . . 366Water-soluble vitamins II . . . . . . . . . . . 368
HormonesHormonal systemBasics . . . . . . . . . . . . . . . . . . . . . . . . . 370Plasma levels and hormone hierarchy. . 372
Lipophilic hormones. . . . . . . . . . . . . . . 374Metabolism of steroid hormones . . . . . 376Mechanism of action . . . . . . . . . . . . . . 378
Hydrophilic hormones . . . . . . . . . . . . . 380Metabolism of peptide hormones . . . . . 382Mechanisms of action . . . . . . . . . . . . . . 384Second messengers. . . . . . . . . . . . . . . . 386Signal cascades. . . . . . . . . . . . . . . . . . . 388
Other signaling substancesEicosanoids . . . . . . . . . . . . . . . . . . . . . 390Cytokines . . . . . . . . . . . . . . . . . . . . . . . 392
Growth and developmentCell proliferationCell cycle . . . . . . . . . . . . . . . . . . . . . . . 394Apoptosis . . . . . . . . . . . . . . . . . . . . . . . 396Oncogenes . . . . . . . . . . . . . . . . . . . . . . 398Tumors . . . . . . . . . . . . . . . . . . . . . . . . 400Cytostatic drugs . . . . . . . . . . . . . . . . . . 402
Viruses . . . . . . . . . . . . . . . . . . . . . . . . . 404
Metabolic charts . . . . . . . . . . . . . . . . . . 406Calvin cycle . . . . . . . . . . . . . . . . . . . . . 407Carbohydrate metabolism. . . . . . . . . . . 408Biosynthesis of fats andmembrane liquids . . . . . . . . . . . . . . . . 409Synthesis of ketone bodies and steroids 410Degradation of fats and phospholipids . 411Biosynthesis of the essentialamino acids . . . . . . . . . . . . . . . . . . . . . 412Biosynthesis of the non-essentialamino acids . . . . . . . . . . . . . . . . . . . . . 413Amino acid degradation I . . . . . . . . . . . 414Amino acid degradation II. . . . . . . . . . . 415Ammonia metabolism. . . . . . . . . . . . . . 416Biosynthesis of purine nucleotides . . . . 417Biosynthesis of the pyrimidine nucleotidesand C1 metabolism . . . . . . . . . . . . . . . . 418Nucleotide degradation. . . . . . . . . . . . . 419
Annotated enzyme list . . . . . . . . . . . . . 420
Abbreviations . . . . . . . . . . . . . . . . . . . . 431
Quantities and units . . . . . . . . . . . . . . . 433
Further reading . . . . . . . . . . . . . . . . . . 434
Source credits. . . . . . . . . . . . . . . . . . . . 435
Index . . . . . . . . . . . . . . . . . . . . . . . . . . 437
Key to color-coding:see front and rear inside covers
X Contents
All rights reserved. Usage subject to terms and conditions of license.Koolman, Color Atlas of Biochemistry, 2nd edition © 2005 Thieme

Introduction
This paperback atlas is intended for studentsof medicine and the biological sciences. Itprovides an introduction to biochemistry,but with its modular structure it can also beused as a reference book for more detailedinformation. The 216 color plates provideknowledge in the field of biochemistry, ac-companied by detailed information in thetext on the facing page. The degree of dif -culty of the subject-matter is indicated bysymbols in the text:
stands for “basic biochemical knowledge” indicates “standard biochemical knowl-
edge” means “specialist biochemical knowledge.”
Some general rules used in the structure ofthe illustrations are summed up in two ex-planatory plates inside the front and backcovers. Keywords, definitions, explanationsof unfamiliar concepts and chemical formulascan be found using the index. The book startswith a few basics in biochemistry (pp. 2–33).There is a brief explanation of the conceptsand principles of chemistry (pp. 2–15). Theseinclude the periodic table of the elements,chemical bonds, the general rules governingmolecular structure, and the structures of im-portant classes of compounds. Several basicconcepts of physical chemistry are also essen-tial for an understanding of biochemicalprocesses. Pages 16–33 therefore discuss thevarious forms of energy and their intercon-version, reaction kinetics and catalysis, theproperties of water, acids and bases, and re-dox processes.
These basic concepts are followed by a sec-tion on the structure of the important biomo-lecules (pp. 34–87). This part of the book isarranged according to the different classes ofmetabolites. It discusses carbohydrates, lipids,amino acids, peptides and proteins, nucleoti-des, and nucleic acids.
The next part presents the reactionsinvolved in the interconversion of thesecompounds—the part of biochemistry that iscommonly referred to as metabolism(pp. 88–195). The section starts with a dis-cussion of the enzymes and coenzymes, anddiscusses the mechanisms of metabolic regu-lation and the so-called energy metabolism.After this, the central metabolic pathwaysare presented, once again arranged accordingto the class of metabolite (pp.150–195).
The second half of the book begins with adiscussion of the functional compartmentswithin the cell, the cellular organelles (pp.196–235). This is followed on pp. 236–265by the current field of molecular genetics(molecular biology). A further extensive sec-tion is devoted to the biochemistry ofindividual tissues and organs (pp. 266–359).Here, it has only been possible to focus on themost important organs and organ systems—the digestive system, blood, liver, kidneys,muscles, connective and supportive tissues,and the brain.
Other topics include the biochemistry ofnutrition (pp. 360–369), the structure andfunction of important hormones (pp.370–393), and growth and development(pp. 394–405).
The paperback atlas concludes with a seriesof schematic metabolic “charts” (pp.407–419). These plates, which are not accom-panied by explanatory text apart from a briefintroduction on p. 406, show simplified ver-sions of the most important synthetic anddegradative pathways. The charts are mainlyintended for reference, but they can also beused to review previously learned material.The enzymes catalyzing the various reactionsare only indicated by their EC numbers. Theirnames can be found in the systematically ar-ranged and annotated enzyme list (pp.420–430).
1Chemistry
All rights reserved. Usage subject to terms and conditions of license.Koolman, Color Atlas of Biochemistry, 2nd edition © 2005 Thieme

Periodic table
A. Biologically important elements
There are 81 stable elements in nature. Fifteenof these are present in all living things, and afurther 8–10 are only found in particular or-ganisms. The illustration shows the first halfof the periodic table, containing all of the bio-logically important elements. In addition tophysical and chemical data, it also providesinformation about the distribution of the ele-ments in the living world and their abun-dance in the human body. The laws of atomicstructure underlying the periodic table arediscussed in chemistry textbooks.
More than 99% of the atoms in animals’bodies are accounted for by just four ele-ments—hydrogen (H), oxygen (O), carbon (C)and nitrogen (N). Hydrogen and oxygen arethe constituents of water, which alone makesup 60–70% of cell mass (see p.196). Togetherwith carbon and nitrogen, hydrogen and oxy-gen are also the major constituents of theorganic compounds on which most livingprocesses depend. Many biomolecules alsocontain sulfur (S) or phosphorus (P). Theabove macroelements are essential for all or-ganisms.
A second biologically important group ofelements, which together represent onlyabout 0.5% of the body mass, are present al-most exclusively in the form of inorganic ions.This group includes the alkali metals sodium(Na) and potassium (K), and the alkaline earthmetals magnesium (Mg) and calcium (Ca). Thehalogen chlorine (Cl) is also always ionized inthe cell. All other elements important for lifeare present in such small quantities that theyare referred to as trace elements. These in-clude transition metals such as iron (Fe), zinc(Zn), copper (Cu), cobalt (Co) and manganese(Mn). A few nonmetals, such as iodine (I) andselenium (Se), can also be classed as essentialtrace elements.
B. Electron configurations: examples
The chemical properties of atoms and thetypes of bond they form with each other aredetermined by their electron shells. The elec-tron configurations of the elements are there-fore also shown in Fig. A. Fig. B explains thesymbols and abbreviations used. More de-
tailed discussions of the subject are availablein chemistry textbooks.
The possible states of electrons are calledorbitals. These are indicated by what isknown as the principal quantum numberand by a letter—s, p, or d. The orbitals arefilled one by one as the number of electronsincreases. Each orbital can hold a maximum oftwo electrons, which must have oppositelydirected “spins.” Fig. A shows the distributionof the electrons among the orbitals for each ofthe elements. For example, the six electrons ofcarbon (B1) occupy the 1s orbital, the 2s orbi-tal, and two 2p orbitals. A filled 1s orbital hasthe same electron configuration as the noblegas helium (He). This region of the electronshell of carbon is therefore abbreviated as“He” in Fig. A. Below this, the numbers ofelectrons in each of the other filled orbitals(2s and 2p in the case of carbon) are shown onthe right margin. For example, the electronshell of chlorine (B2) consists of that of neon(Ne) and seven additional electrons in 3s and3p orbitals. In iron (B3), a transition metal ofthe first series, electrons occupy the 4s orbitaleven though the 3d orbitals are still partlyempty. Many reactions of the transition met-als involve empty d orbitals—e. g., redox reac-tions or the formation of complexes withbases.
Particularly stable electron arrangementsarise when the outermost shell is fully occu-pied with eight electrons (the “octet rule”).This applies, for example, to the noble gases,as well as to ions such as Cl– (3s23p6) and Na+
(2s22p6). It is only in the cases of hydrogenand helium that two electrons are alreadysuf cient to fill the outermost 1s orbital.
2 Basics
All rights reserved. Usage subject to terms and conditions of license.Koolman, Color Atlas of Biochemistry, 2nd edition © 2005 Thieme

??
?
??
1s
2s2p
3s3p
3d4s4p
4d5s5p
3d4s
4d5s
4
5
44.96
Sc21
Ar
12
47.88
Ti22
Ar
22
50.94
V23
Ar
32
52.00
Cr24
Ar
42
54.94
Mn25
Ar
52
55.85
Fe26
Ar
62
58.93
Co27
Ar
72
58.69
Ni28
Ar
82
63.55
Cu29
Ar
92
65.39
Zn30
Ar
102
3 4 5 6 7 8 9 10 11 12
1.01
H1
1
63
4.00
He2
2
6.94
Li3
19.01
Be 2
4
10.81
B5
21
12.01
C6
He22
14.01
N7
He23
1.4
16.00
O8
He24
25.5
19.00
F9
He25
20.18 He
Ne10
26
HeHe He
22.99 Ne
Na 1
11 0.03
24.31
Mg12
Ne
2
0.01
26.98 Ne
Al13
21
28.09
Si14
Ne
22
30.97 Ne
P15
23
0.22
32.07
S16
Ne
24
0.05
35.45
Cl17
Ne
25
0.03
39.95
Ar18
26
39.10 Ar
K19
1
0.06
40.08 Ar
Ca20
2
0.31
69.72
Ga31
Ar
1021
72.61
Ge32
Ar
1022
74.92
As33
Ar
1023
78.96
Se34
Ar
10
79.90
BrAr
1025
83.80
Kr36
Ar
1026
126.9
I53
Kr1025
24 35
Ne
1
2
3
4
5
1 2 13 14 15 16 17 18
30.97
P15 0.22
?
Ne
23
9.5
95.94
Mo42
Kr42
s p ds p s p
[Ne][Ar]
4
3
2
1
3
2
1
4
3
2
1
3
2
1
[He]
Alkalineearths Halogens
Alkalimetals
Noblegases
Group
Relative atomicmassChemical symbol
Atomic number
Electronconfiguration
Percent (%) ofhuman body
all/mostorganisms
Macro element Traceelement
Metal
Semi-metal
Non-metal
Noble gas
Group
Perio
d
possibly
for some
Essential for...
Borongroup
Nitrogengroup
Carbongroup
Oxygengroup
A. Biologically important elements
B. Electron configurations: examples
Helium(He, Noble gas)1s2
Neon(Ne, Noble gas)1s2 2s2 2p6
Argon(Ar, Noble gas)1s2 2s2 2p6 3s2 3p6
1. Carbon (C)[He] 2s2 2p2
2. Chlorine (Cl)[Ne] 3s2 3p5
3. Iron (Fe)[Ar] 4s2 3d6
3Chemistry
All rights reserved. Usage subject to terms and conditions of license.Koolman, Color Atlas of Biochemistry, 2nd edition © 2005 Thieme

Bonds
A. Orbital hybridization and chemicalbonding
Stable, covalent bonds between nonmetalatoms are produced when orbitals (see p. 2)of the two atoms form molecular orbitals thatare occupied by one electron from each of theatoms. Thus, the four bonding electrons of thecarbon atom occupy 2s and 2p atomic orbitals(1a). The 2s orbital is spherical in shape, whilethe three 2p orbitals are shaped like dumb-bells arranged along the x, y, and z axes. Itmight therefore be assumed that carbonatoms should form at least two different typesof molecular orbital. However, this is not nor-mally the case. The reason is an effect knownas orbital hybridization. Combination of the sorbital and the three p orbitals of carbon givesrise to four equivalent, tetrahedrally arrangedsp3 atomic orbitals (sp3 hybridization). Whenthese overlap with the 1s orbitals of H atoms,four equivalent σ-molecular orbitals (1b) areformed. For this reason, carbon is capable offorming four bonds—i. e., it has a valency offour. Single bonds between nonmetal atomsarise in the same way as the four σ or singlebonds in methane (CH4). For example, thehydrogen phosphate ion (HPO4
2–) and theammonium ion (NH4
+) are also tetrahedralin structure (1c).
A second common type of orbital hybrid-ization involves the 2s orbital and only two ofthe three 2p orbitals (2a). This process istherefore referred to as sp2 hybridization.The result is three equivalent sp2 hybrid orbi-tals lying in one plane at an angle of 120° toone another. The remaining 2px orbital is ori-ented perpendicular to this plane. In contrastto their sp3 counterparts, sp2-hybridizedatoms form two different types of bondwhen they combine into molecular orbitals(2b). The three sp2 orbitals enter into σ bonds,as described above. In addition, the electronsin the two 2px orbitals, known as electrons,combine to give an additional, elongated πmolecular orbital, which is located aboveand below the plane of the σ bonds. Bondsof this type are called double bonds. Theyconsist of a σ bond and a π bond, and ariseonly when both of the atoms involved arecapable of sp2 hybridization. In contrast tosingle bonds, double bonds are not freely ro-
tatable, since rotation would distort the π-molecular orbital. This is why all of the atomslie in one plane (2c); in addition, cis–transisomerism arises in such cases (see p. 8).Double bonds that are common in biomole-cules are C=C and C=O. C=N double bonds arefound in aldimines (Schiff bases, see p.178).
B. Resonance
Many molecules that have several doublebonds are much less reactive than might beexpected. The reason for this is that thedouble bonds in these structures cannot belocalized unequivocally. Their π orbitals arenot confined to the space between the dou-ble-bonded atoms, but form a shared,extended -molecular orbital. Structureswith this property are referred to as reso-nance hybrids, because it is impossible to de-scribe their actual bonding structure usingstandard formulas. One can either use whatare known as resonance structures—i. e.,idealized configurations in which π electronsare assigned to specific atoms (cf. pp. 32 and66, for example)—or one can use dashed linesas in Fig. B to suggest the extent of the delo-calized orbitals. (Details are discussed inchemistry textbooks.)
Resonance-stabilized systems include car-boxylate groups, as in formate; aliphatic hy-drocarbons with conjugated double bonds,such as 1,3-butadiene; and the systems knownas aromatic ring systems. The best-knownaromatic compound is benzene, which hassix delocalized π electrons in its ring. Ex-tended resonance systems with 10 or moreπ electrons absorb light within the visiblespectrum and are therefore colored. Thisgroup includes the aliphatic carotenoids (seep.132), for example, as well as the hemegroup, in which 18 π electrons occupy an ex-tended molecular orbital (see p.106).
4 Basics
All rights reserved. Usage subject to terms and conditions of license.Koolman, Color Atlas of Biochemistry, 2nd edition © 2005 Thieme

S Pz Py Px S Pz Py Px
C + 4 H CH4
1a 2a
1b
1c
2b
2c
H
CH
H
H
O
PO
O
OH NH
H
H
H C C
H
R
R'
H
C O
R'
R
C N
H
R
R'
HC
CC
CH
H
H
H
H
C
CC
C
CCH
H
H
H
H
H
H C
O
O
A. Orbital hybridization and chemical bonding
4 Equivalentsp3 atomicorbitals(tetrahedral)
3 Equivalentsp2 atomicorbitals(trigonal)
sp2
Hybrid-ization
Bondingπ-molecularorbitals
sp3
Hybrid-ization
1s Orbitalofhydro-genatom
sp3 Atomicorbitalsofcarbonatom
4 Bondingσ-molecularorbitals
5 Bondingσ-molecularorbitals
Formula
π-Molecularorbitals
Formate 1,3-Butadiene Benzene
AldimineMethane Hydrogen phosphate AmmoniumIon
Alkene Carbonylcompound
B. Resonance
5Chemistry
All rights reserved. Usage subject to terms and conditions of license.Koolman, Color Atlas of Biochemistry, 2nd edition © 2005 Thieme

Molecular structure
The physical and chemical behavior of mole-cules is largely determined by their constitu-tion (the type and number of the atoms theycontain and their bonding). Structural formu-las can therefore be used to predict not onlythe chemical reactivity of a molecule, but alsoits size and shape, and to some extent itsconformation (the spatial arrangement ofthe atoms). Some data providing the basisfor such predictions are summarized hereand on the facing page. In addition, L-dihy-droxyphenylalanine (L-dopa; see p. 352), isused as an example to show the way in whichmolecules are illustrated in this book.
A. Molecule illustrations
In traditional two-dimensional structuralformulas (A1), atoms are represented as lettersymbols and electron pairs are shown as lines.Lines between two atomic symbols symbolizetwo bonding electrons (see p. 4), and all of theother lines represent free electron pairs, suchas those that occur in O and N atoms. Freeelectrons are usually not represented explic-itly (and this is the convention used in thisbook as well). Dashed or continuous circles orarcs are used to emphasize delocalized elec-trons.
Ball-and-stick models (A2) are used to illus-trate the spatial structure of molecules. Atomsare represented as colored balls (for the colorcoding, see the inside front cover) and bonds(including multiple bonds) as gray cylinders.Although the relative bond lengths and anglescorrespond to actual conditions, the size atwhich the atoms are represented is too smallto make the model more comprehensible.
Space-filling van der Waals models (A3) areuseful for illustrating the actual shape andsize of molecules. These models representatoms as truncated balls. Their effective ex-tent is determined by what is known as thevan der Waals radius. This is calculated fromthe energetically most favorable distance be-tween atoms that are not chemically bondedto one another.
B. Bond lengths and angles
Atomic radii and distances are now usuallyexpressed in picometers (pm; 1 pm =10–12 m). The old angstrom unit (Å,Å = 100 pm) is now obsolete. The length ofsingle bonds approximately corresponds tothe sum of what are known as the covalentradii of the atoms involved (see inside frontcover). Double bonds are around 10–20%shorter than single bonds. In sp3-hybridizedatoms, the angle between the individualbonds is approx. 110°; in sp2-hybridizedatoms it is approx. 120°.
C. Bond polarity
Depending on the position of the element inthe periodic table (see p. 2), atoms havedifferent electronegativity—i. e., a differenttendency to take up extra electrons. The val-ues given in C2 are on a scale between 2 and 4.The higher the value, the more electronega-tive the atom. When two atoms with verydifferent electronegativities are bound toone another, the bonding electrons are drawntoward the more electronegative atom, andthe bond is polarized. The atoms involvedthen carry positive or negative partialcharges. In C1, the van der Waals surface iscolored according to the different charge con-ditions (red = negative, blue = positive). Oxy-gen is the most strongly electronegative of thebiochemically important elements, with C=Odouble bonds being especially highly polar.
D. Hydrogen bonds
The hydrogen bond, a special type of nonco-valent bond, is extremely important in bio-chemistry. In this type of bond, hydrogenatoms of OH, NH, or SH groups (known ashydrogen bond donors) interact with freeelectrons of acceptor atoms (for example, O,N, or S). The bonding energies of hydrogenbonds (10–40 kJ mol–1) are much lowerthan those of covalent bonds (approx.400 kJ mol–1). However, as hydrogen bondscan be very numerous in proteins and DNA,they play a key role in the stabilization ofthese molecules (see pp. 68, 84). The impor-tance of hydrogen bonds for the properties ofwater is discussed on p. 26.
6 Basics
All rights reserved. Usage subject to terms and conditions of license.Koolman, Color Atlas of Biochemistry, 2nd edition © 2005 Thieme

0.9 2.1 2.5 3.0 3.5 4.0
1 2 3 4
H C N O FNa
A H B A H B A H B
120°
120°
120°
120°120°
110°
110° 110°
110° 110°
110°
108°
124pm
111
pm14
9pm
110pm
95pm
154 pm
140 pm
137 pm
100 pm
270–280 pm
280 pm
290 pm
290 pm
O
C
O
C C
N
H H
H
H O
O
HH
H
H
H
HH
OH H
O O
H
H H
H
C
CH
N
N
O
H
H
R1
H
O
N
CHC
C O
R2
C C
CN C
N
NHC
NR
H
N
H
H
H NC N
CH
CCO CH3
RO
Chiral center
1. Formula illustration
2. Ball- and-stick model
3. Van der Waals model
1. Partial charges in L-dopa
2. Electronegativities
C. Bond polarity
B. Bond lengths and anglesA. Molecule illustrations
D. Hydrogen bonds
Increasing electronegativity
Positive Neutral Negative
Acid Base
Initial state
1. Principle
Donor Acceptor
Hydrogen bond
Dissociatedacid
Protonatedbase
Complete reaction
Water Proteins DNA2. Examples
7Chemistry
All rights reserved. Usage subject to terms and conditions of license.Koolman, Color Atlas of Biochemistry, 2nd edition © 2005 Thieme

Isomerism
Isomers are molecules with the same compo-sition (i. e. the same molecular formula), butwith different chemical and physical proper-ties. If isomers differ in the way in which theiratoms are bonded in the molecule, they aredescribed as structural isomers (cf. citric acidand isocitric acid, D). Other forms of isomer-ism are based on different arrangements ofthe substituents of bonds (A, B) or on thepresence of chiral centers in the molecule (C).
A. cis–trans isomers
Double bonds are not freely rotatable (seep. 4). If double-bonded atoms have differentsubstituents, there are two possible orienta-tions for these groups. In fumaric acid, anintermediate of the tricarboxylic acid cycle(see p.136), the carboxy groups lie on differentsides of the double bond (trans or E position).In its isomer maleic acid, which is not pro-duced in metabolic processes, the carboxygroups lie on the same side of the bond (cisor Z position). Cis–trans isomers (geometricisomers) have different chemical and physicalproperties—e. g., their melting points (Fp.)and pKa values. They can only be intercon-verted by chemical reactions.
In lipid metabolism, cis–trans isomerism isparticularly important. For example, doublebonds in natural fatty acids (see p. 48) usuallyhave a cis configuration. By contrast, unsatu-rated intermediates of β oxidation have atrans configuration. This makes the break-down of unsaturated fatty acids more compli-cated (see p.166). Light-induced cis–trans iso-merization of retinal is of central importancein the visual cycle (see p. 358).
B. Conformation
Molecular forms that arise as a result of rota-tion around freely rotatable bonds are knownas conformers. Even small molecules can havedifferent conformations in solution. In thetwo conformations of succinic acid illustratedopposite, the atoms are arranged in a similarway to fumaric acid and maleic acid. Bothforms are possible, although conformation 1is more favorable due to the greater distancebetween the COOH groups and therefore oc-curs more frequently. Biologically active mac-
romolecules such as proteins or nucleic acidsusually have well-defined (“native”) confor-mations, which are stabilized by interactionsin the molecule (see p. 74).
C. Optical isomers
Another type of isomerism arises when a mol-ecule contains a chiral center or is chiral as awhole. Chirality (from the Greek cheir, hand)leads to the appearance of structures thatbehave like image and mirror-image andthat cannot be superimposed (“mirror” iso-mers). The most frequent cause of chiral be-havior is the presence of an asymmetric Catom—i. e., an atom with four different sub-stituents. Then there are two forms (enan-tiomers) with different configurations. Usu-ally, the two enantiomers of a molecule aredesignated as L and D forms. Clear classifica-tion of the configuration is made possible bythe R/S system (see chemistry textbooks).
Enantiomers have very similar chemicalproperties, but they rotate polarized light inopposite directions (optical activity, seepp. 36, 58). The same applies to the enantiom-ers of lactic acid. The dextrorotatory L-lacticacid occurs in animal muscle and blood, whilethe D form produced by microorganisms isfound in milk products, for example (seep.148). The Fischer projection is often usedto represent the formulas for chiral centers(cf. p. 58).
D. The aconitase reaction
Enzymes usually function stereospecifically. Inchiral substrates, they only accept one of theenantiomers, and the reaction products areusually also sterically uniform. Aconitatehydratase (aconitase) catalyzes the conver-sion of citric acid into the constitution isomerisocitric acid (see p.136). Although citric acidis not chiral, aconitase only forms one of thefour possible isomeric forms of isocitric acid(2R,3S-isocitric acid). The intermediate of thereaction, the unsaturated tricarboxylic acidaconitate, only occurs in the cis form in thereaction. The trans form of aconitate is foundas a constituent of certain plants.
8 Basics
All rights reserved. Usage subject to terms and conditions of license.Koolman, Color Atlas of Biochemistry, 2nd edition © 2005 Thieme

HO
H
COO
CH3C
HO
H
COO
CH3C
53 °C
3.7
-2.5˚
53 °C
3.7
+ 2.5˚
2
3
1
1 1
H2O H2OC
C
OOC H
OOC CH2 COO
COO
C
C
H OH
H2C
OOC H
COO
COO
C
C
H H
H2C
OOC OH
COO
COO
C
CH3
HO H
OOC
C
CH3
H HO
D. The aconitase reaction
Citrate (prochiral) cis-Aconitate (intermediate product) (2R,3S)-Isocitrate
Aconitase 4.2.1.3trans-Aconitate occurs in plants
A. cis–trans isomers
C. Optical isomers
B. Conformers
Succinic acidConformation 1
SuccinicacidConformation 2
Fumaric acidFp. 287 °CpKa 3.0, 4.5
Maleic acidFp. 130 °CpKa 1.9, 6.5
Not rotatable Freely rotatable
Fischer projections
D-lactic acid
Fp.
pKa value
Specificrotation
L-lactic acid
Fp.
pKa value
Specificrotation In muscle, blood In milk products
L(S) D(R)
9Chemistry
All rights reserved. Usage subject to terms and conditions of license.Koolman, Color Atlas of Biochemistry, 2nd edition © 2005 Thieme

Biomolecules I
A. Important classes of compounds
Most biomolecules are derivatives of simplecompounds of the non-metals oxygen (O),hydrogen (H), nitrogen (N), sulfur (S), andphosphorus (P). The biochemically importantoxygen, nitrogen, and sulfur compounds canbe formally derived from their compoundswith hydrogen (i. e., H2O, NH3, and H2S). Inbiological systems, phosphorus is found al-most exclusively in derivatives of phosphoricacid, H3PO4.
If one or more of the hydrogen atoms of anon-metal hydride are replaced formally withanother group, R—e. g., alkyl residues—thenderived compounds of the type R-XHn–1,R-XHn–2-R, etc., are obtained. In this way,alcohols (R-OH) and ethers (R-O-R) are de-rived from water (H2O); primary amines (R-NH2), secondary amines (R-NH-R) and terti-ary amines (R-N-RR) amines are obtainedfrom ammonia (NH3); and thiols (R-SH) andthioethers (R-S-R) arise from hydrogen sul-fide (H2S). Polar groups such as -OH and -NH2
are found as substituents in many organiccompounds. As such groups are much morereactive than the hydrocarbon structures towhich they are attached, they are referred toas functional groups.
New functional groups can arise as a resultof oxidation of the compounds mentionedabove. For example, the oxidation of a thiolyields a disulfide (R-S-S-R). Double oxidationof a primary alcohol (R-CH2-OH) gives riseinitially to an aldehyde (R-C(O)-H), and thento a carboxylic acid (R-C(O)-OH). In contrast,the oxidation of a secondary alcohol yields aketone (R-C(O)-R). The carbonyl group (C=O)is characteristic of aldehydes and ketones.
The addition of an amine to the carbonylgroup of an aldehyde yields—after removal ofwater—an aldimine (not shown; see p.178).Aldimines are intermediates in amino acidmetabolism (see p.178) and serve to bondaldehydes to amino groups in proteins (seep. 62, for example). The addition of an alcoholto the carbonyl group of an aldehyde yields ahemiacetal (R-O-C(H)OH-R). The cyclic formsof sugars are well-known examples of hemi-
acetals (see p. 36). The oxidation of hemiace-tals produces carboxylic acid esters.
Very important compounds are the carbox-ylic acids and their derivatives, which can beformally obtained by exchanging the OHgroup for another group. In fact, derivativesof this type are formed by nucleophilic sub-stitutions of activated intermediate com-pounds and the release of water (see p.14).Carboxylic acid esters (R-O-CO-R) arise fromcarboxylic acids and alcohols. This group in-cludes the fats, for example (see p. 48). Sim-ilarly, a carboxylic acid and a thiol yield athioester (R-S-CO-R). Thioesters play an ex-tremely important role in carboxylic acid me-tabolism. The best-known compound of thistype is acetyl-coenzyme A (see p.12).
Carboxylic acids and primary amines reactto form carboxylic acid amides (R-NH-CO-R).The amino acid constituents of peptides andproteins are linked by carboxylic acid amidebonds, which are therefore also known aspeptide bonds (see p. 66).
Phosphoric acid, H3PO4, is a tribasic (three-protic) acid—i. e., it contains three hydroxylgroups able to donate H+ ions. At least oneof these three groups is fully dissociatedunder normal physiological conditions, whilethe other two can react with alcohols. Theresulting products are phosphoric acid mono-esters (R-O-P(O)O-OH) and diesters (R-O-P(O)O-O-R). Phosphoric acid monoesters arefound in carbohydrate metabolism, for exam-ple (see p. 36), whereas phosphoric aciddiester bonds occur in phospholipids (seep. 50) and nucleic acids (see p. 82 ).
Compounds of one acid with another arereferred to as acid anhydrides. A particularlylarge amount of energy is required for theformation of an acid—anhydride bond. Phos-phoric anhydride bonds therefore play a cen-tral role in the storage and release of chemicalenergy in the cell (see p.122). Mixed anhy-drides between carboxylic acids and phos-phoric acid are also very important “energy-rich metabolites” in cellular metabolism.
10 Basics
All rights reserved. Usage subject to terms and conditions of license.Koolman, Color Atlas of Biochemistry, 2nd edition © 2005 Thieme

O N
SP
HO
H
OH
CR
H
R'
RO
R'
O
CR R'
O
CH R'
O
PO
O
OR
H
OH
CO
H
R'R
O
CO R'
H
O
CO R'
R
O
PO
O
OH
H
O
PO
O
OR
C R'
O
O
PO
O
OR
P O
O
OH
N
H
R H
N
R''
R R'N
H
R R'
RN
CR'
H
O
SH H
SR H
SR
SR'
O
CS R'
R
N
H
H H
A. Important classes of compounds
HemiacetalCarboxylic acid amide
Phosphoricacid ester
Thioester
“energy-rich” bond
Water
Primaryalcohol
Ether
Oxygen
Secondaryalcohol
Amino group
Nitrogen
Primaryamine
Ammonia
Tertiaryamine
Secondaryamine
Thiol
Disulfide
Sulfur
Carboxylic acid ester
Dihydrogen phosphate
Ketone
Aldehyde
Carboxylic acid
Phosphoric acid anhydride
Mixed anhydride
Carbonyl group
Carboxyl group
Hydrogen sulfide
Sulfhydrylgroup
Phosphorus
Oxidation
Oxidation
OxidationO
H
CH
H
R'
11Chemistry
All rights reserved. Usage subject to terms and conditions of license.Koolman, Color Atlas of Biochemistry, 2nd edition © 2005 Thieme

Biomolecules II
Many biomolecules are made up of smallerunits in a modular fashion, and they can bebroken down into these units again. The con-struction of these molecules usually takesplace through condensation reactions involv-ing the removal of water. Conversely, theirbreakdown functions in a hydrolytic fash-ion—i. e., as a result of water uptake. Thepage opposite illustrates this modular princi-ple using the example of an important coen-zyme.
A. Acetyl CoA
Coenzyme A (see also p.106) is a nucleotidewith a complex structure (see p. 80). It servesto activate residues of carboxylic acids (acylresidues). Bonding of the carboxy group of thecarboxylic acid with the thiol group of thecoenzyme creates a thioester bond (-S-CO-R;see p.10) in which the acyl residue has a highchemical potential. It can therefore be trans-ferred to other molecules in exergonic reac-tions. This fact plays an important role in lipidmetabolism in particular (see pp.162ff.), aswell as in two reactions of the tricarboxylicacid cycle (see p.136).
As discussed on p.16, the group transferpotential can be expressed quantitatively asthe change in free enthalpy (∆G) during hy-drolysis of the compound concerned. This isan arbitrary determination, but it providesimportant indications of the chemical energystored in such a group. In the case of acetyl-CoA, the reaction to be considered is:
Acetyl CoA + H2O acetate + CoA
In standard conditions and at pH 7, thechange in the chemical potential G (∆G0, seep.18) in this reaction amounts to –32 kJ mol–1 and it is therefore as high as the ∆G0
of ATP hydrolysis (see p.18). In addition to the“energy-rich” thioester bond, acetyl-CoA alsohas seven other hydrolyzable bonds with dif-ferent degrees of stability. These bonds, andthe fragments that arise when they are hydro-lyzed, will be discussed here in sequence.
(1) The reactive thiol group of coenzyme Ais located in the part of the molecule that isderived from cysteamine. Cysteamine is a bio-
genic amine (see p. 62) formed by decarbox-ylation of the amino acid cysteine.
(2) The amino group of cysteamine isbound to the carboxy group of another bio-genic amine via an acid amide bond (-CO-NH-). β-Alanine arises through decarboxyla-tion of the amino acid aspartate, but it canalso be formed by breakdown of pyrimidinebases (see p.186).
(3) Another acid amide bond (-CO-NH-)creates the compound for the nextconstituent, pantoinate. This compound con-tains a chiral center and can therefore appearin two enantiomeric forms (see p. 8). In natu-ral coenzyme A, only one of the two forms isfound, the (R)-pantoinate. Human metabo-lism is not capable of producing pantoinateitself, and it therefore has to take up acompound of β-alanine and pantoinate—pantothenate (“pantothenic acid”)—in theform of a vitamin in food (see p. 366).
(4) The hydroxy group at C-4 of pantoinateis bound to a phosphate residue by an esterbond.
The section of the molecule discussed sofar represents a functional unit. In the cell, it isproduced from pantothenate. The moleculealso occurs in a protein-bound form as 4-phosphopantetheine in the enzyme fattyacid synthase (see p.168). In coenzyme A,however, it is bound to 3,5-adenosine di-phosphate.
(5) When two phosphate residues bond,they do not form an ester, but an “energy-rich” phosphoric acid anhydride bond, asalso occurs in other nucleoside phosphates.By contrast, (6) and (7) are ester bonds again.
(8) The base adenine is bound to C-1 ofribose by an N-glycosidic bond (see p. 36). Inaddition to C-2 to C-4, C-1 of ribose also rep-resents a chiral center. The -configuration isusually found in nucleotides.
12 Basics
All rights reserved. Usage subject to terms and conditions of license.Koolman, Color Atlas of Biochemistry, 2nd edition © 2005 Thieme

C H 3
C
S
O
C H 2
C H 2
N
C
C H 2
H
O
C H 2
NH
C
C
O
H OH
C
C H 2
C H 3H 3C
O
P
O
OO
P
O
OO
C H 2
O
H
H H
O OH
H
N
NN
HC
N
N H 2
P
O
OO
Ribose
A. Acetyl CoA
Acetate
Cysteamine
β-Alanine
Pantoinate
Phosphate
Phosphate
Phosphate
Thioester bond
Acid–amidebond
Phosphoric acidester bond
Phosphoric acidanhydride bond
Van der Waals model
Adenine
Energy-rich bond
Chiral centers
Acid–amide bond
Phosphoric acidester bond
Phosphoric acidester bond
N-glycosidic bond
13Chemistry
All rights reserved. Usage subject to terms and conditions of license.Koolman, Color Atlas of Biochemistry, 2nd edition © 2005 Thieme

Chemical reactions
Chemical reactions are processes in whichelectrons or groups of atoms are taken upinto molecules, exchanged between mole-cules, or shifted within molecules. Illustratedhere are the most important types of reactionin organic chemistry, using simple examples.Electron shifts are indicated by red arrows.
A. Redox reactions
In redox reactions (see also p. 32), electronsare transferred from one molecule (the reduc-ing agent) to another (the oxidizing agent).One or two protons are often also transferredin the process, but the decisive criterion forthe presence of a redox reaction is the elec-tron transfer. The reducing agent is oxidizedduring the reaction, and the oxidizing agent isreduced.
Fig. A shows the oxidation of an alcoholinto an aldehyde (1) and the reduction ofthe aldehyde to alcohol (2). In the process,one hydride ion is transferred (two electronsand one proton; see p. 32), which moves tothe oxidizing agent A in reaction 1. The super-fluous proton is bound by the catalytic effectof a base B. In the reduction of the aldehyde(2), A-H serves as the reducing agent and theacid H-B is involved as the catalyst.
B. Acid–base reactions
In contrast to redox reactions, only protontransfer takes place in acid–base reactions(see also p. 30). When an acid dissociates (1),water serves as a proton acceptor (i. e., as abase). Conversely, water has the function ofan acid in the protonation of a carboxylateanion (2).
C. Additions/eliminations
A reaction in which atoms or molecules aretaken up by a multiple bond is described asaddition. The converse of addition—i. e., theremoval of groups with the formation of adouble bond, is termed elimination. Whenwater is added to an alkene (1a), a proton isfirst transferred to the alkene. The unstablecarbenium cation that occurs as an intermedi-ate initially takes up water (not shown), be-fore the separation of a proton produces alco-
hol (1b). The elimination of water from thealcohol (2, dehydration) is also catalyzed byan acid and passes via the same intermediateas the addition reaction.
D. Nucleophilic substitutions
A reaction in which one functional group (seep.10) is replaced by another is termed substi-tution. Depending on the process involved, adistinction is made between nucleophilic andelectrophilic substitution reactions (seechemistry textbooks). Nucleophilic substitu-tions start with the addition of one moleculeto another, followed by elimination of the so-called leaving group.
The hydrolysis of an ester to alcohol andacid (1) and the esterification of a carboxylicacid with an alcohol (2) are shown here as anexample of the SN2 mechanism. Both reac-tions are made easier by the marked polarityof the C=O double bond. In the form of esterhydrolysis shown here, a proton is removedfrom a water molecule by the catalytic effectof the base B. The resulting strongly nucleo-philic OH– ion attacks the positively chargedcarbonyl C of the ester (1a), and an unstablesp3-hybridized transition state is produced.From this, either water is eliminated (2b)and the ester re-forms, or the alcohol ROH iseliminated (1b) and the free acid results. Inesterification (2), the same steps take place inreverse.
Further information
In rearrangements (isomerizations, notshown), groups are shifted within one andthe same molecule. Examples of this in bio-chemistry include the isomerization of sugarphosphates (see p. 36) and of methylmalonyl-CoA to succinyl CoA (see p.166).
14 Basics
All rights reserved. Usage subject to terms and conditions of license.Koolman, Color Atlas of Biochemistry, 2nd edition © 2005 Thieme

H B
R C O
O
OR'
H
O C
R' O
RB
B
HO
H
HO
H
BH
BH
R C O
O
OR'
H
R C
O
O H
H B
R C O
O
OR'
H
B
R C
O
O H
R' O
H
OH
H
R C
O
O H
R C
O
O H
H
OH
H
OHH
O HH
O H
H
O H
R C
O
O
R C
O
O
R C
O
O
H BBA A
H
H BBA H
A
OB
C
H
R
H
HA
R C
O
H
OC
H
R
H
H
R C
O
H
H BH
A
O C
R' O
R
HO
HB1a 1b
1a
2b
2b 2a
C C
R'
H
H
R
R C C
H
R'
H
H
B
B
HO
H
HO
H
BH
BH
R C C
H
R'
H
HOH
BH
BH
B
B
2b
1a
2a
1b
2
1
2
1
2
1
2
1
B R' O
H
BH
BR' O
HBH
1b
2a
B. Acid–base reactionsA. Redox reactions
C. Additions/eliminations
AlcoholCarbonium ion
Acid
Anion
Alcohol Aldehyde
D. Nucleophilic substitutions
Transitional state Carboxylicacid
Alcohol
Alcohol
Alkene
Ester
15Chemistry
All rights reserved. Usage subject to terms and conditions of license.Koolman, Color Atlas of Biochemistry, 2nd edition © 2005 Thieme

Energetics
To obtain a better understanding of the pro-cesses involved in energy storage and conver-sion in living cells, it may be useful first torecall the physical basis for these processes.
A. Forms of work
There is essentially no difference betweenwork and energy. Both are measured in joule(J = 1 N m). An outdated unit is the calorie(1 cal = 4.187 J). Energy is defined as the abil-ity of a system to perform work. There aremany different forms of energy—e. g., me-chanical, chemical, and radiation energy.
A system is capable of performing workwhen matter is moving along a potential gra-dient. This abstract definition is best under-stood by an example involving mechanicalwork (A1). Due to the earth’s gravitationalpull, the mechanical potential energy of anobject is the greater the further the object isaway from the center of the earth. A potentialdifference (∆P) therefore exists between ahigher location and a lower one. In a waterfall,the water spontaneously follows this poten-tial gradient and, in doing so, is able to per-form work—e. g., turning a mill.
Work and energy consist of two quantities:an intensity factor, which is a measure of thepotential difference—i. e., the “driving force”of the process—(here it is the height differ-ence) and a capacity factor, which is a mea-sure of the quantity of the substance beingtransported (here it is the weight of thewater). In the case of electrical work (A2),the intensity factor is the voltage—i. e., theelectrical potential difference between thesource of the electrical current and the“ground,” while the capacity factor is theamount of charge that is flowing.
Chemical work and chemical energy aredefined in an analogous way. The intensityfactor here is the chemical potential of a mol-ecule or combination of molecules. This isstated as free enthalpy G (also known as“Gibbs free energy”). When molecules spon-taneously react with one another, the result isproducts at lower potential. The difference inthe chemical potentials of the educts andproducts (the change in free enthalpy, G) isa measure of the “driving force” of the reac-tion. The capacity factor in chemical work is
the amount of matter reacting (in mol).Although absolute values for free enthalpy Gcannot be determined, ∆G can be calculatedfrom the equilibrium constant of the reaction(see p.18).
B. Energetics and the course of processes
Everyday experience shows that water neverflows uphill spontaneously. Whether a partic-ular process can occur spontaneously or notdepends on whether the potential differencebetween the final and the initial state, ∆P =P2 – P1, is positive or negative. If P2 is smallerthan P1, then ∆P will be negative, and theprocess will take place and perform work.Processes of this type are called exergonic(B1). If there is no potential difference, thenthe system is in equilibrium (B2). In the case ofendergonic processes, ∆P is positive (B3).Processes of this type do not proceed sponta-neously.
Forcing endergonic processes to take placerequires the use of the principle of energeticcoupling. This effect can be illustrated by amechanical analogy (B4). When two massesM1 and M2 are connected by a rope, M1 willmove upward even though this part of theprocess is endergonic. The sum of the twopotential differences (∆Peff = ∆P1 + ∆P2) isthe determining factor in coupled processes.When ∆Peff is negative, the entire process canproceed.
Energetic coupling makes it possible toconvert different forms of work and energyinto one another. For example, in a flashlight,an exergonic chemical reaction provides anelectrical voltage that can then be used forthe endergonic generation of light energy. Inthe luminescent organs of various animals, itis a chemical reaction that produces the light.In the musculature (see p. 336), chemical en-ergy is converted into mechanical work andheat energy. A form of storage for chemicalenergy that is used in all forms of life is aden-osine triphosphate (ATP; see p.122). Ender-gonic processes are usually driven by cou-pling to the strongly exergonic breakdownof ATP (see p.122).
16 Basics
All rights reserved. Usage subject to terms and conditions of license.Koolman, Color Atlas of Biochemistry, 2nd edition © 2005 Thieme

J = Joule = N · m =1 kg · m2 · s-2, 1 cal = 4.187 J
∆P
∆P1
∆P2
M1 M2
P3
P1
P2
P3
P1
P2
∆ Peff
∆P
·
A. Forms of work
Pote
ntia
lLo
wer
Hig
her Elevated position
Lower position
1. Mechanical work 3. Chemical work
Weight
Vol
tage
Ground
Charge
Voltagesource
2. Electrical work
Quantity
Products
Educts
Cha
nge
in fr
ee e
nerg
y (∆
G)
Hei
ght
∆P < 0
Potential
1. Exergonic
∆P = 0 ∆P > 0 ∆Peff < 0
Potential
2. Equilibrium 3. Endergonic 4. Energetically coupled
Coupled processes canoccur spontaneously
Form of work
Mechanical
Electrical
Chemical
Intensity factor
Height
Voltage
Free-enthalpychange ∆G
Unit
m
V =J · C -1
J · mol -1
Unit
J · m -1
C
mol
Work =
Height · Weight
Voltage · Charge
∆G · Quantity
Unit
J
J
J
Capacity factor
Weight
Charge
Quantity
B. Energetics and the course of processes
Process occursspontaneously
Process cannotoccur
17Physical Chemistry
All rights reserved. Usage subject to terms and conditions of license.Koolman, Color Atlas of Biochemistry, 2nd edition © 2005 Thieme

Equilibriums
A. Group transfer reactions
Every chemical reaction reaches after a time astate of equilibrium in which the forward andback reactions proceed at the same speed. Thelaw of mass action describes the concentra-tions of the educts (A, B) and products (C, D) inequilibrium. The equilibrium constant K is di-rectly related to ∆G0, the change in freeenthalpy G involved in the reaction (seep.16) under standard conditions (∆G0 = – R T ln K). For any given concentrations, thelower equation applies. At ∆G < 0, the reac-tion proceeds spontaneously for as long as ittakes for equilibrium to be reached (i. e., until∆G = 0). At ∆G > 0, a spontaneous reaction isno longer possible (endergonic case; seep.16). In biochemistry, ∆G is usually relatedto pH 7, and this is indicated by the “prime”symbol (∆G0 or ∆G).
As examples, we can look at two grouptransfer reactions (on the right). In ATP (seep.122), the terminal phosphate residue is at ahigh chemical potential. Its transfer to water(reaction a, below) is therefore strongly exer-gonic. The equilibrium of the reaction(∆G = 0; see p.122) is only reached whenmore than 99.9% of the originally availableATP has been hydrolyzed. ATP and similarcompounds have a high group transferpotential for phosphate residues. Quantita-tively, this is expressed as the G of hydrolysis(∆G0 = –32 kJ mol–1; see p.122).
In contrast, the endergonic transfer of am-monia (NH3) to glutamate (Glu, reaction b,∆G0 = +14 kJ mol–1) reaches equilibrium soquickly that only minimal amounts of theproduct glutamine (Gln) can be formed inthis way. The synthesis of glutamine fromthese preliminary stages is only possiblethrough energetic coupling (see pp.16, 124).
B. Redox reactions
The course of electron transfer reactions (re-dox reactions, see p.14) also follows the law ofmass action. For a single redox system (seep. 32), the Nernst equation applies (top). Theelectron transfer potential of a redox system(i. e., its tendency to give off or take up elec-trons) is given by its redox potential E (instandard conditions, E0 or E0). The lower the
redox potential of a system is, the higher thechemical potential of the transferred elec-trons. To describe reactions between two re-dox systems, ∆Ε—the difference between thetwo systems’ redox potentials—is usuallyused instead of ∆G. ∆G and ∆E have a simplerelationship, but opposite signs (below). Aredox reaction proceeds spontaneouslywhen ∆E > 0, i. e. ∆G < 0.
The right side of the illustration shows theway in which the redox potential E is depen-dent on the composition (the proportion ofthe reduced form as a %) in two biochemicallyimportant redox systems (pyruvate/lactateand NAD+/NADH+H+; see pp. 98, 104). In thestandard state (both systems reduced to 50%),electron transfer from lactate to NAD+ is notpossible, because ∆E is negative (∆E = –0.13 V,red arrow). By contrast, transfer can proceedsuccessfully if the pyruvate/lactate system isreduced to 98% and NAD+/NADH is 98% oxi-dized (green arrow, ∆E = +0.08 V).
C. Acid–base reactions
Pairs of conjugated acids and bases are alwaysinvolved in proton exchange reactions (seep. 30). The dissociation state of an acid–basepair depends on the H+ concentration. Usu-ally, it is not this concentration itself that isexpressed, but its negative decadic logarithm,the pH value. The connection between the pHvalue and the dissociation state is describedby the Henderson–Hasselbalch equation (be-low). As a measure of the proton transferpotential of an acid–base pair, its pKa valueis used—the negative logarithm of the acidconstant Ka (where “a” stands for acid).
The stronger an acid is, the lower its pKa
value. The acid of the pair with the lower pKa
value (the stronger acid—in this case aceticacid, CH3COOH) can protonate (green arrow)the base of the pair with the higher pKa (inthis case NH3), while ammonium acetate(NH4
+ and CH3COO–) only forms very littleCH3COOH and NH3.
18 Basics
All rights reserved. Usage subject to terms and conditions of license.Koolman, Color Atlas of Biochemistry, 2nd edition © 2005 Thieme

A + B C + D
K=
Ared Aox
a
b
HA + H2O
pH a
b
30
20
10
0
-10
-20
-30
-40
-500 20 40 60 80 100
∆G° = - R · T · ln K
[C] · [D]
[A] · [B]
[C] · [D]
[A] · [B]
R = 8.314 J · mol -1 · K-1
∆G = ∆G° + R · T · ln
∆G = – n · F · ∆E
∆E = EAcceptor – EDonor
∆E = ∆E° + · lnR · T
n · F[Box] ·[Bred]
[Ared]· [Aox]
A + H3O
pH = pKa + log[HA]
[A ]
∆G°(a)
∆G°(b)
∆E° (a)
∆Eº (b)
NAD /NADH+H
- 0.5
- 0.4
- 0.3
-0.2
- 0.1
0.0
0 20 40 60 80 100
pKa(a)
pKa(b)
NH4 /NH3
0
2
4
6
8
10
12
14
0 20 40 60 80 100
CH3 COOH/CH3COO
Glu + NH4 Gln + H2O
ATP + H2O ADP + Pi
E = E° + · lnR · Tn · F [Ared]
[Aox]
K =[HA] · [H2O]
[A ] · [H3O ]
Ka=[HA]
[A ] · [H ]
n = No. of electrons transferredF = Faraday constant
A. Group transfer reactions
Reaction
Law ofmass action
Only appliesin chemicalequilibrium
Relationshipbetween∆G0 and K
In any conditions
∆ G
(KJ/
mol
)
% converted
Equilibrium constantEqui-librium
Equi-librium
Measure of group transfer potential
B. Redox reactions
For a redoxsystem
For any redoxreaction
Redo
x po
tent
ial E
(V)
% reduced
Pyruvate/lactate
Standardreaction
Law of massaction
Simplified
Henderson–Hasselbalchequation
Definitionand sizes
% dissociated
C. Acid–base reactions
Measure of proton transfer potential
Measure of electron transfer potential
19Physical Chemistry
All rights reserved. Usage subject to terms and conditions of license.Koolman, Color Atlas of Biochemistry, 2nd edition © 2005 Thieme

Enthalpy and entropy
The change in the free enthalpy of a chemicalreaction (i. e., its ∆G) depends on a number offactors—e. g., the concentrations of the reac-tants and the temperature (see p.18). Twofurther factors associated with molecularchanges occurring during the reaction are dis-cussed here.
A. Heat of reaction and calorimetry
All chemical reactions involve heat exchange.Reactions that release heat are calledexothermic, and those that consume heatare called endothermic. Heat exchange ismeasured as the enthalpy change ∆H (theheat of reaction). This corresponds to theheat exchange at constant pressure. In exo-thermic reactions, the system loses heat, and∆H is negative. When the reaction is endo-thermic, the system gains heat, and ∆H be-comes positive.
In many reactions, ∆H and ∆G are similar inmagnitude (see B1, for example). This fact isused to estimate the caloric content of foods.In living organisms, nutrients are usually oxi-dized by oxygen to CO2 and H2O (see p.112).The maximum amount of chemical work sup-plied by a particular foodstuff (i. e., the ∆G forthe oxidation of the utilizable constituents)can be estimated by burning a weighedamount in a calorimeter in an oxygen atmo-sphere. The heat of the reaction increases thewater temperature in the calorimeter. Thereaction heat can then be calculated fromthe temperature difference ∆T.
B. Enthalpy and entropy
The reaction enthalpy ∆H and the change infree enthalpy ∆G are not always of the samemagnitude. There are even reactions that oc-cur spontaneously (∆G < 0) even though theyare endothermic (∆H > 0). The reason for thisis that changes in the degree of order of thesystem also strongly affect the progress of areaction. This change is measured as the en-tropy change ( S).
Entropy is a physical value that describesthe degree of order of a system. The lower thedegree of order, the larger the entropy. Thus,when a process leads to increase in disor-der—and everyday experience shows that
this is the normal state of affairs—∆S is pos-itive for this process. An increase in the orderin a system (∆S < 0) always requires an inputof energy. Both of these statements areconsequences of an important natural law,the Second Law of Thermodynamics. Theconnection between changes in enthalpyand entropy is described quantitatively bythe Gibbs–Helmholtz equation (∆G = ∆H –T ∆S). The following examples will helpexplain these relationships.
In the knall-gas (oxyhydrogen) reaction(1), gaseous oxygen and gaseous hydrogenreact to form liquid water. Like many redoxreactions, this reaction is strongly exothermic(i. e., ∆H < 0). However, during the reaction,the degree of order increases. The total num-ber of molecules is reduced by one-third, anda more highly ordered liquid is formed fromfreely moving gas molecules. As a result of theincrease in the degree of order (∆S < 0), theterm –T ∆S becomes positive. However, thisis more than compensated for by the decreasein enthalpy, and the reaction is still stronglyexergonic (∆G < 0).
The dissolution of salt in water (2) is endo-thermic (∆H > 0)—i. e., the liquid cools. Never-theless, the process still occurs spontane-ously, since the degree of order in thesystem decreases. The Na+ and Cl– ions areinitially rigidly fixed in a crystal lattice. Insolution, they move about independentlyand in random directions through the fluid.The decrease in order (∆S > 0) leads to anegative –T ∆S term, which compensatesfor the positive ∆H term and results in anegative ∆G term overall. Processes of thistype are described as being entropy-driven.The folding of proteins (see p. 74) and theformation of ordered lipid structures in water(see p. 28) are also mainly entropy-driven.
20 Basics
All rights reserved. Usage subject to terms and conditions of license.Koolman, Color Atlas of Biochemistry, 2nd edition © 2005 Thieme

1
2
3
4
5
6
1
2
3
4
5
6
∆H = - 287 kJ · mol -1
∆G = - 238 kJ · mol -1
-T · ∆S = +49 kJ · mol -1 -T · ∆S = - 12.8 kJ · mol -1
∆G = - 9.0 kJ · mol -1
∆H = +3.8 kJ · mol -1
O2
1
2
3
4
5
6
1
2
3
4
5
6
CO2
-200 -100 0 +100 +200 -12 -8 -4 0 +4 +8 +12
∆G = ∆H - T · ∆S
H2O
A. Heat of reaction and calorimetry
1. “Knall-gas” reaction 2. Dissolution of NaCl in water
Low degreeof order
System re-leases heat,∆H <0(exothermic)
1 mol H2O(liquid)
Higher degreeof order,∆S < 0
Lowerdegreeof order∆S > 0
1 mol Na1 mol Cl
Systemabsorbsheat,∆H > 0(endothermic)
High degreeof order
Ignition wireto start the reaction
Thermometer
Temperatureinsulation
Pressurizedmetalcontainer
Water
Sample
Stirrer
Waterheated
An enthalpy of1kJ warms 1 l of waterby 0.24 ºC
Combustion
1 mol H2 1 mol NaCl(crystalline)
∆H: changeof enthalpy,heat exchange
∆S: change ofentropy, i.e.degree of order
Gibbs-Helmholtz equation
1/2 mol O2
B. Enthalpy and entropy
Water
Energy Energy
21Physical Chemistry
All rights reserved. Usage subject to terms and conditions of license.Koolman, Color Atlas of Biochemistry, 2nd edition © 2005 Thieme

Reaction kinetics
The change in free enthalpy ∆G in a reactionindicates whether or not the reaction can takeplace spontaneously in given conditions andhow much work it can perform (see p.18).However, it does not tell us anything aboutthe rate of the reaction—i. e., its kinetics.
A. Activation energy
Most organic chemical reactions (with theexception of acid–base reactions) proceedonly very slowly, regardless of the valueof ∆G. The reason for the slow reaction rateis that the molecules that react—theeducts—have to have a certain minimum en-ergy before they can enter the reaction. This isbest understood with the help of an energydiagram (1) of the simplest possible reactionA B. The educt A and the product B are eachat a specific chemical potential (Ge and Gp,respectively). The change in the free enthalpyof the reaction, ∆G, corresponds to the differ-ence between these two potentials. To beconverted into B, A first has to overcome apotential energy barrier, the peak of which,Ga, lies well above Ge. The potential differenceGa –Ge is the activation energy Ea of the re-action (in kJ mol–1).
The fact that A can be converted into B at allis because the potential Ge only representsthe average potential of all the molecules.Individual molecules may occasionally reachmuch higher potentials—e. g., due to collisionswith other molecules. When the increase inenergy thus gained is greater than Ea, thesemolecules can overcome the barrier and beconverted into B. The energy distribution for agroup of molecules of this type, as calculatedfrom a simple model, is shown in (2) and (3).∆n/n is the fraction of molecules that havereached or exceeded energy E (in kJ per mol).At 27 °C, for example, approximately 10% ofthe molecules have energies > 6 kJ mol–1.The typical activation energies of chemicalreactions are much higher. The course ofthe energy function at energies of around50 kJ mol–1 is shown in (3). Statistically, at27 °C only two out of 109 molecules reach thisenergy. At 37 °C, the figure is already four.This is the basis for the long-familiar “Q10
law”—a rule of thumb that states that thespeed of biological processes approximately
doubles with an increase in temperature of10 °C.
B. Reaction rate
The velocity v of a chemical reaction is deter-mined experimentally by observing thechange in the concentration of an educt orproduct over time. In the example shown(again a reaction of the A B type), 3 mmolof the educt A is converted per second and3 mmol of the product B is formed per secondin one liter of the solution. This correspondsto a rate of
v = 3 mM s–1 = 3 10–3 mol L–1 s–1
C. Reaction order
Reaction rates are influenced not only by theactivation energy and the temperature, butalso by the concentrations of the reactants.When there is only one educt, A (1), v isproportional to the concentration [A] of thissubstance, and a first-order reaction is in-volved. When two educts, A and B, reactwith one another (2), it is a second orderreaction (shown on the right). In this case,the rate v is proportional to the product ofthe educt concentrations (12 mM2 at thetop, 24 mM2 in the middle, and 36 mM2 atthe bottom). The proportionality factors k andk are the rate constants of the reaction. Theyare not dependent on the reaction concentra-tions, but depend on the external conditionsfor the reaction, such as temperature.
In B, only the kinetics of simple irreversiblereactions is shown. More complicated cases,such as reaction with three or more reversiblesteps, can usually be broken down into first-order or second-order partial reactions anddescribed using the corresponding equations(for an example, see the Michaelis–Mentenreaction, p. 92).
22 Basics
All rights reserved. Usage subject to terms and conditions of license.Koolman, Color Atlas of Biochemistry, 2nd edition © 2005 Thieme

5
0 s 0 s 1 s
10
15
1
2
3
1
2
3
C1 s
1. 2.
0 s 1 s 3 s
1. 2. 3.
0.0 0.5 1.0 0 5 100
2
4
6
8
10 55
50
45
1. 2. 3.
[A] (mM)
A. Activation energy
B. Reaction rate
mM =mmol · l-1
Product B
Substrate A
Chemicalpotential
Ener
gy (k
J · m
ol-1
)
Activation energy
Ener
gy (k
J · m
ol-1
)
First-order reaction Second-order reaction
1 Liter
k = 1/5 s -1 k' = 1/12 l · mmol-1· s -1
k, k' : Rate constants
v (mM · s-1) (mM) v (mM · s-1)
v = k · [A] v = k' · [A] · [B]
C. Reaction order
Ea
∆G = Gp - Ge
Ga - Ge=
∆n/n ∆n/n · 109
27 ˚C
27˚C
37˚C
= 32 mM[A]0
= 3 mM[B]0
[A] = 23 mM∆[A] = -9 mM
[A] = 29 mM∆[A] = -3 mM
[B] = 6 mM∆[B] = 3 mM
[B] = 12 mM∆[B] = 9 mM
∆t = 1 s ∆t = 3 s
v = -∆ [A] / ∆t = ∆ [ B] / ∆t ( mol · l -1 · s -1 )
= 3[A]˚
= 12[A]˚= 1[B]˚
= 6[A]˚= 4[B]˚
= 12[B]˚
A C A B+
Ga
Ge
Gp
23Physical Chemistry
All rights reserved. Usage subject to terms and conditions of license.Koolman, Color Atlas of Biochemistry, 2nd edition © 2005 Thieme

Catalysis
Catalysts are substances that acceleratechemical reactions without themselves beingconsumed in the process. Since catalystsemerge from the catalyzed reaction withoutbeing changed, even small amounts are usu-ally suf cient to cause a powerful accelerationof the reaction. In the cell, enzymes (see p. 88)generally serve as catalysts. A few chemicalchanges are catalyzed by special RNA mole-cules, known as ribozymes (see p. 246).
A. Catalysis: principle
The reason for the slow rates of most reac-tions involving organic substances is the highactivation energy (see p. 22) that the reactingmolecules have to reach before they can react.In aqueous solution, a large proportion of theactivation energy is required to remove thehydration shells surrounding the educts. Dur-ing the course of a reaction, resonance-stabi-lized structures (see p. 4) are often tempora-rily suspended; this also requires energy. Thehighest point on the reaction coordinates cor-responds to an energetically unfavorable tran-sition state of this type (1).
A catalyst creates a new pathway for thereaction (2). When all of the transition statesarising have a lower activation energy thanthat of the uncatalyzed reaction, the reactionwill proceed more rapidly along the alterna-tive pathway, even when the number of in-termediates is greater. Since the startingpoints and end points are the same in bothroutes, the change in the enthalpy ∆G of thereaction is not influenced by the catalyst. Cat-alysts—including enzymes—are in principlenot capable of altering the equilibrium stateof the catalyzed reaction.
The often-heard statement that “a catalystreduces the activation energy of a reaction” isnot strictly correct, since a completely differentreaction takes place in the presence of a cata-lyst than in uncatalyzed conditions. However,its activation energy is lower than in the un-catalyzed reaction.
B. Catalysis of H2O2 – breakdown by iodide
As a simple example of a catalyzed reaction,we can look at the disproportionation of hy-drogen peroxide (H2O2) into oxygen andwater. In the uncatalyzed reaction (at thetop), an H2O2 molecule initially decays intoH2O and atomic oxygen (O), which then reactswith a second H2O2 molecule to form waterand molecular oxygen (O2). The activationenergy Ea required for this reaction is rela-tively high, at 75 kJ mol–1. In the presence ofiodide (I–) as a catalyst, the reaction takes adifferent course (bottom). The intermediatearising in this case is hypoiodide (OI–), whichalso forms H2O and O2 with another H2O2
molecule. In this step, the I– ion is releasedand can once again take part in the reaction.The lower activation energy of the reactioncatalyzed by iodide (Ea = 56 kJ mol–1)causes acceleration of the reaction by a factorof 2000, as the reaction rate depends expo-nentially on Ea (v ~ e–Ea/R T).
Free metal ions such as iron (Fe) and plat-inum (Pt) are also effective catalysts for thebreakdown of H2O2. Catalase (see p. 284), anenzyme that protects cells against the toxiceffects of hydrogen peroxide (see p. 284), ismuch more catalytically effective still. In theenzyme-catalyzed disproportionation, H2O2
is bound to the enzyme’s heme group, whereit is quickly converted to atomic oxygen andwater, supported by amino acid residues ofthe enzyme protein. The oxygen atom is tem-porarily bound to the central iron atom of theheme group, and then transferred from thereto the second H2O2 molecule. The activationenergy of the enzyme-catalyzed reaction isonly 23 kJ mol–1, which in comparison withthe uncatalyzed reaction leads to accelerationby a factor of 1.3 109.
Catalase is one of the most ef cient en-zymes there are. A single molecule can con-vert up to 108 (a hundred million) H2O2 mol-ecules per second.
24 Basics
All rights reserved. Usage subject to terms and conditions of license.Koolman, Color Atlas of Biochemistry, 2nd edition © 2005 Thieme

100
80
60
40
20
1a
1b
2b2a
A. Catalysis: principle
1. Energy profile without catalyst 2. Energy profile with catalyst
Substrates Products Substrates Products
B. Catalysis of H2O2 – breakdown by iodide
H2O2 H2O2 O2 H2O H2O+ + +1. Breakdown of hydrogen peroxide
H2O2
O2
H2O
O2
H2O2
Atomic oxygen
Catalyst (iodide)
Cat
alyz
edre
acti
onU
ncat
alyz
edre
acti
on
2. Catalyzed reactionHypoiodide
Uncatalyzed Iodide Catalase
3. Activation energies Active center of catalase
Relative velocity
E a (k
J · m
ol -1
)
H2O2
Heme
1300 000 000
2100
H2O
H2O2
H2O
∆G∆G Ea Ea1 Ea2
1
Ea
Ea
Ea
25Physical Chemistry
All rights reserved. Usage subject to terms and conditions of license.Koolman, Color Atlas of Biochemistry, 2nd edition © 2005 Thieme

Water as a solvent
Life as we know it evolved in water and is stillabsolutely dependent on it. The properties ofwater are therefore of fundamental impor-tance to all living things.
A. Water and methane
The special properties of water (H2O) becomeapparent when it is compared with methane(CH4). The two molecules have a similar massand size. Nevertheless, the boiling point ofwater is more than 250 °C above that ofmethane. At temperatures on the earth’s sur-face, water is liquid, whereas methane is gas-eous. The high boiling point of water resultsfrom its high vaporization enthalpy, which inturn is due to the fact that the density of theelectrons within the molecule is unevenlydistributed. Two corners of the tetrahedrally-shaped water molecule are occupied by un-shared electrons (green), and the other twoby hydrogen atoms. As a result, the H–O–Hbond has an angled shape. In addition, theO–H bonds are polarized due to the high elec-tronegativity of oxygen (see p. 6). One side ofthe molecule carries a partial charge (δ) ofabout –0.6 units, whereas the other is corre-spondingly positively charged. The spatialseparation of the positive and negativecharges gives the molecule the properties ofan electrical dipole. Water molecules aretherefore attracted to one another like tinymagnets, and are also connected by hydrogenbonds (B) (see p. 6). When liquid water vapor-izes, a large amount of energy has to be ex-pended to disrupt these interactions. By con-trast, methane molecules are not dipolar, andtherefore interact with one another onlyweakly. This is why liquid methane vaporizesat very low temperatures.
B. Structure of water and ice
The dipolar nature of water molecules favorsthe formation of hydrogen bonds (see p. 6).Each molecule can act either as a donor or anacceptor of H bonds, and many molecules inliquid water are therefore connected by Hbonds (1). The bonds are in a state of constantfluctuation. Tetrahedral networks of mole-cules, known as water “clusters,” often arise.As the temperature decreases, the proportion
of water clusters increases until the waterbegins to crystallize. Under normal atmo-spheric pressure, this occurs at 0 °C. In ice,most of the water molecules are fixed in ahexagonal lattice (3). Since the distance be-tween the individual molecules in the frozenstate is on average greater than in the liquidstate, the density of ice is lower than that ofliquid water. This fact is of immense biologicalimportance—it means, for example, that inwinter, ice forms on the surface of openstretches of water first, and the water rarelyfreezes to the bottom.
C. Hydration
In contrast to most other liquids, water is anexcellent solvent for ions. In the electricalfield of cations and anions, the dipolar watermolecules arrange themselves in a regularfashion corresponding to the charge of theion. They form hydration shells and shieldthe central ion from oppositely charged ions.Metal ions are therefore often present ashexahydrates ([Me(H2O)6
2+], on the right). Inthe inner hydration sphere of this type of ion,the water molecules are practically immobi-lized and follow the central ion. Water has ahigh dielectric constant of 78—i. e., the elec-trostatic attraction force between ions is re-duced to 1/78 by the solvent. Electricallycharged groups in organic molecules (e. g.,carboxylate, phosphate, and ammoniumgroups) are also well hydrated and contributeto water solubility. Neutral molecules withseveral hydroxy groups, such as glycerol (onthe left) or sugars, are also easily soluble,because they can form H bonds with watermolecules. The higher the proportion of polarfunctional groups there is in a molecule, themore water-soluble (hydrophilic) it is. By con-trast, molecules that consist exclusively ormainly of hydrocarbons are poorly soluble orinsoluble in water. These compounds arecalled hydrophobic (see p. 28).
26 Basics
All rights reserved. Usage subject to terms and conditions of license.Koolman, Color Atlas of Biochemistry, 2nd edition © 2005 Thieme

HO
HO
HO
1.
2. 3.
H
H
H
H
H
H
Density 0.92 g · cm-3
hexagonal lattice,stabilized by
hydrogen bonds
IceEthanol
A. Water and methane
B. Structure of water and ice
Anion
Cation
Glycerol
[Me (H2O)6]2
δ+0.3
δ-0.6
δ+0.3
H2O CH4
18 Da 16 Da
+100 °C -162 °C
41 8
6.2 0
Molecular mass
Boiling point
Heat ofvaporization
(kJ · mol-1)
Dipole moment (10-30 C · m)
Water (H2O) Methane (CH4)
C. Hydration
density 1.00 g · cm-3
short-lived clusters
Liquid water
27Physical Chemistry
All rights reserved. Usage subject to terms and conditions of license.Koolman, Color Atlas of Biochemistry, 2nd edition © 2005 Thieme

Hydrophobic interactions
Water is an excellent solvent for ions and forsubstances that contain polarized bonds (seep. 20). Substances of this type are referred toas polar or hydrophilic (“water-loving”). Incontrast, substances that consist mainly ofhydrocarbon structures dissolve only poorlyin water. Such substances are said to be apolaror hydrophobic.
A. Solubility of methane
To understand the reasons for the poor watersolubility of hydrocarbons, it is useful first toexamine the energetics (see p.16) of the pro-cesses involved. In (1), the individual terms ofthe Gibbs–Helmholtz equation (see p. 20) forthe simplest compound of this type, methane,are shown (see p. 4). As can be seen, the tran-sition from gaseous methane to water is ac-tually exothermic (∆H0 < 0). Nevertheless, thechange in the free enthalpy ∆G0 is positive(the process is endergonic), because the en-tropy term T ∆S0 has a strongly positivevalue. The entropy change in the process(∆S0) is evidently negative—i. e., a solution ofmethane in water has a higher degree of orderthan either water or gaseous methane. Onereason for this is that the methane moleculesare less mobile when surrounded by water.More importantly, however, the water aroundthe apolar molecules forms cage-like “clath-rate” structures, which—as in ice—are stabi-lized by H bonds. This strongly increases thedegree of order in the water—and the more sothe larger the area of surface contact betweenthe water and the apolar phase.
B. The “oil drop effect”
The spontaneous separation of oil and water,a familiar observation in everyday life, is dueto the energetically unfavorable formation ofclathrate structures. When a mixture of waterand oil is firmly shaken, lots of tiny oil dropsform to begin with, but these quickly coalescespontaneously to form larger drops—the twophases separate. A larger drop has a smallersurface area than several small drops with thesame volume. Separation therefore reducesthe area of surface contact between the waterand the oil, and consequently also the extentof clathrate formation. The ∆S for this process
is therefore positive (the disorder in the waterincreases), and the negative term –T ∆Smakes the separation process exergonic(∆G < 0), so that it proceeds spontaneously.
C. Arrangements of amphipathic substancesin water
Molecules that contain both polar and apolargroups are called amphipathic or amphiphilic.This group includes soaps (see p. 48), phos-pholipids (see p. 50), and bile acids (see p. 56).
As a result of the “oil drop effect” amphi-pathic substances in water tend to arrangethemselves in such a way as to minimize thearea of surface contact between the apolarregions of the molecule and water. On watersurfaces, they usually form single-layer films(top) in which the polar “head groups” facetoward the water. Soap bubbles (right) consistof double films, with a thin layer of waterenclosed between them. In water, dependingon their concentration, amphipathic com-pounds form micelles—i. e., spherical aggre-gates with their head groups facing towardthe outside, or extended bilayered doublemembranes. Most biological membranes areassembled according to this principle (seep. 214). Closed hollow membrane sacs areknown as vesicles. This type of structureserves to transport substances within cellsand in the blood (see p. 278).
The separation of oil and water (B) can beprevented by adding a strongly amphipathicsubstance. During shaking, a more or lessstable emulsion then forms, in which the sur-face of the oil drops is occupied by amphi-pathic molecules that provide it with polarproperties externally. The emulsification offats in food by bile acids and phospholipidsis a vital precondition for the digestion of fats(see p. 314).
28 Basics
All rights reserved. Usage subject to terms and conditions of license.Koolman, Color Atlas of Biochemistry, 2nd edition © 2005 Thieme

C. Arrangements of amphipathic substances in water
A. Solubility of methane B. The “oil drop effect”
Double membrane
Micelle
Surface film
Soap bubble
Ener
gy
1 x 10 mLSurface area:22 cm2
10 x 1 mLTotal surface area: 48 cm2
Clathratestructure
Clathratestructure
Water
Methane
Air
Air
4 – 5 nm
-T · ∆S0 =+39.6 kJ · mol-1
∆G0 =+26.4 kJ · mol-1
∆H0=-13.2 kJ · mol-1 ∆S > 0
-T · ∆S < 0
∆G < 0
Oil
Spontaneusseparation
Vesicle
0
Air
29Physical Chemistry
All rights reserved. Usage subject to terms and conditions of license.Koolman, Color Atlas of Biochemistry, 2nd edition © 2005 Thieme

Acids and bases
A. Acids and bases
In general, acids are defined as substancesthat can donate hydrogen ions (protons),while bases are compounds that accept pro-tons.
Water enhances the acidic or basic proper-ties of dissolved substances, as water itselfcan act as either an acid or a base. For exam-ple, when hydrogen chloride (HCl) is in aque-ous solution, it donates protons to the solvent(1). This results in the formation of chlorideions (Cl–) and protonated water molecules(hydronium ions, H3O+, usually simply re-ferred to as H+). The proton exchange be-tween HCl and water is virtually quantitative:in water, HCl behaves as a very strong acidwith a negative pKa value (see p.18).
Bases such as ammonia (NH3) take overprotons from water molecules. As a result ofthis, hydroxyl ions (OH–) and positivelycharged ammonium ions (NH4
+, 3) form. Hy-dronium and hydroxyl ions, like other ions,exist in water in hydrated rather than freeform (see p. 26).
Acid–base reactions always involve pairs ofacids and the associated conjugated bases(see p.18). The stronger the acid or base, theweaker the conjugate base or acid, respec-tively. For example, the very strongly acidichydrogen chloride belongs to the very weaklybasic chloride ion (1). The weakly acidic am-monium ion is conjugated with the moder-ately strong base ammonia (3).
The equilibrium constant K for the acid—base reaction between H2O molecules (2) isvery small. At 25 °C,
K = [H+] [OH–] / [H2O] = 2 10–16 mol L–1
In pure water, the concentration [H2O] ispractically constant at 55 mol L–1. Substitut-ing this value into the equation, it gives:
Kw = [H+] [OH–] = 1 10–14 mol L–1
The product [H+] [OH–]—the ion product ofwater—is constant even when additionalacid–base pairs are dissolved in the water.At 25 °C, pure water contains H+ and OH– atconcentrations of 1 10–7 mol L–1 each; it isneutral and has a pH value of exactly 7.
B. pH values in the organism
pH values in the cell and in the extracellularfluid are kept constant within narrow limits.In the blood, the pH value normally rangesonly between 7.35 and 7.45 (see p. 288). Thiscorresponds to a maximum change in the H+
concentration of ca. 30%. The pH value ofcytoplasm is slightly lower than that of blood,at 7.0–7.3. In lysosomes (see p. 234; pH4.5–5.5), the H+ concentration is several hun-dred times higher than in the cytoplasm. Inthe lumen of the gastrointestinal tract, whichforms part of the outside world relative to theorganism, and in the body’s excretion prod-ucts, the pH values are more variable. Ex-treme values are found in the stomach (ca.2) and in the small bowel (> 8). Since thekidney can excrete either acids or bases, de-pending on the state of the metabolism, thepH of urine has a particularly wide range ofvariation (4.8–7.5).
C. Buffers
Short–term pH changes in the organism arecushioned by buffer systems. These are mix-tures of a weak acid, HB, with its conjugatebase, B–, or of a weak base with its conjugateacid. This type of system can neutralize bothhydronium ions and hydroxyl ions.
In the first case (left), the base (B–) binds alarge proportion of the added protons (H+)and HB and water are formed. If hydroxylions (OH–) are added, they react with HB togive B– and water (right). In both cases, it isprimarily the [HB]/[B–] ratio that shifts, whilethe pH value only changes slightly. The titra-tion curve (top) shows that buffer systems aremost effective at the pH values that corre-spond to the pKa value of the acid. This iswhere the curve is at its steepest, so that thepH change, ∆pH, is at its smallest with a givenincrease ∆c in [H+] or [OH–]. In other words,the buffer capacity ∆c/ ∆pH is highest at thepKa value.
30 Basics
All rights reserved. Usage subject to terms and conditions of license.Koolman, Color Atlas of Biochemistry, 2nd edition © 2005 Thieme

3
2
1
2 3 4 5 6 7 8 9
HB
HB B
OHBH
% B
100
80
60
40
20
0
Cl
H
OH H
O
H
H
OH H
O
H
H
N
H
H H
H
OH H
OH
OH H
H
OH
H
NH
H
H
Cl
Gastric juice
Lysosomes
Sweat
Urine
Cytoplasm
Blood plasma
Small intestine
A. Acids and bases
HydrogenchlorideVery strong acid
WaterVery weak base
WaterVery weak acid
WaterVery weak base
WaterVery weak acid
AmmoniaStrong base
Chloride ionVery weak base
Hydronium ionVery strong acid
Hydroxyl ionVery strong base
Ammonium ionWeak acid
Hydronium ionVery strong acid
Hydroxyl ionVery strong base
Protonexchange
Protonexchange
Protonexchange
pKa = -7
pKa = 15.7
pKa = 9.2
Keq = 9 · 106 mol · l-1
Keq = 2 · 10-16 mol · l-1
Keq = 6 · 10-10 mol · l-1
C. BuffersB. pH values in the body
pH
Buffer solution:mixture of a weak acidwith the conjugate base
∆ pH
BasepKa
Acid
∆ pH pH
H2O H2O
BaseAcid
31Physical Chemistry
All rights reserved. Usage subject to terms and conditions of license.Koolman, Color Atlas of Biochemistry, 2nd edition © 2005 Thieme

Redox processes
A. Redox reactions
Redox reactions are chemical changes inwhich electrons are transferred from one re-action partner to another (1; see also p.18).Like acid–base reactions (see p. 30), redox re-actions always involve pairs of compounds. Apair of this type is referred to as a redoxsystem (2). The essential difference betweenthe two components of a redox system is thenumber of electrons they contain. The moreelectronrich component is called the reducedform of the compound concerned, while theother one is referred to as the oxidized form.The reduced form of one system (the reducingagent) donates electrons to the oxidized formof another one (the oxidizing agent). In theprocess, the reducing agent becomes oxidizedand the oxidizing agent is reduced (3). Anygiven reducing agent can reduce only certainother redox systems. On the basis of this typeof observation, redox systems can be ar-ranged to form what are known as redoxseries (4).
The position of a system within one ofthese series is established by its redoxpotential E (see p.18). The redox potentialhas a sign; it can be more negative or morepositive than a reference potential arbitrarilyset at zero (the normal potential of the system[2 H+/H2]). In addition, E depends on the con-centrations of the reactants and on the reac-tion conditions (see p.18). In redox series (4),the systems are arranged according to theirincreasing redox potentials. Spontaneouselectron transfers are only possible if the re-dox potential of the donor is more negativethan that of the acceptor (see p.18).
B. Reduction equivalents
In redox reactions, protons (H+) are oftentransferred along with electrons (e–), or pro-tons may be released. The combinations ofelectrons and protons that occur in redoxprocesses are summed up in the term reduc-tion equivalents. For example, the combina-tion 1 e–/1 H+ corresponds to a hydrogenatom, while 2 e– and 2 H+ together producea hydrogen molecule. However, this does notmean that atomic or molecular hydrogen isactually transferred from one molecule to the
other (see below). Only the combination 2 e–/1 H+, the hydride ion, is transferred as a unit.
C. Biological redox systems
In the cell, redox reactions are catalyzed byenzymes, which work together with solubleor bound redox cofactors.
Some of these factors contain metal ions asredox-active components. In these cases, it isusually single electrons that are transferred,with the metal ion changing its valency. Un-paired electrons often occur in this process,but these are located in d orbitals (see p. 2)and are therefore less dangerous than singleelectrons in non-metal atoms (“free radicals”;see below).
We can only show here a few examplesfrom the many organic redox systems thatare found. In the complete reduction of theflavin coenzymes FMN and FAD (see p.104),2 e– and 2 H+ are transferred. This occurs intwo separate steps, with a semiquinone radi-cal appearing as an intermediate. Since or-ganic radicals of this type can cause damageto biomolecules, flavin coenzymes never oc-cur freely in solution, but remain firmlybound in the interior of proteins.
In the reduction or oxidation of quinone/quinol systems, free radicals also appear asintermediate steps, but these are less reactivethan flavin radicals. Vitamin E, another qui-none-type redox system (see p.104), evenfunctions as a radical scavenger, by delocaliz-ing unpaired electrons so effectively that theycan no longer react with other molecules.
The pyridine nucleotides NAD+ and NADP+
always function in unbound form. The oxi-dized forms contain an aromatic nicotinamidering in which the positive charge is delocal-ized. The right-hand example of the two res-onance structures shown contains an elec-tron-poor, positively charged C atom at thepara position to nitrogen. If a hydride ion isadded at this point (see above), the reducedforms NADH or NADPH arise. No radical inter-mediate steps occur. Because a proton is re-leased at the same time, the reduced pyridinenucleotide coenzymes are correctly expressedas NAD(P)H+H+.
32 Basics
All rights reserved. Usage subject to terms and conditions of license.Koolman, Color Atlas of Biochemistry, 2nd edition © 2005 Thieme

Men+ Mem+
2e2e
2e
2e
O O
H
H
H O
H
O H
H
N
N NC
NHCH3C
H3C
R
O
O
N
N NC
NHCH3C
H3C
R
O
O
H
H
N
N NC
NHCH3C
H3C
R
O
O
H
2e 2H2e1H1e1e 1H
e [H] H [H2]
1e
1H
C
C
H
R
O
H3CO
H3CO
O
C
C
H
R
OH
H3CO
H3CO
O OH
C
C
H
R
OH
H3CO
H3CO
e
H
e
H
e
H
e
H
e
H
O O O O
H e
H
e
He
H
O
H
C
N
CONH
H
HH 2
H
R
H
HN A
N A
P
F A
F
e
1e
1H
C
N
CONH
H
H
H 2
H
R
C
N
CONH
H
H
H 2
H
R
A. Redox reactions
Redoxsystem
C
Redoxsystem
B
Electronexchange
A red B ox
A ox B red
1. Principle
Redoxsystem
A
2. Redox systems
Oxidizingagent
Reducingagentbecomes
reduced
becomesoxidized
4. Redox series3. Possible electron3. transfers
PossibleNotpossible
Transferredcomponents
Equivalent Electron Hydrogen atom Hydride ion Hydrogen molecule
Metalcomplexes
Oxidized Reduced
Flavin
Quinone/hydro-quinone
Reactiveoxygenspecies(ROS)
Oxidized flavin Semiquinone radical Reduced flavin
p-Benzoquinone Semiquinone radical HydroquinoneWater
OxygenHydroperoxylradical
Hydrogenperoxide
Hydroxyl radical Water
C. Biological redox systems
NAD (P) NAD(P)H + H
Hydride ionElectron-poor
B. Reducing equivalents
NAD(P) (Resonance structures)
33Physical Chemistry
All rights reserved. Usage subject to terms and conditions of license.Koolman, Color Atlas of Biochemistry, 2nd edition © 2005 Thieme

Overview
The carbohydrates are a group of naturallyoccurring carbonyl compounds (aldehydesor ketones) that also contain several hydroxylgroups. The carbohydrates include single sug-ars (monosaccharides) and their polymers,the oligosaccharides and polysaccharides.
A. Carbohydrates: overview
Polymeric carbohydrates–above all starch, aswell as some disaccharides–are important(but not essential) components of food (seep. 360). In the gut, they are broken down intomonosaccharides and resorbed in this form(see p. 272). The form in which carbohydratesare distributed by the blood of vertebrates isglucose (“blood sugar”). This is taken up by thecells and either broken down to obtain energy(glycolysis) or converted into other metabo-lites (see pp.150–159). Several organs (partic-ularly the liver and muscles) store glycogen asa polymeric reserve carbohydrate (right; seep.156). The glycogen molecules are covalentlybound to a protein, glycogenin. Polysaccha-rides are used by many organisms as buildingmaterials. For example, the cell walls of bac-teria contain murein as a stabilizing compo-nent (see p. 40), while in plants cellulose andother polysaccharides fulfill this role (seep. 42). Oligomeric or polymeric carbohydratesare often covalently bound to lipids or pro-teins. The glycolipids and glycoproteinsformed in this way are found, for example,in cell membranes (center). Glycoproteinsalso occur in the blood in solute form (plasmaproteins; see p. 276) and, as components ofproteoglycans, form important constituents ofthe intercellular substance (see p. 346).
B. Monosaccharides: structure
The most important natural monosaccharide,D-glucose, is an aliphatic aldehyde with six Catoms, five of which carry a hydroxyl group(1). Since C atoms 2 to 5 represent chiralcenters (see p. 8), there are 15 furtherisomeric aldohexoses in addition to D-glucose,although only a few of these are important innature (see p. 38). Most natural monosaccha-rides have the same configuration at C-5 asD-glyceraldehyde–they belong to the D series.
The open-chained form of glucose shownin (1) is found in neutral solution in less than0.1% of the molecules. The reason for this is anintramolecular reaction in which one of theOH groups of the sugar is added to the alde-hyde group of the same molecule (2). Thisgives rise to a cyclic hemiacetal (see p.10). Inaldohexoses, the hydroxy group at C-5 reactspreferentially, and a six-membered pyranring is formed. Sugars that contain this ringare called pyranoses. By contrast, if the OHgroup at C-4 reacts, a five-part furan ring isformed. In solution, pyranose forms andfuranose forms are present in equilibriumwith each other and with the open-chainedform, while in glucose polymers only thepyranose form occurs.
The Haworth projection (2) is usually usedto depict sugars in the cyclic form, with thering being shown in perspective as viewedfrom above. Depending on the configuration,the substituents of the chiral C atoms are thenfound above or below the ring. OH groupsthat lie on the right in the Fischer projection(1) appear under the ring level in the Haworthprojection, while those on the left appearabove it.
As a result of hemiacetal formation, an ad-ditional chiral center arises at C-1, which canbe present in both possible configurations(anomers) (see p. 8). To emphasize this, thecorresponding bonds are shown here usingwavy lines.
The Haworth formula does not take ac-count of the fact that the pyran ring is notplain, but usually has a chair conformation. InB3, two frequent conformations of D-glucopy-ranose are shown as ball-and-stick models. Inthe 1C4 conformation (bottom), most of theOH groups appear vertical to the ring level, asin the Haworth projection (axial or a posi-tion). In the slightly more stable 4C1 confor-mation (top), the OH groups take the equato-rial or e position. At room temperature, eachform can change into the other, as well as intoother conformations.
34 Biomolecules
All rights reserved. Usage subject to terms and conditions of license.Koolman, Color Atlas of Biochemistry, 2nd edition © 2005 Thieme

1
2
3
4
5
6
123
4
5
6OH
C
HO
OH
OH
H
O
H
H
HH
CH2HO
H
HO
CH2OH
O
OH H
H OH
HOH
H
1
4
1
4
C
C
H O
C
OHH
C
HHO
C
OHH
CH2OH
OHH
OCHO
OH H
H OH
H
H
CH2OH
H
OH O
HO
OH
OH
H
H
H
H
OHH
CH2HO
Glycoproteins
Glycolipids
Mono-saccharide
TransporterOther monosaccharides
Glucose
Pyruvate
ATP
Aminoacids
CO2+H2O
Glycogen
Bacterium
Periplasm
Peptidoglycan(Murein) Proteoglycans
A. Carbohydrates: overview
B. Monosaccharides: structure
Glycogenin
Gluconeo-genesisGlycolysis
Open-chainedform of glucose
Chiralcenter
1. Fischer projection 2. Ring forms (Haworth projection) 3. Conformations
Open-chainedform (< 0.1%)
D-Gluco-furanose (<1%)
D-Gluco-pyranose (99%)
4C1-conformation
1C4-conformation
Hemiacetal formation
35Carbohydrates
All rights reserved. Usage subject to terms and conditions of license.Koolman, Color Atlas of Biochemistry, 2nd edition © 2005 Thieme

Chemistry of sugars
A. Reactions of the monosaccharides
The sugars (monosaccharides) occur in themetabolism in many forms (derivatives).Only a few important conversion reactionsare discussed here, using D-glucose as an ex-ample.
1. Mutarotation. In the cyclic form, as op-posed to the open-chain form, aldoses have achiral center at C-1 (see p. 34). The corre-sponding isomeric forms are called anomers.In the β-anomer (center left), the OH group atC-1 (the anomeric OH group) and the CH2OHgroup lie on the same side of the ring. In the α-anomer (right), they are on different sides.The reaction that interconverts anomers intoeach other is known as mutarotation (B).
2. Glycoside formation. When the anome-ric OH group of a sugar reacts with an alcohol,with elimination of water, it yields anO–glycoside (in the case shown, α –methylglu-coside). The glycosidic bond is not a normalether bond, because the OH group at C-1 has ahemiacetal quality. Oligosaccharides and pol-ysaccharides also contain O-glycosidic bonds.Reaction of the anomeric OH group with anNH2 or NH group yields an N-glycoside (notshown). N-glycosidic bonds occur in nucleo-tides (see p. 80) and in glycoproteins (seep. 44), for example.
3. Reduction and oxidation. Reduction ofthe anomeric center at C-1 of glucose (2) pro-duces the sugar alcohol sorbitol. Oxidation ofthe aldehyde group at C-1 gives the intramo-lecular ester (lactone) of gluconic acid (a gly-conic acid). Phosphorylated gluconolactone isan intermediate of the pentose phosphatepathway (see p.152). When glucose is oxi-dized at C-6, glucuronic acid (a glycuronicacid) is formed. The strongly polar glucuronicacid plays an important role in biotransforma-tions in the liver (see pp.194, 316).
4. Epimerization. In weakly alkaline solu-tions, glucose is in equilibrium with theketohexose D-fructose and the aldohexose D-mannose, via an enediol intermediate (notshown). The only difference between glucoseand mannose is the configuration at C-2. Pairsof sugars of this type are referred to as epi-mers, and their interconversion is called epi-merization.
5. Esterification. The hydroxyl groups ofmonosaccharides can form esters with acids.In metabolism, phosphoric acid esters such asglucose 6-phosphate and glucose 1-phosphate(6) are particularly important.
B. Polarimetry, mutarotation
Sugar solutions can be analyzed by polarim-etry, a method based on the interaction be-tween chiral centers and linearly polarizedlight—i. e., light that oscillates in only oneplane. It can be produced by passing normallight through a special filter (a polarizer). Asecond polarizing filter of the same type (theanalyzer), placed behind the first, only lets thepolarized light pass through when the polar-izer and the analyzer are in alignment. In thiscase, the field of view appears bright whenone looks through the analyzer (1). Solutionsof chiral substances rotate the plane of polar-ized light by an angle α either to the left or tothe right. When a solution of this type isplaced between the polarizer and the ana-lyzer, the field of view appears darker (2).The angle of rotation, α, is determined byturning the analyzer until the field of viewbecomes bright again (3). A solution’s opticalrotation depends on the type of chiral com-pound, its concentration, and the thickness ofthe layer of the solution. This method makes itpossible to determine the sugar content ofwines, for example.
Certain procedures make it possible to ob-tain the α and β anomers of glucose in pureform. A 1-molar solution of α-D-glucose has arotation value [α]D of +112°, while a corre-sponding solution of β-D-glucose has a valueof +19°. These values change spontaneously,however, and after a certain time reach thesame end point of +52°. The reason for this isthat, in solution, mutarotation leads to anequilibrium between the α and β forms inwhich, independently of the starting condi-tions, 62% of the molecules are present in theβ form and 38% in the α form.
36 Biomolecules
All rights reserved. Usage subject to terms and conditions of license.Koolman, Color Atlas of Biochemistry, 2nd edition © 2005 Thieme

1
6
1
23
6
α
β
1
α
1
1
100
80
60
40
20
0
1.
2.
3.
a
a
10 20 4030 50
2
1
O
HO
OH
OH
H
H
HH
COO
OH
H
O
HO
OH
OH
H
H
HH
O
HOCH2
OH
CH2OH
HO
OH
OH
H
H
HH
HOCH2
O
HO
OH
OH
H
H
HH
OH
H
CH2HO
O
HO
OH
OH
H
H
HH
H
OH
CH2HO
O
HO
OH
OH
H
H
HH
OH
H
CH2OPO
O
O O
HO
H
H
HO
OH
HH
CH2OH
OH
H
O
HO
OH
H
HO
H
HH
H
OH
HOCH2
O
HO
OH
OH
H
H
HH
H
O CH3
HOCH2
A. Reactions of the monosaccharides
B. Polarimetry, mutarotation
Polarizer Analyzer
α (˚)
62% β
38% α
α-D-Glucose: [ α ]D = +112°
β-D-Glucose: [α]D = +19°
Time (min)
Suga
rW
ater
Suga
r
β-D-Glucose α-D-Glucose
Mutarotation
Esterification
α-Methyl-glucoside
Glycoside formation
D-FructoseGlucose 6-phosphate
α-D-Mannose
Epimerization
SorbitolGlucuronate Gluconolactone
Oxidation ReductionOxidation
+ 52°
37Carbohydrates
All rights reserved. Usage subject to terms and conditions of license.Koolman, Color Atlas of Biochemistry, 2nd edition © 2005 Thieme

Monosaccharides and disaccharides
A. Important monosaccharides
Only the most important of the large numberof naturally occurring monosaccharides arementioned here. They are classified accordingto the number of C atoms (into pentoses,hexoses, etc.) and according to the chemicalnature of the carbonyl function into aldosesand ketoses.
The best-known aldopentose (1), D-ribose,is a component of RNA and of nucleotidecoenzymes and is widely distributed. In thesecompounds, ribose always exists in the fura-nose form (see p. 34). Like ribose, D-xylose andL-arabinose are rarely found in free form.However, large amounts of both sugars arefound as constituents of polysaccharides inthe walls of plant cells (see p. 42).
The most important of the aldohexoses (1)is D-glucose. A substantial proportion of thebiomass is accounted for by glucose polymers,above all cellulose and starch. Free D-glucoseis found in plant juices (“grape sugar”) and as“blood sugar” in the blood of higher animals.As a constituent of lactose (milk sugar), D-galactose is part of the human diet. Togetherwith D-mannose, galactose is also found inglycolipids and glycoproteins (see p. 44).
Phosphoric acid esters of the ketopentoseD-ribulose (2) are intermediates in the pen-tose phosphate pathway (see p.152) and inphotosynthesis (see p.128). The most widelydistributed of the ketohexoses is D-fructose. Infree form, it is present in fruit juices and inhoney. Bound fructose is found in sucrose (B)and plant polysaccharides (e. g., inulin).
In the deoxyaldoses (3), an OH group isreplaced by a hydrogen atom. In addition to2-deoxy-D-ribose, a component of DNA (seep. 84) that is reduced at C-2, L-fucose is shownas another example of these. Fucose, a sugarin the λ series (see p. 34) is reduced at C-6.
The acetylated amino sugars N-acetyl-D-glucosamine and N-acetyl-D-Galactosamine(4) are often encountered as components ofglycoproteins.
N-acetylneuraminic acid (sialic acid, 5), is acharacteristic component of glycoproteins.Other acidic monosaccharides such as D-glu-curonic acid, D-galacturonic acid, and liduronicacid, are typical constituents of the glycosa-minoglycans found in connective tissue.
Sugar alcohols (6) such as sorbitol andmannitol do not play an important role inanimal metabolism.
B. Disaccharides
When the anomeric hydroxyl group of onemonosaccharide is bound glycosidically withone of the OH groups of another, a disaccha-ride is formed. As in all glycosides, the glyco-sidic bond does not allow mutarotation. Sincethis type of bond is formed stereospecificallyby enzymes in natural disaccharides, they areonly found in one of the possible configura-tions (α or β).
Maltose (1) occurs as a breakdown productof the starches contained in malt (“maltsugar”; see p.148) and as an intermediate inintestinal digestion. In maltose, the anomericOH group of one glucose molecule has an α-glycosidic bond with C-4 in a second glucoseresidue.
Lactose (“milk sugar,” 2) is the most impor-tant carbohydrate in the milk of mammals.Cow’s milk contains 4.5% lactose, while hu-man milk contains up to 7.5%. In lactose, theanomeric OH group of galactose forms a β-glycosidic bond with C-4 of a glucose. Thelactose molecule is consequently elongated,and both of its pyran rings lie in the sameplane.
Sucrose (3) serves in plants as the form inwhich carbohydrates are transported, and as asoluble carbohydrate reserve. Humans valueit because of its intensely sweet taste. Sourcesused for sucrose are plants that contain par-ticularly high amounts of it, such as sugarcane and sugar beet (cane sugar, beet sugar).Enzymatic hydrolysis of sucrose-containingflower nectar in the digestive tract of bees—catalyzed by the enzyme invertase—produceshoney, a mixture of glucose and fructose. Insucrose, the two anomeric OH groups of glu-cose and fructose have a glycosidic bond; su-crose is therefore one of the non-reducingsugars.
38 Biomolecules
All rights reserved. Usage subject to terms and conditions of license.Koolman, Color Atlas of Biochemistry, 2nd edition © 2005 Thieme

Pentoses
1 2
3 4
5 6
2
3
4
6
2
5
6
6
2
2 7
9
4 2141 1
α
β
α β
OCH2
H H
OH OH
H
OH
HOO
CH2
OH H
H OH
H
OH
HOO
H
OH H
H OH
HOH2C
OH
O
HO
OH
H
HO
H
H
OHH
HOCH2
O
HO
OH
OH
H
H
H
OHH
HOCH2
O
H
OH
OH
H
H
HO
OHH
HOCH2
OH
H H
OH OH
HCH2OH
OH
CH2OH
C
C
O
C
OHH
CH2OH
OHH
OHOCH2
H HO
OH H
HCH2OH
OH
CH2OH
C
C
O
C
HHO
C
OHH
CH2OH
OHH
O
HO
OH
HN
H
H
H
OHH
C CH3
O
HOCH2
O
H
OH
HN
H
H
HO
OHH
C CH3
O
HOCH2
O
HO
H
H
HO
OH
H
OHCH3
H
O
HO
OH
OH
H
H
H
OHH
COO
O
HO
OH
OH
H
H
H
OH
H
COOO
H
OH
HN
H
H
HCOO
HC
HC CH3
O
HHO
CHO H
CH2OH
CH2OH
C
C
H
C
HHO
C
OHH
CH2OH
OHH
HO
CH2OH
C
C
OH
C
H
C
OHH
CH2OH
OHH
H
HO
O
OH
OH
H
H
H
OHH
CH2OH
O
HO
OH
OH
H
H
HH
CH2OH
H
O
O
OH
OH
H
H
H
OHH
CH2OH
O
H
OH
OH
H
H
HOH
CH2OH
H
O
O
HO
OH
OH
H
H
HH
CH2OH
H
O
OH HO
OH H
CH2OH H
CH2OH
OCH2
H H
OH H
H
OH
HO
A. Important monosaccharides
Aldoses
D-Ribose (Rib)
Ketoses
D-Fructose (Fru)
Deoxyaldoses
2-Deoxy-D-ribose (dRib)
L-Fucose (Fuc)
Acetylated amino sugars
N -Acetyl-D-galac-tosamine (GalNAc)
N-Acetyl-D-glucos-amine (GlcNAc)
L-Arabinose (Ara)D-Xylose (Xyl)
D-Glucose (Glc) D-Galactose (Gal)D-Mannose (Man)
D-MannitolD-Sorbitol
N-Acetylneuraminic acid(NeuAc)
L-Iduronic acid(IduUA)
D-Glucuronic acid(GlcUA)
Acidic monosaccharides Sugar alcohols (alditoles)
1. Maltoseα-D-Glucopyranosyl-(1 4)-D-glucopyranose
2. Lactoseβ-D-Galactopyranosyl-(1 4)-D-glucopyranose
3. Sucroseα-D-Glucopyranosyl-(1 2)-β-D-fructofuranoside
B. Disaccharides
D-Ribulose (Rub)
Hexoses
39Carbohydrates
All rights reserved. Usage subject to terms and conditions of license.Koolman, Color Atlas of Biochemistry, 2nd edition © 2005 Thieme

Polysaccharides: overview
Polysaccharides are ubiquitous in nature.They can be classified into three separategroups, based on their different functions.Structural polysaccharides provide mechani-cal stability to cells, organs, and organisms.Waterbinding polysaccharides are stronglyhydrated and prevent cells and tissues fromdrying out. Finally, reserve polysaccharidesserve as carbohydrate stores that releasemonosaccharides as required. Due to theirpolymeric nature, reserve carbohydrates areosmotically less active, and they can thereforebe stored in large quantities within the cell.
A. Polysaccharides: structure
Polysaccharides that are formed from onlyone type of monosaccharide are called homo-glycans, while those formed from differentsugar constituents are called heteroglycans.Both forms can exist as either linear orbranched chains.
A section of a glycogen molecule is shownhere as an example of a branched homogly-can. Amylopectin, the branched component ofvegetable starch (see p. 42), has a very similarstructure. Both molecules mainly consist ofα14-linked glucose residues. In glycogen,on average every 8th to 10th residue car-ries —via an α16 bond—another 1,4-linkedchain of glucose residues. This gives rise tobranched, tree-like structures, which in ani-mal glycogen are covalently bound to aprotein, glycogenin (see p.156).
The linear heteroglycan murein, a struc-tural polysaccharide that stabilizes the cellwalls of bacteria, has a more complex struc-ture. Only a short segment of this thread-likemolecule is shown here. In murein, two differ-ent components, both β14-linked, alter-nate: N-acetylglucosamine (GlcNAc) andN-acetylmuraminic acid (MurNAc), a lacticacid ether of N-acetylglucosamine. Peptidesare bound to the carboxyl group of the lactylgroups, and attach the individual strands ofmurein to each other to form a three-dimen-sional network (not shown). Synthesis of thenetwork-forming peptides in murein is inhib-ited by penicillin (see p. 254).
B. Important polysaccharides
The table gives an overview of the composi-tion and make-up both of the glycans men-tioned above and of several more.
In addition to murein, bacterial polysac-charides include dextrans—glucose polymersthat are mostly α16-linked and α13-branched. In water, dextrans form viscousslimes or gels that are used for chromato-graphic separation of macromolecules afterchemical treatment (see p. 78). Dextrans arealso used as components of blood plasmasubstitutes (plasma expanders) and food-stuffs.
Carbohydrates from algae (e. g., agaroseand carrageenan) can also be used to producegels. Agarose has been used in microbiologyfor more than 100 years to reinforce culturemedia (“agar-agar”). Algal polysaccharides arealso added to cosmetics and ready-madefoods to modify the consistency of these prod-ucts.
The starches, the most important vegetablereserve carbohydrate and polysaccharidesfrom plant cell walls, are discussed in greaterdetail on the following page. Inulin, a fructosepolymer, is used as a starch substitute in dia-betics’ dietary products (see p.160). In addi-tion, it serves as a test substance for measur-ing renal clearance (see p. 322).
Chitin, a homopolymer from β14-linkedN-acetylglucosamine, is the most importantstructural substance in insect and crustaceanshells, and is thus the most common animalpolysaccharide. It also occurs in the cell wallof fungi.
Glycogen, the reserve carbohydrate ofhigher animals, is stored in the liver and mus-culature in particular (A, see pp.156, 336). Theformation and breakdown of glycogen aresubject to complex regulation by hormonesand other factors (see p.120).
40 Biomolecules
All rights reserved. Usage subject to terms and conditions of license.Koolman, Color Atlas of Biochemistry, 2nd edition © 2005 Thieme

O
OH
HO
H
H
HH
O
O
OH
OH
H
H
HH
H
O
H
O
CH2
O
OH
OH
H
H
HH
O
O
OH
OH
H
H
HH
H
O
H O
OH
OH
H
H
HH
O
OH
OH
H
H
HH
H
OO
OH
HO HO
HO
CH2 CH2
CH2 HO HOCH2 CH2
O
NHCOCH3
H
H
HH
O
OH
NHCOCH3
H
H
HH
H
O
NHCOCH3
H
H
HH
O
OH
NHCOCH3
H
H
HH
HH
O O O O O
H
O O
C CH3C C O
NH
C O
NH
H3C
HO HOCH2 CH2 HO HOCH2 CH2
H H
1 4
6
α
β
1 4
α
1 4
α
1 4
α
1α
1 4
β
1 4
β
1 423
Glycogen –branchedhomopolymer
Mono-saccharide 1
D-GlcNAcD-Glc
D-GalD-Gal
D-GlcD-Glc
L-AraD-GlcD-GlcD-Fru
D-GlcNAcD-GlcD-GlcUA
Occurrence
Cell wallSlime
Red algae (agar)Red algae
Cell wallCell wall(Hemicellulose)Cell wall (pectin)AmyloplastsAmyloplastsStorage cells
Insects, crabsLiver, muscleConnective tissue
Mono-saccharide 2
D-MurNAc1)
L-aGal2)
D-Xyl (D-Gal,L-Fuc)
Function
SCWB
WBWB
SCSCSC
RCRCRC
SKRKSK,WB
1 3
1 31 4
1 61 2)1 3
1 6
1 6
SC= structural carbohydrate, RC= reserve carbohydrate,WB = water-binding carbohydrate; 1) N-acetylmuramic acid, 2) 3,6-anhydrogalactose
Linkage Branch-ing
βα
ββ
ββ
αααβ
βαββ
α
βα
ββα
α
α
Poly-saccharide
Bacteria
MureinDextran
Plants
AgaroseCarrageenan
CelluloseXyloglucan
ArabinanAmyloseAmylopectinInulin
Animals
ChitinGlycogenHyaluronicacid
A. Polysaccharides: structure
B. Important polysaccharides
Reducing end
Peptide
D-GlcNAc
1 41 6
1 41 3
1 41 4
1 51 41 42 1
1 41 41 41 3
(
Murein – linearheteropolymer
41Carbohydrates
All rights reserved. Usage subject to terms and conditions of license.Koolman, Color Atlas of Biochemistry, 2nd edition © 2005 Thieme

Plant polysaccharides
Two glucose polymers of plant origin are ofspecial importance among the polysac-charides: β14-linked polymer celluloseand starch, which is mostly α14-linked.
A. Cellulose
Cellulose, a linear homoglycan of β14-linked glucose residues, is the most abundantorganic substance in nature. Almost half of thetotal biomass consists of cellulose. Some40–50% of plant cell walls are formed by cel-lulose. The proportion of cellulose in cottonfibers, an important raw material, is 98%. Cel-lulose molecules can contain more than 104
glucose residues (mass 1–2 106 Da) and canreach lengths of 6–8 µm.
Naturally occurring cellulose is extremelymechanically stable and is highly resistant tochemical and enzymatic hydrolysis. Theseproperties are due to the conformation ofthe molecules and their supramolecular or-ganization. The unbranched β14 linkage re-sults in linear chains that are stabilized byhydrogen bonds within the chain and be-tween neighboring chains (1). Already duringbiosynthesis, 50–100 cellulose molecules as-sociate to form an elementary fibril with adiameter of 4 nm. About 20 such elementaryfibrils then form a microfibril (2), which isreadily visible with the electron microscope.
Cellulose microfibrils make up the basicframework of the primary wall of young plantcells (3), where they form a complex networkwith other polysaccharides. The linking poly-saccharides include hemicellulose, which is amixture of predominantly neutral heterogly-cans (xylans, xyloglucans, arabinogalactans,etc.). Hemicellulose associates with the cellu-lose fibrils via noncovalent interactions. Thesecomplexes are connected by neutral andacidic pectins, which typically contain galac-turonic acid. Finally, a collagen-relatedprotein, extensin, is also involved in the for-mation of primary walls.
In the higher animals, including humans,cellulose is indigestible, but important asroughage (see p. 273). Many herbivores (e. g.,the ruminants) have symbiotic unicellular or-ganisms in their digestive tracts that breakdown cellulose and make it digestible by thehost.
B. Starch
Starch, a reserve polysaccharide widely dis-tributed in plants, is the most important car-bohydrate in the human diet. In plants, starchis present in the chloroplasts in leaves, as wellas in fruits, seeds, and tubers. The starch con-tent is especially high in cereal grains (up to75% of the dry weight), potato tubers (ap-proximately 65%), and in other plant storageorgans.
In these plant organs, starch is present inthe form of microscopically small granules inspecial organelles known as amyloplasts.Starch granules are virtually insoluble in coldwater, but swell dramatically when the wateris heated. Some 15–25% of the starch goesinto solution in colloidal form when the mix-ture is subjected to prolonged boiling. Thisproportion is called amylose (“solublestarch”).
Amylose consists of unbranched α14-linked chains of 200–300 glucose residues.Due the α configuration at C-1, these chainsform a helix with 6–8 residues per turn (1).The blue coloring that soluble starch takes onwhen iodine is added (the “iodine–starch re-action”) is caused by the presence of thesehelices—the iodine atoms form chains insidethe amylose helix, and in this largely non-aqueous environment take on a deep bluecolor. Highly branched polysaccharides turnbrown or reddishbrown in the presence ofiodine.
Unlike amylose, amylopectin, which ispractically insoluble, is branched. On average,one in 20–25 glucose residues is linked toanother chain via an α16 bond. This leadsto an extended tree-like structure, which—like amylose—contains only one anomericOH group (a “reducing end”). Amylopectinmolecules can contain hundreds of thousandsof glucose residues; their mass can be morethan 108 Da.
42 Biomolecules
All rights reserved. Usage subject to terms and conditions of license.Koolman, Color Atlas of Biochemistry, 2nd edition © 2005 Thieme

α
1
1
α
4
6
HO
HO
OH
O
OO
O OO
O O O
O
O O
OO
OOH
OH
OH
OHO
O
O
HOO
Oα
1
4
1.
2.
3.
Ca2
β1
423
5
63
12
4
5
6
Ca2
A. Cellulose
B. Starch
Microfibril
Elementaryfibril
2. Amylopectin 80%1. Amylose 20%
Pectin
Hemi-cellulose
CellulosemicrofibrilExtensin
Reducing end
Plant cell
Endoplasmicreticulum
MitochondriaGolgi apparatus
Nucleus
VacuoleChloroplasts
StarchStarch
Plasma membrane
43Carbohydrates
All rights reserved. Usage subject to terms and conditions of license.Koolman, Color Atlas of Biochemistry, 2nd edition © 2005 Thieme

Glycosaminoglycans andglycoproteins
A. Hyaluronic acid
As constituents of proteoglycans (see p. 346),the glycosaminoglycans—a group of acidicheteropolysaccharides—are important struc-tural elements of the extracellular matrix.
Glycosaminoglycans contain amino sugarsas well as glucuronic acid and iduronic acid ascharacteristic components (see p. 38). In ad-dition, most polysaccharides in this group areesterified to varying extents by sulfuric acid,increasing their acidic quality. Glycosamino-glycans can be found in free form, or as com-ponents of proteoglycans throughout the or-ganism.
Hyaluronic acid, an unesterified glycosami-noglycan with a relatively simple structure,consists of disaccharide units in which N-acetylglucosamine and glucuronic acid arealternately β14-linked and β13-linked.Due to the unusual β13 linkage, hyaluronicacid molecules–which may contain severalthousand monosaccharide residues—arecoiled like a helix. Three disaccharide unitsform each turn of the helix. The outwardfac-ing hydrophilic carboxylate groups of the glu-curonic acid residues are able to bind Ca2+
ions. The strong hydration of these groupsenables hyaluronic acid and other glycosami-noglycans to bind water up to 10 000 timestheir own volume in gel form. This is thefunction which hyaluronic acid has in the vit-reous body of the eye, which contains approx-imately 1% hyaluronic acid and 98% water.
B. Oligosaccharide in immunoglobulin G(IgG)
Many proteins on the surface of the plasmamembrane, and the majority of secreted pro-teins, contain oligosaccharide residues thatare post-translationally added to the endo-plasmic reticulum and in the Golgi apparatus(see p. 230). By contrast, cytoplasmic proteinsare rarely glycosylated. Glycoproteins cancontain more than 50% carbohydrate; how-ever, the proportion of protein is generallymuch greater.
As an example of the carbohydrate compo-nent of a glycoprotein, the structure of one ofthe oligosaccharide chains of immunoglobu-lin G (IgG; see p. 300) is shown here. Theoligosaccharide has an N-glycosidic link tothe amide group of an asparagine residue inthe Fc part of the protein. Its function is notknown.
Like all N-linked carbohydrates, the oligo-saccharide in IgG contains a T-shaped corestructure consisting of two N-acetylglucos-amines and three mannose residues (shownin violet). In addition, in this case the struc-ture contains two further N-acetylglucos-amine residues, as well as a fucose residueand a galactose residue. Glycoproteins showmany different types of branching. In thiscase, we not only have β14 linkage, butalso β12, α13, and α16 bonds.
C. Glycoproteins: forms
On the cell surface of certain glycoproteins,O-glycosidic links are found between the car-bohydrate part and a serine or threonine res-idue, instead of N-glycosidic links to aspara-gine residues. This type of link is less commonthan the N-glycosidic one.
There are two types of oligosaccharidestructure with N-glycosidic links, which arisethrough two different biosynthetic pathways.During glycosylation in the ER, the protein isinitially linked to an oligosaccharide, which inaddition to the core structure contains sixfurther mannose residues and three terminalglucose residues (see p. 230). The simplerfrom of oligosaccharide (the mannose-richtype) is produced when only the glucose res-idues are cleaved from the primary product,and no additional residues are added. In othercases, the mannose residues that are locatedoutside the core structure are also removedand replaced by other sugars. This producesoligosaccharides such as those shown on theright (the complex type). At the external endof the structure, glycoproteins of the complextype often contain N-acetylneuraminic acidresidues, which give the oligosaccharide com-ponents negative charges.
44 Biomolecules
All rights reserved. Usage subject to terms and conditions of license.Koolman, Color Atlas of Biochemistry, 2nd edition © 2005 Thieme

Asn
Gal
GalNAc
O
NeuAc
NeuAc
Ser
GlcNAc
GlcNAc
NH
Man Man Man
ManMan
Man
Asn
NH
Man Man
Man
GlcNAc
GlcNAc
Fuc
GlcNAc
GlcNAcGlcNAc
Gal Gal
Gal
NeuAc NeuAc
NeuAc
Man Man Man
I
II
III IVV VI
β
1 3
4
1
βO
OH
NHCOCH3
H
H
HH
O
HO
H
H
HH
H
O
OH
NHCOCH3
H
H
HH
O
OH
H
H
HH
HH HO
O O
H
COO
O O
COO
O
OH
NHCOCH3
H
H
HH
O
H
H
HH
HHO
OO
H
O
COOHOCH2 HOCH2 HOCH2
O
HOH
HO
H
HH
O
OH
NHCOCH3
H
H
HH
O
OH
NHCOCH3
H
H
HH
HH
O O HN
H
O
H
OH
OH
H
H
HOH
O
OH
NHCOCH3
H
H
HH
HH
O
O
OH
H
O
H
HH
H
OHO
HOH2C
CH2
C
CH2
O
C
O
H
HOH
HCH3
H
OHO
H
CH2
HO
O
OH
NHCOCH3
H
H
HH
HHO
O
OH
H
O
H
HH
H
OHO
HOH2C
HOCH2
HOCH2
HO HOCH2 CH2
[ 3)-β-D-GlcNAc-(1 4)-β-D-GlcUA-(1 4]n
OH OH
A. Hyaluronic acid
B. Oligosaccharide in immunoglobulin G (IgG)
Disaccharide unit
Core structure
D-Gal D-GlcNAc
D-ManD-Man
D-Man
D-GlcNAc
D-GlcNAc
L-FucN-glycosidicbond
D-GlcNAc
Mannose-rich type
N-linked
Protein
O-linked
Complex type
C. Glycoproteins: forms
Asn-297
45Carbohydrates
All rights reserved. Usage subject to terms and conditions of license.Koolman, Color Atlas of Biochemistry, 2nd edition © 2005 Thieme

Overview
A. Classification
The lipids are a large and heterogeneousgroup of substances of biological origin thatare easily dissolved in organic solvents suchas methanol, acetone, chloroform, and ben-zene. By contrast, they are either insoluble oronly poorly soluble in water. Their low watersolubility is due to a lack of polarizing atomssuch as O, N, S, and P (see p. 6).
Lipids can be classified into substances thatare either hydrolyzable— i. e., able to undergohydrolytic cleavage—or nonhydrolyzable. Onlya few examples of the many lipids known canbe mentioned here. The individual classes oflipids are discussed in more detail in the fol-lowing pages.
Hydrolyzable lipids (components shown inbrackets). The simple esters include the fats(triacylglycerol; one glycerol + three acyl res-idues); the waxes (one fatty alcohol + one acylresidue); and the sterol esters (one sterol + oneacyl residue). The phospholipids are esterswith more complex structures. Their charac-teristic component is a phosphate residue.The phospholipids include the phosphatidicacids (one glycerol + two acyl residues + onephosphate) and the phosphatides (one glyc-erol + two acyl residues + one phosphate +one amino alcohol). In the sphingolipids, glyc-erol and one acyl residue are replaced bysphingosine. Particularly important in thisgroup are the sugar-containing glycolipids(one sphingosine + one fatty acid + sugar).The cerebrosides (one sphingosine + one fattyacid + one sugar) and gangliosides (one sphin-gosine + one fatty acid + several differentsugars, including neuraminic acid) are repre-sentatives of this group.
The components of the hydrolyzable lipidsare linked to one another by ester bonds. Theyare easily broken down either enzymaticallyor chemically.
Non-hydrolyzable lipids. The hydrocarbonsinclude the alkanes and carotenoids. The lipidalcohols are also not hydrolyzable. They in-clude long-chained alkanols and cyclic sterolssuch as cholesterol, and steroids such as es-tradiol and testosterone. The most importantacids among the lipids are fatty acids. Theeicosanoids also belong to this group; these
are derivatives of the polyunsaturated fattyacid arachidonic acid (see p. 390).
B. Biological roles
1. Fuel. Lipids are an important source of en-ergy in the diet. In quantitative terms, theyrepresent the principal energy reserve in ani-mals. Neutral fats in particular are stored inspecialized cells, known as adipocytes. Fattyacids are released from these again as needed,and these are then oxidized in the mitochon-dria to form water and carbon dioxide, withoxygen being consumed. This process alsogives rise to reduced coenzymes, which areused for ATP production in the respiratorychain (see p.140).
2. Nutrients. Amphipathic lipids are usedby cells to build membranes (see p. 214). Typ-ical membrane lipids include phospholipids,glycolipids, and cholesterol. Fats are onlyweakly amphiphilic and are therefore notsuitable as membrane components.
3. Insulation. Lipids are excellent insula-tors. In the higher animals, neutral fats arefound in the subcutaneous tissue and aroundvarious organs, where they serve as mechan-ical and thermal insulators. As the principalconstituent of cell membranes, lipids also in-sulate cells from their environment mechan-ically and electrically. The impermeability oflipid membranes to ions allows the formationof the membrane potential (see p.126).
4. Special tasks. Some lipids have adoptedspecial roles in the body. Steroids, eicosa-noids, and some metabolites of phospholipidshave signaling functions. They serve as hor-mones, mediators, and second messengers(see p. 370). Other lipids form anchors to at-tach proteins to membranes (see p. 214). Thelipids also produce cofactors for enzymatic re-actions—e. g., vitamin K (see p. 52) and ubiq-uinone (see p.104). The carotenoid retinal, alight-sensitive lipid, is of central importancein the process of vision (see p. 358).
Several lipids are not formed indepen-dently in the human body. These substances,as essential fatty acids and fat-soluble vita-mins, are indispensable components of nutri-tion (see pp. 364ff.)
46 Biomolecules
All rights reserved. Usage subject to terms and conditions of license.Koolman, Color Atlas of Biochemistry, 2nd edition © 2005 Thieme

O2
CO2 H2O
C O
O
CH2
C O
O
C O CH2
O
C O CH
O
H2C O P O
O
O
N CH3
CH2
CH3
C O CH2
O
C O CH
O
C O CH2
O
HO
OH
COOH
CNH
O
OH
OH
OOH
OH
OCH2
HOHO
C O CH2
O
C O CH
O
H2C O P O
O
O
4. Special tasks
1. Fuel 2. Building block
3. Thermal insulator
FatGlycerol
Fatty acid
Mitochondrion
37 °C
0 °C
Phospho-lipid
Membrane
Lipidbilayer
Cytoplasm
Cell
Signaling
Cofactor Visual pigment
Anchor
A. Classification
B. Biological roles
Hydrolyzable lipids
Non-hydrolyzable lipids
HydrocarbonsAlkanesCarotenoids
EstersFatsWaxesSterol esters
PhospholipidsPhosphatidatesPhosphatidsSphingolipids
AlcoholsLong-chain alkanolsSterolsSteroids
GlycolipidsCerebrosidesGangliosides
AcidsFatty acidsEicosanoids
ADP+Pi ATP
CoQ
47Lipids
All rights reserved. Usage subject to terms and conditions of license.Koolman, Color Atlas of Biochemistry, 2nd edition © 2005 Thieme

Fatty acids and fats
A. Carboxylic acids
The naturally occurring fatty acids are carbox-ylic acids with unbranched hydrocarbonchains of 4–24 carbon atoms. They arepresent in all organisms as components offats and membrane lipids. In these com-pounds, they are esterified with alcohols(glycerol, sphingosine, or cholesterol). How-ever, fatty acids are also found in smallamounts in unesterified form. In this case,they are known as free fatty acids (FFAs). Asfree fatty acids have strongly amphipathicproperties (see p. 28), they are usually presentin protein-bound forms.
The table lists the full series of aliphaticcarboxylic acids that are found in plants andanimals. In higher plants and animals, un-branched, longchain fatty acids with either16 or 18 carbon atoms are the most common—e. g., palmitic and stearic acid. The number ofcarbon atoms in the longer, natural fatty acidsis always even. This is because they are bio-synthesized from C2 building blocks (seep.168).
Some fatty acids contain one or moreisolated double bonds, and are therefore “un-saturated.” Common unsaturated fatty acidsinclude oleic acid and linoleic acid. Of the twopossible cis–trans isomers (see p. 8), usuallyonly the cis forms are found in natural lipids.Branched fatty acids only occur in bacteria. Ashorthand notation with several numbers isused for precise characterization of the struc-ture of fatty acids—e g., 18:2;9,12 for linoleicacid. The first figure stands for the number ofC atoms, while the second gives the numberof double bonds. The positions of the doublebonds follow after the semicolon. As usual,numbering starts at the carbon with the high-est oxidation state (i. e., the carboxyl groupcorresponds to C-1). Greek letters are alsocommonly used (α = C-2; β = C-3; ω = thelast carbon, ω-3 = the third last carbon).
Essential fatty acids are fatty acids thathave to be supplied in the diet. Without ex-ception, these are all polyunsaturated fattyacids: the C20 fatty acid arachidonic acid(20:4;5,8,11,14) and the two C18 acids linoleicacid (18:2;9,12) and linolenic acid(18:3;9,12,15). The animal organism requiresarachidonic acid to synthesize eicosanoids
(see p. 390). As the organism is capable ofelongating fatty acids by adding C2 units, butis not able to introduce double bonds into theend sections of fatty acids (after C-9), arachi-donic acid has to be supplied with the diet.Linoleic and linolenic acid can be convertedinto arachidonic acid by elongation, and theycan therefore replace arachidonic acid in thediet.
B. Structure of fats
Fats are esters of the trivalent alcohol glycerolwith three fatty acids. When a single fatty acidis esterified with glycerol, the product is re-ferred to as a monoacylglycerol (fatty acid res-idue = acyl residue).
Formally, esterification with additionalfatty acids leads to diacylglycerol and ulti-mately to triacylglycerol, the actual fat (for-merly termed “triglyceride”). As triacylglycer-ols are uncharged, they are also referred to asneutral fats. The carbon atoms of glycerol arenot usually equivalent in fats. They are distin-guished by their “sn” number, where snstands for “stereospecific numbering.”
The three acyl residues of a fat moleculemay differ in terms of their chain length andthe number of double bonds they contain.This results in a large number of possiblecombinations of individual fat molecules.When extracted from biological materials,fats always represent mixtures of very similarcompounds, which differ in their fatty acidresidues. A chiral center can arise at the mid-dle C atom (sn -C-2) of a triacylglycerol if thetwo external fatty acids are different. Themonoacylglycerols and diacylglycerols shownhere are also chiral compounds. Nutritionalfats contain palmitic, stearic, oleic acid, andlinoleic acid particularly often. Unsaturatedfatty acids are usually found at the centralC atom of glycerol.
The length of the fatty acid residues andthe number of their double bonds affect themelting point of the fats. The shorter the fattyacid residues and the more double bonds theycontain, the lower their melting points.
48 Biomolecules
All rights reserved. Usage subject to terms and conditions of license.Koolman, Color Atlas of Biochemistry, 2nd edition © 2005 Thieme

C-1
C-2
C-3
HOOC CH2 CH2 CH2 CH2 CH3
HO CH2
C
CH2
HHO
HO
O CH2
C
CH2
HHO
HO
CR'
O
O CH2
C
CH2
HO
O
C
CR'
R''
O
O
CR'''
O
O CH2
C
CH2
HO
HO
C
CR'
R''
O
O
Number of double bondsPosition of double bonds
A. Carboxylic acids
B. Structure of fats
Essential in human nutrition
Ester bonding Chiral center sn number
Fatty acids Glycerol
Van der Waalsmodelof tristearylglycerol
Glycerol Monoacylglycerol Diacylglycerol Triacylglycerol = Fat
Name Number of carbons
Formic acidAcetic acidPropionic acidButyric acidValerianic acidCaproic acidCaprylic acidCapric acidLauric acidMyristic acidPalmitic acidStearic acidOleic acidLinoleic acidLinolenic acidArachidic acidArachidonic acidBehenic acidErucic acidLignoceric acidNervonic acid
0000000000001;2;3;04;01;01;
99,129,12,15
5,8,11,14
13
15
Not containedin lipids
Caproic acid
1 :2 :3 :4 :5 :6 :8 :
10 :12 :14 :16 :18 :18 :18 :18 :20 :20 :22 :22 :24 :24 :
Rotatablearound C–C bond
Acyl residue
Acyl residue
Acyl residue
49Lipids
All rights reserved. Usage subject to terms and conditions of license.Koolman, Color Atlas of Biochemistry, 2nd edition © 2005 Thieme

Phospholipids and glycolipids
A. Structure of phospholipids andglycolipids
Fats (triacylglycerol, 1) are esters of glycerolwith three fatty acids (see p. 48). Within thecell, they mainly occur as fat droplets. In theblood, they are transported in the hydropho-bic interior of lipoproteins (see p. 278).
Phospholipids (2) are the main consti-tuents of biological membranes (seepp. 214–217). Their common feature is a phos-phate residue that is esterified with the hy-droxyl group at C-3 of glycerol. Due to thisresidue, phospholipids have at least one neg-ative charge at a neutral pH.
Phosphatidates (anions of the phosphatidicacids), the simplest phospholipids, are phos-phate esters of diacylglycerol. They are impor-tant intermediates in the biosynthesis of fatsand phospholipids (see p.170). Phosphati-dates can also be released from phospholipidsby phospholipases.
The other phospholipids can be derivedfrom phosphatidates (residue = phospha-tidyl). Their phosphate residues are esterifiedwith the hydroxyl group of an amino alcohol(choline, ethanolamine, or serine) or with thecyclohexane derivative myo-inositol. Phos-phatidylcholine is shown here as an exampleof this type of compound. When two phos-phatidyl residues are linked with one glyc-erol, the result is cardiolipin (not shown), aphospholipid that is characteristic of the innermitochondrial membrane. Lysophospholipidsarise from phospholipids by enzymatic cleav-age of an acyl residue. The hemolytic effect ofbee and snake venoms is due in part to thisreaction.
Phosphatidylcholine (lecithin) is the mostabundant phospholipid in membranes.Phosphatidylethanolamine (cephalin) has anethanolamine residue instead of choline, andphosphatidylserine has a serine residue. Inphosphatidylinositol, phosphatidate is esteri-fied with the sugarlike cyclic polyalcoholmyo-inositol. A doubly phosphorylated deriv-ative of this phospholipid, phosphatidylinosi-tol 4,5-bisphosphate, is a special componentof membranes, which, by enzymatic cleavage,can give rise to two second messengers, diacyl-glycerol (DAG) and inositol 1,4,5trisphosphate(InsP3; see p. 386).
Some phospholipids carry additionalcharges, in addition to the negative chargeat the phosphate residue. In phosphatidylcho-line and phosphatidylethanolamine, theN-atom of the amino alcohol is positivelycharged. As a whole, these two phosphatidestherefore appear to be neutral. In contrast,phosphatidylserine—with one additional pos-itive charge and one additional negativecharge in the serine residue—and phosphati-dylinositol (with no additional charge) have anegative net charge, due to the phosphateresidue.
Sphingolipids (3), which are found in largequantities in the membranes of nerve cells inthe brain and in neural tissues, have a slightlydifferent structure from the other membranelipids discussed so far. In sphingolipids, sphin-gosine, an amino alcohol with an unsaturatedalkyl side chain, replaces glycerol and one ofthe acyl residues. When sphingosine forms anamide bond to a fatty acid, the compound iscalled ceramide (3). This is the precursor ofthe sphingolipids. Sphingomyelin (2)—themost important sphingolipid—has an addi-tional phosphate residue with a choline groupattached to it on the sphingosine, in additionto the fatty acid.
Glycolipids (3) are present in all tissues onthe outer surface of the plasma membrane.They consist of sphingosine, a fatty acid, andan oligosaccharide residue, which can some-times be quite large. The phosphate residuetypical of phospholipids is absent. Galacto-sylceramide and glucosylceramide (known ascerebroside) are simple representatives ofthis group. Cerebrosides in which the sugaris esterified with sulfuric acid are known assulfatides. Gangliosides are the most complexglycolipids. They constitute a large family ofmembrane lipids with receptor functions thatare as yet largely unknown. A characteristiccomponent of many gangliosides is N-acetyl-neuraminic acid (sialic acid; see p. 38).
50 Biomolecules
All rights reserved. Usage subject to terms and conditions of license.Koolman, Color Atlas of Biochemistry, 2nd edition © 2005 Thieme

SO3
GalGalNAcGalGlc
NeuAc
P
P
P2
P
P
C O CH2
O
C O C
H2C O P O
O
O
O (CH2)2
H
N CH3
CH3
CH3
N CH3
CH3
CH3
CH2CH2HO CH2HO CH NH3
COO
CH2HO CH2 NH3
HOOH
OH
OHOH OH
H
H
H
H
H H
C
O
NH
CH
C
CH2
C OH
H
C
H
H
O P O
O
O
(CH2)2 N CH3
CH3
CH3
A. Structure of fats, phospholipids, and glycolipids
Acyl residue 1
Gly
cero
l
1. FatsFat
Phosphatidate
Phosphatide(phosphatidylcholine,lecithin)
Amino alcoholor sugar alcoholPhosphatide
Choline Serine
myo-InositolEthanolamine
Acyl residue 2
Acyl residue 3
Acyl residue 1
Acyl residue 2
Sphingosine
Sphingosine
Amino alcoholor sugar alcohol
Lysophospholipid
Gly
cero
lG
lyce
rol
Sphingophospholipid
Amino alcoholor sugar alcohol
Acyl residue 1Acyl residue 1
Acyl residue 1
Gly
cero
l
Sphingosine
Sphingosine
Sugar
Sphingosine
2. Phospholipids
Ceramide
Sphingomyelin
SphingosineSugar
Sulfatide
Sphingosine
Choline
Acyl residue 1
Acyl residue 1
Acyl residue 1
Acyl residue 1
3. Sphingolipids
Cerebroside(galactosyl or glycosyl ceramide)
Ganglioside GM1
Acyl residue 1
Acyl residue 2
51Lipids
All rights reserved. Usage subject to terms and conditions of license.Koolman, Color Atlas of Biochemistry, 2nd edition © 2005 Thieme

Isoprenoids
A. Activated acetic acid as a component oflipids
Although the lipids found in plant and animalorganisms occur in many different forms,they are all closely related biogenetically;they are all derived from acetyl-CoA, the “ac-tivated acetic acid” (see pp.12, 110).
1. One major pathway leads from acetyl-CoA to the activated fatty acids (acyl-CoA; fordetails, see p.168). Fats, phospholipids, andglycolipids are synthesized from these, andfatty acid derivatives in particular are formed.Quantitatively, this is the most importantpathway in animals and most plants.
2. The second pathway leads from acetyl-CoA to isopentenyl diphosphate (“active iso-prene”), the basic component for the isopren-oids. Its biosynthesis is discussed in connec-tion with biosynthesis of the isoprenoid, cho-lesterol (see p.172).
B. Isoprenoids
Formally, isoprenoids are derived from a sin-gle common building block, isoprene (2-methyl-1,3-butadiene), a methyl-branchedcompound with five C atoms. Activatedisoprene, isopentenyl diphosphate, is used byplants and animals to biosynthesize linearand cyclic oligomers and polymers. For theisoprenoids listed here—which only representa small selection—the number of isopreneunits (I) is shown.
From activated isoprene, the metabolicpathway leads via dimerization to activatedgeraniol (I = 2) and then to activated farnesol (I= 3). At this point, the pathway divides intotwo. Further extension of farnesol leads tochains with increasing numbers of isopreneunits—e. g., phytol (I = 4), dolichol (I = 14–24),and rubber (I = 700–5000). The other pathwayinvolves a “head-to-head” linkage betweentwo farnesol residues, giving rise to squalene(I = 6), which, in turn, is converted to choles-terol (I = 6) and the other steroids.
The ability to synthesize particular iso-prenoids is limited to a few species of plantsand animals. For example, rubber is onlyformed by a few plant species, including therubber tree (Hevea brasiliensis). Several iso-prenoids that are required by animals for me-
tabolism, but cannot be produced by themindependently, are vitamins; this groupincludes vitamins A, D, E, and K. Due to itsstructure and function, vitamin D is now usu-ally classified as a steroid hormone (seepp. 56, 330).
Isoprene metabolism in plants is very com-plex. Plants can synthesize many types of ar-omatic substances and volatile oils from iso-prenoids. Examples include menthol (I= 2 ),camphor (I = 2), and citronellal (I = 2). TheseC10 compounds are also called monoterpenes.Similarly, compounds consisting of three iso-prene units (I = 3) are termed sesquiterpenes,and the steroids (I = 6) are called triterpenes.
Isoprenoids that have hormonal and sig-naling functions form an important group.These include steroid hormones (I = 6) andretinoate (the anion of retinoic acid; I = 3) invertebrates, and juvenile hormone (I = 3) inarthropods. Some plant hormones also belongto the isoprenoids—e. g., the cytokinins, absci-sic acid, and brassinosteroids.
Isoprene chains are sometimes used aslipid anchors to fix molecules to membranes(see p. 214). Chlorophyll has a phytyl residue (I= 4) as a lipid anchor. Coenzymes with iso-prenoid anchors of various lengths includeubiquinone (coenzyme Q; I = 6–10), plastoqui-none (I = 9), and menaquinone (vitamin K; I =4–6). Proteins can also be anchored to mem-branes by isoprenylation.
In some cases, an isoprene residue is usedas an element to modify molecules chemi-cally. One example of this is N'-isopentenyl-AMP, which occurs as a modified componentin tRNA.
52 Biomolecules
All rights reserved. Usage subject to terms and conditions of license.Koolman, Color Atlas of Biochemistry, 2nd edition © 2005 Thieme

O
CH3CA
S
O
CA
SO P P
21
O
CH3
H3C
CH3
CH2OH
HO
CH2OH
CH2OH
O
CH3
H3C
HO
CH3
CH3O
O
CH3 O
CH3 O CH3
n = 6–10
OH
CH3
OH
A. Activated acetic acid as a component of lipids
Active isopreneActivated fatty acid
Activated acetic acid
Acetyl-CoA
Acyl-CoAIsopentenyl diphosphate
Fats Phospholipids Glycolipids Isoprenoids
Isoprene
Metabolitemodifiedwith isoprene
Active isopreneI =1
Isopentenyl-AMPI =1
CamphorI = 2
MentholI = 2
CholesterolI = 6
CitronellolI = 2
Juvenile hormoneI = 3
GeraniolI = 2
FarnesolI = 3
SqualeneI = 6
Chain-likeisoprenoids
Building block ofall isoprenoids
Biosynthesis only in plantsand micro-organisms
B. Isoprenoids
Steroid hormones
Bile acids
Steroid glycosides
I = 6
PhytolI = 4
DolicholI = 14 – 24
RubberI = 700 – 5 000
MenaquinoneI = 4 – 6
PlastoquinoneI = 9
Retinoic
Carotenoids(Vitamin A)
Tocopherol(Vitamin E)
I = 4
Phylloquinone(Vitamin K)
I = 4
Cyclicisoprenoids
UbiquinoneI = 6 – 10
53Lipids
All rights reserved. Usage subject to terms and conditions of license.Koolman, Color Atlas of Biochemistry, 2nd edition © 2005 Thieme

Steroid structure
A. Steroid building blocks
Common to all of the steroids is a molecularcore structure consisting of four saturatedrings, known as gonane. At the end of thesteroid core, many steroids also carry a sidechain, as seen in cholestane, the basic compo-nent of the sterols (steroid alcohols).
B. Spatial structure
The four rings of the steroids are distin-guished using the letters A, B, C, and D. Dueto the tetrahedral arrangement of the singlecarbon bonds, the rings are not flat, but puck-ered. Various ring conformations are knownby the terms “chair,” “boat,” and “twisted”(not shown). The chair and boat conforma-tions are common. Fivemembered rings fre-quently adopt a conformation referred to asan “envelope”. Some rings can be convertedfrom one conformation to another at roomtemperature, but with steroids this is dif cult.
Substituents of the steroid core lie eitherapproximately in the same plane as the ring(e = equatorial) or nearly perpendicular to it(a = axial). In threedimensional representa-tions, substituents pointing toward the ob-server are indicated by an unbroken line (βposition), while bonds pointing into the planeof the page are indicated by a dashed line (αposition). The so-called angular methylgroups at C-10 and C-13 of the steroids alwaysadopt the β position.
Neighboring rings can lie in the same plane(trans; 2) or at an angle to one another (cis; 1).This depends on the positions of the substitu-ents of the shared ring carbons, which can bearranged either cis or trans to the angularmethyl group at C-10. The substituents of ste-roid that lie at the points of intersection of theindividual rings are usually in trans position.As a whole, the core of most steroids is moreor less planar, and looks like a flat disk. Theonly exceptions to this are the ecdysteroids,bile acids (in which A:B is cis), cardiac glyco-sides, and toad toxins.
A more realistic impression of the three-dimensional structure of steroids is providedby the space-filling model of cholesterol (3).The four rings form a fairly rigid scaffolding,
onto which the much more mobile side chainis attached.
Steroids are relatively apolar (hydropho-bic). Some polar groups—e. g., hydroxyl andoxo groups—give them amphipathic proper-ties. This characteristic is especially pro-nounced with the bile acids (see p. 314).
C. Thin-layer chromatography
Thin-layer chromatography (TLC) is a power-ful, mainly analytic, technique for rapidly sep-arating lipids and other small molecules suchas amino acids, nucleotides, vitamins, anddrugs. The sample being analyzed is appliedto a plate made of glass, aluminum, or plastic,which is covered with a thin layer of silica gelor other material (1). The plate is then placedin a chromatography chamber that containssome solvent. Drawn by capillary forces, thesolvent moves up the plate (2). The substan-ces in the sample move with the solvent. Thespeed at which they move is determined bytheir distribution between the stationaryphase (the hydrophilic silica), and the mobilephase (the hydrophobic solvent). When thesolvent reaches the top edge of the plate,the chromatography is stopped. After evapo-ration of the solvent, the separated substan-ces can be made visible using appropriatestaining methods or with physical processes(e. g., ultraviolet light) (3). The movement of asubstance in a given TLC system is expressedas its Rf value. In this way, compounds that arenot known can be identified by comparisonwith reference substances.
A process in which the polarity of the sta-tionary and mobile phases is reversed—i. e.,the stationary phase is apolar and the solventis polar—is known as “reversed-phase thin-layer chromatography” (RP-TLC).
54 Biomolecules
All rights reserved. Usage subject to terms and conditions of license.Koolman, Color Atlas of Biochemistry, 2nd edition © 2005 Thieme

1. 2.
R
3.
Rf =ab
ab
CH3
H
CH3
HO
HH
CH3
H
H
HO
A B
C D17
151
23
45
6
7
89
10
1112
13
1416
18
19
20
21 22 24 27
23 25
26
A. Steroid building blocks
Gonane
Cholestane
C. Thin-layer chromatography
B. 3D structure
Cholestanol
Angularmethyl groups
Hydroxyl groupat C-3 adoptsβ conformation
Double bondin ring B: ∆5
Cholesterol
Ring conformations
Boat
Envelope
H and CH3 in cis position
Chair
Methyl-branched sidechain with 8 carbons
β con-formation,equatorial
β con-formation,axial
H and CH3 intranspositionα con-
formation,axial
Cholesterol (Van der Waals model)
Thin-layerplate withsilica gelsurface
Sample:lipidmixture
1. Load 2. Develop 3. Make visible
Chromato-graphy tank
Runningsolvent:Hexane/Diethylether/Formic acid80 : 80 : 2(v/v/v)
Cholesterolesters
Triacyl-glycerols
Free fatty acids
Cholesterol
Diacyl-glycerols
Monoacyl-glycerols
Phospholipids
Front
Start
1,3-1,2-
55Lipids
All rights reserved. Usage subject to terms and conditions of license.Koolman, Color Atlas of Biochemistry, 2nd edition © 2005 Thieme

Steroids: overview
The three most important groups of steroidsare the sterols, bile acids, and steroid hor-mones. Particularly in plants, compoundswith steroid structures are also found thatare notable for their pharmacological ef-fects—steroid alkaloids, digitalis glycosides,and saponins.
A. Sterols
Sterols are steroid alcohols. They have aβ-positioned hydroxyl group at C-3 and oneor more double bonds in ring B and in the sidechain. There are no further oxygen functions,as in the carbonyl and carboxyl groups.
The most important sterol in animals ischolesterol. Plants and microorganisms havea wide variety of closely related sterols in-stead of cholesterol—e. g., ergosterol, β-sitos-terol, and stigmasterol.
Cholesterol is present in all animal tissues,and particularly in neural tissue. It is a majorconstituent of cellular membranes, in which itregulates fluidity (see p. 216). The storage andtransport forms of cholesterol are its esterswith fatty acids. In lipoproteins, cholesteroland its fatty acid esters are associated withother lipids (see p. 278). Cholesterol is a con-stituent of the bile and is therefore found inmany gallstones. Its biosynthesis, metabo-lism, and transport are discussed elsewhere(see pp.172, 312).
Cholesterol-rich lipoproteins of the LDLtype are particularly important in the devel-opment of arteriosclerosis, in which the arte-rial walls are altered in connection with anexcess plasma cholesterol level. In terms ofdietary physiology, it is important that plantfoodstuffs are low in cholesterol. By contrast,animal foods can contain large amounts ofcholesterol—particularly butter, egg yolk,meat, liver, and brain.
B. Bile acids
Bile acids are synthesized from cholesterol inthe liver (see p. 314). Their structures cantherefore be derived from that of cholesterol.Characteristic for the bile acids is a side chainshortened by three C atoms in which the lastcarbon atom is oxidized to a carboxyl group.The double bond in ring B is reduced and rings
A and B are in cis position relative to eachother (see p. 54). One to three hydroxylgroups (in α position) are found in the steroidcore at positions 3, 7, and 12. Bile acids keepbile cholesterol in a soluble state as micellesand promote the digestion of lipids in theintestine (see p. 270). Cholic acid and cheno-deoxycholic acid are primary bile acids thatare formed by the liver. Their dehydroxylationat C-7 by microorganisms from the intestinalflora gives rise to the secondary bile acidslithocholic acid and deoxycholic acid.
C. Steroid hormones
The conversion of cholesterol to steroidhormones (see p. 376) is of minor importancequantitatively, but of major importance interms of physiology. The steroid hormonesare a group of lipophilic signal substancesthat regulate metabolism, growth, and repro-duction (see p. 374).
Humans have six steroid hormones:progesterone, cortisol, aldosterone, testos-terone, estradiol, and calcitriol. With the ex-ception of calcitriol, these steroids have eitherno side chain or only a short side one consist-ing of two carbons. Characteristic for most ofthem is an oxo group at C-3, conjugated witha double bond between C-4 and C-5 of ring A.Differences occur in rings C and D. Estradiol isaromatic in ring A, and its hydroxyl group atC-3 is therefore phenolic. Calcitriol differsfrom other vertebrate steroid hormones; itstill contains the complete carbon frameworkof cholesterol, but lightdependent opening ofring B turns it into what is termed a “secoste-roid” (a steroid with an open ring).
Ecdysone is the steroid hormone of thearthropods. It can be regarded as an earlyform of the steroid hormones. Steroid hor-mones with signaling functions also occur inplants.
56 Biomolecules
All rights reserved. Usage subject to terms and conditions of license.Koolman, Color Atlas of Biochemistry, 2nd edition © 2005 Thieme

HO
HO
HO
OH
HO OH
OH
OOH
HO
O
HO OH
OH
O
OH
HO
O
OH
O
HOC
OH
CH2OH
O OHC
O
HOC
CH2OH
O
O
OH
O
C
CH3
O OH
OH
CH2
HO13
25
OH
OH
HO
HO
O
OH
HO
H
HO
OH
C. Steroid hormones
Molting hormoneof insects,spidersand crabs
Cortisol Aldosterone Testosterone Estradiol
Progesterone Calcitriol Ecdysone
Cholic acid
Lithocholic acid
Cheno-deoxycholic acid Deoxy-
cholic acid
Cholesterol
Ergosterol
Stigmasterol
Animalsterol
β-Sitosterol
Plantsterols
A. Sterols
B. Bile acids
57Lipids
All rights reserved. Usage subject to terms and conditions of license.Koolman, Color Atlas of Biochemistry, 2nd edition © 2005 Thieme

Amino acids: chemistry andproperties
A. Amino acids: functions
The amino acids (2-aminocarboxylic acids)fulfill various functions in the organism.Above all, they serve as the components ofpeptides and proteins. Only the 20 proteino-genic amino acids (see p. 60) are included inthe genetic code and therefore regularlyfound in proteins. Some of these amino acidsundergo further (post-translational) changefollowing their incorporation into proteins(see p. 62). Amino acids or their derivativesare also form components of lipids—e. g., ser-ine in phospholipids and glycine in bile salts.Several amino acids function asneurotransmitters themselves (see p. 352),while others are precursors of neurotransmit-ters, mediators, or hormones (see p. 380).Amino acids are important (and sometimesessential) components of food (see p. 360).Specific amino acids form precursors for othermetabolites—e. g., for glucose in gluconeogen-esis, for purine and pyrimidine bases, forheme, and for other molecules. Several non-proteinogenic amino acids function as inter-mediates in the synthesis and breakdown ofproteinogenic amino acids (see p. 412) and inthe urea cycle (see p.182).
B. Optical activity
The natural amino acids are mainly α-aminoacids, in contrast to β-amino acids such as β-alanine and taurine. Most α-amino acids havefour different substituents at C-2 (Cα). The αatom therefore represents a chiral center—i. e.,there are two different enantiomers (L- andD-amino acids; see p. 8). Among the proteino-genic amino acids, only glycine is not chiral (R= H). In nature, it is almost exclusivelyL-amino acids that are found. D-Amino acidsoccur in bacteria—e. g., in murein (seep. 40)—and in peptide antibiotics. In animalmetabolism, D-Amino acids would disturbthe enzymatic reactions of L-amino acidsand they are therefore broken down in theliver by the enzyme D-amino acid oxidase.
The Fischer projection (center) is used topresent the formulas for chiral centers in bio-molecules. It is derived from their three-di-
mensional structure as follows: firstly, thetetrahedron is rotated in such a way that themost oxidized group (the carboxylate group)is at the top. Rotation is then continued untilthe line connecting line COO– and R (red) islevel with the page. In L-amino acids, theNH3
+ group is then on the left, while in D-amino acids it is on the right.
C. Dissociation curve of histidine
All amino acids have at least two ionizablegroups, and their net charge therefore de-pends on the pH value. The COOH groups atthe α-C atom have pKa values of between 1.8and 2.8 and are therefore more acidic thansimple monocarboxylic acids. The basicity ofthe α-amino function also varies, with pKa
values of between 8.8 and 10.6, dependingon the amino acid. Acidic and basic aminoacids have additional ionizable groups in theirside chain. The pKa values of these side chainsare listed on p. 60. The electrical charges ofpeptides and proteins are mainly determinedby groups in the side chains, as most α-car-boxyl and α-amino functions are linked topeptide bonds (see p. 66).
Histidine can be used here as an example ofthe pH-dependence of the net charge of anamino acid. In addition to the carboxyl groupand the amino group at the α-C atom with pKa
values of 1.8 and 9.2, respectively, histidinealso has an imidazole residue in its side chainwith a pKa value of 6.0. As the pH increases,the net charge (the sum of the positive andnegative charges) therefore changes from +2to –1. At pH 7.6, the net charge is zero, eventhough the molecule contains two almostcompletely ionized groups in these condi-tions. This pH value is called the isoelectricpoint.
At its isoelectric point, histidine is said tobe zwitterionic, as it has both anionic andcationic properties. Most other amino acidsare also zwitterionic at neutral pH. Peptidesand proteins also have isoelectric points,which can vary widely depending on thecomposition of the amino acids.
58 Biomolecules
All rights reserved. Usage subject to terms and conditions of license.Koolman, Color Atlas of Biochemistry, 2nd edition © 2005 Thieme

R
H
COO
R
H
COO
H3N H3NC C
R
C HH3N
COO
R
CH
COO
H3N
2
6
pK39.2
pK26.0
pK11.8
8
10
12
pH
4
0-1 +1 +2
COO
CH3N
CH2
H
CHN
HC N
CH
COO
CH2N
CH2
H
CHN
HC N
CH
COOH
CH3N
CH2
H
CHN
HC NH
CH
COO
CH3N
CH2
H
CHN
HC NH
CH
A. Amino acids: functions
B. Optical activity
(Isoelectric point)
C. Dissociation curve of histidine
L-Amino acid D-Amino acid (mirror image)Fischer projections
pH 11
pH 5pH 0.5
pH 7.6
Net charge
Components of:
PeptidesProteinsPhospholipids
Neurotransmitters:
GlutamateAspartateGlycine
L-Amino acid
Precursors of:
Keto acidsBiogenic aminesGlucoseNucleotidesHeme, creatine
Transport molecule for:
NH2 groups
R
59Amino Acids
All rights reserved. Usage subject to terms and conditions of license.Koolman, Color Atlas of Biochemistry, 2nd edition © 2005 Thieme

Proteinogenic amino acids
A. The proteinogenic amino acids
The amino acids that are included in the ge-netic code (see p. 248) are described as “pro-teinogenic.” With a few exceptions (see p. 58),only these amino acids can be incorporatedinto proteins through translation. Only theside chains of the 20 proteinogenic aminoacids are shown here. Their classification isbased on the chemical structure of the sidechains, on the one hand, and on their polarityon the other (see p. 6). The literature includesseveral slightly different systems for classify-ing amino acids, and details may differ fromthose in the system used here.
For each amino acid, the illustration names:• Membership of structural classes I–VII (see
below; e. g., III and VI for histidine)• Name and abbreviation, formed from the
first three letters of the name (e. g., histi-dine, His)
• The one-letter symbol introduced to savespace in the electronic processing of se-quence data (H for histidine)
• A quantitative value for the polarity of theside chain (bottom left; 10.3 for histidine).The more positive this value is, the morepolar the amino acid is.
In addition, the polarity of the side chains isindicated by color. It increases from yellow,through light and dark green, to bluish green.For ionizing side chains, the correspondingpKa values are also given (red numbers).
The aliphatic amino acids (class I) includeglycine, alanine, valine, leucine, and isoleucine.These amino acids do not contain heteroa-toms (N, O, or S) in their side chains and donot contain a ring system. Their side chainsare markedly apolar. Together with threonine(see below), valine, leucine, and isoleucineform the group of branched-chain aminoacids. The sulfurcontaining amino acids cys-teine and methionine (class II), are also apolar.However, in the case of cysteine, this onlyapplies to the undissociated state. Due to itsability to form disulfide bonds, cysteine playsan important role in the stabilization of pro-teins (see p. 72). Two cysteine residues linkedby a disulfide bridge are referred to as cystine(not shown).
The aromatic amino acids (class III) containresonancestabilized rings. In this group, onlyphenylalanine has strongly apolar properties.Tyrosine and tryptophan are moderately polar,and histidine is even strongly polar. The imi-dazole ring of histidine is already protonatedat weakly acidic pH values. Histidine, which isonly aromatic in protonated form (see p. 58),can therefore also be classified as a basicamino acid. Tyrosine and tryptophan showstrong light absorption at wavelengths of250–300 nm.
The neutral amino acids (class IV) havehydroxyl groups (serine, threonine) or amidegroups (asparagine, glutamine). Despite theirnonionic nature, the amide groups of aspara-gine and glutamine are markedly polar.
The carboxyl groups in the side chains ofthe acidic amino acids aspartic acid and glu-tamic acid (class V) are almost completelyionized at physiological pH values. The sidechains of the basic amino acids lysine andarginine are also fully ionized—i. e., positivelycharged—at neutral pH. Arginine, with itspositively charge guanidinium group, is par-ticularly strongly basic, and therefore ex-tremely polar.
Proline (VII) is a special case. Together withthe α-C atom and the α-NH2 group, its sidechain forms a fivemembered ring. Its nitrogenatom is only weakly basic and is not proto-nated at physiological pH. Due to its ringstructure, proline causes bending of the pep-tide chain in proteins (this is important incollagen, for example; see p. 70).
Several proteinogenic amino acids cannotbe synthesized by the human organism, andtherefore have to be supplied from the diet.These essential amino acids (see p. 360) aremarked with a star in the illustration. Histi-dine and possibly also arginine are essentialfor infants and small children.
60 Biomolecules
All rights reserved. Usage subject to terms and conditions of license.Koolman, Color Atlas of Biochemistry, 2nd edition © 2005 Thieme

–2.4 –1.9 –2.0 –2.3 –2.2 –1.2 –1.5
8.3
+0.8 +6.1 +5.9 +6.0 +5.1 +4.9
10.1
6.04.3
4.0
12.510.8
+9.7 +9.4 +11.0 +10.2 +10.3 +15.0 +20.0
H CH3 CH
CH3
H3C CH2
CH
CH3
H3C
C
CH2
H3C H
CH3
CH2
SH
CH2
CH2
S
CH3
C
OH
H3C HCH2
OHCHHN
H2C CH2
CH2
COO
NH
CH2CH2
OH
CH2
CH2
CONH2
CH2
CH2
CONH2
CH2
COO
CH2
HN
HC N
CH
CH2
CH2
CH2
NH
CH2N NH2
CH2
CH2
CH2
CH2
NH3
CH2
CH2
COO
(Gly, G) (Ala, A) (Val, V) (Leu, L) (Ile, I) (Cys, C) (Met, M)Glycine Cysteine
Aliphatic
Alanine Valine Leucine Isoleucine Methionine
Sulfur-containing
pKa value
A. The proteinogenic amino acids
Chiral center
(Phe, F) (Tyr, Y) (Trp, W) (Pro, P) (Ser, S) (Thr, T)Proline
Aromatic Cyclic
Phenylalanine Tyrosine Tryptophan Serine Threonine
Neutral
(Asn,N) (Gln, Q) (Asp, D) (Glu, E) (His, H) (Lys,K) (Arg, R)
Aspartic acid
Acidic
Asparagine Glutamine Glutamic acid Histidine Lysine Arginine
Neutral Basic
Polarity
Essential amino acids
Indole ring Pyrrolidine ring
Imidazole ring
61Amino Acids
All rights reserved. Usage subject to terms and conditions of license.Koolman, Color Atlas of Biochemistry, 2nd edition © 2005 Thieme

Non-proteinogenic amino acids
In addition to the 20 proteinogenic aminoacids (see p. 60), there are also many morecompounds of the same type in nature. Thesearise during metabolic reactions (A) or as aresult of enzymatic modifications of aminoacid residues in peptides or proteins (B). The“biogenic amines” (C) are synthesized from α-amino acids by decarboxylation.
A. Rare amino acids
Only a few important representatives of thenon-proteinogenic amino acids are men-tioned here. The basic amino acid ornithineis an analogue of lysine with a shortened sidechain. Transfer of a carbamoyl residue to or-nithine yields citrulline. Both of these aminoacids are intermediates in the urea cycle (seep.182). Dopa (an acronym of 3,4-dihydroxy-phenylalanine) is synthesized by hydroxyla-tion of tyrosine. It is an intermediate in thebiosynthesis of catecholamines (see p. 352)and of melanin. It is in clinical use in thetreatment of Parkinson’s disease. Selenocys-teine, a cysteine analogue, occurs as a compo-nent of a few proteins—e. g., in the enzymeglutathione peroxidase (see p. 284).
B. Post-translational protein modification
Subsequent alteration of amino acid residuesin finished peptides and proteins is referredto as post-translational modification. These re-actions usually only involve polar amino acidresidues, and they serve various purposes.
The free α-amino group at the N-terminusis blocked in many proteins by an acetyl res-idue or a longer acyl residue (acylation). N-terminal glutamate can cyclize into a pyroglu-tamate residue, while the C-terminal carbox-ylate group can be present in an amidatedform (see TSH, p. 380). The side chains of ser-ine and asparagine residues are often linkedto oligosaccharides (glycosylation, see p. 230).Phosphorylation of proteins mainly affectsserine and tyrosine residues. These reactionshave mainly regulatory functions (see p.114).Aspartate and histidine residues of enzymesare sometimes phosphorylated, too. A specialmodification of glutamate residues, -carbox-ylation, is found in coagulation factors. It isessential for blood coagulation (see p. 290).
The ε-amino group of lysine residues is sub-ject to a particularly large number of modifi-cations. Its acetylation (or deacetylation) is animportant mechanism for controlling geneticactivity (see p. 244). Many coenzymes andcofactors are covalently linked to lysine resi-dues. These include biotin (see p.108), lipoicacid (see p.106), and pyridoxal phosphate(see p.108), as well as retinal (see p. 358).Covalent modification with ubiquitin marksproteins for breakdown (see p.176). In colla-gen, lysine and proline residues are modifiedby hydroxylation to prepare for the formationof stable fibrils (see p. 70). Cysteine residuesform disulfide bonds with one another (seep. 72). Cysteine prenylation serves to anchorproteins in membranes (see p. 214). Covalentbonding of a cysteine residue with heme oc-curs in cytochrome c. Flavins are sometimescovalently bound to cysteine or histidine res-idues of enzymes. Among the modifications oftyrosine residues, conversion into iodinatedthyroxine (see p. 374) is particularly interest-ing.
C. Biogenic amines
Several amino acids are broken down by de-carboxylation. This reaction gives rise to whatare known as biogenic amines, which havevarious functions. Some of them are compo-nents of biomolecules, such as ethanolaminein phospholipids (see p. 50). Cysteamine and
-alanine are components of coenzyme A (seep.12) and of pantetheine (see pp.108, 168).Other amines function as signaling substan-ces. An important neurotransmitter derivedfrom glutamate is γ-aminobutyrate (GABA,see p. 356). The transmitter dopamine is alsoa precursor for the catecholamines epineph-rine and norepinephrine (see p. 352). The bio-genic amine serotonin, a substance that hasmany effects, is synthesized from tryptophanvia the intermediate 5-hydroxytryptophan.
Monamines are inactivated into aldehydesby amine oxidase (monoamine oxidase,“MAO”) with deamination and simultaneousoxidation. MAO inhibitors therefore play animportant role in pharmacological interven-tions in neurotransmitter metabolism.
62 Biomolecules
All rights reserved. Usage subject to terms and conditions of license.Koolman, Color Atlas of Biochemistry, 2nd edition © 2005 Thieme

HN N
COO
C
CH2
CH2
CH2
NH3
H3N H
COO
C
CH2
CH2
CH2
N
H3N H
C NH2
O
H
COO
C
CH2
H3N H
OH
OH
COO
C
CH2
H3N H
Se H
NH3COOCONH2OH
SH
OH
OOC
H3N
Neurotrans-mitter (GABA)
A. Rare amino acids
D: Pyroglutamyl-Acetyl-Formyl-Myristoyl-
B: Oligo-saccharide
(O-glyco-sylation)
B: Oligo-saccharide
(N-glyco-sylation)
D: Phospho-Methyl-γ-Carboxy-(Glu)
D: Acetyl-Methyl-γ-Hydroxy-
B: Pyridoxal-LiponatBiotinRetinalUbiquitin
Ser, Thr Asn, Gln Asp, Glu Lys
Tyr Phe His Cys
Pro
Ornithine Citrulline L-DopaSeleno-cysteine
D: derivative B: bonds with
Amine Function FunctionAmineAmino acidSerine Ethanol-
amineGlutamate
Cysteine Cysteamine Component ofcoenzyme A
Threonine Amino-propanol
Component ofvitamin B12
Aspartate β-Alanine Component ofcoenzyme A
γ-Amino-butyrate
Histidine Mediator, neuro-transmitter
Dopa Dopamine Neurotransmitter
5-Hydroxy-tryptophan
Serotonin Mediator, neuro-transmitter
Amino acid
D: DisulfidePrenyl-
B: HemeFlavin
D: Phospho-Methyl-
B: Flavin
D: 4-Hydroxy-(Tyrosine)
D: Phospho-Iodo-Sulfato-Adenyl-
D: Amido-(CONH2)
D: 3-Hydroxy-4-Hydroxy-
B. Post-translational protein modification
C. Biogenic amines
Glutamate
Histamine
63Amino Acids
All rights reserved. Usage subject to terms and conditions of license.Koolman, Color Atlas of Biochemistry, 2nd edition © 2005 Thieme

Peptides and proteins: overview
A. Proteins
When amino acids are linked together byacid–amide bonds, linear macromolecules(peptides) are produced. Those containingmore than ca. 100 amino acid residues aredescribed as proteins (polypeptides). Everyorganism contains thousands of different pro-teins, which have a variety of functions. At amagnification of ca. 1.5 million, the semi-schematic illustration shows the structuresof a few intra and extracellular proteins, giv-ing an impression of their variety. The func-tions of proteins can be classified as follows.
Establishment and maintenance of struc-ture. Structural proteins are responsible forthe shape and stability of cells and tissues. Asmall part of a collagen molecule is shown asan example (right; see p. 70). The completemolecule is 1.5 300 nm in size, and at themagnification used here it would be as long asthree pages of the book. Histones are alsostructural proteins. They organize the ar-rangement of DNA in chromatin. The basiccomponents of chromatin, the nucleosomes(top right; see p. 218) consist of an octamericcomplex of histones, around which the DNA iscoiled.
Transport. A wellknown transport proteinis hemoglobin in the erythrocytes (bottomleft). It is responsible for the transport of oxy-gen and carbon dioxide between the lungsand tissues (see p. 282). The blood plasmaalso contains many other proteins with trans-port functions. Prealbumin (transthyretin;middle), for example, transports the thyroidhormones thyroxin and triiodothyronine. Ionchannels and other integral membrane pro-teins (see p. 220) facilitate the transport ofions and metabolites across biological mem-branes.
Protection and defense. The immune sys-tem protects the body from pathogens andforeign substances. An important componentof this system is immunoglobulin G (bottomleft; see p. 300). The molecule shown here isbound to an erythrocyte by complex forma-tion with surface glycolipids (see p. 292).
Control and regulation. In biochemical sig-nal chains, proteins function as signaling sub-stances (hormones) and as hormone recep-tors. The complex between the growth
hormone somatotropin and its receptor isshown here as an example (middle). Here,the extracellular domains of two receptormolecules here bind one molecule of the hor-mone. This binding activates the cytoplasmicdomains of the complex, leading to furtherconduction of the signal to the interior ofthe cell (see p. 384). The small peptidehormone insulin is discussed in detail else-where (see pp. 76, 160). DNA-binding proteins(transcription factors; see p.118) are decisivelyinvolved in regulating the metabolism and indifferentiation processes. The structure andfunction of the catabolite activator protein(top left) and similar bacterial transcriptionfactors have been particularly well investi-gated.
Catalysis. Enzymes, with more than 2000known representatives, are the largest groupof proteins in terms of numbers (see p. 88).The smallest enzymes have molecular massesof 10–15 kDa. Intermediatesized enzymes,such as alcohol dehydrogenase (top left) arearound 100–200 kDa, and the largest—including glutamine synthetase with its 12monomers (top right)—can reach more than500 kDa.
Movement. The interaction between actinand myosin is responsible for muscle contrac-tion and cell movement (see p. 332). Myosin(right), with a length of over 150 nm, isamong the largest proteins there are. Actinfilaments (F-actin) arise due to the polymer-ization of relatively small protein subunits (G-actin). Along with other proteins, tropomyo-sin, which is associated with F-actin, controlscontraction.
Storage. Plants contain special storage pro-teins, which are also important for humannutrition (not shown). In animals, muscleproteins constitute a nutrient reserve thatcan be mobilized in emergencies.
64 Biomolecules
All rights reserved. Usage subject to terms and conditions of license.Koolman, Color Atlas of Biochemistry, 2nd edition © 2005 Thieme

Hemoglobin
Immuno-globulin G
PrealbuminWater
Glucose
Cholesterol
Ion channel
Alcoholdehydrogenase
DNACatabolite activatorprotein
Glutaminesynthetase
Myosin
F-Actin
Nucleus
10 nm
Cyto-plasm
Nucleosome
Somatotropinreceptor(dimer)
Somatotropin
Insulin
Blood
Collagentriple helix
Tropo-myosin
A. Proteins
Erythrocyte
65Peptides and Proteins
All rights reserved. Usage subject to terms and conditions of license.Koolman, Color Atlas of Biochemistry, 2nd edition © 2005 Thieme

Peptide bonds
A. Peptide bond
The amino acid components of peptides andproteins are linked together by amide bonds(see p. 60) between α-carboxyl and α-aminogroups. This type of bonding is therefore alsoknown as peptide bonding. In the dipeptideshown here, the serine residue has a freeammonium group, while the carboxylategroup in alanine is free. Since the amino acidwith the free NH3
+ group is named first, thepeptide is known as seryl alanine, or in abbre-viated form Ser-Ala or SA.
B. Resonance
Like all acid–amide bonds, the peptide bond isstabilized by resonance (see p. 4). In the con-ventional notation (top right) it is representedas a combination of a C=O double bond with aC–N single bond. However, a C=N double bondwith charges at O and N could also be written(middle). Both of these are only extreme casesof electron distribution, known as resonancestructures. In reality, the π electrons aredelocalized throughout all the atoms (bot-tom). As a mesomeric system, the peptidebond is planar. Rotation around the C–Nbond would only be possible at the expenseof large amounts of energy, and the bond istherefore not freely rotatable. Rotations areonly possible around the single bonds markedwith arrows. The state of these is expressedusing the angles φ and ψ (see D). The plane inwhich the atoms of the peptide bond lie ishighlighted in light blue here and on the fol-lowing pages.
C. Peptide nomenclature
Peptide chains have a direction and thereforetwo different ends. The amino terminus (Nterminus) of a peptide has a free ammoniumgroup, while the carboxy terminus (C termi-nus) is formed by the carboxylate group of thelast amino acid. In peptides and proteins, theamino acid components are usually linked inlinear fashion. To express the sequence of apeptide, it is therefore suf cient to combinethe three-letter or single-letter abbreviationsfor the amino acid residues (see p. 60). Thissequence always starts at the N terminus. For
example, the peptide hormone angiotensin II(see p. 330) has the sequence Asp-Arg-Val-Tyr-Ile-His-Pro-Phe, or DRVYIHPF.
D. Conformational space of the peptidechain
With the exception of the terminal residues,every amino acid in a peptide is involved intwo peptide bonds (one with the precedingresidue and one with the following one). Dueto the restricted rotation around the C–Nbond, rotations are only possible around theN–Cα and Cα–C bonds (2). As mentionedabove, these rotations are described by thedihedral angles φ (phi) and ψ (psi). The angledescribes rotation around the N–Cα bond; ψdescribes rotation around Cα–C—i. e., the po-sition of the subsequent bond.
For steric reasons, only specific combina-tions of the dihedral angles are possible.These relationships can be illustrated clearlyby a so-called φ/ψ diagram (1). Most combi-nations of φ and ψ are sterically “forbidden”(red areas). For example, the combination φ =0° and ψ = 180° (4) would place the twocarbonyl oxygen atoms less than 115 pmapart—i. e., at a distance much smaller thanthe sum of their van der Waals radii (see p. 6).Similarly, in the case of φ = 180° and ψ = 0° (5),the two NH hydrogen atoms would collide.The combinations located within the greenareas are the only ones that are stericallyfeasible (e. g., 2 and 3). The important secon-dary structures that are discussed in the fol-lowing pages are also located in these areas.The conformations located in the yellow areasare energetically less favorable, but still pos-sible.
The φ/ψ diagram (also known as a Rama-chandran plot) was developed from modelingstudies of small peptides. However, the con-formations of most of the amino acids in pro-teins are also located in the permitted areas.The corresponding data for the small protein,insulin (see p. 76), are represented by blackdots in 1.
66 Biomolecules
All rights reserved. Usage subject to terms and conditions of license.Koolman, Color Atlas of Biochemistry, 2nd edition © 2005 Thieme

180
120
60
ψ 0
-60
-120
-180 -120 -60 0 60 120 180
ϕ
A-9 B-20B-8
αr
βp
βaC
B-23
αl
2.
3.
4.
5.
ϕ
ψ
2 R
13
R3
1
ϕψ2
R
ϕ
ψ
1
3
2
ϕψ
R
2
1 31.
C N
H
O
C N
H
O
C N
H
O
ϕ ψ
H3NC
CN
CC
NC
CN
CC
NC
COO
R1
O
H
R2
O
H
R3
O
H
R4
O
H
Rn
HHH
H H
C N
H
O
C N
O
H
C N
O
H
A. Peptide bonds
C. Peptide nomenclature
Residue 1 Residue 2 Residue 3 Residue 4 Residue
Aminoterminus(N terminus)
Carboxy- terminus(C terminus)
B. Resonance
Resonancestructures
Mesomericstructure
Seryl alanine(Ser-Ala, H3N-Ser-Ala-COO , SA)
D. Conformation space of the peptide chain
ϕ (Phi): Rotation aboutj (Phi): N – Cαψ (Psi): Rotation abouty (Psi): Cα – C
Allowed Forbidden
ϕ = 0°ψ = 180°
d = 115 pm
ϕ = -139°ψ = -135°
ϕ = 180°ψ = 0°
d =155 pm
ϕ = -57°ψ = -47°
Collagen helixC
Pleated sheet (antiparallel)
Pleated sheet (parallel)
αr
αl
α Helix (right-handed)
α Helix (left-handed)
βa
βp
67Peptides and Proteins
All rights reserved. Usage subject to terms and conditions of license.Koolman, Color Atlas of Biochemistry, 2nd edition © 2005 Thieme

Secondary structures
In proteins, specific combinations of the dihe-dral angles φ and ψ (see p. 66) are much morecommon than others. When several succes-sive residues adopt one of these conforma-tions, defined secondary structures arise,which are stabilized by hydrogen bonds ei-ther within the peptide chain or betweenneighboring chains. When a large part of aprotein takes on a defined secondary struc-ture, the protein often forms mechanicallystable filaments or fibers. Structural proteinsof this type (see p. 70) usually have character-istic amino acid compositions.
The most important secondary structuralelements of proteins are discussed here first.The illustrations only show the course of thepeptide chain; the side chains are omitted. Tomake the course of the chains clearer, thelevels of the peptide bonds are shown asblue planes. The dihedral angles of the struc-tures shown here are also marked in diagramD1 on p. 67.
A. -Helix
The right-handed α-helix (αR) is one of themost common secondary structures. In thisconformation, the peptide chain is woundlike a screw. Each turn of the screw (the screwaxis in shown in orange) covers approxi-mately 3.6 amino acid residues. The pitch ofthe screw (i. e., the smallest distance betweentwo equivalent points) is 0.54 nm. α-Helicesare stabilized by almost linear hydrogen bondsbetween the NH and CO groups of residues,which are four positions apart from each an-other in the sequence (indicated by red dots;see p. 6). In longer helices, most amino acidresidues thus enter into two H bonds. Apolaror amphipathic α-helices with five to seventurns often serve to anchor proteins in bio-logical membranes (transmembrane helices;see p. 214).
The mirror image of the αR helix, the left-handed -helix (αL), is rarely found in nature,although it would be energetically “permissi-ble.”
B. Collagen helix
Another type of helix occurs in the collagens,which are important constituents of the con-nectivetissue matrix (see pp. 70, 344). Thecollagen helix is left-handed, and with a pitchof 0.96 nm and 3.3 residues per turn, it issteeper than the α-helix. In contrast to theα-helix, H bonds are not possible within thecollagen helix. However, the conformation isstabilized by the association of three helicesto form a righthanded collagen triple helix(see p. 70).
C. Pleated-sheet structures
Two additional, almost stretched, conforma-tions of the peptide chain are known aspleated sheets, as the peptide planes are ar-ranged like a regularly folded sheet of paper.Again, H bonds can only form between neigh-boring chains (“strands”) in pleated sheets.When the two strands run in opposite direc-tions (1), the structure is referred to as anantiparallel pleated sheet (βa). When theyrun in the same direction (2), it is a parallelpleated sheet (βp). In both cases, the α-Catoms occupy the highest and lowest pointsin the structure, and the side chains pointalternately straight up or straight down (seep. 71 C). The βa structure, with its almost lin-ear H bonds, is energetically more favorable.In extended pleated sheets, the individualstrands of the sheet are usually not parallel,but twisted relative to one another (see p. 74).
D. Turns
Turns are often found at sites where thepeptide chain changes direction. These aresections in which four amino acid residuesare arranged in such a way that the courseof the chain reverses by about 180° into theopposite direction. The two turns shown(types I and II) are particularly frequent.Both are stabilized by hydrogen bonds be-tween residues 1 and 4. β Turns are oftenlocated between the individual strands ofantiparallel pleated sheets, or betweenstrands of pleated sheets and α helices.
68 Biomolecules
All rights reserved. Usage subject to terms and conditions of license.Koolman, Color Atlas of Biochemistry, 2nd edition © 2005 Thieme

N C N C
N
C
N
C
A. α Helix B. Collagen helix
1. Type I 2. Type II
1. Antiparallel 2. Parallelϕ = –139˚ψ = +135˚
ϕ = –119˚ψ = +113˚
D. β Turns
C. Pleated-sheet structures
0.54
nm
0.15
nm
ϕ = –57˚ψ = –47˚
0.96
nm
0.29
nm
–80˚ < ϕ < –50˚+130˚ < ψ < +155˚
69Peptides and Proteins
All rights reserved. Usage subject to terms and conditions of license.Koolman, Color Atlas of Biochemistry, 2nd edition © 2005 Thieme

Structural proteins
The structural proteins give extracellularstructures mechanical stability, and are in-volved in the structure of the cytoskeleton(see p. 204). Most of these proteins contain ahigh percentage of specific secondary struc-tures (see p. 68). For this reason, the aminoacid composition of many structural proteinsis also characteristic (see below).
A. Keratin
-Keratin is a structural protein that predom-inantly consists of α helices. Hair (wool),feathers, nails, claws and the hooves of ani-mals consist largely of keratin. It is also animportant component of the cytoskeleton(cytokeratin), where it appears in intermedi-ate filaments (see p. 204).
In the keratins, large parts of the peptidechain show right-handed α-helical coiling.Two chains each form a left-handed super-helix, as is also seen in myosin (see p. 65).The superhelical keratin dimers join to formtetramers, and these aggregate further toform protofilaments, with a diameter of3 nm. Finally, eight protofilaments thenform an intermediate filament, with a diam-eter of 10 nm (see p. 204).
Similar keratin filaments are found in hair.In a single wool fiber with a diameter of about20 µm, millions of filaments are bundled to-gether within dead cells. The individual kera-tin helices are cross-linked and stabilized bynumerous disulfide bonds (see p. 72). This factis exploited in the perming of hair. Initially,the disulfide bonds of hair keratin are dis-rupted by reduction with thiol compounds(see p. 8). The hair is then styled in the desiredshape and heat-dried. In the process, newdisulfide bonds are formed by oxidation,which maintain the hairstyle for some time.
B. Collagen
Collagen is the quantitatively most importantprotein in mammals, making up about 25% ofthe total protein. There are many differenttypes of collagen, particularly in connectivetissue. Collagen has an unusual amino acidcomposition. Approximately one-third of theamino acids are glycine (Gly), about 10% pro-line (Pro), and 10% hydroxyproline (Hyp). The
two latter amino acids are only formed duringcollagen biosynthesis as a result of posttrans-lational modification (see p. 344).
The triplet Gly-X-Y (2) is constantly re-peated in the sequence of collagen, with theX position often being occupied by Pro andthe Y position by Hyp. The reason for this isthat collagen is largely present as a triple helixmade up of three individual collagen helices(1). In triple helices, every third residue lieson the inside of the molecule, where for stericreasons there is only room for glycine resi-dues (3; the glycine residues are shown inyellow). Only a small section of a triple helixis illustrated here. The complete collagenmolecule is approximately 300 nm long.
C. Silk fibroin
Silk is produced from the spun threads fromsilkworms (the larvae of the moth Bombyxmori and related species). The main proteinin silk, fibroin, consists of antiparallel pleatedsheet structures arranged one on top of theother in numerous layers (1). Since the aminoacid side chains in pleated sheets point eitherstraight up or straight down (see p. 68), onlycompact side chains fit between the layers. Infact, more than 80% of fibroin consists of gly-cine, alanine, and serine, the three aminoacids with the shortest side chains. A typicalrepetitive amino acid sequence is (Gly-Ala-Gly-Ala-Gly-Ser). The individual pleated sheetlayers in fibroin are found to lie alternately0.35 nm and 0.57 nm apart. In the first case,only glycine residues (R = H) are opposed toone another. The slightly greater distance of0.57 nm results from repulsion forces be-tween the side chains of alanine and serineresidues (2).
70 Biomolecules
All rights reserved. Usage subject to terms and conditions of license.Koolman, Color Atlas of Biochemistry, 2nd edition © 2005 Thieme

Ala
Gly
Ala
Gly
Ala Ala
Gly Gly
GlyGly
SerAla
Gly
Gly
Gly
Gly
Gly
Gly
Arg
Gln
Pro
Pro
Ala
X
Hyp
Arg
Hyp
Gln
Arg
Y
Gly
3 nm
10 nm
A. α-Keratin
C. Silk fibroin
Left-handedsuperhelix
Right-handedα helix
Intermediaryfilament
Protofilament
1. Spatial illustration
B. Collagen
1. Triple helix (section)
2. Front view
0.35
nm
0.57
nm
3. Triple helix(view from above)
2. Typical sequence
71Peptides and Proteins
All rights reserved. Usage subject to terms and conditions of license.Koolman, Color Atlas of Biochemistry, 2nd edition © 2005 Thieme

Globular proteins
Soluble proteins have a more complex struc-ture than the fibrous, completely insolublestructural proteins. The shape of soluble pro-teins is more or less spherical (globular). Intheir biologically active form, globularproteins have a defined spatial structure(the native conformation). If this structure isdestroyed (denaturation; see p. 74), not onlydoes the biological effect disappear, but theprotein also usually precipitates in insolubleform. This happens, for example, when eggsare boiled; the proteins dissolved in the eggwhite are denatured by the heat and producethe solid egg white.
To illustrate protein conformations in aclear (but extremely simplified) way, Richard-son diagrams are often used. In thesediagrams, α-helices are symbolized by redcylinders or spirals and strands of pleatedsheets by green arrows. Less structured areasof the chain, including the β-turns, are shownas sections of gray tubing.
A. Conformation-stabilizing interactions
The native conformation of proteins is stabi-lized by a number of different interactions.Among these, only the disulfide bonds (B)represent covalent bonds. Hydrogen bonds,which can form inside secondary structures,as well as between more distant residues, areinvolved in all proteins (see p. 6). Many pro-teins are also stabilized by complex formationwith metal ions (see pp. 76, 342, and 378, forexample). The hydrophobic effect is particu-larly important for protein stability. In glob-ular proteins, most hydrophobic amino acidresidues are arranged in the interior of thestructure in the native conformation, whilethe polar amino acids are mainly found onthe surface (see pp. 28, 76).
B. Disulfide bonds
Disulfide bonds arise when the SH groups oftwo cysteine residues are covalently linked asa dithiol by oxidation. Bonds of this type areonly found (with a few exceptions) in extra-cellular proteins, because in the interior of thecell glutathione (see p. 284) and other reduc-ing compounds are present in such high con-centrations that disulfides would be reduc-
tively cleaved again. The small plant proteincrambin (46 amino acids) contains three di-sulfide bonds and is therefore very stable. Thehigh degree of stability of insulin (see p. 76)has a similar reason.
C. Protein dynamics
The conformations of globular proteins arenot rigid, but can change dramatically onbinding of ligands or in contact with otherproteins. For example, the enzyme adenylatekinase (see p. 336) has a mobile domain (do-main = independently folded partial struc-ture), which folds shut after binding of thesubstrate (yellow). The larger domain (bot-tom) also markedly alters its conformation.There are large numbers of allostericproteins of this type. This group includes, forexample, hemoglobin (see p. 280), calmodulin(see p. 386), and many allosteric enzymessuch as aspartate carbamoyltransferase (seep.116).
D. Folding patterns
The globular proteins show a high degree ofvariability in folding of their peptide chains.Only a few examples are shown here. Purelyhelically folded proteins such as myoglobin (1;see p. 74, heme yellow) are rare. In general,pleated sheet and helical elements existalongside each other. In the hormone-bindingdomain of the estrogen receptor (2; see p. 378),a small, two-stranded pleated sheet functionsas a “cover” for the hormone binding site(estradiol yellow). In flavodoxin, a small flavo-protein with a redox function (3; FMN yel-low), a fan-shaped, pleated sheet made up offive parallel strands forms the core of themolecule. The conformation of the β subunitof the G-protein transducin (4; see pp. 224,358) is very unusual. Seven pleated sheetsform a large, symmetrical “β propeller.” TheN-terminal section of the protein contains onelong and one short helix.
72 Biomolecules
All rights reserved. Usage subject to terms and conditions of license.Koolman, Color Atlas of Biochemistry, 2nd edition © 2005 Thieme

S
NH
CO
SS
C O
N H
CH2HC CH2 CH
A. Conformation-stabilizing interactions
C. Protein dynamics
D. Folding patterns
4. Transducin (β subunit)
B. Disulfide bonds
1. Myoglobin
2. Estrogen receptor (domain)
3. Flavodoxin
Polar surface
Apolar core
Disulfidebond
Metalcomplex
Hydrogen bond
Mobile domain
Adenylate kinase
Substrate
73Peptides and Proteins
All rights reserved. Usage subject to terms and conditions of license.Koolman, Color Atlas of Biochemistry, 2nd edition © 2005 Thieme

Protein folding
Information about the biologically active (na-tive) conformation of proteins is already en-coded in their amino acid sequences. The na-tive forms of many proteins arise spontane-ously in the test tube and within a few mi-nutes. Nevertheless, there are specialauxiliary proteins (chaperonines) that sup-port the folding of other proteins in the con-ditions present within the cell (see p. 232). Animportant goal of biochemistry is to under-stand the laws governing protein folding. Thiswould make it possible to predict the confor-mation of a protein from the easily accessibleDNA sequence (see p. 260).
A. Folding and denaturation ofribonuclease A
The folding of proteins to the native form isfavored under physiological conditions. Thenative conformation is lost, as the result ofdenaturation, at extreme pH values, at hightemperatures, and in the presence of organicsolvents, detergents, and other denaturingsubstances, such as urea.
The fact that a denatured protein can spon-taneously return to its native conformationwas demonstrated for the first time with ri-bonuclease, a digestive enzyme (see p. 266)consisting of 124 amino acids. In the nativeform (top right), there are extensive pleatedsheet structures and three α helices. The eightcysteine residues of the protein are formingfour disulfide bonds. Residues His-12, Lys-41and His-119 (pink) are particularly importantfor catalysis. Together with additional aminoacids, they form the enzyme’s active center.
The disulfide bonds can be reductivelycleaved by thiols (e. g., mercaptoethanol,HO-CH2-CH2-SH). If urea at a high concentra-tion is also added, the protein unfolds com-pletely. In this form (left), it is up to 35 nmlong. Polar (green) and apolar (yellow) sidechains are distributed randomly. The dena-tured enzyme is completely inactive, becausethe catalytically important amino acids (pink)are too far away from each other to be able tointeract with each other and with the sub-strate.
When the urea and thiol are removed bydialysis (see p. 78), secondary and tertiarystructures develop again spontaneously. Thecysteine residues thus return to a suf cientlyclose spatial vicinity that disulfide bonds canonce again form under the oxidative effect ofatmospheric oxygen. The active center alsoreestablishes itself. In comparison with thedenatured protein, the native form is aston-ishingly compact, at 4.5 2.5 nm. In this state,the apolar side chains (yellow) predominatein the interior of the protein, while the polarresidues are mainly found on the surface. Thisdistribution is due to the “hydrophobic effect”(see p. 28), and it makes a vital contribution tothe stability of the native conformation (B).
B. Energetics of protein folding
The energetics of protein folding are not atpresent satisfactorily understood. Only a sim-plified model is discussed here. The confor-mation of a molecule is stable in any givenconditions if the change in its free enthalpyduring folding (∆Gfold) is negative (see p.16).The magnitude of the folding enthalpy is af-fected by several factors. The main factorworking against folding is the strong increasein the ordering of the molecule involved. Asdiscussed on p. 20, this leads to a negativechange in entropy of ∆Sconf and therefore toa strongly positive entropy term –T ∆S (violetarrow). By contrast, the covalent and nonco-valent bonds in the interior of the proteinhave a stabilizing influence. For this reason,the change in folding enthalpy ∆Hfold is neg-ative (red arrow). A third factor is the changein the system’s entropy due to the hydropho-bic effect. During folding, the degree of orderin the surrounding water decreases—i. e.,∆Swater is positive and therefore –T ∆S isnegative (blue arrow). When the sum of theseeffects is negative (green arrow), the proteinfolds spontaneously into its native conforma-tion.
74 Biomolecules
All rights reserved. Usage subject to terms and conditions of license.Koolman, Color Atlas of Biochemistry, 2nd edition © 2005 Thieme

26-84
40-95
58-110
65-72
–
+
40
95
26
84
58
110
65
72
A. Folding and denaturation of ribonuclease A
Folding
B. Energetics of protein folding
Denaturation
Ener
gy
∆Hfa
lt
-T·∆
S conf
∆Gfold = ∆Hfold –T·∆Swater –T·∆Sconf
Increased orderin the molecule
Reducedorderin water
Interactionsin themolecule
Free enthalpyof folding(∆Gfold)
-T·∆
S was
N terminus N terminus
C terminus
His -12
Lys-41
C terminus
His-119
His -12
Lys-41
His-119
75Peptides and Proteins
All rights reserved. Usage subject to terms and conditions of license.Koolman, Color Atlas of Biochemistry, 2nd edition © 2005 Thieme

Molecular models: insulin
The opposite page presents models of insulin,a small protein. The biosynthesis and functionof this important hormone are discussed else-where in this book (pp.160, 388). Monomericinsulin consists of 51 amino acids, and with amolecular mass of 5.5 kDa it is only half thesize of the smallest enzymes. Nevertheless, ithas the typical properties of a globular pro-tein.
Large quantities of pure insulin are re-quired for the treatment of diabetes mellitus(see p.160). The annual requirement for insu-lin is over 500 kg in a country the size ofGermany. Formerly, the hormone had to beobtained from the pancreas of slaughteredanimals in a complicated and expensiveprocedure. Human insulin, which is producedby overexpression in genetically engineeredbacteria, is now mainly used (see p. 262).
A. Structure of insulin
There are various different structural levels inproteins, and these can be briefly discussedagain here using the example of insulin.
The primary structure of a protein is itsamino acid sequence. During the biosynthesisof insulin in the pancreas, a continuous pep-tide chain with 84 residues is first synthesi-zed—proinsulin (see p.160). After folding ofthe molecule, the three disulfide bonds arefirst formed, and residues 31 to 63 are thenproteolytically cleaved releasing the so-calledC peptide. The molecule that is left over (1)now consists of two peptide chains, the Achain (21 residues, shown in yellow) and theB chain (30 residues, orange). One of the di-sulfide bonds is located inside the A chain,and the two others link the two chains to-gether.
Secondary structures are regions of thepeptide chain with a defined conformation(see p. 68) that are stabilized by H-bonds. Ininsulin (2), the α-helical areas are predomi-nant, making up 57% of the molecule; 6%consists of β-pleated-sheet structures, and10% of β-turns, while the remainder (27%)cannot be assigned to any of the secondarystructures.
The three-dimensional conformation of aprotein, made up of secondary structural ele-ments and unordered sections, is referred to
as the tertiary structure. In insulin, it is com-pact and wedge-shaped (B). The tip of thewedge is formed by the B chain, whichchanges its direction at this point.
Quaternary structure. Due to non-covalentinteractions, many proteins assemble to formsymmetrical complexes (oligomers). The indi-vidual components of oligomeric proteins(usually 2–12) are termed subunits or mono-mers. Insulin also forms quaternary struc-tures. In the blood, it is partly present as adimer. In addition, there are also hexamersstabilized by Zn2+ ions (light blue) (3), whichrepresent the form in which insulin is storedin the pancreas (see p.160).
B. Insulin (monomer)
The van der Waals model of monomeric in-sulin (1) once again shows the wedge-shapedtertiary structure formed by the two chainstogether. In the second model (3, bottom), theside chains of polar amino acids are shown inblue, while apolar residues are yellow or pink.This model emphasizes the importance of the“hydrophobic effect” for protein folding (seep. 74). In insulin as well, most hydrophobicside chains are located on the inside of themolecule, while the hydrophilic residues arelocated on the surface. Apparently in contra-diction to this rule, several apolar side chains(pink) are found on the surface. However, allof these residues are involved in hydrophobicinteractions that stabilize the dimeric andhexameric forms of insulin.
In the third model (2, right), the coloredresidues are those that are located on thesurface and occur invariably (red) or almostinvariably (orange) in all known insulins. It isassumed that amino acid residues that are notreplaced by other residues during the courseof evolution are essential for the protein’sfunction. In the case of insulin, almost all ofthese residues are located on one side of themolecule. They are probably involved in thebinding of the hormone to its receptor (seep. 224).
76 Biomolecules
All rights reserved. Usage subject to terms and conditions of license.Koolman, Color Atlas of Biochemistry, 2nd edition © 2005 Thieme

2324252627282930R R A K P T Y F F G
R22
1 2 3 4 5 6 12 13 14 15 16 17 18 19 20CG I V E Q S L Y Q L E N
21Y C N
1 2 3 4 5 6 7 8 9 10 11 12 13 14 15 16 17 18 19 20
21F V N Q H L C G S H L V E A L Y L V C G
E
T S I
7C
11C
8 9 10
K RQ
E
NH3
NH3
OOC
OOC
NH3
OOC
OOC
NH3
1. 2.
3.
A chain
C peptide
2. Secondary and tertiary structure
B chain
A-chain
B-chain
Polarside chain
Apolarside chain
Invariantresidue
Involvedin subunitinteractions
A. Structure of insulin
1. Primary structure
B chain
A chain
C Peptide
Disulfide bonds
3. Quaternary structure
B. Insulin (monomer)
77Peptides and Proteins
All rights reserved. Usage subject to terms and conditions of license.Koolman, Color Atlas of Biochemistry, 2nd edition © 2005 Thieme

Isolation and analysis of proteins
Purified proteins are nowadays required for awide variety of applications in research, med-icine, and biotechnology. Since the globularproteins in particular are very unstable (seep. 72), purification is carried out at low tem-peratures (0–5 °C) and particularly gentleseparation processes are used. A few of themethods of purifying and characterizing pro-teins are discussed on this page.
A. Salt precipitation
The solubility of proteins is strongly depen-dent on the salt concentration (ionic strength)of the medium. Proteins are usually poorlysoluble in pure water. Their solubility in-creases as the ionic strength increases, be-cause more and more of the well-hydratedanorganic ions (blue circles) are bound tothe protein’s surface, preventing aggregationof the molecules (salting in). At very highionic strengths, the salt withdraws the hy-drate water from the proteins and thus leadsto aggregation and precipitation of the mole-cules (salting out). For this reason, addingsalts such as ammonium sulfate (NH4)2SO4
makes it possible to separate proteins from amixture according to their degree of solubility(fractionation).
B. Dialysis
Dialysis is used to remove lower-molecularcomponents from protein solutions, or to ex-change the medium. Dialysis is based on thefact that due to their size, protein moleculesare unable to pass through the pores of asemipermeable membrane, while lower-mo-lecular substances distribute themselvesevenly between the inner and outer spacesover time. After repeated exchanging of theexternal solution, the conditions inside thedialysis tube (salt concentration, pH, etc.)will be the same as in the surrounding solu-tion.
C. Gel filtration
Gel permeation chromatography (“gel filtra-tion”) separates proteins according to theirsize and shape. This is done using a chroma-tography column, which is filled with
spherical gel particles (diameter 10–500 µm)of polymeric material (shown schematicallyin 1a). The insides of the particles are tra-versed by channels that have defined diame-ters. A protein mixture is then introduced atthe upper end of the column (1b) and elutionis carried out by passing a buffer solutionthrough the column. Large protein molecules(red) are unable to penetrate the particles,and therefore pass through the columnquickly. Medium-sized (green) and small par-ticles (blue) are delayed for longer or shorterperiods (1c). The proteins can be collectedseparately from the ef uent (eluate) (2). Theirelution volume Ve depends mainly on theirmolecular mass (3).
D. SDS gel electrophoresis
The most commonly used procedure forchecking the purity of proteins is sodium do-decyl sulfate polyacrylamide gel electropho-resis (SDS-PAGE). In electrophoresis, mole-cules move in an electrical field (see p. 276).Normally, the speed of their movement de-pends on three factors—their size, their shape,and their electrical charge.
In SDS-PAGE, the protein mixture is treatedin such a way that only the molecules’ massaffects their movement. This is achieved byadding sodium dodecyl sulfate (C12H25-OSO3Na), the sulfuric acid ester of lauryl alco-hol (dodecyl alcohol). SDS is a detergent withstrongly amphipathic properties (see p. 28). Itseparates oligomeric proteins into their sub-units and denatures them. SDS moleculesbind to the unfolded peptide chains (ca.0.4 g SDS / g protein) and give them a stronglynegative charge. To achieve complete denatu-ration, thiols are also added in order to cleavethe disulfide bonds (1).
Following electrophoresis, which is carriedout in a vertically arranged gel of polymericacrylamide (2), the separated proteins aremade visible by staining. In example (3), thefollowing were separated: a) a cell extractwith hundreds of different proteins, b) a pro-tein purified from this, and c) a mixture ofproteins with known masses.
78 Biomolecules
All rights reserved. Usage subject to terms and conditions of license.Koolman, Color Atlas of Biochemistry, 2nd edition © 2005 Thieme

22
20
18
16
14
12
a b c
20 40 60801012 16 20 248
Ve (mL)
20 40 60 80a b c
SDS
SS
D. SDS gel electrophoresisC. Gel filtration
A. Salt precipitation B. Dialysis
Dialysistube
Proteinsolution
StirrerBuffersolution
Ion Protein
Solubility
Salting in
Salting out
Salt concentration
1. Principle
PumpChannel
Gel particle(cross-section)
Elutionbuffer
Column
Eluted volume (mL)
2. Elution diagram 3. Analysis
Mass (kDa)
Gelparticle
3. Stained gel 4. Analysis
Mass (kDa)
Distance
2. Apparatus
Lower bufferreservoir
Upper bufferreservoir
Polyacrylamidegel
Cathode
Anode
Plasticcasing
Probe
1. Principle
Denatured
Folded
R – SH Thiol
Hydrateshell
Exclusionvolume
79Peptides and Proteins
All rights reserved. Usage subject to terms and conditions of license.Koolman, Color Atlas of Biochemistry, 2nd edition © 2005 Thieme

Bases and nucleotides
The nucleic acids play a central role in thestorage and expression of genetic information(see p. 236). They are divided into two majorclasses: deoxyribonucleic acid (DNA) func-tions solely in information storage, while ri-bonucleic acids (RNAs) are involved in moststeps of gene expression and protein biosyn-thesis. All nucleic acids are made up fromnucleotide components, which in turn consistof a base, a sugar, and a phosphate residue.DNA and RNA differ from one another in thetype of the sugar and in one of the bases thatthey contain.
A. Nucleic acid bases
The bases that occur in nucleic acids arearomatic heterocyclic compounds derivedfrom either pyrimidine or purine. Five of thesebases are the main components of nucleicacids in all living creatures. The purine basesadenine (abbreviation Ade, not “A”!) and gua-nine (Gua) and the pyrimidine base cytosine(Cyt) are present in both RNA and DNA. Incontrast, uracil (Ura) is only found in RNA. InDNA, uracil is replaced by thymine (Thy), the5-methyl derivative of uracil. 5-methylcyto-sine also occurs in small amounts in the DNAof the higher animals. A large number of othermodified bases occur in tRNA (see p. 82) andin other types of RNA.
B. Nucleosides, nucleotides
When a nucleic acid base is N-glycosidicallylinked to ribose or 2-deoxyribose (see p. 38), ityields a nucleoside. The nucleoside adenosine(abbreviation: A) is formed in this way fromadenine and ribose, for example. The corre-sponding derivatives of the other bases arecalled guanosine (G), uridine (U), thymidine(T) and cytidine (C). When the sugar compo-nent is 2-deoxyribose, the product is adeoxyribonucleoside—e. g., 2-deoxyadeno-sine (dA, not shown). In the cell, the 5OHgroup of the sugar component of the nucleo-side is usually esterified with phosphoric acid.2-Deoxythymidine (dT) therefore gives riseto 2-deoxythymidine-5-monophosphate(dTMP), one of the components of DNA (2).If the 5phosphate residue is linked via anacid–anhydride bond to additional phosphate
residues, it yields nucleoside diphosphatesand triphosphates—e. g., ADP and ATP, whichare important coenzymes in energy metabo-lism (see p.106). All of these nucleoside phos-phates are classified as nucleotides.
In nucleosides and nucleotides, the pentoseresidues are present in the furanose form (seep. 34). The sugars and bases are linked by anN-glycosidic bond between the C-1 of thesugar and either the N-9 of the purine ringor N-1 of the pyrimidine ring. This bond al-ways adopts the β-configuration.
C. Oligonucleotides, polynucleotides
Phosphoric acid molecules can form acid–an-hydride bonds with each other. It is thereforepossible for two nucleotides to be linked viathe phosphate residues. This gives rise to di-nucleotides with a phosphoric acid–anhydridestructure. This group includes the coenzymesNAD(P)+ and CoA, as well as the flavinderivative FAD (1; see p.104).
If the phosphate residue of a nucleotidereacts with the 3-OH group of a second nu-cleotide, the result is a dinucleotide with aphosphoric acid diester structure. Dinucleo-tides of this type have a free phosphate resi-due at the 5 end and a free OH group at the 3end. They can therefore be extended withadditional mononucleotides by adding fur-ther phosphoric acid diester bonds. This isthe way in which oligonucleotides, and ulti-mately polynucleotides, are synthesized.
Polynucleotides consisting of ribonucleo-tide components are called ribonucleic acid(RNA), while those consisting of deoxyribonu-cleotide monomers are called deoxyribonu-cleic acid (DNA; see p. 84). To describe thestructure of polynucleotides, the abbrevia-tions for the nucleoside components are writ-ten from left to right in the 53 direction.The position of the phosphate residue is alsosometimes indicated by a “p”. In this way, thestructure of the RNA segment shown Fig. 2can be abbreviated as ..pUpG.. or simply as.. UG .. .
80 Biomolecules
All rights reserved. Usage subject to terms and conditions of license.Koolman, Color Atlas of Biochemistry, 2nd edition © 2005 Thieme

1
2 3 4
56 7
9
12
3 4 5
6
8
RNAF A
F A
U
G
TP
TP
A
5'
1'β
A 5'
1'
β
N
HCN
CH
CH
HC
HN
CNH
CH
CHC
O
O
HN
CNH
CH
CC
O
O
CH3N
CNH
CH
CHC
O
NH2
N
HCN
C
C
HC
NH
CHN
N
HCN
C
CC
NH
CHN
NH2
N
CHN
C
CC
NHC
N
NH2
OCH2HO
H
OH OH
HH H
N
OCH2O
H
OH H
HH H
PO
O
O
CH
CC
HN
CO
CH3
O
N
CN
C
CC
NC
N
N
OCH2O
H
OH OH
HH H
H
H H
H
PO
O
O
PO
O
O
H2C
CH OH
C
C
OHH
CH2
OHH
NC
CN
C
C
CC
CC N
C
NCH3C
H3C
H
H O
H
O
NH
CN
C
CC
NHC
N
O
OCH2O
H
O OH
HH H
NH2PO
O
O
N
OCH2O
H
OH
HH H
PO
O
O
C
NHC
HC
HC
O
O
To the 5' end
A. Nucleic acid bases
Pyrimidine
Pyrimidine bases
Purine bases
Purine
Uracil (Ura) Thymine (Thy) Cytosine (Cyt)
Adenine (Ade) Guanine (Gua)
B. Nucleosides, nucleotides
1. Adenosine (Ado) 2. 2'-Deoxythymidine 5'-monophosphate (dtMP)
C. Oligonucleotides, polynucleotides
1. Flavin adenine dinucleotide(FAD) 2. RNA (section)
Flavin
To the 3' end
Ribose
Ribitol
Phosphoric aciddiester bond
Phosphoric acid–anhydride bond
HN
CN
C
CC
NH
CHN
O
H2N
81Nucleotides and Nucleic Acids
All rights reserved. Usage subject to terms and conditions of license.Koolman, Color Atlas of Biochemistry, 2nd edition © 2005 Thieme

RNA
Ribonucleic acids (RNAs) are polymers con-sisting of nucleoside phosphate componentsthat are linked by phosphoric acid diesterbonds (see p. 80). The bases the contain aremainly uracil, cytosine, adenine, and guanine,but many unusual and modified bases are alsofound in RNAs (B).
A. Ribonucleic acids (RNAs)
RNAs are involved in all the individual steps ofgene expression and protein biosynthesis (seepp. 242–253). The properties of the most im-portant forms of RNA are summarized in thetable. The schematic diagram also gives anidea of the secondary structure of these mol-ecules.
In contrast to DNA, RNAs do not form ex-tended double helices. In RNAs, the base pairs(see p. 84) usually only extend over a fewresidues. For this reason, substructures oftenarise that have a finger shape or clover-leafshape in two-dimensional representations. Inthese, the paired stem regions are linked byloops. Large RNAs such as ribosomal 16S-rRNA (center) contain numerous “stem andloop” regions of this type. These sections areagain folded three-dimensionally—i. e., likeproteins, RNAs have a tertiary structure (seep. 86). However, tertiary structures are onlyknown of small RNAs, mainly tRNAs. The dia-grams in Fig. B and on p. 86 show that the“clover-leaf” structure is not recognizable ina three-dimensional representation.
Cellular RNAs vary widely in their size,structure, and lifespan. The great majority ofthem are ribosomal RNA (rRNA), which inseveral forms is a structural and functionalcomponent of ribosomes (see p. 250). Riboso-mal RNA is produced from DNA by transcrip-tion in the nucleolus, and it is processed thereand assembled with proteins to form ribo-some subunits (see pp. 208, 242). The bacte-rial 16S-rRNA shown in Fig. A, with 1542 nu-cleotides (nt), is a component of the smallribosomae subunit, while the much smaller5S-rRNA (118 nt) is located in the large sub-unit.
Messenger RNAs (mRNAs) transfer geneticinformation from the cell nucleus to the cyto-plasm. The primary transcripts are substan-tially modified while still in the nucleus(mRNA maturation; see p. 246). Since mRNAshave to be read codon by codon in the ribo-some, they must not form a stable tertiarystructure. This is ensured in part by the at-tachment of RNA-binding proteins, which pre-vent base pairing. Due to the varying amountsof information that they carry, the lengths ofmRNAs also vary widely. Their lifespan is usu-ally short, as they are quickly broken downafter translation.
Small nuclear RNAs (snRNAs) are involvedin the splicing of mRNA precursors (seep. 246). They associate with numerous pro-teins to form “spliceosomes.”
B. Transfer RNA (tRNAPhe)
The transfer RNAs (tRNAs) function duringtranslation (see p. 250) as links between thenucleic acids and proteins. They are smallRNA molecules consisting of 70–90 nucleoti-des, which “recognize” specific mRNA codonswith their anticodons through base pairing. Atthe same time, at their 3 end (sequence.. CCA-3) they carry the amino acid that isassigned to the relevant mRNA codon accord-ing to the genetic code (see p. 248).
The base sequence and the tertiary struc-ture of the yeast tRNA specific for phenylala-nine (tRNAPhe) is typical of all tRNAs. Themolecule (see also p. 86) contains a high pro-portion of unusual and modified components(shaded in dark green in Fig. 1). These includepseudouridine (Ψ), dihydrouridine (D), thymi-dine (T), which otherwise only occurs in DNA,and many methylated nucleotides such as 7-methylguanidine (m7G) and—in the anti-codon—2-O-methylguanidine (m2G). Numer-ous base pairs, sometimes deviating from theusual pattern, stabilize the molecule’s confor-mation (2).
82 Biomolecules
All rights reserved. Usage subject to terms and conditions of license.Koolman, Color Atlas of Biochemistry, 2nd edition © 2005 Thieme

3'
5'
3'5'
3'
5'
3'5'
3' 5'
*
3'
5'
*
*
**
*
*
*
PheAC
G
U
CA
C
UA
AG A AC C
G UUCCU
GGAG
C
GU
AY
Y
G A AUC
C
AGA
CG
G A G CAG
GGD
D GA C U C G
AUUUAGGCG
G
C
T
C U A
G
CY
Phe
3'
5'
NH
CN
C
CC
NHC
N
O
OCH2O
H
O OH
HH H
NH
CH3
1'
3'
O
N
OCH2O
H
OH
HH H
C
NHC
H2C
H2C
O
O
O
C
OCH2O
H
OH
HH H
C
NHC
HN
HC
O
O5'
NH
CN
C
CC
NHC
N
O
OCH2O
H
O OCH3
HH H
NH2
A. Ribonucleic acids (RNAs)
B. Transfer RNA (tRNAPhe)
tRNA
16S-RNA 5S-rRNA
mRNA U1-snRNA
1. Structure
Dihydrouridine (D) Pseudouridine (Ψ)
2. Conformation
D loop
TΨ loop
Variableloop
mRNA
Codon
Species per cell
Type
Length (b)
Proportion
Lifespan
Function
Variableloop
Anticodon
TΨ loop
D loop 7-methylguanidine (m7G)2'-O-methylguanidine (m2G)
Normal basepairing
Unusual basepairing
>50 4 > 1000 ~ 10
tRNA rRNA mRNA snRNA
74 - 95 120 - 5000 400 - 6000 100 - 300
10-20% 80% 5% < 1%
Long Long Short Long
Translation Translation Translation Splicing
* Methylated base
Anticodon
83Nucleic Acids
All rights reserved. Usage subject to terms and conditions of license.Koolman, Color Atlas of Biochemistry, 2nd edition © 2005 Thieme

DNA
A. DNA: structure
Like RNAs (see p. 82), deoxyribonucleic acids(DNAs) are polymeric molecules consisting ofnucleotide building blocks. Instead of ribose,however, DNA contains 2-deoxyribose, andthe uracil base in RNA is replaced by thymine.The spatial structure of the two moleculesalso differs (see p. 86).
The first evidence of the special structureof DNA was the observation that the amountsof adenine and thymine are almost equal inevery type of DNA. The same applies to gua-nine and cytosine. The model of DNA struc-ture formulated in 1953 explains these con-stant base ratios: intact DNA consists of twopolydeoxynucleotide molecules (“strands”).Each base in one strand is linked to a comple-mentary base in the other strand by H-bonds.Adenine is complementary to thymine, andguanine is complementary to cytosine. Onepurine base and one pyrimidine base arethus involved in each base pair.
The complementarity of A with T and of Gwith C can be understood by considering theH bonds that are possible between the differ-ent bases. Potential donors (see p. 6) areamino groups (Ade, Cyt, Gua) and ring NHgroups. Possible acceptors are carbonyl oxy-gen atoms (Thy, Cyt, Gua) and ring nitrogenatoms. Two linear and therefore highly stablebonds can thus be formed in A–T pairs, andthree in G–C pairs.
Base pairings of this type are only possible,however, when the polarity of the two strandsdiffers—i. e., when they run in opposite direc-tions (see p. 80). In addition, the two strandshave to be intertwined to form a double helix.Due to steric hindrance by the 2-OH groupsof the ribose residues, RNA is unable to form adouble helix. The structure of RNA is thereforeless regular than that of DNA (see p. 82).
The conformation of DNA that predomi-nates within the cell (known as B-DNA) isshown schematically in Fig. A2 and as a vander Waals model in Fig. B1. In the schematicdiagram (A2), the deoxyribose–phosphate“backbone” is shown as a ribbon. The bases(indicated by lines) are located on the insideof the double helix. This area of DNA is there-fore apolar. By contrast, the molecule’s surfaceis polar and negatively charged, due to the
sugar and phosphate residues in the back-bone. Along the whole length of the DNAmolecule, there are two depressions—re-ferred to as the “minor groove” and the “ma-jor groove”—that lie between the strands.
B. Coding of genetic information
In all living cells, DNA serves to store geneticinformation. Specific segments of DNA(“genes”) are transcribed as needed intoRNAs, which either carry out structural orcatalytic tasks themselves or provide the basisfor synthesizing proteins (see p. 82). In thelatter case, the DNA codes for the primarystructure of proteins. The “language” used inthis process has four letters (A, G, C, and T). Allof the words (“codons”) contain three letters(“triplets”), and each triplet stands for one ofthe 20 proteinogenic amino acids.
The two strands of DNA are not function-ally equivalent. The template strand (the (–)strand or “codogenic strand,” shown in lightgray in Fig. 1) is the one that is read during thesynthesis of RNA (transcription; see p. 242).Its sequence is complementary to the RNAformed. The sense strand (the (+) strand or“coding strand,” shown in color in Figs. 1 and2) has the same sequence as the RNA, exceptthat T is exchanged for U. By convention, it isagreed that gene sequences are expressed byreading the sequence of the sense strand inthe 53 direction. Using the genetic code(see p. 248), in this case the protein sequence(3) is obtained directly in the reading direc-tion usual for proteins—i. e., from the N termi-nus to the C terminus.
84 Biomolecules
All rights reserved. Usage subject to terms and conditions of license.Koolman, Color Atlas of Biochemistry, 2nd edition © 2005 Thieme
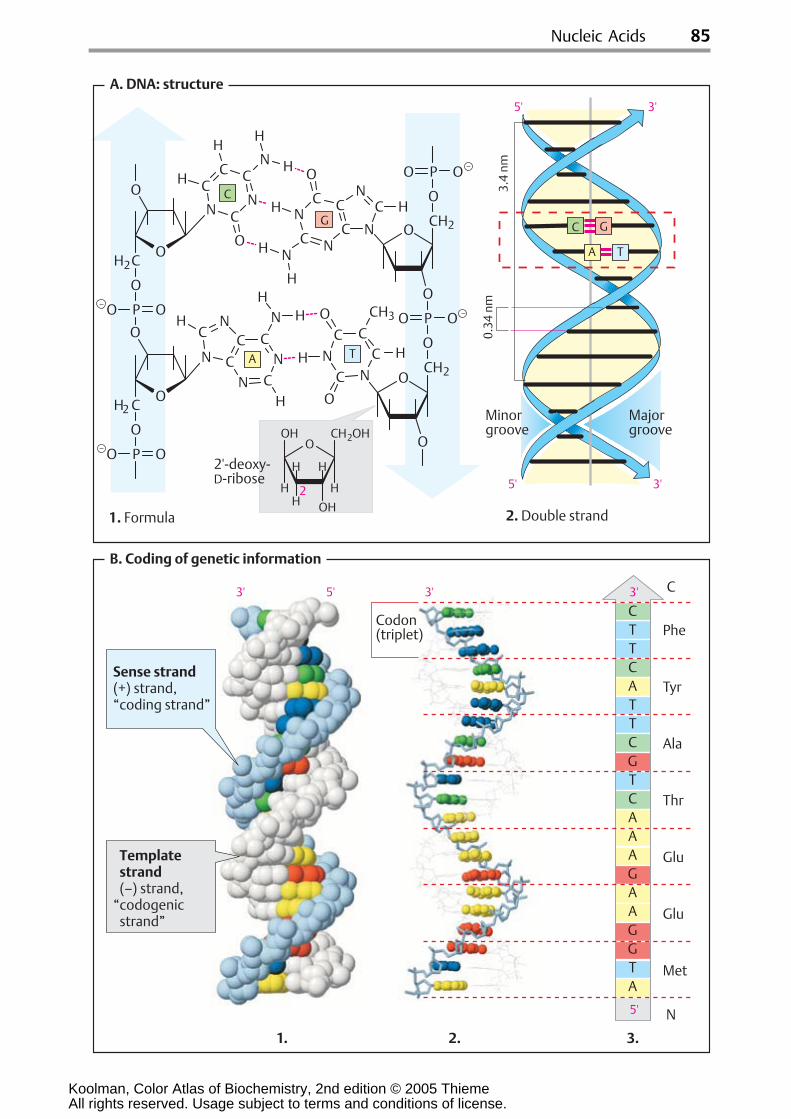
Phe
Tyr
Ala
Thr
Glu
Glu
Met
1. 2. 3.
CTTCATTCGTCAAAGAAGGTA
A T
3'5'
5' 3'
GC
5'3' 3' 3'
OH2C
O
O
PO O
N CN
CCCH
HN
H N
O H N
H
C NC
CC CN
O
H
O
H
H
CH2
O
P OO
O
P
O
CH2
O O
O
O
OH2 C
O
PO O
NCN
C CC H
CH3O
HN
OHCN
C
C CN
CN N HH
H
O2CHOH
H H
HHH OH
A T
G
C
OH
O
2
5'
C
N
N
A. DNA: structure
Codon(triplet)
2. Double strand
Minorgroove
3.4
nm0.
34 n
m
Majorgroove
1. Formula
Sense strand(+) strand,“coding strand”
2'-deoxy-D-ribose
B. Coding of genetic information
Templatestrand(–) strand,
“codogenicstrand”
85Nucleic Acids
All rights reserved. Usage subject to terms and conditions of license.Koolman, Color Atlas of Biochemistry, 2nd edition © 2005 Thieme

Molecular models: DNA and RNA
The illustration opposite shows selected nuc-leic acid molecules. Fig. A shows various con-formations of DNA, and Fig. B shows the spa-tial structures of two small RNA molecules. Inboth, the van der Waals models (see p. 6) areaccompanied by ribbon diagrams that makethe course of the chains clear. In all of themodels, the polynucleotide “backbone” ofthe molecule is shown in a darker color, whilethe bases are lighter.
A. DNA: conformation
Investigations of synthetic DNA moleculeshave shown that DNA can adopt several dif-ferent conformations. All of the DNA seg-ments shown consist of 21 base pairs (bp)and have the same sequence.
By far the most common form is B-DNA (2).As discussed on p. 84, this consists of twoantiparallel polydeoxynucleotide strands in-tertwined with one another to form a right-handed double helix. The “backbone” of thesestrands is formed by deoxyribose and phos-phate residues linked by phosphoric acid di-ester bonds.
In the B conformation, the aromatic rings ofthe nucleobases are stacked at a distance of0.34 nm almost at right angles to the axis ofthe helix. Each base is rotated relative to thepreceding one by an angle of 35°. A completeturn of the double helix (360°) therefore con-tains around 10 base pairs (abbreviation: bp),i. e., the pitch of the helix is 3.4 nm. Betweenthe backbones of the two individual strandsthere are two grooves with different widths.The major groove is visible at the top andbottom, while the narrower minor groove isseen in the middle. DNA-binding proteins andtranscription factors (see pp.118, 244) usuallyenter into interactions in the area of the majorgroove, with its more easily accessible bases.
In certain conditions, DNA can adopt the Aconformation (1). In this arrangement, thedouble helix is still right-handed, but thebases are no longer arranged at right anglesto the axis of the helix, as in the B form. As canbe seen, the A conformation is more compactthan the other two conformations. The minorgroove almost completely disappears, and themajor groove is narrower than in the B form.
A-DNA arises when B-DNA is dehydrated. Itprobably does not occur in the cell.
In the Z-conformation (3), which can occurwithin GC-rich regions of B-DNA, the organ-ization of the nucleotides is completely differ-ent. In this case, the helix is left-handed, andthe backbone adopts a characteristic zig-zagconformation (hence “Z-DNA”). The Z doublehelix has a smaller pitch than B-DNA. DNAsegments in the Z conformation probablyhave physiological significance, but detailsare not yet known.
B. RNA
RNA molecules are unable to form extendeddouble helices, and are therefore less highlyordered than DNA molecules. Nevertheless,they have defined secondary and tertiarystructures, and a large proportion of the nu-cleotide components enter into base pairingswith other nucleotides. The examples shownhere are 5S-rRNA (see p. 242), which occurs asa structural component in ribosomes, and atRNA molecule from yeast (see p. 82) that isspecific for phenylalanine.
Both molecules are folded in such a waythat the 3 end and the 5 end are close to-gether. As in DNA, most of the bases are lo-cated in the inside of the structures, while themuch more polar “backbone” is turned out-wards. An exception to this is seen in thethree bases of the anticodon of the tRNA(pink), which have to interact with mRNAand therefore lie on the surface of the mole-cule. The bases of the conserved CCA triplet atthe 3 end (red) also jut outward. Duringamino acid activation (see p. 248), they arerecognized and bound by the ligases.
86 Biomolecules
All rights reserved. Usage subject to terms and conditions of license.Koolman, Color Atlas of Biochemistry, 2nd edition © 2005 Thieme

5'3' 5'3'
5'
3'
5'
3'
5' 3'
5'
3'
5'
3'
5'3'
A. DNA: conformation
B. RNA
1. A - DNA 2. B - DNA 3. Z - DNABackboneBases
1. 5S-rRNA 2. Phe-tRNAPhe
(118 nucleotides) (77 nucleotides)
87Nucleic Acids
All rights reserved. Usage subject to terms and conditions of license.Koolman, Color Atlas of Biochemistry, 2nd edition © 2005 Thieme

Enzymes: basics
Enzymes are biological catalysts—i. e., sub-stances of biological origin that acceleratechemical reactions (see p. 24). The orderlycourse of metabolic processes is only possiblebecause each cell is equipped with its owngenetically determined set of enzymes. It isonly this that allows coordinated sequencesof reactions (metabolic pathways; see p.112).Enzymes are also involved in many regulatorymechanisms that allow the metabolism toadapt to changing conditions (see p.114). Al-most all enzymes are proteins. However,there are also catalytically active ribonucleicacids, the “ribozymes” (see pp. 246, 252).
A. Enzymatic activity
The catalytic action of an enzyme, its activity,is measured by determining the increase inthe reaction rate under precisely defined con-ditions—i. e., the difference between the turn-over (violet) of the catalyzed reaction (or-ange) and uncatalyzed reaction (yellow) in aspecific time interval. Normally, reaction ratesare expressed as the change in concentrationper unit of time (mol 1–1 s–1; see p. 22).Since the catalytic activity of an enzyme isindependent of the volume, the unit usedfor enzymes is usually turnover per unit time,expressed in katal (kat, mol s–1). However,the international unit U is still more com-monly used (µmol turnover min–1; 1 U =16.7 nkat).
B. Reaction and substrate specificity
The action of enzymes is usually very specific.This applies not only to the type of reactionbeing catalyzed (reaction specificity), but alsoto the nature of the reactants (“substrates”)that are involved (substrate specificity; seep. 94). In Fig. B, this is illustrated schemati-cally using a bond-breaking enzyme as anexample. Highly specific enzymes (type A,top) catalyze the cleavage of only one typeof bond, and only when the structure of thesubstrate is the correct one. Other enzymes(type B, middle) have narrow reaction specif-icity, but broad substrate specificity. Type Cenzymes (with low reaction specificity andlow substrate specificity, bottom) are veryrare.
C. Enzyme classes
More than 2000 different enzymes are cur-rently known. A system of classification hasbeen developed that takes into account boththeir reaction specificity and their substratespecificity. Each enzyme is entered in the En-zyme Catalogue with a four-digit EnzymeCommission number (EC number). The firstdigit indicates membership of one of the sixmajor classes. The next two indicate sub-classes and subsubclasses. The last digit indi-cates where the enzyme belongs in the sub-subclass. For example, lactate dehydrogenase(see pp. 98–101) has the EC number 1.1.1.27(class 1, oxidoreductases; subclass 1.1, CH–OHgroup as electron donor; sub-subclass 1.1.1,NAD(P)+ as electron acceptor).
Enzymes with similar reaction specificitiesare grouped into each of the six major classes:
The oxidoreductases (class 1) catalyze thetransfer of reducing equivalents from one re-dox system to another.
The transferases (class 2) catalyze thetransfer of other groups from one moleculeto another. Oxidoreductases and transferasesgenerally require coenzymes (see pp.104ff.).
The hydrolases (class 3) are also involved ingroup transfer, but the acceptor is always awater molecule.
Lyases (class 4, often also referred to as“synthases”) catalyze reactions involving ei-ther the cleavage or formation of chemicalbonds, with double bonds either arising ordisappearing.
The isomerases (class 5) move groupswithin a molecule, without changing thegross composition of the substrate.
The ligation reactions catalyzed by ligases(“synthetases,” class 6) are energy-dependentand are therefore always coupled to the hy-drolysis of nucleoside triphosphates.
In addition to the enzyme name, we alsousually give its EC number. The annotatedenzyme list (pp. 420ff.) includes all of the en-zymes mentioned in this book, classified ac-cording to the Enzyme Catalog system.
88 Metabolism
All rights reserved. Usage subject to terms and conditions of license.Koolman, Color Atlas of Biochemistry, 2nd edition © 2005 Thieme

89Enzymes
+ +
A red
+ +
A–B
A–B B–OH
+
A A–B
Iso-A
XP P P P P
X
P
++
++
B
A XTP
X=A, G, U, C XDP
A–B
Aox
A
A–H
B ox
C
H2O
B
A
B red
B–C
C
B
A
A
BBBB
C C C C C C C C
= Reduction equivalent
A. Enzymatic activity B. Reaction and substrate specificity
Turnover (mol product .s–1)without enzyme
Turnover (mol product .s–1) with enzyme
Enzyme activity (mol .s–1 = kat)
C. The enzyme classes
Class Reaction type Important subclasses
DehydrogenasesOxidases, peroxidasesReductasesMonooxygenasesDioxygenases
C1-TransferasesGlycosyltransferasesAminotransferasesPhosphotransferases
EsterasesGlycosidasesPeptidasesAmidases
C-C-LyasesC-O-LyasesC-N-LyasesC-S-Lyases
Epimerasescis trans IsomerasesIntramoleculartransferases
C-C-LigasesC-O-LigasesC-N-LigasesC-S-Ligases
6 Ligases (“synthetases”)
5 Isomerases
4 Lyases (“synthases”)
3 Hydrolases
2 Transferases
1 Oxidoreductases
Reaction specificity Substrate specificity
High High
High Low
Low Low
1 Katal (kat): Amount of enzymewhich increasesturnover by 1 mol .s–1
Group
Bond
Group
All rights reserved. Usage subject to terms and conditions of license.Koolman, Color Atlas of Biochemistry, 2nd edition © 2005 Thieme

Enzyme catalysis
Enzymes are extremely effective catalysts.They can increase the rate of a catalyzed re-action by a factor of 1012 or more. To grasp themechanisms involved in enzyme catalysis, wecan start by looking at the course of an un-catalyzed reaction more closely.
A. Uncatalyzed reaction
The reaction A + B C + D is used as anexample. In solution, reactants A and B aresurrounded by a shell of water molecules(the hydration shell), and they move in ran-dom directions due to thermal agitation. Theycan only react with each other if they collidein a favorable orientation. This is not veryprobable, and therefore only occurs rarely.Before conversion into the products C + D,the collision complex A-B has to pass througha transition state, the formation of which usu-ally requires a large amount of activationenergy, Ea (see p. 22). Since only a few A–Bcomplexes can produce this amount of en-ergy, a productive transition state ariseseven less often than a collision complex. Insolution, a large proportion of the activationenergy is required for the removal of the hy-dration shells between A and B. However,charge displacements and other chemicalprocesses within the reactants also play arole. As a result of these limitations, conver-sion only happens occasionally in the absenceof a catalyst, and the reaction rate v is low,even when the reaction is thermodynamicallypossible—i. e., when ∆G < 0 (see p.18).
B. Enzyme-catalyzed reaction
Shown here is a sequential mechanism inwhich substrates A and B are bound and prod-ucts C and D are released, in that order. An-other possible reaction sequence, known asthe “ping-pong mechanism,” is discussed onp. 94.
Enzymes are able to bind the reactants(their substrates) specifically at the active cen-ter. In the process, the substrates are orientedin relation to each other in such a way thatthey take on the optimal orientation for theformation of the transition state (1–3). Theproximity and orientation of the substratestherefore strongly increase the likelihood
that productive A–B complexes will arise. Inaddition, binding of the substrates results inremoval of their hydration shells. As a resultof the exclusion of water, very different con-ditions apply in the active center of the en-zyme during catalysis than in solution (3–5).A third important factor is the stabilization ofthe transition state as a result of interactionsbetween the amino acid residues of the pro-tein and the substrate (4). This further re-duces the activation energy needed to createthe transition state. Many enzymes also takeup groups from the substrates or transferthem to the substrates during catalysis.
Proton transfers are particularly common.This acid–base catalysis by enzymes is muchmore effective than the exchange of protonsbetween acids and bases in solution. In manycases, chemical groups are temporarily boundcovalently to the amino acid residues of theenzyme or to coenzymes during the catalyticcycle. This effect is referred to as covalentcatalysis (see the transaminases, for example;p.178). The principles of enzyme catalysissketched out here are discussed in greaterdetail on p.100 using the example of lactatedehydrogenase.
C. Principles of enzyme catalysis
Although it is dif cult to provide quantitativeestimates of the contributions made by indi-vidual catalytic effects, it is now thought thatthe enzyme’s stabilization of the transitionstate is the most important factor. It is nottight binding of the substrate that is impor-tant, therefore—this would increase the acti-vation energy required by the reaction, ratherthan reducing it—but rather the binding of thetransition state. This conclusion is supportedby the very high af nity of many enzymes foranalogues of the transition state (see p. 96). Asimple mechanical analogy may help clarifythis (right). To transfer the metal balls (thereactants) from location EA (the substratestate) via the higher-energy transition stateto EP (the product state), the magnet (thecatalyst) has to be orientated in such a waythat its attractive force acts on the transitionstate (bottom) rather than on EA (top).
90 Metabolism
All rights reserved. Usage subject to terms and conditions of license.Koolman, Color Atlas of Biochemistry, 2nd edition © 2005 Thieme

C
+ +BA D
CD
A
B
A
X Y
Z
B
X Y
Z
X Y
Z
YX
Z
C
X Y
Z
D C
EPEA
EPEA Ea
Ga cc
b
d
X Y
Z
X Y
Z
A. Uncatalyzed reaction
Reactants Collisioncomplex 1
Transitionstate
Collisioncomplex 2
Products
B. Enzyme-catalyzed reaction
1. Freeenzyme E 4.Transition state E
2. E.A-complex 3. E.A.B-complex
6. E.D-complex 5. E.C.D-complex
Active site
C. Principles of enzyme catalysis
Approximation and orientationof the substrates
Exclusion of water
Stabilization of thetransition state
Group transfer
a
b
c
d
Transitionstate
Stabilizationof the EA complex
Stabilizationof the transition state
91Enzymes
All rights reserved. Usage subject to terms and conditions of license.Koolman, Color Atlas of Biochemistry, 2nd edition © 2005 Thieme

Enzyme kinetics I
The kinetics of enzyme-catalyzed reactions(i. e., the dependence of the reaction rate onthe reaction conditions) is mainly determinedby the properties of the catalyst. It is thereforemore complex than the kinetics of an uncata-lyzed reaction (see p. 22). Here we discussthese issues using the example of a simplefirst-order reaction (see p. 22)
A. Michaelis–Menten kinetics
In the absence of an enzyme, the reaction rate vis proportional to the concentration of sub-stance A (top). The constant k is the rate con-stant of the uncatalyzed reaction. Like all cat-alysts, the enzyme E (total concentration [E]t)creates a new reaction pathway. Initially, A isbound to E (partial reaction 1, left). If thisreaction is in chemical equilibrium, thenwith the help of the law of mass action—andtaking into account the fact that [E]t = [E] +[EA]—one can express the concentration [EA]of the enzyme–substrate complex as a func-tion of [A] (left). The Michaelis constant Km
thus describes the state of equilibrium of thereaction. In addition, we know that kcat > k—inother words, enzyme-bound substrate reactsto B much faster than A alone (partial reaction2, right). kcat, the enzyme’s turnover number,corresponds to the number of substrate mol-ecules converted by one enzyme molecule persecond. Like the conversion A B, the forma-tion of B from EA is a first-order reaction—i. e.,v = k [EA] applies. When this equation iscombined with the expression already de-rived for EA, the result is the Michaelis–Menten equation.
In addition to the variables v and [A], theequation also contains two parameters that donot depend on the substrate concentration[A], but describe properties of the enzymeitself: the product kcat [E]g is the limitingvalue for the reaction rate at a very high [A],the maximum velocity Vmax of the reaction(recommended abbreviation: V). The Michae-lis constant Km characterizes the af nity of theenzyme for a substrate. It corresponds to thesubstrate concentration at which v reacheshalf of Vmax (if v = Vmax/2, then [A]/(Km +[A]) = 1/2, i. e. [A] is then = Km). A high af nityof the enzyme for a substrate therefore leadsto a low Km value, and vice versa. Of the two
enzymes whose substrate saturation curvesare shown in diagram 1, enzyme 2 has thehigher af nity for A [Km = 1 mmol l–1);Vmax, by contrast, is much lower than withenzyme 1.
Since v approaches V asymptotically withincreasing values of [A], it is dif cult to obtainreliable values for Vmax—and thus for Km aswell—from diagrams plotting v against [A]. Toget around this, the Michaelis–Menten equa-tion can be arranged in such a way that themeasured points lie on a straight line. In theLineweaver–Burk plot (2), 1/v is plottedagainst 1/[A]. The intersections of the line ofbest fit with the axes then produce 1/Vmax
and—1/Km. This type of diagram is very clear,but for practical purposes it is less suitable fordetermining Vmax and Km. Calculation meth-ods using personal computers are faster andmore objective.
B. Isosteric and allosteric enzymes
Many enzymes can occur in various conforma-tions (see p. 72), which have different catalyticproperties and whose proportion of the totalnumber of enzyme molecules is influenced bysubstrates and other ligands (see pp.116 and280, for example). Allosteric enzymes of thistype, which are usually present in oligomericform, can be recognized by their S-shaped(sigmoidal) saturation curves, which cannotbe described using the Michaelis model. Inthe case of isosteric enzymes (with only oneenzyme conformation, 1), the ef ciency ofsubstrate binding (dashed curve) declinesconstantly with increasing [A], because thenumber of free binding sites is constantlydecreasing. In most allosteric enzymes (2),the binding ef ciency initially rises with in-creasing [A], because the free enzyme ispresent in a low-af nity conformation(square symbols), which is gradually con-verted into a higher-af nity form (round sym-bols) as a result of binding with A. It is only athigh [A] values that a lack of free binding sitesbecomes noticeable and the binding strengthdecreases again. In other words, the af nity ofallosteric enzymes is not constant, but de-pends on the type and concentration of theligand.
92 Metabolism
All rights reserved. Usage subject to terms and conditions of license.Koolman, Color Atlas of Biochemistry, 2nd edition © 2005 Thieme

0 90 100 0.0 0.5 1.0 1.5 2.0
[A]v =
Km
·
+ [A]
kcat [E]g
EAE + A
[EA] = [E]g[A]
Km + [A]
kcat
v = kcat · [EA]
[EA] E + B
A B
KmEA
kcat
A
E
E
Km
-0.5-1.010842 6 95
10
8
4
2
0
6
1.0
0.8
0.4
0.2
0.0
0.6
VmaxKm
-1/Km
1/Vmax 1/VmaxVmaxKm
0 105 15 20 0 105 15 20
-1/Km
v = k · [A]
·
[A]O.5Km
VmaxVmax
Vmax = kcat · [E]g (mol · l-1· s-1)
Uncatalyzed reaction
Concentration [A] (mM)
Vel
ocit
y v
1. Hyperbolic plot 2. Lineweaver–Burk plotReciprocal concentration 1/[A] (mM–1)
Partial reaction 1:formation and decayof enzyme–substratecomplex EA
Partial reaction 2:formation of theproduct of EA
Enzyme 1
Enzyme 2
Vel
ocit
y v
Isosteric(n=1)
Allosteric(n=3)
B. Isosteric and allosteric enzymes
Km (mol · l-1)Michaelis constant
Enzyme-catalyzed reaction Enzyme-catalyzed reaction
A. Michaelis Menten kinetics
Reci
proc
al v
eloc
ity
1/v
[A] (mmol · l–1)
Vel
ocit
y v
[A] (mmol · l–1)
Bondingstrenght
Bondingstrenght
Maximum velocity
93Enzymes
All rights reserved. Usage subject to terms and conditions of license.Koolman, Color Atlas of Biochemistry, 2nd edition © 2005 Thieme

94 Metabolism
Enzyme kinetics II
The catalytic properties of enzymes, and con-sequently their activity (see p. 90), are influ-enced by numerous factors, which all have tobe optimized and controlled if activity meas-urements are to be carried out in a useful andreproducible fashion. These factors includephysical quantities (temperature, pressure),the chemical properties of the solution (pHvalue, ionic strength), and the concentrationsof the relevant substrates, cofactors, and in-hibitors.
A. pH and temperature dependency ofenzyme activity
The effect of enzymes is strongly dependenton the pH value (see p. 30). When the activityis plotted against pH, a bell-shaped curve isusually obtained (1). With animal enzymes,the pH optimum—i. e., the pH value at whichenzyme activity is at its maximum—is oftenclose to the pH value of the cells (i. e., pH 7).However, there are also exceptions to this. Forexample, the proteinase pepsin (see p. 270),which is active in the acidic gastric lumen,has a pH optimum of 2, while other enzymes(at least in the test tube) are at their mostactive at pH values higher than 9. The bellshape of the activity–pH profile results fromthe fact that amino acid residues with ioniz-able groups in the side chain are essential forcatalysis. In example (1), these are a basicgroup B (pKa = 8), which has to be protonatedin order to become active, and a second acidicamino acid AH (pKa = 6), which is only activein a dissociated state. At the optimum pH of 7,around 90% of both groups are present in theactive form; at higher and lower values, oneor the other of the groups increasingly passesinto the inactive state.
The temperature dependency of enzymaticactivity is usually asymmetric. With increas-ing temperature, the increased thermalmovement of the molecules initially leads toa rate acceleration (see p. 22). At a certaintemperature, the enzyme then becomes un-stable, and its activity is lost within a narrowtemperature difference as a result of denatu-ration (see p. 74). The optimal temperatures ofthe enzymes in higher organisms rarely ex-ceed 50 °C, while enzymes from thermophilicbacteria found in hot springs, for instance,may still be active at 100 °C.
B. Substrate specificity
Enzymes “recognize” their substrates in ahighly specific way (see p. 88). It is only themarked substrate specificity of the enzymesthat makes a regulated metabolism possible.This principle can be illustrated using the ex-ample of the two closely related proteinasestrypsin and chymotrypsin. Both belong to thegroup of serine proteinases and contain thesame “triad” of catalytically active residues(Asp–His–Ser, shown here in green; seep.176). Trypsin selectively cleaves peptidebonds on the C-terminal side of basic aminoacids (lysine and arginine), while chymotryp-sin is specific for hydrophobic residues. Thesubstrate binding “pockets” of both enzymeshave a similar structure, but their amino acidsequences differ slightly. In trypsin, a nega-tively charged aspartate residue (Asp-189,red) is arranged in such a way that it canbind and fix the basic group in the side chainof the substrate. In chymotrypsin, the “bind-ing pocket” is slightly narrower, and it is linedwith neutral and hydrophobic residues thatstabilize the side chains of apolar substrateamino acids through hydrophobic interac-tions (see p. 28).
C. Bisubstrate kinetics
Almost all enzymes—in contrast to the sim-plified description given on p. 92—have morethan one substrate or product. On the otherhand, it is rare for more than two substrates tobe bound simultaneously. In bisubstrate reac-tions of the type A + B C + D, a number ofreaction sequences are possible. In addition tothe sequential mechanisms (see p. 90), inwhich all substrates are bound in a specificsequence before the product is released, thereare also mechanisms in which the first sub-strate A is bound and immediately cleaved. Apart of this substrate remains bound to theenzyme, and is then transferred to the secondsubstrate B after the first product C has beenreleased. This is known as the ping-pongmechanism, and it is used by transaminases,for example (see p.178). In the Lineweaver—Burk plot (right; see p. 92), it can be recog-nized in the parallel shifting of the lines when[B] is varied.
All rights reserved. Usage subject to terms and conditions of license.Koolman, Color Atlas of Biochemistry, 2nd edition © 2005 Thieme

1.0
0.8
0.4
0.2
0.0
0.6
4 5 6 7 8 9 10 0 10 20 30 40 50
0 2 4
X Y
Z
YX
Z
A
B
P2
X Y
Z
X Y
Z
X Y
Z
1 2
B
1.0
0.8
0.4
0.2
0.0
0.6
BH +
A -
BH + AH BH + A - B A -
A -BH +
P1
A. pH and temperature dependency of enzyme activity
Act
ivit
y
pH Temperature (°C)
Enzymeactive
Enzymedenatured
Denaturation
Increasedactivity dueto temperatureincrease
Proportion BH Proportion A
B. Substrate specificity
Substrate (-X-Arg-Y-) Substrate (-X-Phe-Y-)
Trypsin (3.4.21.4)–X–Y–Arg (Lys)–Z–
Chymotrypsin (3.4.21.1)–X–Y–Tyr (Trp, Phe, Leu)–Z–
C. Bisubstrate kinetics
2. EA complex
3. Covalentintermediateproduct E'
1. Free enzyme E
5. EP2 complex 4. E'B complex
1/ve
loci
ty
1/A(mM-1)
Active center
Ser-195
His-57
Asp-102
Ser-195
His-57
Asp-102
Asp-189 Ser-189
Act
ivit
y
+ -
95Enzymes
All rights reserved. Usage subject to terms and conditions of license.Koolman, Color Atlas of Biochemistry, 2nd edition © 2005 Thieme

Inhibitors
Many substances can affect metabolic pro-cesses by influencing the activity ofenzymes. Enzyme inhibitors are particularlyimportant here. A large proportion ofmedicines act as enzyme inhibitors. Enzyme-kinetic experiments are therefore an impor-tant aspect of drug development and testingprocedures. Natural metabolites are also in-volved in regulatory processes as inhibitors(see p.114).
A. Types of inhibitor
Most enzyme inhibitors act reversibly—i. e.,they do not cause any permanent changes inthe enzyme. However, there are also irrever-sible inhibitors that permanently modify thetarget enzyme. The mechanism of action of aninhibitor—its inhibition type—can be deter-mined by comparing the kinetics (see p. 92)of the inhibited and uninhibited reactions (B).This makes it possible to distinguish compet-itive inhibitors (left) from noncompetitiveinhibitors (right), for example. Allostericinhibition is particularly important for meta-bolic regulation (see below).
Substrate analogs (2) have properties sim-ilar to those of one of the substrates of thetarget enzyme. They are bound by the en-zyme, but cannot be converted further andtherefore reversibly block some of the enzymemolecules present. A higher substrate concen-tration is therefore needed to achieve a half-maximum rate; the Michaelis constant Km
increases (B). High concentrations of the sub-strate displace the inhibitor again. The max-imum rate Vmax is therefore not influenced bythis type of inhibition. Because the substrateand the inhibitor compete with one anotherfor the same binding site on the enzyme, thistype of inhibition is referred to as compe-titive. Analogs of the transition state (3) usu-ally also act competitively.
When an inhibitor interacts with a groupthat is important for enzyme activity, but doesnot affect binding of the substrate, the inhi-bition is non-competitive (right). In this case,Km remains unchanged, but the concentrationof functional enzyme [E]t, and thus Vmax, de-crease. Non-competitive inhibitors generallyact irreversibly, by modifying functionalgroups of the target enzyme (4).
“Suicide substrates” (5) are substrate ana-logs that also contain a reactive group. Ini-tially, they bind reversibly, and then theyform a covalent bond with the active centerof the enzyme. Their effect is therefore alsonon-competitive. A well-known example ofthis is the antibiotic penicillin (see p. 254).
Allosteric inhibitors bind to a separatebinding site outside the active center (6).This results in a conformational change inthe enzyme protein that indirectly reducesits activity (see p.116). Allosteric effects prac-tically only occur in oligomeric enzymes. Thekinetics of this type of system can no longerbe described using the simple Micha-elis–Menten model.
B. Inhibition kinetics
In addition to the Lineweaver–Burk plot (seep. 92), the Eadie–Hofstee plot is also com-monly used. In this case, the velocity v isplotted against v /[A]. In this type of plot,Vmax corresponds to the intersection of theapproximation lines with the v axis, whileKm is derived from the gradient of the lines.Competitive and non-competitive inhibitorsare also easily distinguishable in the Eadie—Hofstee plot. As mentioned earlier, competi-tive inhibitors only influence Km, and notVmax. The lines obtained in the absence andpresence of an inhibitor therefore intersect onthe ordinate. Non-competitive inhibitors pro-duce lines that have the same slope (Km un-changed) but intersect with the ordinate at alower level. Another type of inhibitor, notshown here, in which Vmax and Km are re-duced by the same factor, is referred to asuncompetitive. Inhibitors with purely uncom-petitive effects are rare. A possible explana-tion for this type of inhibition is selectivebinding of the inhibitor to the EA complex.
Allosteric enzymes shift the target en-zyme’s saturation curve to the left (seep. 92). In Eadie–Hofstee and Lineweaver–Burkplots (see p. 92), allosteric enzymes are recog-nizable because they produce curved lines(not shown).
96 Metabolism
All rights reserved. Usage subject to terms and conditions of license.Koolman, Color Atlas of Biochemistry, 2nd edition © 2005 Thieme

10
8
4
2
00.0 0.5 1.0 1.5 2.0
10
8
4
2
00 10 20 80 90 100
6 6
6.
1.
I
[A]
vI
C
C C
b
C CII
C
I
C
C C
b a
I
C
C C
C
C
I
CC C
C
I C
C
C
a
A. Types of inhibitor
B. Kinetics of inhibition
5. “Suicide substrate”3. Transition state analog
Competitive Uninhibited Noncompetitive
Allosteric
2. Substrate analogs
4. Modifying reagent
v/[A] (nkat · mM –o)Substrate concentration [A] (mM)
1. Hyperbolic plot 2. Eadie Hofstee plot
Vel
ocit
y v
(nka
t)
Competitiveinhibition:V unchanged
Kmunchanged
Maximalvelocity V
Slope = Km
Kmincreased
Non-competitiveinhibition:V reduced
Vel
ocit
y v
(nka
t)
97Enzymes
All rights reserved. Usage subject to terms and conditions of license.Koolman, Color Atlas of Biochemistry, 2nd edition © 2005 Thieme

Lactate dehydrogenase: structure
Lactate dehydrogenase (LDH, EC 1.1.1.27) isdiscussed in some detail here and on thenext page as an example of the structureand function of an enzyme.
A. Lactate dehydrogenase: structure
The active form of lactate dehydrogenase(mass 144 kDa) is a tetramer consisting offour subunits (1). Each monomer is formedby a peptide chain of 334 amino acids(36 kDa). In the tetramer, the subunitsoccupy equivalent positions (1); each mono-mer has an active center. Depending on met-abolic conditions, LDH catalyzes NADH-de-pendent reduction of pyruvate to lactate, orNAD+-dependent oxidation of lactate to pyru-vate (see p.18).
The active center of an LDH subunit isshown schematically in Fig. 2. The peptidebackbone is shown as a light blue tube. Alsoshown are the substrate lactate (red), thecoenzyme NAD+ (yellow), and three aminoacid side chains (Arg-109, Arg-171, and His-195; green), which are directly involved in thecatalysis. A peptide loop (pink) formed byamino acid residues 98–111 is also shown. Inthe absence of substrate and coenzyme, thispartial structure is open and allows access tothe substrate binding site (not shown). In theenzyme lactate NAD+ complex shown, thepeptide loop closes the active center. The cat-alytic cycle of lactate dehydrogenase is dis-cussed on the next page.
B. Isoenzymes
There are two different LDH subunits in theorganism—M and H—which have a slightlydifferent amino acid sequence and conse-quently different catalytic properties. As thesetwo subunits can associate to form tetramersrandomly, a total of five different isoenzymesof LDH are found in the body.
Fig. 1 shows sections from the amino acidsequences of the two subunits, using the sin-gle-letter notation (see p. 60). A common pre-cursor gene was probably duplicated at somepoint in evolution. The two genes then con-tinued to develop further independently ofeach other through mutation and selection.
The differences in sequence between the Mand H subunits are mainly conservative—i. e.,both residues are of the same type, e. g. gly-cine (G) and alanine (A), or arginine (R) andlysine (K). Non-conservative exchanges areless frequent—e. g., lysine (K) for glutamine(Q), or threonine (T) for glutamic acid (E).Overall, the H subunit contains more acidicand fewer basic residues than the M form, andit therefore has a more strongly negativecharge. This fact is exploited to separate theisoenzymes using electrophoresis (2; seepp. 78, 276). The isoenzyme LDH-1, consistingof four H subunits, migrates fastest, and theM4 isoenzyme is slowest.
The separation and analysis of isoenzymesin blood samples is important in the diagnosisof certain diseases. Normally, only smallamounts of enzyme activity are found in se-rum. When an organ is damaged, intracellularenzymes enter the blood and can be demon-strated in it (serum enzyme diagnosis). Thetotal activity of an enzyme reflects the se-verity of the damage, while the type of iso-enzyme found in the blood provides evidenceof the site of cellular injury, since each of thegenes is expressed in the various organs atdifferent levels. For example, the liver andskeletal muscles mainly produce M subunitsof lactate dehydrogenase (M for muscle),while the brain and cardiac muscle mainlyexpress H subunits (H for heart). In conse-quence, each organ has a characteristic isoen-zyme pattern (3). Following cardiac infarction,for example, there is a strong increase in theamount of LDH-1 in the blood, while the con-centration of LDH-5 hardly changes. The iso-enzymes of creatine kinase (see p. 336) arealso of diagnostic importance.
98 Metabolism
All rights reserved. Usage subject to terms and conditions of license.Koolman, Color Atlas of Biochemistry, 2nd edition © 2005 Thieme

RYLMGERLGVHPLSCHGWVLGEHGDSSVPVWSGMNVAGCSLKTLHPDL GTD..
RYLMAEKLG I HPSSCHGW I LGEHGDSSVAVWSG V NVAGVSLQELNPEMGTD..
NADH + H NAD
N AN A
A. Lactate dehydrogenase: structure
1. Tetramer 144 kDa
Pyruvate LactateLactatedehydrogenase1.1.1.27
Enzymeprotein
MobileloopEssential
aminoacidsArg-109His-195Arg-171
Substrate(lactate)
2. Active center
Lactate dehydrogenase M
Lactate dehydrogenase H
1. Gene
2. Forms
Skeletal muscle
Liver
Brain
Cardiac muscle
LDH5 LDH4 LDH3 LDH2 LDH1
3. Separation by gel electrophoresis
B. Isoenzymes
Coenzyme(NAD )
LDH5 (M4)
LDH4 (M3H1)
LDH3 (M2H2)
LDH2 (M1H3)
LDH1 (H4)
99Enzymes
All rights reserved. Usage subject to terms and conditions of license.Koolman, Color Atlas of Biochemistry, 2nd edition © 2005 Thieme

Lactate dehydrogenase:mechanism
The principles of enzyme catalysis discussedon p. 90 can be illustrated using the reactionmechanism of lactate dehydrogenase (LDH)as an example.
A. Lactate dehydrogenase: catalytic cycle
LDH catalyzes the transfer of hydride ions (seep. 32) from lactate to NAD+ or from NADH topyruvate.
L-lactate + NAD+ ↔pyruvate + NADH + H+
The equilibrium of the reaction strongly fa-vors lactate formation. At high concentrationsof lactate and NAD+, however, oxidation oflactate to pyruvate is also possible (seep.18). LDH catalyzes the reaction in both di-rections, but—like all enzymes—it has no ef-fect on chemical equilibrium.
As the reaction is reversible, the catalyticprocess can be represented as a closed loop.The catalytic cycle of LDH is reduced to six“snapshots” here. Intermediate steps in catal-ysis such as those shown here are extremelyshort-lived and therefore dif cult to detect.Their existence was deduced indirectly from alarge number of experimental findings—e. g.,kinetic and binding measurements.
Many amino acid residues play a role in theactive center of LDH. They can mediate thebinding of the substrate and coenzyme, ortake part in one of the steps in the catalyticcycle directly. Only the side chains of threeparticularly important residues are shownhere. The positively charged guanidiniumgroup of arginine-171 binds the carboxylategroup of the substrate by electrostatic inter-action. The imidazole group of histidine-195 isinvolved in acid–base catalysis, and the sidechain of arginine-109 is important for the sta-bilization of the transition state. In contrast toHis-195, which changes its charge during cat-alysis, the two essential arginine residues areconstantly protonated. In addition to thesethree residues, the peptide loop 98–111 men-tioned on p. 98 is also shown here schemati-cally (red). Its function consists of closing theactive center after binding of the substrate
and coenzyme, so that water molecules arelargely excluded during the electron transfer.
We can now look at the partial reactionsinvolved in LDH-catalyzed pyruvate reduc-tion.
In the free enzyme, His195 is protonated(1). This form of the enzyme is therefore de-scribed as E H+. The coenzyme NADH isbound first (2), followed by pyruvate (3). Itis important that the carbonyl group of thepyruvate in the enzyme and the active site inthe nicotinamide ring of the coenzyme shouldhave a fairly optimal position in relation toeach other, and that this orientation shouldbecome fixed (proximity and orientation of thesubstrates). The 98–111 loop now closes overthe active center. This produces a markeddecrease in polarity, which makes it easierto achieve the transition state (4; water ex-clusion). In the transition state, a hydride ion,H– (see p. 32), is transferred from the coen-zyme to the carbonyl carbon (group transfer).The transient—and energetically unfavora-ble—negative charge on the oxygen that oc-curs here is stabilized by electrostatic inter-action with Arg-109 (stabilization of the tran-sition state). At the same time, a proton fromHis-195 is transferred to this oxygen atom(group transfer), giving rise to the enzyme-bound products lactate and NAD+ (5). Afterthe loop opens, lactate dissociates from theenzyme, and the temporarily uncharged imi-dazole group in His-195 again binds a protonfrom the surrounding water (6). Finally, theoxidized coenzyme NAD+ is released, and theinitial state (1) is restored. As the diagramshows, the proton that appears in the reactionequation (NADH + H+) is not bound togetherwith NADH, but after release of the lacta-te—i. e., between steps (5) and (6) of theprevious cycle.
Exactly the same steps occur during theoxidation of lactate to pyruvate, but in theopposite direction. As mentioned earlier, thedirection which the reaction takes dependsnot on the enzyme, but on the equilibriumstate—i. e., on the concentrations of all thereactants and the pH value (see p.18).
100 Metabolism
All rights reserved. Usage subject to terms and conditions of license.Koolman, Color Atlas of Biochemistry, 2nd edition © 2005 Thieme

E . H E . H . NADH
E . H
. N
AD
H .
Pyru
vat
E . H
. N
AD
NADH
Arg-109
H
N
H
C
H
O
NH2
H
H
NAD
His-195Arg-171
C
HCNH
CH
N
H
C
HN
H2N NH2
C
H2N
HN NH2
C
HN
H2N NH2
C
HCNH
CH
N
H
C
H2N
HN NH2
C
H2N
HN NH2
N
H
C
H H
H
O
NH2
C
HN
H2N NH2
C
HCNH
CH
N
H
C
HCNH
CH
N
C
H2N
HN NH2N
H
C
H H
H
O
NH2
O O
C
HN
H2N NH2
C
H3C
O H
C
H2N
HN NH2N
H
C
H
H
O
NH2
HH
O O
N
H
C
H
H
O
NH2
C
H2N
HN NH2
C
HN
H2N NH2
C
HCNH
CH
NH
HH
C
H3C
O
O O
C
HN
H2N NH2
C
H3C
OC
HCNH
CH
N
H
H
A. Lactate dehydrogenase: catalytic cycle
1. Free enzyme 2. NADH bound
3. Pyruvate bound
4. Redox reaction5. Lactate bound
6. NAD bound
Protontransfer
Hydridetransfer
E . NAD . Lactate Transition state
Loop98-111
Pyruvat
Lactate
101Enzymes
All rights reserved. Usage subject to terms and conditions of license.Koolman, Color Atlas of Biochemistry, 2nd edition © 2005 Thieme

Enzymatic analysisEnzymes play an important role in biochem-ical analysis. In biological material—e. g., inbody fluids—even tiny quantities of an en-zyme can be detected by measuring its cata-lytic activity. However, enzymes are also usedas reagents to determine the concentrationsof metabolites—e. g., the blood glucose level(C). Most enzymatic analysis procedures usethe method of spectrophotometry (A).
A. Principle of spectrophotometry
Many substances absorb light in the visible orultraviolet region of the spectrum. This prop-erty can be used to determine the concentra-tion of such a substance. The extent of lightabsorption depends on the type and concen-tration of the substance and on the wave-length of the light used. Monochromaticlight—i. e., light with a defined wavelengthisolated from white light using a monochrom-ator—is therefore used. Monochromatic lightwith an intensity of I0 is passed through arectangular vessel made of glass or quartz (acuvet), which contains a solution of the ab-sorbing substance. The absorption A of thesolution (often also referred to as its extinc-tion) is defined as the negative decadic loga-rithm of the quotient I/I0. The Beer–Lambertlaw states that A is proportional to the con-centration c of the absorbing substance andthe thickness d of the solution it passesthrough. As mentioned earlier, the absorptioncoef•cient ε depends on the type of substanceand the wavelength.
B. Measurement of lactate dehydrogenaseactivity
Measurement of lactate dehydrogenase (LDH)activity takes advantage of the fact that whilethe reduced coenzyme NADH + H+ absorbslight at 340 nm, oxidized NAD+ does not. Ab-sorption spectra (i. e., plots of A against thewavelength) for the substrates and the coen-zymes of the LDH reaction are shown in Fig. 1.Differences in absorption behavior betweenNAD+ and NADH between 300 and 400 nmresult from changes in the nicotinamide ringduring oxidation or reduction (see p. 32). Tomeasure the activity, a solution containinglactate and NAD+ is placed in a cuvet, and
absorption is recorded at a constantwavelength of 340 nm. The uncatalyzed LDHreaction is very slow. It is only after additionof the enzyme that measurable quantities ofNADH are formed and absorption increases.Since according to the Beer–Lambert law therate of the increase in absorption ∆A/∆t isproportional to the reaction rate ∆c/∆t. Theabsorption coef cient ε at 340 nm or compar-ison with a standard solution can be used tocalculate LDH activity.
C. Enzymatic determination of glucose
Most biomolecules do not show any absorp-tion in the visible or ultraviolet spectrum. Inaddition, they are usually present in the formof mixtures with other—similar—compoundsthat would also react to a chemical test pro-cedure. These two problems can be avoidedby using an appropriate enzyme to produce acolored dye selectively from the metabolitethat is being analyzed. The absorption of thedye can then be measured.
A procedure (1) that is often used to mea-sure glucose when monitoring blood glucoselevels (see p. 160) involves two successive re-actions. The glucose-specific enzyme glucoseoxidase (obtained from fungi) first produceshydrogen peroxide, H2O2, which in the secondstep—catalyzed by a peroxidase—oxidizes acolorless precursor into a green dye (2).When all of the glucose in the sample hasbeen used up, the amount of dye formed—which can be measured on the basis of itslight absorption—is equivalent to the quantityof glucose originally present.
102 Metabolism
All rights reserved. Usage subject to terms and conditions of license.Koolman, Color Atlas of Biochemistry, 2nd edition © 2005 Thieme

∆A
0 2010
O2
H2O22 H2O
240 280 320 360 400
0.5
1.0
1.5
2.0
∆t
0
∆ANAD
0
1. 2.
∆c; ;
∆A ∆c∆t · ε ∆t
v= =
A = –log I = ε . c . d
d
0
ε∆A
=
I
A. Principle of spectrophotometry
White lightMonochroma-tic light,intensity
Monochroma-tic light,intensity
MonochromatorLight source Detector
Beer Lambertlaw
Sample solution,concentration c
Lightabsorption
Instrument
Absorption
B. Assay of lactate dehydrogenase activity
Wavelength (nm)
Abs
orpt
ion
Additionof LDH
Time
2 nkat
1 nkat
Abs
orpt
ion
(340
nm
) 3 nkat
Lactate; NAD
0.1 mMeach
NADH
LactatePyruvate
LactatePyruvateNADNADH
v ≈ Activity
C. Enzymatic determination of glucose
1. Reaction 2. Procedure
Enzymes
Colorlessprecursor
Abs
orpt
ion
(440
nm
)
Time (min)
Glucose-containingsample solution
Glucose Glucono-lactone
Greendye
Colorlessprecursor
Peroxidase1.11.1.7[Heme]
Glucoseoxidase1.1.3.4 [FAD]
Absorption
0
[Green dye]∞ = [Glucose]0
[Green dye]∞ = ∆A—ε
103Enzymes
All rights reserved. Usage subject to terms and conditions of license.Koolman, Color Atlas of Biochemistry, 2nd edition © 2005 Thieme

Coenzymes 1
A. Coenzymes: definitions
In many enzyme-catalyzed reactions, elec-trons or groups of atoms are transferredfrom one substrate to another. This type ofreaction always also involves additional mol-ecules, which temporarily accept the groupbeing transferred. Helper molecules of thistype are called coenzymes. As they are notcatalytically active themselves, the less fre-quently used term “cosubstrate” would bemore appropriate. In contrast to substratesfor which a given enzyme is usually specific(see p. 88), coenzymes cooperate with manyenzymes of varying substrate specificity. Wehave rather arbitrarily divided the coenzymeshere into group-transferring and redox coen-zymes. Strictly speaking, redox coenzymesalso transfer groups—namely, reducing equiv-alents (see p. 32).
Depending on the type of interaction withthe enzyme, a distinction is made betweensoluble coenzymes and prosthetic groups.Soluble coenzymes (1) are bound likesubstrates during a reaction, undergo a chem-ical change, and are then released again. Theoriginal form of the coenzyme is regeneratedby a second, independent reaction. Prostheticgroups (2), on the other hand, are coenzymesthat are tightly bound to the enzyme and re-main associated with it during the reaction.The part of the substrate bound by the coen-zyme is later transferred to another substrateor coenzyme of the same enzyme (not shownin Fig. 2).
B. Redox coenzymes 1
All oxidoreductases (see p. 88) require coen-zymes. The most important of these redoxcoenzymes are shown here. They can act insoluble form (S) or prosthetically (P). Theirnormal potentials E0 are shown in additionto the type of reducing equivalent that theytransfer (see p. 18).
The pyridine nucleotides NAD+ and NADP+
(1) are widely distributed as coenzymes ofdehydrogenases. They transport hydride ions(2e– and 1 H+; see p. 32) and always act insoluble form. NAD+ transfers reducing equiv-alents from catabolic pathways to the respi-ratory chain and thus contributes to energy
metabolism. In contrast, reduced NADP+ is themost important reductant involved in biosyn-thesis (see p. 112).
The flavin coenzymes FMN and FAD (2, 3)contain flavin (isoalloxazine) as a redox-activegroup. This is a three-membered, N-contain-ing ring system that can accept a maximum oftwo electrons and two protons during reduc-tion. FMN carries the phosphorylated sugaralcohol ribitol at the flavin ring. FAD arisesfrom FMN through bonding with AMP. Thetwo coenzymes are functionally similar.They are found in dehydrogenases, oxidases,and monooxygenases. In contrast to the pyri-dine nucleotides, flavin reactions give rise toradical intermediates (see p. 32). To preventdamage to cell components, the flavins al-ways remain bound as prosthetic groups inthe enzyme protein.
The role of ubiquinone (coenzyme Q, 4) intransferring reducing equivalents in the res-piratory chain is discussed on p. 140. Duringreduction, the quinone is converted into thehydroquinone (ubiquinol). The isoprenoid sidechain of ubiquinone can have various lengths.It holds the molecule in the membrane, whereit is freely mobile. Similar coenzymes are alsofound in photosynthesis (plastoquinone; seep. 132). Vitamins E and K (see p. 52) also be-long to the quinone/hydroquinone systems.
L-Ascorbic acid (vitamin C, 5) is a powerfulreducing agent. As an antioxidant, it providesnonspecific protection against oxidative dam-age (see p. 284), but it is also an essentialcofactor for various monooxygenases and di-oxygenases. Ascorbic acid is involved in thehydroxylation of proline and lysine residuesduring the biosynthesis of collagen (seep. 344), in the synthesis of catecholamines(see p. 352) and bile acids (see p. 314), aswell as in the breakdown of tyrosine (seep. 415). The reduced form of the coenzymeis a relatively strong acid and forms salts,the ascorbates. The oxidized form is knownas dehydroascorbic acid. The stimulation ofthe immune system caused by ascorbic acidhas not yet been fully explained.
104 Metabolism
All rights reserved. Usage subject to terms and conditions of license.Koolman, Color Atlas of Biochemistry, 2nd edition © 2005 Thieme

L –0.32
L
N A
N A
P
N A
N A
P
2[H]
OH
OH
a b c d
1.
2.
O
O O
C
CH2OH
HHO
O
H
2[H]L
–0to
+0.2
N
H
H
H
C
H
NH2
O
O
HH H
OH OH
H
C
CN
C
NCN
CN
N
N
H
H H
CNH2
OHH
O
HH H
OH OH
H
CH2O P O
O
O
P CH2O
O
O
H H
H
H3CO
H3CO
O
CH3
O
H3CO
H3CO
OH
CH3
OH
H
CH36 –10
O
HO O
C
CH2OH
HHO
HO
P 2[H] –0.3to
+0.2
F A F A
N
N
N
CNH
O
H3C
H3CC
O
P 2[H] –0.3to
+0.2
F
N
N
N
CNH
O
H3C
H3CC
O
F
C
CC
C
CC
N
N NC
NC
H
H3C
H3C
H H
CH2
O
H
O
H
CH
C
OH
H OH
CH OH
C O P
O
O
OH2
+0.1
Ribitol (Rit)
ox. red.
ox. red.
ox. red.
N
N
N
CNH
O
H3C
H3CC
O
H
H
O
HH H
H
C
CN
C
NCN
CN
N
O P O
O
O
P CH2O
O
O
H H
H
OH OH
A. Coenzymes: definitions
B. Redox coenzymes
Coenzyme Oxidized form Reduced form Type Trans-ferred
Eol
(V)
Substrate 1 Coenzyme(form 1)
Grouptransfer
Substrate 2 Coenzyme(form 2)
Prostheticgroup (form1) Substrate 1
Prostheticgroup (form 2)Substrate 2
4. Ubiquinone(coenzym Q)
5. Ascorbicacid
3. Flavin adenine
dinucleotide(FAD)
2. Flavinmononucleotide(FMN)
Ribitol
1. NAD(P)
105Enzymes
All rights reserved. Usage subject to terms and conditions of license.Koolman, Color Atlas of Biochemistry, 2nd edition © 2005 Thieme

Coenzymes 2
A. Redox coenzymes 2
In lipoic acid (6), an intramolecular disulfidebond functions as a redox-active structure. Asa result of reduction, it is converted into thecorresponding dithiol. As a prosthetic group,lipoic acid is usually covalently bound to alysine residue (R) of the enzyme, and it isthen referred to as lipoamide. Lipoamide ismainly involved in oxidative decarboxylationof 2-oxo acids (see p. 134). The peptidecoenzyme glutathione is a similar disulfide/dithiol system (not shown; see p. 284).
Iron–sulfur clusters (7) occur as prostheticgroups in oxidoreductases, but they are alsofound in lyases—e. g., aconitase (see p. 136)and other enzymes. Iron–sulfur clusters con-sist of 2–4 iron ions that are coordinated withcysteine residues of the protein (–SR) andwith anorganic sulfide ions (S). Structures ofthis type are only stable in the interior ofproteins. Depending on the number of ironand sulfide ions, distinctions are made be-tween [Fe2S2], [Fe3S4], and [Fe4S4] clusters.These structures are particularly numerousin the respiratory chain (see p. 140), andthey are found in all complexes except com-plex IV.
Heme coenzymes (8) with redox functionsexist in the respiratory chain (see p. 140), inphotosynthesis (see p. 128), and in monooxy-genases and peroxidases (see p. 24). Heme-containing proteins with redox functions arealso referred to as cytochromes. In cyto-chromes, in contrast to hemoglobin and myo-globin, the iron changes its valence (usuallybetween +2 and +3). There are several classesof heme (a, b, and c), which have differenttypes of substituent – R1 to – R 3. Hemoglobin,myoglobin, and the heme enzymes containheme b. Two types of heme a are found incytochrome c oxidase (see p. 132), whileheme c mainly occurs in cytochrome c, whereit is covalently bound with cysteine residuesof the protein part via thioester bonds.
B. Group-transferring coenzymes 1
The nucleoside phosphates (1) are not onlyprecursors for nucleic acid biosynthesis; manyof them also have coenzyme functions. Theyserve for energy conservation, and as a result
of energetic coupling (see p. 124) also allowendergonic processes to proceed. Metabolitesare often made more reactive (“activated”) asa result of the transfer of phosphate residues(phosphorylation). Bonding with nucleosidediphosphate residues (mainly UDP and CDP)provides activated precursors for polysac-charides and lipids (see p. 110). Endergonicformation of bonds by ligases (enzyme class6) also depends on nucleoside triphosphates.
Acyl residues are usually activated bytransfer to coenzyme A (2). In coenzyme A(see p. 12), pantetheine is linked to 3-phos-pho-ADP by a phosphoric acid anhydridebond. Pantetheine consists of three compo-nents connected by amide bonds—pantoicacid, -alanine, and cysteamine. The lattertwo components are biogenic amines formedby the decarboxylation of aspartate andcysteine, respectively. The compound formedfrom pantoic acid and β−alanine (pantothenicacid) has vitamin-like characteristics for hu-mans (see p. 368). Reactions between thethiol group of the cysteamine residue andcarboxylic acids give rise to thioesters, suchas acetyl CoA. This reaction is strongly ender-gonic, and it is therefore coupled to exergonicprocesses. Thioesters represent the activatedform of carboxylic acids, because acyl residuesof this type have a high chemical potentialand are easily transferred to other molecules.This property is often exploited in metabo-lism.
Thiamine diphosphate (TPP, 3), in coopera-tion with enzymes, is able to activate alde-hydes or ketones as hydroxyalkyl groups andthen to pass them on to other molecules. Thistype of transfer is important in the transketo-lase reaction, for example (see p. 152). Hy-droxyalkyl residues also arise in the decar-boxylation of oxo acids. In this case, they arereleased as aldehydes or transferred to lipo-amide residues of 2-oxoacid dehydrogenases(see p. 134). The functional component of TPPis the sulfur- and nitrogen-containing thiazolering.
106 Metabolism
All rights reserved. Usage subject to terms and conditions of license.Koolman, Color Atlas of Biochemistry, 2nd edition © 2005 Thieme

P
3+ 2+
1e
P 2[H]
S S HS SH
B-Rib
B-Rib-
TPP
AS
NP P P
P
B-Rib- P P
P
1eP
Fe S
FeS
S Fe
SFeRS
RS
SR
Fe FeS
S
RS
RS
SR
SR
S S
HCCH2
CH S S
HCCH2
CH
H H
N
H
O
N N
NN
Fe3+
CH3
R3
CH3R1
H3C
R2
A B
D C
COOCOO
O
HH
OH OH
H
CH2
BaseOPO
O
O
PO
O
O
PO
O
O
C
N
O
CH2
H
CH2
SH
CH2
C
N
O
CH2
H
CH2
S
CH2
C
CH3
O
N
H
C C
O
C
H
OH
CH2
CH3
CH3
O P O
O
O
P
O
OO
CH2O
HH H
O OH
H
N
NNHC
N
NH2
P
O
OO
H
N S
H3C CH2
C
N SCH2
H3C CH2 CH2O
N
N
H3C NH2
R
OHH
P P
N N
NN
Fe 2+
CH3
R3
CH3R1
H3C
R2
A B
D C
COOCOO
[Fe2 S2] [Fe4 S4]n+ m+
ox. red.
A. Redox coenzymes 2
8. Heme 0to
+0.5
–0.296. Lipoamide
Coenzyme(symbol)
Free form Charged form Group(s)trans-ferred
Importantenzymes
1. Nucleoside1. phosphates
Phospho-transferasesNucleotidyl-transferases(2.7.n.n)Ligases(6.n.n.n)
2. Coenzyme A Acylresidues
Acyltrans-ferases(2.3.n.n)
CoA trans-ferases(2.8.3.n)
3. Thiamine3. diphosphate
Hydroxy-alkylresidues
Decarboxy-lases (4.1.1.n)Oxoacid de-hydrogenases(1.2.4. n)Transketolase(2.2.1.1)
B. Group-transferring coenzymes 1
Coenzyme Oxidized form Reduced form Type Trans-ferred
7. Iron–sulfurcluster
Eol
–0.6to
+0.5
ox. red.
107Enzymes
All rights reserved. Usage subject to terms and conditions of license.Koolman, Color Atlas of Biochemistry, 2nd edition © 2005 Thieme

Coenzymes 3
A. Group-transferring coenzymes 2
Pyridoxal phosphate (4) is the most importantcoenzyme in amino acid metabolism. Its rolein transamination reactions is discussed indetail on p. 178. Pyridoxal phosphate is alsoinvolved in other reactions involving aminoacids, such as decarboxylations and dehydra-tions. The aldehyde form of pyridoxal phos-phate shown here (left) is not generally foundin free form. In the absence of substrates, thealdehyde group is covalently bound to the ε-amino group of a lysine residue as aldimine(“Schiff’s base”). Pyridoxamine phosphate(right) is an intermediate of transaminationreactions. It reverts to the aldehyde form byreacting with 2-oxoacids (see p. 178).
Biotin (5) is the coenzyme of the carboxy-lases. Like pyridoxal phosphate, it has anamide-type bond via the carboxyl groupwith a lysine residue of the carboxylase. Thisbond is catalyzed by a specific enzyme. UsingATP, biotin reacts with hydrogen carbonate(HCO3
–) to form N-carboxybiotin . From thisactivated form, carbon dioxide (CO2) is thentransferred to other molecules, into which acarboxyl group is introduced in this way. Ex-amples of biotindependent reactions of thistype include the formation of oxaloacetic acidfrom pyruvate (see p. 154) and the synthesisof malonyl-CoA from acetyl-CoA (see p. 162).
Tetrahydrofolate (THF, 6) is a coenzymethat can transfer C1 residues in different oxi-dation states. THF arises from the vitamin folicacid (see p. 366) by double hydrogenation ofthe heterocyclic pterin ring. The C1 unitsbeing transferred are bound to N-5, N-10, orboth nitrogen atoms. The most important de-rivatives are:
a) N5-formyl-THF and N10-formyl-THF, inwhich the formyl residue has the oxidationstate of a carboxylic acid;
b) N5-methylene-THF, with a C1 residue inthe oxidation state of an aldehyde; and
c) N5-methyl-THF, in which the methylgroup has the oxidation state of an alcohol.
C1 units transferred by THF play a role inthe synthesis of methionine (see p. 412), pu-rine nucleotides (see p. 188), and dTMP (seep. 190), for example. Due to the central role of
THF derivatives in the biosynthesis of DNAprecursors, the enzymes involved in THF me-tabolism are primary targets for cytostaticdrugs (see p. 402).
The cobalamins (7) are the chemically mostcomplex form of coenzyme. They also repre-sent the only natural substances that containthe transition metal cobalt (Co) as an essentialcomponent. Higher organisms are unable tosynthesize cobalamins themselves, and aretherefore dependent on a supply of vitaminB12 synthesized by bacteria (see p. 368).
The central component of the cobalaminsis the corrin ring, a member of the tetrapyr-roles, at the center of which the cobalt ion islocated. The end of one of the side chains ofthe ring carries a nucleotide with the unusualbase dimethylbenzimidazole. The ligands forthe metal ion are the four N atoms of thepyrrole ring, a nitrogen from dimethylbenzi-midazole, and a group X, which is organo-metallically bound—i. e., mainly covalently.
In methylcobalamin, X is a methyl group.This compound functions as a coenzyme forseveral methyltransferases, and among otherthings is involved in the synthesis of methio-nine from homocysteine (see p. 418). How-ever, in human metabolism, in which methio-nine is an essential amino acid, this reactiondoes not occur.
Adenosylcobalamin (coenzyme B12) carriesa covalently bound adenosyl residue at themetal atom. This is a coenzyme of variousisomerases, which catalyze rearrangementsfollowing a radical mechanism. The radicalarises here through homolytic cleavage of thebond between the metal and the adenosylgroup. The most important reaction of thistype in animal metabolism is the rearrange-ment of methylmalonyl-CoA to form succinyl-CoA, which completes the breakdown of odd-numbered fatty acids and of the branchedamino acids valine and isoleucine (seepp. 166 and 414).
108 Metabolism
All rights reserved. Usage subject to terms and conditions of license.Koolman, Color Atlas of Biochemistry, 2nd edition © 2005 Thieme

109Enzymes
All rights reserved. Usage subject to terms and conditions of license.Koolman, Color Atlas of Biochemistry, 2nd edition © 2005 Thieme

Activated metabolites
Many coenzymes (see pp. 104ff.) serve to ac-tivate molecules or groups that are poorlyreactive. Activation consists of the formationof reactive intermediate compounds in whichthe group concerned is located at a higherchemical potential and can therefore betransferred to other molecules in an exer-gonic reaction (see p. 124). Acetyl-CoA is anexample of this type of compound (see p. 12).
ATP and the other nucleoside triphosphatecoenzymes not only transfer phosphate resi-dues, but also provide the nucleotide compo-nents for this type of activation reaction. Onthis page, we discuss metabolites or groupsthat are activated in the metabolism by bond-ing with nucleosides or nucleotides. Inter-mediates of this type are mainly found inthe metabolism of complex carbohydratesand lipids.
A. Activated metabolites
1. Uridine diphosphate glucose (UDPglucose)
The inclusion of glucose residues into poly-mers such as glycogen or starches is an ender-gonic process. The activation of the glucosebuilding blocks that is required for this takesplaces in several steps, in which two ATPs areused per glucose. After the phosphorylation offree glucose, glucose 6-phosphate is isomer-ized to glucose 1-phosphate (a), reaction withUTP (b) then gives rise to UDPglucose, inwhich the anomeric OH group at C-1 of thesugar is bound with phosphate. This “energy-rich” compound (an acetal phosphate) allowsexergonic transfer of glucose residues to gly-cogen (c; see pp. 156, 408) or other acceptors.
2. Cytidine diphosphate choline (CDPcholine)
The amino alcohol choline is activated for in-clusion in phospholipids following a similarprinciple (see p. 170). Choline is first phos-phorylated by ATP to form choline phosphate(a), which by reaction with CTP and cleavageof diphosphate, then becomes CDPcholine. Incontrast to (1), it is not choline that is trans-ferred from CDPcholine, but rather cholinephosphate, which with diacylglycerol yieldsphosphatidylcholine (lecithin).
3. Phosphoadenosine phosphosulfate (PAPS)
Sulfate residues occur as strongly polargroups in various biomolecules—e. g., in gly-cosaminoglycans (see p. 346) and conjugatesof steroid hormones and xenobiotics (seep. 316). In the synthesis of the “activated sul-fate” PAPS, ATP first reacts with anorganicsulfate to form adenosine phosphosulfate(APS, a). This intermediate already containsthe “energy-rich” mixed anhydride bond be-tween phosphoric acid and sulfuric acid. Inthe second step, the 3-OH group of APS isphosphorylated, with ATP being used again.After transfer of the sulfate residue to OHgroups (c), adenosine-3,5-bisphosphate re-mains.
4. S-adenosyl methionine (SAM)
The coenzyme tetrahydrofolate (THF) is themain agent by which C1 fragments are trans-ferred in the metabolism. THF can bind thistype of group in various oxidation states andpass it on (see p. 108). In addition, there is“activated methyl,” in the form of S-adenosylmethionine (SAM). SAM is involved in manymethylation reactions—e. g., in creatine syn-thesis (see p. 336), the conversion of norepi-nephrine into epinephrine (see p. 352), theinactivation of norepinephrine by methyla-tion of a phenolic OH group (see p. 316), andin the formation of the active form of thecytostatic drug 6-mercaptopurine (seep. 402).
SAM is derived from degradation of theproteinogenic amino acid methionine, towhich the adenosyl residue of an ATP mole-cule is transferred. After release of the acti-vated methyl group, S-adenosyl homocys-teine (SAH) is left over. This can be convertedback into methionine in two further steps.Firstly, cleavage of the adenosine residuegives rise to the non-proteinogenic aminoacid homocysteine, to which a methyl groupis transferred once again with the help of N5-methyl-THF (see p. 418). Alternatively, homo-cysteine can also be broken down into pro-pionyl-CoA.
110 Metabolism
All rights reserved. Usage subject to terms and conditions of license.Koolman, Color Atlas of Biochemistry, 2nd edition © 2005 Thieme

THF
PPU
APPP
PPU
APPP
PPC
PC
P
P
PA A
PPP
P
P
AP
P
A
P
AS
R
A
AS
R
THF
PGlc
Glc
P
Glc
PP
Glc
Glc
UPPP
CPPP
PP
PP
APPP
APPP
H3C
3
CH3
SO3O
O3S
OH
O3S
SO42
PPA
a
b
c
a
b
c
d
a
b
c
a
b
c
P P
CH3
O
P
O
OO P O
O
O
CH2O
NC
NHC
HC
HC
NH2
O
H
OH OH
HH H
NH3C (CH2)2
CH3
CH3
O
P
O
O
O
HO
OH
OH
H
CH2HO
HH
H
HO P O
O
O
CH2O
NC
NHC
HC
HC
O
O
H
OH OH
HH H
N
CHN
C
CC
NHC
N
N
OCH2O
H
O OH
HH H
H H
P
O
O
OSO
O
O
P
O
OO
N
CN
C
CC
NC
N
N
OCH2S
H
OH OH
HH H
H
H H
H
H3C
CH2
CH2
CH3N
COO
H
A. Activated metabolites
4. S-adenosyl methionine (SAM)
3. Phosphoadenosine phosphosulfate (PAPS)
2. Cytidine diphosphate choline (CDPcholine)
1. Uridine diphosphate glucose (UDP-glucose)
Glucose1-phosphate
Glycogen Extended glycogen
UDP-glucose
Diacylglycerol Phosphatidylcholine
CDP-choline
N5-Methyl-THF
Methylatedsubstrate
SAMS-adenosyl-homocysteine
Adenosine
Choline
Choline
Choline
Methionine Homocysteine
Sulfatedsubstrate
PAPS
Choline
ADP
ADP
111Enzymes
All rights reserved. Usage subject to terms and conditions of license.Koolman, Color Atlas of Biochemistry, 2nd edition © 2005 Thieme

Intermediary metabolism
Hundreds of chemical reactions are con-stantly taking place in every cell, and takentogether these are referred to as the metabo-lism. The chemical compounds involved inthis are known as metabolites. Outside ofthe cell, almost all of the chemical changesin metabolites would only take place veryslowly and without any specific direction. Bycontrast, organized sequences of chemical re-actions with a high rate of throughput, knownas metabolic pathways, become possiblethrough the existence of specific enzymes(see p. 88).
A. Intermediary metabolism: overview
A number of central metabolic pathways arecommon to most cells and organisms. Thesepathways, which serve for synthesis, degra-dation, and interconversion of important me-tabolites, and also for energy conservation,are referred to as the intermediary metabo-lism.
In order to survive, all cells constantly re-quire organic and inorganic nutrients, as wellas chemical energy, which is mainly derivedfrom ATP (see below). Depending on the wayin which these needs are satisfied, organismscan be classified into autotrophic and hetero-trophic groups. The autotrophs, which in-clude plants and many microorganisms, cansynthesize organic molecules from inorganicprecursors (CO2). An autotrophic lifestyle ispossible through photosynthesis, for exam-ple (see p. 128). The heterotrophs—e. g., ani-mals and fungi—depend on organic substan-ces supplied in their diet. The schema shownon this page provides an overview of animalmetabolism.
The polymeric substances contained in thediet (proteins, carbohydrates, and nucleicacids—top) cannot be used by the organismdirectly. Digestive processes first have to de-grade them to monomers (amino acids, sug-ars, nucleotides). These are then mostly bro-ken down by catabolic pathways (pink ar-rows) into smaller fragments. The metabolitesproduced in this way (generally referred to asthe “metabolite pool”) are then either used toobtain energy through further catabolic con-version, or are built up again into more com-plex molecules by anabolic pathways (blue
arrows). Of the numerous metabolites in thepool, only three particularly important repre-sentatives—pyruvate, acetyl-CoA, and gly-cerol—are shown here. These moleculesrepresent connecting links between themetabolism of proteins, carbohydrates, andlipids. The metabolite pool also includes theintermediates of the tricarboxylic acid cycle(6). This cyclic pathway has both catabolic andanabolic functions—i. e., it is amphibolic (vio-let; see p. 138).
Waste products from the degradation oforganic substances in animal metabolisminclude carbon dioxide (CO2), water (H2O),and ammonia (NH3). In mammals, the toxicsubstance ammonia is incorporated into ureaand excreted in this form (see p. 182).
The most important form of storage forchemical energy in all cells is adenosinetriphosphate (ATP, see p. 122). ATP synthesisrequires energy—i. e., the reaction is ender-gonic. Conversely, cleavage of ATP into ADPand phosphate releases energy. Exergonic hy-drolysis of ATP, as a result of energeticcoupling (see p. 16), makes energy-depend-ent (endergonic) processes possible. For ex-ample, most anabolic pathways, as well asmovement and transport processes, are en-ergy-dependent.
The most important pathway for the syn-thesis of ATP is oxidative phosphorylation(see p. 122). In this process, catabolic path-ways first form reduced cofactors (NADH+H+,QH2, ETFH2). Electrons are then transferredfrom these compounds to oxygen. Thisstrongly exergonic process is catalyzed bythe respiratory chain and used indirectly forthe ATP synthesis (see p. 140). In anaerobicconditions—i. e., in the absence of oxygen—most organisms can fall back on ATP thatarises in glycolysis (3). This less ef cienttype of ATP synthesis is referred to as fermen-tation (see p. 146).
While NADH exclusively supplies oxidativephosphorylation, NADPH+H+—a very similarcoenzyme—is the reducing agent for anabolicpathways. NADPH + H+ is mainly formed inthe pentose phosphate pathway (PPP, 1; seep. 152).
112 Metabolism
All rights reserved. Usage subject to terms and conditions of license.Koolman, Color Atlas of Biochemistry, 2nd edition © 2005 Thieme

1
2
3
4
5
6
7
1
4 5
7
P
2
6
3
Proteins Nucleicacids Fats Iso-
prenoids
Aminoacids Pentoses Fatty
acids
Bases
Glycerol
ATP NADPH
NADHOtherbiosyn-theses
NADHETF
NH3
ATP
H2O CO2Urea
Catabolic pathwayAnabolic pathwayAmphibolic pathway
Pentose phosphate pathway
Gluconeogenesis
Glycolysis
β-Oxidation
Fatty acid biosynthesis
Tricarboxylic acid cycle
Urea cycle
Waste products
Lipids
Food
Poly-saccharides
Storage compoundNADHQH2
Pyruvate
AcetylCoA
Glucose
A. Intermediary metabolism: overview
O2 Oxidativephospho-rylation
113Metabolic Regulation
All rights reserved. Usage subject to terms and conditions of license.Koolman, Color Atlas of Biochemistry, 2nd edition © 2005 Thieme

Regulatory mechanisms
A. Fundamental mechanisms of metabolicregulation
The activities of all metabolic pathways aresubject to precise regulation in order to adjustthe synthesis and degradation of metabolitesto physiological requirements. An overview ofthe regulatory mechanisms is presented here.Further details are shown on pp. 116ff.
Metabolite flow along a metabolic pathwayis mainly determined by the activities of theenzymes involved (see p. 88). To regulate thepathway, it is suf cient to change the activityof the enzyme that catalyzes the slowest stepin the reaction chain. Most metabolic path-ways have key enzymes of this type on whichthe regulatory mechanisms operate. The ac-tivity of key enzymes is regulated at threeindependent levels:
Transcriptional control. Here, Biosynthesisof the enzyme protein is influenced at thegenetic level (1). Interventions in enzymesynthesis mainly affect synthesis of the cor-responding mRNA—i. e., transcription of thegene coding for the enzyme. The term “tran-scriptional control” is therefore used (seepp. 118, 244). This mechanism is mediated byregulatory proteins (transcription factors) thatact directly on DNA. The genes have a specialregulatory segment for this purpose, knownas the promoter region, which contains bind-ing sites (control elements) for regulatoryproteins. The activity of these proteins is, inturn, affected by metabolites or hormones.When synthesis of a protein is increased bytranscriptional control, the process is referredto as induction; when it is reduced or sup-pressed, it is referred to as repression. Induc-tion and repression processes take some timeand are therefore not immediately effective.
Interconversion of key enzymes (2) takeseffect considerably faster than transcriptionalcontrol. In this case, the enzyme is alreadypresent at its site of effect, but it is initiallystill inactive. It is only when needed that it isconverted into the catalytically active form,after signaling and mediation from secondmessengers (see p. 120) through an activatingenzyme (E1). If the metabolic pathway is nolonger required, an inactivating enzyme (E2)returns the key enzyme to its inactive restingstate.
Interconversion processes in most casesinvolve ATP-dependent phosphorylation ofthe enzyme protein by a protein kinase ordephosphorylation of it by a protein phospha-tase (see p. 120). The phosphorylated form ofthe key enzyme is usually the more activeone, but the reverse may also occur.
Modulation by ligands. An important vari-able that regulates flow through a metabolicpathway is precursor availability (metaboliteA in the case shown here). The availability ofprecursor A increases along with the activityof the metabolic pathways that form A (3) andit decreases with increasing activity of otherpathways that also consume A (4). Transportfrom one cell compartment to another canalso restrict the availability of A.
Coenzyme availability can also often have alimiting effect (5). If the coenzyme is regen-erated by a second, independent metabolicpathway, the speed of the second pathwaycan limit that of the first one. For example,glycolysis and the tricarboxylic acid cycle aremainly regulated by the availability of NAD+
(see p. 146). Since NAD+ is regenerated by therespiratory chain, the latter indirectly con-trols the breakdown of glucose and fatty acids(respiratory control, see p. 144).
Finally, the activity of key enzymes can beregulated by ligands (substrates, products,coenzymes, or other effectors), which as allo-steric effectors do not bind at the active centeritself, but at another site in the enzyme,thereby modulating enzyme activity (6; seep. 116). Key enzymes are often inhibited byimmediate reaction products, by end prod-ucts of the reaction chain concerned (“feed-back” inhibition), or by metabolites from com-pletely different metabolic pathways. Theprecursors for a reaction chain can stimulatetheir own utilization through enzyme activa-tion.
114 Metabolism
All rights reserved. Usage subject to terms and conditions of license.Koolman, Color Atlas of Biochemistry, 2nd edition © 2005 Thieme

P
R
H H
H
P PA
A ZCP
6
2
1
54
AP P P
3
BA
A Z
A. Fundamental mechanisms of metabolic regulation
Transcription
Gene
RepressionInductionTranscriptionalcontrol
Regulatorprotein
Translation
mRNA
Hormone
Secondmessenger
Key enzyme(inactive)
Regenerationof the coenzyme
Interconversion
Modulationby ligands
Competition for substratesor coenzymes
E1 E2Inactivatedenzyme
End product
Coenzyme Coenzyme
Key enzyme(active)
Feedback inhibition
Activatedenzyme
Availability pre-cursors, com-partmentation
Meta-bolicpathway
RP
RP RP
RP
115Metabolic Regulation
All rights reserved. Usage subject to terms and conditions of license.Koolman, Color Atlas of Biochemistry, 2nd edition © 2005 Thieme

Allosteric regulation
The regulation of aspartate carbamoyltrans-ferase (ACTase), a key enzyme of pyrimidinebiosynthesis (see p. 188) is discussed here asan example of allosteric regulation of enzymeactivity. Allosteric effects are mediated by thesubstrate itself or by inhibitors and activators(allosteric effectors, see p. 114). The latter bindat special sites outside the active center, pro-ducing a conformational change in the en-zyme protein and thus indirectly lead to analteration in its activity.
A. Aspartate carbamoyltransferase:reaction
ACTase catalyzes the transfer of a carbamoylresidue from carbamoyl phosphate to theamino group of L-aspartate. The N-carbamoylL-aspartate formed in this way already con-tains all of the atoms of the later pyrimidinering (see p. 188). The ACTase of the bacteriumEscherichia coli is inhibited by cytidine tri-phosphate (CTP), an end product of the ana-bolic metabolism of pyrimidines, and is ac-tivated by the precursor ATP.
B. Kinetics
In contrast to the kinetics of isosteric (normal)enzymes, allosteric enzymes such as ACTasehave sigmoidal (S-shaped) substrate satura-tion curves (see p. 92). In allosteric systems,the enzyme’s af nity to the substrate is notconstant, but depends on the substrate con-centration [A]. Instead of the Michaelis con-stant Km (see p. 92), the substrate concentra-tion at half-maximal rate ([A]0.5) is given. Thesigmoidal character of the curve is describedby the Hill coef•cient h. In isosteric systems,h = 1, and h increases with increasing sig-moidicity.
Depending on the enzyme, allosteric effec-tors can influence the maximum rate Vmax,the semi-saturation concentration [A]0.5, andthe Hill coef cient h. If it is mainly Vmax that ischanged, the term “V system” is used. Muchmore common are “K systems”, in which al-losteric effects only influence [A]0.5 and h.
The K type also includes ACTase. The inhib-itor CTP in this case leads to right-shifting ofthe curve, with an increase in [A]0.5 and h(curve II). By contrast, the activator ATP
causes a left shift; it reduces both [A]0.5 andh (curve III). This type of allosteric effect wasfirst observed in hemoglobin (see p. 280),which can be regarded as an “honorary” en-zyme.
C. R and T states
Allosteric enzymes are almost always oligo-mers with 2–12 subunits. ACTase consists ofsix catalytic subunits (blue) and six regulatorysubunits (yellow). The latter bind the allo-steric effectors CTP and ATP. Like hemoglobin,ACTase can also be present in two conforma-tions—the less active T state (for “tense”) andthe more active R state (for “relaxed”). Sub-strates and effectors influence the equili-brium between the two states, and therebygive rise to sigmoidal saturation behavior.With increasing aspartate concentration, theequilibrium is shifted more and more towardthe R form. ATP also stabilizes the R confor-mation by binding to the regulatory subunits.By contrast, binding of CTP to the same sitespromotes a transition to the T state. In thecase of ACTase, the structural differences be-tween the R and T conformations are partic-ularly dramatic. In T R conversion, the cat-alytic subunits separate from one another by1.2 nm, and the subunits also rotate aroundthe axis of symmetry. The conformations ofthe subunits themselves change only slightly,however.
D. Structure of a dimer
The subunits of ACTase each consist of twodomains—i. e., independently folded partialstructures. The N-terminal domain of the reg-ulatory subunit (right) mediates interactionwith CTP or ATP (green). A second, Zn2+-con-taining domain (Zn2+ shown in light blue)establishes contact with the neighboring cat-alytic subunit. Between the two domains ofthe catalytic subunit lies the active center,which is occupied here by two substrate ana-logs (red).
116 Metabolism
All rights reserved. Usage subject to terms and conditions of license.Koolman, Color Atlas of Biochemistry, 2nd edition © 2005 Thieme

CP P P
COO
CH2
H3NCH COO
NH2
POC
H2N
OC C
HNH
CH2
COO
COO
P
AP P P
CTP
UMP
P
CTP
ATP
III
I
II
5
4
3
2
1
00.0 5.0 10.0 15.0
6
7
[A]0.5
C1 C3
C4 C6
R1
R'1
R'1
C1 C3
C4 C6
R1
R'2
R2
C2
C5
R3
C2
C5
R'2
R2
Substrate
Catalyticsubunit ATP/CTP-binding domain
Regulatorysubunit
N-CarbamoylL-aspartateN-Carbamoyl–
L-Aspartate
Aspartatecarbamoyl-transferase2.1.3.2 [ Zn2 ]
ATP (CTP)
A. Aspartate carbamoyltransferase: reaction
C. R and T conformationB. Kinetics
T conformation(less active)
Activecenter
R conformation(more active)
Effector-bindingsite
D. Structure of a dimer
Act
ivit
y
[Aspartate] (mM)
2 mM ATPh = 1.4
Withouteffectorh = 2.0
0.5 mM CTPh = 2.3
Zn2 domain
CO2R-NH2ATP
117Metabolic Regulation
All rights reserved. Usage subject to terms and conditions of license.Koolman, Color Atlas of Biochemistry, 2nd edition © 2005 Thieme

Transcription control
A. Functioning of regulatory proteins
Regulatory proteins (transcription factors) areinvolved in controlling gene expression in allcells. These regulatory proteins bind to spe-cific DNA sequences and thereby activate orinhibit the transcription of genes (Tran-scription control). The effects of transcriptionfactors are usually reversible and are oftencontrolled by ligands or by interconversion.
The nomenclature for transcription factorsis confusing. Depending on their mode of ac-tion, various terms are in use both for theproteins themselves and for the DNA sequen-ces to which they bind. If a factor blocks tran-scription, it is referred to as a repressor; oth-erwise, it is called an inducer. DNA sequencesto which regulatory proteins bind are referredto as control elements. In prokaryotes, controlelements that serve as binding sites for RNApolymerases are called promoters, whereasrepressor-binding sequences are usuallycalled operators. Control elements that bindactivating factors are termed enhancers,while elements that bind inhibiting factorsare known as silencers.
The numerous regulatory proteins that areknown can be classified into four differentgroups (1–4), based on their mechanisms ofaction. Negative gene regulation—i. e.,switching off of the gene concerned—is car-ried out by repressors. Some repressors onlybind to DNA (1a) in the absence of specificligands (L). In this case, the complex betweenthe repressor and the ligand loses its ability tobind to the DNA, and the promoter regionbecomes accesible for binding of RNA poly-merase (1b). It is often the free repressor thatdoes not bind to the DNA, so that transcrip-tion is only blocked in the presence of theligand (2a, 2b). A distinction between twodifferent types of positive gene regulationcan be made in the same way. If it is onlythe free inducer that binds, then transcriptionis inhibited by the appropriate ligand (3).Conversely, many inducers only become ac-tive when they have bound a ligand (4). Thisgroup includes the receptors for steroid hor-mones, for example (see p. 378).
B. Lactose operon
The well-investigated lactose operon of thebacterium Escherichial coli can be used hereas an example of transcriptional control. Thelac operon is a DNA sequence that is simul-taneously subject to negative and positivecontrol. The operon contains the structuralgenes for three proteins that are required forthe utilization of lactose (one transporter andtwo enzymes), as well as control elements thatserve to regulate the operon.
Since lactose is converted to glucose in thecell, there is no point in expressing the genesif glucose is already available. And indeed, thegenes are in fact only transcribed when glu-cose is absent and lactose is present (3). This isachieved by interaction between two regula-tory proteins. In the absence of lactose, the lacrepressor blocks the promoter region (2).When lactose is available, it is convertedinto allolactose, which binds to the repressorand thereby detaches it from the operator (3).However, this is still not suf cient for thetranscription of the structural genes. For bind-ing of the RNA polymerase to take place, aninducer—the catabolite activator protein(CAP)—is required, which only binds to theDNA when it is present as a complex with3,5-cyclo-AMP (cAMP; see p. 386). cAMP, asignal for nutrient deficiency, is only formedby E. coli in the absence of glucose.
The interaction between the CAP–cAMPcomplex and DNA is shown in Fig. 4. Eachsubunit of the dimeric inducer (yellow or or-ange) binds one molecule of cAMP (red). Con-tact with the DNA (blue) is mediated by two“recognition helices” that interact with themajor groove of the DNA. The bending of theDNA strand caused by CAP has functional sig-nificance.
Transcription control is much more com-plex in eukaryotes (see p. 244). The numberof transcription factors involved is larger, andin addition the gene activity is influenced bythe state of the chromatin (see p. 238).
118 Metabolism
All rights reserved. Usage subject to terms and conditions of license.Koolman, Color Atlas of Biochemistry, 2nd edition © 2005 Thieme

L
L
L
L
1a 1b
2a 2b
3a 3b
4a 4b
CAP
1.
2.
3.
5'
3'
OCH2
O
H
O OH
HH H
PO
O
RNApoly-merase
DNA Gen
Repressor
Negative regulation
Without ligand With ligand
mRNA
Ligand
RNApoly-merase
Inducer
Positive regulation
Without ligand
Promoter
B. Lactose operon
RNA polymerase(only binds in thepresence ofCAP · cAMP)
CAP-bindingsite
lac RepressorLactose
Cataboliteactivatorprotein(CAP)
Genes forpermeasegalactosidasetransacetylase
LactoseRepressorallo-lactosecomplex
cAMP
mRNA
Lactose catabolism
CAP · cAMP Transcription
Glucose
Allolactose4. CAP · cAMP bound to DNA
Promoter
Operator
cAMPRecognitionhelix
With ligand
A. Functions of regulatory proteins
Adenin
119Metabolic Regulation
All rights reserved. Usage subject to terms and conditions of license.Koolman, Color Atlas of Biochemistry, 2nd edition © 2005 Thieme

Hormonal control
In higher organisms, metabolic and otherprocesses (growth, differentiation, control ofthe internal environment) are controlled byhormones (see pp. 370ff.)
A. Principles of hormone action
Depending on the type of hormone, hormonesignals are transmitted to the target cells indifferent ways. Apolar (lipophilic) hormonespenetrate the cell and act in the cell nucleus,while polar (hydrophilic) hormones act on theexternal cell membrane.
Lipophilic hormones, which include thesteroid hormones, thyroxine, and retinoicacid, bind to a specific receptor protein insidetheir target cells. The complex formed by thehormone and the receptor then influencestranscription of specific genes in the cell nu-cleus (see pp. 118, 244). The group of hydro-philic hormones (see p. 380) consists of hor-mones derived from amino acids, as well aspeptide hormones and proteohormones.Their receptors are located in the plasmamembrane. Binding of the hormone to thistype of receptor triggers a signal that is trans-mitted to the interior of the cell, where itcontrols the processes that allow the hor-mone signal to take effect (signal transduc-tion; see pp. 384ff.)
B. Hormonal regulation of glucosemetabolism in the liver
The liver plays a major role in glucose homeo-stasis in the organism (see p. 310). If glucosedeficiency arises, the liver releases glucoseinto the blood, and when blood sugar levelsare high, it takes glucose up from the bloodand converts it into different metabolites.Several hormones from both groups are in-volved in controlling these processes. A verysimplified version of the way in which theywork is presented here. Glycogen is the formin which glucose is stored in the liver andmuscles. The rate of glycogen synthesis isdetermined by glycogen synthase (bottomright), while its breakdown is catalyzed byglycogen phosphorylase (bottom left).
Regulation by interconversion (bottom). Ifthe blood glucose level falls, the peptidehormone glucagon is released. This activates
glycogen breakdown, releasing glucose, andat the same time inhibits glycogen synthesis.Glucagon binds to receptors in the plasmamembrane (bottom left) and, with mediationby a G-protein (see p. 386), activates theenzyme adenylate cyclase, which forms thesecond messenger 3,5-cyclo-AMP (cAMP)from ATP. cAMP binds to another enzyme,protein kinase A (PK-A), and activates it.PK-A has several points of attack. Throughphosphorylation, it converts the active formof glycogen synthase into the inactive form,thereby terminating the synthesis of glyco-gen. Secondly, it activates another proteinkinase (not shown), which ultimately con-verts the inactive form of glycogen phosphor-ylase into the active form through phosphor-ylation. The active phosphorylase releases glu-cose 1-phosphate from glycogen, which afterconversion into glucose 6-phosphate suppliesfree glucose. In addition, via an inhibitor (I) ofprotein phosphatase (PP), active PK-A inhibitsinactivation of glycogen phosphorylase. Whenthe cAMP level falls again, phosphoproteinphosphatases become active, which dephos-phorylate the various phosphoproteins in thecascade described, and thereby arrest glyco-gen breakdown and re-start glycogen synthe-sis. Activation and inactivation of proteinsthrough phosphorylation or dephosphoryla-tion is referred to as interconversion.
In contrast to glucagon, the peptidehormone insulin (see p. 76) increases glyco-gen synthesis and inhibits glycogen break-down. Via several intermediates, it inhibitsprotein kinase GSK-3 (bottom right; for de-tails, see p. 388) and thereby prevents inacti-vation of glycogen synthase. In addition, in-sulin reduces the cAMP level by activatingcAMP phosphodiesterase (PDE).
Regulation by transcriptional control (top).If the liver’s glycogen reserves have been ex-hausted, the steroid hormone cortisol main-tains glucose release by initiating the conver-sion of amino acids into glucose (gluconeo-genesis; see p. 154). In the cell nucleus, thecomplex of cortisol and its receptor (seep. 378) binds to the promoter regions of var-ious key enzymes of gluconeogenesis andleads to their transcription. The active en-zymes are produced through translation ofthe mRNA formed. Control of the transcrip-tion of the gluconeogenesis enzyme PEP car-boxykinase is discussed on p. 244.
120 Metabolism
All rights reserved. Usage subject to terms and conditions of license.Koolman, Color Atlas of Biochemistry, 2nd edition © 2005 Thieme

H
H
H H
HH
P
P
IP P
P
A. Principles of hormone action
B. Hormonal regulation of glucose metabolism in the liver
Hormonereceptorcomplex mRNA 1 mRNA 2 mRNA 3
Gluco-corticoidreceptor
Enzyme 1 Enzyme 2 Enzyme 3
Glu-cose
ATP AMP
Adenylatecyclase
PKA
PDE
PI3K
IRS
PPGlucagonreceptor
Glycogenphosphorylase
Glycogensynthase
Insulinreceptor
Insulin
Cell response
Tran-scription
Cell response
Second messenger
Translation
mRNA
Hydrophilichormones
Lipophilichormones
Cortisol
Transcription
Gene 1 Gene 2 Gene 3
Glucagon
Gluconeogenesis
GlycogenPP
Aminoacids
Translation
GSK-3
Glucose Glc-6-
Glc-1-
Gα
DNA
Protein
Polysome
Receptor
cAMP
Receptor
121Metabolic Regulation
All rights reserved. Usage subject to terms and conditions of license.Koolman, Color Atlas of Biochemistry, 2nd edition © 2005 Thieme

ATP
The nucleotide coenzyme adenosinetriphosphate (ATP) is the most importantform of chemical energy in all cells. Cleavageof ATP is strongly exergonic. The energy thisprovides (∆G; see p. 16) is used to drive ender-gonic processes (such as biosynthesis andmovement and transport processes) throughenergetic coupling (see p. 124). The other nu-cleoside triphosphate coenzymes (GTP, CTP, andUTP) have similar chemical properties to ATP,but they are used for different tasks in metab-olism (see p. 110).
A. ATP: structure
In ATP, a chain of three phosphate residues islinked to the 5-OH group of the nucleosideadenosine (see p. 80). These phosphate resi-dues are termed α, β , and γ. The α phosphateis bound to ribose by a phosphoric acid esterbond. The linkages between the three phos-phate residues, on the other hand, involvemuch more unstable phosphoric acid anhy-dride bonds. The active coenzyme is in factgenerally a complex of ATP with an Mg2+
ion, which is coordinatively bound to the αand β phosphates (Mg2+ ATP4–). However,the term “ATP” is usually used for the sakeof simplicity.
B. Hydrolysis energies
The formula for phosphate residues shown inFig. A, with single and double bonds, is not anaccurate representation of the actual chargedistribution. In ATP, the oxygen atoms of allthree phosphate residues have similarlystrong negative charges (orange), while thephosphorus atoms represent centers of posi-tive charge. One of the reasons for the insta-bility of phosphoric anhydride bonds is therepulsion between these negatively chargedoxygen atoms, which is partly relieved bycleavage of a phosphate residue. In addition,the free phosphate anion formed by hydroly-sis of ATP is better hydrated and more stronglyresonance-stabilized than the correspondingresidue in ATP. This also contributes to thestrongly exergonic character of ATP hydroly-sis.
In standard conditions, the change in freeenthalpy ∆G0 (see p. 18) that occurs in thehydrolysis of phosphoric acid anhydridebonds amounts to –30 to –35 kJ mol–1 atpH 7. The particular anhydride bond of ATPthat is cleaved only has a minor influence on∆G0 (1–2). Even the hydrolysis of diphos-phate (also known as pyrophosphate; 4) stillyields more than –30 kJ mol–1. By contrast,cleavage of the ester bond between ribose andphosphate only provides –9 kJ mol–1 (3).
In the cell, the ∆G of ATP hydrolysis is sub-stantially larger, because the concentrationsof ATP, ADP and Pi are much lower than instandard conditions and there is an excess ofATP over ADP (see p. 18). The pH value andMg2+ concentration also affect the value of ∆G.The physiological energy yield of ATP hydrol-ysis to ADP and anorganic phosphate (Pi) isprobably around –50 kJ mol–1.
C. Types of ATP formation
Only a few compounds contain phosphateresidues with a group transfer potential (seep. 18) that is high enough to transfer them toADP and thus allow ATP synthesis. Processesthat raise anorganic phosphate to this type ofhigh potential are called substrate level phos-phorylations (see p. 124). Reactions of thistype take place in glycolysis (see p. 150) andin the tricarboxylic acid cycle (see p. 136).Another “energy-rich” phosphate compoundis creatine phosphate, which is formed fromATP in muscle and can regenerate ATP asneeded (see p. 336).
Most cellular ATP does not arise in the waydescribed above (i. e., by transfer of phosphateresidues from organic molecules to ADP), butrather by oxidative phosphorylation. Thisprocess takes place in mitochondria (or aslight-driven phosphorylation in chloroplasts)and is energetically coupled to a proton gra-dient over a membrane. These H+ gradientsare established by electron transport chainsand are used by the enzyme ATP synthase as asource of energy for direct linking of anor-ganic phosphate to ADP. In contrast to sub-strate level phosphorylation, oxidative phos-phorylation requires the presence of oxygen(i. e., aerobic conditions).
122 Metabolism
All rights reserved. Usage subject to terms and conditions of license.Koolman, Color Atlas of Biochemistry, 2nd edition © 2005 Thieme

-10
-20
-30
∆G OI
kJ · mol-1
β αγMg
P PA
AP P P
P
ATP
H
P PA
AP P PP
P
P
e
N
CHN
C
CC
NHC
N
NH2
OCH2O
H
OH OH
HH H
P
O
O
OPO
O
O
P
O
O
O
αβγ
P
P
P
P
+
4
ATP
P
P
P
Ade
nosi
ne
+
3
AM
P
P
P
ATP
+
2
AD
PAT
P
P
+
1
321
A
H
OCH2O
H
OH
H
P
O
O
OPO
O
O
αβ
A. ATP: structure
C. Types of ATP formation
2. Mg2 -Complex
B. Hydrolysis energies
Phosphorylatedsubstrate
Enzyme
Substrate
1. Phosphate transfer
Electrons
Protons ATPsynthase
ADP
2. Oxidative phosphorylation
Phosphoric acidanhydride bonds
Phosphoric acidester bond
Ade
nine
1. Formula
2. ATP: charge density
ATP
Substratechain phos-phorylation
N-glycosidicbond
Positive
Neutral
Negative
1. Hydrolysis energies
Ared
AdenosinePhosphate residue
Ribose
ADP
123Energy Metabolism
All rights reserved. Usage subject to terms and conditions of license.Koolman, Color Atlas of Biochemistry, 2nd edition © 2005 Thieme

Energetic coupling
The cell stores chemical energy in the form of“energy-rich” metabolites. The most impor-tant metabolite of this type is adenosine tri-phosphate (ATP), which drives a large numberof energy-dependent reactions via energeticcoupling (see p. 16).
A. Energetic coupling
The change in free enthalpy ∆G0 during hy-drolysis (see p. 18) has been arbitrarily se-lected as a measure of the group transferpotential of “energy-rich” compounds. How-ever, this does not mean that ATP is in facthydrolyzed in energetically coupled reactions.If ATP hydrolysis and an endergonic processwere simply allowed to run alongside eachother, the hydrolysis would only produceheat, without influencing the endergonicprocess. For coupling, the two reactions haveto be linked in such a way that a commonintermediate arises. This connection is illus-trated here using the example of the gluta-mine synthetase reaction.
Direct transfer of NH3 to glutamate is en-dergonic (∆G0 = +14 kJ mol–1; see p. 18),and can therefore not take place. In the cell,the reaction is divided into two exergonicsteps. First, the γ-phophate residue is trans-ferred from ATP to glutamate. This gives riseto an “energy-rich” mixed acid anhydride. Inthe second step, the phosphate residue fromthe intermediate is substituted by NH3, andglutamine and free phosphate are produced.The energy balance of the reaction as a whole(∆G0 = –17 kJ mol–1) is the sum of thechanges in free enthalpy of direct glutaminesynthesis (∆G0 = 14 kJ mol–1) plus ATP hy-drolysis (∆G0 = –31 kJ mol–1), although ATPhas not been hydrolyzed at all.
B. Substrate-level phosphorylation
As mentioned earlier (see p. 122), there are afew metabolites that transfer phosphate toADP in an exergonic reaction and can there-fore form ATP. In ATP synthesis, anorganicphosphate or phosphate bound in an ester-like fashion is transferred to bonds with ahigh phosphate transfer potential. Reactionsof this type are termed “substrate-level phos-
phorylations,” as they represent individualsteps within metabolic pathways.
In the glyceraldehyde 3-phosphate dehy-drogenation reaction, a step involved in gly-colysis (1; see also C), the aldehyde group inglyceraldehyde 3-phosphate is oxidized into acarboxyl group. During the reaction, an anor-ganic phosphate is also introduced into theproduct, producing a mixed acid anhy-dride—1,3-bisphosphoglycerate. Phosphopyr-uvate hydratase (“enolase”, 2) catalyzes theelimination of water from 2-phosphoglycer-ate. In the enol phosphate formed (phosphoe-nol pyruvate), the phosphate residue—in con-trast to 2-phosphoglycerate—is at an ex-tremely high potential (∆G0 of hydrolysis:–62 kJ mol–1). A third reaction of this typeis the formation of succinyl phosphate, whichoccurs in the tricarboxylic acid cycle as anindividual step in the succinyl CoA ligase re-action. Here again, anorganic phosphate isintroduced into a mixed acid anhydridebond to be transferred from there to GDP.Succinyl phosphate is only an intermediatehere, and is not released by the enzyme.
In the literature, the term “substrate levelphosphorylation” is used inconsistently.Some authors use it to refer to reactions inwhich anorganic phosphate is raised to a highpotential, while others use it for the subse-quent reactions, in which ATP or GTP isformed from the energy-rich intermediates.
C. Glyceraldehyde-3-phosphatedehydrogenase
The reaction catalyzed during glycolysis byglyceraldehyde-3-phosphate dehydrogenase(GADPH) is shown here in detail. Initially,the SH group of a cysteine residue of theenzyme is added to the carbonyl group ofglyceraldehyde 3-phosphate (a). This inter-mediate is oxidized by NAD+ into an “en-ergy-rich” thioester (b). In the third step (c),anorganic phosphate displaces the thiol, andthe mixed anhydride 1,3-bisphosphoglyceratearises. In this bond, the phosphate residue isat a high enough potential for it to be trans-ferred to ADP in the next step (not shown; seep. 150).
124 Metabolism
All rights reserved. Usage subject to terms and conditions of license.Koolman, Color Atlas of Biochemistry, 2nd edition © 2005 Thieme

70
60
50
40
30
20
10
a
b
c
N A
N A
N A
P
P
P
P
P
N A
AP P P
P P
P
P
P
P
P
+
H
CR O
SH
H
CR S
OH
CR S
O
SH
CR O
O
C H
COO
(CH )
CO O
NH
2 2
3
C H
COO
(CH )
CO NH
NH
2
2 2
3
C H
COO
(CH )
CO O
NH
PHO O
O
2 2
3
AP P P P P
A
2
1 3
A. Energetic coupling
C. Glyceraldehyde 3-phosphatedehydrogenase
B. Substrate level phosphorylation
Gln Glu-γ-phosphate
H2O
NH4
NH3
1. Glutamine synthetase reaction
Reaction 1: Glutamate + NH3 +14 kJ . mol–1
Reaction 2: ATP + H2O – 31 kJ . mol–1
Glutamine
ADP +
Total: Glutamate + NH3 + ATP ADP
2. Energy balance
Chemicalpotential
Phospho-enolpyruvate
1,3-bisphospho-glycerate
Succinyl-phosphate
ATP (GTP)
Glycer-aldehyde3-phos-phate
2-Phospho-glycerate
CoA
Succinyl-CoA
Inorganicphosphate
Glyceraldehyde3-phosphate
Inter-mediate 1
1,3-Bisphos-phoglycerate
Inorganicphosphate
Glycer-aldehyde-3-phosphatedehydro-genase
Inter-mediate 2
Mixed anhydride
Glu
ATP ADP
Glutamine +– 17 kJ . mol–1
+ H2O
Thioester
∆GOI = -17 kJ . mol-1∆GOI =+14 kJ .
mol-1
–
125Energy Metabolism
All rights reserved. Usage subject to terms and conditions of license.Koolman, Color Atlas of Biochemistry, 2nd edition © 2005 Thieme

Energy conservation at membranes
Metabolic energy can be stored not only in theform of “energy-rich” bonds (see p. 122), butalso by separating electric charges from eachother using an insulating layer to preventthem from redistributing. In the field of tech-nology, this type of system would be called acondenser. Using the same principle, energy isalso stored (“conserved”) at cell membranes.The membrane functions as an insulator;electrically charged atoms and molecules(ions) function as charges.
A. Electrochemical gradient
Although artificial lipid membranes are al-most impermeable to ions, biological mem-branes contain ion channels that selectivelyallow individual ion types to pass through(see p. 222). Whether an ion can cross thistype of membrane, and if so in which direc-tion, depends on the electrochemical gra-dient—i. e., on the concentrations of the ionon each side of the membrane (the concen-tration gradient) and on the difference in theelectrical potential between the interior andexterior, the membrane potential.
The membrane potential of resting cells(resting potential; see p. 350) is –0.05 to–0.09 V—i. e., there is an excess negativecharge on the inner side of the plasma mem-brane. The main contributors to the restingpotential are the two cations Na+ and K+, aswell as Cl– and organic anions (1). Data on theconcentrations of these ions outside and in-side animal cells, and permeability coef -cients, are shown in the table (2).
The behavior of an ion type is describedquantitatively by the Nernst equation (3).∆ψG is the membrane potential (in volts, V)at which there is no net transport of the ionconcerned across the membrane (equilibriumpotential). The factor R T/F n has a value of0.026 V for monovalent ions at 25 °C. Thus,for K+, the table (2) gives an equilibrium po-tential of ca. –0.09 V—i. e., a value more or lessthe same as that of the resting potential. Bycontrast, for Na+ ions, ∆ψG is much higher thanthe resting potential, at +0.07 V. Na+ ionstherefore immediately flow into the cellwhen Na+ channels open (see p. 350). Thedisequilibrium between Na+ and K+ ions is
constantly maintained by the enzyme Na+/K+-ATPase, which consumes ATP.
B. Proton motive force
Hydronium ions (“H+ ions”) can also developelectrochemical gradients. Such a proton gra-dient plays a decisive part in cellular ATP syn-thesis (see p. 142). As usual, the energy con-tent of the gradient depends on the concen-tration gradients—i. e., on the pH difference∋pH between the two sides of the membrane.In addition, the membrane potential ∆ψ alsomakes a contribution. Together, these twovalues give the proton motive force ∆p, ameasure for the work that the H+ gradientcan do. The proton gradient across the innermitochondrial membrane thus delivers ap-proximately 24 kJ per mol H+.
C. Energy conservation in proton gradients
Proton gradients can be built up in variousways. A very unusual type is represented bybacteriorhodopsin (1), a light-driven protonpump that various bacteria use to produceenergy. As with rhodopsin in the eye, thelight-sensitive component used here is cova-lently bound retinal (see p. 358). In photosyn-thesis (see p. 130), reduced plastoquinone(QH2) transports protons, as well as electrons,through the membrane (Q cycle, 2). The for-mation of the proton gradient by the respira-tory chain is also coupled to redox processes(see p. 140). In complex III, a Q cycle is respon-sible for proton translocation (not shown). Incytochrome c oxidase (complex IV, 3), H+ trans-port is coupled to electron flow fromcytochrome c to O2.
In each of these cases, the H+ gradient isutilized by an ATP synthase (4) to form ATP.ATP synthases consist of two components—aproton channel (F0) and an inwardly directedprotein complex (F1), which conserves theenergy of back-flowing protons through ATPsynthesis (see p. 142).
126 Metabolism
All rights reserved. Usage subject to terms and conditions of license.Koolman, Color Atlas of Biochemistry, 2nd edition © 2005 Thieme

AP P P
P PA
P
Fe
Fe
A. Electrochemical gradient
B. Proton motive force
Protein
Proton motive force ≈ 0.06 V
∆p = ∆ψ - · ∆pH
∆G = -F · ∆p
Membranepotential
∆ψ = ψa - ψ i
pH gradient∆pH = pHa - pHi
(in pH units)
Ha H i
2.3 · R · T
F
1. Cause
2. Concentrations
R = gas constantT = temperature (K)
3. Nernst equation
n = Ion chargeF = Faraday constant
outside∆ΨG =
R · TF · n
lninside
3. Electron-drivenprotonpump(cyto-chrome Coxidase)
Inside
1. Light-drivenproton pump(bacterio-rhodopsin)
2. Q cycle(plasto-quinonecyclein plants)
Heme/a3
4. Proton-driven ATPsynthesis
ATP
2H
Proton flowElectron flow
Ion Concentrations PermeabilitycoefficientCyto-
plasmExtracelluarspace
(mM) (mM) (cm · s–1 · 109)
Organicanions
100 5 500
15 150 5
0.0002 2
138 34 0
Na
K
Ca2
Na K Cl Organic anions
Outside
Retinal
2H2H
Cyto-chrome C
b/f-complex
C
C ·
13 150 10Cl
C. Energy conservationin proton gradients
CuA
CuB
2 H2O 4H
8HO2
2H
2e
2e
PS II
QH2
Q
QH2
Q
nH
F1 F0
127Energy Metabolism
All rights reserved. Usage subject to terms and conditions of license.Koolman, Color Atlas of Biochemistry, 2nd edition © 2005 Thieme

Photosynthesis: light reactions
Sunlight is the most important source of en-ergy for nearly all living organisms. With thehelp of photosynthesis, light energy is used toproduce organic substances from CO2 andwater. This property of phototrophic organ-isms (plants, algae, and some bacteria) is ex-ploited by heterotrophic organisms (e. g., ani-mals), which are dependent on a supply oforganic substances in their diet (see p. 112).The atmospheric oxygen that is vital to higherorganisms is also derived from photosynthe-sis.
A. Photosynthesis: overview
The chemical balance of photosynthesis issimple. Six molecules of CO2 are used toform one hexose molecule (right). The hydro-gen required for this reduction process istaken from water, and molecular oxygen isformed as a by-product (left). Light energy isrequired, since water is a very poor reducingagent and is therefore not capable of reducingCO2.
In the light-dependent part of photosyn-thesis—the “light reactions ”—H2O moleculesare split into protons, electrons, and oxygenatoms. The electrons undergo excitation bylight energy and are raised to an energy levelthat is high enough to reduce NADP+. TheNADPH+H+ formed in this way, in contrast toH2O, is capable of “fixing” CO2 reductive-ly—i. e., of incorporating it into organic bonds.Another product of the light reactions is ATP,which is also required for CO2 fixation. IfNADPH+H+, ATP, and the appropriate en-zymes are available, CO2 fixation can alsotake place in darkness. This process is there-fore known as the “dark reaction.”
The excitation of electrons to form NADPHis a complex photochemical process thatinvolves chlorophyll, a tetrapyrrole dye con-taining Mg2+ that bears an extra phytol resi-due (see p. 132).
B. Light reactions
In green algae and higher plants, photosyn-thesis occurs in chloroplasts. These are organ-elles, which—like mitochondria—are sur-rounded by two membranes and contain theirown DNA. In their interior, the stroma, thyla-
koids or flattened membrane sacs are stackedon top of each other to form grana. The insideof the thylakoid is referred to as the lumen.The light reactions are catalyzed by enzymeslocated in the thylakoid membrane, whereasthe dark reactions take place in the stroma.
As in the respiratory chain (see p. 140), thelight reactions cause electrons to pass fromone redox system to the next in an electrontransport chain. However, the direction oftransport is opposite to that found in the res-piratory chain. In the respiratory chain, elec-trons flow from NADH+H+ to O2, with theproduction of water and energy.
In photosynthesis, electrons are taken upfrom water and transferred to NADP+, with anexpenditure of energy. Photosynthetic electrontransport is therefore energetically “uphillwork.” To make this possible, the transportis stimulated at two points by the absorptionof light energy. This occurs through two pho-tosystems—protein complexes that containlarge numbers of chlorophyll molecules andother pigments (see p. 132). Another compo-nent of the transport chain is the cytochromeb/f complex, an aggregate of integral mem-brane proteins that includes two cytochromes(b563 and f). Plastoquinone, which is com-parable to ubiquinone, and two soluble pro-teins, the coppercontaining plastocyanin andferredoxin, function as mobile electron car-riers. At the end of the chain, there is anenzyme that transfers the electrons to NADP+.
Because photosystem II and the cyto-chrome b/f complex release protons from re-duced plastoquinone into the lumen (via a Qcycle), photosynthetic electron transport es-tablishes an electrochemical gradient acrossthe thylakoid membrane (see p. 126), which isused for ATP synthesis by an ATP synthase.ATP and NADPH+H+, which are both neededfor the dark reactions, are formed in thestroma.
128 Metabolism
All rights reserved. Usage subject to terms and conditions of license.Koolman, Color Atlas of Biochemistry, 2nd edition © 2005 Thieme

Mg2+
P PA
AP P P
N A
P
P
H
N A
P6 H2O
3 O2
H
12 H
QQH2
H2O2 H2 H
[O]
P PA A
P P P
P
N A
PATP
nH
N A
P1
2
1
2
NADPH + H
NADP
Mg2+
Mg2+
OC
N
N
H3C
N
N
O
CH3
CH2
CH3
CH
H
C
H
H3COMg
H
CH2
CH3
OH3C
O
B. Light reactions
A. Photosynthesis: overview
Chlorophyll a
Electron flow
Proton flow 12 NADP
18 ADP + Pi
18 ATP
12 NADPH + H
“Darkreactions”(Calvincycle)
Hexose
Innermembrane
Outermembrane
Lumen
Stroma
Thylakoid
Granum
Phytol residue
6 CO2
2 HPhotosystem II Cytochrome b/f complex
Plasto-quinone
Stroma
Light
Thylakoid membrane
Ferredoxin (Fd)
Photosystem I
Ferredoxin-NADP -reductase1.18.1.2
ATP synthase3.6.1.34
Plasto-cyanin(PC)
Lumen
Plasmamembrane
Nucleus
VacuoleChloroplast
Cytoplasm
1 µm
129Energy Metabolism
All rights reserved. Usage subject to terms and conditions of license.Koolman, Color Atlas of Biochemistry, 2nd edition © 2005 Thieme

Photosynthesis: dark reactions
The “light reactions” in photosynthesis bringabout two strongly endergonic reactions—thereduction of NADP+ to NADPH+H+ and ATPsynthesis (see p. 122). The chemical energyneeded for this is produced from radiant en-ergy by two photosystems.
A. Photosystem II
The photosynthetic electron transport chainin plants starts in photosystem II (PS II; seep. 128). PS II consists of numerous proteinsubunits (brown) that contain bound pig-ments—i. e., dye molecules that are involvedin the absorption and transfer of light energy.
The schematic overview of PS II presentedhere (1) only shows the important pigments.These include a special chlorophyll molecule,the reaction center P680; a neighboring Mg2+
free chlorophyll (pheophytin); and two boundplastoquinones (QA and QB). A third quinone(QP) is not linked to PS II, but belongs to theplastoquinone pool. The white arrows indi-cate the direction of electron flow from waterto QP. Only about 1% of the chlorophyll mol-ecules in PS II are directly involved in photo-chemical excitation (see p. 128). Most of themare found, along with other pigments, in whatare known as light-harvesting or antennacomplexes (green). The energy of light quantastriking these can be passed on to the reactioncenter, where it can be utilized.
In Fig. 2, photosynthetic electron transportin PS II is separated into the individual stepsinvolved. Light energy from the light-harvest-ing complexes (a) raises an electron of thechlorophyll in the reaction center to anexcited “singlet state.” The excited electron isimmediately passed on to the neighboringpheophytin. This leaves behind an “electrongap” in the reaction center—i. e., a positivelycharged P680 radical (b). This gap is now filledby an electron removed from an H2O mole-cule by the water-splitting enzyme (b). Theexcited electron passes on from the pheophy-tin via QA to QB, converting the latter into asemiquinone radical (c). QB is then reduced tohydroquinone by a second excited electron,and is then exchanged for an oxidized qui-none (QP) from the plastoquinone pool. Fur-ther transport of electrons from the plasto-
quinone pool takes place as described on thepreceding page and shown in B.
B. Redox series
It can be seen from the normal potentials E0
(see p. 18) of the most important redox sys-tems involved in the light reactions why twoexcitation processes are needed in order totransfer electrons from H2O to NADP+. Afterexcitation in PS II, E0 rises from around –1 Vback to positive values in plastocyanin(PC)—i. e., the energy of the electrons has tobe increased again in PS I. If there is no NADP+
available, photosynthetic electron transportcan still be used for ATP synthesis. Duringcyclic photophosphorylation, electrons returnfrom ferredoxin (Fd) via the plastoquinonepool to the b/f complex. This type of electrontransport does not produce any NADPH, butdoes lead to the formation of an H+ gradientand thus to ATP synthesis.
C. Calvin cycle
The synthesis of hexoses from CO2 is onlyshown in a very simplified form here; a com-plete reaction scheme is given on p. 407. Theactual CO2 fixation—i. e., the incorporation ofCO2 into an organic compound—is catalyzedby ribulose bisphosphate carboxylase/oxygen-ase (“rubisco”). Rubisco, the most abundantenzyme on Earth, converts ribulose 1,5-bis-phosphate, CO2 and water into two mole-cules of 3-phosphoglycerate. These are thenconverted, via 1,3-bisphosphoglycerate and3-phosphoglycerate, into glyceraldehyde3-phosphate (glyceral 3-phosphate). In thisway, 12 glyceraldehyde 3-phosphates are syn-thesized from six CO2. Two molecules of thisintermediate are used by gluconeogenesis re-actions to synthesize glucose 6-phosphate(bottom right). From the remaining 10 mole-cules, six molecules of ribulose 1,5-bisphos-phate are regenerated, and the cycle thenstarts over again. In the Calvin cycle, ATP isrequired for phosphorylation of 3-phospho-glycerate and ribulose 5-phosphate.NADPH+H+, the second product of the lightreaction, is consumed in the reduction of 1,3-bisphosphoglycerate to glyceraldehyde 3-phosphate.
130 Metabolism
All rights reserved. Usage subject to terms and conditions of license.Koolman, Color Atlas of Biochemistry, 2nd edition © 2005 Thieme

N A
P
EOl (V)
-1.0
-0.8
-0.6
-0.4
-0.2
0
+0.2
+0.4
+0.6
+0.8
-1.2
H
Ph
QA
QB
QPb/f
PC
Q
Fe/S
Fd
H2O
Mg2+
Mg2+
QB QPQA
Fe
H2O 2 H 1/2 O2
a b c d
2.
OH
OH
Mg2+
Mg2+ Mg2+
Mg2+ Mg2+
1.
Mg2+ Mg2+ Mg2+Mg2+
H2O
P PA A
P P P
N A
P
AP P P
P PA
N A
P
1
2
3
4
1
2
6 CO2
6 H2O4 P
12 P
3
4
CO2, Mg2 1
2P
H2O
CO2
P
P
NADP
P
H2C C
O
C
OH
O
O
P
CH2C
O
C
OH
O
O
H2C C
O
C
H
OH
C
H
OH
CH2
O O
O C O
A. Photosystem II
C. Calvin cycle
Photo-chemicalexcitation
Cyclicphotophos-phorylation
B. Redox series
Boundquinone
Exchangeablequinone
Plasto-quinone
Pheophytin
Reactioncenter(P680)
Water-splittingenzyme
4 Mn2+
4 ions
Plasto-quinone(ox.)
ExchangeQB (red) QP(ox)
Ribulo
se 1.5
-
bisphosp
hate
Ribulose5-phosphate
Glyceral
3-phosp
hate
Glyceraldehyde3-phosphate
Glucose6-phosphate
Ribulose-bisphosphatecarboxylase 4.1.1.39
Phosphoglycerate kinase2.7.2.3
Glyceraldehyde 3-phosphatedehydrogenase (NADP ) 1.2.1.13
Phosphoribulokinase 2.7.1.19
Gluco-neogenesis
3-Phospho-
glycerate
Light-harvestingcomplex
6 ATP6 ADP
12 ATP
12 ADP
12 NADPH 12 NADP
Light
Light
Light
12
6
6
10
PS II(P680)
PS I(P700)
131Energy Metabolism
All rights reserved. Usage subject to terms and conditions of license.Koolman, Color Atlas of Biochemistry, 2nd edition © 2005 Thieme

Molecular models:membrane proteins
The plates show, in simplified form, the struc-tures of cytochrome c oxidase (A; complex IVof the respiratory chain) and of photosystem Iof a cyanobacterium (B). These two moleculesare among the few integral membrane pro-teins for which the structure is known in de-tail. Both structures were determined by X-ray crystallography.
A. Cytochrome c oxidase
The enzyme cytochrome c oxidase (“COX,” EC1.9.3.1) catalyzes the final step of the respira-tory chain. It receives electrons from the smallheme protein cytochrome c and transfersthem to molecular oxygen, which is therebyreduced to water (see p. 140). At the sametime, 2–4 protons per water molecule formedare pumped from the matrix into the inter-membrane space.
Mammalian COX (the illustration showsthe enzyme from bovine heart) is a dimerthat has two identical subunits with massesof 204 kDa each. Only one subunit is shown indetail here; the other is indicated by graylines. Each subunit consists of 13 differentpolypeptides, which all span the inner mito-chondrial membrane. Only polypeptides I(light blue) and II (dark blue) and the linkedcofactors are involved in electron transport.The other chains, which are differently ex-pressed in the different organs, probablyhave regulatory functions. The two hemegroups, heme a (orange) and heme a1 (red)are bound in polypeptide 1. The copper centerCuA consists of two copper ions (green),which are coordinated by amino acid residuesin polypeptide II. The second copper (CuB) islocated in polypeptide I near heme a3.
To reduce an O2 molecule to two moleculesof H2O, a total of four electrons are needed,which are supplied by cytochrome c (pink, topleft) and initially given off to CuA. From there,they are passed on via heme a and heme a3 tothe enzyme’s reaction center, which is locatedbetween heme a3 and CuB. The reduction ofthe oxygen takes place in several steps, with-out any intermediate being released. The fourprotons needed to produce water and the H+
ions pumped into the intermembrane space
are taken up by two channels (D and K, notshown). The mechanism that links protontransport to electron transfer is still beinginvestigated.
B. Reaction center of Synechococcuselongatus
Photosystem I (PS I) in the cyanobacteriumSynechococcus elongatus is the first system ofthis type for which the structure has beensolved in atomic detail. Although the bacterialphotosystem differs slightly from the systemsin higher plants, the structure provides val-uable hints about the course of the light re-actions in photosynthesis (see p. 128). Thefunctioning of the photosystem is discussedin greater detail on p. 130.
The functional form of PS I in S. elongatusconsists of a trimer with a mass of more than106 Da that is integrated into the membrane.Only one of the three subunits is shown here.This consists of 12 different polypeptides(gray-blue), 96 chlorophyll molecules (green),22 carotenoids (orange), several phylloqui-nones (yellow), and other components. Mostof the chlorophyll molecules are so-called an-tenna pigments. These collect light energyand conduct it to the reaction center, whichis located in the center of the structure andtherefore not visible. In the reaction center, anelectron is excited and transferred via variousintermediate steps to a ferredoxin molecule(see p. 128). The chlorophylls (see formula)are heme-like pigments with a highly modi-fied tetrapyrrole ring, a central Mg2+ ion, andan apolar phytol side chain. Shown here ischlorophyll a, which is also found in the re-action center of the S. elongatus photosystem.
The yellow and orange-colored carot-enoids—e. g., -carotene (see formula)—areauxiliary pigments that serve to protect thechloroplasts from oxidative damage. Danger-ous radicals can be produced during the lightreaction—particularly singlet oxygen. Caroten-oids prevent compounds of this type fromarising, or render them inactive. Carotenoidsare also responsible for the coloring of leavesseen during fall. They are left behind whenplants break down chlorophyll in order torecover the nitrogen it contains.
132 Metabolism
All rights reserved. Usage subject to terms and conditions of license.Koolman, Color Atlas of Biochemistry, 2nd edition © 2005 Thieme

N
N
N
N
CH2
CH3HH3C
HH
H3CO
CH3
CH3
CH3
C
O
O
C
O O
CH
Mg2+
H3C
H3C
O
O
Innermitochondrialmembrane
Matrix
A. Cytochrome C oxidase
B. Photosystem I
Outermitochondrialmembrane
Thylakoid membrane
Cytochrome C
Chlorophyll
Plastoquinone
β-carotene
Heme a
Heme a3
Cu B
Cu AIntermembrane space
133Energy Metabolism
All rights reserved. Usage subject to terms and conditions of license.Koolman, Color Atlas of Biochemistry, 2nd edition © 2005 Thieme

Oxoacid dehydrogenases
The intermediary metabolism has multien-zyme complexes which, in a complex reaction,catalyze the oxidative decarboxylation of 2-oxoacids and the transfer to coenzyme A ofthe acyl residue produced. NAD+ acts as theelectron acceptor. In addition, thiamine di-phosphate, lipoamide, and FAD are also in-volved in the reaction. The oxoaciddehydrogenases include a) the pyruvate dehy-drogenase complex (PDH, pyruvate acetylCoA), b) the 2-oxoglutarate dehydrogenasecomplex of the tricarboxylic acid cycle (ODH,2-oxoglutarate succinyl CoA), and c) thebranched chain dehydrogenase complex, whichis involved in the catabolism of valine, leu-cine, and isoleucine (see p. 414).
A. Pyruvate dehydrogenase: reactions
The pyruvate dehydrogenase reaction takesplace in the mitochondrial matrix (seep. 210). Three different enzymes [E1–E3]form the PDH multienzyme complex (see B).
[1] Initially, pyruvate dehydrogenase [E1]catalyzes the decarboxylation of pyruvateand the transfer of the resulting hydroxyethylresidue to thiamine diphosphate (TPP, 1a). Thesame enzyme then catalyzes oxidation of theTPP-bound hydroxyethyl group to yield anacetyl residue. This residue and the reducingequivalents obtained are then transferred tolipoamide (1b).
[2] The second enzyme, dihydrolipoamideacetyltransferase [E2], shifts the acetyl residuefrom lipoamide to coenzyme A (2), with dihy-drolipoamide being left over.
[3] The third enzyme, dihydrolipoamide de-hydrogenase [E3], reoxidizes dihydrolipo-amide, with NADH+H+ being formed. Theelectrons are first taken over by enzyme-bound FAD (3a) and then transferred via acatalytically active disulfide bond in the E3subunit (not shown) to soluble NAD+ (3b).
The five different coenzymes involved areassociated with the enzyme components indifferent ways. Thiamine diphosphate isnon-covalently bound to E1, whereas lipo-amide is covalently bound to a lysine residueof E2 and FAD is bound as a prosthetic group toE3. NAD+ and coenzyme A, being solublecoenzymes, are only temporarily associatedwith the complex.
An important aspect of PDH catalysis is thespatial relationship between the componentsof the complex. The covalently bound lipo-amide coenzyme is part of a mobile domainof E2, and is therefore highly mobile. Thisstructure is known as the lipoamide arm, andswings back and forth between E1 and E3during catalysis. In this way, lipoamide caninteract with the TPP bound at E1, with solutecoenzyme A, and also with the FAD thatserves as the electron acceptor in E3.
B. PDH complex of Escherichia coli
The PDH complex of the bacterium Escheri-chia coli has been particularly well studied. Ithas a molecular mass of 5.3 106, and with adiameter of more than 30 nm it is larger thana ribosome. The complex consists of a total of60 polypeptides (1, 2): 24 molecules of E2(eight trimers) form the almost cube-shapedcore of the complex. Each of the six surfaces ofthe cube is occupied by a dimer of E3 compo-nents, while each of the twelve edges of thecube is occupied by dimers of E1 molecules.Animal oxoacid dehydrogenases have similarstructures, but differ in the numbers of sub-units and their molecular masses.
Further information
The PDH reaction, which is practically irrever-sible, occupies a strategic position at the inter-face between carbohydrate and fatty acid me-tabolism, and also supplies acetyl residues tothe tricarboxylic acid cycle. PDH activity istherefore strictly regulated (see p. 144). Inter-conversion is particularly important in animalcells (see p. 120). Several PDH-specific proteinkinases inactivate the E1 components throughphosphorylation, while equally specific pro-tein phosphatases reactivate it again. Thebinding of the kinases and phosphatases tothe complex is in turn regulated by metabo-lites. For example, high concentrations of ace-tyl CoA promote binding of kinases andthereby inhibit the reaction, while Ca2+ in-creases the activity of the phosphatase. Insu-lin activates PDH via inhibition of phosphor-ylation.
134 Metabolism
All rights reserved. Usage subject to terms and conditions of license.Koolman, Color Atlas of Biochemistry, 2nd edition © 2005 Thieme

E1
E2
CoA
E3
1.
E1+ E2 + E3 = 60
E1 12 · 2 = 24
E2 8 · 3 = 24
E3 6 · 2 =12
10nm
E1 E3
E2
2.
CO2
AS
OOC C CH3
O
F A
S S
SS
HH
S
S
S
S
C CH3
O
H
E1
E2
E3NAD NADH + H
F A
N A N A
AS C CH3
O
S
N H
R2
H3C
R1
4b
4a
2
3
TPP
OH
CH3
HS
CN
C
R
H3C
R
1
A. Pyruvate dehydrogenase: reactions
B. PDH complex of Escherichia coli
Hydroxyalkyl thiaminediphosphate
Acetyllipoamide
Dihydrolipoamide
Pyruvate dehydro-genase 1.2.4.1
Dihydrolipoamideacetyltransferase 2.3.1.12
Dihydrolipoamidedehydrogenase 1.8.1.4
Acetyl CoA
Pyruvate
Thiaminediphosphate
135Energy Metabolism
All rights reserved. Usage subject to terms and conditions of license.Koolman, Color Atlas of Biochemistry, 2nd edition © 2005 Thieme

Tricarboxylic acid cycle: reactions
The tricarboxylic acid cycle (TCA cycle, alsoknown as the citric acid cycle or Krebs cycle)is a cyclic metabolic pathway in the mitochon-drial matrix (see p. 210). In eight steps, it oxi-dizes acetyl residues (CH3-CO-) to carbon di-oxide (CO2). The reducing equivalents ob-tained in this process are transferred toNAD+ or ubiquinone, and from there to therespiratory chain (see p. 140). Additional met-abolic functions of the cycle are discussed onp. 138.
A. Tricarboxylic acid cycle
The acetyl-CoA that supplies the cycle withacetyl residues is mainly derived from -oxidation of fatty acids (see p. 164) and fromthe pyruvate dehydrogenase reaction. Both ofthese processes take place in the mitochon-drial matrix.
[1] In the first step of the cycle, citratesynthase catalyzes the transfer of an acetylresidue from acetyl CoA to a carrier molecule,oxaloacetic acid. The product of this reaction,tricarboxylic acid, gives the cycle its name.
[2] In the next step, tricarboxylic acidundergoes isomerization to yield isocitrate.In the process, only the hydroxyl group isshifted within the molecule. The correspond-ing enzyme is called aconitate hydratase(“aconitase”), because unsaturated aconitatearises as an enzyme-bound intermediate dur-ing the reaction (not shown; see p. 8). Due tothe properties of aconitase, the isomerizationis absolutely stereospecific. Although citrate isnot chiral, isocitrate has two chiral centers, sothat it could potentially appear in four iso-meric forms. However, in the tricarboxylicacid cycle, only one of these stereoisomers,(2R,3S)-isocitrate, is produced.
[3] The first oxidative step now follows.Isocitrate dehydrogenase oxidizes the hy-droxyl group of isocitrate into an oxo group.At the same time, a carboxyl group is releasedas CO2, and 2-oxoglutarate (also known as α-ketoglutarate) and NADH+H+ are formed.
[4] The next step, the formation of succinylCoA, also involves one oxidation and one de-carboxylation. It is catalyzed by 2-oxogluta-rate dehydrogenase, a multienzyme complexclosely resembling the PDH complex (see
p. 134). NADH+H+ is once again formed inthis reaction.
[5] The subsequent cleavage of the thio-ester succinylCoA into succinate and coen-zyme A by succinic acid-CoA ligase (succinylCoA synthetase, succinic thiokinase) isstrongly exergonic and is used to synthesizea phosphoric acid anhydride bond (“substratelevel phosphorylation ”, see p.124). However, itis not ATP that is produced here as is other-wise usually the case, but instead guanosinetriphosphate (GTP). However, GTP can be con-verted into ATP by a nucleoside diphosphatekinase (not shown).
[6] Via the reactions described so far, theacetyl residue has been completely oxidizedto CO2. At the same time, however, the carriermolecule oxaloacetate has been reduced tosuccinate. Three further reactions in the cyclenow regenerate oxaloacetate from succinate.Initially, succinate dehydrogenase oxidizessuccinate to fumarate. In contrast to the otherenzymesinthecycle,succinatedehydrogenaseisanintegralproteinoftheinnermitochondrialmembrane. It is therefore also assigned to therespiratory chain as complex II. Although suc-cinate dehydrogenase contains FAD as a pros-thetic group, ubiquinone is the real electronacceptor of the reaction.
[7] Water is now added to the double bondof fumarate by fumarate hydratase (“fuma-rase”), and chiral (2S)-malate is produced.
[8] In the last step of the cycle, malate isagain oxidized by malate dehydrogenase intooxaloacetate, with NADH+H+ again being pro-duced. With this reaction, the cycle is com-plete and can start again from the beginning.As the equilibrium of the reaction lies well onthe side of malate, the formation of oxaloace-tic acid by reaction [8] depends on thestrongly exergonic reaction [1], which imme-diately removes it from the equilibrium.
The net outcome is that each rotation ofthe tricarboxylic acid cycle converts one ace-tyl residue and two molecules of H2O into twomolecules of CO2. At the same time, one GTP,three NADH+H+ and one reduced ubiquinone(QH2) are produced. By oxidative phosphory-lation (see p. 122), the cell obtains aroundnine molecules of ATP from these reducedcoenzymes (see p. 146). Together with thedirectly formed GTP, this yields a total of 10ATP per acetyl group.
136 Metabolism
All rights reserved. Usage subject to terms and conditions of license.Koolman, Color Atlas of Biochemistry, 2nd edition © 2005 Thieme

5
P
N A
AS
H2O
H2O
OOH
OH
O
GP P P
P PG
AS
7
8
2
3
1 6
CO2 CO2
N A N A
N AN A 2
7 8
16
AS
+28.1
-38.2
+6.7
-7.1-37.0
-8.8
±0
-3.8
4
4 3
N A
5
AS
GTP
kJ · mol-1∆G0I
COO
CH
C
OH
COO
HH
COO
CH
C
COO
H
COO
CH2
CH2
COO
CH2H2C
C
OOC
O
O C O
CH2H2C
C
COO
OOC
OO C O
COO
CH2C
C
H
COO
OOC
H OH
COO
CH2C
CH2
OH
COO
OOC
C CH3
O
COO
C
CH2
O
COO
(2S) - Malate
Respiratorychain
Fumarate
Succinate
Acetyl CoA
Citrate
Succinyl CoA
2-Oxoglutarate
Citrate synthase4.1.3.7
Aconitase4.2.1.3 [Fe4S4]
Isocitrate DH 1.1.1.41
2-Oxoglutarate DH complex1.2.4.2, 1.8.1.4, 2.3.1.61
Succinate-CoA ligase6.2.1.4
Succinate DH 1.3.5.1[FAD, Fe2S2, Fe4S4]
Fumarate hydratase4.2.1.2
Malate DH 1.1.1.37DH = dehydrogenase
Center of chirality
UbiquinolQH2
Oxaloacetate
(2R,3S)-Isocitrate
A. Tricarboxylic acid cycle
137Energy Metabolism
All rights reserved. Usage subject to terms and conditions of license.Koolman, Color Atlas of Biochemistry, 2nd edition © 2005 Thieme

Tricarboxylic acid cycle: functions
A. Tricarboxylic acid cycle: functions
The tricarboxylic acid cycle (see p. 136) isoften described as the “hub of intermediarymetabolism.” It has both catabolic and ana-bolic functions—it is amphibolic.
As a catabolic pathway, it initiates the “ter-minal oxidation” of energy substrates. Manycatabolic pathways lead to intermediates ofthe tricarboxylic acid cycle, or supply metab-olites such as pyruvate and acetyl-CoA thatcan enter the cycle, where their C atoms areoxidized to CO2. The reducing equivalents(see p. 14) obtained in this way are thenused for oxidative phosphorylation—i. e., toaerobically synthesize ATP (see p. 122).
The tricarboxylic acid cycle also suppliesimportant precursors for anabolic pathways.Intermediates in the cycle are converted into:
• Glucose (gluconeogenesis; precursors: oxa-loacetate and malate—see p. 154)
• Porphyrins (precursor: succinyl-CoA—seep. 192)
• Amino acids (precursors: 2-oxoglutarate,oxaloacetate—see p. 184)
• Fatty acids and isoprenoids (precursor: cit-rate—see below)
The intermediates of the tricarboxylic acidcycle are present in the mitochondria only invery small quantities. After the oxidation ofacetyl-CoA to CO2, they are constantly regen-erated, and their concentrations therefore re-main constant, averaged over time. Anabolicpathways, which remove intermediates of thecycle (e. g., gluconeogenesis) would quicklyuse up the small quantities present in themitochondria if metabolites did not reenterthe cycle at other sites to replace the com-pounds consumed. Processes that replenishthe cycle in this way are called anapleroticreactions.
The degradation of most amino acids isanaplerotic, because it produces either inter-mediates of the cycle or pyruvate (glucogenicamino acids; see p. 180). Gluconeogenesis is infact largely sustained by the degradation ofamino acids. A particularly important ana-plerotic step in animal metabolism leadsfrom pyruvate to oxaloacetic acid. This ATP-dependent reaction is catalyzed by pyruvate
carboxylase [1]. It allows pyruvate yieldingamino acids and lactate to be used for gluco-neogenesis.
By contrast, acetyl CoA does not have ana-plerotic effects in animal metabolism. Its car-bon skeleton is completely oxidized to CO2
and is therefore no longer available for bio-synthesis. Since fatty acid degradation onlysupplies acetyl CoA, animals are unable toconvert fatty acids into glucose. During peri-ods of hunger, it is therefore not the fat re-serves that are initially drawn on, but pro-teins. In contrast to fatty acids, the aminoacids released are able to maintain the bloodglucose level (see p. 308).
The tricarboxylic acid cycle not only takesup acetyl CoA from fatty acid degradation, butalso supplies the material for the biosynthesisof fatty acids and isoprenoids. Acetyl CoA,which is formed in the matrix space of mito-chondria by pyruvate dehydrogenase (seep. 134), is not capable of passing through theinner mitochondrial membrane. The acetylresidue is therefore condensed with oxalo-acetate by mitochondrial citrate synthase toform citrate. This then leaves the mitochon-dria by antiport with malate (right; seep. 212). In the cytoplasm, it is cleaved againby ATP-dependent citrate lyase [4] into acetyl-CoA and oxaloacetate. The oxaloacetateformed is reduced by a cytoplasmic malatedehydrogenase to malate [2], which then re-turns to the mitochondrion via the antiportalready mentioned. Alternatively, the malatecan be oxidized by “malic enzyme” [5], withdecarboxylation, to pyruvate. The NADPH+H+
formed in this process is also used for fattyacid biosynthesis.
Additional information
Using the so-called glyoxylic acid cycle, plantsand bacteria are able to convert acetyl-CoAinto succinate, which then enters the tricar-boxylic acid cycle. For these organisms, fatdegradation therefore functions as an ana-plerotic process. In plants, this pathway islocated in special organelles, the glyoxysomes.
138 Metabolism
All rights reserved. Usage subject to terms and conditions of license.Koolman, Color Atlas of Biochemistry, 2nd edition © 2005 Thieme

Pi
CO2
O2 2[H]2[H]
H2O
CO2
ADP ATP
CO2
AspPhe*Tyr
AspAsn
Ile*Val*Met*Trp*
HisProArgGlnGlu
1
2
3
4
5
3
AN
OH
OH
NADH+H
AP P PP
AP P +
2
A
S
4
5P
AN
P
AN
2
Pyruvate
ATP
1
2
ADP+PiATP
CoA
Carbo-hydrates
Oxalo-acetateMalate
Citrate
Fattyacids
Fat
Phe*, Tyr, Trp*
AcetylCoA
Ala, Ser, Thr*,Cys, Gly
Asp, Asn,Arg, Met*,Thr*, Ile*
Irreversible
Oxaloacetate
Pyruvate
Mitochondrialmatrix
Catabolic pathwayAnabolic pathwayAnaplerotic reaction
Ala, Leu*,Val*
Ubiquinol(QH2)
Carnitineshuttle
* Essential* amino acid
Fat
Malate
Pyruvate carboxylase6.4.1.1
Malate dehydrogenase1.1.1.37
PEP carboxykinase4.1.1.32
Citrate lyase 4.1.3.8
Malic enzyme 1.1.1.40
β-Oxidation
Oxidativephosphorylation
GTP
Cytoplasm
Irreversible
CO2
CO2
Malate
Fumarate
Succinate
SuccinylCoA 2-Oxo-
glutarate
Isocitrate
Citrate
Oxalo-acetate
Glu, Gln,Pro, Arg
Acyl-CoA
AcylCoA
AcetylCoA
Porphyrins
A. Tricarboxylic acid cycle: functions
PEP
GTPGlucose
139Energy Metabolism
All rights reserved. Usage subject to terms and conditions of license.Koolman, Color Atlas of Biochemistry, 2nd edition © 2005 Thieme

Respiratory chain
The respiratory chain is one of the pathwaysinvolved in oxidative phosphorylation (seep. 122). It catalyzes the steps by which elec-trons are transported from NADH+H+ or re-duced ubiquinone (QH2) to molecular oxygen.Due to the wide difference between the redoxpotentials of the donor (NADH+H+ or QH2)and the acceptor (O2), this reaction is stronglyexergonic (see p. 18). Most of the energy re-leased is used to establish a proton gradientacross the inner mitochondrial membrane(see p. 126), which is then ultimately used tosynthesize ATP with the help of ATP synthase.
A. Components of the respiratory chain
The electron transport chain consists of threeprotein complexes (complexes I, III, and IV),which are integrated into the inner mitochon-drial membrane, and two mobile carrier mol-ecules—ubiquinone (coenzyme Q) and cyto-chrome c. Succinate dehydrogenase, which ac-tually belongs to the tricarboxylic acid cycle,is also assigned to the respiratory chain ascomplex II. ATP synthase (see p. 142) is some-times referred to as complex V, although it isnot involved in electron transport. With theexception of complex I, detailed structural in-formation is now available for every complexof the respiratory chain.
All of the complexes in the respiratorychain are made up of numerous polypeptidesand contain a series of different proteinbound redox coenzymes (see pp. 104, 106).These include flavins (FMN or FAD in com-plexes I and II), iron–sulfur clusters (in I, II,and III), and heme groups (in II, III, and IV).Of the more than 80 polypeptides in the res-piratory chain, only 13 are coded by the mi-tochondrial genome (see p. 210). The remain-der are encoded by nuclear genes, and have tobe imported into the mitochondria afterbeing synthesized in the cytoplasm (seep. 228).
Electrons enter the respiratory chain in var-ious different ways. In the oxidation ofNADH+H+ by complex I, electrons pass viaFMN and Fe/S clusters to ubiquinone (Q). Elec-trons arising during the oxidation of succinate,acyl CoA, and other substrates are passed toubiquinone by succinate dehydrogenase orother mitochondrial dehydrogenases via en-
zyme-bound FADH2 and the electron-trans-porting flavoprotein (ETF; see p. 164). Ubiq-uinol passes electrons on to complex III, whichtransfers them via two b-type heme groups,one Fe/S cluster, and heme c1 to the smallheme protein cytochrome c. Cytochrome cthen transports the electrons to complexIV—cytochrome c oxidase. Cytochrome c oxi-dase contains redox-active components in theform of two copper centers (CuA and CuB) andhemes a and a3, through which the electronsfinally reach oxygen (see p. 132). As the resultof the two-electron reduction of O2, thestrongly basic O2– anion is produced (at leastformally), and this is converted into water bybinding of two protons. The electron transferis coupled to the formation of a proton gradi-ent by complexes I, III, and IV (see p. 126).
B. Organization
Proton transport via complexes I, III, and IVtakes place vectorially from the matrix intothe intermembrane space. When electronsare being transported through the respiratorychain, the H+ concentration in this space in-creases—i. e., the pH value there is reduced byabout one pH unit. For each H2O moleculeformed, around 10 H+ ions are pumped intothe intermembrane space. If the inner mem-brane is intact, then generally only ATP syn-thase (see p. 142) can allow protons to flowback into the matrix. This is the basis for thecoupling of electron transport to ATP synthe-sis, which is important for regulation pur-poses (see p. 144).
As mentioned, although complexes Ithrough V are all integrated into the innermembrane of the mitochondrion, they are notusually in contact with one another, since theelectrons are transferred by ubiquinone andcytochrome c. With its long apolar side chain,ubiquinone is freely mobile within the mem-brane. Cytochrome c is water-soluble and islocated on the outside of the inner membrane.
NADH oxidation via complex I takes placeon the inside of the membrane—i. e., in thematrix space, where the tricarboxylic acidcycle and β-oxidation (the most importantsources of NADH) are also located. O2 reduc-tion and ATP formation also take place in thematrix.
140 Metabolism
All rights reserved. Usage subject to terms and conditions of license.Koolman, Color Atlas of Biochemistry, 2nd edition © 2005 Thieme

I
III V
4 H
4 H
H2O
4 H
10 HATP
33
3
P PA A
P P P
P
2-4 H
1/2 O2O2
IV?
4 H 2 H
2 H
Q ∆p
N A N A
NADH+HNAD
2e
II
ETF
II
P PA A
P P PP
H
2 H
I
III
HS SH
-0.3
E OI
(V
+0.1
+0.3
+0.8
Q
H
H
IVCN
O2
1/2 O2
H2O
nH
V
nHCO
N A
Electron flow
Proton flow
Cytochrome CMr 12 kDa1 heme
Succinate
Fumarate
NADH
Innermitochon-drialmembrane
Matrixspace
Outermitochon-drialmembrane
Inter-membranespace
Tricarboxylicacid cycle
β-Oxidation
Cyto-chrome C
Pyruvate2-Oxoglutarate
3-Hydroxybutyrate3-Hydroxyacyl CoAMalateIsocitrate
Acyl CoAα-GlycerophosphateDihydroorotatCholin
Complex I
NADH dehydrogenase (ubiquinone)1.6.5.3
Mr 700 - 800 kDa, 25 - 30 subunits1 FMN, 2 Fe2S2, 4 - 5 Fe4S4
Complex II
Succinate dehydrogenase 1.3.5.1
Mr 125 kDa, 4 - 6 subunits1 FAD, 1 Fe2S2, 1 Fe4S4, 1Fe3S42 ubiquinone, 1 heme b
Complex III
Ubiquinol-cytochrome Creductase 1.10.2.2Mr ≈ 400 kDa, 11 subunits2 Fe2S2, 2 heme b, 1 heme c1
Complex V
Complex IV
Mr >400 kDa, >20 subunits
Cytochrome C oxidase 1.9.3.1
Mr ≈ 200 kDa, 8 - 13 subunits2 Cu, 1 Zn, 1 heme a, 1 heme a3
Liponamide-H2
A. Components of the respiratory chain
B. Organization
H -transporting ATP synthase3.6.1.34
141Energy Metabolism
All rights reserved. Usage subject to terms and conditions of license.Koolman, Color Atlas of Biochemistry, 2nd edition © 2005 Thieme

ATP synthesis
In the respiratory chain (see p. 140), electronsare transferred from NADH or ubiquinol (QH2)to O2. The energy obtained in this process isused to establish a proton gradient across theinner mitochondrial membrane. ATP synthe-sis is ultimately coupled to the return of pro-tons from the intermembrane space into thematrix.
A. Redox systems of the respiratory chain
The electrons provided by NADH do not reachoxygen directly, but instead are transferred toit in various steps. They pass through at least10 intermediate redox systems, most of whichare bound as prosthetic groups in complexesI, III, and IV. The large number of coenzymesinvolved in electron transport may initiallyappear surprising. However, as discussed onp. 18, in redox reactions, the change in freeenthalpy ∆G—i. e., the chemical work that isdone—depends only on the difference in re-dox potentials ∆E between the donor and theacceptor. Introducing additional redox sys-tems does not alter the reaction’s overall en-ergy yield. In the case of the respiratory chain,the difference between the normal potentialof the donor (NAD+/NADH+H+, E0 = –0.32 V)and that of the acceptor (O2/H2O, E0 =+0.82 V) corresponds to an energy difference∆G0 of more than 200 kJ mol–1. This largeamount is divided into smaller, moremanageable “packages,” the size of which isdetermined by the difference in redox poten-tials between the respective intermediates. Itis assumed that this division is responsible forthe astonishingly high energy yield (about60%) achieved by the respiratory chain.
The illustration shows the important redoxsystems involved in mitochondrial electrontransport and their approximate redox poten-tials. These potentials determine the path fol-lowed by the electrons, as the members of aredox series have to be arranged in order ofincreasing redox potential if transport is tooccur spontaneously (see p. 32).
In complex 1, the electrons are passed fromNADH+H+ first to FMN (see p. 104) and thenon to several iron–sulfur (Fe/S) clusters. Theseredox systems are only stable in the interiorof proteins. Depending on the type, Fe/S clus-ters may contain two to six iron ions, which
form complexes with inorganic sulfide andthe SH groups of cysteine residues (seep. 286). Ubiquinone (coenzyme Q; seep. 104) is a mobile carrier that takes up elec-trons from complexes I and II and from re-duced ETF and passes them on to complex III.Heme groups are also involved in electrontransport in a variety of ways. Type b hemescorrespond to that found in hemoglobin (seep. 280). Heme c in cytochrome c is covalentlybound to the protein, while the tetrapyrrolering of heme a is isoprenylated and carries aformyl group. In complex IV, a copper ion (CuB)and heme a3 react directly with oxygen.
B. ATP synthase
The ATP synthase (EC 3.6.1.34, complex V) thattransports H+ is a complex molecular ma-chine. The enzyme consists of two parts—aproton channel (Fo, for “oligomycin-sensitive”)that is integrated into the membrane; and acatalytic unit (F1) that protrudes into the ma-trix. The Fo part consists of 12 membrane-spanning c-peptides and one a-subunit. The“head” of the F1 part is composed of three αand three β subunits, between which thereare three active centers. The “stem” betweenFo and F1 consists of one γ and one ε subunit.Two more polypeptides, b and δ, form a kindof “stator,” fixing the α and β subunits relativeto the Fo part.
The catalytic cycle can be divided intothree phases, through each of which the threeactive sites pass in sequence. First, ADP and Pi
are bound (1), then the anhydride bond forms(2), and finally the product is released (3).Each time protons pass through the Fo chan-nel protein into the matrix, all three activesites change from their current state to thenext. It has been shown that the energy forproton transport is initially converted into arotation of the γ subunit, which in turn cycli-cally alters the conformation of the α and βsubunits, which are stationary relative to theFo part, and thereby drives ATP synthesis.
142 Metabolism
All rights reserved. Usage subject to terms and conditions of license.Koolman, Color Atlas of Biochemistry, 2nd edition © 2005 Thieme

APP P
AP P P
AP P P
AP P P
AP P P
AP P P
AP P P
AP P P
AP P P
AP P P
1
2
3
APP P
H2O
H2O
H2O
H2O
H2O
H2O
H2O
2+3+
2+3+
2+
3+2+3+
N A
N A
OH
OHCu2
Cu
Cu2
Cu
O2
F F
∆G'(kJ · mol–1)
E'(V)
–0.4
–0.2
0
+0.2
+0.4
+0.6
+0.8
0
–220O
IV
III
I
NAD
NADH+H
2+3+
F1
ε
α β
βα
ε
F0
β α
γ
H
H
a
b2
δ
∆G = –n · F · ∆E
O
O
A. Redox systems of the respiratory chain
B. ATP synthase
Binding of ADP and Pi
Formation of ATP
Release of ATP
1. Structure and location 2. Catalytic cycle
Inside:matrix
Outside:Inter-membranespace
Hinside
Houtside
Houtside
Houtside
Heme a3
Heme c1
Cyto-chrome C Heme a
Fe/S center
Fe/S centers
FMN/FMNH2
CoQ(ubi-quinone)
Hemes b
143Energy Metabolism
All rights reserved. Usage subject to terms and conditions of license.Koolman, Color Atlas of Biochemistry, 2nd edition © 2005 Thieme

Regulation
The amount of nutrient degradation and ATPsynthesis have to be continually adjusted tothe body’s changing energy requirements.The need to coordinate the production andconsumption of ATP is already evident fromthe fact that the total amounts of coenzymesin the organism are low. The human bodyforms about 65 kg ATP per day, but only con-tains 3–4 g of adenine nucleotides (AMP, ADP,and ATP). Each ADP molecule therefore has tobe phosphorylated to ATP and dephosphory-lated again many thousand times a day.
A. Respiratory control
The simple regulatory mechanism which en-sures that ATP synthesis is “automatically”coordinated with ATP consumption is knownas respiratory control. It is based on the factthat the different parts of the oxidative phos-phorylation process are coupled via sharedcoenzymes and other factors (left).
If a cell is not using any ATP, hardly any ADPwill be available in the mitochondria. WithoutADP, ATP synthase (3) is unable to break downthe proton gradient across the inner mito-chondrial membrane. This in turn inhibitselectron transport in the respiratory chain(2), which means that NADH+H+ can no lon-ger be reoxidized to NAD+. Finally, the result-ing high NADH/NAD+ ratio inhibits the tricar-boxylic acid cycle (C), and thus slows downthe degradation of the substrate SH2 (1). Con-versely, high rates of ATP utilization stimulatenutrient degradation and the respiratorychain via the same mechanism.
If the formation of a proton gradient isprevented (right), substrate oxidation (1)and electron transport (2) proceed muchmore rapidly. However, instead of ATP, onlyheat is produced.
B. Uncouplers
Substances that functionally separate oxida-tion and phosphorylation from one anotherare referred to as uncouplers. They breakdown the proton gradient by allowing H+
ions to pass from the intermembrane spaceback into the mitochondrial matrix withoutthe involvement of ATP synthase. Uncouplingeffects are produced by mechanical damage
to the inner membrane (1) or by lipid-solublesubstances that can transport protonsthrough the membrane, such as 2,4-dinitrophenol (DNP, 2). Thermogenin (uncou-pling protein-1, UCP-1, 3)—an ion channel(see p. 222) in mitochondria of brown fat tis-sue—is a naturally occurring uncoupler.Brown fat is found, for example, in newbornsand in hibernating animals, and serves exclu-sively to generate heat. In cold periods, nor-epinephrine activates the hormone-sensitivelipase (see p. 162). Increased lipolysis leadsto the production of large quantities of freefatty acids. Like DNP, these bind H+ ions in theintermembrane space, pass the UCP in thisform, and then release the protons in thematrix again. This makes fatty acid degrada-tion independent of ADP availability—i. e., ittakes place at maximum velocity and onlyproduces heat (A). It is becoming increasinglyclear that there are also UCPs in other cells,which are controlled by hormones such asthyroxine (see p. 374). This regulates theATP yield and what is known as the basalmetabolic rate.
C. Regulation of the tricarboxylic acid cycle
The most important factor in the regulation ofthe cycle is the NADH/NAD+ ratio. In additionto pyruvate dehydrogenase (PDH) and oxoglu-tarate dehydrogenase (ODH; see p. 134), cit-rate synthase and isocitrate dehydrogenase arealso inhibited by NAD+ deficiency or an excessof NADH+H+. With the exception of isocitratedehydrogenase, these enzymes are also sub-ject to product inhibition by acetyl-CoA, suc-cinyl-CoA, or citrate.
Interconversion processes (see p. 120) alsoplay an important role. They are shown herein detail using the example of the PDH com-plex (see p. 134). The inactivating proteinkinase [1a] is inhibited by the substrate pyru-vate and is activated by the products acetyl-CoA and NADH+H+. The protein phosphatase[1b]—like isocitrate dehydrogenase [3] and theODH complex [4]—is activated by Ca2+. This isparticularly important during muscle con-traction, when large amounts of ATP areneeded. Insulin also activates the PDH com-plex (through inhibition of phosphorylation)and thereby promotes the breakdown of glu-cose and its conversion into fatty acids.
144 Metabolism
All rights reserved. Usage subject to terms and conditions of license.Koolman, Color Atlas of Biochemistry, 2nd edition © 2005 Thieme

AN
AH2 A
AP P P
1
2
3
AN
PAP P
AN
AH2 A
AP P P
1
2
3
AN
PAP P
1 3
1b
2
31a
4
NADH
1b Ca2
2
Ca2
N A
3
1a
4
H
H
H
H
NO2
NO2
NO2
O2N
H
H
O
OH
2,4-Dinitrophenol
Norepinephrine
Fattyacids
Dehydro-genases
Respira-tory chain
ATPsynthase
Heat
1. Coupled 2. Uncoupled
Hinside
Houtside ATP syn-
thesisuncoupledfrom protontransport
Couplingpoints
Dehydro-genases
Endergonicprocesses Endergonic
processes
Hinside
Houtside
A. Respiratory control
C. Regulation of thetricarboxylic acid cycle
B. Uncouplers
PDH kinase2.7.1.99
Citrate synthase 4.1.3.7
Isocitrate dehydro-genase 1.1.1.42
PDH phosphatase3.1.3.43
2-Oxoglutaratedehydrogenase 1.2.4.2,1.8.1.4,2.3.1.61
2-Oxo-glutarate
Citrate
Isocitrate
Acetyl CoA
Oxalo-acetate
Pyruvate
SuccinylCoA
Most importantfactor: con-centration ratio[NADH] / [NAD ]
1. Membrane1. damage
2. Mobile2. carriers
3. Gated proton3. channels
Innermitochochondrialmembrane
Thermo-genin(UCP1)
Fat
Insulin
NADH
145Energy Metabolism
All rights reserved. Usage subject to terms and conditions of license.Koolman, Color Atlas of Biochemistry, 2nd edition © 2005 Thieme

Respiration and fermentation
A. Aerobic and anaerobic oxidation ofglucose
In the presence of oxygen (i. e., in aerobicconditions), most animal cells are capable of“respiring” various types of nutrient (lipids,amino acids, and carbohydrates)—i. e., usingoxidative processes to break them down com-pletely. If oxygen is lacking (i. e., in anaerobicconditions), only glucose can be used for ATPsynthesis. Although in these conditions glu-cose breakdown in animals already ends inlactate and only produces small quantities ofATP, it is decisively important for the survivalof cells at times of oxygen deficiency.
In aerobic conditions (left), ATP is derivedalmost exclusively from oxidative phosphor-ylation (see p. 140). Fatty acids enter the mi-tochondria with the help of carnitine (seep. 164), and are broken down there into CoA-bound acetyl residues. Glucose is convertedinto pyruvate by glycolysis (see p. 150) in thecytoplasm. Pyruvate is then also transportedinto the mitochondrial matrix, where it isoxidatively decarboxylated by the pyruvatedehydrogenase complex (see p. 134) to yieldacetyl-CoA. The reducing equivalents (2NADH+H+ per glucose) that arise in glycolysisenter the mitochondrial matrix via the malateshuttle (see p. 212). The acetyl residues thatare formed are oxidized to CO2 in the tricar-boxylic acid cycle (see p. 136). Breakdown ofamino acids also produces acetyl residues orproducts that can directly enter the tricarbox-ylic acid cycle (see p. 180). The reducingequivalents that are obtained are transferredto oxygen via the respiratory chain as re-quired. In the process, chemical energy is re-leased, which is used (via a proton gradient)to synthesize ATP (see p. 140).
In the absence of oxygen—i. e., in anaerobicconditions—the picture changes completely.Since O2 is missing as the electron acceptorfor the respiratory chain, NADH+H+ and QH2
can no longer be reoxidized. Consequently,not only is mitochondrial ATP synthesishalted, but also almost the whole metabolismin the mitochondrial matrix. The main reasonfor this is the high NADH+H+ concentrationand lack of NAD+, which inhibit the tricarbox-
ylic acid cycle and the pyruvate dehydro-genase reaction (see p. 144). β-Oxidationand the malate shuttle, which are dependenton free NAD+, also come to a standstill. Sinceamino acid degradation is also no longer ableto contribute to energy production, the cellbecomes totally dependent on ATP synthe-sized via the degradation of glucose byglycolysis. For this process to proceed contin-uously, the NADH+H+ formed in the cyto-plasm has to be constantly reoxidized. Sincethis can no longer occur in the mitochondria,in anaerobic conditions animal cells reducepyruvate to lactate and pass it into the blood.This type of process is called fermentation(see p. 148). The ATP yield is low, with onlytwo ATPs per glucose arising during lactatesynthesis.
To estimate the number of ATP moleculesformed in an aerobic state, it is necessary toknow the P/O quotient—i. e., the molar ratiobetween synthesized ATP (“P”) and the waterformed (“O”). During transport of two elec-trons from NADH+H+ to oxygen, about 10 pro-tons are transported into the intermembranespace, while from ubiquinol (QH2), the num-ber is only six. ATP synthase (see p. 142) prob-ably requires three H+ to synthesize one ATP,so that maximum P/O quotients of around 3or 2 are possible. This implies a yield of up to38 ATP per mol of glucose. However, the ac-tual value is much lower. It needs to be takeninto account that the transport of specific me-tabolites into the mitochondrial matrix andthe exchange of ATP4– for ADP3– are alsodriven by the proton gradient (see p. 212).The P/O quotients for the oxidation ofNADH+H+ and QH2 are therefore more in therange of 2.5 and 1.5. If the energy balance ofaerobic glycolysis is calculated on this basis,the result is a yield of around 32 ATP perglucose. However, this value is also not con-stant, and can be adjusted as required by thecell’s own uncouplers (UCPs; see p. 144) andother mechanisms.
146 Metabolism
All rights reserved. Usage subject to terms and conditions of license.Koolman, Color Atlas of Biochemistry, 2nd edition © 2005 Thieme

7
9
+2
0
–2
–2
–1
AP P P
2 GTP
AN
AP P P
AP P P
H
H2O
H
H
AP P P
2
2
2
PAP P
2
1 2
4
AN2 25
O2
PAP P
AN
AP
AN
AP P P
AP P P
H
H
H
AP P P
2
2
2
PAP P
2
1 2
4
AN AN2 25
O2
AP
2
8
9
10
11
12
AN
+2 ATP
+3 ATP
+5 ATP
+5 ATP
+5 ATP
+5 ATP
+5 ATP
1
2
3
4
5
6
8
10
11
12+2 GTP
+2 QH2
+2 NADH
+2 NADH
+2 NADH
+2 NADH
+2 ATP
+2 ATP
+2 NADH
–1 ATP
–1 ATP
+32
+30
+27
+22
+17
+12
+7
+5
+3
–2
–1
–2 NADH
+2 ATP
+2 ATP
+2 NADH
–1 ATP
–1 ATP
8
10
12
11
3
6
3
P P P
P
AN
7
9
7
Pyruvate
AcetylCoA
ATP Coenzymes
Glucose
1. Aerobic
Glyco-lysis
Pyruvate
AcetylCoA
Glucose
2. Anaerobic
Lactate
Pyruvate
Hexokinase
6-Phosphofructokinase
Glyceraldehyde-3 DH
Phosphoglycerate kinase
Pyruvate kinase
Lactate dehydrogenase
Pyruvate dehydrogenase
Isocitrate dehydrogenase
Oxoglutarate dehydrogenase
Malate dehydrogenase
Succinate dehydrogenase
Succinate-CoA ligase
Sum: 32 ATP/glucose
ATPCoenzymes
Pyruvate
Malate shuttle
Sum: 2 ATP/glucose
Enzymes
P
PEP PEP
A. Aerobic and anaerobic oxidation of glucose
DH = dehydrogenase
NADrecycled
Tricarboxylicacid cycleinhibited dueto high ratio ofNADH/NAD
147Energy Metabolism
All rights reserved. Usage subject to terms and conditions of license.Koolman, Color Atlas of Biochemistry, 2nd edition © 2005 Thieme

Fermentations
As discussed on p. 146, degradation of glucoseto pyruvate is the only way for most organ-isms to synthesize ATP in the absence of oxy-gen. The NADH+H+ that is also formed in thisprocess has to be constantly reoxidized toNAD+ in order to maintain glycolysis andthus ATP synthesis. In the animal organism,this is achieved by the reduction of pyruvateto lactate. In microorganisms, there are manyother forms of NAD+ regeneration. Processesof this type are referred to as fermentations.Microbial fermentation processes are oftenused to produce foodstuffs and alcoholic bev-erages, or to preserve food. Features commonto all fermentation processes are that theystart with pyruvate and only occur underanaerobic conditions.
A. Lactic acid and propionic acidfermentation
Many milk products, such as sour milk, yo-gurt, and cheese are made by bacterial lacticacid fermentation (1). The reaction is the sameas in animals. Pyruvate, which is mainly de-rived from degradation of the disaccharidelactose (see p. 38), is reduced to lactate bylactate dehydrogenase [1]. Lactic acid fermen-tation also plays an important role in theproduction of sauerkraut and silage. Theseproducts usually keep for a long time, becausethe pH reduction that occurs during fermen-tation inhibits the growth of putrefying bac-teria.
Bacteria from the genera Lactobacillus andStreptococcus are involved in the first steps ofdairy production (3). The raw materials pro-duced by their effects usually only acquiretheir final properties after additional fermen-tation processes. For example, the character-istic taste of Swiss cheese develops during asubsequent propionic acid fermentation. Inthis process, bacteria from the genusPropionibacterium convert pyruvate to propi-onate in a complex series of reactions (2).
B. Alcoholic fermentation
Alcoholic beverages are produced by the fer-mentation of plant products that have a highcarbohydrate content. Pyruvate, which isformed from glucose, is initially decarboxy-
lated by pyruvate decarboxylase [2], whichdoes not occur in animal metabolism, to pro-duce acetaldehyde (ethanal). When this is re-duced by alcohol dehydrogenase [3], withNADH being consumed, ethanol [3] is formed.
Yeasts, unicellular fungi that belong to theeukaryotes (3), rather than bacteria, are re-sponsible for this type of fermentation. Yeastsare also often used in baking. They produceCO2 and ethanol, which raise the dough.Brewers’ and bakers’ yeasts (Saccharomycescerevisiae) are usually haploid and reproduceasexually by budding (3). They can live bothaerobically and anaerobically. Wine is pro-duced by other types of yeast, some of whichalready live on the grapes. To promote theformation of ethanol, efforts are made to gen-erally exclude oxygen during alcoholic fer-mentation—for example, by covering doughwith a cloth when it is rising and by ferment-ing liquids in barrels that exclude air.
C. Beer brewing
Barley is the traditional starting material forthe brewing of beer. Although cereal grainscontain starch, they hardly have any free sug-ars. The barley grains are therefore first al-lowed to germinate so that starch-cleavingamylases are formed. Careful warming of thesprouting grain produces malt. This is thenground, soaked in water, and kept warm fora certain time. In the process, a substantialproportion of the starch is broken down intothe disaccharide maltose (see p. 38). Theproduct (the wort) is then boiled, yeast andhops are added, and the mixture is allowed toferment for several days. The addition of hopsmakes the beer less perishable and gives it itsslightly bitter taste. Other substances con-tained in hops act as sedatives and diuretics.
148 Metabolism
All rights reserved. Usage subject to terms and conditions of license.Koolman, Color Atlas of Biochemistry, 2nd edition © 2005 Thieme

Champag
ne
CO2
+ CO21. 3.2.
O2
1 1.
2
3
3.2.
2
N A
N A
3
N A
1.
10 µm
3.2.
N A 2[H]1
2[H]
H
CH
H
C C
OH
H O
O
H
CH
H
C C
O
O
O
O
C
O
H C C
H
H H
OH
H
H C C
H
H H
O
O
H
CH
H
C C
H
H
O
A. Lactic acid and propionic acid fermentation
Barley
Malt Hops
Yeast
Germinate,dry
Grind,incubatein water
Wort
Maltose
Glucose
Ethanol
Starch
Amylases
Maltose
CO2
Lactate dehydrogenase1.1.1.27
Yeast(Saccharomycescerevisiae)
Daughter cellSeptum
ER
Cell wall
Nucleus
MitochondriumTonoplast
Vacuole
Pyruvate decarboxylase[TPP] 4.1.1.1Alcohol dehydrogenase[Zn2 ] 1.1.1.1
Ethanol
Ethanal
(Acet-aldehyde)
Lactobacillus
Propioni-bacterium
Streptococcus
Cell wallDNA
Propionate
Lactate
Yogurt
Pyruvate
Amylasesformed inseedling
B. Alcoholic fermentation
C. Beer brewing
Fermentation
10 µm
milkSour
Sauerkraut
149Energy Metabolism
All rights reserved. Usage subject to terms and conditions of license.Koolman, Color Atlas of Biochemistry, 2nd edition © 2005 Thieme

Glycolysis
A. Balance
Glycolysis is a catabolic pathway in the cyto-plasm that is found in almost all organisms—irrespective of whether they live aerobicallyor anaerobically. The balance of glycolysis issimple: glucose is broken down into two mol-ecules of pyruvate, and in addition two mol-ecules of ATP and two of NADH+H+ areformed.
In the presence of oxygen, pyruvate andNADH+H+ reach the mitochondria, wherethey undergo further transformation (aerobicglycolysis; see p. 146). In anaerobic condi-tions, fermentation products such as lactateor ethanol have to be formed in the cytoplasmfrom pyruvate and NADH+H+, in order to re-generate NAD+ so that glycolysis can continue(anaerobic glycolysis; see p. 146). In the anae-robic state, glycolysis is the only means ofobtaining ATP that animal cells have.
B. Reactions
Glycolysis involves ten individual steps, in-cluding three isomerizations and four phos-phate transfers. The only redox reaction takesplace in step [6].
[1] Glucose, which is taken up by animalcells from the blood and other sources, is firstphosphorylated to glucose 6-phosphate, withATP being consumed. The glucose 6-phos-phate is not capable of leaving the cell.
[2] In the next step, glucose 6-phosphate isisomerized into fructose 6-phosphate.
[3] Using ATP again, another phosphoryla-tion takes place, giving rise to fructose 1,6-bisphosphate. Phosphofructokinase is themost important key enzyme in glycolysis(see p. 144).
[4] Fructose 1,6-bisphosphate is brokendown by aldolase into the C3 compounds glyc-eraldehyde 3-phosphate (also known as glyc-eral 3-phosphate) and glycerone 3-phosphate(dihydroxyacetone 3-phosphate).
[5] The latter two products are placed infast equilibrium by triosephosphate isomerase.
[6] Glyceraldehyde 3-phosphate is nowoxidized by glyceraldehyde-3-phosphate de-hydrogenase, with NADH+H+ being formed.In this reaction, inorganic phosphate is takenup into the molecule (substrate-level phos-
phorylation; see p. 124), and 1,3-bisphos-phoglycerate is produced. This intermediatecontains a mixed acid–anhydride bond, thephosphate part of which is at a high chemicalpotential.
[7] Catalyzed by phosphoglycerate kinase,this phosphate residue is transferred to ADP,producing 3-phosphoglycerate and ATP. TheATP balance is thus once again in equilibrium.
[8] As a result of shifting of the remainingphosphate residue within the molecule, theisomer 2-phosphoglycerate is formed.
[9] Elimination of water from 2-phospho-glycerate produces the phosphate ester of theenol form of pyruvate—phosphoenolpyruvate(PEP). This reaction also raises the secondphosphate residue to a high potential.
[10] In the last step, pyruvate kinase trans-fers this residue to ADP. The remaining enolpyruvate is immediately rearranged intopyruvate, which is much more stable. Alongwith step [7] and the thiokinase reaction inthe tricarboxylic acid cycle (see p. 136), thepyruvate kinase reaction is one of the threereactions in animal metabolism that are ableto produce ATP independently of the respira-tory chain.
In glycolysis, two molecules of ATP are ini-tially used for activation ([1], [3]). Later, twoATPs are formed per C3 fragment. Overall,therefore, there is a small net gain of 2 molATP per mol of glucose.
C. Energy profile
The energy balance of metabolic pathways de-pends not only on the standard changes inenthalpy ∆G0, but also on the concentrationsof the metabolites (see p. 18). Fig. C shows theactual enthalpy changes ∆G for the individualsteps of glycolysis in erythrocytes.
As can be seen, only three reactions ([1],[3], and [10]), are associated with largechanges in free enthalpy. In these cases, theequilibrium lies well on the side of the prod-ucts (see p. 18). All of the other steps arefreely reversible. The same steps are also fol-lowed—in the reverse direction—in gluconeo-genesis (see p. 154), with the same enzymesbeing activated as in glucose degradation. Thenon-reversible steps [1], [3], and [10] are by-passed in glucose biosynthesis (see p. 154).
150 Metabolism
All rights reserved. Usage subject to terms and conditions of license.Koolman, Color Atlas of Biochemistry, 2nd edition © 2005 Thieme

0
-20
-40
-60
-80
P PA
AP P P
∆G' (kJ · mol-1)
P PA
AP P P
P PA
AP P P
P PA A
P P P
8
76
5
4
9
1
10
3
2
P PAA
P P P P PAA
P P P
P PAA
P P P
P PA A
P P P
1 32
8 7
4
5
22
22
N AN A
6
1
2
3
4
510
9
7
9
P
P
P
P
P
P
10
P P
6
8
2 H2O
P PA A
P P P
N A N A
P
2
2
2
2
2
∆GOI = –35 kJ · mol–1
2 2
P
PP P
O
HO
OH
OH
OH
HH
HH
CH2
H
HO
O
HO
OH
OH
OH
HH
HH
CH2
H
HO
O
HO
OH
OH
OH
HH
HH
CH2
H
OO
CH2O
OH H
CH2OH
OH
HH HO
OCH2O
OH H
CH2
OH
HH HO
O
HC OH
H2C
C
O
O O
HC OH
H2C
CO O
O
HC O
H2C
CO O
OH
HC OH
H2C
C
O
O H
C O
CH2
H2C
O
OH
C O
CH2
CO O
C O
CH3
CO O
C O
CH3
COO
C O
CH3
COO
P
Pyruvate
Steps 1, 3 and 10are bypassed ingluconeogenesis
Glyceraldehyde3-phosphate
1,3-Bisphospho-glycerate
3-Phospho-glycerate
Phospho-enolpyruvate
2-Phospho-glycerate
Glycerone3-phosphate
Fructose6-phosphate
Glucose6-phosphate
Fructose1,6-bisphosphate
2 2 2
2
Hexokinase 2.7.1.1
Glucose 6-phosphateIsomerase 5.3.1.9
6-Phosphofructo-kinase 2.7.1.11
Fructose bisphosphatealdolase 4.1.2.13
Triose-phosphateisomerase 5.3.1.1 Pyruvate kinase
2.7.1.40
Phosphopyruvatehydratase 4.2.1.11
Phosphoglyceratekinase 2.7.2.3
Glucose
Pyruvate2
Glyceraldehyde-3- dehydro-genase 1.2.1.12
Phosphoglyceratemutase 5.4.2.1
Glucose Pyruvate Pyruvate
Glycolysis
A. Glycolysis: balance
C. Energy profile
B. Reactions
2
151Carbohydrate Metabolism
All rights reserved. Usage subject to terms and conditions of license.Koolman, Color Atlas of Biochemistry, 2nd edition © 2005 Thieme

Pentose phosphate pathway
The pentose phosphate pathway (PPP, alsoknown as the hexose monophosphatepathway) is an oxidative metabolic pathwaylocated in the cytoplasm, which, like glycoly-sis, starts from glucose 6-phosphate. It sup-plies two important precursors for anabolicpathways: NADPH+H+, which is required forthe biosynthesis of fatty acids and isopren-oids, for example (see p. 168), and ribose 5-phosphate, a precursor in nucleotide biosyn-thesis (see p. 188).
A. Pentose phosphate pathway:oxidative part
The oxidative segment of the PPP convertsglucose 6-phosphate to ribulose 5-phosphate.One CO2 and two NADPH+H+ are formed inthe process. Depending on the metabolicstate, the much more complex regenerativepart of the pathway (see B) can convert someof the pentose phosphates back to hexosephosphates, or it can pass them on to glycol-ysis for breakdown. In most cells, less than10% of glucose 6-phosphate is degraded viathe pentose phosphate pathway.
B. Reactions
[1] The oxidative part starts with the oxida-tion of glucose 6-phosphate by glucose-6-phosphate dehydrogenase. This formsNADPH+H+ for the first time. The secondproduct, 6-phosphogluconolactone, is an in-tramolecular ester (lactone) of 6-phospho-gluconate.
[2] A specific hydrolase then cleaves thelactone, exposing the carboxyl group of6-phosphogluconate.
[3] The last enzyme in the oxidative part isphosphogluconate dehydrogenase [3], whichreleases the carboxylate group of 6-phospho-gluconate as CO2 and at the same time oxi-dizes the hydroxyl group at C3 to an oxogroup. In addition to a second NADPH+H+,this also produces the ketopentose ribulose5-phosphate. This is converted by an isomer-ase to ribose 5-phosphate, the initial com-pound for nucleotide synthesis (top).
The regenerative part of the PPP is onlyshown here schematically. A complete reac-tion scheme is given on p. 408. The function
of the regenerative branch is to adjust the netproduction of NADPH+H+ and pentose phos-phates to the cell’s current requirements. Nor-mally, the demand for NADPH+H+ is muchhigher than that for pentose phosphates. Inthese conditions, the reaction steps shownfirst convert six ribulose 5-phosphates tofive molecules of fructose 6-phosphate andthen, by isomerization, regenerate five glu-cose 6-phosphates. These can once again sup-ply NADPH+H+ to the oxidative part of thePPP. Repeating these reactions finally resultsin the oxidation of one glucose 6-phosphateinto six CO2. Twelve NADPH+H+ arise in thesame process. In sum, no pentose phosphatesare produced via this pathway.
In the recombination of sugar phosphatesin the regenerative part of the PPP, there aretwo enzymes that are particularly important:
[5] Transaldolase transfers C3 units fromsedoheptulose 7-phosphate, a ketose withseven C atoms, to the aldehyde group of glyc-eraldehyde 3-phosphate.
[4] Transketolase, which contains thiaminediphosphate, transfers C2 fragments from onesugar phosphate to another.
The reactions in the regenerative segmentof the PPP are freely reversible. It is thereforeeasily possible to use the regenerative part ofthe pathway to convert hexose phosphatesinto pentose phosphates. This can occurwhen there is a high demand for pentosephosphates—e. g., during DNA replication inthe S phase of the cell cycle (see p. 394).
Additional information
When energy in the form of ATP is required inaddition to NADPH+H+, the cell is able tochannel the products of the regenerativepart of the PPP (fructose 6-phosphate andglyceraldehyde 3-phosphate) into glycolysis.Further degradation is carried out via the tri-carboxylic acid cycle and the respiratory chainto CO2 and water. Overall, the cell in this wayobtains 12 mol NADPH+H+ and around150 mol ATP from 6 mol glucose 6-phos-phate. PPP activity is stimulated by insulin(see p. 388). This not only increases the rateof glucose degradation, but also produces ad-ditional NADPH+H+ for fatty acid synthesis(see p. 168).
152 Metabolism
All rights reserved. Usage subject to terms and conditions of license.Koolman, Color Atlas of Biochemistry, 2nd edition © 2005 Thieme

CO2
2N A
P
NADP NADPH + H
PPP –oxidativepart
2N A
P
PP
b
6
6
a b b
a
b
a
b
a
6 CO2
N A
P
N A
P
a b
a b
a a b
6
6
N A
P
N A
P
P P P P P P
P P P P P P
P P
PP
P P
PP P
P P
a
b
1
1
PP
4
5
4
P
P
P
P
P
P
P
P
5
3
4
3
2
H2O2
P
6
6
6
6
P
P
P
O
HO
OH
OH
OH
HH
HH
CH2
H
OO
C
H
CH C
H
OH
C
H
OH
C
O
H
H
OH
O
C
H
CH C
H
OH
C
H
OH
C
O
H
H
OH
O
C
H
CH C
H
OH
C
H
OH
C
OH
C
H
OHH O
O
O
C
HO
OH
OH
HH
H
CH2
H
O
O
O
HO
OH
OH
OH
HH
HH
CH2
H
O
P
A. Pentose phosphate pathway: oxidative part
B. Reactions
Glucose 6-phosphate Ribulose 5-phosphate
Fructose6-
Ribulose5-
Ribose5-
Xylulose5-
Sedo-heptulose7-
Erythrose4-
Glucose 6-phosphate dehydrogenase 1.1.1.49
Anabolicpathways
Glyceral3-
Transaldolase 2.2.1.2
Transketolase 2.2.1.1
Phosphogluconate dehydrogenase (decarboxylating) 1.1.1.44
Gluconolactonase 3.1.1.17
Glucose6-phosphate
6-Phospho-glucono-lactone
6-Phospho-gluconate
Ribulose5-phosphate
Glycer-aldehyde3-
Fructose6-
153Carbohydrate Metabolism
All rights reserved. Usage subject to terms and conditions of license.Koolman, Color Atlas of Biochemistry, 2nd edition © 2005 Thieme

Gluconeogenesis
Some tissues, such as brain and erythrocytes,depend on a constant supply of glucose. If theamount of carbohydrate taken up in food isnot suf cient, the blood sugar level can bemaintained for a limited time by degradationof hepatic glycogen (see p. 156). If these re-serves are also exhausted, de-novo synthesisof glucose (gluconeogenesis) begins. The liveris also mainly responsible for this (see p. 310),but the tubular cells of the kidney also show ahigh level of gluconeogenetic activity (seep. 328). The main precursors for gluconeo-genesis are amino acids derived from muscleproteins. Another important precursor islactate, which is formed in erythrocytes andmuscle proteins when there is oxygen de-ficiency. Glycerol produced from the degrada-tion of fats can also be used for gluconeogen-esis. However, the conversion of fatty acidsinto glucose is not possible in animal metab-olism (see p. 138). The human organism cansynthesize several hundred grams of glucoseper day by gluconeogenesis.
A. Gluconeogenesis
Many of the reaction steps involved in gluco-neogenesis are catalyzed by the same en-zymes that are used in glycolysis (seep. 150). Other enzymes are specific to gluco-neogenesis and are only synthesized, underthe influence of cortisol and glucagon whenneeded (see p. 158). Glycolysis takes placeexclusively when needed in the cytoplasm,but gluconeogenesis also involves the mito-chondria and the endoplasmic reticulum (ER).Gluconeogenesis consumes 4 ATP (3 ATP + 1GTP) per glucose—i. e., twice as many as gly-colysis produces.
[1] Lactate as a precursor for gluconeogen-esis is mainly derived from muscle (see Coricycle, p. 338) and erythrocytes. LDH (seep. 98) oxidizes lactate to pyruvate, withNADH+H+ formation.
[2] The first steps of actual gluconeogenesistake place in the mitochondria. The reason forthis “detour” is the equilibrium state of thepyruvate kinase reaction (see p. 150). Evencoupling to ATP hydrolysis would not be suf-ficient to convert pyruvate directly into phos-phoenol pyruvate (PEP). Pyruvate derived
from lactate or amino acids is therefore ini-tially transported into the mitochondrial ma-trix, and—in a biotin-dependent reaction cat-alyzed by pyruvate carboxylase—is carboxy-lated there to oxaloacetate. Oxaloacetate isalso an intermediate in the tricarboxylic acidcycle. Amino acids with breakdown productsthat enter the cycle or supply pyruvate cantherefore be converted into glucose (seep. 180).
[3] The oxaloacetate formed in the mito-chondrial matrix is initially reduced to ma-late, which can leave the mitochondria viainner membrane transport systems (seep. 212).
[4] In the cytoplasm, oxaloacetate is re-formed and then converted into phospho-enol pyruvate by a GTP-dependent PEP car-boxykinase. The subsequent steps up to fruc-tose 1,6-bisphosphate represent the reverseof the corresponding reactions involved inglycolysis. One additional ATP per C3 frag-ment is used for the synthesis of 1,3-bisphos-phoglycerate.
Two gluconeogenesis-specific phosphat-ases then successively cleave off the phos-phate residues from fructose 1,6-bisphos-phate. In between these reactions lies theisomerization of fructose 6-phosphate to glu-cose 6-phosphate—another glycolytic reac-tion.
[5] The reaction catalyzed by fructose1,6-bisphosphatase is an important regulationpoint in gluconeogenesis (see p. 158).
[6] The last enzyme in the pathway, glucose6-phosphatase, occurs in the liver, but not inmuscle. It is located in the interior of thesmooth endoplasmic reticulum. Specifictransporters allow glucose 6-phosphate toenter the ER and allow the glucose formedthere to return to the cytoplasm. From there,it is ultimately released into the blood.
Glycerol initially undergoes phosphoryla-tion at C-3 [7]. The glycerol 3-phosphateformed is then oxidized by an NAD+-depen-dent dehydrogenase to form glycerone 3-phosphate [8] and thereby channeled intogluconeogenesis. An FAD-dependent mito-chondrial enzyme is also able to catalyzethis reaction (known as the “glycerophos-phate shuttle”; see p. 212).
154 Metabolism
All rights reserved. Usage subject to terms and conditions of license.Koolman, Color Atlas of Biochemistry, 2nd edition © 2005 Thieme

P P P
PH2O
ADPATP
NADH+H
CO2
NADH+H
NAD
NAD
NAD
NADH+H
NADHNAD
5
3
P
8
7ADP
ATP
CO2
ADP ATP
23
1
GDPGTP
4
gER
8
7
6
5
4
3
2
1
P H2O
6
P
P
O
HO
OH
OH
OH
HH
HH
CH2
H
O
OCH2O
OH HCH2OH
OH
HH HO
O
HO
OH
OH
OH
HH
HH
CH2
H
HO
OCH2O
OH HCH2
OH
HH HO
O
COO
C
CH2
O
COO
C O
CH2
COO COO
C
CH3
O
COO
C
CH3
OHH
H2C
HC
H2C
OH
OH
OH
COO
C
CH3
O
COO
C
CH2
O
COO
COO
CH
CH2
OH
COO
Glucose 6-phosphate
3-Phospho-glycerate
1,3-Bisphospho-glycerate
Glyceraldehyde3-phosphate
2-Phospho-glycerate
Phospho-enolpyruvate
Pyruvate Lactate Glycerol
Glycerone3-phosphate
OxaloacetatePyruvate
Glucose
Mitochrondrion
Cytoplasm
Fructose 1,6-bisphosphate
Malate
Oxaloacetate
Amino acids
Fructose 6-phosphate
Lactatedehydrogenase1.1.1.27
Pyruvatecarboxylase(biotin)6.4.1.1
Malatedehydrogenase1.1.1.37
Fructose 1,6-bisphosphate3.1.3.11
Glucose 6-phosphatase3.1.3.9
Glycerol kinase2.7.1.30
Glycerol 3-phosphatedehydrogenase1.1.1.8
PEPcarboxykinase4.1.1.32
Glycerol
Lactate
Amino acids
Glucose 6-phosphate Glucose
Glycerol3-phosphate
A. Gluconeogenesis
Malate
155Carbohydrate Metabolism
All rights reserved. Usage subject to terms and conditions of license.Koolman, Color Atlas of Biochemistry, 2nd edition © 2005 Thieme

Glycogen metabolism
Glycogen (see p. 40) is used in animals as acarbohydrate reserve, from which glucosephosphates and glucose can be releasedwhen needed. Glucose storage itself wouldnot be useful, as high concentrations withincells would make them strongly hypertonicand would therefore cause an influx of water.By contrast, insoluble glycogen has only lowosmotic activity.
A. Glycogen balance
Animal glycogen, like amylopectin in plants, isa branched homopolymer of glucose. The glu-cose residues are linked by an α14-glyco-sidic bond. Every tenth or so glucose residuehas an additional α16 bond to anotherglucose. These branches are extended byadditional α14-linked glucose residues.This structure produces tree-shaped mole-cules consisting of up to 50000 residues(M > 1 107 Da).
Hepatic glycogen is never completely de-graded. In general, only the nonreducing endsof the “tree” are shortened, or—when glucoseis abundant—elongated. The reducing end ofthe tree is linked to a special protein, glyco-genin. Glycogenin carries out autocatalyticcovalent bonding of the first glucose at oneof its tyrosine residues and elongation of thisby up to seven additional glucose residues. Itis only at this point that glycogen synthasebecomes active to supply further elongation.
[1] The formation of glycosidic bonds be-tween sugars is endergonic. Initially, there-fore, the activated form—UDP-glucose—issynthesized by reaction of glucose 1-phos-phate with UTP (see p. 110).
[2] Glycogen synthase now transfers glu-cose residues one by one from UDP-glucoseto the non-reducing ends of the available“branches.”
[3] Once the growing chain has reached aspecific length (> 11 residues), the branchingenzyme cleaves an oligosaccharide consistingof 6–7 residues from the end of it, and addsthis into the interior of the same chain or aneighboring one with α16 linkage. Thesebranches are then further extended by glyco-gen synthase.
[4] The branched structure of glycogen al-lows rapid release of sugar residues. The most
important degradative enzyme, glycogenphosphorylase, cleaves residues from a non-reducing end one after another as glucose1-phosphate. The larger the number of theseends, the more phosphorylase molecules canattack simultaneously. The formation of glu-cose 1-phosphate instead of glucose has theadvantage that no ATP is needed to channelthe released residues into glycolysis or thePPP.
[5] [6] Due to the structure of glycogenphosphorylase, degradation comes to a haltfour residues away from each branchingpoint. Two more enzymes overcome thisblockage. First, a glucanotransferase moves atrisaccharide from the side chain to the end ofthe main chain [5]. A 1,6-glucosidase [6] thencleaves the single remaining residue as a freeglucose and leaves behind an unbranchedchain that is once again accessible to phos-phorylase.
The regulation of glycogen metabolism byinterconversion, and the role of hormones inthese processes, are discussed on p. 120.
B. Glycogen balance
The human organism can store up to 450 g ofglycogen—one-third in the liver and almost allof the remainder in muscle. The glycogencontent of the other organs is low.
Hepatic glycogen is mainly used to main-tain the blood glucose level in the postresorp-tive phase (see p. 308). The glycogen contentof the liver therefore varies widely, and candecline to almost zero in periods of extendedhunger. After this, gluconeogenesis (seep. 154) takes over the glucose supply for theorganism. Muscle glycogen serves as an energyreserve and is not involved in blood glucoseregulation. Muscle does not contain any glu-cose 6-phosphatase and is therefore unable torelease glucose into the blood. The glycogencontent of muscle therefore does not fluctuateas widely as that of the liver.
156 Metabolism
All rights reserved. Usage subject to terms and conditions of license.Koolman, Color Atlas of Biochemistry, 2nd edition © 2005 Thieme

1
R
R
R
P
R
2
3
4
5
6
P PU
P PU
P
P
P P
1
4
R
42
6
5
4
3
A. Glycogen metabolism
B. Glycogen balance
α-1,4-Glucan chain(unbranched)
α-1,4-Glucan chain(α-1,6-branched)
Glucose 1-phosphate
Glucose1-phosphate
Building blocksynthesis Glucose
UDP-glucose
UTP-glucose 1-phosphateuridyltransferase 2.7.7.9
Glycogen synthase 2.4.1.11
Glucan branching enzyme2.4.1.18
Phosphorylase 2.4.1.1
4-α-Glucanotransferase 2.4.1.25
Amylo-1,6-glucosidase3.2.1.33
Glucose6-phosphate
Glucose
Liverglycogen
Degra-dation
Muscleglycogen
Bloodglucose
Liver Blood
Glucose1-phosphate
Glucose6-phosphate
Glucose1-phosphate
Muscleglycogen
Liverglycogen
Glucose
Muscle
Reducingend
Degra-dation
Glucose
UTP Furtherdegradation
De-grad-ation
150 g
4 – 6 g · l-1 300 g
200 g
1 g
157Carbohydrate Metabolism
All rights reserved. Usage subject to terms and conditions of license.Koolman, Color Atlas of Biochemistry, 2nd edition © 2005 Thieme

Regulation
A. Regulation of carbohydrate metabolism
In all organisms, carbohydrate metabolism issubject to complex regulatory mechanismsinvolving hormones, metabolites, andcoenzymes. The scheme shown here (still asimplified one) applies to the liver, whichhas central functions in carbohydrate metab-olism (see p. 306). Some of the control mech-anisms shown here are not effective in othertissues.
One of the liver’s most important tasks is tostore excess glucose in the form of glycogenand to release glucose from glycogen whenrequired (buffer function). When the glycogenreserves are exhausted, the liver can provideglucose by de novo synthesis (gluconeogene-sis; see p. 154). In addition, like all tissues, theliver breaks glucose down via glycolysis.These functions have to be coordinated witheach other. For example, there is no point inglycolysis and gluconeogenesis taking placesimultaneously, and glycogen synthesis andglycogen degradation should not occur simul-taneously either. This is ensured by the factthat two different enzymes exist for importantsteps in both pathways, each of which cata-lyzes only the anabolic or the catabolic reac-tion. The enzymes are also regulated differ-ently. Only these key enzymes are shownhere.
Hormones. The hormones that influencecarbohydrate metabolism include the pepti-des insulin and glucagon; a glucocorticoid,cortisol; and a catecholamine, epinephrine(see p. 380). Insulin activates glycogensynthase ([1]; see p. 388), and induces severalenzymes involved in glycolysis [3, 5, 7]. At thesame time, insulin inhibits the synthesis ofenzymes involved in gluconeogenesis(repression; [4, 6, 8, 9]). Glucagon, the antag-onist of insulin, has the opposite effect. Itinduces gluconeogenesis enzymes [4, 6, 8, 9]and represses pyruvate kinase [7], a key en-zyme of glycolysis. Additional effects of glu-cagon are based on the interconversion of en-zymes and are mediated by the second mes-senger cAMP. This inhibits glycogen synthesis[1] and activates glycogenolysis [2].Epinephrine acts in a similar fashion. The in-hibition of pyruvate kinase [7] by glucagon isalso due to interconversion.
Glucocorticoids—mainly cortisol (seep. 374)—induce all of the key enzymes in-volved in gluconeogenesis [4, 6, 8, 9]. At thesame time, they also induce enzymes in-volved in amino acid degradation and therebyprovide precursors for gluconeogenesis. Reg-ulation of the expression of PEP carboxy-kinase, a key enzyme in gluconeogenesis, isdiscussed in detail on p. 244.
Metabolites. High concentrations of ATPand citrate inhibit glycolysis by allosteric reg-ulation of phosphofructokinase. ATP alsoinhibits pyruvate kinase. Acetyl-CoA, an inhib-itor of pyruvate kinase, has a similar effect. Allof these metabolites arise from glucosedegradation (feedback inhibition). AMP andADP, signals for ATP deficiency, activate gly-cogen degradation and inhibit gluconeogene-sis.
B. Fructose 2,6-bisphosphate
Fructose 2,6-bisphosphate (Fru-2,6-bP) playsan important part in carbohydrate metabo-lism. This metabolite is formed in small quan-tities from fructose 6-phosphate and haspurely regulatory functions. It stimulates gly-colysis by allosteric activation of phospho-fructokinase and inhibits gluconeogenesis byinhibition of fructose 1,6-bisphosphatase.
The synthesis and degradation of Fru-2,6-bP are catalyzed by one and the same protein[10a, 10b]. If the enzyme is present in an un-phosphorylated form [10a], it acts as a kinaseand leads to the formation of Fru-2,6-bP. Afterphosphorylation by cAMP-dependent proteinkinase A (PK-A), it acts as a phosphatase [10b]and now catalyzes the degradation of Fru-2,6-bP to fructose 6-phosphate. The equilibriumbetween [10a] and [10b] is regulated by hor-mones. Epinephrine and glucagon increasethe cAMP level (see p. 120). As a result ofincreased PK-A activity, this reduces the Fru-2,6-bP concentration and inhibits glycolysis,while at the same time activating gluconeo-genesis. Conversely, via [10a], insulin acti-vates the synthesis of Fru-2,6-bP and thusglycolysis. In addition, insulin also inhibitsthe action of glucagon by reducing the cAMPlevel (see p. 120).
158 Metabolism
All rights reserved. Usage subject to terms and conditions of license.Koolman, Color Atlas of Biochemistry, 2nd edition © 2005 Thieme

1
2
3
4
5
3'
6
7
8
9
3
4
3'
R
R
8
R
R
R
21
7
5
6
9
P
5
6
ATP
ADP
10a 10b
10b
10a
A. Regulation of carbohydrate metabolism
Insulin
EpinephrineGlucagon
Glycogen synthase 2.4.1.11
Glycogen phosphorylase 2.4.1.1
Hexokinase 2.7.1.1
Hexokinase (liver) 2.7.1.1
Glucose 6-phosphatase 3.1.3.9
6-Phosphofructokinase 2.7.1.11
Fructose 1,6-bisphosphatase 3.1.3.11
Pyruvate kinase 2.7.1.40
Pyruvate carboxylase 6.4.1.1
PEP carboxykinase (GTP) 4.1.1.32
Glycogen
Insulin Insulin
CortisolGlucagon
CortisolGlucagon
Fru-2,6-bis P AMP
AMP
Fructose6-phosphate
Glucose6-phosphate
Glucose1-phosphate
Fructose1,6-bisphosphateGlucose
Insulin
Glucagon
Pyruvate
Acetyl CoA
Insulin
Insulin
Oxalo-acetate
Oxalo-acetate
ATPAcetyl CoA
Insulin
CortisolGlucagon
Fru 2,6-bis PAMP
ATPCitrate
EpinephrineGlucagon
B. Fructose 2,6-bisphosphate
PEP
6-Phosphofructo-2-kinase 2.7.1.105 Fructose 2,6-bisphosphatase 3.1.3.46
Fructose 1,6-bisphosphate
Fructose 2,6-bisphosphate
Fructose 6-phosphate
Insulin Citrate, PEP
Insulin GlucagoncAMP
159Carbohydrate Metabolism
All rights reserved. Usage subject to terms and conditions of license.Koolman, Color Atlas of Biochemistry, 2nd edition © 2005 Thieme

Diabetes mellitus
Diabetes mellitus is a very common metabolicdisease that is caused by absolute or relativeinsulin deficiency. The lack of this peptidehormone (see p. 76) mainly affects carbohy-drate and lipid metabolism. Diabetes mellitusoccurs in two forms. In type 1 diabetes (in-sulin-dependent diabetes mellitus, IDDM),the insulin-forming cells are destroyed inyoung individuals by an autoimmune reac-tion. The less severe type 2 diabetes (non-insulin-dependent diabetes mellitus, NIDDM)usually has its first onset in elderly individu-als. The causes have not yet been explained indetail in this type.
A. Insulin biosynthesis
Insulin is produced by the B cells of the isletsof Langerhans in the pancreas. As is usual withsecretory proteins, the hormone’s precursor(preproinsulin) carries a signal peptide thatdirects the peptide chain to the interior ofthe endoplasmic reticulum (see p. 210). Proin-sulin is produced in the ER by cleavage of thesignal peptide and formation of disulfidebonds. Proinsulin passes to the Golgi appara-tus, where it is packed into vesicles—the β-granules. After cleavage of the C peptide, ma-ture insulin is formed in the β-granules and isstored in the form of zinc-containing hexam-ers until secretion.
B. Effects of insulin deficiency
The effects of insulin on carbohydratemetabolism are discussed on p. 158. In sim-plified terms, they can be described as stim-ulation of glucose utilization and inhibition ofgluconeogenesis. In addition, the transport ofglucose from the blood into most tissues isalso insulin-dependent (exceptions to this in-clude the liver, CNS, and erythrocytes).
The lipid metabolism of adipose tissue isalso influenced by the hormone. In these cells,insulin stimulates the reorganization of glu-cose into fatty acids. This is mainly based onactivation of acetyl CoA carboxylase (seep. 162) and increased availability ofNADPH+H+ due to increased PPP activity(see p. 152). On the other hand, insulin alsoinhibits the degradation of fat by hormone-
sensitive lipases (see p. 162) and prevents thebreakdown of muscle protein.
The effects of insulin deficiency on metab-olism are shown by arrows in the illustration.Particularly noticeable is the increase in theglucose concentration in the blood, from5 mM to 9 mM (90 mg dL–1) or more(hyperglycemia, elevated blood glucoselevel). In muscle and adipose tissue – the twomost important glucose consumers—glucoseuptake and glucose utilization are impairedby insulin deficiency. Glucose utilization inthe liver is also reduced. At the same time,gluconeogenesis is stimulated, partly due toincreased proteolysis in the muscles. This in-creases the blood sugar level still further.When the capacity of the kidneys to resorbglucose is exceeded (at plasma concentrationsof 9 mM or more), glucose is excreted in theurine (glucosuria).
The increased degradation of fat that oc-curs in insulin deficiency also has serious ef-fects. Some of the fatty acids that accumulatein large quantities are taken up by the liverand used for lipoprotein synthesis (hyperlipi-demia), and the rest are broken down intoacetyl CoA. As the tricarboxylic acid cycle isnot capable of taking up such large quantitiesof acetyl CoA, the excess is used to form ke-tone bodies (acetoacetate and -hydroxy-butyrate see p. 312). As H+ ions are releasedin this process, diabetics not receiving ad-equate treatment can suffer severe metabolicacidosis (diabetic coma). The acetone that isalso formed gives these patients’ breath acharacteristic odor. In addition, large amountsof ketone body anions appear in the urine(ketonuria).
Diabetes mellitus can have serious secon-dary effects. A constantly raised blood sugarlevel can lead in the long term to changes inthe blood vessels (diabetic angiopathy), kid-ney damage (nephropathy) and damage tothe nervous system (neuropathy), as well asto cataracts in the eyes.
160 Metabolism
All rights reserved. Usage subject to terms and conditions of license.Koolman, Color Atlas of Biochemistry, 2nd edition © 2005 Thieme

1
2
3
4
1 2 3
4
CC
Exo-cytosis
RoughER Golgi apparatus
β-Granules
H3N
Preproinsulin
Signalpeptide
OOC
104 ASProinsulin
C peptide
84 ASInsulin
51 AS
Zn2
Insulinhexamer
Nucleus
A. Insulin biosynthesis
B. Effects of insulin deficiency
B cells
Muscle andother insulin-dependent tissues
Blood
Hyper-lipid-emia
Glucoseuptakeimpaired
Adiposetissue
Maximalresorptioncapacityexceeded
Kidney
Glyco-gen
Lipo-proteinsFatty
acids
Aminoacids
Lipolysis
Protein
Glucose Glucose Glucose
Fat
Proteo-lysis
Fatty acids
Fatty acids
Hyper-glycemia
Glucose
Anionsof ketonebodies
Glucose
Aminoacids
PyruvateLiver Glucose
MetabolicacidosisInsulin deficiency
WaterElectrolytes
Urine
Anionsof ketonebodies
H
Ketonebodies
AcetylCoA
161Carbohydrate Metabolism
All rights reserved. Usage subject to terms and conditions of license.Koolman, Color Atlas of Biochemistry, 2nd edition © 2005 Thieme

Overview
A. Fat metabolism
Fat metabolism in adipose tissue (top). Fats(triacylglycerols) are the most important en-ergy reserve in the animal organism. They aremostly stored in insoluble form in the cells ofadipose tissue—the adipocytes—where theyare constantly being synthesized and brokendown again.
As precursors for the biosynthesis of fats(lipogenesis), the adipocytes use triacylgly-cerols from lipoproteins (VLDLs and chylomi-crons; see p. 278), which are formed in theliver and intestines and delivered by theblood. Lipoprotein lipase [1], which is locatedon the inner surface of the blood capillaries,cleaves these triacylglycerols into glyceroland fatty acids, which are taken up by theadipocytes and converted back into fats.
The degradation of fats (lipolysis) is cata-lyzed in adipocytes by hormone-sensitivelipase [2]—an enzyme that is regulated byvarious hormones by cAMP-dependent inter-conversion (see p. 120). The amount of fattyacids released depends on the activity of thislipase; in this way, the enzyme regulates theplasma levels of fatty acids.
In the blood plasma, fatty acids are trans-ported in free form—i. e., non-esterified. Onlyshort-chain fatty acids are soluble in theblood; longer, less water-soluble fatty acidsare transported bound to albumin.
Degradation of fatty acids in the liver (left).Many tissues take up fatty acids from theblood plasma in order to synthesize fats orto obtain energy by oxidizing them. The me-tabolism of fatty acids is particularly intensivein the hepatocytes in the liver.
The most important process in the degra-dation of fatty acids is -oxidation—a meta-bolic pathway in the mitochondrial matrix(see p. 164). Initially, the fatty acids in thecytoplasm are activated by binding to coen-zyme A into acyl CoA [3]. Then, with the helpof a transport system (the carnitine shuttle[4]; see p. 164), the activated fatty acids enterthe mitochondrial matrix, where they arebroken down into acetyl CoA. The resultingacetyl residues can be oxidized to CO2 in thetricarboxylic acid cycle, producing reduced
coenzyme and ATP derived from it by oxida-tive phosphorylation. If acetyl CoA productionexceeds the energy requirements of the hepa-tocytes—as is the case when there is a highlevel of fatty acids in the blood plasma (typicalin hunger and diabetes mellitus)—then theexcess is converted into ketone bodies (seep. 312). These serve exclusively to supplyother tissues with energy.
Fat synthesis in the liver (right). Fatty acidsand fats are mainly synthesized in the liverand in adipose tissue, as well as in the kid-neys, lungs, and mammary glands. Fatty acidbiosynthesis occurs in the cytoplasm—in con-trast to fatty acid degradation. The most im-portant precursor is glucose, but certainamino acids can also be used.
The first step is carboxylation of acetyl CoAto malonyl CoA. This reaction is catalyzed byacetyl-CoA carboxylase [5], which is the keyenzyme in fatty acid biosynthesis. Synthesisinto fatty acids is carried out by fatty acidsynthase [6]. This multifunctional enzyme(see p. 168) starts with one molecule of ace-tyl-CoA and elongates it by adding malonylgroups in seven reaction cycles until palmi-tate is reached. One CO2 molecule is releasedin each reaction cycle. The fatty acid thereforegrows by two carbon units each time.NADPH+H+ is used as the reducing agentand is derived either from the pentose phos-phate pathway (see p. 152) or from isocitratedehydrogenase and malic enzyme reactions.
The elongation of the fatty acid by fatty acidsynthase concludes at C16, and the product,palmitate (16:0), is released. Unsaturatedfatty acids and long-chain fatty acids can arisefrom palmitate in subsequent reactions. Fatsare finally synthesized from activated fattyacids (acyl CoA) and glycerol 3-phosphate(see p. 170). To supply peripheral tissues,fats are packed by the hepatocytes into lipo-protein complexes of the VLDL type and re-leased into the blood in this form (see p. 278).
162 Metabolism
All rights reserved. Usage subject to terms and conditions of license.Koolman, Color Atlas of Biochemistry, 2nd edition © 2005 Thieme

2
1
3
4 2
3
4
5
6
5
6
P
P P
CoA ATP
AMP+
HCO3
NADP
NADPH+H
ADP+
ATP
CO2
7x
COO
1
NADH+H
COOChylo-microns
Triacylglycerols
Free fatty acids
Insulin
Hormone-sensitivelipase 3.1.1.3
Lipoproteinlipase 3.1.1.34
Fatty acid-CoAligase 6.2.1.3
Carnitine O-palmitoyltrans-ferase 2.3.1.21
Fatty acid-albumin complex
Largestenergystore
Acetyl-CoAcarboxylase6.4.1.2 [Biotin]
Fatty acidsynthase2.3.1.85
From theintestine
EpinephrineNorepinephrineGlucagon etc.
Blood
A. Fat metabolism
Insulin
VLDL
β-Oxidation
Acyl CoA Elongatedfatty acids
Unsaturatedfatty acids
Fat biosynthesis
Acyl CoA
Free fatty acids
Adipocyte
Hepatocyte
Mitochondrion
Palmitate
Acyl CoA
Triacylglycerols
Glucose
Acetyl CoA
GlycolysisSupplyof energyto othertissues
Fatty aciddegradation
CO2+ATP
Amino aciddegradation
Most importantprecursorFatty acid
biosynthesis
Ketone bodies
Citric acidcycleRespiratorychain
Amino acids
Citrate
Malonyl CoA
Acetyl CoA
Insulin
Glucagon
Acetyl CoAor acyl CoA
163Lipid Metabolism
All rights reserved. Usage subject to terms and conditions of license.Koolman, Color Atlas of Biochemistry, 2nd edition © 2005 Thieme

Fatty acid degradation
A. Fatty acid degradation: -oxidation
After uptake by the cell, fatty acids areactivated by conversion into their CoA deriva-tives—acyl CoA is formed. This uses up twoenergy-rich anhydride bonds of ATP per fattyacid (see p. 162). For channeling into the mi-tochondria, the acyl residues are first trans-ferred to carnitine and then transportedacross the inner membrane as acyl carnitine(see B).
The degradation of the fatty acids occurs inthe mitochondrial matrix through an oxida-tive cycle in which C2 units are successivelycleaved off as acetyl CoA (activated aceticacid). Before the release of the acetyl groups,each CH2 group at C-3 of the acyl residue (theβ-C atom) is oxidized to the keto group—hence the term -oxidation for this metabolicpathway. Both spatially and functionally, it isclosely linked to the tricarboxylic acid cycle(see p. 136) and to the respiratory chain (seep. 140).
[1] The first step is dehydrogenation of acylCoA at C-2 and C-3. This yields an unsaturated∆2-enoyl-CoA derivative with a trans-config-ured double bond. The two hydrogen atomsare initially transferred from FAD-containingacyl CoA dehydrogenase to the electron-trans-ferring flavoprotein (ETF). ETF dehydrogenase[5] passes them on from ETF to ubiquinone(coenzyme Q), a component of the respiratorychain (see p. 140). Other FAD-containing mi-tochondrial dehydrogenases are also able tosupply the respiratory chain with electrons inthis fashion.
There are three isoenzymes (see p. 98) ofacyl CoA dehydrogenase that are specializedfor long-chain fatty acids (12–18 C atoms),medium-chain fatty acids (4–14), and short-chain fatty acids (4–8).
[2] The next step in fatty acid degradationis the addition of a water molecule to thedouble bond of the enoyl CoA (hydration),with formation of -hydroxyacyl CoA.
[3] In the next reaction, the OH group at C-3 is oxidized to a carbonyl group (dehydro-genation). This gives rise to -ketoacyl CoA,and the reduction equivalents are transferredto NAD+, which also passes them on to therespiratory chain.
[4] β-Ketoacyl-CoA is now broken down byan acyl transferase into acetyl CoA and an acylCoA shortened by 2 C atoms (“thioclasticcleavage”).
Several cycles are required for completedegradation of long-chain fatty acids—eightcycles in the case of stearyl-CoA (C18:0), forexample. The acetyl CoA formed can thenundergo further metabolism in the tricarbox-ylic acid cycle (see p. 136), or can be used forbiosynthesis. When there is an excess of ace-tyl CoA, the liver can also form ketone bodies(see p. 312).
When oxidative degradation is complete,one molecule of palmitic acid supplies around106 molecules of ATP, corresponding to anenergy of 3300 kJ mol–1. This high energyyield makes fats an ideal form of storage formetabolic energy. Hibernating animals suchas polar bears can meet their own energyrequirements for up to 6 months solely byfat degradation, while at the same time pro-ducing the vital water they need via the res-piratory chain (“respiratory water”).
B. Fatty acid transport
The inner mitochondrial membrane has agroup-specific transport system for fattyacids. In the cytoplasm, the acyl groups ofactivated fatty acids are transferred to carni-tine by carnitine acyltransferase [1]. They arethen channeled into the matrix by an acylcar-nitine/carnitine antiport as acyl carnitine, inexchange for free carnitine. In the matrix, themitochondrial enzyme carnitine acyltransfer-ase catalyzes the return transfer of the acylresidue to CoA.
The carnitine shuttle is the rate-determin-ing step in mitochondrial fatty acid degrada-tion. Malonyl CoA, a precursor of fatty acidbiosynthesis, inhibits carnitine acyltransferase(see p. 162), and therefore also inhibits uptakeof fatty acids into the mitochondrial matrix.
The most important regulator of β-oxida-tion is the NAD+/NADH+H+ ratio. If the respi-ratory chain is not using any NADH+H+, thennot only the tricarboxylic acid cycle (seep. 136) but also β-oxidation come to a stand-still due to the lack of NAD+.
164 Metabolism
All rights reserved. Usage subject to terms and conditions of license.Koolman, Color Atlas of Biochemistry, 2nd edition © 2005 Thieme

N A
AS
ASN A
2
H2O
4
QH2
Q
F A
F A
5
1
3
AS
AS
AS
AS
AS A
S
AS
AS
1
SA
1
SA
A
3
4
5
2
1
1
SA
SA
C C C
H
H
H
H
C
H
H
O
C C
H
H
O
C C
H
H
O
H
C C
H
H
O
H
C C
H
H
O
H
C C C
H
H
C
H O
H
O C C
H
H
O
H
C C C
H
H
H
C
H O
C C C
H
H
C
H O
H
OH
H
CO
O
C
H
CH2 N CH3
CH3
CH3
CH2OOC
A. Fatty acid degradation: β-oxidation
Acyl CoA(n – 2 carbons)
β-Carbon
Electron-transferringflavoprotein (ETF)
Respiratorychain
Respiratorychain
Tricarboxylic acid cycle
Acylcarnitine
CarnitineCarnitine
Acyl
β-OxidationFat degradation
Acylcarnitine
B. Fatty acid transport
Acyl CoA
Acetyl CoA
3-Hydroxyacyl-CoA dehydrogenase1.1.1.35
Acetyl-CoA acyltransferase 2.3.1.16
ETF dehydrogenase [FAD, Fe4S4] 1.5.5.1
Enoyl-CoA hydratase 4.2.1.17
Acyl-CoA dehydrogenase 1.3.99.3
CarnitineO-palmitoyltransferase2.3.1.21
Acyl
Acylcarnitine
165Lipid Metabolism
All rights reserved. Usage subject to terms and conditions of license.Koolman, Color Atlas of Biochemistry, 2nd edition © 2005 Thieme

Minor pathways of fatty aciddegradation
Most fatty acids are saturated and even-num-bered. They are broken down via -oxidation(see p.164). In addition, there are special path-ways involving degradation of unsaturatedfatty acids (A), degradation of fatty acidswith an odd number of C atoms (B), α and ωoxidation of fatty acids, and degradation inperoxisomes.
A. Degradation of unsaturated fatty acids
Unsaturated fatty acids usually contain a cisdouble bond at position 9 or 12—e. g., linoleicacid (18:2; 9,12). As with saturated fatty acids,degradation in this case occurs via β-oxida-tion until the C-9-cis double bond is reached.Since enoyl-CoA hydratase only accepts sub-strates with trans double bonds, the corre-sponding enoyl-CoA is converted by an iso-merase from the cis-∆3, cis- ∆6 isomer into thetrans-∆3,cis-∆6 isomer [1]. Degradation by β-oxidation can now continue until a shortenedtrans-∆2, cis-∆4 derivative occurs in the nextcycle. This cannot be isomerized in the sameway as before, and instead is reduced in anNADPH-dependent way to the trans-∆3 com-pound [2]. After rearrangement by enoyl-CoAisomerase [1], degradation can finally be com-pleted via normal β-oxidation.
B. Degradation of oddnumbered fatty acids
Fatty acids with an odd number of C atoms aretreated in the same way as “normal” fattyacids—i. e., they are taken up by the cell withATP-dependent activation to acyl CoA and aretransported into the mitochondria with thehelp of the carnitine shuttle and brokendown there by β−oxidation (see p. 164). Inthe last step, propionyl CoA arises instead ofacetyl CoA. This is first carboxylated by pro-pionyl CoA carboxylase into (S)-methylmalonylCoA [3], which—after isomerization into the(R) enantiomer (not shown; see p. 411)—isisomerized into succinyl CoA [4].
Various coenzymes are involved in thesereactions. The carboxylase [3] requires biotin,and the mutase [4] is dependent on coenzymeB12 (5-deoxyadenosyl cobalamin; see p. 108).Succinyl-CoA is an intermediate in the tricar-
boxylic acid cycle and is available for gluco-neogenesis through conversion into oxaloace-tate. Odd-numbered fatty acids from pro-pionyl-CoA can therefore be used to synthe-size glucose.
This pathway is also important for rumi-nant animals, which are dependent on sym-biotic microorganisms to break down theirfood. The microorganisms produce largeamounts of propionic acid as a degradationproduct, which the host can channel into themetabolism in the way described.
Further information
In addition to the degradation pathways de-scribed above, there are also additional spe-cial pathways for particular fatty acids foundin food.
Oxidation is used to break down methyl-branched fatty acids. It takes place throughstep-by-step removal of C1 residues, beginswith a hydroxylation, does not require coen-zyme A, and does not produce any ATP.
Oxidation—i. e., oxidation starting at theend of the fatty acid—also starts with a hy-droxylation catalyzed by a monooxygenase(see p. 316), and leads via subsequent oxida-tion to fatty acids with two carboxyl groups,which can undergo β-oxidation from bothends until C8 or C6 dicarboxylic acids arereached, which can be excreted in the urinein this form.
Degradation of unusually long fatty acids.An alternative form of β-oxidation takes placein hepatic peroxisomes, which are specializedfor the degradation of particularly long fattyacids (n > 20). The degradation products areacetyl-CoA and hydrogen peroxide (H2O2),which is detoxified by the catalase (seep. 32) common in peroxisomes.
Enzyme defects are also known to exist inthe minor pathways of fatty acid degradation.In Refsum disease, the methyl-branched phy-tanic acid (obtained from vegetable foods)cannot be degraded by α-oxidation. In Zell-weger syndrome, a peroxisomal defect meansthat long-chain fatty acids cannot be de-graded.
166 Metabolism
All rights reserved. Usage subject to terms and conditions of license.Koolman, Color Atlas of Biochemistry, 2nd edition © 2005 Thieme

cis
cis
trans
trans trans
AS
AS
AS
AS
trans
cis
AS
cis
AS
N A
N A
P
P
1
1
2
1
2
1
2
3 CoA
4 CoA
NADPH
NADP
P PAA
P P P
Pn Acetyl CoA
CO2
AS
43
4
3
AS
AS
AS
AS
C C
H
H
O
H
C C
H
H
O
C
H
H
H C C
H
COO
O
C
H
H
H CC
H
H
O
C
H
COO
H
C
O
12
9
C
O3
6
C
O
6
2 C
O
2
4
C
O
2 C
O
3
Linoleoyl CoA (18 : 2; 9,12)
5 Acetyl CoA
Reduction andshift of themarkeddouble bonds
Shift andizomerizationof themarkeddouble bond
3 Acetyl CoA
Acetyl CoA
β-Oxidation
Enoyl-CoA isomerase5.3.3.8
2,4-Dienoyl-CoA reductase1.3.1.34
β-Oxidation
β-Oxidation
CoA
Odd-numberedfatty acids
Tricarboxylic acid cycle
Propionyl CoA Methylmalonyl CoA Succinyl CoA
Propionyl-CoA carboxylase6.4.1.3 [biotin]
Methylmalonyl-CoA mutase5.4.99.2 [cobamide]β-Oxidation
A. Degradation of unsaturated fatty acids
B. Degradation of odd-numbered fatty acids
167Lipid Metabolism
All rights reserved. Usage subject to terms and conditions of license.Koolman, Color Atlas of Biochemistry, 2nd edition © 2005 Thieme

Fatty acid synthesis
In the vertebrates, biosynthesis of fatty acidsis catalyzed by fatty acid synthase, a multi-functional enzyme. Located in the cytoplasm,the enzyme requires acetyl CoA as a startermolecule. In a cyclic reaction, the acetyl resi-due is elongated by one C2 unit at a time forseven cycles. NADPH+H+ is used as a reducingagent in the process. The end product of thereaction is the saturated C16 acid, palmiticacid.
A. Fatty acid synthase
Fatty acid synthase in vertebrates consists oftwo identical peptide chains—i. e., it is a ho-modimer. Each of the two peptide chains,which are shown here as hemispheres, cata-lyzes all seven of the partial reactions re-quired to synthesize palmitate. The spatialcompression of several successive reactionsinto a single multifunctional enzyme has ad-vantages in comparison with separate en-zymes. Competing reactions are prevented,the individual reactions proceed in a coordi-nated way as if on a production line, and dueto low diffusion losses they are particularlyef cient.
Each subunit of the enzyme binds acetylresidues as thioesters at two different SHgroups: at one peripheral cysteine residue(CysSH) and one central 4-phosphopante-theine group (Pan-SH). Pan-SH, which is verysimilar to coenzyme A (see p. 12), is cova-lently bound to a protein segment of the syn-thase known as the acyl-carrier protein (ACP).This part functions like a long arm that passesthe substrate from one reaction center to thenext. The two subunits of fatty acid synthasecooperate in this process; the enzyme istherefore only capable of functioning as adimer.
Spatially, the enzyme activities are ar-ranged into three different domains.Domain 1 catalyzes the entry of the substratesacetyl CoA and malonyl CoA by [ACP]-S-acetyltransferase [1] and [ACP]-Smalonyltransferase [2] and subsequent condensationof the two partners by 3-oxoacyl-[ACP]-synthase [3]. Domain 2 catalyzes the conver-sion of the 3-oxo group to a CH2 group by 3-oxoacyl-[ACP]-reductase [4], 3-hydroxyacyl-[ACP]-dehydratase [5], and enoyl-[ACP]-re-
ductase [6]. Finally, domain 3 serves to releasethe finished product by acyl-[ACP]-hydrolase[7] after seven steps of chain elongation.
B. Reactions of fatty acid synthase
The key enzyme in fatty acid synthesis is ace-tyl CoA carboxylase (see p. 162), which pre-cedes the synthase and supplies the malonyl-CoA required for elongation. Like all carbox-ylases, the enzyme contains covalently boundbiotin as a prosthetic group and is hormone-dependently inactivated by phosphorylationor activated by dephosphorylation (seep. 120). The precursor citrate (see p. 138) isan allosteric activator, while palmitoyl-CoAinhibits the end product of the synthesispathway.
[1] The first cycle (n = 1) starts with thetransfer of an acetyl residue from acetyl CoAto the peripheral cysteine residue (Cys-SH). Atthe same time,
[2] a malonyl residue is transferred frommalonyl CoA to 4-phosphopantetheine (Pan-SH).
[3] By condensation of the acetyl resi-due—or (in later cycles) the acyl residue—withthe malonyl group, with simultaneous decar-boxylation, the chain is elongated.
[4]–[6] The following three reactions (re-duction of the 3-oxo group, dehydrogenationof the 3-hydroxyl derivative, and renewedreduction of it) correspond in principle to areversal of β-oxidation, but they are catalyzedby other enzymes and use NADPH+H+ insteadof NADH+H+ for reduction. They lead to anacyl residue bound at Pan-SH with 2n + 2 Catoms (n = the number of the cycle). Finally,depending on the length of the product,
[1] The acyl residue is transferred back tothe peripheral cysteine, so that the next cyclecan begin again with renewed loading of theACP with a malonyl residue, or:
[7] After seven cycles, the completed pal-mitic acid is hydrolytically released.
In all, one acetyl-CoA and seven malonyl-CoA are converted with the help of 14NADPH+H+ into one palmitic acid, 7 CO2,6 H2O, 8 CoA and 14 NADP+. Acetyl CoA car-boxylase also uses up seven ATP.
168 Metabolism
All rights reserved. Usage subject to terms and conditions of license.Koolman, Color Atlas of Biochemistry, 2nd edition © 2005 Thieme

N A
P
CC
H
H
O
C
OH
H
C H
H
H
1
21
3
45
6
7
7
ACP
2 1
3
45
6
ACP
CysSH
SH
SH
SH
Cys
P
AS
AS
5
6
7
AS
AS
1
AS
71
7x
Cys–S
Pan–S
AS
2
H2O
5H2O
Cys–SH
Pan–S
6N A
P
NADP
Cys–SH
Pan–S
Cys–SH
Pan–S
4N A
P
N A
PNADP
Cys–SH
Pan–S
3
H
CO2
1
2
3
4
5
6
7
CC
H
H
O
C
H
H
C H
H
H
CC
HO
C
H
C H
H
H
CC
H
H
O
C
O
C H
H
H
CC
H
H
O
COO
CC
H
H
O
H
NADP+H
NADP+H
A. Fatty acid synthase
Product release
Chain elongation
Substrate entry
Reduction
Water cleavage1s
t domain
3 rd domain 2 nd domain
-Pantethein
Acetyl
Malonyl
Palmitate
Reduction
B. Reactions of fatty acid synthesis
Acetyl Malonyl
Palmitate
Productrelease
Starting reactionAcetyl oracyl residue
Acyl-
trans-Enoyl-
3-Hydroxy-acyl-
3-Oxoacyl-
[ACP]-S-Acetyl-transferase 2.3.1.38
[ACP]-S-Malonyl-transferase 2.3.1.39
3-Oxoacyl-[ACP]synthase 2.3.1.41
3-Oxoacyl-[ACP]reductase 1.1.1.100
3-Hydroxypalmitoyl-[ACP]dehydratase 4.2.1.61
Enoyl-[ACP]reductase (NADPH) 1.3.1.10
Acyl-[ACP]hydrolase 3.1.2.14
2
3
4
169Lipid Metabolism
All rights reserved. Usage subject to terms and conditions of license.Koolman, Color Atlas of Biochemistry, 2nd edition © 2005 Thieme

Biosynthesis of complex lipids
A. Biosynthesis of fats and phospholipids
Complex lipids, such as neutral fats (triacyl-glycerols), phospholipids, and glycolipids, aresynthesized via common reaction pathways.Most of the enzymes involved are associatedwith the membranes of the smooth endoplas-mic reticulum.
The synthesis of fats and phospholipidsstarts with glycerol 3-phosphate. This com-pound can arise via two pathways:
[1] By reduction from the glycolyticintermediate glycerone 3-phosphate (dihy-droxyacetone 3-phosphate; enzyme: glyc-erol-3-phosphate dehydrogenase (NAD+)1.1.1.8), or:
[2] By phosphorylation of glycerol derivingfrom fat degradation (enzyme: glycerol kinase2.7.1.30).
[3] Esterification of glycerol 3-phosphatewith a long-chain fatty acid produces astrongly amphipathic lysophosphatidate (en-zyme: glycerol-3-phosphate acyltransferase2.3.1.15). In this reaction, an acyl residue istransferred from the activated precursoracyl-CoA to the hydroxy group at C-1.
[4] A second esterification of this type leadsto a phosphatidate (enzyme: 1-acylglycerol-3-phosphate acyltransferase 2.3.1.51). Unsatu-rated acyl residues, particularly oleic acid,are usually incorporated at C-2 of the glycerol.Phosphatidates (anions of phosphatidic acids)are the key molecules in the biosynthesis offats, phospholipids, and glycolipids.
[5] To biosynthesize fats (triacylglycerols),the phosphate residue is again removed byhydrolysis (enzyme: phosphatidate phospha-tase 3.1.3.4). This produces diacylglycerols(DAG).
[6] Transfer of an additional acyl residue toDAG forms triacylglycerols (enzyme: diacyl-glycerol acyltransferase 2.3.1.20). This com-pletes the biosynthesis of neutral fats. Theyare packaged into VLDLs by the liver and re-leased into the blood. Finally, they are storedby adipocytes in the form of insoluble fatdroplets.
The biosynthesis of most phospholipidsalso starts from DAG.
[7] Transfer of a phosphocholine residue tothe free OH group gives rise to phosphatidyl-choline (lecithin; enzyme: 1-alkyl-2-acetyl-glycerolcholine phosphotransferase 2.7.8.16).The phosphocholine residue is derived fromthe precursor CDP-choline (see p. 110). Phos-phatidylethanolamine is similarly formedfrom CDP-ethanolamine and DAG. Bycontrast, phosphatidylserine is derived fromphosphatidylethanolamine by an exchange ofthe amino alcohol. Further reactions serve tointerconvert the phospholipids—e. g., phos-phatidylserine can be converted into phos-phatidylethanolamine by decarboxylation,and the latter can then be converted intophosphatidylcholine by methylation with S-adenosyl methionine (not shown; see alsop. 409). The biosynthesis of phosphatidylino-sitol starts from phosphatidate rather thanDAG.
[8] In the lumen of the intestine, fats fromfood are mainly broken down into monoacyl-glycerols (see p. 270). The cells of the intesti-nal mucosa re-synthesize these into neutralfats. This pathway also passes via DAG(enzyme: acylglycerolpalmitoyl transferase2.3.1.22).
[9] Transfer of a CMP residue gives rise firstto CDP-diacylglycerol (enzyme: phosphatida-tecytidyl transferase 2.3.1.22).
[10] Substitution of the CMP residue byinositol then provides phosphatidylinositol(PtdIns; enzyme: CDPdiacylglycerolinositol-3-phosphatidyl transferase 2.7.8.11).
[12] An additional phosphorylation (en-zyme: phosphatidylinositol-4-phosphate kin-ase 2.7.1.68) finally provides phosphaditylino-sitol-4,5-bisphosphate (PIP2, PtdIns(4,5)P2).PIP2 is the precursor for the second messen-gers 2,3-diacylglycerol (DAG) and inositol-1,4,5-trisphosphate (InsP3, IP3; see p. 367).
The biosynthesis of the sphingolipids isshown in schematic form on p. 409.
170 Metabolism
All rights reserved. Usage subject to terms and conditions of license.Koolman, Color Atlas of Biochemistry, 2nd edition © 2005 Thieme

ATP
ADP
ATP
ADP
PP P
PC
AP P P
AS
P
PP
P
PPC
AS
AS
AS
P
P
AS
AS
P
AS
P
P PA
N A N A
P
O
AS
P PC
CP P P
PP
1 2
3
109
4
126
7
11 58
CDP-diacylglycerol
Inositol
Phosphatidylcholine
2-Monoacylglycerol
orethanol-amine
Phosphatidylinositol 4,5-bisphosphate
Phosphatidylinositol 4-phosphate
Inositol
Phosphatidylinositol
Triacylglycerol
Diacylglycerol
Acyl CoA
Lysophosphatidate
Acyl CoA
Glycolysis
Glycerone 3-phosphate Glycerol3-phosphate
Glycerol
Food
Choline
CMP
Inositol
Choline
Phosphatidate
Inositol
A. Biosynthesis of fats and phospholipids
171Lipid Metabolism
All rights reserved. Usage subject to terms and conditions of license.Koolman, Color Atlas of Biochemistry, 2nd edition © 2005 Thieme

Biosynthesis of cholesterol
Cholesterol is a major constituent of the cellmembranes of animal cells (see p. 216). Itwould be possible for the body to provide itsfull daily cholesterol requirement (ca. 1 g) bysynthesizing it itself. However, with a mixeddiet, only about half of the cholesterol is de-rived from endogenous biosynthesis, whichtakes place in the intestine and skin, andmainly in the liver (about 50%). The rest istaken up from food. Most of the cholesterolis incorporated into the lipid layer of plasmamembranes, or converted into bile acids (seep. 314). A very small amount of cholesterol isused for biosynthesis of the steroid hormones(see p. 376). In addition, up to 1 g cholesterolper day is released into the bile and thusexcreted.
A. Cholesterol biosynthesis
Cholesterol is one of the isoprenoids, synthe-sis of which starts from acetyl CoA (see p. 52).In a long and complex reaction chain, the C27
sterol is built up from C2 components. Thebiosynthesis of cholesterol can be dividedinto four sections. In the first (1),mevalonate, a C6 compound, arises fromthree molecules of acetyl CoA. In the secondpart (2), mevalonate is converted into isopen-tenyl diphosphate, the “active isoprene.” Inthe third part (3), six of these C5 moleculesare linked to produce squalene, a C30 com-pound. Finally, squalene undergoes cycliza-tion, with three C atoms being removed, toyield cholesterol (4). The illustration onlyshows the most important intermediates inbiosynthesis.
(1) Formation of mevalonate. The conver-sion of acetyl CoA to acetoacetyl CoA and thento 3-hydroxy-3-methylglutaryl CoA (3-HMGCoA) corresponds to the biosynthetic path-way for ketone bodies (details on p. 312). Inthis case, however, the synthesis occurs not inthe mitochondria as in ketone body synthesis,but in the smooth endoplasmic reticulum. Inthe next step, the 3-HMG group is cleavedfrom the CoA and at the same time reducedto mevalonate with the help of NADPH+H+. 3-HMG CoA reductase is the key enzyme in cho-lesterol biosynthesis. It is regulated by repres-sion of transcription (effectors: oxysterolssuch as cholesterol) and by interconversion
(effectors: hormones). Insulin and thyroxinestimulate the enzyme and glucagon inhibits itby cAMP-dependent phosphorylation. A largesupply of cholesterol from food also inhibits3-HMG-CoA reductase.
(2) Formation of isopentenyl diphosphate.After phosphorylation, mevalonate is decar-boxylated to isopentenyl diphosphate, withconsumption of ATP. This is the componentfrom which all of the isoprenoids are built(see p. 53).
(3) Formation of squalene. Isopentenyldiphosphate undergoes isomerization toform dimethylallyl diphosphate. The two C5
molecules condense to yield geranyl diphos-phate, and the addition of another isopen-tenyl diphosphate produces farnesyl diphos-phate. This can then undergo dimerization, ina head-to-head reaction, to yield squalene.Farnesyl diphosphate is also the starting-point for other polyisoprenoids, such as doli-chol (see p. 230) and ubiquinone (see p. 52).
(4) Formation of cholesterol. Squalene, alinear isoprenoid, is cyclized, with O2 beingconsumed, to form lanosterol, a C30 sterol.Three methyl groups are cleaved from thisin the subsequent reaction steps, to yield theend product cholesterol. Some of these reac-tions are catalyzed by cytochrome P450 sys-tems (see p. 318).
The endergonic biosynthetic pathway de-scribed above is located entirely in the smoothendoplasmic reticulum. The energy neededcomes from the CoA derivatives used andfrom ATP. The reducing agent in the formationof mevalonate and squalene, as well as in thefinal steps of cholesterol biosynthesis, isNADPH+H+.
The division of the intermediates of thereaction pathway into three groups is charac-teristic: CoA compounds, diphosphates, andhighly lipophilic, poorly soluble compounds(squalene to cholesterol), which are bound tosterol carriers in the cell.
172 Metabolism
All rights reserved. Usage subject to terms and conditions of license.Koolman, Color Atlas of Biochemistry, 2nd edition © 2005 Thieme

P PA
AP P P
AS
N A
P
PN A
P
P P
P P
P P
P P
P P
P P P P
AS
AS
AP P P
P PA
P P
2
2
C2 C6 C5 C30 C273x 6x
2 CO21 HCOOH
R
NADPH+H
NADP
N A
P
O2 +
H2O + N A
P
N A
Px O2 + x
x H2O + x N A
P
2
2
1
1 2
3
3 4
1C
2
3C
4
CO2
P P
3x H3C C
O
OOC CH2 C CH2
CH3
OH
C
O
OOC CH2 C CH2
CH3
OH
CH2OH
O O
O
O
OOC CH2 C CH2
CH3
OH
CH2OH
OC
H2C
CH3
HO
HO
OOC CH2 C CH2
CH3
OH
CH2 O
Squalene
Acetyl CoA
3-Hydroxy-3-methyl-glutaryl CoA
Mevalonyldiphosphate
Key enzyme
Dimethylallyldiphosphate
Geranyldiphosphate
Farnesyldiphosphate
Lanosterol
Acetyl CoA Mevalonate Isopentenyl diphosphate Squalene Cholesterol
Insulin
Thyroxin
GlucagonCholesterol
Isopentenyl diphosphate
Multiple steps
Isopentenyl diphosphateMevalonate
Mevalonate
Two steps
A. Cholesterol biosynthesis
Cholesterol
Squalene
HMG-CoAreductase1.1.1.34
173Lipid Metabolism
All rights reserved. Usage subject to terms and conditions of license.Koolman, Color Atlas of Biochemistry, 2nd edition © 2005 Thieme

Protein metabolism: overview
Quantitatively, proteins are the most impor-tant group of endogenous macromolecules. Aperson weighing 70 kg contains about 10 kgprotein, with most of it located in muscle. Bycomparison, the proportion made up by othernitrogencontaining compounds is minor. Theorganism’s nitrogen balance is therefore pri-marily determined by protein metabolism.Several hormones—mainly testosterone andcortisol—regulate the nitrogen balance (seep. 374).
A. Protein metabolism: overview
In adults, the nitrogen balance is generally inequilibrium—i. e., the quantities of protein ni-trogen taken in and excreted per day are ap-proximately equal. If only some of the nitro-gen taken in is excreted again, then the bal-ance is positive. This is the case during growth,for example. Negative balances are rare andusually occur due to disease.
Proteins taken up in food are initially bro-ken down in the gastrointestinal tract intoamino acids, which are resorbed and distrib-uted in the organism via the blood (seep. 266). The human body is not capable ofsynthesizing 8–10 of the 20 proteinogenicamino acids it requires (see p. 60). Theseamino acids are essential, and have to be sup-plied from food (see p. 184).
Proteins are constantly being lost via theintestine and, to a lesser extent, via the kid-neys. To balance these inevitable losses, atleast 30 g of protein have to be taken upwith food every day. Although this minimumvalue is barely reached in some countries, inthe industrial nations the protein content offood is usually much higher than necessary.As it is not possible to store amino acids, up to100 g of excess amino acids per day are usedfor biosynthesis or degraded in the liver inthis situation. The nitrogen from this excessis converted into urea (see p. 182) and ex-creted in the urine in this form. The carbonskeletons are used to synthesize carbohy-drates or lipids (see p. 180), or are used toform ATP.
It is thought that adults break down300–400 g of protein per day into aminoacids (proteolysis). On the other hand, ap-proximately the same amount of amino acids
is reincorporated into proteins (protein bio-synthesis). The body’s high level of proteinturnover is due to the fact that many proteinsare relatively short-lived. On average, theirhalf-lives amount to 2–8 days. The key en-zymes of the intermediary metabolism haveeven shorter half-lives. They are sometimesbroken down only a few hours after beingsynthesized, and are replaced by new mole-cules. This constant process of synthesis anddegradation makes it possible for the cells toquickly adjust the quantities, and thereforethe activity, of important enzymes in orderto meet current requirements. By contrast,structural proteins such as the histones, he-moglobin, and the components of the cyto-skeleton are particularly long-lived.
Almost all cells are capable of carrying outbiosynthesis of proteins (top left). The forma-tion of peptide chains by translation at theribosome is described in greater detail onpp. 250–253. However, the functional formsof most proteins arise only after a series ofadditional steps. To begin with, supported byauxiliary proteins, the biologically active con-formation of the peptide chain has to beformed (folding; see pp. 74, 232). Duringsubsequent “post-translational” maturation,many proteins remove part of the peptidechain again and attach additional groups—e. g., oligosaccharides or lipids. These pro-cesses take place in the endoplasmic reticu-lum and in the Golgi apparatus (see p. 232).Finally, the proteins have to be transported totheir site of action (sorting; see p. 228).
Some intracellular protein degradation(proteolysis) takes place in the lysosomes(see p. 234). In addition, there are proteincomplexes in the cytoplasm, known as pro-teasomes, in which incorrectly folded or oldproteins are degraded. These molecules arerecognized by a special marking (see p. 176).The proteasome also plays an important partin the presentation of antigens by immunecells (see p. 296).
174 Metabolism
All rights reserved. Usage subject to terms and conditions of license.Koolman, Color Atlas of Biochemistry, 2nd edition © 2005 Thieme

AP P P
100 g
Prot
ein
synt
hesi
s (3
00–4
00 g
/day
)
Proteolysis (300–400 g/day)Proteasome
Lysosome
Peptide
Intestine
10g/day Kidney
Marking
Degradation
Degradation
50–100 g/day
Degradation
Food50–100 g/day
NH3
CO2, H2O
Ketonebodies
As required
De-novosynthesis
LipidsGlucose
Urea
PyruvatePhosphoenolpyruvate3-Phosphoglycerate2-OxoacidsSugar phosphates
Digestion
Functionalproteins
Maturation
Folding
Translation
50 g/day
Proteinsecretion
Up to 150 g/day
2-Oxo-acids
Excessaminoacids
Aminoacids
A. Protein metabolism: overview
Amino acid pool
Resorption
Sugars
ATP
10 000 g
175Protein Metabolism
All rights reserved. Usage subject to terms and conditions of license.Koolman, Color Atlas of Biochemistry, 2nd edition © 2005 Thieme

Proteolysis
A. Proteolytic enzymes
Combinations of several enzymes with differ-ent specificities are required for completedegradation of proteins into free aminoacids. Proteinases and peptidases are foundnot only in the gastrointestinal tract (seep. 268), but also inside the cell (see below).
The proteolytic enzymes are classified intoendopeptidases and exopeptidases, accordingto their site of attack in the substrate mole-cule. The endopeptidases or proteinases cleavepeptide bonds inside peptide chains. They“recognize” and bind to short sections of thesubstrate’s sequence, and then hydrolyzebonds between particular amino acid residuesin a relatively specific way (see p. 94). Theproteinases are classified according to theirreaction mechanism. In serine proteinases,for example (see C), a serine residue in theenzyme is important for catalysis, while incysteine proteinases, it is a cysteine residue,and so on.
The exopeptidases attack peptides fromtheir termini. Peptidases that act at the Nterminus are known as aminopeptidases,while those that recognize the C terminusare called carboxypeptidases. The dipepti-dases only hydrolyze dipeptides.
B. Proteasome
The functional proteins in the cell have to beprotected in order to prevent premature deg-radation. Some of the intracellularly activeproteolytic enzymes are therefore enclosedin lysosomes (see p. 234). The proteinasesthat act there are also known as cathepsins.Another carefully regulated system for pro-tein degradation is located in the cytoplasm.This consists of large protein complexes (mass2 106 Da), the proteasomes. Proteasomescontain a barrel-shaped core consisting of 28subunits that has a sedimentation coef cient(see p. 200) of 20 S. Proteolytic activity(shown here by the scissors) is localized inthe interior of the 20-S core and is thereforeprotected. The openings in the barrel aresealed by 19-S particles with a complex struc-ture that control access to the core.
Proteins destined for degradation in theproteasome (e. g., incorrectly folded or old
molecules) are marked by covalent linkagewith chains of the small protein ubiquitin.The ubiquitin is previously activated by theintroduction of reactive thioester groups.Molecules marked with ubiquitin (“ubiquiti-nated”) are recognized by the 19S particle,unfolded using ATP, and then shifted intothe interior of the nucleus, where degradationtakes place. Ubiquitin is not degraded, but isreused after renewed activation.
C. Serine proteases
A large group of proteinases contain serine intheir active center. The serine proteases in-clude, for example, the digestive enzymestrypsin, chymotrypsin, and elastase (seepp. 94 and 268), many coagulation factors(see p. 290), and the fibrinolytic enzyme plas-min and its activators (see p. 292).
As described on p. 270, pancreatic protein-ases are secreted as proenzymes (zymogens).Activation of these is also based on proteolyticcleavages. This is illustrated here in detail us-ing the example of trypsinogen, the precursorof trypsin (1). Activation of trypsinogen startswith cleavage of an N-terminal hexapeptideby enteropeptidase (enterokinase), a specificserine proteinase that is located in the mem-brane of the intestinal epithelium. The cleav-age product (β-trypsin) is already catalyticallyactive, and it cleaves additional trypsinogenmolecules at the sites marked in red in theillustration (autocatalytic cleavage). The pre-cursors of chymotrypsin, elastase, and car-boxypeptidase A, among others, are also acti-vated by trypsin.
The active center of trypsin is shown inFig. 2. A serine residue in the enzyme (Ser-195), supported by a histidine residue andan aspartate residue (His-57, Asp-102), nucle-ophilically attacks the bond that is to becleaved (red arrow). The cleavage site in thesubstrate peptide is located on the C-terminalside of a lysine residue, the side chain ofwhich is fixed in a special “binding pocket”of the enzyme (left) during catalysis (seep. 94).
176 Metabolism
All rights reserved. Usage subject to terms and conditions of license.Koolman, Color Atlas of Biochemistry, 2nd edition © 2005 Thieme

H3N
COO
COO
H3N
COO
H3N
A
A
1 2
A. Proteolytic enzymes
C. Serine proteasesB. Proteasome
Amino acid residue
Serine proteinase3.4.21.nCysteine proteinase3.4.22.nAspartate proteinase3.4.23.nMetalloproteinase3.4.24.n
Aminopeptidase[Zn2 ] 3.4.11.n
Carboxy-peptidase3.4.17.n
Dipeptidase[Zn2 ] 3.4.13.n
C-Terminus
N-Terminus
Exopeptidase
Endopeptidase
Foldedprotein
Activatedubiquitin
Ubiquitinatedprotein
19 Sparticle
20 Snucleus
19 Sparticle
Activationofubiquitin
Markingwithubiquitin
Unfolding
Binding
Degradation
Disulfidebond
Autocatalyticcleavage
Auto-cata-lyticcleavage
1. Trypsinogen activation
2. Trypsin: active center
Activecenter
Cleavageby entero-peptidaseand trypsin
Ser-195
Enteropeptidase3.4.21.9
Trypsin3.4.21.4
Asp-102
Lysine residue
His-57
Substrate
177Protein Metabolism
All rights reserved. Usage subject to terms and conditions of license.Koolman, Color Atlas of Biochemistry, 2nd edition © 2005 Thieme

Transamination and deamination
Amino nitrogen accumulates during proteindegradation. In contrast to carbon, amino ni-trogen is not suitable for oxidative energyproduction. If they are not being reused forbiosynthesis, the amino groups of amino acidsare therefore incorporated into urea (seep. 182) and excreted in this form.
A. Transamination and deamination
Among the NH2 transfer reactions, trans-aminations (1) are particularly important.They are catalyzed by transaminases, and oc-cur in both catabolic and anabolic amino acidmetabolism. During transamination, theamino group of an amino acid (amino acid1) is transferred to a 2-oxoacid (oxoacid 2).From the amino acid, this produces a 2-oxo-acid (a), while from the original oxoacid, anamino acid is formed (b). The NH2 group istemporarily taken over by enzyme-boundpyridoxal phosphate (PLP; see p. 106), whichthus becomes pyridoxamine phosphate.
If the NH2 is released as ammonia, theprocess is referred to as deamination. Thereare different mechanisms for this (see p. 180).A particularly important one is oxidativedeamination (2). In this reaction, the α-aminogroup is initially oxidized into an imino group(2a), and the reducing equivalents are trans-ferred to NAD+ or NADP+. In the second step,the imino group is then cleaved by hydrolysis.As in transamination, this produces a 2-oxo-acid (C). Oxidative deamination mainly takesplace in the liver, where glutamate is brokendown in this way into 2-oxoglutarate andammonia, catalyzed by glutamate dehydro-genase. The reverse reaction initiates biosyn-thesis of the amino acids in the glutamatefamily (see p. 184).
B. Mechanism of transamination
In the absence of substrates, the aldehydegroup of pyridoxal phosphate is covalentlybound to a lysine residue of the transaminase(1). This type of compound is known as analdimine or “Schiff’s base.” During the reac-tion, amino acid 1 (A, 1a) displaces the lysineresidue, and a new aldimine is formed (2). Thedouble bond is then shifted by isomerization.
The ketimine (3) is hydrolyzed to yield the 2-oxoacid and pyridoxamine phosphate (4).
In the second part of the reaction (see A,1b), these steps take place in the oppositedirection: pyridoxamine phosphate and thesecond 2-oxoacid form a ketimine, which isisomerized into aldimine. Finally, the secondamino acid is cleaved and the coenzyme isregenerated.
C. NH3 metabolism in the liver
In addition to urea synthesis itself (seep. 182), the precursors NH3 and aspartate arealso mainly formed in the liver. Amino nitro-gen arising in tissue is transported to the liverby the blood, mainly in the form of glutamine(Gln) and alanine (Ala; see p. 338). In the liver,Gln is hydrolytically deaminated by glutami-nase [3] into glutamate (Glu) and NH3. Theamino group of the alanine is transferred byalanine transaminase [1] to 2-oxoglutarate (2-OG; formerly known as α-ketoglutarate). Thistransamination (A) produces another gluta-mate. NH3 is finally released from glutamateby oxidative deamination (A). This reaction iscatalyzed by glutamate dehydrogenase [4], atypical liver enzyme. Aspartate (Asp), the sec-ond amino group donor in the urea cycle, alsoarises from glutamate. The aspartatetransaminase [2] responsible for this reactionis found with a high level of activity in theliver, as is alanine transaminase [1].
Transaminases are also found in other tis-sues, from which they leak from the cells intothe blood when injury occurs. Measurementof serum enzyme activity (serum enzyme di-agnosis; see also p. 98) is an importantmethod of recognizing and monitoring thecourse of such injuries. Transaminase activityin the blood is for instance important for di-agnosing liver disease (e. g., hepatitis) andmyocardial disease (cardiac infarction).
178 Metabolism
All rights reserved. Usage subject to terms and conditions of license.Koolman, Color Atlas of Biochemistry, 2nd edition © 2005 Thieme

2.
3.
a
b
H2O
PLP
b
a
NH4
1.
H
4.
H2O
Ala
Glu
Gln
Asp
Pyr
2-OG
OAA
NH3N
A
NA
3
1
4
NH3
4
3
2
1
22
P
N A
P
N A
C H
R1
CO O
H3N
H3N
C H
R2
CO O
H3NC
R2
CO O
O
C H
R2
CO O
H3N C
R2
CO O
H2N
C
R2
CO O
O
OOC C R
H
NH3
OOC C R
H
NH
O
C
N
H
O
PH3C
H
NH
O
C
N
H
O
PH3C
H
HO
CH2
N
O
PH3C
H
NH2
OOCC
R
NH
O
CH2
N
O
PH3C
H
OOC C R
O
C
R1
CO O
O
A. Transamination and deamination
Amino acid 1 Oxoacid 1
Pyridoxaminephosphate
Oxoacid 2 Amino acid 2
1. Transamination
Imino acid
Oxoacid
2. Oxidative deamination
Aldimine 2
PLP (Aldimine 1)
Ketimine
Oxoacid Pyridoxamine-P
Alanine trans-aminase [PLP]2.6.1.2
Aspartate trans-aminase [PLP]2.6.1.1
Glutaminase3.5.1.2
Glutamatedehydrogenase1.4.1.2
Transamination
Oxidativedeamination
Hydrolyticdeamination
Urea cycle,bio-syntheses
Urea cycle
Fromtheblood
From
theblood
B. Mechanism of transamination
Amino acid
Aldimine 2
Lysine residue
Rearrangement
Aminoacid
Enzy
me
C. NH3 metabolism in the liver
179Protein Metabolism
All rights reserved. Usage subject to terms and conditions of license.Koolman, Color Atlas of Biochemistry, 2nd edition © 2005 Thieme

Amino acid degradation
A large number of metabolic pathways areavailable for amino acid degradation, and anoverview of these is presented here. Furtherdetails are given on pp. 414 and 415.
A. Amino acid degradation : overview
During the degradation of most amino acids,the α-amino group is initially removed bytransamination or deamination. Variousmechanisms are available for this, and theseare discussed in greater detail in B. The carbonskeletons that are left over after deaminationundergo further degradation in various ways.
During degradation, the 20 proteinogenicamino acids produce only seven differentdegradation products (highlighted in pinkand violet). Five of these metabolites (2-oxo-glutarate, succinyl CoA, fumarate, oxaloace-tate, and pyruvate) are precursors for gluco-neogenesis and can therefore be convertedinto glucose by the liver and kidneys (seep. 154). Amino acids whose degradation sup-plies one of these five metabolites are there-fore referred to as glucogenic amino acids.The first four degradation products listed arealready intermediates in the tricarboxylic acidcycle, while pyruvate can be converted intooxaloacetate by pyruvate carboxylase and thusmade available for gluconeogenesis (greenarrow).
With two exceptions (lysine and leucine;see below), all of the proteinogenic aminoacids are also glucogenic. Quantitatively,they represent the most important precursorsfor gluconeogenesis. At the same time, theyalso have an anaplerotic effect—i. e., they re-plenish the tricarboxylic acid cycle in order tofeed the anabolic reactions that originate in it(see p. 138).
Two additional degradation products (ace-toacetate and acetyl CoA) cannot be chan-neled into gluconeogenesis in animal metab-olism, as there is no means of convertingthem into precursors of gluconeogenesis.However, they can be used to synthesize ke-tone bodies, fatty acids, and isoprenoids.Amino acids that supply acetyl CoA or aceto-acetate are therefore known as ketogenicamino acids. Only leucine and lysine arepurely ketogenic. Several amino acids yielddegradation products that are both glucogenic
and ketogenic. This group includes phenylala-nine, tyrosine, tryptophan, and isoleucine.
Degradation of acetoacetate to acetyl CoAtakes place in two steps (not shown). First,acetoacetate and succinyl CoA are convertedinto acetoacetyl CoA and succinate (enzyme:3-oxoacid-CoA transferase 2.8.3.5). AcetoacetylCoA is then broken down by β-oxidation intotwo molecules of acetyl CoA (see p. 164),while succinate can be further metabolizedvia the tricarboxylic acid cycle.
B. Deamination
There are various ways of releasing ammonia(NH3) from amino acids, and these are illus-trated here using the example of the aminoacids glutamine, glutamate, alanine, and ser-ine.
[1] In the branched-chain amino acids (Val,Leu, Ile) and also tyrosine and ornithine, deg-radation starts with a transamination. For ala-nine and aspartate, this is actually the onlydegradation step. The mechanism of transa-mination is discussed in detail on p. 178.
[2] Oxidative deamination, with the forma-tion of NADH+H+, only applies to glutamate inanimal metabolism. The reaction mainly takesplace in the liver and releases NH3 for ureaformation (see p. 178).
[3] Two amino acids—asparagine and glu-tamine—contain acid–amide groups in theside chains, from which NH3 can be releasedby hydrolysis (hydrolytic deamination). In theblood, glutamine is the most important trans-port molecule for amino nitrogen. Hydrolyticdeamination of glutamine in the liver alsosupplies the urea cycle with NH3.
[4] Eliminating deamination takes place inthe degradation of histidine and serine. H2O isfirst eliminated here, yielding an unsaturatedintermediate. In the case of serine, this inter-mediate is first rearranged into an imine (notshown), which is hydrolyzed in the secondstep into NH3 and pyruvate, with H2O beingtaken up. H2O does not therefore appear inthe reaction equation.
180 Metabolism
All rights reserved. Usage subject to terms and conditions of license.Koolman, Color Atlas of Biochemistry, 2nd edition © 2005 Thieme

COO
)(CH2 2
COO
C HH3N
2-OG Glu
Ala
Gln
Ser
H2O
Pyr
4
3
2
1
N A N ANH4
NH4
4
3
2
1
H3
H3N C
C
COO
CO
)(CH2 2
H2
COO
C HH3N
N
H3N H
H2 OH
C
C
COO
H3
C
C
COO
O
)
C
(CH2
COO
COO
O
2
NADH+H NAD
H
B. Deamination
Transamination Hydrolytic deamination
Oxidative deamination Eliminating deamination
Glucogenic
KetogenicGlucogenicand ketogenic
Glutamate dehydrogenase 1.4.1.2 Serine dehydratase [PLP] 4.2.1.13
Glutaminase 3.5.1.2Alanine transaminase [PLP] 2.6.1.2
A. Amino acid degradation: overview
Ketonebody
Pyruvate
Alanine
Cysteine
Asparagine
Aspartate
Serine
Aceto-acetate
Threonine
Glycine
Leucine
Cysteine
Tyrosine
Phenyl-alanine
Glutamate
Glutamine
Arginine
Proline
Histidine
Tryptophan
AcetylCoA
Severalpathways
Lysine
Valine
Iso-leucine
Methionine
2-Oxo-glutarateSuccinyl
CoA
Fuma-rate
Oxalo-acetate
AcetylCoA
Serine
Pyruvate
Glucose
PropionylCoA
Pyruvate
Alanine
Tricarboxylicacid cycle
181Protein Metabolism
All rights reserved. Usage subject to terms and conditions of license.Koolman, Color Atlas of Biochemistry, 2nd edition © 2005 Thieme

Urea cycle
Amino acids are mainly broken down in theliver. Ammonia is released either directly orindirectly in the process (see p. 178). The deg-radation of nucleobases also provides signifi-cant amounts of ammonia (see p. 186).
Ammonia (NH3) is a relatively strong base,and at physiological pH values it is mainlypresent in the form of the ammonium ionNH4
+ (see p. 30). NH3 and NH4+ are toxic, and
at higher concentrations cause brain damagein particular. Ammonia therefore has to beeffectively inactivated and excreted. This canbe carried out in various ways. Aquatic ani-mals can excrete NH4
+ directly. For example,fish excrete NH4
+ via the gills (ammonotelicanimals). Terrestrial vertebrates, includinghumans, hardly excrete any NH3, and instead,most ammonia is converted into urea beforeexcretion (ureotelic animals). Birds and rep-tiles, by contrast, form uric acid, which ismainly excreted as a solid in order to savewater (uricotelic animals).
The reasons for the neurotoxic effects ofammonia have not yet been explained. Itmay disturb the metabolism of glutamateand its precursor glutamine in the brain (seep. 356).
A. Urea cycle
Urea (H2N–CO–NH2) is the diamide of car-bonic acid. In contrast to ammonia, it is neu-tral and therefore relatively non-toxic. Thereason for the lack of basicity is the molecule’smesomeric characteristics. The free electronpairs of the two nitrogen atoms are delocal-ized over the whole structure, and are there-fore no longer able to bind protons. As a small,uncharged molecule, urea is able to cross bio-logical membranes easily. In addition, it iseasily transported in the blood and excretedin the urine.
Urea is produced only in the liver, in a cyclicsequence of reactions (the urea cycle) thatstarts in the mitochondria and continues inthe cytoplasm. The two nitrogen atoms arederived from NH4
+ (the second has previouslybeen incorporated into aspartate; see below).The keto group comes from hydrogen carbo-nate (HCO3
–), or CO2 that is in equilibriumwith HCO3
–.
[1] In the first step, carbamoyl phosphate isformed in the mitochondria from hydrogencarbonate (HCO3
–) and NH4+, with two ATP
molecules being consumed. In this com-pound, the carbamoyl residue (–O–CO–NH2)is at a high chemical potential. In hepaticmitochondria, enzyme [1] makes up about20% of the matrix proteins.
[2] In the next step, the carbamoyl residueis transferred to the non-proteinogenic aminoacid ornithine, converting it into citrulline,which is also non-proteinogenic. This ispassed into the cytoplasm via a transporter.
[3] The second NH2 group of the later ureamolecule is provided by aspartate, whichcondenses with citrulline into argininosucci-nate. ATP is cleaved into AMP and diphos-phate (PPi) for this endergonic reaction. Toshift the equilibrium of the reaction to theside of the product, diphosphate is removedfrom the equilibrium by hydrolysis.
[4] Cleavage of fumarate from argininosuc-cinate leads to the proteinogenic amino acidarginine, which is synthesized in this way inanimal metabolism.
[5] In the final step, isourea is releasedfrom the guanidinium group of the arginineby hydrolysis (not shown), and is immedi-ately rearranged into urea. In addition, orni-thine is regenerated and returns via the orni-thine transporter into the mitochondria,where it becomes available for the cycleonce again.
The fumarate produced in step [4] is con-verted via malate to oxaloacetate [6, 7], fromwhich aspartate is formed again by transami-nation [9]. The glutamate required for reac-tion [9] is derived from the glutamate dehy-drogenase reaction [8], which fixes the sec-ond NH4
+ in an organic bond. Reactions [6]and [7] also occur in the tricarboxylic acidcycle. However, in urea formation they takeplace in the cytoplasm, where the appropriateisoenzymes are available.
The rate of urea formation is mainly con-trolled by reaction [1]. N-acetyl glutamate, asan allosteric effector, activates carbamoyl-phosphate synthase. In turn, the concentrationof acetyl glutamate depends on arginine andATP levels, as well as other factors.
182 Metabolism
All rights reserved. Usage subject to terms and conditions of license.Koolman, Color Atlas of Biochemistry, 2nd edition © 2005 Thieme

NH4
AP P P
P
N A
N AN A
PP
AP
APP
P
AP P P
2
1 3
4
5
6
7
8
91
2
7
2 2
6
8
HCO3
NH4
H2O
P
4
3
9
5
H2O
COO
C
CH2
CH2
CH2
NCH
HH3N
NH2
HN
C
H
COOCH2OOC
C
H2N
O NH2
H2O
COO
C
C
COO
H
H
COO
C
CH2
CH2
CH2
N
H
HH
HH3N
COO
C
CH2
CH2
CH2
NCH
HH3N
NH2
H2N
CNH2
OCOO
C
CH2
CH2
CH2
NCH
HH3N
NH2
O
COO
CH2
C
COO
H OHCOO
CH2
C
COO
O
CH2
CH2
C
COO
NH3
COO
H
CH2
CH2
C
COO
O
COO
COO
CH2
C
COO
NH3H
Transporter
Ornithine carbamoyltransferase 2.1.3.3
Carbamoyl phosphate synthase (NH3)6.3.4.16
Argininosuccinate synthase 6.3.4.5
Argininosuccinate lyase 4.3.2.1
Arginase 3.5.3.1
Fumarate hydratase 4.2.1.2
Malate dehydrogenase 1.1.1.37
Glutamate dehydrogenase 1.4.1.2
Aspartate transaminase [PLP]
Cyt
opla
smM
itoc
hond
rion
A. Urea cycle
Urea
Carbamoylphosphate
Ornithine Citrulline
Arginine
MalateGlutamate
Oxaloacetate
Aspartate
N-Acetylglutamate
Arginino-succinate
Fumarate
2-Oxo-glutarate
183Protein Metabolism
All rights reserved. Usage subject to terms and conditions of license.Koolman, Color Atlas of Biochemistry, 2nd edition © 2005 Thieme

Amino acid biosynthesis
A. Symbiotic nitrogen fixation
Practically unlimited quantities of elementarynitrogen (N2) are present in the atmosphere.However, before it can enter the natural nitro-gen cycle, it has to be reduced to NH3 andincorporated into amino acids (“fixed”). Onlya few species of bacteria and bluegreen algaeare capable of fixing atmospheric nitrogen.These exist freely in the soil, or in symbiosiswith plants. The symbiosis between bacteriaof the genus Rhizobium and legumes(Fabales)—such as clover, beans, and peas—isof particular economic importance. Theseplants are high in protein and are thereforenutritionally valuable.
In symbiosis with Fabales, bacteria live asbacteroids in root nodules inside the plantcells. The plant supplies the bacteroids withnutrients, but it also benefits from the fixednitrogen that the symbionts make available.
The N2-fixing enzyme used by the bacteriais nitrogenase. It consists of two components:an Fe protein that contains an [Fe4S4] clusteras a redox system (see p. 106), accepts elec-trons from ferredoxin, and donates them tothe second component, the Fe–Mo protein.This molybdenum-containing protein trans-fers the electrons to N2 and thus, via variousintermediate steps, produces ammonia (NH3).Some of the reducing equivalents are trans-ferred in a side-reaction to H+. In addition toNH3, hydrogen is therefore always producedas well.
B. Amino acid biosynthesis: overview
The proteinogenic amino acids (see p. 60) canbe divided into five families in relation totheir biosynthesis. The members of each fam-ily are derived from common precursors,which are all produced in the tricarboxylicacid cycle or in catabolic carbohydrate metab-olism. An overview of the biosynthetic path-ways is shown here; further details are givenon pp. 412 and 413.
Plants and microorganisms are able to syn-thesize all of the amino acids from scratch, butduring the course of evolution, mammalshave lost the ability to synthesize approxi-mately half of the 20 proteinogenic aminoacids. These essential amino acids therefore
have to be supplied in food. For example,animal metabolism is no longer capable ofcarrying out de-novo synthesis of the aro-matic amino acids (tyrosine is only non-es-sential because it can be formed from phenyl-alanine when there is an adequate supplyavailable). The branched-chain amino acids(valine, leucine, isoleucine, and threonine) aswell as methionine and lysine, also belong tothe essential amino acids. Histidine and argi-nine are essential in rats; whether the sameapplies in humans is still a matter of debate. Asupply of these amino acids in food appears tobe essential at least during growth.
The nutritional value of proteins (seep. 360) is decisively dependent on their es-sential amino acid content. Vegetable pro-teins—e. g., those from cereals—are low in ly-sine and methionine, while animal proteinscontain all the amino acids in balanced pro-portions. As mentioned earlier, however,there are also plants that provide high-valueprotein. These include the soy bean, one of theplants that is supplied with NH3 by symbioticN2 fixers (A).
Non-essential amino acids are those thatarise by transamination from 2-oxoacids inthe intermediary metabolism. These belongto the glutamate family (Glu, Gln, Pro, Arg,derived from 2-oxoglutarate), the aspartatefamily (only Asp and Asn in this group, de-rived from oxaloacetate), and alanine, whichcan be formed by transamination from pyru-vate. The amino acids in the serine family (Ser,Gly, Cys) and histidine, which arise from in-termediates of glycolysis, can also be synthe-sized by the human body.
184 Metabolism
All rights reserved. Usage subject to terms and conditions of license.Koolman, Color Atlas of Biochemistry, 2nd edition © 2005 Thieme

4
2
per
8 H
N2
H2
P PA
AP P P
P
N A
N A
2 NH3
2
4
e
*
**
*
*
**
*
*
Vascular bundle
Rootnodule
BacteroidsFerredoxin
Fe-Protein[Fe4S4]
Nitrogenase1.18.6.1
Iron-molyb-denumcofactor
Host cell
FeMo-Protein[Fe4S4], [FeMoCo]
Air
Soil
N2
Ammonia
A. Symbiotic nitrogen fixation
B. Amino acid biosynthesis: overview
Serine family
Pentose phos-phate pathway
Aromaticfamily
Serine
Ornithine
Essential amino acid
Pyruvate family
Aspartate family
Glutamate family
Cysteine
3-Phospho-glycerate
Glucose 6-phosphate
Glutamate
Serine Erythrose4-phosphate
Proline Arginine
Glutamine
Ribose 5-phosphate
Phenyl-alanine
Trypto-phan
Tyrosine
Synthesized fromphenylalanine
HistidineValine
Leucine
AsparagineLysine
Threo-nine
Iso-leucine
Methionine
Aspar-tate
Phospho-enolpyruvate
Urea cycle
Glyco-lysis
Reductive aminationTransamination
Oxalo-acetate
2 NH3
2-Oxo-glutarat
Glycine
Alanine
Pyruvate
NH3
NH3
Tricarboxylicacid cycle
185Protein Metabolism
All rights reserved. Usage subject to terms and conditions of license.Koolman, Color Atlas of Biochemistry, 2nd edition © 2005 Thieme

Nucleotide degradation
The nucleotides are among the most complexmetabolites. Nucleotide biosynthesis is elab-orate and requires a high energy input (seep. 188). Understandably, therefore, bases andnucleotides are not completely degraded, butinstead mostly recycled. This is particularlytrue of the purine bases adenine and guanine.In the animal organism, some 90% of thesebases are converted back into nucleosidemonophosphates by linkage with phosphori-bosyl diphosphate (PRPP) (enzymes [1] and[2]). The proportion of pyrimidine bases thatare recycled is much smaller.
A. Degradation of nucleotides
The principles underlying the degradation ofpurines (1) and pyrimidines (2) differ. In thehuman organism, purines are degraded intouric acid and excreted in this form. The purinering remains intact in this process. In contrast,the ring of the pyrimidine bases (uracil, thy-mine, and cytosine) is broken down into smallfragments, which can be returned to the me-tabolism or excreted (for further details, seep. 419).
Purine (left). The purine nucleotide guano-sine monophosphate (GMP, 1) is degraded intwo steps—first to the guanosine and then toguanine (Gua). Guanine is converted by de-amination into another purine base, xanthine.
In the most important degradative path-way for adenosine monophosphate (AMP), itis the nucleotide that deaminated, and inosinemonophosphate (IMP) arises. In the same wayas in GMP, the purine base hypoxanthine isreleased from IMP. A single enzyme, xanthineoxidase [3], then both converts hypoxanthineinto xanthine and xanthine into uric acid. Anoxo group is introduced into the substrate ineach of these reaction steps. The oxo group isderived from molecular oxygen; another reac-tion product is hydrogen peroxide (H2O2),which is toxic and has to be removed byperoxidases.
Almost all mammals carry out further deg-radation of uric acid with the help of uricase,with further opening of the ring to allantoin,which is then excreted. However, the pri-mates, including humans, are not capable ofsynthesizing allantoin. Uric acid is thereforethe form of the purines excreted in these
species. The same applies to birds and manyreptiles. Most other animals continue purinedegradation to reach allantoic acid or ureaand glyoxylate.
Pyrimidine (right). In the degradation ofpyrimidine nucleotides (2), the free bases ura-cil (Ura) and thymine (Thy) are initially re-leased as important intermediates. Both arefurther metabolized in similar ways. The pyri-midine ring is first reduced and then hydro-lytically cleaved. In the next step, -alaninearises by cleavage of CO2 and NH3 as thedegradation product of uracil. When there isfurther degradation, -alanine is brokendown to yield acetate, CO2, and NH3. Propio-nate, CO2, and NH3 arise in a similar way from
-aminoisobutyrate, the degradation productof thymine (see p. 419).
B. Hyperuricemia
The fact that purine degradation in humansalready stops at the uric acid stage can lead toproblems, since—in contrast to allantoin—uricacid is poorly soluble in water. When largeamounts of uric acid are formed or uric acidprocessing is disturbed, excessive concentra-tions of uric acid can develop in the blood(hyperuricemia). This can result in the accu-mulation of uric acid crystals in the body.Deposition of these crystals in the joints cancause very painful attacks of gout.
Most cases of hyperuricemia are due todisturbed uric acid excretion via the kidneys(1). A high-purine diet (e. g., meat) may alsohave unfavorable effects (2). A rare hereditarydisease, Lesch–Nyhan syndrome, results froma defect in hypoxanthine phosphoribosyl-transferase (A, enzyme [1]). The impaired re-cycling of the purine bases caused by thisleads to hyperuricemia and severe neurolog-ical disorders.
Hyperuricemia can be treated withallopurinol, a competitive inhibitor of xan-thine oxidase. This substrate analogue differsfrom the substrate hypoxanthine only in thearrangement of the atoms in the 5-ring.
186 Metabolism
All rights reserved. Usage subject to terms and conditions of license.Koolman, Color Atlas of Biochemistry, 2nd edition © 2005 Thieme

1. 2.
GMP AMP
H2O
NH3
IMP
Rib
UMP dTMP
Ura Thy
NH3,CO2
N A
P
PA
PG
PU
PC
PT
G
P
P P
PI
P
N A
P
N A
P
N A
P
I
1
2
1
PRPP
PRPP
PRPP
3
2
3
CMP
Gua
H2O
Ade
NH3
H2O
Rib
P
P
H2O2O2
H2O
3 H2O
H2O H2O
NH3,CO2
H2O
H2O2
O2H2O
1
2a
1
2
Gua
AMP
IMP
GMP
1
2b
2b
Ade
2b
P P
HN
CNH
C
CC
NH
CHN
O
O
HN
CNH
C
CC
NH
C
HN
O
O
O
H2N
CNH
C
C
NH
C
HN
O
O
H
O
HN
HCN
C
CC
NH
CHN
O
HN
CNH
CH2
CC
O
O
H
R
H2N
CNH
CH2
C
O
R
COO
H
C
CH2
NH3
COO
H R
HN
HCN
C
CC
NH
N
HC
O
Purine nucleotides Pyrimidine nucleotides
Adenine
Guanine
Xanthine (Xan) Hypoxanthine (Hyp)
Uric acid
Excretedby primates,birds, andreptiles
Allantoin
Excretedby mostmammals
Allantoic acid 2 Urea +glyoxylate
Adenine phosphoribosyl-transferase 2.4.2.7
Xanthine oxidase [Fe, Mo, FAD] 1.1.3.22
UracilFreebases
Thymine
β-Alanine(R = H)
β-Amino-isobutyrate(R = CH3)
Dihydro-uracil(R = H)
Dihydro-thymine(R = CH3)
N-Carbamoylβ-alanine(R = H)
N-Carbamoylβ-amino-isobutyrate(R = CH3)
Phospho-ribosyldiphos-phate
Hypoxanthine phosphoribosyl-transferase 2.4.2.8
A. Degradation of nucleotides
Recyclingreactions
Disturbed uricacid excretion
Elevated uric acidformation
a) Unbalanceda) nutrition
b) Impairedb) recycling ofb) purine bases
Allopurinol
Causes:
Xanthine Hypo-xanthine
Allopurinol
Uricacid
B. Hyperuricemia (gout)
187Nucleotide Metabolism
All rights reserved. Usage subject to terms and conditions of license.Koolman, Color Atlas of Biochemistry, 2nd edition © 2005 Thieme
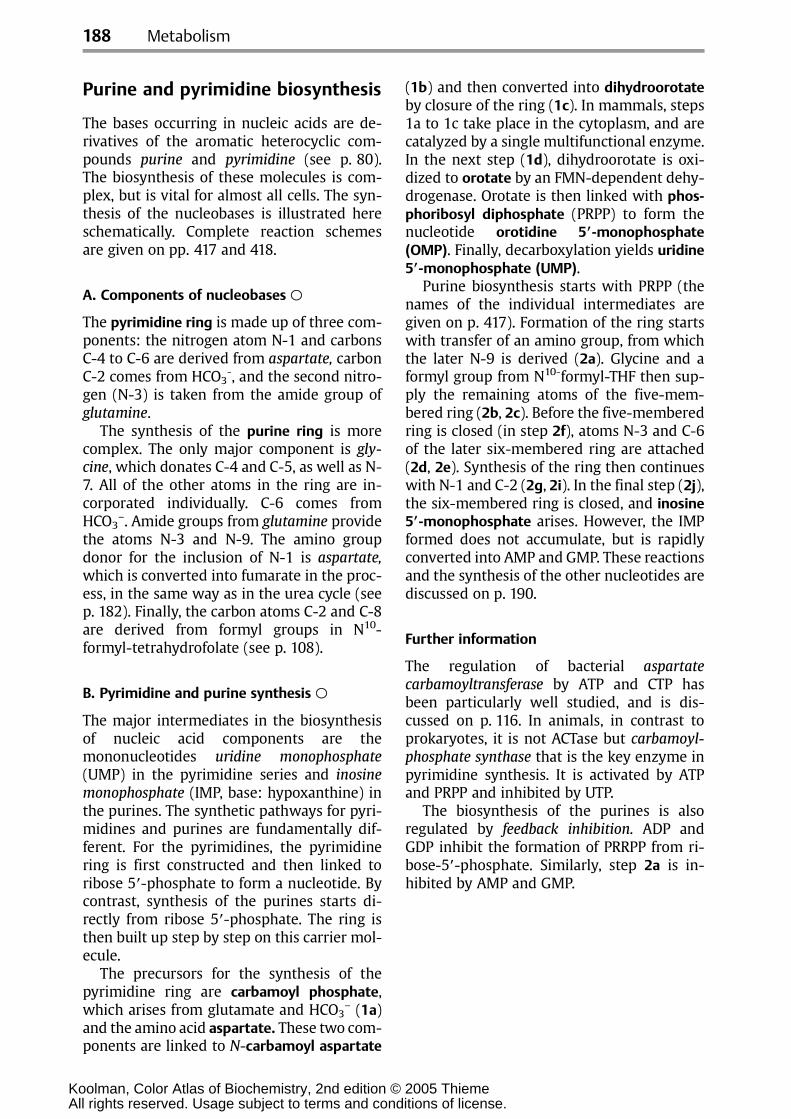
Purine and pyrimidine biosynthesis
The bases occurring in nucleic acids are de-rivatives of the aromatic heterocyclic com-pounds purine and pyrimidine (see p. 80).The biosynthesis of these molecules is com-plex, but is vital for almost all cells. The syn-thesis of the nucleobases is illustrated hereschematically. Complete reaction schemesare given on pp. 417 and 418.
A. Components of nucleobases
The pyrimidine ring is made up of three com-ponents: the nitrogen atom N-1 and carbonsC-4 to C-6 are derived from aspartate, carbonC-2 comes from HCO3
-, and the second nitro-gen (N-3) is taken from the amide group ofglutamine.
The synthesis of the purine ring is morecomplex. The only major component is gly-cine, which donates C-4 and C-5, as well as N-7. All of the other atoms in the ring are in-corporated individually. C-6 comes fromHCO3
–. Amide groups from glutamine providethe atoms N-3 and N-9. The amino groupdonor for the inclusion of N-1 is aspartate,which is converted into fumarate in the proc-ess, in the same way as in the urea cycle (seep. 182). Finally, the carbon atoms C-2 and C-8are derived from formyl groups in N10-formyl-tetrahydrofolate (see p. 108).
B. Pyrimidine and purine synthesis
The major intermediates in the biosynthesisof nucleic acid components are themononucleotides uridine monophosphate(UMP) in the pyrimidine series and inosinemonophosphate (IMP, base: hypoxanthine) inthe purines. The synthetic pathways for pyri-midines and purines are fundamentally dif-ferent. For the pyrimidines, the pyrimidinering is first constructed and then linked toribose 5-phosphate to form a nucleotide. Bycontrast, synthesis of the purines starts di-rectly from ribose 5-phosphate. The ring isthen built up step by step on this carrier mol-ecule.
The precursors for the synthesis of thepyrimidine ring are carbamoyl phosphate,which arises from glutamate and HCO3
– (1a)and the amino acid aspartate. These two com-ponents are linked to N-carbamoyl aspartate
(1b) and then converted into dihydroorotateby closure of the ring (1c). In mammals, steps1a to 1c take place in the cytoplasm, and arecatalyzed by a single multifunctional enzyme.In the next step (1d), dihydroorotate is oxi-dized to orotate by an FMN-dependent dehy-drogenase. Orotate is then linked with phos-phoribosyl diphosphate (PRPP) to form thenucleotide orotidine 5-monophosphate(OMP). Finally, decarboxylation yields uridine5-monophosphate (UMP).
Purine biosynthesis starts with PRPP (thenames of the individual intermediates aregiven on p. 417). Formation of the ring startswith transfer of an amino group, from whichthe later N-9 is derived (2a). Glycine and aformyl group from N10-formyl-THF then sup-ply the remaining atoms of the five-mem-bered ring (2b, 2c). Before the five-memberedring is closed (in step 2f), atoms N-3 and C-6of the later six-membered ring are attached(2d, 2e). Synthesis of the ring then continueswith N-1 and C-2 (2g, 2i). In the final step (2j),the six-membered ring is closed, and inosine5-monophosphate arises. However, the IMPformed does not accumulate, but is rapidlyconverted into AMP and GMP. These reactionsand the synthesis of the other nucleotides arediscussed on p. 190.
Further information
The regulation of bacterial aspartatecarbamoyltransferase by ATP and CTP hasbeen particularly well studied, and is dis-cussed on p. 116. In animals, in contrast toprokaryotes, it is not ACTase but carbamoyl-phosphate synthase that is the key enzyme inpyrimidine synthesis. It is activated by ATPand PRPP and inhibited by UTP.
The biosynthesis of the purines is alsoregulated by feedback inhibition. ADP andGDP inhibit the formation of PRRPP from ri-bose-5-phosphate. Similarly, step 2a is in-hibited by AMP and GMP.
188 Metabolism
All rights reserved. Usage subject to terms and conditions of license.Koolman, Color Atlas of Biochemistry, 2nd edition © 2005 Thieme

N
1d 1e 1f
2a
2b 2c 2d
2e,2f
2i 2j
N
C
C
NC
C
C
N
CN
CN
C
CC
N
CN
C
C
CN
CN
C
C
N
N
C
C
CN
C
C
N
N
C
C
N
N
C
NC
C
N
N
C
C
NC
C
N
N
C
CN
NC
C
N
N
C
CN
CN
C
C
N
N
C
CN
CN
C
C
2g,2h
1a
1b 1cP R P R
P P PR[NH2]
HCO3
O P
P RP RP RP R
P P PR
P R =
P R
CN
CN
C
C
C
C C
C
C
P R P R P R
THF
CN
CN
C
C
CN
CN
C
C
N
N
C
THF
THF
THF
COO
H2CNH3
H3N
OOCCH2
CH COO
1a
1
2g2h
2f
2b
CHO2i
2c
2a2d
[NH2]
HCO3
Asp
[NH2]
[NH2]
Gln
Glu
Gln Glu Gln Glu
[NH2]
[CHO]
[CHO] OHCN10
HCO3
1
2
34
56 7
8
9
1
2
3
4
5
6
N10
OCH2O
OH OH
HHH H
P5'
1'
OCH2O
OH OH
H
N
HH H
P
CH
CHC
HN
CO
O
OCH2O
OH OH
HHH H
P
C
CN
HC
HNC
NCH
N
O
Carbamoylphosphate
Phosphoribosyldiphosphate
Dihydro-orotate
Orotate 5'-mono-phosphate
Uridine 5'-mono-phosphate (UMP)
Phosphoribosyldiphosphate
5'-Phosphoribosyl residueGlycine
2. Purines
Inosine 5'-mono-phosphate (IMP)
A. Components of nucleobases
B. Pyrimidine and purine synthesis
PyrimidineAspartate
Glycine
Purine
N-Carbamoylaspartate
UMP
IMP
Aspartate
1. Pyrimidines
Fumarate
189Nucleotide Metabolism
All rights reserved. Usage subject to terms and conditions of license.Koolman, Color Atlas of Biochemistry, 2nd edition © 2005 Thieme

Nucleotide biosynthesis
De novo synthesis of purines and pyrimidinesyields the monophosphates IMP and UMP,respectively (see p. 188). All other nucleotidesand deoxynucleotides are synthesized fromthese two precursors. An overview of thepathways involved is presented here; furtherdetails are given on p. 417. Nucleotide syn-thesis by recycling of bases (the salvage path-way) is discussed on p. 186.
A. Nucleotide synthesis: overview
The synthesis of purine nucleotides (1) startsfrom IMP. The base it contains, hypoxanthine,is converted in two steps each into adenine orguanine. The nucleoside monophosphatesAMP and GMP that are formed are then phos-phorylated by nucleoside phosphate kinases toyield the diphosphates ADP and GDP, andthese are finally phosphorylated into thetriphosphates ATP and GTP. The nucleosidetriphosphates serve as components for RNA,or function as coenzymes (see p. 106). Con-version of the ribonucleotides into deoxyribo-nucleotides occurs at the level of the diphos-phates and is catalyzed by nucleoside diphos-phate reductase (B).
The biosynthetic pathways for the pyrimi-dine nucleotides (2) are more complicated.The first product, UMP, is phosphorylated firstto the diphosphate and then to thetriphosphate, UTP. CTP synthase then convertsUTP into CTP. Since pyrimidine nucleotidesare also reduced to deoxyribonucleotides atthe diphosphate level, CTP first has to be hy-drolyzed by a phosphatase to yield CDP beforedCDP and dCTP can be produced.
The DNA component deoxythymidine tri-phosphate (dTTP) is synthesized from UDP inseveral steps. The base thymine, which onlyoccurs in DNA (see p. 80), is formed by meth-ylation of dUMP at the nucleoside monophos-phate level. Thymidylate synthase and itshelper enzyme dihydrofolate reductase areimportant target enzymes for cytostatic drugs(see p. 402).
B. Ribonucleotide reduction
2-Deoxyribose, a component of DNA, is notsynthesized as a free sugar, but arises at thediphosphate level by reduction of ribonucleo-
side diphosphates. This reduction is a com-plex process in which several proteins areinvolved. The reducing equivalents neededcome from NADPH+H+. However, they arenot transferred directly from the coenzymeto the substrate, but first pass through a redoxseries that has several steps (1).
In the first step, thioredoxin reductase re-duces a small redox protein, thioredoxin, viaenzyme-bound FAD. This involves cleavage ofa disulfide bond in thioredoxin. The resultingSH groups in turn reduce a catalytically activedisulfide bond in nucleoside diphosphatereductase (“ribonucleotide reductase”). Thefree SH groups formed in this way are theactual electron donors for the reduction ofribonucleotide diphosphates.
In eukaryotes, ribonucleotide reductase is atetramer consisting of two R1 and two R2subunits. In addition to the disulfide bondmentioned, a tyrosine radical in the enzymealso participates in the reaction (2). It initiallyproduces a substrate radical (3). This cleaves awater molecule and thereby becomes radicalcation. Finally, the deoxyribose residue is pro-duced by reduction, and the tyrosine radical isregenerated.
The regulation of ribonucleotide reductaseis complex. The substrate-specificity and ac-tivity of the enzyme are controlled by twoallosteric binding sites (a and b) in the R1subunits. ATP and dATP increase or reducethe activity of the reductase by binding atsite a. Other nucleotides interact with site b,and thereby alter the enzyme’s specificity.
190 Metabolism
All rights reserved. Usage subject to terms and conditions of license.Koolman, Color Atlas of Biochemistry, 2nd edition © 2005 Thieme

1
dCDP
AMP IMP GMP
dGDPGDPdADP
dGTPGTPdATP
RNADNA
ATP
ADP
RNA DNA RNADNA RNA DNA
dUMPUMP dTMP
UDP dUDP dTDP
dTTPUTPCTPdCTP
CDP
23
1 1 1 1
3
2
4 4 4 4
5 5 5 5 5 5 5
45
H2O
N A
P
N A
P
S
S
SH
SH
S SHS SH
NADPH+H
NADP
6 2e , H
1
6
1
NDP dNDP
S S S S
R2R2
NTP NTP
ATPdATP
O O
ATPdATP
R1 R1a
b
a
b
H
H2O
2
1
3
NDP
dNDP
OO
HO OH
Base
H H
P PO
O
HO H
Base
H H
P P
O OH
OCH2R
OH OH
HHH H
OCH2R
OH OH
HHH
OCH2R
OH H
HHH H
OCH2R
OH
HHH
A. Nucleotide synthesis: overview
B. Ribonucleotide reduction
1. Purine1. nucleotides
Precursors
De novo synthesis
2. Pyrimidine2. nucleotides
Ribonucleosidediphosphatereductase 1.17.4.1
CTP synthase 6.3.4.2
Thymidylate synthase 2.1.1.45
Precursors
De novo synthesis
Nucleoside phosphate kinase 2.7.4.4
Nucleoside diphosphate kinase 2.7.4.6
Thio-redoxin(oxidized)
Nucleoside diphosphate
Deoxyribonucleosidediphosphate
Thio-redoxin(reduced)
Thioredoxin reductase [FAD] 1.6.4.5
Radical
Ribonucleoside diphosphate reductase 1.17.4.1
Substrate(NDP)
Tyrosineradical
2. Ribonucleotide reductase
3. Reaction mechanism1. Overview
Base Base
Base Base
191Nucleotide Metabolism
All rights reserved. Usage subject to terms and conditions of license.Koolman, Color Atlas of Biochemistry, 2nd edition © 2005 Thieme

Heme biosynthesis
Heme, an iron-containing tetrapyrrole pig-ment, is a component of O2-binding proteins(see p. 106) and a coenzyme of various oxi-doreductases (see p. 32). Around 85% of hemebiosynthesis occurs in the bone marrow, and amuch smaller percentage is formed in theliver. Both mitochondria and cytoplasm areinvolved in heme synthesis.
A. Biosynthesis of heme
Synthesis of the tetrapyrrole ring starts in themitochondria.
[1] Succinyl CoA (upper left), an intermedi-ate in the tricarboxylic acid cycle, undergoescondensation with glycine and subsequentdecarboxylation to yield 5-aminolevulinate(ALA). The ALA synthase responsible for thisstep is the key enzyme of the whole pathway.Synthesis of ALA synthase is repressed andexisting enzyme is inhibited by heme, theend product of the pathway. This is a typicalexample of end-product or feedback inhibi-tion.
[2] 5-Aminolevulinate now leaves the mi-tochondria. In the cytoplasm, two moleculescondense to form porphobilinogen, a com-pound that already contains the pyrrole ring.Porphobilinogen synthase is inhibited by leadions. This is why acute lead poisoning is asso-ciated with increased concentrations of ALAin the blood and urine.
[3] The tetrapyrrole structure characteristicof the porphyrins is produced in the nextsteps of the synthetic pathway. Hydroxyme-thylbilane synthase catalyzes the linkage offour porphobilinogen molecules and cleavageof an NH2 group to yield uroporphyrinogen III.
[4] Formation of this intermediate step re-quires a second enzyme, uroporphyrinogen IIIsynthase. If this enzyme is lacking, the“wrong” isomer, uroporphyrinogen I, isformed.
The tetrapyrrole structure of uroporphyri-nogen III is still very different from that ofheme. For example, the central iron atom ismissing, and the ring contains only eight ofthe 11 double bonds. In addition, the ringsystem only carries charged R side chains(four acetate and four propionate residues).As heme groups have to act in the apolarinterior of proteins, most of the polar side
chains have to be converted into less polargroups.
[5] Initially, the four acetate residues (R1)are decarboxylated into methyl groups. Theresulting coproporphyrinogen III returns tothe mitochondria again. The subsequent stepsare catalyzed by enzymes located either on orinside the inner mitochondrial membrane.
[6] An oxidase first converts two of thepropionate groups (R2) into vinyl residues.The formation of protoporphyrinogen IX com-pletes the modification of the side chains.
[7] In the next step, another oxidation pro-duces the conjugated π-electron system ofprotoporphyrin IX.
[8] Finally, a divalent iron is incorporatedinto the ring. This step also requires a specificenzyme, ferrochelatase. The heme b or Fe-pro-toporphyrin IX formed in this way is found inhemoglobin and myoglobin, for example (seep. 280), where it is noncovalently bound, andalso in various oxidoreductases (see p. 106).
Further information
There are a large number of hereditary oracquired disturbances of porphyrin synthesis,known as porphyrias, some of which cancause severe clinical pictures. Several of thesediseases lead to the excretion of heme pre-cursors in feces or urine, giving them a darkred color. Accumulation of porphyrins in theskin can also occur, and exposure to light thencauses disfiguring, poorly healing blisters.Neurological disturbances are also commonin the porphyrias.
It is possible that the medieval legendsabout human vampires (“Dracula”) originatedin the behavior of porphyria sufferers (avoid-ance of light, behavioral disturbances, anddrinking of blood in order to obtain heme—which markedly improves some forms of por-phyria).
192 Metabolism
All rights reserved. Usage subject to terms and conditions of license.Koolman, Color Atlas of Biochemistry, 2nd edition © 2005 Thieme

2
2
6[H]
O2
2 H2O
AS
H2O
2 CO2
CO2
Fe2
4 CO2
4 NH4
4
31 2
(ALA)
4
2
3
2
2
1
1
55
2
18
7
6
5
2+
R
AS
R1
R1
R1
R3 R3
N N
NN
Fe 2 +
R2
R1
R2
A B
D C
R1
R1
R1
R3 R3
NH HN
HNNH
R2
R1
R2
A B
D C
C
CH2
CH2
COO
O
H2C COO
NH3
H2C
NH3
C
CH2
CH2
COO
OCH2
C
CH2
CH2
COO
O
NH3
CH3
R1
CH
R2
CH2
CH2
R3
CH2
COO
H2C
NH3
C
C
NH
CH
C
CH2CH2
OOC CH2
COO
CH2
R3
CH2
COO
CH2
R2
CH2
COO
CH3
R1
CH2
R3
CH2
COO
CH2
R2
CH2
COO
CH2
R1
COO
A. Heme biosynthesis
Mitochondrion
Cytoplasm
Pyrrolering
SuccinylCoA
Hydroxymethylbilane synthase4.3.1.8
Uroporphyrinogen-III synthase4.2.1.75
5-Aminolevulinate synthase[PLP] 2.3.1.37
Porphobilinogen synthase4.2.1.24
5-Amino-levulinate
VinylresidueGlycine
Tricarboxylicacid cycle
Protoporphyrin IX
Protoporphyrinogen IX
Coproporphyrinogen III
Porphobilinogen Uroporphyrinogen III
Heme
193Porphyrin Metabolism
All rights reserved. Usage subject to terms and conditions of license.Koolman, Color Atlas of Biochemistry, 2nd edition © 2005 Thieme

Heme degradation
A. Degradation of heme groups
Heme is mainly found in the human organismas a prosthetic group in erythrocyte hemoglo-bin. Around 100–200 million aged erythro-cytes per hour are broken down in the humanorganism. The degradation process starts inreticuloendothelial cells in the spleen, liver,and bone marrow.
[1] After the protein part (globin) has beenremoved, the tetrapyrrole ring of heme isoxidatively cleaved between rings A and Bby heme oxygenase. This reaction requiresmolecular oxygen and NADPH+H+, and pro-duces green biliverdin, as well as CO (carbonmonoxide) and Fe2+, which remains availablefor further use (see p. 286).
[2] In another redox reaction, biliverdin isreduced by biliverdin reductase to the orange-colored bilirubin. The color change from pur-ple to green to yellow can be easily observedin vivo in a bruise or hematoma.
The color of heme and the other porphyrinsystems (see p. 106) results from their numer-ous conjugated double bonds. Heme containsa cyclic conjugation (highlighted in pink) thatis removed by reaction [1]. Reaction [2]breaks the π system down into two smallerseparate systems (highlighted in yellow).
For further degradation, bilirubin is trans-ported to the liver via the blood. As bilirubin ispoorly soluble, it is bound to albumin fortransport. Some drugs that also bind to albu-min can lead to an increase in free bilirubin.
[3] The hepatocytes take up bilirubin fromthe blood and conjugate it in the endoplasmicreticulum with the help of UDP-glucuronicacid into the more easily soluble bilirubinmonoglucuronides and diglucuronides. To dothis, UDP-glucuronosyltransferase forms ester-type bonds between the OH group at C-1 ofglucuronic acid and the carboxyl groups inbilirubin (see p. 316). The glucuronides arethen excreted by active transport into thebile, where they form what are known asthe bile pigments.
Glucuronide synthesis is the rate-deter-mining step in hepatic bilirubin metabolism.Drugs such as phenobarbital, for example, caninduce both conjugate formation and thetransport process.
Some of the bilirubin conjugates are bro-ken down further in the intestine by bacterial
-glucuronidases. The bilirubin released isthen reduced further via intermediate stepsinto colorless stercobilinogen, some of whichis oxidized again into orange to yellow-col-ored stercobilin. The end products of bile pig-ment metabolism in the intestine are mostlyexcreted in feces, but a small proportion isresorbed (enterohepatic circulation; seep. 314). When high levels of heme degrada-tion are taking place, stercobilinogen appearsas urobilinogen in the urine, where oxidativeprocesses darken it to form urobilin.
In addition to hemoglobin, other heme pro-teins (myoglobin, cytochromes, catalases, andperoxidases; see p. 32) also supply hemegroups that are degraded via the same path-way. However, these contribute only about10–15% to a total of ca. 250 mg of bile pig-ment formed per day.
Further information
Hyperbilirubinemias. An elevated bilirubinlevel (> 10 mg L–1) is known as hyperbiliru-binemia. When this is present, bilirubin dif-fuses from the blood into peripheral tissueand gives it a yellow color (jaundice). Theeasiest way of observing this is in the whiteconjunctiva of the eyes.
Jaundice can have various causes. If in-creased erythrocyte degradation (hemolysis)produces more bilirubin, it causes hemolyticjaundice. If bilirubin conjugation in the liver isimpaired—e. g., due to hepatitis or liver cir-rhosis—it leads to hepatocellular jaundice,which is associated with an increase in un-conjugated (“indirect”) bilirubin in the blood.By contrast, if there is a disturbance of biledrainage (obstructive jaundice, due to gall-stones or pancreatic tumors), then conjugated(“direct”) bilirubin in the blood increases. Neo-natal jaundice (physiologic jaundice) usuallyresolves after a few days by itself. In severecases, however, unconjugated bilirubin cancross the blood–brain barrier and lead tobrain damage (kernicterus).
194 Metabolism
All rights reserved. Usage subject to terms and conditions of license.Koolman, Color Atlas of Biochemistry, 2nd edition © 2005 Thieme

1
3
2
P
N A
P
N A
2
3
P PU
2
CO
3 O2
P
N A3P
N A3
Fe23 H2O
2
1
1
O NH
CH
NH
CH2
NH
CH
NH
O
CH3 CH
CH2
CH3 CH2
CH2OOC
CH2
H2C COO
CH3 CH3 CH
CH2
B C D A
N N
NN
Fe 2
CH3
R3
CH3R1
H3C
R2
A B
D C
COOCOO
A. Degradation of heme groups
Bacterialmetabolism
2 GlcUA
StercobilinogenUrobilinogen
Intestine
StercobilinUrobilin
Bilirubindiglucuronide
Bilirubin
Bilepigments
Heme Reusedfor hemesynthesis
Heme oxygenase(decyclizing) 1.14.99.3
Glucuronosyl transferase 2.4.1.17
Biliverdin reductase1.3.1.24
Blood
RESBilirubin
Gallbladder
Entero-hepaticcirculation
Sloweststep inhepaticmetabo-lism
Bilirubindiglucuronide
Bilirubin
Biliverdin
Bilirubin
Heme Cleavage by
Bindingsite forbilirubinand drugs
Albumin
Bilirubin
Albumin
Urine
2 UDPGlcUA
195Porphyrin Metabolism
All rights reserved. Usage subject to terms and conditions of license.Koolman, Color Atlas of Biochemistry, 2nd edition © 2005 Thieme

Structure of cells
A. Comparison of prokaryotes andeukaryotes
Present-day living organisms can be dividedinto two large groups—the prokaryotes andeukaryotes. The prokaryotes are representedby bacteria (eubacteria and archaebacteria).These are almost all small unicellular organ-isms only a few microns (10–6 m) in size. Theeukaryotes include fungi, plants, and animalsand comprise both unicellular and multicel-lular organisms. Multicellular eukaryotes aremade up of a wide variety of cell types that arespecialized for different tasks. Eukaryotic cellsare much larger than prokaryotic ones (vol-ume ratio approximately 2000 : 1). The mostimportant distinguishing feature of these cellsin comparison with the prokaryotes is the factthat they have a nucleus (karyon inGreek—hence the term).
In comparison with the prokaryotes, eu-karyotic cells have greater specialization andcomplexity in their structure and functioning.Eukaryotic cells are structured into compart-ments (see below). The metabolism and syn-thesis of macromolecules are distributedthrough these reaction spaces and are sepa-rately regulated. In prokaryotes, these func-tions are organized in a simpler fashion andare spatially closely related.
Although the storage and transfer of ge-netic information function according to thesame principle in the prokaryotes and euka-ryotes, there are also differences. EukaryoticDNA consists of very long, linear moleculeswith a total of 107 to more than 1010 base pairs(bp), only a small fraction of which are usedfor genetic information. In eukaryotes, thegenes (20000–50000 per genome) are usu-ally interrupted by non-coding regions (in-trons). Eukaryotic DNA is located in the nu-cleus, where together with histones and otherproteins it forms the chromatin (see p. 238).
In prokaryotes, by contrast, DNA is ring-shaped, much shorter (up to 5 106 bp), andlocated in the cytoplasm. Almost all of it isused for information storage, and it does notcontain any introns.
B. Structure of an animal cell
In the human body alone, there are at least200 different cell types. The illustration out-lines the basic structures of an animal cell inan extremely simplified way. The detailsgiven regarding the proportion of the com-partments relative to cell volume (highlightedin yellow) and their numbers per cell fre-quency (blue) refer to mammalian hepato-cytes (liver cells). The figures can vary widelyfrom cell type to cell type.
The eukaryotic cell is subdivided by mem-branes. On the outside, it is enclosed by aplasma membrane. Inside the cell, there is alarge space containing numerous componentsin solution—the cytoplasm. Additional mem-branes divide the internal space intocompartments (confined reaction spaces).Welldefined compartments of this type areknown as organelles.
The largest organelle is the nucleus (seep. 208). It is easily recognized using the lightmicroscope. The endoplasmic reticulum (ER),a closed network of shallow sacs and tubules(see pp. 226ff.), is linked with the outer mem-brane of the nucleus. Another membrane-bound organelle is the Golgi apparatus (seep. 228), which resembles a bundle of layeredslices. The endosomes and exosomes are bub-ble-shaped compartments ( vesicles) that areinvolved in the exchange of substances be-tween the cell and its surroundings. Probablythe most important organelles in the cell’smetabolism are the mitochondria, which arearound the same size as bacteria (seepp. 210ff.). The lysosomes and peroxisomesare small, globular organelles that carry outspecific tasks. The whole cell is traversed by aframework of proteins known as the cytoske-leton (see pp. 204ff.).
In addition to these organelles, plant cells(see p. 43) also have plastids—eg., chloro-plasts, in which photosynthesis takes place(see p. 128). In their interior, there is a large,fluid-filled vacuole. Like bacteria and fungi,plant cells have a rigid cell wall consisting ofpolysaccharides and proteins.
196 Organelles
All rights reserved. Usage subject to terms and conditions of license.Koolman, Color Atlas of Biochemistry, 2nd edition © 2005 Thieme

10-30 µm
A. Comparison of prokaryotes and eukaryotes
Number per cell
Golgi complex 6% ?
Roughendoplasmicreticulum9% 1
Mitochondrion22% ~2000
Peroxisome1% 400
Nucleus6% 1
Lysosome1% 300
Freeribosomes
Endosome1% 200
Cytoplasm54% 1
Plasmamembrane
Proportion ofcell volume
B. Structure of an animal cell
Prokaryotes Eukaryotes
EubacteriaArchaebacteria
Single-celled
FungiPlantsAnimals
FormSingle or multi-cellular
Organelles, cytoskeleton, cell division apparatusMissing Present, complicated, specialized
DNA
RNA: Synthesis and maturation
Protein: Synthesis and maturation
Metabolism
Endocytosis and Exocytosis
Small, circular, nointrons, plasmids Large, in nucleus, many introns
Simple, in cytoplasm
Simple, coupled withRNA synthesis
Complicated, in the cytoplasmand the rough endoplasmic reticulum
Anaerobic or aerobicvery flexible Mostly aerobic, compartmented
no yes
Organisms
Complicated, in nucleus
1-10 µm
10-100 µm
197Basics
All rights reserved. Usage subject to terms and conditions of license.Koolman, Color Atlas of Biochemistry, 2nd edition © 2005 Thieme

Cell fractionation
A. Isolation of cell organelles
To investigate the individual compartments ofthe cell (see p. 196), various procedures havebeen developed to enrich and isolate cell or-ganelles. These are mainly based on the sizeand density of the various organelles.
The isolation of cell components startswith disruption of the tissue being examinedand subsequent homogenization of it (break-ing down the cells) in a suitable buffer (seebelow). Homogenization using the “Potter”(the Potter–Elvehjem homogenizer, a rotatingTeflon pestle in a glass cylinder) is particularlysuitable for animal tissue. This method is verygentle and is therefore used to isolate fragilestructures and molecules. Other cell disrup-tion procedures include enzymatic lysis withthe help of enzymes that break down the cellwall, mechanical disruption by grinding fro-zen tissue, cutting or smashing with rotatingknives, large pressure changes, osmoticshock, and repeated freezing and thawing.
To isolate intact organelles, it is importantfor the homogenization solution to be iso-tonic—i. e., the osmotic value of the bufferhas to be the same as that of the interior ofthe cell. If hypotonic solutions were used, theorganelles would take up water and burst,while in hypertonic solutions they wouldshrink.
Homogenization is followed by coarse fil-tration through gauze to remove intact cellsand connective-tissue fragments. The actualfractionation of cellular components is thencarried out by centrifugation steps, in whichthe gravitational force (given as multiples ofthe earth’s gravity, g = 9.81 m s–2) is gradu-ally increased (differential centrifugation; seep. 200). Due to the different shapes and den-sities of the organelles, this leads to succes-sive sedimentation of each type out of thesuspension.
Nuclei already sediment at low accelera-tions that can be achieved with bench-topcentrifuges. Decanting the residue (the“supernatant”) and carefully suspending thesediment (or “pellet”) in an isotonic mediumyields a fraction that is enriched with nuclei.However, this fraction may still contain othercellular components as contaminants—e. g.,fragments of the cytoskeleton.
Particles that are smaller and less densethan the nuclei can be obtained by step-by-step acceleration of the gravity on the super-natant left over from the first centrifugation.However, this requires very powerful centri-fuges (high-speed centrifuges and ultracentri-fuges). The sequence in which the fractionsare obtained is: mitochondria, membranevesicles, and ribosomes. Finally, the superna-tant from the last centrifugation contains thecytosol with the cell’s soluble components, inaddition to the buffer.
The isolation steps are carried out at lowtemperatures on principle (usually 0–5 °C), toslow down degradation reactions—e. g., dueto released enzymes and other influencingfactors. The addition of thiols and chelatingagents protects functional SH groups fromoxidation. Isolated cell organelles quicklylose their biological activity despite these pre-cautions. Nevertheless, it is possible by work-ing carefully to isolate mitochondria that willstill take up substrates for a few hours in thetest tube and produce ATP via oxidative phos-phorylation.
B. Marker molecules
During cell fractionation, it is very importantto analyze the purity of the fractions obtained.Whether or not the intended organelle ispresent in a particular fraction, and whetheror not the fraction contains other compo-nents, can be determined by analyzingcharacteristic marker molecules. These aremolecules that occur exclusively or predom-inantly in one type of organelle. For example,the activity of organelle-specific enzymes(marker enzymes) is often assessed. The dis-tribution of marker enzymes in the cell re-flects the compartmentation of the processesthey catalyze. These reactions are discussed ingreater detail here under the specific organ-elles.
198 Organelles
All rights reserved. Usage subject to terms and conditions of license.Koolman, Color Atlas of Biochemistry, 2nd edition © 2005 Thieme

A. Isolation of cell organelles
B. Marker molecules
Cell fraction Marker enzyme
NucleusDNA
Plasma membraneNa+/K+ ATPase
3.6.1.37Phosphodiesterase I
3.1.4.1
Lysosomeβ-N-Acetylhexos-
aminidase 3.2.1.52β-Galactosidase
3.2.1.23
EndosomeUptake of
peroxidase1.11.1.7
RibosomesrRNA
CytosolL-Lactate
dehydrogenase1.1.1.27
Golgi complexα-Mannosidase II
3.2.1.24
PeroxisomeCatalase1.11.1.6
Slice
Tissue
BufferPotterhomo-genizer
Homo-genize
Centrifuge
Gauze
Wholecells,connectivetissue
NucleusCytoskeleton
MitochondriaLysosomesPeroxisomes(Plants:chloroplasts)
Plasma membraneER fragmentsSmall vesiclesMicrosomalfraction
RibosomesVirusesMacromolecules
Cytosol
Filter
Centrifugetube
Super-natant
Pellet
Glucose 6-phospha-tase 3.1.3.9
RNA
MitochondrionSuccinate dehydro-
genase 1.3.5.1Cytochrome-c
oxidase1.9.3.1
g = 60010'
g = 15 00015'
g = 100 00060'
g = 300 000120'
Endoplasmicreticulum
199Basics
All rights reserved. Usage subject to terms and conditions of license.Koolman, Color Atlas of Biochemistry, 2nd edition © 2005 Thieme

Centrifugation
A. Principles of centrifugation
In a solution, particles whose density is higherthan that of the solvent sink (sediment), andparticles that are lighter than it float to thetop. The greater the difference in density, thefaster they move. If there is no difference indensity (isopyknic conditions), the particleshover. To take advantage of even tiny differ-ences in density to separate various particlesin a solution, gravity can be replaced with themuch more powerful “centrifugal force” pro-vided by a centrifuge.
Equipment. The acceleration achieved bycentrifugation is expressed as a multipleof the earth’s gravitational force (g =9.81 m s–2). Bench-top centrifuges can reachacceleration values of up to 15000 g, whilehighspeed refrigerated centrifuges can reach50000 g and ultracentrifuges, which operatewith refrigeration and in a vacuum, can reach500000 g. Two types of rotor are available inhigh-powered centrifuges: fixed angle rotorsand swingout rotors that have movable bucketcontainers. The tubes or buckets used for cen-trifugation are made of plastic and have to bevery precisely adjusted to avoid any imbalan-ces that could lead to accidents.
Theory. The velocity (v) of particle sedi-mentation during centrifugation depends onthe angular velocity ω of the rotor, its effectiveradius (reff, the distance from the axis of rota-tion), and the particle’s sedimentation prop-erties. These properties are expressed as thesedimentation coef•cient S (1 Svedberg,= 10–13 s). The sedimentation coef cient de-pends on the mass M of the particle, its shape(expressed as the coef cient of friction, f), andits density (expressed as the reciprocaldensity v
_, “partial specific volume”).
At the top right, the diagram shows thedensities and sedimentation coef cients forbiomolecules, cell organelles, and viruses.Proteins and protein-rich structures havedensities of around 1.3 g cm–3, while nucleicacids show densities of up to 2 g cm–3. Equi-librium sedimentation of nucleic acids there-fore requires high-density media—e. g., con-centrated solutions of cesium chloride (CsCl).To allow comparison of S values measured indifferent media, they are usually corrected tovalues for water at 20 °C (“S20W” ).
B. Density gradient centrifugation
Density gradient centrifugation is used toseparate macromolecules that differ onlyslightly in size or density. Two techniquesare commonly used.
In zonal centrifugation, the sample beingseparated (e. g., a cell extract or cells) is placedon top of the centrifugation solution as a thinlayer. During centrifugation, the particlesmove through the solution due to theirgreater density. The rate of movement basi-cally depends on their molecular mass (see A,formulae). Centrifugation stops before theparticles reach the bottom of the tube. Dril-ling a hole into the centrifugation tube andallowing the contents to drip out makes itpossible to collect the different particles inseparate fractions. During centrifugation, thesolution tube is stabilized in the tube by adensity gradient. This consists of solutions ofcarbohydrates or colloidal silica gel, the con-centration of which increases from the sur-face of the tube to the bottom. Density gra-dients prevent the formation of convectioncurrents, which would impair the separationof the particles.
Isopyknic centrifugation, which takesmuch longer, starts with a CsCl solution inwhich the sample material (e. g., DNA, RNA,or viruses) is homogeneously distributed. Adensity gradient only forms during centrifu-gation, as a result of sedimentation and dif-fusion processes. Each particle moves to theregion corresponding to its own buoyant den-sity. Centrifugation stops once equilibriumhas been reached. The samples are obtainedby fractionation, and their concentration ismeasured using the appropriate methods.
200 Organelles
All rights reserved. Usage subject to terms and conditions of license.Koolman, Color Atlas of Biochemistry, 2nd edition © 2005 Thieme

2.0
1.8
1.6
1.4
1.2
1 10 102 103 104 105 106 107
reff
v:
ω:
v = ω2 · reff · s
M · (1 - v · r)s =
f
g = ω2 · reffg:
f :
r :
v :M:
s:
reff:
1 2 3 4 5 6 7 8 9 10 11
0 0.5 1 2 h 8 h0 2 4
1 2 3 4 5 6 7 8 90
Viruses
Glycogen
Ribosomes, Polysomes
Nuclei
RNA
DNA
Solubleproteins
Mitochondria
Microsomes
Den
sity
(g ·
cm-3
)
Fixed angle rotor
Swing-out bucket rotor
Centrifugebucket
Swing-outcentrifugebucket
Axis of rotation
Sedimentation velocity(cm · s–1)
Angular velocity(rad · s–1)
Gravitational acceleration
Coefficient of friction
Density of the solution(g · cm3)
Partial specific particle volume(cm3 · g–1)
Molecular mass
Sedimentation coefficient(S = 10–13 s)
Fraction
ProbeParticles migrateaccording to S-value
Sucrosedensitygradient
After t =
Fractionation
Zonal centrifugation
Particles distributedaccording to densityCentrifugation
Isopyknic centrifugation
Con
cent
rati
on
Fraction
Detection
CsCldensitygradient
Centrifugation
Sucrose orCsCl gradient
Effective radius (cm)
A. Principles of centrifugation
B. Density gradient centrifugation
Sedimentation coefficient (Svedberg, S)
201Basics
All rights reserved. Usage subject to terms and conditions of license.Koolman, Color Atlas of Biochemistry, 2nd edition © 2005 Thieme

Cell components and cytoplasm
The Gram-negative bacterium Escherichia coli(E. coli) is a usually harmless symbiont in theintestine of mammals. The structure and char-acteristics of this organism have been partic-ularly well characterized. E. coli is also fre-quently used in genetic engineering (seep. 258).
A. Components of a bacterial cell
A single E. coli cell has a volume of about0.88 µm3. One-sixth of this consists of mem-branes and one-sixth is DNA (known as the“nucleoid”). The rest of the internal space ofthe cell is known as cytoplasm (not “cytosol”;see p. 198).
The main component of E. coli—as in allcells—is water (70%). The other componentsare macromolecules (proteins, nucleic acids,polysaccharides), small organic molecules,and inorganic ions. The majority of the macro-molecules are proteins, which represent ca.55% of the dry mass of the cell. When a num-ber of assumptions are made about the dis-tribution and size (average mass 40 kDa) ofproteins, it can be estimated that there areapproximately 250000 protein molecules inthe cytoplasm of an E. coli cell. In eukaryoticcells, which are about a thousand times larger,it is estimated that the number of proteinmolecules is in the order of several billion.
B. Looking inside a bacterial cell
The illustration shows a schematic view in-side the cytoplasm of E. coli, magnified ap-proximately one million times. At this magni-fication, a single carbon atom would be thesize of a grain of salt, and an ATP moleculewould be as large as a grain of rice. The detailshown is 100 nm long, corresponding toabout 1/600th of the volume of a cell in E.coli. To make the macromolecules clearer,small molecules such as water, cofactors,and metabolites have all been omitted fromthe illustration. The section of the cytoplasmshown contains:
• Several hundred macromolecules, whichare needed for protein biosynthesis—i. e.,30 ribosomes, more than 100 protein fac-
tors, 30 aminoacyl–tRNA synthases, 340tRNA molecules, 2–3 mRNAs (each of whichis 10 times the length of the section shown),and six molecules of RNA polymerase.
• About 330 other enzyme molecules, includ-ing 130 glycolytic enzymes and 100 en-zymes from the tricarboxylic acid cycle.
• 30000 small organic molecules withmasses of 100–1000 Da—e. g., metabolitesof the intermediary metabolism and coen-zymes. These are shown at a magnification10 times higher in the bottom right corner.
• And finally, 50000 inorganic ions. The restconsists of water.
The illustration shows that the cytoplasm ofcells is a compartment densely packed withmacromolecules and smaller organic mole-cules. The distances between organic mole-cules are small. They are only separated by afew water molecules.
All of the molecules are in motion. Due toconstant collisions, however, they do not ad-vance in a straight path but move in zigzags.Due to their large mass, proteins are particu-larly slow. However, they do cover an averageof 5 nm in 1 ms—a distance approximatelyequal to their own length. Statistically, a pro-tein is capable of reaching any point in abacterial cell in less than a second.
C. Biochemical functions of the cytoplasm
In eukaryotes, the cytoplasm, representingslightly more than 50% of the cell volume, isthe most important cellular compartment. Itis the central reaction space of the cell. This iswhere many important pathways of the inter-mediary metabolism take place—e. g., glycol-ysis, the pentose phosphate pathway, the ma-jority of gluconeogenesis, and fatty acid syn-thesis. Protein biosynthesis (translation; seep. 250) also takes place in the cytoplasm. Bycontrast, fatty acid degradation, the tricarbox-ylic acid cycle, and oxidative phosphorylationare located in the mitochondria (see p. 210).
202 Organelles
All rights reserved. Usage subject to terms and conditions of license.Koolman, Color Atlas of Biochemistry, 2nd edition © 2005 Thieme

Macromolecules
A. Components of a bacterial cell
B. View into a bacterial cell
C. Biochemical functions of the cytoplasm
DNA
mRNA
tRNA
Ribosome
Proteins
Water
Amino acidCarbohydrate
Protein
RNA-Polymerase
Water(70%, 1)
Proteins(17%, 3 000)
RNA (8%) DNA (1%)
Inorganicions (1%, 20)
Sugars (1%, 250)
Amino acids(0.4%, 100)
Nucleotides(0.4%, 100)
Lipids (1%, 50)
Other smallorganicmolecules(0.2%, 300)
Number ofdifferent mole-cule types
Glycolysis
Pentose phos-phate cycle
Gluconeogenesis
Proteinbiosynthesis And many other
reactions
Fatty acidbiosynthesis
Schematicnet of thereactionsin the cytoplasm
203Basics
All rights reserved. Usage subject to terms and conditions of license.Koolman, Color Atlas of Biochemistry, 2nd edition © 2005 Thieme

Cytoskeleton: components
The cytoplasm of eukaryotic cells is traversedby three–dimensional scaffolding structuresconsisting of filaments (long protein fibers),which together form the cytoskeleton. Thesefilaments are divided into three groups, basedon their diameters: microfilaments (6–8 nm),intermediate filaments (ca. 10 nm), and mi-crotubules (ca. 25 nm). All of these filamentsare polymers assembled from protein compo-nents.
A. Actin
Actin, the most abundant protein in eukary-otic cells, is the protein component of themicrofilaments (actin filaments). Actin occursin two forms—a monomolecular form (G actin,globular actin) and a polymer (F actin, fila-mentous actin). G actin is an asymmetricalmolecule with a mass of 42 kDa, consistingof two domains. As the ionic strength in-creases, G actin aggregates reversibly toform F actin, a helical homopolymer. G actincarries a firmly bound ATP molecule that isslowly hydrolyzed in F actin to form ADP.Actin therefore also has enzyme properties(ATPase activity).
As individual G actin molecules are alwaysoriented in the same direction relative to oneanother, F actin consequently has polarity. Ithas two different ends, at which polymeriza-tion takes place at different rates. If the endsare not stabilized by special proteins (as inmuscle cells), then at a critical concentrationof G actin the (+) end of F actin will constantlygrow, while the (–) end simultaneously de-cays. These partial processes can be blockedby fungal toxins experimentally. Phalloidin, atoxin contained in the Amanita phalloidesmushroom, inhibits decay by binding to the(–) end. By contrast, cytochalasins, mold tox-ins with cytostatic effects, block polymeriza-tion by binding to the (+) end.
Actin–associated proteins. The cytoplasmcontains more than 50 different proteinsthat bind specifically to G actin and F actin.Their actin uptake has various different func-tions. This type of bonding can serve to regu-late the G actin pool (example: profilin), influ-ence the polymerization rate of G actin (vil-lin), stabilize the chain ends of F actin (fragin,
–actinin), attach filaments to one another or
to other cell components (villin, –actinin,spectrin), or disrupt the helical structure of Factin (gelsolin). The activity of these proteinsis regulated by protein kinases via Ca2+ andother second messengers (see p. 386).
B. Intermediate filaments
The components of the intermediate fila-ments belong to five related protein families.They are specific for particular cell types. Typ-ical representatives include the cytokeratins,desmin, vimentin, glial fibrillary acidic protein(GFAP), and neurofilament. These proteins allhave a rod–shaped basic structure in the cen-ter, which is known as a superhelix (“coiledcoil”; see keratin, p. 70). The dimers are ar-ranged in an antiparallel fashion to form tet-ramers. A staggered head-to–head arrange-ment produces protofilaments. Eight protofi-laments ultimately form an intermediary fil-ament.
Free protein monomers of intermediate fil-aments rarely occur in the cytoplasm, in con-trast to microfilaments and microtubules.Their polymerization leads to stable polymersthat have no polarity.
C. Tubulins
The basic components of the tube-shaped mi-crotubules are α– and β–tubulin (53 and55 kDa). These form α,β-heterodimers, whichin turn polymerize to form linear protofila-ments. Thirteen protofilaments form a ring-shaped complex, which then grows into along tube as a result of further polymeriza-tion.
Like microfilaments, microtubules are dy-namic structures with (+) and (–) ends. The(–) end is usually stabilized by bonding to thecentrosome. The (+) end shows dynamicinstability. It can either grow slowly orshorten rapidly. GTP, which is bound by themicrotubules and gradually hydrolyzed intoGDP, plays a role in this. Various proteins canalso be associated with microtubules.
204 Organelles
All rights reserved. Usage subject to terms and conditions of license.Koolman, Color Atlas of Biochemistry, 2nd edition © 2005 Thieme

α β
8 nm
ADPPi
ATP
ADPPi
ATP
A. Actin
B. Intermediate filaments
C. Tubulins
Tubulin53 and 55 kDaheterodimer
Microtubule(cylindrical polymer)
binds GTP andslowly hydrolyzes it
(–) End: stabilized by bindingto the centromere
(+) End: growsor shortens
IF Proteins:
CytokeratinsDesminVimentinGlial fibrillaryacidic proteinNeurofilamentsLamins
Dimer
Superhelical structure
Tetramer
Protofilament
Intermediatefilament
F-actinhelical polymermicrofilament (detail)
G-Actinmonomers42 kDa
Cytochalasin
dissociation favored
(–) End: polymerizationfavored
(+) End:
Slow hydrolysis
Associatesmore easily
Dissociatesmore easily
Phalloidin
Polymerization
Depolymerization
Plantalkaloids:Vinblastine,vincristine,colchicine
Protofilament
Taxol
25 nm
10 n
m
205Cytoskeleton
All rights reserved. Usage subject to terms and conditions of license.Koolman, Color Atlas of Biochemistry, 2nd edition © 2005 Thieme

Structure and functions
The cytoskeleton carries out three majortasks:
• It represents the cell’s mechanical scaffold-ing, which gives it its typical shape andconnects membranes and organelles toeach other. This scaffolding has dynamicproperties; it is constantly being synthe-sized and broken down to meet the cell’srequirements and changing conditions.
• It acts as the motor for movement of animalcells. Not only muscle cells (see p. 332), butalso cells of noncontractile tissues containmany different motor proteins, which theyuse to achieve coordinated and directedmovement. Cell movement, shape changesduring growth, cytoplasmic streaming, andcell division are all made possible by com-ponents of the cytoskeleton.
• It serves as a transport track within the cell.Organelles and other large protein com-plexes can move along the filaments withthe help of the motor proteins.
A. Microfilaments and intermediatefilaments
The illustration schematically shows a detailof the microvilli of an intestinal epithelial cellas an example of the structure and function ofthe components of the cytoskeleton (see alsoC1).
Microfilaments of F actin traverse the mi-crovilli in ordered bundles. The microfila-ments are attached to each other by actin–as-sociated proteins, particularly fimbrin and vil-lin. Calmodulin and a myosin–like ATPase con-nect the microfilaments laterally to theplasma membrane. Fodrin, another microfila-ment–associated protein, anchors the actinfibers to each other at the base, as well asattaching them to the cytoplasmic membraneand to a network of intermediate filaments. Inthis example, the microfilaments have amainly static function. In other cases, actin isalso involved in dynamic processes. These in-clude muscle contraction (see p. 332), cellmovement, phagocytosis by immune cells,the formation of microspikes and lamellipo-dia (cellular extensions), and the acrosomalprocess during the fusion of sperm with theegg cell.
B. Microtubules
Only the cell’s microtubules are shown here.They radiate out in all directions from a centernear the nucleus, the centrosome. The tube-shaped microtubules are constantly beingsynthesized and broken down at their (+)ends. In the centriole, the (–) end is blockedby associated proteins (see p. 204). The (+)end can also be stabilized by associated pro-teins—e. g., when the microtubules havereached the cytoplasmic membrane.
The microtubules are involved in definingthe shape of the cell and also serve as guidingtracks for the transport of organelles. To-gether with associated proteins (dynein, kine-sin), microtubules are able to carry out me-chanical work—e. g., during the transport ofmitochondria, the movement of cilia (hair-like cell protrusions in the lungs, intestinalepithelium, and oviduct) and the beating ofthe flagella of sperm. Microtubules also play aspecial role in the mitotic period of cell divi-sion (see p. 394).
C. Architecture
The complex structure and net-like density ofthe cytoskeleton is illustrated here usingthree examples in which the cytoskeletalcomponents are visualized with the help ofantibodies.
1. The border of an intestinal epithelial cellis seen here (see also B). There are micro-filaments (a) passing from the interior of thecell out into the microvilli. The filaments arefirmly held together by spectrin (b), an asso-ciated protein, and they are anchored to in-termediate filaments (c).
2. Only microtubules are seen in this fibro-blast cell. They originate from the microtubuleorganizing center (centrosome) and radiateout as far as the plasma membrane.
3. Keratin filaments are visible here in anepithelial cell. Keratin fibers belong to thegroup of intermediate filaments (see pp. 70,204; d = nucleus).
206 Organelles
All rights reserved. Usage subject to terms and conditions of license.Koolman, Color Atlas of Biochemistry, 2nd edition © 2005 Thieme

2. Mikrotubuli
a
b cd
d
A. Microfilaments and intermediate filaments
B. Microtubules
C. Architecture
Microvillus
Fodrin
End ofF-Actin
Secretoryvesicle
Nucleus
Motor for movement
Rail for transport
Centrosome
Nucleus
Stable ends
Microtubule – associated protein stabilizes end
End grows orbecomes shorter
A mitochondrionmigrates alonga microtubule
1. Microfilaments 2. Microtubules 3. Intermediate filaments
Mechanicalframework
Actinfilament(micro-filament)
Villin
Fimbrin
Calmodulin
Plasmamembrane
Intermediatefilament
207Cytoskeleton
All rights reserved. Usage subject to terms and conditions of license.Koolman, Color Atlas of Biochemistry, 2nd edition © 2005 Thieme

Nucleus
A. Nucleus
The nucleus is the largest organelle in the eu-karyotic cell. With a diameter of about 10 µm,it is easily recognizable with the light micro-scope. This is the location for storage, replica-tion, and expression of genetic information.
The nucleus is separated from the cyto-plasm by the nuclear envelope, which consistsof the outer and inner nuclear membranes.Each of the two nuclear membranes has twolayers, and the membranes are separatedfrom each other by the perinuclear space.The outer nuclear membrane is continuouswith the rough endoplasmic reticulum andis covered with ribosomes. The inner side ofthe membrane is covered with a protein layer(the nuclear lamina), in which the nuclearstructures are anchored.
The nucleus contains almost all of the cell’sDNA (around 1% of which is mitochondrialDNA). Together with histones and structuralproteins, the nuclear DNA forms the chroma-tin (see p. 238). It is only during cell divisionthat chromatin condenses into chromosomes,which are also visible with the light micro-scope. During this phase, the nuclear mem-brane temporarily disintegrates.
During the phase between cell divisions,the interphase, it is possible to distinguishbetween the more densely packed hetero-chromatin and loose euchromatin using anelectron microscope. Active transcription ofDNA into mRNA takes place in the region ofthe euchromatin. A particularly electron-dense region is noticeable in manynuclei—the nucleolus (several nucleoli aresometimes present). The DNA in the nucleoluscontains numerous copies of the genes forrRNAs (see p. 242). They are constantly under-going transcription, leading to a high localconcentration of RNA.
B. Nuclear pores
The exchange of substances between the nu-cleus and the cytoplasm is mediated by porecomplexes with complicated structures,which traverse the nuclear membrane. Thenuclear pores consist of numerous proteinsthat form several connected rings of varyingdiameter. Low-molecular structures and small
proteins can enter the nucleus without dif -culty. By contrast, larger proteins (over40 kDa) can only pass through the nuclearpores if they carry a nuclear localization se-quence consisting of four successive basicamino acids inside their peptide chains (seep. 228). mRNAs and rRNAs formed in the nu-cleus cross the pores into the cytoplasm ascomplexes with proteins (see below).
C. Relationships between the nucleus andcytoplasm
Almost all of the RNA in the cell is synthesizedin the nucleus. In this process, known astranscription, the information stored in DNAis transcribed into RNA (see p. 242). As men-tioned above, ribosomal RNA (rRNA) is mainlyproduced in the nucleolus, while messengerand transfer RNA (mRNA and tRNA) areformed in the region of the euchromatin. En-zymatic duplication of DNA—replication—alsoonly takes place in the nucleus (see p. 240).
The nucleotide components required fortranscription and replication have to be im-ported into the nucleus from the cytoplasm.Incorporation of these components into RNAleads to primary products, which are thenaltered by cleavage, excision of introns, andthe addition of extra nucleotides (RNA matu-ration; see p. 242). It is only once these pro-cess have been completed that the RNA mol-ecules formed in the nucleus can be exportedinto the cytoplasm for protein synthesis(translation; see p. 250).
The nucleus is not capable of synthesizingproteins. All of the nuclear proteins thereforehave to be imported—the histones with whichDNA is associated in chromatin, and also theso–called non–histone proteins (DNA poly-merases and RNA polymerases, auxiliary andstructural proteins, transcription factors, andribosomal proteins). Ribosomal RNA (rRNA)already associates with proteins in the nucle-olus to form ribosome precursors.
A special metabolic task carried out by thenucleus is biosynthesis of NAD+. The immedi-ate precursor of this coenzyme, nicotinamidemononucleotide (NMN+), arises in the cyto-plasm and is then transported into the nucle-olus, where it is enzymatically converted intothe dinucleotide NAD+. Finally, NAD+ then re-turns to the cytoplasm.
208 Organelles
All rights reserved. Usage subject to terms and conditions of license.Koolman, Color Atlas of Biochemistry, 2nd edition © 2005 Thieme

NADNMN
N N A
N N A
Ribosomalproteins,Histones,Non-histone proteins
CytoplasmNucleoplasm
Nucleolus
Ribosomalsubunits
Polysome
DNA
pre-tRNAshnRNAs45S-RNA
rRNAs
Translation
NADsynthesis
Replication
mRNAs
DNA
tRNAs
Processing
Transcription
B. Nuclear pores
Outernuclearmembrane
Innernuclearmembrane
NucleolusNuclear pores
EuchromatinHeterochromatin
DNA, RNA, histones,non-histone proteins
Cytoplasmic fibrils
Basket
Distal ring
Lumen
Outerring
Innerring
Outernuclearmembrane
Innernuclearmembrane
C. Interactions between nucleus and cytoplasm
A. Nucleus10 µm
209Nucleus
All rights reserved. Usage subject to terms and conditions of license.Koolman, Color Atlas of Biochemistry, 2nd edition © 2005 Thieme

Structure and functions
A. Mitochondrial structure
Mitochondria are bacteria-sized organelles(about 1 × 2 µm in size), which are found inlarge numbers in almost all eukaryotic cells.Typically, there are about 2000 mitochondriaper cell, representing around 25% of the cellvolume. Mitochondria are enclosed by twomembranes—a smooth outer membrane anda markedly folded or tubular inner mitochon-drial membrane, which has a large surfaceand encloses the matrix space. The folds ofthe inner membrane are known as cristae,and tube-like protrusions are called tubules.The intermembrane space is located betweenthe inner and the outer membranes.
The number and shape of the mitochon-dria, as well as the numbers of cristae theyhave, can differ widely from cell type to celltype. Tissues with intensive oxidative meta-bolism—e. g., heart muscle—have mitochon-dria with particularly large numbers of cris-tae. Even within one type of tissue, the shapeof the mitochondria can vary depending ontheir functional status. Mitochondria are mo-bile, plastic organelles.
Mitochondria probably developed duringan early phase of evolution from aerobic bac-teria that entered into symbiosis with pri-meval anaerobic eukaryotes. This endosym-biont theory is supported by many findings.For example, mitochondria have a ring-shaped DNA (four molecules per mitochon-drion) and have their own ribosomes. Themitochondrial genome became smaller andsmaller during the course of evolution. In hu-mans, it still contains 16 569 base pairs,which code for two rRNAs, 22 tRNAs, and 13proteins. Only these 13 proteins (mostly sub-units of respiratory chain complexes) are pro-duced in the mitochondrion. All of the othermitochondrial proteins are coded by the nu-clear genome and have to be imported intothe mitochondria after translation in the cy-toplasm (see p. 228). The mitochondrial en-velope consisting of two membranes alsosupports the endosymbiont theory. The innermembrane, derived from the former sym-biont, has a structure reminiscent of proka-ryotes. It contains the unusual lipid cardioli-pin (see p. 50), but hardly any cholesterol (seep. 216).
Both mitochondrial membranes are veryrich in proteins. Porins (see p. 214) in theouter membrane allow small molecules(< 10 kDa) to be exchanged between the cy-toplasm and the intermembrane space. Bycontrast, the inner mitochondrial membraneis completely impermeable even to smallmolecules (with the exception of O2, CO2,and H2O). Numerous transporters in the innermembrane ensure the import and export ofimportant metabolites (see p. 212). The innermembrane also transports respiratory chaincomplexes, ATP synthase, and other enzymes.The matrix is also rich in enzymes (see B).
B. Metabolic functions
Mitochondria are also described as being thecell’s biochemical powerhouse, since—throughoxidative phosphorylation (see p. 112)—theyproduce the majority of cellular ATP. Pyruvatedehydrogenase (PDH), the tricarboxylic acidcycle, β-oxidation of fatty acids, and parts ofthe urea cycle are located in the matrix. Therespiratory chain, ATP synthesis, and enzymesinvolved in heme biosynthesis (see p. 192) areassociated with the inner membrane.
The inner membrane itself plays an impor-tant part in oxidative phosphorylation. As it isimpermeable to protons, the respiratorychain—which pumps protons from the matrixinto the intermembrane space via complexesI, III, and IV—establishes a proton gradientacross the inner membrane, in which thechemical energy released during NADH oxi-dation is conserved (see p. 126). ATP synthasethen uses the energy stored in the gradient toform ATP from ADP and inorganic phosphate.Several of the transport systems are also de-pendent on the H+ gradient.
In addition to the endoplasmic reticulum,the mitochondria also function as anintracellular calcium reservoir. The mitochon-dria also play an important role in “pro-grammed cell death”—apoptosis (see p. 396).
210 Organelles
All rights reserved. Usage subject to terms and conditions of license.Koolman, Color Atlas of Biochemistry, 2nd edition © 2005 Thieme

2 µm
NH3
HCO3
CO2CO2
H2O
O2
ATPN A
AP P P
AP P P
H + H + H +
P PA
P
H +
H +
–
Ca2
Ca2
ETF
P PA
ADP
Outer membrane Inner membrane Enzymesoflipidmetabo-lism
PorinNucleotidekinases
Outermembrane
Innermembrane
ATPsynthase
Enzymesofoxidativemetabo-lism
Transporter
Respi-ratorychain
Matrixspace
Inter-membranespace
Creatinekinase
Cristae
Matrix space
Intermembrane space
DNA
A. Mitochondrial structure
Pyruvate
Outer membrane
Inner membrane
Urea cycle
Acetyl CoA
Tri-carboxylicacid cycle
Respiratory chain
Urea
Acyl CoA
Cytoplasmiccalcium ions
ATP synthesis
Acyl CoA
Carnitine shuttleInter-membranespace
B. Metabolic functions
Pyruvate
β-Oxidation
211Mitochondria
All rights reserved. Usage subject to terms and conditions of license.Koolman, Color Atlas of Biochemistry, 2nd edition © 2005 Thieme

Transport systems
Mitochondria are surrounded by an inner andan outer membrane (see p. 210). The outermembrane contains porins, which allowsmaller molecules up to 10 kDa in size topass. By contrast, the inner membrane is alsoimpermeable to small molecules (with theexception of water and the gases O2, CO2,and NH3). All of the other substrates of mito-chondrial metabolism, as well as its products,therefore have to be moved through the innermembrane with the help of special transport-ers.
A. Transport systems
The transport systems of the inner mitochon-drial membrane use various mechanisms.Metabolites or ions can be transported alone(uniport, U), together with a second substance(symport, S), or in exchange for another mol-ecule (antiport, A). Active transport—i. e.,transport coupled to ATP hydrolysis—doesnot play an important role in mitochondria.The driving force is usually the proton gra-dient across the inner membrane (blue star)or the general membrane potential (red star;see p. 126).
The pyruvate (left) formed by glycolysis inthe cytoplasm is imported into the matrix inantiport with OH–. The OH– ions react in theintermembrane space with the H+ ions abun-dantly present there to form H2O. This main-tains a concentration gradient of OH–. Theimport of phosphate (H2PO4
–) is driven in asimilar way. The exchange of the ATP formedin the mitochondrion for ADP via an adeninenucleotide translocase (center) is also depen-dent on the H+ gradient. ATP with a quadruplenegative charge is exchanged for ADP with atriple negative charge, so that overall onenegative charge is transported into the H+-rich intermembrane space. The import of ma-late by the tricarboxylate transporter, which isimportant for the malate shuttle (see B) iscoupled to the export of citrate, with a netexport of one negative charge to the exterioragain. In the opposite direction, malate canleave the matrix in antiport for phosphate.When Ca2+ is imported (right), the metal cat-ion follows the membrane potential. An elec-troneutral antiport for two H+ or two Na+
serves for Ca2+ export.
B. Malate and glycerophosphate shuttles
Two systems known as “shuttles” are avail-able to allow the import of reducing equiva-lents that arise from glycolysis in the cyto-plasm in the form of NADH+H+. There is notransporter in the inner membrane forNADH+H+ itself.
In the malate shuttle (left)—which operatesin the heart, liver, and kidneys, for exam-ple—oxaloacetic acid is reduced to malate bymalate dehydrogenase (MDH, [2a]) with thehelp of NADH+H+. In antiport for 2-oxogluta-rate, malate is transferred to the matrix,where the mitochondrial isoenzyme forMDH [2b] regenerates oxaloacetic acid andNADH+H+. The latter is reoxidized by complexI of the respiratory chain, while oxaloaceticacid, for which a transporter is not available inthe inner membrane, is first transaminated toaspartate by aspartate aminotransferase (AST,[3a]). Aspartate leaves the matrix again, andin the cytoplasm once again supplies oxalo-acetate for step [2a] and glutamate for returntransport into the matrix [3b]. On balance,only NADH+H+ is moved from the cytoplasminto the matrix; ATP is not needed for this.
The glycerophosphate shuttle (right) wasdiscovered in insect muscle, but is also activein the skeletal musculature and brain inhigher animals. In this shuttle, NADH+H+
formed in the cytoplasm is used to reduceglycerone 3-phosphate, an intermediate ofglycolysis (see p. 150) to glycerol 3-phos-phate. Via porins, this enters the intermem-brane space and is oxidized again there on theexterior side of the inner membrane by theflavin enzyme glycerol 3-phosphate dehydro-genase back into glycerone 3-phosphate. Thereducing equivalents are passed on to therespiratory chain via ubiquinone (coenzymeQ).
The carnitine shuttle for transporting acylresidues into the mitochondrial matrix is dis-cussed on p. 164.
212 Organelles
All rights reserved. Usage subject to terms and conditions of license.Koolman, Color Atlas of Biochemistry, 2nd edition © 2005 Thieme

N AGlu
AspN A
Glu
Asp N A
2H , O+
H2O
1
5
42a 2b
3a 3b
3a
3b 2a1
2b
Q
I
4
5
H +
H +
(Na )+
Ca2 +
Ca2 +
HPO42
HPO42
ATP 4
ADP 3
ATP 4
ADP 3
H2PO4
H2PO4
OH
OH
H2O
A
U
A
AA
A
A
N A
+
A. Transport systems
B. Malate and glycerophosphate shuttle
Driving force:
Inner mitochondrial membrane
Malateshuttle
Glyco-lysis
Glucose 6-phosphate
Fructose 1,6-bisphosphate
Glycerone 3-phosphate
Glyceral 3-phosphate
Oxalo-acetate
Glycerophos-phate shuttle
2-Oxo-glutarate
Cyto-plasm
Outer
Mitochon-drialmembrane
2-Oxo-glutarate
Complex III
Complex IV
Ubiquinone
Complex I
Porin
Malate dehydrogenase 1.1.1.37Glyceraldehyde3-phosphatedehydrogenase1.2.1.12
Aspartate transaminase 2.6.1.1
Glycerol 3-phosphate dehydrogenase 1.1.1.8
Glyceral 3-phosphate DH (FAD) 1.1.99.5
Glycerol 3-phosphate
1,3-Bisphos-phoglycerate
Pyruvate
Malate –
2-Oxoglutarate/citrate
Malate–2-oxo-glutarate/citrate
Membranepotential
Protongradient
BreakdownConversion
ATP synthesis
Citrate exportMalate shuttle
storage release
Ca2+
Ca2+
NADH + HCytoplasma
+
Pyruvate
Malate
Oxalo-acetate
Malate
Inner
Matrix NADH + HMitochondrion
213Mitochondria
All rights reserved. Usage subject to terms and conditions of license.Koolman, Color Atlas of Biochemistry, 2nd edition © 2005 Thieme

Structure and components
A. Structure of the plasma membrane
All biological membranes are constructed ac-cording to a standard pattern. They consist ofa continuous bilayer of amphipathic lipids ap-proximately 5 nm thick, into which proteinsare embedded. In addition, some membranesalso carry carbohydrates (mono- and oligo-saccharides) on their exterior, which arebound to lipids and proteins. The proportionsof lipids, proteins, and carbohydrates differmarkedly depending on the type of cell andmembrane (see p. 216).
Membrane lipids are strongly amphipathicmolecules with a polar hydrophilic “headgroup” and an apolar hydrophobic “tail.” Inmembranes, they are primarily held togetherby the hydrophobic effect (see p. 28) andweak Van der Waals forces, and are thereforemobile relative to each other. This gives mem-branes a more or less fluid quality.
The fluidity of membranes primarily de-pends on their lipid composition and on tem-perature. At a specific transition temperature,membranes pass from a semicrystalline stateto a more fluid state. The double bonds in thealkyl chains of unsaturated acyl residues inthe membrane lipids disturb the semicrystal-line state. The higher the proportion of unsa-turated lipids present, therefore, the lower thetransition temperature. The cholesterol con-tent also influences membrane fluidity. Whilecholesterol increases the fluidity of semicrys-talline, closely-packed membranes, it stabil-izes fluid membranes that contain a high pro-portion of unsaturated lipids.
Like lipids, proteins are also mobile withinthe membrane. If they are not fixed in placeby special mechanisms, they float within thelipid layer as if in a two-dimensional liquid;biological membranes are therefore also de-scribed as being a “fluid mosaic.”
Lipids and proteins can shift easily withinone layer of a membrane, but switching be-tween the two layers (“flip/flop”) is not possi-ble for proteins and is only possible with dif-ficulty for lipids (with the exception of cho-lesterol). To move to the other side, phospho-lipids require special auxiliary proteins(translocators, “flipases”).
B. Membrane lipids
The illustration shows a model of a smallsection of a membrane. The phospholipidsare the most important group of membranelipids. They include phosphatidylcholine(lecithin), phosphatidylethanolamine, phos-phatidylserine, phosphatidylinositol, andsphingomyelin (for their structures, seep. 50). In addition, membranes in animal cellsalso contain cholesterol (with the exceptionof inner mitochondrial membranes). Glycoli-pids (a ganglioside is shown here) are mainlyfound on the outside of the plasma mem-brane. Together with the glycoproteins, theyform the exterior coating of the cell (the gly-cocalyx).
C. Membrane proteins
Proteins can be anchored in or on membranesin various ways. Integral membrane proteinscross right through the lipid bilayer. The sec-tions of the peptide chains that lie within thebilayer usually consist of 20 to 25 mainlyhydrophobic amino acid residues that form aright-handed α-helix.
Type I and II membrane proteins onlycontain one transmembrane helix of thistype, while type III proteins contain several.Rarely, type I and II polypeptides can aggre-gate to form a type IV transmembrane pro-tein. Several groups of integral membraneproteins—e. g., the porins (see p. 212)—pene-trate the membrane with antiparallel β-sheetstructures. Due to its shape, this tertiarystructure is known as a “β-barrel.”
Type V and VI proteins carry lipid anchors.These are fatty acids (palmitic acid, myristicacid), isoprenoids (e. g., farnesol), or glycoli-pids such as glycosyl phosphatidylinositol(GPI) that are covalently bound to the peptidechain.
Peripheral membrane proteins are associ-ated with the head groups of phospholipidsor with another integral membrane protein(not shown).
214 Organelles
All rights reserved. Usage subject to terms and conditions of license.Koolman, Color Atlas of Biochemistry, 2nd edition © 2005 Thieme

e f g h
a b c da
b
c
d
e
f
g
h
N
C
C
N
Polar
Outerleaflet
Innerleaflet
Type I Type II Type III Type IV Type V
1. α-Helical 2. β-Barrel
Apolar
Polar
Lipidanchor
C. Membrane proteins
TypeVI
Phosphatidyl-inositol
Sphingomyelin
Ganglioside
Phosphatidyl-ethanolamine
Cerebroside
Phosphatidyl-choline
Cholesterol
Phosphatidyl-serine
Phospholipids
Glycolipids
Cholesterol
A. Structure of the plasma membrane
Extracellularside
Glycoprotein
Glycolipid
Phospholipid
Integralmembrane proteins
Peripheralmembraneprotein
Cytoplasmicside
Oligosaccharide
B. Membrane lipids
5 nm
Lipidbilayer
215Biological membranes
All rights reserved. Usage subject to terms and conditions of license.Koolman, Color Atlas of Biochemistry, 2nd edition © 2005 Thieme

Functions and composition
The most important membranes in animalcells are the plasma membrane, the innerand outer nuclear membranes, the mem-branes of the endoplasmic reticulum (ER) andthe Golgi apparatus, and the inner and outermitochondrial membranes. Lysosomes, peroxi-somes, and various vesicles are also separatedfrom the cytoplasm by membranes. In plants,additional membranes are seen in the plastidsand vacuoles. All membranes show pola-rity—i. e., there is a difference in the composi-tion of the inner layer (facing toward thecytoplasm) and the outer layer (facing awayfrom it).
A. Functions of membranes
Membranes and their components have thefollowing functions:
1. Enclosure and insulation of cells and or-ganelles. The enclosure provided by theplasma membrane protects cells from theirenvironment both mechanically and chemi-cally. The plasma membrane is essential formaintaining differences in the concentrationof many substances between the intracellularand extracellular compartments.
2. Regulated transport of substances,which determines the internal milieu and isa precondition for homeostasis—i. e., themaintenance of constant concentrations ofsubstances and physiological parameters.Regulated and selective transport of substan-ces through pores, channels, and transporters(see p. 218) is necessary because the cells andorganelles are enclosed by membrane sys-tems.
3. Reception of extracellular signals andtransfer of these signals to the inside of thecell (see pp. 384ff.), as well as the productionof signals.
4. Enzymatic catalysis of reactions. Impor-tant enzymes are located in membranes at theinterface between the lipid and aqueousphases. This is where reactions with apolarsubstrates occur. Examples include lipidbiosynthesis (see p. 170) and the metabolismof apolar xenobiotics (see p. 316). The mostimportant reactions in energy conver-sion—i. e., oxidative phosphorylation (see
p. 140) and photosynthesis (see p. 128)—alsooccur in membranes.
5. Interactions with other cells for the pur-poses of cell fusion and tissue formation, aswell as communication with the extracellularmatrix.
6. Anchoring of the cytoskeleton (seep. 204) to maintain the shape of cells andorganelles and to provide the basis for move-ment processes.
B. Composition of membranes
Biological membranes consist of lipids, pro-teins, and carbohydrates (see p. 214). Thesecomponents occur in varying proportions(left). Proteins usually account for the largestproportion, at around half. By contrast, carbo-hydrates, which are only found on the sidefacing away from the cytoplasm, make uponly a few percent. An extreme compositionis seen in myelin, the insulating material innerve cells, three-quarters of which consistsof lipids. By contrast, the inner mitochondrialmembrane is characterized by a very low pro-portion of lipids and a particularly high pro-portion of proteins.
When the individual proportions of lipidsin membranes are examined more closely(right part of the illustration), typical patternsfor particular cells and tissues are also found.The illustration shows the diversity of themembrane lipids and their approximatequantitative composition. Phospholipids arepredominant in membrane lipids in compar-ison with glycolipids and cholesterol. Triacyl-glycerols (neutral fats) are not found in mem-branes.
Cholesterol is found almost exclusively ineukaryotic cells. Animal membranes containsubstantially more cholesterol than plantmembranes, in which cholesterol is usuallyreplaced by other sterols. There is no choles-terol at all in prokaryotes (with a few excep-tions). The inner mitochondrial membrane ofeukaryotes is also low in cholesterol, while itis the only membrane that contains largeamounts of cardiolipin. These facts both sup-port the endosymbiotic theory of the devel-opment of mitochondria (see p. 210).
216 Organelles
All rights reserved. Usage subject to terms and conditions of license.Koolman, Color Atlas of Biochemistry, 2nd edition © 2005 Thieme

A+BC+DA
A
B
B
1
4
5
6
32
*
*
**
* *
*
S
***
*
Boundary Controlledmetabolitetransport
Signal re-ception andtransmission
Enzymaticreactions
Contactwithother cells
Anchorfor cyto-skeleton
A. Functions of membranes
B. Composition of membranes
Nerve cell: Plasma membrane
Liver cell: Plasma membrane
Erythrocyte: Plasma membrane
Mitochondrion
Carbohydrates
Lipids
Proteins
Glycolipids
Sphingomyelin
Phosphatidyl-cholinePhosphatidyl-serinePhosphatidyl-ethanolamine
Cholesterol
Membrane components Relative proportion of lipids
Phospholipids
Other lipids
Cardiolipin
Inner membrane Both membranes
217Biological membranes
All rights reserved. Usage subject to terms and conditions of license.Koolman, Color Atlas of Biochemistry, 2nd edition © 2005 Thieme

Transport processes
A. Permeability
Only small, uncharged molecules such asgases, water, ammonia, glycerol, or urea areable to pass through biological membranes byfree diffusion. With increasing size, even com-pounds of this type are no longer able to passthrough. Membranes are impermeable to glu-cose and other sugars, for example.
The polarity of a molecule is also impor-tant. Apolar substances, such as benzene,ethanol, diethyl ether, and many narcoticagents are able to enter biological membraneseasily. By contrast, membranes are imperme-able to strongly polar compounds, particu-larly those that are electrically charged. Tobe able to take up or release molecules ofthis type, cells have specialized channels andtransporters in their membranes (see below).
B. Passive and active transport
Free diffusion is the simplest form of mem-brane transport. When it is supported by in-tegral membrane proteins, it is known as fa-cilitated diffusion (or facilitated transport).
1. Channel proteins have a polar porethrough which ions and other hydrophiliccompounds can pass. For example, there arechannels that allow selected ions to pass (ionchannels; see p. 222) and porins that allowmolecules below a specific size to pass in amore or less nonspecific fashion (see p. 212).
2. Transporters recognize and bind themolecules to be transported and help themto pass through the membrane as a result of aconformational change. These proteins (per-meases) are thus comparable with enzy-mes—although with the difference that they“catalyze” vectorial transport rather than anenzymatic reaction. Like enzymes, they showa certain affinity for each molecule trans-ported (expressed as the dissociationconstant, Kd in mol L–1) and a maximumtransport capacity (V).
Free diffusion and transport processes fa-cilitated by ion channels and transport pro-teins always follow a concentration gradient—i. e., the direction of transport is from thesite of higher concentration to the site oflower concentration. In ions, the membrane
potential also plays a role; the processes aresummed up by the term “electrochemicalgradient” (see p. 126). These processes there-fore involve passive transport, which runs“downhill” on the slope of a gradient.
By contrast, active transport can also run“uphill”—i. e., against a concentration orcharge gradient. It therefore requires an inputof energy, which is usually supplied by thehydrolysis of ATP (see p. 124). The transporterfirst binds its “cargo” on one side of the mem-brane. ATP-dependent phosphorylation thencauses a conformation change that releasesthe cargo on the other side of the membrane(see p. 220). A non-spontaneous transportprocess can also take place through couplingto another active transport process (known assecondary active transport; see p. 220).
Using the transport systems in the mem-branes, cells regulate their volume, internalpH value, and ionic environment. They con-centrate metabolites that are important forenergy metabolism and biosynthesis, and ex-clude toxic substances. Transport systemsalso serve to establish ion gradients, whichare required for oxidative phosphorylationand stimulation of muscle and nerve cells,for example (see p. 350).
C. Transport processes
Another classification of transport processesis based on the number of particles trans-ported and the direction in which theymove. When a single molecule or ion passesthrough the membrane with the help of achannel or transporter, the process is de-scribed as a uniport (example: the transportof glucose into liver cells). Simultaneoustransport of two different particles can takeplace either as a symport (example: the trans-port of amino acids or glucose together withNa+ ions into intestinal epithelial cells) or asan antiport. Ions are often transported in anantiport in exchange for another similarlycharged ion. This process is electroneutraland therefore more energetically favorable(example: the exchange of HCO3
– for Cl– atthe erythrocyte membrane).
218 Organelles
All rights reserved. Usage subject to terms and conditions of license.Koolman, Color Atlas of Biochemistry, 2nd edition © 2005 Thieme

219Biological membranes
Pore
P
P
AP P
AP P P
P
H2ONa
Cl
HCO3
U
S
A
HCO3
Cl
Freediffusion
Nomembranepassage Facilitated
diffusion
Freediffusion
Electrochemical gradientCharge gradient
Channelprotein
TransportATPase
Activetransport
Passivetransport
Lowconcentration
Transporter
Confor-mationalchange
Confor-mationalchange
A. Permeability of membranes B. Passive and active transport
Small molecules
Large molecules
Apolar
Polar, uncharged
Polar, uncharged
O2, N2Benzene
e.g. glucose
C. Transport processes
H2OUreaGlycerolCO2 , NH3
IonsH , Na , K , Mg2
Ca2 , NH4HCO3 , Cl , H2PO4
Amino acidsNucleotides
Uniport
Symport
Antiport
Glucose
Glucose
Highconcentration
All rights reserved. Usage subject to terms and conditions of license.Koolman, Color Atlas of Biochemistry, 2nd edition © 2005 Thieme

Transport proteins
Illustrations B–D show transporters whosestructure has been determined experimen-tally or established on analogy with otherknown structures. They all belong to groupIII of the α-helical transmembrane proteins(see p. 214).
A. Transport mechanisms
Some cells couple the “pure” transport formsdiscussed on p. 218—i. e., passive transport (1)and active transport (2)—and use this mech-anism to take up metabolites. In secondaryactive transport (3), which is used for exam-ple by epithelial cells in the small intestineand kidney to take up glucose and aminoacids, there is a symport (S) located on theluminal side of the membrane, which takes upthe metabolite M together with an Na+ ion.An ATP-dependent Na+ transporter (Na+/K+
ATPase; see p. 350) on the other side keepsthe intracellular Na+ concentration low andthus indirectly drives the uptake of M. Finally,a uniport (U) releases M into the blood.
B. Glucose transporter Glut-1
The glucose transporters (Glut) are a family ofrelated membrane proteins with varying dis-tribution in the organs. Glut-1 and Glut-3have a relatively high af nity for glucose (Kd
= 1 mM). They occur in nearly all cells, andensure continuous glucose uptake. Glut-2 isfound in the liver and pancreas. This form hasa lower af nity (Kd = 15–20 mM). The rate ofglucose uptake by Glut-2 is therefore stronglydependent on the blood glucose level (nor-mally 4–8 mM). Transport by Glut-4 (Kd =5 mM), which is mainly expressed in muscleand fat cells, is controlled by insulin, whichincreases the number of transporters on thecell surface (see p. 388). Glut-5 mediates sec-ondary active resorption of glucose in the in-testines and kidney (see A).
Glut-1 consists of a single peptide chainthat spans the membrane with 12 α-helicesof different lengths. The glucose is bound bythe peptide loops that project on each side ofthe membrane.
C. Aquaporin-1
Aquaporins help water to pass through bio-logical membranes. They form hydrophilicpores that allow H2O molecules, but not hy-drated ions or larger molecules, to passthrough. Aquaporins are particularly impor-tant in the kidney, where they promote thereuptake of water (see p. 328). Aquaporin-2in the renal collecting ducts is regulated byantidiuretic hormone (ADH, vasopressin),which via cAMP leads to shifting of the chan-nels from the ER into the plasma membrane.
Aquaporin-1, shown here, occurs in theproximal tubule and in Henle’s loop. It con-tains eight transmembrane helices with dif-ferent lengths and orientations. The yellow-colored residues form a narrowing that onlyH2O molecules can overcome.
D. Sarcoplasmic Ca2+ pump
Transport ATPases transport cations—they are“ion pumps.” ATPases of the F type—e. g., mito-chondrial ATP synthase (see p. 142)—use H+
transport for ATP synthesis. Enzymes of the Vtype, using up ATP, “pump” protons into lyso-somes and other acidic cell compartments (seep. 234). P type transport ATPases are particu-larly numerous. These are ATP-driven cationtransporters that undergo covalent phosphor-ylation during the transport cycle.
The Ca2+ ATPase shown also belongs to theP type. In muscle, its task is to pump the Ca2+
released into the cytoplasm to trigger musclecontraction back into the sarcoplasmic retic-ulum (SR; see p. 334). The molecule (1) con-sists of a single peptide chain that is folded intovarious domains. In the transmembrane part,which is formed by numerous α-helices, thereare binding sites for two Ca2+ ions (blue) ATPis bound to the cytoplasmic N domain (green).
Four different stages can be distinguishedin the enzyme’s catalytic cycle (2). First, bind-ing of ATP to the N domain leads to the uptakeof two Ca2+ into the transmembrane part (a).Phosphorylation of an aspartate residue in theP domain (b) and dissociation of ADP thencauses a conformation change that releasesthe Ca2+ ions into the SR (c). Finally, dephos-phorylation of the aspartate residue restoresthe initial conditions (d).
220 Organelles
All rights reserved. Usage subject to terms and conditions of license.Koolman, Color Atlas of Biochemistry, 2nd edition © 2005 Thieme

M
N
N C
H2O
Na
MM
M
ES
U
a)
b)
c)
d)
ATP
P PA
AP P P
P+
P PA
AP P P
P+
P PA
AP P P
P
P
P PA
Ca2
P
AP P P
N C
Na
M
P
N
β
A. Transport mechanisms
D. Sarcoplasmic Ca2 pumpB. Glucose transporter Glut-1
C. Aquaporin-1
Lum
en Epithelial cells
1. Facilitated diffusion 2. Active transport 3. Secondary active transport
Glucose
Blood
Plasmamembrane
Cytoplasm
Tubularlumen
Plasmamembrane
Tubule cell
Bloo
d
Glucose
Cyto-plasm
“Stalk”
Trans-membranedomain
Bindingsitesfor Ca2
1. Structure
2. Catalytic cycle
Bindingsite forATP
SR
Dom
ains
221Biological membranes
All rights reserved. Usage subject to terms and conditions of license.Koolman, Color Atlas of Biochemistry, 2nd edition © 2005 Thieme

Ion channels
Ion channels facilitate the diffusion of ionsthrough biological membranes. Some ionchannels open and close depending on themembrane potential (voltage-gated channels,A) or in response to specific ligands (ligand-gated channels, B). Other channels operatepassively. In these cases, transport dependsonly on the concentration gradient (C).
A. Voltage-gated Na+ channel
Voltage-gated Na+ channels play a decisivepart in the conduction of electrical impulsesin the nervous system (see p. 350). Thesechannels open when the membrane potentialin their environment reverses. Due to the highequilibrium potential for Na+ (see p. 126), aninflow of Na+ ions takes place, resulting inlocal depolarization of the membrane, whichpropagates by activation of neighboring volt-age-dependent Na+ channels. A spreading de-polarization wave of this type is known as anaction potential (see p. 350). Externally di-rected K+ channels are involved in the repola-rization of the membrane. In their function-ing, these resemble the much more simplystructured K+ channels shown in C. The Ca2+
channels that trigger exocytosis of vesicles(see p. 228) are also controlled by the actionpotential.
The voltage-gated Na+ channels in higheranimals are large complexes made up of sev-eral subunits. The α-subunit shown here me-diates Na+ transport. It consists of a very longpeptide chain (around 2000 amino acid resi-dues), which is folded into four domains, eachwith six transmembrane helices (left). The S6helices of all the domains (blue) togetherform a centrally located hydrophilic porewhich can be made narrow or wide depend-ing on the channel’s functional status. The sixS4 helices (green) function as voltage sensors.
The current conception of the way in whichthe opening and closing mechanism functionsis shown in a highly simplified form on theright. For the sake of clarity, only one of thefour domains (domain IV) is shown. The S4helices contain several positively charged res-idues. When the membrane is polarized (a),the surplus negative charges on the inner sidekeep the helix in the membrane. If this attrac-tion is removed as a result of local depolariza-
tion, the S4 helices are thought to snap up-wards like springs and thus open the centralpore (b).
B. Nicotinic acetylcholine receptor
Many receptors for neurotransmitters func-tion as ligand-gated channels for Na+, K+
and/or Ca2+ ions (see p. 354). The ones thathave been studied in the greatest detail arethe nicotinic receptors for acetylcholine (seep. 352). These consist of five separate butstructurally closely related subunits. Eachforms four transmembrane helices, the sec-ond of which is involved in the central pore ineach case. The type of monomer and its ar-rangement in the complex is not identical inall receptors of this type. In the neuromuscu-lar junction (see p. 334), the arrangementαβγαδ is found (1).
In the interior of the structure, acetylcho-line binds to the two α-subunits and thusopens the pore for a short time (1–2 ms).Negatively charged residues are arranged inthree groups in a ring shape inside it. They areresponsible for the receptor’s ion specificity. Itis thought that binding of the neurotransmit-ter changes the position of the subunits insuch a way that the pore expands (3). Thebound acetylcholine dissociates again and ishydrolytically inactivated (see p. 356). Thereceptor is thus able to function again.
C. K+ channel in Streptomyces lividans
The only detailed structures of ion channelsestablished so far are those of potassiumchannels like that of an outwardly directedK+ channel in the bacterium Streptomyces liv-idans. It consists of four identical subunits(blue, yellow, green, and red), each of whichcontains two long α-helices and one shorterone. In the interior of the cell (bottom), the K+
ions (violet) enter the structure’s centralchannel. Before they are released to the out-side, they have to pass through what is knownas a “selectivity filter.” In this part of thechannel, several C=O groups in the peptidechain form a precisely defined opening thatis only permeable to non-hydrated K+ ions.
222 Organelles
All rights reserved. Usage subject to terms and conditions of license.Koolman, Color Atlas of Biochemistry, 2nd edition © 2005 Thieme

I II III IV
N Ca
b
δ βαL Hα
K
DBA C
Na
1
2 3
4
56
1
2
34
5
6
N C γδ αα β
Na
1 2 3 5 64
C. K + channel in Streptomyces lividans
α-Subunit
Voltage-sensitivehelix(helix 4)
Narrow poreMembranepolarized,helix 4in position 1
Wide pore
Membranedepolarized,helix 4in position 2
A. Voltage-gated Na+ channel
1. Structure 2. Pore
2. Mechanism1. Structure
B. Nicotinic acetylcholine receptor
3. Mechanism
Acetyl-choline
Helix 2
Na
Subunits
Outside
Pore
Inside
Homotetramer
Outside
Plasmamembrane
Inside
Subunits
Outside
Plasma-membrane
Inside
From above
223Biological membranes
All rights reserved. Usage subject to terms and conditions of license.Koolman, Color Atlas of Biochemistry, 2nd edition © 2005 Thieme

Membrane receptors
To receive and pass on chemical or physicalsignals, cells are equipped with receptor pro-teins. Many of these are integral membraneproteins in the plasma membrane, wherethey receive signals from their surroundings.Other receptor proteins are located in inter-cellular membranes. The receptors for lipo-philic hormones are among the few that func-tion in a soluble form. They regulate genetranscription in the nucleus (see p. 378).
A. Principle of receptor action
Membrane-located receptors can be dividedinto three parts, which have different tasks.The receptor domain reacts specifically to agiven signal. Signals of this type can be of apurely physical nature. For example, manyorganisms react to light. In this way, plantsadapt growth and photosynthesis to lightconditions, while animals need light recep-tors for visual processing (C; see p. 358). Me-chanoreceptors are involved in hearing and inpressure regulation, among other things.Channels that react to action potentials (seep. 350) can be regarded as receptors for elec-trical impulses.
However, most receptors do not react tophysical stimuli, but rather to signal mole-cules. Receptors for these chemical signalscontain binding sites in the receptor domainthat are complementary to each ligand. In thisrespect, they resemble enzymes (see p. 94).As the effector domain of the receptor is usu-ally separated by a membrane, a mechanismfor signal transfer between the domains isneeded. Little is yet known regarding this. Itis thought that conformation changes in thereceptor protein play a decisive part. Somereceptors dimerize after binding of the ligand,thereby bringing the effector domains of twomolecules into contact (see p. 392).
The way in which the effector works differsfrom case to case. By binding or interconver-sion, many receptors activate special media-tor proteins, which then trigger a signal cas-cade (signal transduction; see p. 384). Otherreceptors function as ion channels. This isparticularly widespread in receptors for neu-rotransmitters (see p. 354).
B. Insulin receptor
The receptor for the hormone insulin (seep. 76) belongs to the family of 1-helix recep-tors.
These molecules span the membrane withonly one α-helix. The subunits of the dimericreceptor (red and blue) each consist of twopolypeptides (α and β) bound by disulfidebonds. The α-chains together bind the insulin,while the β-chains contain the transmem-brane helix and, at the C-terminus, domainswith tyrosine kinase activity. In the activatedstate, the kinase domains phosphorylatethemselves and also mediator proteins (re-ceptor substrates) that set in motion cascadesof further phosphorylations (see pp. 120 and388).
C. 7-helix receptors
A large group of receptors span the mem-brane with α-helices seven times. These areknown as 7-helix receptors. Via their effectordomains, they bind and activate trimeric pro-teins, which in turn bind and hydrolyze GTPand are therefore called G proteins. Most Gproteins, in turn, activate or inhibit enzymesthat create secondary signaling molecules(second messengers; see p. 386). Other G pro-teins regulate ion channels. The illustrationshows the complex of the light receptor rho-dopsin, with the associated G protein trans-ducin (see p. 358). The GTP-binding α-subunit(green) and the γ-subunit (violet) of transdu-cin are anchored in the membrane via lipids(see p. 214). The β-subunit is shown in detailon p. 72.
D. T-cell receptor
The cells of the immune system communicatewith each other particularly intensively. TheT-cell receptor plays a central role in the acti-vation of T lymphocytes (see p. 296). The cellat the top has been infected with a virus, andit indicates this by presenting a viral peptide(violet) with the help of a class I MHC protein(yellow and green). The combination of thetwo molecules is recognized by the dimericT-cell receptor (blue) and converted into asignal that activates the T cell (bottom) andthereby enhances the immune response tothe virus.
224 Organelles
All rights reserved. Usage subject to terms and conditions of license.Koolman, Color Atlas of Biochemistry, 2nd edition © 2005 Thieme

GTP
α2 α1
β2 β1
P P
P P
α2 α1
β2 β1
GDP
GDP
Chemical signals
MetabolitesHormonesNeurotransmittersMediatorsOdorantsTastantsOther moleculesInorganic ions
Physical signals
LightElectrical impulsesMechanical stimuli
ActivatorProtein kinaseIon channel
A. Principle of receptor action
D. T-cell receptorB. Insulin receptor
Cellular response
Protein activatedby ions
G-proteinreceptor substrate
ReceptorLipidanchor
G proteinβ-Sub-unit
γ-Sub-unit
Signalingsubstance
G protein Effectorenzyme
Activatedreceptor
GTP
α-Sub-unit
PrecursorSecondmessenger
Mediator
C. 7-Helix receptors
Insulin
Tyrosinekinasedomain
Adaptorprotein
Receptorsubstrate
Adaptorprotein
Protein kinase Protein kinase
Antigen-presenting cell
T-helper cell
Viralpeptide
β2-Micro-globulin
MHCprotein(class I)
T-cellreceptor
Effector
Signal
Recipient
Transmitter
Cellular response
225Biological membranes
All rights reserved. Usage subject to terms and conditions of license.Koolman, Color Atlas of Biochemistry, 2nd edition © 2005 Thieme

ER: structure and function
The endoplasmic reticulum (ER) is an exten-sive closed membrane system consisting oftubular and saccular structures. In the areaof the nucleus, the ER turns into the externalnuclear membrane. Morphologically, a dis-tinction is made between the rough ER (rER)and the smooth ER (sER). Large numbers ofribosomes are found on the membranes of therER, which are lacking on the sER. On theother hand, the sER is rich in membrane-bound enzymes, which catalyze partial reac-tions in the lipid metabolism as well as bio-transformations.
A. Rough endoplasmic reticulum and theGolgi apparatus
The rER (1) is a site of active proteinbiosynthesis. This is where proteins destinedfor membranes, lysosomes, and export fromthe cell are synthesized. The remaining pro-teins are produced in the cytoplasm on ribo-somes that are not bound to membranes.
Proteins synthesized at the rER (1) arefolded and modified after translation (proteinmaturation; see p. 230). They remain either inthe rER as membrane proteins, or pass withthe help of transport vesicles (2) to the Golgiapparatus (3). Transport vesicles are formedby budding from existing membranes, andthey disappear again by fusing with them(see p. 228).
The Golgi apparatus (3) is a complex net-work, also enclosed, consisting of flattenedmembrane saccules (“cisterns”), which arestacked on top of each other in layers. Pro-teins mature here and are sorted and packed.A distinction is made between the cis, medial,and trans Golgi regions, as well as a transGolgi network (tGN). The post–translationalmodification of proteins, which starts in theER, continues in these sections.
From the Golgi apparatus, the proteins aretransported by vesicles to various targets inthe cells—e. g., to lysosomes (4), the plasmamembrane (6), and secretory vesicles (5) thatrelease their contents into the extracellularspace by fusion with the plasma membrane(exocytosis; see p. 228). Protein transport caneither proceed continuously (constitutive), orit can be regulated by chemical signals. Thedecision regarding which pathway a protein
will take and whether its transport will beconstitutive or regulated depends on the sig-nal sequences or signal structures that pro-teins carry with them like address labels (seep. 228). In addition to proteins, the Golgi ap-paratus also transports membrane lipids totheir targets.
B. Smooth endoplasmic reticulum
Regions of the ER that have no bound ribo-somes are known as the smooth endoplasmicreticulum (sER). In most cells, the proportionrepresented by the sER is small. A marked sERis seen in cells that have an active lipid me-tabolism, such as hepatocytes and Leydigcells. The sER is usually made up of branching,closed tubules.
Membrane-located enzymes in the sERcatalyze lipid synthesis. Phospholipid synthe-sis (see p. 170) is located in the sER, for exam-ple, and several steps in cholesterol biosyn-thesis (see p. 172) also take place there. Inendocrine cells that form steroid hormones, alarge proportion of the reaction steps in-volved also take place in the sER (see p. 376).
In the liver’s hepatocytes, the proportionrepresented by the sER is particularly high.It contains enzymes that catalyze so-calledbiotransformations. These are reactions inwhich apolar foreign substances, as well asendogenous substances—e. g., steroid hormo-nes—are chemically altered in order to inacti-vate them and/or prepare them for conjuga-tion with polar substances (phase I reactions;see p. 316). Numerous cytochrome P450enzymes are involved in these conversions(see p. 318) and can therefore be regardedas the major molecules of the sER.
The sER also functions as an intracellularcalcium store, which normally keeps the Ca2+
level in the cytoplasm low. This function isparticularly marked in the sarcoplasmic retic-ulum, a specialized form of the sER in musclecells (see p. 334). For release and uptake ofCa2+, the membranes of the sER contain sig-nal-controlled Ca2+ channels and energy-de-pendent Ca2+ ATPases (see p. 220). In the lu-men of the sER, the high Ca2+ concentration isbuffered by Ca2+-binding proteins.
226 Organelles
All rights reserved. Usage subject to terms and conditions of license.Koolman, Color Atlas of Biochemistry, 2nd edition © 2005 Thieme

Ca2 +
Morphologicalstructures
Biochemicalprocesses
2. Transport2. vesicle
3. Golgi complex
4. Lysosome
1. rER
5. Secretory5. vesicle
6. Cytoplasmic6. membrane
2. Protein synthesis2. and folding2. Signal peptide2. cleavage2. Formation of2. disulfide bonds2. Oligomerization2. N-Glycosylation
folding
1. Transport
3. cis:3. Phosphorylation3. medial:3. Sugar cleavage3. Addition of GlcNAc3. Addition of3. Gal and NeuAc3. trans-Golgi network:3. Sorting
cis
medial
trans
trans-Golgi networkMembraneprotein
Nucleus
4. Hydrolysis of4. macromolecules
6. Exocytosis
5. Proteolysis
A. Rough endoplasmic reticulum and Golgi apparatus
B. Smooth endoplasmic reticulum
Phospholipids CholesterolSteroidhormones
Xeno-biotics
Metabolites
Enzyme systemsof the lipid metabolism
Calcium storeOutside
Plasmamembrane
Inside
227Endoplasmic reticulum and Golgi apparatus
All rights reserved. Usage subject to terms and conditions of license.Koolman, Color Atlas of Biochemistry, 2nd edition © 2005 Thieme

Protein sorting
A. Protein sorting
The biosynthesis of all proteins starts on freeribosomes (top). However, the paths that theproteins follow soon diverge, depending onwhich target they are destined for. Proteinsthat carry a signal peptide for the ER (1) followthe secretory pathway (right). Proteins that donot have this signal follow the cytoplasmicpathway (left).
Secretory pathway. Ribosomes that syn-thesize a protein with a signal peptide forthe ER settle on the ER (see p. 228). The pep-tide chain is transferred into the lumen of therER. The presence or absence of other signalsequences and signal regions determines thesubsequent transport pathway.
Proteins that have stop-transfer sequences(4) remain as integral membrane proteins inthe ER membrane. They then pass into othermembranes via vesicular transport (seep. 226). From the rER, their pathway thenleads to the Golgi apparatus and then on tothe plasma membrane. Proteins destined toremain in the rER—e. g., enzymes—find theirway back from the Golgi apparatus to the rERwith the help of a retention signal (2). Otherproteins move from the Golgi apparatus tothe lysosomes (3; see p. 234), to the cellmembrane (integral membrane proteins orconstitutive exocytosis), or are transportedout of the cell (9; signal-regulated exocytosis)by secretory vesicles (8).
Cytoplasmic pathway. Proteins that do nothave a signal peptide for the ER are synthe-sized in the cytoplasm on free ribosomes, andremain in that compartment. Special signalsmediate further transport into the mitochon-dria (5; see p. 232), the nucleus (6; see p. 208)or peroxisomes (7).
B. Translocation signals
Signal peptides are short sections at the N or Cterminus, or within the peptide chain. Areason the protein surface that are formed byvarious sections of the chain or by variouschains are known as signal regions. Signalpeptides and signal regions are structural sig-nals that are usually recognized by receptorson organelles (see A). They move the proteins,with the help of additional proteins, into the
organelles (selective protein transfer). Struc-tural signals can also activate enzymes thatmodify the proteins and thereby determinetheir subsequent fate. Examples include lyso-somal proteins (see p. 234) and membraneproteins with lipid anchors (see p. 214).
After they have been used, signal peptidesat the N terminus are cleaved off by specifichydrolases (symbol: scissors). In proteins thatcontain several successive signal sequences,this process can expose the subsequent sig-nals. By contrast, signal peptides that have tobe read several times are not cleaved.
C. Exocytosis
Exocytosis is a term referring to processesthat allow cells to expel substances (e. g., hor-mones or neurotransmitters) quickly and inlarge quantities. Using a complex protein ma-chinery, secretory vesicles fuse completely orpartially with the plasma membrane and re-lease their contents. Exocytosis is usuallyregulated by chemical or electrical signals. Asan example, the mechanism by which neuro-transmitters are released from synapses (seep. 348) is shown here, although only the mostimportant proteins are indicated.
The decisive element in exocytosis is theinteraction between proteins known asSNAREs that are located on the vesicularmembrane (v-SNAREs) and on the plasmamembrane (t-SNAREs). In the resting state(1), the v-SNARE synaptobrevin is blocked bythe vesicular protein synaptotagmin. When anaction potential reaches the presynapticmembrane, voltage-gated Ca2+ channelsopen (see p. 348). Ca2+ flows in and triggersthe machinery by conformational changes inproteins. Contact takes place between synap-tobrevin and the t-SNARE synaptotaxin (2).Additional proteins known as SNAPs bind tothe SNARE complex and allow fusion betweenthe vesicle and the plasma membrane (3). Theprocess is supported by the hydrolysis of GTPby the auxiliary protein Rab.
The toxin of the bacterium Clostridium bot-ulinum, one of the most poisonous substancesthere is, destroys components of the exocyto-sis machinery in synapses through enzymatichydrolysis, and in this way blocks neurotrans-mission.
228 Organelles
All rights reserved. Usage subject to terms and conditions of license.Koolman, Color Atlas of Biochemistry, 2nd edition © 2005 Thieme

Rough ERH3N
*
R
RR
+ +
1
2
3
4
5
6
7
8
9
*Ca2 +
*
*
H2N-SKL
-KDEL+
1.
2.
3.
1
2
3
4
5
6
7
8
P
Ca2
Ca2
...LEDK....
P
+ + +
...KKKRK...
...FKS...
+ +H2N+
OOC+
GTP
GTP
GDP
A. Protein sorting
B. Translocation signals
Signal peptide(secretory pathway)
Signal sequence(ER proteins)
Signal group(lysosomal proteins)
Stop-transfer sequence(membrane proteins)
Signal peptide(mitochondrialproteins)
Signal sequence(nuclear proteins)
Signal region(secretory vesicle)
Signal sequence(peroxisomes)
Transmitter Rab · GTP
SNARE complex
Synapto-brevin(v-SNARE) Synapto-
tagminSyntaxin(t-SNARE)
Actionpotential
Rab · GDP
Synaptotagminreleasesv-SNAREs
Membranefusion
Vesicle
Synaptic cleft Ca2Channel
C. Exocytosis
Mannose 6-phosphate
Apolarsequence
α-Helix
SNAP+NSF
Cytoplasm
Cytoplasmic pathwayRibosomes
Secretory pathway
Peroxisomes Mitochondria
Lysosomes
Golgi complex
Cell membrane
Secretoryvesicle
Protein
Receptor
*Standard pathway (without signal)
Nucleus
Retention
Retention
229Endoplasmic reticulum and Golgi apparatus
All rights reserved. Usage subject to terms and conditions of license.Koolman, Color Atlas of Biochemistry, 2nd edition © 2005 Thieme

Protein synthesis and maturation
A. Protein synthesis in the rER
With all proteins, protein biosynthesis(Translation; for details, see p. 250) starts onfree ribosomes in the cytoplasm (1). Proteinsthat are exported out of the cell or into lyso-somes, and membrane proteins of the ER andthe plasma membrane, carry a signal peptidefor the ER at their N-terminus. This is a sectionof 15–60 amino acids in which one or twostrongly basic residues (Lys, Arg) near the N-terminus are followed by a strongly hydro-phobic sequence of 10–15 residues (seep. 228).
As soon as the signal peptide (red) appearson the surface of the ribosome (2), an RNA-containing signal recognition particle (SRP,green) binds to the sequence and initiallyinterrupts translation (3). The SRP then bindsto an SRP receptor in the rER membrane, andin this way attaches the ribosome to the ER(4). After this, the SRP dissociates from thesignal peptide and from the SRP receptorand is available again for step 3. This ender-gonic process is driven by GTP hydrolysis (5).Translation now resumes. The remainder ofthe protein, still unfolded, is gradually intro-duced into a channel (the translocon) in thelumen of the rER (6), where a signal peptidaselocated in the inner ER membrane cleaves thesignal peptide while translation is still takingplace (7). This converts the preprotein into aproprotein, from which the mature proteinfinally arises after additional post-transla-tional modifications (8) in the ER and in theGolgi apparatus.
If the growing polypeptide contains a stop-transfer signal (see p. 228), then this hydro-phobic section of the chain remains stuck inthe membrane outside the translocon, and anintegral membrane protein arises. In thecourse of translation, an additional signal se-quence can re-start the transfer of the chainthrough the translocon. Several repetitions ofthis process produce integral membrane pro-teins with several transmembrane helices(see p. 214).
B. Protein glycosylation
Most extracellular proteins contain covalentlybound oligosaccharide residues. For example,
all plasma proteins with the exception of al-bumin are glycosylated. Together with glyco-lipids, numerous glycoproteins on the cellsurface form the glycocalyx. Inside the ER,the carbohydrate parts of the glycoproteinsare cotranslationally transferred to the grow-ing chain, and are then converted into theirfinal form while passing through the ER andGolgi apparatus.
N-bound oligosaccharides (see p. 44) arealways bound to the acid-amide group of as-paragine residues. If a glycosylation sequence(–Asn–X–Ser(Thr)–, where X can be anyamino acid) appears in the growing peptidechain, then a transglycosylase in the ER mem-brane [1] transfers a previously produced coreoligosaccharide consisting of 14 hexoseresidues en-bloc from the carrier moleculedolichol diphosphate to the peptide.
Dolichol is a long-chain isoprenoid (seep. 52) consisting of 10–20 isoprene units,which is embedded in the ER membrane. Ahydroxyl group at the end of the molecule isbound to diphosphate, on which the nuclearoligosaccharide is built up in an extendedreaction sequence (not shown here in detail).The core structure consists of two residues ofN-acetylglucosamine (GlcNAc), a branchedgroup of nine mannose residues (Man) andthree terminal glucose resides (Glc).
As the proprotein passes through the ER,glycosidases [2] remove the glucose residuescompletely and the mannoses partially(“trimming”), thereby producing the man-nose-rich type of oligosaccharide residues.Subsequently, various glycosyltransferases [3]transfer additional monosaccharides (e. g.,GlcNAc, galactose, fucose, and N-acetylneura-minic acid; see p. 38) to the mannose-richintermediate and thereby produce the com-plex type of oligosaccharide. The structure ofthe final oligosaccharide depends on the typeand activity of the glycosyltransferases pre-sent in the ER of the cell concerned, and istherefore genetically determined (althoughindirectly).
230 Organelles
All rights reserved. Usage subject to terms and conditions of license.Koolman, Color Atlas of Biochemistry, 2nd edition © 2005 Thieme

H2O
GDP+Pi
GTP
1 2 3 4
5 6 7 8
1
2
P
P
3
3
UDPGDPDolDol
P
P
1
Asn
Asn
Asn
Asn
2
A. Protein synthesis in the rough endoplasmic reticulum
B. Protein glycosylation
mRNA
Freeribosome
Signal peptidase
RibosomeTransloconDolichol (Dol)
Core structure
Mannose-rich type
Complextype
Dolichol diphosphate (9–23 isoprene units)
Glucose
N-acetylglucosamine
Mannose
Galactose
N-acetylneuraminicacid
Proteinglycosyltransferase2.4.1.119
O-glycosidases 3.2.1.n
Glycosyltransferases2.4.1.n
ER membrane
ER-lumen
Signalpeptide
Post-transl.modification
SRP receptor
Precursors
Translocon
SRP
231Endoplasmic reticulum and Golgi apparatus
All rights reserved. Usage subject to terms and conditions of license.Koolman, Color Atlas of Biochemistry, 2nd edition © 2005 Thieme

Protein maturation
After translation, proteins destined for thesecretory pathway (see p. 228) first have tofold into their native conformation within therER (see p. 230). During this process they aresupported by various auxiliary proteins.
A. Protein folding in the rER
To prevent incorrect folding of the growingprotein during protein biosynthesis, chaper-ones (see B) in the lumen of the rER bind tothe peptide chain and stabilize it until trans-lation has been completed. Binding protein(BiP) is an important chaperone in the ER.
Many secretory proteins—e. g., pancreaticribonuclease (RNAse; see p. 74)—contain sev-eral disulfide bonds that are only formed ox-idatively from SH groups after translation.The eight cysteine residues of the RNAse canin principle form 105 different pairings, butonly the combination of the four disulfidebonds shown on p. 75 provides active en-zyme. Incorrect pairings can block furtherfolding or lead to unstable or insoluble con-formations. The enzyme protein disulfide iso-merase [1] accelerates the equilibration be-tween paired and unpaired cysteine residues,so that incorrect pairs can be quickly splitbefore the protein finds its final conformation.
Most peptide bonds in proteins take on thetrans conformation (see p. 66). Only bondswith proline residues (–X–Pro–) can bepresent in both cis and trans forms.
In the protein’s native conformation, everyX–Pro bond has to have the correct conforma-tion (cis or trans). As the uncatalyzed transi-tion between the two forms is very slow,there is a proline cis–trans isomerase [2] inthe ER that accelerates the conversion.
B. Chaperones and chaperonins
Most proteins fold spontaneously into theirnative conformation, even in the test tube.In the cell, where there are very high concen-trations of proteins (around 350 g L–1), thisis more dif cult. In the unfolded state, theapolar regions of the peptide chain (yellow)tend to aggregate—due to the hydrophobiceffect (see p. 28)—with other proteins orwith each other to form insoluble products(2). In addition, unfolded proteins are suscep-
tible to proteinases. To protect partly foldedproteins, there are auxiliary proteins calledchaperones because they guard immatureproteins against damaging contacts. Chaper-ones are formed increasingly during tempera-ture stress and are therefore also known asheat-shock proteins (hsp). Several classes ofhsp are distinguished. Chaperones of thehsp70 type (Dna K in bacteria) are common,as are type hsp60 chaperonins (GroEL/ES inbacteria). Class hsp90 chaperones have spe-cial tasks (see p. 378).
While small proteins can often reach theirnative conformation without any help (1),larger molecules require hsp70 proteins forprotection against aggregation which bind asmonomers and can dissociate again, depend-ent on ATP (3). By contrast, type hsp60 chap-eronins form large, barrel-shaped complexeswith 14 subunits in which proteins can foldindependently while shielded from their en-vironment (4). The function of hsp60 has beeninvestigated in detail in the bacterialchaperonin GroEL (right). The barrel has twochambers, which are closed with a lid (GroES)during folding of the guest protein. Driven byATP hydrolysis, the chambers open and closealternately—i. e., the release of the fully foldedprotein from one chamber is coupled to theuptake of an unfolded peptide in the secondchamber.
C. Protein import in mitochondria
Class hsp70 chaperones are also needed fortranslocation of nuclear-coded proteins fromthe cytoplasm into the mitochondria (seep. 228). As two membranes have to becrossed to reach the matrix, there are twotranslocator complexes: TOM (“transportouter membrane”) and TIM (“transport innermembrane”). For transport, proteins are un-folded in the cytoplasm and protected byhsp70. TOM recognizes the positively chargedsignal sequence at the protein’s N terminus(see p. 228) and with the help of the mem-brane potential threads the chains throughthe central pores of the two complexes. InsideTIM, further hsp70 molecules bind and pullthe chain completely into the matrix. As withimport into the ER, the signal peptide is pro-teolytically removed by a signal peptidaseduring translocation.
232 Organelles
All rights reserved. Usage subject to terms and conditions of license.Koolman, Color Atlas of Biochemistry, 2nd edition © 2005 Thieme

1 2SS
SS
SH SS S
SSH
SS S
SSH
1
2
1. 2. 3.
P P
1
2 3
4
7 ADP7 ATP
7 ADP 7 ATP
1
2
3
47 7
Protein disulfide isomerase 5.3.4.1
Peptidyl proline cis-trans-isomerase 5.2.1.8
BiP (Chaperonin) Pro (cis) Pro (trans)
Smallprotein
Foldedprotein
hsp 70(chaperone)
hsp 60(Chape-ronin)
Insolubleprecipitateor degradation
Folded protein
hsp 70Cytoplasm
TOMcomplex
TIMcomplex
Outermitochondrialmembrane
Innermitochondrialmembrane
Mitochondrialmatrix
A. Protein folding in the rER
B. Chaperones and chaperonins
Peptidase
Signal peptide for mitochondrialimport
Nuclear-codedmitochondrial protein
hsp 70
Cyto-plasm
gER
Aggregation
Folded protein
GroES
GroEL
C. Protein import in mitochondria
233Endoplasmic reticulum and Golgi apparatus
All rights reserved. Usage subject to terms and conditions of license.Koolman, Color Atlas of Biochemistry, 2nd edition © 2005 Thieme

Lysosomes
A. Structure and contents
Animal lysosomes are organelles with a diam-eter of 0.2–2.0 µm with various shapes thatare surrounded by a single membrane. Thereare usually several hundred lysosomes percell. ATP-driven V-type proton pumps are ac-tive in their membranes (see p. 220). As theseaccumulate H+ in the lysosomes, the contentof lysosomes with pH values of 4.5–5 is muchmore acidic than the cytoplasm (pH 7–7.3).
The lysosomes are the cell’s “stomach,”serving to break down various cell compo-nents. For this purpose, they contain some40 different types of hydrolases, which arecapable of breaking down every type of mac-romolecule. The marker enzyme of lysosomesis acid phosphatase. The pH optimum of lyso-somal enzymes is adjusted to the acid pH valueand is also in the range of pH 5. At neutral pH,as in the cytoplasm, lysosomal enzymes onlyhave low levels of activity. This appears to be amechanism for protecting the cells from di-gesting themselves in case lysosomal enzymesenter the cytoplasm at any time. In plants andfungi, the cell vacuoles (see p. 43) have thefunction of lysosomes.
B. Functions
Lysosomes serve for enzymatic degradation ofmacromolecules and cell organelles, whichare supplied in various ways. The exampleshows the degradation of an overaged mito-chondrion by autophagy. To accomplish this,the lysosome encloses the organelle (1). Dur-ing this process, the primary lysosome con-verts into a secondary lysosome, in which thehydrolytic degradation takes place (2). Finally,residual bodies contain the indigestible resi-dues of the lysosomal degradation process.Lysosomes are also responsible for the degra-dation of macromolecules and particles takenup by cells via endocytosis and phagocyto-sis—e. g., lipoproteins, proteohormones, andbacteria (heterophagy). In the process, lyso-somes fuse with the endosomes (3) in whichthe endocytosed substances are supplied.
C. Synthesis and transport of lysosomalproteins
Primary lysosomes arise in the region of theGolgi apparatus. Lysosomal proteins are syn-thesized in the rER and are glycosylated thereas usual (1; see p. 228). The next steps arespecific for lysosomal proteins (right part ofthe illustration). In a two-step reaction, ter-minal mannose residues (Man) are phos-phorylated at the C–6 position of the man-nose. First, N-acetylglucosamine 1-phosphateis transferred to the OH group at C-6 in aterminal mannose residue, and N-acetylglu-cosamine is then cleaved again. Lysosomalproteins therefore carry a terminal mannose6–phosphate (Man6–P; 2).
The membranes of the Golgi apparatuscontain receptor molecules that bind Man6–P. They recognize lysosomal proproteinsby this residue and bind them (3). With thehelp of clathrin, the receptors are concen-trated locally. This allows the appropriatemembrane sections to be pinched off andtransported to the endolysosomes with thehelp of transport vesicles (4), from which pri-mary lysosomes arise through maturation (5).Finally, the phosphate groups are removedfrom Man 6–P (6).
The Man 6–P receptors are reused. The fallin the pH value in the endolysosomes releasesthe receptors from the bound proteins (7)which are then transported back to the Golgiapparatus with the help of transport vesicles.
Further information
Many hereditary diseases are due to geneticdefects in lysosomal enzymes. The metabo-lism of glycogen ( glycogenoses), lipids (lipidoses), and proteoglycans ( mucopoly-saccharidoses) is particularly affected. As thelysosomal enzymes are indispensable for theintracellular breakdown of macromolecules,unmetabolized macromolecules or degrada-tion products accumulate in the lysosomesin these diseases and lead to irreversible celldamage over time. In the longer term, en-largement takes place, and in severe casesthere may be failure of the organ affected—e. g., the liver.
234 Organelles
All rights reserved. Usage subject to terms and conditions of license.Koolman, Color Atlas of Biochemistry, 2nd edition © 2005 Thieme

12
3
AAP P P P P P
H
H
UP
1
2
PU
P -GlcNAc1
1
2
3
4
5
6
7
8
H2O
GlcNAc
2
P
O
HO
OH
H
HOH
H
CH2
H
OH
O R
O
HO
OH
NH
HH
H
CH2
H
OH
O P
CO
CH3
O
O
O
CH2
O
HO
OH
H
HOH
H
H
O R
O
HO
OH
CH2
O
HO
R
O
Secondarylysosome
Secondarylysosome
Endosome
Primarylysosome
Endocytoticvesicle
Residualbody
Cell
Macro-molecules,particles
Enzymaticdegradation
Overagedmitochondrion
A. Structure and contents
C. Synthesis and transport of lysosomal proteins
B. Functions
Lysosome
NucleasesProteasesGlycosidasesLipasesPhosphatasesSulfatasesPhospholipases
Cytoplasm
pH = 4.5 - 5.0
pH = 7.0 - 7.3
Approx. 40 different hydrolaseswith acidic pH optima
H -transportingATPase3.6.1.35
rERProteinbiosynthesisN-Glycosy-lation
cis-GolgiapparatusPhosphory-lation
trans-GolginetworkBinding toMan-6- PreceptorSortingSealingVesiculartransport
Endo-lysosomeAcidificationDissociationof the receptor-proteincomplex
PrimarylysosomePhosphatecleavage
No Man-6-no transport
Low pH triggersconformationalchange
GlcNAc-Phosphotransferase 2.7.8.17
GlcNAc-Phosphoglycosidase 3.1.4.45
Glyco-proteinR
Receptor
Terminal mannose
Acidhydrolases
Endocytosisor phagocytosis
P
235Lysosomes
All rights reserved. Usage subject to terms and conditions of license.Koolman, Color Atlas of Biochemistry, 2nd edition © 2005 Thieme

Molecular genetics: overview
Nucleic acids (DNA and various RNAs) are ofcentral importance in the storage, transmis-sion, and expression of genetic information.The decisive factor involved is their ability toenter into specific base pairings with eachother (see p. 84). The individual processes in-volved, which are summed up in an overviewhere, are discussed in more detail on the fol-lowing pages.
A. Expression and transmission of geneticinformation
Storage. The genetic information of all cells isstored in the base sequence of their DNA (RNAonly occurs as a genetic material in viruses;see p. 404). Functional sections of DNA thatcode for inheritable structures or functionsare referred to as genes. The 30 000–40 000human genes represent only a few percent ofthe genome, which consists of approximately5 109 base pairs (bp). Most genes code forproteins—i. e., they contain the informationfor the sequence of amino acid residues of aprotein (its sequence). Every amino acid res-idue is represented in DNA by a code word (acodon) consisting of a sequence of three basepairs (a triplet). At the level of DNA, codonsare defined as sequences of the sense strandread in the 53 direction (see p. 84). A DNAcodon for the amino acid phenylalanine, forexample, is thus TTC (2).
Replication. During cell division, all of thegenetic information has to be passed on to thedaughter cells. To achieve this, the whole ofthe DNA is copied during the S phase of thecell cycle (see p. 394). In this process, eachstrand serves as a matrix for the synthesisof a complementary second strand (1; seep. 240).
Transcription. For expression of a gene—i. e.,synthesis of the coded protein—the DNA se-quence information has to be converted into aprotein sequence. As DNA itself is not in-volved in protein synthesis, the informationis transferred from the nucleus to the site ofsynthesis in the cytoplasm. To achieve this,the template strand in the relevant part ofthe gene is transcribed into an RNA (hnRNA).The sequence of this RNA is thus complemen-tary to that of the template strand (3), but—with the exception of the exchange of thy-
mine for uracil—it is identical to that of thesense strand. In this way, the DNA triplet TTCgives rise in hnRNA to the RNA codon UUC.
RNA maturation. In eukaryotes, the hnRNAinitially formed is modified several times be-fore it can leave the nucleus as messengerRNA (mRNA, 4). During RNA maturation,superfluous (“intervening”) sequences (in-trons) are removed from the molecule, andboth ends of the transcript are protected bythe addition of further nucleotides (seep. 246).
Translation. Mature mRNA enters the cyto-plasm, where it binds to ribosomes, whichconvert the RNA information into a peptidesequence. The ribosomes (see p. 250) consistof more than 100 proteins and several RNAmolecules (rRNA; see p. 82). rRNA plays a roleas a ribosomal structural element and is alsoinvolved in the binding of mRNA to the ribo-some and the formation of the peptide bond.
The actual information transfer is based onthe interaction between the mRNA codonsand another type of RNA, transfer RNA(tRNA; see p. 82). tRNAs, of which there arenumerous types, always provide the correctamino acid to the ribosome according to thesequence information in the mRNA. tRNAs areloaded with an amino acid residue at the 3end. Approximately in the middle, theypresent the triplet that is complementary toeach mRNA codon, known as the anticodon(GAA in the example shown). If the codon UUCappears on the mRNA, the anticodon binds amolecule of Phe-t-RNAPhe to the mRNA (5)and thus brings the phenylalanine residue atthe other end of the molecule into a positionin which it can take over the growing poly-peptide chain from the neighboring tRNA (6).
Amino acid activation. Before binding tothe ribosomes, tRNAs are loaded with thecorrect amino acids by specific ligases (7;see p. 248). It is the amino acid tRNA ligasesthat carry out the transfer (translation) of thegenetic information from the nucleic acidlevel to the protein level.
236 Molecular genetics
All rights reserved. Usage subject to terms and conditions of license.Koolman, Color Atlas of Biochemistry, 2nd edition © 2005 Thieme

5' 3'
3' 5'
N T C
G
N T
NN A A
N
N
5' 3'
3' 5'
N T C
G
N T
NN A A
N
N
N
N
Phe
5' 3'
3' 5'
NN T C
G
N T
NN N A A
N
N
5' 3'
3' 5'
NN U C
G
N U
NN N A A
N
N
5' 3'NN U CN U N
5' 3'
5'
NN U C
G
N U
N N A A
N
N N
Phe
1
2
3
4
5
6
7
N
N
A P
A. Expression and transmission of genetic information
hnRNA
Template strand
Sense strand
Cap
Poly(A) tail
tRNA
Ribosome
Protein
mRNA
Phe-tRNA
Template strand
DNA
DNA
Amino acidactivation
mRNA
Replication
Transcription
RNA maturation
Translation
237Overview
All rights reserved. Usage subject to terms and conditions of license.Koolman, Color Atlas of Biochemistry, 2nd edition © 2005 Thieme

Genome
A. Chromatin
In the nuclei of eukaryotes (see p. 196), DNA isclosely associated with proteins and RNA.These nucleoprotein complexes, with a DNAproportion of approximately one-third, areknown as chromatin. It is only during celldivision (see p. 394) that chromatin con-denses into chromosomes that are visibleunder light microscopy. During interphase,most of the chromatin is loose, and in theseconditions a morphological distinction can bemade between tightly packed heterochroma-tin and the less dense euchromatin. Euchro-matin is the site of active transcription.
The proteins contained in chromatin areclassified as either histone or non-histoneproteins. Histones (B) are small, strongly basicproteins that are directly associated withDNA. They contribute to the structural organ-ization of chromatin, and their basic aminoacids also neutralize the negatively chargedphosphate groups, allowing the dense pack-ing of DNA in the nucleus. This makes it pos-sible for the 46 DNA molecules of the diploidhuman genome, with their 5 109 base pairs(bp) and a total length of about 2 m, to beaccommodated in a nucleus with a diameterof only 10 µm. Histones also play a centralrole in regulating transcription (see p. 244).
Two histone molecules each of types H2A(blue), H2B (green), H3 (yellow), and H4 (red)form an octameric complex, around which146 bp of DNA are wound in 1.8 turns. Theseparticles, with a diameter of 7 nm, are re-ferred to as nucleosomes. Another histone(H1) binds to DNA segments that are not di-rectly in contact with the histone octamers(“linker” DNA). It covers about 20 bp and sup-ports the formation of spirally wound super-structures with diameters of 30 nm, known assolenoids. When chromatin condenses intochromosomes, the solenoids form loops about200 nm long, which already contain about80 000 bp. The loops are bound to a proteinframework (the nuclear scaffolding), which inturn organizes some 20 loops to form mini-bands. A large number of stacked minibandsfinally produces a chromosome. In the chro-mosome, the DNA is so densely packed thatthe smallest human chromosome alreadycontains more than 50 million bp.
The non-histone proteins are very hetero-geneous. This group includes structural pro-teins of the nucleus, as well as many enzymesand transcription factors (see p. 118), whichselectively bind to specific segments of DNAand regulate gene expression and other pro-cesses.
B. Histones
The histones are remarkable in several ways.With their high proportions of lysine and ar-ginine (blue shading), they are strongly basic,as mentioned above. In addition, their aminoacid sequence has hardly changed at all in thecourse of evolution. This becomes clear whenone compares the histone sequences in mam-mals, plants, and fungi (yeasts are single-celled fungi; see p. 148). For example, theH4 histones in humans and wheat differonly in a single amino acid residue, and thereare only a few changes between humans andyeast. In addition, all of these changes are“conservative”—i. e., the size and polaritybarely differ. It can be concluded from thisthat the histones were already “optimized”when the last common predecessor of ani-mals, plants, and fungi was alive on Earth(more than 700 million years ago). Althoughcountless mutations in histone genes havetaken place since, almost all of these evidentlyled to the extinction of the organisms con-cerned.
The histones in the octamer carry N-termi-nal mobile “tails” consisting of some 20 aminoacid residues that project out of the nucleo-somes and are important in the regulation ofchromatin structure and in controlling geneexpression (see A2; only two of the eight tailsare shown in full length). For example, thecondensation of chromatin into chromo-somes is associated with phosphorylation (P)of the histones, while the transcription ofgenes is initiated by acetylation (A) of lysineresidues in the N-terminal region (see p. 244).
238 Molecular genetics
All rights reserved. Usage subject to terms and conditions of license.Koolman, Color Atlas of Biochemistry, 2nd edition © 2005 Thieme

VDMATVTK V Y A L K R Q G R T L Y G F G G
VDMATVTK V Y A L K R Q G R T L Y G F G G
VDLSTVTK V Y A L K R Q G R T L Y G F G G
10080 90
VKLVGRTE F L E N V I R D A V T Y T E H A K R
IKLVGRTE F L E N V I R D A V T Y T E H A R R
SKLVARVE F L E S V I R D S V T Y T E H A K R
60 70
IAPKTIGQ R R L A R R G G V K R I S G L I Y E
IAPKTIGQ R R L A R R G G V K R I S G L I Y E
IAPKTIGQ R R L A R R G G V K R I S G L I Y E
30 40 50
A MP
A MA A A AP
KGGKGRGS G L G K G G A K R H R K V L R D N IKGGKGRGS G L G K G G A K R H R K V L R D N IKGGKGRGS G L G K G G A K R H R K I L R D N I
10
A. Chromatin
B. Histone
Amino acid sequence of histone H4
AnimalsPlantsYeast
AnimalsPlantsYeast
AnimalsPlantsYeast
Acetylation Phosphorylation Methylation
AnimalsPlantsYeast
Nuclear scaffold
Solenoid
DNA double helix Nucleosome
Histonemolecules
Chromosome
Loops
N-terminaltail (H3)
N-terminaltail (H2B)
DNA
1. Organization of chromatin
Histone-Octamer(H2A · H2B)2(H3 · H4)2
2. Nucleosome
30 nm
10 nm
2 nm
200 nm
700 nm
H2A
H2B
H3
H4
239Replication
All rights reserved. Usage subject to terms and conditions of license.Koolman, Color Atlas of Biochemistry, 2nd edition © 2005 Thieme

Replication
For genetic information to be passed on dur-ing cell division, a complete copy of the ge-nome has to be produced before each mitosis.This process is known as DNA replication.
A. Mechanism of DNA polymerases
Replication is catalyzed by DNA–dependentDNA polymerases. These enzymes require asingle strand of DNA, known as the tem-plate. Beginning at a short starting sequenceof RNA (the primer), they synthesize a secondcomplementary strand on the basis of thistemplate, and thus create a complete DNAdouble helix again. The substrates of theDNA polymerases are the four deoxynucleo-side triphosphates dATP, dGTP, dCTP, anddTTP. In each step, base pairing first bindsthe nucleotide that is complementary to thecurrent base in the template strand. Theα–phosphate residue of the newly bound nu-cleoside triphosphate is then subjected to nu-cleophilic attack by the 3–OH group of thenucleotide incorporated immediately previ-ously. This is followed by the elimination ofdiphosphate and the formation of a newphosphoric acid diester bond. These stepsare repeated again for each nucleotide. Themechanism described means that the matrixcan only be read in the 35 direction. Inother words, the newly synthesized strandalways grows in the 53 direction. Thesame mechanism is also used in transcriptionby DNA-dependent RNA polymerases (seep. 242). Most DNA and RNA polymerases con-sist of more than 10 subunits, the role ofwhich is still unclear to some extent.
B. Replication in E. coli
Although replication in prokaryotes is nowwell understood, many details in eukaryotesare still unclear. However, it is certain that theprocess is in principle similar. A simplifiedscheme of replication in the bacteriumEscherichia coli is shown here.
In bacteria, replication starts at a specificpoint in the circular DNA—the origin of repli-cation—and proceeds in both directions. Thisresults in two diverging replication forks, inwhich the two strands are replicated simulta-neously. Numerous proteins are involved in
the processes taking place in this type of fork,and only the most important are shown here.The two strands of the initial DNA (1) areshown in blue and violet, while the newlyformed strands are pink and orange.
Each fork (2) contains two molecules ofDNA polymerase III and a number of helperproteins. The latter include DNA topoisomer-ases and single–strand-binding proteins.Topoisomerases are enzymes that unwindthe superhelical DNA double strand (gyrase,topoisomerase II) and then separate it into thetwo individual strands (helicase, topoisomer-ase I). Since the template strand is always readfrom 3 to 5 (see above), only one of thestrands (known as the leading strand; violet/pink) can undergo continuous replication. Forthe lagging strand (light blue), the readingdirection is the opposite of the direction ofmovement of the fork. In this matrix, thenew strand is first synthesized in individualpieces, which are known as Okazaki frag-ments after their discoverer (green/orange).
Each fragment starts with a short RNA pri-mer (green), which is necessary for the func-tioning of the DNA polymerase and is synthe-sized by a special RNA polymerase (“primase,”not shown). The primer is then extended byDNA polymerase III (orange). After 1000–2000nucleotides have been included, synthesis ofthe fragment is interrupted and a new one isbegun, starting with another RNA primer thathas been synthesized in the interim. The in-dividual Okazaki fragments are initially notbound to one another and still have RNA atthe 5 end (3). At some distance from the fork,DNA polymerase I therefore starts to removethe RNA primer and replace it with DNA com-ponents. Finally, the gaps still remaining areclosed by a DNA ligase. In DNA double helicesformed in this way, only one of the strands hasbeen newly synthesized—i. e., replication issemiconservative.
In bacteria, some 1000 nucleotides are re-plicated per second. In eukaryotes, replicationtakes place more slowly (about 50 nucleotides s–1) and the genome is larger. Thousands ofreplication forks are therefore active simulta-neously in eukaryotes.
240 Molecular genetics
All rights reserved. Usage subject to terms and conditions of license.Koolman, Color Atlas of Biochemistry, 2nd edition © 2005 Thieme

A
T
T
A
G G
G
C
A
T
T
A
G G
G
C
G
C
C
PP
PPP
PPP
3'
5'
3'
5'
5'
5'
Gua
AdeHO
HO
HO
HO
PP
OF1
OF2
1.
2.
3.
OF3
3'5'
3'5'
3'5'
5'3'
3'5'
3'5'
3'5'
5'
OF2OF1
OF3
4.
5'3'
5'3'
O
HH
O H
H H
PO O
O
H2CO
HH
HO H
H H
Cyt
1'
3'
5'
O
PO O
O
H2CO
HH
HO H
H H
Thy
3'
5'PO
O
O
PO
O
O
A. Mechanism of DNA polymerases
B. Replication in E. coli
Templatestrand
Templatestrand
Newly synthe-sized strand
DNA poly-merase2.7.7.7
Old DNA strands
New DNA strands
RNA primer
Auxiliary proteins
Okazakifragments
Singlestrandbindingproteins
Movement of thereplication fork
DNA polymerase I2.7.7.7
DNA ligase6.5.1.1
Replication is semiconservative
Replication fork
DNA helicase 5.99.1.2DNA gyrase 5.99.1.3
Origin ofreplication
DNA polymerase III2.7.7.7
241Replication
All rights reserved. Usage subject to terms and conditions of license.Koolman, Color Atlas of Biochemistry, 2nd edition © 2005 Thieme

Transcription
For the genetic information stored in DNA tobecome effective, it has to be rewritten(transcribed) into RNA. DNA only serves as atemplate and is not altered in any way by thetranscription process. Transcribable segmentsof DNA that code for a defined product arecalled genes. It is estimated that the mamma-lian genome contains 30 000–40 000 genes,which together account for less than 5% of theDNA.
A. Transcription and maturation of RNA:overview
Transcription is catalyzed by DNA–dependentRNA polymerases. These act in a similar way toDNA polymerases (see p. 240), except thatthey incorporate ribonucleotides instead ofdeoxyribonucleotides into the newly synthe-sized strand; also, they do not require a pri-mer. Eukaryotic cells contain at least threedifferent types of RNA polymerase. RNA poly-merase I synthesizes an RNA with a sedimen-tation coef cient (see p. 200) of 45 S, whichserves as precursor for three ribosomal RNAs.The products of RNA polymerase II arehnRNAs, from which mRNAs later develop,as well as precursors for snRNAs. Finally,RNA polymerase III transcribes genes thatcode for tRNAs, 5S rRNA, and certain snRNAs.These precursors give rise to functional RNAmolecules by a process called RNA maturation(see p. 246). Polymerases II and III are inhib-ited by –amanitin, a toxin in the Amanitaphalloides mushroom.
B. Organization of the PEP-CK gene
The way in which a typical eukaryotic gene isorganized is illustrated here using a gene thatcodes for a key enzyme in gluconeogenesis(see p. 154)—the phosphoenolpyruvate car-boxykinase (PEP-CK).
In the rat, the PEP-CK gene is nearly 7 kbp(kilobase pairs) long. Only 1863 bp, distrib-uted over 10 coding segments (exons, darkblue) carry the information for the protein’s621 amino acids. The remainder is allotted tothe promoter (pink) and intervening sequen-ces (introns, light blue). The gene’s promoterregion (approximately 1 kbp) serves for reg-ulation (see p. 188). Transcription starts at the
3 end of the promoter (“transcription start”)and continues until the polyadenylation se-quence (see below) is reached. The primarytranscript (hnRNA) still has a length of about6.2 kbp. During RNA maturation, the non-coding sequences corresponding to the in-trons are removed, and the two ends of thehnRNA are modified. The translatable mRNAstill has half the length of the hnRNA and ismodified at both ends (see p. 246).
In many eukaryotic genes, the proportionof introns is even higher. For example, thegene for dihydrofolate reductase (see p. 402)is over 30 kbp long. The information is dis-tributed over six exons, which together have alength of only about 6 kbp.
C. Transcription process
As mentioned above, RNA polymerase II(green) binds to the 3 end of the promoterregion. A sequence that is important for thisbinding is known as the TATA box—a short A–and T–rich sequence that varies slightly fromgene to gene. A typical base sequence (“con-sensus sequence”) is ...TATAAA... Numerousproteins known as basal transcription factorsare necessary for the interaction of the poly-merase with this region. Additional factorscan promote or inhibit the process (transcrip-tional control; see p. 244). Together with thepolymerase, they form the basal transcriptioncomplex.
At the end of initiation (2), the polymeraseis repeatedly phosphorylated, frees itself fromthe basal complex, and starts moving alongthe DNA in the 3 direction. The enzyme sep-arates a short stretch of the DNA double helixinto two single strands. The complementarynucleoside triphosphates are bound by basepairing in the template strand and are linkedstep by step to the hnRNA as it grows in the53 direction (3). Shortly after the begin-ning of elongation, the 5 end of the transcriptis protected by a “cap” (see p. 246). Once thepolyadenylation sequence has been reached(typical sequence: .. .AATAA...), the transcriptis released (4). Shortly after this, the RNApolymerase stops transcribing and dissociatesfrom the DNA.
242 Molecular genetics
All rights reserved. Usage subject to terms and conditions of license.Koolman, Color Atlas of Biochemistry, 2nd edition © 2005 Thieme

P P
P
45S rRNA28S rRNA18S rRNA5.8S rRNA
mRNA
5S rRNAtRNA
snRNA
ATP, GTP, CTP, UTP
snRNA
3'
DNA
mRNA
hn RNA
...TATAAA.. ..AATAAA..
1.
2.
3.
3'5'
3'5'
3'5'
3'5'
4.
3'5'
3'5'
3'5'
P P
P
C. Process of transcription
B. Organization of the PEP-CK gene
Transcription
DNA
Polymerase I
Polymerase II
α-Amanitin
Polymerase III
Maturation
hnRNAsnRNA-precursors
Precursors
DNA-directed RNApolymerase 2.7.7.6
Translationstart (ATG)
ExonTranslationend (TAA)Transcription
start Transcriptionend
Promoterregion
CapPoly-A sequence
TATA-BoxTranscription start Polyadenylation
sequence
RNA Polymerase II
Cap
Termination
Intron
Elongation
hnRNA
Transcription
RNA maturation
Basal transcription complex
Template strand
A. Transcription and maturation of RNA: overview
100 Bases
AUG UAA
243Transcription
All rights reserved. Usage subject to terms and conditions of license.Koolman, Color Atlas of Biochemistry, 2nd edition © 2005 Thieme

Transcriptional control
Although all cells contain the complete ge-nome, they only use a fraction of the informa-tion in it. The genes known as “housekeepinggenes,” which code for structural moleculesand enzymes of intermediate metabolism, arethe only ones that undergo constant tran-scription. The majority of genes are only ac-tive in certain cell types, in specific metabolicconditions, or during differentiation. Whichgenes are transcribed and which are not isregulated by transcriptional control (see alsop. 118). This involves control elements (cis-active elements) in the gene’s promoter re-gion and gene-specific regulatory proteins(transcription factors, trans -active factors),which bind to the control elements andthereby activate or inhibit transcription.
A. Initiation of transcription
In the higher organisms, DNA is blocked byhistones (see p. 238) and is therefore not ca-pable of being transcribed without specialpositive regulation. In eukaryotes, it is there-fore histones that play the role of repressors(see p. 118). For transcription to be set in mo-tion at all, the chromatin first has to be re-structured.
In the resting state, the lysine residues inthe N-terminal “tail” of the histones (seep. 238) are not acetylated. In this state, whichcan be produced by histone deacetylases [1],the nucleosomes are stable. It is only the in-teraction of activator and regulator proteinswith their control elements that allows thebinding of coactivator complexes that havehistone acetylase activity [2]. They acetylatethe histone tails and thereby loosen the nu-cleosome structure suf ciently for the basaltranscription complex to form.
This consists of DNA-dependent RNA poly-merase II and basal transcription factors(TFIIX, X = A – H). First, the basal factor TFIIDbinds to the promoter. TFIID, a large complexof numerous proteins, contains TATA box-binding protein (TBP) and so-called TAFs(TBP-associated factors). The polymerase isattached to this core with the help of TFIIB.Before transcription starts, additional TFshave to bind, including TFIIH, which has heli-case activity and separates the two strands ofDNA during elongation. In all, some 35 differ-
ent proteins are involved in the basal com-plex. This alone, however, is still not suf cientfor transcription to start. In addition, positivesignals have to be emitted by more distanttrans-active factors, integrated by the coacti-vator/mediator complex, and passed on to thebasal complex (see B).
The actual signal for starting elongationconsists of the multiple phosphorylation of adomain in the C-terminal region of the poly-merase. In phosphorylated form, it releasesitself from the basal complex along with afew TFs and starts to synthesize hnRNA.
B. Regulation of PEP-CK transcription
Phosphoenolpyruvate carboxykinase (PEP-CK),a key enzyme in gluconeogenesis, is regulatedby several hormones, all of which affect thetranscription of the PEP-CK gene. Cortisol,glucagon, and thyroxin induce PEP-CK, whileinsulin inhibits its induction (see p. 158).
More than ten control elements (dark red),distributed over approximately 1 kbp, have sofar been identified in the promoter of the PEP-CK gene (top). These include response ele-ments for the glucocorticoid receptor (GRE;see p. 378), for the thyroxin receptor (TRE),and for the steroid-like retinoic acid (AF-1).Additional control elements (CRE, cAMP-re-sponsive element) bind the transcription fac-tor C/EBP, which is activated by cAMP-de-pendent protein kinase A through phosphor-ylation. This is the way in which glucagon,which raises the cAMP level (see p. 158),works. Control element P1 binds the hor-mone-independent factor NF-1 (nuclear fac-tor-1). All proteins that bind to the controlelements mentioned above are in contactwith a coactivator/mediator complex (CBP/p300), which integrates their input like acomputer and transmits the result in theform of stronger or weaker signals to the basaltranscription complex. Inhibition of PEP-CKtranscription by insulin is mediated by aninsulin-responsive element (IRE) in the vicin-ity of the GRE. Binding of an as yet unknownfactor takes place here, inhibiting the bindingof the glucocorticoid receptor to the GRE.
244 Molecular genetics
All rights reserved. Usage subject to terms and conditions of license.Koolman, Color Atlas of Biochemistry, 2nd edition © 2005 Thieme

PI3K
GR
TR
PK-A C/EBP
1
1
4
3
2
2
AF-1 IRE GRE TRE P4 CRE P1 CRE
RAR ? GR TR C/EBP HNF-1 NF-1 C/EBPCREB
TBP
cAMP
GRE
TRENF-1
C/EBP
CREP1
TAFs
AD F
TBP B E H 43
2
AP-1(Fos/Jun)
A. Initiation of transcription
B. Regulation of PEP-CK transcription
Enhancer(HRE)
Histone deacetylase
TATA-Box
Activator protein
Regulatorprotein
Coactivator complex(histone acetylase)
TATA box
Nucleosome Upstream promoter element
Insulin
Cortisol
Thyroxin
Glucagon
CoactivatorMediator(CBP/p300)
TATA box
Basal transcription complex
Histone “tails”
Controlelement
Transcriptionfactor
Receptors for retinoatecortisol thyroxine
Histone deacetylase n.n.n.n
Histone acetyltransferase 2.3.1.48
RNA polymerase 2.7.7.6
DNA topoisomerase I 5.99.1.2
HRE – hormone response elementTAFs – TBP-associated factorsTBP – TATA box-binding proteinA–H – basal transcription factors
TATA-Box
Tran-scriptionstart
Coactivator complexMediator complex
RNA polymerase II
Basal transcription complex
245Transcriptional control
All rights reserved. Usage subject to terms and conditions of license.Koolman, Color Atlas of Biochemistry, 2nd edition © 2005 Thieme

RNA maturation
Before the hnRNA produced by RNA polymer-ase II (see p. 242) can leave the nucleus inorder to serve as a template for protein syn-thesis in the cytoplasm, it has to undergoseveral modifications first. Even during tran-scription, the two ends of the transcript haveadditional nucleotides added (A). The sectionsthat correspond to the intervening gene se-quences in the DNA (introns) are then cut out(splicing; see B). Other transcripts—e. g., the45 S precursor of rRNA formed by polymeraseI (see p. 242)—are broken down into smallerfragments by nucleases before export into thecytoplasm.
A. 5 and 3 modification of mRNA
Shortly after transcription begins in eukary-otes, the end of the growing RNA is blocked inseveral reaction steps by a structure known asa “cap.” In hnRNAs, this consists of a GTPresidue that is methylated at N-7 of the gua-nine ring. The β-phosphate residue of the capis linked to the free 5-OH group of the ter-minal ribose via an ester bond. After the“polyadenylation signal” has been reached(typical sequence: ...AAUAAA...; see p. 242),a polyadenylate “tail” consisting of up to 200AMP nucleotides is also added at the free 3end of the transcript. This reaction is cata-lyzed by a special polyadenylate polymerase.It is only at this point that the mRNA leavesthe nucleus as a complex with RNA-bindingproteins.
Both the cap and the poly-A tail play a vitalpart in initiating eukaryotic translation (seep. 250). They help position the ribosome cor-rectly on the mRNA near to the starting co-don. The protection which the additional nu-cleotides provide against premature enzy-matic degradation appears to be of lesser im-portance.
B. Splicing of hnRNA
Immediately after transcription, the hnRNAintrons are removed and the exons are linkedto form a continuous coding sequence. Thisprocess, known as splicing, is supported bycomplicated RNA–protein complexes in thenucleus, the so-called spliceosomes. The com-ponents of these macromolecular machines
are called snRNPs (small nuclear ribonucleo-protein particles, pronounced “snurps”).SnRNPs occur in five different forms (U1, U2,U4, U5, and U6). They consist of numerousproteins and one molecule of snRNA each(see p. 82).
To ensure that the RNA message is notdestroyed, splicing has to take place in avery precise fashion. The start and end ofthe hnRNA introns are recognized by a char-acteristic sequence (...AGGT.. . at the 5 end or...[C,U]AGG... at the 3 end). Another impor-tant structure is the so-called branching pointinside the intron. Its sequence is less con-served than the terminal splicing sites, but italways contains one adenosine residue (A).During splicing, the 2-OH group of this resi-due—supported by the spliceosome (seeC)—attacks the phosphoric acid diester bondat the 5 end of the intron and cleaves it (b).Simultaneously, an unusual 25 bond isformed inside the intron, which thereby takeson a lasso shape (c; see formula). In the secondstep of the splicing process, the free 3-OHgroup at the end of the 5 terminal exon at-tacks the A–G bond at the 3 end of the intron.As a result, the two exons are linked and theintron is released, still in a lasso shape (d).
C. Spliceosome
As described above, it is residues of thehnRNA that carry out bond cleavage andbond formation during the splicing process.It is therefore not a protein enzyme that actsas a catalyst here, but rather an RNA. CatalyticRNAs of this type are called ribozymes (seealso p. 88). The task of the spliceosomes is tofix and orientate the reacting groups by es-tablishing base pairings between snRNAs andsegments of the hnRNA. The probable situa-tion before the adenosine attack at thebranching point on the 5 splicing site (seeB, Fig. b) is shown schematically on the rightside of the illustration. In this phase, the U1snRNA fixes the 5 splicing site, U2 fixes thebranching site, and U5 fixes the ends of thetwo exons.
246 Molecular genetics
All rights reserved. Usage subject to terms and conditions of license.Koolman, Color Atlas of Biochemistry, 2nd edition © 2005 Thieme

. . .AGGU.. . . . .C AGG.. . 3'
5'
5'
5'
5'
3'
3'
3'
UGG
A
A
5'
. . . A G GU
... ...G
A
C . . .C A GG.. .
. . .G AC.. .
UG
...GA
C . . .C A GG.. .. . .AG
.. .AGGG.. .U
G
...GA
C . . .C A
+
+
+
+
+3'
CA
GG
CH2 O P
O
O
O
H
H H
O
OH O
O
H
Gua CH2 O P
O
O
OH
H
AdeO
H
Gua
H
CH2 O P
O
O
O
HH
O
H
P OO
O
H2CO
H H
OHHO
HH
O
P O
O
O
P
O
OO
CH2
C
CN
C
HNC
NC
N
CH3O
H2N
H5'
7
5'
O
H H
OHO
HH
N
OCH2 Ade
HH
O OH
H H
PO O
O
CH2O
Ade
HH
O OH
H H
PO O
O
CH2O
Ade
HH
O OH
H H
C. Spliceosome
Proteins snRNA snRNP
hnRNA
Lassostructure
A. 5' and 3' modificationof mRNA
7-methyl guanosine
Cap
5' end
mRNA
Poly-A sequence
To the 3' end
m7Gppp N...
B. Splicing of hnRNA: mechanism
Intron
snRNA
5' exon
Spliceosome (schematic)
5' splicingsite
Branchingpoint
3' splicingsite
3' exon
3' exon
5' exon Introna)
b)
c)
d)
U1 U2
U5 U 4/6
U1U1
U2U2
U4U4
U5U5
U6
U6
247RNA maturation
All rights reserved. Usage subject to terms and conditions of license.Koolman, Color Atlas of Biochemistry, 2nd edition © 2005 Thieme

Amino acid activation
A. The genetic code
Most of the genetic information stored in thegenome codes for the amino acid sequencesof proteins. For these proteins to be ex-pressed, a text in “nucleic acid language”therefore has to be translated into “proteinlanguage.” This is the origin of the use of theterm translation to describe protein biosyn-thesis. The dictionary used for the translationis the genetic code.
As there are 20 proteinogenic amino acids(see p. 60), the nucleic acid language has tocontain at least as many words (codons).However, there are only four letters in thenucleic acid alphabet (A, G, C, and U or T). Toobtain 20 different words from these, eachword has to be at least three letters long(with two letters, there would only be42 = 16 possibilities). And in fact the codonsdo consist of three sequential bases (triplets).
Figure 1 shows the standard code in “DNAlanguage” (i. e., as a sequence of triplets in thesense strand of DNA, read in the 53 direc-tion; see p. 84), represented as a circular dia-gram. The scheme is read from the inside tothe outside. For example, the triplet CAT codesfor the amino acid histidine. With the excep-tion of the exchange of U for T, the DNA co-dons are identical to those of mRNA.
As the genetic code provides 43 = 64 co-dons for the 20 amino acids, there are severalsynonymous codons for most amino acids—the code is degenerate. Three triplets do notcode for amino acids, but instead signal theend of translation (stop codons). Anotherspecial codon, the start codon, marks the startof translation. The code shown here is almostuniversally applicable; only the mitochondria(see p. 210) and a few microorganisms devi-ate from it slightly.
As an example of the way in which thecode is read, Fig. 2 shows small sectionsfrom the normal and a mutated form of theβ-globin gene (see p. 280), as well as the cor-responding mRNA and protein sequences. Thepoint mutation shown, which is relatively fre-quent, leads to replacement of a glutamateresidue in position 6 of the β-chain by valine(GAG GTG). As a consequence, the mutatedhemoglobin tends to aggregate in the deoxy-genated form. This leads to sickle-shaped dis-
tortions of the erythrocytes and disturbancesof O2 transport (sickle-cell anemia).
B. Amino acid activation
Some 20 different amino acid tRNA ligases inthe cytoplasm each bind one type of tRNA(see p. 82) with the corresponding aminoacid. This reaction, known as amino acid acti-vation, is endergonic and is therefore coupledto ATP cleavage in two steps.
First, the amino acid is bound by the en-zyme and reacts there with ATP to form di-phosphate and an “energy–rich” mixed acidanhydride (aminoacyl adenylate). In the sec-ond step, the 3-OH group (in other ligases itis the 2-OH group) of the terminal riboseresidue of the tRNA takes over the aminoacid residue from the aminoacyl adenylate.In aminoacyl tRNAs, the carboxyl group ofthe amino acid is therefore esterified withthe ribose residue of the terminal adenosineof the sequence .. .CCA-3.
The accuracy of translation primarily de-pends on the specificity of the amino acidtRNA ligases, as incorrectly incorporatedamino acid residues are not recognized bythe ribosome later. A “proofreading mecha-nism” in the active center of the ligase there-fore ensures that incorrectly incorporatedamino acid residues are immediately re-moved again. On average, an error only occursonce every 1300 amino acid residues. This is asurprisingly low rate considering how similarsome amino acids are—e. g., leucine and iso-leucine.
C. Asp–tRNA ligase (dimer)
The illustration shows the ligase responsiblefor the activation of aspartate. Each subunit ofthe dimeric enzyme (protein parts shown inorange) binds one molecule of tRNAAsp (blue).The active centers can be located by thebound ATP (green). They are associated withthe 3 end of the tRNA. Another domain in theprotein (upper left) is responsible for “recog-nition” of the tRNA anticodon.
248 Molecular genetics
All rights reserved. Usage subject to terms and conditions of license.Koolman, Color Atlas of Biochemistry, 2nd edition © 2005 Thieme

Pro Val Glu
5'3'
5'
C A CC U C
Glu
C C T G G G A GG G A C A C C T C
TC C T G A G G A GG G A C T C C T C
C C U G U G G A GC U G A G G A G
5'3'
5'
Val
Pro Glu Glu
CG
A CTG
A
G
CT
A
CT
G
CT
A
GA C
T
Phe
Pro
Val
Glu
Gln
Leu
Ser
Tyr
Stop
Stop
Cys
Trp
Leu
His
ArgIle
Thr
Asn
Lys
Ser
Ala
Asp
Gly
Arg
Met
TCAG
TC
AG
TC
A G T C A G T C A G T C AG
TC
AG
TCAGTC
AG
TC
AG
TCAGTCAGTCAGTCA
GT
CA
GT
CAG
AC T His=
1
2
PP
ATP
AMP
tRNA
R C C O
OH3N
H
P
P O CH2O
Ade
HH
HO OH
H H
P
5'
3' 2'
P O CH2O
Ade
HH
HO OH
H H
5'
3'1'
2'
CC
O
R
H3N
H
O
HO OH
H
AdeCH2OP
O OH
HH 1'
5'
3' 2'4'
O
H
Cyt
H HH
1'
3' 2'
4'
O
O OH
H
AdeCH2OP
O
O
OH
H
Cyt
HH
H HH
1'
1'
5'
3' 2'
3' 2'4'
4'
CC
O
R
H3N
H
Normal globingene (β-chain)
Sickle-cell globingene (β-chain)
mRNA
Val-tRNA
Glu-tRNA
C. Asp-tRNA-Ligase (Dimer)B. Amino acid activation
A. The genetic code
Amino acid
Protein
ATP
Active center
Anticodon recognition domain
ATP
Activecenter
tRNAAsp
tRNAAsp
TranslationTranslation
Transcription Transcription
Example
Aminoacyl adenylate
AminoacyltRNA
Amino acid-tRNA ligase6.1.1.n
Mutation
2.1.
Start
249Genetic code
All rights reserved. Usage subject to terms and conditions of license.Koolman, Color Atlas of Biochemistry, 2nd edition © 2005 Thieme

Translation I: initiation
Like amino acid activation (see p. 248), pro-tein biosynthesis (translation) takes place inthe cytoplasm. It is catalyzed by complexnucleoprotein particles, the ribosomes, andmainly requires GTP to cover its energy re-quirements.
A. Structure of the eukaryotic ribosome
Ribosomes consist of two subunits of differentsize, made up of ribosomal RNA (rRNA) andnearly 80 proteins (the number of proteinsapplies to rat liver ribosomes). It is customaryto give the sedimentation coef cients (seep. 200) of ribosomes and their componentsinstead of their masses. For example, the eu-karyotic ribosome has a sedimentation coef-ficient of 80 Svedberg units (80 S), while thesedimentation coef cients of its subunits are40 S and 60 S (S values are not additive).
The smaller 40 S subunit consists of onemolecule of 18 S rRNA and 33 protein mole-cules. The larger 60 S subunit contains threetypes of rRNA with sedimentation coef cientsof 5 S, 5.8 S, and 28 S and 47 proteins. In thepresence of mRNA, the subunits assemble toform the complete ribosome, with a massabout 650 times larger than that of a hemo-globin molecule.
The arrangement of the individual compo-nents of a ribosome has now been deter-mined for prokaryotic ribosomes. It is knownthat filamentous mRNA passes through a cleftbetween the two subunits near the charac-teristic “horn” on the small subunit. tRNAsalso bind near this site. The illustration showsthe size of a tRNA molecule for comparison.
Prokaryotic ribosomes have a similar struc-ture, but are somewhat smaller than those ofeukaryotes (sedimentation coef cient 70 Sfor the complete ribosome, 30 S and 50 S forthe subunits). Mitochondrial and chloroplastribosomes are comparable to prokaryoticones.
B. Polysomes
In cells that are carrying out intensive proteinsynthesis, ribosomes are often found in a lin-ear arrangement like a string of pearls; theseare known as polysomes. This arrangementarises because several ribosomes are translat-
ing a single mRNA molecule simultaneously.The ribosome first binds near the start codon(AUG; see p. 248) at the 5 end of the mRNA(top). During translation, the ribosome movesin the direction of the 3 end until it reaches astop codon (UAA, UAG, or UGA). At this point,the newly synthesized chain is released, andthe ribosome dissociates again into its twosubunits.
C. Initiation of translation in E. coli
Protein synthesis in prokaryotes is in princi-ple the same as in eukaryotes. However, as theprocess is simpler and has been better studiedin prokaryotes, the details involved in trans-lation are discussed here and on p. 252 usingthe example of the bacterium Escherichia coli.
The first phase of translation, initiation, in-volves several steps. First, two proteins, ini-tiation factors IF–1 and IF–3, bind to the 30 Ssubunit (1). Another factor, IF–2, binds as acomplex with GTP (2). This allows the subunitto associate with the mRNA and makes itpossible for a special tRNA to bind to the startcodon (3). In prokaryotes, this starter tRNAcarries the substituted amino acid N-formylmethionine (fMet). In eukaryotes, it car-ries an unsubstituted methionine. Finally, the50 S subunit binds to the above complex (4).During steps 3 and 4, the initiation factors arereleased again, and the GTP bound to IF–2 ishydrolyzed to GDP and Pi.
In the 70 S initiation complex, formylme-thionine tRNA is initially located at a bindingsite known as the peptidyl site (P). A secondbinding site, the acceptor site (A), is not yetoccupied during this phase of translation.Sometimes, a third tRNA binding site is de-fined as an exit site (E), from which unchargedtRNAs leave the ribosome again (see p. 252;not shown).
250 Molecular genetics
All rights reserved. Usage subject to terms and conditions of license.Koolman, Color Atlas of Biochemistry, 2nd edition © 2005 Thieme

N
25 n
m
3'60S 40S
N
N
N
C
IF-2GTP
f-Met
IF-1
2
1 3
CA
GG
AA
AG
AG
CU
AU
G
UC
CU
P
mRNA
IF-3
tRNA-
IF-3
IF-1
IF-3
IF-1IF-2
PA
GTP
f-Met
UA
C
IF-1
IF-2
GDP
4
5
IF-3
IF-1
IF-2GTP
f-Met
A. Structure of eukaryotic ribosomes
C. Initiation of translation in E. coliB. Polysome
Stop codon(UAA,UAGor UGA)
5S-RNA(120 nt)
5.8S-RNA(160 nt)
49 Proteins 28S-RNA (4718 nt)
33 Proteins 18S-RNA (1874 nt)
Largesubunit (60S)2.8 · 106 Da
Ribosome (80S)4.2 · 106 Da
mRNA
Smallsubunit (40S)1.4 · 106 Da
Hemoglobinat the same scale
mRNA
Growingpeptidechain
Protein
Direction ofribosomalmovement
50Ssubunit
30Ssubunit
tRNA
mRNA
70S-Initiationcomplex
Termination
Elongation
rRNA(16S)
Formyl-methionine
tRNA
mRNA
Startcodon(AUG)
Protein
251Protein biosynthesis
All rights reserved. Usage subject to terms and conditions of license.Koolman, Color Atlas of Biochemistry, 2nd edition © 2005 Thieme

Translation II: elongation andtermination
After translation has been initiated (seep. 250), the peptide chain is extended by theaddition of further amino acid residues(elongation) until the ribosome reaches astop codon on the mRNA and the process isinterrupted (termination).
A. Elongation and termination of proteinbiosynthesis in E. coli
Elongation can be divided into four phases:[1] Binding of aminoacyl tRNA. First, the
peptidyl site (P) of the ribosome is occupiedby a tRNA that carries at its 3 end the com-plete peptide chain formed up to this point(top left). A second tRNA, loaded with thenext amino acid (Val–tRNAVal in the exampleshown), then binds via its complementaryanticodon (see p. 82) to the mRNA codon ex-posed at the acceptor site (in this case GUG).The tRNA binds as a complex with a GTP-containing protein, the elongation factor Tu(EF–Tu) (1a). It is only after the bound GTPhas been hydrolyzed to GDP and phosphatethat EF–Tu dissociates again (1b). As the bind-ing of the tRNA to the mRNA is still loosebefore this, GTP hydrolysis acts as a delayingfactor, making it possible to check whetherthe correct tRNA has been bound. A furtherprotein, the elongation factor Ts (EF-Ts), latercatalyzes the exchange of GDP for GTP and inthis way regenerates the EF–Tu GTP com-plex. EF-Tu is related to the G proteins in-volved in signal transduction (see p. 384).
[2] Synthesis of the peptide bond takesplace in the next step. Ribosomal peptidyl-transferase catalyzes (without consumptionof ATP or GTP) the transfer of the peptidechain from the tRNA at the P site to the NH2
group of the amino acid residue of the tRNA atthe A site. The ribosome’s peptidyltransferaseactivity is not located in one of the ribosomalproteins, but in the 28 S rRNA. Catalyticallyactive RNAs of this type are known as ribo-zymes (cf. p. 246). It is thought that the fewsurviving ribozymes are remnants of the “RNAworld”—an early phase of evolution in whichproteins were not as important as they aretoday.
[3] After the transfer of the growing pep-tide to the A site, the free tRNA at the P sitedissociates and another GTP–containing elon-gation factor (EF-G GTP) binds to the ribo-some. Hydrolysis of the GTP in this factorprovides the energy for translocation of theribosome. During this process, the ribosomemoves three bases along the mRNA in thedirection of the 3 end. The tRNA carryingthe peptide chain is stationary relative tothe mRNA and reaches the ribosome’s P siteduring translocation, while the next mRNAcodon (in this case GUG) appears at the A site.
[4] The uncharged Val-tRNA then dissoci-ates from the E site. The ribosome is nowready for the next elongation cycle.
When one of the three stop codons (UAA,UAG, or UGA) appears at the A site, termi-nation starts.
[5] There are no complementary tRNAs forthe stop codons. Instead, two releasing factorsbind to the ribosome. One of these factors(RF–1) catalyzes hydrolytic cleavage of theester bond between the tRNA and the C–ter-minus of the peptide chain, thereby releasingthe protein.
[6] Hydrolysis of GTP by factor RF–3 sup-plies the energy for the dissociation of thewhole complex into its component parts.
Energy requirements in protein synthesisare high. Four energy-rich phosphoric acidanhydride bonds are hydrolyzed for eachamino acid residue. Amino acid activationuses up two energy-rich bonds per aminoacid (ATP AMP + PP; see p. 248), and twoGTPs are consumed per elongation cycle. Inaddition, initiation and termination each re-quire one GTP per chain.
Further information
In eukaryotic cells, the number of initiationfactors is larger and initiation is thereforemore complex than in prokaryotes. The capat the 5 end of mRNA and the polyA tail (seep. 246) play important parts in initiation.However, the elongation and terminationprocesses are similar in all organisms. Theindividual steps of bacterial translation canbe inhibited by antibiotics (see p. 254).
252 Molecular genetics
All rights reserved. Usage subject to terms and conditions of license.Koolman, Color Atlas of Biochemistry, 2nd edition © 2005 Thieme

COO
3'
5'
5'
3'
3'P
PA
PA
PA
CC
UG
UG
EF-GGTP
EF-GGDP
PA
GU
G
EF-TuGDP P
PA
GU
GU
AG
6
RF-3GTP
PA
RF-3GDP
P
RF-1
RF-1
ValPro
ProPro
CC
UG
UG
CC
U
GU
GC
CU
NH3 NH3
ValPro
NH3
ValPro
NH3
EF-TuGTP
Val
4
1a 1b
2
5
NH3NH3
Val
ValPro
5'
3'
GDP EF-Ts EF-Ts GTP
1
3
5'
50Ssubunit
mRNA
30SsubunitTermination
factors Stopcodon
If stop codonin A site
Valine codon
Peptidyl transferase2.3.2.12
Elongation
A. Elongation and termination of protein biosynthesis in E. coli
Val-tRNA
tRNA
tRNA
Protein
Termination
253Protein biosynthesis
All rights reserved. Usage subject to terms and conditions of license.Koolman, Color Atlas of Biochemistry, 2nd edition © 2005 Thieme

Antibiotics
A. Antibiotics: overview
Antibiotics are substances which, even at lowconcentrations, inhibit the growth and repro-duction of bacteria and fungi. The treatmentof infectious diseases would be inconceivabletoday without antibiotics. Substances thatonly restrict the reproduction of bacteria aredescribed as having bacteriostatic effects (orfungistatic for fungi). If the target cells arekilled, then the term bactericidal (or fungici-dal) is used. Almost all antibiotics are pro-duced by microorganisms—mainly bacteriaof the genus Streptomyces and certain fungi.However, there are also synthetic antibacte-rial substances, such as sulfonamides and gy-rase inhibitors.
A constantly increasing problem in antibi-otic treatment is the development of resistantpathogens that no longer respond to thedrugs available. The illustration shows a fewof the therapeutically important antibioticsand their sites of action in the bacterial me-tabolism.
Substances known as intercalators, such asrifamycin and actinomycin D (bottom) are de-posited in the DNA double helix and therebyinterfere with replication and transcription(B). As DNA is the same in all cells, intercalat-ing antibiotics are also toxic for eukaryotes,however. They are therefore only used as cy-tostatic agents (see p. 402). Synthetic inhib-itors of DNA topoisomerase II (see p. 240),known as gyrase inhibitors (center), restrictreplication and thus bacterial reproduction.
A large group of antibiotics attack bacterialribosomes. These inhibitors of translation(left) include the tetracyclines—broad-spec-trum antibiotics that are effective against alarge number of different pathogens. The ami-noglycosides, of which streptomycin is thebest-known, affect all phases of translation.Erythromycin impairs the normal functioningof the large ribosomal subunit. Chlorampheni-col, one of the few natural nitro compounds,inhibits ribosomal peptidyltransferase. Fi-nally, puromycin mimics an aminoacyl tRNAand therefore leads to premature interruptionof elongation.
The –lactam antibiotics (bottom right) arealso frequently used. The members of thisgroup, the penicillins and cephalosporins, are
synthesized by fungi and have a reactive β-lactam ring. They are mainly used againstGram-positive pathogens, in which they in-hibit cell wall synthesis (C).
The first synthetic antibiotics were thesulfonamides (right). As analogues of p–ami-nobenzoic acid, these affect the synthesis offolic acid, an essential precursor of the coen-zyme THF (see p. 108). Transport antibiotics(top center) have the properties of ion chan-nels (see p. 222). When they are deposited inthe plasma membrane, it leads to a loss of ionsthat damages the bacterial cells.
B. Intercalators
The effects of intercalators (see also p. 262)are illustrated here using the example of thedaunomycin–DNA complex, in which twodaunomycin molecules (red) are inserted inthe double helix (blue). The antibiotic’s ringsystem inserts itself between G/C base pairs(bottom), while the sugar moiety occupies theminor groove in the DNA (above). This leadsto a localized change of the DNA conforma-tion that prevents replication and transcrip-tion.
C. Penicillin as a “suicide substrate”
The site of action in the β–lactam antibiotics ismuramoylpentapeptide carboxypeptidase, anenzyme that is essential for cross–linking ofbacterial cell walls. The antibiotic resemblesthe substrate of this enzyme (a peptide withthe C-terminal sequence D-Ala–D–Ala) and istherefore reversibly bound in the active cen-ter. This brings the β–lactam ring into prox-imity with an essential serine residue of theenzyme. Nucleophilic substitution then re-sults in the formation of a stable covalentbond between the enzyme and the inhibitor,blocking the active center (see p. 96). In divid-ing bacteria, the loss of activity of the enzymeleads to the formation of unstable cell wallsand eventually death.
254 Molecular genetics
All rights reserved. Usage subject to terms and conditions of license.Koolman, Color Atlas of Biochemistry, 2nd edition © 2005 Thieme

6
5
4
3
2
1
R'
R''
HO O OH O
CNH2
O
OH
OH
HNCH3HO
H3C CH3
SH2N NH
O
O N
S
NO2
HONH
CCHCl2
OOH
H
HC
C
HN
C N
S
NH3
HO
OCH3
CH3
H COO
H3CO O OH
O OH
CCH3
O
H O
OH
O
HOH
H HCH3
H
H
H3NH
C N
S
OCH3
CH3
H COO
R
HO
C HN
S
CH3
CH3
H COO
R
OO
A. Antibiotics: overview
C. Penicillin as “suicide substrate”B. Intercalators
mRNA DNA
Outermembrane Murein
Innermembrane
Cell wallsynthesis
Gyraseinhibitors
Ion channel
RifamycinActinomycin DDaunomycin
Transcription
Replication
Folatesynthesis
AminoglycosidesTetracyclinesErythromycinPuromycinChloramphenicol
Translation
Chloramphenicol
Nitrogroup
Transport antibiotics
Ampicillin
Daunomycin-DNA complex
R''-D-Ala-D-Ala(substrate)
Covalent acyl enzymeEnzyme-inhibitorcomplex
Serine residue
Penicillin(inhibitor)
Daunomycin
C/G pair
G/C pair
Proteins
DNA
PenicillinsCephalosporins
Sulfathiazole
Tetracycline Sulfonamides
Precursors THF
255Antibiotics
All rights reserved. Usage subject to terms and conditions of license.Koolman, Color Atlas of Biochemistry, 2nd edition © 2005 Thieme

Mutation and repair
Genetic information is set down in the basesequence of DNA. Changes in the DNA basesor their sequence therefore have mutageniceffects. Mutagens often also damage growthregulation in cells, and they are then alsocarcinogenic (see p. 400). Gene alterations(mutations) are one of the decisive positivefactors in biological evolution. On the otherhand, an excessive mutation frequency wouldthreaten the survival of individual organismsor entire species. For this reason, every cellhas repair mechanisms that eliminate most ofthe DNA changes arising from mutations (C).
A. Mutagenic agents
Mutations can arise as a result of physical orchemical effects, or they can be due to acci-dental errors in DNA replication and recombi-nation.
The principal physical mutagen is ionizingradiation (α, β, and γ radiation, X-rays). Incells, it produces free radicals (moleculeswith unpaired electrons), which are ex-tremely reactive and can damage DNA.Short-wavelength ultraviolet light (UV light)also has mutagenic effects, mainly in skin cells(sunburn). The most common chemicalchange due to UV exposure is the formationof thymine dimers, in which two neighboringthymine bases become covalently linked toone another (2). This results in errors when theDNA is read during replication and transcription.
Only a few examples of the group of chem-ical mutagens are shown here. Nitrous acid(HNO2; salt: nitrite) and hydroxylamine(NH2OH) both deaminate bases; they convertcytosine to uracil and adenine to inosine.
Alkylating compounds carry reactivegroups that can form covalent bonds withDNA bases (see also p. 402). Methylnitro-samines (3) release the reactive methyl cation(CH3
+), which methylates OH and NH2 groupsin DNA. The dangerous carcinogen benzo[a]pyrene is an aromatic hydrocarbon that isonly converted into the active form in theorganism (4; see p. 316). Multiple hydroxyla-tion of one of the rings produces a reactiveepoxide that can react with NH2 groups inguanine residues, for example. Free radicalsof benzo[a ]pyrene also contribute to its tox-icity.
B. Effects
Nitrous acid causes point mutations (1). Forexample, C is converted to U, which in thenext replication pairs with A instead of G.The alteration thus becomes permanent. Mu-tations in which a number of nucleotides notdivisible by three are inserted or removedlead to reading errors in whole segments ofDNA, as they move the reading frame (frame-shift mutations). This is shown in Fig. 2 usinga simple example. From the inserted C on-wards, the resulting mRNA is interpreted dif-ferently during translation, producing a com-pletely new protein sequence.
C. Repair mechanisms
An important mechanism for the removal ofDNA damage is excision repair (1). In thisprocess, a specific excision endonuclease re-moves a complete segment of DNA on bothsides of the error site. Using the sequence ofthe opposite strand, the missing segment isthen replaced by a DNA polymerase. Finally, aDNA ligase closes the gaps again.
Thymine dimers can be removed byphotoreactivation (2). A specific photolyasebinds at the defect and, when illuminated,cleaves the dimer to yield two single basesagain.
A third mechanism is recombination repair(3, shown in simplified form). In this process,the defect is omitted during replication. Thegap is closed by shifting the correspondingsequence from the correctly replicated secondstrand. The new gap that results is then filledby polymerases and ligases. Finally, the orig-inal defect is corrected by excision repair as inFig. 1 (not shown).
256 Molecular genetics
All rights reserved. Usage subject to terms and conditions of license.Koolman, Color Atlas of Biochemistry, 2nd edition © 2005 Thieme

1.
2. Thymine dimer
α, β, γX
[CH3 ]O
3.
4.
HNO2
·· Val-Pro- ·· -Ala-Thr-X ··
· G TAU C T ·· C AT G GA ·
· G TAU C T ·· C AT A GA ·
· G TAT C T ·· C ATAGA ·
· G TA C C T ·· C AT G G A ·
· G C TAC C T ·· C G AT G G A ·
· G C TAC C T ·· C C AT G GA ·
a
b
c
d
e
a
b
c
a
b
c
· G TAC C T ·· C AT G G A ·
· G TAC C T ·· C AT G G A ·
CH CNCO
R
CNH
CH3
OCH
CNCO
R
CNH
CH3
OR
NNO
CH3
CHHC
CC
O
HO
OH
HH
A. Mutagenic agents
Ionizingradiation
Alkylatingcompounds
UVradi-ation
HNO2
Freeradicals
Methylnitrosamine
Deletionsorinsertionsdue tofaultyrecombination
Formationofpyrimidinedimers
BaseexchangeC UA I
Spon-taneousloss ofbases
Chemicalmodificatonof bases
Mutagenicderivative ofbenzo(a)pyrene
EpoxideDesami-nation
Reactivemethylgroup
Normal
1. Point mutation
Replication
Baseexchange
Permanentchange
2. Frameshift mutation
Insertion
Replication
Thymine dimer
Excisionendonuclease
Defect-bindingprotein
Single-strandbindingproteinsDNA poly-
merase
DNA ligase
Repaired DNA
Photo-lyase4.1.99.3
2. Photoreactivation
3. Recombinational repair1. Excision repair
Light
Replication
C. Repair mechanismsB. Effects
257Mutation and repair
All rights reserved. Usage subject to terms and conditions of license.Koolman, Color Atlas of Biochemistry, 2nd edition © 2005 Thieme

DNA cloning
The growth of molecular genetics since 1970has mainly been based on the developmentand refinement of methods of analyzing andmanipulating DNA. Genetic engineering haspractical applications in many fields. For ex-ample, it has provided new methods of diag-nosing and treating diseases, and it is nowalso possible to create targeted changes inspecific characteristics of organisms. Since bi-ological risks cannot be completely ruled outwith these procedures, it is particularly im-portant to act responsibly when dealing withgenetic engineering. A short overview of im-portant methods involved in genetic engi-neering is provided here and on the followingpages.
A. Restriction endonucleases
In many genetic engineering procedures, de-fined DNA fragments have to be isolated andthen newly combined with other DNA seg-ments. For this purpose, enzymes are usedthat can cut DNA and join it together againinside the cell. Of particular importance arerestriction endonucleases—a group of bacterialenzymes that cleave the DNA double strand ina sequence–specific way. The numerous re-striction enzymes known are named usingabbreviations based on the organism fromwhich they originate. The example usedhere is EcoRI, a nuclease isolated from thebacterium Escherichia coli.
Like many other restriction endonucleases,EcoRI cleaves DNA at the site of a palin-drome—i. e., a short segment of DNA in whichboth the strand and counter-strand have thesame sequence (each read in the 53 direc-tion). In this case, the sequence is 5-GAATTC-3. EcoRI, a homodimer, cleaves the phos-phoric acid diester bonds in both strands be-tween G and A. This results in the formation ofcomplementary overhanging or “sticky” ends(AATT), which are held together by base pair-ing. However, they are easily separated—e. g.by heating. When the fragments are cooled,the overhanging ends hybridize again in thecorrect arrangement. The cleavage sites canthen be sealed again by a DNA ligase.
B. DNA cloning
Most DNA segments—e. g., genes—occur invery small quantities in the cell. To be ableto work with them experimentally, a largenumber of identical copies (“clones”) firsthave to be produced. The classic procedurefor cloning DNA takes advantage of the abilityof bacteria to take up and replicate short,circular DNA fragments known as plasmids.
The segment to be cloned is first cut out ofthe original DNA using restriction endonu-cleases (see above; for the sake of simplicity,cleavage using EcoRI alone is shown here, butin practice two different enzymes are usuallyused). As a vehicle (“vector”), a plasmid isneeded that has only one EcoRI cleavage site.The plasmid rings are first opened by cleavagewith EcoRI and then mixed with the isolatedDNA fragments. Since the fragment and thevector have the same overhanging ends, someof the molecules will hybridize in such a waythat the fragment is incorporated into thevector DNA. When the cleavage sites arenow closed again using DNA ligase, a newlycombined (“recombinant”) plasmid arises.
By pretreating a large number of host cells,one can cause some of them to take up theplasmid (a process known as transformation)and replicate it along with their own genomewhen reproducing. To ensure that only hostbacteria that contain the plasmid replicate,plasmids are used that give the host resistanceto a particular antibiotic. When the bacteriaare incubated in the presence of this antibi-otic, only the cells containing the plasmid willreplicate. The plasmid is then isolated fromthese cells, cleaved with EcoRI again, and thefragments are separated using agarose gelelectrophoresis (see p. 262). The desired frag-ment can be identified using its size and thenextracted from the gel and used for furtherexperiments.
258 Molecular genetics
All rights reserved. Usage subject to terms and conditions of license.Koolman, Color Atlas of Biochemistry, 2nd edition © 2005 Thieme

HH
O H
H H
PO O
O
H2CO
HH
3'
5'
3'
PO O
O
H2CO
H
5'
3'
OOH H
HHH
3'
5' 3'
3' 5'
G
A T C
G
A T
C T T A A
G A T C
G
A T
C T T A A
G A T C
G
A T
C T T A A
3'
5'
3'
5'
5'
3'
5'
3'
3.1.21.4 6.5.1.1
G CT TA A G CT TA A
C GA AT TC GA AT T
C T TA A GG
A AT T C
G
A
G
A
Overhanging ends
A. Restriction endonucleases
B. DNA cloning
+ DNAEcoRI
Vector DNA(Plasmid)
Purification
IsolatedDNA fragment
Gene forantibioticresistance
Recombinantplasmid
Plasmid
Bacterial culture in thepresence of antibiotic
PlasmidisolationCleavage
with
ClonedDNA fragment
Host cell(bacterium)
DNA
Bacterialgenome
Palindrome
DNA-LigaseEcoRI
Transformation
EcoRIEcoRI
EcoRI
DNA ligase
259Genetic engineering
All rights reserved. Usage subject to terms and conditions of license.Koolman, Color Atlas of Biochemistry, 2nd edition © 2005 Thieme

DNA sequencing
A. Gene libraries
It is often necessary in genetic engineering toisolate a DNA segment when its details are notfully known—e. g., in order to determine itsnucleotide sequence. In this case, one can usewhat are known as DNA libraries. A DNA li-brary consists of a large number of vector DNAmolecules containing different fragments offoreign DNA. For example, it is possible to takeall of the mRNA molecules present in a cell andtranscribe them into DNA. These DNA frag-ments (known as copy DNA or cDNA) are thenrandomly introduced into vector molecules.
A library of genomic DNA can be estab-lished by cleaving the total DNA from a cellinto small fragments using restriction endo-nucleases (see p. 258), and then incorporatingthese into vector DNA. Suitable vectors forgene libraries include bacteriophages, for ex-ample (“phages” for short). Phages are virusesthat only infect bacteria and are replicated bythem (see p. 404). Gene libraries have theadvantage that they can be searched for spe-cific DNA segments, using hybridization witholigonucleotides.
The first step is to strongly dilute a smallpart of the library (105–106 phages in a smallvolume), mix it with host bacteria, and plateout the mixture onto nutrient medium. Thebacteria grow and form a continuous cloudylayer of cells. Bacteria infected by phagesgrow more slowly. In their surroundings, thebacterial “lawn” is less dense, and a clearercircular zone known as a plaque forms. Thebacteria in this type of plaque exclusivelycontain the offspring of a single phage fromthe library.
The next step is to make an impression ofthe plate on a plastic foil, which is thenheated. This causes the phage DNA to adhereto the foil. When the foil is incubated with aDNA fragment that hybridizes to the DNA seg-ment of interest (a gene probe), the probebinds to the sites on the imprint at whichthe desired DNA is attached. Binding of thegene probe can be detected by prior radio-active or other labeling of the probe. Phagesfrom the positive plaques in the original plateare then isolated and replicated. Restrictioncleavage finally provides large amounts of thedesired DNA.
B. Sequencing of DNA
The nucleotide sequence of DNA is nowadaysusually determined using the so-called chaintermination method. In single-strand se-quencing, the DNA fragment (a) is clonedinto the DNA of phage M13 (see p. 404),from which the coded single strand can beeasily isolated. This is hybridized with a pri-mer—a short, synthetically produced DNAfragment that binds to 3 end of the intro-duced DNA segment (b).
Based on this hybrid, the missing secondstrand can now be generated in the test tubeby adding the four deoxyribonucleoside tri-phosphates (dNTP) and a suitable DNA poly-merase (c). The trick lies in also adding smallamounts of dideoxynucleoside triphosphates(ddNTP). Incorporating a ddNTP leads to thetermination of second-strand synthesis. Thiscan occur whenever the corresponding dNTPought to be incorporated. The illustrationshows this in detail using the example ofddGTP. In this case, fragments are obtainedthat each include the primer plus three, six,eight, 13, or 14 additional nucleotides. Fourseparate reactions, each with a differentddNTP, are carried out (c), and the productsare placed side by side on a supporting mate-rial. The fragments are then separated by gelelectrophoresis (see p. 76), in which theymove in relation to their length.
Following visualization (d), the sequence ofthe fragments in the individual lanes is simplyread from bottom to top (e) to directly obtainthe nucleotide sequence. A detail from such asequencing gel and the corresponding proteinsequence are shown in Fig. 2.
In a more modern procedure, the fourddNTPs are covalently marked with fluores-cent dyes, which produce a different color foreach ddNTP on laser illumination. This allowsthe sequence in which the individual frag-ments appear at the lower end of the gel tobe continuously recorded and directly storedin digital form.
260 Molecular genetics
All rights reserved. Usage subject to terms and conditions of license.Koolman, Color Atlas of Biochemistry, 2nd edition © 2005 Thieme

5' 3'3' 5'
+ 4 dNTP + 4 dNTP + 4 dNTP + 4 dNTP
G
= ddG
C
T
T
Phe
C
A
T
Tyr
T
C
G
Ala
T
C
A
Thr
A
A
G
Glu
A
A
G
Glu
G
T
A
Met
5'3'
+ ddGTP + ddATP + ddTTP + ddCTP
G A T C
G A T C
G A T C
a
b
c
d
e
f N5'
3' N
A. Gene libraries
B. Sequencing of DNA
Gene libraryin phages
Host cellImprint onplastic membrane
Platewith phage plaques
Positive plaque
Gene probe
Hybrid-ization
Washing,detectionof thegene probe
Gene Gene probe
Membrane
DNAisolation
Restriction Phagerepli-cation
Cloned gene
Single-stranded preparationHybridization
Synthetic primer
+ Polymerase
Example:
1. Method 2. Sequence pattern
+ Polymerase+ Polymerase+ Polymerase
DNAsequence
Proteinsequence
Gel electrophoresis
Visualization of the fragments
Reading off ( ) : ACGATG ...
261Genetic engineering
All rights reserved. Usage subject to terms and conditions of license.Koolman, Color Atlas of Biochemistry, 2nd edition © 2005 Thieme

PCR and protein expression
A. Polymerase chain reaction (PCR)
The polymerase chain reaction (PCR) is animportant procedure in genetic engineeringthat allows any DNA segment to be replicated(amplified) without the need for restrictionenzymes, vectors, or host cells (see p. 258).However, the nucleotide sequence of the seg-ment has to be known. Two oligonucleotides(primers) are needed, which each hybridizewith one of the strands at each end of the DNAsegment to be amplified; also needed are suf-ficient quantities of the four deoxyribonucleo-side triphosphates and a special heat-tolerantDNA polymerase. The primers are producedby chemical synthesis, and the polymerase isobtained from thermostable bacteria.
First, the starter is heated to around 90 °Cto separate the DNA double helix into singlestrands (a; cf. p. 84). The mixture is thencooled to allow hybridization of the primers(b). Starting from the primers, complemen-tary DNA strands are now synthesized inboth directions by the polymerase (c). Thiscycle (cycle 1) is repeated 20–30 times withthe same reaction mixture (cycle 2 and sub-sequent cycles). The cyclic heating and cool-ing are carried out by computer-controlledthermostats.
After only the third cycle, double strandsstart to form with a length equal to the dis-tance between the two primers. The propor-tion of these approximately doubles duringeach cycle, until almost all of the newly syn-thesized segments have the correct length.
B. DNA electrophoresis
The separation of DNA fragments by electro-phoresis is technically simpler than proteinelectrophoresis (see p. 78). The mobility ofmolecules in an electrical field of a givenstrength depends on the size and shape ofthe molecules, as well as their charge. In con-trast to proteins, in which all three factorsvary, the ratio of mass to charge in nucleicacids is constant, as all of the nucleotide com-ponents have similar masses and carry onenegative charge. When electrophoresis is car-ried out in a wide-meshed support materialthat does not separate according to size andshape, the mobility of the molecules depends
on their mass alone. The supporting materialgenerally used in genetic engineering is a gelof the polysaccharide agarose (see p. 40).Agarose gels are not very stable and are there-fore poured horizontally into a plastic cham-ber in which they are used for separation(top).
To make the separated fragments visible,after running the procedure the gels areplaced in solutions of ethidium bromide.This is an intercalator (see p. 254) that showsstrong fluorescence in UV light after bindingto DNA, although it barely fluoresces in anaqueous solution. The result of separatingtwo PCR amplificates (lanes 1 and 2) is shownin the lower part of the illustration. Compar-ing their distances with those of poly-nucleotides of known lengths (lane 3; bp =base pairs) yields lengths of approximately800 bp for fragment 1 and 1800 bp for frag-ment 2. After staining, the bands can be cutout of the gel and the DNA can be extractedfrom them and used for further experiments.
C. Overexpression of proteins
To treat some diseases, proteins are neededthat occur in such small quantities in the or-ganism that isolating them on a large scalewould not be economically feasible. Proteinsof this type can be obtained by overexpressionin bacteria or eukaryotic cells. To do this, thecorresponding gene is isolated from humanDNA and cloned into an expression plasmidas described on p. 258. In addition to the geneitself, the plasmid also has to contain DNAsegments that allow replication by the hostcell and transcription of the gene. After trans-formation and replication of suitable hostcells, induction is used in a targeted fashionto trigger ef cient transcription of the gene.Translation of the mRNA formed in the hostcell then gives rise to large amounts of thedesired protein. Human insulin (see p. 76),plasminogen activators for dissolving bloodclots (see p. 292), and the growth hormonesomatotropin are among the proteins pro-duced in this way.
262 Molecular genetics
All rights reserved. Usage subject to terms and conditions of license.Koolman, Color Atlas of Biochemistry, 2nd edition © 2005 Thieme

2
1
3
a
b
c
cba
cba
Indu
ctio
n
1 2 3
bp
b
a
1857
1058929
383
NH3C
NH2
Br
Sample
C. Overexpression of proteins
A. Polymerase chain reaction (PCR) B. DNA electrophoresis
Gene to beexpressed
Ribosomebindingsite
Induciblepromotor
Origin ofreplication
Gene forantibioticresistance
Expression plasmid
Host cell
Trans-formation
Repli-cation
Proteinpurification
Celllysis
Overexpressedprotein
Electrophoresis chamber
Agarose gel
Ethidium bromide
Power supplyunit
Heat
Hybridize
De-novo synthesis(DNA polymerase)
etc
Cycle
Cycle
Cycle
Primer
DNA
263Genetic engineering
All rights reserved. Usage subject to terms and conditions of license.Koolman, Color Atlas of Biochemistry, 2nd edition © 2005 Thieme

Genetic engineering in medicine
Genetic engineering procedures are becom-ing more and more important in medicinefor diagnostic purposes (A–C). New geneticapproaches to the treatment of severe dis-eases are still in the developmental stage(“gene therapy,” D).
A. DNA fingerprinting
DNA fingerprinting is used to link smallamounts of biological material—e. g., tracesfrom the site of a crime—to a specific person.The procedure now used is based on the factthat the human genome contains non-codingrepetitive DNA sequences, the length of whichvaries from individual to individual. Shorttandem repeats (STRs) thus exist in whichdinucleotides (e. g., -T-X-) are frequently re-peated. Each STR can occur in five to 15 differ-ent lengths (alleles), of which one individualpossesses only one or two. When the variousallele combinations for several STRs are de-termined after PCR amplification of the DNAbeing investigated, a “genetic fingerprint” ofthe individual from whom the DNA originatesis obtained. Using comparative material—e. g.,saliva samples—definite identification is thenpossible.
B. Diagnosis of sickle-cell anemia using RFLP
This example illustrates a procedure for diag-nosing a point mutation in the β-globin genethat leads to sickle-cell anemia (see p. 248).The mutation in the first exon of the genedestroys a cleavage site for the restrictionendonuclease MstII (see p. 258). When theDNA of healthy and diseased individuals iscleaved with MstII, different fragments areproduced in the region of the β-globin gene,which can be separated by electrophoresisand then demonstrated using specific probes(see p. 260). In addition, heterozygotic car-riers of the sickle-cell gene can be distin-guished from homozygotic ones.
C. Identification of viral DNA using RT-PCR
In viral infections, it is often dif cult to deter-mine the species of the pathogen precisely.RT-PCR can be used to identify RNA viruses. Inthis procedure, reverse transcriptase (seep. 404) is used to transcribe the viral RNAinto dsDNA, and then PCR is employed to
amplify a segment of this DNA with virus-specific primers. In this way, an amplificatewith a characteristic length can be obtainedfor each pathogen and identified using gelelectrophoresis as described above.
D. Gene therapy
Many diseases, such as hereditary metabolicdefects and tumors, can still not be ad-equately treated. About 10 years ago, projectswere therefore initiated that aimed to treatdiseases of this type by transferring genesinto the affected cells (gene therapy). Theillustration combines conceivable and alreadyimplemented approaches to gene therapy formetabolic defects (left) and tumors (right).None of these procedures has yet becomeestablished in clinical practice.
If a mutation leads to failure of an enzymeE1 (left), its substrate B will no longer beconverted into C and will accumulate. Thiscan lead to cell damage by B itself or by atoxic product formed from it. Treatmentwith intact E1 is not possible, as the proteinsare not capable of passing through the cellmembrane. By contrast, it is in principle pos-sible to introduce foreign genes into the cellusing viruses as vectors (adenoviruses or ret-roviruses are mainly used). Their gene prod-ucts could replace the defective E1 or convertB into a harmless product. Another approachuses the so-called antisense DNA (bottomright). This consists of polynucleotides thathybridize with the mRNA for specific cellularproteins and thereby prevent their transla-tion. In the case shown, the synthesis of E2could be blocked, for example.
The main problem in chemotherapy fortumors is the lack of tumor-specificity in thehighly toxic cytostatic agents used (seep. 402). Attempts are therefore being madeto introduce into tumor cells genes with prod-ucts that are only released from a precursor toform active cytostatics once they havereached their target (left). Other gene prod-ucts are meant to force the cells into apoptosis(see p. 396) or make them more susceptibleto attack by the immune system. To steer theviral vectors to the tumor (targeting), at-tempts are being made to express proteinson the virus surface that are bound by tu-mor-specific receptors. Fusion with a tumor-specific promoter could also help limit theeffect of the foreign gene to the tumor cells.
264 Molecular genetics
All rights reserved. Usage subject to terms and conditions of license.Koolman, Color Atlas of Biochemistry, 2nd edition © 2005 Thieme

B. Diagnosis of sickle-cell anemia using RFLP
DNA
Evidence
Locus 1Locus 2Locus 3
Comparativefragments
Alleles
1/3
1/4
2/4
3/3
3/5
Agarose gel
Locus 1
Locus 2
Locus 3
Mst II1200 bp
Mst II
1401 bp
201 bp
E1 I1 E2
Normalgene
Sickle-cellgene
1 2 3
1 Normal (A/A)2 Heterozygotic (A/S)3 Homozygotic (S/S)
Virus
RNA Hy-brid
ss-DNA
ds-DNA
P2
PCR
P3
P1
Reversetranscriptase
DNA polymerase
Amplificate Standards
Agarose gel
A. DNA fingerprinting
C. Evidence of viral DNA using RT-PCR
Mst II Mst II
STR, z.B.TCTATCTGTCTG
Mutation
1.21.4
kbp
Amplificate
Extraction
PCR
D. Gene therapy
1. For metabolic defects
Viral vector withforeign DNA
Normalbody cell
Harmlessproduct
Toxicproduct
AntisenseDNA Lipo-
some
2. For tumors
Tumor-specificreceptor
Viral vectorwith foreign DNA
Tumor-specificpromoter
Cytostaticagent
Tumor cell
DNA
mRNA
DNA
mRNA
Geneproduct
Accu-mulates
Geneproduct
Celldeath
Apoptosis
Immunesystem
Genome
E1
E1
E1
Cellproliferation
E1
E2
CBA
265Genetic engineering
All rights reserved. Usage subject to terms and conditions of license.Koolman, Color Atlas of Biochemistry, 2nd edition © 2005 Thieme

Digestion: overview
Most components of food (see p. 360) cannotbe resorbed directly by the organism. It is onlyafter they have been broken down intosmaller molecules that the organism cantake up the essential nutrients. Digestion re-fers to the mechanical and enzymatic break-down of food and the resorption of the result-ing products.
A. Hydrolysis and resorption of foodcomponents
Following mechanical fragmentation of foodduring chewing in the mouth, the process ofenzymatic degradation starts in the stomach.For this purpose, the chyme is mixed withdigestive enzymes that occur in the variousdigestive secretions or in membrane-boundform on the surface of the intestinal epithe-lium (see p. 268). Almost all digestive en-zymes are hydrolases (class 3 enzymes; seep. 88); they catalyze the cleavage of compo-site bonds with the uptake of water.
Proteins are first denatured by thestomach’s hydrochloric acid (see p. 270), mak-ing them more susceptible to attack by theendopeptidases (proteinases) present in gas-tric and pancreatic juice. The peptides re-leased by endopeptidases are further de-graded into amino acids by exopeptidases. Fi-nally, the amino acids are resorbed by theintestinal mucosa in cotransport with Na+
ions (see p. 220). There are separate transportsystems for each of the various groups ofamino acids.
Carbohydrates mainly occur in food in theform of polymers (starches and glycogen).They are cleaved by pancreatic amylase intooligosaccharides and are then hydrolyzed byglycosidases, which are located on the surfaceof the intestinal epithelium, to yield mono-saccharides. Glucose and galactose are takenup into the enterocytes by secondary activecotransport with Na+ ions (see p. 220). In ad-dition, monosaccharides also have passivetransport systems in the intestine.
Nucleic acids are broken down into theircomponents by nucleases from the pancreasand small intestine (ribonucleases and deoxy-ribonucleases). Further breakdown yields thenucleobases (purine and pyrimidine deriva-tives), pentoses (ribose and deoxyribose),
phosphate, and nucleosides (nucleobase pen-tose). These cleavage products are resorbedby the intestinal wall in the region of thejejunum.
Lipids are a special problem for digestion,as they are not soluble in water. Before enzy-matic breakdown, they have to be emulsifiedby bile salts and phospholipids in the bile (seep. 314). At the water–lipid interface, pancre-atic lipase then attacks triacylglycerols withthe help of colipase (see p. 270). The cleavageproducts include fatty acids, 2–monoacylgly-cerols, glycerol, and phosphate from phospho-lipid breakdown. After resorption into theepithelial cells, fats are resynthesized fromfatty acids, glycerol and 2–monoacylglycerolsand passed into the lymphatic system (seep. 272). The lipids in milk are more easilydigested, as they are already present in emul-sion; on cleavage, they mostly provide short-chain fatty acids.
Inorganic components such as water, elec-trolytes, and vitamins are directly absorbed bythe intestine.
High-molecular-weight indigestible com-ponents, such as the fibrous components ofplant cell walls, which mainly consist of cel-lulose and lignin, pass through the bowel un-changed and form the main component offeces, in addition to cells shed from the intes-tinal mucosa. Dietary fiber makes a positivecontribution to digestion as a ballast materialby binding water and promoting intestinalperistalsis.
The food components resorbed by the epi-thelial cells of the intestinal wall in the regionof the jejunum and ileum are transporteddirectly to the liver via the portal vein. Fats,cholesterol, and lipid–soluble vitamins areexceptions. These are first released by theenterocytes in the form of chylomicrons (seep. 278) into the lymph system, and only reachthe blood via the thoracic duct.
266 Tissues and organs
All rights reserved. Usage subject to terms and conditions of license.Koolman, Color Atlas of Biochemistry, 2nd edition © 2005 Thieme

HCl
A. Hydrolysis and resorption of dietary constituents
Proteins Carbohydrates Nucleic acids Lipids FiberVitaminsInorganicsubstancesBile salts
Phospholipids
2-Monoacyl-glycerolFatty acidsCholesterol
CelluloseLignin
GlucoseGalactose
Portal vessel Lymph system
Blood Feces
*Resorption by active transport
Nut
rient
sC
leav
age
prod
ucts
Tran
spor
t
Aminoacids
Mono-saccharides
Glycerolphosphate
Liver
NucleobasesPentosesPhosphateNucleosides
Hydrophilic Lipophilic
R e s o r p t i o n
E n z y m a t i c h y d r o l y s i s
Wilh
elm
Bus
ch
* **
267Digestion
All rights reserved. Usage subject to terms and conditions of license.Koolman, Color Atlas of Biochemistry, 2nd edition © 2005 Thieme

Digestive secretions
A. Digestive juices
Saliva. The salivary glands produce a slightlyalkaline secretion which—in addition to waterand salts—contains glycoproteins (mucins) aslubricants, antibodies, and enzymes.
–Amylase attacks polysaccharides, and a li-pase hydrolyzes a small proportion of theneutral fats. α–Amylase and lysozyme, a mu-rein-cleaving enzyme (see p. 40), probablyserve to regulate the oral bacterial flora ratherthan for digestion (see p. 340).
Gastric juice. In the stomach, the chyme ismixed with gastric juice. Due to its hydro-chloric acid content, this secretion of the gas-tric mucosa is strongly acidic (pH 1–3; seep. 270). It also contains mucus (mainly glyco-proteins known as mucins), which protectsthe mucosa from the hydrochloric acid, salts,and pepsinogen—the proenzyme (“zymogen”)of the aspartate proteinase pepsin (seepp. 176, 270). In addition, the gastric mucosasecretes what is known as “intrinsic factor”—aglycoprotein needed for resorption of vitaminB12 ( “extrinsic factor”) in the bowel.
In the stomach, pepsin and related en-zymes initiate the enzymatic digestion of pro-teins, which takes 1–3 hours. The acidic gas-tric contents are then released into the duo-denum in batches, where they are neutralizedby alkaline pancreatic secretions and mixedwith cystic bile.
Pancreatic secretions. In the acinar cells,the pancreas forms a secretion that is alkalinedue to its HCO3
– content, the buffer capacityof which is suf cient to neutralize the stom-ach’s hydrochloric acid. The pancreatic secre-tion also contains many enzymes that catalyzethe hydrolysis of high–molecular-weight foodcomponents. All of these enzymes are hydro-lases with pH optimums in the neutral orweakly alkaline range. Many of them areformed and secreted as proenzymes and areonly activated in the bowel lumen (seep. 270).
Trypsin, chymotrypsin, and elastase are en-dopeptidases that belong to the group of ser-ine proteinases (see p. 176). Trypsin hydro-lyzes specific peptide bonds on the C side ofthe basic amino acids Arg and Lys, while chy-motrypsin prefers peptide bonds of the apolaramino acids Tyr, Trp, Phe, and Leu (see p. 94).
Elastase mainly cleaves on the C side of thealiphatic amino acids Gly, Ala, Val, and Ile.Smaller peptides are attacked by carboxy-peptidases, which as exopeptidases cleave in-dividual amino acids from the C–terminal endof the peptides (see p. 176).
–Amylase, the most important endoglyco-sidase in the pancreas, catalyzes the hydroly-sis of α14 bonds in the polymeric carbohy-drates starch and glycogen. This releases mal-tose, maltotriose, and a mixture of other oli-gosaccharides.
Various pancreatic enzymes hydrolyze lip-ids, including lipase with its auxiliary proteincolipase (see p. 270), phospholipase A2, andsterol esterase. Bile salts activate the lipid-cleaving enzymes through micelle formation(see below).
Several hydrolases—particularly ribo-nuclease (RNAse) and deoxyribonuclease(DNAse)—break down the nucleic acids con-tained in food.
Bile. The liver forms a thin secretion (bile)that is stored in the gallbladder after waterand salts have been extracted from it. Fromthe gallbladder, it is released into the duode-num. The most important constituents of bileare water and inorganic salts, bile acids andbile salts (see p. 314), phospholipids, bile pig-ments, and cholesterol. Bile salts, togetherwith phospholipids, emulsify insoluble foodlipids and activate the lipases. Without bile,fats would be inadequately cleaved, if at all,resulting in “fatty stool” (steatorrhea). Re-sorption of fat-soluble vitamins would alsobe affected.
Small-intestinal secretions. The glands ofthe small intestine (the Lieberkühn and Brun-ner glands) secrete additional digestive en-zymes into the bowel. Together with enzymeson the microvilli of the intestinal epithelium(peptidases, glycosidases, etc.), these en-zymes ensure almost complete hydrolysis ofthe food components previously brokendown by the endoenzymes.
268 Tissues and organs
All rights reserved. Usage subject to terms and conditions of license.Koolman, Color Atlas of Biochemistry, 2nd edition © 2005 Thieme

A. Digestive juices
Functionor substrate
Compo-nents
EndoenzymeExoenzyme
Pancreatic secretionsDaily secretion 0.7–2.5 lpH 7.7 (7.5–8.8)WaterHCO3Trypsin (3.4.21.4)Chymotrypsin (3.4.21.1)Elastase (3.4.21.36)Carboxypeptidases (3.4.n.n)α-Amylase (3.2.1.1)Triacylglycerol lipase (3.1.1.3)Co-LipasePhospholipase A2 (3.1.1.4)Sterol esterase (3.1.1.13)Ribonuclease (3.1.27.5)Deoxyribonuclease I (3.1.21.1)
Neutralizes gastric juiceProteinsProteinsProteinsPeptidesStarch and glycogenFatsCofactor for lipasePhospholipidsCholesterol estersRNADNA
BileDaily secretion 0.6 lpH 6.9–7.7WaterHCO3Bile saltsPhospholipidsBile pigmentsCholesterol
Neutralizes gastric juiceFacilitate lipid digestionFacilitate lipid digestionWaste productsWaste product
Gastric juiceDaily secretion 2–3 lpH 1WaterSaltsHCl
MucusPepsins (3.4.23.1-3)Chymosin (3.4.23.4)Triacylglycerol lipase (3.1.1.3)Intrinsic factor
Denatures proteins,kills bacteriaProtects stomach liningCleave proteinsPrecipitates caseinCleaves fatsProtects vitamin B12
Secretions of the small intestineDaily secretion unknownpH 6.5–7.8Aminopeptidases (3.4.11.n)Dipeptidases (3.4.13.n)α-Glucosidase (3.2.1.20)Oligo-1,6-glucosidase (3.2.1.10)β-Galactosidase (3.2.1.23)Sucrose α-glucosidase (3.2.1.48)α, α-Trehalase (3.2.1.28)Alkaline phosphatase (3.1.3.1)Polynucleotidases (3.1.3.n)Nucleosidases (3.2.2.n)Phospholipases (3.1.n.n)
PeptidesDipeptidesOligosaccharidesOligosaccharidesLactoseSucroseTrehalosePhosphoric acid estersNucleic acids, nucleotidesNucleosidesPhospholipids
SalivaDaily secretion 1.0–1.5 lpH 7WaterSaltsMucusAntibodiesα-Amylases (3.2.1.1)Lysozyme (3.2.1.17)
Moistens food
LubricantBind to bacteriaCleave starchAttacks bacterial cell walls
269Digestion
All rights reserved. Usage subject to terms and conditions of license.Koolman, Color Atlas of Biochemistry, 2nd edition © 2005 Thieme

Digestive processes
Gastric juice is the product of several celltypes. The parietal cells produce hydrochloricacid, chief cells release pepsinogen, and acces-sory cells form a mucin-containing mucus.
A. Formation of hydrochloric acid
The secretion of hydrochloric acid (H+ and Cl–)by the parietal cells is an active process thatuses up ATP and takes place against a concen-tration gradient (in the gastric lumen, with apH of 1, the H+ concentration is some 106
times higher than in the parietal cells, whichhave a pH of 7).
The precursors of the exported H+ ions arecarbon dioxide (CO2) and water (H2O). CO2
diffuses from the blood into the parietal cells,and in a reaction catalyzed by carbonate de-hydratase (carbonic anhydrase [2]), it reactswith H2O to form H+ and hydrogen carbonate(HCO3
–). The H+ ions are transported into thegastric lumen in exchange for K+ by a mem-brane-bound H+/K+-exchanging ATPase [1] (atransport ATPase of the P type; see p. 220).The remaining hydrogen carbonate is re-leased into the interstitium in electroneutralantiport in exchange for chloride ions (Cl–),and from there into the blood. The Cl– ionsfollow the secreted protons through a chan-nel into the gastric lumen.
The hydrochloric acid in gastric juice isimportant for digestion. It activates pepsin-ogen to form pepsin (see below) and createsan optimal pH level for it to take effect. It alsodenatures food proteins so that they are moreeasily attacked by proteinases, and it killsmicro-organisms.
Regulation. HCl secretion is stimulated bythe peptide hormone gastrin, the mediatorhistamine (see p. 380), and—via the neuro-transmitter acetylcholine—by the autonomousnervous system. The peptide somatostatinand certain prostaglandins (see p. 390) haveinhibitory effects. Together with cholecysto-kinin, secretin, and other peptides, gastrinbelongs to the group of gastrointestinal hor-mones (see p. 370). All of these are formed inthe gastrointestinal tract and mainly act in thevicinity of the site where they are formed—i. e., they are paracrine hormones (see p. 372).While gastrin primarily enhances HClsecretion, cholecystokinin and secretin mainly
stimulate pancreatic secretion and bile re-lease.
B. Zymogen activation
To prevent self–digestion, the pancreas re-leases most proteolytic enzymes into the du-odenum in an inactive form as proenzymes(zymogens). Additional protection from theeffects of premature activation of pancreaticproteinases is provided by proteinase inhibi-tors in the pancreatic tissue, which inactivateactive enzymes by complex formation (right).
Trypsinogen plays a key role among theproenzymes released by the pancreas. In thebowel, it is proteolytically converted into ac-tive trypsin (see p. 176) by enteropeptidase, amembrane enzyme on the surface of the en-terocytes. Trypsin then autocatalytically acti-vates additional trypsinogen molecules andthe other proenzymes (left).
C. Fat digestion
Due to the “hydrophobic effect” (see p. 28),water-insoluble neutral fats in the aqueousenvironment of the bowel lumen would ag-gregate into drops of fat in which most of themolecules would not be accessible to pancre-atic lipase. The amphipathic substances in bile(bile acids, bile salts, phospholipids) create anemulsion in which they occupy the surface ofthe droplets and thereby prevent them fromcoalescing into large drops. In addition, thebile salts, together with the auxiliary proteincolipase, mediate binding of triacylglycerollipase [1] to the emulsified fat droplets. Acti-vation of the lipase is triggered by a confor-mation change in the C-terminal domain ofthe enzyme, which uncovers the active center.
During passage through the intestines, theactive lipase breaks down the triacylglycerolsin the interior of the droplets into free fattyacids and amphipathic monoacylglycerols.Over time, smaller micelles develop (seep. 28), in the envelope of which monoacylgly-cerols are present in addition to bile salts andphospholipids. Finally, the components of themicelles are resorbed by the enterocytes inways that have not yet been explained.
Monoacylglycerols and fatty acids are re-assembled into fats again (see p. 272), whilethe bile acids return to the liver (enterohe-patic circulation; see p. 314).
270 Tissues and organs
All rights reserved. Usage subject to terms and conditions of license.Koolman, Color Atlas of Biochemistry, 2nd edition © 2005 Thieme

H
HCO3
CO2
H2O
Cl
CO2
K
Cl
HCO3
H
K
≈ 0.1 mol · l-1
AP P
P
AP P P
2
Cl
21
1
1
1
H Cl
1
Anionexchanger
A. Formation of hydrochloric acid
B. Zymogen activation
Interstitialfluid
Parietal cell Lumen of the stomachPeptides
Pepsino-gens
Pepsins3.4.23.1-3 Native
protein
Micro-organism
DenaturedproteinChloride channel
Activated digestiveenzymes
Digestion
Mucosal cell Entero-peptidase3.4.21.9
Trypsin3.4.21.4
Zymogens: Procarboxypeptidases Proelastase Chymotrypsinogen Prophospholipase A2 Trypsinogen
H /K -exchanging ATPase 3.6.1.36Carbonate dehydratase 4.2.1.1 [Zn2 ]
Variouszymogens
Trypsin inhibitor
Blocked trypsin
Prematuretrypsinactivation
Trypsinogen
C. Fat digestion
Small bowel Pancreatic secretion
Triacylglycerol lipase 3.1.1.3
C-terminaldomain
Colipase
Bile salt
Phospholipid
Triacylglycerol
Monoacyl-glycerol
Enterocyte
ResorptionMicelle
271Digestion
All rights reserved. Usage subject to terms and conditions of license.Koolman, Color Atlas of Biochemistry, 2nd edition © 2005 Thieme

Resorption
Enzymatic hydrolysis in the digestive tractbreaks down foodstuffs into their resorbablecomponents. Resorption of the cleavage prod-ucts takes place primarily in the small intes-tine. Only ethanol and short–chain fatty acidsare already resorbed to some extent in thestomach.
The resorption process is facilitated by thelarge inner surface of the intestine, with itsbrush–border cells. Lipophilic molecules pen-etrate the plasma membrane of the mucosalcells by simple diffusion, whereas polar mol-ecules require transporters (facilitated diffu-sion; see p. 218). In many cases, carrier-medi-ated cotransport with Na+ ions can be ob-served. In this case, the difference in the con-centration of the sodium ions (high in theintestinal lumen and low in the mucosal cells)drives the import of nutrients against a con-centration gradient (secondary active trans-port; see p. 220). Failure of carrier systems inthe gastrointestinal tract can result in dis-eases.
A. Monosaccharides
The cleavage of polymeric carbohydrates by–amylase [1] leads to oligosaccharides,
which are broken down further by exoglyco-sidases (oligosaccharidases and disacchari-dases [2]) on the membrane surface of thebrush border. The monosaccharides releasedin this way then pass with the help of varioussugar–specific transporters into the cells ofintestinal epithelium. Secondary activetransport serves for the uptake of glucoseand galactose, which are transported againsta concentration gradient in cotransport withNa+. The Na+ gradient is maintained on thebasal side of the cells by Na+/K+-ATPase [3].Another passive transporter then releasesglucose and galactose into the blood.Fructose is taken up by a special type of trans-porter using facilitated diffusion.
Amino acids (not illustrated)
Protein degradation is initiated by proteina-ses—by pepsins in the stomach and by trypsin,chymotrypsin, and elastase in the small intes-tine. The resulting peptides are then furtherhydrolyzed by various peptidases into amino
acids. Individual amino acid groups havegroup–specific amino acid transporters, someof which transport the amino acids into theenterocytes in cotransport with Na+ ions (sec-ondary active transport), while others trans-port them in an Na+–independent mannerthrough facilitated diffusion. Small peptidescan also be taken up.
B. Lipids
Fats and other lipids are poorly soluble inwater. The larger the accessible surfaceis—i. e., the better the fat is emulsified—theeasier it is for enzymes to hydrolyze it (seep. 270). Due to the special properties of milk,milk fats already reach the gastrointestinaltract in emulsified form. Digestion of themtherefore already starts in the oral cavityand stomach, where lipases in the saliva andgastric juice are available. Lipids that are lessaccessible—e. g., from roast pork—are emulsi-fied in the small intestine by bile salts and bilephospholipids. Only then are they capable ofbeing attacked by pancreatic lipase [4] (seep. 270).
Fats (triacylglycerols) are mainly attackedby pancreatic lipase at positions 1 and 3 of theglycerol moiety. Cleavage of two fatty acidresidues gives rise to fatty acids and 2-mono-acylglycerols, which are quantitatively themost important products. However, a certainamount of glycerol is also formed by completehydrolysis. These cleavage products are re-sorbed by a non-ATP-dependent processthat has not yet been explained in detail.
In the mucosal cells, long-chain fatty acidsare resynthesized by an ATP-dependent ligase[5] to form acyl-CoA and then triacylglycerols(fats; see p. 170). The fats are released into thelymph in the form of chylomicrons (seep. 278) and, bypassing the liver, are depositedin the thoracic duct—i. e., the blood system.Cholesterol also follows this route.
By contrast, short-chain fatty acids (withchain lengths of less than 12 C atoms) passdirectly into the blood and reach the liver viathe portal vein. Resorbed glycerol can alsotake this path.
272 Tissues and organs
All rights reserved. Usage subject to terms and conditions of license.Koolman, Color Atlas of Biochemistry, 2nd edition © 2005 Thieme

3x
2x
80%
ATP ADPPi
2 K
2 K3 Na
*
20%
3
*
3
4
4
4
5
4
P P
P
AP P P
AP
5
Na Na
1
2
AS
AS
1
2
IntestinallumenTriacyl-
glycerol
Diacyl-glycerol
2-Mono-acyl-glycerol
Fatty acids
Glyco-lysis
Thoracicduct
Portalvein
Fatsynthesis
Lymph
Blood
Poly-saccharides
α-Amylase
Oligo-saccharides
Glucosetransporter
Liver
GlucoseGalactose
GlucoseGalactose
Na glucosesymporter
Portalvein
FructoseOther mono-saccharides
FructoseOther mono-saccharides
Glycerol
Stimulated by bile salts,phospholipids, colipase and Ca2
Triacylglycerol lipase 3.1.1.3
Fatty acid-CoA ligase 6.2.1.3
Secondary-active transportFacilitated diffusion
α-Amylase 3.2.1.1
DisaccharidasesOligosaccharidases
Na /K -exchangingATPase 3.6.1.37
Fatsynthesis
Short-chainfatty acids
Resorption
Liver
A. Monosaccharides
B. Lipids
Intestinalepithelial cell
Intestinalepithelial cell
273Digestion
All rights reserved. Usage subject to terms and conditions of license.Koolman, Color Atlas of Biochemistry, 2nd edition © 2005 Thieme

Blood: composition and functions
Human blood constitutes about 8% of thebody’s weight. It consists of cells and cell frag-ments in an aqueous medium, the bloodplasma. The proportion of cellular elements,known as hematocrit, in the total volume isapproximately 45%.
A. Functions of the blood
The blood is the most important transportmedium in the body. It serves to keep the“internal milieu” constant (homeostasis) andit plays a decisive role in defending the bodyagainst pathogens.
Transport. The gases oxygen and carbondioxide are transported in the blood. Theblood mediates the exchange of substancesbetween organs and takes up metabolic endproducts from tissues in order to transportthem to the lungs, liver, and kidney for excre-tion. The blood also distributes hormonesthroughout the organism (see p. 370).
Homeostasis. The blood ensures that a bal-anced distribution of water is maintained be-tween the vascular system, the cells (intra-cellular space), and the extracellular space.The acid–base balance is regulated by theblood in combination with the lungs, liver,and kidneys (see p. 288). The regulation ofbody temperature also depends on the con-trolled transport of heat by the blood.
Defense. The body uses both non-specificand specific mechanisms to defend itselfagainst pathogens. The defense system in-cludes the cells of the immune system andcertain plasma proteins (see p. 294).
Self-protection. To prevent blood losswhen a vessel is injured, the blood has sys-tems for stanching blood flow and coagulat-ing the blood (hemostasis; see p. 290). Thedissolution of blood clots (fibrinolysis) isalso managed by the blood itself (see p. 292).
B. Cellular elements
The solid elements in the blood are the eryth-rocytes (red blood cells), leukocytes (whiteblood cells), and thrombocytes (platelets).
The erythrocytes provide for gas transportin the blood. They are discussed in greaterdetail on pp. 280–285.
The leukocytes include various types ofgranulocyte, monocyte, and lymphocyte. Allof these have immune defense functions (seep. 294). The neutrophil granulocytes¸ mono-cytes, and the macrophages derived frommonocytes are phagocytes. They can ingestand degrade invading pathogens. The lympho-cytes are divided into two groups, B lympho-cytes and T lymphocytes. B lymphocytesproduce antibodies, while T lymphocytes reg-ulate the immune response and destroy virus-infected cells and tumor cells. Eosinophilic andbasophilic granulocytes have special tasks fordefense against animal parasites.
Thrombocytes are cell fragments that arisein the bone marrow from large precursorcells, the megakaryocytes. Their task is topromote hemostasis (see p. 290).
C. Blood plasma: composition
The blood plasma is an aqueous solution ofelectrolytes, nutrients, metabolites, proteins,vitamins, trace elements, and signaling sub-stances. The fluid phase of coagulated blood isknown as blood serum. It differs from theplasma in that it lacks fibrin and other coag-ulation proteins (see p. 290).
Laboratory assessment of the compositionof the blood plasma is often carried out inclinical chemistry. Among the electrolytes,there is a relatively high concentration ofNa+, Ca2+, and Cl– ions in the blood in compar-ison with the cytoplasm. By contrast, the con-centrations of K+, Mg2+, and phosphate ionsare higher in the cells. Proteins also have ahigher intracellular concentration. The elec-trolyte composition of blood plasma is similarto that of seawater, due to the evolution ofearly forms of life in the sea. The solutionknown as “physiological saline” (NaCl at a con-centration of 0.15 mol L–1) is almost isotonicwith blood plasma.
A list of particularly important metabolitesin the blood plasma is given on the right.
274 Tissues and organs
All rights reserved. Usage subject to terms and conditions of license.Koolman, Color Atlas of Biochemistry, 2nd edition © 2005 Thieme

1 2 3 4 5 6123456
Transport
Homeostasis
Defense Self defense
Water balance
Acid-basebalance
Blood gases:
Hormones
NutrientsMetabolitesMetabolicwastes
Extracellularspace
Bodytemperature
Immune cells Antibodies
Blood clottingand fibrinolysis
A. Functions of the blood B. Cellular elements
C. Blood plasma: composition
Cations
OrganicacidsProteins
Anions
Unchargedmolecules
Concentration (mM)MetaboliteNon-electrolytes Concentration
Erythrocyte
Thrombocytes
granulocyte
Neutrophilicgranulocyte
Monocyte
lymphocyte
Small Large
Eosinophilic Basophilic
Leukocytes
Cell
UreaUric acidCreatininAmino acidsAmmonia
GlucoseLactatePyruvate
Lipids (total)TriacylglycerolsCholesterol
O2
CO2
H2OH
OH
5000 · 109 · l-1
10 µm
59% 6.5%
31%
2.4% 0.6%
200
150
100
50
mM
H2CO3
Na
K
Ca2
Mg2
Cl
HCO3
HPO42
SO42
0
136-145
2.1-2.6
0.6-1.0
1.2
24-28
100-110
1.1-1.5
0.3-0.6
3.60.40.07
3.50.180.062.30.02
5.5 – 6.0 g · l-1
1.0 – 1.3 g · l-1
1.7 – 2.1 g · l-1
– 6.1– 1.8– 0.11
– 9.0– 0.54– 0.13– 4.0– 0.06
250 · 109 · l-1
7 · 109 · l-1
3.5-5.0
275Blood
All rights reserved. Usage subject to terms and conditions of license.Koolman, Color Atlas of Biochemistry, 2nd edition © 2005 Thieme

Plasma proteins
Quantitatively, proteins are the most impor-tant part of the soluble components of theblood plasma. With concentrations of be-tween 60 and 80 g L–1, they constitute ap-proximately 4% of the body’s total protein.Their tasks include transport, regulation ofthe water balance, hemostasis, and defenseagainst pathogens.
A. Plasma proteins
Some 100 different proteins occur in humanblood plasma. Based on their behavior duringelectrophoresis (see below), they are broadlydivided into five fractions: albumins and α1–,α2–, β– and γ-globulins. Historically, the dis-tinction between the albumins and globulinswas based on differences in the proteins’solubility –albumins are soluble in purewater, whereas globulins only dissolve inthe presence of salts.
The most frequent protein in the plasma, ataround 45 g L–1, is albumin. Due to its highconcentration, it plays a crucial role in main-taining the blood’s colloid osmotic pressureand represents an important amino acid re-serve for the body. Albumin has binding sitesfor apolar substances and therefore functionsas a transport protein for long-chain fattyacids, bilirubin, drugs, and some steroid hor-mones and vitamins. In addition, serum albu-min binds Ca2+ and Mg2+ ions. It is the onlyimportant plasma protein that is not glycosy-lated.
The albumin fraction also includes trans-thyretin (prealbumin), which together withother proteins transports the hormone thy-roxine and its metabolites.
The table also lists important globulins inblood plasma, with their mass and function.The α- and β-globulins are involved in thetransport of lipids (lipoproteins; see p. 278),hormones, vitamins, and metal ions. In addi-tion, they provide coagulation factors, pro-tease inhibitors, and the proteins of the com-plement system (see p. 298). Soluble antibod-ies (immunoglobulins; see p. 300) make upthe γ-globulin fraction.
Synthesis and degradation. Most plasmaproteins are synthesized by the liver. Excep-tions to this include the immunoglobulins,which are secreted by B lymphocytes known
as plasma cells (see p. 302) and peptide hor-mones, which derive from endocrine glandcells.
With the exception of albumin, almost allplasma proteins are glycoproteins. They carryoligosaccharides in N-and O-glycosidic bonds(see p. 44). N-acetylneuraminic acid (sialicacid; see p. 38) often occurs as a terminalcarbohydrate among sugar residues.Neuraminidases (sialidases) on the surface ofthe vascular endothelia gradually cleave thesialic acid residues and thereby release ga-lactose units on the surfaces of the proteins.These asialoglycoproteins (“asialo-” = withoutsialic acid) are recognized and bound by gal-actose receptors on hepatocytes. In this way,the liver takes up aged plasma proteins byendocytosis and breaks them down. The oli-gosaccharides on the protein surfaces thusdetermine the half-life of plasma proteins,which is a period of days to weeks.
In healthy individuals, the concentration ofplasma proteins is constant. Diseases in or-gans that are involved in protein synthesisand breakdown can shift the protein pattern.For example, via cytokines (see p. 392), se-vere injuries trigger increased synthesis ofacute-phase proteins, which include C-reac-tive protein, haptoglobin, fibrinogen, comple-ment factor C-3, and others. The concentra-tions of individual proteins are altered insome diseases (known as dysproteinemias).
B. Carrier electrophoresis
Proteins and other electrically charged mac-romolecules can be separated using electro-phoresis (see also pp. 78, 262). Among thevarious procedures used, carrier electropho-resis on cellulose acetate foil (CAF) is partic-ularly simple. Using this method, serum pro-teins—which at slightly alkaline pH values allmove towards the anode, due to their excessof negative charges—can be separated intothe five fractions mentioned. After the pro-teins have been stained with dyes, the result-ing bands can be quantitatively assessed us-ing densitometry.
276 Tissues and organs
All rights reserved. Usage subject to terms and conditions of license.Koolman, Color Atlas of Biochemistry, 2nd edition © 2005 Thieme

Densitometry
Ligh
t abs
orpt
ion
Albumins α1- α2- β- γ-Globulins
Electro-phoresis
Staining
Anode Cathode
+ –Serumsample
Cellulose-acetate sheet
Cellulose-acetate sheetsoaked with buffer
Buffer-saturated stripof filter paper
52-58%
2.4-4.4%
6.1-10.1%
10-21%
8.5-14.5%
+ –
Mr in kDa FunctionGroup Protein
IgGIgAIgMIgDIgE
γ-Globulins: 150162900172196
Late antibodiesMucosa-protecting antibodiesEarly antibodiesB-lymphocyte receptorsReagins
Albumins: TransthyretinAlbumin: 45 g · l-1
50-6667
Transport of thyroxin and triiodothyroninMaintenance of osmotic pressure; transport offatty acids, bilirubin, bile acids, steroid hor-mones, pharmaceuticals and inorganic ions.
2
4
6
8
10 m
2.000-4.50080
340
6538
110
β-Globulins: Lipoprotein (LDL)TransferrinFibrinogenSex hormone- binding globulinTranscobalaminC-reactive protein
Transport of lipidsTransport of iron ionsCoagulation factor I
Transport of testosterone and estradiolTransport of vitamin B12Complement activation
Transport of copper ionsInhibition of blood clottingBinding of hemoglobinCleavage of choline estersPrecursor of plasmin (3.4.21.7), breakdownof blood clotsBinding of proteases, transport of zinc ions
Transport of vitamin ATransport of calciols
α2-Globulins: CeruloplasminAntithrombin IIIHaptoglobinCholinesterase (3.1.1.8)Plasminogen
Macroglobulin
Retinol-binding proteinVitamin D-binding protein
13558
100ca. 350
90
725
2152
α1-Globulins: AntitrypsinAntichymotrypsinLipoprotein (HDL)Prothrombin
Transcortin
Acid glycoproteinThyroxin-binding globulin
5158-68
200-40072
51
4454
Inhibition of trypsin and other proteasesInhibition of chymotrypsinTransport of lipidsCoagulation factor II, thrombin precursor (3.4.21.5)Transport of cortisol, corticosterone and progesteroneTransport of progesteroneTransport of iodothyronins
A. Plasma proteins
B. Electrophoresis
277Blood
All rights reserved. Usage subject to terms and conditions of license.Koolman, Color Atlas of Biochemistry, 2nd edition © 2005 Thieme

Lipoproteins
Most lipids are barely soluble in water, andmany have amphipathic properties. In theblood, free triacylglycerols would coalesceinto drops that could cause fat embolisms.By contrast, amphipathic lipids would be de-posited in the blood cells’ membranes andwould dissolve them. Special precautions aretherefore needed for lipid transport in theblood. While long-chain fatty acids are boundto albumin and short-chain ones are dissolvedin the plasma (see p. 276), other lipids aretransported in lipoprotein complexes, ofwhich there several types in the bloodplasma, with different sizes and composition.
A. Composition of lipoprotein complexes
Lipoproteins are spherical or discoid aggre-gates of lipids and apoproteins. They consistof a nucleus of apolar lipids (triacylglycerolsand cholesterol esters) surrounded by a sin-gle-layered shell approximately 2 nm thick ofamphipathic lipids (phospholipids and cho-lesterol; the example shown here is LDL).The shell, in which the apoproteins are alsodeposited, gives the surfaces of the particlespolar properties and thereby prevents themfrom aggregating into large particles. Thelarger the lipid nucleus of a lipoproteinis—i. e., the larger the number of apolar lipidsit contains—the lower its density is.
Lipoproteins are classified into five groups.In order of decreasing size and increasingdensity, these are: chylomicrons, VLDLs(very-low-density lipoproteins), IDLs (inter-mediate-density lipoproteins), LDLs (low-density lipoproteins), and HDLs (high-densitylipoproteins). The proportions of apoproteinsrange from 1% in chylomicrons to over 50% inHDLs. These proteins serve less for solubilitypurposes, but rather function as recognitionmolecules for the membrane receptors andenzymes that are involved in lipid exchange.
B. Transport functions
The classes of lipoproteins differ not only intheir composition, but also in the ways inwhich they originate and function.
The chylomicrons take care of the transportof triacylglycerols from the intestine to thetissues. They are formed in the intestinal mu-
cosa and reach the blood via the lymphaticsystem (see p. 266). In the peripheral vessel-s—particularly in muscle and adipose tis-sue—lipoprotein lipase [1] on the surface ofthe vascular endothelia hydrolyzes most ofthe triacylglycerols. Chylomicron breakdownis activated by the transfer of apoproteins Eand C from HDL. While the fatty acids releasedand the glycerol are taken up by the cells, thechylomicrons gradually become convertedinto chylomicron remnants, which are ulti-mately removed from the blood by the liver.
VLDLs, IDLs, and LDLs are closely related toone another. VLDLs formed in the liver (seep. 312) transport triacylglycerols, cholesterol,and phospholipids to other tissues. Like chy-lomicrons, they are gradually converted intoIDL and LDL under the influence of lipoproteinlipase [1]. This process is also stimulated byHDL. Cells that have a demand for cholesterolbind LDL through an interaction betweentheir LDL receptor and ApoB-100, and thentake up the complete particle through recep-tor-mediated endocytosis. This type of trans-port is mediated by depressions in the mem-brane (“coated pits”), the interior of which islined with the protein clathrin. After LDLbinding, clathrin promotes invagination ofthe pits and pinching off of vesicles (“coatedvesicles”). The clathrin then dissociates off andis reused. After fusion of the vesicle with ly-sosomes, the LDL particles are broken down(see p. 234), and cholesterol and other lipidsare used by the cells.
The HDLs also originate in the liver. Theyreturn the excess cholesterol formed in thetissues to the liver. While it is being trans-ported, cholesterol is acylated by lecithin cho-lesterol acyltransferase (LCAT). The cholesterolesters formed are no longer amphipathic andcan be transported in the core of the lipopro-teins. In addition, HDLs promote chylomicronand VLDL turnover by exchanging lipids andapoproteins with them (see above).
278 Tissues and organs
All rights reserved. Usage subject to terms and conditions of license.Koolman, Color Atlas of Biochemistry, 2nd edition © 2005 Thieme

*
* **
21
1
2
+
+
**
1
Apo-B-100
Lipoproteincoat
Lipoproteincore
Composition
Characteristicapoproteins
Apoprotein
Free cholesterol
Phospholipid
Cholesterol ester
Triacylglycerols
Lipoprotein Density (g · cm-3)ChylomicronsVLDLIDLLDLHDL
0.950 – 1.0061.006 – 1.0191.019 – 1.0631.063 – 1.210
<0.95
Chylom
icron
B. Transport functions
A. Composition of lipoprotein complexes
Dietary lipids Endogenous lipids
Liver
Intestine
Chylomicrons
Chylomicronremnants
Muscle
Adipose tissue
VLDL
IDL
HDL
LDL
Exchangeof lipids andapoproteins
Extrahepatictissues
Receptor-mediatedendocytosis
IDL
Cholesterol
Fats
Cholesterol
Fatty acids
HDL
HDL
Chylomicrons
LDL
HDL
Lecithin-cholesterol acyltransferase(LCAT) 2.3.1.43
Lipoprotein lipase3.1.1.34
Freefattyacids
Freefattyacids
Freefattyacids
Freefattyacids
VLDL
Cholesterolreturn
B-100, C-III, E, C-II
A-I, A-III, C-III
B-100
C-III, B-48, C-II,C-II, E, A-I
10 nm
B-100, E, C-III
279Blood
All rights reserved. Usage subject to terms and conditions of license.Koolman, Color Atlas of Biochemistry, 2nd edition © 2005 Thieme

Hemoglobin
The most important task of the red blood cells(erythrocytes) is to transport molecular oxy-gen (O2) from the lungs into the tissues, andcarbon dioxide (CO2) from the tissues backinto the lungs. To achieve this, the higherorganisms require a special transport system,since O2 is poorly soluble in water. For exam-ple, only around 3.2 mL O2 is soluble in 1 Lblood plasma. By contrast, the protein hemo-globin (Hb), contained in the erythrocytes,can bind a maximum of 220 mL O2 perliter—70 times the physically soluble amount.
The Hb content of blood, at 140–180 g L–1
in men and 120–160 g L–1 in women, istwice as high as that of the plasma proteins(50–80 g L–1). Hb is therefore also responsi-ble for the majority of the blood proteins’ pHbuffer capacity (see p. 288).
A. Hemoglobin: structure
In adults, hemoglobin (HbA; see below) is aheterotetramer consisting of two α-chains andtwo β-chains, each with masses of 16 kDa.The α- and β-chains have different sequences,but are similarly folded. Some 80% of theamino acid residues form -helices, whichare identified using the letters A–H.
Each subunit carries a heme group (for-mula on p. 106), with a central bivalent ironion. When O2 binds to the heme iron(Oxygenation of Hb) and when O2 is released(Deoxygenation), the oxidation stage of theiron does not change. Oxidation of Fe2+ toFe3+ only occurs occasionally. The oxidizedform, methemoglobin, is then no longer ableto bind O2. The proportion of Met-Hb is keptlow by reduction (see p. 284) and usuallyamounts to only 1–2%.
Four of the six coordination sites of the ironin hemoglobin are occupied by the nitrogenatoms of the pyrrol rings, and another is oc-cupied by a histidine residue of the globin(the proximal histidine). The iron’s sixth siteis coordinated with oxygen in oxyhemoglobinand with H2O in deoxyhemoglobin.
B. Hemoglobin: allosteric effects
Like aspartate carbamoyltransferase (seep. 116), Hb can exist in two different states(conformations), known as the T form and
the R form. The T form (for tense; left) andhas a much lower O2 af nity than the R form(for relaxed; right).
Binding of O2 to one of the subunits of the Tform leads to a local conformational changethat weakens the association between thesubunits. Increasing O2 partial pressure thusmeans that more and more molecules convertto the higher–af nity R form. This coopera-tive interaction between the subunits in-creases the O2 af nity of Hb with increasingO2 concentrations—i. e., the O2 saturationcurve is sigmoidal (see p. 282).
Various allosteric effectors influence theequilibrium between the T and R forms andthereby regulate the O2 binding behavior ofhemoglobin (yellow arrows). The most impor-tant effectors are CO2, H+, and 2,3-bisphospho-glycerate (see p. 282).
Further information
As mentioned above, hemoglobin in adultsconsists of two α- and two β-chains. In addi-tion to this main form (HbA1, α2β2), adultblood also contains small amounts of a secondform with a higher O2 af nity in which the β-chains are replaced by δ-chains (HbA2, α2δ2).Two other forms occur during embryonic andfetal development. In the first three months,embryonic hemoglobins are formed, with thestructure ζ2ε2 and α2ε2. Up to the time ofbirth, fetal hemoglobin then predominates(HbF, α2γ2), and it is gradually replaced byHbA during the first few months of life. Em-bryonic and fetal hemoglobins have higher O2
af nities than HbA, as they have to take upoxygen from the maternal circulation.
280 Tissues and organs
All rights reserved. Usage subject to terms and conditions of license.Koolman, Color Atlas of Biochemistry, 2nd edition © 2005 Thieme

α α
β β
α α
β β
O2
T R
β
α
A E F
B G
D C
H
A
E
F
BGDC
H
α
β
A. Hemoglobin: structure
B. Hemoglobin: allosteric effects
OxyhemoglobinR form
O2 affinity 70times higherthan in T formDeoxyhemoglobin
T form
BPGstabilizesT form
O2 bondweakensassociation
Hemoglobin A (α2 β2) M: 65 kDa
Proximalhistidine
Distalhistidine
F helix Heme E helix
NH3
COO
COO
NH3
NH3
O2
[BPG]
pO2
pCO2 , pH
HbT · BPG HbR · (O2)4 H BPG4
[BPG]
pO2
pCO2 , pH
281Blood
All rights reserved. Usage subject to terms and conditions of license.Koolman, Color Atlas of Biochemistry, 2nd edition © 2005 Thieme

Gas transport
Most tissues are constantly dependent on asupply of molecular oxygen (O2) to maintaintheir oxidative metabolism. Due to its poorsolubility, O2 is bound to hemoglobin fortransport in the blood (see p. 280). This notonly increases the oxygen transport capacity,but also allows regulation of O2 uptake in thelungs and O2 release into tissues.
A. Regulation of O2 transport
When an enzyme reacts to effectors (sub-strates, activators, or inhibitors) with confor-mational changes that increase or reduce itsactivity, it is said to show allosteric behavior(see p. 116). Allosteric enzymes are usuallyoligomers with several subunits that mutuallyinfluence each other.
Although hemoglobin is not an enzyme (itreleases the bound oxygen without changingit), it has all the characteristics of an allostericprotein. Its effectors include oxygen, which asa positive homotropic effector promotes itsown binding. The O2 saturation curve of he-moglobin is therefore markedly sigmoidal inshape (2, curve 2). The non-sigmoidal satura-tion curve of the muscular protein myoglobinis shown for comparison (curve 1). The struc-ture of myoglobin (see p. 336) is similar tothat of a subunit of hemoglobin, but as amonomer it does not exhibit any allostericbehavior.
CO2, H+, and a special metabolite of ery-throcytes—2,3-bisphosphoglycerate (BPG)—act as heterotropic effectors of hemoglobin.BPG is synthesized from 1,3–bisphosphogly-cerate, an intermediate of glycolysis (seep. 150), and it can be returned to glycolysisagain by breakdown into 2–phosphoglycerate(1), with loss of an ATP.
BPG binds selectively to deoxy–Hb, therebyincreasing its amount of equilibrium. The re-sult is increased O2 release at constant pΟ2. Inthe diagram, this corresponds to a right shiftof the saturation curve (2, curve 3). CO2 andH+ act in the same direction as BPG. Theirinfluence on the position of the curve haslong been known as the Bohr effect.
The effects of CO2 and BPG are additive. Inthe presence of both effectors, the saturationcurve of isolated Hb is similar to that of wholeblood (curve 4).
B. Hemoglobin and CO2 transport
Hemoglobin is also decisively involved in thetransport of carbon dioxide (CO2) from thetissues to the lungs.
Some 5% of the CO2 arising in the tissues iscovalently bound to the N terminus of hemo-globin and transported as carbaminohemoglo-bin (not shown). About 90% of the CO2 is firstconverted in the periphery into hydrogen car-bonate (HCO3
–), which is more soluble (bot-tom). In the lungs (top), CO2 is regeneratedagain from HCO3
– and can then be exhaled.These two processes are coupled to the
oxygenation and deoxygenation of Hb.Deoxy–Hb is a stronger base than oxy–Hb. Ittherefore binds additional protons (about0.7 H+ per tetramer), which promotes the for-mation of HCO3
– from CO2 in the peripheraltissues. The resulting HCO3
– is released intothe plasma via an antiporter in the erythro-cyte membrane in exchange for Cl–, andpasses from the plasma to the lungs. In thelungs, the reactions described above thenproceed in reverse order: deoxy-Hb is oxy-genated and releases protons. The protonsshift the HCO3/CO2 equilibrium to the leftand thereby promote CO2 release.
O2 binding to Hb is regulated by H+ ions(i. e., by the pH value) via the same mecha-nism. High concentrations of CO2 such asthose in tissues with intensive metabolismlocally increase the H+ concentration andthereby reduce hemoglobin’s O2 af nity(Bohr effect; see above). This leads to in-creased O2 release and thus to an improvedoxygen supply.
The adjustment of the equilibrium be-tween CO2 and HCO3
– is relatively slow inthe uncatalyzed state. It is therefore acceler-ated in the erythrocytes by carbonate dehy-dratase (carbonic anhydrase) [1])—an enzymethat occurs in high concentrations in theerythrocytes.
282 Tissues and organs
All rights reserved. Usage subject to terms and conditions of license.Koolman, Color Atlas of Biochemistry, 2nd edition © 2005 Thieme

CO2
Cl
Cl
CO2
HCO3
Cl
HCO3
CO2
Cl
HCO3 HCO3
CO2
CO2
H2O [H2CO3]
H - Hb Hb -O2
H - Hb Hb - O2
H2O [H2CO3]
+
+ +
+
+
+
1
1
O2
O2
O2
O2
[H2CO3]
[H2CO3]
CO2
1
CO2O2
P
1
2
2
1
0 10 20 30 40 50
1.0
0.8
0.6
0.4
0.2
0.0
pH = 7.40
1 2 3 4ADPATP
C O
H2C
CO O
O
PH
P
A. Regulation of O2 transport
D. Hemoglobin and CO2 transport
pO2100 mmHg
pO230-40 mmHg
Veins Arteries
Lungs
Blood
Lungs
Tissue
Carbonate dehydratase [Zn2 ] 4.2.1.1
Erythrocyte
1. BPG metabolism
O2 partial pressure (mmHg)
1,3-Bisphospho-glycerate
2-Phospho-glycerate
Bisphosphoglyceratemutase 5.4.2.4
Bisphosphoglyceratephosphatase3.1.3.13
2,3-Bisphospho-glycerate (BPG)
Satu
rati
on
MyoglobinHemoglobin (Hb)Hb + BPGHb + CO2 + BPG
1234
2. Saturation curves
3-Phospho-glycerate
Heart
283Blood
All rights reserved. Usage subject to terms and conditions of license.Koolman, Color Atlas of Biochemistry, 2nd edition © 2005 Thieme

Erythrocyte metabolism
Cells living in aerobic conditions are depen-dent on molecular oxygen for energy produc-tion. On the other hand, O2 constantly givesrise to small quantities of toxic substancesknown as reactive oxygen species (ROS).These substances are powerful oxidationagents or extremely reactive free radicals(see p. 32), which damage cellular structuresand functional molecules. Due to their role inO2 transport, the erythrocytes are constantlyexposed to high concentrations of O2 and aretherefore particularly at risk from ROS.
A. Reactive oxygen species
The dioxygen molecule (O2) contains two un-paired electrons—i. e., it is a diradical. Despitethis, O2 is relatively stable due to its specialelectron arrangement. However, if the mole-cule takes up an extra electron (a), the highlyreactive superoxide radical ( O2
–) arises. An-other reduction step (b) leads to the peroxideanion (O2
2–), which easily binds protons andthus becomes hydrogen peroxide (H2O2). In-clusion of a third electron (c) leads to cleavageof the molecule into the ions O2– and O–.While O2– can form water by taking up twoprotons, protonation of O– provides the ex-tremely dangerous hydroxy radical ( OH). Afourth electron transfer and subsequent pro-tonation also convert O– into water.
The synthesis of ROS can be catalyzed byiron ions, for example. Reaction of O2 withFMN or FAD (see p. 32) also constantly pro-duces ROS. By contrast, reduction of O2 bycytochrome c-oxidase (see p. 140) is “clean,”as the enzyme does not release the intermedi-ates. In addition to antioxidants (B), enzymesalso provide protection against ROS: superox-ide dismutase [1] breaks down (“dispropor-tionates”) two superoxide molecules into O2
and the less damaging H2O2. The latter is inturn disproportionated into O2 and H2O byheme-containing catalase [2].
B. Biological antioxidants
To protect them against ROS and other radi-cals, all cells contain antioxidants. These arereducing agents that react easily with oxida-tive substances and thus protect more impor-tant molecules from oxidation. Biological
antioxidants include vitamins C and E (seepp. 364, 368), coenzyme Q (see p. 104), andseveral carotenoids (see pp. 132, 364). Biliru-bin, which is formed during heme degrada-tion (see p. 194), also serves for protectionagainst oxidation.
Glutathione, a tripeptide that occurs inhigh concentrations in almost all cells, is par-ticularly important. Glutathione (sequence:Glu–Cys–Gly) contains an atypical γ-peptidebond between Glu and Cys. The thiol group ofthe cysteine residue is redox-active. Two mol-ecules of the reduced form (GSH, top) arebound to the disulfide (GSSG, bottom) duringoxidation.
C. Erythrocyte metabolism
Erythrocytes also have systems that can in-activate ROS (superoxide dismutase, catalase,GSH). They are also able to repair damagecaused by ROS. This requires products thatare supplied by the erythrocytes’ mainte-nance metabolism, which basically only in-volves anaerobic glycolysis (see p. 150) andthe pentose phosphate pathway (PPP; seep. 152).
The ATP formed during glycolysis servesmainly to supply Na+/K+-ATPase, which main-tains the erythrocytes’ membrane potential.The allosteric effector 2,3-BPG (see p. 282) isalso derived from glycolysis. The PPP suppliesNADPH+H+, which is needed to regenerateglutathione (GSH) from GSSG with the helpof glutathione reductase [3]. GSH, the mostimportant antioxidant in the erythrocytes,serves as a coenzyme for glutathione peroxi-dase [5]. This selenium-containing enzymedetoxifies H2O2 and hydroperoxides, whicharise during the reaction of ROS with unsatu-rated fatty acids in the erythrocyte mem-brane. The reduction of methemoglobin(Hb Fe3+) to Hb (Hb Fe2+, [4]) is carried outby GSH or ascorbate by a non-enzymaticpathway; however, there are also NAD(P)H-dependent Met-Hb reductases.
284 Tissues and organs
All rights reserved. Usage subject to terms and conditions of license.Koolman, Color Atlas of Biochemistry, 2nd edition © 2005 Thieme

N A
P
AP P P
P PA
P
N A
P
Hb
3
4
N A
P
N A
P
3
5
R-O-O-R' R -OHR'-OH
O2BPG
43 5
2+23+2
2 GSH GSSG 2 GSH GSSG
3 Na
2 K
O2
H2O2
O2
e
e
e
e
O22
2H
H2O
2H
H
OOH
21
2
1
O2
a
b
c
d
Glu Cys Gly
H
COOC
NH3
(CH2)2 C N
O
C
H
C
H
CH2
SH
N
O
CH2
H
COO
S
H
COOC
NH3
(CH2)2 C N
O
C
H
C
H
CH2
S
N
O
CH2
H
COO
3 2
H
COOC
NH
(CH2)2 C N
O
C
H
C
H
CH
N
O
CH2
H
COO
A. Reactive oxygen species B. Biological antioxidants
C. Erythrocyte metabolism
Glycolysis
Glucose
2 Lactate2 Lactate
Glucose 6-phosphateGlucose
Na /K -ATPase
Glutathione reductase[FAD] 1.6.4.2
Methemoglobinreductase
Glutathione peroxidase[Se] 1.11.1.9/12
Met-HbPeroxide
Pentose phosphate pathway
Molecularoxygen
Superoxideradical
Dispro-portionation
Hydrogenperoxide
Hydroxyradical
Water
Superoxide dismutase1.15.1.1
Catalase1.11.1.6
Quinolsand enols
α-Tocopherol (vitamin E)Ubiquinol (coenzyme Q)Ascorbic acid (vitamin C)
Carotenoids β-CarotinLycopin
Others GlutathioneBilirubin
1. Examples
2. Glutathione
2 Glutathione2 (GSH)
Glutathionedisulfide (GSSG)
ReductionOxidation
285Blood
All rights reserved. Usage subject to terms and conditions of license.Koolman, Color Atlas of Biochemistry, 2nd edition © 2005 Thieme

Iron metabolism
A. Distribution of iron
Iron (Fe) is quantitatively the most importanttrace element (see p. 362). The human bodycontains4–5g iron, whichis almostexclusivelypresentinprotein-boundform.Approximatelythree-quarters of the total amount is found inheme proteins (see pp. 106, 192), mainly he-moglobin and myoglobin. About 1% of theiron is bound in iron–sulfur clusters (seep. 106), which function as cofactors in therespiratory chain, in photosynthesis, and inother redox chains. The remainder consistsof iron in transport and storage proteins(transferrin, ferritin; see B).
B. Iron metabolism
Iron can only be resorbed by the bowel inbivalent form (i. e., as Fe2+). For this reason,reducing agents in food such as ascorbate(vitamin C; see p. 368) promote iron uptake.Via transporters on the luminal and basal sideof the enterocytes, Fe2+ enters the blood,where it is bound by transferrin. Part of theiron that is taken up is stored in the bowel inthe form of ferritin (see below). Heme groupscan also be resorbed by the small intestine.
Most of the resorbed iron serves for theformation of red blood cells in the bone mar-row (erythropoiesis, top). As discussed onp. 192, it is only in the final step of hem bio-synthesis that Fe2+ is incorporated by ferro-chelatase into the previously prepared tetra-pyrrol framework.
In the blood, 2.5–3.0 g of hemoglobin ironcirculates as a component of the erythrocytes(top right). Over the course of several months,the flexibility of the red blood cells constantlydeclines due to damage to the membrane andcytoskeleton. Old erythrocytes of this type aretaken up by macrophages in the spleen andother organs and broken down. The organicpart of the heme is oxidized into bilirubin (seep. 194), while the iron returns to the plasmapool. The quantity of heme iron recycled perday is much larger than the amount resorbedby the intestines.
Transferrin, a β-globulin with a mass of80 kDa, serves to transport iron in the blood.This monomeric protein consists of two sim-ilar domains, each of which binds an Fe2+ ion
very tightly. Similar iron transport proteinsare found in secretions such as saliva, tears,and milk; these are known as lactoferrins(bottom right). Transferrin and the lactofer-rins maintain the concentration of free iron inbody fluids at values below 10–10 mol L–1.This low level prevents bacteria that requirefree iron as an essential growth factor fromproliferating in the body. Like LDLs (seep. 278), transferrin and the lactoferrins aretaken up into cells by receptor-mediatedendocytosis.
Excess iron is incorporated into ferritin andstored in this form in the liver and otherorgans. The ferritin molecule consists of 24subunits and has the shape of a hollow sphere(bottom left). It takes up Fe2+ ions, which inthe process are oxidized to Fe3+ and thendeposited in the interior of the sphere as fer-rihydrate. Each ferritin molecule is capable ofstoring several thousand iron ions in this way.In addition to ferritin, there is another storageform, hemosiderin, the function of which isnot yet clear.
Further information
Disturbances of the iron metabolism are fre-quent and can lead to severe disease pictures.
Iron deficiency is usually due to blood loss,or more rarely to inadequate iron uptake.During pregnancy, increased demand canalso cause iron deficiency states. In severecases, reduced hemoglobin synthesis canlead to anemia (“iron-deficiency anemia”). Inthese patients, the erythrocytes are smallerand have less hemoglobin. As their membraneis also altered, they are prematurely elimi-nated in the spleen.
Disturbances resulting from raised ironconcentrations are less frequent. Known ashemochromatoses, these conditions canhave genetic causes, or may be due to re-peated administration of blood transfusions.As the body has practically no means of ex-creting iron, more and more stored iron isdeposited in the organs over time in patientswith untreated hemochromatosis, ultimatelyleading to severe disturbances of organ func-tion.
286 Tissues and organs
All rights reserved. Usage subject to terms and conditions of license.Koolman, Color Atlas of Biochemistry, 2nd edition © 2005 Thieme

XH2
Fe3+
Fe2+
Fe2+
Fe2+
Fe2+
X
O2
A. Distribution of ironHeme enzyme (<1%)
Hemo-globin(66%)
Myo-globin(6%)
1. Heme iron
Iron–sulfurclusters
(< 1%)
Transport andstorage forms
(26%)
2. Non-heme iron
Intestine
Erythro-cytes
Trans-ferrin Erythro-
cytedegra-dation
Hemosiderin
Storage tissue(liver, etc.)
Ferritin
Apoferritin (section)
Fe4S4-ClusterOxygenated heme
Erythro-poiesis
Heme
Concentrationof free iron in the blood< 10-10 mol . l -1
Insoluble
Bilirubin
Lactoferrin
Ferritin
B. Iron metabolism
E.g.,ascorbate
Store
Spleen
Bloodserum
Heme
Bonemarrow
Free iron
Transferrin
Ferritin
Hemosiderin30
mg
. d-1
1mg . d -1
5 m
g . d
-1
120 – 150 mg
2500 – 3000 mg
5 m
g . d
-1
30 mg . d -1
1-2 mg . d -1
150 – 200 mg
4 mg
287Blood
All rights reserved. Usage subject to terms and conditions of license.Koolman, Color Atlas of Biochemistry, 2nd edition © 2005 Thieme

Acid–base balance
A. Hydrogen ion concentration in the bloodplasma
The H+ concentration in the blood and ex-tracellular space is approximately 40 nM(4 10–8 mol L–1). This corresponds to a pHof 7.40. The body tries to keep this value con-stant, as large shifts in pH are incompatiblewith life.
The pH value is kept constant by buffersystems that cushion minor disturbances inthe acid–base balance (C). In the longer term,the decisive aspect is maintaining a balancedequilibrium between H+ production and up-take and H+ release. If the blood’s bufferingcapacity is not suf cient, or if the acid–basebalance is not in equilibrium—e. g., in kidneydisease or during hypoventilation or hyper-ventilation—shifts in the plasma pH valuecan occur. A reduction by more than 0.03units is known as acidosis, and an increase iscalled alkalosis.
B. Acid–base balance
Protons are mainly derived from two sour-ces—free acids in the diet and sulfur–contain-ing amino acids. Acids taken up with food—e. g., citric acid, ascorbic acid, and phosphoricacid—already release protons in the alkalinepH of the intestinal tract. More important forproton balance, however, are the amino acidsmethionine and cysteine, which arise fromprotein degradation in the cells. Their S atomsare oxidized in the liver to form sulfuric acid,which supplies protons by dissociation intosulfate.
During anaerobic glycolysis in the musclesand erythrocytes, glucose is converted intolactate, releasing protons in the process (seep. 338). The synthesis of the ketone bodiesacetoacetic acid and 3–hydroxybutyric acidin the liver (see p. 312) also releases protons.Normally, the amounts formed are small andof little influence on the proton balance. Ifacids are formed in large amounts, however(e. g., during starvation or in diabetes mellitus;see p. 160), they strain the buffer systems andcan lead to a reduction in pH (metabolicacidoses; lactacidosis or ketoacidosis).
Only the kidney is capable of excreting pro-tons in exchange for Na+ ions (see p. 326). In
the urine, the H+ ions are buffered by NH3 andphosphate.
C. Buffer systems in the plasma
The buffering capacity of a buffer system de-pends on its concentration and its pKa value.The strongest effect is achieved if the pHvalue corresponds to the buffer system’s pKa
value (see p. 30). For this reason, weak acidswith pKa values of around 7 are best suited forbuffering purposes in the blood.
The most important buffer in the blood isthe CO2/bicarbonate buffer. This consists ofwater, carbon dioxide (CO2, the anhydride ofcarbonic acid H2CO3), and hydrogen carbo-nate (HCO3
–, bicarbonate). The adjustmentof the balance between CO2 and HCO3
– isaccelerated by the zinc-containing enzymecarbonate dehydratase (carbonic anhydrase[1]; see also p. 282). At the pH value of theplasma, HCO3
– and CO2 are present in a ratioof about 20 : 1. However, the CO2 in solutionin the blood is in equilibrium with the gaseousCO2 in the pulmonary alveoli. The CO2/HCO3
–
system is therefore a powerful open buffersystem, despite having a not entirely optimalpKa value of 6.1. Faster or slower respirationincreases or reduces CO2 release in the lungs.This shifts the CO2/HCO3
– ratio and thus theplasma pH value (respiratory acidosis or alka-losis). In this way, respiration can compensateto a certain extent for changes in plasma pHvalues. However, it does not lead to the ex-cretion of protons.
Due to their high concentration, plasmaproteins—and hemoglobin in the erythro-cytes in particular—provide about one-quar-ter of the blood’s buffering capacity. The buf-fering effect of proteins involves contribu-tions from all of the ionizable side chains. Atthe pH value of blood, the acidic amino acids(Asp, Glu) and histidine are particularly effec-tive.
The second dissociation step in phosphate(H2PO4/HPO4
2–) also contributes to the buf-fering capacity of the blood plasma. Althoughthe pKa value of this system is nearly optimal,its contribution remains small due to the lowtotal concentration of phosphate in the blood(around 1 mM).
288 Tissues and organs
All rights reserved. Usage subject to terms and conditions of license.Koolman, Color Atlas of Biochemistry, 2nd edition © 2005 Thieme

75%
24%
HCO3 /CO2 + H2O
1%HPO42 /H
2PO
4
pKa = 6.8H2PO4 + HHPO4
2
pKa = 4 – 12Prot · H Prot + H
CO2 + H2OpKa = 6.1
H2 CO3 H + HCO31
Fatty acids
HCO2 + H2O HCO3 +
pH 7.2 7.4 7.6
60 50 40 30 20nM
[H ]
1
Hyperventilationincreased H excretion
Urine (~60 mmol H /day)
A. Hydrogen ion concentration in the blood plasma
C. Buffer systems in the plasma
B. Acid–base balance
Buffering capacity
Prot/Prot· H
Phosphate buffer1 mM
Protein buffer200 – 240 g Protein · l-1
Carbon dioxide-bicarbonate buffer
1.2 mM 24 mM
Food
Proteins
Acids
+ SO422H+ anionsH + anionsH + lactateH
Glucose
Ketone bodies
Lung influencespH value by CO2excretion
Lung
Thiol groups
H2 SO4
Excr
etio
n
Acidosis Alkalosis
Hypoventilation, increased production,decreased excretion of H
Linear scale
Logarithmic scale
pH value of the plasma
Met
abol
ism
Only overproduction leads to acidosis
Carbonate dehydratase 4.2.1.1
289Blood
All rights reserved. Usage subject to terms and conditions of license.Koolman, Color Atlas of Biochemistry, 2nd edition © 2005 Thieme

Blood clotting
Following injury to blood vessels, hemostasisensures that blood loss is minimized. Initially,thrombocyte activation leads to contractionof the injured vessel and the formation ofa loose clot consisting of thrombocytes(hemostasis). Slightly later, the action of theenzyme thrombin leads to the formation anddeposition in the thrombus of polymeric fi-brin (coagulation, blood clotting). The coagu-lation process is discussed here in detail.
A. Blood clotting
The most important reaction in blood clottingis the conversion, catalyzed by thrombin, ofthe soluble plasma protein fibrinogen (factorI) into polymeric fibrin, which is deposited asa fibrous network in the primary thrombus.Thrombin (factor IIa) is a serine proteinase(see p. 176) that cleaves small peptides fromfibrinogen. This exposes binding sites thatspontaneously allow the fibrin molecules toaggregate into polymers. Subsequent covalentcross-linking of fibrin by a transglutaminase(factor XIII) further stabilizes the thrombus.
Normally, thrombin is present in the bloodas an inactive proenzyme (see p. 270). Pro-thrombin is activated in two different ways,both of which represent cascades of enzy-matic reactions in which inactive proenzymes(zymogens, symbol: circle) are proteolyticallyconverted into active proteinases (symbol:sector of a circle). The proteinases activatethe next proenzyme in turn, and so on. Sev-eral steps in the cascade require additionalprotein factors (factors III, Va and VIIIa) aswell as anionic phospholipids (PL; see below)and Ca2+ ions. Both pathways are activated byinjuries to the vessel wall.
In the extravascular pathway (right), tissuethromboplastin (factor III), a membrane pro-tein in the deeper layers of the vascular wall,activates coagulation factor VII. The activatedform of this (VIIa) autocatalytically promotesits own synthesis and also generates the ac-tive factors IXa and Xa from their precursors.With the aid of factor VIIIa, PL, and Ca2+, factorIXa produces additional Xa, which finally—with the support of Va, PL, and Ca2+—releasesactive thrombin.
The intravascular pathway (left) is prob-ably also triggered by vascular injuries. It
leads in five steps via factors XIIa, XIa, IXa,and Xa to the activation of prothrombin. Thesignificance of this pathway in vivo has beencontroversial since it was found that a geneticdeficiency in factor XII does not lead to coag-ulation disturbances.
Both pathways depend on the presence ofactivated thrombocytes, on the surface ofwhich several reactions take place. For exam-ple, the prothrombinase complex (left) formswhen factors Xa and II, with the help of Va,bind via Ca2+ ions to anionic phospholipids inthe thrombocyte membrane. For this to hap-pen, factors II and X have to contain the non-proteinogenic amino acid -carboxygluta-mate (Gla; see p. 62), which is formed in theliver by post-translational carboxylation ofthe factors. The Gla residues are found ingroups in special domains that create contactsto the Ca2+ ions. Factors VII and IX are alsolinked to membrane phospholipids via Glaresidues.
Substances that bind Ca2+ ions (e. g., citrate)prevent Gla-containing factors from attachingto the membrane and therefore inhibitcoagulation. Antagonists of vitamin K, whichis needed for synthesis of the Gla residues(see p. 364) also have anticoagulatory effects.These include dicumarol, for example.
Active thrombin not only converts fibrino-gen into fibrin, but also indirectly promotesits own synthesis by catalyzing the activationof factors V and VIII. In addition, it catalyzesthe activation of factor XIII and thereby trig-gers the cross-linking of the fibrin.
Regulation of blood clotting (not shown).To prevent the coagulation reaction from be-coming excessive, the blood contains a num-ber of anticoagulant substances, includinghighly effective proteinase inhibitors. Forexample, antithrombin III binds to various ser-ine proteinases in the cascade and therebyinactivates them. Heparin, an anticoagulantglycosaminoglycan (see p. 346), potentiatesthe effect of antithrombin III. Thrombomodu-lin, which is located on the vascular endothe-lia, also inactivates thrombin. A glycoproteinknown as Protein C ensures proteolytic deg-radation of factors V and VIII. As it is activatedby thrombin, coagulation is shut down in thisway.
290 Tissues and organs
All rights reserved. Usage subject to terms and conditions of license.Koolman, Color Atlas of Biochemistry, 2nd edition © 2005 Thieme

XIII XIIIa
IIa
XIIa
XIa
IXa VIIa VII
XII
XI
IX
X Xa
II
~3 min ~10 s
III
Ca2 Ca2 Ca2 Ca2
Va
ThrombinIIaXa
EGF2
EGF1
K2
K1
II
I
V PLCa2Va +
VIII PLCa2VIIIa +
?
Intravascular pathway Extravascular pathway
A. Blood clotting
Fibrinpolymer
Polymericfibrin network
Coagulation factors
Fibrinogen Fibrin
l Fibrinogen lX Christmas factor* 3.4.21.22ll Prothrombin* 3.4.21.5 X Stuart–Prower factor* 3.4.21.6
lll Tissue factor/thromboplastin Xl Plasma thromboplastin antecedent* (PTA) 3.4.21.27
Vl Synonym for VaVll Proconvertin* 3.4.21.21
Vlll Antihemophilic factor A
V Proaccelerin Xlll Fibrin-stabilizing factor* 2.3.2.13lV Ca2 Xll Hageman factor* 3.4.21.38
Thrombin
Thromboplastin
EndotheliumDeeperwalllayers
ProenzymeContains γ-carboxyglutamate
*
Function unclear
Kallikrein
Prothrombinase complex
Gla domain
Thrombocyte membrane
291Blood
All rights reserved. Usage subject to terms and conditions of license.Koolman, Color Atlas of Biochemistry, 2nd edition © 2005 Thieme

Fibrinolysis, blood groups
A. Fibrinolysis
The fibrin thrombus resulting from bloodclotting (see p. 290) is dissolved again byplasmin, a serine proteinase found in theblood plasma. For this purpose, the pre-cursor plasminogen first has to be proteolyti-cally activated by enzymes from various tis-sues. This group includes the plasminogenactivator from the kidney (urokinase) and tis-sue plasminogen activator (t-PA) from vascularendothelia. By contrast, the plasma proteinα2-antiplasmin, which binds to active plasminand thereby inactivates it, inhibits fibrinoly-sis.
Urokinase, t-PA, and streptokinase, a bac-terial proteinase with similar activity, areused clinically to dissolve thrombi followingheart attacks. All of these proteins are ex-pressed recombinantly in bacteria (seep. 262).
B. Blood groups: the ABO system
During blood transfusions, immune reactionscan occur that destroy the erythrocytes trans-fused from the donor. These reactions resultfrom the formation of antibodies (see p. 300)directed to certain surface structures on theerythrocytes. Known as blood group antigens,these are proteins or oligosaccharides that candiffer from individual to individual. More than20 different blood group systems are nowknown. The ABO system and the Rh systemare of particular clinical importance.
In the ABO system, the carbohydrate partsof glycoproteins or glycolipids act as antigens.In this relatively simple system, there are fourblood groups (A, B, AB, and 0). In individualswith blood groups A and B, the antigens con-sist of tetrasaccharides that only differ in theirterminal sugar (galactose or N-acetylgalactos-amine). Carriers of the AB blood group haveboth antigens (A and B). Blood group 0 arisesfrom an oligosaccharide (the H antigen) thatlacks the terminal residue of antigens A and B.The molecular causes for the differences be-tween blood groups are mutations in the gly-cosyl transferases that transfer the terminalsugar to the core oligosaccharide.
Antibodies are only formed against anti-gens that the individual concerned does not
possess. For example, carriers of blood groupA form antibodies against antigen B (“anti-B”),while carriers of group B form antibodiesagainst antigen A (“anti-A”). Individuals withblood group 0 form both types, and thosewith blood group AB do not form any of theseantibodies.
If blood from blood group A is transfusedinto the circulation of an individual withblood group B, for example, then the anti-Apresent there binds to the A antigens. Thedonor erythrocytes marked in this way arerecognized and destroyed by the complementsystem (see p. 298). In the test tube, aggluti-nation of the erythrocytes can be observedwhen donor and recipient blood are incom-patible.
The recipient’s serum should not containany antibodies against the donor erythro-cytes, and the donor serum should not con-tain any antibodies against the recipient’serythrocytes. Donor blood from blood group0 is unproblematic, as its erythrocytes do notpossess any antibodies and therefore do notreact with anti-A or anti-B in the recipient’sblood. Conversely, blood from the AB groupcan only be administered to recipients withthe AB group, as these are the only ones with-out antibodies.
In the Rh system (not shown), proteins onthe surface of the erythrocytes act as antigens.These are known as “rhesus factors,” as thesystem was first discovered in rhesus mon-keys.
The rhesus D antigen occurs in 84% of allwhite individuals, who are therefore “Rh-pos-itive.” If an Rh-positive child is born to an Rh-negative mother, fetal erythrocytes can enterthe mother’s circulation during birth and leadto the formation of antibodies (IgG) againstthe D antigen. This initially has no acute ef-fects on the mother or child. Complicationsonly arise when there is a second pregnancywith an Rh-positive child, as maternal anti-Dantibodies cross the placenta to the fetus evenbefore birth and can trigger destruction of thechild’s Rh-positive erythrocytes (fetal erythro-blastosis).
292 Tissues and organs
All rights reserved. Usage subject to terms and conditions of license.Koolman, Color Atlas of Biochemistry, 2nd edition © 2005 Thieme

1
GDP
GDP
GP GP GP
GP
1
GP
UDP UDP
23
UDP UDP
2
3
40% 16% 4% 40%
H H
HH
HH
H
H H
A A
BB
AAB
B
BB B
B
BB
B
B
A A
AA
AAA
A
Solubleproteins
B. Blood groups: the AB0 system
Erythrocyte
Membraneprotein
Oligosaccharide
B antigen H antigen (blood group 0) A antigen
Glycoprotein with oligosaccharide
N-acetyl-D-glucosamine
D-Galactose
D-Fucose
N-acetyl-D-galactosamine
Fucosyltransferase 2.4.1.69/152
N-acetyl-galactosaminyltransferase 2.4.1.40Galactosyltransferase 2.4.1.37
Glyco-lipid
Plasminogen
Plasminogenactivator3.4.21.73
Plasmin3.4.21.7Fibrin
thrombus
Inactive plasmin α2-antiplasmin
Tissueplasminogenactivator3.4.21.68
A. Fibrinolysis
Blood group
Genotypes
Antigens
A B AB 0
AA and A0 BB and B0 AB 00
Antibodiesin blood
anti-B anti-A anti-Aanti-B
Frequency incentral Europe
293Blood
All rights reserved. Usage subject to terms and conditions of license.Koolman, Color Atlas of Biochemistry, 2nd edition © 2005 Thieme

Immune response
Viruses, bacteria, fungi, and parasites that en-ter the body of vertebrates of are recognizedand attacked by the immune system. Endog-enous cells that have undergone alterations—e. g., tumor cells—are also usually recognizedas foreign and destroyed. The immune systemis supported by physiological changes ininfected tissue, known as inflammation. Thisreaction makes it easier for the immune cellsto reach the site of infection.
Two different systems are involved in theimmune response. The innate immune systemis based on receptors that can distinguishbetween bacterial and viral surface structuresor foreign proteins (known as antigens) andthose that are endogenous. With the help ofthese receptors, phagocytes bind to the patho-gens, absorb them by endocytosis, and breakthem down. The complement system (seep. 298) is also part of the innate system.
The acquired (adaptive) immune system isbased on the ability of the lymphocytes toform highly specific antigen receptors “onsuspicion,” without ever having met the cor-responding antigen. In humans, there are sev-eral billion different lymphocytes, each ofwhich carries a different antigen receptor. Ifthis type of receptor recognizes “its” cognateantigen, the lymphocyte carrying it is acti-vated and then plays its special role in theimmune response.
In addition, a distinction is made betweencellular and humoral immune responses. TheT lymphocytes (T cells) are responsible for cel-lular immunity. They are named after the thy-mus, in which the decisive steps in their dif-ferentiation take place. Depending on theirfunction, another distinction is made be-tween cytotoxic T cells (green) and helper Tcells (blue). Humoral immunity is based onthe activity of the B lymphocytes (B cells, lightbrown), which mature in the bone marrow.After activation by T cells, B cells are able torelease soluble forms of their specific antigenreceptors, known as antibodies (see p. 300),into the blood plasma. The immune system’s“memory” is represented by memory cells.These are particularly long–lived cells thatcan arise from any of the lymphocyte typesdescribed.
A. Simplified diagram of the immuneresponse
Pathogens that have entered the body—e. g.,viruses (top)—are taken up by antigen-pre-senting cells (APCs) and proteolytically de-graded (1). The viral fragments produced inthis way are then presented on the surfaces ofthese cells with the help of special membraneproteins (MHC proteins; see p. 296) (2). TheAPCs include B lymphocytes, macrophages,and dendritic cells such as the skin’s Langer-hans cells.
The complexes of MHC proteins and viralfragments displayed on the APCs are recog-nized by T cells that carry a receptor thatmatches the antigen (“T-cell receptors”; seep. 296) (3). Binding leads to activation of the Tcell concerned and selective replication of it(4, “clonal selection”). The proliferation of im-mune cells is stimulated by interleukins (IL).These are a group of more than 20 signalingsubstances belonging to the cytokine family(see p. 392), with the help of which immunecells communicate with each other. For exam-ple, activated macrophages release IL-1 (5),while T cells stimulate their own replicationand that of other immune cells by releasingIL-2 (6).
Depending on their type, activated T cellshave different functions. Cytotoxic T cells(green) are able to recognize and bind virus-infected body cells or tumor cells (7). Theythen drive the infected cells into apoptosis(see p. 396) or kill them with perforin, a pro-tein that perforates the target cell’s plasmamembrane (8).
B lymphocytes, which as APCs present viralfragments on their surfaces, are recognized byhelper T cells (blue) or their T cell receptors(9). Stimulated by interleukins, selective clo-nal replication then takes place of B cells thatcarry antigen receptors matching those of thepathogen (10). These mature into plasma cells(11) and finally secrete large amounts ofsoluble antibodies (12).
294 Tissues and organs
All rights reserved. Usage subject to terms and conditions of license.Koolman, Color Atlas of Biochemistry, 2nd edition © 2005 Thieme

IL- 2
10
ILIL- 1
IL- 2
1
22
33
44
5
6
6
9
11
12
8 7
IL- 1
Plasmacell
Activatedhelper cells
ActivatedcytotoxicT cells
Memory cells
Virus MHC protein(class I)
MacrophageB lymphocyte
Antibody(IgM)
MHC protein(class II) withvirus fragment
MHC protein(class I) withviral peptide
T lymphocytes
T cell receptorfor MHC-protein(class II)
Restinghelper cells
Activatedhelper cell
RestingcytotoxicT cells
Antibody(IgG)
Any bodycell
MHC protein(class II)
IL = interleukin
Macrophage
A. Simplified scheme of the immune response
Antigen-presenting cells
295Immune response
All rights reserved. Usage subject to terms and conditions of license.Koolman, Color Atlas of Biochemistry, 2nd edition © 2005 Thieme

T-cell activation
For the selectivity of the immune response(see p. 294), the cells involved must be ableto recognize foreign antigens and proteins onother immune cells safely and reliably. To dothis, they have antigen receptors on their cellsurfaces and co-receptors that support recog-nition.
A. Antigen receptors
Many antigen receptors belong to the immu-noglobulin superfamily. The common charac-teristic of these proteins is that they are madeup from “immunoglobulin domains.” Theseare characteristically folded substructuresconsisting of 70–110 amino acids, which arealso found in soluble immunoglobulins (Ig;see p. 300). The illustration shows schemati-cally a few of the important proteins in the Igsuperfamily. They consist of constant regions(brown or green) and variable regions (or-ange). Homologous domains are shown inthe same colors in each case. All of the recep-tors have transmembrane helices at the Cterminus, which anchor them to the mem-branes. Intramolecular and intermolecular di-sulfide bonds are also usually found in pro-teins belonging to the Ig family.
Immunoglobulin M (IgM), a membraneprotein on the surface of B lymphocytes,serves to bind free antigens to the B cells. Bycontrast, T cell receptors only bind antigenswhen they are presented by another cell as acomplex with an MHC protein (see below).Interaction between MHC-bound antigensand T cell receptors is supported by co-recep-tors. This group includes CD8, a membraneprotein that is typical in cytotoxic T cells. Thelper cells use CD4 as a co-receptor instead(not shown). The abbreviation “CD” stands for“cluster of differentiation.” It is the term for alarge group of proteins that are all located onthe cell surface and can therefore be identi-fied by antibodies. In addition to CD4 andCD8, there are many other co-receptors onimmune cells (not shown).
The MHC proteins are named after the“major histocompatibility complex”—the DNAsegment that codes for them. Human MHCproteins are also known as HLA antigens (“hu-man leukocyte-associated” antigens). Theirpolymorphism is so large that it is unlikely
that any two individuals carry the same set ofMHC proteins—except for monozygotic twins.
Class I MHC proteins occur in almost allnucleated cells. They mainly interact with cy-totoxic T cells and are the reason for the re-jection of transplanted organs. Class I MHCproteins are heterodimers (αβ). The β subunitis also known as β2-microglobulin.
Class II MHC proteins also consist of twopeptide chains, which are related to eachother. MHC II molecules are found on all anti-gen-presenting cells in the immune system.They serve for interaction between these cellsand CD4-carrying T helper cells.
B. T-cell activation
The illustration shows an interaction betweena virus-infected body cell (bottom) and a CD8-carrying cytotoxic T lymphocyte (top). Theinfected cell breaks down viral proteins inits cytoplasm (1) and transports the peptidefragments into the endoplasmic reticulumwith the help of a special transporter (TAP)(2). Newly synthesized class I MHC proteinson the endoplasmic reticulum are loadedwith one of the peptides (3) and then trans-ferred to the cell surface by vesicular trans-port (4). The viral peptides are bound on thesurface of the α2 domain of the MHC proteinin a depression formed by an insertion as a“floor” and two helices as “walls” (see smallerillustration).
Supported by CD8 and other co-receptors,a T cell with a matching T cell receptor bindsto the MHC peptide complex (5; cf. p. 224).This binding activates protein kinases in theinterior of the T cell, which trigger a chain ofadditional reactions (signal transduction; seep. 388). Finally, destruction of the virus-in-fected cell by the cytotoxic T lymphocytestakes place.
296 Tissues and organs
All rights reserved. Usage subject to terms and conditions of license.Koolman, Color Atlas of Biochemistry, 2nd edition © 2005 Thieme

Aufsicht
α1α2
• •
••
••
••
••
••
••
••
••
••
••
••
••
• •• •
• •
α3••
••
••
••
••
••
••
••
••
••
•• ••
••••
••••
• •
1
23
4
5
ATP ADP + P
H chainL chain
Cytotoxic T cell
CD8
T cellreceptor
Virus-infected body cell
T cell activity
β2 Micro-globulin12 kDa
MHC protein(class I)
MHC protein(class II)
T cell receptor
α Chain44 kDa
IgM
Characteristicdomain of thesuperfamily
β Chain28 kDa
α Chain33 kDa
C terminus
α Chain44 kDa
β Chain37 kDa
CD8
Ig domain
A. Antigen receptors
B. T cell activationViral peptide
Presentedviral peptide
MHCprotein(class I)
Virus
EndoplasmicreticulumVesicular
transport
TAP Viral peptides
Variable partConstant part
Disulfide bond
Proteo-lysis
297Immune response
All rights reserved. Usage subject to terms and conditions of license.Koolman, Color Atlas of Biochemistry, 2nd edition © 2005 Thieme

Complement system
The complement system is part of the innateimmune system (see p. 294). It supports non-specific defense against microorganisms. Thesystem consists of some 30 different proteins,the “complement factors,” which are found inthe blood and represent about 4% of allplasma proteins there. When inflammatoryreactions occur, the complement factors enterthe infected tissue and take effect there.
The complement system works in threedifferent ways:
Chemotaxis. Various complement factorsattract immune cells that can attack andphagocytose pathogens.
Opsonization. Certain complement factors(“opsonins”) bind to the pathogens andthereby mark them as targets for phagocytos-ing cells (e. g., macrophages).
Membrane attack. Other complement fac-tors are deposited in the bacterial membrane,where they create pores that lyse the patho-gen (see below).
A. Complement activation
The reactions that take place in the comple-ment system can be initiated in several ways.During the early phase of infection, lipopoly-saccharides and other structures on the sur-face of the pathogens trigger the alternativepathway (right). If antibodies against thepathogens become available later, the anti-gen–antibody complexes formed activate theclassic pathway (left). Acute-phase proteins(see p. 276) are also able to start the comple-ment cascade (lectin pathway, not shown).
Factors C1 to C4 (for “complement”) belongto the classic pathway, while factors B and Dform the reactive components of the alterna-tive pathway. Factors C5 to C9 are responsiblefor membrane attack. Other components notshown here regulate the system.
As in blood coagulation (see p. 290), theearly components in the complement systemare serine proteinases, which mutually acti-vate each other through limited proteolysis.They create a self-reinforcing enzyme cas-cade. Factor C3, the products of which areinvolved in several functions, is central tothe complement system.
The classic pathway is triggered by the for-mation of factor C1 at IgG or IgM on the sur-face of microorganisms (left). C1 is an 18-partmolecular complex with three different com-ponents (C1q, C1r, and C1s). C1q is shaped likea bunch of tulips, the “flowers” of which bindto the Fc region of antibodies (left). This acti-vates C1r, a serine proteinase that initiates thecascade of the classic pathway. First, C4 isproteolytically activated into C4b, which inturn cleaves C2 into C2a and C2b. C4B andC2a together form C3 convertase [1], whichfinally catalyzes the cleavage of C3 into C3aand C3b. Small amounts of C3b also arise fromnon-enzymatic hydrolysis of C3.
The alternative pathway starts with thebinding of factors C3b and B to bacterial lipo-polysaccharides (endotoxins). The formationof this complex allows cleavage of B by factorD, giving rise to a second form of C3 conver-tase (C3bBb).
Proteolytic cleavage of factor C3 providestwo components with different effects. Thereaction exposes a highly reactive thioestergroup in C3b, which reacts with hydroxyl oramino groups. This allows C3b to bind cova-lently to molecules on the bacterial surface(opsonization, right). In addition, C3b initiatesa chain of reactions leading to the formationof the membrane attack complex (see below).Together with C4a and C5a (see below), thesmaller product C3a promotes the inflamma-tory reaction and has chemotactic effects.
The “late” factors C5 to C9 are responsiblefor the development of the membrane attackcomplex (bottom). They create an ion-perme-able pore in the bacterial membrane, whichleads to lysis of the pathogen. This reaction istriggered by C5 convertase [2]. Depending onthe type of complement activation, this en-zyme has the structure C4b2a3b or C3bBb3b,and it cleaves C5 into C5a and C5b. The com-plex of C5b and C6 allows deposition of C7 inthe bacterial membrane. C8 and numerous C9molecules—which form the actual pore—thenbind to this core.
298 Tissues and organs
All rights reserved. Usage subject to terms and conditions of license.Koolman, Color Atlas of Biochemistry, 2nd edition © 2005 Thieme

C3
C3a
C3bS C
O
NH
SH CO
S CO
C1
C4 C2
C4b C2a
B
Bb
D
C3b’
1
1
C3a
C3 C3b 1
NH2H2O
C6 C7 C8 C9
C5
C5b
2
C2b
C2aC4b C3bBb
2
A. Complement activation
Membraneattack complex
Collagen-likefilament
Isactivated whenC1q binds to Ab
C1r*andC1s*
C1qAffinityforantibodyFc domain
Bacterium
Bacterial membrane
Structure of the membrane attack complex
Immune complex Pathogen surfaceLipopolysaccharide
Classic pathway Alternative pathwayC3 convertase
MembraneattackC3/C5 convertase
3.4.21.43/47
Chemo-taxis
Opson-ization
C5 convertase 3.4.21.47 C2aC3bC4b or (C3b)2 Bb
299Immune response
All rights reserved. Usage subject to terms and conditions of license.Koolman, Color Atlas of Biochemistry, 2nd edition © 2005 Thieme

Antibodies
Soluble antigen receptors, which are formedby activated B cells (plasma cells; see p. 294)and released into the blood, are known asantibodies. They are also members of the im-munoglobulin family (Ig; see p. 296). Anti-bodies are an important part of the humoralimmune defense system. They have no anti-microbial properties themselves, but supportthe cellular immune system in various ways:
1. They bind to antigens on the surface ofpathogens and thereby prevent them frominteracting with body cells (neutralization;see p. 404, for example).
2. They link single-celled pathogens intoaggregates (immune complexes), which aremore easily taken up by phagocytes (aggluti-nation).
3. They activate the complement system(see p. 298) and thereby promote the innateimmune defense system (opsonization).
In addition, antibodies have become indis-pensable aids in medical and biological diag-nosis (see p. 304).
A. Domain structure of immunoglobulin G
Type G immunoglobulins (IgG) are quantita-tively the most important antibodies in theblood, where they form the fraction of γ-glob-ulins (see p. 276). IgGs (mass 150 kDa) aretetramers with two heavy chains (H chains;red or orange) and two light chains (L chains;yellow). Both H chains are glycosylated (vio-let; see also p. 43).
The proteinase papain cleaves IgG into twoFab fragments and one Fc fragment. The Fab
(“antigen-binding”) fragments, which eachconsist of one L chain and the N-terminalpart of an H chain, are able to bind antigens.The Fc (“crystallizable”) fragment is made upof the C-terminal halves of the two H chains.This segment serves to bind IgG to cell sur-faces, for interaction with the complementsystem and antibody transport.
Immunoglobulins are constructed in amodular fashion from several immunoglobu-lin domains (shown in the diagram on theright in Ω form). The H chains of IgG containfour of these domains (V H, C H1, C H2, andC H3) and the L chains contain two (C L and V L).The letters C and V designate constant orvariable regions.
Disulfide bonds link the two heavy chains toeach other and also link the heavy chains tothe light chains. Inside the domains, there arealso disulfide bonds that stabilize the tertiarystructure. The domains are approximately 110amino acids (AA) long and are homologouswith each other. The antibody structure evi-dently developed as a result of gene duplica-tion. In its central region, known as the“hinge” region, the antibodies are highly mo-bile.
B. Classes of immunoglobulins
Human immunoglobulins are divided intofive classes. IgA (with two subgroups), IgD,IgE, IgG (with four subgroups), and IgM aredefined by their H chains, which are desig-nated by the Greek letters α, δ, ε, γ, and µ. Bycontrast, there are only two types of L chain(κ and λ). IgD and IgE (like IgG) are tetramerswith the structure H2L2. By contrast, solubleIgA and IgM are multimers that are heldtogether by disulfide bonds and additionalJ peptides (joining peptides).
The antibodies have different tasks. IgMsare the first immunoglobulins formed aftercontact with a foreign antigen. Their earlyforms are located on the surface of B cells(see p. 296), while the later forms are se-creted from plasma cells as pentamers. Theiraction targets microorganisms in particular.Quantitatively, IgGs are the most importantimmunoglobulins (see the table showing se-rum concentrations). They occur in the bloodand interstitial fluid. As they can pass theplacenta with the help of receptors, they canbe transferred from mother to fetus. IgAsmainly occur in the intestinal tract and inbody secretions. IgEs are found in low con-centrations in the blood. As they can triggerdegranulation of mast cells (see p. 380), theyplay an important role in allergic reactions.The function of IgDs is still unexplained. Theirplasma concentration is also very low.
300 Tissues and organs
All rights reserved. Usage subject to terms and conditions of license.Koolman, Color Atlas of Biochemistry, 2nd edition © 2005 Thieme

VH
VL
CH1
CL
CH2
CH3
Fc
S
SS
S
S
SS
S
SS S
S
S
S
S
S
S
S
S
S
S
S S
S
S S
S S
SS S
S
Fab
SS
S S
JSS
S S SS
α δ ε γ µ
S SSS
S SJ
H
L
S S S S
(α2 κ2)nJ δ2 κ2
(α2 λ2)nJ δ2 λ2
ε2 κ2
ε2 λ2
γ2 κ2
γ2 λ2
(µ2 κ2)5 J
(µ2 λ2)5 J
Heavychain(450 AA)
Antigen-bindingsite
C-terminal end
Lightchain(212 AA)
Variabledomain
Disulfidebond
“Hinge” region
Cleavage sitefor papain3.4.22.2
Fab fragment
F c fr
agm
ent
Light chain
Heavy chain
Oligo-saccharide
A. Domain structure of immunoglobulin G
IgA360-720 kDa
IgD172 kDa
IgE196 kDa
IgG150 kDa
IgM935 kDa
κ or λ κ or λ κ or λ κ or λ κ or λ
Chain:
Serum concentration (g · l-1)
IgA3.5 IgD
0.03IgE
0.00005
IgG13.5 IgM
1.5
Structure:
n =1, 2 or 3
B. Classes of immunoglobulins
Oligo-saccharide
301Immune response
All rights reserved. Usage subject to terms and conditions of license.Koolman, Color Atlas of Biochemistry, 2nd edition © 2005 Thieme

Antibody biosynthesis
The acquired (adaptive) immune system (seep. 294) is based on the ability of the lympho-cytes to keep an extremely large repertoire ofantigen receptors and soluble antibodiesready for use, so that even infections involv-ing new types of pathogen can be combated.The wide range of immunoglobulins (Ig) areproduced by genetic recombination and addi-tional mutations during the development andmaturation of the individual lymphocytes.
A. Variability of immunoglobulins
It is estimated that more than 108 differentantibody variants occur in every humanbeing. This variability affects both the heavyand the light chains of immunoglobulins.
There are five different types of heavy (H)chain, according to which the antibody classesare defined (α, δ, ε, γ, µ), and two types of light(L) chain (κ and λ; see p. 300). The various Igtypes that arise from combinations of thesechains are known as isotypes. During immu-noglobulin biosynthesis, plasma cells canswitch from one isotype to another (“geneswitch”). Allotypic variation is based on theexistence of various alleles of the samegene—i. e., genetic differences between indi-viduals. The term idiotypic variation refers tothe fact that the antigen binding sites in theFab fragments can be highly variable. Idiotypicvariation affects the variable domains (shownhere in pink) of the light and heavy chains. Atcertain sites—known as the hypervariable re-gions (shown here in red)—variation is partic-ularly wide; these sequences are directly in-volved in the binding of the antigen.
B. Causes of antibody variety
There are three reasons for the extremelywide variability of antibodies:
1. Multiple genes. Various genes are avail-able to code for the variable protein domains.Only one gene from among these is selectedand expressed.
2. Somatic recombination. The genes aredivided into several segments, of which thereare various versions. Various (“untidy”) com-binations of the segments during lymphocyte
maturation give rise to randomly combinednew genes (“mosaic genes”).
3. Somatic mutation. During differentiationof B cells into plasma cells, the coding genesmutate. In this way, the “primordial” germ-line genes can become different somatic genesin the individual B cell clones.
C. Biosynthesis of a light chain
We can look at the basic features of the ge-netic organization and synthesis of immuno-globulins using the biosynthesis of a mouse κchain as an example. The gene segments forthis light chain are designated L, V, J, and C.They are located on chromosome 6 in thegerm-line DNA (on chromosome 2 in humans)and are separated from one another by in-trons (see p. 242) of different lengths.
Some 150 identical L segments code for thesignal peptide (“leader sequence,” 17–20amino acids) for secretion of the product(see p. 230). The V segments, of which thereare 150 different variants, code for most of thevariable domains (95 of the 108 amino acids).L and V segments always occur in pairs—intandem, so to speak. By contrast, there areonly five variants of the J segments (joiningsegments) at most. These code for a peptidewith 13 amino acids that links the variablepart of the κ chains to the constant part. Asingle C segment codes for the constant partof the light chain (84 amino acids).
During the differentiation of B lympho-cytes, individual V/J combinations arise ineach B cell. One of the 150 L/V tandem seg-ments is selected and linked to one of the fiveJ segments. This gives rise to a somatic genethat is much smaller than the germline gene.Transcription of this gene leads to the forma-tion of the hnRNA for the κ chain, from whichintrons and surplus J segments are removedby splicing (see p. 246). Finally, the completedmRNA still contains one each of the L–V–J–Csegments and after being transported into thecytoplasm is available for translation. Thesubsequent steps in Ig biosynthesis followthe rules for the synthesis of membrane-bound or secretory proteins (see p. 230).
302 Tissues and organs
All rights reserved. Usage subject to terms and conditions of license.Koolman, Color Atlas of Biochemistry, 2nd edition © 2005 Thieme

V1 V2 V3 Vn J1 J2 J3 J4L L L L CV1 V2 V3 V4 V5 V6 V....
J1 J2 J3 J4V V1 V2 V3 J2 J3L L L C
V3 J2 J3L C
V3 J2L C
V3J2
C
COO
H3N
AAA....
AAA....
A. Variability of immunoglobulins
C. Biosynthesis of a light chainB. Origins of antibody variety
1. Multiple genes
3. Somatic mutation
DNA
Protein
Germ lineDNA
SomaticDNA
Protein
Selection andlinkage ofgene segments
GermlineDNA
Protein
V/J Recombination
Transcription
Splicing
Translation
B cellDNA
hnRNA
mRNA
Is removedIntro
Allotypic Idiotypic
κ or λ
α,δ,ε,γor µ
Variabledomain
Hyper-variableregions
Isotypic
Constantdomain
2. Somatic recombination
Protein
Germ lineDNA
SomaticDNAin B cell
Point mutationsduring B cellmaturation
Constantdomain
303Immune response
All rights reserved. Usage subject to terms and conditions of license.Koolman, Color Atlas of Biochemistry, 2nd edition © 2005 Thieme

Monoclonal antibodies,immunoassay
A. Monoclonal antibodies
Monoclonal antibodies (MABs) are secretedby immune cells that derive from a singleantibody-forming cell (from a single cellclone). This is why each MAB is directedagainst only one specific epitope of an immu-nogenic substance, known as an “antigenicdeterminant.” Large molecules contain severalepitopes, against which various antibodies areformed by various B cells. An antiserum con-taining a mixture of all of these antibodies isdescribed as being polyclonal.
To obtain MABs, lymphocytes isolated fromthe spleen of immunized mice (1) are fusedwith mouse tumor cells (myeloma cells, 2).This is necessary because antibody-secretinglymphocytes in culture have a lifespan of onlya few weeks. Fusion of lymphocytes with tu-mor cells gives rise to cell hybrids, known ashybridomas, which are potentially immortal.
Successful fusion (2) is a rare event, but thefrequency can be improved by adding poly-ethylene glycol (PEG). To obtain only success-fully fused cells, incubation is required for anextended period in a primary culture withHAT medium (3), which contains hypoxan-thine, aminopterin, and thymidine. Amino-pterin, an analogue of dihydrofolic acid, com-petitively inhibits dihydrofolate reductase andthus inhibits the synthesis of dTMP (seep. 402). As dTMP is essential for DNA synthe-sis, myeloma cells cannot survive in the pres-ence of aminopterin. Although spleen cellsare able to circumvent the inhibitory effectof aminopterin by using hypoxanthine andthymidine, they have a limited lifespan anddie. Only hybridomas survive culture in HATmedium, because they possess both the im-mortality of the myeloma cells and the spleencells’ metabolic side pathway.
Only a few fused cells actually produceantibodies. To identify these cells, the hybrid-omas have to be isolated and replicated bycloning (4). After the clones have been testedfor antibody formation, positive cultures arepicked out and selected by further cloning (5).This results in hybridomas that synthesizemonoclonal antibodies. Finally, MAB produc-tion is carried out in vitro using a bioreactor,
or in vivo by producing ascites fluid in mice(6).
B. Immunoassay
Immunoassays are semiquantitative proce-dures for assessing substances with low con-centrations. In principle, immunoassays canbe used to assess any compound againstwhich antibodies are formed.
The basis for this procedure is the anti-gen–antibody “reaction”—i. e., specific bindingof an antibody to the molecule being assayed.Among the many different immunoassaytechniques that have been developed—e. g.,radioimmunoassay (RIA), and chemolumines-cence immunoassay (CIA)—a version of theenzyme-linked immunoassay (EIA) is shownhere.
The substance to be assayed—e. g., the hor-mone thyroxine in a serum sample—is pipet-ted into a microtiter plate (1), the walls ofwhich are coated with antibodies that specif-ically bind the hormone. At the same time, asmall amount of thyroxine is added to theincubation to which an enzyme known asthe “tracer” (1) has been chemically coupled.The tracer and the hormone being assayedcompete for the small number of antibodybinding sites available. After binding hastaken place (2), all of the unbound moleculesare rinsed out. The addition of a substratesolution for the enzyme (a chromogenic solu-tion) then triggers an indicator reaction (3),the products of which can be assessed usingphotometry (4).
The larger the amount of enzyme that canbind to the antibodies on the container’swalls, the larger the amount of dye that isproduced. Conversely, the larger the amountof the substance being assayed that is presentin the sample, the smaller the amount oftracer that can be bound by the antibodies.Quantitative analysis can be carried outthrough parallel measurement using stan-dards with a known concentration.
304 Tissues and organs
All rights reserved. Usage subject to terms and conditions of license.Koolman, Color Atlas of Biochemistry, 2nd edition © 2005 Thieme

CC
C B
A B C
B
A BC
B
C
C
C CC
C C
AAA
E
C
F
C
F
Antikörper
E
E
E
CC C
C
CC F F
F
E
EE
A. Monoclonal antibodies
B. Immunoassay
Selectionof positiveclones
Immunizedmouse
Antigen
Immunization Spleen cells
Myeloma cells
Hybridoma cells Antibody test:
Positivecultures
Clone
Mouse withascites
Culture ofa selectedclone
Production ofmonoclonalantibodies
Cell culture
Cloning
Primary cultureFusion
Subcloning
WithPEG
HATmedium
Readabsorption
CChromogen + H2O2
Enzyme:peroxidase
TracerSample
Incubate
Wash
Substrate: H2O2Chromogen: C
Incubate
Microtiter plate
Peroxidase1.11.1.7
FDye + H2O
AbsorptionWorking range10-6-10-12 M
Concentration
Cell culture
Antibodies
1.
2. 3.
4.
5.
6.
1. 2.
3.4.
305Immune response
All rights reserved. Usage subject to terms and conditions of license.Koolman, Color Atlas of Biochemistry, 2nd edition © 2005 Thieme

Liver: functions
Weighing 1.5 kg, the liver is one of the largestorgans in the human body. Although it onlyrepresents 2–3% of the body’s mass, it ac-counts for 25–30% of oxygen consumption.
A. Diagram of a hepatocyte
The 3 1011 cells in the liver—particularly thehepatocytes, which make up 90% of the cellmass—are the central location for the body’sintermediary metabolism. They are in closecontact with the blood, which enters the liverfrom the portal vein and the hepatic arteries,flows through capillary vessels known as si-nusoids, and is collected again in the centralveins of the hepatic lobes. Hepatocytes areparticularly rich in endoplasmic reticulum,as they carry out intensive protein and lipidsynthesis. The cytoplasm contains granules ofinsoluble glycogen. Between the hepatocytes,there are bile capillaries through which bilecomponents are excreted.
B. Functions of the liver
The most important functions of the liver are:1. Uptake of nutrients supplied by the in-
testines via the portal vein.2. Biosynthesis of endogenous compounds
and storage, conversion, and degradation ofthem into excretable molecules (metabolism).In particular, the liver is responsible for thebiosynthesis and degradation of almost allplasma proteins.
3. Supply of the body with metabolites andnutrients.
4. Detoxification of toxic compounds bybiotransformation.
5. Excretion of substances with the bile.
C. Hepatic metabolism
The liver is involved in the metabolism ofpractically all groups of metabolites. Its func-tions primarily serve to cushion fluctuationsin the concentration of these substances inthe blood, in order to ensure a constant sup-ply to the peripheral tissues (homeostasis).
Carbohydrate metabolism. The liver takesup glucose and other monosaccharides fromthe plasma. Glucose is then either stored in
the form of the polysaccharide glycogen orconverted into fatty acids. When there is adrop in the blood glucose level, the liver re-leases glucose again by breaking down glyco-gen. If the glycogen store is exhausted, glu-cose can also be synthesized by gluconeogen-esis from lactate, glycerol, or the carbon skel-eton of amino acids (see p. 310).
Lipid metabolism. The liver synthesizesfatty acids from acetate units. The fatty acidsformed are then used to synthesize fats andphospholipids, which are released into theblood in the form of lipoproteins. The liver’sspecial ability to convert fatty acids into ke-tone bodies and to release these again is alsoimportant (see p. 312).
Like other organs, the liver also synthesizescholesterol, which is transported to other tis-sues as a component of lipoproteins. Excesscholesterol is converted into bile acids in theliver or directly excreted with the bile (seep. 314).
Amino acid and protein metabolism. Theliver controls the plasma levels of the aminoacids. Excess amino acids are broken down.With the help of the urea cycle (see p. 182),the nitrogen from the amino acids is con-verted into urea and excreted via the kidneys.The carbon skeleton of the amino acids entersthe intermediary metabolism and serves forglucose synthesis or energy production. Inaddition, most of the plasma proteins are syn-thesized or broken down in the liver (seep. 276).
Biotransformation. Steroid hormones andbilirubin, as well as drugs, ethanol, and otherxenobiotics are taken up by the liver and in-activated and converted into highly polar me-tabolites by conversion reactions (see p. 316).
Storage. The liver not only stores energyreserves and nutrients for the body, but alsocertain mineral substances, trace elements,and vitamins, including iron, retinol, and vi-tamins A, D, K, folic acid, and B12.
306 Tissues and organs
All rights reserved. Usage subject to terms and conditions of license.Koolman, Color Atlas of Biochemistry, 2nd edition © 2005 Thieme

2
3
1 5
4
* *
*
***
**
**
A. Diagram of a hepatocyte
B. Functions of the liver
C. Liver metabolism
Amino acidsUrea
CB
Amino acidmetabolism
Lipidmetabolism
Fatty acidsFatsKetone bodiesCholesterolBile acidsVitamins
BCBCBBECBESC
BSCCCCBCCBCBSC
Carbohydratemetabolism
GlucoseGalactoseFructoseMannosePentosesLactateGlycerolGlycogen
BC
ES
BiosynthesisConversion anddegradationExcretionStorage
ECECCEC
Biotrans-formation
Steroid hormonesBile pigmentsEthanolDrugs
LipoproteinsAlbuminCoagulationfactorsHormonesEnzymes
Plasmaproteins
BCBC
BC CBC
Vena cava
GallbladderFrom the gastrointestinaltract, pancreas, spleen
Intestine
Portal vein
Bile duct
ExcretionUptake
Metabolism
BiosynthesisStorageConversionandDegradation
Detoxifica-tionBiotrans-formation
Supply
BSC
Sinusoid
Erythrocyte
Lysosome
NucleusRough ER
Microbody
Mitochondrion
Desmosome
Lipoproteins
Smooth ER
Dissespace
Golgicomplex
Biliary capillary
Glycogen
307Liver
All rights reserved. Usage subject to terms and conditions of license.Koolman, Color Atlas of Biochemistry, 2nd edition © 2005 Thieme

Buffer function in organ meta-bolism
All of the body’s tissues have a constant re-quirement for energy substrates and nu-trients. The body receives these metaboliteswith food, but the supply is irregular and invarying amounts. The liver acts here alongwith other organs, particularly adipose tissue,as a balancing buffer and storage organ.
In the metabolism, a distinction is madebetween the absorptive state (well-fed state)immediately after a meal and the postabsorb-tive state (state of starvation), which startslater and can merge into hunger. The switch-ing of the organ metabolism between the twophases depends on the concentration of en-ergy-bearing metabolites in the blood (plas-ma level). This is regulated jointly by hor-mones and by the autonomic nervous system.
A. Absorptive state
The absorptive state continues for 2–4 hoursafter food intake. As a result of food digestion,the plasma levels of glucose, amino acids, andfats (triacylglycerols) temporarily increase.
The endocrine pancreas responds to this byaltering its hormone release—there is an in-crease in insulin secretion and a reduction inglucagon secretion. The increase in the insu-lin/glucagon quotient and the availability ofsubstrates trigger an anabolic phase in thetissues—particularly liver, muscle, and adi-pose tissues.
The liver forms increased amounts of gly-cogen and fats from the substrates supplied.Glycogen is stored, and the fat is released intothe blood in very low density lipoproteins(VLDLs).
Muscle also refills its glycogen store andsynthesizes proteins from the amino acidssupplied.
Adipose tissue removes free fatty acidsfrom the lipoproteins, synthesizes triacylgly-cerols from them again, and stores these inthe form of insoluble droplets.
During the absorptive state, the heart andneural tissue mainly use glucose as an energysource, but they are unable to establish anysubstantial energy stores. Heart muscle cellsare in a sense “omnivorous,” as they can alsouse other substances to produce energy (fatty
acids, ketone bodies). By contrast, the centralnervous system (CNS) is dependent on glu-cose. It is only able to utilize ketone bodiesafter a prolonged phase of hunger (B).
B. Postabsorptive state
When the food supply is interrupted, thepostabsorbtive state quickly sets in. The pan-creatic A cells now release increased amountsof glucagon, while the B cells reduce theamount of insulin they secrete. The reducedinsulin/glucagon quotient leads to switchingof the intermediary metabolism. The bodynow falls back on its energy reserves. To dothis, it breaks down storage substances (gly-cogen, fats, and proteins) and shifts energy-supplying metabolites between the organs.
The liver first empties its glycogen store(glycogenolysis; see p.156). It does not usethe released glucose itself, however, but sup-plies the other tissues with it. In particular,the brain, adrenal gland medulla, and eryth-rocytes depend on a constant supply of glu-cose, as they have no substantial glucose re-serves themselves. When the liver’s glycogenreserves are exhausted after 12–24 hours,gluconeogenesis begins (see p. 154). The pre-cursors for this are derived from the muscu-lature (amino acids) and adipose tissue (glyc-erol from fat degradation). From the fattyacids that are released (see below), the liverstarts to form ketone bodies (ketogenesis; seep. 312). These are released into the blood andserve as important energy suppliers duringthe hunger phase. After 1–2 weeks, the CNSalso starts to use ketone bodies to supply partof its energy requirements, in order to saveglucose.
In muscle, the extensive glycogen reservesare exclusively used for the muscles’ ownrequirements (see p. 320). The slowly initi-ated protein breakdown in muscle suppliesamino acids for gluconeogenesis in the liver.
In adipose tissue, glucagon triggers lipoly-sis, releasing fatty acids and glycerol. The fattyacids are used as energy suppliers by manytypes of tissue (with the exception of brainand erythrocytes). An important recipient ofthe fatty acids is the liver, which uses them forketogenesis.
308 Tissues and organs
All rights reserved. Usage subject to terms and conditions of license.Koolman, Color Atlas of Biochemistry, 2nd edition © 2005 Thieme

Liver
Intestine
MuscleNervoustissue
Heart
Do not haveenergyreserves
Ketone bodies
Glucose
Gluconeogenesis
ProteinsAmino acids
Glycogen
Fatty acids
Adipose tissue
Pancreas
InsulinGlucagon
Triacylglycerols
Glucoseaminoacids
GlycogenErythrocytes
Liver
Intestine
Heart
Nervoustissue Muscle
Adipose tissue
Triacylglycerols
Glucose Fat
Glycogen
Amino acids
Proteins
Glycogen
High bloodglucose level
Storage compound
InsulinGlucagon
GlucoseAminoacids Pancreas
A. Absorptive state
B. Postabsorptive state
Fat
309Liver
All rights reserved. Usage subject to terms and conditions of license.Koolman, Color Atlas of Biochemistry, 2nd edition © 2005 Thieme

Carbohydrate metabolism
Besides fatty acids and ketone bodies, glucoseis the body’s most important energy supplier.The concentration of glucose in the blood (the“blood glucose level”) is maintained at4–6 mM (0.8–1.0 g L–1) by precise regula-tion of glucosesupplying and glucose-utilizingprocesses. Glucose suppliers include the in-testines (glucose from food), liver, and kid-neys. The liver plays the role of a “glucostat”(see p. 308).
The liver is also capable of forming glucoseby converting other sugars—e. g., fructose andgalactose—or by synthesizing from other me-tabolites. The conversion of lactate to glucosein the Cori cycle (see p. 338) and the conver-sion of alanine to glucose with the help of thealanine cycle (see p. 338) are particularly im-portant for the supply of erythrocytes andmuscle cells.
Transporters in the plasma membrane ofhepatocytes allow insulin-independent trans-port of glucose and other sugars in both di-rections. In contrast to muscle, the liver pos-sesses the enzyme glucose-6-phosphatase,which can release glucose from glucose-6-phosphate.
A. Gluconeogenesis: overview
Regeneration of glucose (up to 250 g per day)mainly takes place in the liver. The tubulecells of the kidney are also capable of carryingout gluconeogenesis, but due to their muchsmaller mass, their contribution only repre-sents around 10% of total glucose formation.Gluconeogenesis is regulated by hormones.Cortisol, glucagon, and epinephrine promotegluconeogenesis, while insulin inhibits it(see pp. 158, 244).
The main precursors of gluconeogenesis inthe liver are lactate from anaerobically work-ing muscle cells and from erythrocytes,glucogenic amino acids from the digestivetract and muscles (mainly alanine), andglycerol from adipose tissue. The kidneymainly uses amino acids for gluconeogenesis(Glu, Gln; see p. 328).
In mammals, fatty acids and other suppli-ers of acetyl CoA are not capable of being usedfor gluconeogenesis, as the acetyl residuesformed during β-oxidation in the tricarbox-ylic acid cycle (see p. 132) are oxidized to CO2
and therefore cannot be converted into oxalo-acetic acid, the precursor for gluconeogenesis.
B. Fructose and galactose metabolism
Fructose is mainly metabolized by the liver,which channels it into glycolysis (left half ofthe illustration).
A special ketohexokinase [1] initially phos-phorylates fructose into fructose 1-phos-phate. This is then cleaved by an aldolase[2], which is also fructose-specific, to yieldglycerone 3-phosphate (dihydroxyacetonephosphate) and glyceraldehyde. Glycerone3-phosphate is already an intermediate ofglycolysis (center), while glyceraldehydecan be phosphorylated into glyceraldehyde3-phosphate by triokinase [3].
To a smaller extent, glyceraldehyde is alsoreduced to glycerol [4] or oxidized to glycer-ate, which can be channeled into glycolysisfollowing phosphorylation (not shown). Thereduction of glyceraldehyde [4] uses upNADH. As the rate of degradation of alcoholin the hepatocytes is limited by the supply ofNAD+, fructose degradation accelerates alco-hol degradation (see p. 320).
Outside of the liver, fructose is channeledinto the sugar metabolism by reduction at C-2to yield sorbitol and subsequent dehydrationat C-1 to yield glucose (the polyol pathway;not shown).
Galactose is also broken down in the liver(right side of the illustration). As is usual withsugars, the metabolism of galactose startswith a phosphorylation to yield galactose1-phosphate [5]. The connection to the glu-cose metabolism is established by C-4 epime-rization to form glucose 1-phosphate. How-ever, this does not take place directly. Instead,a transferase [6] transfers a uridine 5-mono-phosphate (UMP) residue from uridine di-phosphoglucose (UDPglucose) to galactose1-phosphate. This releases glucose 1-phos-phate, while galactose 1-phosphate is con-verted into uridine diphosphogalactose (UDP-galactose). This then is isomerized into UDP-glucose. The biosynthesis of galactose also fol-lows this reaction pathway, which is freelyreversible up to reaction [5]. Genetic defectsof enzymes [5] or [6] can lead to the clinicalpicture of galactosemia.
310 Tissues and organs
All rights reserved. Usage subject to terms and conditions of license.Koolman, Color Atlas of Biochemistry, 2nd edition © 2005 Thieme

ATP
ATP ADPNAD +
NADH+H +
ADP
ATP
ADP
2
3
4
5
6
71
2
4
51
6
7
10%
90%
O
H
OH
OH
H
H
HOH
OH
HOCH2
3
P P
A. Gluconeogenesis: overview
B. Fructose and galactose metabolism
Glucose
Glycer-aldehyde
Fructose Galactose
Pyruvate
UDP-Glucose
Galactokinase2.7.1.6
Fructose-bisphosphatealdolase 4.1.2.13
Ketohexokinase2.7.1.3
Triokinase2.7.1.28
Aldehyde reductase1.1.1.21
Hexose-1-phosphateuridyltransferase2.7.7.12
UDPglucose4-epimerase5.1.3.2
Fructose 1-
Glycerone 3- Glycer-aldehyde 3-
Fructose 1,6-bis-
Fructose 6-
Glucose 6- Glucose 1- Galactose 1-
UDP-Galactose
Glycerol
Glycolysis
Muscle
Adipose tissue
KidneyLiver
Glycerol
Lactate
Amino acids Gluco-neogenesis
Glucose
CortisolGlucagonEpinephrine
Gluco-neogenesis
Not possiblein mammals
Plasmaconcentration4 – 6 mM
Glycogen
Fatty acids
Conversion
PP
P
P
PP
Amino acids
Galactose
Fructose
Insulin
311Liver
All rights reserved. Usage subject to terms and conditions of license.Koolman, Color Atlas of Biochemistry, 2nd edition © 2005 Thieme

Lipid metabolism
The liver is the most important site for theformation of fatty acids, fats (triacylglycerols),ketone bodies, and cholesterol. Most of theseproducts are released into the blood. In con-trast, the triacylglycerols synthesized in adi-pose tissue are also stored there.
A. Lipid metabolism
Lipid metabolism in the liver is closely linkedto the carbohydrate and amino acid metabo-lism. When there is a good supply of nutrientsin the resorptive (wellfed) state (see p. 308),the liver converts glucose via acetyl CoA intofatty acids. The liver can also take up fattyacids from chylomicrons, which are suppliedby the intestine, or from fatty acid–albumincomplexes (see p. 162). Fatty acids from bothsources are converted into fats and phospho-lipids. Together with apoproteins, they arepacked into very-low-density lipoproteins(VLDLs; see p. 278) and then released intothe blood by exocytosis. The VLDLs supplyextrahepatic tissue, particularly adipose tis-sue and muscle.
In the postresorptive state (see p. 292)—particularly during fasting and starva-tion—the lipid metabolism is readjusted andthe organism falls back on its own reserves. Inthese conditions, adipose tissue releases fattyacids. They are taken up by the liver and aremainly converted into ketone bodies (B).
Cholesterol can be derived from two sour-ces—food or endogenous synthesis from ace-tyl-CoA. A substantial percentage of endo-genous cholesterol synthesis takes place inthe liver. Some cholesterol is required forthe synthesis of bile acids (see p. 314). In ad-dition, it serves as a building block for cellmembranes (see p. 216), or can be esterifiedwith fatty acids and stored in lipid droplets.The rest is released together into the blood inthe form of lipoprotein complexes (VLDLs)and supplies other tissues. The liver also con-tributes to the cholesterol metabolism by tak-ing up from the blood and breaking downlipoproteins that contain cholesterol and cho-lesterol esters (HDLs, IDLs, LDLs; see p. 278).
B. Biosynthesis of ketone bodies
At high concentrations of acetyl-CoA in theliver mitochondria, two molecules condenseto form acetoacetyl CoA [1]. The transfer ofanother acetyl group [2] gives rise to3-hydroxy-3-methylglutaryl-CoA (HMG CoA),which after release of acetyl CoA [3] yieldsfree acetoacetate (Lynen cycle). Acetoacetatecan be converted to 3-hydroxybutyrate byreduction [4], or can pass into acetone bynonenzymatic decarboxylation [5]. Thesethree compounds are together referred to as“ketone bodies,” although in fact 3-hydroxy-butyrate is not actually a ketone. As reaction[3] releases an H+ ion, metabolic acidosis canoccur as a result of increased ketone bodysynthesis (see p. 288).
The ketone bodies are released by the liverinto the blood, in which they are easily solu-ble. Blood levels of ketone bodies thereforerise during periods of hunger. Together withfree fatty acids, 3-hydroxybutyrate and ace-toacetate are then the most important energysuppliers in many tissues (including heartmuscle). Acetone cannot be metabolized andis exhaled via the lungs or excreted withurine.
To channel ketone bodies into the energymetabolism, acetoacetate is converted withthe help of succinyl CoA into succinic acidand acetoacetyl CoA, which is broken downby β-oxidation into acetyl CoA (not shown;see p.180).
If the production of ketone bodies exceedsthe demand for them outside the liver, thereis an increase in the concentration of ketonebodies in the plasma (ketonemia) and they arealso eventually excreted in the urine (ketonu-ria). Both phenomena are observed after pro-longed starvation and in inadequately treateddiabetes mellitus. Severe ketonuria with ke-toacidosis can cause electrolyte shifts andloss of consciousness, and is therefore life-threatening (ketoacidotic coma).
312 Tissues and organs
All rights reserved. Usage subject to terms and conditions of license.Koolman, Color Atlas of Biochemistry, 2nd edition © 2005 Thieme

4
N A N A CO2
5
3
1
2
3
5
1 2
4
AS
AS13
13
AS
H +
H
C
H
CC
O
C
OH
H
H
HCH H
COO
H
C
H
CH
O H
C
H
CC
O
C
OH
H
H
H
C
H
HCC
O
H
H
H
H
C
H
COOCC
O
H
H
H
H
C
H
COOCC
OH
H
H
H H
Acetyl-CoA-C-acyltransferase 2.3.1.16
Hydroxymethylglutaryl-CoA synthase 4.1.3.5
Hydroxymethylglutaryl-CoA lyase 4.1.3.4
3-Hydroxybutyrate dehydrogenase 1.1.1.30
Nonenzymatic reaction
Acetacetate Acetone
Acetyl CoA CoA Acetyl CoA CoA
A. Lipid metabolism
Intestine
Fats
Cholesterol
Chylomicronresidues
Adipose tissue Muscle
VLDL
HDLIDLLDL
Peripheraltissues
Absorptive statePostabsorptive state
Glucose
Acetyl CoA
Fatty acids
Ketone bodies Ketonebodies
Fatty acids
Fats
Phospholipids
Apolipo-proteins
Cholesterol
Cholesterolesters
Bile
Bileacids
A. Biosynthesis of ketone bodies
Acetyl CoA3-Hydroxy-3-methyl-glutaryl CoA
3-Hydroxybutyrate
Acetacetyl CoA
313Liver
All rights reserved. Usage subject to terms and conditions of license.Koolman, Color Atlas of Biochemistry, 2nd edition © 2005 Thieme

Bile acids
Bile is an important product released by thehepatocytes. It promotes the digestion of fatsfrom food by emulsifying them in the smallintestine (see p. 2770). The emulsifying com-ponents of bile, apart from phospholipids,mainly consist of bile acids and bile salts(see below). The bile also contains free cho-lesterol, which is excreted in this way (seep. 312).
A. Bile acids and bile salts
Bile acids are steroids consisting of 24 C atomscarrying one carboxylate group and severalhydroxyl groups. They are formed from cho-lesterol in the liver via an extensive reactionpathway (top). Cytochrome P450 enzymes inthe sER of hepatocytes are involved in manyof the steps (seep. 318). Initially, the choles-terol double bond is removed. Monooxyge-nases then introduce one or two additionalOH groups into the sterane framework. Fi-nally, the side chain is shortened by three Catoms, and the terminal C atom is oxidized toa carboxylate group.
It is important that the arrangement of theA and B rings is altered from trans to cis dur-ing bile acid synthesis (see p. 54). The resultof this is that all of the hydrophilic groups inthe bile acids lie on one side of the molecule.Cholesterol, which is weakly amphipathic(top), has a small polar “head” and an ex-tended apolar “tail.” By contrast, the muchmore strongly amphipathic bile acid mole-cules (bottom) resemble disks with polar topsides and apolar bottom sides. At physiolog-ical pH values, the carboxyl groups are almostcompletely dissociated and therefore nega-tively charged.
Cholic acid and chenodeoxycholic acid,known as the primary bile acids, are quanti-tatively the most important metabolites ofcholesterol. After being biosynthesized, theyare mostly activated with coenzyme A andthen conjugated with glycine or the non-pro-teinogenic amino acid taurine (see p. 62). Theacid amides formed in this way are known asconjugated bile acids or bile salts. They areeven more amphipathic than the primaryproducts.
Deoxycholic acid and lithocholic acid areonly formed in the intestine by enzymatic
cleavage of the OH group at C-7 (see B).They are therefore referred to as secondarybile acids.
B. Metabolism of bile salts
Bile salts are exclusively synthesized in theliver (see A). The slowest step in their biosyn-thesis is hydroxylation at position 7 by a 7- -hydroxylase. Cholic acid and other bile acidsinhibit this reaction (end-product inhibition).In this way, the bile acids present in the liverregulate the rate of cholesterol utilization.
Before leaving the liver, a large proportionof the bile acids are activated with CoA andthen conjugated with the amino acids glycineor taurine (2; cf. A). In this way, cholic acidgives rise to glycocholic acid and taurocholicacid. The liver bile secreted by the liver be-comes denser in the gallbladder as a result ofthe removal of water (bladder bile; 3).
Intestinal bacteria produce enzymes thatcan chemically alter the bile salts (4). Theacid amide bond in the bile salts is cleaved,and dehydroxylation at C-7 yields the corre-sponding secondary bile acids from the pri-mary bile acids (5). Most of the intestinal bileacids are resorbed again in the ileum (6) andreturned to the liver via the portal vein (en-terohepatic circulation). In the liver, the sec-ondary bile acids give rise to primary bileacids again, from which bile salts are againproduced. Of the 15–30g bile salts that arereleased with the bile per day, only around0.5g therefore appears in the feces. This ap-proximately corresponds to the amount ofdaily de novo synthesis of cholesterol.
Further information
The cholesterol excreted with the bile ispoorly water-soluble. Together with phos-pholipids and bile acids, it forms micelles(see p. 270), which keep it in solution. If theproportions of phospholipids, bile acids andcholesterol shift, gallstones can arise. Thesemainly consist of precipitated cholesterol(cholesterol stones), but can also containCa2+ salts of bile acids and bile pigments (pig-ment stones).
314 Tissues and organs
All rights reserved. Usage subject to terms and conditions of license.Koolman, Color Atlas of Biochemistry, 2nd edition © 2005 Thieme

R
6
5
4
3
2
1
3 7
12
3
HO OH
OH CN COO
O
H
HO OH
OH CN
O
H
SO3
C D
A B
HO
C D
A B
HO
COO
OH
OH
A. Bile acids and bile salts
B. Metabolism of bile salts
HO– in positionBile acids
Primary bile acids— Cholic acid— Chenodeoxycholic
acid
Secondary bile acids— Deoxycholic acid— Lithocholic acid
C-3 C-7 C-12C-3 C-7 -
C-3 - C-12
Bile salts = conjugated bile acids
Taurocholic acid
Glycocholic acid
Bile salts
Feces
Gallbladder Bile
Bile salts
Primarybile acids
CholesterolIntestine
Glycine,taurine
Resorption
Secondarybile acids
Glycine, taurine
Primarybile acids
Bile salts
Breakdown of bile saltsby intestinal bacteria
Enterohepaticcirculation
14 steps
Cholesterol
Cholic acid
Taurine
Glycine
15 – 30 g
0,5 g
C-3 - -
315Liver
All rights reserved. Usage subject to terms and conditions of license.Koolman, Color Atlas of Biochemistry, 2nd edition © 2005 Thieme

Biotransformations
The body is constantly taking up foreign sub-stances (= xenobiotics) from food or throughcontact with the environment, via the skinand lungs. These substances can be naturalin origin, or may have been synthetically pro-duced by humans. Many of these substancesare toxic, particularly at high concentrations.However, the body has effective mechanismsfor inactivating and then excreting foreignsubstances through biotransformations. Themechanisms of biotransformation are similarto those with which endogenous substancessuch as bile pigments and steroid hormonesare enzymatically converted. Biotransforma-tions mainly take place in the liver.
A. Biotransformations
Phase I reactions (interconversion reactions).Type I reactions introduce functional groupsinto inert, apolar molecules or alter functionalgroups that are already present. In manycases, this is what first makes it possible forforeign substances to conjugate with polarmolecules via phase II reactions (see below).Phase I reactions usually reduce the biologicalactivity or toxicity of a substance (“detoxifica-tion”). However, some substances only be-come biologically active as a result of theinterconversion reaction (see, for example,benzo[a]pyrene, p. 256) or become more toxicafter interconversion than the initial sub-stance (“toxification”).
Important phase I biotransformation reac-tions include:
• Hydrolytic cleavages of ether, ester, andpeptide bonds. Example (1) shows hydrol-ysis of the painkiller acetylsalicylic acid.
• Oxidations. Hydroxylations, epoxide for-mation, sulfoxide formation, dealkylation,deamination. For example, benzene is oxi-dized into phenol, and toluene (methylben-zene) is oxidized into benzoic acid.
• Reductions. Reduction of carbonyl, azo-, ornitro- compounds, dehalogenation.
• Methylations. Example (2) illustrates theinactivation of the catecholamine norepi-nephrine by methylation of a phenolic OHgroup (see p. 334).
• Desulfurations. The reactions take place inthe hepatocytes on the smooth endoplas-mic reticulum.
Most oxidation reactions are catalyzed bycytochrome P450 systems (see p. 318).These monooxygenases are induced bytheir substrates and show wide specificity.The substrate-specific enzymes of the ste-roid metabolism (see p. 376) are exceptionsto this.
Phase II reactions (conjugate formation). TypeII reactions couple their substrates (bilirubin,steroid hormones, drugs, and products ofphase I reactions) via ester or amide bondsto highly polar negatively charged molecules.The enzymes involved are transferases, andtheir products are known as conjugates.
The most common type of conjugate for-mation is coupling with glucuronate (GlcUA)as an O-or N-glucuronide. The coenzyme forthe reaction is uridine diphosphate glucuro-nate, the “active glucuronate” (see p. 110).Coupling with the polar glucuronate makesan apolar (hydrophobic) molecule morestrongly polar, and it becomes suf cientlywater-soluble and capable of being excreted.Example (3) shows the glucuronidation oftetrahydrocortisol, a metabolite of the gluco-corticoid cortisol (see p. 374).
The biosynthesis of sulfate esters with thehelp of phosphoadenosine phosphosulfate(PAPS), the “active sulfate”, (see p. 110) andamide formation with glycine and glutaminealso play a role in conjugation. For example,benzoic acid is conjugated with glycine toform the more soluble and less toxic hippuricacid (N-benzoylglycine; see p. 324).
In contrast with unconjugated compounds,the conjugates are much more water-solubleand capable of being excreted. The conjugatesare eliminated from the liver either by thebiliary route—i. e., by receptor-mediated ex-cretion into the bile—or by the renal route,via the blood and kidneys by filtration.
Further information
To detoxify heavy metals, the liver containsmetallothioneins, a group of cysteine-rich pro-teins with a high af nity for divalent metalions such as Cd2+, Cu2+, Hg2+, and Zn2+. Thesemetal ions also induce the formation of metal-lothioneins via a special metal-regulating el-ement (MRE) in the gene's promoter (seep. 244).
316 Tissues and organs
All rights reserved. Usage subject to terms and conditions of license.Koolman, Color Atlas of Biochemistry, 2nd edition © 2005 Thieme

1 2
H2O CH3-COOH
1
2
3
3
OC
CH3
O
COO
OH
COO
CH
CH2H3N
HO
OH
OH
HO
CO
H
HO
CH2OH
OH
O
CO
H
HO
CH2OH
OH
O
HO
OH
OH
H
H
HH
COO
H
CH
CH2H3N
HO
OCH3
OH
UDP-GlcUA
UDP
Conjugateformation:GlucuronidationEsterificationwith sulfateAmidationwith Gly and Glu
Foreignsubstances:
DrugsPreservativesPlasticizersPigmentsPesticides etc.
Endogenoussubstances
Steroid hormonesand other lowmolecular weightsubstancesBile pigments
Transformationreactions:
Hydrolyticcleavage,Epoxide formationDealkylationDeaminationReductionMethylationDesulfuration
Bile Urine
Phase IIreactions
Phase Ireactions
Transformationproduct
Conjugate
Poorlysoluble,biologicallyactive, sometoxic
Water soluble,inactive,non-toxic
Substrateinduction
1. Hydrolysis of a drug
3. Glucuronidation of a hormone
Acetylsalicylic acid Salicylate
Norepinephrine
S-adenosyl homocysteineS-adenosylmethionine
Arylesterase3.1.1.2
Catechol O-methyl-transferase 2.1.1.6
O-methylnorepinephrine
Acetic acid
Tetrahydrocortisol
Tetrahydrocortisol glucuronide
2. Methylationof a hormone/neurotransmitter
Glucuronosyltransferase 2.4.1.17
A. Biotransformations
Substrateinduction
317Liver
All rights reserved. Usage subject to terms and conditions of license.Koolman, Color Atlas of Biochemistry, 2nd edition © 2005 Thieme

Cytochrome P450 systems
During the first phase of biotransformation inthe liver, compounds that are weakly chemi-cally reactive are enzymatically hydroxylated(see p. 316). This makes it possible for them tobe conjugated with polar substances. The hy-droxylating enzymes are generally mono-oxygenases that contain a heme as the redox-active coenzyme (see p. 106). In the reducedform, the heme can bind carbon monoxide(CO), and it then shows characteristic lightabsorption at 450 nm. This was what led tothis enzyme group being termed cytochromeP450 (Cyt P450).
Cyt P450 systems are also involved in manyother metabolic processes—e. g., the biosyn-thesis of steroid hormones (see p. 172), bileacids (see p. 314), and eicosanoids (seep. 390), as well as the formation of unsatu-rated fatty acids (see p. 409). The liver’s red-dish-brown color is mainly due to the largeamounts of P450 enzymes it contains.
A. Cytochrome P450-dependent mono oxy-genases: reactions
Cyt P450-dependent monooxygenases cata-lyze reductive cleavage of molecular oxygen(O2). One of the two oxygen atoms is trans-ferred to the substrate, while the other is re-leased as a water molecule. The necessary re-ducingequivalentsaretransferredtotheactualmonooxygenase by an FAD-containing auxili-ary enzyme from the coenzyme NADPH+H+.
Cyt P450 enzymes occur in numerousforms in the liver, steroid-producing glands,and other organs. The substrate specificity ofliver enzymes is low. Apolar compounds con-taining aliphatic or aromatic rings are partic-ularly easily converted. These include endog-enous substances such as steroid hormones,as well as medical drugs, which are inacti-vated by phase I reactions. This is why CytP450 enzymes are of particular interest inpharmacology. The degradation of ethanol inthe liver is also partly catalyzed by Cyt P450enzymes (the “microsomal ethanol-oxidizingsystem”; see p. 304). As alcohol and drugs arebroken down by the same enzyme system,the effects of alcoholic drinks and medicaldrugs can sometimes be mutually en-hancing—even sometimes to the extent ofbecoming life-threatening.
Only a few examples of the numerous CytP450-dependent reactions are shown here.Hydroxylation of aromatic rings (a) plays acentral part in the metabolism of medicinesand steroids. Aliphatic methyl groups can alsobe oxidized to hydroxyl groups (b). Epoxi-dation of aromatics (c) by Cyt P450 yieldsproducts that are highly reactive and oftentoxic. For example, the mutagenic effect ofbenzo[a]pyrene (see p. 244) is based on thistype of interconversion in the liver. In CytP450 dependent dealkylations (d), alkyl sub-stituents of O, N, or S atoms are released asaldehydes.
B. Reaction mechanism
The course of Cyt P450 catalysis is in principlewell understood. The most important func-tion of the heme group consists of convertingmolecular oxygen into an especially reactiveatomic form, which is responsible for all of thereactions described above.
[1] In the resting state, the heme iron istrivalent. Initially, the substrate binds near theheme group.
[2] Transfer of an electron from FADH2 re-duces the iron to the divalent form that is ableto bind an O2 molecule (2).
[3] Transfer of a second electron and achange in the valence of the iron reduce thebound O2 to the peroxide.
[4] A hydroxyl ion is now cleaved from thisintermediate. Uptake of a proton gives rise toH2O and the reactive form of oxygen men-tioned above. In this ferryl radical, the ironis formally tetravalent.
[5] The activated oxygen atom inserts itselfinto a C–H bond in the substrate, therebyforming an OH group.
[6] Dissociation of the product returns theenzyme to its initial state.
318 Tissues and organs
All rights reserved. Usage subject to terms and conditions of license.Koolman, Color Atlas of Biochemistry, 2nd edition © 2005 Thieme

HO
AF
P
AN
S Fe3
OOH
S Fe3
OO
S Fe2
S Fe3
H
OS Fe4
HO
S Fe3
AF
P
AN
e
e
H
O2
H
1
2
34
5
6
H
H
H
AF
O O
P
AN
AF
P
AN
H
Fe
2H
1
H2O
(H ) O
OR
O
CH3O
CH2
R
HO
C
R
H O
OO
CH2O
H
OR
OH
1
H
H2O
A. Cytochrome P450-dependent monooxygenases: reactions
Monooxygenase1.14.n.n [heme P450]
a) Hydroxylationaromatic
b) Hydroxylationalipathic
c) Epoxidation d) Dealkylation
Apolar substrate
Oxygenated product
Cyt P450reductase
SubstrateProduct
“Activatedoxygen”
Restingstate
B. Reaction mechanism
319Liver
All rights reserved. Usage subject to terms and conditions of license.Koolman, Color Atlas of Biochemistry, 2nd edition © 2005 Thieme

Ethanol metabolism
A. Blood ethanol level
Ethanol (EtOH, “alcohol”) naturally occurs infruit in small quantities. Alcoholic drinkscontain much higher concentrations. Theiralcohol content is usually given as percentby volume. To estimate alcohol uptake andthe blood alcohol level, it is useful to convertthe amount to grams of ethanol (density0.79 kg L–1). For example, a bottle of beer(0.5 L at 4% v/v alcohol) contains20 mL = 16 g of ethanol, while a bottle ofwine (0.7 L at 12% v/v alcohol) contains84 mL = 66 g ethanol.
Ethanol is membrane-permeable and isquickly resorbed. The maximum blood levelis already reached within 60–90 min afterdrinking. The resorption rate depends on var-ious conditions, however. An empty stomach,a warm drink (e. g., mulled wine), and thepresence of sugar and carbonic acid (e. g., inchampagne) promote ethanol resorption,whereas a heavy meal reduces it. Ethanol israpidly distributed throughout the body. Alarge amount is taken up by the muscles andbrain, but comparatively little by adipose tis-sue and bones. Roughly 70% of the body isaccessible to alcohol. Complete resorption ofthe ethanol contained in one bottle of beer(16 g) by a person weighing 70 kg (distribu-tion in 70 kg 70/100 = 49 kg) leads to ablood alcohol level of 0.33 per thousand(7.2 mM). The lethal concentration of alcoholis approximately 3.5 per thousand (76 mM).
B. Ethanol metabolism
The major site of ethanol degradation is theliver, although the stomach is also able to me-tabolize ethanol. Most ethanol is initially oxi-dized by alcohol dehydrogenase to form etha-nal (acetaldehyde). A further oxidization, cata-lyzed by aldehyde dehydrogenase, leads to ace-tate. Acetate is then converted with the helpof acetate-CoA ligase to form acetyl CoA, usingATP and providing a link to the intermediarymetabolism. In addition to cytoplasmic alco-hol dehydrogenase, catalase and induciblemicrosomal alcohol oxidase (“MEOS”; seep. 318)alsocontributetoalesserextenttoetha-nol degradation. Many of the enzymes men-tioned above are induced by ethanol.
The rate of ethanol degradation in the liveris limited by alcohol dehydrogenase activity.The amount of NAD+ available is the limitingfactor. As the maximum degradation rate isalready reached at low concentrations ofethanol, the ethanol level therefore declinesat a constant rate (zero-order kinetics). Thecalorific value of ethanol is 29.4 kJ g–1. Alco-holic drinks—particularly in alcoholics—cantherefore represent a substantial proportionof dietary energy intake.
C. Liver damage due to alcohol
Alcohol is a socially accepted drug of abuse inWestern countries. Due to the high potentialfor addiction to develop, however, it is ac-tually a “hard” drug and has a much largernumber of victims than the opiate drugs, forexample. In the brain, ethanol is deposited inmembranes due to its amphipathic proper-ties, and it influences receptors for neuro-transmitters (see p. 352). The effect of GABAis enhanced, while that of glutamate declines.
High ethanol consumption over manyyears leads to liver damage. For a healthyman, the limit is about 60 g per day, and fora woman about 50 g. However, these valuesare strongly dependent on body weight,health status, and other factors.
Ethanol-related high levels of NADH+H+
and acetyl-CoA in the liver lead to increasedsynthesis of neutral fats and cholesterol.However, since the export of these in theform of VLDLs (see p. 278) is reduced due toalcohol, storage of lipids occurs (fatty liver).This increase in the fat content of the liver(from less than 5% to more than 50% of thedry weight) is initially reversible. However, inchronic alcoholism the hepatocytes are in-creasingly replaced by connective tissue.When liver cirrhosis occurs, the damage tothe liver finally reaches an irreversible stage,characterized by progressive loss of liverfunctions.
320 Tissues and organs
All rights reserved. Usage subject to terms and conditions of license.Koolman, Color Atlas of Biochemistry, 2nd edition © 2005 Thieme
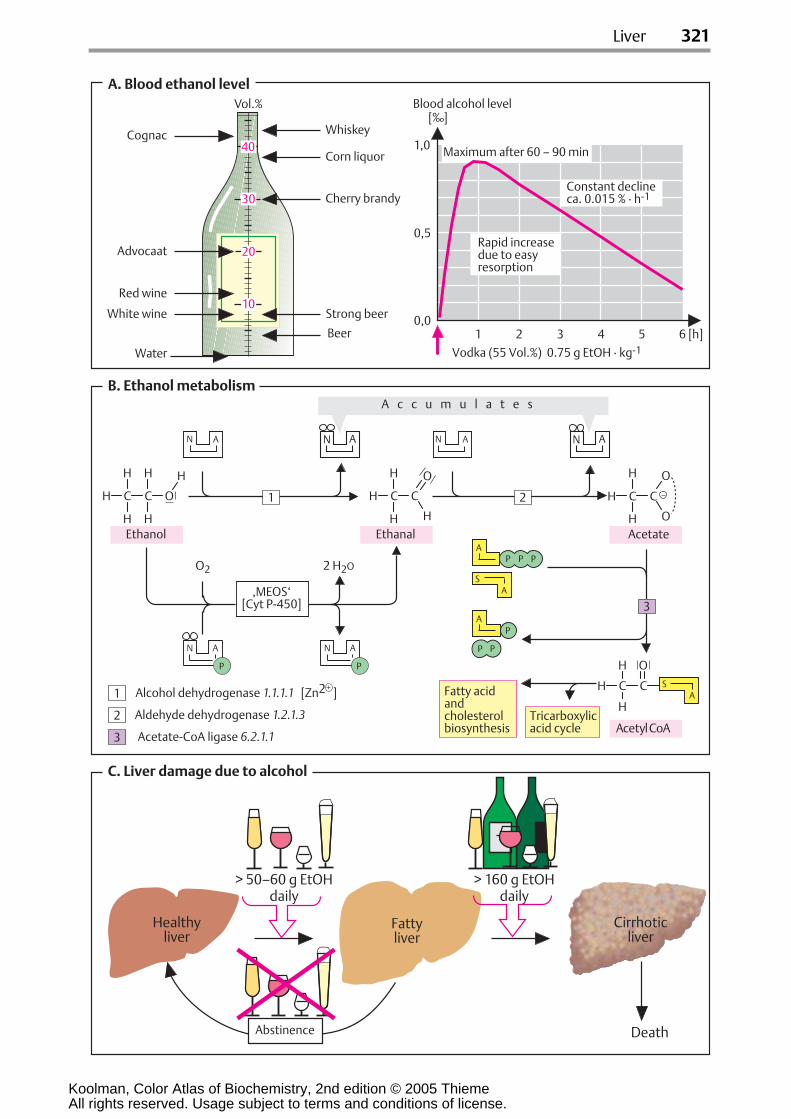
P P PA
PA
P P
AS
N A
PP
N A
O2 2 H2O
N A N AN AN A
‚MEOS‘[Cyt P-450]
AS
Vol.%
10
60,0
[‰]
1,0
0,5
54321 [h]
20
30
40
C
O
CH
H
H
H C C O
H
H
H
H
H
H C C
H
H
O
H O
C
O
CH
H
H
1
2
3
1 2
3
Water
A. Blood ethanol level
B. Ethanol metabolism
Death
Healthyliver
Fattyliver
Cirrhoticliver
> 50–60 g EtOHdaily
> 160 g EtOHdaily
Abstinence
Aldehyde dehydrogenase 1.2.1.3
Fatty acidandcholesterolbiosynthesis
Tricarboxylicacid cycle Acetyl CoA
Ethanal
A c c u m u l a t e s
Beer
Cherry brandy
Corn liquor
WhiskeyCognac
Blood alcohol level
Vodka (55 Vol.%) 0.75 g EtOH · kg-1
Maximum after 60 – 90 min
Constant declineca. 0.015 % · h-1
Rapid increasedue to easyresorption
White wine
Advocaat
Red wine
Strong beer
Alcohol dehydrogenase 1.1.1.1 [Zn2 ]
Acetate-CoA ligase 6.2.1.1
AcetateEthanol
C. Liver damage due to alcohol
321Liver
All rights reserved. Usage subject to terms and conditions of license.Koolman, Color Atlas of Biochemistry, 2nd edition © 2005 Thieme

Kidney: functions
A. Functions of the kidneys
The kidneys’ main function is excretion ofwater and water-soluble substances (1). Thisis closely associated with their role in regulat-ing the body’s electrolyte and acid–base bal-ance (homeostasis, 2; see pp. 326 and 328).Both excretion and homeostasis are subject tohormonal control. The kidneys are also in-volved in synthesizing several hormones (3;see p. 315). Finally, the kidneys also play a rolein the intermediary metabolism (4), particu-larly in amino acid degradation and gluconeo-genesis (see p. 154).
The kidneys are extremely well-perfusedorgans, with about 1500 L of blood flowingthrough them every day. Approximately 180 Lof primary urine is filtered out of this. Re-moval of water leads to extreme concentra-tion of the primary urine (to approximatelyone-hundredth of the initial volume). As aresult, only a volume of 0.5–2.0 L of finalurine is excreted per day.
B. Urine formation
The functional unit of the kidney is the neph-ron. It is made up of the Malpighian bodies orrenal corpuscles (consisting of Bowman’s cap-sules and the glomerulus), the proximal tu-bule, Henle’s loop, and the distal tubule,which passes into a collecting duct. The hu-man kidney contains around one millionnephrons. The nephrons form urine in thefollowing three phases.
Ultrafiltration. Ultrafiltration of the bloodplasma in the glomerulus gives rise to primaryurine, which is isotonic with plasma. The poresin the glomerular basal membrane, which aremade up of type IV collagen (see p. 344), havean effective mean diameter of 2.9 nm. This al-lows all plasma components with a molecularmass of up to about 15 kDa to pass throughunhindered. At increasing masses, moleculesare progressively held back; at masses greaterthan 65 kDa, they are completely unable toenter the primary urine. This applies to almostall plasma proteins—which in addition, beinganions, are repelled by the negative charge inthe basal membrane.
Resorption. All low-molecular weightplasma components enter the primary urinevia glomerular filtration. Most of these are
transported back into the blood by resorption,to prevent losses of valuable metabolites andelectrolytes. In the proximal tubule, organicmetabolites (e. g., glucose and other sugars,amino acids, lactate, and ketone bodies) arerecovered by secondary active transport (seep. 220). There are several group-specifictransport systems for resorbing amino acids,with which hereditary diseases can beassociated (e. g., cystinuria, glycinuria, andHartnup’s disease). HCO3
–, Na+, phophate,and sulfate are also resorbed by ATP-depend-ent (active) mechanisms in the proximal tu-bule. The later sections of the nephron mainlyserve for additional water recovery and regu-lated resorption of Na+ and Cl– (see pp. 326,328). These processes are controlled by hor-mones (aldosterone, vasopressin).
Secretion. Some excretable substances arereleased into the urine by active transport inthe renal tubules. These substances include H+
and K+ ions, urea, and creatinine, as well asdrugs such as penicillin.
Clearance. Renalclearanceisusedasaquan-titative measure of renal function. It is definedas the plasma volume cleared of a given sub-stance per unit of time. Inulin, a fructose poly-saccharide with a mass of ca. 6 kDa (see p. 40)that is neither actively excreted nor resorbedbut is freely filtered, has a clearance of120mL min–1 in healthy individuals.
Further information
Concentrating urine and transporting itthrough membranes are processes that re-quire large amounts of energy. The kidneystherefore have very high energy demands. Inthe proximal tubule, the ATP needed is ob-tained from oxidative metabolism of fattyacids, ketone bodies, and several amino acids.To a lesser extent, lactate, glycerol, and citricacid are also used. In the distal tubule andHenle’s loop, glucose is the main substratefor the energy metabolism. The endothelialcells in the proximal tubule are also capableof gluconeogenesis. The substrates for this aremainly the carbohydrate skeletons of aminoacids. Their amino groups are used as ammo-nia for buffering urine (see p. 311). Enzymesfor peptide degradation and the amino acidmetabolism occur in the kidneys at high lev-els of activity (e. g., amino acid oxidases,amine oxidases, glutaminase).
322 Tissues and organs
All rights reserved. Usage subject to terms and conditions of license.Koolman, Color Atlas of Biochemistry, 2nd edition © 2005 Thieme

HV
NH3
Resorption
Regulatedsecretion
Secretion
Regulatedresorption
Ultra-filtration
All soluteplasmacomponentssmallerthan3 nm = 15 kDa
Glomerulus
Bowman’scapsule
Efferentarteriole
Afferentarteriole
Ultrafiltration Secretion
Drugs
Uric acid
Creatinine
K
H
Resorption
Glucose
Amino acids
Lactate2-Oxoacids
Na , K , Ca2 , Mg2
Water, etc.Cl , SO4 , HPO4,
22
ErythropoietinCalcitriol
4. Metabolism
3. Hormone synthesis
Aminoacids
Glucose Blood
Urine
Gluconeo-genesis
WaterSaltsMetabolicwastesForeignsubstances
Acid-base balanceElectrolyte balance
1. Excretion
2. Homeostasis
Proximaltubule
Distaltubule
Collectingduct
Henle’sloop
Finalurine
HCO3
of H2O
A. Functions of the kidneys
B. Urine formation
Renal corpuscle
323Kidney
All rights reserved. Usage subject to terms and conditions of license.Koolman, Color Atlas of Biochemistry, 2nd edition © 2005 Thieme

Urine
A. Urine
Water and water-soluble compounds are ex-creted with the urine. The volume and com-position of urine are subject to wide variationand depend on food intake, body weight, age,sex, and living conditions such as tempera-ture, humidity, physical activity, and healthstatus. As there is a marked circadian rhythmin urine excretion, the amount of urine and itscomposition are usually given relative to a 24-hour period.
A human adult produces 0.5–2.0 L urineper day, around 95% of which consists ofwater. The urine usually has a slightly acidicpH value (around 5.8). However, the pH valueof urine is strongly affected by metabolic sta-tus. After ingestion of large amounts of plantfood, it can increase to over 7.
B. Organic components
Nitrogen-containing compounds are amongthe most important organic components ofurine. Urea, which is mainly synthesized inthe liver (urea cycle; see p.182), is the form inwhich nitrogen atoms from amino acids areexcreted. Breakdown of pyrimidine bases alsoproduces a certain amount of urea (seep. 190). When the nitrogen balance is con-stant, as much nitrogen is excreted as is takenup (see p. 174), and the amount of urea in theurine therefore reflects protein degradation:70 g protein in food yields approximately30 g urea in the urine.
Uric acid is the end product of the purinemetabolism. When uric acid excretion via thekidneys is disturbed, gout can develop (seep. 190). Creatinine is derived from the musclemetabolism, where it arises spontaneouslyand irreversibly by cyclization of creatineand creatine phosphate (see p. 336). Sincethe amount of creatinine an individual ex-cretes per day is constant (it is directly pro-portional to muscle mass), creatinine as anendogenous substance can be used to mea-sure the glomerular filtration rate. Theamount of amino acids excreted in free formis strongly dependent on the diet and on theef ciency of liver function. Amino acid deriv-atives are also found in the urine (e. g., hippu-rate, a detoxification product of benzoic acid).
Modified amino acids, which occur in specialproteins such as hydroxyproline in collagenand 3-methylhistidine in actin and myosin,can be used as indicators of the degradationof these proteins.
Other components of the urine are conju-gates with sulfuric acid, glucuronic acid, gly-cine, and other polar compounds that aresynthesized in the liver by biotransformation(see p. 316). In addition, metabolites of manyhormones (catecholamines, steroids, seroto-nin) also appear in the urine and can provideinformation about hormone production. Theproteohormone chorionic gonadotropin (hCG,mass ca. 36 kDa), which is formed at the onsetof pregnancy, appears in the urine due to itsrelatively small size. Evidence of hCG in theurine provides the basis for an immunologicalpregnancy test.
The yellow color of urine is due to uro-chromes, which are related to the bile pig-ments produced by hemoglobin degradation(see p. 194). If urine is left to stand longenough, oxidation of the urochromes maylead to a darkening in color.
C. Inorganic components
The main inorganic components of the urineare the cations Na+, K+, Ca2+, Mg2+, and NH4
+
and the anions Cl–, SO42–, and HPO4
2–, as wellas traces of other ions. In total, Na+ and Cl–
represent about two-thirds of all the electro-lytes in the final urine. Calcium and magne-sium occur in the feces in even larger quanti-ties. The amounts of the various inorganiccomponents of the urine also depend on thecomposition of the diet. For example, inacidosis there can be a marked increase inthe excretion of ammonia (see p. 326). Excre-tion of Na+, K+, Ca2+, and phosphate via thekidneys is subject to hormonal regulation (seep. 330).
Further information
Shifts in the concentrations of the physiolog-ical components of the urine and the appear-ance of pathological urine components can beused to diagnose diseases. Important exam-ples are glucose and ketone bodies, which areexcreted to a greater extent in diabetesmellitus (see p. 160).
324 Tissues and organs
All rights reserved. Usage subject to terms and conditions of license.Koolman, Color Atlas of Biochemistry, 2nd edition © 2005 Thieme

Cl120-240
2HPO410-40
2SO430-60
NH430-50
Na100 -150
K60-80
Mg23-6
Ca24-11
C
CNH
C
HNC
NH
C
HN
O
O
O
CNH
COO
O
NH2
OC
H2C
NC
NH2
O
H3C
C
O
N
CN
H2C
H3C NH2H2N
CNH2
O
24-h urine
A. Urine
C. Inorganic constituents
Dailyexcretion(mmol)
Hippurate0.15 g
Volume: 0.5 - 2 l/day
Density: 1.015 - 1.022 kg/lpH: 5.8 (4.8 - 7.5)
Osmolarity: 50 -1300 mosmol/kgSolids: 50 - 72 g/day
Creatinine1.0-1.5 gfrom creatineand creatinephosphate
Creatine0.05-0.10 gfrom musclemetabolism
Urea20-35 gfrom proteinsand amino acids
Uric acid0.3-2.0 gfrom purinedegradation
Proteins< 0.15 g
Amino acids1-3 g
Glucose< 0.16 g
B. Organic constituents
Ketone bodies< 3 g
Dissociationdependent on pH
325Kidney
All rights reserved. Usage subject to terms and conditions of license.Koolman, Color Atlas of Biochemistry, 2nd edition © 2005 Thieme

Functions in the acid–base balance
Along with the lungs, the kidneys are partic-ularly involved in keeping the pH value of theextracellular fluid constant (see p. 288). Thecontribution made by the kidneys particularlyinvolves resorbing HCO3
– and actively excret-ing protons.
A. Proton excretion
The renal tubule cells are capable of secretingprotons (H+) from the blood into the urineagainst a concentration gradient, despite thefact that the H+ concentration in the urine isup to a thousand times higher than in theblood. To achieve this, carbon dioxide (CO2)is taken up from the blood and—together withwater (H2O) and with the help of carbonatedehydratase (carbonic anhydrase, [1])—con-verted into hydrogen carbonate (“bicarbo-nate,” HCO3
–) and one H+. Formally, this yieldscarbonic acid H2CO3 as an intermediate, but itis not released during the reaction.
The hydrogen carbonate formed in car-bonic anhydrase returns to the plasma, whereit contributes to the blood’s base reserve. Theproton is exported into the urine by secondaryactive transport in antiport for Na+ (bottomright). The driving force for proton excretion,as in other secondary active processes, is theNa+ gradient established by the ATPase in-volved in the Na+/K+ exchange (“Na+/K+ AT-Pase”, see p. 220). This integral membraneprotein on the basal side (towards the blood)of tubule cells keeps the Na+ concentration inthe tubule cell low, thereby maintaining Na+
inflow. In addition to this secondary active H+
transport mechanism, there is a V-type H+-transporting ATPase in the distal tubule andcollecting duct (see p. 220).
An important function of the secreted H+
ions is to promote HCO3- resorption (top
right). Hydrogen carbonate, the most impor-tant buffering base in the blood, passes intothe primary urine quantitatively, like all ions.In the primary urine, HCO3
– reacts with H+
ions to form water and CO2, which returnsby free diffusion to the tubule cells and fromthere into the blood. In this way, the kidneysalso influence the CO2/HCO3
– buffering bal-ance in the plasma.
B. Ammonia excretion
Approximately 60 mmol of protons are ex-creted with the urine every day. Bufferingsystems in the urine catch a large proportionof the H+ ions, so that the urine only becomesweakly acidic (down to about pH 4.8).
An important buffer in the urine is thehydrogen phosphate/dihydrogen phosphatesystem (HPO4
2–/H2PO4–). In addition, ammo-
nia also makes a vital contribution to buffer-ing the secreted protons.
Since plasma concentrations of free am-monia are low, the kidneys release NH3 fromglutamine and other amino acids. At0.5–0.7 mM, glutamine is the most importantamino acid in the plasma and is the preferredform for ammonia transport in the blood. Thekidneys take up glutamine, and with the helpof glutaminase [4], initially release NH3 fromthe amide bond hydrolytically. From the glu-tamate formed, a second molecule of NH3 canbe obtained by oxidative deamination withthe help of glutamate dehydrogenase [5] (seep. 178). The resulting 2-oxoglutarate is fur-ther metabolized in the tricarboxylic acidcycle. Several other amino acids—alanine inparticular, as well as serine, glycine, andaspartate—can also serve as suppliers of am-monia.
Ammonia can diffuse freely into the urinethrough the tubule membrane, while the am-monium ions that are formed in the urine arecharged and can no longer return to the cell.Acidic urine therefore promotes ammonia ex-cretion, which is normally 30–50 mmol perday. In metabolic acidosis (e. g., during fastingor in diabetes mellitus), after a certain timeincreased induction of glutaminase occurs inthe kidneys, resulting in increased NH3 excre-tion. This in turn promotes H+ release andthus counteracts the acidosis. By contrast,when the plasma pH value shifts towardsalkaline values (alkalosis), renal excretion ofammonia is reduced.
326 Tissues and organs
All rights reserved. Usage subject to terms and conditions of license.Koolman, Color Atlas of Biochemistry, 2nd edition © 2005 Thieme

H2O
NH3 NH3
HCO3
CO2 CO2
HCO3
H
H2O
H2O
N A
NH4
3Na
2KA
P P P
AP P
P
3Na
2K
H
NH4
3
4
1
2
4
3
H2O
N A
NaNa
H
HCO3CO2
1
1
2
H
Na /K -exchanging ATPase 3.6.1.37
Secondary activetransport of H
Blood plasma
Tubule cellFrom thefinal urine
Tricarboxylicacid cycle
Diffusion
AlaSerGlyAsp
Amino acidwith the highestplasmaconcentration
2-Oxoglutarate
Glutamine Glutamine
Glutamate Glutamate
Glutaminase 3.5.1.2
Glutamat-Dehydrogenase 1.4.1.2
Excretion of30 – 50 mmol/day
A. Proton secretion
B. Ammonia excretion
Carbonate dehydratase4.2.1.1 [Zn ]
Urine
2
327Kidney
All rights reserved. Usage subject to terms and conditions of license.Koolman, Color Atlas of Biochemistry, 2nd edition © 2005 Thieme

Electrolyte and water recycling
A. Electrolyte and water recycling
Electrolytes and other plasma componentswith low molecular weights enter the primaryurine by ultrafiltration (right). Most of thesesubstances are recovered by energy-depen-dent resorption (see p. 322). The extent ofthe resorption determines the amount thatultimately reaches the final urine and is ex-creted. The illustration does not take into ac-count the zoning of transport processes in thekidney (physiology textbooks may be referredto for further details).
Calcium and phosphate ions. Calcium(Ca2+) and phosphate ions are almost com-pletely resorbed from the primary urine byactive transport (i. e., in an ATP-dependentfashion). The proportion of Ca2+ resorbed isover 99%, while for phosphate the figure is80–90%. The extent to which these two elec-trolytes are resorbed is regulated by the threehormones parathyrin, calcitonin, and calci-triol.
The peptide hormone parathyrin (PTH),which is produced by the parathyroid gland,stimulates Ca2+ resorption in the kidneys andat the same time inhibits the resorption ofphosphate. In conjunction with the effects ofthis hormone in the bones and intestines (seep. 344), this leads to an increase in the plasmalevel of Ca2+ and a reduction in the level ofphosphate ions.
Calcitonin, a peptide produced in the C cellsof the thyroid gland, inhibits the resorption ofboth calcium and phosphate ions. The result isan overall reduction in the plasma level of bothions. Calcitonin is thus a parathyrin antago-nist relative to Ca2+.
The steroid hormone calcitriol, which isformed in the kidneys (see p. 304), stimulatesthe resorption of both calcium and phosphateions and thus increases the plasma level ofboth ions.
Sodium ions. Controlled resorption of Na+
from the primary urine is one of the mostimportant functions of the kidney. Na+ resorp-tion is highly effective, with more than 97%being resorbed. Several mechanisms are in-volved: some of the Na+ is taken up passivelyin the proximal tubule through the junctionsbetween the cells (paracellularly). In addition,there is secondary active transport together
with glucose and amino acids (see p. 322).These two pathways are responsible for60–70% of total Na+ resorption. In the ascend-ing part of Henle’s loop, there is anothertransporter (shown at the bottom right),which functions electroneutrally and takesup one Na+ ion and one K+ ion together withtwo Cl– ions. This symport is also dependenton the activity of Na+/K+ ATPase [2], whichpumps the Na+ resorbed from the primaryurine back into the plasma in exchange for K+.
The steroid hormone aldosterone (seep. 55) increases Na+ reuptake, particularly inthe distal tubule, while atrial natriureticpeptide (ANP) originating from the cardiacatrium reduces it. Among other effects, aldo-sterone induces Na+/K+ ATPase and variousNa+ transporters on the luminal side of thecells.
Water. Water resorption in the proximaltubule is a passive process in which waterfollows the osmotically active particles, par-ticularly the Na+ ions. Fine regulation of waterexcretion (diuresis) takes place in the collect-ing ducts, where the peptide hormone vaso-pressin (antidiuretic hormone, ADH) operates.This promotes recovery of water by stimulat-ing the transfer of aquaporins (see p. 220)into the plasma membrane of the tubule cellsvia V2 receptors. A lack of ADH leads to thedisease picture of diabetes insipidus, in whichup to 30 L of final urine is produced per day.
B. Gluconeogenesis
Apart from the liver, the kidneys are the onlyorgans capable of producing glucose byneosynthesis (gluconeogenesis; see p.154).The main substrate for gluconeogenesis inthe cells of the proximal tubule is glutamine.In addition, other amino acids and also lac-tate, glycerol, and fructose can be used asprecursors. As in the liver, the key enzymesfor gluconeogenesis are induced by cortisol(see p. 374). Since the kidneys also have ahigh level of glucose consumption, they onlyrelease very little glucose into the blood.
328 Tissues and organs
All rights reserved. Usage subject to terms and conditions of license.Koolman, Color Atlas of Biochemistry, 2nd edition © 2005 Thieme

Ca2Ca2 Ca2
NH3
AP P P
AP P P
H2O
NH3
H
NH4
H2PO4 H2PO4 H2PO4
1
H2O
3Na 3Na
2K 2KA
P PP
AP P P
2
Na
2 Cl
K
2 Cl
1
2
Freediffusion
Blood plasma
Tubule cell
Urine
Gluconeogenesis
Glucose
Cortisol
Glutamine
Glycerol
Fructose
Amino acids
Glucose
Water followsosmoticgradientVasopressin
(adiuretin)
2-Oxoglutarate
Glutamine
A. Electrolyte and water recycling
B. Gluconeogenesis
ANP
Ca2 -transportingATPase 3.6.1.38
Na /K -exchangingATPase 3.6.1.37
AldosteroneAldosterone
CalcitriolParathyrin Calcitonin
329Kidney
All rights reserved. Usage subject to terms and conditions of license.Koolman, Color Atlas of Biochemistry, 2nd edition © 2005 Thieme

Renal hormones
A. Renal hormones
In addition to their involvement in excretionand metabolism, the kidneys also have endo-crine functions. They produce the hormoneserythropoietin and calcitriol and play a deci-sive part in producing the hormone angioten-sin II by releasing the enzyme renin. Renalprostaglandins (see p. 390) have a local effecton Na+ resorption.
Calcitriol (vitamin D hormone, 1α,25-dihy-droxycholecalciferol) is a hormone closely re-lated to the steroids that is involved in Ca2+
homeostasis (see p. 342). In the kidney, it isformed from calcidiol by hydroxylation at C-1.The activity of calcidiol-1-monooxygenase [1]is enhanced by the hormone parathyrin(PTH).
Erythropoietin is a peptide hormone that isformed predominantly by the kidneys, butalso by the liver. Together with other factorsknown as “colony-stimulating factors” (CSF;see p. 392), it regulates the differentiation ofstem cells in the bone marrow.
Erythropoietin release is stimulated by hy-poxia (low pO2). Within hours, the hormoneensures that erythrocyte precursor cells in thebone marrow are converted to erythrocytes,so that their numbers in the blood increase.Renal damage leads to reduced erythropoie-tin release, which in turn results in anemia.Forms of anemia with renal causes can nowbe successfully treated using erythropoietinproduced by genetic engineering techniques.The hormone is also administered to dialysispatients. Among athletes and sports profes-sionals, there have been repeated cases oferythropoietin being misused for doping pur-poses.
B. Renin–angiotensin system
The peptide hormone angiotensin II is notsynthesized in a hormonal gland, but in theblood. The kidneys take part in this process byreleasing the enzyme renin.
Renin [2] is an aspartate proteinase (seep. 176). It is formed by the kidneys as a pre-cursor (prorenin), which is proteolyticallyactivated into renin and released into theblood. In the blood plasma, renin acts onangiotensinogen, a plasma glycoprotein in
the α2-globulin group (see p. 276), whichlike almost all plasma proteins is synthesizedin the liver. The decapeptide cleaved off byrenin is called angiotensin I. Further cleavageby peptidyl dipeptidase A (angiotensin-con-verting enzyme, ACE), a membrane enzymelocated on the vascular endothelium in thelungs and other tissues, gives rise to theoctapeptide angiotensin II [3], which acts asa hormone and neurotransmitter. The lifespanof angiotensin II in the plasma is only a fewminutes, as it is rapidly broken down by otherpeptidases (angiotensinases [4]), which occurin many different tissues.
The plasma level of angiotensin II is mainlydetermined by the rate at which renin is re-leased by the kidneys. Renin is synthesized byjuxtaglomerular cells, which release it whensodium levels decline or there is a fall in bloodpressure.
Effects of angiotensin II. Angiotensin II haseffects on the kidneys, brain stem, pituitarygland, adrenal cortex, blood vessel walls, andheart via membrane-located receptors. It in-creases blood pressure by triggering vasocon-striction (narrowing of the blood vessels). Inthe kidneys, it promotes the retention of Na+
and water and reduces potassium secretion.In the brain stem and at nerve endings in thesympathetic nervous system, the effects ofangiotensin II lead to increased tonicity (neu-rotransmitter effect). In addition, it triggersthe sensation of thirst. In the pituitary gland,angiotensin II stimulates vasopressin release(antidiuretic hormone) and corticotropin(ACTH) release. In the adrenal cortex, it in-creases the biosynthesis and release of aldo-sterone, which promotes sodium and waterretention in the kidneys. All of the effects ofangiotensin II lead directly or indirectly toincreased blood pressure, as well as increasedsodium and water retention. This importanthormonal system for blood pressure regula-tion can be pharmacologically influenced byinhibitors at various points:• Using angiotensinogen analogs that inhibit
renin.• Using angiotensin I analogs that competi-
tively inhibit the enzyme ACE [3].• Using hormone antagonists that block the
binding of angiotensin II to its receptors.
330 Tissues and organs
All rights reserved. Usage subject to terms and conditions of license.Koolman, Color Atlas of Biochemistry, 2nd edition © 2005 Thieme

pO2
1
25
3 1
OH
HO
CH2
OH
A. Renal hormones
B. Renin angiotensin system
Effects
Decapeptide
Degradation products
Angiotensin II
Angiotensin I
Angiotensinogenfrom liver
Dipeptide
Residualprotein
NaBlood pressure
Protein
VasoconstrictionBlood pressure
Blood vessels:
Aldosteroneproduction
Adrenals:
Release ofcorticotropinand adiuretin,Thirst
Na retentionH2O retention
Kidneys:
Hormone
DRVYIHPF
Erythropoietin18.4 kDa
Calcitriol Calcitriol
Hormone
DigestivetractKidneysBones
Calcidiol
Calcidiolfrom liver
Angiotensinogen57 kDa
Angiotensin I
EnzymeParathyrin
Hormone
Renin 42 kDa
Stem cell Erythrocyte
DifferentiationMaturation
Angiotensin II
Renin
Prorenin
Peptidyl-dipeptidase A[Zn2 ] 3.4.15.1 (ACE)
Renin 3.4.23.15
Calcidiol 1-monooxygenase[heme P450]1.14.13.13
Blood
Peptidases 3.4.n.n
Brain:
Octapeptide
ACE inhibitors
2
3
4
3
2
1
3
2
4
331Kidney
All rights reserved. Usage subject to terms and conditions of license.Koolman, Color Atlas of Biochemistry, 2nd edition © 2005 Thieme

Muscle contraction
The musculature is what makes movementspossible. In addition to the skeletal muscles,which can be contracted voluntarily, there arealso the autonomically activated heart muscleand smooth muscle, which is also involuntary.In all types of muscle, contraction is based onan interplay between the proteins actin andmyosin.
A. Organization of skeletal muscle
Striated muscle consists of parallel bundles ofmuscle fibers. Each fiber is a single large mul-tinucleate cell. The cytoplasm in these cellscontains myofibrils 2–3 µm thick that can ex-tend over the full length of the muscle fiber.
The striation of the muscle fibers is charac-teristic of skeletal muscle. It results from theregular arrangement of molecules of differingdensity. The repeating contractile units, thesarcomeres, are bounded by Z lines fromwhich thin filaments of F-actin (see p. 204)extend on each side. In the A bands, thereare also thick parallel filaments of myosin.The H bands in the middle of the A bandsonly contain myosin, while only actin is foundon each size of the Z lines.
Myosin is quantitatively the most impor-tant protein in the myofibrils, representing65% of the total. It is shaped like a golf club(bottom right). The molecule is a hexamerconsisting of two identical heavy chains(2 × 223 kDa) and four light chains (eachabout 20 kDa). Each of the two heavy chainshas a globular “head” at its amino end, whichextends into a “tail” about 150 nm long inwhich the two chains are intertwined toform a superhelix. The small subunits are at-tached in the head area. Myosin is present as abundle of several hundred stacked moleculesin the form of a “thick myosin filament.” Thehead portion of the molecule acts as anATPase, the activity of which is modulatedby the small subunits.
Actin (42 kDa) is the most important com-ponent of the “thin filaments.” It represents ca.20–25% of the muscle proteins. F-actin is alsoan important component of the cytoskeleton(see p. 204). This filamentous polymer is heldin equilibrium with its monomer, G-actin. Theother protein components of muscle includetropomyosin and troponin. Tropomyosin
(64 kDa) attaches to F-actin as a rod-likedimer and connects approximately seven ac-tin units with each other. The heterotrimertroponin (78 kDa) is bound to one end oftropomyosin.
In addition to the above proteins, a numberof other proteins are also typical ofmuscle—including titin (the largest knownprotein), - and -actinin, desmin, andvimentin.
B. Mechanism of muscle contraction
The sliding filament model describes themechanism involved in muscle contraction.In this model, sarcomeres become shorterwhen the thin and thick filaments slide along-side each other and telescope together, withATP being consumed. During contraction, thefollowing reaction cycle is repeated severaltimes:
[1 ] In the initial state, the myosin heads areattached to actin. When ATP is bound, theheads detach themselves from the actin (the“plasticizing” effect of ATP).
[2 ] The myosin head hydrolyzes the boundATP to ADP and Pi, but initially withholds thetwo reaction products. ATP cleavage leads toallosteric tension in the myosin head.
[3 ] The myosin head now forms a newbond with a neighboring actin molecule.
[4 ] The actin causes the release of the Pi,and shortly afterwards release of the ADP aswell. This converts the allosteric tension inthe myosin head into a conformationalchange that acts like a rowing stroke.
The cycle can be repeated for as long as ATPis available, so that the thick filaments areconstantly moving along the thin filamentsin the direction of the Z disk. Each rowingstroke of the 500 or so myosin heads in a thickfilament produces a contraction of about10 nm. During strong contraction, the processis repeated about five times per second. Thisleads to the whole complex of thin filamentsmoving together; the H band becomes shorterand the Z lines slide closer together.
332 Tissues and organs
All rights reserved. Usage subject to terms and conditions of license.Koolman, Color Atlas of Biochemistry, 2nd edition © 2005 Thieme

OOCOOC
NH3
NH3
Z Z Z
P PA
AP P P
P
H2O
ATP
A. Organization of striated muscle
B. Mechanism of muscle contraction
Muscle Tendon
Nucleus
Muscle fiber
Z line
Actin
Thick myosin filament
Thin actin filament
Troponin Tropomyosin
Small subunits
Globular head
Myosin molecule
Bundle of muscle fibers
Center of thesarcomere
Myosin head relaxed
Power stroke
Actin
Myosin
Contact Myosin head contracted
Thinfilament
Thickfilament
Sarcomere
MyofibrilH zone A band I band
Z H
150 nm
4
3
2
15
333Muscle
All rights reserved. Usage subject to terms and conditions of license.Koolman, Color Atlas of Biochemistry, 2nd edition © 2005 Thieme

Control of muscle contraction
A. Neuromuscular junction
Muscle contraction is triggered by motorneurons that release the neurotransmitteracetylcholine (see p. 352). The transmitter dif-fuses through the narrow synaptic cleft andbinds to nicotinic acetylcholine receptors onthe plasma membrane of the muscle cell(the sarcolemma), thereby opening the ionchannels integrated into the receptors (seep. 222). This leads to an inflow of Na+, whichtriggers an action potential (see p. 350) in thesarcolemma. The action potential propagatesfrom the end plate in all directions and con-stantly stimulates the muscle fiber. With adelay of a few milliseconds, the contractilemechanism responds to this by contractingthe muscle fiber.
B. Sarcoplasmic reticulum (SR)
The action potential (A) produced at the neu-romuscular junction is transferred in themuscle cell into a transient increase in theCa2+ concentration in the cytoplasm of themuscle fiber (the sarcoplasm).
In the resting state, the Ca2+ level in thesarcoplasm is very low (less than 10–7 M). Bycontrast, the sarcoplasmic reticulum (SR),which corresponds to the ER, contains Ca2+
ions at a concentration of about 10–3 M. TheSR is a branched organelle that surrounds themyofibrils like a net stocking inside themuscle fibers (illustrated at the top usingthe example of a heart muscle cell). The highCa2+ level in the SR is maintained by Ca2+-transporting ATPases (see p. 220). In addition,the SR also contains calsequestrin, a protein(55 kDa) that is able to bind numerous Ca2+ -ions via acidic amino acid residues.
The transfer of the action potential to the SRis made possible by transverse tubules (T tu-bules), which are open to the extracellular spaceand establish a close connection with the SR.There is a structure involved in the contact be-tween the T tubule and the SR that was formerlyknown as the “SR foot” (it involves parts of theryanodine receptor; see p. 386).
At the point of contact with the SR, theaction potential triggers the opening of theCa2+ channels on the surface of the sarco-lemma. Calcium ions then leave the SR and
enter the sarcoplasm, where they lead to arapid increase in Ca2+ concentrations. This inturn causes the myofibrils to contract (C).
C. Regulation by calcium ions
In relaxed skeletal muscle, the complex con-sisting of troponin and tropomyosin blocksthe access of the myosin heads to actin (seep. 332). Troponin consists of three differentsubunits (T, C, and I). The rapid increase incytoplasmic Ca2+ concentrations caused byopening of the calcium channels in the SRleads to binding of Ca2+ to the C subunit oftroponin, which closely resembles calmodulin(see p. 386). This produces a conformationalchange in troponin that causes the whole tro-ponin–tropomyosin complex to slip slightlyand expose a binding site for myosin (red).This initiates the contraction cycle. After con-traction, the sarcoplasmic Ca2+ concentrationis quickly reduced again by active transportback into the SR. This results in troponin los-ing the bound Ca2+ ions and returning to theinitial state, in which the binding site for my-osin on actin is blocked. It is not yet clearwhether the mechanism described above isthe only one that triggers binding of myosinto actin.
When triggering of contraction in striatedmuscle occurs, the following sequence ofprocesses thus takes place:1. The sarcolemma is depolarized.2. The action potential is signaled to Ca2+
channels in the SR.3. The Ca2+ channels open and the Ca2+ level
in the sarcoplasm increases.4. Ca2+ binds to troponin C and triggers a
conformational change.5. Troponin causes tropomyosin to slip, and
the myosin heads bind to actin.6. The actin–myosin cycle takes place and the
muscle fibers contract.
Conversely, at the end of contraction, the fol-lowing processes take place:1. The Ca2+ level in the sarcoplasm declines
due to transport of Ca2+ back into the SR.2. Troponin C loses Ca2+ and tropomyosin re-
turns to its original position on the actinmolecule.
3. The actin–myosin cycle stops and themuscle relaxes.
334 Tissues and organs
All rights reserved. Usage subject to terms and conditions of license.Koolman, Color Atlas of Biochemistry, 2nd edition © 2005 Thieme

P PA PA
P P P
Ca2
Ca2 =10-3M
P PA PA
P P P
P PA
P
AP P P
TC
I
T
I
Ca2Ca2
A. Neuromuscular junction
C. Regulation by calcium ions
B. Sarcoplasmatic reticulum (SR)Transverse tubule Sarcoplasmic reticulum
T tubule
Ca2 <10-7M
SR foot
Ca2 channel
Calsequestrin
SR
Extracellularspace
Cytoplasm
TroponinMyosin-bindingsite onactinblocked
Actin
Tropomyosin Myosin head
Ca2
exposesmyosin-bindingsite onactin
Motoneuron
End plate
Action potential
Nucleus
Muscle fiber
Depolarizationof membranecausesopening ofCa2 -channels
335Muscle
All rights reserved. Usage subject to terms and conditions of license.Koolman, Color Atlas of Biochemistry, 2nd edition © 2005 Thieme

Muscle metabolism I
Muscle contraction is associated with a highlevel of ATP consumption (see p. 332). With-out constant resynthesis, the amount of ATPavailable in the resting state would be used upin less than 1 s of contraction.
A. Energy metabolism in the white and redmuscle fibers
Muscles contain two types of fibers, the pro-portions of which vary from one type ofmuscle to another. Red fibers (type I fibers)are suitable for prolonged effort. Their metab-olism is mainly aerobic and therefore dependson an adequate supply of O2. White fibers(type II fibers) are better suited for fast, strongcontractions. These fibers are able to formsuf cient ATP even when there is little O2
available. With appropriate training, athletesand sports participants are able to change theproportions of the two fiber types in the mus-culature and thereby prepare themselves forthe physiological demands of their disciplinesin a targeted fashion. The expression of func-tional muscle proteins can also change duringthe course of training.
Red fibers provide for their ATP require-ments mainly (but not exclusively) from fattyacids, which are broken down via β-oxidation,the tricarboxylic acid cycle, and the respira-tory chain (right part of the illustration). Thered color in these fibers is due to the mono-meric heme protein myoglobin, which theyuse as an O2 reserve. Myoglobin has a muchhigher af nity for O2 than hemoglobin andtherefore only releases its O2 when there isa severe drop in O2 partial pressure(cf. p. 282).
At a high level of muscular effort—e. g.,during weightlifting or in very fast contrac-tions such as those carried out by the eyemuscles—the O2 supply from the bloodquickly becomes inadequate to maintain theaerobic metabolism. White fibers (left part ofthe illustration) therefore mainly obtain ATPfrom anaerobic glycolysis. They have suppliesof glycogen from which they can quickly re-lease glucose-1-phosphate when needed (seep. 156). By isomerization, this gives rise toglucose-6-phosphate, the substrate for glycol-ysis. The NADH+H+ formed during glycolysishas to be reoxidized into NAD+ in order to
maintain glucose degradation and thus ATPformation. If there is a lack of O2, this isachieved by the formation of lactate, whichis released into the blood and is resynthesizedinto glucose in the liver (Cori cycle; seep. 338).
Muscle-specific auxiliary reactions for ATPsynthesis exist in order to provide additionalATP in case of emergency. Creatine phosphate(see B) acts as a buffer for the ATP level.Another ATP-supplying reaction is catalyzedby adenylate kinase [1] (see also p. 72). Thisdisproportionates two molecules of ADP intoATP and AMP. The AMP is deaminated intoIMP in a subsequent reaction [2] in order toshift the balance of the reversible reaction [1]in the direction of ATP formation.
B. Creatine metabolism
Creatine (N-methylguanidoacetic acid) and itsphosphorylated form creatine phosphate(a guanidophosphate) serve as an ATP bufferin muscle metabolism. In creatine phosphate,the phosphate residue is at a similarly highchemical potential as in ATP and is thereforeeasily transferred to ADP. Conversely, whenthere is an excess of ATP, creatine phosphatecan arise from ATP and creatine. Both proce-sses are catalyzed by creatine kinase [5].
In resting muscle, creatine phosphateforms due to the high level of ATP. If there isa risk of a severe drop in the ATP level duringcontraction, the level can be maintained for ashort time by synthesis of ATP from creatinephosphate and ADP. In a nonenzymatic reac-tion [6], small amounts of creatine and crea-tine phosphate cyclize constantly to form cre-atinine, which can no longer be phosphory-lated and is therefore excreted with the urine(see p. 324).
Creatine does not derive from the musclesthemselves, but is synthesized in two steps inthe kidneys and liver (left part of the illustra-tion). Initially, the guanidino group of argi-nine is transferred to glycine in the kidneys,yielding guanidino acetate [3]. In the liver,N-methylation of guanidino acetate leads tothe formation of creatine from this [4]. Thecoenzyme in this reaction is S-adenosyl methi-onine (SAM; see p.110).
336 Tissues and organs
All rights reserved. Usage subject to terms and conditions of license.Koolman, Color Atlas of Biochemistry, 2nd edition © 2005 Thieme

AP P P
CO2
2+
H2O 2+
N A
ATP
ADP
NADH + H +
CO2
1
2
ADPADP
N A
N A
NADH + H +
NAD +
O2
O2
P PA
PA
AMP IMP
PI
NH3
2
4
5
6
3
4
AP P P P P
A
6 6
5
1
3
Orn
Arg
N
H2CC
O
NHC
HN
3C
P
O
OHO
N
H2CC
O
NH2C
NH2
H3C
O
N
H2CC
O
NH2C
NH2
H
O
N
H2CC
N
O
CH3C NH2
H
O
Tricarboxylicacid cycle
Cori cycle(liver)
Ketonebodies
Liver
β-Oxidation
Myoglobin
Glucose
Glycolysis
A. Energy metabolism in the white and red muscle fibers
B. Creatine metabolism
Red (fast) fibers, aerobic
AMP deaminase3.5.4.6
Adenylate kinase2.7.4.3
Creatinephosphate
Creatine
Acetyl CoA
Glycogen
Creatine
Creatinine
Guanidinoacetate
S-adenosylhomocysteine
S-adenosylmethionine
Glycine
Glycineamidinotransferase2.1.4.1
Guanidinoacetatemethyltransferase2.1.1.2
Creatinekinase 2.7.3.2
Not-enzymatic
Creatine
Creatine
Blood
Guanidino-acetate
Kidney
Creatinephosphate
Contraction
Fatty acids
Glucose
Muscle
Respiratory chain
PyruvateLactate
White (slow) fibers, anaerobic
337Muscle
All rights reserved. Usage subject to terms and conditions of license.Koolman, Color Atlas of Biochemistry, 2nd edition © 2005 Thieme

Muscle metabolism II
A. Cori and alanine cycle
White muscle fibers (see p. 336) mainly ob-tain ATP from anaerobic glycolysis—i. e., theyconvert glucose into lactate. The lactate aris-ing in muscle and, in smaller quantities, itsprecursor pyruvate are released into theblood and transported to the liver, where lac-tate and pyruvate are resynthesized into glu-cose again via gluconeogenesis, with ATP beingconsumed in the process (see p. 154). Theglucose newly formed by the liver returnsvia the blood to the muscles, where it can beused as an energy source again. This circula-tion system is called the Cori cycle, after theresearchers who first discovered it. There isalso a very similar cycle for erythrocytes,which do not have mitochondria and there-fore produce ATP by anaerobic glycolysis (seep. 284).
The muscles themselves are not capable ofgluconeogenesis. Nor would this be useful, asgluconeogenesis requires much more ATPthan is supplied by glycolysis. As O2 deficien-cies do not arise in the liver even during in-tensive muscle work, there is always suf -cient energy there available for gluconeogen-esis.
There is also a corresponding circulationsystem for the amino acid alanine. The alaninecycle in the liver not only provides alanine asa precursor for gluconeogenesis, but alsotransports to the liver the amino nitrogenarising in muscles during protein degrada-tion. In the liver, it is incorporated into ureafor excretion.
Most of the amino acids that arise inmuscle during proteolysis are converted intoglutamate and 2-oxo acids by transamination(not shown; cf. p.180). Again by transamina-tion, glutamate and pyruvate give rise to ala-nine, which after glutamine is the second im-portant form of transport for amino nitrogenin the blood. In the liver, alanine and 2-oxo-glutarate are resynthesized into pyruvate andglutamate (see p. 178). Glutamate suppliesthe urea cycle (see p. 182), while pyruvate isavailable for gluconeogenesis.
B. Protein and amino acid metabolism
The skeletal muscle is the most important sitefor degradation of the branched-chain aminoacids (Val, Leu, Ile; see p. 414), but other aminoacids are also broken down in the muscles.Alanine and glutamine are resynthesizedfrom the components and released into theblood. They transport the nitrogen that arisesduring amino acid breakdown to the liver(alanine cycle; see above) and to the kidneys(see p. 328).
During periods of hunger, muscle proteinsserve as an energy reserve for the body. Theyare broken down into amino acids, which aretransported to the liver. In the liver, the car-bon skeletons of the amino acids are con-verted into intermediates in the tricarboxylicacid cycle or into acetoacetyl-CoA (see p. 175).These amphibolic metabolites are then avail-able to the energy metabolism and for gluco-neogenesis. After prolonged starvation, thebrain switches to using ketone bodies in orderto save muscle protein (see p. 356).
The synthesis and degradation of muscleproteins are regulated by hormones. Cortisolleads to muscle degradation, while testo-sterone stimulates protein formation. Syn-thetic anabolics with a testosterone-like ef-fect have repeatedly been used for dopingpurposes or for intensive muscle-building.
Further information
Smooth muscle differs from skeletal muscle invarious ways. Smooth muscles—which arefound, for example, in blood vessel wallsand in the walls of the intestines—do notcontain any muscle fibers. In smooth-musclecells, which are usually spindle-shaped, thecontractile proteins are arranged in a less reg-ular pattern than in striated muscle. Contrac-tion in this type of muscle is usually notstimulated by nerve impulses, but occurs ina largely spontaneous way. Ca2+ (in the formof Ca2+-calmodulin; see p. 386) also activatescontraction in smooth muscle; in this case,however, it does not affect troponin, but acti-vates a protein kinase that phosphorylates thelight chains in myosin and thereby increasesmyosin’s ATPase activity. Hormones such asepinephrine and angiotensin II (see p. 330)are able to influence vascular tonicity in thisway, for example.
338 Tissues and organs
All rights reserved. Usage subject to terms and conditions of license.Koolman, Color Atlas of Biochemistry, 2nd edition © 2005 Thieme

6 ATP 2 ATP
3
1
2
4
1
2
4
2
N A
N A
N A
N A
33
TestosteroneAnabolicagents
Glucose 6 Glucose 6
Liver Blood Muscle
Glucose Glucose3.70-5.18
mM
Pyruvate0.02-0.07
mM
Lactate0.74-2.40
mM
Aminoacids
Alanine Alanine0.33-0.61
mM
Glycolysis
Transamination
Lactate dehydrogenase1.1.1.27Gluconeogenesis
Storage
Glycogen
NADH/NAD+quotient high
NADH/NAD+quotient low
Alanine cycle
Cori cycle
Protein
A. Cori and alanine cycle
B. Protein and amino acid metabolism
Plasmaconcentration
Protein
Blood Muscle
Cortisol
Amino acids
Energy gain
Energyreserve inprolongedhunger
Muscle breaksdownbranched-chainamino acids
Degradation
Amino acidsAla, Gln
Synthesis
Ile0.08mM
Leu0.16mM
Val0.25mM
Gln0.65mM
Ala0.42mM
[NH2]
Glucose
Pyruvate
Lactate Lactate
Alanine
P
Pyruvate
Urea
Plasma concentration in adults
Glycogen P
Tri-carboxylic
acidcycle
[NH2]
339Muscle
All rights reserved. Usage subject to terms and conditions of license.Koolman, Color Atlas of Biochemistry, 2nd edition © 2005 Thieme

Bone and teeth
The family of connective-tissue cells includesfibroblasts, chondrocytes (cartilage cells), andosteoblasts (bone-forming cells). They are spe-cialized to secrete extracellular proteins, par-ticularly collagens, and mineral substances,which they use to build up the extracellularmatrix (see p. 346). By contrast, osteoclastsdissolve bone matter again by secreting H+
and collagenases (see p. 342).
A. Bone
Bone is an extremely dense, specialized formof connective tissue. In addition to its suppor-tive function, it serves to store calcium andphosphate ions. In addition, blood cells areformed in the bone marrow. The most impor-tant mineral component of bone is apatite, aform of crystalline calcium phosphate.
Apatites are complexes of cationic Ca2+
matched by HPO42–, CO3
2–, OH–, or F– asanions. Depending on the counter-ion, apatitecan occur in the forms carbonate apatiteCa10(PO4)6CO3, as hydroxyapatite Ca10(PO4)6
(OH)2, or fluoroapatite Ca10(PO4)6F2. In addi-tion, alkaline earth carbonates also occur inbone. In adults, more than 1 kg calcium isstored in bone.
Osteoblast and osteoclast activity is con-stantly incorporating Ca2+ into bone and re-moving it again. There are various hormonesthat regulate these processes: calcitonin in-creases deposition of Ca2+ in the bone matrix,while parathyroid hormone (PTH) promotesthe mobilization of Ca2+, and calcitriol im-proves mineralization (for details, see p. 342).
The most important organic components ofbone are collagens (mainly type I; see p. 344)and proteoglycans (see p. 346). These formthe extracellular matrix into which the apa-tite crystals are deposited (biomineralization).Various proteins are involved in this not yetfully understood process of bone formation,including collagens and phosphatases. Alka-line phosphatase is found in osteoblasts andacid phosphatase in osteoclasts. Both of theseenzymes serve as marker enzymes for bonecells.
B. Teeth
The illustration shows a longitudinal sectionthrough an incisor, one of the 32 permanentteeth in humans. The majority of the toothconsists of dentine. The crown of the toothextends beyond the gums, and it is covered inenamel. By contrast, the root of the tooth iscoated in dental cement.
Cement, dentin, and enamel are bone-likesubstances. The high proportion of inorganicmatter they contain (about 97% in the dentalenamel) gives them their characteristic hard-ness. The organic components of cement,dentin, and enamel mainly consist of collagensand proteoglycans; their most important min-eral component is apatite, as in bone (seeabove).
A widespread form of dental disease, ca-ries, is caused by acids that dissolve the min-eral part of the teeth by neutralizing the neg-atively charged counter-ions in apatite (seeA). Acids occur in food, or are produced bymicroorganisms that live on the surfaces ofthe teeth (e. g., Streptococcus mutans).
The main product of anaerobic degradationof sugars by these organisms is lactic acid.Other products of bacterial carbohydrate me-tabolism include extracellular dextrans (seep. 40)—insoluble polymers of glucose thathelp bacteria to protect themselves from theirenvironment. Bacteria and dextrans are com-ponents of dental plaque, which forms on in-adequately cleaned teeth. When Ca2+ saltsand other minerals are deposited in plaqueas well, tartar is formed.
The most important form of protectionagainst caries involves avoiding sweet sub-stances (foods containing saccharose, glucose,and fructose). Small children in particularshould not have very sweet drinks freelyavailable to them. Regular removal of plaqueby cleaning the teeth and hardening of thedental enamel by fluoridization are also im-portant. Fluoride has a protective effect be-cause fluoroapatite (see A) is particularly re-sistant to acids.
340 Tissues and organs
All rights reserved. Usage subject to terms and conditions of license.Koolman, Color Atlas of Biochemistry, 2nd edition © 2005 Thieme

Ca2
Calcitonin
Parathyroid hormone
Hormonesof the calciummetabolism
A. Bone
B. Teeth
DentalenamelSaccharose
GlucoseFructose
Lactic acidPropionic acidAcetic acidButyric acid
BacteriumE.g.,Streptococcusmutans Calcium
salts
Attackapatite
Protectbacteria
De-mineral-ization
Anaerobicmetabolism
Dentalplaque
Crown
Dentalenamel
Dextrans
Plaque
Bacterium
Root
Neck
Hardest substancein the body
Dextrans
Sugar
Acids
Functions: Composition:
Hydroxyapatite Ca10(PO4)6(OH)2
Ca2in plasma
Absence leadsto rickets Calcitriol
Organic Type I collagen Proteoglycans Phosphatases
Inorganic Apatite Carbonate Water
Mechanical supportStorage for Ca2and phosphateSynthesis of blood cellsMaturation of B cells
Inorganiccomponents
O
Ca
P
OH
Dental enamelDentinCementJawbone
97%70%65%45%
341Connective tissue
All rights reserved. Usage subject to terms and conditions of license.Koolman, Color Atlas of Biochemistry, 2nd edition © 2005 Thieme

Calcium metabolism
A. Functions of calcium
The human body contains 1–1.5 kg Ca2+, mostof which (about 98%) is located in the mineralsubstance of bone (see p. 362).
In addition to its role as a bone component,calcium functions as a signaling substance.Ca2+ ions act as second messengers in signaltransduction pathways (see p. 386), theytrigger exocytosis (see p. 228) and musclecontraction (see p. 334), and they are indis-pensable as cofactors in blood coagulation (seep. 290). Many enzymes also require Ca2+ fortheir activity. The intracellular and extracel-lular concentrations of Ca2+ are strictly regu-lated in order to make these functions possi-ble (see B, C, and p. 388).
Proteins bind Ca2+ via oxygen ligands, par-ticularly carboxylate groups and carbonylgroups of peptide bonds. This also applies tothe structure illustrated here, in which a Ca2+
ion is coordinated by the oxygen atoms ofcarboxylate and acid amide groups.
B. Bone remodeling
Deposition of Ca2+ in bone (mineralization)and Ca2+ mobilization from bone are regu-lated by at least 15 hormones and hormone-like signaling substances. These mainly influ-ence the maturation and activity of bone cells.
Osteoblasts (top) deposit collagen, as wellas Ca2+ and phosphate, and thereby createnew bone matter, while osteoclasts (bottom)secrete H+ ions and collagenases that locallydissolve bone (bone remodeling). Osteoblastsand osteoclasts mutually activate each otherby releasing cytokines (see p. 392) andgrowth factors. This helps keep bone forma-tion and bone breakdown in balance.
The Ca2+-selective hormones calcitriol, par-athyroid hormone, and calcitonin influencethis interaction in the bone cells. Parathyroidhormone promotes Ca2+ release by promotingthe release of cytokines by osteoblasts. Inturn, the cytokines stimulate the develop-ment of mature osteoclasts from precursorcells (bottom). Calcitonin inhibits this process.At the same time, it promotes the develop-ment of osteoblasts (top). Osteoporosis, whichmainly occurs in women following the men-opause, is based (at least in part) on a reduc-
tion in estrogen levels. Estrogens normallyinhibit the stimulation of osteoclast differen-tiation by osteoblasts. If the effects of estrogendecline, the osteoclasts predominate and ex-cess bone removal occurs.
The effects of the steroid hormone calcitriol(see p. 330) in bone are complex. On the onehand, it promotes bone formation by stimu-lating osteoblast differentiation (top). This isparticularly important in small children, inwhom calcitriol deficiency can lead to miner-alization disturbances (rickets; see p. 364). Onthe other hand, calcitriol increases blood Ca2+
levels through increased Ca2+ mobilizationfrom bone. An overdose of vitamin D (chole-calciferol), the precursor of calcitriol, cantherefore have unfavorable effects on theskeleton similar to those of vitamin deficiency(hypervitaminosis; see p. 364).
C. Calcium homeostasis
Ca2+ metabolism is balanced in healthy adults.Approximately 1g Ca2+ is taken up per day,about 300 mg of which is resorbed. The sameamount is also excreted again. The amounts ofCa2+ released from bone and deposited in itper day are much smaller. Milk and milk prod-ucts, especially cheese, are particularly rich incalcium.
Calcitriol and parathyroid hormone, on theone hand, and calcitonin on the other, ensurea more or less constant level of Ca2+ in theblood plasma and in the extracellular space(80–110 mg 2.0–2.6 mM). The peptide para-thyroid hormone (PTH; 84 AA) and the steroidcalcitriol (see p. 374) promote direct or indi-rect processes that raise the Ca2+ level inblood. Calcitriol increases Ca2+ resorption inthe intestines and kidneys by inducing trans-porters. Parathyroid hormone supports theseprocesses by stimulating calcitriol biosynthe-sis in the kidneys (see p. 330). In addition, itdirectly promotes resorption of Ca2+ in thekidneys (see p. 328) and Ca2+ release frombone (see B). The PTH antagonist calcitonin(32 AA) counteracts these processes.
342 Tissues and organs
All rights reserved. Usage subject to terms and conditions of license.Koolman, Color Atlas of Biochemistry, 2nd edition © 2005 Thieme

CO2
Ca2
HCO3
H
H2O
H
Ca2
Ca2
Ca2
A. Functions of calcium
Calcitriol
Calcitonin
Osteoblast
Hydroxy-apatite
Collagen I
Osteoclast
Calci-tonin Calcitriol Stock
oder
Bone
Calci-triol
Parathyroidhormone
Kidney
B. Bone remodeling
Mineralization
Signaltransduction
Musclecon-traction
Nerveconduction
complex
Proteinfunction
Hydroxy-apatite
Calci-tonin
Parathyroidhormone
Intestine Blood
Filtration
Resorption
Precursorcells
Precursorcells
Growthfactors
Estrogens
Calcitonin
Parathyroidhormone
Cyto-kinesExocytosis
C. Calcium homeostasis
500 mg · d-1
500 mg · d-1
10 000 mg · d-1
9 850 mg · d-1
150 mg·d-1
1000000 mg600 – 900mg
1000 mg · d-1
300mg · d-1
till 150mg · d-1
850mg · d-1
Parathyroid hormone
Calcitriol
343Connective tissue
All rights reserved. Usage subject to terms and conditions of license.Koolman, Color Atlas of Biochemistry, 2nd edition © 2005 Thieme

Collagens
Collagens are quantitatively the most abun-dant of animal proteins, representing 25% ofthe total. They form insoluble tensile fibersthat occur as structural elements of the ex-tracellular matrix and connective tissuethroughout the body. Their name (which lit-erally means “glue-producers”) is derivedfrom the gelatins that appear as a decompo-sition product when collagen is boiled.
A. Structure of collagens
Nineteen different collagens are now known,and they are distinguished using roman nu-merals. They mostly consist of a dextro-rotatory triple helix made up of three poly-peptides (α-chains) (see p. 70).
The triplet Gly-X-Y is constantly repeated inthe sequence of the triple-helical regions—i. e., every third amino acid in such sequencesis a glycine. Proline (Pro) is frequently found inpositions X or Y; the Y position is often occu-pied by 4-hydroxyproline (4Hyp), although3-hydroxyproline (3Hyp) and 5-hydroxylysine(5Hyl) also occur. These hydroxylated aminoacids are characteristic components of colla-gen. They are only produced after proteinbiosynthesis by hydroxylation of the aminoacids in the peptide chain (see p. 62).
The formation of Hyp and Hyl residues inprocollagen is catalyzed by iron-containingoxygenases (“proline and lysine hydrox-ylase,” EC 1.14.11.1/2). Ascorbate is requiredto maintain their function. Most of the symp-toms of the vitamin C deficiency diseasescurvy (see p. 368) are explained by disturbedcollagen biosynthesis.
The hydroxyproline residues stabilize thetriple helix by forming hydrogen bonds be-tween the α-chains, while the hydroxylgroups of hydroxylysine are partly glycosy-lated with a disaccharide (–Glc–Gal).
The various types of collagen consist ofdifferent combinations of α-chains (α1 to α3and other subtypes). Types I, II, and III repre-sent 90% of collagens. The type I collagenshown here has the structure [α1(I)]2α2(1).
Numerous tropocollagen molecules (mass285 kDa, length 400 nm) aggregate extracell-ularly into a defined arrangement, formingcylindrical fibrils (20–500 nm in diameter).Under the electron microscope, these fibrils
are seen to have a characteristic banding pat-tern of elements that are repeated every64–67 nm.
Tropocollagen molecules are firmly linkedtogether, particularly at their ends, by cova-lent networks of altered lysine side chains.The number of these links increases withage. Type IV collagens form networks with adefined mesh size. The size-selective filteringeffect of the basal membranes in the renalglomeruli is based on this type of structure(see p. 322).
B. Biosynthesis
The precursor molecule of collagen (prepro-collagen), formed in the rER, is subject toextensive post-translational modifications(see p. 232) in the ER and Golgi apparatus.
Cleavage of the signal peptide gives rise toprocollagen, which still carries large propep-tides at each end [1]. During this phase, mostproline residues and some lysine residues ofprocollagen are hydroxylated [2]. The procol-lagen is then glycosylated at hydroxylysineresidues [3]. Intramolecular and intermolecu-lar disulfide bonds form in the propeptides[4], allowing correct positioning of the pep-tide strands to form a triple helix [5]. It is onlyafter these steps have been completed thatprocollagen is secreted into the extracellularspace by exocytosis. This is where the N- andC-terminal propeptides are removed proteo-lytically [6], allowing the staggered aggrega-tion of the tropocollagen molecules to formfibrils [7]. Finally, several ε-amino groups inlysine residues are oxidatively converted intoaldehyde groups [8]. Covalent links betweenthe molecules then form as a result of con-densation [9]. In this way, the fibrils reachtheir final structure, which is characterizedby its high tensile strength and proteinase re-sistance.
344 Tissues and organs
All rights reserved. Usage subject to terms and conditions of license.Koolman, Color Atlas of Biochemistry, 2nd edition © 2005 Thieme

– Gly – X – Y – Gly – X – Y – Gly – X – Y –
N
CHC
C
C
C OH2
H2HO
H
N
CHC
C
CH2
H2
H2
C O
CH2
NH
HN
C O
C CH
CO
2 CH2 C CH2 NH3
OH
H
Gene
Pre-procollagen
Intracellularproteinmodification
Collagen fibril
Procollagen-proline 4-dioxygenase 1.14.11.2[ascorbate, Fe]Procollagen-lysine 5-dioxygenase 1.14.11.4[ascorbate, Fe]
Protein-lysine 6-oxidase 1.4.3.13 [Cu]
Exocytosis
Procollagen
Transcription
Translation
A. Structure of collagens B. Biosynthesis
Type I tropocollagen ~285 kDa
Overlap GapD = 64 - 67 nm 40 nm
Collagen fibril (section)
Diameter1.5 nm
Length 400 nm
20-5
00 n
m
Cross-linking to form supramolecules
Oxidation of Lys and 5Hyl to aldehydes
Staggered deposition to form fibrils
Removal of the propeptide
Assemblage to form triple helix
Oxidation of Cys in propeptides
Glycosylation of 5Hyl and Asn
Hydroxylation of Pro and Lys residues
Removal of the prepeptide
Special amino acids:4-Hydroxyproline (4Hyp)3-Hydroxyproline (3Hyp)5-Hydroxylysine (5Hyl)
Primary structureBasic unit
Extracellularproteinmodification
1
2
3
9
8
7
6
5
4
3
2
1
1 2
3
12345
6
7
8
9
Hyp = Y
Pro = X
Gly
Hyl
345Connective tissue
All rights reserved. Usage subject to terms and conditions of license.Koolman, Color Atlas of Biochemistry, 2nd edition © 2005 Thieme

Extracellular matrix
A. Extracellular matrix
The space between the cells (the interstitium)is occupied by a substance with a complexcomposition known as the extracellularmatrix (ECM). In many types of tissue—e. g.,muscle and liver—the ECM is only a narrowborder between the cells, while in others itforms a larger space. In connective tissue,cartilage, and bone, the ECM is particularlystrongly marked and is actually the functionalpart of the tissue (see p. 340). The illustrationshows the three main constituents of the ex-tracellular matrix in a highly schematic way:collagen fibers, network-forming adhesiveproteins, and space-filling proteoglycans.
The ECM has a very wide variety of func-tions: it establishes mechanical connectionsbetween cells; it creates structures with spe-cial mechanical properties (as in bone, carti-lage, tendons, and joints); it creates filters(e. g., in the basal membrane in the renal cor-puscles; see p. 322); it separates cells and tis-sues from each other (e. g., to allow the jointsto move freely); and it provides pathways toguide migratory cells (important for embry-onic development). The chemical composi-tion of the ECM is just as diverse as its func-tions.
Collagens (see p. 344), of which there areat least 19 different varieties, form fibers, fi-brils, networks, and ligaments. Their charac-teristic properties are tensile strength andflexibility. Elastin is a fiber protein with ahigh degree of elasticity.
Adhesive proteins provide the connectionsbetween the various components of the ex-tracellular matrix. Important representativesinclude laminin and fibronectin (see B). Thesemultifunctional proteins simultaneously bindto several other types of matrix component.Cells attach to the cell surface receptors in theECM with the help of the adhesive proteins.
Due to their polarity and negative charge,proteoglycans (see C) bind water moleculesand cations. As a homogeneous “cement,”they fill the gaps between the ECM fibers.
B. Fibronectins
Fibronectins are typical representatives ofadhesive proteins. They are filamentousdimers consisting of two related peptidechains (each with a mass of 250 kDa) linkedto each other by disulfide bonds. The fibro-nectin molecules are divided into differentdomains, which bind to cell-surface receptors,collagens, fibrin, and various proteoglycans.This is what gives fibronectins their “molec-ular glue” characteristics.
The domain structure in fibronectins ismade up of a few types of peptide modulethat are repeated numerous times. Each ofthe more than 50 modules is coded for byone exon in the fibronectin gene. Alternativesplicing (see p. 246) of the hnRNA transcript ofthe fibronectin gene leads to fibronectins withdifferent compositions. The module that cau-ses adhesion tocellscontainsthe characteristicamino acid sequence –Arg–Gly–Asp–Ser–. It isthese residues that enable fibronectin to bindto cell-surface receptors, known as integrins.
C. Proteoglycans
Proteoglycans are giant molecule complexesconsisting of carbohydrates (95%) and pro-teins (5%), with masses of up to 2 106 Da.Their bottlebrush-shaped structure is pro-duced by an axis consisting of hyaluronate.This thread-like polysaccharide (see p. 44)has proteins attached to it, from which inturn long polysaccharide chains emerge. Likethe central hyaluronate, these terminal poly-saccharides belong to the glycosaminoglycangroup (see p. 44).
The glycosaminoglycans are made up ofrepeating disaccharide units, each of whichconsists of one uronic acid (glucuronic acidor iduronic acid) and one amino sugar (N-acetylglucosamine or N-acetylgalactosamine)(see p. 38). Many of the amino sugars are alsoesterified with sulfuric acid (sulfated), furtherincreasing their polarity. The proteoglycansbind large amounts of water and fill thegaps between the fibrillar components ofthe ECM in the form of a hydrated gel. Thisinhibits the spread of pathogens in the ECM,for example.
346 Tissues and organs
All rights reserved. Usage subject to terms and conditions of license.Koolman, Color Atlas of Biochemistry, 2nd edition © 2005 Thieme

100 nm
GlcUA
GlcNAc
GlcNAc
GlcUA
GalUA
IduUA GalNAc
GalNAc
–Arg–Gly–Asp–Ser–
N C
N Cs ss s
O
OH
OH
H
H
H O
HN
H
H
HOH
HH H
OO
H2CCOO
C CH3
O
O SO3
O
OH
HN
H
H
HO
OH
H
H
HO
HH
O
H
COO
O
H2C
C CH3
O
O SO3
O
OH
OH
H
H
H O
HN
H
H
OH
HH H
O
CH2OHH
C CH3
O
COO
O3S
O
O
OH
OH
H
H
H O
HN
H
H
HH
HH HO
O
CH2OHCOO
C CH3
O
O
33
O
OH
O
H
H
H H O
OH
HN
H
H
H H
H2CCOO
SOO O
O SO3
SO
Collagens(at least19 differenttypes)
Cell membrane
Cell surfacereceptors(Integrins)
Adhesiveproteins:Elastin, laminin,fibronectin
Proteoglycansandhyaluronic acid
A. Extracellular matrix
C. Proteoglycans
B. Fibronectins
Core protein
Ribosomeforcomparison
Glycosamino-glycans
Hyaluronate
20 – 40Disaccharideunits
Disaccharide units– Uronic acid – Amino sugar –
Dermatansulfate
Keratansulfate
Chondroitin6-sulfate
GlcUAGalNAc
Heparin
IduUA
= N-Acetyl-= galactosamine
= Glucuronate
GlcNAc = N-Acetyl-= glucosamine
= Iduronate
Heparan sulfateCollagens IntegrinsFibrin
Peptide modules Variable peptides
Heparane sulfate FibrinDomains
347Connective tissue
All rights reserved. Usage subject to terms and conditions of license.Koolman, Color Atlas of Biochemistry, 2nd edition © 2005 Thieme

Signal transmission in the CNS
A. Structure of nerve cells
Nerve cells (neurons) are easily excitable cellsthat produce electrical signals and can react tosuch signals as well. Their structure is mark-edly different from that of other types of cell.Numerous branching processes project fromtheir cell body (soma). Neurons are able toreceive signals via dendrites and to passthem on via axons. The axons, which can beup to 1 m long, are usually surrounded bySchwann cells, which cover them with alipid-rich myelin sheath to improve theirelectrical insulation.
The transfer of stimuli occurs at thesynapses, which link the individual neuronsto each other as well as linking neurons func-tionally to muscle fibers. Neurotransmitters(see p. 352) are stored in the axonal nerveendings. These signaling substances are re-leased in response to electrical signals in or-der to excite neighboring neurons (or musclecells). It is estimated that each neuron in thebrain is in contact via synapses with approx-imately 10 000 other neurons.
There is a noticeably high proportion oflipids in the composition of nerve cells, rep-resenting about 50% of their dry weight. Inparticular, there is a very wide variety ofphospholipids, glycolipids, and sphingolipids(see p. 216).
B. Neurotransmitters and neurohormones
Neurosecretions are classed into two groups:neurotransmitters are released into the syn-aptic cleft in order to influence neighboringcells (C). They have a short range and a shortlifespan. By contrast, neurohormones are re-leased into the blood, allowing them to coverlarger distances. However, the distinction be-tween the two groups is a fluid one; someneurotransmitters simultaneously functionas neurohormones.
C. Synaptic signal transmission
All chemical synapses function according to asimilar principle. In the area of the synapse,the surface of the signaling cell (presynapticmembrane) is separated from the surface ofthe receiving cell (postsynaptic membrane)
only by a narrow synaptic cleft. When an ac-tion potential (see p. 350) reaches the presyn-aptic membrane, voltage-gated Ca2+ channelsintegrated into the membrane open andtrigger exocytosis of the neurotransmitterstored in the presynaptic cell (for details, seep. 228).
Each neuron usually releases only one typeof neurotransmitter. Neurons that releasedopamine are referred to as “dopaminergic,”for example, while those that release acetyl-choline are “cholinergic,” etc. The transmit-ters that are released diffuse through thesynaptic cleft and bind on the other side toreceptors on the postsynaptic membrane.These receptors are integral membrane pro-teins that have binding sites for neurotrans-mitters on their exterior (see p. 224).
The receptors for neurotransmitters aredivided into two large groups according tothe effect produced by binding of the trans-mitter (for details, see p. 354).
Ionotropic receptors (bottom left) areligand-gated ion channels. When they openas a result of the transmitter’s influence,ions flow in due to the membrane potential(see p. 126). If the inflowing ions are cations(Na+, K+, Ca2+), depolarization of the mem-brane occurs and an action potential is trig-gered on the surface of the postsynaptic cell.This is the way in which stimulatory trans-mitters work (e. g., acetylcholine and gluta-mate). By contrast, if anions flow in (mainlyCl–), the result is hyperpolarization of thepostsynaptic membrane, which makes theproduction of a postsynaptic action potentialmore dif cult. The action of inhibitory trans-mitters such as glycine and GABA is based onthis effect.
A completely different type of effect is ob-served in metabotropic receptors (bottomright). After binding of the transmitter, theseinteract on the inside of the postsynapticmembrane with G proteins (see p. 384), whichin turn activate or inhibit the synthesis ofsecond messengers. Finally, second messen-gers activate or inhibit protein kinases, whichphosphorylate cellular proteins and therebyalter the behavior of the postsynaptic cells(signal transduction; see p. 386).
348 Tissues and organs
All rights reserved. Usage subject to terms and conditions of license.Koolman, Color Atlas of Biochemistry, 2nd edition © 2005 Thieme

4
Ca2
Ca2
Ca2
1
23
3
2
Na
5
6
Cl
SM
Action potential
Voltage-gatedCa2 channel
Synaptic vesiclewith transmitter
Presynapticmembrane
Actionpotential
Opens voltage-gated calciumchannels
Synapticcleft
Neurotransmitter Neurohormone
Blood capillaryErythrocyte
Postsynaptic cell
Neuronal axon
Receptor
Myelin sheath Node of Ranvier
Dendrite
Axon
Synapses
Schwann cell
Nucleus
Axonterminals
A. Structure of nerve cells
A. Neurotransmitters and neurohormones
De-polarization
Hyper-polarization
Pre-cursor
Cellularresponse
Postsynapticmembrane
Secondmessenger
Enzyme
Cell body(Soma)
Ionotropicreceptor
Metabotropicreceptor
C. Synaptic signal transmission
349Brain and sensory organs
All rights reserved. Usage subject to terms and conditions of license.Koolman, Color Atlas of Biochemistry, 2nd edition © 2005 Thieme

Resting potential and actionpotential
A. Resting potential
A characteristic property of living cells is theuneven distribution of positively and nega-tively charged ions on the inside and outsideof the plasma membrane. This gives rise to amembrane potential (see p. 126)—i. e., there iselectrical voltage between the two sides ofthe membrane, which can only balance outwhen ion channels allow the unevenly distrib-uted ions to move.
At rest, the membrane potential in mostcells is –60 to –90 mV. It mainly arises fromthe activity of Na+/K+ transporting ATPase(“Na+/K+ ATPase”), which occurs on practicallyall animal cells. Using up ATP, this P-typeenzyme (see p. 220) “pumps” three Na+ ionsout of the cell in exchange for two K+ ions.Some of the K+ ions, following the concentra-tion gradient, leave the cell again throughpotassium channels. As the protein anionsthat predominate inside the cell cannot fol-low them, and inflow of Cl– ions from theoutside is not possible, the result is an excessof positive charges outside the cell, whileanions predominate inside it.
An equilibrium potential exists for each ofthe ions involved. This is the value of themembrane potential at which there is no netinflow or outflow of the ions concerned. ForK+ ions, the resting potential lies in the rangeof the membrane potential, while for Na+ ionsit is much higher at +70 mV. At the first op-portunity, Na+ ions will therefore spontane-ously flow into the cell. The occurrence ofaction potentials is based on this (see B).
Nerve cell membranes contain ion chan-nels for Na+, K+, Cl–, and Ca2+. These channelsare usually closed and open only briefly to letions pass through. They can be divided intochannels that are regulated by membrane po-tentials (“voltage-gated”—e. g., fast Na+ chan-nels; see p. 222) and those regulated byligands (“ligand-gated”—e. g., nicotinic acetyl-choline receptors; see p. 222).
B. Action potential
Action potentials are special signals that areused to transmit information in the nervoussystem. They are triggered by chemical stim-
uli (or more rarely electrical stimuli). Bindingof a neurotransmitter to an ionotropic recep-tor results in a brief local increase in themembrane potential from –60 mV to about+30 mV. Although the membrane potentialquickly returns to the initial value within afew milliseconds (ms) at its site of origin, thedepolarization is propagated because neigh-boring membrane areas are activated duringthis time period.
[1] The process starts with the opening ofvoltage-gated Na+ channels (see p. 222). Dueto their high equilibrium potential (see A), Na+
ions flow into the cell and reverse the localmembrane potential (depolarization).
[2] The Na+ channels immediately closeagain, so that the inflow of positive chargesis only very brief.
[3] Due to the increase in the membranepotential, voltage-dependent K+ channelsopen and K+ ions flow out. In addition, Na+/K+ ATPase (see A) pumps the Na+ ions thathave entered back out again. This leads torepolarization of the membrane.
[4] The two processes briefly lead to thecharge even falling below the resting poten-tial (hyperpolarization). The K+ channels alsoclose after a few milliseconds. The nerve cellis then ready for re-stimulation.
Generally, it is always only a very smallpart of the membrane that is depolarized dur-ing an action potential. The process can there-fore be repeated again after a short refractoryperiod, when the nerve cell is stimulatedagain. Conduction of the action potential onthe surface of the nerve cell is based on thefact that the local increase in the membranepotential causes neighboring voltage-gatedion channels to open, so that the membranestimulation spreads over the whole cell in theform of a depolarization wave.
350 Tissues and organs
All rights reserved. Usage subject to terms and conditions of license.Koolman, Color Atlas of Biochemistry, 2nd edition © 2005 Thieme

K
ClNaK
ClNa
P PAA
P P P
P
-60 mV-60 mV
1
1
(mV)
1 2 3
+40
+20
0
-20
-40
-60
-80
1
2
3
4
Na
KNa
K
1
Na
KNa
2
*
*
Na
KNa3
Na
KNa4
1 2 3
K
Na
K
KK
1
2
3
4
11
11
Chloridechannel
Extracellular space
Cytoplasm
Organicanions
Potassiumchannel
Na /K ATPase3.6.1.37
Sodiumchannel
Oftenopen
Usuallyclosed
A. Resting potential
B. Action potential
Charge reversalat membrane
Time (ms)
Mem
bran
e po
tent
ial Action potential
Depolarization
Resting potential
Hyperpolarization
*
Ion
cond
ucti
vity
Time (ms)
Organicanions
351Brain and sensory organs
All rights reserved. Usage subject to terms and conditions of license.Koolman, Color Atlas of Biochemistry, 2nd edition © 2005 Thieme

Neurotransmitters
Neurotransmitters in the strict sense are sub-stances that are produced by neurons, storedin the synapses, and released into the synap-tic cleft in response to a stimulus. At the post-synaptic membrane, they bind to special re-ceptors and affect their activity.
A. Important neurotransmitters
Neurotransmitters can be classified into sev-eral groups according to their chemical struc-ture. The table lists the most important rep-resentatives of this family, which has morethan 100 members.
Acetylcholine, the acetic acid ester of thecationic alcohol choline (see p. 50) acts atneuromuscular junctions, where it triggersmuscle contraction (see p. 334), and in certainparts of the brain and in the autonomousnervous system.
Several proteinogenic amino acids (seep. 60) have neurotransmitter effects. A partic-ularly important one is glutamate, which actsas a stimulatory transmitter in the CNS. Morethan half of the synapses in the brain areglutaminergic. The metabolism of glutamateand that of the amine GABA synthesized fromit (see below) are discussed in more detail onp. 356. Glycine is an inhibitory neurotransmit-ter with effects in the spinal cord and in partsof the brain.
Biogenic amines arise from amino acids bydecarboxylation (see p. 62). This group in-cludes 4-aminobutyrate (γ-aminobutyricacid, GABA), which is formed from glutamateand is the most important inhibitory trans-mitter in the CNS. The catecholamines norepi-nephrine and epinephrine (see B), serotonin,which is derived from tryptophan, and hista-mine also belong to the biogenic amine group.All of them additionally act as hormones ormediators (see p. 380).
Peptides make up the largest group amongthe neurosecretions. Many peptide hormo-nes—e. g., thyroliberin (TRH) and angiotensinII—simultaneously act as transmitters. Mostneuropeptides are small (3–15 AA). At theirN-terminus, many of them have a glutamateresidue that has been cyclized to formpyroglutamate (5-oxoproline, <G), while theC-terminus is often an acid amide (–NH2).
This provides better protection against break-down by peptidases.
Endorphins, dynorphins, and enkephalinsare a particularly interesting group of neuro-peptides. They act as “endogenous opiates” byproducing analgetic, sedative, and euphorianteffects in extreme situations. Drugs such asmorphine and heroin activate the receptorsfor these peptides (see p. 354).
Purine derivatives with neurotransmitterfunction are all derived from adenine-con-taining nucleotides or nucleosides. ATP is re-leased along with acetylcholine and othertransmitters, and among other functions itregulates the emission of transmitters fromits synapse of origin. The stimulatory effectof caffeine is mainly based on the fact that itbinds to adenosine receptors.
B. Biosynthesis of catecholamines
The catecholamines are biogenic amines thathave a catechol group. Their biosynthesis inthe adrenal cortex and CNS starts from tyro-sine.
[1] Hydroxylation of the aromatic ring ini-tially produces dopa (3,4-dihydroxyphenyl-alanine). This reaction uses the unusualcoenzyme tetrahydrobiopterin (THB). Dopa(cf. p. 6) is also used in the treatment of Par-kinson’s disease.
[2] Decarboxylation of dopa yields dopa-mine, an important transmitter in the CNS. Indopaminergic neurons, catecholamine syn-thesis stops at this point.
[3] The adrenal gland and adrenergic neu-rons continue the synthesis by hydroxylatingdopamine into norepinephrine (noradrena-line). Ascorbic acid (vitamin C; see p. 368)acts as a hydrogen-transferring coenzymehere.
[4] Finally, N-methylation of norepineph-rine yields epinephrine (adrenaline). Thecoenzyme for this reaction is S-adenosylme-thionine (SAM; see p.110).
The physiological effects of the catechol-amines are mediated by a large number ofdifferent receptors that are of particular inter-est in pharmacology. Norepinephrine acts inthe autonomic nervous system and certainareas of the brain. Epinephrine is also usedas a transmitter by some neurons.
352 Tissues and organs
All rights reserved. Usage subject to terms and conditions of license.Koolman, Color Atlas of Biochemistry, 2nd edition © 2005 Thieme

2 4
31
42
CO2
O2 H2O
3
O2 H2O
N A
P
N A
P
1
THB
P PAA
P P P PA A
CH2
CH2
CH2H3N
COONH
CH2
CH2H3N
HO N
NH
CH2
CH2H3N
C H
COO
(CH )
NH
COO
CHH3N
COO
CH2
OH
CHH3N
COO
CH2
OH
OH
CH2H3N
CH2
OH
OH
CH2H3N
CH
OH
OH
HO
CH2H2N
CH
OH
OH
HO
CH3
CNH
CC
N
O CH2
NH
N
HN
CO
OC
O NH2
H
2 2
3
CH2H3N
COO
H3C C O
O
CH2 CH2 N CH3
CH3
CH3
B. Biosynthesis of the catecholamines
Tyrosine 3-monooxygenase [Fe2 ,THB] 1.14.16.2Aromatic-L-amino-acid decarboxylase(Dopa decarboxylase) [PLP] 4.1.1.28
Dopamine β-monooxygenase[Cu] 1.14.17.1
Phenylethanolamine N-methyltransferase 2.1.1.28
S-Adenosyl-methionine
S-Adenosyl-homocysteine
Tyrosine Dopa Dopamine Norepinephrine Epinephrine
Ascorbate
Dehydro-ascorbate
Peptides:
and many others Thyroliberin
<GHP-NH2
YGGFM und YGGFLYGGFMTSEKSQTPLVTLFKNAITKNAYKKGE
RPKPQQFFGLMAGCKNFFWKTFTSC
WMDF-NH2
Thyroliberin (TRH)Gonadoliberin (GnRH)
Met- and Leu-enkephalinβ-Endorphin
Substance PSomatostatinAngiotensin IICholecystokinin (CCK-4)
γ-Aminobutyrate (GABA)Biogenicamines: Dopa
DopamineNorepinephrineEpinephrineSerotonineHistamine
GABA Serotonin Histamine
Aminoacids:
GlutamateGlycineDopa
Glutamate Glycine
Acetyl-choline
Pyroglutamate (<G)
Purinederivatives:
ATPADPAMPAdenosine
<GHWSYGLRPG-NH2
DRVYIHPF
A. Important neurotransmitters
353Brain and sensory organs
All rights reserved. Usage subject to terms and conditions of license.Koolman, Color Atlas of Biochemistry, 2nd edition © 2005 Thieme

Receptors for neurotransmitters
Like all signaling substances, neurotrans-mitters (see p. 352) act via receptor proteins.The receptors for neurotransmitters are inte-grated into the membrane of the postsynapticcell, where they trigger ion inflow or signaltransduction processes (see p. 348).
A. Receptors for neurotransmitters
A considerable number of receptors for neu-rotransmitters are already known and newones are continuing to be discovered. Thetable only lists the most important examples.They are classified into two large groups ac-cording to their mode of action.
Ionotropic receptors are ligand-gated ionchannels (left half of the table). The receptorsfor stimulatory transmitters (indicated in thetable by a ⊕) mediate the inflow of cations(mainly Na+). When these open after bindingof the transmitter, local depolarization of thepostsynaptic membrane occurs. By contrast,inhibitory neurotransmitters (GABA and gly-cine) allow Cl– to flow in. This increases themembrane’s negative resting potential andhinders the action of stimulatory transmitters(hyperpolarization, O-).
Metabotropic receptors (right half of thetable) are coupled to G proteins (see p. 386),through which they influence the synthesisof second messengers. Receptors that workwith type Gs proteins (see p. 386) increasethe cAMP level in the postsynaptic cell([cAMP]), while those that activate Gi pro-teins reduce it ([cAMP]). Via type Gq pro-teins, other receptors increase the intracellu-lar Ca2+ concentration ([Ca2+]).
There are several receptor subtypes formost neurotransmitters. These are distin-guished numerically (e. g., D1 to D5) or arenamed after their agonists—i. e., after mole-cules experimentally found to activate thereceptor. For example, one specific subtypeof glutamate receptors reacts to NMDA(N-methyl-D-aspartate), while another sub-type reacts to the compound AMPA, etc.
B. Acetylcholine receptors
Acetylcholine (ACh) was the neurotransmitterfirst discovered, at the beginning of the lastcentury. It binds to two types of receptor.
The nicotinic ACh receptor responds to thealkaloid nicotine contained in tobacco (manyof the physiological effects of nicotine arebased on this). The nicotinic receptor is iono-tropic. Its properties are discussed in greaterdetail on p. 222.
The muscarinic ACh receptors (of whichthere are at least five subtypes) are metabo-tropic. Their name is derived from thealkaloid muscarine, which is found in the flyagaric mushroom (Amanita muscaria), for ex-ample. Like ACh, muscarine is bound at thereceptor, but in contrast to ACh (see C), it isnot broken down and therefore causes per-manent stimulation of muscle.
The muscarinic ACh receptors influence thecAMP level in the postsynaptic cells (M1, M3
and M5 increase it, while subtypes M2 and M4
reduce it).
C. Metabolism of acetylcholine
Acetylcholine is synthesized from acetyl-CoAand choline in the cytoplasm of the presynap-tic axon [1] and is stored in synaptic vesicles,each of which contains around 1000–10 000ACh molecules. After it is released by exocy-tosis (see p. 228), the transmitter travels bydiffusion to the receptors on the postsynapticmembrane. Catalyzed by acetylcholinesterase,hydrolysis of ACh to acetate and choline im-mediately starts in the synaptic cleft [2], andwithin a few milliseconds, the ACh releasedhas been eliminated again. The cleavageproducts choline and acetate are taken upagain by the presynaptic neuron and reusedfor acetylcholine synthesis [3].
Substances that block the serine residue inthe active center of acetylcholinesterase[2]—e. g., the neurotoxin E605 and otherorganophosphates—prevent ACh degradationand thus cause prolonged stimulation of thepostsynaptic cell. This impairs nerve conduc-tion and muscle contraction. Curare, a para-lyzing arrow-poison used by South AmericanIndians, competitively inhibits binding of AChto its receptor.
354 Tissues and organs
All rights reserved. Usage subject to terms and conditions of license.Koolman, Color Atlas of Biochemistry, 2nd edition © 2005 Thieme

P P
PA
AP P P
AS
H2O
2
1
2
3
AS
AS
3
1
Ca2
βα αγ
Na
GTP
Acetyl-
Synapticvesicle
Acetate
Presynaptic membrane
Acetate
Choline
Neurotoxins
Synapticcleft
Postsynaptic membrane
Storage
Packing
Acetylcholine
Receptor
C. Metabolism of acetylcholine
Ionotropic Metabotropic
Receptor Transmitter Ion(s) Effect Receptor Transmitter
Acetyl-choline
(nicotinic)
Acetyl-choline
Acetylcholine(muscarinic)
M1, M3, M5, M2, M4
Acetylcholine
5HT3 Serotonin 5HT15HT25HT4
Serotonin„„
GABAa GABA α1
α2
β1, β2, β3
Norepinephrine „
„
Glycine Glycine
AMPANMDAKainate
GlutamateGlutamateGlutamate
D1, D5D2, D3, D4
Dopamine„
Acetylcholine
1. Nicotinic receptor 2. Muscarinic receptors
A. Receptors for neurotransmitters
B. Acetylcholine receptors
Na [cAMP]Ca2[ ]
[cAMP]
[cAMP][cAMP]
[cAMP]Ca2[ ]
[cAMP]
[cAMP]Ca2[ ]
[cAMP]
Opioids
Na
Na K Ca2Na K
Na K δ,κ,µ
Re-uptake Release
Receptor G protein
Choline
Choline acetyltransferase2.3.1.6Acetylcholinesterase3.1.1.7Acetate-CoA ligase6.2.1.1
Curare
Acetylcholine
CI
CI
Effector enzymePL-CAdenylate cyclase
Effect
355Brain and sensory organs
All rights reserved. Usage subject to terms and conditions of license.Koolman, Color Atlas of Biochemistry, 2nd edition © 2005 Thieme

Metabolism
The brain and other areas of the central ner-vous system (CNS) have high ATP require-ments. Although the brain only representsabout 2% of the body’s mass, it consumesaround 20% of the metabolized oxygen andca. 60% of the glucose. The neurons’ high en-ergy requirements are mainly due to ATP-de-pendent ion pumps (particularly Na+/K+ AT-Pase) and other active transport processesthat are needed for nerve conduction (seep. 350).
A. Energy metabolism of the brain
Glucose is normally the only metabolite fromwhich the brain is able to obtain adequateamounts of ATP through aerobic glycolysisand subsequent terminal oxidation to CO2
and H2O. Lipids are unable to pass the blood–brain barrier, and amino acids are also onlyavailable in the brain in limited quantities(see B). As neurons only have minor glycogenreserves, they are dependent on a constantsupply of glucose from the blood. A severedrop in the blood glucose level—as can occurafter insulin overdosage in diabetics, for ex-ample—rapidly leads to a drop in the ATP levelin the brain. This results in loss of conscious-ness and neurological deficits that can lead todeath. Oxygen deficiency (hypoxia) also fintaffects the brain. The effects of a brief periodof hypoxia are still reversible, but as timeprogresses irreversible damage increasinglyoccurs and finally complete loss of function(“brain death”).
During periods of starvation, the brain aftera certain time acquires the ability to use ke-tone bodies (see p. 312) in addition to glucoseto form ATP. In the first weeks of a starvationperiod, there is a strong increase in the activ-ities of the enzymes required for this in thebrain. The degradation of ketone bodies in theCNS saves glucose and thereby reduces thebreakdown of muscle protein that maintainsgluconeogenesis in the liver during starva-tion. After a few weeks, the extent of musclebreakdown therefore declines to one-third ofthe initial value.
B. Glutamate, glutamine, and GABA
The proteinogenic amino acid glutamate(Glu) and the biogenic amine 4-aminobuty-rate derived from it are among the most im-portant neurotransmitters in the brain (seep. 352). They are both synthesized in thebrain itself. In addition to the neurons, whichuse Glu or GABA as transmitters, neuroglia arealso involved in the metabolism of these sub-stances.
Since glutamate and GABA as transmittersmust not appear in the extracellular space inan unregulated way, the cells of the neuroglia(center) supply “glutaminergic” and “GABAer-gic” neurons with the precursor glutamine(Gln), which they produce from glutamatewith the help of glutamine synthetase [1].
GABA neurons (left) and glutamate neu-rons (right) initially hydrolyze glutaminewith the help of glutaminase [1] to form glu-tamate again. The glutamate neurons storethis in vesicles and release it when stimu-lated. The GABA neurons continue the degra-dation process by using glutamate decarbox-ylase [3] to convert glutamate into the trans-mitter GABA.
Both types of neuron take up their trans-mitter again. Some of it also returns to theneuroglia, where glutamate is amidated backinto glutamine.
Glutamate can also be produced again fromGABA. The reaction sequence needed for this,known as the GABA shunt, is characteristic ofthe CNS. A transaminase [4] first convertsGABA and 2-oxoglutarate into glutamate andsuccinate semialdehyde (–OOC–CH2–CH2–CHO). In an NAD+-dependent reaction, thealdehyde is oxidized to succinic acid [5],from which 2-oxoglutarate can be regener-ated again via tricarboxylic acid cycle reac-tions.
The function of glutamate as a stimulatorytransmitter in the brain is the cause of what isknown as the “Chinese restaurant syndrome.”In sensitive individuals, the monosodium glu-tamate used as a flavor enhancer in Chinesecooking can raise the glutamate level in thebrain to such an extent that transient mildneurological disturbances can occur (dizzi-ness, etc.).
356 Tissues and organs
All rights reserved. Usage subject to terms and conditions of license.Koolman, Color Atlas of Biochemistry, 2nd edition © 2005 Thieme

GABA-Rezeptor
Glutamat-Rezeptor
2K3 Na
CO2 + H2O
O2P P
A
AP P P
P
O2
1
1
1
2
3
4
5
H2O
CO2
AP P P
P PA
P
N A
N A
1
2
4
1
NH4
H2O
NH4
NH4
5
3
GABAneuron Glia cell
Glutamateneuron
Amino acids
Small amount
GlycolysisTricarboxylic acid cycleRespiratory chain
Ketone bodies
Na /K -exchangingATPase 3.6.1.37
A. Energy metabolism of the brain
B. Glutamate, glutamine, and GABA
GABA receptor Glutamate receptor
Glucose
Constantlyrequired
Energy suppliersduring prolongedstarvation
Glycogen
Blood glucose
Glutaminase 3.5.1.2
Glutamine synthetase 6.3.1.2
Glutamate decarboxylase 4.1.1.15
4-Aminobutyrate transaminase 2.6.1.19
Succinic semialdehyde dehydrogenase1.2.1.24
Glutamine Glutamine Glutamine
Glutamate
Glutamate
Glutamate
2-Oxoglutarate
Succinic acid
Tricarboxylicacid cycle
Exo-cytosis
GlutamateGABA Glutamate
GABA
GABA
GABA
Succinatesemialdehyde
357Brain and sensory organs
All rights reserved. Usage subject to terms and conditions of license.Koolman, Color Atlas of Biochemistry, 2nd edition © 2005 Thieme

Sight
Two types of photoreceptor cell are found inthe human retina—rods and cones. Rods aresensitive to low levels of light, while the conesare responsible for color vision at higher lightintensities.
Signaling substances and many proteinsare involved in visual processes. Initially, alight-induced cis–trans isomerization of thepigment retinal triggers a conformationalchange in the membrane protein rhodopsin.Via the G protein transducin, which is associ-ated with rhodopsin, an enzyme is activatedthat breaks down the second messengercGMP. Finally, the cGMP deficiency leads tohyperpolarization of the light-sensitive cell,which is registered by subsequent neuronsas reduced neurotransmitter release.
A. Photoreceptor
The cell illustrated opposite, a rod, has astructure divided by membrane discs intowhich the 7-helix receptor rhodopsin is inte-grated (see p. 224). In contrast to other recep-tors in the 7-helix class (see p. 384), rhodop-sin is a light-sensitive chromoprotein. Its pro-tein part, opsin, contains the aldehyde retinal(see p. 364)—an isoprenoid which is bound tothe ε-amino group of a lysine residue as analdimine.
The light absorption of rhodopsin is in thevisible range, with a maximum at about500 nm. The absorption properties of the vis-ual pigment are thus optimally adjusted tothe spectral distribution of sunlight.
Absorption of a photon triggers isomeriza-tion from the 11-cis form of retinal to all-trans-retinal (top right). Within milliseconds,this photochemical process leads to an allos-teric conformational change in rhodopsin.The active conformation (rhodopsin*) bindsand activates the G protein transducin. Thesignal cascade (B) that now follows causesthe rod cells to release less neurotransmitter(glutamate) at their synapses. The adjoiningbipolar neurons register this change andtransmit it to the brain as a signal for light.
There are several different rhodopsins inthe cones. All of them contain retinal mole-cules as light-sensitive components, the ab-sorption properties of which are modulatedby the different proportions of opsin they
contain in such a way that colors can also beperceived.
B. Signal cascade
Dark (bottom left). Rod cells that are notexposed to light contain relatively high con-centrations (70 µM) of the cyclic nucleotidecGMP (3,5-cycloGMP; cf. cAMP, p. 386),which is synthesized by a guanylate cyclase([2], see p. 388). The cGMP binds to an ionchannel in the rod membrane (bottom left)and thus keeps it open. The inflow of cations(Na+, Ca2+) depolarizes the membrane andleads to release of the neurotransmitter glu-tamate at the synapse (see p. 356).
Light (bottom right). When the G proteintransducin binds to light-activated rhodop-sin* (see A, on the structure of the complex;see p. 224), it leads to the GDP that is bound tothe transducin being exchanged for GTP. Intransducin* that has been activated in thisway, the GTP-containing α-subunit breaksoff from the rest of the molecule and in turnactivates a membrane cGMP phosphodiester-ase [1]. This hydrolyzes cGMP to GMP andthus reduces the level of free cGMP withinmilliseconds. As a consequence, the cGMPbound at the ion channel dissociates off andthe channel closes. As cations are constantlybeing pumped out of the cell, the membranepotential falls and hyperpolarization of thecell occurs, which interrupts glutamate re-lease.
Regeneration. After exposure to light, severalprocesses restore the initial conditions:1. The α-subunit of transducin* inactivates
itself by GTP hydrolysis and thus termi-nates the activation of cGMP esterase.
2. The reduced Ca2+ concentration causes ac-tivation of guanylate cyclase, which in-creases the cGMP level until the cationchannels reopen.
3. An isomerase [3] transfers all-trans -retinalto the 11-cis -form, in which it is availablefor the next cycle. A dehydrogenase [4] canalso allow retinal to be supplied from vita-min A (retinol).
358 Tissues and organs
All rights reserved. Usage subject to terms and conditions of license.Koolman, Color Atlas of Biochemistry, 2nd edition © 2005 Thieme

ca.5
0 µm
1211
Na
ATP ADP P
GMPGTP
H2OP P
GTP
αGDP
αP
βγ
GTP
Transducin*
GDPGDP
GTP
GDP
*
cGMP
cGMP
3N A
N A
4
2 1
3
4
2
1
Ca2Na
Ca2Na
Ca2
Ca2Na
CH3
CH3
H3C
HCNH
CH3H3C
CH3
CH3CH3H3C CH3 HC
NH
Opsin
A. Photoreceptor
Membranediscs
Mitochon-drion
Nucleus
Decreased releaseof neurotransmitter
Out
er s
egm
ent
Cytoplasm
Interlamellarspace
Light (h · ν)
Cilium
Synapse
Rhodopsin
Opsin
The double bondbetween C-11 and C-12 is isomerized fromcis to trans by light
cGMP esterase 3.1.4.35
Retinal isomerase 5.2.1.3
B. Signal cascade
Guanylate cyclase 4.6.1.2
Cation channelCation channel Cation pump
Dark
Light
Cytoplasm
Extracellular space
Vitamin A
Retinol
Retinol dehydrogenase 1.1.1.105
Closes due tolack of cGMP
TransducinTransducin
all-transRetinal
11-cis-Retinal
Light
Rhodopsin Rhodopsin*
Rhodopsin*
*activates
all-trans-Retinal
11-cis-Retinal
359Brain and sensory organs
All rights reserved. Usage subject to terms and conditions of license.Koolman, Color Atlas of Biochemistry, 2nd edition © 2005 Thieme

Organic substances
A balanced human diet needs to contain alarge number of different components. Theseinclude proteins, carbohydrates, fats, minerals(including water), and vitamins. These sub-stances can occur in widely varying amountsand proportions, depending on the type ofdiet. As several components of the diet areessential for life, they have to be regularlyingested with food. Recommended daily min-imums for nutrients have been published bythe World Health Organization (WHO) and anumber of national expert committees.
A. Energy requirement
The amount of energy required by a human isexpressed in kJ d–1 (kilojoule per day). Anolder unit is the kilocalorie (kcal; 1 kcal =4.187 kJ). The figures given are recommendedvalues for adults with a normal body weight.However, actual requirements are based onage, sex, body weight, and in particular onphysical activity. In those involved in compet-itive sports, for example, requirements canincrease from 12 000 to 17 000 kJ d–1.
It is recommended that about half of theenergy intake should be in the form of carbo-hydrates, a third at most in the form of fat, andtherestasprotein.Thefact thatalcoholic bever-ages can make a major contribution to dailyenergy intake is often overlooked. Ethanol hasa caloric value of about 30 kJ g–1 (see p. 320).
B. Nutrients
Proteins provide the body with amino acids,which are used for endogenous protein bio-synthesis. Excess amino acids are brokendown to provide energy (see p. 174). Mostamino acids are glucogenic—i. e., they can beconverted into glucose (see p. 180).
Proteins are essential components of thediet, as they provide essential amino acidsthat the human body is not capable of pro-ducing on its own (see the table). Some aminoacids, including cysteine and histidine, are notabsolutely essential, but promote growth inchildren. Some amino acids are able to sub-stitute for each other in the diet. For example,humans can form tyrosine, which is actuallyessential, by hydroxylation from phenylala-nine, and cysteine from methionine.
The minimum daily requirement of proteinis 37 g for men and 29 g for women, but therecommended amounts are about twice thesevalues. Requirements in pregnant and breast-feeding women are even higher. Not only thequantity, but also the quality of protein isimportant. Proteins that lack several essentialamino acids or only contain small quantitiesof them are considered to be of low value, andlarger quantities of them are thereforeneeded. For example, pulses only containsmall amounts of methionine, while wheatand corn proteins are poor in lysine. In con-trast to vegetable proteins, most animal pro-teins are high-value (with exceptions such ascollagen and gelatin).
Carbohydrates serve as a general and easilyavailable energy source. In the diet, they arepresent as monosaccharides in honey andfruit, or as disaccharides in milk and in allfoods sweetened with sugar (sucrose). Meta-bolically usable polysaccharides are found invegetable products (starch) and animal prod-ucts (glycogen). Carbohydrates represent asubstantial proportion of the body’s energysupply, but they are not essential.
Fats are primarily important energy suppli-ers in the diet. Per gram, they provide morethan twice as much energy as proteins andcarbohydrates. Fats are essential as suppliersof fat-soluble vitamins (see p. 364) and assources of polyunsaturated fatty acids, whichare needed to biosynthesize eicosanoids (seepp. 48, 390).
Mineral substances and trace elements, avery heterogeneous group of essential nu-trients, are discussed in more detail onp. 362. They are usually divided into macro-minerals and microminerals.
Vitamins are also indispensable compo-nents of the diet. The animal body requiresthem in very small quantities in order to syn-thesize coenzymes and signaling substances(see pp. 364–369).
360 Nutrition
All rights reserved. Usage subject to terms and conditions of license.Koolman, Color Atlas of Biochemistry, 2nd edition © 2005 Thieme

Quantityin body
(kg)
Energy content Dailyrequirement (g)
General functionin metabolism
EssentialconstituentskJ · g-1
(kcal · g-1) a b c
A. Energy requirement
B. Nutrients
Dailyrequirement
(average)
Recommended proportion of energy supply:
12 600 kJ(3000 kcal)
9 200 kJ(2 200 kcal)
Fats 30%Proteins15 - 20%
Carbohydrates50 - 55%
Prot
eins
Supplier of amino acids
Energy source
Car
bo-
hydr
ates
Fats
Wat
erM
iner
als
Vit
amin
s
10 17(4.1)
Essentialamino acids::ValLeuIleLysPheTrpMetThr
(14)(16)(12)(12)(16)( 3)
(10)( 8)
37 55 92
29 45 75
Daily require-ment in mg perkg body weight
Cys andHis stimu-late growth
1 17(4.1)
General sourceof energy (glucose)
0 390 240-310
Energy reserve(glycogen)Roughage (cellulose)Supporting substances(bones, cartilage, mucus)
Non-essentialnutritionalconstituent
10-15 39(9.3)
10 80 130 General energy source
Most important energyreserve
35-40 0 2 400 – –
0Building blocksElectrolytesCofactors of enzymes
–Often precursorsof coenzymes
3
–
Solvent for vitamins
Supplier ofessential fatty acids
MacromineralsMicrominerals(trace elements)
Lipid-soluble vitamins
Water-solublevitamins
a: Minimum daily requirement b: Recommended daily intake c: Actual daily intake inc: industrialized nations
Poly-unsaturatedfatty acids:Linoleic acidLinolenic acidArachidonic acid(together10 g/day)
SolventCellular building blockDielectricReaction partnerTemperature regulator
361Nutrients
All rights reserved. Usage subject to terms and conditions of license.Koolman, Color Atlas of Biochemistry, 2nd edition © 2005 Thieme

Minerals and trace elements
A. Minerals
Water is the most important essential inor-ganic nutrient in the diet. In adults, the bodyhas a daily requirement of 2–3 L of water,which is supplied from drinks, water con-tained in solid foods, and from the oxidationwater produced in the respiratory chain (seep. 140). The special role of water for livingprocesses is discussed in more detail else-where (see p. 26).
The elements essential for life can be div-ided into macroelements (daily requirement> 100 mg) and microelements (daily require-ment < 100 mg). The macroelements includethe electrolytes sodium (Na), potassium (K),calcium (Ca), and magnesium (Mg), and thenonmetals chlorine (Cl), phosphorus (P), sul-fur (S), and iodine (I).
The essential microelements are only re-quired in trace amounts (see also p. 2). Thisgroup includes iron (Fe), zinc (Zn), manganese(Mn), copper (Cu), cobalt (Co), chromium (Cr),selenium (Se), and molybdenum (Mo). Fluo-rine (F) is not essential for life, but does pro-mote healthy bones and teeth. It is still amatter of controversy whether vanadium,nickel, tin, boron, and silicon also belong tothe essential trace elements.
The second column in the table lists theaverage amounts of mineral substances inthe body of an adult weighing 65 kg. The dailyrequirements listed in the fourth column alsoapply to an adult, and are average values.Children, pregnant and breast-feeding wo-men, and those who are ill generally havehigher mineral requirements relative tobody weight than men.
As the human body is able to store manyminerals, deviations from the daily ration arebalanced out over a given period of time.Minerals stored in the body include water,which is distributed throughout the wholebody; calcium, stored in the form of apatitein the bones (see p. 340); iodine, stored asthyroglobulin in the thyroid; and iron, storedin the form of ferritin and hemosiderin in thebone marrow, spleen, and liver (see p. 286).The storage site for many trace elements isthe liver. In many cases, the metabolism ofminerals is regulated by hormones—for exam-ple, the uptake and excretion of H2O, Na+,
Ca2+, and phosphate (see p. 328), and storageof Fe2+ and I–.
Resorption of the required mineral sub-stances from food usually depends on thebody’s requirements, and in several casesalso on the composition of the diet. One ex-ample of dietary influence is calcium (seep. 342). Its resorption as Ca2+ is promoted bylactate and citrate, but phosphate, oxalic acid,and phytol inhibit calcium uptake from fooddue to complex formation and the productionof insoluble salts.
Mineral deficiencies are not uncommonand can have quite a variety of causes—e. g.,an unbalanced diet, resorption disturbances,and diseases. Calcium deficiency can lead torickets, osteoporosis, and other disturbances.Chloride deficiency is observed as a result ofsevere Cl– losses due to vomiting. Due to thelow content of iodine in food in many regionsof central Europe, iodine deficiency is wides-pread there and can lead to goiter. Magnesiumdeficiency can be caused by digestive disor-ders or an unbalanced diet—e. g., in alco-holism. Trace element deficiencies often re-sult in a disturbed blood picture—i. e., forms ofanemia.
The last column in the table lists some ofthe functions of minerals. It should be notedthat almost all of the macroelements in thebody function either as nutrients or electro-lytes. Iodine (as a result of its incorporationinto iodothyronines) and calcium act as sig-naling substances. Most trace elements arecofactors for proteins, especially for enzymes.Particularly important in quantitative termsare the iron proteins hemoglobin, myoglobin,and the cytochromes (see p. 286), as well asmore than 300 different zinc proteins.
362 Nutrition
All rights reserved. Usage subject to terms and conditions of license.Koolman, Color Atlas of Biochemistry, 2nd edition © 2005 Thieme

Mineral Content(g)
Major source Daily requirement Functions/Occurrence*
Water 35 000-40 000
1200
900
300g
Solvent, cellular buil-ding block, dielectric,coolant, medium fortransport, reaction partner
Macroelements (daily requirement >100 mg)
Na 100 Table salt 1.1-3.3Osmoregulation,membrane potential,mineral metabolism
K 150 Vegetables, fruit,cereals 1.9-5.6 Membrane potential,
mineral metabolism
Ca 1 300 Milk, milk products 0.8Bone formation,blood clotting,signal molecule
Mg
Cl
P
S
20
100
650
Green vegetables 0.35 Bone formation,cofactor for enzymes
1.7-5.1 Mineral metabolism
Meat, milk,cereals, vegetables 0.8
Bone formation, energymetabolism, nucleicacid metabolism
S-containingamino acids(Cys and Met)
Lipid and carbohydratemetabolism,conjugate formation
Microelements (trace elements)
Fe 4-5Meat, liver, eggs,vegetables, potatoes,cereals
10Hemoglobin, myoglobin,cytochromes,Fe/S clusters
Zn 2-3 Meat, liver,cereals 15 Zinc enzymes
Mn
Cu
Co
Cr
Se
Mo
I
F
0.02
0.1-0.2
0.02
0.03
Found in manyfoodstuffsMeat, vegetables,fruit, fish
Meat
Vegetables, meat
Cereals, nuts,legumes
Seafood,iodized salt,drinking water
2-5
2-3
Enzymes
Oxidases
Traces Vitamin B12
0.05-0.2 Not clear
0.05-0.2 Selenium enzymes
0.15-0.5 Redox enzymes
0.15 Thyroxin
Requirement not known
Drinking water(fluoridated), tea, milk 0.0015-0.004 Bones, dental enamel
* Content in the body of a 65 kg adult
DrinksWater in solidfoodsFrom metabolism
(mg
(g)
Metals Non-metals
<0.01
<0.01
200 0.2
Table salt
A. Minerals
363Nutrients
All rights reserved. Usage subject to terms and conditions of license.Koolman, Color Atlas of Biochemistry, 2nd edition © 2005 Thieme

Lipid-soluble vitamins
Vitamins are essential organic compoundsthat the animal organism is not capable offorming itself, although it requires them insmall amounts for metabolism. Most vitaminsare precursors of coenzymes; in some cases,they are also precursors of hormones or act asantioxidants. Vitamin requirements vary fromspecies to species and are influenced by age,sex, and physiological conditions such aspregnancy, breast-feeding, physical exercise,and nutrition.
A. Vitamin supply
A healthy diet usually covers average dailyvitamin requirements. By contrast, malnutri-tion, malnourishment (e. g., an unbalanceddiet in older people, malnourishment in alco-holics, ready meals), or resorption disturban-ces lead to an inadequate supply of vitaminsfrom which hypovitaminosis, or in extremecases avitaminosis, can result. Medical treat-ments that kill the intestinal flora—e. g., anti-biotics—can also lead to vitamin deficiencies(K, B12, H) due to the absence of bacterialvitamin synthesis.
Since only a few vitamins can be stored (A,D, E, B12), a lack of vitamins quickly leads todeficiency diseases. These often affect theskin, blood cells, and nervous system. Thecauses of vitamin deficiencies can be treatedby improving nutrition and by administeringvitamins in tablet form. An overdose of vita-mins only leads to hypervitaminoses, withtoxic symptoms, in the case of vitamins Aand D. Normally, excess vitamins are rapidlyexcreted with the urine.
B. Lipid-soluble vitamins
Vitamins are classified as either lipid-solubleor water-soluble. The lipid-soluble vitaminsinclude vitamins A, D, E, and K, all of whichbelong to the isoprenoids (see p. 52).
Vitamin A (retinol) is the parent substanceof the retinoids, which include retinal andretinoic acid. The retinoids also can be synthe-sized by cleavage from the provitamin β-car-otene. Retinoids are found in meat-containingdiets, whereas β-carotene occurs in fruits andvegetables (particularly carrots). Retinal is in-volved in visual processes as the pigment of
the chromoprotein rhodopsin (see p. 358).Retinoic acid, like the steroid hormones, in-fluences the transcription of genes in the cellnucleus. It acts as a differentiation factor ingrowth and development processes. VitaminA deficiency can result in night blindness, vis-ual impairment, and growth disturbances.
Vitamin D (calciol, cholecalciferol) is theprecursor of the hormone calcitriol (1α,25-di-hydroxycholecalciferol; see p. 320). Togetherwith two other hormones (parathyrin andcalcitonin), calcitriol regulates the calciummetabolism (see p. 342). Calciol can be syn-thesized in the skin from 7-dehydrocholes-terol, an endogenous steroid, by a photo-chemical reaction. Vitamin D deficienciesonly occur when the skin receives insuf cientexposure to ultraviolet light and vitamin D islacking in the diet. Deficiency is observed inthe form of rickets in children and osteomala-cia in adults. In both cases, bone mineraliza-tion is disturbed.
Vitamin E (tocopherol) and related com-pounds only occur in plants (e. g., wheatgerm). They contain what is known as a chro-man ring. In the lipid phase, vitamin E ismainly located in biological membranes,where as an antioxidant it protects unsatu-rated lipids against ROS (see p. 284) and otherradicals.
Vitamin K (phylloquinone) and similar sub-stances with modified side chains are in-volved in carboxylating glutamate residuesof coagulation factors in the liver (seep. 290). The form that acts as a cofactor forcarboxylase is derived from the vitamin byenzymatic reduction. Vitamin K antagonists(e. g., coumarin derivatives) inhibit this reduc-tion and consequently carboxylation as well.This fact is used to inhibit blood coagulationin prophylactic treatment against thrombosis.Vitamin K deficiency occurs only rarely, as thevitamin is formed by bacteria of the intestinalflora.
364 Nutrition
All rights reserved. Usage subject to terms and conditions of license.Koolman, Color Atlas of Biochemistry, 2nd edition © 2005 Thieme

* Adult daily* requirement
Provitamin
VegetablesFruit
1
MilkLiverEgg yolk
uv
0.01
Cod liver oilMilkEgg yolk
Functional form
Visual pigments
Coenzyme
Signal molecule
Important for
Sight
Sugartransport
DevelopmentDifferentiation
Hormone
Calciummetabolism
Anti-oxidant
10
CerealsLiverEggsSeed oil
Blood clotting(carboxylationof plasmaproteins)0.08
IntestinalbacteriaVegetablesLiver
β-Carotene
Retinol
Cholesterol
Calciol
Tocopherols
Phylloquinones
Retinal
Retinol
Retinoic acid
Calcitriol
Tocopherols
Phyllohydro-quinones
Reducing agent
A
D
E
K
CH3
CH3CH3H3C CH3
CH2OH
H3CH3C CH3
CH3
CH2
HO
O
CH3
HO
H3C
CH3
H
CH3
CH3
3
O
O
CH3
H
CH34
Healthynutrition Vitamin require-
ment satisfied
Poor nutritionMalnutritionAntibioticsDisturbedresorption
Vitamin intake
Urine
Excessvitamins
VitaminA and D
Vitamin poisoning
Hypo-vitaminosisDiseases
Hypervitaminosis
Overdose
A. Vitamin supply
B. Lipid-soluble vitamins
365Vitamins
All rights reserved. Usage subject to terms and conditions of license.Koolman, Color Atlas of Biochemistry, 2nd edition © 2005 Thieme

Water-soluble vitamins I
The B group of vitamins covers water-solublevitamins, all of which serve as precursors forcoenzymes. Their numbering sequence is notcontinuous, as many substances that wereoriginally regarded as vitamins were not laterconfirmed as having vitamin characteristics.
A. Water-soluble vitamins I
Vitamin B1 (thiamine) contains two heterocy-clic rings—a pyrimidine ring (a six-memberedaromatic ring with two Ns) and a thiazole ring(a five-membered aromatic ring with N andS), which are joined by a methylene group.The active form of vitamin B1 is thiaminediphosphate (TPP), which contributes as acoenzyme to the transfer of hydroxyalkyl res-idues (active aldehyde groups). The most im-portant reactions of this type are oxidativedecarboxylation of 2-oxoacids (see p. 134)and the transketolase reaction in the pentosephosphate pathway (see p. 152). Thiaminewas the first vitamin to be discovered, around100 years ago. Vitamin B1 deficiency leads toberiberi, a disease with symptoms that in-clude neurological disturbances, cardiac in-suf ciency, and muscular atrophy.
Vitamin B2 is a complex of several vita-mins: riboflavin, folate, nicotinate, and pan-tothenic acid.
Riboflavin (from the Latin flavus, yellow)serves in the metabolism as a component ofthe redox coenzymes flavin mononucleotide(FMN) and flavin adenine dinucleotide (FAD;see p.104). As prosthetic groups, FMN and FADare cofactors for various oxidoreductases (seep. 32). No specific disease due to a deficiencyof this vitamin is known.
Folate, the anion of folic acid, is made up ofthree different components—a pteridinederivative, 4-aminobenzoate, and one ormore glutamate residues. After reduction totetrahydrofolate (THF), folate serves as acoenzyme in the C1 metabolism (see p. 418).Folate deficiency is relatively common, andleads to disturbances in nucleotide biosynthe-sis and thus cell proliferation. As the precur-sors for blood cells divide particularly rapidly,disturbances of the blood picture can occur,with increased amounts of abnormal precur-sors for megalocytes (megaloblastic anemia).Later, general damage ensues as phospholipid
synthesis and the amino acid metabolism areaffected.
In contrast to animals, microorganisms areable to synthesize folate from their own com-ponents. The growth of microorganisms cantherefore be inhibited by sulfonamides, whichcompetitively inhibit the incorporation of 4-aminobenzoate into folate (see p. 254). Sincefolate is not synthesized in the animal organ-ism, sulfonamides have no effect on animalmetabolism.
Nicotinate and nicotinamide, together re-ferred to as “niacin,” are required for biosyn-thesis of the coenzymes nicotinamide ad-enine dinucleotide (NAD+) and nicotinamideadenine dinucleotide phosphate (NADP+).These both serve in energy and nutrient me-tabolism as carriers of hydride ions (seepp. 32, 104). The animal organism is able toconvert tryptophan into nicotinate, but onlywith a poor yield. Vitamin deficiency there-fore only occurs when nicotinate, nicotin-amide, and tryptophan are all simultaneouslyare lacking in the diet. It manifests in the formof skin damage (pellagra), digestive distur-bances, and depression.
Pantothenic acid is an acid amide consist-ing of β-alanine and 2,4-dihydroxy-3,3-di-methylbutyrate (pantoic acid). It is a precur-sor of coenzyme A, which is required for acti-vation of acyl residues in the lipid metabolism(see pp. 12, 106). Acyl carrier protein (ACP; seep.168) also contains pantothenic acid as partof its prosthetic group. Due to the widespreadavailability of pantothenic acid in food (Greekpantothen = “from everywhere”), deficiencydiseases are rare.
Further information
The requirement for vitamins in humans andother animals is the result of mutations in theenzymes involved in biosynthetic coenzymes.As intermediates of coenzyme biosynthesisare available in suf cient amounts in thediet of heterotrophic animals (see p. 112),the lack of endogenous synthesis did nothave unfavorable effects for them. Microor-ganisms and plants whose nutrition is mainlyautotrophic have to produce all of these com-pounds themselves in order to survive.
366 Nutrition
All rights reserved. Usage subject to terms and conditions of license.Koolman, Color Atlas of Biochemistry, 2nd edition © 2005 Thieme

F A
B1
CoA
THF
TPP
N A
AS
N A
P
NADP
NAD
FAD
FMN
B2
F
Glu
N
NHN
NO
O
CH2
CH3
CH3
C
C
OHH
C
OHH
CH2OH
OHH
N
NN
NH2N
CH2
OH HN CNH
O
CH
COO
CH2
CH2
COO
N
COO
N
NH2
O
C CNH
COO
HO OH
OCH3H3C
CH
NH2
N
NH3C
N
S
3
CH2 CH2OHThiaminediphosphate
A. Water-soluble vitamins I
* Adult daily*requirement
Vitamin Active form:coenzyme
Function inmetabolism
Transfer ofhydroxy-alkyl residues
1.5 mg *
GrainYeast productsPork
Riboflavin
1.8 mg*
Hydrogentransfer
MilkEggs
4-Aminobenzoate residue
C1-metabolism
0.2 mg*
Hydridetransfer
20 mg*
(or 1.2 g tryptophan)
Meat, yeast productsFruit and vegetables
β-Alanine 7 mg*
Widelydistributed
Activationof carboxy-lic acids
Pantothenate
Fresh greenvegetablesLiver
Tetrahydro-folate
Pteridine derivative
NicotinamideNicotinate
Pantoinate
NicotinateNicotinamide
Thiamine
Folate
367Vitamins
All rights reserved. Usage subject to terms and conditions of license.Koolman, Color Atlas of Biochemistry, 2nd edition © 2005 Thieme

Water-soluble vitamins II
A. Water-soluble vitamins II
Vitamin B6 consists of three substituted pyr-idines—pyridoxal, pyridoxol, and pyrid-oxamine. The illustration shows the structureof pyridoxal, which carries an aldehyde group(–CHO) at C-4. Pyridoxol is the correspondingalcohol (–CH2OH), and pyridoxamine theamine (–CH2NH2).
The active form of vitamin B6, pyridoxalphosphate, is the most important coenzymein the amino acid metabolism (see p. 106).Almost all conversion reactions involvingamino acids require pyridoxal phosphate, in-cluding transaminations, decarboxylations,dehydrogenations, etc. Glycogen phosphory-lase, the enzyme for glycogen degradation,also contains pyridoxal phosphate as a cofac-tor. Vitamin B6 deficiency is rare.
Vitamin B12 (cobalamine) is one of the mostcomplex low-molecular-weight substancesoccurring in nature. The core of the moleculeconsists of a tetrapyrrol system (corrin), withcobalt as the central atom (see p. 108). Thevitamin is exclusively synthesized by micro-organisms. It is abundant in liver, meat, eggs,and milk, but not in plant products. As theintestinal flora synthesize vitamin B12, strictvegetarians usually also have an adequatesupply of the vitamin.
Cobalamine can only be resorbed in thesmall intestine when the gastric mucosa se-cretes what is known as intrinsic factor—aglycoprotein that binds cobalamine (the ex-trinsic factor) and thereby protects it fromdegradation. In the blood, the vitamin isbound to a special protein known as trans-cobalamin. The liver is able to store vitaminB12 in amounts suf cient to last for severalmonths. Vitamin B12 deficiency is usuallydue to an absence of intrinsic factor and theresulting resorption disturbance. This leads toa disturbance in blood formation known aspernicious anemia.
In animal metabolism, derivatives of cobal-amine are mainly involved in rearrangementreactions. For example, they act as coenzymesin the conversion of methylmalonyl-CoA tosuccinyl-CoA (see p. 166), and in the formationof methionine from homocysteine (see p. 418).In prokaryotes, cobalamine derivatives alsoplay a part in the reduction of ribonucleotides.
Vitamin C is L-ascorbic acid (chemically:2-oxogulonolactone). The two hydroxylgroups have acidic properties. By releasing aproton, ascorbic acid therefore turns into itsanion, ascorbate. Humans, apes, and guineapigs require vitamin C because they lack theenzyme L-gulonolactone oxidase (1.1.3.8),which catalyzes the final step in the conver-sion of glucose into ascorbate.
Vitamin C is particularly abundant in freshfruit and vegetables. Many soft drinks andfoodstuffs also have synthetic ascorbic acidadded to them as an antioxidant and flavorenhancer. Boiling slowly destroys vitamin C.In the body, ascorbic acid serves as a reducingagent in variations reactions (usually hydrox-ylations). Among the processes involved arecollagen synthesis, tyrosine degradation, cate-cholamine synthesis, and bile acid biosynthesis.The daily requirement for ascorbic acid isabout 60 mg, a comparatively large amountfor a vitamin. Even higher doses of the vita-min have a protective effect against infec-tions. However, the biochemical basis forthis effect has not yet been explained. VitaminC deficiency only occurs rarely nowadays; itbecomes evident after a few months in theform of scurvy, with connective-tissue dam-age, bleeding, and tooth loss.
Vitamin H (biotin) is present in liver, eggyolk, and other foods; it is also synthesized bythe intestinal flora. In the body, biotin is co-valently attached via a lysine side chain toenzymes that catalyze carboxylation reac-tions. Biotin-dependent carboxylases includepyruvate carboxylase (see p. 154) and acetyl-CoA carboxylase (see p. 162). CO2 binds, usingup ATP, to one of the two N atoms of biotin,from which it is transferred to the acceptor(see p. 108).
Biotin binds with high af nity(Kd = 10–15 M) and specificity to avidin, a pro-tein found in egg white. Since boiling dena-tures avidin, biotin deficiency only occurswhen egg whites are eaten raw.
368 Nutrition
All rights reserved. Usage subject to terms and conditions of license.Koolman, Color Atlas of Biochemistry, 2nd edition © 2005 Thieme

B6
B12
C
H
PLP
B
AS
AS
H3C N
HO
CO H
CH2OH
O
HO O
C
CH2OH
HHO
HO
O
HN NH
S COO
HCCC
H
COO
H
H
O
H C C C
H
H
H
COO
O
H2N
N
CCH2N
OO
N
N
N
CH3
H3C
CNH2
O
C
O
NH2
H3CH3C
CH2N
OCHN
OH2C
CHH3C
O
PO O
O
H3C
CH3
CH3
Co2 CH3
O
HO
CH2
N
N
CH3
CH3
HO
X
CO NH2
A. Water-soluble vitamins II
* Adult daily*requirement
Activationof aminoacids
2 mg*MeatVegetablesGrain products
Cobalamine 5-Deoxy-adenosylcobalamine
Isomerizatione.g.
0.002 mg*
MeatLiverMilkEggs
Ascorbic acid Ascorbate
Stabilizationof enzymesystems,coenzyme,antioxidant60 mg*
FruitVegetables
Biotin
Biotin
Transferofcarboxylgroups0.1 mg*
Yeast productsLegumesNuts
Vitamin Active form:coenzyme
Function inmetabolism
PyridoxalPyridoxolPyridoxamine
Pyridoxalphosphate
Methylmalonyl CoA
Succinyl CoA
Pyridoxal
369Vitamins
All rights reserved. Usage subject to terms and conditions of license.Koolman, Color Atlas of Biochemistry, 2nd edition © 2005 Thieme

Basics
Hormones are chemical signaling substances.They are synthesized in specialized cells thatare often associated to form endocrine glands.Hormones are released into the blood andtransported with the blood to their effectororgans. In the organs, the hormones carryout physiological and biochemical regulatoryfunctions. In contrast to endocrine hormones,tissue hormones are only active in the imme-diate vicinity of the cells that secrete them.
The distinctions between hormones andother signaling substances (mediators, neuro-transmitters, and growth factors) are fluid.Mediators is the term used for signaling sub-stances that do not derive from special hor-mone-forming cells, but are form by many celltypes. They have hormone-like effects in theirimmediate surroundings. Histamine (seep. 352) and prostaglandins (see p. 390) areimportant examples of these substances.Neurohormones and neurotransmitters aresignaling substances that are produced andreleased by nerve cells (see p. 348). Growthfactors and cytokines mainly promote cellproliferation and cell differentiation (seep. 392).
A. Hormones: overview
The animal organism contains more than 100hormones and hormone-like substances,which can be classified either according totheir structure or according to their function.In chemical terms, most hormones are aminoacid derivatives, peptides or proteins, or ste-roids. Hormones regulate the following pro-cesses:• Growth and differentiation of cells, tissues,
and organsThese processes include cell proliferation,embryonic development, and sexual dif-ferentiation—i. e., processes that require aprolonged time period and involve proteinsde novo synthesis. For this reason, mainlysteroid hormones which function via tran-scription regulation are active in this field(see p. 244).
• Metabolic pathwaysMetabolic regulation requires rapidly act-ing mechanisms. Many of the hormonesinvolved therefore regulate interconversionof enzymes (see p. 120). The main processes
subject to hormonal regulation are the up-take and degradation of storage substances(glycogen, fat), metabolic pathways for bio-synthesis and degradation of central me-tabolites (glucose, fatty acids, etc.), andthe supply of metabolic energy.
• Digestive processesDigestive processes are usually regulatedby locally acting peptides (paracrine; seep. 372), but mediators, biogenic amines,and neuropeptides are also involved (seep. 270).
• Maintenance of ion concentrations (ho-meostasis)Concentrations of Na+, K+, and Cl– in bodyfluids, and the physiological variables de-pendent on these (e. g. blood pressure), aresubject to strict regulation. The principalsite of action of the hormones involved isthe kidneys, where hormones increase orreduce the resorption of ions and recoveryof water (see pp. 326–331). The concentra-tions of Ca2+ and phosphate, which formthe mineral substance of bone and teeth,are also precisely regulated.
Many hormones influence the above pro-cesses only indirectly by regulating the syn-thesis and release of other hormones (hormo-nal hierarchy; see p. 372).
B. Hormonal regulation system
Each hormone is the center of a hormonalregulation system. Specialized glandular cellssynthesize the hormone from precursors,store it in many cases, and release it into thebloodstream when needed (biosynthesis). Fortransport, the poorly water-soluble lipophilichormones are bound to plasma proteinsknown as hormone carriers. To stop the ef-fects of the hormone again, it is inactivated byenzymatic reactions, most of which take placein the liver (metabolism). Finally, the hor-mone and its metabolites are expelled viathe excretory system, usually in the kidney(excretion). All of these processes affect theconcentration of the hormone and thus con-tribute to regulation of the hormonal signal.
Intheeffectororgans,targetcellsreceivethehormone’s message. These cells have hormonereceptors for the purpose, which bind the hor-mone. Binding of a hormone passes informa-tion to the cell and triggers a response (effect).
370 Hormones
All rights reserved. Usage subject to terms and conditions of license.Koolman, Color Atlas of Biochemistry, 2nd edition © 2005 Thieme

H
H
H
P H H
H
H M
H M H MP
H
M
MH
H
H H
M
M
MH
H
H M
InsulinGlucagonCortisolThyroxinEpinephrine
(H2O, electrolytes, )
Parathyroid hormoneCalcitoninANFAldosteroneCalcitriol
GastrinSecretinCCKetc.
A. Hormonal regulation system
Gland cell Circulatory system Target cell
Response
PeptideProtein
Steroid
Aminoacidderivative
ProliferationGrowthDevelopment
Sexualhormones
Retinoicacid
CytokinesGrowth factorsSomatotropin
Homeostasis
Metabolism Digestion
A. Hormones: overview
Biosynthesis Effect
Hormone precursor
Hormone
Hormone metabolite
Hormone carrier
Transport
ExcretionMetabolism
Hormones
P
371Hormonal system
All rights reserved. Usage subject to terms and conditions of license.Koolman, Color Atlas of Biochemistry, 2nd edition © 2005 Thieme

Plasma levels and hormonehierarchy
A. Endocrine, paracrine, and autocrine hor-mone effects
Hormones transfer signals by migrating fromtheir site of synthesis to their site of action.They are usually transported in the blood. Inthis case, they are said to have an endocrineeffect (1; example: insulin). By contrast, tissuehormones, the target cells for which are in theimmediate vicinity of the glandular cells thatproduce them, are said to have a paracrineeffect (2; example: gastrointestinal tract hor-mones). When signal substances also pass ef-fects back to the cells that synthesize them,they are said to have an autocrine effect (3;example: prostaglandins). Autocrine effectsare often found in tumor cells (see p. 400),which stimulate their own proliferation inthis way.
Insulin, which is formed in the B cells of thepancreas, has both endocrine and paracrineeffects. As a hormone with endocrine effects,it regulates glucose and fat metabolism. Via aparacrine mechanism, it inhibits the synthesisand release of glucagon from the neighboringA cells.
B. Dynamics of the plasma level
Hormones circulate as signaling substances inthe blood at very low concentrations (10–12 tobetween 10–7 mol L–1). These values changeperiodically in rhythms that depend on thetime of day, month, or year, or on physiolog-ical cycles.
The first example shows the circadianrhythm of the cortisol level. As an activatorof gluconeogenesis (see p. 158), cortisol ismainly released in the early morning, whenthe liver’s glycogen stores are declining. Dur-ing the day, the plasma cortisol level declines.
Many hormones are released into the bloodin a spasmodic and irregular manner. In thiscase, their concentrations change in anepisodic or pulsatile fashion. This applies, forinstance, to luteinizing hormone (LH, lutropin).
Concentrations of other hormones areevent-regulated. For example, the body re-sponds to increased blood sugar levels aftermeals by releasing insulin. Regulation of hor-
mone synthesis, release, and degradation al-lows the blood concentrations of hormones tobe precisely adjusted. This is based either onsimple feedback control or on hierarchicallystructured regulatory systems.
C. Closed-loop feedback control
The biosynthesis and release of insulin by thepancreatic B cells (see p. 160) is stimulated byhigh blood glucose levels (> 5 mM). The in-sulin released then stimulates increased up-take and utilization of glucose by the cells ofthe muscle and adipose tissues. As a result,the blood glucose level falls back to its normalvalue, and further release of insulin stops.
D. Hormone hierarchy
Hormone systems are often linked to eachanother, giving rise in some cases to a hier-archy of higher-order and lower-order hor-mones. A particularly important example isthe pituitary–hypothalamic axis, which is con-trolled by the central nervous system (CNS).
Nerve cells in the hypothalamus react tostimulatory or inhibitory signals from the CNSby releasing activating or inhibiting factors,which are known as liberins (“releasing hor-mones”) and statins (“inhibiting hormones”).These neurohormones reach the adenohy-pophysis by short routes through the blood-stream. In the adenohypophysis, they stimu-late (liberins) or inhibit (statins) the bio-synthesis and release of tropines. Tropines(glandotropic hormones) in turn stimulate pe-ripheral glands to synthesize glandular hor-mones. Finally, the glandular hormone acts onits target cells in the organism. In addition, itpasses effects back to the higher-order hormonesystems. This (usually negative) feedback influ-ences theconcentrations of thehigher-order hor-mones, creating a feedback loop.
Many steroid hormones are regulated bythis type of axis—e. g., thyroxin, cortisol, es-tradiol, progesterone, and testosterone. In thecase of the glucocorticoids, the hypothalamusreleases corticotropin-releasing hormone(CRH or corticoliberin, a peptide consistingof 41 amino acids), which in turn releasescorticotropin (ACTH, 39 AAs) in the pituitarygland. Corticotropin stimulates synthesis andrelease of the glandular steroid hormone cor-tisol in the adrenal cortex.
372 Hormones
All rights reserved. Usage subject to terms and conditions of license.Koolman, Color Atlas of Biochemistry, 2nd edition © 2005 Thieme

H
H
VH
H
HH
HH H
H
HH
H
V
HH
H
H
V
H
H
H
mg · l-1
mU · ml-112 18 24 246 12 18
100
200
mU · ml-1
12 15 18 2421 3
10
20
30
6 9
Cortisol
12 15 18 2421 3
10
20
30
6 9
H
V
H
R
R
H
HH
Time of day
Time of day
A. Endocrine, paracrine and autocrine hormone effects
D. Hormone hierarchyB. Plasma level dynamics
C. Regulatory circuit
Pancreatic B cell
Muscle cell, fat cell
InsulinGlucose
Glucose
Metabolite
CNS
Hypo-thalamus
Pituitary
Tropin
Peripheralgland
Glandularhormone
Target cell
Precursors
Precursors
Negativefeed-back
Response
Liberin(releasinghormone)
Statin(inhibitinghormone)
1. Endocrine 2. Paracrine 3. Autocrine
Gland and target cell
Gland cell Targetcell
Hormone receptor
Bloodstream
Hormone
Time of day
Event-dependent
Periodic
Insulin
Lutropin Episodic, pulsatile
Meals
Precursors
373Hormonal system
All rights reserved. Usage subject to terms and conditions of license.Koolman, Color Atlas of Biochemistry, 2nd edition © 2005 Thieme

Lipophilic hormones
Classifying hormones into hydrophilic andlipophilic molecules indicates the chemicalproperties of the two groups of hormonesand also reflects differences in their mode ofaction (see p. 120).
A. Lipophilic hormones
Lipophilic hormones, which include steroidhormones, iodothyronines, and retinoic acid,are relatively small molecules (300–800 Da)that are poorly soluble in aqueous media.With the exception of the iodothyronines,they are not stored by hormone-forming cells,but are released immediately after being syn-thesized. During transport in the blood, theyare bound to specific carriers. Via intracellularreceptors, they mainly act on transcription(see p. 358). Other effects of steroid hor-mones—e. g., on the immune system—arenot based on transcriptional control. Theirdetails have not yet been explained.
Steroid hormones
The most important steroid hormones in ver-tebrates are listed on p. 57. Calcitriol (vitaminD hormone) is also included in this group,although it has a modified steroid structure.The most important steroid hormone in in-vertebrates is ecdysone.
Progesterone is a female sexual steroid be-longing to the progestin (gestagen) family. It issynthesized in the corpus luteum of the ova-ries. The blood level of progesterone varieswith the menstrual cycle. The hormone pre-pares the uterus for a possible pregnancy.Following fertilization, the placenta also startsto synthesize progesterone in order to main-tain the pregnant state. The development ofthe mammary glands is also stimulated byprogesterone.
Estradiol is the most important of theestrogens. Like progesterone, it is synthesizedby the ovaries and, during pregnancy, by theplacenta as well. Estradiol controls the men-strual cycle. It promotes proliferation of theuterine mucosa, and is also responsible for thedevelopment of the female secondary sexualcharacteristics (breast, fat distribution, etc.).
Testosterone is the most important of themale sexual steroids (androgens). It is synthe-sized in the Leydig intersitial cells of thetestes, and controls the development andfunctioning of the male gonads. It also deter-mines secondary sexual characteristics inmen (muscles, hair, etc.).
Cortisol, the most important glucocorticoid,is synthesized by the adrenal cortex. It is in-volved in regulating protein and carbohydratemetabolism by promoting protein degrada-tion and the conversion of amino acids intoglucose. As a result, the blood glucose levelrises (see p. 152). Synthetic glucocorticoids(e. g., dexamethasone) are used in drugs dueto their anti-inflammatory and immunosup-pressant effects.
Aldosterone, a mineralocorticoid, is alsosynthesized in the adrenal gland. In the kid-neys, it promotes Na+ resorption by inducingNa+/K+ ATPase and Na+ channels (see p. 328).At the same time, it leads to increased K+
excretion. In this way, aldosterone indirectlyincreases blood pressure.
Calcitriol is a derivative of vitamin D (seep. 364). On exposure to ultraviolet light, aprecursor of the hormone can also arise inthe skin. Calcitriol itself is synthesized in thekidneys (see p. 330). Calcitriol promotes theresorption of calcium in the intestine and in-creases the Ca2+ level in the blood.
Iodothyronines
The thyroid hormone thyroxine (tetraiodo-thyronine, T4) and its active form triiodo-thyronine (T3) are derived from the aminoacid tyrosine. The iodine atoms at positions 3and 5 of the two phenol rings are character-istic of them. Post-translational synthesis ofthyroxine takes place in the thyroid glandfrom tyrosine residues of the protein thyro-globulin, from which it is proteolyticallycleaved before being released. Iodothyroninesare the only organic molecules in the animalorganism that contain iodine. They increasethe basal metabolic rate, partly by regulatingmitochondrial ATP synthesis. In addition, theypromote embryonic development.
374 Hormones
All rights reserved. Usage subject to terms and conditions of license.Koolman, Color Atlas of Biochemistry, 2nd edition © 2005 Thieme

S
ATP
CO2
O2 H2O
Ca2
2K
3Na
2K
3Na
ProteolysisProtein synthesis
GluconeogeneseBlut-Glucose
Activity of the immunesystem
Progesterone
Hormone
Ovaries
Estradiol
Ovaries
Sites of action
Uterus
Prepares uterusfor pregnancy
Promotes implantationof fertilized egg
Maintenance ofpregnancy
Development ofmammary glands
Stimulates proliferationof endometrium
Testosterone
Testes
Cortisol
Causes:Sexual differentiationto male phenotypeFormation of ejaculateSpermatogenesis
Development ofsecondary malesex characteristicse.g., skeleton,muscles, body hairProtein synthesis
Calcitriol
Thyroxine
Thyroid gland
Embryo
Fetal development,growth, and maturation
Basal metabolic rateHeat generationO2 consumption
ATP, Heat
Uterus and other organs
Proteins Aminoacids
Glucose
Aldosterone ADP+Pi
Na retentionK excretion
Blood pressure
Ca2 - and phosphateresorption
Ca2 metabolismof bones
ADP+Pi
Actions
Adrenal glands(cortex)
Gut
Intermediarymetabolism
Bones
Adrenal glands(cortex)
Site of formation
A. Lipophilic hormones
Kidneys
Kidneys
Menstrual cycleBone developmentDevelopment ofsecondary femalesex characteristicse.g., fat distribution,breasts, body hair
375Lipophilic hormones
All rights reserved. Usage subject to terms and conditions of license.Koolman, Color Atlas of Biochemistry, 2nd edition © 2005 Thieme

Metabolism of steroid hormones
A. Biosynthesis of steroid hormones
All steroid hormones are synthesized fromcholesterol. The gonane core of cholesterolconsists of 19 carbon atoms in four rings(A–D). The D ring carries a side chain of eightC atoms (see p. 54).
The cholesterol required for biosynthesis ofthe steroid hormones is obtained from vari-ous sources. It is either taken up as a constit-uent of LDL lipoproteins (see p. 278) into thehormone-synthesizing glandular cells, or syn-thesized by glandular cells themselves fromacetyl-CoA (see p. 172). Excess cholesterol isstored in the form of fatty acid esters in lipiddroplets. Hydrolysis allows rapid mobilizationof the cholesterol from this reserve again.
Biosynthetic pathways. Only an overviewof the synthesis pathways that lead to theindividual hormones is shown here. Furtherdetails are given on p. 410.
Among the reactions involved, hydroxyla-tions (H) are particularly numerous. These arecatalyzed by specific monooxygenases (“hy-droxylases”) of the cytochrome P450 family(see p. 318). In addition, there are NADPH-dependent and NADP+-dependent hydrogena-tions (Y) and dehydrogenations (D), as well ascleavage and isomerization reactions (S, I). Theestrogens have a special place among the ste-roid hormones, as they are the only ones thatcontain an aromatic A ring. When this isformed, catalyzed by aromatase, the angularmethyl group (C-19) is lost.
Pregnenolone is an important intermedi-ate in the biosynthesis of most steroid hor-mones. It is identical to cholesterol with theexception of a shortened and oxidized sidechain. Pregnenolone is produced in threesteps by hydroxylation and cleavage in theside chain. Subsequent dehydrogenation ofthe hydroxyl group at C-3 (b) and shifting ofthe double bond from C-5 to C-4 results in thegestagen progesterone.
With the exception of calcitriol, all steroidhormones are derived from progesterone. Hy-droxylations of progesterone at C atoms 17,21, and 11 lead to the glucocorticoid cortisol.Hydroxylation at C-17 is omitted during syn-thesis of the mineralocorticoid aldosterone.Instead, the angular methyl group (C-18) isoxidized to the aldehyde group. During syn-
thesis of the androgen testosterone from pro-gesterone, the side chain is completely re-moved. Aromatization of the A ring, as men-tioned above, finally leads to estradiol.
On the way to calcitriol (vitamin D hor-mone; see p. 342), another double bond inthe B ring of cholesterol is first introduced.Under the influence of UV light on the skin,the B ring is then photochemically cleaved,and the secosteroid cholecalciferol arises (vi-tamin D3; see p. 364). Two Cyt P450-depen-dent hydroxylations in the liver and kidneysproduce the active vitamin D hormone (seep. 330).
B. Inactivation of steroid hormones
The steroid hormones are mainly inactivatedin the liver, where they are either reduced orfurther hydroxylated and then conjugatedwith glucuronic acid or sulfate for excretion(see p. 316). The reduction reactions attackoxo groups and the double bond in ring A. Acombination of several inactivation reactionsgives rise to many different steroid metabo-lites that have lost most of their hormonalactivity. Finally, they are excreted with theurine and also partly via the bile. Evidence ofsteroids and steroid metabolites in the urineis used to investigate the hormone metabo-lism.
Further information
Congenital defects in the biosynthesis of ste-roid hormones can lead to severe develop-mental disturbances. In the adrenogenitalsyndrome (AGS), which is relatively common,there is usually a defect in 21-hydroxylase,which is needed for synthesis of cortisol andaldosterone from progesterone. Reduced syn-thesis of this hormone leads to increased for-mation of testosterone, resulting in masculin-ization of female fetuses. With early diagno-sis, this condition can be avoided by providingthe mother with hormone treatment beforebirth.
376 Hormones
All rights reserved. Usage subject to terms and conditions of license.Koolman, Color Atlas of Biochemistry, 2nd edition © 2005 Thieme

1
H
H
D
ID
2
HDH
HS
AH Y
3
HA
C18
HSY
C19
HHHD
YD
HHH/S
C21
DSHHC27
HHH
HO
OH
O
OH
HO
CO
CH3
O
CO
CH3
O
OHC CO
CH2OH
HO
O
CO
2
HO OH
CH OH
HO
OH
HO OH
CH2
HO
OH
O
CO
CH2OH
HO OH
HO
A B
C D
O
CO
A B
C D
CH3
A B
C D
O
O
HYDHH
Cholesterol
Progesterone
Androstenedione
Cholesterol
Estradiol
Oxidation
Conjugateformation
Conjugate formation
Hydroxylation
A. Biosynthesis of steroid hormones
Cortisol
Conjugateformation
Conjugateformation
Reduction
Oxidative cleavage
Oxidation
Reduction
Estradiol
Progesterone
Pregnenolone Cortisol
Progesterone Aldosterone
Calcitriol
HydroxylationDehydrogenationIsomerizationHydrogenationCleavageAromatization
B. Inactivation of steroid hormones
H:D:I :Y:S:A:
377Lipophilic hormones
All rights reserved. Usage subject to terms and conditions of license.Koolman, Color Atlas of Biochemistry, 2nd edition © 2005 Thieme

Mechanism of action
A. Mechanism of action of lipophilichormones
Lipophilic signaling substances include thesteroid hormones, calcitriol, the iodothy-ronines (T3 and T4), and retinoic acid. Thesehormones mainly act in the nucleus of thetarget cells, where they regulate gene tran-scription in collaboration with their receptorsand with the support of additional proteins(known as coactivators and mediators; seep. 244). There are several effects of steroidhormones that are not mediated by transcrip-tion control. These alternative pathways forsteroid effects have not yet been fully ex-plained.
In the blood, there are a number of trans-port proteins for lipophilic hormones (seep. 276). Only the free hormone is able to pen-etrate the membrane and enter the cell. Thehormone encounters its receptor in the nu-cleus (and sometimes also in the cytoplasm).
The receptors for lipophilic hormones arerare proteins. They occur in small numbers(103–104 molecules per cell) and showmarked specificity and high affinity for thehormone (Kd = 10–8–10–10 M). After bindingto the hormone, the steroid receptors are ableto bind as homodimers or heterodimers tocontrol elements in the promoters of specificgenes, from where they can influence thetranscription of the affected genes—i. e., theyact as transcription factors.
The illustration shows the particularlywell-investigated mechanism of action forcortisol, which is unusual to the extent thatthe hormone–receptor complex alreadyarises in the cytoplasm. The free receptor ispresent in the cytoplasm as a monomer incomplex with the chaperone hsp90 (seep. 232). Binding of cortisol to the complexleads to an allosteric conformational changein the receptor, which is then released fromthe hsp90 and becomes capable of DNA bind-ing as a result of dimerization.
In the nucleus, the hormone–receptorcomplex binds to nucleotide sequencesknown as hormone response elements(HREs). These are short palindromic DNA seg-ments that usually promote transcription asenhancer elements (see p. 244). The illustra-tion shows the HRE for glucocorticoids (GRE;
“n” stands for any nucleotide). Each hormonereceptor only recognizes its “own” HRE andtherefore only influences the transcription ofgenes containing that HRE. Recognition be-tween the receptor and HRE is based on in-teraction between the amino acid residues inthe DNA-binding domain (B) and the relevantbases in the HRE (emphasized in color in thestructure illustrated).
As discussed on p. 244, the hormone recep-tor does not interact directly with the RNApolymerase, but rather—along with othertranscription factors—with a coactivator/me-diator complex that processes all of the sig-nals and passes them on to the polymerase. Inthis way, hormonal effects lead within a pe-riod of minutes to hours to altered levels ofmRNAs for key proteins in cellular processes(“cellular response”).
B. Steroid receptors
The receptors for lipophilic signaling substan-ces all belong to one protein superfamily. Theyare constructed in a modular fashion fromdomains with various lengths and functions.Starting from the N terminal, these are: theregulatory domain, the DNA-binding domain, anuclear localization sequence (see p. 228), andthe hormone-binding domain (see p. 73D).
The homology among receptors is particu-larly great in the area of the DNA-bindingdomain. The proteins have cysteine-rich se-quences here that coordinatively bind zincions (A, Cys shown in yellow, Zn2+ in lightblue). These centers, known as “zinc fingers”or “zinc clusters,” stabilize the domains andsupport their dimerization, but do not takepart in DNA binding directly. As in other tran-scription factors (see p. 118), “recognitionhelices” are responsible for that.
In addition to the receptors mentioned inA, the family of steroid receptors also includesthe product of the oncogene erb-A (seep. 398), the receptor for the environmentaltoxin dioxin, and other proteins for which adistinct hormone ligand has not been identi-fied (known as “orphan receptors”). Severalsteroid receptors—e. g., the retinoic acid re-ceptor—form functional heterodimers withorphan receptors.
378 Hormones
All rights reserved. Usage subject to terms and conditions of license.Koolman, Color Atlas of Biochemistry, 2nd edition © 2005 Thieme

hsp90
2x
hsp90
A/B C D E
An GGT CT n A AAnTC T
A nG G TC TnA A A n T C T
Hormone
RNApolymerase Gene
mRNA
Protein
Target cell
Nucleus
DNA-bindingdomain (dimer)bound to DNA
Hormonereceptor
DNA
Hormone response element (HRE)
Heat-shockprotein
A. Mechanism of action of lipophilic hormones
B. Receptors of lipophilic hormones
Nuclear-targetingsequence
Receptorgene
Variable length Domains
Regulatorydomain
DNA-bindingdomain
Hormone-bindingdomain
Receptor proteinDomain A/B100 – 600 aa
Domain E
~250 aa
Domain C~70 aaDomain D
Interaction with othernuclear components
Binds ligand
DNA
Hormone-receptordimer
Cell response
Translation
SteroidhormoneT3, T4CalcitriolRetinoic acid
Glucocorticoid receptor/DNA complex
with a total of400 – 1000 aa
Binds to DNA
379Lipophilic hormones
All rights reserved. Usage subject to terms and conditions of license.Koolman, Color Atlas of Biochemistry, 2nd edition © 2005 Thieme

Hydrophilic hormones
The hydrophilic hormones are derived fromamino acids, or are peptides and proteinscomposed of amino acids. Hormones withendocrine effects are synthesized in glandularcells and stored there in vesicles until they arereleased. As they are easily soluble, they donot need carrier proteins for transport in theblood. They bind on the plasma membrane ofthe target cells to receptors that pass the hor-monal signal on (signal transduction; seep. 384). Several hormones in this group haveparacrine effects—i. e., they only act in theimmediate vicinity of their site of synthesis(see p. 372).
A. Signaling substances derived from aminoacids
Histamine, serotonin, melatonin, and the cat-echolamines dopa, dopamine, norepineph-rine, and epinephrine are known as “biogenicamines.” They are produced from amino acidsby decarboxylation and usually act not only ashormones, but also as neurotransmitters.
Histamine, an important mediator (localsignaling substance) and neurotransmitter, ismainly stored in tissue mast cells and baso-philic granulocytes in the blood. It is involvedin inflammatory and allergic reactions. “His-tamine liberators” such as tissue hormones,type E immunoglobulins (see p. 300), anddrugs can release it. Histamine acts via vari-ous types of receptor. Binding to H1 receptorspromotes contraction of smooth muscle in thebronchia, and dilates the capillary vessels andincreases their permeability. Via H2 receptors,histamine slows down the heart rate and pro-motes the formation of HCl in the gastric mu-cosa. In the brain, histamine acts as a neuro-transmitter.
Epinephrine is a hormone synthesized inthe adrenal glands from tyrosine (seep. 352). Its release is subject to neuronal con-trol. This “emergency hormone” mainly actson the blood vessels, heart, and metabolism. Itconstricts the blood vessels and thereby in-creases blood pressure (via α1 and α2 recep-tors); it increases cardiac function (via β2 re-ceptors); it promotes the degradation of gly-cogen into glucose in the liver and muscles(via β2 receptors); and it dilates the bronchia(also via β2 receptors).
B. Examples of peptide hormones andproteohormones
Numerically the largest group of signalingsubstances, these arise by protein biosynthe-sis (see p. 382). The smallest peptide hor-mone, thyroliberin (362 Da), is a tripeptide.Proteohormones can reach masses of morethan 20 kDa—e. g., thyrotropin (28 kDa). Sim-ilarities in the primary structures of manypeptide hormones and proteohormonesshow that they are related to one another.They probably arose from common predeces-sors in the course of evolution.
Thyroliberin (thyrotropin-releasing hor-mone, TRH) is one of the neurohormones ofthe hypothalamus (see p. 330). It stimulatespituitary gland cells to secrete thyrotropin(TSH). TRH consists of three amino acids,which are modified in characteristic ways(see p. 353).
Thyrotropin (thyroid-stimulating hor-mone, TSH) and the related hormoneslutropin (luteinizing hormone, LH) andfollitropin (follicle-stimulating hormone,FSH) originate in the adenohypophysis. Theyare all dimeric glycoproteins with masses ofaround 28 kDa. Thyrotropin stimulates thesynthesis and secretion of thyroxin by thethyroid gland.
Insulin (for the structure, see p. 70) is pro-duced and released by the B cells of the pan-creas and is released when the glucose levelrises. Insulin reduces the blood sugar level bypromoting processes that consume glu-cose—e. g., glycolysis, glycogen synthesis,and conversion of glucose into fatty acids. Bycontrast, it inhibits gluconeogenesis and gly-cogen degradation. The transmission of theinsulin signal in the target cells is discussedin greater detail on p. 388.
Glucagon, a peptide of 29 amino acids, is aproduct of the A cells of the pancreas. It is theantagonist of insulin and, like insulin, mainlyinfluences carbohydrate and lipid metabo-lism. Its effects are each opposite to those ofinsulin. Glucagon mainly acts via the secondmessenger cAMP (see p. 384).
380 Hormones
All rights reserved. Usage subject to terms and conditions of license.Koolman, Color Atlas of Biochemistry, 2nd edition © 2005 Thieme

HCl
N
NH
CH2
CH2H3N
CH2H2N
CH
OH
OH
HO
CH3
Thyrotropinsecretion
Neurotransmitteraction
Synthesis andsecretion of thyroxine
Glucoseuptake by cellsBlood glucose
Storage compounds:formationdegradation
GlycogenolysisGluconeogenesisBlood glucose
Ketone bodyformation
Width of bronchi
Capillaries:widthpermeability
Gastric acidsecretionby parietal cells
Width ofblood vesselsBlood pressure
Cardiac output
Metabolism:GlycogenolysisBlood glucoseLipolysis
Actions
Thyroliberin(TRH)3 AA
Hypothalamus
TSHBrain
Thyrotropin(TSH)α chain 92 AAβ chain 112 AA Adeno-
hypophysisThyroidgland Thyroxine
Glucose
PancreasB cells Glycogen
Glucose
Proteins
PancreasA cells
Glycogen
Glucose Aminoacids
Fats
Fattyacids
Aminoacids
InsulinA chain 21 AAB chain 30 AA
Glucagon29 AA
Histamine
Histaminestores
LungsMast cell
Basophilicgranulocyte Stomach
Epinephrine
Adrenal glands(medulla)
Heart
MuscleLiverAdipose
tissue
A. Signaling substances derived from amino acids
B. Examples of peptide hormones and proteohormones
Pituitary
Fats
Fattyacids
Ketonebodies
Hormone Sites of formation Sites of action
381Hydrophilic hormones
All rights reserved. Usage subject to terms and conditions of license.Koolman, Color Atlas of Biochemistry, 2nd edition © 2005 Thieme

Metabolism of peptide hormones
Hydrophilic hormones and other water-solu-ble signaling substances have a variety of bio-synthetic pathways. Amino acid derivativesarise in special metabolic pathways (seep. 352) or through post-translational modi-fication (see p. 374). Proteohormones, like allproteins, result from translation in the ribo-some (see p. 250). Small peptide hormonesand neuropeptides, most of which only con-sist of 3–30 amino acids, are released fromprecursor proteins by proteolytic degradation.
A. Biosynthesis
The illustration shows the synthesis and pro-cessing of the precursor protein proopiome-lanocortin (POMC) as an example of the bio-synthesis of small peptides with signalingfunctions. POMC arises in cells of the adeno-hypophysis, and after processing in the rERand Golgi apparatus, it supplies the opiate-like peptides met-enkephalin and -endor-phin (implying “opio-”; see p. 352), threemelanocyte-stimulating hormones (α-, β- andγ-MSH, implying “melano-”), and the glan-dotropic hormone corticotropin (ACTH, im-plying “-cortin”). Additional products ofPOMC degradation include two lipotropinswith catabolic effects in the adipose tissue(β- and γ-LPH).
Some of the peptides mentioned are over-lapping in the POMC sequence. For example,additional cleavage of ACTH gives rise to α-MSH and corticotropin-like intermediarypeptide (CLIP). Proteolytic degradation of β-LPH provides γ-LPH and β-endorphin. Thelatter can be further broken down to yieldmet-enkephalin, while γ-LPH can still giverise to β-MSH (not shown). Due to the numer-ous derivative products with biological activ-ity that it has, POMC is also known as a poly-protein. Which end product is formed and inwhat amounts depends on the activity of theproteinases in the ER that catalyze the indi-vidual cleavages.
The principles underlying protein synthe-sis and protein maturation (see pp. 230–233)can be summed up once again using the ex-ample of POMC:
[1] As a result of transcription of the POMCgene and maturation of the hnRNA, a maturemRNA consisting of some 1100 nucleotides
arises, which is modified at both ends (seep. 246). This mRNA codes for prepro-POMC—i. e., a POMC protein that still has a signalpeptide for the ER at the N terminus (seep. 230).
[2] Prepro-POMC arises through translationin the rough endoplasmic reticulum (rER).The growing peptide chain is introducedinto the ER with the help of a signal peptide.
[3] Cleavage of the signal peptide and othermodifications in the ER (formation of disulfidebonds, glycosylation, phosphorylation) giverise to the mature prohormone (“pro-POMC”).
[4] The neuropeptides and hormones men-tioned are now formed by limited proteolysisand stored in vesicles. Release from thesevesicles takes place by exocytosis whenneeded.
The biosynthesis of peptide hormones andproteohormones, as well as their secretion, iscontrolled by higher-order regulatory sys-tems (see p. 372). Calcium ions are amongthe substances involved in this regulation assecond messengers; an increase in calciumions stimulates synthesis and secretion.
B. Degradation and inactivation
Degradation of peptide hormones often startsin the blood plasma or on the vascular walls;it is particularly intensive in the kidneys.
Several peptides that contain disulfidebonds (e. g., insulin) can be inactivated byreductive cleavage of the disulfide bonds (1).Peptides and proteins are also cleaved bypeptidases, starting from one end of the pep-tide by exopeptidases (2), or in the middle of itby proteinases (endopeptidases, 3). Proteoly-sis gives rise to a variety of hormone frag-ments, several of which are still biologicallyactive. Some peptide hormones and proteo-hormones are removed from the blood bybinding to their receptors with subsequentendocytosis of the hormone–receptor com-plex (4). They are then broken down in thelysosomes. All of the degradation reactionslead to amino acids, which become availableto the metabolism again.
382 Hormones
All rights reserved. Usage subject to terms and conditions of license.Koolman, Color Atlas of Biochemistry, 2nd edition © 2005 Thieme

87 ~3 900 151 ~2 8001
2
3
4
ACTH
β-MSH
210–214190–207
β-LPHACTH
5`
γ-MSH ACTH β-LPH
50–6 112–150 153–236
γ-MSH α-MSH-CLIP γ-LPH
P
P
P
α-MSH CLIP γ-LPH
112–124 129–150 153–207 220–236
AAAA---meGppp
3`
P
A. Biosynthesis
B. Degradation and inactivation
Signal peptidefor secretion
Chromosome
834 Base pairs
TATA-Box
Intron Exon
~1100 Nucleotides
Translationstop
Translationstart
Kappe Poly(A)sequence
Intron
β-Endorphinand otherpeptides
ACTH(Cortico-tropin)
Pro-ACTH
HumanchromosomewithPOMC gene
PeptidesencodedbyPOMC gene
POMC-mRNA
Met-Enke- phalin
Cleavage ofsignal peptide
Translation
Splicing
Transcription
β-Endorphin
DNA
Prohormone
Hormone
LimitedproteolysisProteinmodificationStorageSecretion
mRNA
Extracellular degradation: Intracellular degradation:
4. Binding to4. membrane receptors4. Endocytosis4. Degradation in lysosomes
1. Cleavage of1. disulfide bonds1. by reductases
2. Degradation by2. exopeptidases
3. Degradation by3. proteinases
Disulfide bond
β-En-dorphin
383Hydrophilic hormones
All rights reserved. Usage subject to terms and conditions of license.Koolman, Color Atlas of Biochemistry, 2nd edition © 2005 Thieme

Mechanisms of action
The messages transmitted by hydrophilic sig-naling substances (see p. 380) are sent to theinterior of the cell by membrane receptors.These bind the hormone on the outside ofthe cell and trigger a new second signal onthe inside by altering their conformation. Inthe interior of the cell, this secondary signalinfluences the activity of enzymes or ionchannels. Via further steps, switching of themetabolism, changes in the cytoskeleton, andactivation or inhibition of transcription factorscan occur (“signal transduction”) can occur.
A. Mechanisms of action
Receptors are classified into three differenttypes according to their structure (see alsop. 224):
1. 1-Helix receptors (left) are proteins thatspan the membrane with only one α-helix. Ontheir inner (cytoplasmic) side, they have do-mains with allosterically activatable enzymeactivity. In most cases, these are tyrosinekinases.
Insulins (see p. 388), growth factors, andcytokines (see p. 392), for example, act via 1-helix receptors. Binding of the signaling sub-stance leads to activation of internal kinaseactivity (in some cases, dimerization of thereceptor is needed for this). The activatedkinase phosphorylates itself using ATP (auto-phosphorylation), and also phosphorylates ty-rosine residues of other proteins (known asreceptor substrates). Adaptor proteins thatrecognize the phosphotyrosine residues bindto the phosphorylated proteins (see pp. 388,392). They pass the signal on to other proteinkinases.
2. Ion channels (center). These receptorscontain ligand-gated ion channels. Binding ofthe signaling substance opens the channelsfor ions such as Na+, K+, Ca2+, and Cl–. Thismechanism is mainly used by neurotrans-mitters such as acetylcholine (nicotinic recep-tor; see p. 224) and GABA (A receptor; seep. 354).
3. 7-Helix receptors (serpentine receptors,right) represent a large group of membrane pro-teins that transfer the hormone or transmittersignal,with the helpofG proteins (see below), toeffector proteins that alter the concentrationsof ions and second messengers (see B).
B. Signal transduction by G proteins
G proteins transfer signals from 7-helix re-ceptors to effector proteins (see above). Gprotein are heterotrimers consisting of threedifferent types of subunit (α, β , and γ; seep. 224). The α-subunit can bind GDP or GTP(hence the name “G protein”) and has GTPaseactivity. Receptor-coupled G proteins are re-lated to other GTP-binding proteins such asRas (see pp. 388, 398) and EF-Tu (see p. 252).
G proteins are divided into several types,depending on their effects. Stimulatory G pro-teins (Gs) are widespread. They activate ad-enylate cyclases (see below) or influence ionchannels. Inhibitory G proteins (Gi) inhibit ad-enylate cyclase. G proteins in the Gq familyactivate another effector enzyme—phospholi-pase c (see p. 386).
Binding of the signaling substance to a 7-helix receptor alters the receptor conforma-tion in such a way that the corresponding Gprotein can attach on the inside of the cell.This causes the α-subunit of the G protein toexchange bound GDP for GTP (1). The G pro-tein then separates from the receptor anddissociates into an α-subunit and a βγ-unit.Both of these components bind to other mem-brane proteins and alter their activity; ionchannels are opened or closed, and enzymesare activated or inactivated.
In the case of the β2-catecholamine recep-tor (illustrated here), the α-subunit of the Gs
protein, by binding to adenylate cyclase, leadsto the synthesis of the second messengercAMP. cAMP activates protein kinase A, whichin turn activates or inhibits other proteins (2;see p.120).
The βγ-unit of the G protein stimulates akinase (βARK, not shown), which phosphory-lates the receptor. This reduces its af nity forthe hormone and leads to binding of theblocking protein arrestin. The internal GTPaseactivity of the α-subunit hydrolyzes thebound GTP to GDP within a period of secondsto minutes, and thereby terminates the actionof the G protein on the adenylate cyclase (3).
384 Hormones
All rights reserved. Usage subject to terms and conditions of license.Koolman, Color Atlas of Biochemistry, 2nd edition © 2005 Thieme

PK-APK-GPK-C
cAMPcGMPDAGInsP3
Ca2
NOCa2
NaKCl
1. 2.
cAMP
GTP ATPPP
GDP
P
ATP ADP
GDP
3.
1
1 1 1
P
P
+
u.a.
Hydro-philicsignalingsubstance
1. 1-Helix receptor 2. Ion channel 3. 7-Helixreceptor
Pore forions
7 Trans-membranehelices
G protein
Cytoplasm
Transcription factors
Nucleus
Transcription
Protein kinases (PKs)Protein phosphatases
and manyothers
Metabolism Cytoskeleton
Effector enzyme
G protein
modulatere
gulate
phosphorylate modify
Second messengerIon concentration
Enzymes
formsincreases
Secondmessenger
G protein(Gs)
Activated 7-helix receptor
GTPGDP
Signalingsubstance
Activeα-unit
β, γ-unit
A. Mechanisms of action
B. Signal transduction by G proteins
Tyrosinekinase
Receptorsubstrate
Otherenzymes
Inactiveα-unit
Arrestin
Adenylate cyclase 4.6.1.1
Signalingsubstance
Signalingsubstance
Adenylate cyclasePhospholipase Cand A2Guanylate cyclase
385Hydrophilic hormones
All rights reserved. Usage subject to terms and conditions of license.Koolman, Color Atlas of Biochemistry, 2nd edition © 2005 Thieme

Second messengers
Second messengers are intracellular chemicalsignals, the concentration of which is regu-lated by hormones, neurotransmitters, andother extracellular signals (see p. 384). Theyarise from easily available substrates and onlyhave a short half-life. The most importantsecond messengers are cAMP, cGMP, Ca2+, in-ositol triphosphate (InsP3), diacylglycerol(DAG), and nitrogen monoxide (NO).
A. Cyclic AMP
Metabolism. The nucleotide cAMP (adenosine3,5-cyclic monophosphate) is synthesizedby membrane-bound adenylate cyclases [1]on the inside of the plasma membrane. Theadenylate cyclases are a family of enzymesthat cyclize ATP to cAMP by cleaving diphos-phate (PPi). The degradation of cAMP to AMPis catalyzed by phosphodiesterases [2], whichare inhibited by methylxanthines such as caf-feine, for example. By contrast, insulin acti-vates the esterase and thereby reduces thecAMP level (see p. 388).
Adenylate cyclase activity is regulated by Gproteins (Gs and Gi), which in turn are con-trolled by extracellular signals via 7-helix re-ceptors (see p. 384). Ca2+-calmodulin (see be-low) also activates specific adenylate cyclases.
Action. cAMP is an allosteric effector ofprotein kinase A (PK-A, [3]). In the inactivestate, PK-A is a heterotetramer (C2R2), thecatalytic subunits of which (C) are blockedby regulatory units (R; autoinhibition).When cAMP binds to the regulatory units,the C units separate from the R units andbecome enzymatically active. Active PK-Aphosphorylates serine and threonine residuesof more than 100 different proteins, enzymes,and transcription factors. In addition to cAMP,cGMP also acts as a second messenger. It isinvolved in sight (see p. 358) and in the signaltransduction of NO (see p. 388).
B. Inositol 1,4,5-trisphosphate anddiacylglycerol
Type Gq G proteins activate phospholipase C[4]. This enzyme creates two second messen-gers from the double-phosphorylated mem-brane phospholipid phosphatidylinositolbisphosphate (PInsP2), i. e., inositol 1,4,5-tris-
phosphate (InsP3), which is soluble, and diac-ylglycerol (DAG). InsP3 migrates to the endo-plasmic reticulum (ER), where it opens Ca2+
channels that allow Ca2+ to flow into the cy-toplasm (see C). By contrast, DAG, which islipophilic, remains in the membrane, whereit activates type C protein kinases, whichphosphorylate proteins in the presence ofCa2+ ions and thereby pass the signal on.
C. Calcium ions
Calcium level. Ca2+ (see p. 342) is a signalingsubstance. The concentration of Ca2+ ionsin the cytoplasm is normally very low(10–100 nM), as it is kept down by ATP-driven Ca2+ pumps and Na+/Ca2+ exchangers.In addition, many proteins in the cytoplasmand organelles bind calcium and thus act asCa2+ buffers.
Specific signals (e. g., an action potential orsecond messenger such as InsP3 or cAMP) cantrigger a sudden increase in the cytoplasmicCa2+ level to 500–1000 nM by openingCa2+ channels in the plasma membrane or inthe membranes of the endoplasmic or sarco-plasmic reticulum. Ryanodine, a plant sub-stance, acts in this way on a specific channelin the ER. In the cytoplasm, the Ca2+ levelalways only rises very briefly (Ca2+ “spikes”),as prolonged high concentrations in the cyto-plasm have cytotoxic effects.
Calcium effects. The biochemical effects ofCa2+ in the cytoplasm are mediated by specialCa2+-binding proteins (“calcium sensors”).These include the annexins, calmodulin, andtroponin C in muscle (see p. 334). Calmodulinis a relatively small protein (17 kDa) that oc-curs in all animal cells. Binding of four Ca2+
ions (light blue) converts it into a regulatoryelement. Via a dramatic conformationalchange (cf. 2a and 2b), Ca2+-calmodulin entersinto interaction with other proteins and mod-ulates their properties. Using this mechanism,Ca2+ ions regulate the activity of enzymes, ionpumps, and components of the cytoskeleton.
386 Hormones
All rights reserved. Usage subject to terms and conditions of license.Koolman, Color Atlas of Biochemistry, 2nd edition © 2005 Thieme

1 cAMPATP
PPi H2O
AMP2
3
1
2
P
ATP
ADP
3
5'
3'
N
CHN
C
CC
NHC
N
NH2
OCH2
O
H
O OH
HH H
PO
OGiGs
Na
ATP
ADP
ER/SR
ATP
ATP
ADP
500-1000 nM
ca. 2 500 000 nM
10-100 nM
Pi Pi
Ca2 Ca2
Ca2
Ca2
Ca2
a
b
cAMP
InsP3
P
4
H2O
4
P P O
O
OH
OOH
H
H
H
HOH
PH H
P
P
Ca2
InsP3Ca2
Ca2
A. Cyclic AMP
7 Helix receptors
G proteins
EnzymesTranscriptionfactorsIon channels
Adenylate cyclase 4.6.1.1
Phosphodiesterase 3.1.4.17
Protein kinase A 2.7.1.37
cAMP
Protein kinase A
Caffeine
Ryanodine
Depolarization
Glutamate
2. Calmodulin
Calcium-bindingprotein
1. Calcium transport
B. Inositol 1,4,5-trisphosphate and diacylglycerol
7 Helixreceptors
Inositol
PlnsP2
DAG (Diacylglycerol)
Proteinkinase C
Gly
cero
lAcyl residue 1
Acyl residue 2
IntracellularCa2
release
G protein (Gq)
Phospholipid
Phospholipase C 3.1.4.3
C. Calcium ions
387Hydrophilic hormones
All rights reserved. Usage subject to terms and conditions of license.Koolman, Color Atlas of Biochemistry, 2nd edition © 2005 Thieme

Signal cascades
The signal transduction pathways that medi-ate the effects of the metabolic hormone in-sulin are of particular medical interest (see A).The mediator nitrogen monoxide (NO) is alsoclinically important, as it regulates vascularcaliber and thus the body’s perfusion withblood (see B).
A. Insulin: signal transduction
The diverse effects of insulin (see p. 160) aremediated by protein kinases that mutuallyactivate each other in the form of enzymecascades. At the end of this chain there arekinases that influence gene transcription inthe nucleus by phosphorylating target pro-teins, or promote the uptake of glucose andits conversion into glycogen. The signal trans-duction pathways involved have not yet beenfully explained. They are presented here in asimplified form.
The insulin receptor (top) is a dimer withsubunits that have activatable tyrosine kinasedomains in the interior of the cell (see p. 224).Binding of the hormone increases the tyrosinekinase activity of the receptor, which thenphosphorylates itself and other proteins(receptor substrates) at various tyrosine re-sidues. Adaptor proteins, which conduct thesignal further, bind to the phosphotyrosineresidues.
The effects of insulin on transcription areshown on the left of the illustration. Adaptorproteins Grb-2 and SOS (“son of sevenless”)bind to the phosphorylated IRS (insulin-re-ceptor substrate) and activate the G proteinRas (named after its gene, the oncogene ras;see p. 398). Ras activates the protein kinaseRaf (another oncogene product). Raf sets inmotion a phosphorylation cascade that leadsvia the kinases MEK and ERK (also known asMAPK, “mitogen-activated protein kinase”) tothe phosphorylation of transcription factorsin the nucleus.
Some of the effects of insulin on the carbo-hydrate metabolism (right part of the illustra-tion) are possible without protein synthesis.In addition to Grb-2, another dimeric adaptorprotein can also bind to phosphorylated IRS.This adaptor protein thereby acquires phos-phatidylinositol-3-kinase activity (PI3K) and,in the membrane, phosphorylates phospholi-
pids from the phosphatidylinositol group (seep. 50) at position 3. Protein kinase PDK-1binds to these reaction products, becomingactivated itself and in turn activating proteinkinase B (PK-B).
This has several effects. In a manner not yetfully understood, PK-B leads to the fusionwith the plasma membrane of vesicles thatcontain the glucose transporter Glut-4. Thisresults in inclusion of Glut-4 in the membraneand thus to increased glucose uptake into themuscles and adipose tissue (see p. 160). Inaddition, PK-B inhibits glycogen synthase kin-ase 3 (GSK-3) by phosphorylation. As GSK-3 inturn inhibits glycogen synthase by phosphor-ylation (see p. 120), its inhibition by PK-Bleads to increased glycogen synthesis. Proteinphosphatase-1 (PP-1) converts glycogen syn-thase into its active form by dephosphoryla-tion (see p. 120). PP-1 is also activated byinsulin.
B. Nitrogen monoxide (NO) as a mediator
Nitrogen monoxide (NO) is a short-lived rad-ical that functions as a locally acting mediator(see p. 370).
In a complex reaction, NO arises from argi-nine in the endothelial cells of the blood ves-sels [1]. The trigger for this is Ca2+-calmodulin(see p. 386), which forms when there is anincrease in the cytoplasmic Ca2+ level.
NO diffuses from the endothelium into theunderlying vascular muscle cells, where itleads, as a result of activation of guanylatecyclase [2], to the formation of the secondmessenger cGMP (see pp. 358, 384). Finally,by activating a special protein kinase (PK-G),cGMP triggers relaxation of the smoothmuscle and thus dilation of the vessels. Theeffects of atrionatriuretic peptide (ANP; seep. 328) in reducing blood pressure are alsomediated by cGMP-induced vasodilation. Inthis case, cGMP is formed by the guanylatecyclase activity of the ANP receptor.
Further information
The drug nitroglycerin (glyceryl trinitrate),which is used in the treatment of anginapectoris, releases NO in the bloodstream andthereby leads to better perfusion of cardiacmuscle.
388 Hormones
All rights reserved. Usage subject to terms and conditions of license.Koolman, Color Atlas of Biochemistry, 2nd edition © 2005 Thieme

Ras
SOS
Grb-2 IRS-1
P P
P P
P
P
N AP
N AP
P
α α
β β
PDK-1
PK-B
PP-1
GSK-3
Glut-4
Ca2
InsP3
PK-G
ANP
NO·NO·
P
5'
3'
OCH2
O
H
O OH
HH H
PO
OcGMP
GTP
GTP
Ca2
ER
1
Ca2
?
GP P P
P
GP P P
P
2
32 O2
2 H2O
3/2
3/2
A. Insulin: signal transduction
B. Nitrogen monoxide (NO) as a mediator
Insulinreceptor
Insulin Phosphatidyl-inositols
Raf
GlucosePhosphatidyl-inositol3-phosphate
MEK(MAPKK)
MAPK(ERK)
Nucleus
Transcriptionfactors
Activatedtranscriptionfactors DNA
Promoter
Signalingsubstance
NO synthase 1.14.13.39 Guanylate cyclase 4.6.1.2 ANF receptor 4.6.1.2
Transcription
Intracellularvesicle
Glycogen synthase(active)
Glycogensynthesis
Glut-4
Arginine
Endothelial cell Vascular muscle cell
Physiological effects
Calmodulin
Citrulline
Glucoseuptake
Protein kinase Inactive
Active
Guanine
PI-3-Kinase
Protein phosphatase
1 2 3
389Hydrophilic hormones
All rights reserved. Usage subject to terms and conditions of license.Koolman, Color Atlas of Biochemistry, 2nd edition © 2005 Thieme

Eicosanoids
The eicosanoids are a group of signaling sub-stances that arise from the C-20 fatty acidarachidonic acid and therefore usually contain20 C atoms (Greek eicosa = 20). As mediators,they influence a large number of physiologicalprocesses (see below). Eicosanoid metabolismis therefore an important drug target. Asshort-lived substances, eicosanoids only actin the vicinity of their site of synthesis (para-crine effect; see p. 372).
A. Eicosanoids
Biosynthesis. Almost all of the body’s cellsform eicosanoids. Membrane phospholipidsthat contain the polyunsaturated fatty acidarachidonic acid (20:4; see p. 48) provide thestarting material.
Initially, phospholipase A2 [1] releases thearachidonate moiety from these phospholi-pids.TheactivityofphospholipaseA2 is strictlyregulated. It is activated by hormones andother signals via G proteins. The arachidonatereleased is a signaling substance itself. How-ever, its metabolites are even more important.
Two different pathways lead from arachi-donate to prostaglandins, prostacyclins, andthromboxanes, on the one hand, or leuko-trienes on the other. The key enzyme for thefirst pathway is prostaglandin synthase [2].Using up O2, it catalyzes in a two-step reac-tion the cyclization of arachidonate to prosta-glandin H2, the parent substance for the pros-taglandins, prostacyclins, and thromboxanes.Acetylsalicylic acid (aspirin) irreversibly ace-tylates a serine residue near the active centerof prostaglandin synthase, so that access forsubstrates is blocked (see below).
As a result of the action of lipoxygenases [3],hydroxyfatty acids and hydroperoxyfatty acidsare formed from arachidonate, from whichelimination of water and various conversionreactions give rise to the leukotrienes. The for-mulae only show one representative from eachof the various groups of eicosanoids.
Effects. Eicosanoids act via membrane re-ceptors in the immediate vicinity of their siteof synthesis, both on the synthesizing cellitself (autocrine action) and on neighboringcells (paracrine action). Many of their effectsare mediated by the second messengers cAMPand cGMP.
The eicosanoids have a very wide range ofphysiological effects. As they can stimulate orinhibit smooth-muscle contraction, depend-ing on the substance concerned, they affectblood pressure, respiration, and intestinal anduterine activity, among other properties. Inthe stomach, prostaglandins inhibit HCl se-cretion via Gi proteins (see p. 270). At thesame time, they promote mucus secretion,which protects the gastric mucosa againstthe acid. In addition, prostaglandins are in-volved in bone metabolism and in the activityof the sympathetic nervous system. In theimmune system, prostaglandins are impor-tant in the inflammatory reaction. Amongother things, they attract leukocytes to thesite of infection. Eicosanoids are also deci-sively involved in the development of painand fever. The thromboxanes promote throm-bocyte aggregation and other processes in-volved in hemostasis (see p. 290).
Metabolism. Eicosanoids are inactivatedwithin a period of seconds to minutes. Thistakes place by enzymatic reduction of doublebonds and dehydrogenation of hydroxylgroups. As a result of this rapid degradation,their range is very limited.
Further information
Acetylsalicylic acid and related non-steroidalanti-inflammatory drugs (NSAIDs) selectivelyinhibit the cyclooxygenase activity of prosta-glandin synthase [2] and consequently thesynthesis of most eicosanoids. This explainstheir analgesic, antipyretic, and antirheumaticeffects. Frequent side effects of NSAIDs alsoresult from inhibition of eicosanoid synthesis.For example, they impair hemostasis becausethe synthesis of thromboxanes by thrombo-cytes is inhibited. In the stomach, NSAIDs in-crease HCl secretion and at the same timeinhibit the formation of protective mucus.Long-term NSAID use can therefore damagethe gastric mucosa.
390 Hormones
All rights reserved. Usage subject to terms and conditions of license.Koolman, Color Atlas of Biochemistry, 2nd edition © 2005 Thieme

Ser
COO
CH3
COOOH
S Cys
CH3
Gly
COO
CH3
O
OH OHH
H
CH3
H OHHHO
O
COO
COO
CH3
H OHH
HHO
HO
COO
CH3
H OHH
H
O
HO
HO
Arachidonic acid
Hormones andother signals
Lysophospholipid
Prostaglandinsynthase
Hydroxy- andHydroperoxy fatty acids
Essentialfatty acids:Linoleic acid
Linolenic acid
Thromboxane B2Prostaglandin F2αProstacyclin I2
Leukotriene D4
Contraction of smooth muscleBiosynthesis of steroid hormonesGastric juice secretion
Hormone-controlled lipasesThrombocyte aggregationPain productionInflammatory response
Effects: Stimulation of
Prostaglandin H2
Arachidonate
Phospholipid
Inclusion in
Heme
Arachidonate
Peroxidasecenter
Cyclooxy-genasechannel
Arachidonate lipoxygenases 1.13.11. n
Prostaglandin H-synthase [heme](dioxygenase + peroxidase) 1.14.99.1
Phospholipase A2 3.1.1.4
Prosta-glandinsynthase
Lipoxygenase
Prostaglandin H2
A. Eicosanoids
Prostacyclins ThromboxanesProstaglandins
Leukotrienes
Acetylsalicylicacid
2 3
2
3
1
1
391Other signaling substances
All rights reserved. Usage subject to terms and conditions of license.Koolman, Color Atlas of Biochemistry, 2nd edition © 2005 Thieme

Cytokines
A. Cytokines
Cytokines are hormone-like peptides and pro-teins with signaling functions, which are syn-thesized and released by cells of the immunesystem and other cell types. Their numerousbiological functions operate in three areas:they regulate the development and homeosta-sis of the immune system; they control thehematopoietic system; and they are involvedin non-specific defense, influencing inflamma-tory processes, blood coagulation, and bloodpressure. In general, cytokines regulate thegrowth, differentiation, and survival of cells.They are also involved in regulating apoptosis(see p. 396).
There is an extremely large number of cy-tokines; only the most important representa-tives are listed opposite. The cytokinesinclude interleukins (IL), lymphokines, mono-kines, chemokines, interferons (IFN), and col-ony-stimulating factors (CSF). Via interleukins,immune cells stimulate the proliferation andactivity of other immune cells (see p. 294).Interferons are used medically in the treat-ment of viral infections and other diseases.
Although cytokines rarely show structuralhomologies with each other, their effects areoften very similar. The cytokines differ fromhormones (see p. 370) only in certain re-spects: they are released by many differentcells, rather than being secreted by definedglands, and they regulate a wider variety oftarget cells than the hormones.
B. Signal transduction in the cytokines
As peptides or proteins, the cytokines are hy-drophilic signaling substances that act bybinding to receptors on the cell surface (seep. 380). Binding of a cytokine to its receptor(1) leads via several intermediate steps (2 –5)to the activation of transcription of specificgenes (6).
In contrast to the receptors for insulin andgrowth factors (see p. 388), the cytokine re-ceptors (with a few exceptions) have no ty-rosine kinase activity. After binding of cyto-kine (1), they associate with one another toform homodimers, join together with othersignal transduction proteins (STPs) to formdimers, or promote dimerization of other
STPs (2). Class I cytokine receptors interactwith three different STPs (gp130, βc, and γc).The STPs themselves do not bind cytokines,but conduct the signal to tyrosine kinases (3).The fact that different cytokines can activatethe same STP via their receptors explains theoverlapping biological activity of some cyto-kines.
As an example of the signal transductionpathway in cytokines, the illustration showsthe way in which the IL-6 receptor, after bind-ing its ligand IL-6 (1), induces the dimeriza-tion of the STP gp130 (2). The dimeric gp130binds cytoplasmic tyrosine kinases from theJak family (“Janus kinases,” with two kinasecenters) and activates them (3). The Januskinases phosphorylate cytokine receptors,STPs, and various cytoplasmic proteins thatconduct the signal further. In addition, theyphosphorylate transcription factors known asSTATs (“signal transducers and activators oftranscription”). STATs are among the proteinsthat have an SH2 domain and are able to bindphosphotyrosine residues (see p. 388). Theytherefore bind to cytokine receptors that havebeen phosphorylated by Janus kinases. WhenSTATs are then also phosphorylated them-selves (4), they are converted into their activeform and become dimers (5). After transfer tothe nucleus, they bind—along with auxiliaryproteins as transcription factors—to the pro-moters of inducible genes and in this wayregulate their transcription (6).
The activity of the cytokine receptors isterminated by protein phosphatases, whichhydrolytically cleave the phosphotyrosineresidues. Several cytokine receptors are ableto lose their ligand-binding extracellular do-main by proteolysis (not shown). The extra-cellular domain then appears in the blood,where it competes for cytokines. This reducesthe effective cytokine concentration.
392 Hormones
All rights reserved. Usage subject to terms and conditions of license.Koolman, Color Atlas of Biochemistry, 2nd edition © 2005 Thieme

6
STAT
54
IL-6
STAT
gp 1301
432
5
ATPADP
ATP
ADP
43 5
Tyr
Transcriptional controlNucleus
A. Cytokines
B. Signal transduction in the cytokines
PhosphorylationDimerization
STATdimer
Phospho-tyrosineresidue
SH2 domaincan bindphospho-tyrosineresidues
IL-6receptor
Janus kinase
STAT dimer
STAT
gp 130
Januskinase
Phosphorylation of STAT
Dimerization of STAT
IL-1IL-2IL-3IL-4IL-5IL-6IFN-αIFN-βIFN-γ
Interleukin 1Interleukin 2Interleukin 3Interleukin 4Interleukin 5Interleukin 6Interferon αInterferon βInterferon γ
G-CSFGM-CSF
MIFM-CSFTNFαTNFβ
and others
Granulocyte colony-stimulating factorGranulocyte/macrophage colony-stimulatingfactorMacrophage migration inhibitory factorMonocyte colony-stimulating factorTumor necrosis factor- αTumor necrosis factor- β
Cytokine
Effects on manycell types
Signal peptideor signal protein
Secretion byindividual cells
Nonspecific defense
Hematopoietic system
Immune system
393Other signaling substances
All rights reserved. Usage subject to terms and conditions of license.Koolman, Color Atlas of Biochemistry, 2nd edition © 2005 Thieme

Cell cycle
A. Cell cycle
Proliferating cells undergo a cycle of division(the cell cycle), which lasts approximately24 hours in mammalian cells in cell culture.The cycle is divided into four different phases(G1, S, G2, and M—in that sequence).
Fully differentiated animal cells only dividerarely. These cells are in the so-called G0
phase, in which they can remain permanently.Some G0 cells return to the G1 phase againunder the influence of mitogenic signals(growth factors, cytokines, tumor viruses,etc.), and after crossing a control point (G1 toS), enter a new cycle. DNA is replicated (seep. 240) during the S phase, and new chroma-tin is formed. Particularly remarkable in mor-phological terms is the actual mitosis (Mphase), in which the chromosomes separateand two daughter cells are formed. The M andS phases are separated by two segmentsknown as the G1 and G2 phases (the G standsfor “gap”). In the G1 phase, the duration ofwhich can vary, the cell grows by de novosynthesis of cell components. Together, theG1, G0, S, and G2 phases are referred to asthe interphase, which alternates in the cellcycle with the short M phase.
B. Control of the cell cycle
The progression of the cell cycle is regulatedby interconversion processes. In each phase,special Ser/Thr-specific protein kinases areformed, which are known as cyclin-depen-dent kinases (CDKs). This term is used be-cause they have to bind an activator protein(cyclin) in order to become active. At eachcontrol point in the cycle, specific CDKs asso-ciate with equally phase-specific cyclins. Ifthere are no problems (e. g., DNA damage),the CDK–cyclin complex is activated by phos-phorylation and/or dephosphorylation. Theactivated complex in turn phosphorylatestranscription factors, which finally lead tothe formation of the proteins that are re-quired in the cell cycle phase concerned (en-zymes, cytoskeleton components, other CDKs,and cyclins). The activity of the CDK–cyclincomplex is then terminated again by pro-teolytic cyclin degradation.
The above outline of cell cycle progressioncan be examined here in more detail using theG2–M transition as an example.
Entry of animal cells into mitosis is basedon the “mitosis-promoting factor” (MPF). MPFconsists of CDK1 (cdc2) and cyclin B. The in-tracellular concentration of cyclin B increasesconstantly until mitosis starts, and then de-clines again rapidly (top left). MPF is initiallyinactive, because CDK1 is phosphorylated andcyclin B is dephosphorylated (top center). TheM phase is triggered when a protein phos-phatase [1] dephosphorylates the CDK whilecyclin B is phosphorylated by a kinase [2]. Inits active form, MPF phosphorylates variousproteins that have functions in mitosis—e. g.,histone H1 (see p. 238), components of thecytoskeleton such as the laminins in the nu-clear membrane, transcription factors, mitoticspindle proteins, and various enzymes.
When mitosis has been completed, cyclin Bis marked with ubiquitin and broken downproteolytically by proteasomes (see p. 176).Protein phosphatases then regain controland dephosphorylate the proteins involvedin mitosis. This returns the cell to the inter-phase.
Further information
The G1–S transition (not shown) is particu-larly important for initiating the cell cycle. Itis triggered by the CDK4–cyclin D complex,which by phosphorylating the protein pRbreleases the transcription factor E2F previ-ously bound to pRb. This activates the tran-scription of genes needed for DNA replication.
If the DNA is damaged by mutagens or ion-izing radiation, the protein p53 initially delaysentry into the S phase. If the DNA repair sys-tem (see p. 256) does not succeed in remov-ing the DNA damage, p53 forces the cell intoapoptosis (see p. 396). The genes coding forpRb and p53 belong to the tumor-suppressorgenes (see p. 398). In many tumors (seep. 400), these genes are in fact damaged bymutation.
394 Growth and development
All rights reserved. Usage subject to terms and conditions of license.Koolman, Color Atlas of Biochemistry, 2nd edition © 2005 Thieme

P PAA
P P P
P
P
P
P
AP P P
M M M M
2
11
11
2
11
12h
0 h
8 h
4 h
P
P
A. Cell cycle
B. Control of the cell cycle
Cyclin B concentration
Time
Cyclin BCyclin-dependentprotein kinase (CDK1)
Regulatorysubunit
Catalyticsubunit
Inactiveproteinkinase
MPFActive protein kinase
Interphase
Protein
Histone H1LamininProtein kinasesTranscriptionfactors
Other proteins
Mitosis
Spindle formationChromosomecondensationDisappearance ofnuclear membraneTranscription stopCyclin degradation
Reactions latein mitosis
M = Mitosis
Cyclinfragments
Phosphoproteinphosphatase
Protein kinase
MitosisChromosomeseparationCell division
DNA replicationHistone synthesisCentrosome formedChromosomeduplication
Preparationfor mitosis
G2 phase
M phase G1 phase
G0 phase
No celldivision
Restrictionpoint
S phase
RNA and proteinsynthesisCell growth
Cyclin-dependentproteinkinases
CDK 1 – 6
Cyclin
Cyclins A – E
Reactions earlyin mitosis
Proteolysis
395Cell proliferation
All rights reserved. Usage subject to terms and conditions of license.Koolman, Color Atlas of Biochemistry, 2nd edition © 2005 Thieme

Apoptosis
A. Cell proliferation and apoptosis
The number of cells in any tissue is mainlyregulated by two processes—cell proliferationand physiological cell death, apoptosis. Both ofthese processes are regulated by stimulatoryand inhibitory factors that act in solute form(growth factors and cytokines) or are pre-sented in bound form on the surface of neigh-boring cells (see below).
Apoptosis is genetically programmed celldeath, which leads to “tidy” breakdown anddisposal of cells. Morphologically, apoptosis ischaracterized by changes in the cell mem-brane (with the formation of small blebsknown as “apoptotic bodies”), shrinking ofthe nucleus, chromatin condensation, andfragmentation of DNA. Macrophages andother phagocytic cells recognize apoptoticcells and remove them by phagocytosis with-out inflammatory phenomena developing.
Cell necrosis (not shown) should be distin-guished from apoptosis. In cell necrosis, celldeath is usually due to physical or chemicaldamage. Necrosis leads to swelling and burst-ing of the damaged cells and often triggers aninflammatory response.
The growth of tissue (or, more precisely,the number of cells) is actually regulated byapoptosis. In addition, apoptosis allows theelimination of unwanted or superfluouscells—e. g., during embryonic developmentor in the immune system. The contraction ofthe uterus after birth is also based on apop-tosis. Diseased cells are also eliminated byapoptosis—e. g., tumor cells, virus-infectedcells, and cells with irreparably damagedDNA. An everyday example of this is the peel-ing of the skin after sunburn.
B. Regulation of apoptosis
Apoptosis can be triggered by a number ofdifferent signals that use various transmissionpathways. Other signaling pathways preventapoptosis.
At the center of the apoptotic process lies agroup of specialized cysteine-containing as-partate proteinases (see p. 176), known as cas-pases. These mutually activate one another,creating an enzyme cascade resembling thecascade involved in blood coagulation (see
p. 290). Other enzymes in this group, knownas effector caspases, cleave cell componentsafter being activated—e. g., laminin in the nu-clear membrane and snRP proteins (seep. 246)—or activate special DNases whichthen fragment the nuclear DNA.
An important trigger for apoptosis isknown as the Fas system. This is used bycytotoxic T cells, for example, which eliminateinfected cells in this way (top left). Most of thebody’s cells have Fas receptors (CD 95) ontheir plasma membrane. If a T cell is activatedby contact with an MHC presenting a viralpeptide (see p. 296), binding of its Fasligands occurs on the target cell’s Fas recep-tors. Via the mediator protein FADD (“Fas-associated death domain”), this activates cas-pase-8 inside the cell, setting in motion theapoptotic process.
Another trigger is provided by tumor ne-crosis factor- (TNF-α), which acts via a sim-ilar protein (TRADD) and supports the endog-enous defense system against tumors by in-ducing apoptosis.
Caspase-8 activates the effector caspaseseither directly, or indirectly by promotingthe cytochrome c (see p. 140) from mitochon-dria. Once in the cytoplasm, cytochrome cbinds to and activates the protein Apaf-1(not shown) and thus triggers the caspasecascade. Apoptotic signals can also comefrom the cell nucleus. If irreparable DNA dam-age is present, the p53 protein (seep. 394)—the product of a tumor suppressorgene—promotes apoptosis and thus helpseliminate the defective cell.
There are also inhibitory factors that op-pose the signals that activate apoptosis. Theseinclude bcl-2 and related proteins. The ge-nomes of several viruses include genes forthis type of protein. The genes are expressedby the host cell and (to the benefit of thevirus) prevent the host cell from being pre-maturely eliminated by apoptosis.
396 Growth and development
All rights reserved. Usage subject to terms and conditions of license.Koolman, Color Atlas of Biochemistry, 2nd edition © 2005 Thieme

Fas ligand
Fasreceptor
TNF-α
bcl-2 proteinp53 protein
snRNAproteins
Laminin
Apoptosis
Cytotoxic T cell
A. Cell proliferation and apoptosis
B. Regulation of apoptosis
Factors
Cell proliferation
Factors
Apoptosis
Constant cell number
Phagocyticmacrophage
Changes inmembranes
Dissolutionof nuclear structure
Condensationof chromatin
Fragmentationof DNA
Shrinking ofcytoplasm
Apoptotic cell
TNFreceptortype I
Mitochondrion
Effectorcaspases
Cytochrome c
Other proteins Caspase-activatedDNAase
DNA withirradiationdamage
TRADDFADD
cleave
Caspase 8
397Cell proliferation
All rights reserved. Usage subject to terms and conditions of license.Koolman, Color Atlas of Biochemistry, 2nd edition © 2005 Thieme

Oncogenes
Oncogenes are cellular genes that can triggeruncontrolled cell proliferation if their se-quence is altered or their expression is incor-rectly regulated. They were first discovered asviral (v-) oncogenes in retroviruses that causetumors (tumor viruses). Viruses of this type(see p. 404) sometimes incorporate genesfrom the host cell into their own genome. Ifthese genes are reincorporated into the hostDNA again during later infection, tumors canthen be caused in rare cases. Although virus-related tumors are rare, research into themhas made a decisive contribution to ourunderstanding of oncogenes and their func-tioning.
A. Proto-oncogenes: biological role
The cellular form of oncogenes (known as c-oncogenes or proto-oncogenes) code for pro-teins involved in controlling growth and dif-ferentiation processes. They only become on-cogenes if their sequence has been altered bymutations (see p. 256), deletions, and otherprocesses, or when excessive amounts of thegene products have been produced as a resultof overexpression.
Overexpression can occur when amplifica-tion leads to numerous functional copies ofthe respective gene, or when the gene fallsunder the influence of a highly active pro-moter (see p. 244). If the control of oncogeneexpression by tumor suppressor genes (seep. 394) is also disturbed, transformation andunregulated proliferation of the cells can oc-cur. A single activated oncogene does notusually lead to a loss of growth control. Itonly occurs when over the course of timemutations and regulation defects accumulatein one and the same cell. If the immune sys-tem does not succeed in eliminating thetransformed cell, it can over the course ofmonths or years grow into a macroscopicallyvisible tumor.
B. Oncogene products:biochemical functions
A feature common to all oncogenes is the factthat they code for proteins involved in signaltransduction processes. The genes are desig-nated using three-letter abbreviations that
usually indicate the origin of the viral geneand are printed in italics (e. g., myc for mye-locytomatosis, a viral disease in birds). Onco-gene products can be classified into the fol-lowing groups according to their functions.
1. Ligands such as growth factors andcytokines, which promote cell proliferation.
2. Membrane receptors of the 1-helix typewith tyrosine kinase activity, which canbind growth factors and hormones (seep. 394).
3. GTP-binding proteins. This group includesthe G proteins in the strict sense and re-lated proteins such as Ras (see p. 388), theproduct of the oncogene c-ras.
4. Receptors for lipophilic hormones mediatethe effects of steroid hormones and relatedsignaling substances. They regulate thetranscription of specific genes (seep. 378). The products of several oncogenes(e. g., erbA) belong to this superfamily ofligand-controlled transcription factors.
5. Nuclear tumor suppressors inhibit returnto the cell cycle in fully differentiated cells.The genes that code for these proteins arereferred to as anti-oncogenes due to thisfunction. On the role of p53 and pRb, seep. 394.
6. DNA-binding proteins. A whole series ofoncogenes code for transcription factors.Particularly important for cell proliferationare myc, as well as fos and jun. The proteinproducts of the latter two genes form thetranscription factor AP-1 as a heterodimer(see p. 244).
7. Protein kinases play a central role in intra-cellular signal transduction. By phosphor-ylating proteins, they bring about altera-tions in biological activity that can onlybe reversed again by the effects of proteinphosphatases. The interplay between pro-tein phosphorylation by protein kinasesand dephosphorylation by protein phos-phatases (interconversion) serves to regu-late the cell cycle (see p. 394) and otherimportant processes. The protein kinaseRaf is also involved in the signal transduc-tion of insulin (see p. 388).
398 Growth and development
All rights reserved. Usage subject to terms and conditions of license.Koolman, Color Atlas of Biochemistry, 2nd edition © 2005 Thieme

GTP
Ca2
P
GTP
P
P
A. Proto-oncogenes: biological role
B. Oncogene products: biochemical functions
ReceptorEffectorenzyme
G proteinSecondmessenger
Proteinkinase
Voltage-gatedion channel
Ligand-gatedion channel
Calmodulin
Proteinphospha-tase
Phospho-rylatedproteinTranscription
factor
Hormonereceptor
Oncogene products(examples)
Ligandssis, hst, int-2, wnt-1
Receptorsfms, trk, trkB, ros, kit,mas, neu, erbB
GTP-binding proteins
Nuclear hormonereceptors
erbA, NGF1-B
Nuclear tumorsuppressors
Rb, p53, wt1, DCC, APC
DNA-binding proteinsjun, fos, myc, N-myc,myb, fra1, egr-1, rel
Protein kinasessrc, yes, fps, abl, met,mos, raf
Othereffects
Transcription
Intra-cellularG protein
Gene
Transformation
Alteredproteins Defective
control
Tumorformation
Tumor virus
OncogeneDefectivesuppressor gene
v-Oncogene
Mutation, deletion,amplification,altered control
Tumorinitiation
Proto-oncogeneTumorsuppressorgene
Control proteine.g., p53 proteinRb protein
Normaldevelopment
Normalgrowth anddifferentiation
Reversetranscriptionincorporation
Alteredcontrolprotein
Ha-ras, Ki-ras, N-ras
3
4
5 6
7
1
2
3
4
5
6
73
7
1
2
399Cell proliferation
All rights reserved. Usage subject to terms and conditions of license.Koolman, Color Atlas of Biochemistry, 2nd edition © 2005 Thieme

Tumors
A. Division behavior of cells
The body’s cells are normally subject to strict“social” control. They only divide until theycome into contact with neighboring cells; celldivision then ceases due to contact inhibition.Exceptions to this rule include embryoniccells, cells of the intestinal epithelium (wherethe cells are constantly being replaced), cellsin the bone marrow (where formation ofblood cells takes place), and tumor cells. Un-controlled cell proliferation is an importantindicator of the presence of a tumor. Whilenormal cells in cell culture only divide 20–60times, tumor cells are potentially immortaland are not subject to contact inhibition.
In medicine, a distinction is made betweenbenign and malignant tumors. Benign tumorsconsist of slowly growing, largely differenti-ated cells. By contrast, malignant tumorsshow rapid, invasive growth and tend toform metastases (dissemination of daughterlesions). The approximately 100 differenttypes of tumor that exist are responsible formore than 20% of deaths in Europe and NorthAmerica.
B. Transformation
The transition of a normal cell into a tumorcell is referred to as transformation.
Normal cells have all the characteristics offully differentiated cells specialized for a par-ticular function. Their division is inhibitedand they are usually in the G0 phase of thecell cycle (see p. 394). Their external shape isvariable and is determined by a stronglystructured cytoskeleton.
In contrast, tumor cells divide without in-hibition and are often de-differentiated—i. e.,they have acquired some of the properties ofembryonic cells. The surface of these cells isaltered, and this is particularly evident in adisturbance of contact inhibition by neighbor-ing cells. The cytoskeleton of tumor cells isalso restructured and often reduced, givingthem a rounded shape. The nuclei of tumorcells can be atypical in terms of shape, num-ber, and size.
Tumor markers are clinically important fordetecting certain tumors. These are proteinsthat are formed with increasing frequency by
tumor cells (group 1) or are induced by themin other cells (group 2). Group 1 tumormarkers include tumor-associated antigens,secreted hormones, and enzymes. The tablelists a few examples.
The transition from a normal to a trans-formed state is a process involving severalsteps.
1. Tumor initiation. Almost every tumor be-gins with damage to the DNA of an individualcell. The genetic defect is almost always causedby environmental factors. These can includetumor-inducing chemicals (carcinogens—e. g.,components of tar from tobacco), physicalprocesses (e. g., UV light, X-ray radiation; seep. 256), or in rare cases tumor viruses (seep. 398). Most of the approximately 1014 cellsin the human body probably suffer this typeof DNA damage during the average lifespan,but it is usually repaired again (see p. 256). Itis mainly defects in proto-oncogenes (seep. 398) that are relevant to tumor initiation;these are the decisive cause of transformation.Loss of an anti-oncogene (a tumor-suppressorgene) can also contribute to tumor initiation.
2. Tumor promotion is preferential prolif-eration of a cell damaged by transformation. Itis a very slow process that can take manyyears. Certain substances are able to stronglyaccelerate it—e. g., phorbol esters. These occurin plants (e. g., Euphorbia species) and act asactivators of protein kinase C (see p. 386).
3. Tumor progression finally leads to amacroscopically visible tumor as a result ofgrowth. When solid tumors of this type ex-ceed a certain size, they form their own vas-cular network that supplies them with blood(angiogenesis). Collagenases (matrix metallo-proteinases, MMPs) play a special role in themetastatic process, by loosening surroundingconnective tissue and thereby allowing tumorcells to disseminate and enter the blood-stream. New approaches to combating tumorshave been aimed at influencing tumor angio-genesis and metastatic processes.
400 Growth and development
All rights reserved. Usage subject to terms and conditions of license.Koolman, Color Atlas of Biochemistry, 2nd edition © 2005 Thieme

1
2
3
UV
H3C
H3C
O OHCH2OH
CH3
CH3
OHOH
H3C
H
HOH
Hormones
Nutrientmedium
Normal cells Tumor cells
Uncontrolledcell proliferation
Growth inhibitiondue to contactswith adjacent cells
A. Division behavior of cells
B. Transformation
Tumor markers (examples)
Tumor-associated antigens
CEA Carcinoembryonicantigen
AFP
Hormones CalcitoninACTH
Enzymes Acid phosphatase
Tumor initiation:Genetic damage
Tumor progression:Preferential propagation
Tumor promoters
e.g. Estersof phorbol
Tumor initiators
Viruses
Physical processes
Carcinogenicchemicals
Indicators:DifferentiatedNon-dividingDefined form
Indicators:De-differentiatedUncontrolled cell divisionAltered cell surfaceAltered cytoskeletonand nucleus
Tumor cell
Normal cell
Tumor progression:Acquisition of malignancy
Phorbol
α1-Fetoprotein
401Cell proliferation
All rights reserved. Usage subject to terms and conditions of license.Koolman, Color Atlas of Biochemistry, 2nd edition © 2005 Thieme

Cytostatic drugs
Tumors (see p. 400) arise from degenerated(transformed) cells that grow in an uncon-trolled way as a result of genetic defects.Most transformed cells are recognized bythe immune system and eliminated (seep. 294). If endogenous defense is not suf -ciently effective, rapid tumor growth can oc-cur. Attempts are then made to inhibit growthby physical or chemical treatment.
A frequently used procedure is targetedirradiation with γ-rays, which block cell re-production due their mutagenic effect (seep. 256). Another approach is to inhibit cellgrowth by chemotherapy. The growth-inhib-iting substances used are known as cytostaticdrugs. Unfortunately, neither radiotherapynor chemotherapy act selectively—i. e., theydamage normal cells as well, and are there-fore often associated with severe side effects.
Most cytostatic agents directly or indirectlyinhibit DNA replication in the S phase of thecell cycle (see p. 394). The first group (A) leadto chemical changes in cellular DNA that im-pede transcription and replication. A secondgroup of cytostatic agents (B) inhibit the syn-thesis of DNA precursors.
A. Alkylating agents, anthracyclines
Alkylating agents are compounds capable ofreacting covalently with DNA bases. If a com-pound of this type contains two reactivegroups, intramolecular or intermolecularcrosslinking of the DNA double helix and“bending” of the double strand occurs. Exam-ples of this type shown here are cyclophos-phamide and the inorganic complex cisplatin.Anthracyclines such as doxorubicin (adriamy-cin) insert themselves non-covalently be-tween the bases and thus lead to local alter-ations in the DNA structure (see p. 254 B).
B. Antimetabolites
Antimetabolites are enzyme inhibitors (seep. 96) that selectively block metabolic pathways.The majority of clinically important cytostaticdrugs act on nucleotide biosynthesis. Many ofthese are modified nucleobases or nucleotidesthat competitively inhibit their target enzymes(see p. 96). Manyarealso incorporatedinto theDNA, thereby preventing replication.
The cytostatic drugs administered (indi-cated by a syringe in the illustration) are oftennot active themselves but are only convertedinto the actual active agent in the metabolism.This also applies to the adenine analogue 6-mercaptopurine, which is initially convertedto the mononucleotide tIMP (thioinosinemonophosphate). Via several intermediatesteps, tIMP gives rise to tdGTP, which is in-corporated into the DNA and leads to cross-links and other anomalies in it. The secondeffective metabolite of 6-mercaptopurine isS-methylated tIMP, an inhibitor of amidophos-phoribosyl transferase (see p. 188).
Hydroxyurea selectively inhibits ribonu-cleotide reductase (see p. 190). As a radicalscavenger, it removes the tyrosine radicalsthat are indispensable for the functioning ofthe reductase.
Two other important cytostatic agents tar-get the synthesis of DNA-typical thymine,which takes place at the level of the deoxy-mononucleotide (see p. 190). The deoxymo-nonucleotide formed by 5-fluorouracil or thecorresponding nucleoside inhibits thymidy-late synthase. This inhibition is based on thefact that the fluorine atom in the pyrimidinering cannot be substituted by a methyl group.In addition, the fluorine analogue is also in-corporated into the DNA.
Dihydrofolate reductase acts as an auxiliaryenzyme for thymidylate synthase. It is in-volved in the regeneration of the coenzymeN5,N10-methylene-THF, initially reducing DHFto THF with NADPH as the reductant (seep. 418). The folic acid analogue methotrexate,a frequently used cytostatic agent, is an ex-tremely effective competitive inhibitor of di-hydrofolate reductase. It leads to the deple-tion of N5,N10-methylene-THF in the cells andthus to cessation of DNA synthesis.
Further information
To reduce the side effects of cytostatic agents,new approaches are currently being devel-oped on the basis of gene therapy (seep. 264). Attempts are being made, for exam-ple, to administer drugs in the form of pre-cursors (known as prodrugs), which only be-come active in the tumor itself (“tumor tar-geting”).
402 Growth and development
All rights reserved. Usage subject to terms and conditions of license.Koolman, Color Atlas of Biochemistry, 2nd edition © 2005 Thieme

dGDP
me-tIMP
SAH SAM
tIMP
1 3
2 4
4
12
3
GIn Glu tdGDPtGDPtGMPtIMP
IMP GMP GDP
P P
PRPP
N APTHF
DHF
5
6
5
DNA
DNA
dTTP
dTMP
6
N AP
dUMP
+
HC
H
N
POCH2
CH2
HCH2 Cl
CH2 Cl
H3CO O
O
OH H O
C
OHCH2OH
O
R
OH
PtH3N
H3N
Cl
Cl
C
C NCH
NCN
HCN
S
Rib
CH3
P
C
C NCH
NCN
HCN
SH
RibP
C
C NCH
NCN
HCN
SH
NOHC
H2N
O
H
N
RibP
CH
CC
HN
CO
O
F
CN
CN
C
C
H2N
NC
CHN
CH2
NNH2 H3C
C
HN
O
C
H
COOCH2OOC CH2
A. Alkylating agents, anthracyclines
B. Antimetabolites
6-Mercaptopurine
Purinesynthesis
Hydroxyurea
5-fluoro-deoxyuridinemonophosphate
5-fluorouracil5-fluoro-deoxyuridine
Methotrexate(amethopterin)
Thymidylate synthase 2.1.1.45
Dihydrofolate reductase 1.5.1.3
Hypoxanthine phospho-ribosyltransferase 2.4.2.8Thiopurine methyl-transferase2.1.1.67
Amidophosphoribosyltransferase 2.4.2.14Ribonucleoside diphosphatereductase 1.17.4.1
N5,N10-methylene-THF
Cross-linkingof DNAcomponents
“Bending”of the DNAdouble helix
Cyclophosphamide Adriamycin Cisplatin
Precursors
Phospho-ribosylamine
Dihydrofolate
403Cell proliferation
All rights reserved. Usage subject to terms and conditions of license.Koolman, Color Atlas of Biochemistry, 2nd edition © 2005 Thieme

Viruses
Viruses are parasitic nucleoprotein complexes.They often consist of only a single nucleic acidmolecule (DNA or RNA, never both) and aprotein coat. Viruses have no metabolism oftheir own, and can therefore only replicatethemselves with the help of host cells. Theyare therefore not regarded as independentorganisms. Viruses that damage the host cellwhen they replicate are pathogens. Diseasescaused by viruses include AIDS, rabies, polio-myelitis, measles, German measles, smallpox,influenza, and the common cold.
A. Viruses: examples
Only a few examples from the large numberof known viruses are illustrated here. They areall shown on the same scale.
Viruses that only replicate in bacteria areknown as bacteriophages (or “phages” forshort). An example of a phage with a simplestructure is M13. It consists of a single-stranded DNA molecule (ssDNA) of about7000 bp with a coat made up of 2700 helicallyarranged protein subunits. The coat of a virusis referred to as a capsid, and the completestructure as a nucleocapsid. In genetic engi-neering, M13 is important as a vector for for-eign DNA (see p. 258).
The phage T4 (bottom left), one of the larg-est viruses known, has a much more complexstructure with around 170 000 base pairs (bp)of double-stranded DNA (dsDNA) containedwithin its “head.”
The tobacco mosaic virus (center right), aplant pathogen, has a structure similar to thatof M13, but contains ssRNA instead of DNA.The poliovirus, which causes poliomyelitis, isalso an RNA virus. In the influenza virus, thepathogen that causes viral flu, the nucleocap-sid is additionally surrounded by a coat de-rived from the plasma membrane of the hostcell (C). The coat carries viral proteins that areinvolved in the infection process.
B. Capsid of the rhinovirus
Rhinoviruses cause the common cold. In theseviruses, the capsid is shaped like an icosahe-dron—i. e., an object made up of 20 equilateraltriangles. Its surface is formed from three dif-ferent proteins, which associate with one an-
other to form pentamers and hexamers. In all,60 protein molecules are involved in thestructure of the capsid.
C. Life cycle of HIV
The human immunodeficiency virus (HIV)causes the immunodeficiency disease knownas AIDS (acquired immune deficiency syn-drome). The structure of this virus is similarto that of the influenza virus (A).
The HIV genome consists of two moleculesof ssRNA (each 9.2 kb). It is enclosed by adouble-layered capsid and a protein-contain-ing coating membrane. HIV mainly infects Thelper cells (see p. 294) and can thereby leadto failure of the immune system in the longerterm.
During infection (1), the virus’s coatingmembrane fuses with the target cell’s plasmamembrane, and the core of the nucleocapsidenters the cytoplasm (2). In the cytoplasm,the viral RNA is initially transcribed into anRNA/DNA hybrid (3) and then into dsDNA (4).Both of these reactions are catalyzed by re-verse transcriptase, an enzyme deriving fromthe virus. The dsDNA formed is integratedinto the host cell genome (5), where it canremain in an inactive state for a long time.
When viral replication occurs, the DNAsegment corresponding to the viral genomeis first transcribed by host cell enzymes (6).This gives rise not only to viral ssRNA, but alsoto transcription of mRNAs for precursors ofthe viral proteins (7). These precursors areintegrated into the plasma membrane (8, 9)before undergoing proteolytic modification(10). The cycle is completed by the release ofnew virus particles (11).
The group of RNA viruses to which HIVbelongs are called retroviruses, because DNAis produced from RNA in their replication cy-cle—the reverse of the usual direction of tran-scription (DNA RNA).
404 Growth and development
All rights reserved. Usage subject to terms and conditions of license.Koolman, Color Atlas of Biochemistry, 2nd edition © 2005 Thieme

1
2
1
10
11
9
8
7
6
5
4
3
2
1
1
2
Phage M13ssDNA 7 kbHelical
Coat
Influenza virusssRNA (8 molecules) 3.6 kbNucleocapsid with coatEicosa-
hedralhead
T4-Phageds DNA170 kbpcomplexstructure
Tail
Phage DNABacterial cell
1. Bacteriophages
30 nm
PoliovirusssRNA 7 kbEicosahedral capsid
2. Plant and animalpathogenic viruses
Tobacco mosaic virusssRNA6.4 kbHelical
A. Viruses: examples
C. Life cycle of the human immunodeficiency virus (HIV)
B. Capsid of the rhinovirus
1. Structure
Hexamer Capsid
Eicosahedron of180 monomers2. Diagram
Pentamer
ViralRNA
RNA/DNAhybrid
mRNA
GP120
100 nm
Precursorsof core proteinsand enzymes
ViralRNA
NucleusCytoplasm
GlycoproteinGP120
Reversetranscriptase Core
ViralRNA
Otherenzymes
Maturevirusparticle
Translation
Transcription
Integration
Infection
Host DNA
Membrane
dsDNA
Reverse transcriptase2.7.7.49
Ribonuclease H3.1.26.4
405Viruses
All rights reserved. Usage subject to terms and conditions of license.Koolman, Color Atlas of Biochemistry, 2nd edition © 2005 Thieme

Metabolic charts
Explanations
The following 13 plates (pp. 407–419) providea concise schematic overview of the mostimportant metabolic pathways. Explanatorytext is deliberately omitted from them.
These “charts”:• Contain details of metabolic pathways that
are only shown in outline in the main textfor reasons of space. This applies in partic-ular to the synthesis and degradation of theamino acids and nucleotides, and for someaspects of carbohydrate and lipid metabo-lism.
• Offer a quick overview of a specific path-way, the metabolites that arise in it, and theenzymes involved.
• Can be used for reference purposes and forrevising material previously learned.
The most important intermediates are shownwith numbers in the charts. The correspond-ing compounds can be identified using thetable on the same page.
In addition, at each step the four-figure ECnumber (see p. 88) for the enzyme responsi-ble for a reaction is given in italics. The en-zyme name and its systematic classification inthe system used by the Enzyme Catalogue areavailable in the following annotated enzymelist (pp. 420–430), in which all of the enzymesmentioned in this book are listed according totheir EC number. The book’s index is helpfulwhen looking for a specific enzyme in thetext.
In reactions that involve coenzymes, thecoenzyme names are also given (sometimesin simplified form). Particularly importantstarting, intermediate, or end products aregiven with the full name, or as formulae.
Example
On p. 407, the initial step of the dark reactionsin plant photosynthesis (in the Calvin cycle) isshown at the top left.
In this reaction, one molecule of ribulose-1,5-bisphosphate (metabolite 1) and one mol-ecule of CO2 (metabolite 2) give rise to twomolecules of 3-phosphoglycerate (metabolite3). The enzyme responsible has the ECnumber 4.1.1.39. The annotated enzyme listshows that this refers to ribulose bisphosphatecarboxylase (“rubisco” for short). Rubisco be-longs to enzyme class 4 (the lyases) and,within that group, to subclass 4.1 (the car-boxy-lyases). It contains copper as a cofactor([Cu]).
406 Metabolic charts
All rights reserved. Usage subject to terms and conditions of license.Koolman, Color Atlas of Biochemistry, 2nd edition © 2005 Thieme

C5
C7
C5
6 CO2 + 18 ATP + 12 NADPH + 12 H Hexose + 18 ADP + 18 P + 12 NADP
2x
5 5 5 5 55
21
3 3
4.1.1.39
2.7.2.3
4 4
2
1.2.1.13
PP
5 5
6x
5.3.1.1
6 6
4.1.2.13
7
3.1.3.11
8
2.2.1.19 4.
2.1.
13
10
3.1.3.37 P
11
2.2.1.1
1212 13
14 14 14
1 1 1
5.1.3.4 5.3.1.6
2.7.1.19 2.7.1.19
CO2
C5 C5
15
2
C3
C6P
C4
ATP ADP ATP
NADPNADPH
ATP
ADP
ATP
ADP
ATP
ADP
NADPH
4
5
6
7
8
9
10
11
12
13
14
1
2
3
Ribulose 1,5-bisphosphate
Carbon dioxide
3-Phosphoglycerate
1,3-Bisphosphoglycerate
Glyceraldehyde 3-phosphate
Dihydroxyacetone phosphate
Fructose 1,6-bisphosphate
Fructose 6-phosphate
Erythrose 4-phosphate
Sedoheptulose 1,7-bisphosphate
Sedoheptulose 7-phosphate
Xylulose 5-phosphate
Ribose 5-phosphate
Ribulose 5-phosphate
15 Glucose 6-phosphate
Ribulose 1,5 - bis P
Glucose 6-phosphatePGlyceraldehyde 3-
A. Calvin cycle (plant chloroplasts)
Glu
cone
ogen
esis
407Metabolic charts
All rights reserved. Usage subject to terms and conditions of license.Koolman, Color Atlas of Biochemistry, 2nd edition © 2005 Thieme

408 Metabolic charts
19
1
2.4.
1.11
2 2.4.
1.1
35.4.2.2
43.1.3.9
2.7.1.1
8CO2
5.3.1.69 10 10
7
6
5 14 15
13
1211
1.1.
1.44
3.1.
1.17
H2O1.
1.1.
49
5.3.1.9
2.2.1.1
2.2.1.2
2.2.1.1
3.1.3.11
2.7.1.11
4.1.2.13
H2O
20
23
18 17 12 16
22 2521
23 21 24
4.2.
1.11
4.1.
1.32
CO2
5.3.1.11.2.1.122.7.2.35.4.2.1
1.1.1.272.7.1.40
1.1.
1.8
2.7.
1.30
6.4.1.1C4
FatATPADP
C3
UDP
UTP
P
C6
P P
2.7.
7.9
P P
5.1.3.1
GTP
GDP
ATP ADP ATP ADP
NADPH
NADP
NADP
ATP
ADP
NADPH
NADNADHNAD
NADHATP ADP
ADP ATP
P
1
2
3
4
5
6
7
8
Glycogen
UDP-Glucose
Glucose 1-phosphate
Glucose
Glucose 6-phosphate
Gluconolactone 6-
Gluconate 6-phosphate
Ribulose 5-phosphate
17
18
21
19
20
23
24
25
22
1,3-Bisphosphoglycerate
3-Phosphoglycerate
2-Phosphoglycerate
Phosphoenolpyruvate
Pyruvate Lactate
Oxaloacetate
Glycerol
Glycerol 3-phosphate16
9
10
11
12
13
14
15
Ribose 5-phosphate
Xylulose 5-phosphate
Sedoheptulose 7-phosphate
Glyceraldehyde 3-phosphate
Erythrose 4-phosphate
Fructose 6-phosphate
Fructose 1,6-bisphosphate
Glycerone-3-phosphate
P
Mitochondrion
Glucose 6-phosphate
GlycogenRibose 5-phosphate
GlycerolAminoacids
Lactate
Pyruvate
Glucose
Aminoacids
A. Carbohydrate metabolism
All rights reserved. Usage subject to terms and conditions of license.Koolman, Color Atlas of Biochemistry, 2nd edition © 2005 Thieme

2.7.1.30 1.1.1.8
2.3.
1.15
CoA
2.3.
1.42
1.1.1.101
2.3.
1.51
2.7.7.41
3.1.
3.4
2.3.1.20
2.7.1.32 2.7.7.15
2.7.8.2
2.7.1.82 2.7.7.14
2.7.
8.11
2.3.
1.24
2.4.
1.47
P
NADH
19
1
3 4
8
9 10
76
5
14 1513
1211
20
23
181716
25
21
24
2
2
16
22
15
11
NADPHNADP
NAD
6
PCTP
CMP
CoA
CoA
PCTP P
PP
CMP
CMP
2.7.8.1
22
UDP
UDP-Gal
ATP ADP
CTPATP ADP
ATP ADP
CoA
Pyruvate
Dihydroxyacetone 3-
Acetyl CoA
Glycerol
Glycerol 3-phosphate
Acyl CoA
1-Acylglycerol 3-phosphate
1-Acylglycerone 3-phosphate
Phosphatidate
CDP-diacylglycerol
1,2-Diacylglycerol
Phosphatidylinositol
Choline
CDP-choline
Phosphatidylcholine
Ethanolamine
CDP-ethanolamine
Phosphatidylethanolamine
Palmitoyl CoA
Phosphatidylserine
Sphingosine
Serine
Ceramide
Galactosylceramide
Sphingomyelin
19
1
3
4
8
9
10
7
6
5
14
15
13
12
11
20
23
18
17
16
22
25
21
24
2 P
AcetylCoA
Acyl-CoAKetone bodiesIsoprenoids
Inositol
Phos
phol
ipid
s
Sphingosine
Ceramide
Cere-brosides
UDP-Glc, UDP-GalUDP-GlcNAcCMP-NeuAc
Ganglio-sides
Sphingo-myelins
Glycolysis
Fatty acidsynthase
Serine
Palmitoyl CoA
A. Biosynthesis of fats and membrane lipids
Fat
409Metabolic charts
All rights reserved. Usage subject to terms and conditions of license.Koolman, Color Atlas of Biochemistry, 2nd edition © 2005 Thieme

410 Metabolic charts
1.1.1.304.
1.3.
4
4.1.3.5 2.3.1.16
1.1.
1.34
2.7.
1.36
2.7.
4.2 2 H2O
2 [H]O2
1.14
.99.
5
6.2.
1.3
CoA
AMP
CO2PP
2.5.1.1 2.5.1.102.5.1.21
1.14
.95.
6
1.14.99.9
1.1.
1.51
1.1.1.515.3.3.1
1.14
.15.
4
1.14.99.10 1.14.99.9
1.14
.15.
4
ATP
ADP
1
34
8
9
10
7
65
2
19
14 1513
12
11
20 18
1716
5a
23
22 25
21
2426
27 29 28
NADPHNADP
NADPH
NADP
2 [H]O2
H2O
2 [H] O2H2O 2 [H] O2H2O
PP NADPHNADP
H2O
2 [H]O2
H2O
ATP
ADP
2
2
NADPH
NADP
CoAATP
2 [H]O2
2
CO2 NADH NAD
CoA NADH
NAD
2 [H] O2
20Pyruvate
Acetyl CoA
Acetoacetyl CoA3-Hydroxy-3-methyl-glutaryl CoAAcetoacetate
Acetone
3-Hydroxybutyrate
Palmitate
Palmitoyl CoA
Stearoyl CoA
Oleyl CoA
Mevalonate
Mevalonate 5-diphosphate
Isopentenyl diphosphate
Geranyl diphosphate
Farnesyl diphosphate
Squalene
Cholesterol
Pregnenolone
17-OH-Pregnenolone
Dehydroepiandrosterone
Androstene-3,17-dione
Testosterone
Estradiol
Progesterone
17-OH-Progesterone
11-Deoxycortisol
Cortisol
11-Deoxycorticosterone
Aldosterone
1
3
4
8
9
7
6
5
2
5a
23
22
25
21
24
26
27
29
28
10
19
14
15
13
12
11
18
17
16
Ketone bodies
Glucose
Acetyl CoA
Fatty acidextension
GlycineTaurine
Hormone Estradiol Cortisol
Aldosterone
Isoprenoids
Cholesterol
Glycolysis
Fatty acidsynthesis
Bileacids
Bilesalts
β-Oxi-dation
Pyruvate
“Aromatase”
A. Synthesis of ketone bodies and steroids
Testo-sterone
Proge-sterone
All rights reserved. Usage subject to terms and conditions of license.Koolman, Color Atlas of Biochemistry, 2nd edition © 2005 Thieme

9'
1.1.
1.8
2.7.
1.30
3.1.
1.23
3.1.
1.34
3.1.
1.3
3.1.
1.4
6.2.
1.3
2.3.
1.21
2.3.
1.21
1.3.99.3
4.2.1.17
1.1.1.
35
2.3.1.16
6.4.1.3
5.1.
99.1
5.4.
99.2
NADH
NADCO2
1
2
7
11
8
12
3 9
13
4
10
14
6
5 16 17
18
19
1
2
7
11
8
12
3
13
4 10
6
5
15
16
17
18
19
11
9
4
10
ATP
ADP
CoA
ATP
PP
3.1.
1.32
NADH
NAD
CoA
CoA
H2O H2O
H2O
H2O
ETFredETFox
CoA15
H2OATP ADP
A1
A2
C
D
3.1.1.32
3.1.1.4
3.1.4.3
3.1.4.4
A1 A2
C
D
14
9
9'
Triacylglycerol
Diacylglycerol
Monoacylglycerol
Glycerol
Phospholipid
Free fatty acid
Carnitine
Acyl carnitine
3-Hydroxyacyl CoA
Acetyl CoA
Propionyl CoA
(S)-Methylmalonyl CoA
(R)-Methylmalonyl CoA
Succinyl CoA
Pyruvate
Glucose
Respiratory chain
Respiratorychain
From uneven-numbered fatty acids
Adipose tissue
β-Oxidation
A. Degradation of fats and phospholipids
Glycerol 3-phosphate
Glycerone 3-phosphate 2,3-Dehydroacyl CoA
Phospholipases
3-Oxoacyl CoA
Acyl CoA
Shortened acyl CoA
411Metabolic charts
All rights reserved. Usage subject to terms and conditions of license.Koolman, Color Atlas of Biochemistry, 2nd edition © 2005 Thieme

412 Metabolic charts
ADP
4
5
67
8
9 10
11 12
2
3
15
1920
1816
NADPH
NADP
OG OG
CO2
[CH3]2.7.2.4
1.2.
1.11
1.1.1.3 2.7.1.39
H2O
OG
Glu Glu
OG
Glu PP
Glu
PEP
13
14
P
17
8
OG
PNADPH NADP
1
2.6.
1.42
2.6.
1.42
(2.6
.1.6
)
2.6.
1.42
ATP
ATP
ATPADP
4.1.3.18
4.2.99.2
Glu
81
9
Pyruvate
2-Oxobutyrate
2-Aceto-2-hydroxybutyrate
2-Oxo-4-methylvalerate
2-Acetolactate
2-Oxoisovalerate
2-Oxoisocaproate
Phosphoribosyldiphosphate
Aspartate
Aspartyl 4-phosphate
Aspartate 4-semialdehyde
Homoserine
Phosphohomoserine
Phosphoenolpyruvate
Erythrose 4-phosphate
2-Oxo-3-deoxy-arabinoheptulosonate7-phosphate
Chorismate
Phenylpyruvate
Anthranilate
N-(Phosphoribosyl)-anthranilate
4
5
6
7
10
11
12
13
14
2
3
15
19
20
18
16
17
Pyruvate
Aspartate
Histidine
Phenyl-alanineSerineTrypto-
phan
Methionine
Threonine
Lysine
Leucin ValineIsoleucine
A. Biosynthesis of the essential amino acids
Cysteine
2-Oxo-glutarate
Threonine
All rights reserved. Usage subject to terms and conditions of license.Koolman, Color Atlas of Biochemistry, 2nd edition © 2005 Thieme

1.14.16.1
2.6.1.52 1.1.1.95
2.1.2.1
4.2.1.22
4.4.
1.1
2.6.1.2
2.6.1.1 6.3.5.4
1.5.
1.2
1.2.
1.41
1.4.
1.2
6.3.
1.2
2.7.2.11
2.3.
1.1
3.5.
1.16
2.7.
2.8
2.6.
1.11
1.2.1.38
P
5,10M-THF THF
THB O2 H2O DHP
NH3
ATP
ADP
NAD
NADPH NADP
NADPH
NADP
NADPH
NADP
NH3
NH3
ATP
ADP
ATP ADP
ATP AMP
123
4
11
12 15
13 14
16
17
1056
7
8
9
2120
19
18
NADH
CoA
NADNADH
H2O
H2O
OG GluOGGlu
OGGlu GluGln
OG
Glu
3-Phosphoglycerate
3-Phosphohydroxypyruvate
3-Phosphoserine
Glycine
Homocysteine
Cystathionine
2-Oxobutyrate
Pyruvate
Oxaloacetate
Aspartate
Asparagine
2-Oxoglutarate
Glutamate
γ-Glutamyl phosphate
∆1-Pyrroline-5-carboxylate
N-Acetylglutamate
N-Acetylglutamate 5-phosphate
N-Acetylglutamate semialdehyde
N-Acetylornithine
Ornithine
Arginine
1
2
3
4
11
12
15
13
14
16
17
10
5
6
7
8
9
21
20
19
18
Tricarboxylicacid cycle
TyrosinePhenylalanine
Tetra-hydro-biopterin
Glycolysis
AlanineSerine
Glycine
Cysteine
Aspar-agine
Aspar-tate
Glutamine
Gluta-mate
Arginine
Proline
Ureacycle
2-Oxoglutarate
A. Biosynthesis of the non-essential amino acids
AcetylCoA Ace-
tate
Methionine
413Metabolic charts
All rights reserved. Usage subject to terms and conditions of license.Koolman, Color Atlas of Biochemistry, 2nd edition © 2005 Thieme

414 Metabolic charts
1.4.4.2
2.1.2.10
CO2
2.6.
1.42
1.2.
1.25
1.3.
99.3
4.2.1.17 4.2.
1.17
3.1.
2.4
1.1.
1.31
2.1.2.1
4.1.2.5
4.2.
1.13
2.6.1.2
4.3.
1.3
4.2.
1.49
3.5.
2.7
1.1.
1.35
2.3.
1.16
6.4.1.3
5.1.
99.1
5.4.9
9.2
1.4.
1.2
3.5.1.2
2.1.2.54.
1.3.
4
4.2.1.18
6.4.1.4
2[H
NH3
NAD
NADH
Glu
THF
5,10M-THF
3 a, b, c
2 a, b, c
1 a, b, c
b
a
c
b
4
11
12
15
13 14
16
17
10
5
6 7
8 21
20
19
18NH3
ATP ADP
5F-THF
CoA
CoA
CO2
OG
[FAD]
[FADH2]
THF
H2O
H2O
H2ONAD
NADH
NH3
CO2
NAD
NADH
H2O
CoA
CO2
ATP
ADP
c
H2O
NAD
NADH
H2O
CoQox
CoQred
a
H2O
OGGlu
NH3
9
22
4
3c
2-Oxoisovalerate
2-Oxo-3-methylvalerate
2-Oxoisocapronate
Isobutyryl CoA
2-Methylbutyryl CoA
Isovaleryl CoA
Methylacrylyl CoA
Tiglyl CoA
3-Methylcrotonyl CoA
3-Hydroxyisobutyryl CoA
3-Hydroxyisobutyrate
Methylmalonyl-semialdehyde
(S)-Methylmalonyl CoA
(R)-Methylmalonyl CoA
Succinyl CoA
2-Methyl-3-hydroxybutyryl CoA
2-Methylacetoacetyl CoA
Propionyl CoA
3-Methylglutaconyl CoA
3-Hydroxy-3-methylglutaryl CoA
AcetoacetateAcetyl CoA
Pyruvate
Acetaldehyde
Urocanate
Imidazolone-5-propionate
N-Formimino-glutamate
2-Oxoglutarate
11
12
15
13
14
16
17
10
5
6
7
8
9
21
20
19
18
1a
1b
1c
2a
2b
2c
3a
3b
22
Alanine
Gluta-mate
Gluta-mine
Histi-dine
Threo-nine
Branched-chainα-ketoaciddehydrogenasecomplex
Valine GlycineLeucineIso-leucine
A. Amino acid degradation I
Tricarboxylicacid cycle
Serine Glycine
All rights reserved. Usage subject to terms and conditions of license.Koolman, Color Atlas of Biochemistry, 2nd edition © 2005 Thieme

2.6.1.3 1.13.11.20
[CH3]
2.5.
1.6
3.5.
1.1
SO2 OG O2
3.7.
1.2
5.2.
1.2
2.6.1.13.3.
1.1
4.2.
1.22
4.4.
1.1
1.2.7.2
1.4.
1.2
1.5.
1.12
1.5.99.8
2[H]
2.6.1.13 3.5.3.1
1.14.16.12.6.1.5
1.13
.11.
271.
13.1
1.5
NAD
NADH
Glu
1
2
3
4
11
12
15
13
14
16
17
10
5
6
7
8
9
21
201918
ATP
NH3P PP
H2O
H2O
NH3
H2O
Glu
OG
H2O
O2
O2
CO2NH3
NAD
NADH
H2O
H2OOGGlu
OGGluTHB
O2H2O
H2OCoA
CO2
H2O
[2 H]
∆1-Pyrroline-5-carboxylate
S-Adenosylmethionine
Homocysteine
Cystathionine
2-Oxobutyrate
Propionyl CoA
Succinyl CoA
Fumarate
Oxaloacetate
Cysteine sulfinate
3-Sulfinylpyruvate
2-Oxoadipate
Crotonyl CoA
4-Hydroxyphenylpyruvate
4-Maleylacetoacetate
Fumarylacetoacetate
Homogentisate
Acetoacetate
Glutamate 4-semialdehyde
Ornithine
2-Oxoglutarate
1
2
3
4 11
12
15
13
14
16
1710
5
6
7
8
9
21
20
19
18
8 steps3 st
eps
Severalpathways
Cysteine
Tricarboxylicacid cycle
Proline
AsparagineMethioninePyru-vate
AcetylCoAAspartate
β-Oxidation
Cys-teine
Argi-nine
Urea
Glutamate Tyro-sine
Phenyl-alanine
Trypto-phan
Ascorbate
Dehydroascorbate
A. Amino acid degradation II
Non-enzymaticreaction
Lysine
Serine
Non-enzymaticreaction
Ade-nosine
See pre-vious page
415Metabolic charts
All rights reserved. Usage subject to terms and conditions of license.Koolman, Color Atlas of Biochemistry, 2nd edition © 2005 Thieme

416 Metabolic charts
AMP, PP
Gln
Glu Ala
ATP
ADP, Pi
Gln
3.5.4.n1.4.1.2
3.5.
1.2
2.6.1.2
1.1.
1.37
4.2.
1.2
6.3.4.5
2.6.
1.1
6.3.
4.16
2.1.3.3
3.5.3.1 4.3.2.1
HCO32 ATP
2 ADP, Pi
1 2
7
8
3
9
4
10
6
5Asp
ATP
H2O
H2O
NH3
2
H2O
H2O
Glu
NADH
NAD
7
8
9
10
61
2
3
4
5
6.3.
1.2
Ureacycle
Neutral,non-toxic
Nitrogen donator insynthesis of purinebases, cytosine,GlcNAc, His, and Trp
Fromproteindegradation
BasicToxic
NucleotideNucleobases
Urea
A. Ammonia metabolism
Kidney
Pyruvate
2-Oxoglutarate
Oxaloacetate
Carbamoyl phosphate
Malate
Fumarate
Ornithine
Citrulline
Argininosuccinate
Arginine
All rights reserved. Usage subject to terms and conditions of license.Koolman, Color Atlas of Biochemistry, 2nd edition © 2005 Thieme

DNA
2.7.6.1 2.4.2.14 6.3.4.13
2.1.
2.2
4.1.1.21 6.3.3.1 6.3.5.3
6.3.
2.6
4.3.
2.2
2.1.2.3 3.5.4.10
6.3.4.41.1.1.205
4.3.
2.2
1.17.4.1
6.3.
5.2
1.17.4.1
4
5
6
7
8
9
10
11
12
2
3
4
5678
9 10 11
12
2 31
NAD
NADPH NADP
NADH
ATP AMP
THF
10F-THFGlyGluGln
H2O
HCO3
RNA DNA
ATP ADP
PRPP
P P
ATPADP ATPADP Glu Gln
Asp
ADP
ATP
THF
O
HNN
N N
C
P Rib
IMP
AMP
ATP
ADP
dGTP
dGDP
RNA
GMP
GTP
GDP
1
dATP
dADP
NADPH NADP
XMP
ATP
ADP
Asp
ADP
ATP
Gln
Glu
10F-THF
Ribose 5-phosphate
Phosphoribosyldiphosphate (PRPP)
PR-amine
PR-glycineamide
PR-formylglycine-amide
PR-4-carboxy-5-aminoimidazole
PR-5-formamido-imidazole-4-carbox-amide
Inosine 5'-mono-phosphate
Adenylosuccinic acid
PR = 5'-Phosphoribosyl-
N10-Formyl-THF
Fumarate
Ribose 5-phosphate
Fumarate
PR-formylglycine-amidine
A. Biosynthesis of purine nucleotides
Xanthinemono-phosphate
PR-5-aminoimidazole
PR-5-amino-4-imidazolecarboxamide Nucleoside
diphosphatereductase
417Metabolic charts
All rights reserved. Usage subject to terms and conditions of license.Koolman, Color Atlas of Biochemistry, 2nd edition © 2005 Thieme

418 Metabolic charts
THF
CH H
ADP
NADP
dUMP UMP
H2O FMNH2
6.3.5.5 2.1.3.2 3.5.2.3 1.3.99.11
5,10M-THF
CO2
2.1.1.45
3.6.
1.6
1.17.4.1
2[H
[NH2
6.3.4.2
1.17.4.1
N5-Formyl-THF
6.3.3.2
3.5.4.9
2.1.2.2, 2.1.2.3 1.5.1.3
2.1.1.45
2.1.
2.1
1.5.1.201.5.1.5
NADPH
4 5
6
7
2 3
GluGln
RNADNA
1
ATP Asp
1
2
3
4
56
7
ATP
ADP
P P
P
dTTP
dTDP
dTMP
DHF
dUDP UDP CDP dCDP
UTP CTP dCTP
RNA DNA
P
ATPADP2[H
4..1.1.23
2.4.
2.10
dUMP
dTMP
NADPH NADPNADPH
2.1.
1.13
H2O
DHF
THF
THF
THF
CH3
THF
HCO
THF
HCO
THF
HC
H2O
NADP
FMN
HCO3
Carbamoylphosphate
Carbamoylaspartate
Dihydroorotate
Orotate
Orotate 5'-mono-phosphate
Nucleosidediphosphatereductase
CTPsynthase
Phosphoribosyldiphosphate
Thymidylatesynthase
Histidine
Methionine
Serine
Homocysteine
Dihydro-folate
Tetrahydro-folate
Purine ring (C-2, C-8)
A. Biosynthesis of the pyrimidine nucleotides and C1 metabolism
Glycine
N5,N10-Methylen-THF
N5-Methyl-THF
N10-Formyl-THF
N5,N10-Methenyl-THF
All rights reserved. Usage subject to terms and conditions of license.Koolman, Color Atlas of Biochemistry, 2nd edition © 2005 Thieme

3.1.
3.5
NH3,CO2
Ade GMPAMP dTMP UMP CMP
GIMP dT U C
GuaI Thy Ura
A
1 2 7 11
8 12
3 9 13
4 10 14
6
5
NH3
H2O
H2O
P
H2O
P
H2O
P
H2O
P
H2O
P
P
P
Rib
NH3 H2O
H2OO2
H2O2
P
P
Rib
P
P
Rib
NH3
H2O
Uricacid
H2OO2
H2O2
O2
H2O
H2O
P
P
Rib
NADPH
NADP
NADPH
NADP
H2O
H2O
NH3,CO2
H2O
H2O
Glu
2-OG
Glu(Ala)
2-OG(Pyr)
2.4.
2.1
3.5.
4.3
1.1.
3.22
1.7.
3.3
3.5.
2.5
3.5.
3.4
2.4.
2.1
3.5.
4.4
3.1.
3.5
1.1.3.22
3.5.4.5
3.1.
3.5
3.1.
3.5
3.1.
3.5
2.4.
2.2
2.4.
2.2
1.3.
1.2
1.3.
1.2
3.5.
2.2
3.5.
2.2
3.5.
1.6
3.5.
1.6
2.6.
1.19
2.6.
1.40
(2.6
.1.1
9)
CO2 CO22
3.1.
3.5
3.5.
4.4
NH3
H2O
H2O
P
11
12
13
14
6
7
8
9
10
1
2
3
4
5
6 5
4
3
Primates,birds, reptiles
Other mammals,molluscs
Inosine
Propionate AcetateCartilaginous fish,amphibians
Osseous fish
Dihydrouracil
Carbamoyl-β-alanine
β-alanine
3-oxopropionate
Urea
Dihydrothymine
Carbamoyl-β-amino-isobutyrate
β-Aminoisobutyrate
2-Methyl-3-oxopropionate
Hypoxanthine (Hyp)
Xanthine (Xan)
Allantoin
Allantoic acid
Glyoxylate
A. Nucleotide degradation
419Metabolic charts
All rights reserved. Usage subject to terms and conditions of license.Koolman, Color Atlas of Biochemistry, 2nd edition © 2005 Thieme

420 Annotated enzyme list
Annotated enzyme list
Only the enzymes mentioned in this atlas are listed here, from among the more than 2000enzymes known. The enzyme names are based on the IUBMB’s of cial Enzyme nomenclature1992. The additions shown in round brackets belong to the enzyme name, while prostheticgroups and other cofactors are enclosed in square brackets. Common names of enzyme groupsare given in italics, and trivial names are shown in quotation marks.
Class 1: Oxidoreductases (catalyze reduction-oxidation reactions)
Subclass 1.n: What is the electron donor?Sub-subclass 1.n.n: What is the electron acceptor?
1.1 A –CH–OH group is the donor
1.1.1 NAD(P)+ is the acceptor (dehydrogenases, reductases)1.1.1.1 Alcohol dehydrogenase [Zn2+]1.1.1.3 Homoserine dehydrogenase1.1.1.8 Glycerol 3-phosphate dehydrogenase (NAD+)1.1.1.21 Aldehyde reductase1.1.1.27 Lactate dehydrogenase1.1.1.30 3-Hydroxybutyrate dehydrogenase1.1.1.31 3-Hydroxyisobutyrate dehydrogenase1.1.1.34 Hydroxymethylglutaryl-CoA reductase (NADPH)1.1.1.35 3-Hydroxyacyl-CoA dehydrogenase1.1.1.37 Malate dehydrogenase1.1.1.40 Malate dehydrogenase (oxaloacetate-decarboxylating, NADP+)—“malic enzyme”1.1.1.41 Isocitrate dehydrogenase (NAD+)1.1.1.42 Isocitrate dehydrogenase (NADP+)1.1.1.44 Phosphogluconate dehydrogenase (decarboxylating)1.1.1.49 Glucose 6-phosphate 1-dehydrogenase1.1.1.51 3(or 17)β-Hydroxysteroid dehydrogenase1.1.1.95 Phosphoglycerate dehydrogenase1.1.1.100 3-Oxoacyl-[ACP] reductase1.1.1.101 Acylglycerone phosphate reductase1.1.1.105 Retinol dehydrogenase1.1.1.145 3β-Hydroxy-∆5-steroid dehydrogenase1.1.1.205 IMP dehydrogenase
1.1.3 Molecular oxygen is the acceptor (oxidases)1.1.3.4 Glucose oxidase [FAD]1.1.3.8 L-Gulonolactone oxidase1.1.3.22 Xanthine oxidase [Fe, Mo, FAD]1.1.99.5 Glycerol-3-phosphate dehydrogenase (FAD)
1.2 An aldehyde or keto group is the donor
1.2.1 NAD(P)+ is the acceptor (dehydrogenases)1.2.1.3 Aldehyde dehydrogenase (NAD+)1.2.1.11 Aspartate semialdehyde dehydrogenase1.2.1.12 Glyceraldehyde 3-phosphate dehydrogenase1.2.1.13 Glyceraldehyde 3-phosphate dehydrogenase (NADP+) (phosphorylating)1.2.1.24 Succinate semialdehyde dehydrogenase1.2.1.25 2-Oxoisovalerate dehydrogenase (acylating)1.2.1.38 N-Acetyl-γ-glutamylphosphate reductase1.2.1.41 Glutamylphosphate reductase
All rights reserved. Usage subject to terms and conditions of license.Koolman, Color Atlas of Biochemistry, 2nd edition © 2005 Thieme

421Annotated enzyme list
1.2.4 A disulfide is the acceptor1.2.4.1 Pyruvate dehydrogenase (lipoamide) [TPP]1.2.4.2 Oxoglutarate dehydrogenase (lipoamide) [TPP]
1.2.7 An Fe/S protein is the acceptor1.2.7.2 2-Oxobutyrate synthase
1.3 A –CH–CH– group is the donor1.3.1.10 Enoyl-[ACP] reductase (NADPH)1.3.1.24 Biliverdin reductase1.3.1.34 2,4-Dienoyl-CoA reductase1.3.5.1 Succinate dehydrogenase (ubiquinone) [FAD, Fe2S2, Fe4S4], “complex II”1.3.99.3 Acyl-CoA dehydrogenase [FAD]1.3.99.11 Dihydroorotate dehydrogenase [FMN]
1.4 A –CH–NH2 group is the donor1.4.1.2 Glutamate dehydrogenase1.4.3.4 Amine oxidase [FAD], “monoamine oxidase (MAO)”1.4.3.13 Protein lysine 6-oxidase [Cu]1.4.4.2 Glycine dehydrogenase (decarboxylating) [PLP]
1.5 A –CH–NH group is the donor1.5.1.2 Pyrroline-5-carboxylate reductase1.5.1.3 Dihydrofolate reductase1.5.1.5 Methylenetetrahydrofolate dehydrogenase (NADP+)1.5.1.12 1-Pyrroline-5-carboxylate dehydrogenase1.5.1.20 Methylenetetrahydrofolate reductase (NADPH) [FAD]1.5.5.1 Electron-transferring flavoprotein (ETF) dehydrogenase [Fe4S4]1.5.99.8 Proline dehydrogenase [FAD]
1.6 NAD(P)H is the donor16.4.2 Glutathione reductase (NADPH) [FAD]1.6.4.5 Thioredoxin reductase (NADPH) [FAD]1.6.5.3 NADH dehydrogenase (ubiquinone) [FAD, Fe2S2, Fe4S4]—“complex I”
1.8 A sulfur group is the donor1.8.1.4 Dihydrolipoamide dehydrogenase [FAD]
1.9 A heme group is the donor1.9.3.1 Cytochrome c oxidase [heme, Cu, Zn] – “cytochrome oxidase,” “complex IV”
1.10 A diphenol is the donor1.10.2.2 Ubiquinol cytochrome c reductase [heme, Fe2S2]—“complex III”
1.11 A peroxide is the acceptor (peroxidases)1.11.1.6 Catalase [heme]1.11.1.7 Peroxidase [heme]1.11.1.9 Glutathione peroxidase [Se]1.11.1.12 Lipid hydroperoxide glutathione peroxidase [Se]
1.13 Molecular oxygen is incorporated into the electron donor (oxygenases)
1.13.11 One donor, both O atoms are incorporated (dioxygenases)1.13.11.5 Homogentisate 1,2-dioxygenase [Fe]1.13.11.20 Cysteine dioxygenase [Fe]1.13.11.27 4-Hydroxyphenylpyruvate dioxygenase [ascorbate]1.13.11.n Arachidonate lipoxygenases
All rights reserved. Usage subject to terms and conditions of license.Koolman, Color Atlas of Biochemistry, 2nd edition © 2005 Thieme

422 Annotated enzyme list
1.14 Two donors, one O atom is incorporated into both (monooxygenases, hydroxylases)1.14.11.2 Procollagen proline 4-dioxygenase [Fe, ascorbate]—“proline hydroxylase”1.14.11.4 Procollagen lysine 5-dioxygenase [Fe, ascorbate]—“lysine hydroxylase”1.14.13.13 Calcidiol 1-monooxygenase [heme]1.14.15.4 Steroid 11β-monooxygenase [heme]1.14.15.6 Cholesterol monooxygenase (side-chain-cleaving) [heme]1.14.16.1 Phenylalanine 4-monooxygenase [Fe, tetrahydrobiopterin]1.14.16.2 Tyrosine 3-monooxygenase [Fe, tetrahydrobiopterin]1.14.17.1 Dopamine β-monooxygenase [Cu]1.14.99.1 Prostaglandin H-synthase [heme]1.14.99.3 Heme oxygenase (decyclizing) [heme]1.14.99.5 Stearoyl-CoA desaturase [heme]1.14.99.9 Steroid 17α-monooxygenase [heme]1.14.99.10 Steroid 21-monooxygenase [heme]
1.15 A superoxide radical is the acceptor1.15.1.1 Superoxide dismutase
1.17 A –CH2 group is the donor1.17.4.1 Ribonucleoside diphosphate reductase [Fe]—“ribonucleotide reductase”
1.18 Reduced ferredoxin is the donor1.18.1.2 Ferredoxin-NADP+ reductase [FAD]1.18.6.1 Nitrogenase [Fe, Mo, Fe4S4]
Class 2: Transferases (catalyze the transfer of groups from one molecule to another)
Subclass 2.n: Which group is transferred?
2.1 A C1 group is transferred
2.1.1 A methyl group2.1.1.2 Guanidinoacetate N-methyltransferase2.1.1.6 Catechol O-methyltransferase2.1.1.13 5-Methyltetrahydrofolate-homocysteine S-methyltransferase2.1.1.28 Phenylethanolamine N-methyltransferase2.1.1.45 Thymidylate synthase2.1.1.67 Thiopurine methyltransferase
2.1.2 A formyl group2.1.2.1 Glycine hydroxymethyltransferase [PLP]2.1.2.2 Phosphoribosylglycinamide formyltransferase2.1.2.3 Phosphoribosylaminoimidazolecarboxamide formyltransferase2.1.2.5 Glutamate formiminotransferase [PLP]2.1.2.10 Aminomethyltransferase
2.1.3 A carbamoyl group2.1.3.2 Aspartate carbamoyltransferase [Zn2+]
2.1.3.3 Ornithine carbamoyltransferase
2.1.4 An amidino group2.1.4.1 Glycine amidinotransferase
2.2 An aldehyde or ketone residue is transferred2.2.1.1 Transketolase [TPP]2.2.1.2 Transaldolase
All rights reserved. Usage subject to terms and conditions of license.Koolman, Color Atlas of Biochemistry, 2nd edition © 2005 Thieme

423Annotated enzyme list
2.3 An acyl group is transferred
2.3.1 With acyl-CoA as donor2.3.1.1 Amino acid N-acetyltransferase2.3.1.6 Choline O-acetyltransferase2.3.1.12 Dihydrolipoamide acetyltransferase [lipoamide]2.3.1.15 Glycerol 3-phosphate O-acyltransferase2.3.1.16 Acetyl-CoA acyltransferase2.3.1.20 Diacylglycerol O-acyltransferase2.3.1.21 Carnitine O-palmitoyltransferase2.3.1.22 Acylglycerol O-palmitoyltransferase2.3.1.24 Sphingosine N-acyltransferase2.3.1.37 5-Aminolevulinate synthase [PLP]2.3.1.38 [ACP] S-acetyltransferase2.3.1.39 [ACP] S-malonyltransferase2.3.1.41 3-Oxoacyl-[ACP] synthase2.3.1.42 Glycerone phosphate O-acyltransferase2.3.1.43 Phosphatidylcholine-sterol acyltransferase—“lecithin-cholesterol acyltransferase
(LCAT)”2.3.1.51 Acylgylcerol-3-phosphate O-acyltransferase2.3.1.61 Dihydrolipoamide succinyltransferase2.3.1.85 Fatty-acid synthase
2.3.2 An aminoacyl group is transferred2.3.2.2 γ-glutamyltransferase2.3.2.12 Peptidyltransferase (a ribozyme)2.3.2.13 Protein-glutamine γ-glutamyltransferase [Ca]—“fibrin-stabilizing factor”
2.4 A glycosyl group is transferred
2.4.1 A hexose residue2.4.1.1 Phosphorylase [PLP]—“glycogen (starch) phosphorylase”2.4.1.11 Glycogen (starch) synthase2.4.1.17 Glucuronosyltransferase2.4.1.18 1,4-α-Glucan branching enzyme2.4.1.25 4-α-Glucanotransferase2.4.1.47 N-Acylsphingosine galactosyltransferase2.4.1.119 Protein glycotransferase
2.4.2 A pentose residue2.4.2.7 Adenine phosphoribosyltransferase2.4.2.8 Hypoxanthine phosphoribosyltransferase2.4.2.10 Orotate phosphoribosyltransferase2.4.2.14 Amidophosphoribosyl transferase
2.5 An alkyl or aryl group is transferred2.5.1.1 Dimethylallyltransferase2.5.1.6 Methionine adenosyltransferase2.5.1.10 Geranyltransferase2.5.1.21 Farnesyl diphosphate farnesyltransferase
2.6 A nitrogen-containing group is transferred
2.6.1 An amino group (transaminases)2.6.1.1 Aspartate transaminase [PLP]—“GOT”2.6.1.2 Alanine transaminase [PLP]—“GPT”
All rights reserved. Usage subject to terms and conditions of license.Koolman, Color Atlas of Biochemistry, 2nd edition © 2005 Thieme

424 Annotated enzyme list
2.6.1.3 Cysteine transaminase [PLP]2.6.1.5 Tyrosine transaminase [PLP]2.6.1.6 Leucine transaminase (PLP]2.6.1.11 Acetylornithine transaminase [PLP]2.6.1.13 Ornithine transaminase [PLP]2.6.1.19 4-Aminobutyrate transaminase [PLP]2.6.1.42 Branched-chain amino acid transaminase [PLP]2.6.1.52 Phosphoserine transaminase [PLP]
2.7 A phosphorus-containing group is transferred (kinases)
2.7.1 With –CH–OH as acceptor2.7.1.1 Hexokinase2.7.1.3 Ketohexokinase2.7.1.6 Galactokinase2.7.1.11 6-Phosphofructokinase2.7.1.19 Phosphoribulokinase2.7.1.28 Triokinase (triosekinase)2.7.1.30 Glycerol kinase2.7.1.32 Choline kinase2.7.1.36 Mevalonate kinase2.7.1.37 Protein kinase2.7.1.38 Phosphorylase kinase2.7.1.39 Homoserine kinase2.7.1.40 Pyruvate kinase2.7.1.67 1-Phosphatidylinositol-4-kinase2.7.1.68 1-Phosphatidylinositol 4-phosphate kinase2.7.1.82 Ethanolamine kinase2.7.1.99 [Pyruvate dehydrogenase] kinase2.7.1.105 6-Phosphofructo-2-kinase2.7.1.112 Protein tyrosine kinase
2.7.2 With –CO–OH as acceptor2.7.2.3 Phosphoglycerate kinase2.7.2.4 Aspartate kinase2.7.2.8 Acetylglutamate kinase2.7.2.11 Glutamate 5-kinase
2.7.3 With a nitrogen-containing group as acceptor2.7.3.2 Creatine kinase
2.7.4 With a phosphate group as acceptor2.7.4.2 Phosphomevalonate kinase2.7.4.3 Adenylate kinase2.7.4.4 Nucleoside phosphate kinase2.7.4.6 Nucleoside diphosphate kinase
2.7.6 A diphosphate residue is transferred2.7.6.1 Ribose phosphate pyrophosphokinase
2.7.7 A nucleotide is transferred2.7.7.6 DNA-directed RNA polymerase—“RNA polymerase”2.7.7.7 DNA-directed DNA polymerase—“DNA polymerase”2.7.7.9 UTP-glucose-l-phosphate uridyltransferase2.7.7.12 Hexose-1-phosphate uridyltransferase2.7.7.14 Ethanolamine phosphate cytidyltransferase
All rights reserved. Usage subject to terms and conditions of license.Koolman, Color Atlas of Biochemistry, 2nd edition © 2005 Thieme

425Annotated enzyme list
2.7.7.15 Choline phosphate cytidyltransferase2.7.7.41 Phosphatidate cytidyltransferase2.7.7.49 RNA-directed DNA polymerase—“reverse transcriptase”
2.7.8 Another substituted phosphate is transferred2.7.8.1 Ethanolaminephosphotransferase2.7.8.2 Diacylglycerol cholinephosphotransferase2.7.8.11 CDPdiacylglycerol-inositol 3-phosphatidyltransferase2.7.8.16 1-Alkyl-2-acetylglycerol cholinephosphotransferase2.7.8.17 N-Acetylglucosaminephosphotransferase
Class 3: Hydrolases (catalyze bond cleavage by hydrolysis)
Subclass 3.n: What kind of bond is hydrolyzed?
3.1 An ester bond is hydrolyzed (esterases)
3.1.1 In carboxylic acid esters3.1.1.2 Arylesterase3.1.1.3 Triacylglycerol lipase3.1.1.4 Phospholipase A2
3.1.1.7 Acetylcholinesterase3.1.1.13 Cholesterol esterase3.1.1.17 Gluconolactonase3.1.1.32 Phospholipase A1
3.1.1.34 Lipoprotein lipase, diacylglycerol lipase
3.1.2 In thioesters 3.1.2.43-Hydroxyisobutyryl-CoA hydrolase
3.1.2.14 Acyl-[ACP] hydrolase
3.1.3 In phosphoric acid monoesters (phosphatases)3.1.3.1 Alkaline phosphatase [Zn2+]3.1.3.2 Acid phosphatase3.1.3.4 Phosphatidate phosphatase3.1.3.9 Glucose 6-phosphatase3.1.3.11 Fructose bisphosphatase3.1.3.13 Bisphosphoglycerate phosphatase3.1.3.16 Phosphoprotein phosphatase3.1.3.37 Sedoheptulose bisphosphatase3.1.3.43 [Pyruvate dehydrogenase] phosphatase3.1.3.46 Fructose-2,6-bisphosphate 2-phosphatase3.1.3.n Polynucleotidases
3.1.4 In phosphoric acid diesters (phosphodiesterases)3.1.4.1 Phosphodiesterase3.1.4.3 Phospholipase C3.1.4.4 Phospholipase D3.1.4.17 3,5-cNMP phosphodiesterase3.1.4.35 3,5-cGMP phosphodiesterase3.1.4.45 N-Acetylglucosaminyl phosphodiesterase
3.1.21 In DNA3.1.21.1 Deoxyribonuclease I3.1.21.4 Site-specific deoxyribonuclease (type II)—“restriction endonuclease”
All rights reserved. Usage subject to terms and conditions of license.Koolman, Color Atlas of Biochemistry, 2nd edition © 2005 Thieme

3.10.26–7 In RNA3.1.26.4 Ribonuclease H3.1.27.5 Pancreatic ribonuclease
3.2 A glycosidic bond is hydrolyzed (glycosidases)
3.2.1 In O-glycosides3.2.1.1 α-Amylase3.2.1.10 Oligo-1,6-glucosidase3.2.1.17 Lysozyme3.2.1.18 Neuraminidase3.2.1.20 α-Glucosidase3.2.1.23 β-Galactosidase3.2.1.24 α -Mannosidase3.2.1.26 β-Fructofuranosidase—“saccharase,” “invertase”3.2.1.28 α,α-Trehalase3.2.1.33 Amylo-1,6-glucosidase3.2.1.48 Sucrose α-glucosidase3.2.1.52 β-N-Acetylhexosaminidase3.2.2.n Nucleosidases
3.3 An ether bond is hydrolyzed3.3.1.1 Adenosylhomocysteinase
3.4 A peptide bond is hydrolyzed (peptidases)
3.4.11 Aminopeptidases (N-terminal exopeptidases)3.4.11.n Various aminopeptidases [Zn2+]
3.4.13 Dipeptidases (act on dipeptides only)3.4.13.n Various dipeptidases [Zn2+]
3.4.15 Peptidyl dipeptidases (C-terminal exopeptidases, releasing dipeptides)3.4.15.1 Peptidyl-dipeptidase A [Zn2+]—“angiotensin-converting enzyme (ACE)”
3.4.17 Carboxypeptidases (C-terminal exopeptidases)3.4.17.1 Carboxypeptidase A [Zn2+]3.4.17.2 Carboxypeptidase B [Zn2+]3.4.17.8 Muramoylpentapeptide carboxypeptidase
3.4.21 Serine proteinases (endopeptidases)3.4.21.1 Chymotrypsin3.4.21.4 Trypsin3.4.21.5 Thrombin3.4.21.6 Coagulation factor Xa—“Stuart–Prower factor”3.4.21.7 Plasmin3.4.21.9 Enteropeptidase—“enterokinase”3.4.21.21 Coagulation factor VIIa—“proconvertin”3.4.21.22 Coagulation factor IXa—“Christmas factor”3.4.21.27 Coagulation factor XIa—“plasma thromboplastin antecedent”3.4.21.34 Plasma kallikrein3.4.21.35 Tissue kallikrein3.4.21.36 Elastase3.4.21.38 Coagulation factor XIIa—“Hageman factor”3.4.21.43 C3/C5 convertase (complement—classical pathway)3.4.21.47 C3/C5 convertase (complement—alternative pathway)
426 Annotated enzyme list
All rights reserved. Usage subject to terms and conditions of license.Koolman, Color Atlas of Biochemistry, 2nd edition © 2005 Thieme

427Annotated enzyme list
3.4.21.68 Plasminogen activator (tissue)—“tissue plasminogen activator (t-PA)”3.4.21.73 Plasminogen activator (urine)—“urokinase”
3.4.22 Cysteine proteinases (endopeptidases)3.4.22.2 Papain
3.4.23 Aspartate proteinases (endopeptidases)3.4.23.1 Pepsin A3.4.23.2 Pepsin B3.4.23.3 Gastricsin (pepsin C)3.4.23.4 Chymosin3.4.23.15 Renin
3.4.24 Metalloproteinases (endopeptidases)3.4.24.7 Collagenase
3.4.99 Other peptidases3.4.99.36 Signal peptidase
3.5 Another amide bond is hydrolyzed (amidases)3.5.1.1 Asparaginase3.5.1.2 Glutaminase3.5.1.16 Acetylornithine deacetylase [Zn2+]3.5.2.3 Dihydroorotase3.5.2.7 Imidazolonepropionase3.5.3.1 Arginase3.5.4.6 AMP deaminase3.5.4.9 Methylenetetrahydrofolate cyclohydrolase3.5.4.10 IMP cyclohydrolase
3.6 An anhydride bond is hydrolyzed3.6.1.6 Nucleoside diphosphatase3.6.1.32 Myosin ATPase3.6.1.34 H+-transporting ATP synthase—“ATP synthase,” “complex V”3.6.1.35 H+-transporting ATPase3.6.1.36 H+/K+-exchanging ATPase3.6.1.37 Na+/K+-exchanging ATPase—“Na+/K+-ATPase”3.6.1.38 Ca2+-transporting ATPase
3.7 A C–C bond is hydrolyzed3.7.1.2 Fumarylacetoacetase
Class 4: Lyases (cleave or form bonds without oxidative or hydrolytic steps)
Subclass 4.n: What kind of bond is formed or cleaved?
4.1 A C–C bond is formed or cleaved
4.1.1 Carboxy-lyases (carboxylases, decarboxylases)4.1.1.1 Pyruvate decarboxylase [TPP]4.1.1.15 Glutamate decarboxylase [PLP]4.1.1.21 Phosphoribosylaminoimidazole carboxylase4.1.1.23 Orotidine-5-phosphate decarboxylase4.1.1.28 Aromatic L-amino acid decarboxylase [PLP]4.1.1.32 Phosphoenolpyruvate carboxykinase (GTP)4.1.1.39 Ribulose bisphosphate carboxylase [Cu]—“rubisco”
All rights reserved. Usage subject to terms and conditions of license.Koolman, Color Atlas of Biochemistry, 2nd edition © 2005 Thieme

428 Annotated enzyme list
4.1.2 Acting on aldehydes or ketones4.1.2.5 Threonine aldolase [PLP]4.1.2.13 Fructose bisphosphate aldolase—“aldolase”4.1.3.4 Hydroxymethylglutaryl-CoA lyase4.1.3.5 Hydroxymethylglutaryl-CoA synthase4.1.3.7 Citrate synthase4.1.3.8 ATP-citrate lyase4.1.3.18 Acetolactate synthase [TPP, flavin]
4.1.99 Other C–C lyases4.1.99.3 Deoxyribodipyrimidine photolyase [FAD]—“photolyase”
4.2 A C–O bond is formed or cleaved
4.2.1 Hydrolyases (hydratases, dehydratases)4.2.1.1 Carbonate dehydratase [Zn2+]—“carbonic anhydrase”4.2.1.2 Fumarate hydratase—“fumarase”4.2.1.3 Aconitate hydratase [Fe4S4]—“aconitase”4.2.1.11 Phosphopyruvate hydratase—“enolase”4.2.1.13 Serine dehydratase4.2.1.17 Enoyl-CoA hydratase4.2.1.18 Methylglutaconyl-CoA hydratase4.2.1.22 Cystathionine β-synthase [PLP]4.2.1.24 Porphobilinogen synthase4.2.1.49 Urocanate hydratase4.2.1.61 3-Hydroxypalmitoyl-[ACP] dehydratase4.2.1.75 Uroporphyrinogen III synthase
4.2.99 Other C–O lyases4.2.99.2 Threonine synthase [PLP]
4.3 A C–N bond is formed or cleaved
4.3.1 Ammonia lyases 4.3.1.3Histidine ammonia lyase
4.3.1.8 Hydroxymethylbilane synthase
4.3.2 Amidine lyases 4.3.2.1Argininosuccinate lyase
4.3.2.2 Adenylosuccinate lyase
4.4 A C–S bond is formed or cleaved4.4.1.1 Cystathionine γ-lyase [PLP]
4.6 A P–O bond is formed or cleaved4.6.1.1 Adenylate cyclase4.6.1.2 Guanylate cyclase
Class 5: Isomerases (catalyze changes within one molecule)
Subclass 5.n: What kind of isomerization is taking place?
5.1 A racemization or epimerization (epimerases)5.1.3.1 Ribulose phosphate 3-epimerase5.1.3.2 UDPglucose 4-epimerase5.1.3.4 L-Ribulose phosphate 4-epimerase5.1.99.1 Methylmalonyl-CoA epimerase
All rights reserved. Usage subject to terms and conditions of license.Koolman, Color Atlas of Biochemistry, 2nd edition © 2005 Thieme

5.2 A cis–trans isomerization5.2.1.2 Maleylacetoacetate isomerase5.2.1.3 Retinal isomerase5.2.1.8 Peptidyl proline cis–trans-isomerase
5.3 An intramolecular electron transfer5.3.1.1 Triose phosphate isomerase5.3.1.6 Ribose 5-phosphate isomerase5.3.1.9 Glucose 6-phosphate isomerase5.3.3.1 Steroid ∆-isomerase5.3.3.8 Enoyl-CoA isomerase5.3.4.1 Protein disulfide isomerase
5.4 An intramolecular group transfer (mutases)5.4.2.1 Phosphoglycerate mutase5.4.2.2 Phosphoglucomutase5.4.2.4 Bisphosphoglycerate mutase5.4.99.2 Methylmalonyl-CoA mutase [cobamide]
5.99 Another kind of isomerization5.99.1.2 DNA topoisomerase (type I)—“DNA helicase”5.99.1.3 DNA topoisomerase (ATP-hydrolyzing, type II)—“DNA gyrase”
Class 6: Ligases (join two molecules with hydrolysis of an “energy-rich” bond)
Subclass 6.n: What kind of bond is formed?
6.1 A C–O bond is formed6.1.1.n (Amino acid)-tRNA ligases (aminoacyl-tRNA synthetases)
6.2 A C–S bond is formed6.2.1.1 Acetate-CoA ligase6.2.1.3 Long-chain fatty-acid-CoA ligase6.2.1.4 Succinate-CoA ligase (GDP-forming)—“thiokinase”
6.3 A C–N bond is formed6.3.1.2 Glutamate-NH3 ligase—“glutamine synthetase”6.3.2.6 Phosphoribosylaminoimidazolesuccinocarboxamide synthase (sorry!)6.3.3.1 Phosphoribosylformylglycinamidine cycloligase6.3.3.2 5-Formyltetrahydrofolate cycloligase6.3.4.2 CTP synthase6.3.4.4 Adenylosuccinate synthase6.3.4.5 Argininosuccinate synthase6.3.4.13 Phosphoribosylamine glycine ligase6.3.4.16 Carbamoylphosphate synthase (NH3)6.3.5.2 GMP synthase (glutamine-hydrolyzing)6.3.5.3 Phosphoribosylformylglycinamidine synthase6.3.5.4 Asparagine synthase (glutamine-hydrolyzing)6.3.5.5 Carbamoylphosphate synthase (glutamine-hydrolyzing)
6.4 A C–C bond is formed6.4.1.1 Pyruvate carboxylase [biotin]6.4.1.2 Acetyl-CoA carboxylase [biotin]6.4.1.3 Propionyl-CoA carboxylase [biotin]6.4.1.4 Methylcrotonyl-CoA carboxylase [biotin]
6.5 A P–O bond is formed6.5.1.1 DNA ligase (ATP)
429Annotated enzyme list
All rights reserved. Usage subject to terms and conditions of license.Koolman, Color Atlas of Biochemistry, 2nd edition © 2005 Thieme

All rights reserved. Usage subject to terms and conditions of license.Koolman, Color Atlas of Biochemistry, 2nd edition © 2005 Thieme

431Abbreviations
Abbreviations
Abbreviations for amino acids, p. 60For bases and nucleosides, p. 80For monosaccharides, p. 38
AA Amino acidACE Angiotensin-converting en-
zyme (peptidyl-dipeptidase A)ACP Acyl carrier proteinACTH Adrenocorticotropic hormone
(corticotropin)ADH Antidiuretic hormone (adiure-
tin, vasopressin)ADP Adenosine 5-diphosphateAIDS Acquired immunodeficiency
syndromeALA 5-Aminolevulinic acidAMP Adenosine 5-monophosphateANF Atrial natriuretic factorANP Atrial natriuretic peptide
(= ANF)ATP Adenosine 5-triphosphateAVP Arginine vasopressinb Basebp Base pairBPG 2,3-BisphosphoglyceratecAMP 3,5-Cyclic AMPCAP Catabolite activator proteinCDK Cyclin-dependent protein
kinase (in cell cycle)cDNA Complementary DNACDP Cytidine 5-diphosphatecGMP 3,5-Cyclic GMPCIA Chemoluminescence immuno-
assayCMP Cytidine 5-monophosphateCoA Coenzyme ACoQ Coenzyme Q (ubiquinone)CSF colony-stimulating factorCTP Cytidine 5-triphosphated Deoxy-Da Dalton (atomic mass unit)DAG Diacylglyceroldd Dideoxy-DH DehydrogenaseDNA Deoxyribonucleic aciddsDNA Double-stranded DNAEA EthanolamineEIA Enzyme-linked immunoassayER Endoplasmic reticulum
FAD Flavin adenine dinucleotideFd FerredoxinFFA Free fatty acidfMet N-formylmethionineFMN Flavin mononucleotideFp Flavoprotein (containing FMN
or FAD)GABA γ-Aminobutyric acidGDP Guanosine 5-diphosphateGlut Glucose transporterGMP Guanosine 5-monophosphateGSH Reduced glutathioneGSSG Oxidized glutathioneGTP Guanosine 5-triphosphateh hourHAT medium Medium containing hypoxan-
thine, aminopterin, and thymi-dine
Hb HemoglobinHDL High-density lipoproteinHIV Human immunodeficiency
virusHLA Human leukocyte-associated
antigenHMG-CoA 3-Hydroxy-3-methylglutaryl-
CoAHMP Hexose monophosphate path-
wayhnRNA Heterogeneous nuclear ribo-
nucleic acidHPLC High-performance liquid chro-
matographyhsp Heat-shock proteinIDL Intermediate-density lipopro-
teinIF Intermediary filamentIFN InterferonIg ImmunoglobulinIL InterleukinInsP3 Inositol 1,4,5-trisphosphateIPTG IsopropylthiogalactosideIRS Insulin-receptor substratekDa Kilodalton (103 atomic mass
units)Km Michaelis constant
All rights reserved. Usage subject to terms and conditions of license.Koolman, Color Atlas of Biochemistry, 2nd edition © 2005 Thieme

432 Abbreviations
LDH Lactate dehydrogenaseLDL Low-density lipoproteinM Molarity (mol L–1)Mab Monoclonal antibodyMAP kinase Mitogen-activated protein
kinaseMHC Major histocompatability
complexMPF Maturation-promoting factormRNA Messenger ribonucleic acidN Nucleotide with any baseNAD+ Oxidized nicotinamide adenine
dinucleotideNADH Reduced nicotinamide adenine
dinucleotideNADP+ Oxidized nicotinamide adenine
dinucleotide phosphateNADPH Reduced nicotinamide adenine
dinucleotide phosphateNeuAc N-acetylneuraminic acidnm Nanometer (10–9 m)ODH 2-Oxoglutarate dehydrogenasePAGE Polyacrylamide gel electropho-
resisPan PantetheinePAPS Phosphoadenosine
phosphosulfatePCR Polymerase chain reactionPDH Pyruvate dehydrogenasePEG Polyethylene glycolPEP PhosphoenolpyruvatepH pH valuePi Inorganic phosphatePK Protein kinasePLP Pyridoxal phosphatePP Protein phosphatasePPP Pentose phosphate pathwayPQ PlastoquinonePRPP 5-Phosphoribosyl 1-diphos-
phatePS PhotosystemPTH Parathyroid hormoneQ Oxidized coenzyme Q (ubiqui-
none)
QH2 Reduced coenzyme Q (ubiqui-nol)
R Gas constantrER Rough endoplasmic reticulumRES Reticuloendothelial systemRFLP Restriction fragment length
polymorphismRIA RadioimmunoassayRNA Ribonucleic acidROS Reactive oxygen speciesRP Reversed phase (of silica gel)rRNA Ribosomal ribonucleic acidS Svedberg (unit of sedimenta-
tion coef cient)SAH S-adenosyl L-homocysteineSAM S-adenosyl L-methionineSDS Sodium dodecylsulfatesER Smooth endoplasmic reticulumsn Stereospecific numberingsnRNA Small nuclear ribonucleic acidSR Sarcoplasmic reticulumssDNA Single-stranded DNATBG Thyroxine-binding globulinTHB TetrahydrobiopterinTHF TetrahydrofolateTLC Thin-layer chromatographyTPP Thiamine diphosphateTRH Thyrotropin-releasing hor-
mone (thyroliberin)Tris Tris(hydroxymethyl)aminome-
thanetRNA Transfer ribonucleic acidTSH Thyroid-stimulating hormone
(thyrotropin)UDP Uridine 5-diphosphateUMP Uridine 5-monophosphateUTP Uridine 5-triphosphateUV Ultraviolet radiationVmax, V Maximal velocity (of an
enzyme)VLDL Very-low-density lipoprotein
All rights reserved. Usage subject to terms and conditions of license.Koolman, Color Atlas of Biochemistry, 2nd edition © 2005 Thieme

Quantities and units
1. SI base units
Quantity SI unit Symbol Remarks
Length Meter m 1 yard (yd) = 0.9144 m1 inch (in) = 0.0254 m1 Å = 10–10 m = 0.1 nm
Mass Kilogram kg 1 pound (lb) = 0.4536 kgTime Second sCurrent strength Ampere ATemperature Kelvin K °C (degree Celsius) = K – 273.2
Fahrenheit: °C = 5/9 (°F – 32)Light Candela CdAmount of substance Mol mol
2 Derived units
Quantity Unit Symbol Derivation Remarks
Frequency Hertz HzS
–1
Volume Liter L 10–3 m3 1 U.S. gallon (gal) = 3.785 LForce Newton N kg m s–2
Pressure Pascal Pa N m–2 1 bar = 105 Pa1 mmHg = 133.3 Pa
Energy, work, heat Joule J N m 1 calorie (cal) = 4.1868 JPower Watt W J s–1
Electrical charge Coulomb C A sVoltage Volt V W A–1
Concentration Molarity M mol L–1
Molecular mass Dalton Da 1.6605 10–24 gMolar mass – – gMolecular weight – Mr – NondimensionalReaction rate v mol s–1
Catalytic activity Katal kat mol s–1 1 unit (U) = 1.67 10–8 katSpecific activity – – kat (kg
enzyme)–1Usually: U (mg enzyme)–1
Sedimentationcoef cient
Svedberg S 10–13 s
Radioactivity Becquerel Bq Decays s–1 1 curie (Ci) = 3.7 1010 Bq
433Quantities and units
3 Multiples and fractions
Factor Prefix Sym-bol
Example
109 Giga G GHz = 109 hertz106 Mega M MPa = 106 pascal103 Kilo k kJ = 103 joule10–3 Milli m mM = 10–3 mol L–1
10–6 Micro µ µV = 10–6 volt10–9 Nano n nkat = 10–9 katal10–12 Pico p pm = 10–12 meter
4 Important constants
General gasconstant, R
R = 8.314 J mol–1 K–1
Loschmidt(Avogadro)number, N(number ofparticles permol)
N = 6.0225 1023
Faraday constant F F = 96480 C mol–1
All rights reserved. Usage subject to terms and conditions of license.Koolman, Color Atlas of Biochemistry, 2nd edition © 2005 Thieme

434 Further reading
Further reading
Textbooks
Alberts B, Bray D, Lewis J, Raff M, Roberts K, Watson JD. The molecular biology of the cell. 4th ed.New York: Garland Science, 2002.
Berg JM, Tymoczko JL, Stryer L. Biochemistry. 5th ed. New York: Freeman, 2002.Devlin TM, editor. Textbook of biochemistry: with clinical correlations. 5th ed. New York: Wiley-
Liss, 2002.Granner DK, Mayes PA, Rodwell VW. Murray RK. Harper’s illustrated biochemistry. 26th ed. New
York : McGraw-Hill/Appleton and Lange, 2003.Lodish H, Darnell J, Baltimore D. Molecular cell biology. 3rd ed. New York: Scientific American
Books, New York, 1995.Mathews CK, van Holde KE, Ahern KG. Biochemistry. 3rd ed. San Francisco: Cummings, 2000.Nelson DL, Cox MM. Lehninger principles of biochemistry. 3rd ed. New York: Worth, 2000.Voet D, Voet JG. Biochemistry. 3rd ed. New York: Wiley, 2004.
Reference works
Branden C, Tooze J. Introduction to protein structure. New York: Garland, 1991.Janeway CA, Travers P, editors. Immunobiology. 5th ed. New York: Garland, 2001.Michal G, editor. Biochemical pathways: an atlas of biochemistry and molecular biology. New
York: Wiley, 1999.Nature Publishing Group. Encyclopedia of life sciences. http://www.els.net [an Internet ency-
clopedia with up-to-date overview articles in every field of biochemistry and cell biology].Webb EC, editor. Enzyme nomenclature 1992. San Diego: International Union of Biochemistry
and Molecular Biology/Academic Press, 1992.
Selected periodicals (journals and yearbooks)
Annual Review of Biochemistry. Annual Reviews, Inc., Palo Alto, CA, USA[the most important collection of biochemical reviews].
Current Biology, Current Opinion in Cell Biology, Current Opinion in Structural Biology, andrelated journals in this series. Current Biology, Ltd. London [short up-to-date reviews].
Trends in Biochemical Sciences. Elsevier Trends Journals, Cambridge, United Kingdom [the“newspaper” for biochemists; of cial publication of the International Union of Biochemistryand Molecular Biology (IUBMB)].
All rights reserved. Usage subject to terms and conditions of license.Koolman, Color Atlas of Biochemistry, 2nd edition © 2005 Thieme

435Source credits
Source credits
Individual graphic elements in the following plates are based on the following sources, usedwith the kind permission of the authors and publishers concerned.
Page Figure Source
65 Goodsell DS, Trends Biochem Sci 1993; 18: 65–8201 A Beckman Instruments, Munich, Bulletin no. DS-555A, p. 6, Fig. 6203 B Goodsell DS, Trends Biochem Sci 1991; 16: 203–6, Figs. 1a and 1b207 C Stryer L. Biochemistry. New York: Freeman, 1988, p. 945, Fig. 36–47207 C Alberts B, et al. The molecular biology of the cell. New York: Gar-
land, 1989, p. 663, Fig.11–73B and p. 634, Fig.11–36279 A, B Voet D, Voet JG. Biochemistry. New York: Wiley, 1990, p. 305,
Fig.11–45 and p. 306, Fig.11–47295 A Voet D, Voet JG. Biochemistry. New York: Wiley, 1990, p.1097,
Fig. 34–13297 A Voet D, Voet JG. Biochemistry. New York: Wiley, 1990, p.1112,
Fig. 34–33297 A Janeway CA, Travers P. Immunology. Heidelberg, Germany: Spek-
trum, 1994, p.164, Fig. 4.3.c333 B Voet D, Voet JG. Biochemistry. New York: Wiley, 1990, p.1126,
Fig. 34–55335 B Darnell J, et al. Molecular cell biology. 2nd ed. New York: Freeman,
1990, p. 923, Fig. 23–26
All rights reserved. Usage subject to terms and conditions of license.Koolman, Color Atlas of Biochemistry, 2nd edition © 2005 Thieme

All rights reserved. Usage subject to terms and conditions of license.Koolman, Color Atlas of Biochemistry, 2nd edition © 2005 Thieme

437
Index
Numbers in italics indicate figures.
A
A-DNA 86, 87AA see amino acidsABO blood groups 292, 293absorption
A 102light 102, 103, 128, 129
absorptive state 308acceptors 6
electrons 88site (A) 250
ACE see angiotensin-con-verting enzyme
acetaldehyde see ethanalacetate 13, 354acetate-CoA ligase 320, 321,
354, 355, 429acetic acid 49, 52, 53
activated see acetyl-CoAacetoacetate 180acetoacetic acid 160acetoacetone 312acetoacetyl-CoA 312acetolactate synthase 428acetylcholine 270N-acetyl glutamate 182, 183acetyl lipoamide 135acetyl-CoA 12, 52, 53, 110,
163acyltransferase 165, 312,
313, 423carboxylase 160, 161, 162,
163, 168, 429cholesterol 172, 173ethanol metabolism 320fatty acid degradation
164, 165, 167pyruvate kinase inhibitor
158tricarboxylic acid cycle
136, 137, 138, 139van der Waals model 13
N-acetyl-galactosaminyltransferase 292, 293
N-acetyl-γ-glutamylphos-phate reductase 420
acetylated amino sugars 38
see also individual sugarsacetylation 62, 244acetylcholine 352
receptors 222, 335, 354acetylcholinesterase 354,
355, 425N-acetylglucosamine
(GlcNAc)40, 44aphosphoglycosidase 234,
235phosphotransferase 234,
235, 425acetylglutamate kinase 424β-N-acetylhexosaminidase
426N-acetylmuraminic acid
(MurNAc) 40N-acetylneuraminic acid
(NeuAc) 38acetylornithine
deacetylase 427transaminase 424
acetylsalicylic acid 317acid amide bonds 12acid anhydrides 10acid phosphatase 425acid—amide bonds 13acid—anhydride bonds 150acid—base
balance 274, 288-9, 289,326-7
catalysis 90reactions 14, 15, 18, 19
acidic amino acids 60acidic monosaccharides 38,
39see also N-acetylneura-
minic acid; D-galactur-onic acid; D-glucuronicacid; iduronic acid
acidoses, metabolic 160, 161,288, 326
acids 15, 18, 30-1, 31aconitate 9
hydratase (aconitase) 8,9, 106, 136, 137, 428
ACP see acyl carrier proteinacquired immune system
294acquired immunodeficiency
syndrome (AIDS) 404ACTase see aspartate carba-
moyltransferaseACTH see adrenocortico-
tropic hormone (cortico-tropin)
actin 204, 205, 332F-actin 64, 65, 332G-actin 332
actin-associated proteins204
actinomycin D 254, 255action potential 222, 348,
350, 351activating enzymes 114activation, T-cell 296-7activation energy (Ea) 22, 23,
25, 90active centers 74, 90
enzymes 95essential amino acids 99lactate dehydrogenase
100trypsin 177
active transport 218, 220acyl carnitine 164, 165acyl carrier proteins (ACP)
S-acetyltransferase 168,169, 423
acyl carrier proteins (ACP),S-malonyltransferase168, 169, 423S-ferase 423
acyl-[ACP] hydrolase 168,169, 425
acyl-CoA 52, 141, 164, 168,170dehydrogenase 164, 165,
421fat biosynthesis 170, 171fatty acid degradation
162, 163acylation 62, 380
All rights reserved. Usage subject to terms and conditions of license.Koolman, Color Atlas of Biochemistry, 2nd edition © 2005 Thieme

438 Index
acylglycerol O-palmitoyltransferase 170, 171, 423
acylglycerol-3-phosphateO-acyltransferase 170,171, 423
acylglycerone phosphatereductase 420
N-acylsphingosine galacto-syltransferase 423
adaptive immune system294
adaptor proteins 388Grb-2 388SOS 388
additions 14, 15adenine 12, 13, 80, 81
phosphoribosyltransfera-se 187, 423
adenosine 80, 81, 1235’-diphosphate (ADP) see
ADP5’-monophosphate
(AMP) see AMP5’-triphosphate (ATP) see
ATPS-adenosyl-L-homocysteine
(SAH) 111S-adenosyl-L-methionine
(SAM) 110, 111adenosylcobalamin 108adenosylhomocysteinase
426adenylate
cyclase 120, 121, 384, 385,386, 387, 428
kinase 72, 73, 336, 337,424
adenylosuccinatelyase 428synthase 429
ADH see antidiuretic hor-mone
adhesive proteins 346adipocytes 46adipose tissues 160, 161, 162,
308adiuretin see antidiuretic
hormoneADP 190, 191, 212adrenaline see epinephrineadrenocorticotropic hor-
mone (ACTH)adriamycin see doxorubicinaerobic glycolysis 150aerobic metabolism 122
aerobic oxidation 146, 147agarose 40, 41, 262agents, alkylating 256, 402,
403AIDS 404air 29ALA see 5-aminolevulinic
acidalanine 60, 61, 178, 184, 185
β-alanine 12, 13, 62, 63,106degradation 186
cycle 338, 339seryl 65, 66, 67transaminase 178, 179,
181, 423albumins 194, 195, 277alcohol 10
blood 321dehydrogenase 64, 420fermentation 148, 149liver damage 320, 321primary 11secondary 11
alcohol dehydrogenase 65,320, 321fermentation 148, 149
alcohols 15sugar 38, 39
aldehyde 11dehydrogenase 320, 321,
420reductase 310, 311, 420
aldehydes 10, 15aldimes 10aldimine 10, 108, 178, 179aldohexoses 34, 38
D-glucose see D-glucosealdolase see fructose bis-
phosphate adolasealdopentoses 38
see also L-arabinose;D-ribose; D-xylose
aldoses 39aldosterone 56, 57, 374, 376aliphatic amino acids 60alkaline phosphatase 425alkanes 46, 47alkanols 46alkenes 151-alkyl-2-acetylglycerol
choline phosphotrans-ferase 170, 171, 425
alkylating agents 256, 402,403
allantoic acid 187allantoin 186, 187allolactose 119allopurinol 186, 187allosteric effects 2-3, 114,
115, 116BPG 282, 284hemoglobin 116, 280
allosteric enzymes 92, 93,96, 116
allosteric inhibitors 96allosteric proteins 72allotypic variation 302α-amanitin 242α1-globulins 276α2-globulins 276α-keratin 71alternative pathway,
complement 298Amanita phalloides 242amidases 89, 427amidine lyases 428amidophosphoribosyl
transferase 402, 403, 423amine oxidase 62, 421amines 10
biogenic 62, 63, 352primary 11secondary 11tertiary 11
Aminita phalloides 204amino acid N-acetyltrans-
ferase 423D-amino acid oxidase 58amino acid tRNA ligases 248amino acids (AA) 35, 58-63,
146activation 236, 248-9, 249aromatic 60, 184biosynthesis 184-5, 185,
412-13branched chain 184, 185charge 58degradation 180-1, 181,
414-15essential see essential
amino acidsexcretion 324function 58, 59glucogenic 180gluconeogenesis 154ketogenic 180metabolism 306, 338neurotransmitters 352optical activity 58, 59
All rights reserved. Usage subject to terms and conditions of license.Koolman, Color Atlas of Biochemistry, 2nd edition © 2005 Thieme

439Index
proteinogenic 58, 60-1,61non-proteinogenic 62-
3resorption 272signaling 380, 381translation 60
amino sugars 39, 44aminoacyl
adenylate 248, 249tRNAs 248, 249, 252
4-aminobutyrate transami-nase 356, 357, 424
aminodipeptidases 425aminoglycosides 254β-aminoisobutyrate 186,
1875-aminolevulinate 192, 193
synthase 192, 193, 423aminomethyltransferase
422aminopeptidases 176, 177,
426aminopropanol 63aminopterin 304aminotransferases 89ammonia 11
bases 30, 31degradation 112excretion 326, 327lyases 428metabolism 178, 179, 416urea cycle 182, 183
ammonium ions (NH4+) 31,
182, 183, 326ammonotelic animals 182AMP 158, 186, 190, 191
deaminase 336, 337, 427amphibolic function 136amphibolic pathways 112,
113amphipathic molecules 28,
29amphiphilic molecules 28ampicillin 255amplification 398
DNA 262amylases
α-amylase 268, 269, 272,273, 426
brewing 148, 149amylo-1,6-glucosidase 156,
157, 426amylopectin 41, 42, 43amyloplasts 42
amylose 41, 42, 43anabolic pathways 112, 113,
138, 139, 338anaerobic conditions 112,
146anaerobic glycolysis 150,
336, 338anaerobic oxidation 146, 147analogs
substrates 96, 97transition states 97
analysisanalyzers 36biochemical 102, 103proteins 78
anaplerotic effect 180anaplerotic pathways 139anchors, lipid 214anemia 286
sickle-cell 249, 264, 265ANF see atrial natriuretic
factorangiotensin 330, 331angiotensin-converting en-
zyme (ACE) 426anhydrides
mixed 11phosphoric acid 11
animalscells 197types of 182
anions 15, 27anomers 36ANP see atrial natriuretic
peptideantenna pigments 132anthracyclines 402, 403anti-oncogenes 400antibiotics 225, 254-5, 255antibodies 300-3, 303
monoclonal 304-5, 305plasma cells 294
anticodons 82, 86, 236, 248,249
antidiuretic hormone (ADH)220
antigen-presenting cells(APCs) 294
antigensblood groups 292receptors 296, 297
antihemophilic factor A 291antimetabolites 402, 403antioxidants 104, 284, 285,
364
antiparallel pleated sheet 68antiport 212, 218antisense DNA 264apatites 340, 341APC see antigen-presenting
cellsapoferritin 287apolar molecules 28apoproteins 278apoptosis 210, 396-7, 397aquaporin-1 220, 221arabinan 41L-arabinose 38, 39, 42arachidonate lipoxygenases
390, 391, 421arachidonic acid 48, 49, 390arginase 183, 427arginine 60, 61, 182, 183
lactate dehydrogenase100
vasopressin (AVP) seeantidiuretic hormone
argininosuccinate 182, 183lyase 183, 428synthase 183, 429
aromatic amino acids 60,184L-amino acid decarboxy-
lase 352, 353, 427aromatic family 185aromatic ring systems 4arylesterase 316, 317, 425ascorbates 104, 368L-ascorbic acid see vitamin Casialoglycoproteins 276Asp-tRNA ligase 248, 249asparaginase 427asparagine 60, 61
synthase 429aspartate 63, 178, 182, 183
carbamoyltransferase(ACTase) 116, 117, 188,422
family 184, 185kinase 424kinetics 117proteinases 177, 427purine ring 188, 189pyrimidine ring 188, 189semialdehyde dehydro-
genase 420transaminase 178, 179,
183, 212, 213, 423aspartic acid 60, 61atomic oxygen 25
All rights reserved. Usage subject to terms and conditions of license.Koolman, Color Atlas of Biochemistry, 2nd edition © 2005 Thieme

440 Index
ATP 35, 112, 122-3, 123ATP, charge density 123
dATP 240energetic coupling 16,
122, 124exchange 212formation 122, 123glucose oxidation 147hydrolysis 122, 123nucleotide biosynthesis
190, 191oxidative
phosphorylation 123phosphate transfer 123structure 122synthase see ATP syn-
thasesynthesis 112, 122, 142-5,
210NADH+H+ 142, 143proton driven 126, 127
ATP synthase 122, 126, 142,143, 210catalytic units 142, 143H+-transporting 140, 141,
143, 427light reactions 128, 129proton channels 142, 143respiratory control 144,
145ATP-citrate lyase 428ATP-dependent phosphory-
lation 114ATPases
Ca2+ 220F type 220H+-transporting 427H+/K+-exchanging 427P type 220V type 220
atrial natriuretic factor(ANF), receptor 388, 389
atrial natriuretic peptide(ANP) 388, 389
autocrine effectseicosanoids 390hormones 372, 373
autotrophs 112AVP see arginine vasopres-
sinaxial (a) position 34
axons 348
B
B cell 161, 274, 275, 294B-DNA 84, 87bacteria
carbohydrates 35cell components 202-3,
203cyanobacteria 132lactic acid fermentation
148, 149nitrogen fixation 184, 185polysaccharides 41symbiosis 184
bacteriophages 260, 404bacteriorhodopsin 126, 127bacteroids 184, 185ball-and-stick models 6basal transcription complex
242, 244, 245base pairs (bp) 84bases (b) 30-1, 31, 80-1
ammonia 30, 31, 182chloride ions 31conjugated 18, 30DNA ratios 84hydroxyl ions 31water 31
basic amino acids 60, seealso individual aminoacids
bcl-2 396beer 148, 149Beer—Lambert law 102behencic acid 49bell-shaped curves 94, 95benzene 4, 5benzo(a)pyrenes 256, 257p-benzoquinone 33β-granules 160, 161β turns 69β-oxidation 210β-configurations 12β-globulins 276, 286bicarbonate, resorption 326bile 194, 268, 269
pigments 194salts 314, 315
bile acids 56, 57, 172, 312conjugated 314primary 56, 314-15secondary 56, 314-15
bilirubin 194, 195, 287diglucuronides 194, 195monoglucuronides 194
biliverdin 194, 195reductase 194, 195, 421
binding sites 250aminoacyl tRNA 252
biogenic amines 12, 62, 63,352
biomolecules 10-13biosynthesis
heme 192-3, 193, 210NAD+ 208
biotin see vitamin Hbiotransformations 226,
306, 316-17, 317BiP 2331,3-bisphosphoglycerate
124, 125, 150, 151, 155,282, 283
2,3-bisphosphoglycerate seeBPG
bisphosphoglyceratemutase 283, 429phosphatase 283, 425
bisubstrate kinetics 95blood
alcohol 321cells 274, 275clotting 290-1, 291composition 274ethanol 320, 321function 274, 275groups 292-3, 293metabolites 274plasma 31serum 274
blood—brain barrier 356boat conformation 54, 55bodies, residual 234Bohr effect 282bonds
acid—amide 13acid—anhydride 150angles 7chemical see chemical
bondsdisulfides 62, 72, 73, 106,
190double 4electron 6hydrogen 72lengths 7peptide 66-7phosphoric acid 122
All rights reserved. Usage subject to terms and conditions of license.Koolman, Color Atlas of Biochemistry, 2nd edition © 2005 Thieme

441Index
polarity 6, 7single 4
bone 340, 341calcium 342remodeling 342, 343
Bowman’s capsule 323BPG 282, 283brain 356, 357
gluconeogenesis 154branched-chain amino acid
transaminase 424brewing 149Brunner glands 268buffers 30, 31
blood plasma 288, 289capacity 30, 288dialysis 78, 79function, organ metabo-
lism 308-9building blocks, lipids 461,3,-butadiene 4, 5butyric acid 49
C
C peptide, insulin 76, 77,160, 161
C segment 302C state 116C terminus 66c-oncogenes see proto-on-
cogenesC-peptides 76C1
metabolism 418transferases 89
caesium chloride 201calcidol 1-monooxygenase
330, 331, 422calciol see vitamin Dcalcitonin 342, 343calcitriol 56, 57, 330, 342,
374, 376calcium
ATPase 220bone 342functions 342, 343homeostasis 342, 343ions 328, 334, 335, 386,
387metabolism 342-3reservoir 210sarcoplasmic pump 220signaling 342
store 226calcium-transporting ATP-
ase 427calmodulin 386, 387calorimetry 20, 21Calvin cycle 128, 129, 130,
131, 407cAMP 120, 380, 384, 386,
387lactose operon 119phosphodiesterase 120,
121camphor 52, 53CAP see catabolite activator
proteincap, RNA modification 246capacity factor 16capric acid 49caproic acid 49capsids, rhinovirus 404N-carbamoyl aspartate 188,
189carbamoyl phosphate 182,
183, 188, 189synthase 182, 183, 188,
429carbohydrate metabolism
160, 306, 310-11, 388metabolic charts 408, 409regulation 158-9, 159
carbohydrates 34-45, 35bacteria 35disaccharides see disac-
charideshydrolysis 266membranes 216metabolism see carbohy-
drate metabolismmonosaccharides see
monosaccharidesnutrients 360oligosaccharides see oli-
gosaccharidespolysaccharides see poly-
saccharidesreserve 156resorption 266see also glycolipids; gly-
coproteinscarbamoyl phosphate 116,
182, 183, 188carbon dioxide 35, 108
bicarbonate buffer 288degradation 112fixation 130transport 282-3, 283
hemoglobin 280, 282carbonate dehydratase 270,
271, 283, 289, 428proton secretion 326, 327
carbonic anhydrase see car-bonate dehydratase
carbonium ions 15carbonyl groups 11carboxy-lyases 427N-carboxybiotin 108γ-carboxyglutamate 62, 290carboxyl groups 11carboxylases see carboxy-
lyasesγ-carboxylation 62, 290carboxylic acid 10, 11, 15, 48,
49activated 106amides 10, 11ester 10, 11
carboxypeptidases 176, 177,425-6
caries 340carnitine 164, 165
acyltransferase 164, 165O-palmitoyltransferase
163, 165, 423shuttle 212
carotenoids 46, 47β-carotene 132, 133
carrageenan 40, 41carrier electrophoresis 276caspases 396catabolic pathways 112, 113,
138, 139catabolite activator protein
(CAP) 64, 65, 118, 119catalase 24, 25, 166, 284,
285, 421catalysis 24-5, 25
acid—base 90covalent 90cycles 100, 143, 221enzymes 90-1hydrogen peroxide 25iodide 25lactate dehydrogenase
100membranes 216
catalysts 88, 92, see also en-zymes
catalytic units, ATP synthase142, 143
catechol O-methyltransfer-ase 316, 317, 422
catecholamines 352, 353
All rights reserved. Usage subject to terms and conditions of license.Koolman, Color Atlas of Biochemistry, 2nd edition © 2005 Thieme

442 Index
cathepsins 176cations 27CD4 296CD8 296cdc2 see cyclin-dependent
protein kinase 1 (CDK1)CDK see cyclin-dependent
protein kinasecDNA 260CDP 190, 191
choline 110, 111diacylglycerol 170, 171diacylglycerol-inositol 3-
phosphatidyl transfer-ase 170, 171, 425
cell bodies 348cell cycle 394-5, 395cells
animal 196antigen-presenting
(APCs) 294division 400, 401fractionation 198-9inhibition 402interaction 216movement 206necrosis 396organelles 196, 198plant 196proliferation 396, 397structure 196-7transformation 401transport 206vacuoles 234
cellular immunity 294cellulose 34, 41, 42, 43
hemicellulose 43cement 340centers
active 74, 90reaction 132
central nervous system seeCNS
centrifugation 201density gradient 200, 201equipment 200isopyknic 200principles 200-1steps 198zonal 200
centrosome 206cephalin see phosphatidyl-
ethanolaminecephalosporins 254, 255cerebrosides 46, 47, 51
galactosyl 51glucosylceramide 50, 51
cGMP 386esterase 358, 359phosphodiesterase 425photoreceptors 358
chain termination method260
chainsrespiratory 106, 112, 126,
140-1, 210side 76, 77
chair conformation 34, 54,55
channelsion 126, 218, 222-4, 350,
384K+ 222ligand-gated 222passive 222protein 218voltage-gated Na+ 222
chaperones 232, 233chaperonins 232, 233charge 59chemical bonds 4-7, 5chemical energy 112, 122chemical potential 12, 16, 22chemical reactions 14-15chemical work 17chemokines 392chemoluminescent immu-
noassay (CIA)chemotaxis 298chenodeoxycholic acid 56,
57, 314chiral center 8, 12, 35, 49chitin 40, 41chloramphenicol 254, 255chloride ions, bases 31chlorophylls 128, 129, 132,
133chloroplasts 196, 407, 407
lumen 128, 129cholecalciferol see vitamin Dcholecystokinin 270cholestane 54, 55cholestanol 54, 55cholesterol 52, 53, 56, 57, 65,
312, 315biosynthesis 172, 173esterase 425membranes 214, 215monooxygenase 422van der Waals models 54,
55cholic acid 56, 57, 314, 315choline 50, 51, 141, 354
kinase 424O-acetyltransferase 354,
355, 423phosphate cytidyltrans-
ferase 425chondroitin 6-sulfate 347Christmas factor 291chromatin 208, 238, 239chromatography 55, 78chromosomes 238chylomicrons 163, 272, 278chymosin 427chymotrypsin 94, 95, 268,
269, 426CIA see chemoluminescence
immunoassaycircadian rhythm 372cirrhosis 320cis—trans isomerases 89cis—trans isomers 8, 9, 54,
55, 429cisplatin 402citrate 9, 137, 158
fat metabolism 163lyase 139synthase 136, 137, 138,
428tricarboxylic acid cycle
144, 145citric acid 136
cycle 141, 147citronellal 52, 53citrulline 62, 63, 182, 183classic pathway, comple-
ment 298clathrate, structure 28, 29cleavage, homolytic 108clones 258, 304closed-loop feedback con-
trol 372clotting 290-1, 291CMP 1873’,5’-cNMP phosphodiester-
ase 425CNS, signal transmission
348-9co-lipase 268, 269co-receptors 296CO2 see carbon dioxideCoA see acetyl CoA; coen-
zyme Acoactivator/mediator com-
All rights reserved. Usage subject to terms and conditions of license.Koolman, Color Atlas of Biochemistry, 2nd edition © 2005 Thieme

443Index
plex 244coagulation factors 291, 426cobalamine see vitamin B12cobalt 108, 109coding strands 85codogenic strands 85codons 236
anticodons 82, 86, 236,248, 249
start 248, 250stop 248, 250
coenzyme A (CoA) 106, 107,134acetyl CoA see acetyl CoA
coenzyme Q (CoQ) 104, 136,140, 212ATP synthesis 142, 143isoprenoid anchors 52, 53oxidized 212redox systems 105reduced 147
cytochrome c reduc-tase complex 141, 421
coenzymes 104-11, 105availability 114coenzyme A see coen-
zyme Acoenzyme Q see coen-
zyme Qdefinition 104energetic coupling 106,
107flavin see flavingroup-transferring 106-7,
107, 108-9, 109heme 106, 107NAD see NADnucleotide triphosphates
110, 122-3redox 104, 105, 106-7, 107soluble 104vitamins 364
cofactors 46, 104collagenase 427collagens 64, 70, 71, 346
biosynthesis 344, 345bone 340helix 65, 68, 69, 344procollagen 344structure 344, 345tropocollagen 344
collision complexes 90colony-stimulating factors
(CSF) 392combustion 21competitive inhibitors 96, 97
complement 298-9activation 298, 299alternative pathway 298C1—C9 298, 299C3/C5 convertase 298,
299, 426C5 convertase 298, 299classic pathway 298factors 298
complementary DNA(cDNA) see cDNA
complex glycoproteins 45complex I 140complex II see succinate de-
hydrogenasecomplex III 140complex IV 140complex V see ATP synthase,
H+-transportingcomplexescomplex lipids 170-1complex oligosaccharides
44, 230complex
basal transcription 242,244, 245
coactivator/mediator 244daunomycin—DNA 254enzyme—substrate 92enzymes 91, 95fatty acid—albumin 163formation 72initiation, 70S 250lipoprotein 312membrane attack 298multienzyme 134oxoglutarate dehydro-
genase 144, 145pores 208prothrombinase 291repressor—allolactose 119translocator 232vitamin B2 366
compounds 11concentration
gradients 126, 127substrates 97, 116and velocity 93, 97
condensation, chromosomal238
cones 358conformation 8, 9, 35
A 86cis—trans 8, 9, 54, 55, 429enzymes 92native 72, 74
R 117, 280, 281ring 54, 55space 66stabilizing interactions
72, 73T 117, 280, 281zig-zag (Z) 86
conjugates 316steroid hormones 110
conservationdifferences 98energy 106, 126-7, 127
constitution 6contraction
muscles 332-3control 334-5
control elements 118transcription 244
copper ions (Cu) 132, 133,142, 143
coproporphyrinogen III 192,193
CoQ see coenzyme Qcore oligosaccharide 230core structures 44Cori cycle 338, 339corrin 108corticotropin see adreno-
corticotropic hormonecortisol 56, 57, 159, 338, 374,
376, 378gluconeogenesis 120, 121,
154cosubstrates 104cotton fibers 42coupling
energetic 16, 18, 106, 112ATP 16, 122, 124, 125
covalency 6, 90, 108creatine 324
kinase 98, 336, 337, 424metabolism 336, 337phosphate 122, 336
creatinine 336cristae 210CSF see colony-stimulating
factorCTP 190, 191
dCTP 190, 191, 240synthase 190, 191, 429
cultures, primary 304curves, bell-shaped 94, 95cyanobacteria, photosystem
(PS) I 132cycles, catalytic 100, 1433’5’-cyclic AMP see cAMP
All rights reserved. Usage subject to terms and conditions of license.Koolman, Color Atlas of Biochemistry, 2nd edition © 2005 Thieme

444 Index
3’5’-cyclic GMP see cGMPcyclic phosphorylation 130,
131cyclin 394
B 394cyclin-dependent protein
kinases (CDK) 394CDK1 394
cyclophosphamide 402cystathionine
β-syntase 428γ-lyase 428
cysteamine 12, 13, 62, 63cysteine 60, 61, 63
acid—base balance 288dioxygenase 421proteinases 177, 427transaminase 424
cystinuria 322Cyt P450 see cytochrome
P450cytidine 80, 81
5’-diphosphate (CDP) seeCDP
5’-monophosphate(CMP) see CMP
5’-triphosphate (CTP) seeCTP
cytochalasins 204cytochrome c 140, 396
oxidase 132, 133, 140, 141,421proton pumps 126, 127
cytochromes 106b/f complex 128, 129c see cytochrome cP450 172, 316, 318-19,
319cytokines 342, 392-3, 393cytoplasm 196, 202
biochemical functions203
nuclear interactions 208,209
pH 31cytoplasmic pathway 228cytosine 80, 81cytoskeleton 196, 204-7, 216cytosol, fractionation 198cytostatic drugs 402-3cytotoxic T cells 294
D
D series monosaccharides34
DAG see diacylglyceroldATP 240daunomycin 254, 255dCDP 190dCTP 190, 191, 240ddNTPs 260, 261deamination 178-80, 179,
180, 181decarboxylases see carboxy-
lyasesdecarboxylation 62, 63, 108
oxidative 134defense, blood 274deficiency
minerals 362vitamins 364
genetic code 248degradation 112
amino acids 180cyclin 394nucleotides 186-7
dehydration 108dehydrogenases (DH) 89,
104, 145dehydroascorbic acid 104denaturation 72dendrites 348density gradient
centrifugation 201dentine 3402-deoxy-D-ribose 39deoxyaldoses 38, 39
see also 2-deoxy-D-ribose; L-fucose
deoxycholic acid 56, 57, 314,315
deoxyhemoglobin 281deoxyribodipyrimidine
photolyase 428deoxyribonuclease I 425deoxyribonucleic acid see
DNAdeoxyribonucleosides 80
triphosphates see dNTPs,ddNTPs
2-deoxythymidine-5’-mono-phosphate see dTMP
dephosphorylation 114depolarization 222
channels 350membranes 348
dermatan sulfate 347desmin 332
desulfurations 316detoxification 306development, cytokines 392dextrans 40, 41dGTP 240DH see dehydrogenasesdiabetes mellitus 76, 160-1
ketone bodies 312diacylglycerol (DAG) 48, 49,
170, 171, 386, 387O-acyltransferase 170,
171, 423choline phosphotransfer-
ase 425diacylglycerols (DAG), lipase
425dialysis 78, 792,4-dienoyl-CoA reductase
167, 421differentiation, hormones
370diffusion
facilitated 218free 218
digestion 266-73, 370digestive juices 268, 269
dihydrofolate reductase242, 304, 402, 403
dihydrogen phosphate 11dihydrolipoamide
acetyltransferase 134,135, 423
dehydrogenase 1, 34, 135,421
succinyltransferase 423dihydroorotase 427dihydroorotate 141, 188, 189
dehydrogenase 421dihydrouridine 82, 83dihydroxyacetone
phosphate see glycerone-1-phosphate
3,4-dihyroxyphenylalaninesee dopa
dimers 116, 117dimethylallyl
diphosphate 173transferase 423
dimethylbenzimidazole 1082,4-dinitrophenol (DNP) see
DNPdioxygenases 89dipeptidases 176, 177, 425-6dipeptides 66disaccharides 38, 39, 272,
All rights reserved. Usage subject to terms and conditions of license.Koolman, Color Atlas of Biochemistry, 2nd edition © 2005 Thieme

445Index
273disruption 198dissociation curves 58dissolution 20, 21disulfides 10-11
bonds 62, 72, 73, 106, 190,300
dithiol 106diuresis 328DNA 80, 84-5
amplification 262antisense 264B-DNA 84, 86cDNA 260cloning 258-9, 259conformation 86-7, 87electrophoresis 262, 263fingerprinting 264, 265genetic coding 84germ-line 302gyrase see DNA topoiso-
merase (ATP-hydro-lyzing, type II)
helicase see DNA topoi-somerase (type I)
libraries 260, 261ligase 256, 257, 429nucleus 208polymerases 240, 241
see also individualpolymerases
primers 240proteins 65sequencing 260-1, 261structure 84, 85templates 240zig-zag 86
Dna K 232DNA polymerases 240, 241
repair 256, 257DNA topoisomerases 240
(ATP-hydrolyzing, type II)240, 429
(type I) 240, 245, 429DNA-binding proteins, on-
cogenes 398DNA-dependent DNA poly-
merases 240, 242DNA-directed DNA poly-
merases 424DNA-directed RNA poly-
merases 240, 242, 243,245, 424
DNP 144dNTPs 260, 261, 262
dolichol 53, 53diphosphate 230
domainsdimers 116receptors 224SH2 392steroid receptors 378
donors 6electrons 88
dopa 62, 63, 352L-dopa 6, 7, 63
dopamine 62, 63, 352β-monooxygenase 352,
353, 422double helix 84, 86double stranded (dsDNA)
see dsDNAdoxorubicin 402drugs, cytostatic 402-3dTMP 80, 81, 187, 191dTTP 190, 191, 240dUMP 190dynamics, proteins 72, 73
E
e- see electronsEA see ethanolamineEadie—Hofstee plots 96,
97EC number 88ecdysone 56, 57ECM see extracellular matrixEcoRI sites 258, 259effectors
allosteric 114, 115, 116caspases 396domain 224
EIA see enzyme-linked im-munoassay
eicosanoids 46, 47, 390-1,391autocrine effects 390paracrine effects 390signaling 46, 390
elastase 268, 269, 426electrical dipole 26electrical work 17electrochemical gradients
126, 127, 128electrolytes, recycling 328-
9, 329electron-transferring flavo-
protein (ETF) 164
dehydrogenase 164, 165,421
electronegativity 6electroneutral processes
218electrons 14
acceptors 88configurations 2, 3donors 88excitation 128, 129oxidized forms 32p 4pairs 6potential 18, 19reduced forms 32reducing equivalent 33singlet state 130transfers 33transport chain 128, 140
electrophoresis 263, 277carrier 276DNA 262, 263lactate dehydrogenase
(LDH) 99SDS gel 78, 79
elementary fibrils 42, 43elements 3eliminations 14, 15eliminative deamination
180elongation 242
Escherichia coli 251factors 252
elution, proteins 78, 79embryo, hemoglobin 280lemulsions 28, 270enamel 340enantiomers 8enclosure, membranes 216endergonic processes 16, 17,
112endergonic transfer 18endocrine effects 372, 373endocytosis 234, 235
receptor-mediated 278endonucleases, restriction
258, 259, 425endopeptidases see metal-
loproteinasesendoplasmic reticulum (ER)
196, 226, 227gluconeogenesis 154protein folding 232, 233protein synthesis 231rough (rER) 226, 232
All rights reserved. Usage subject to terms and conditions of license.Koolman, Color Atlas of Biochemistry, 2nd edition © 2005 Thieme

446 Index
smooth (sER) 172, 173,226, 227
endosomes 196, 234endosymbiotic theory 210endothermic reactions 20energetic coupling 16, 17, 18,
112, 124-5, 125ATP 16, 122, 124coenzymes 106, 107
energetics 16-17, 17coupling see energetic
couplingprotein folding 74, 75
energyactivation 25chemical 112, 122conservation 106, 126-7,
127definition 16metabolism 336, 356requirements 360, 361
engineering, genetic 258enhancers 118enol phosphate 124enolase see phosphopyru-
vate hydrataseenoyl-[ACP] reductase 168,
169, 421enoyl-CoA
hydratase 165, 166, 428isomerase 166, 167, 429
enterohepatic circulation194, 314
enteropeptidase (enteroki-nase) 176, 270, 426
enthalpy 20-1, 21folding 74free 142, 143
entropy 20-1, 21envelope conformation 54,
55enzyme—substrate com-
plexes 92enzyme-catalyzed reactions
90, 93enzyme-linked immunoas-
say (EIA) 304enzymes
activating 114active centers 95activity 88, 89allosteric 92, 93analysis 102-3basics 88-9catalysis 90-1, 216
classes 88, 89see also individual
classescomplement cascade
298complexes 91, 95conformations 92glucose determination
102, 103inhibitors see inhibitorsinterconversion 114isoenzymes 98, 99isosteric 92, 93kinetics 92-5markers 198nomenclature 420-30pH 94, 95proteolytic 177reaction specificity 88regulatory mechanisms
114serum diagnosis 98, 178substrate specificity 88temperature 94, 95turnover 88, 89watersplitting 130see also individual en-
zymesepimers 36
epimerases 89, 428epimerization 36, 37
epinephrine 159, 163, 352,380
episodic release 372equilibrium 16, 17, 18-19
constant (K) 18, 19nitrogen 174, 175potential 126, 350
equitorial (e) position 34ER see endoplasmic reticu-
lumergosterol 56, 57ERK see MAPKerucic acid 49erythrocytes 274
gluconeogenesis 154metabolism 284-5, 285
erythromycin 254, 255erythropoiesis 286erythropoietin 330erythrose-4-phosphate 153Escherichia coli
aspartate carbamoyl-transferase 116
cell components 202-3
elongation 251lactose operon 118protein biosynthesis 251pyruvate dehydrogenase
134, 135replication 240, 241termination 251translation 251
essential amino acids (EAA)60, 174, 360active centers 99biosynthesis 184, 185,
410, 412non-essential 184, 413
essential fatty acids 46, 48ester bonds 12esterases 89esterification 36, 37esters 15, 47estradiol 56, 57, 374, 376estrogen 342
receptor 72, 73ethanal 320ethanol 27, 320-1, 321ethanolamine (EA) 50, 51,
62, 63kinase 424phosphate cytidyltrans-
ferase 424phosphotransferase 425
ethers 10, 11ethidium bromide 262, 263euchromatin 208, 238eukaryotes 196, 197, 250,
251event-regulated hormones
372excision repair 256excitation, electrons 128,
129excretion
ammonia 326, 327hormones 370kidneys 322liver 306protons 326
exergonic processes 16, 17,18, 112
exocytosis 226, 228, 229neurotransmitters 348
exons 242, 243exopeptidases 176, 177exosomes 196exothermic reactions 20expression plasmids 262
All rights reserved. Usage subject to terms and conditions of license.Koolman, Color Atlas of Biochemistry, 2nd edition © 2005 Thieme

447Index
extensin 42, 43extracellular matrix (ECM)
346-7, 347
F
F type ATPase 220F-actin 64, 65, 332Fabales 184facilitated diffusion 218factors, intrinsic 268, 269FAD see flavin adenine di-
nucleotideFaraday constant 19farnesol 52, 53farnesyl diphosphate 173
farnesyltransferase 423Fas system 396fat-soluble vitamins 46fats 47, 48-9
biosynthesis 171, 409brown 144, 145degradation 410-11digestion 270, 271metabolism 162-3, 163,
312nutrients 360structure 48, 49, 51synthesis, liver 162uncouplers 144, 145
fatty acid synthase 12, 168,169, 423fat metabolism 162, 163
fatty acid—albumincomplex 163
fatty acid-CoA ligase 163,272, 273
fatty acids 46, 47, 48-9, 146,312degradation 163, 164-5,
165, 166-7essential 46, 48liver 162long 166muscle fibers 336odd-numbered 166, 167resorption 272synthesis 113, 163, 168-9,
169transport 164, 165unsaturated 48, 166, 167
fatty liver 320Fd see ferredoxinFe protein 184-5
Fe—Mo protein 184, 185Fe-protoporphyrin IX 192feedback inhibition 114, 115,
158purines 188
fermentation 112, 146, 148-9, 149
ferredoxin 184, 185ferredoxin-NADP+ reduc-
tase 422ferritins 286, 287ferredoxin (Fd) 128, 129fetal hemoglobin 280FFA see free fatty acidsfibers
cotton 42muscle 332, 337red muscle 336resorption 266white muscle 336
fibrils 42, 344elementary 42, 43
fibrin stabilizing factor 291fibrin-stabilizing factor see
protein-glutamine γ-glu-tamyltransferase
fibrinogen 291fibrinolysis 292-3, 293fibroin 70fibronectins 346, 347filaments
intermediate 70, 71, 204,205, 206, 207
keratin 70, 71, 206microfilaments 204, 206,
207protofilaments 71, 204
filmsamphipathic 28surface 29
filtrationcell 198ultrafiltration 322
first-order reactions 22, 23Fischer projections 9, 35, 59fixation, carbon dioxide 130flavin 104, 140
redox systems 33flavin adenine dinucleotide
(FAD) 32, 81, 104pyruvate dehydrogenase
134flavin mononucleotide
(FMN) 32, 104, 105ATP synthesis 142, 143
flavodoxin 72, 73flavoprotein (Fp)5-fluorouracil 402fMet see N-formylmethionefolate 366folic acid 254, 255food 34, 266, 360foreign genes 264forks, replication 240formate 4, 5formic acid 49N-formylmethionine (fMet)
250, 2515-formyltetrahydrofolate
cycloligase 429Fp see flavoproteinfragments, Okazaki 240frameshift mutation 257free diffusion 218free electron pairs 6free enthalpy (G) 16, 142,
143free fatty acids (FFA) 48free radicals 32, 190, 256frucose-1,6-bisphosphate
151β-fructofuranosidase 38,
426fructose
-1,6-bisphosphatase 154,155
bisphosphate 4251,6-bisphosphate 150,
154, 1592,6-bisphosphate 158,1592,6-bisphosphate 2-
phosphatase 425bisphosphate, adolase
310, 311, 428D-fructose 36, 37, 391-phosphate 38, 3106-phosphate 150, 151,
153, 155, 159fructoses
gluconeogenesis 328metabolism 310, 311uptake 272
fucose 34, 44L-fucose 39
fucosyltransferase 292, 293fuel, lipids 46fumarate 136, 137, 182, 183,
189dehydrogenase 136, 137hydratase (fumarase) 183,
All rights reserved. Usage subject to terms and conditions of license.Koolman, Color Atlas of Biochemistry, 2nd edition © 2005 Thieme

448 Index
428fumaric acid 8, 9fumarylacetoacetase 427functional groups 10furanose 34
G
G proteinsRas 388signal transduction 384,
385G0 phase 394G1 phase 394GABA 63, 356, 357galactokinase 310, 311, 424galactose 44
D-galactose 38, 39, 44metabolism 310, 311uptake 272
galactose 1-phosphate 310galactosidase 119
β-galactosidase 426galactosylceramide 50, 51galactosyltransferase 292,
293gallbladder 195gallstones 314GalNAc see N-acetyl-D-gal-
actosamineγ-aminobutyric acid see
GABAγ-carboxyglutamate 62, 290γ-globulins 276γ-glutamyltransferase 423gangliosides 46, 47, 50, 51,
214, 215gas constant (R)gases, transport 282-3gastric juice 268, 269
pH 31gastricsin (pepsin C) 427gastrin 270gastrointestinal hormones
270GDP 190, 191gels 79
electrophoresisDNA 263lactate dehydrogenase
(LDH) 99SDS 78, 79
filtration 78, 79particles 78, 79
permeation chromato-graphy 78
genesexpression 236-7foreign 264genetic information 236,
237libraries 260, 261multiple 302probes 260regulation 118structural 118therapy 264, 265, 402
genetic code 85, 248, 249genetic engineering 258,
264-5genetics, molecular 236-65genomes 236, 238-9geometric isomers 8geraniol 52, 53geranyl diphosphate 173geranyltransferase 423germ-line DNA 302Gibbs—Helmholtz equation
20, 21glandular hormones 372GlcNAc see N-acetyl-D-
glucosamine; N-acetyl-glucosamine
GlcA see D-glucuronic acidglobular proteins 72-3globulins 276, 277
β-globulins 286glucagon 163, 308, 380
gluconeogenesis 154, 158,159
glucagon receptor 1211,4-α-glucan, branching
enzyme 157, 423α-1,4-glucan, chain 1574-α-glucanotransferase 157,
423D-glucofuranose 35glycogen 120gluconeogenesis 35, 113,
310, 311amino acids 138, 154, 155,
180cortisol 120, 121glucagon 154, 158, 159insulin 160, 161recycling 328, 329
gluconic acid 36gluconolactonase 153, 425
gluconolactone 37, 103D-glucopyranose 34, 35glucose 34, 35, 65, 146, 162
adipose tissue 160, 161brain 356chain 35D-glucose 34, 36, 39, 44enzymic determination
102, 103gluconeogenesis 154, 155glycogen 156, 157glycolysis 150, 151insulin 121, 158, 159, 160,
161kidney 160, 161lactose operon 118liver 160, 161metabolism 120, 121muscle 160, 161oxidase 102, 103, 420oxidation 36, 146, 147reduction 36transporter Glut-1 220,
221uptake 272
glucose oxidation,hexokinase 147
glucose 1-phosphate 156,157, 159, 310
glucose 6-phosphatase 154,155, 157, 425
glucose 6-phosphate 37,150, 151, 152, 157, 159dehydrogenase 152, 153,
420gluconeogenesis 154, 155isomerase 151, 429pentose phosphate
pathway 153α-glucosidase 224glucoside formation 36glucosuria 160glucosylceramide 50glucuronate 37glucuronic acid 36, 44β-glucuronidases 194glucuronosyltransferase
194, 195, 316, 317, 423glutamate 178, 326, 357
5-kinase 424decarboxylase 356, 357,
427dehydrogenase 178, 179,
181, 183, 326, 327, 421family 184, 185
All rights reserved. Usage subject to terms and conditions of license.Koolman, Color Atlas of Biochemistry, 2nd edition © 2005 Thieme

449Index
formiminotransferase422
neurotransmitters 356glutamate-NH3 ligase 429glutamic acid 60, 61glutaminase 178, 179, 181,
327, 356, 357, 427glutamine 60, 61, 178, 326,
357brain 356gluconeogenesis 328muscle metabolism 338purine biosynthesis 188,
189pyrimidine biosynthesis
188, 189synthase 64synthetase 65, 124, 125,
356, 357, 429glutamylphosphate reduc-
tase 420glutathione 106, 284, 285
disulfide bonds 72oxidized
peroxidase 284, 285, 421reductase 284, 285, 421
glyceral-3-phosphate dehy-drogenase 212, 213
glyceral 5-phosphate 153glyceraldehyde 310
D-glyceraldehyde 34glyceraldehyde 3-phos-
phate 150, 151, 153, 155glyceraldehyde-3-phos-
phate dehydrogenase124, 125, 420glucose oxidation 147glycerophosphate shuttle
212, 213glycolysis 150, 151
glycerol 27, 48, 49, 154, 170,171gluconeogenesis 328kinase 155, 170, 171, 424
glycerol 3-phosphate 154,155, 170, 171dehydrogenase 155, 170,
171, 212, 213, 420O-acyltransferase 170,
171, 423glycerone phosphate O-
acyltransferase 423glycerone 1-phosphate 310glycerone 3-phosphate 151,
154, 170, 171
α-glycerophosphate 141glycerophosphate shuttle
212, 213glycine 60, 61, 192, 193, 314
amidinotransferase 336,337, 422
collagen 70dehydrogenase 421hydroxymethyltransfer-
ase 422glycinuria 322glycosaminoglycans 110glycocalyx 214, 230glycocholic acid 314, 315glycogen 34, 35, 40, 41, 120,
121balance 157liver 156metabolism 156-7, 157muscle 156, 336polymer 41(starch) phosphorylase
see phosphorylase(starch) synthase 423synthase 120, 121, 156,
157, 158, 159kinase 3 (GSK-3) 388
glycogenin 34, 35, 156glycolipids 35, 46, 47, 50-1
membranes 214structure 50, 51
glycolysis 35, 113, 146, 150-9, 151, 336, 338
glycoproteins 35, 230complex 45forms 45, 45mannose-rich 45O-linked 45
glycosaminoglycans 44-5,346
N-glycosidic bonds 80glycosidases 89, 426O-glycosidases 231N-glycosides 36, 37N-glycosidic bonds 12, 13,
44, 123N-glycosidic links 44O-glycosidic links 44glycosylation 62, 230
collagen 344proteins 230, 231sequence 230
glycosylceramide 50, 51glycosyltransferases 89, 231glyoxylic acid cycle 138
GMP 186, 187, 190, 191synthase 429
Golgi apparatus 196, 226,227
gonane 54, 55GOT see aspartate transa-
minasegout 186, 187gp130 392GPT see alanine transami-
nasegrana 128, 129granulocytes 274, 275Grb-2 388GroEL 232, 233GroES 232, 233grooves, strands 86group transfer
coenzymes 106-7, 107,108-9, 109
potential 12, 19reactions 18, 19
group X 108groups
hydroxyalkyl 106leaving 14prosthetic 104, 134, 142
growthfactors 342hormones 370
GSH see glutathione, re-duced
GSK-3 see glycogen syn-thase kinase-3
GSSG see glutathione, oxi-dized
GTP 136, 190, 191dGTP 240
GTP-binding proteins 398guanidine
2’-O-methylguanidine 82,83
7-methylguanidine 82, 83guanidinoacetate 336
N-methyltransferase 336,337, 422
guanine 80, 81, 186, 187guanosine 80, 81, 186
5’-diphosphate (GDP) seeGDP
5’-monophosphate(GMP) see GMP
All rights reserved. Usage subject to terms and conditions of license.Koolman, Color Atlas of Biochemistry, 2nd edition © 2005 Thieme

450 Index
5’-triphosphate (GTP) seeGTP
guanylate cyclase 358, 359,388, 389, 428
L-gulonolactone oxidase 420gyrase 240
inhibitors 254
H
H+ see hydronium ions(H3O+); protons
H+-transporting ATPsynthase see ATP syn-thase, H+-transporting
H+-transporting ATPase 427H+/K+-exchanging ATPase
270, 271, 427Hageman factor 291hair 70Hartnup’s disease 322HAT medium 304Haworth projections 34, 35Hb see hemoglobinHCO3
-, resorption 326HDL 278heart
absorptive state 308muscle 332
heatloss 20of reaction 20, 21
heat-shock proteins (hsp)232, 378
heavy chains, IgG 300helicase 240helices
1-helix receptors 3847-helix receptors 225,
384α-helix 67, 68, 69, 71α-keratin 70, 71collagen 68, 70, 344DNA 84, 86double 84, 86left-handed 86pitch 86superhelix 70, 71triple helix 70, 71, 344
helper T cells 294heme
ATP synthesis 142, 143b 192biosynthesis 192-3, 193,
210catalase 25coenzymes 106, 107, 140,
141degradation 194-5, 195groups 280iron 286monooxygenases 318oxygenase 194, 195, 422oxygenated 287
hemiacetals 10, 11, 34hemicellulose 42hemochromatoses 286hemoglobin (Hb) 64, 65,
280-1, 281allosteric effect 116, 280buffers 288transport 282, 283
hemosiderin 286, 287Henderson—Hasselbalch
equation 18, 19heparin 290, 347hepatic glycogen 156hepatic metabolism 306hepatocytes 163, 306, 307heterochromatin 208, 238heterogenous nuclear ribo-
nucleic acid (hnRNA) seehnRNA
heteroglycans 40heterotrophs 112, 128Hevea brasiliensis 52hexokinase 147, 159, 424hexose monophosphate
pathway (HMP) see pen-tose phosphate pathway
hexose-1-phosphate uridyl-transferase 310, 311, 424
hexoses 39high-density lipoprotein
(HDL) see HDLhigh-performance liquid
chromatography (HPLC)Hill coef cient (H) 116hippurate 324histamine 270, 380histidine 59, 60, 61, 63, 184,
185ammonia lyase 428dissociation curves 58lactate dehydrogenase
100histone
acetyl transferase 244,245
deacetylase 244, 245histones 64, 238, 239
non-histone proteins 238phosphorylation 238
HIV 404, 405HMG-CoA 172, 173, 312
dehydrogenase 420lyase 312, 313, 428reductase 172, 173synthase 312, 313, 428
HMP see hexose mono-phosphate pathway
hnRNA 236, 242immunoglobulins 302splicing 246, 247
homeostasis 322, 326, 328blood 274calcium 342, 343cytokines 392hormones 370see also acid—base bal-
ancehomocysteine 110homogenization 198homogentisate 1,2-dioxyge-
nase 421homoglycans 40homoserine
dehydrogenase 420kinase 424
honey 38hops 148hormone response ele-
ments (HREs) 245, 378hormone-sensitive lipase
162, 163hormones 315, 322, 370-1,
371action 120, 121, 378-9biosynthesis 370, 383carbohydrate metabolism
158closed-loop feedback
control 372degradation 383differentiation 370digestive processes 370effects 370, 372, 373episodic release 372event-regulated 372excretion 370gastrointestinal 270glandular 372glucose metabolism 121growth 370
All rights reserved. Usage subject to terms and conditions of license.Koolman, Color Atlas of Biochemistry, 2nd edition © 2005 Thieme

451Index
hierarchy 372, 373homeostasis 370hydrophilic 120, 121, 380-
9inactivation 383ion concentrations 370juvenile 52, 53lipophilic 120, 374-5, 375,
379lipophilic see lipophilic
hormonesmetabolism 120-1, 370neurohormones 348, 349peptide 380, 381, 382-3plasma levels 372-3, 373proteohormones 380, 381proteolysis 382pulsatile release 372receptors 120regulation 120, 370, 371renal 330-1, 331second messengers 386-7signal cascades 388-9steroid see steroid hor-
monestissue 370transport 370vitamins 364
HPLC see high performanceliquid chromatography
HRE see hormone responseelements
hsp see heat-shock proteinshuman
body 31immunodeficiency virus
(HIV) see HIVhumoral immunity 294hyaluronate 346, 347hyaluronic acid 41, 44, 45hybridomas 304hydration 26, 27, 44
shell 90hydride ions 32, 33, 104hydrocarbons 46, 47hydrochloric acid 266, 270,
271hydrogen
atoms 33bonds 6, 7, 26, 68, 72carbonate 182chloride 30, 31ions 288, 289peroxide 24, 186, 284
catalysis 25
redox systems 33reducing equivalents 33sulfide 11
hydrolases 88, 89, 234, 425hydrolysis 266, 267
G of 18hydrolytic cleavage 316hydrolytic deamination 179,
180hydrolyzable lipids 46
non-hydrolyzable 46hydronium ions (H3O+) 30,
31hydroperoxyl radical 33hydrophilic hormones 120,
121, 380-9, 385hydrophilic molecules 26, 28hydrophilic signaling sub-
stances 392hydrophobic effects 72hydrophobic molecules 26,
28hydroquinone 33, 104hydroxy radicals 2843-hydroxy-3-methylglu-
taryl-CoA see HMG-CoA3β-hydroxy-∆5-steroid de-
hydrogenase 420β-hydroxyacyl-CoA 1643-hydroxyacyl-CoA
dehydrogenase 165, 420hydroxyalkyl groups 106hydroxyalkyl thiamine
diphosphate 1353-hydroxybutyrate 141, 312
dehydrogenase 420β-hydroxybutyric acid 1603-hydroxyisobutyrate dehy-
drogenase 312, 313, 4203-hydroxyisobutyryl-CoA
hydrolase 425hydroxyl ions (OH-) 30, 313-hydroxylacyl-CoA 141hydroxylation 62, 70
collagen 344hydroxymethylbilane syn-
thase 192, 193, 428hydroxymethylglutaryl-CoA
see HMG-CoA3-hydroxypalmitoyl-[ACP]
dehydratase 168, 169, 4284-hydroxyphenylpyruvate
dioxygenase 421hydroxyproline, collagen 703β-hydroxysteroid dehy-
drogenase 42017β-hydroxysteroid dehy-
drogenase 4205-hydroxytryptophan 63hydroxyurea 402hyperbilirubinemias 194hyperbolic plots 93, 97hyperglycemia 160, 161hyperlipidemia 160, 161hyperpolarization 348hyperuricemia 186, 187hypervitaminosis 364hypoiodide 25hypovitaminosis 364hypoxanthine 186, 187, 304
phosphoribosyltransfer-ase 186, 187, 402, 403,423
I
ice 26, 27idiotypic variation 302IDL 278iduronic acid 44IF see intermediary fila-
mentsIFN see interferonsIg see immunoglobulinsIL see interleukinsimidazolonepropionase 427imino acids 179immune response 294-5,
295immune system
acquired 294cytokines 392inate 294
immunoassays 304, 305immunoglobulins (Ig)
classes 301domains 300heavy chains 302IgA 300IgD 300IgE 300IgG 44, 45, 64, 65
domains 300, 301IgM 296, 300light chains 302, 303superfamily 296variability 302, 303
IMP 186, 187biosynthesis 188, 189,
All rights reserved. Usage subject to terms and conditions of license.Koolman, Color Atlas of Biochemistry, 2nd edition © 2005 Thieme

452 Index
190, 191cyclohydrolase 427dehydrogenase 420
innate immune system 294inducers 118
catabolite activator pro-tein (CAP) 118
induction, transcription 114,262
influenza virus 404inhibition, feedback 114, 115inhibitors 96-7, 97
allosteric 96competitive 96, 97gyrase 254irreversible 96kinetics 96, 97reversible 96translation 254
initiationcomplexes, 70 S 250, 251factors 250transcription 242, 244,
245inorganic components
food resorption 266urine 324
inorganic ions 2, 202inorganic phosphate (Pi)
125, 150inosine 5’-monophosphate
(IMP) see IMPinositol 1, 4, 5-trisphosphate
(InsP3) 170, 171, 386, 387insulation
lipids 46, 47membranes 216
insulin 64, 70, 76, 77, 160,161, 380A chain 76, 77B chain 76, 77biosynthesis 151, 160-1C peptide 76, 77, 160, 161circuit 373deficiency 160, 161gluconeogenesis 160, 161glucose 121, 158, 159, 160,
161human 76monomer 76overexpression 76pentose phosphate path-
way 152postabsorptive state 308,
309preproinsulin 160, 161
proinsulin 76, 160, 161receptor see insulin re-
ceptorsignal transduction 388,
389insulin receptor 121, 224,
225, 388substrate (IRS) 388
intensity factor 16intercalators 225, 254
daunomycin—DNA com-plex 254
interconversion 134enzymes 114, 115processes 144, 394pyruvate dehydrogenase
134regulation 118, 120
interferons (IFN) 392interleukins (IL) 392
IL-6 receptor 392intermediary metabolism
112, 322intermediate filaments (IF)
204, 205, 206, 207α-keratin 70, 71
intermediate-densitylipoprotein see IDL
intermediates 142, 143intermembrane space 210international units (U) 88interphase 394intestines, pH 31intramolecular transferases
89intrinsic factor 268, 269introns 242, 243inulin 40, 41invertase see β-fructofura-
nosidaseiodide
catalysis 25hypoiodide 25
iodothyronines 374ion channels 65, 126, 218,
222-4, 350, 384see also individual recep-
torsionic strength 78ionizing radiation 256ionotropic receptors 348,
354ions
calcium 328, 386hormone concentrations
370
inorganic 202products 30
IPTG see isopropylthioga-lactoside
irondeficiency 286distribution 287ion, hemoglobin 280metabolism 286-7, 287protein 184-5uptake 286
iron—sulfur centers 140, 141,142, 143
iron—sulfur clusters 106,107, 286, 287
iron-protoporphyrin IX 192IRS see insulin-receptor
substrateislets of Langerhans 160isoalloxazine see flavin(2R,3S)-isocitrate 9, 127isocitrate 136, 141
dehydrogenase 136, 137,420glucose oxidation 147tricarboxylic cycle 144,
145isoelectric point 58, 59isoenzymes 99
pattern 98isolation, proteins 78isoleucine 60, 61isomerases 88, 89, 428
cis—trans-isomerases 89coenzymes 108
isomerization, light-in-duced 358
isomersgeometric 8isomerism 8-9
isopentenyl diphosphate 52,53, 172, 173
isopentenyl-AMP 53isoprenoids 52-3, 53, 172isoprenylation 52isopropylthiogalactoside
(IPTG)isosteric enzymes 92, 93isotypes 302isopyknic centrifugation
200
All rights reserved. Usage subject to terms and conditions of license.Koolman, Color Atlas of Biochemistry, 2nd edition © 2005 Thieme

453Index
J
J segments 302Janus kinases (JAK) 392jaundice 194joules 16, 17juvenile hormone 52, 53
K
K+ channels 223K systems 116katal 88keratan sulfate 247keratin
filaments 206α-keratin 70, 71
kernicterus 194ketamine 179ketoacidosis 288ketoacidotic coma 312β-ketoacyl-CoA 164ketogenic amino acids 180α-ketoglutarate see 2-oxo-
glutarateketohexokinase 310, 311,
424ketohexoses 38
D-fructose see D-fructoseketone bodies 160, 161, 162,
163, 172acid—base balance 288biosynthesis 312, 313brain 356synthesis 410
ketonemia 312ketones 10, 11, 162ketonuria 160, 312ketopentoses 38
D-ribulose see D-ribuloseketoses 39kidney, glucose 160, 161kidneys 154, 288, 322-3, 323kinetics
allosteric enzymes 116aspartate 117bisubstrate 94, 95enzymes 92-3inhibition 96, 97see also reaction kinetics
Km see Michaelis constantknall-gas 20
reaction see oxyhydrogenreaction
L
L segments 302lac-repressor 118, 119lactacidosis 288β-lactam antibiotics 254lactate 98, 99, 154, 155, 288
dehydrogenase see lac-tate dehydrogenase
gluconeogenesis 328muscle 338redox reactions 19
lactate dehydrogenase(LDH) 99, 420activity 102, 103catalytic cycle 100, 101Cori cycle 338, 339fermentation 148, 149gel electrophoresis 99gluconeogenesis 155glucose oxidation 147isoenzymes 98structure 98
lactic acid 8, 9, 149Lactobacillus 148, 149lactoferrin 286, 287lactose 38, 39
allolactose 119lactose operon 118operon 118, 119
laminin 346lanosterol 173lattices
hexagonal 27ice 26
lauric acid 49LDH see lactate dehydro-
genaseLDL 278
receptor 278leaving groups 14lecithin see phosphatidyl-
cholinelecithin-cholesterol acyl-
transferase (LCAT) seephosphatidylcholine-ste-rol acyltransferase
lefthanded α-helix (aL) 68Lesch—Nyhan syndrome
186leucine 60, 61
transaminase 424leukocytes 274leukotrienes 390liberins 372
librariesDNA 260, 261genes 260, 261
Lieberkühn glands 268life cycle, HIV 404ligand-gated channels 222
nicotinic acetylcholinereceptor 222
ligands 118, 119modulation 114, 115oncogenes 398
ligases 88, 89, 106, 429light
absorption 102, 103, 128,129
monochromatic 102ultraviolet 256
light chainsbiosynthesis 302IgG 300
light-induced isomerization358
lignoceric acid 49Lineweaver—Burk plots 92,
93, 96linoleic acid 48, 49linolenic acid 48, 49lipase 268, 269lipid 46-57
alcohols 46anchors 214classification 47complex 170-1hydrolysis 266hydroperoxide gluta-
thione peroxidase 421lipoproteins 278membranes 214, 215, 216metabolism 160, 306,
312-13, 313resorption 272, 273role 46, 47synthesis 226
lipid-soluble vitamins 46,364-5, 365
lipoamide 106, 107, 134arm 134, 135
lipogenesis 162lipoic acid 62, 106lipolysis 162lipophilic hormones 120,
374-5, 375, 378, 379receptors 378, 398
lipoprotein 278-9, 279lipase 162, 163, 278, 279,
All rights reserved. Usage subject to terms and conditions of license.Koolman, Color Atlas of Biochemistry, 2nd edition © 2005 Thieme

454 Index
425lithocholic acid 56, 57, 314liver
absorptive state 308alcohol 320cirrhosis 320damage, alcohol 321
liver, fat synthesis 162fatty 320fatty acids 162functions 306-7, 307glucose 160, 161glycogen 156metabolism see liver me-
tabolismpostabsorptive state 308postresorption 309resorption 309urea 182
liver metabolism 306, 307ammonia 178, 179glucose 120, 121
long-chain fatty-acid-CoAligase 429
loopschromosomes 238mobile 99peptides 98
low-density lipoprotein seeLDL
lumen, chloroplasts 128, 129lyases 88, 89, 427-8lymphocytes 161, 274, 275,
294monoclonal antibodies
304lymphokines 392Lynen cycle 312lysine 60, 61, 184
hydroxylase see procolla-gen lysine 5-dioxyge-nase
lysines, acetylation 238lysophosphatidate 170, 171lysophospholipid 50, 51lysosomes 196, 234-5, 235
pH 31lysozyme 42
M
M phase 394M13 phage 260, 404mAb see monoclonal anti-
bodiesmacroelements 2, 363macromolecules 202macrophages 274, 275major histocompatibility
complex see MHCmalate 137, 141
dehydrogenase 136, 137,138, 139, 420gluconeogenesis 154,
155glucose oxidation 147urea cycle 183
shuttle 212, 213maleic acid 8, 9maleylacetoacetate isomer-
ase 429malic enzyme 139malonyl-CoA 162, 163malt 148maltose 38, 39
brewing 148, 149D-mannitol 39mannose 44
D-mannose 36, 37, 38, 39,44
mannose 6-phosphate 234mannose-rich glycoproteins
45mannose-rich oligosacchar-
ides 44, 230α-mannosidase 426MAPK (MAP kinase) 388markers
enzymes 198molecules 198, 199tumors 400
mass action, law of 18, 19matrix
extracellular 346-7space 210
maturation, RNA 208, 236,242, 243
maturation-promoting fac-tor (MPF)
maximum velocity (Vmax)92, 93
mechanical damage 144mechanical work 17mechanisms
ping-pong 90, 91, 94regulatory 114-21sequential 90, 91, 94, 95
mediators 224, 370, 388MEK 388
membrane receptors 224-5,398
membranesattack complex 298carbohydrates 216cell interaction 216composition 216cytoskeletal anchors 216depolarization 348electrochemical gra-
dients 126energy conservation 126-
7functions 216-17hyperpolarization 348lipids 214, 216, 409micelles 28mitochondrial 210nuclear 208permeability 218, 219plasma 196, 214-15potential 126, 127, 350proteins 214, 216proton gradients 126, 127receptors see membrane
receptorssemipermeable 78transport 216-19uncouplers 144, 145vesicles 28, 198
menaquinone 52, 53menthol 52, 536-mercaptopurine 402messenger RNA see mRNAmessengers, second see sec-
ond messengersmetabolic acidoses 160, 161,
288, 326metabolic charts 406-10metabolic defects, gene
therapy 265metabolic pathways 88
hormones 370metabolism 356-7
acetylcholine 354, 355antimetabolites 402, 403buffer function 308-9calcium 342-3carbohydrate 388creatine 336energy, brain 356glycogen 157hormones 120-1, 370,
376-7intermediary112,113, 322
All rights reserved. Usage subject to terms and conditions of license.Koolman, Color Atlas of Biochemistry, 2nd edition © 2005 Thieme

455Index
liver 306muscle 336-7regulation 115, 120-1steroids 376-7
metabolites 96, 158activated 110-11, 111liver 306
metabotropic receptors 348,354
metalloproteinases 176, 177,427
metalscomplexes 33heavy 316nonmetals 2
methane 26, 27, 28, 29methemoglobin reductase
284, 285methionine 60, 61, 110, 184,
250, 251acid—base balance 288adenosyltransferase 423
methotrexate 402methylation 110, 316methylcobalamin 108methylcrotonyl-CoA car-
boxylase 429methylenetetrahydrofolate
dehydrogenase 421reducatase 421
α-methylglucoside 37methylglutaconyl-CoA hy-
dratase 4287-methylguanidine 82, 832’-O-methylguanidine 82,
83methylmalonyl-CoA 166,
167epimerase 428mutase 167, 429
methylnitrosamines 256,257
O-methylnorepinephrine317
methyltetrahydrofolate cy-clohydrolase 427
5-methyltetrahydrofolate-homocysteine S-methyl-transferase 422
methyltransferases 108mevalonate 172, 173
kinase 424mevalonyl diphosphate 173MHC proteins 224, 296micelles 28, 29, 270Michaelis constant (Km) 92,
93, 96Michaelis-Menten
equation 92, 93kinetics 92, 93model 96microelements 362microfibrils 42, 43microfilaments 204, 206,
207microtubules 204, 206, 207milk products, fermentation
148, 149minerals 360, 362-3, 363minibands, chromosomes
238mitochondria 196
fatty acid degradation 163fractionation 198gluconeogenesis 154membrane 210metabolic functions 210-
11protein import 232, 233structure 210-11, 211transport 212-13, 213
mitogen-activated proteinkinase see MAPK
mitosis-promoting factor(MPF) 394
mobile loops 99mobile phase 54modulation, ligands 114molecular genetics 236-65molecular models 76-7p-molecular orbitals 4molecular oxygen 186molecular structure 6molecules 7, 198, 202, 218monoacylglycerols 48, 49,
170, 1712-monoacylglycerols 272monoamine oxidase (MAO)
see amine oxidasemonochromatic light 102monoclonal antibodies
(mAb) 304-5, 305monocytes 274, 275monokines 392monomers, insulin 76monooxygenases 89, 104,
106, 166, 318, 319cytochrome P450-de-
pendent 318, 319monosaccharides 34-5, 35
acidic 38, 39reactions 36-9, 37, 39
resorption 272, 273motor end plate 335MPF see maturation-pro-
moting factor; mitosis-promoting factor
mRNA 82, 236, 2463’ modification 246, 2475’ modification 246, 247immunoglobulins 302POMC 382
MstII 264, 265mucus 268multienzyme complexes
134muramoylpentapeptide car-
boxypeptidase 254, 426murein 34, 35
polymers 41MurNAc see N-acetylmura-
minic acidmuscle
absorptive state 308amino acid metabolism
338, 339calcium ions 335contraction see muscle
contractionfibers see muscle fibersglucose 160, 161glycogen 156, 336heart 332metabolism see muscle
metabolismmotor end plate 335postabsorptive state 308protein 338, 339sarcoplasmatic reticulum
(SR) 335skeletal 332smooth 332, 338striated 333
muscle contraction 332-3,333, 334-5
muscle fibers 332, 336, 337muscle metabolism 336-9,
339mutarotation 36, 37mutases 429mutation 256-7
frameshift 256, 257mutagens 256, 257point 248, 256, 257repair 256, 257somatic 302
myelomas 304myo-inositol 50, 51
All rights reserved. Usage subject to terms and conditions of license.Koolman, Color Atlas of Biochemistry, 2nd edition © 2005 Thieme

456 Index
myofibrils 332myoglobin 72, 73, 282, 336myosin 64, 65, 332
ATPase 427tropomyosin 64, 65, 332,
334myristic acid 49
N
N terminus 66N-bound oligosaccharides
230Na+/K+-ATPase 126, 127, 272,
273, 326, 327, 350, 351,427
NAD+ 99, 101, 104, 366/NADH ratio 144biosynthesis 208gluconeogenesis 155redox reactions 19
NADH 101dehydrogenase 141, 421glucose oxidation 147
NADH+H+
ATP synthesis 142, 143gluconeogenesis 155
NADP+ 33, 104, 105, 366photosynthesis 128, 129,
131NADPH+H+ 33, 152, 190, 191,
284photosynthesis 128, 129
native conformation 72nephron 322Nernst equation 126, 127nerve cells 348, 349nervonic acid 49net charge, amino acids 59net outcome 136NeuAc see N-acetylneura-
minic acidneural synapses 349neural tissue 308neuraminidases 276, 426neurohormones 348, 349neuropeptides, proteolysis
382neurotransmitters 62, 63,
348, 349, 352-3, 353GABA 62, 63, 356glutamate 356receptors 354-5, 355
neutral amino acids 60
urea 182niacin 366nicotinamide 366
adenine dinucleotideoxidized see NAD+
reduced see NADHadenine dinucleotide
phosphate
oxidized see NADP+
reduced see NADPHnicotinate 366nicotinic acetylcholine
receptor 223nitric oxide synthase 388,
389nitrogen 11
balance 174fixation 184, 185monoxide (NO) 388, 389
nitrogenase 184, 185, 422norepinephrine 145, 163,
317, 352nuclear localization se-
quence 208nuclear pores 208, 209nuclear tumor suppressors
398nucleic acids
bases 80, 81genetic information 236hydrolysis 266see also individual nucleic
acidsnucleobases
components 188, 189see also purine ring;
pyrimidine ringnucleolus 208nucleophilic substitutions
14, 15nucleosidases 426nucleoside 80, 81
diphosphatase 427diphosphate kinase 190,
191, 424phosphate 106, 107
kinase 190, 191, 424nucleoside diphosphate re-
ductase 190, 191nucleosomes 65, 238nucleotides 80-1, 81
biosynthesis 190-1, 191,417-18
degradation 186-7, 187,
419dinucleotides 80nucleotide triphosphates
110, 122see also individual nu-
cleotidesnucleus 196, 208-9, 209
and cytoplasm 208, 209fractionation 198localization sequence 208membrane 208pores 208, 209scaffolding 238tumor suppressors 398
nutrients 112, 306, 360, 361
O
O2 see oxygenoctet rule 2ODH see 2-oxoglutarate de-
hydrogenaseOH- see hydroxyl ions (OH-)oil
drop effect 28, 29emulsions 28
Okazaki fragments 240oleic acid 49oligo-1,6-glucosidase 426oligonucleotides 80, 81oligosaccharides 44, 45, 230,
272, 273OMP 188, 189oncogenes 398-9, 399, 400one-helix receptors 224operators 118opsin 358opsonization 298optical activity 8optical isomers 8, 9optical rotation 36orbitals 2, 4, 5organ metabolism 308-9organelles 196, 198, 199organic compounds 2organic substances 360-1organisms
heterotrophic 128phototrophic 128
orientation, substrates 90,100
origin of replication 240ornithine 62, 63, 182, 183
carbamoyltransferase
All rights reserved. Usage subject to terms and conditions of license.Koolman, Color Atlas of Biochemistry, 2nd edition © 2005 Thieme

457Index
183, 422orotate phosphoribosyl-
transferase 423orotidine 5’-
monophosphate see OMPorotidine-5’-phosphate de-
carboxylase 427osteoblasts 342osteoclasts 342overexpression, insulin 76oxaloacetate 137, 155oxaloacetic acid 136, 154oxidases 89, 104oxidation 10, 11, 316
α-oxidation 166β-oxidation 113, 141, 210
oxidation, β-oxidation, fatmetabolism 162, 163
fatty acid degradation164, 165, 166, 167
glucose 36, 37ω-oxidation 166terminal 136
oxidative deamination 179-80
oxidative decarboxylation134
oxidative phosphorylation112, 140, 210ATP 122, 123
oxidized forms, electrons 32oxidizing agents 32oxidoreductases 88, 89oxoacid 179oxoacid dehydrogenases
134-53-oxoacid-CoA transferase
1803-oxoacyl-[ACP] reductase
168, 169, 4203-oxoacyl-[ACP] synthase
168, 169, 4232-oxobutyrate synthase 4212-oxoglutarate 136, 178
dehydrogenase (ODH)144, 145, 147, 421glucose oxidation 147
2-oxoisovalerate dehydro-genase 420
oxygen 11atomic 25
photosynthesis 128, 129redox systems 33
oxygen transport 282-3hemoglobin 280, 282saturation curve 280, 282
2-oxyglutarate 137, 326dehydrogenase 134, 135
complex 136, 137oxyhydrogen reaction 20, 21
P
P type ATPase 220P/O quotient 146p53 protein 394, 396PAGE see polyacrylamide gel
electrophoresispalmitate 162, 163, 169palmitic acid 49, 168Pan see pantetheinepancreas 268, 269, 308pancreatic ribonuclease 426pantetheine 106, 169pantoic acid 12, 13, 106pantothenate 12pantothenic acid 106, 366papain 300, 427PAPS see phosphoadenosine
phosphosulfateparacrine effects 372, 373,
390parallel pleated sheet 68parathyroid hormones
(PTH) 342Parkinson’s disease 62passive channels 222passive transport 218pathways
amphibolic 112, 113anabolic 112, 113, 138,
139, 338anaplerotic 139catabolic 112, 113, 138,
139cytoplasmic 228pentose phosphate (PPP)
113, 152-3, 153secretory 228
PCR 262-3, 263deoxyribonucleoside tri-
phosphates 262primers 262RT-PCR 264, 265
PDH see pyruvate dehydro-
genasePDK-1 388pectins 42, 43PEG see polyethylene glycolpenicillins 40, 254, 255pentose phosphate pathway
(PPP) 113, 152-3, 153and amino acid
biosynthesis 185pentoses 39PEP 124, 125, 150, 154, 155
carboxykinase 139, 154,155
carboxylase 158, 159PEP-CK 242, 427
gene 243transcription 245
pepsin 94, 176, 268, 269,270A 427B 427
pepsinogen 268peptidases 89, 176, 330, 331,
426peptide hormones 380, 381,
382-3biosynthesis 382degradation 382hormone-like 392-3inactivation 382
peptidesbonds 66-7, 67, 252C-peptides 76chains 66conformation 66, 67hormones see peptide
hormonesloops 98neurotransmitters 352nomenclature 66, 67sequence 66signal 228, 230
peptidoglycan 35peptidyl dipeptidases 330,
331, 425peptidyl proline cis—trans-
isomerase 233, 429peptidyl site (P) 250, 252peptidyl-dipeptidase A see
angiotensin-convertingenzyme
peptidyltransferase 423perinuclear space 208periodic table 2, 3peroxisomes 196
All rights reserved. Usage subject to terms and conditions of license.Koolman, Color Atlas of Biochemistry, 2nd edition © 2005 Thieme

458 Index
periplasm 35permeability, membranes
218, 219permease 119peroxidases 89, 102, 103,
106, 305, 421peroxide anions 284pH 18
cells 30, 31enzymes 94, 95fermentation 148
pH, gradient 127membrane difference 126neutral 30
phages see bacteriophagesphagocytosis 234, 235phalloidin 204phenobarbital 194phenylalanine 60, 61
4-monooxygenase 422phenylethanolamine N-
methyltransferase 352,353, 422
pheophytin 130, 131phosphates 13
ATP transfer 123buffers 288ions 328residues 12transport 212
phosphatidates 47, 50, 51,170, 171cytidyltransferase 170,
171, 425lysophosphatidate 170,
171phosphatase 170, 171, 425
phosphatides 46, 47, 51phosphatidic acids 46phosphatidylcholine 50, 51,
170, 171, 212, 213sterol acyltransferase
278, 279, 423phosphatidylethanolamine
50, 170, 171, 212, 213phosphatidylinositol 50,
170, 171, 212, 213phosphatidylinositol 4, 5-
bisphosphate (PIP2) 170,171
phosphatidylinositol-4-phosphate kinase 170, 171
phosphatidylserine 50, 170,171, 212, 213
phosphoadenosine phos-
phosulfate (PAPS) 110, 111phosphodiesterase 120, 121,
386, 387, 425phosphoenolpyruvate see
PEPphosphoenolpyruvate,
carboxykinase see PEP-CK6-phosphofructo-2-kinase
4246-phosphofructokinase 158,
159glucose oxidation 147glycolysis 150, 151
phosphoglucomutase 429phosphogluconate
6-phosphogluconate 152,153
dehydrogenase 153, 4206-phosphogluconolactone
152, 153phosphoglycerate
2-phosphoglycerate 125,150, 151, 155
3-phosphoglycerate 150,151, 155
dehydrogenase 420kinase 131, 147, 424
glycolysis 150, 151mutase 151, 429
phospholipasesA1 425A2 268, 390, 391, 425C 386, 387, 425D 425
phospholipids 46, 47, 50-1,51biosynthesis 171blood clotting 290degradation 411lipid metabolism 312lysophospholipids 50membranes 214structure 50, 51
phosphomevalonate kinase424
4’-phosphopantetheine 12phosphoprotein
phosphatase 394, 395,425
phosphates 120, 121phosphopyruvate hydratase
124, 4285-phosphoribosyl 1-diphos-
phate (PRPP) 188, 189phosphoribosylamine gly-
cine ligase 429phosphoribosylaminoimi-
dazolecarboxamide formyl-
transferase 422carboxylase 427succinocarboxamide
synthase 429phosphoribosylformylglyci-
namidine synthase 429phosphoribosylglycinamide
formyltransferase 422phosphoribulokinase 131phosphoric acid, esters 10,
11, 80phosphoric acid—anhydride
11, 80bonds 12, 13, 122, 123
phosphoric acid—ester,bonds 13, 122, 123
phosphorus 11phosphorylase 120, 121, 423
carbohydrate metabolism159
glycogen metabolism156, 157
kinase 424phosphorylation 62, 106
ATP-dependent 114cyclic 130, 131dephosphorylation 114histones 238oxidative 112, 122, 140,
210protein kinase A 120, 121substrate-level 122, 124,
150phosphoserine transami-
nase 424phosphatidylinositols
1-phosphatidylinositol-4-kinase 424
1-phosphatidylinositol-4-phosphate kinase424
phosphatidylinositol(PtdIns) 170
phosphatidylinositol-3-kinase (PI3K) 388
phosphatidylinositol-4,5-bisphosphate (PIP2, PtdInsP2) 170
phosphotransferases 89photolyase see deoxyribodi-
pyrimidine photolyase
All rights reserved. Usage subject to terms and conditions of license.Koolman, Color Atlas of Biochemistry, 2nd edition © 2005 Thieme

459Index
photoreactivation 256photoreceptors 358, 359photosynthesis 106, 112,
128-9, 129, 130-1photosystems (PS) 128
I 131, 132, 133II 130, 131, 133
phototrophs 128phylloquinone see vitamin Kphytol 52, 53, 128, 129phytyl 52, 53Pi see inorganic phosphateπ electrons 4PI3K see phosphatidylinosi-
tol-3-kinasepigments, antenna 132ping-pong mechanisms 90,
91, 94pitch 68
helix 86PK see protein kinasePK-B see protein kinase BpKa value 18plants 42-3plaques 260plasma 274, 275
buffers 288, 289cells 294hormones 372-3, 373hydrogen ions 288, 289kallikrein 426membranes see plasma
membranespH 31proteins 276-7, 277, 288thromboplastin
antecedent see coagu-lation factor XIa
plasma membranes 196composition 217functions 217lipids 215permeability 219proteins 215structure 214-15, 215transport 219, 221
plasma thromboplastinantecedent 291
plasmids 258, 259, 262, 263plasmin 426plasminogen activator 427plastocyanin 128, 129plastoquinone (PQ) 52, 53
photosystem I 133photosystem II 128, 129,
131Q cycle 126, 127reduced (QH2) 126, 127see also coenzyme Q, re-
ducedpleated sheets
α-pleated sheet 67β-pleated sheet 68, 69
plotshyperbolic 93, 97Lineweaver—Burk 92, 93
PLP see pyridoxal phosphatepoint mutations 248, 257polar molecules 28polarimetry 36, 37polarity 218polarization 6
depolarization 222, 348,350
hyperpolarization 348,350
membranes 348repolarization 350
polarizers 36poliovirus 404polyacrylamide gel electro-
phoresis (PAGE)polyadenylate
polymerase 246tail 243, 246, 247
polyethylene glycol (PEG)polymerase chain reaction
see PCRpolynucleotidases 425polynucleotides 80, 81polysaccharides 40-5, 41,
42-3polysomes 250, 251POMC 382
mRNA 382prepro-POMC 382pro-POMC 382
pores 208, 209porins 210porphobilinogen 192, 193
synthase 192, 193, 428porphyrias 192porphyrin systems 194post-translational modifica-
tion 62, 63, 344postabsorptive state 308potassium channels 222, 233potential
action 222, 348, 350, 351difference ( P) 16
electron transfer 19equilibrium 126, 350group transfer 19membrane 350normal 130, 131proton transfer 19resting 126, 350, 351
PPP see protein phosphatepathway
PQ see plastoquinonepRb 394prealbumin 64, 65precipitation 79precursors 114, 138pregnenolone 376prenylation 62, 214preproinsulin 160, 161preprotein 230primary structure 76primase 240primers
DNA 240PCR 262sequencing 260
proaccelerin 291probes, gene 260processes, electroneutral
218procollagen 344
lysine 5-dioxygenase344, 345, 422
proline 4-dioxygenase344, 345, 422
proconvertin 291proconvertin see coagula-
tion factor VIIaproduct 22
inhibition 144proenzymes 176progesterone 56, 57, 374,
376proinsulin 76, 160, 161prokaryotes 196, 197proline 60, 61
collagen 70dehydrogenase 421hydroxylase see procolla-
gen proline 4-dioxyge-nase
promoters 114, 118proopiomelanocortin see
POMCPropionibacterium 148, 149propionic acid 49
fermentation 148, 149
All rights reserved. Usage subject to terms and conditions of license.Koolman, Color Atlas of Biochemistry, 2nd edition © 2005 Thieme

460 Index
propionyl-CoA 166, 167carboxylase 166, 167,
429proprotein 230prostacyclins 390prostaglandins 390
prostaglandin H-syn-thase 390, 391, 422
prosthetic groups 104, 134,142
proteasomes 176, 177protein
disulfide isomerase 233,429
glycosyltransferase 231,423
lysine 6-oxidase 344, 345,421
phosphatases 114, 144,145, 392
tyrosine kinase 424see also proteins
protein folding 72, 74-5, 75,174endoplasmic reticulum
233energetics 74rough endoplasmic retic-
ulum 232protein kinases (PK) 114,
394, 395, 424ERK 388inactivating 144MEK 388oncogenes 398PDK-1 388PK-A 120, 121, 386, 387PK-B 388Raf 388second messengers 348
protein metabolism 174-5,175, 306muscle 338, 339
protein-glutamine γ-gluta-myltransferase 423
proteinases 176, 290proteinogenic amino acids
60-1, 61non-proteinogenic 62-3
proteins 64-5, 65adaptor 388adhesive 346allosteric 72analysis 78biosynthesis 174
catalysis 64channels 218clotting factors 290defense 64denaturation 74, 75dynamics 72, 73elution 78Escherichia coli 251foldingsee protein foldingglobular 72-3glycosylation 230, 231gradients 127heat-shock (hsp) 232hyaluronate 346hydrolysis 266isolation 78lysosomal 234, 235marking 174maturation 230-3mediator 224membranes 214, 215, 216metabolism see protein
metabolismmitochondrial import
232, 233motive force 127movement 64non-histone 238nutrients 360overexpression 262, 263plasma 277polyproteins 382post-translational
modification 63, 174preprotein 230proprotein 230regulation 64regulatory 114, 119resorption 266ribosomal 250single—strand-binding
240sorting 174, 228-9, 229stabilization 74storage 64structure 64, 68-71synthesis 230-1, 231transport 64, 220-1
proteoglycans 34, 35, 340,346, 347
proteohormones 380, 381proteolysis 174, 176-7
enzymes 177hormones 382neuropeptides 382
prothrombin 291prothrombinase complex
291proto-oncogenes 398, 399,
400protofilaments 70, 204proton channels, ATP syn-
thase 142, 143proton gradients 126, 140,
210, 212membranes 126, 127
protonsexcretion 326gradient see proton
gradientmotive force ( P) 126pumps 126, 127secretion 327transfer 14, 18, 19
protoporphyrin IX 192, 193protoporphyrinogen IX 192,
193proximity, substrates 90,
100PRPP see 5-phosphoribosyl-
1-diphosphatepseudouridine 82, 83PTH see parathyroid hor-
monepulsatile release, hormones
372purines 80, 81
biosynthesis 188-9, 189,190, 417
degradation 186, 187derivatives 352ring 188, 189
pyranoses 34pyridine nucleotides 32, see
also NAD+; NADP+
pyridoxal 368phosphate (PLP) 62, 178,
358, 368transamination 108,
109see also vitamin B6
complexpyridoxamine 179, 368
phosphate 108, 178, 179pyridoxol 368pyrimidines 80, 81
biosynthesis 188-9, 189,190, 418
degradation 186, 187ring 188, 189
All rights reserved. Usage subject to terms and conditions of license.Koolman, Color Atlas of Biochemistry, 2nd edition © 2005 Thieme

461Index
pyrrolines1-pyrroline-5-carboxy-
late dehydrogenase421
pyrroline-5-carboxylatereductase 421
pyruvate 35, 99, 154, 155,3382-oxoglutarate 141carboxylase 159, 429decarboxylase 427dehydrogenase see pyru-
vate dehydrogenaseglycolysis 150, 151kinase 151, 159, 424redox reactions 19, 101transport 212
pyruvate carboxylase 138,139, 155
pyruvate decarboxylase,fermentation 148, 149
pyruvate dehydrogenase(PDH) 210, 421-phosphatase 425Escherichia coli 134, 135glucose oxidation 147kinase 424tricarboxylic cycle 144,
145pyruvate kinase 147
glucagon 158, 159glycolysis 150, 151
Q
Q see coenzyme Q, oxidized(ubiquinone)
Q cycle 126, 127QH2 see coenzyme Q,
reduced (ubiquinol);plastoquinone
quaternary structure 76quinol system 32quinones 104, 131
hydroquinone 33, 104redox systems 33semiquinone radical 32,
33, 104system 32see also plastoquinone
R
R conformation 117hemoglobin 280, 281
R state 116R/S system 8radiation 256radicals
free 32, 256hydroperoxyl 33hydroxyl 33, 284semiquinone 32, 33, 130,
131superoxide 284tyrosine 190, 191
radioimmunoassays (RIA)Raf 388Ramachandran plot 66Ras 388rate constants 22, 23reaction
centers 132, 133P680 130, 131
heat of 20, 21reactions
catalyzed 25endergonic 112enzyme specificity 88,
89enzyme-catalyzed 90, 93exergonic 112first-order 22, 23kinetics 22-3order 22, 23rates 22, 23, 88second-order 22, 23specificity 88, 89spontaneous 18substratespecificity88,89uncatalyzed 90
reactive oxygen species(ROS) 33, 284, 285
reagentsenzymes 102, 103modifying 97
rearrangements 14see also isomerizations
receptor signaling 216signal recognition par-
ticle (SRP) 230signal transfer 224
receptor-mediated endocy-tosis 278
receptors1-helix 224, 3847-helix 224, 384acetylcholine 354
antigen 296, 297co-receptors 296cytokines 392domain 224effects of 225glucagon 121hormones 120insulin 224, 225, 388ion channels 126, 218,
222-4, 350, 384ionotropic 348, 354lipophilic hormones 378,
398membrane 216, 224-5metabotropic 348, 354neurotransmitters 354-5,
355nicotinic acetylcholine
222oncogenes 398photoreceptors 358, 359signaling see receptor
signalingsteroid 378substrates 388synapses 348T-cell 224see also individual recep-
torsreciprocal velocity 93recombination
repair 256somatic 302, 303
recycling 328-9, 329redox
coenzymes 104, 105, 106-7, 107, 140see also flavins; heme
groups; iron—sulfurcenters
potential (E) 18, 19, 32processes 32-3reactions see redox reac-
tionsseries 32, 130, 131, 142systems see redox sys-
temsredox reactions 14, 15, 32,
33lactate 19, 100, 101NAD+ 18, 19, 101pyruvate 19
redox systems 32biological 32, 33coenzyme Q (CoQ) 105
All rights reserved. Usage subject to terms and conditions of license.Koolman, Color Atlas of Biochemistry, 2nd edition © 2005 Thieme

462 Index
flavin 33hydrogen peroxide 33respiratory chain 142, 143
reduced forms, electrons 32reducing agents 32reductases 89reduction 316
equivalents 32, 33, 212glucose 36, 37
Refsum disease 166regions, signal 228regulation 114-21, 144-5
allosteric 116carbohydrate metabolism
158-9gene 118glycogen metabolism 156interconversion 120transcription 118-20, 244tricarboxylic cycle 144
regulatory proteins 114, 118,119
relative velocity 25renal hormones 330-1, 331renin 330, 331, 427renin—angiotensin system
330, 331repair, mutations 256, 257replication 208
DNA polymerases 240Escherichia coli 240, 241forks 240genetic information 236,
240-1origin of 240
repolarization 350repression, transcription
114repressors 118rER see rough endoplasmic
reticulumRES see reticuloendothelial
systemresidual bodies 234resonance 4, 5, 32, 66, 67resorption 266, 267, 272-3,
273HCO3
- 326liver 309minerals 362urine 322
respiration 144, 145, 146-7respiratory chain 106, 112,
126, 140-1, 210ATP synthesis 142
components 132, 140, 141redox systems 142, 143
respiratory control, ATPsynthase 144, 145
resting potential 126, 350,351
restriction endonucleases258, 259, 264, 425
restriction fragment lengthpolymorphisms see RFLP
reticuloendothelial system(RES)
retinal 62, 358, 364isomerase 358, 359, 429
retinoate 52, 53retinoic acid 364retinol see vitamin Aretinol, dehydrogenase 358,
359, 420retroviruses 404reverse transcriptase see
RNA-directed DNA poly-merase
RFLP 265sickle-cell anemia 262,
264rhesus (Rh) blood groups
292rhinovirus 404, 405Rhizobium 184rhodopsin 224, 358RIA see radioimmunoassayriboflavin 366ribonucleic acid,
transcription 243ribonuclease
A 74, 75H 404, 405, 426pancreatic 426
ribonucleic acid (RNA) seeRNA
ribonucleoside diphosphatereductase 190, 191, 403,422
ribonucleotidereductase see ribonucleo-
side diphosphate re-ductase
reduction 191ribose 12, 13, 123
phosphate pyrophospho-kinase 424
D-ribose 34, 38, 39ribose 5-phosphate 152, 153,
429
ribosomal RNA see rRNAribosomes 82, 236
eukaryotes 250, 251fractionation 198proteins 250
ribozymes 24, 88ribuloses
D-ribulose 38, 39, 128, 152ribulose phosphate 3-
epimerase 428L-ribulose phosphate 4-
epimerase 428ribulose 5-phosphate
152, 153ribulose bisphosphate,
carboxylase 130, 131,427
Richardson diagrams 72, 73rifamycin 254, 255righthanded helix
α-helix (αR) 68double 86
RNA 80, 81, 82-3, 83, 87conformation 86hnRNA 236, 246, 247, 302immunoglobulins 302maturation 208, 236, 242,
243, 246-7transcription 242, 243translation 83see also mRNA; rRNA;
snRNA; tRNARNA polymerase see DNA-
directed RNA polymeraseRNA-binding proteins 82RNA-directed DNA poly-
merase 404, 405, 425rods 358root nodules 184, 185ROS see reactive oxygen
speciesrotation 67rough endoplasmic reticu-
lum (rER) 226, 227, 231,232
roughage 42, 273rRNA 82
5S-rRNA 86, 87RT-PCR 264, 265rubber 52, 53rubisco see ribulase bis-
phosphate carboxylase
S
All rights reserved. Usage subject to terms and conditions of license.Koolman, Color Atlas of Biochemistry, 2nd edition © 2005 Thieme

463Index
S see Svedberg unitsS phase 394saccharase see β-fructofura-
nosidaseSaccharomyces cerevisiae
148, 149SAH see S-adenosyl-L-ho-
mocysteinesalicylate 317saliva 268, 269salt, precipitation 78, 79SAM see S-adenosyl-L-me-
thioninesarcomeres 332sarcoplasmic Ca2+ pump
220, 221sarcoplasmic reticulum (SR)
334, 335scaffolding
cytoskeletal 206nuclear 238
Schiff’s base 108SDS gel electrophoresis 78,
79second messengers 224, 348
glycolipids 50hormones 120, 121, 384,
386-7see also individual mes-
sengerssecond-order reactions 22,
23secondary structure 68-9, 76secretin 270secretions
kidney 322pancreas 268-9small intestines 268-9
secretory pathway 228sedimentation coef cient
200sedoheptulose bisphospha-
tase 425sedoheptulose 153selenocysteine 6, 63self-protection, blood 274semiquinone radical 32, 130,
131sense strands 84separation, spontaneous 29sequences
glycosylation 230nuclear localization 208peptides 66
sequencing 261
sequential mechanisms 90,91, 94, 95
sER see smooth endoplasmicreticulum
serine 50, 51, 60, 61, 63dehydratase 181, 428family 184, 185proteases 176, 177, 298proteinases 177, 425
serotonin 62, 63serum 274
enzyme diagnosis 98, 178seryl alanine 65, 66, 67seven-helix receptors 224SH2 domain 392short tandem repeats (STRs)
264shuttles 212sialic acid see N-acetylneur-
aminic acidsickle-cell anemia 249, 264,
265sight 358-9sigmoidal substrate satura-
tion curves 116signal
cascades see signal cas-cades
peptidase 427peptides 228, 230, 231receptor transfer 224regions 228signaling see signalingSRP see signal recognition
particlestop-transfer 230transduction see signal
transductiontranslocation 228, 229transmission see signal
transmissionsignal cascades
hormones 388-9photoreceptors 358, 359
signal recognition particle(SRP) 230, 231receptor 230
signal transducers and acti-vators of transcription seeSTAT
signal transduction 120cytokines 392, 393G proteins 384, 385insulin 388, 389
oncogenes 398proteins (STPs) 392
signal transmissionCNS 348-9synaptic 348
signalingamino acids 380, 381calcium 342cytokines 392-3eicosanoids 46, 390-1hydrophilic substances
392membranes 216second messengers 224steroids 46
silencers 118silk 70, 71single—strand-binding pro-
teins 240single-stranded DNA
(ssDNA)site-specific
deoxyribonuclease seerestriction endonucleases
β-sitosterol 56, 57size, molecular 218skeletal muscles 332small intestines 31, 268,
269small nuclear ribonucleo-
protein particles(snRNPs) 246
small nuclear RNA (snRNA)82
smooth endoplasmic retic-ulum (sER) 172, 173, 226,227
smooth muscle 332, 338sn see stereospecific num-
beringSNAREs 228, 229snRNA, splicing 83snRNPs (snurps) 246soap bubbles 28, 29sodium
chloride dissolution 21dodecylsulfate see SDSions 328voltage-gated channel
222, 223solenoids 238solubility 28, 29soluble coenzymes 104solvents 26-7, 54somatic mutation 302
All rights reserved. Usage subject to terms and conditions of license.Koolman, Color Atlas of Biochemistry, 2nd edition © 2005 Thieme

464 Index
somatic recombination 302somatotropin 64, 65
receptor 64son of sevenless see SOSsorbitol 36, 37
D-sorbitol 39sorting, proteins 174, 228-9,
229SOS, adaptor proteins 388spacespace, intermembrane 210
matrix 210spectrin 206spectrophotometry 102, 103sphingolipids 46, 47, 51, 170sphingomyelin 214, 215sphingophospholipid 51sphingosine 51
N-acetyltransferase 423spliceosomes 246, 247splicing
hnRNA 246, 247snRNA 83
spontaneous separation 29squalene 52, 53, 172, 173SR see sarcoplasmic reticu-
lumssDNA see single-stranded
DNAstabilization
catalysis 90transition states 100, 101
starches 40, 42, 43brewing 148, 149
start codons 248, 250STAT 392statins 372stationary phase 54stearic acid 49stearoyl-CoA desaturase 422stercobilin 195stercobilinogen 194, 195stereospecific numbering
(sn)stereospecificity 8steroid alcohols see sterolssteroid hormones 56, 57,
172, 374, 377biosynthesis 376conjugates 110inactivation 376metabolism 376-7, 377see also individual
hormonessteroids 46, 52, 53, 54-7, 55
hormones see steroidhormones
receptors 378signaling 46steroid 11β-monooxyge-
nase 422steroid 17α-monooxyge-
nase 422steroid 21-monooxyge-
nase 422steroid -isomerase 429structure 54synthesis 410
sterol esterase 268, 269sterol esters 47sterols 46, 54, 55, 56, 57
see also cholesterol;ergosterol; β-sitos-terol; stigmasterol
stearylglycerols,tristearylglycerol 49
stigmasterol 56, 57stop codons 248, 250stop-transfer signal 230storage, liver 306STP see signal transduction
proteinstrands
double 85grooves 86matrix 85sense 85
Streptococcus 148, 149Streptomyces lividans 222,
223streptomycin 254striated muscle 333stroma 128, 129STRs see short tandem
repeatsstructural genes 118structure 6
dimers 116isomers 8polysaccharides 40primary 76proteins 68, 70-1secondary 76tertiary 76quaternary 76
Stuart—Prower factor seecoagulation factor Xa
Stuart-Prower factor 291substitution, nucleophilic 14substrate-level phosphory-
lation 150substrates
activity 95analogs 96, 97bisubstrate kinetics 94, 95coenzymes 105concentration 97, 116cosubstrates 104enzymes 94insulin 388orientation 90, 100phosphorylation 122,
124, 125proximity 90, 100receptors 388specificity 88, 89, 94suicide 96, 97
succinate 136, 137dehydrogenase 136, 137,
140, 421glucose oxidation 147
semialdehyde dehydro-genase 356, 357, 420
succinate-CoA ligase 136,137, 147(GDP-forming) 429
succinic acid 8, 9succinyl phosphate 125succinyl-CoA 136, 137, 166,
167heme biosynthesis 192,
193ligase 124, 125
sucrose 38, 39α-glucosidase 426density gradients 201
sugar 38alcohols 38, 39
see also mannitol;sorbitol
amino 44suicide substrates 96, 97sulfathiazole 255sulfatides 50, 51sulfides, disulfide 11sulfonamides 254, 255sulfur 11sulfur-containing amino
acids 60superoxide
dismutase 284, 285, 422radicals 284
surface films 29Svedberg unit (S)sweat 31
All rights reserved. Usage subject to terms and conditions of license.Koolman, Color Atlas of Biochemistry, 2nd edition © 2005 Thieme

465Index
symbiosisendosymbiotic theory
210nitrogen fixation 184, 185
symport 212, 218, 220synapses 348
receptors 348signal transmission 348,
349vesicles 354
synaptobrevin 228, 229synaptotagmin 228, 229Synechococcus elongatus
130, 132syntaxin 228, 229synthases see lyasessynthetases see ligases
T
T cell 274, 275, 294activation 296-7, 297receptor 224, 225
T form 117hemoglobin 280, 281
T state 116T4 phage 404TAFs see TATA box, binding
protein, associated fac-tors (TAFs)
tail, polyadenylate 246TATA box 242, 243
binding protein (TBP)244, 245associated factors
(TAFs) 244, 245taurine 314taurocholic acid 314, 315TBG see thyroxine-binding
globulinTBP see TATA box, binding
proteinteeth 340, 341temperature,enzymes94,95templates 84, 240terminal oxidation 136termination, Escherichia coli
251terpenes 52, 53tertiary structure 76testosterone 56, 57, 338,
374, 376tetracyclines 254tetrahydrobiopterin (THB)
tetrahydrocortisol 317tetrahydrofolate (THF) 108,
110N5-formyl-THF 108N5-methyl-THF 108N5-methylene-THF 108N10-formyl-THF 108
tetraiodothyronine see thy-roxine
tetramers 99tetrapyrroles 128, 129THB see tetrahydrobiopterinThermodynamics, Second
Law of 20thermogenin (UCP-1) 144,
145THF see tetrahydrofolatethiamine see vitamin B1thiamine
diphosphate (TPP) 106,107, 366pyruvate dehydrogen-
ase 134, 135see also vitamin B1
thiazole ring 106thin-layer chromatography
(TLC) 54, 55thioesters 10, 11, 106, 125
bonds 12, 13thioethers 10thiokinase see succinate-
CoA ligase (GDP-form-ing); succinyl-CoA ligase
thiols 10, 11thiopurine methyltransfer-
ase 402, 403, 422thioredoxin 190, 191
reductase 190, 191, 421threonine 60, 61, 63
aldolase 428synthase 428
thrombin 290, 426thrombocytes 274, 290thromboplastin 291thromboxanes 390thylakoids 128, 129, 133thymidine 80, 81, 82, 304thymidylate synthase 190,
191, 402, 403, 422thymine 81, 84, 186, 187
dimers 256thyroid-stimulating hor-
mone (TSH) see thyrotro-pin
thyroliberin 380
thyrotropin 380thyrotropin-releasing hor-
mone (TRH) see thyroli-berin
thyroxine 62, 374thyroxine-binding globulin
(TBG)TIM 232tissue kallikrein 426tissue plasminogen activa-
tor (tPa) see plasminogenactivator (tissue)
tissuesdisruption 198hormones 370
titin 332titration curves 30TLC see thin-layer chroma-
tographyTMP, dTMP 80, 81, 187TNF-a see tumor necrosis
factor-atobacco mosaic virus 404tocopherol see vitamin ETOM 232topoisomerases 240, 245,
429toxicity, urea 182TPP see thiamine diphos-
phatetrace elements 2, 360, 362-3TRADD 396transducin 224transferrin 286transacetylase 119transaldolase 152, 153, 422transaminases 94, 176, 177transamination 134, 178-9,
179, 180pyridoxal phosphate 108,
109transcription 208, 242-5,
243control 114, 115, 118-20,
244-5factors 114, 118, 119, 392,
394genetic information 236initiation 244, 245PEP-CK 244, 245regulation 244RNA 242, 243
transducin 72, 73, 358transfer RNA see tRNAtransferases 88, 89
All rights reserved. Usage subject to terms and conditions of license.Koolman, Color Atlas of Biochemistry, 2nd edition © 2005 Thieme

466 Index
C1-transferases 89intermolecular 89
transferrin 287transformation 258, 398,
401bio 226, 317tumors 400
transition states 15, 90, 100analogs 97stabilization 100, 101
transketolase 152, 153, 422translation 174, 208
amino acids 60elongation 252-3Escherichia coli 250, 251,
252, 253genetic information 236,
248, 250-3inhibitors 254initiation 250-1RNA 83termination 252-3
translocation 252signals 228, 229
translocator complexesTIM 232TOM 232
translocon 230transmembrane helix 214transport
active 218antibiotics 254antiport 212, 218blood 274CO2 282, 283hemoglobin 282, 283hormones 370lipoproteins 279mechanisms 220membrane regulation
216mitochondrial 212-13O2 282-3, 283passive 218plasma membranes 219processes 218-19proteins 220-1secondary 220symport 212, 218, 220uniport 212, 218
transporters 35, 210, 212,218, 220
transthyretin 64, 65, 276transverse tubules 334α, α-trehalase 426
triacylglycerol 48, 49, 163,170, 171lipase 270, 271, 272, 273,
425tricarboxylic acid cycle 113,
136-9, 137, 139, 210and amino acid
biosynthesis 185regulation 144, 145
triiodothyronine 374see also thyroxine
triokinase 310, 311, 424triose phosphate isomerase
150, 151, 429Tris(hydroxymethyl)amino-
methanetristearylglycerol, van der
Waals model 49tRNAPhe 82, 83, 86, 87
aminoacyl 248genetic information 236
tropines 372tropomyosin 64, 65, 332,
334troponin 332, 334trypsin 94, 95, 177, 268, 269,
426trypsinogen 176, 177, 270tryptophan 60, 61TSH see thyroid-stimulating
hormonetubules 210, 221
microtubules 204, 206,207
transverse 334tubulins 204, 205tumor necrosis factor-α
(TNF-α) 396tumor-suppressor genes
394, 398tumors 400-1, 401
gene therapy 264, 265monoclonal antibodies
302turnover
enzymes 88, 89number 92
β-turns 68type 1 diabetes 160type 2 diabetes 160tyrosine 60, 61, 352
kinases 224, 392radical 190, 191transaminase 424
tyrosine-3-monooxygenase
352, 353, 422
U
ubiquinol see coenzyme Q,reduced
ubiquinone see coenzyme Q,oxidized
ubiquitin 62, 176, 177, 394UCP-1 see thermogeninUDP glucose 110, 111, 156
4-epimerase 310, 311, 428UDP glucose 1-phosphate
uridyltransferase 157UDP glucuronic acid 194UDP-glucuronosyltransfer-
ase 194ultrafiltration 322ultraviolet radiation (UV)
256UMP 187, 188, 189, 190uncouplers 144, 145uniport 212, 218units, international (U) 88unsaturated fatty acids 48uracil 80, 81, 84, 186, 187urea 324
cycle 113, 182-3, 183degradation 112liver 182
ureotelic animals 182uric acid 186, 187, 324uricase 186uricotelic animals 182uridine 80, 81
5’-diphosphate see UDP5’-monophosphate see
UMP5’-triphosphate see UTPdihydrouridine 82, 83pseudouridine 82, 83
urine 31, 322, 323, 324-5,325
urobilin 194, 195urobilinogen 194, 195urocanate hydratase 428urokinase see plasminogen
activator (urine)uroporphyrinogen III 192,
193synthase 192, 193, 428
UTP 190UTP-glucose-1-phosphate
uridyltransferase 424
All rights reserved. Usage subject to terms and conditions of license.Koolman, Color Atlas of Biochemistry, 2nd edition © 2005 Thieme

467Index
UV see ultraviolet radiation
V
V segments 302V systems 116V type ATPase 220V/J recombination 302, 303vacuoles 43, 196, 234valerianic acid 49valine 60, 61van der Waals models 6, 7
acetyl-CoA 13cholesterol 54, 55tristearylglycerol 49
variability, immunoglobu-lins 302
variationallotypic 302idiotypic 302
vasopressin see antidiuretichormone (ADH)
vectors 258, 259velocity
and concentration 93, 97maximum 92, 93reciprocal 93relative 25
very-low-densitylipoprotein see VDLV
vesicles 28, 29fractionation 198synaptic 354
vimentin 332viruses 404-5, 405
DNA 264, 265rhinovirus 404, 405
vitamins 365A (retinol) 52, 53, 364, 365antioxidants 364B1 (thiamine) 366, 367B2 complex 366, 367B6 complex 368, 369B12 (cobalamine) 108,
368, 369C (L-ascorbic acid) 104,
105, 368, 369coenzymes 364D (calciol, cholecalciferol)
52, 53, 364, 365deficiency diseases 364E (tocopherol) 32, 52, 53,
104, 364, 365H (biotin) 62, 108, 109,
368, 369hormones 364K (phylloquinone) 52, 53,
104, 364, 365lipid-soluble 46, 364-5,
365nutrients 360water-soluble 366-9, 367,
369VLDL 163, 278, 312Vmax see maximum velocityvoltage-gated Na+ channels
222
W
water 11, 27, 65, 296acids 31bacterial cells 202degradation 112
emulsions 28exclusion of 90excretion 322hydrophobic interactions
28-9nutrients 362O2
- 284recycling 328-9, 329solvents 26-7structure 26
water-soluble vitamins 366-9, 367, 369
waterbinding polysacchar-ides 40
watersplitting enzyme 130wavelength, constant 102,
103waxes 47work 17
energy 16wort 148, 149
X
xanthine 187oxidase 186, 187, 420
xyloglucan 41D-xylose 38, 39, 42xylulose 5-phosphate 153
Y
yeasts 148, 149
Z
All rights reserved. Usage subject to terms and conditions of license.Koolman, Color Atlas of Biochemistry, 2nd edition © 2005 Thieme
Related Documents


