COLONIZATION AND SUBSISTENCE CHANGE ON THE 17TH CENTURY CHESAPEAKE FRONTIER By Henry Micha el Miller St. Mary 's City, Maryland 1984

Welcome message from author
This document is posted to help you gain knowledge. Please leave a comment to let me know what you think about it! Share it to your friends and learn new things together.
Transcript
COLONIZATION AND SUBSISTENCE CHANGE
ON THE 17TH CENTURY CHESAPEAKE FRONTIER
By
Henry Michae l Miller
St. Mary ' s City, Maryland
1984

ABSTRACT
COLONIZATION AND SUBSISTENCE CHANGE ON THE 17TH CENTURY CHESAPEAKE FRONTIER
By
HENRY MICHAEL MILLER
Colonization is a process by which people occupy and
adapt to new lands and environments. In this study, a model
of colonization is used to derive six hypotheses that
predict how human subsistence patterns will change in
front i er settings. These hypotheses are tested with
archaeological data from 17th and early 18th Century
colonial sites in the Chesapeake Bay region of Maryland and
Virginia, scene of the earliest British settlement in the
New World. Animal remains comprise the primary data base.
The findings demonstrate that the diet altered dramatically
during the 17th Century. Early subsistence was generalist
in nature, relying upon a diversity of domestic and wild
animals, and the diet was highly seasonal in character.
Through time, subsistence patterns became focused upon two
domestic animals - cattle and swine. Usage of wild game
declined significantly as the diet became more specialized.
Trends of change toward more complexity, greater stability
and reduced seasonal variation in subsistence are also
identified.
All but one of the hypotheses are supported. Increased
subsistence variation between households through time due to
socio- economic factors did not occur as predicted.

Henry Michael Miller
Variation was most pronounced during the early phases of
settlement and became less pronounced through time, despite
evidence for greater social and economic stratification in
Chesapeake society. This discovery suggests that dietary
differences between socio- economic groups may not be an
inevitable feature of social stratification.
Colonization is a distinctive, pervasive cultural
process. Through a model of colonization, patterns of
subsistence change are elucidated. Application of the
colonization model to a particular historical setting
reveals the importance of considering broad cultural process
as well as specific historical factors in explaining change.

TABLE OF CONTENTS
LIST OF TABLES . ix
LIST OF FIGURES . xiii
CHAPTER 1
CHAPTER 2
CHAPTER 3
COLONIZATION THEORY AND SUBSISTENCE CHANGE Introduction . The Concept of Colonization Adaptation and Culture .. The Colonization Model . Subsistence and the Frontie r Colonization and Subsistence Patte r ns Hypotheses abou t Frontier Subsistence
1 2 6
13 28 45 49
THE BRITISH HOMELAND AND BRITISH SUBSISTENCE PRACTICES . . . . 54
British Climate and Landscape 55 Agriculture and Livestock Husbandry
by Region Methods of Agriculture and Husbandry British Diet and the Yeoman Tradition Food Resources in British Subsistence Methods of Food Preparation and
Consumption Food Preservation
61 67 72 75
The Annual Subsistence Cycle of the Yeoman . The Diet of the Commoners and the
81 85 86
Importance of Meat Summary
THE 17TH-CENTURY CHESAPEAKE: THE SETTING FOR COLONIZATION
History of the Colonies . . . Geology and Geography of the Chesapeake Climate of the Chesapeake Region Soils Terrestrial Vegetation . Marshes Fauna in the Chesapeake Region Chesapeake Mammals . Chesapeake Birds . Reptiles and Amphibians Aquatic Animals The Chesapeake Indians Summary
vi
90 97
99 105 109 115 116 119 121 122 124 127 128
. 137 142

CHAPTER 4
CHAPTER 5
CHAPTER 6
17TH- CENT UR Y CHESAPEAKE SOCIETY AND TH E COLONIZATION PROCESS
17th- century Settlemen t Patterns. Tob acco and t h e Chesapeake Economy Immigration and the Labor Supply Life and Death i n the Chesapeake Development of a Stab le Societ y
145 151 155 161
· 164
SOURCES OF INSIGHT : THE HISTORICAL AND ARCHAEOLOGICAL RECORDS
The Ne e d for Archaeological Data The Historical Dat a Base . . . Food Remains and the Meat Diet . Some Necessary Assumptions .. Th e Archaeological Data Base
Potomac River Sites James River Sites .... Unit s of Analysis Bone Preservation Recovery Methods . . Methods of Analysis Faunal Quantification
176 . . . . . . 177
180 · 181
. . . 182 186 191 197 202 205
. . . . . 208 212
Estimating Consumed Meat Weights · 220 223 Seasonality ..... .
Livestock Aging Methods .... . · 225
SUBSISTENCE AND CULTURAL IMPOVERISHMENT. 227
CHAPTER 7 CHANGING ADAPTIVE STRATEGIES . . . . 243 Measures of Niche Width . . . . . .. . 250 Seasonality in Subsistence: 1620- 1660 .. 267 Resource Depletion and Focal Adaptations .. 278 Trends in Relative Faunal Frequencies . 283 Seasonal i ty: 1660 - 1740 . . 301 Summary .............. . 309
CHAPTER 8 PATTERNS OF STABILITY, UNIFORMITY AND COMPLEXITY
CHAPTER 9
Stability and Uniformity in Subsistence 312 Evidence of Increasing Subsistence
Complexity . . . 326 Summary . . . . . .. .... 332
VARIATION IN SUBSISTENCE BEHAVIOR Geographic Variation ... Resource Exploitation and wealth Discussion . . . . . . ..
333 340 367
CHAPTER 10 SUMMARY AND CONCLUSIONS Summary 372
376 390
Discussion Conclusion
vii

APPENDICIES I: Faunal Remains From Sites. . . 395
II: Estimated Meat Weights of Species 418 I II: Seasonal Indicators in the Chesapeak e .. 424
I V: Bone Fusion Data For Cattle .. 456 V: Statistical Data . . . 467
BIBLIOGRAPHY . 471
viii
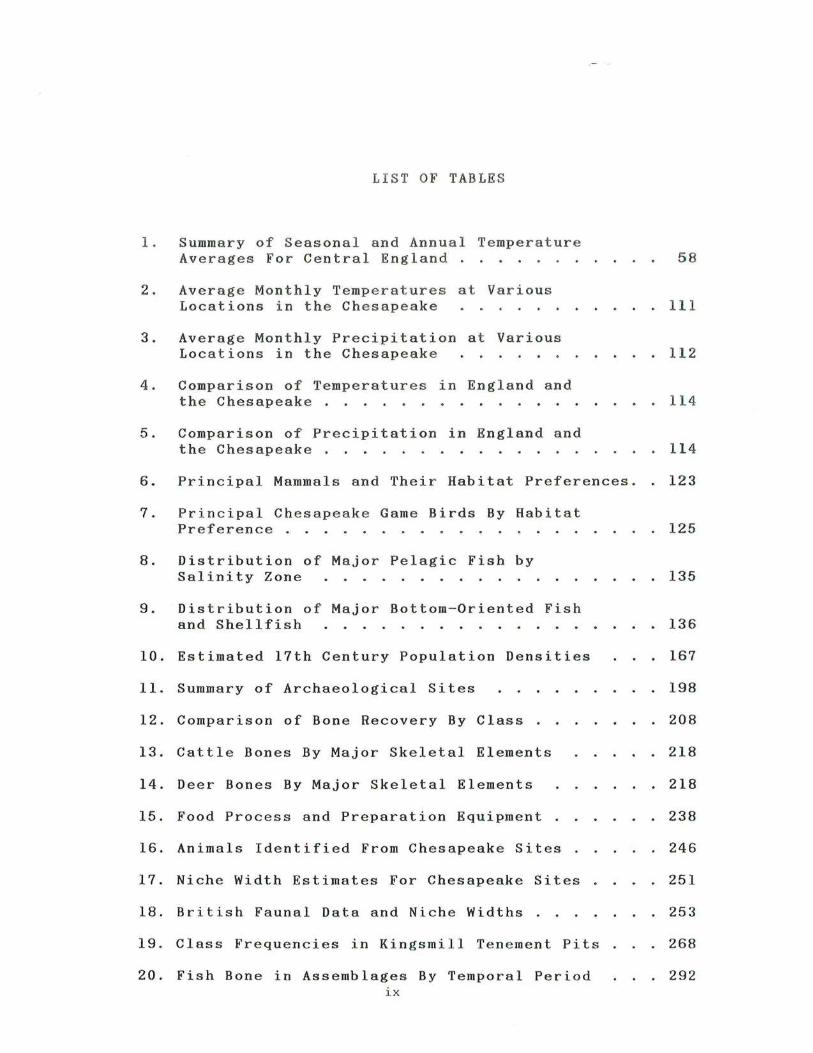
LIST OF TABLES
1. Summary of Seasonal and Annual Temperature Averages For Central England 58
2. Average Monthly Temp eratures at Various Locations in the Chesapeake . III
3. Average Monthly Precipitation at Various Locations in the Chesapeake 112
4. Comparison of Temperatures in England and the Chesapeake . . 114
5. Comparison of Precipitation in England and the Chesapeake . 11 4
6. Principal Mammals and Thei r Habitat Preferences. 123
7. Principal Chesapeak e Game Birds By Habitat Preference . . 125
8. Distribution of Major Pelagic Fish by Salinity Zone . 135
9. Distribution of Major Bottom-Oriented Fish and Shellfish 136
10. Estimated 17th Century Population Densities
11. Summary of Archaeological Sites
12. Comparison of Bone Recovery By Class
13. Cattle Bones By Major Skeletal Elements
14. Deer Bones By Major Skeletal Elements
15. Food Process and Preparation Equipment
16. Animals Identified From Chesapeake Sites
17. Niche Width Estimates For Chesapeake Sites
18. British Faunal Data and Niche Widths
19. Class Frequencies in Kingsmill Tenement Pits
20. Fish Bone in Assemblages By Temporal Period ix
. 167
198
208
. 218
218
238
246
251
253
268
292

2l. Estimated Meat Frequencies By Temporal Period
22. Estimated Meat From Features at Drummond I . 23 . Estimated Meat From Features At Wills Cove . 24. Estimated Meat From Features At Bennett Farm II
25. Estimated Meat Fr om Features in St. Mary's City
26. Variabilit y in Faunal Classes By Period
27. Steer s By Age in St . Mary's County In vent o ries
28. Ca rts and Plows in St. Mary's County Estates.
29. Comp ar i son of Dairying and Co o king Equi pment
30. Me an Bone Frequencies by Geographic Area an d Tempo r a l Peri o d
31. Mean Meat Fr equen c ies b y Geograph ic Area and Tempora l Pe r io d
32. Frequen c ies o f Bo ne a n d Meat at Benn e tt Fa rm
33. Estimated Me a t Fr e quen c ies at Multi - Phas e Si t e s
34. Bone and Meat Frequenc i e s from the First Phas e of Occupation at Sites .
35. Cattle , Swine, and Wi ld Animal Frequencies in Period 2 Assemblage s .
36. Period 3 Assemblage Bon e and Meat Frequencies of Cattle, Swine and Combined Wild Animals .
37. Faunal Materials From Drummond Wells 326 and
38. Faunal Remains From th e Maine Site . 39. Faunal Remains From Kingsmill Tenenment
40 . Faunal Mat e rials From St . John's I
41. Faunal Remains From Pope's Fort
42. Faunal Remains Fr om Chancellor s Po i nt
43. Faunal Remains From Bennett Farm I
44. Faunal Re mai ns From Drummond , Ph a s e I
x
347
294
302
· 303
· 305
306
313
· 323
325
326
· 335
335
338
· 342
· 34 6
· 35 4
361
365
395
396
398
399
400
401
4 0 2

45. Faunal Remai ns From Drumm o nd , Phas e I I .
46. Faunal Re mains Fr om the Wills Cov e Sit e
4 7. Fa unal Remains From Be n ne t t Farm II
48 . Faunal Remai ns From Smith's Tav e rn Cell a r
49 . Faunal Remains From Bak er ' s Ta ve r n
5 0 . Faunal Remains From Cl ifts, Phas e I
5 1 . Faunal Remains From Pettus Plan ta t i on
52 . Fau nal Rema in s Fr om Utopia.
53. Faun al Rema i ns Fr om Van Swere n gin ' s.
54 . Faunal Remains From St. John 's, II .
55. Faun a l Rem a i ns From Clif t s, Phas e III
56 . Faunal Remai ns Fr om Clift s , Phase I V .
57. Faunal Remains From Drummo n d , Phase III
58 . Faunal Remai n s Fr om t h e Br a y Plantat ion
59 . Kingsmi11 Tenement: Fea t ur e 15 4
60 . Kingsmil l Te n e ment: Feature 396
61. Kingsmil1 Tenement: Feature 393
62. Kingsmill Tenement: Feature 4 25
63. Kingsmill Tenement: Featur e 4 30
64. St . John's: Feature 50M/50P
65. St. John's Feature: 55C , 55G
66 . Pope's Fort: Strata 1222 P an d N
67. Bennett Farm I: Feature 28A
68 . Drummond Site: Feature 265
69. Drummond Site: Feature 255
70 . Drummond Site: Feature 332 .
71. Wills Cover Site : Feature 5
xi
403
405
406
407
408
40 9
4 1 0
41 1
412
413
414
415
4 16
417
4 3 0
4 3 1
432
433
434
436
437
4 38
439
440
441
442
44 3

72. Wills Cove Site: Feature 6 .
73. Bennett Farm II: Feature 6
74 . Bennett Farm II: Feature 8
75. Bennett Farm II: Feature 16
76. Bennett Farm II: Fe a t u re 30
77. Smith 's Ordinary Cella r
78. Baker's Tavern.
79. st. John's II: Large Circular Pit
80. Van Swerengin's Feature
81. st. John's II: Cellar
82 . Drummond III: Feature 277
83. Bray Plantation: Feature 10
84 . Cattle Bone Fusion Data From Kingsmill Tenement
85. Cattle Bone Fusion Data From Pope's Fort
86. Cattle Bone Fusion Data From Drummond I
87. Cattle Bone Fusion Data From Drummond II
88 . Cattle Bone Fusion Data From Pettus Plantation
89. Cattle Bone Fusion Data From Utopia
90. Cattle Bone Fusion Data From Bennett Farm II
91. Cattle Bone Fusion Data From St. John's II
92 . Cattle Bone Fusion Data From Drummond III
93. Cattle Bone Fusion Data From Clifts III
94. Cattle Bone Fusion Data From Clifts IV .
xii
444
445
· 446
447
448
· 449
45 0
451
452
453
454
455
456
457
· 458
459
460
461
462
463
464
465
466
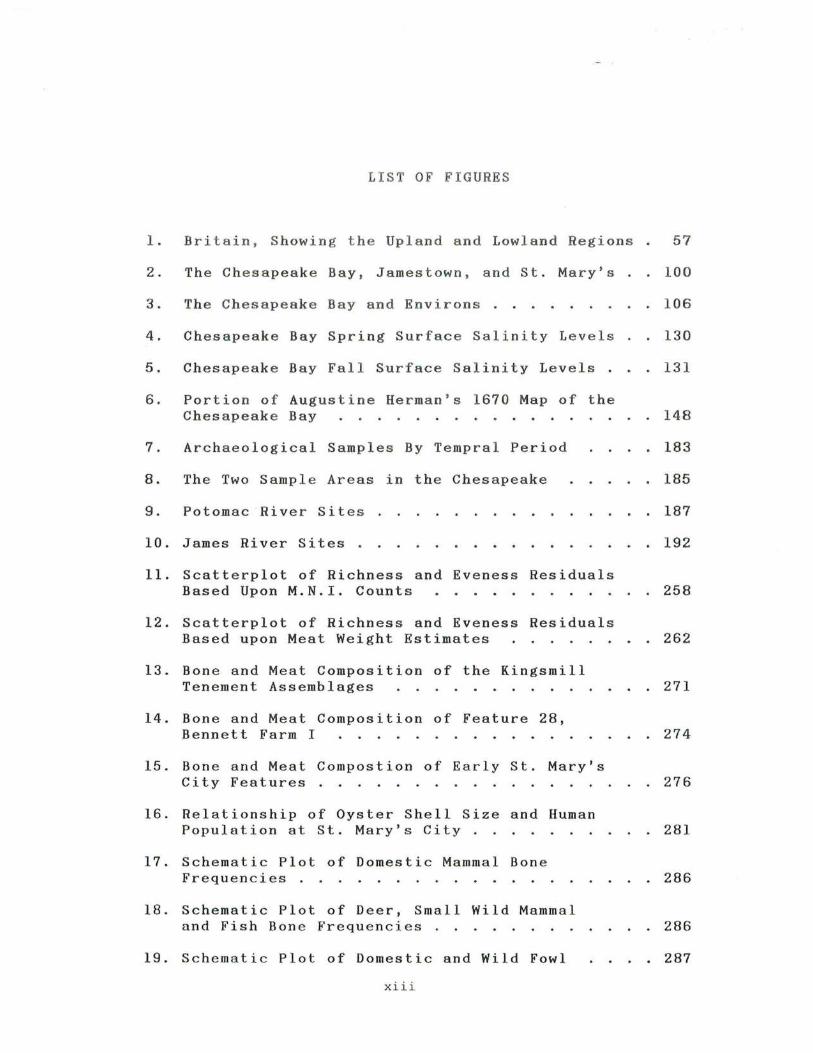
LIST OF FIGURES
1. Britain , Showing t he Upland and Low land Regions. 57
2. Th e Chesapeake Bay, Jamestown , and St. Mary's 100
3. The Chesapeake Bay and Envi rons . 1 06
4. Chesapeak e Bay Spring Surface Salinity Levels 130
5. Chesapeake Bay Fall Surface Salinit y Levels .
6. Portion of Augustine Herman 's 1670 Map of the Chesapeake Bay
7. Archaeolo gica l Samples By Tempra l Period
8. Th e Two Sampl e Areas in the Chesapeake
9. Potomac Rive r Site s
10. James River Sites .
11. Scatterplot of Richness and Eveness Residuals Based Upon M.N.I. Count s
12. Scatterplot of Richness and Eveness Residuals Based upon Meat Weight Estimates
13. Bone and Meat Composition of the Kingsmill Tenement Assemblages
14. Bone and Meat Composition of Feature 28, Bennett Farm I
15 . Bone and Meat Compostion of Early St. Mary's City Features
16. Relationship of Oyster Shell Size and Human Population at St. Mary's City.
17. Schematic Plot of Domestic Mammal Bone Frequencies .
18. Schematic Plot of Deer, Small Wild Mammal and Fish Bon e Frequencies .
19. Schematic Plot of Domestic and Wild Fowl
xiii
· 13 1
148
183
185
187
192
· 258
· 262
· 271
· 274
· 276
· 281
· 286
286
287

20 . Livest o c k Tren d s in Ho useh old I nv en t ories, St. Ma r y 's Coun t y, Marylan d . 298
2 l. Pe r c e n tage o f Estimated Total Wild Mea t i n Feature s · 308
22. Percent a g e o f Cat tle Killed By Age Ran ge, Ki n gsm i ll Tenement · 3 14
23. P e rcen tage of Catt le Ki l led By Ag e Range, Pope"s Fort · · 314
2 4 . Percen tage of Cattle Killed By Age Range, Dr ummon d I 3 16
25 . Pe rcen tage o f Cat tle Killed By Ag e Range. Drummond II · 3 16
26 . Pe r c entage of Ca tt l e Killed By Age Range , Pe tt us Pl a n t a tio n · 3 17
27 . Perc e nt a g e o f Cattle Killed By Ag e Ra n ge, Utopia Si te · · 318
28. Percentage of Cat t le Killed By Age Range , Bennett Farm · 318
29. Percentage of Cat t le Killed By Ag e Ra nge , St. John's II · 320
30. Percentage o f Cat t le Kil l ed By Ag e Ra nge, Drummond III · 320
3l. Percentage of Cattle Killed By Age Range, Clifts III 321
32. Percentage of Cattle Killed By Age Range, Clifts IV . 321
33. Comparison of Bone Freque nci e s From Pettus and Utopia 357
34. Comparison of Meat Frequencies From Pettus and Utopia 357
35. Cattle Bones By Body Sect i on: Pettus Pl a ntation 359
36. Cattle Bones By Body Section: Utopia 359
37. Swine Bones By Body Section: Pettus Plantation 360
38. Swine Bones By Body Section: Utopia 360
xiv

39. Availability Periods of Common Wildfowl in the Chesapeake .
40. Seasonal Availabi lity of Fish in the Chesapeake .
xv
426
428

CHAPTER 1
COLONIZAT I ON THEO RY AND SUB SISTE NC E CHANGE
Int r oduction
Th e s e ttling of new lan d s 1S a tough , d e manding an d
exciting v e nture which has occupied peopl e s on prac tically
ev ery continent and over a l ar g e span o f human history .
Fo r that reason, the subject of colonization has long
att r acted the attention of scholars , especia l ly historians,
who have struggled to understand the impact of the frontier
on social and political developm e nt . Much of thi s ef f ort h a s
been directed to the study of specific frontiers and their
unique characteristics while the study of colonization as a
broader phenomenon has been largely neglected. Recently
however, research by a growing number of anthropologists,
geographers and historians has begun to re vea l how truly
worldwide and cross - cultural this phenomenon is. From th e
comparative study of frontiers in a variety of places is
emerging an understanding of colonization not only as a way
of occupying new lands, but as a process of cult ur e change.
In this dissertation, colonization as a cultural process will
be the sub ject of investigation and a colonization model will
be tested using archaeological data .
Most frontier research has dealt almost exclusively with
historical documents or th e et hnographic observation of
1

2
contemporary colonization efforts and very few archaeology -
based studies of this s ubj ect have been conducted. This is
unfortunate because the time depth and pervasiveness of the
archaeological record can permit the study of a vast sample
o f frontiers s pread ove r thousands of years and in nearly
every environment found on earth. It is hoped that this
dissertatio n will h e lp demo nstra te t he ef ficac y of an
archaeological appraoch to colonization study. Th e re g ion
selected for investigation is the Chesapeak e Bay of eastern
No rth America . Th e earli est English colonization in the
present Un it ed States took place in the Chesape a ke , and the
archaeological remains of these early settlements have been
subject to more than a decade of intensive, systematic
expl orat ion .
The Concept of Colonization
The ways in which humans adapt to the challenges of the
world is an issue of central importance in Anthropology and
one of the most dramatic instances of adaptation occurs when
humans settle new, unknown lands. One form by which these
new lands are settled is th e rapid movement of peoples known
as colonization. It can be defined as the process by which a
society rapidly occupies new territories and environments
through migration and readaptation. Colonization by Western
European cultures is the most well known and will b e focused
upon here, but this process has occurred throughout the world
and with a variety of cullural systems. Indeed, th e process
ha s been so widespread that a historian has argued "It might
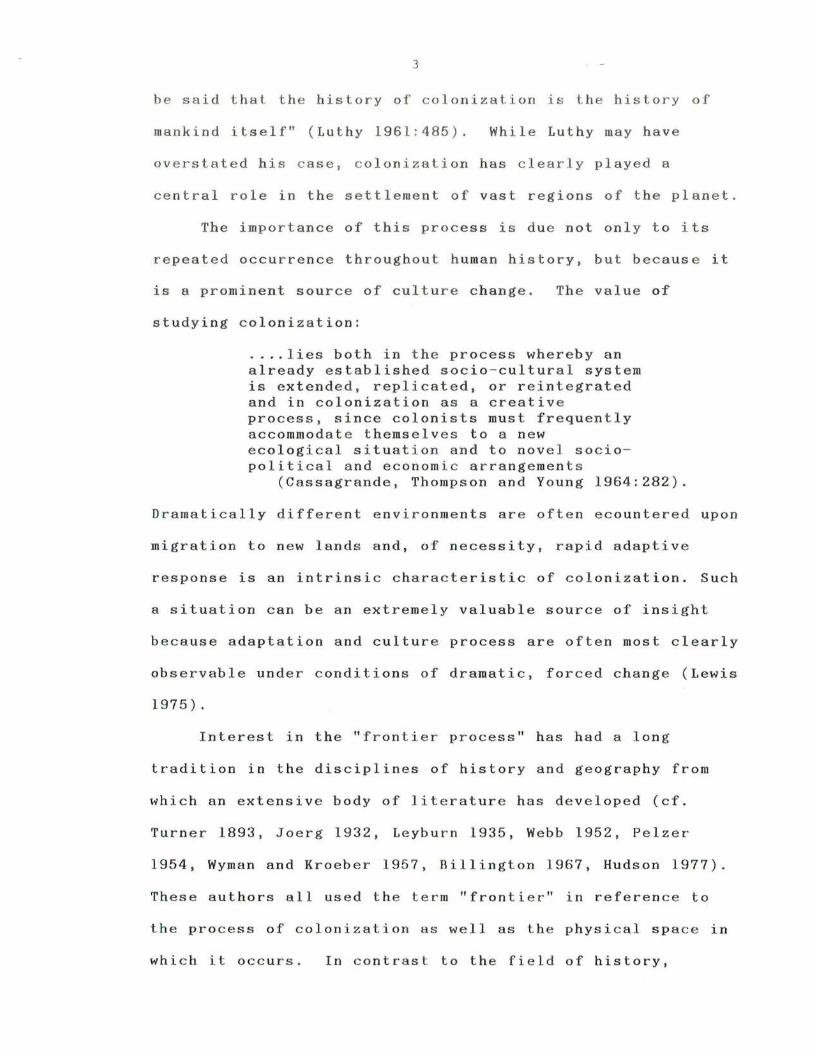
3
be said that the history of colonization is the history of
mankind itself" (Luthy 1961:485). While Luthy may have
ov erstated his ca se, co loni zation has clearly played a
central role in the settlement of vast regions of the planet.
The importance o f this process is due not only to its
repeated occurrence throughout human history, but because it
is a prominent source of culture c hange. The value of
studying co loni zati on:
.. .. lies bot h in the p r oces s whereby an already established socio-cultural system is extended, replicated, or rein tegrate d and in colonization as a creative proces s, since colonists must frequently accommodat e themselves to a n e w ecological situation and to novel soci o polit i ca l a nd econom ic arrangement s
(Cassagrande, Thompson and Young 1964:282).
Dramatically different environments are of ten ecountered upon
migration to n e w lands and, of necessity, rapid adaptive
response is an intrinsic characteristic of colonization. Such
a situation can be an extremely valuable source of insight
because adaptation and cultur e process are often most clearly
observable under conditions of dramatic, forced change (Lewis
1975) .
Interest in the "fron tier process" has had a long
tradition in the disciplines of history and geography from
which an extensive body of literature has developed (cf.
Turner 1893, Joerg 1932, Leyburn 1935, Webb 1952, Pelzer
1954, Wyman and Kroeber 1957, Billington 1967, Hudson 1977).
These authors all used the term "frontier" in reference to
the process of colonization as well as the physical space in
which it occurs. In contrast to th e fi e ld of history,

4
anthropology has devoted liltle attention to the subject of
co loniz ati on . Sahlins and Service (1960: 5 0 ) discussed the
s ubj ect and conclude that it was a significant factor in
general cultural e v o lu tion. Most ant h r op ological res e arch,
however, has focused upon t h e impact of colonizati on upo n
aboriginal peoples while virtually ignoring the colonists
(cf. Spicer 1962, Bohannan a nd Plog 1967). On e of the
earliest and most influential discussions of thi s subject
from the colonists ' point of vi e w is "Colonizati on as a
Research Frontier" (Cassagrande, Thompson, and Young 1964) .
Their article appealed for more research into the subject and
since its publication, a sign if icant body of literature has
been produced (Doolittle 1973; Lewis 1973, 1975, 1977; Miller
and Steffen 1977; Savage and Thompson 1979; Sm i th 1981;
Thompson 1970, 1973, 1975). Each of these works focused upon
specific aspects of the process by which colonizing cultures
are changed through adaptation to the new physical and social
environment of the frontier. As a result of this growing
research effort, colonization is recognized as an important
adaptive process with distinctive features that serve to
distinguish it from other cultural phenomena. These findings
have been distilled into a "Colonization Model" (Thompson
1973; Lewis 1975) which comprises much of the theoretical
basis for this investigation. The goal is not to determine
the ultimate causes of colonization or the unique
characteristics of specific frontiers but rather to elucidate
the regularit ies display e d by cultural systems engaged in the
5
process o f coloniza t ion.
One common feature of colonizing situations is a rapid
and often pronounced adaptive response necessitated by new
ecological and/or social settings . The significance of th e
environment in pr oduc ing this change was recognized b y
Frederick Jackson Turne r , a historian, who champion ed th e
view of the frontier as the causa l factor in the emergence of
Ame ri can democ racy. He wrot e that:
... at the frontier the environment is at first too strong for the man . He must accept the conditions which it furnishes, or perish, and so he fits himself into the Indian clearings and follows Indian trails. Littl e by little he transforms the wilderness, but the outcome is not the old Europe ... The fact is that here is a new product that is American (1893:546).
Turner recognized that colonization is a two-way process
which involved the settlers' transformation of the
environment as well as the environment having a significant
impact upon the settlers. This same point has been
acknowledged by many scholars and Thompson (1973:2)
emphasized that adaptation necessitated by the new
environment is the most fundamental cause of cultural change
during colonization. Thus, adaptation lies at the heart of
the colonization process and because of this, it is necessary
to examine the concept of adaptation before more fully
considering the colonization model .
6
Ad aptation and Culture
The concept of adaptation is widely employed in the
social and biological scie nces. Ada p tation h as b een defined
as the process of change by which a better fit between an
o r ganism and its envir onment is a chiev e d. Th e co n c e p t of
a d a p tation is s o i ntricate l y bo u n d wit h evo luti on ary bio logy
that a state o f adap t ati o n i s consider e d the g o a l of
evolut i ona ry change (Grant 1963 :563) . Thi s point is
r einforced by Dobzhansky (1968:28) who referred to evolu ti o n
a s the adaptiv e re sp onse s to the chall e nges of the
environmen t .
For humans, culture i s the pr i ncipal means of adap t at i o n
and cultu re can be defined as an integrated system of lea r ned
behavior patterns possessed by a group of peopl e through
which they adapt to the environment . The environment for
humans involves not only the physical setting but also the
social, for they must cope with both. Emphasis upon culture
and learning as the primary method of human adaptation is
responsible for the relatedness of culture, environment, and
evolution and one aspect cannot be fully understood without
reference to the others. As a consequence, evolutionary and
ecological perspectives within anthropology have converged.
A product of that convergence has been a strong emphasis upon
the study of culture change processes, which has, in turn,
accentuated the perspective of culture as an adaptive system
(cf . Sahlins 1964; Alland 1975; Bennett 1976; Richerson 1977 ;
Hardesty 1975, 1977; Kirch 1980). This view and the
importanc e of adaptation for under s tanding cultural proc e sses

7
has been expressed succinctly by Binford (1968: 13 6) who wrote
that:
. . . Changes in cultural systems must be invest igated with regard to the adaptive o r coping si t ua tions which are presented to the huma n populations. I f we are to prof itably study process, we must be abl e to iso la t e cultural systems and study t hem in their adaptive milieu.
On e appr oach to understanding the operation of a daptation
utilizes concepts derived from systems theo ry. Rappaport
(1968 , 1969) has taken this path and viewed cultural
adaptation as a p r ocess by which a cultural system maint a ins
homeo s tasis with the environment . This concept of
homeostasis refers to a tendency toward a state of
equilibrium in terms of energy and materials exchanges with
the environment (Von Bertalanffy 1968:78), even though no
ecological or cultural situation i s ever totally stable.
Also implicit within this definition is the belief that
cultural systems have the goal of continuity or persistence
through time, a goal which, along with stability, cultural
systems seem to share with biological systems in general
CDobzhansky 1968; Odum 1969). Various means are employed in
the achievement of these goals but the central mechanism in
all adaptation is selection.
Cultural selection is a complex phenomenon and involves
both human cognition and behavior CAlland 1975). Perceptions
regarding the condition of the physical or social environment
are linked in an intricate manner with information about
alternative responses, results of past actions, human goals,
and assessment of the costs and risks involved in order to

8
produce an appr op riate response. The efficacy o f this
respon se is, in t urn , evalua t ed through various means, one of
the most i mpo rtant being the processing of fee dback.
Behavior which is p er c eived as being an effective, thus
suitable, response is retained an d emphasized, while
ineffective behavior or that which reduces adaptiveness i s
discontinued. Unfortunately for the archaeologist, the
cognitive element in this process is not directly available
for study, leaving only the physical evidence of behavioral
responses. It is behavior, however, which interacts with the
environment to bring about greater or lesser adaptivenes s and
hence behavior which is directly subject to selection.
Therefore, the study of adaptation and the crucial
relationship between culture and environment must focus upon
the behavioral responses which are observable in the
archaeological record and not upon cognition. Dependence
upon the products of behavior does not deny the importance of
cognition in adaptation or the necessity of considering
decision-making criteria likely to have been employed by a
past people. Rather, utilization of behavioral products,
artifacts, emphasizes that the actual attempts to deal with
environmental perturbations offer the greatest potential of
revealing how cultural systems adapt.
Given the large range of environmental changes with which
cultural systems must cope, it seems likely that the
expression of the adaptive process will also tend to vary in
unison. Environmental changes may be classified into three
general types: 1) cyclic, 2) unidirectional/ continuous, and
9
3) revolutio na ry (Thoday 1953: 108 -110). Th e adaptive
responses to each of these differ, reflecting the magnitude
of the change to which responses must be made . Cyclic change
involves year ly o r longer cycles of ecol ogical alterat ions
such as the seasons, or per iodic but less predictable events
such as drought or flood. These occur with sufficient
regularity so that behavio ral resp onses are integrated into
the overall adaptation. Accordingly, relatively little
modification of a culture's adaptation is required to cope
with cyclic change if the culture has occupied that
environment for a sufficent period of time to become
harmonized with the cycles.
Unidirectional / continuous change on the other hand, tends
to be long term and involves a more or less permanent
alteration in the environment such as a gradual shift in
rainfall patterns or the extinction of a plant or animal
species. Some of the best known examples of such change are
the slow succession from glacial to temperate climatic
conditions and the rise of world sea levels following the
last Ice Age. Adaptive responses to this type of change will
at first tend to be relatively minor. Initially, responses
are probably handled in the same manner as cyclic change.
Over time, however, as the environmental shift progresses,
the modifications of the culture's adaptation will become
increasingly pronounced (Kirch 1980:125). New behavioral
patterns will eventually evolve as the magnitude of the
ecological shift increases. Slow reaction to this type of

10
change is probably related to an inherent conservatism i n
cultures which tends to emphasize traditional patterns OT
behavior if possible. A significan t segment of research in
North American prehistory has been directed to the
adaptations associated wit h this type of change (cf. Cleland
1966; Braun 1974; McMillan 1976).
In contrast to cyclical and unidirectional/continuous
change, revolutionary change entails a rapid and extensive
shift in ecological conditions. Consequently, this type of
change exerts the strongest adaptive pressure and may
necessitate a major reordering of the cultural system.
Perhaps the best example of this occurs during colonization
when a group is suddenly thrust into a new and often quite
different environment from that to which they had been
previously adapted.
Each of these types of environmental change differs in
pace, scope and magnitude, and it seems likely that each will
require differing degrees of adaptive response. Clearly, the
necessity of response will be most compelling with
revolutionary change, which will probably entail extensive
modification throughout the cultural system. Revolutionary
change encompasses all of the environmental alterations
associated with cyclic and unidirectional / continuous change,
but takes place much more suddenly and on a broader scale.
In order for cultures to respond to revolutionary
environmental change, the existence of behavioral
alternatives in the cultural system is essential, especially
for a society engaged in the colonization of new lands.

11
From these behavioral alternatives new adaptive strategies
will be forged . On a frontier, potentially adaptive behavior
derives from several sources . One of the most important
sou rces, the cultural heritage of the participants, provides
a div ersity of options that were developed ove r a long perio d
in the homeland. Many of these alternatives will be
inappropria t e on t h e frontier, but some behavior which was
perhaps ma r ginal to the origina l adaptat i on and had been
retained to cope with infrequent conditions of adversity, may
p rove highly adaptive in the new environment. An additional
source of alternative responses is the heterogeneous nature
of colonial populations wh ich are usually made up of
individuals from a diversity of origins, thereby further
increasing the pool of behaviora l possibilities. New means
of adapting can also be obtained from other cultures through
borrowing and diffusion. These sources are especial ly
appropriate when obtained from indigenious peoples who are
already adapted to the environment being colonized.
Additionally, invention can be very important. New tools or
ways of behaving can be invented and frontiers have long been
regarded as loci of innovative behavior (Thompson 1973).
Selection thus acts upon this large pool of behavioral
options to create an appropriate adaptation to the
environment.
But precisely where does selection of appropriate
adaptive alternatives operat e on the individual, a
specific group of individuals or the entire population?

1 2
Individuals are frequently thought of as the focus of
selective pressure, perhaps through analogy with biological
and genetic selection. But while the individual may be the
source of innovative behavior, it is unlikely that a person
is the sole unit of selection in culture. Humans live in
groups and information is exchanged between both individuals
and groups. Major decisions regarding the adaptive strategy
of a culture are probably rarely the prerogative of a single
individual. In this study, and for most instances of
colonization, two units of adaptation and selection seem
relevant: 1) the household, and 2) the regional or ecological
population.
The household is the basic unit of human domestic
activity and, for many peoples, the primary economic unit
(Goody 1971; Blum 1982). The household is also the level at
which a great deal of decision making and experimentation
occurs (Barlett 1980). Decisions about specific responses to
a situation are often made jointly and are executed within
the context of a household. It is at the household level
that the beneficial or detrimental results of a response will
be most rapidly perceived. In colonization, the household
(not necessarily a nuclear or extended family) is the basic
social and economic unit and is directly involved in coping
with the new environmental conditions.
Human cultural systems operate within a much broader
context, however, and a larger group than the household is
essential for biological reproduction. It has been suggested
that this larger unit should be called the "ecological
1 3
population" (Kirch 1980: Ill), a group of interacting people
who are faced with the same adaptive pressures in the same
general environment, and who share adaptive information and
display similar behavioral patterns in adapting to that
environment. This term aptly describes the population engaged
in colonization within a specific region and thus has utility
in the study of frontiers. The household may be considered
the unit in which most adaptive behavior occurs and where the
adaptive pressures bear most directly. However, it is the
larger ecological population where the efficacy of an
adaptation is ultimately judged since continuance of the
group and culture, not a household, is the goal of cultural
adaptation.
The Colonization Model
The type of cultural expansion being investigated here is
the rapid, often large scale movement of peoples from settled
homelands to new territories. Such movement is usually
associated with stratified social systems and these have most
frequently been at the state level of socio- cultural
integration (Lewis 1975:32). In this study, colonization by
western European states is the general focus, specifically of
the British. There are other forms of expansion, such as the
gradual movement of peoples into new lands, which is
exemplified by the settling of the New World by the Indians.
The stimuli, pace and characteristics of this and other forms
of expansion, however, are likely to differ considerably from
the process with which this study is concerned.

14
The colonization process occurs in several varieties and
a typology of these was presented by Leyburn (1935) . He
found that each form of colonization or frontier type
displays specific, unique traits but all can still be divided
into two general categories - impermanent or permanent.
Impermanent frontiers are those created for the exploitation
of select resources, such as minerals, lumber or fur-bearing
animals, and are generally of short duration. Individuals
focus upon the exploitation of these specific resources, and
when these are depleted, they migrate elsewhere. As a
consequence, there is little emphasis upon becoming highly
adapted to the natural environment, being self- sufficient in
food production, or forming permanent social units.
Permanent frontiers, on the othe r hand, invol v e the
long term settlement of a region. Colonists s t r i ve t o b ec ome
self- sufficient. The cultural response is to develop a
stable, sustainable adaptation to the environment. While the
nature of permanent frontiers varies widely, most of the
known examples have involved agricultural or pastoral
peoples. The resource they exploit is land, either through
crop production or animal grazing. Since permanent frontiers
involve an attempt to achieve stable and long term
adaptations to the environment, they offer the most clearly
discernable opportunity for observing the adaptive process
and, therefore, will be the focus of investigation in this
dissertation.
Not only have permanent agricultural frontiers been very
common over the last several thousand years of human history,

1 5
but they have also received the greatest attention from
anthropologists. Ethnographic work on contemporary
colonization efforts in South America and elsewhere has
contributed much to our understanding of this process and
has identified specific cultural patterns which seem to be
associated with it (Cassagrande et.al. 1964; Thompson 1970;
Ekstrom 1975; Gugler 1973; Smith 1981). Out of this effort
has emerged a series of hypotheses regarding frontier
settlement which forms a model of colonization. The
characteristic features of the process and this model will
now be examined.
Colonization can be characterized as a gradual process
of cultural stabilization and social maturation.
Colonization can occur in unoccupied lands, but most
frequently the territories have been previously inhabited by
peoples at a lower level of socio-cultural integration than
the colonists (Thompson 1973:2). Thes space in which the
process occurs is referred to as the "area of colonization"
by Cassagrande et al. (1964:284) and here is called the
frontier. The culture engaged in this type of expansion is
characterized by fluidity and a rapid pace of change as the
new environment is explored, knowledge about it is
accumulated, and an adaptation emerges. It is important to
stress that the process discussed here involves the movement
of settlers who occupy the lands more or less permanently.
Colonization involves adaptation to a new natural and/or
social environment that is usually very different from that
found in the colonists' homeland. The traditional adaptation
1 6
which the colonists carry as a sort of cultural model from
their homeland, nevertheless, will have a clear and
pronounced impact upon the adaptive response they make on the
fronti e r. Tradition is a powerful force and one goal of the
colonists is the reestablishment of familiar cultural
practices to the extent possible (Thompson 1973). Thus, the
colonial culture will represent a mixture of elements, some
originating in the homeland and found to be operative on the
frontier, and new adaptations necessitated by the frontier
environment. The effort to continue basic themes from the
homeland has been addressed by Doolittle (1973:41) who wrote
that:
... th e more highly specialized the culture, the more conservative it becomes. Ideologies arise to protect and preserve these adaptations and, given an environment even remotely capable of supporting the adaptation, the culture will make a herculean effort to maintain them.
This traditionalism will be most operative for the more
conservative components of culture such as religion or legal
systems. It also seems likely that a people who previously
operated within a market economy will attempt to continue it.
Initially, however, colonists seem to abandon many of the
more complex elements of their traditional culture.
Abandonment of complexity, one of the most pronounced
features of colonization, has been called Itruralizationlt by
Cassagrande et a1. (1964) and Itcultural impoverishment lt by
Thompson (1970:198). This phenomenon refers to the loss of
the most specialized and some of the more general components
17
of the cultural system. In essence, the process works to
simplify the culture upon its entry into the frontier
environment. Thompson (1970:196) has suggested that reduced
complexity is an inevitable concomitant of all colonizing
situations, regardless of the economic base of the culture.
Reduced complexity is probably an expression of the
evolutionary principle proposed by Sahlins and Service
(1960:52) which stated that a generalized, non - specific
culture is more "highly efficient in dealing with extensive,
relatively open environments." Sahlins and Service precisely
describe the environmental situation confronting colonists.
Vitally linked to the cultural impoverishment phenomenom
and central to the model is the concept of the colonization
gradient (Cassagrande et ale 1964; Thompson 1973). This
concept has both spatial and temporal aspects and encompasses
one of the most distinctive features of colonization -- the
rapid tempo of change and marked fluidity in frontier
settlement, social structure, and economics. In spatial
terms, a greater degree of cultural simplification, change
and flexibility is witnessed as the distance from the
homeland increases. Conversely, the nearer the homeland, the
more stable and complex will the culture tend to be.
Distance in this situation may refer more to the degree of
access than to actual spatial separation. A distant frontier
with excellent transportation links to the homeland may be
culturally more complex than a region which is physically
closer but which has poorly developed systems of
communication and transportation.

1 8
The temporal aspect of the colonization gradient is
particularily significant and refers to a sequence of
cultural development that corresponds directly to the
duration of permanent colonial settlement. As the duration
of occupation in a specific area lengthens, the cultural
system becomes increasingly complex and displays greater
stability and social maturity. This notion of directional,
regularized change by immigrant peoples on frontiers is at
the core of the colonization model.
The gradient concept and cultural impoverishment are
predicted to be visible in many different aspects of a
society engaged in colonization, one of which is the
settlement pattern. As Thompson (1973:11) observed:
Most frontiers in the past and in the contemporary world have been characterized by relatively large- scale extensive agriculture on tracts substantially larger than those of the "settled area" or homeland.
The abundance of land results in a distinctive pattern of
settlement that is typically highly dispersed unless
restrained by a hostile social environment. The pattern is
comprised of four settlement types which vary in size,
complexity, function, and distribution (Cassagrande et al:
1964;312- 314). These are: dispersed settlements, semi-
nucleated villages, nucleated villages and frontier towns.
Dispersed settlements are the most common and consist of
isolated households or plantations. Less frequent, but
larger in size, are the semi - nucleated villages which are
loose assemblages of houses with no governmental functions
and only limited services. Still larger in size but fewer in

19
number are the nucleated villages which occur most commonly
along major transportation routes. Clusters of houses and
possibly a few public buildings with an organized government,
and the capability to provide a number of commercial, social
and medical services characterize nucleated villages.
Finally, the largest in size but least common settlement
within the area of colonization is the frontier town. The
frontier town is the major supply and communications link
with the outside world and the focus of most economic,
political, social and religious activities. The frontier
town also serves as the "jumping off" point for new colonists
entering the area.
What is distinctive about frontier settlement and
reflects the colonization gradient concept is the
distribution of settlement types. The frontier town is only
found in the longest settled portion of the frontier.
Nucleated villages are most common in the longest settled
areas but a few may be found in the more newly inhabited
regions and are primarily located along the main
transportation routes with the best access to the more
settled areas. Dispersed settlements and semi-nucleated
villages are found throughout the frontier but they are the
only settlements in he more recently occupied sections.
Basically, the simplest form of community is found at the
edge of colonization and the more complex settlement types
occur in the longest settled areas. These settlement types
can also be seen as graded stages in the process of
settlement system development. Through such a process, the

20
cultural geography of the frontier region may eventually
reach a level of complexity and integration' equal to that of
the homeland. The same developmental sequence can also apply
to an individual community because a dispersed settlement
can, if favorably located, grow into a nucleated village and
perhaps even a frontier town.
Social structure in a colonizing culture should also
reflect the key elements of the model. During the early
stages of settlement, the structure of the society is very
flexible and poorly integrated (Thompson 1970, 1973; Williams
1977). This combination of flexibility and poor integration
is partially due to the small proportion of permanent social
units and the mix of settlers from many different portions of
the homeland. Both often act to reduce kinship as an
integrating and stabilizing force. In some instances,
kinship can also serve as a means by which immigrants are
recruited in the Homeland, but in general, frontier
populations are composed of mostly unrelated people. This
mixture of settlers results in a clash of contrasting
behavioral patterns and value systems which contributes to a
high frequency of conflict and factionalism on frontiers
(Williams 1977:259; Thompson 1973). Initially, interpersonal
relations and the formation of permanent social bonds are
hindered by other factors: an influx of new settlers,
geographic mobility of individuals and a high death rate
often found on frontiers that is responsible for a rapid
turnover in personnel. The dispersed nature of early
settlement serves to limit social interaction. The result of

21
all of these factors working during the early phases of
colonization should be a social structure that is weakly
developed and poorly organized. Over time, as the mortality
rate declines, settlements become more numerous and more
closely spaced, and a greater number of family units are
formed, the colonial social structure is expected to become
more stable, b e tter integrated, and more complex.
The amount of opportunity available to colonists also has
a tremendous impact upon the nature of the colonization
process. Abundant opportunity is integral to colonization
and is probably the major stimulus for immigration to
frontier areas (Billington 1967). Such opportunity is the
product of the rich untapped resources, especially land,
which are perceived to be available for exploitation.
Economic, soci a l, and political advancement which is unlikely
in the colonists' homeland, becomes possible. As a
consequence of this more ready access to resources when
compared to the homeland, there is a high potential for
upward social mobility during the earlier phases of
settlement and hence, social stratification is weakly
developed. Such fluidity in social position further
contributes to the flexible nature of colonial society.
As the available lands are occupied and other resources
exploited, however, both opportunity and the potential for
upward social mobility should decline (Williams 1977:265).
The colonial social structure is predicted to become
increasingly complex and there should be greater rigidity in
22
status positions though time.
Another characteristic of colonization is a critical
shortage of labor, especially during the earlier phases of
settlement. Given the generally small size of the original
colonizing population and the immense amount of effort in
land clearance, construction and other labor intensive tasks
needed to establish a new society, a shortage of personnel is
inevitable. In some cases the problem has been solved by
enslaving native peoples. Generally, though, population
growth is necessary to eventually overcome the problem. The
effect of the labor shortage on a frontier is to
significantly raise labor costs above that paid in the
homeland. This situation provides a better economic
opportunity for laborers but means that other costs are also
higher. One consequence is that labor-saving expedients are
frequently necessary on frontiers. Another consequence is
the emphasis upon large families or multi-family households,
especially on frontiers engaged in market agricultural
production (Thompson 1970:199-201).
A poorly developed transportation system is
characteristic of most frontiers. This, along with a
dispersed settlement pattern, creates pronounced limitations
upon social interaction. Even more significant for the
market-oriented colonist, however, is the fact that an
inadequate transportation system serves to restrict access to
markets, thereby limiting the crops or other products which
can be effectively sold. Simultaneously, the variety of
manufactured goods which is available is reduced while the

23
cost of those goods is increased (cf. Miller and Hurry 1983).
Frontier demography is quite distinctive. Normally, a
small number of people initially engages in colonization and
the population density is very low when compared to the
homeland's population density (Hart 1974; Thompson 1973).
The population displays a quite unbalanced sex ratio and a
heavily skewed age structure. Males greatly predominate
and young adults form a majority of the population (Lefferts
1977). Children and the aged often comprise a small portion
of the population during the initial phases of settlement.
The emigration of families to frontiers also occurs but in
most cases, young single individuals make up a major portion
of the population. High mortality rates are usually
associated with frontiers because of the colonists exposure
to new disease environments (cf. Curtin 1968; Smith 1981).
A often high death rate and the unbalanced sex ratio combine
to hinder the formation of families.
As a result, the population growth rate is initially
very low and is usually dependent more upon immigration than
natural increase to sustain the population. Only after a
period of time do the colonists physiologically adapt to the
disease vectors in the new environment, achieve a balanced
sex-ratio and form families. Population then increases
through reproduction rather than immigration. Fertility
rates usually begin to rise with the first generation of
settlers, and often will peak with the second generation
(Lefferts 1977:50). After the initial period of low

24
reproductive increase, frontier populations tend to display
rapid growth rates through natural increase.
Other important features of colonization to be addressed
are the length of the process and the point at which it can
be considered finished. The duration of the process is
obviously highly variable and it will depend upon a number of
factors including the degree of ecological difference between
the homeland and the colony and the pace of immigration.
Thompson (1973:11) stated that the process can continue for a
generation or more but provided no criteria by which to
measure its progress. As perceived here, colonization is
never a very short term phenomenon and the complexity of the
task of developing a stable adaptation will generally require
a time frame on the order of decades rather than years to
achieve.
The beginning of colonization is relatively easy to
establish for it is initiated by the first movement of
explorers and settlers into a region. Defining the
termination of the process is a more formidable task,
however, because the problem is essentially deciding when a
cultural system is stable and has achieved a successful
adaptation to a new environment. Although it is extremely
difficult to devise direct measures of this, the colonization
model suggests several features which should indirectly
signify completion of the process.
One characteristic of successful colonization is the
demographic composition of the colonial population. The
expected pattern on frontiers is for unbalanced age and sex

25
ratios, a low initial rate of reproduction and, often, a high
mortality rate. Therefore, the achievement of a more normal
age and sex distribution in the population can be seen as one
significant and necessary step in the development of a
stable, mature society. Population growth through natural
increase rather than immigration, and the establishment of a
native - born majority can also be considered crucial
indicators of a colony's demographic maturity. The
achievement of these features would seem to demonstrate that
a viable adaptation to the environment has been made since
reproductive success is one of the best indicators of
positive adaptiveness in a population (Kirch 198:121).
In cultural terms, the ending of colonizaton may be
indicated by the appearance of a similar and consistent
pattern of adaptation throughout the area of colonizaton as
well as by signs of increased cultural complexity. From the
diversity of potential behavior available at the beginning of
colonization, it is assumed that certain elements will be
better suited to the new environmental conditions than
others. Since successful cultural adaptation can be defined
as the creation and maintenance of a state of stability or
homeostasis, this would entail limiting the range of
behavioral alternatives through selection to those which are
most suited to the achievement of that goal. Because of this,
colonization should result in the creation of an adaptation
which is eventually shared by the colonists within the
environmental setting.

26
The colonization process is, in summary, a
distinctive cultural phenomenon which displays a number
of characteristic features. The most important are:
A. Initially 1. unbalanc e d demographic structure 2. shortage of labor 3. abundant opportunity for participants 4. flexible social structure 5. cultural impoverishment
B. Through Time 6. directional change toward greater
stability and adaptiveness 7. high rate of population growth 8. increased rigidity of social structure 9. increased cultural complexity .
All of these are essential elements which together comprise
the colonization model, but cultural impoverishment and
directional change are two of the most important features of
the cultural process. No t only does the model enable
prediction of a distinctive combination of attributes which
should characterize colonial cultural systems, but the model
also predicts that the changes should occur in a regular,
directional manner. To reiterate, this trend of change
should be from fluid, impermanent, "primitive" conditions
toward greater stability, permanence, and complexity. The
precise expression of the colonization process is likely to
vary from frontier to frontier because each situation offers
a unique set of environmental, economic and cultural factors.
The general characteristics and patterns of change of any
culture engaged in this process nevertheless should be
similar.

2 7
Th e model and available ethonographic data sugges t th a t
the changes associated with colonization will be broad in
scope and pervasive throughout the cultural system, with few
components escaping some degree of modification. As early as
1935, Leyburn suggested that the changes in the subsistence
and economic aspects of frontier culture would be the most
pronounced. He summarized thi s view with the glib comment
that "Man's most sensitive nerves seem to run to his stomach
and to his pocketbook" (Leyburn 1935:235). The same
conclusion was drawn by Lewis (1975) who offered an
explanation as to why the economic aspect would be most
profoundly affected:
This is a consequence of placing a population into an environment so different from that in which it had formerly existed that the normal environmental inputs and outputs from the socio-cultural system are severed. This necessitates the immediate restructuring and simplification of those subsystems which are most closely related to the environmental component (Lewis 1975:57).
Both Leyburn and Lewis recognized the fact, also emphasized
by Steward (1955) and White (1959), that culture is organized
in a hierarchical manner based upon how closely a component
interacts with the environment. Marvin Harris (1979)
explained this hierarchical organization of culture with his
"principle of infrastructural determinism" that states that
the major sourc e of change in cultural systems lies in those
components which interact with the environment. This
relationship e xists because the procurement of energy to

28
sustain life is the most important transaction which occurs
between humans and the environment. For a colony to survive,
it is essential that a rapid and effective adaptation be
achieved to provide this energy ration. Most colonies
initially subsist on foodstuffs from the homeland but these
are always limited and the procurement of locally available
foods is crucial. Lewis (1975:41) emphasized this and argued
that of all the components in a colonial cultural system,
probably none is more profoundly altered than subsistence.
Subsistence is therefore one of the more crucial elements in
frontier settlement, and it should clearly reflect the
characteristics of the colonization process. Subsistence is
also one of the more visible elements of past cultural
systems in the archaeological record. For these reasons,
subsistence is an appropriate subject with which to test the
proposed colonization model.
Subsistence And The Frontier
Subsistence occupies a crucial position in the
articulation between the cultural system and the natural
environment. The term "subsistence" refers to the means of
obtaining the necessities of life: food, clothing, and
shelter. Normally food is the most critical element of the
three and it is this investigation's central concern.
Several schemes of classification have been proposed for the
numerous approaches to meeting subsistence needs (Lowie 1938;
Forde 1949; Murdock 1962). Although each classification
differs slightly, each makes five similar divisions of

29
subsistence into gathering, hunting, fishing, animal
husbandry, and agriculture. Although there is some advantage
to this approach from a general perspective, it is seriously
flawed for the study of specific subsistence systems because
few adaptations exclusively utilize one of these types.
Adaptations instead generally rely upon a mixture of
subsistence sources. Presumably subsistence during
colonization will display such a mixture.
The various forms of human subsistence nevertheless do
seem to share many features in common and can be investigated
using similar assumptions and concepts. One important
asssumption is that subsistence will be a patterned
phenomenon because of the close association between ecology
and the adaptive stance of a cultural system. As Cleland
(1976:60) has noted, "Cultural adaptations are patterned and
predictable because nature is patterned and predictable."
As natural resources are available in a patterned form,
subsistence varies in a repetitive, seasonal manner over the
course of a year. This can be termed the subsistence cycle
which is the annual sequence of food procurement strategies
employed by a culture to meet the subsistence requirements.
All subsistence systems can be viewed in terms of the
"adaptive strategies" they employ. Adaptive strategies are
the choices in labor investment and resource utilization made
by a culture to satisfy its subsistence needs. This sequence
of choices as to which resources will be exploited serves to
structure individual subsistence patterns:

30
~hoices of usable resources, decisions as to their proportional use and time of utilization, and the demographic and spatial arrangements chosen in order to accomplish the exploitation, all allot human time and energy and are visualized as structuring the subsistence and settlement patterns of a human group" (Jochim 1976:4)
Every culture must select which foods to consume and because
of the complexity of factors involved in the decision making
process, Jochim (1976:12) has labeled the selection of the
appropriate resource-use schedule one of the major problems
to be resolved in adaptation. While the specific strategy
chosen will depend upon the particular circumstances, it is
assumed that there are general, underlying approaches and
criteria employed by humans in making these decisions. Some
authors (Clarke 1968; Jochim 1976) found that adaptive
strategies can be profitably viewed as either maximizing or
satisfying. Maximizing strategies attempt to achieve returns
to the greatest extent possible and thus offer very high
returns but at the cost of a much greater risk of failure.
Due to the risk level and danger of totally depleting
resources with this approach, non - market cultural systems
probably rarely follow purely maximizing strategies. Even
market oriented economies, which may maximize in the
production of specific goods intended for exchange, will
probably operate other elements of the subsistence system
with a non-maximizing strategy due to the problems of labor
and materials allocation.
31
A satisfying strategy, on the other hand, does not
attempt to get the maximum return; it attempts to achieve an
adequate return that will merely meet the subsistence
requirements (Simon 1957). Although the payoffs are usually
much lower than with maximizing strategies, this approach is
safer since the risk factors are kept to a minimum. Clarke
(1968:95) wrote that "It is highly probable that the
procedure in most or all of the cultural sub-systems, in many
different sorts of society, may equally operate on satisficer
strategies." Acceptance of Clarke's statement therefore
provides some general guidelines for considering adaptive
strategies.
Selection of a specific procurement s~rategy, however,
is based upon a number of criteria, one of the most important
of which is cost (Earle 1980). Cost refers to the materials,
energy and time expenditure necessary to obtain a unit of the
resource, whether the unit is a deer, a fish or a basket of
corn, and is thus closely related to efficiency. Costs can
be divided into five major components: 1) technology,
2) transportation, 3) production, 4) processing, and
5) storage. Technological costs include the equipment
necessary to procure a given food and the time required to
maintain and repair this equipent. Such equipment might
include a bow and arrows, baskets, a fishing boat, musket,
oxen or a tractor. Transportation costs include the time and
expense required to travel to the location of a given
resource for exploitation. The effort necessary to produce
or obtain a particular food is also a very significant cost.

32
Encompass ed within the c at e gory of product i on co s t s is t h e
labor r e quired in agricultural production, the time and
effort needed to dig roots or the time necessary to stalk
game. Processin g involv es t he time and effort r equired to
pr e pare the food for consumption; this may be the butchery of
game or livestock, efforts necessary to grind grain into
flour or the cooking of food. S t orage c osts include not only
the time needed to prepare food for storage, but also the
labor and expense involved in building and maintaining
storage facilities such a s a corn crib. The investments
necessary to meet the food requirements of a group wil l v ar y
widely depending upon the culture, available technology,
population size and the characteristics of the resources
being exploited.
Cos t vary according to the nature of the food resources
and one especially important distinction is between wild and
domestic food resources. Wild resources, especially on land,
are limited in quantity and hence, subsistence efforts can
only extract a finite amount of a particular plant or animal
resource before that resource becomes depleted. There are
some means available to increase the productivity of certain
species, such as burning to create a more productive habitat
or to concentrate scattered resources, but this merely raises
harvestable quantities of that resource slightly without
overcoming the limits on productivity. Relevant attributes
of wild resources include their abundance, distribution,
mobility, size and fat content (Jochim 1976:23). Domesti c
plants and animals, in contrast, are controlled by human
3 3
efforts. Domesticated resources generally provid e highe r
yields per unit of land and offer greater potential for the
expansion of production. The major advantage of agriculture
is that more calories can be obtained per unit of land per
unit of time than with wild resources (Jochim 1976:23).
Relevant attributes in considering domestic resources include
their productivity, dependability, storability, labor
requirements during growth and harvesting.
Initially in the colonization process, the cost of
exploiting wild resources may be very low. The plants or
animals will be abundant and many species will be more or
less evenly distributed over the area, allowing of course for
ecological variability in resource distribution. As
exploitation significantly increases, however, the
distribution of particular resources will become highly
uneven and abundance will decline. With a decrease in
resource density, there is a corresponding increase in the
transportation and procurement costs of those wild food
resources. At that point the "law of diminishing returns"
becomes operative. Costs will increase as the output or
yield approaches the limit of resource availability. A
hunter for example, has to travel further and spend greater
time and effort in capturing an increasingly scarce animal.
The costs also rise with expanded agricultural production,
but they do so at a slower rate and the maximum potential
production level is much higher than for natural resources
(Earle 1980:20).

34
Most studi es o f hum an s ub s i st enc e have s ee n cost as one
of the primary factors in th e r e source select i on process. A
widely applied theoretical position using this is the conc e pt
of optimal foraging strategy (Jochim 1976, 1979; Osborn 1977;
Earle 1980), which assumes that cultur e s operate on the
principle of cost minimization. A group will attempt to keep
labor and other cost s to a minimum while a chiev i ng the
highest possible yields. Although this concept has been
most frequently used with hunte r-gatherer economies, i t ha s
also been applied to ag r icultu r ali s ts (Green 1980) , and t he
idea of cost minimization, although not optimization, wa s
important in Boserup's (1965) study of the evolution of
Western European agriculture.
Unfortunately, the optimal for ag in g theory makes some
assumptions of questionable val i dity. The theory requires
that people assess the input - to - yield ratio for each resource
before selection, and that people see cost as the prime
factor used in decision making. This theory assumes, perhaps
wrongly, that rationality is the basis for selection. Even
more detrimental to the theory's validity is the necessary
assumption that individuals possess a full range of knowledge
regarding the local environment and the resources to make the
"optimal" decisions. These assumptions are often of
questionable validity, especially on frontiers where the
level of ecological knowledge is very low. Jochim (1976:5)
believes that decisions are made within the context of
"partial uncertainty". Reidhead (1980:178) supports this
view and suggests that the most acceptable position is that

35
hum a n s attemp t t o mak e rati on a l d ec i s ions bu t are n ormally
ignorant of the total situation. Another fact which seems to
furth e r compromise the concept is that resou r c e s may tak e on
a prestige value, thereby making costs of secondary
importanc e . Also, during seasonal periods wh e n resourc e
availability is low and access is restricted , su c h as winter
in tempera t e climates, greater efforts ma y be required t o
obtain sca r ce foods with less consideration given to co s t s.
Thus, a n umb er of probl e ms a re associ a ted with op t imal
foragin g strate gy. In sp i te of these problems , i t remai ns
likely that the concept of cost is valid in re s ou r ce
selection, especially in situations where labor is limited.
Costs, therefore, must be employed as a relevant criterion in
the evaluation of subsist e nce strategies.
Pe rhaps the major problem in dealing with the costs of
human subsistence strategies is the difficulty of
measurement. Necessary estimates of criteria such as
resource abundance, distribution, procurement eff i cienc y and
processing efficiency are extremely difficult to obtain .
Some reliable data may be derived through the investigation
of living peoples. For example, Rappaport (1968) estimat e d
energy costs by timing activities and then estimating the
energy expended in accomplishing each task. For the
archaeologist, however, no such precise measure of costs is
possible. The approach most widely applied in archaeology
has been to employ ethnog r aphic analogy and the results of
experimentation to rank various subsistence strateg i es In
order by approximate cost (cf. Limp and Reidhead 1979;

36
Reidhead 1980; Earle 1980).
One of the most prominent of factors in resource
selection, other than cost, is the risk associated with a
particular strategy (Cancian 1972; Cleland 1976; Bartlett
1980). The fact that a resource has a high potential for
failure, even though it is extremely productive, can serve to
restrict or eliminate its use. At the same time, a resource
that offers low yields at a high cost, but which is extremely
reliable, may occupy a prominent position in the subsistence
cycle. Security is very significant in the development of an
adaptive strategy becaus e stability and continuity are key
goals of adaptation.
Cultural criteria also playa significant role in
determining which resources are exploited. Among these are
the food preferences and concepts of taste displayed by a
group which may exclude certain foods from consideration.
Ideology may require the consumption of specific foods at
specific times of the year or may forbid the eating of
particular plants or animals. Humans also seem to desire
variety in diet and this may entail the use of costly
resources to quench this appetite for diversity. In
stratified societies, access to food resources or the
technology to exploit them, may be restricted to individuals
at a particular status or wealth level. Some foods may take
on prestige connotations. Each of these potential factors
can be extremely important in the decision making process,
and along with cost and risk, must be considered when
37
evaluating adaptive strategies.
As previously discussed, the scheduling of resource
usage is central in the development of an adaptive strategy
and timing factors can be of major significance in the
selection process. When two or more resources become
available at approximately the same time, a decision must be
made concerning the allocation of labor and materials. Of
particular importance in this decision is the demographic
composition of the subsistence group. Specifically, the
ratio of producers to consumers can have a marked effect upon
resource exploitation. If there are many non-producers such
as young children, the sick or the aged, there will be
limited flexibility in subsistence since additional emphasis
must be placed upon obtaining the necessary food requirements
with a limited labor supply. If, however, there is a high
ratio of producers to non-producers, economic roles can be
more diversified and greater flexibility is potentially
available in resource scheduling (Green 1980:210).
While it is extremely important that the criteria used
in resource selection are clearly defined, it is equally
essential that quantifiable means be found to evaluate the
structure of adaptive strategies. One such means is provided
by Hardesty (1975, 1979) who employed the concept of niche.
He defined a niche as "the distinctive ways of using
resources for subsistence that set cultural species apart"
Hardesty (1975:7). The niche concept is valued for its
measurement of two important variables -- how many resources
are actually exploited, and how much each of these resources

38
contributes to the total diet. Both meas ur a ble fac tors can
be used to distinguish b etween adaptations. Resourc e
diversity or richness refers to the number of different foods
which are integrated into the diet, while "niche width" is
the measure of the proportions in which these resources are
utilized. Niche width therefore constitutes an index of
evenness in a subsistence pattern. By utilizing both of
these measures and combining them with data regarding the
scheduling of resources during a yearly cycle, different
adaptive strategies may be compared with some degree of
precision.
The focal - diffuse concept (Cleland 1966, 1976) makes
good use of niche width measures in subsistence evaluation.
This concept views total subsistence systems in an adaptive
framework and places adaptive strategies along a continuum
ranging from highly specialized to highly generalized.
Because this approach emphasizes the total subsistence
pattern, a complete annual cycle of subsistence activities is
the analytical unit to which the concept is applied. Focal
adaptations are specialized and based upon the intensive
exploitation of one or a few resources. Diffuse adaptations,
on the other hand, are based upon the utilization of a wide
variety of food sources in a regular, scheduled manner. As
Cleland (1976:61) pointed out, few adaptations are totally
focal or diffuse, but most tend to cluster toward either end
of the continuum. Focal adaptations concentrate upon a few
resources that have a high degree of reliability and
productivity. Risk of total subsistence failure is reduced

39
by in te n s if ie d usag e of th e mo st de p e nd a b le p l a nt s a n d
animals wi th proven procureme n t strat egi e s . Cha racteris t ic
of focal adaptations is a tend e ncy for cons e rvatism and slow
change (Cl e land 1976:63). The major adv a nt a g e of this type
of economy is a stable cultural system, but conversely, the
major disadvantage is its r ig idity. Ch a ng e occurs only under
abnormal conditions. Th e cha nge i s difficult to accompl i sh
and frequently results in ma jor a daptiv e reorganizaton.
Diffuse adaptations can be c haracterized as flexible.
Since they represent a n att e mp t to utilize a wide divers i ty
of resources without dependenc e upon anyone, diffuse
adaptations can occur only in areas of ecological diversity
(Cleland 1976). Many alternatives are available; no single
resource n ee d be relied upon solely and new resou r ces can be
easily incorporated into the annual subsistence cycle. A
diffuse strategy is based upon the exploitation of resources
in a regular, carefully scheduled manner. Risk is minimized
by maintaining sufficient alternatives so that compensation
can be made for the unpredicted loss of one or more food
sources.
By employing the measures of resource diversity and
niche width, it is possible to calculate the relative
positions of adaptive strategies along the focal - diffuse
continuum. Focal adaptations would be indicated by low
resource diversity and a high evenness index since only a few
food sources comprise the diet. Diffuse adaptations should
display high resource diversity but only low levels of
dependence upon any specific resource.

40
Cleland (1976:66) believes that the long term
evolutionary tendency is for focal adaptations to gradually
develop from the diffuse type. This shift is due to
selection over time of adaptive elements that are more
productive, dependable and efficient. In situations of
dramatic environmental change, however, focal economies may
undergo extensive alteration and become more diffuse. The
reason for this alteration is believed to lie in the flexible
nature of the diffuse adaptation, its ability to combine new
elements easily and its lower risk potential because of its
wider variety of subsistence alternatives. Christenson
(1980) supports Cleland's predictions and adds changing costs
as a critical element in the emergence of focal economies.
The causes of change in human subsistence systems derive
from many sources but the three principal ones seem to be 1)
environmental, 2) technological/social, and 3) demographic.
Changes in the environment can result from either natural or
human induced causes. Natural changes could be climatic
shift, the elimination of a species through extinction or
variation in sea level. As previously discussed,
environmental changes can take three basic forms - cyclical,
unidirectional/continious and revolutionary - and the
adaptive response to each will depend upon the specific
circumstances. Cyclical change is a problem faced by all
cultures. Its most common expression is seasonal variation
in resources. Coping with these seasonal changes to ensure a
constant food input is a major problem in creating a viable
adaptive strategy. The specific procurement strategies

41
employed to deal with cyclic change depend upon the nature of
the environment, available resources and the procurement and
storage capabilities of the culture.
Unidirectional/continuous and revolutionary change will
also have varying impacts upon the subsistence pattern of a
group. If the changes reduce plant and animal diversity, a
likely occurrence in a situation such as the onset of arid
conditions, the cultural response could be a greater emphasis
upon the most dependable resources and a move toward a focal
economy. Alternatively, if the climatic change produces an
increased variety of resources, the response could be toward
a more diffuse adaptation. It must be strongly emphasized
that the response depends upon the specific changes taking
place in a specific situation. The assumption is warranted,
however, that these responses will be in conformance with the
goals of cultural stability, risk reduction and cost
minimization.
Human induced environmental changes include the
overexploitation and possible extinction of particular
species or habitats, and radical transformation of a habitat
through land clearance or the use of fire (cf. Pyne 1982).
Overexploitation normally results in reduced resource variety
and can necessitate the development of a more focal economy
or a shift in the usage of resources. Land clearance or fire
alteration of the landscape, in contrast, may act to increase
the variety of plant and animal species through creation of
less mature ecological situations (Odum 1969). The potential
for increased dietary diversity is thus created if the

4 2
conditions are appropriate for a shift to a more diffuse
adaptation.
Technological and social changes can be important in
subsistence alteration. New techniques or tools can lower
the procurement costs of resources so that they can be more
widely exploited, or make previously untapped resources
available. Social changes may also necessitate shift s in
adaptive strategy. For example, a breakdown in social
cohesion due to political factors may prohibit communal
hunting activities or a shift in settlement location due to
warfare or other causes can allow or restrict the
exploitation of specific food resources (cf. Johnson 1977).
Changes in human demography will also have a significant
impact upon the subsistence strategy because of alteration of
the group's food requirements. An increase or decrease in
population size simultaneously raises or lowers the quantity
of foods necessary to maintain the group. Since a general
trend throughout much of human history has been population
increase, the subject of population growth has received the
greatest scholarly attention (cf. Boserup 1965; Binford 1968;
Cohen 1977). Christenson (1980) has developed a model of
subsistence change specifically for situations where
population increase is the principal causal factor. He
assumed that during the process of adapting to growth, the
culture will follow a least - costs approach. The model begins
with a small population reliant upon wild food sources. In
such a situation, Christenson (1980:36- 37) predicted that the
diet will be concentrated upon a few low - cost, highly

4 3
dependable resources. As growth occurs, two responses are
thought to be initiated : 1) the intensified use of the
resources already being exploited, and 2) the addition of
previously unused resources to the subsistence cycle. The
result of this is an increase in resource diversity and a
broadening of niche width. Costs of procurement rise,
however, because the more intensively a natural resource is
utilized, the higher the costs due to diminishing returns
(Earle 1980). With continued growth, Christenson predicted
that agriculture will eventually be adopted because
agricultural output can be more easily expanded than can the
output of naturally occurring resources. Wild food usage
will continue but eventually, as overexploitation of the wild
resources occurs and their procurement costs become
prohibitive, the predominant food sources for the group will
be agricultural. Accordingly, resource diversity declines
and there is a major reduction in niche width. In essence,
Christenson employed cost criteria to predict a shift from a
very focal economy to a more diffuse one which, in turn,
evolves into another focal economy but which is based upon
completely different resources from the original adaptation.
Christenson's evolutionary sequence is very similar to that
proposed by Cleland (1976).
Boserup (1965) provided one of the first models for
strictly agricultural populations undergoing growth. She
postulated that the changes in agricultural practices from
extensive, swidden type methods to intensive, multi - cropping
of land was related to the increased demand for food stemming
44
from a growing population. For agriculturalists, she
uses three major costs - land, capital, and labor. The
capital required for production in non-market economies is
normally small and land is generally less expensive than
labor (Green 1980:214; Clark 1967). Typically, a similar
situation occurs on frontiers. If the least cost strategy is
used, and this seems likely, then only the minimal required
amount of the most expensive variable (labor) will be
applied, while the use of the least expensive variable (land)
will be emphasized. For societies engaged in colonization,
Boserup's findings imply that the first stages of
agricultural production will be extensive, possibly of the
swidden type (also see Green 1980). However, as the density
of the population increases, the cost factors reverse and
land becomes an increasingly expensive input since it is no
longer readily available. As the population continues to
rise and more intensive agricultural methods are adopted to
meet the rising food requirements, the output per man-hour of
labor declines, but the output from a unit of land rises.
Consequently, in situations of population growth where new
lands are unavailable to expand production, the predicted
response will be an intensification of subsistence practices
with a focus upon a few highly productive resourceS, in
short, a more focal adaptation (Boserup 1965:25-30). The
fact that frontiers are the scenes of often explosive
population growth suggests that colonization may offer a
particularily valuable opportunity in which to investigate
the adaptive responses to rapid population increase.

45
Colonization and Subsistence Patterns
The preceding discussion of human subsistence systems
has revealed something of their complexity and has defined
several of the criteria involved in the development and
modification of adaptive strategies. While many
characteristics of subsistence systems are dependent upon the
specific culture and the particular environment to which an
adaptation is made, there also seem to be general
similarities between cultures in the manner of resource
selection, responses to specific types of change and the
evolution of subsistence systems over time. The implications
of these characteristics are essential to the understanding
frontier subsistence.
As previously emphasized, colonization is a very dynamic
process with multiple factors stimulating culture change.
Indeed, colonists are almost simultaneously faced with two
major causes of change in human subsistence changes in
environment and demography -- and colonization is thus one of
the most complex adaptive situations known. They must cope
with a new natural environment, a changed social environment,
a shift in demographic structure and subsequent relatively
rapid population growth. At the same time, the natural
environment is altered by the colonists' attempts to adapt
to it.
The task of adapting to this new setting is further
complicated by the colonists' initial lack of knowledge
regarding the ecology or the available resources. They
poorly comprehend the types, quantities, distributions or

4 6
seasonal characteristics of food sources, and risk as s essment
is unreliable because of limited data regarding cyclic change
in the environment. The absence of ecological knowledge
significantly hampers the decision making process which is so
essential in the development of a viable adaptive strategy.
Given these limitations to knowledge, and the necessity of
the colonists to establish a stable and secure adaptation,
the insights of Cleland (1976) regarding focal and diffuse
subsistence strategies are particularily relevant. These
insights enable the prediction that a diffuse strategy will
be the most appropriate on a newly settled frontier since
this type of adaptation offers the greatest security in the
face of limited knowledge.
Adaptation to the new physical environment may be most
immediate and pronounced source of change during
colonization, but demographic factors, especially population
growth, cannot be discounted. Immigration produces most of
the initial growth, but as the colony matures, reproduction
begins to contribute the major portion of the new
individuals. Growth of frontier populations can be explosive
in comparison to that found in more stable cultural
situations, with a doubling or tripling of the population
within a few decades or less. Large numbers of colonists may
be settled with little difficulty during the earlier phases
of colonization due to the labor shortage and the abundance
of resources and unoccupied land. As the lands become
occupied and population density increases, however, increased
demands upon the subsistence system are inevitable. It seems
47
unlikely that the colonists' original adaptive strategy will
remain appropriate for a population three or four times its
original size. Such pressure on resources may only
gradually occur and it may not even become significant until
the colonization process is terminating, but it seems certain
that a modification of the original adaptive strategy will
eventually become necessary. Wild food resource usage is a
particularily sensitive indicator of population pressure
since these resources could not withstand intensive usage
without a real danger of overexploitation.
Rapid growth in population is accompanied by a gradual
change in demographic structure. The majority of t he
individuals on newly settled frontiers are young adults, most
of whom are male; consequently, there are f ew d ependents and
the producer-to-consumer ratio is very high. This rat io
allows greater differentiation in economic rol e s which, in
turn, provides the potential for much flexibility in resource
use. Such flexibility is important because it increases the
likelihood that a diffuse strategy, involving the scheduled
use of many different resources, can be adapted. Through
time, however, it is expected that age and sex structures
comparable to the colonists' homeland will be established
through reproduction and aging of the population, and this
should act to significantly lower the producer-to- consumer
ratio. Thus, at the same time that population growth
increases the food requirements of the group, the shrinking
percentage of producers within the total population reduces
the potential flexibility in the resource use schedule.

48
These conditions make th e t h e or e tical wo r k of Bos e rup (1965)
and Christ e n s on (1980) regarding subsi stence response to
population growth especially relevant in the study of
frontier subsistence change. Both predict that there wi l l be
an intensification of subsistence activities with a gradual
emphasis upon specific dependabl e , highly product i ve
resource s , in other words, a n evolution toward a more focal
economy .
Frontier subsistence can be assumed to generally follow
a satisfier strategy and employ the least-cost principle a s
one criterion in the selection of resources. The usage of a
satisfier strategy and the least-cost principle is applicable
to the labor deprived frontier setting. A labor shortage
should both limit the amoun t of effort which can be
reasonably directed toward any specific activity and should
put a premium upon the labor available. Colonies engaged in
market production may employ a maximizing strategy with the
resources intended for exchange. Because of the labor
shortage, however, it is unlikely that maximizing strategies
would be employed for subsistence resources. Indeed, an
emphasis upon a "cash crop" would tend to reduce the labor
available to exploit other necessary, but non - market
resources, thereby making the satisfier and least - cost
assumptions for subsistence even more likely on market-
oriented than non - market oriented frontiers. Further
increasing the likelyhood of this is the poorly developed
transportation system on frontiers which limits the range of
potential goods that can be shipped to a market. Often, a

49
limited transportation network acts to select a small number
of products for market which are easily transportable and non -
perishable. Because of the perishability problem, many goods
are simply inappropriate as market commodities on frontiers.
As local market systems slowly develop within the area of
colonization, some of these products may acquire an exchange
value, especially those which can serve as a source of food
for newly arrived colonists.
Hypotheses about Frontier Subsistence
As previously noted, the process of colonization is
expected to have a significant impact upon most components of
the cultural system, particularily subsistence. By combining
the characteristics predicted in the colonization model with
the information regarding human adaptive strategies discussed
above, it is possible to formulate specific hypotheses
regarding frontier subsistence. These hypotheses predict, in
general terms, how the subsistence system will differ from
the homeland and evolve within the area of colonization.
Hypothesis I
During colonization, subsistence practices will tend to be less complex and specialized than those practices found in the homeland.
Based upon environmental differences between the homeland and
the colony, the cultural impoverishment characteristic and a
frontier labor shortage, the colonization model predicts that
subsistence practices will be relatively simple and non-
specialized. Such a subsistence simplification phenomenon

50
may be most directly observable in specialized aspects of
subsistence such as animal husbandry, the production of
luxury or variety crops, and in cooking practices.
Hypothesis 2
The adaptive strategy developed during the early phases of settlement will be of the diffuse type when compared to the strategy used in the homeland.
The colonization model predicts a simplified, non - specialized
culture in general, but it does not specify exactly how this
will be expressed in subsistence. Fortunately, the focal -
diffuse concept of Cleland (1976) provides a basis for
predicting that a diffuse adaptive strategy will develop.
Given the necessity of rapid adaptation, the limited
knowledge available regarding the new environment and a
simplified frontier culture, a diffuse strategy appears to be
the most viable. Hardesty (1975:82) provided support for
this prediction when he suggested that a wide niche width is
most adaptive in uncertain environments. During
colonization, this prediction may not involve the development
of a fully diffuse adaptation as defined by Cleland. Rather,
it may be expressed as a relative increase in niche width
when compared to that of the homeland.
Hypothesis 3
As the available lands are occupied and the population grows, emphasis will be increasingly placed upon dependable resources which can be intensively exploited; gradually the adaptive strategy will become more focal.
51
This response to t h e ris e in population density and incr e ased
food requi r ements is predicted by the work of Boserup (1965)
and Christenson (1980). During the colonization proc e ss, a
stable, dependable adaptation is expected to have developed.
But with population growth, there is pressure for greater
exploitation of the resources to meet the increasing demand
for food. Some resources can wi thstand greater harves ting
for a period without severe depletion. Other food sources,
though, have much lower depletion thresholds and, as the
limits of exploitation are reached, the costs become
prohibitive. Therefore, the expected response is the
increased exploitation of the resources which are most
dependable and for which production can be expanded without
costs becoming too high. The result should be a reduction
through time in resource diversity and a drop in niche width.
Hypothesis 4
Colonial subsistence will display a directional change toward greater stability and complexity through time.
The colonization gradient concept is the basis for this
prediction. The model suggests that the direction of change
will be toward increased specialization and complexity in the
cultural system and, as Cassagrande et al. (1964:314)
noted "the overall process is one of increasing
stabilization." The development of a stable adaptive
strategy appropriate for the environment should be reflected
archaeologically by the increasingly frequent appearance of
uniform subsistence patterns in a region (Clarke 1968). It

52
is also likely that mor e complex or sp e cializ e d subsist e nce
practices will be gradually a dded.
Hypothesis 5
The genera l patt er n of sub s i s tence change will be the same throughout the area of colonization.
Colonization is thought to b e a pervasive cultural process by
which a population occupies and adapts to a new habitat.
Provided that the environment is similar throughout, the
pattern of subsistence change should be basically the same
over the entire region. Variables such as wealth level or
the date of a household's establishment may alter the
magnitude of the changes, but every household is
participating in the same general adaptive process so that
the evolution of adaptive strategies should be quite simi l ar
between them.
Hypothesis 6
Increasing differentiation in subsistence strategies and diet will occur between socieo- econom i c groups in th e area of colonization through time.
Such a prediction is based upon the decline in opportunity
available to individuals and the tendency for the social
structure of a colony to become increasingly rigid and
hierarchical over time. During the early phases of
settlement, the fluid social structure and plentiful
opportunity should tend to minimize these differences. As
opportunity and the chances for upward social mobility

53
decline, wealth and status differentiation should be
accentuated (cf. Williams 1977).
Each of these hypotheses will form the basis for further
discussion and will be tested in later chapters, following
the presentation of necessary background information. Data
to be used in this investigation are from the Chesapeake Bay
region of North America. Early successful colonization
efforts by the British began in the Chesapeake in 1607.
Since these early efforts at settlement represent the first
sustained British confrontation with the New World
environment, it is likely that the colonization process will
have operated fully there, and hence, it is an exemplary
region in which to investigate the process.

CHAPTER 2
THE BRITISH HOMELAND AND BRITISH SUBSISTENCE PRACTICES
Before considering the colonization of the Chesapeake
and the adaptive responses made by the English colonists, it
is necessary to gain some understanding of the homeland and
the settlers cultural background. The practices and
perceptions an immigrant carries to the frontier will have a
major impact upon the type of adaptation that emerges there.
The subsistence practices of late 16th and early 17th Century
Britain were themselves the result of adaptive responses to
the changing, largely man-altered natural and social
landscape. Only by having the emigrant's cultural background
as the basis for comparison with the immigrant experience is
it possible to gauge accurately the adaptations that were
made in the Chesapeake. In this chapter, the climate,
landscape, society and subsistence practices of late 16th and
17th Century Britain will be investigated.
Evidence suggests that the Chesapeake settlers came
from many different places throughout Britain. Most appear
to have been from the southeast and the west of England but
others originated in northern England, some were from Wales,
and a few even came from Scotland (Horn 1979). Such
diversity of origin indicates that a range of knowledge of
54

55
subsist e nce practices appropriate to many different
environmental settings was transported to the Chesapeake,
along with the set tlers, and was thus available for potential
application.
British Climate and Landscape
Seventeenth Century Britain had a cool, temperate
climate with abundant precipitation , much as it is today.
The most prominent factor in producing this moderate climate
is the Gulf Stream system which brings warm, tropical waters
across the Atlantic Ocean. Westerly maritime winds also
convey warmth to the island, bringing generally equable
temperatures which change slowly from month to month without
abrupt shifts (Drury 1973:17 - 18). In the western portions of
England such as Cornwall, the climate is directly influenced
by the warm water temperatures that moderate the climate. In
contrast, the temperatures tend to be slightly cooler and
vary more between winter and summer on the eastern side of
the island because the air has been cooled by its passage
over the land. The average difference between mean winter and
summer temperatures in Cornwall is 17° F while in Essex, on
the east coast, it is 24° F (Miller 1967:22). On the whole,
though, all of Britain experiences rather moderate
temperatures throughout the year with mean January
temperatures averaging around 40° F and temperatures in July
averaging 60° F (Drury 1973:18).
Another factor which has an important impact upon the
British climate is topography. Britain may be divided

56
into two principal regions based upon its topography: 1) an
upland zone which covers most of northern and western
England, Wales and Scotland, and 2) a lowland zone found in
the eastern and southern portions o f England (Figu re 1). The
uplands are cooler because of their higher elevation. The
uplands also have more rainfall , largely because of their
location in the west where the moisture laden westerly winds
first strike land. This moisture content is reduced by the
time a weather front reaches the lowlands of eastern England.
The average annual rainfall figures clearly reflect this
difference with rain on the west coast typically of 30 to 40
inches a year. In the central section of the country,
appropriately named the Midlands, an annual average of
30 inches of rain falls while the lands on the eastern coast
receive 20 to 25 inches in a typical year (Miller 1967:22;
Drury 1973:27). There is no dry season and rainfall is
evenly distributed throughout the year. The number of days
with measurable precipitation ranges from 150 to 200 days a
year in the lowlands and is generally over 200 days in the
uplands.
Are these modern meterological data an accurate
reflection of the climate in the 17th Century?
Unfortunately, meterological data from the 17th Century are
sparse, but there is one long term temperature record from
central England which begins in 1659. Comparison of this
with modern figures provided in Table 1 reveals that
temperatures were cooler, especially in the winter season.

57
N
1 0 20 100 ,....
mil e s
Figure 1: Britain, Showing the Upland and Lowland Regions
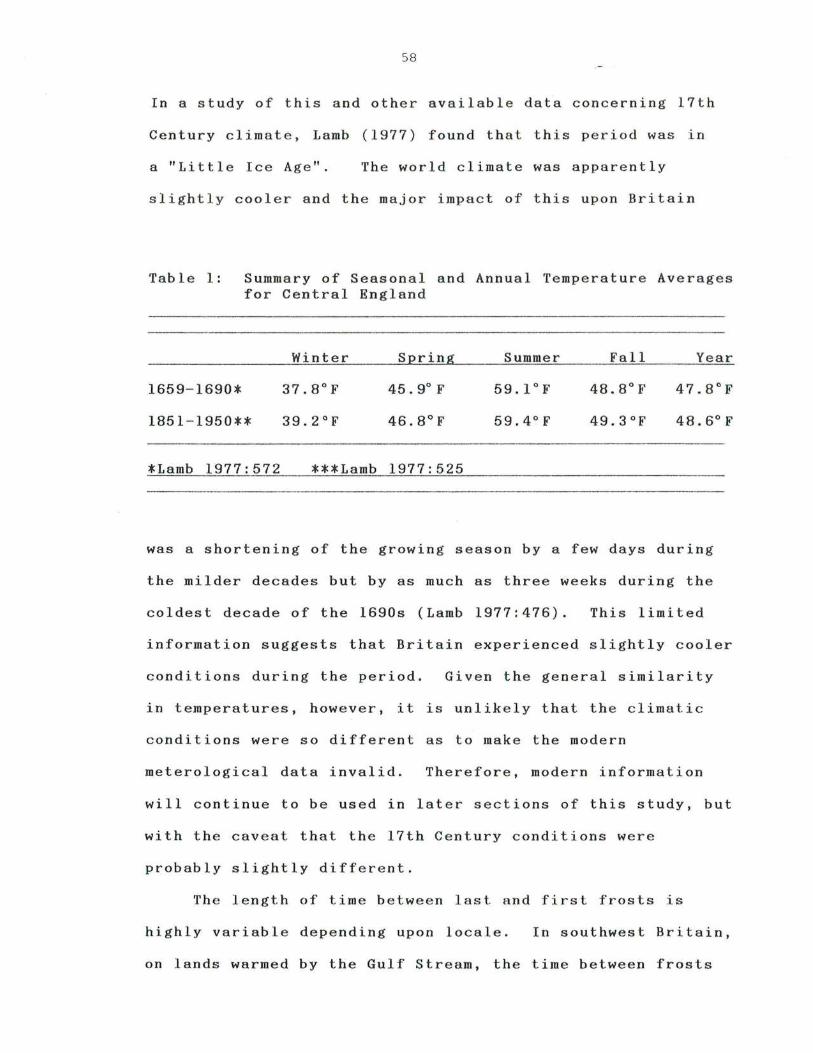
5 8
In a study of this and other available data concerning 17th
Century climate, Lamb (1977) found that this period was in
a "Little Ice Age". The world climate was apparently
slightly cooler and the major impact of this upon Britain
Table 1: Summary of Seasonal and Annual Temperature Averages for Central England
Winter Spring Summer Fall Year
1659- 1690*
1851 - 1950** 48.6°F
*Lamb 1977:572 ***Lamb 1977:525
was a shortening of the growing season by a few days during
the milder decades but by as much as three weeks during the
coldest decade of the 1690s (Lamb 1977:476). This limited
information suggests that Britain experienced slightly cooler
conditions during the period. Given the general similarity
in temperatures, however, it is unlikely that the climatic
conditions were so different as to make the modern
meterological data invalid. Therefore, modern information
will continue to be used in later sections of this study, but
with the caveat that the 17th Century conditions were
probably slightly different.
The length of time between last and first frosts is
highly variable depending upon locale. In southwest Britain,
on lands warmed by the Gulf Stream, the time between frosts

59
can last up to 9 months of the year. More typical of the
lowland zone are periods averaging between 6 and 7 months.
In the high upland areas of the west and especially in
northern England and Scotland, this period is reduced to 5 or
even 4 months. Growing season is closely related to this
frost-free period, although it is usually slightly longer
since the first frost may not necessarily be of the "killing"
variety (Drury 1973:19- 20).
Britain's weather conditions are quite variable. So to
are its topography and ecology. The western and northern
portions of the island are generally high, mountainous lands,
often rugged in nature. A cool, damp climate typifies the
uplands and, except for valleys and areas near the coast, the
agricultural potential of the area is limited. The lowland
zone, in contrast, has small hills, an undulating topography,
and a climate much more amenable to agriculture (Thirsk
1967:2- 3).
The types of soils found over Britain are diverse but
essentially of two general types. One is a Podsol (humid
climate type) while the other is a Brown Forest soil (sub -
humid type) (Miller 1973:29). The podsol is found in the
uplands, primarily, where the heavy rainfall has leached away
many of the nutrients, leaving a thin, acidic and generally
infertile soil. The Brown Forest soil predominates in the
lowlands and is typically associated with deciduous forests.
This Brown Forest soil is much deeper than the upland soil,
generally has a high humus content, and consequently is quite
60
f er til e . How e v er, leaching sti ll o ccurs, es p ecia lly under
cultivation, and this makes fertiliz a t i on neces sa ry.
Th e par e nt mater i a l from which a s o i l i s d e r i ved also
has a ma jor i mp a ct upo n i t s qualit ies. Among t h e more
dis t inctive soil s tha t h a v e d e v e loped du e to und e rlying
geological formations a re acidic peat and moorland soil, and
the chalk a nd clay soils of southe astern England . Glacia l
action has enhanced the variability of British soils with
glacial drift covering portions of the east and the Midlands.
The most common of these i s a stiff "boulder clay" soil
(Tansley 1949:25- 28).
There are four basic ecological regions found in
Britain: uplands, lowlands, forests, and fenlands. Athough
there is a great deal of variation, the uplands primar i ly
support a grass vegetation, with plants such a s bracken and
heather on the more acidic bog soils . The lowlands in the
17th Century were primarily agricultural or pastoral (Thirsk
1967:3 - 4).
Surviving throughout both of these areas were patches of
forested lands, preserved primarily through royal edict or
private ownership, and us e d as deer parks or coppice woods
(Emery 1973:273). Forest had covered large portions of
England in early medieval times, but clearing had been so
extensive that by 1587, there was concern over a possible
timber shortage (Harrison 1968) . In the remaining patches of
forest, dense woodlands were apparently rare. More typical
were open forests with small meadows and cultivated areas
scattered thoughout (Thirsk 1967:95 - 105). Principal trees
61
included a vari et y of oaks (Quercet um sp . ), hazel (Corylus
avellana), hawthorn (Crataegus oxyacanta), beech (fagus sp.),
elm (Ulmus sp.), and birch ( ~etula sp. ) (Tansley 1949, Emery
1973:273). Another ecologically distinc ti v e regi on occurred
in the coastal lowlands and was known as the fens. Fenlands
were often quite extensive areas of marsh which offered
excellent pasture for livestock. Without drainage, however,
the fenland soils are not especially productive
agriculturally. The marsh vegetation did attract large
numbers of migratory waterfowl during the spring and fall
migratory seasons.
These four ecological regions, the uplands, lowlands,
forests, and fenlands, are broad generalizations; a
complexity of micro - environmental zones within them could be
defined. Given the sparsity of precise ecological data from
the 17th Century and the diverse origins of the British
immigrants to the Chesapeake, however, a more detailed
discussion is unwarranted. It is sufficient to observe that
the distribution of soils, vegetation and climatic factors is
highly variable and ecological diversity was a prominent
feature of the British landscape. Human subsistence
practices were also variable but they tended to be closely
tied to the four basic ecological divisions discussed above.
Agriculture and Livestock Husbandry by Region
British subsistence in the 17th Century was based upon
two means of food procurement, intensive grain agriculture
and livestock husbandry. Although both grain and livestock

62
wer e r a ise d in almost a l l regi on s, the re l a t i v e e mp h asis o f
each va ried acco r din g to t h e re gion a nd it s concomit a nt
environmental potential. In the uplands, animal raising was
the ma jor emphas is. Th e principal animals were cattle (Bos
taurus) and sheep (Ovis a r i e s) although a few swine (Sus
scrofa) were also kept. The re a r i ng of these animals and
dairyi n g wer e the ma jo r a ctivi ti es of the upland farmer
(Thirsk 1967:3). La rgely due to poor soils and a damp
climat e , agriculture was of dec i dedly secondary i mpo rtan ce in
the uplands. In many areas, only enough grain was produced
for loc a l needs and, sometimes, no t even that amount was
produced. Major upland crops were barley (Hordeum sp.), oats
(Avena satova), and peas (Pisum sativum and Pisum arvense)
(Thirsk 1967:21,71; Emery 1973:139) . Pasture occupied a
great deal of the land and, significantly, most pasture was
divided into parcels and enclosed by fencing or hedges. One
result of thi s g e nerally enclosed landscape is that a
dispersed settlement pattern existed, comprised of hamlets or
individual farmsteads . Only limited evidence of cooperative
agricultural activities in the grass - farming areas has been
found (Thirsk 1967:8). Pastoral farming required less labor
than intensive grain agriculture and, perhaps as a result,
the upland residents appear to have engaged in a variety of
supplementary crafts such as mining, quarrying, clothmaking,
and knitting (Thirsk 1967 : 12).
Lowland agricultural practices were more varied and can
be described as a "mixed farm economy". Grain production
and with animal husbandry were the hallmarks of lowland

63
farming. Agriculturally, a basic division existed between
the farming methods of the enclose d lands and the large, open
field areas known as the "Champion " (Thirsk 1967). Large
"common" fields were most prominent in t he landscape of the
lowlands and the residents of a village practiced a form of
cooperative husbandry on these common fields. Typically, two
or three large fields we re divided into small strips
representing individual holdings. In the three field system,
one was planted exclusively in winter grain such as wheat or
rye, one was used for sprin g-s own grains of barley or oat s,
and the third was left fallow annually (Emery 1973:263; Orwin
and Orwin 1967). Although an individual household had the
rights to small strips in each of these fields, communal
agrarian practice required that the same crops be planted
throughout a field in a specific year. This strip system
also provided the household with the rights to graze
livestock on the surrounding waste lands, fallow fields, and
recently harvested fields. Such a system was especially
common in the Midlands area. This complex system often
divided the fields into one thousand or more separate
holdings and considerable effort was expended to ensure that
each household received holdings of equal quality (Thirsk
1967; Orwin and Orwin 1967). Many variations of this open
field system existed but all were characterized by the
communal management of agriculture and the possession by each
household in a village of a right to both agricultural and
pasture land. Nucleated villages were consistently

64
associated with this form of agriculture.
Another type of agriculture was the infield- outfi e ld
system that involved the use of a small, intensively farmed
field near the vi llage . The fields' fertility was maintained
through intensi ve manuring. The production of this small
field was supplimented by a much larger pasture land that was
farmed for a few years and then allowed to revert to pasture
for a period of five or more years (Emery 1973:270).
In the southeast of England, the open field system was
being eliminated by the enclosure of lands. Common fields
were still used, but they were of irregular shapes and
private fields frequently adjoined them (Emery 1973:264).
Hedges demarcated many of these individual holdings, although
others were marked by fences or ditches . In this
increasingly partitioned landscape settlements tended to be
more dispersed, and hamlets or individual farmsteads
predominated instead of villages (Thirsk 1967). A shift from
agrarian to pastoral economies and the increasing importance
of market production were among the leading factors in the
movement toward land enclosure. London was particularily
influential and market gardening, along with dairying and
fruit production, developed specifically for that city's
consumption (Emery 1973:271). A result of enclosure was the
drastic reduction or abolition of common rights, thereby
creating a growing body of poor, landless people dependent
upon wage labor for survival (Everitt 1967:399).
In the forests or open woodlands throughout England the
subsistence practices differed markedly from those in nearby

65
cleared areas. Indeed, period wri ters commented upon the
difference between the open and t h e wooded, often enclosed,
countryside (Emery 1973:255) . The woodland economies,
regardless of particular location, displayed a remarkably
similar emphasis upon cattle raising, dairying, and pig
keeping (Thirsk 1967:71). These woodlands were used
primarily for pasturage with only small scale a gricultur e
conducted within them. In fact, residents of some forest
districts were reliant upon imported grain for their
subsistence. One of the unique features of these wooded
areas was the presence of many swine. Residents had pannage
rights which permitted them to run the swine in the forests
to feed on mast in the fall. In certain places such as the
"New Forest" in Hampshire, the production of pigs was a
specialty and Hampshire hams were widely acclaimed (Thirsk
1967:36).
A significant imigration of the poor into the forested
areas took place during the late 16th and early 17th
Centuries as enclosure forced people off the land. In many
areas such as densely populated southeastern England, the
woodlands were the only places with room for population
expansion. The forest population was primarily comprised of
small farmers and immigrants. Settlement in these woodlands
was mostly dispersed with individual farms and small hamlets
predominating (Thirsk 1967:95 - 96). The Commons for grazing
were normally quite large and since the forest areas were not
usually under firm manorial control, both land and individual
66
rights to the common s were far more available than in the
mixed farming area (Thirsk 1967:90- 95).
The major se ttlemen t f orm in the extensive marshes and
fenlands found in the c oastal regi on was the nucleated
village, which tended to occu r on the scattered patches of
high land . This high ground was also the location in which
some wheat, flax, hemp, and beans were grown. In general,
however, livestock raising and fattening of cattle and sheep
on the rich marsh grasses was the primary economic activity
of the residents. Agriculture was of minor importance during
the 16th and early 17th Centuries (Emery 1973:268). In
addition to being exceptionally fertile pasture, these salt
marshes were considered excellent for sheep, since the salt
helped prevent foot rot (Thirsk 1967:183- 85). In areas such
as the Essex marshes near London, dairying was also an
important occupation (Trow- Smith 1957:193). Besides animal
husbandry, fishing and fowling were important secondary
activities and winter fowling provided both food and a
marketable commodity if near enough to a market.
These four regions displayed the major variations in
subsistence activities found in 17th Century Britain .
It is particularily noteworthy that regional variations in
subsistence activities were differences of emphasis rather
than the selection of one or two activities to the exclusion
of others. While the uplands were primarily pastoral, an
open field type of agriculture was practiced in small
isolated areas in stream valleys and along the coast in this
region. Studies of individual counties reveal in even

67
greater detai l how these various activities were mixed. For
examp le, the County of Kent in extreme southeastern England
contained separate areas of mixed corn and sheep farmi n g ,
fruit production and p ig keeping, along with sheep and cattle
fattening on the marshes (Chalkl in 1965). A similar
diversity of agrari an activities ha s been document e d in
Lincolnshire (Thirsk 1957), an d the Welsh border counties
(Sylvester 1969). In shor t, alt hough there were general
regional patterns, subsi sten c e activities thoughout England
were highly variable. Significant differences in subsistence
activities could be found within the space of a few miles.
Methods of Agriculture and Husbandry
Despite these varied approaches to food production,
English subsis tence was based upon a rather small complex of
plants and animals. Of the cereal grains and legumes, the
most widely grown was barley (Hordeum sp.), although large
quantities of wheat (Triticum sp.) and rye (Secale cereale)
were also produced. Oats (Avena sativa) constituted a
secondary crop in some areas but was particularily important
in the higher lands in the west and north. Legumes included
field peas (Pisum sativum and Pisum arvense), beans
(Phaseolus vulgari~) and occasionally lentils (Lens
culinaris) . Although all of these legumes were consumed by
humans, they were largely intended as animal fodder. English
husbandmen also produced crops of hemp (Cannabis sativa) for
rope, flax (Linum usitatissimum) for linen and dye plants
like woad (Isatis tinctoria) and madder iRubia tinctorum),

68
which significantly broadened their econom i c possibil it i e s
(Thirsk 1967).
The rais i ng of these crops was intimately linked with
livestock husbandry. Plows and harrows were the principal
agrarian tools and thes e required animal power. Th e specific
use of oxen or horses depended upon the type of plow and the
nature of the soil. Grain seed was typically sown by the
broadcast method and a harrow was then used to cover the
seed. Crop harvesting was performed with hand tools and this
required large inputs of labor to cut and thresh the grain
(Thirsk 1967:163-175).
In addition to providing traction, the livestock
provided essential fertilization of the fields through their
dung. Although a few alternative sources of fertilization
were available, such as ashes, marl and river sludge, animal
manures were the best, especially of sheep. In the mixed
farming regions, sheep were crucial to the agrarian system
and were valued as much for their manure as their wool or
meat (Thirsk 1967:58, 168). To accomplish this fertilization
of the fields, the movement of the cattle and sheep was
carefully regulated to take maximum advantage of their
droppings. Temporary pens were often erected to concentrate
the dung on lands intended for heavy cultivation. This
technique was employed the infield- outfield system. In other
areas, animals were moved to fallow or recently harvested
fields during the day and then returned to a fold at night
(Trow-Smith 1957:239).

6 9
Of a ll th e Br i tish livestock, c at tle we r e p r ob a bl y t h e
most desired farm animal due to their traction capability,
milk production, and manure. Shee p were a close second
choice, however, because of their manure, wool and lambs
(Thirsk 1967:187). An Engl i sh farm e r would also raise s wine,
a few goats, pigeons, chickens, and occasionally, geese and
rabbits (Markham 1648; Thirsk and Cooper 1972:166- 167). The
major animals - cattle and sheep - were not raised so much
for their meat as for their other products. According t o
Trow-Smith (1957: 173), it was only during the late 16th and
early 17th centuries that English farmers began to regard an
animal's meat of equal importance with its other products.
Prior to this time, meat was considered the final function of
an animal, appropriate only after it had provided wool or
milk, been bred, or had pulled a plow for many years. While
horses were highly valued animals, they were not considered
an acceptable food source by 17th Century Englishmen and
consequently, horse meat was never eaten except in the most
extraordinary circumstances (Simoons 1961:83-84).
Even though animal husbandry methods varied among the
separate regions of Britain, there were many basic
similarities. In nearly every instance, management of the
herds required personnel to guide the animals to the intended
grazing areas, to keep them there, to protect them from harm,
to inspect them for disease, and to fold them safely at
night. While children sometimes performed these tasks, there
were many professional herdsmen and shepherds throughout
Britain (Tusser 1812; Markham 1648; Trow-Smith 1957). Only

70
In open woodland areas were animals allowed greater f r e edom
to range, but e ven there herdsm e n apparently fol l ow ed th e
animals. Cont e mporary accounts complained about t h e forest
dwell e rs who lived primarily upon their cattle and " ...
wasted t heir days in sauntering after them" (Th irsk 1967:96).
The climate of England necessitated that every far mer
store fodder to nouri sh his livestock during the winter
season. As lo n g as the fie l d s offered any grazing potenti a l,
the animals wer e put out to eat. Eventually, though, this
sparse diet had to be supplemented with hay, several
variet ies of straw, and occasionally grains like oats o r a
legume (Trow - Smith 1957:250 - 256). Although new fodder crops
such as turnips, clover, and ryegrass were slowly being
introduced to England, these were not widely used until the
late 17th Cen t ury. Stock were usually given some shelter
during the winter, especially at night, in byres, stables,
and sheep houses (Trow-Smith 1957:239, 255 - 257).
Swine were kept by the majority of the households and
this creature was regarded as:
... the husbandman's best Scavenger, and the Housewives most wholesome sink, for his food and living is by that which would else rot in the yard... (Markham 1648:126).
On most farms, a few pigs were raised. These animals were
allowed to forage in the fallowed fields, common lands or
marshes during the day and were enclosed in a sty at night
(Markham 1648: 128). Their diet was supplemented with all
manner of household and farm waste. In many areas, the

71
destructiveness of rooting swine in t h e fields and pastures
was controlled by t h e method of piercing and ringing their
noses. Large numbers of swine wer e only fo und in the forest
dis tricts or on commercial dairy farms where they were fed on
dairy wastes such as whey (Thirsk 1967:192). Forest areas,
with large ranges and abundant wild foods, provided for
greater numbers of swine . This was especially true in the
fall when the pigs were allowed to feed on the mast.
Fattening in the woods normally took from six to eight weeks,
with the swine under the care of a herdsman or hired hand
(Thirsk 1967:193). Even in the enclosed regions of mixed
farming, the inhabitants attempted to utilize the autumn
windfall of foods to fatten their animals . As Gervase
Markham advis ed in his Cheap and Good Husbandry (1648:129):
... at the fall of the leaf, it is good to drive them [swine] to hedges, where they may get Haws, Hips, Sloes, Crabs, or such fruit which is also very wholesome: and the poorer sort will gather their fruits and keep them to feed their swine with all the winter.
Both the agricultural and husbandry methods employed in
Britain during the 17th century were complex and demanding of
labor, skill and knowledge. Subsistence practices required a
high degree of planning, and a careful allocation of all
resources, be these land, manure, grass, forage crops or
labor. In many areas the basis for survival was the
cooperation of a large group of unrelated individuals who
shared the land in common. In other regions, isolated
homesteads were more frequent than villages, but the
difficulty of resource allocation remained a central problem.

7 2
The complexity of s ub sistence activities was furt her
accentuated b y the ecol o gical diversity of the British
landscape that c ompelled farmers, often within a few miles o f
each other, to adopt radically differen t methods .
British Diet and the Yeoman Tradition
Whil e an understanding of the agrarian economy in 17th
Century Britain is essential for investigating the
subsistence system, it does not reveal how food was
incorporated into a diet. Hence it is necessary to identify
the cultural preferences regarding food as well as the actual
composition of the yearly diet. Both of these are important
because the preferred diet constituted a subsistence model
which the colonists carried with them to America. Their
actual diet in Britain on the other hand, is of relevance
because it represents the foods they were accustomed to
eating, which may have been quite different from the
preferred dietary items. Actual and preferred foods both
influence the evaluation of new foods on the frontier, and
can have a major impact upon the way in which the new
subsistence pattern evolves.
England in the 16th and 17th Centuries was a highly
stratified society which complicates the evaluation of diet
since one of the key characteristics of a stratified society
is differential access to resources (Fried 1974). The types
of resources available to different social groups will vary,
thereby producing differences in the types of foods which can
be obtained and consumed. Certain foods have a status

73
association and the consumption of these fo ods, the us e o f
speci fic cooking met hod s and the u se of certain spices and
other seas onings take on social values (Garine 1972). Su ch
status associations of f ood make cons ideration of England's
social structure imperative.
Peter Laslett's investigation of 17th Century England in
The World We Have Lost (1973) revealed that the society wa s
divided into two major groups. The basic separation was
between the "Gentry" and the "Commoners". The gentry
included the royalty and aristocracy, knights, professionals,
and gentlemen. At most, it comprised 5% of the population
(Laslett 1973:27). The gentry owned most of the wealth and
controlled the political and economic structure of the
nation. The king stood at the pinnacle of this group with
the nobility immediately beneath him. In the ranks below
them were the knights, doctors, military officers, clergymen
and some major merchants.
Most of the inhabitants of Britain were "commoners" who
had much less wealth and were obligated to do manual labor
for a living. Highest in rank within this group were the
yeomen, who owned their land and generally operated
agricultural enterprises. Artisans and tradesmen were
slightly below them in social prestige, although not
necessarily in wealth . Embodying the lowest levels of the
society were poor husbandmen, landless and semi - skilled
laborers, and paupers (Laslett 1973:47). Most of them owned
or had access to only small patches of land and were at least

74
partial l y dependent u pon wages for survival (Fussel 1949 ).
Laslett observed that there was a significant gap
between the gentry and the yeomen, expressed by a difference
in out lo ok, behavior, and dress (1973 : 47) . The difference
between gent r y an d yeomen were also expressed in diet. Th e
cuisine of the gentry derived largely from a medieval
tradition with a strong inf luence from continental Europe,
especially France. They at e heavily spiced dishes with many
different ingredients cooked together to form often extremely
sweet conglomerations (Aylett and Ordish 1965). Writin g in
1587, William Harrison (1968:127) noted this:
In number of dishes and change of meat, the nobilities of England (whose cookes are for the most part musicall-headed Frenchmen and strangers) doo most exceed".
In marked contrast to this was the cuisine of the yeomen
and husbandmen. This dietary tradition was shared by the
commoners who comprised nearly 95% of the English population.
The English yeoman's cuisine has been analyzed in detail by
Anderson (1971:275) who described it as:
... Home grown, the end product of centuries of experimentation with the procurement, preservation, and preparation of food on self- sufficient farms, clustered in and around isolated villages. Transmitted primarily by word of mouth and example, the tradition reached its perfection in the farms and kitchens of literate yeoman ...
Although ther e were pronounced regional differences in
subsistence methods, this yeoman cuisine seems to have been
the fundamental dietary tradition throughout Britain.

75
S ince yeoma n cuisi n e is largely r eprese n tative of Br i t i sh
diet, a nd sinc e few members of the gentry e ver cam e to the
Chesap e ake colonies , attent i on will be f o c used upon the
common fare .
What we r e t h e co re elements o f thi s widespread Ye oman
subsi s tence tr a dition? I n an ea rly 17th Century play, The
Witch o f Edmonton, a l ine states tha t whe n a v i si t o r ar r i v es,
"he sha ll be welcome to bread, bee r and be e f, y e oman's fare"
(quoted in Anderson 1971:246). Ot he r desc r iption s of y e o men
food t e nd to agree with thi s and consistently r efer to fou r
major foods: beef, bread, b e e r a nd, dai r y products. On e o f
the best listings o f the major foods in th e ye oman ' s diet
derives from the writings of Nicholas Breton who in 1618
descr i bed provisions sto r ed in a farmer ' s house at the end of
the ha r vest:
Again we have. . corn in the garner, cheese in the loft, milk in the dairy, creme in the pot, butter in the dish, ale in the tub, aqua vitae in the bottle, beefe in the brine, brawne in the sowce, and b acon in the roofe, herbs in the garden, and some money in the copher and having all this, if we serve God withal, What in God's name can we desire more? (quoted in Anderson 1971:24).
Other period writers repea t thes e basic it e ms and add mutton,
legumes and domestic fowl to the group (Harrison 1968: 126 -
235 [ original 1587], Tusser 1812 [original 1573 ] , Markham
1615) .
Food Resources in British Subsistence
A number of pertinent questions arise as to where thes e
various foods were obtained, how they were typically prepared
76
a nd ho w th e y were integrated into a n a nnual subsistence
cycle . Fortunately, y eomen and prosperous husbandmen are an
a ppropriate group to which these questions should be
address ed since their diets incorporated the widest rang e of
subsistence resou rces. In addition, their diet is bette r
documented than other commoners' diets, and yeomen were very
nearly self-sufficient in s ubsistence. Thi s latter point was
emphasized by William Webb in 1656 when he wrot e regarding
the typical yeoman of Cheshire.
They layout seldom any money for any prov is ion, but hav e it as their own as Beef, Mutton, Pork, Capons, Hens, Wild Fowl, and Fish. They bake their own bread and brew their own drink" (quoted in Campbell 1942:244).
Being self- sufficient in food was a trait for wh ich the
yeoman was particularily admired and period writers
often celebrated it in often terms (Anderson 1971:27).
The items normally purchased from a market included a
few essentials, namely salt and salted fish, and sometimes
the difficult to make malt for brewing, and luxury items
such as spices, sugar, dried fruits, almonds and wines to be
used in special dishes (Anderson 1971:83:84). These few
exceptions aside, the subsistence system was based upon foods
obtained on or near the yeoman's farm.
While subsistence practices over England display some
variability due to ecological differences, the key elements
in the diet typically derived from three primary
sources: 1) the fields and pastures, 2) the farmyard and
garden, and 3) the orchard, and two secondary sources: 4) the

77
woodl a nds and h e dge r ows, and 5) the waterways an d marshes.
As may h ave been s u rmised from the earlier discussi on o f
agricultural and husbandry pract ices, th e fields and pastures
lay at the heart of English subsistence. From fields were
obtained ba rley for bread and beer; wheat, rye and oats for
bread; and peas and other l egumes f or pottages. These same
fields provided grazing for the livestock during the fallow
years and after the harvest. The fields, pastures and forest
lands, through cattle, also provided the dairy products that
were key dietary items. Milk, butter and cheese were
prominently noted in all descriptions of diet during this
period and they were clearly an important source of nutrition
for the yeoman and poorer people (Anderson 1971; Wilson
1973:150- 168). Inhabitants of the uplands region had a more
pastoral oriented economy than those of the lowlands during
this period, but they were also dependent upon the
agricultural products of the soil, and frequently had to
import grain from more agriculturally oriented areas (Thirsk
1967:60 - 70).
Of only slightly less importance were the foods produced
in the immediate vicinity of the yeoman's home. In the
farmyard, the yeoman's wife maintained domestic fowl such as
chickens and ducks and occasionally kept geese which provided
meat, eggs and feathers. Swine were stied in the area and
they consumed the waste from various household and farm
activities. Bee hives were also located near the house and
provided the principal sweetening agent used in cooking.

78
Th e garden was lo ca ted in t h e farmyard area an d it seems
to have been a significant source of foo d. Herbs of both
dietary and medicinal value wer e gr own there. Food plants
were also raised but relatively few descriptions have
survived and v egetables were only occasionally itemized. One
of the best sources o f information regarding gard e n plants is
John Gerard's The Herbal or General His tory of Plan ts,
written in 1587 and expanded in 1633 by Thomas Johnson. In
this massive work, every pl ant known in England was desc ri bed
in detail and illustrated. Among those specifically noted as
"Garden Plants" are artichokes, garden beans, cabbages,
carrots, cucumbers, lettuce, melons, onions, parsnips,
radishes, skirrets, spinach and t urnips. Richard Gardiner in
his Instructions for Manuring, Sowing and Planting of Kitchen
Gar~ens (1973, original 1603) listed the same plants, as did
William Harrison (1968:264), clearly suggesting that these
were the most commonly grown vegetables in England. Although
the garden may have provided only a minor portion of the diet
when compared to that obtained from the fields, it was
certainly the major source of vitamins in the yeoman diet.
Typically, an orchard was also planted near the house.
Trees bore fruit and nuts that were of increasing importance
in the English diet, for as Harrison (1968:269) st at ed:
And even as it fareth with our gardens, so doth it with our orchards, which wer e never furnished with so much good fruit not with such variety as this present. For besides that we have more delicate apples, plums, pears, walnuts, filberts, etc. and those sundry sorts, planted within forty years pas t .. ..

79
Apples and pears seem to have been the most common types .
Th e sal e of fruit and nu ts wa s a lso an important s ou rce of
income for som e Yeomen as well as t h e po o rer hu sbandmen
(And erson 1971:51; Baxter 1926:182 ), while the spoiled fruits
from orchards were used to fatten swine in some areas
(Anderson 1971:102).
The woodl an ds and hedgerows we re of dec i dedly s econda r y
importance a s a source o f food t o the yeoman. Both ar eas
provided food on which swine could fatten and thus,
indirectly supplied food for the table. Few wild animal s
could be found in England by the early 17th Century except in
the major forests and deer parks maintained by the wealthy.
The most famous game animals were t he red deer (Cervus
elaphus) and fallow deer (Dama dama) , but hunt i ng them wa s
ostensibly the privilege of the gentry . In spite of this
restriction, the yeomen, husbandmen and poorer laborers
apparently poached for deer when the opportunity arose,
(Anderson 1971:79, Drummond 1958:98). More commonly trapped
or hunted were hares, rabbits, fox, badgers and small birds
such as quail and woodcock. Collection of wild plants was
apparently of little importance and was limited to a few wild
herbs, nuts and berries (Everitt 1967:452).
Perhaps of somewhat greater significance than the
woodlands were the waterways, marshes and ponds since they
yielded fish, molluscs, and fowl. Obviously, there was a
strong regional pattern in the use of these resources since
the yeoman living along the coast or in the fenlands had much
better access than inland farmers. Hunting and fishing were
80
popular recreatio ns for yeomen that contributed some
diversity to their diet, but which cannot have provided a
major food source for t h e typical farmer (Campb el l
1942:311).
Much seafood was transport e d inland, usually in a
preserved state. One factor which greatly increased the
consumption of fish in 16th and 17th Century Britain was
religion. There were weekly fish days, in addition to th e
season of Lent, during which meats were not to be consumed.
The number of fish days and their enforcement had
significantly declined by the 17th Century but they still
exerted an influence on eating habits (Wilson 1973:44). In
1587, William Harrison (1968:322 - 323) discussed the kinds of
fish obtainable during each season of the year: among the
freshwater varieties he listed were perch, pike, and trout.
Salt water fish included mackerel, haddock, herring, cod and
sole.
clams.
Molluscs eaten included oysters, scallops, mussels and
Many varieties of ducks and other waterfowl were
hunted or snared in the marshes but their consumption wa s
generally limited to yeomen dwelling in that vicinity.
Each of these areas was a principal source of food for
the yeomen and contributed to a diet that was largely of
domestic origin with only a minor addition of wild foods.
Beef, pork, mutton, fowl, bread, beer, pulse and dairy
products predominated and, along with occasional vegetables,
fruits and wild game, they comprised th e regular diet of th e
17th Century English Ye oman.

81
17th Century En glish Yeoman . Me thods . of Food Preparatio n an d Consumption
Of all of t h e foo ds list ed a bove, grain s were pr obably
th e mo st important in the diet (Ashley 1928; Campb ell
1942:245). Grains were use d in a number of ways, bu t without
doubt, the most common form was as bread. The particular
grain us ed for bread dep ende d upon t he region, f or as
Harrison (1968:133) related in 1587:
The bread throughout the land is made of such grain as the soil yieldeth: nevertheless, the gentility commonly provide them seleves sufficiently of wheat for their own table whilst their household and poor neighbors in some shires are enforced to content themselves with rye or barley, yea, and in times of dearth, many with bread made from either of beans, peason or oats or of all together and some acorns among.
Elsewhere, he commented that in the open champion country:
. much rye and barley bread is eaten, but especially where wheat is scant and geason (Harrison 1968:135).
Examination of agricultural accounts and other sources of
information indicates that wheat-based bread was most common
in the southeast, although even there it was often mixed with
rye. In the north and the west, rye, barley and oat breads
were most frequently consumed (Ashley 1928). The most
popular types of bread in the lowland area were called
"maslin" and "brown" bread. The first was a mix of wheat and
rye while the second contained rye and barley mixed with
ground peas (Anderson 1971:164). Pure wheat bread was rarely
eaten except by the wealthy, and there were strong social
connotations associated with its consumption. Besides bread,

82
grain was a main ingredien t in many pottages, puddings, an d
gruels, and flour wa s essential f or pastries and pies.
Oatmeal was consumed by itself a nd was also used as a
thickening agen t in other pottages (Markham 1615:48, 64 - 68).
Although ce real grains were of first order importance in
yeoman nutrition, meat and fish occupied the premiere
position in food preference (Campbell 1942:246, Anders on
1971: 185 - 186). Freshly butchered meat was especially
relished and the favorite method of preparing it was by
roasting. In Markham's The English Housewife, published in
1615, recipes for roasting a large variety of meats were
presented, among which are mutton, beef, pork, veal, capon,
swan, and other fowl, and venison (pp. 54-59). English cooks
were widely acclaimed for their ability at roasting and roast
beef came to characterize the epitome of English cookery
(Wilson 1973:89-91). Indeed, it was traditional to serve it
twice a week, on Thursday and Sunday (Anderson 1971:260).
In spite of the popularity of roasting, boiling was
probably more common because of its simplicity and the fact
that it produced a rich broth. Boiling is particularily
appropriate for salted meats such as corned beef or salted
fish. The widespread usage of this cooking method is
indicated by Markham (1615:47):
... we speak of boild meats and broths, which for as much as our Housewife is intended to be general, one that can as well feed the poor e as the rich, we will first beginne with those ordinary wholesome boild meats, which are of us e in every good man's house ...

83
A boiled meat might be cooked as a single large piece with a
few herbs, onions and finely chopped vegetables, or cut up
and made into an "ordinary pottage". Ma r kham (1615:47 - 48)
gave recipes for several types of pottages which contained
varying amounts of herbs and usually included oatmeal as a
thickening agent. Stews differed from pottages chiefly in
the fact that they had great quantities of meat; rabbit, hare
and chicken were often consumed in this manner (Anderson
1971:206).
Meat was also baked, generally in the form of pies.
These were made through the careful preparation of pastry
which matched the characteristics of the meat. Virtually any
available meat was used in pies and there are surviving
recipes for venison, beef, bacon, lamb, mutton, chicken,
waterfowl, fish and oyster pies (Markham 1615, Avery 1688).
One final method of meat cookery was by frying. Frying was
quite common and often used to make "fricasses" which were
dishes of many compositions, and ingredients, as flesh, fish, eggs, herbs, and many other things, all being prepared and made ready in a frying pan . (Markham 1615:42-43).
Dairy products were employed in many different dishes as
well as being eaten in the forms of buttermilk, milk, curds,
butter or cheese. However, recipes that emphasize dairy
products are not common, being limited mostly to custards
made with fruit, and semi - solid drinks such as syllabub and
posset. Cheese was principally eaten by itself in several
forms ranging from firm, hard cheese that had been well aged

84
to soft, curded new cheese, and occasionally cream cheese
(Wilson 1973:158-163). Butter was eaten on bread as well as
used in cooking.
Vegetables from kitchen gardens were employed in several
manners, depending upon whether they were "pot" or "sallet"
herbs. Pot herbs were for the most part root crops like
carrots, parsnips, or turnips, but cabbage and onions were
also included in this group. Potherbs were usually added to
pottages, stews and other boiled meat dishes (Anderson
1971:219; Markham 1615). Legumes represent another group
that was widely consumed, often in the form of pottages;
indeed, pease pottage was a national dish throughout this
period (Wilson 973:196). Beans were also baked, especially
during the winter months.
Salad herbs, on the other hand, were more often eaten
fresh. Cucumbers, small carrots, cauliflower, lettuce,
radishes, and spinach were all grouped into this category and
could be eaten hot or cold, individually or mixed together
into a "compound sallet" and served with oil, vinegar and
spices (Markham 1615:39-40). Some of these vegetables were
also preserved by pickling and those most generally used in
this manner were onions, cabbage and cucumbers (Wilson
1973:306, 321 - 325).
Fruit was eaten fresh, cooked, dried or preserved in the
form of various drinks. William Harrison (1968:139) wrote in
1587 that:
In some places of England there is a kind of drink made of apples which they call cider or pommage, but that of pears is

85
named perry, and both ar e ground and pr e s se d in pr e sse s ma d e f or th e nonce. Certes these two are very common in Suss e x, Kent, Worcester and other st ea ds where those sorts of f ruits do abound ...
Apples and pears were also roas te d, made into sauce and baked
in tarts or pies. Other fruits such as cherries, peaches,
gooseberries and plums were cooked in tarts and used to
flavor puddings and other dishes; some fruits we r e pickled
(Wilson 1973:310- 315).
Food Preservation
Because Britain has a temperate climate, the
availability of many of the foods discussed above varied in a
distinct seasonal pattern. Food had to be stored for the
slack seasons, and hence, numerous subsistence stapl e s we re
preserved. The four principal preservation method s dry ing ,
salting, pickling and potting (Anderson 1971:86- 87 , 100 -1 15;
Markham 1615). Drying of grains, beans and fru it was common
and generally effective. Meat was also dried, although this
was usually done in association with other treatments such as
smoking. The most widely used method of meat preservation
was by salting, either dry or in a brine. The brining method
produced corned beef, hams or salt pork while the dry salting
of beef yielded "powdered beef" which apparently stored well.
Smaller animals such as sheep, fowl and rabbit were normally
eaten fresh and were rarely salted. Pickling was most
commonly employed to preserve vegetables, oysters and some
meats. Of all the methods, potting seems to have been the
most successful. This involved the cooking of pork, beef or

86
chick en, placing it in an eart h enwar e vessel and cov ering it
totally with some type of fat to form a seal. Pott ed f oods
were especially popular on ships since these foodstuffs
tended to preser v e longer (Anders on 1971:105). Cow's milk
was preserved in the form o f butter and cheese which, if
stored in a cool dry environment, would keep well. Through
the careful application of these varied preservation methods,
the yeoman could depend upon a supply of food throughout the
year.
The Annual Subsistence Cycle of the Yeoman
Based upon the annual shifts in climatic conditions,
17th Century Englishmen divided the year into four seasons.
These were the winter (late October to early February),
spring (February to late April), summer (May to early
August), and the harvest season (early August to October)
(Anderson 1971:86). Such a division provides a convenient
and reasonably accurate means of discussing the subsistence
cycle. The following discussion is based upon a synthesis of
many works: Drummond 1958; Gerard 1633; Harrison 1968;
Markham 1615, 1648; Anderson 1971; Tusser 1812; and Thirsk
1967.
The widest variety of foods was available to the yeoman
during the winter period following the harvest. During this
season, grain and legumes were abundant and October was a
traditional brewing month. Fruit drinks such as cider, perry
and various fruit wines were widely consumed duing this
period along with stored fresh fruits. Cheese and butter,

87
products of the long dairying season that ran from May to
late September, were plentiful. Meat consumption was
greatest during the winter. Butchery was traditionally
conducted in November when the weather was suitably cold and
before the fattened livestock could lose weight because of
the poor winter fodder. Much freshly slaughtered beef and
pork were preserved for the coming months, but the butchery
process yielded organ meats, blood and many small cuts that
were eaten immediately. Perhaps the highpoint of the winter
season was the Christmas celebration when elaborate meals
were served. Thomas Tusser (1812:73), writing in 1573,
describde this festive feasting:
Good bread and good drink, a good fire in the Hall, brawn, pudding, and souse and good mustard withall.
Beef, mutton, and pork, shred pies of the best, pig, veal, goose, and capon, and turkey well drest, Cheese, apples, and nuts, jolly carols to hear, As then in the country, is counted good cheer.
In the spring months, the yeoman's fare differed
considerably from that of the previous season. Preserved
meats were emphasized and bread was abundant in the early
spring. March was also the traditional month for brewing
strong beer. Also, sufficient grain was available to
continue the weekly or bi-weekly brewing of "small beer"
which was drunk almost immediately. In contrast, cider and
other fruit drinks would have been in short supply.
Punctuating this season was the observance of Lent from late
February or early March to early April. During this 40 day

88
period of penanc e and prayer , individu a ls we re to abstain
from the consumption of me a t. Inst e ad, cheese, pease
p o t t age, oth e r grain or legum e di s h es a n d salted o r
occasionally fresh fish predominated in the diet. Notably
lacking throughout this entire period we re any fresh
vegetables or fruit. The long months of salted meat and
Lenten far e came to an end at Easter when geese, othe r fowl,
young lambs or a sheep were slaughtered for the Easter feast.
Overall, the spring period was one of adequate food, but with
a significant shortage of fresh meat, vegetables and fruit.
The summer diet contrasted sharply with that of the
winter or spring and was the leanest period for the yeoman.
Supplies of wheat, barley, rye, pease and beans ran low,
and, if the harvest were late, hunger could result.
Fortunately, this was also the period during which garden
produce became available and dairying was at a peak. Some
preserved meats may have still been on hand but these were
probably badly tainted. Occasionally, a fowl, a pig, or a
sheep was probably consumed during this period along with the
yield of the dairy. Gooseberries, strawberries and other
garden fruits ripened in the summer months along with the
vegetables and provided a much needed source of vitamins in
the diet. Dairy products, vegetables and fruit, some meat,
and rapidly shrinking stores of grain and legumes comprised
the normal summer diet.
Harvest was the shortest season and was marked by a
significantly more varied diet due to the differing ripening
89
dates of the various grains, legumes and fruits. During the
early weeks of the harvest, the summer diet probably
continued almost unchanged. A variety of vegetables and
fruits would have been available along with new cheese. But
as the harvest progressed, the plethora of new provisions
enabled a shift back to the "Beef, Bread, and Beer" style of
diet which characterized the winter pattern of subsistence.
The completion of harvest was often marked by a feast for all
the workers. One such meal hosted in 1641 by Henry Best, a
Yorkshire farmer described that:
. and then have they puddings, bacon or boiled beef, flesh or apple pies, and then cream brought in platters, and everyone a spoon, then after all they have hot cakes and ale . (Thirsk and Cooper 1972: 125).
This then was the annual subsistence cycle of the
English Yeoman farmer of the late 16th and the early 17th
Centuries. There were certainly regional variations in this
diet with the types and proportions of specific grains,
meats, fruits and vegetables differing according to the
section of the country. Nevertheless, the yearly subsistence
cycle was undeniably based upon the core components of
domestic meats, bread, legumes, beer and dairy products. For
the prosperous husbandman or yeoman, such a diet apparently
provided "solid sufficiency" and enabled a reasonably healthy
existence. Furthermore, the yeoman and his cuisine served as
a cultural ideal toward which others aspired.

90
Th e Diet o f the Commoners and the Importance of Meat
If such a diet was typical of the more prosperous yeoman
farmers, what of the people below that rank? These wer e the
craftsmen, small scale farmers, and wage laborers who either
owned or rented small tracts of land. As the enclosure
movement spread, their rights to commons pasture were slowly
reduced or eliminated. Many laborers in the more urban areas
were almost totally dependent upon their wages fo r food. How
did the diets of these people differ from that of the
virtually self-sufficient yeomen?
One way of answering this question is to determine how
widespread was the yeoman subsistence tradition. Sources of
information are th e foods that repeatedly appear in menus of
institutions such as poor houses, hospitals or military
organizations. Such data are relevant because
"incorportation into an institutional fare usually indicates
that a commodity is firmly entrenched in the diet of the
general population" (Shammas 1983:97). Data are available
concerning the foods typically served in 17th Century poor
houses and hospitals (Shammas 1983:98), jails (Anderson
1971:246), the army during the English Civil War (Firth
1921), English soldiers during the second half of the 17th
Century (Thacker 1894), and the Royal Navy (Drummond 1958).
Each of these reveals a remarkable similarity in foods. The
same components of beer, bread or biscuit, meat (beef, pork
or mutton), cheese, butter and oats or peas appear in nearly
every menu or ration. For example, dinner fare at a jail in

9 1
1588 con s i s t e d o f "bread ma d e o f rye wit h a py n te o f
po rre d ge , a quarter poun d o f f 1es h e, and a pi n te o f beare"
(c i t e d in Anders on 197 1 : 246 ). Th e s t a nd ard f oo ds se rv e d in
po o r ho uses b et ween 1570 and 1650 we re b read, c h eese , peas,
meat o r salted fish, beer , occ a sional milk o r butter and a
few vegetables when in season (Sha mmas 1983). Whil e there
was probably l itt l e comp ar iso n in quality b etween these
institutional meal s and those served in a yeoman's househo l d,
the con s i s tency of ingredient s strongly argues that these
were indeed the key components of the die t of commoners
thoughout Britain. Practically all ate bread, cheese,
butter, and legumes, and drank beer. What seems to have
differentiated the diet of the yeoman from that of the poor
people were the proportion s of meat and vege t able s they
consumed.
Meat in 17th Century England was the most desired food
in the diet (Anderson 1971:185 - 186). Indeed, as Drummond
(1958:102) stat e s, " the standard of living was judged
to a considerable extent by the amount of meat eaten". It i s
clear that the amount of meat consumed was a c e ntral fac t or
in differentiating between the diets of the rich and th e
poor. In 1587, Harrison (1968:126) indicated that the rich
ate a variety of meats while dairy products were deemed more
suitable for the poor
. white meats, as milk, butt e r and cheese, which were . wont to be accounted of as one of the chief Stays throughout the island, are not much reputed as food appertinent only to th e inferior sort, whilst such as are more wealthy do feed upon the flesh of all

9 2
kinds of cattle accustomed to be eaten, all sorts of fish taken upon our coast and in our fresh rivers, bred in our island or brought unto us from other countries in the main.
The most esteemed of all meats was venison. Deer could
only be found in some forest areas where they were under
royal ownership or in private deer parks and as Harrison
(1968:255) declared:
... that vain commodity ... venison in England is neither bought nor sold as in other countries but maintained only for the pleasure of the [deer park] owner and his friends ....
In other words, deer meat was a food of the gentry and had
elite social connotations for those who could serve it
(Wilson 1973:99- 100). William Harrison (1968: 131 - 132) also
observed that when poor people at a festival:
. happen to stumble upon a piece of venison and a cup of wine or very strong beer or ale. . they think their cheer so great and themselves to have fared so well as the Lord Mayor of London
This cultural preference for meat and its high status
was accompanied by a low opinion of vegetables. This
disfavor derived in part from medieval beliefs that fruits
and vegetables were sources of melancholy and fevers
(Drummond 1958:125). This view began to change during the
17th Century but it still had influence . Such a negative
attitude was clearly expressed by Thomas Fuller in 1642:
Still at our Yeomans table you shall have as many joints as dishes; no meat disguis'd with strange sauces; no straggling joynt of a sheep in the midst of a pasture of grasse, beset with sa1lads on every side, but solid substantial food (Fuller 1938:106).
9 3
This attitude was changing and some of the wealthier members
of society, "were eating more vegetables and importing exotic
varieties of plants to stock their gardens (Harrison 1968:
264) . For the most part, however, vegetables possessed a
reputation as a food suitable for times of hunger, and were
associated with the diet of the poor. Such a cultural
association clearly contributed to the low esteem in which
vegetables were held. Nevertheless, the importance of
vegetables as a food for the poor was stressed by several
writers during the period . Harrison (1968:216) told that:
.. . sometime a poor man ... think himself very friendly dealt with if he may have an acre of ground assigned unto him whereon to keep a cow or wherein to set cabbages, radishes, parsnips, carrots, melons, pompions, or such like stuff, by which he and his poor household liveth as by their principal food, sith they can do no better. And as for wheaten bread, they eat it when they can reach unto the price of it, contenting themselves in the meantime with bread made of oats or barley: a poor estate, God wot
A similar attitude was expressed by Richard Gardiner in his
Instructions for Manuring, Sowing and Planting of Kitchen
Gardens (1603) who wrote the book specifically "to provide
sufficient victuals for the poore and greatest number of
people to relieve their hungrie stomachs". He described in
detail the growing of garden beans, carrots, cabbages,
cucumbers, lettuce, onions, parsnips, radishes and turnips.
Gardiner was convinced that the poor could improve their
diets and health by eating these plants.

94
Hunger among the poor was du e largely to their lack of
access to land to raise crops and graze animals. Th e small
husbandman or far m laborer may have owned or re nted a little
land, but this wa s seldom more than fiv e acres (Everitt
1967:401). More t ypical was an acre o r s o surrounding their
cottages (Fussell 1949). Upon this amount of land, they
could maintain a small garden, perhaps a few livestock, and
several fruit t~ees . Normally, however, this was
insufficient space to produce grains or legumes in quantity,
and the cottager wa s forced to purchase thes e at the market
(Fussell 1949:26- 29). As Ha rris on noted in 1587 (1968:216),
their bread was usually of barley or mixed grains but rarely
wheat, due to its cost. Peas or other legumes were often
mixed with the bar ley flou r to stretch it (Fussel 1949:30).
Accounts suggest that dairy products, rather than meat, were
the chief source of protein in the diet of the poor (Everitt
1967:451). Some kept a cow if they had sufficient land or
access to common grazing, but for most people, milk, butter,
and cheese had to be purchased . The livestock of the poor
was often limited to a few swine, sheep, or some fowl. Many
commoners did not attempt to raise swine on the small amount
of land available to them and occasionally purchased a flitch
of bacon or some salt pork (Everitt 1967:452). This lack of
meat in their diet was emphasized by Richard Baxter in 1691
in his discussion of "poor racked husbandmen":
The poor tenants are glad of a piec e of hanged bacon once a week, and some few that can kill a bull eat now and then a bit of hanged beef, enough to try the stomach of an ostrich. He is a rich man
95
that can afford to eat a joint of fresh meat (Beef, Mutton or Veal) once in a mont h or fortnight. If their s ow pigs or their hens breed chickens, they cannot afford to e a t them , but must sell t h em to make the rent. The cannot afford to eat the eggs that their hens lay, nor the apples or pears that g row on their trees (Sav e some that are not vendible) but must make money of all. All the best of their butter and cheese they must sell and feed themse lves and their children and s ervants with skimmed cheese, and skimmed milk and whey curds (Baxte r 1926:182).
No doubt thes e poor laborers supplemented their meat di ets
through fishing, fowling, hunting rabbits, and, if near a
forested area, poaching deer (Everitt 1967:452). Given such
a diet, though, the importance of vegetables in supplementing
the food supply is obvious and the garden was one of th e few
subsistence res ources which could be controlled by the
"poorer sorts." In a study of the diets of "cottagers",
Fussel (1949:32) found that there was relatively little
variation in their diets from one part of England to the
other. He summarized the pervasive dietary regime of the
laborer thus:
Usually the cottage staple would be bread of mixed flour, white meats, milk, buttermilk or whey, and skim milk cheese, occasional meat meals, mainly derived from pig, or at festivals beef, mutton and possibly poultrYi for example a Michaelmas goose, perhaps a wild rabbit. Home-made ale, and various home - made wines, cider the most usual. and all sorts of concoctions made from flowers, berries and v eget ables were common drink (Fussell 1949:35).

96
Wages were clearly cruc ial f o r t he se labo rers. A st udy
of pay rates and t heir correlation with the prices of foods
indi c ates that laborers in the early 17th Century spent o ver
50 % of their income on food (Shammas 1983:93). Of course ,
workers in rural areas co uld supplement this with garden
produce, some livestock, wild foods, and poached game, but
the urban dweller could p r obably only keep a tiny garden and
a few fowl. Data suggest that the small but r apidly grow ing
population of poor urban workers depended upon bread,
preserved fish, cheese, butter and a few low quality cut s of
meat for their subsistence (Drummond 1958:100).
Nutritionally, they were probably worse off than their rural
counterparts.
The skilled urban craftsmen , on the other hand,
generally fared much better. Even though they were not self-
sufficient in food, their trades were sufficiently rewarding
to allow them a diet roughly comparable to that of yeomen of
moderate means. One description of the foods eaten by this
group stated that they:
... make greatest account of such meat as they may soonest come by and have it quickliest ready ... Their food consisteth principally in beef and such meat as the butcher selleth, that it to say, mutton, veal, lamb, pork, etc. whereof he findeth great store in the markets adjoining, besides souse, brawn, bacon, fruit, pies of fruit, fowl of sundry sorts, cheese, butter, eggs, etc .. . (Harrison 1968 : 131).
Urban dwellers also ate butter and cheese in increasing
amounts during the 17th Century and consumed breads of higher
quality than in the rural areas (Drummond 1958:105 - 106) .

9 7
More difficult than ident i f y in g t h e type s o f f ood ea ten
by 17th Century En g l i shmen is ascertai nin g from infreq'uent
and imprecise information the quantities in which such foods
were consumed. What information is available has been
synthesized by Jay Anderson (1971:262) who referred to the
daily consumption of adults. His estima t e, which is probably
as accurate as the limited dat a wil l allow, puts the daily
consumption of adults at:
... one - half pound each of butter or cheese, meat or fish, one-quarter pound of porridge meal, one pound of bread, moderate quantities of what ever vegetables and fruits were available, and one gallon of a beverage--skim milk, whey, beer or cider.
Of course, the exact quantities of meat, grain and vegetables
in the diet would tend to vary widely around this average,
depending upon the locale, wealth level of the individual
and the season of the year.
Summary
Late 16th and early 17th Century British diet was based
upon a core group of foods produced through intensive
agriculture and animal husbandry practices. Although
definite regional variations in the agrarian economy existed,
data suggest that there were fundamental similarities in the
diet throughout Britain. Grains used in making bread, beer,
and pottages; dairy products; meat, primarily be e f and pork;
fish; and legumes constituted the key elements in the
subsistence of rich and poor alike. A variety of other foods
supplemented this core diet but they displayed more

98
pronounced seasonal and regional variab ility. Waterfowl and
fresh fish , for example, wer e mor e important in the c oastal
and fen areas, whil e the us e of vegetables was generally
limited to a specific season.
eaten.
Relatively few wild foods were
These foods were clearly ranked in terms of thei r
cultural value, with meat at the top of this value system.
Meat had a distinct status association and the types eaten
along with the quantities and frequency with which it could
be consumed were major demarcators between the diets of the
rich and the poor. Vegetables, on the other hand, were
widely consumed but regarded with lower esteem unless they
were exotic imports.
Although the actual diets varied according to individual
preferences, economic status and the region in which a person
lived, all diets shared a common subsistence tradition based
upon a small group of domesticated plants and animals of
which meat was the premiere component. Immigrants to the
Chesapeake carried the same tradition with them and it thus
provided the framework from which a new subsistence system on
the frontier could emerge.

CHAPTER 3
THE 17TH CENTURY CHESAPEAKE: THE SETTING FOR COLONIZATION
The first successful British colonization in the New
World took place in the Chesapeake region of North America.
In this setting the British first confronted the American
wilderness and struggled to devise ways of adapting to it.
In this chapter, the nature of the Chesapeake environment
will be discussed and some comparison with that of Britain
will be made.
History of the Colonies
The settlement of the Chesapeake has been thoroughly
discussed elsewhere (cf. Craven 1949; Morgan 1975; Carr,
Menard and Peddicord 1978) and for this reason, only a brief
summary of the general facts regarding the colonies of
Virginia and Maryland will be presented here.
The first British settlement was established in May of
1607 when three ships entered the waters of the Chesapeake.
After a brief period of exploration, the settlers chose a
low, marshy island up a large river some 60 miles from the
mouth of the Chesapeake Bay where they established the colony
of Virginia (Figure 2). They named the river the James and
called the first settlement Jamestown in honor of King James,
constructed a fort, and began exploration. Establishment of
99

Figure 2:
;{
I 0 10
~- mile s
100
50
v ....
"<:'
o
The Cheasapeake Bay , Jamestown, and St . Mary' s City
101
a n English claim to territory in the New World was one of
their primary reasons f o r colonization. These first settlers
thought Spain would be a major threat to the new colony
because of Spanish claims to that portion of North America.
A Spanish threat, however, never materialized.
Instead, trouble c ame from the native Indians.
Relat i on s were originally good b etween the British an d the
local Algonquians united under a chief called Powhatan.
Indeed, the colonists bec ame dependent upon the Indians f or
food during the first decad e of settlement. Cultural
difference s between these groups, politics and a domineering
attitude on the part of the English, however, produced
conflict and relations steadily deteriorat e d (Fausz 1977).
Animosities culminated in the "1622 Massacre" during which
several hundred of the colonists and much of their livestock
were killed in a surprise attack. The English quickly
recovered from this, waged a guerrilla style war against the
Indians and subdued them. The Indians attacked the settlers
again in 1644, but this attempt failed and the resulting
counterattacks by the English completely eliminated the
native Indians as a threat to the James River settlements.
Although royal land claims and religious conversion of
the Indians were general reasons given to justify
colonization, the major concern of the Virginia Company,
the enterprise's sponsor, and its settlers was the
acquisition of wealth from the new lands. The first
colonists were apparently so intent upon gaining quick
riches, such as gold, that Virginia was regarded as a
102
t e mp o rary st o pping place, and a mining camp type of mentality
pervaded the original Jamestown settlement (Morgan 1975).
Su ch an attitude, combined with poor leadership, a
conservative attit ud e t oward change and an exceptionally high
death r ate, ma d e th e f i rst decade of settleme n t a fiasc o.
Li t tl e e ffort was e xe rted to p ro duce fo o d sin c e trad e wit h
the Indian s was easi e r, an d c ons eq u e n tl y s t ar vati o n remaine d
a continuing t h re at du ri n g t h e e a r ly y e a rs.
Added to these probl e ms wa s the dif f i culty of f in ding a
suitabl e mark et commodity to sus tai n t h e colon y . Thi s is
always a problem for newly established , market - or i ented
front i ers sinc e t he potential of t he new environm e nt and its
resources canno t be immediately as s ess e d. In Vir g ini a , the
early dreams o f gold, silver and j e we ls wen t un rea lized.
Timber was extraordinarily abundant but its bulk p r ohibited
economical transport to Engl a nd. Furs wer e important during
the first years but were only available in limited
quantities. The solution to the nagging problem of finding a
marketable commodity was finally discov e red in 1612 when John
Rolfe b e ~an exp e r i menting with tobacco. A market already
exist e d for this newly introduced substance in England, where
it commanded high prices, and the Chesapeake climate was well
suited to tobacco production (Herndon 1957). Tobacco was
rapidly adapt e d by th e c olonists a s a market commodity and it
soon became the sole basis of th e Virginia economy. From the
first full cargo of 20,000 pounds sh i pp e d i n 1617, produ c tion
soared to over one million pounds by 1630 and r e ach e d 18

103
million p ounds b y the 1680 s (Herndon 1957) .
Disc o very of a good mar k et co mmodit y , ho wever, did n o t
resolve the many problems of the Virginia settleme nt .
Lea d ersh ip was a recurri n g pr oblem du ring t h e e a rly decades .
Ag e nt s o f th e Virginia Com p an y st ol e compan y s upplies and
labor to amass private fo rt unes. As a consequenc e, th e
company saw littl e profit f rom its inv e stme nt. A very high
death rate wa s a continuing probl e m. After news o f t h e 16 22
Indian Mas sacr e re a che d Eng l and, complaints about th e
Virginia Company increased to such an extent that in 1624 ,
King James revoked the charter. He made Virgi n ia a royal
colony under the leadership of an appointed governor. This
action eventually helped to improv e th e popular perception of
Virginia, and propelled by the profits from tobacco, th e
colony began to grow at a rapid rate. Settlement first
spread beyond the James River in the 1630s and by mid
century, English occupation was well established on every
major tributary of the Chesapeake in Virginia. Jamestown
remained the capital of the colony until 1699 when the
goverment was moved to the healthier site of Williamsburg.
As settlement in Virginia expand e d beyond the Jam e s,
the second Chesapeake colony of Maryland was founded under a
royal charter granted to George Calvert, the first Lord
Baltimore. Maryland was to be a propri e tary colony und e r th e
control of the Calvert family. The colony was e stablished
because the Calverts, who were Catholi c s, desired to creat e a
refuge from the religious hostilities which pervad e d England
at that time. Secondly, they and other investors hoped to
104
ma k e l a rg e pr o f its f r om t h e Mary land v ent u re . Lord Balt imo re
plann e d f o r th e colon y to b e bas e d upon t h e En gl i s h ma norial
s ystem, wit h a hierarchical s ociety r u led by h i mself and
s elect ma noria l lords.
Geo r g e Ca lv e rt di e d b e for e the exp e d it ion could be
organized, but under the direction of his son, Cec ilius,
approximat e ly 150 c olonists sa i le d from England in 1633 .
They reached the waters of the Chesapeake in March 1634 a nd
explored for a suitable settlement location. Expedition
leade r Leonard Calvert negotiated with the local Indians and
purchased land along a small stream just a few miles from th e
mouth of the Potomac River. There, at a place they named
St.Mary's, the colony of Maryland was founded. They
constructed a fort and immediately began to plant crops. It
seems likly that the Cal verts learned from the mistakes of
the Virginia Company and they particularly sought to maintain
good relations with the Indians. Because of this, the fort
proved unnecessary and the colonists gradually dispersed to
build houses scattered along the shores of the nearby
streams.
Although Lord Baltimore had directed that the colonists
develop a diversified economy and a manor - based society,
neither came to be. Tobacco was too lucrative for resources
to be diverted to other enterprises, and the fortunes of
Maryland were soon wedded to that of the "sotweed." Ample
opportunity for immigrants to acquire abundantly available
land made the manorial system unworkable. Despite military

105
and political attacks during the l64 0 s and 165 0 s by
Protestant enemies of the Ca lverts, the colony prosper ed an d
settlement expande d from the capital o f St. Mary's City at a
rapid p ace. Lord Baltimor e was able to r etai n control of the
colony until 1689 when a rebellion by the Prot estant settlers
r es u lted in the monarchs Wil liam and Mary making Mary land a
roya l colony. Shortly aft er this, in 1695, the capital was
moved from St. Mary's City to Annapol is f or polit ical reasons
as well as the more central location of Annapolis.
Geology and Geography of the Chesapeake
The region in which the first colonists settled is
located along the eastern seaboard of the United States
(Figure 3). The Chesapeake is within the Atlantic Coastal
Plain physiographic province and the nature of its geological
makeup is of significance for understanding the region.
Underlying the entire Chesapeake are ancient igneous and
metamorphic rock formations that slope to the east. Upon
this basement of crystalline rock are several thousand feet
of unconsolidated to semi - consolidated Cretaceous and Miocene
sediments. These are topped with a thin mantle of
Pleistocene and Holocene deposits of gravel, sand, clay and
silt (Vokes and Edwards 1968).
The western edge of the coastal plain is defined by the
emergence of the crystalline rock formations from beneath the
thick coastal sediments . These erosion - resistant formations
rise above the coastal plain, causing numerous falls or
rapids where streams cross over. This junction is called

o 10 ~
:
--
0::
Figure 3:
J{
1 mile s Baltimore
MD
106
5 0
.~
The Chesapeake Bay a nd Environs
c:: o
<Q
CJ o

107
the " fall line' and it serves as the dividing line between
the Piedmont and Coastal provinces.
The coastal plain is a l ow, generally flat s u rface with
elevations rarely above 300 feet . Terraces of Pleistocene
ag e provide mos t of the relief and account for a division of
the landscape into lowland and upland areas. The uplands are
level to gently rolling tablelands, which hav e been highly
dissected by streams. Th e lowland terrces are mostly level
or gentle in slope, are smaller in extent, and are not as
dissected by stream action (Vokes 1957; Glaser 1968).
Cutting through the coastal plain sediments are a
series of innundated rivers and streams which flow into the
Chesapeake Bay. The Bay is the most prominent feature of the
entire region and has an important impact upon most aspects
of the environment (see Figure 3). The Chesapeake is of
recent origin, being formed some 10,000 years ago at the end
of the Pleistocene by sea level rise. These marine waters
flooded the Susquehanna River Valley and its tributaries to
form one of the largest estuaries in the world, measuring 195
miles in length and averaging 15 miles in width (Hack 1957;
Wolman 1968). An estuary is defined as a "semi - enclosed body
of water that has a free connection with the open sea and
within which sea water is measurably diluted with fresh water
derived from land drainage" (Pritchard 1967:3). The
Chesapeake conforms precisely with this definition since it
connects at its southern end with the Atlantic Ocean, and the
inflowing salt waters of the ocean are diluted by fresh
waters coming from six major rivers and over 40 secondary

108
tributaries. The ma jo r river systems lie on the western side
of the Bay and are, in order from the south, the James, York,
Rappahannock, Potomac, Patuxent and Susquehanna Rivers.
Innundation of these r iver valleys has produced a body of
water that extends over 2120 square miles of s u rface area but
which is remarkably shallow, with a mean depth of the bay and
its tributaries of 21.4 feet (Wolma n 1968:8 ).
As sea level rose at the end of the Pleistocene an d
created larger bodies of open water, wind - produced wave s
along with tidal action began to erode the uncon soli dat ed
geological deposits of th e coastal plain. Thi s erosion has
produced a heavily indented, sinuous shoreline with many
small creeks, coves and wide bays. The shoreline length of
the Bay and its tributaries in the coastal plain is over 4600
miles (Wolman 1968:8).
One major attribute of this innundated river system,
of which the colonists took advantage, was that it allowed
ocean going ships to travel far inland. European settlements
during the 17th and early 18th Centuries concentrated along
sections of the rivers that wer e subject to daily tidal
action. This tidewater region includes large portions of
Maryland, Virginia and the entire Eastern Shore. On the
western side, this tidal zone extends to just below the fall
line. In terms of modern geography, this is demarcated by a
line through Richmond, Virginia, Washington, D.C, and
Baltimore, Maryland to a point just above the mouth of the
Susquehanna River. Because 17th Century settlement only

109
occurred in the Tidewater Chesapeak e, this study focuses upon
that region.
Climate of the Chesapeake Region
The Chesapeake Tidewater region has a humid, temperate
climate of th e continental type with marked seasonal
v ar iabil i ty (Gibson 1978:2; Hal l 1973). The proximity to the
Atlan tic Ocean and Chesapeake Bay serves t o moderat e winter
and summer temperatures whi le producing high humidity du ri ng
the summe r (Hubbard 1941 :1168 ). Th e Appalachian Moun tains to
the west also moderate win ter temperat ures by diverting major
wint er storms from the region.
Temperature varies in a distinct seasonal patt er n with
the highest temperatures in July and August a nd the lowest in
January and February . John Smith (1907:80 - 84) described the
climate he experienced in early 17th Century Virginia.
The sommer is hot as in Spaine; the winter colde as in Fraunce or England. The heat of sommer is in June, Julie and August, but commonly the coole Breeses asswage the vehemencie of the heat. The chiefe of winter is halfe December, January, February, and halfe March. The colde is extreame sharpe ...
Average January temperature in the Maryland Tidewater is
36°f while the Virginia average is 39°f. Temperatures may
drop to as low as - 15 or - 18°F but these occurrences are
rare. July temperatures in Maryland and Virginia average
76°f and 77°f respectively (Weeks 1941: 909; Hubbard
1941: 1164) . High temperatures range up to 109°f and days
over 100 ° f are common in July and August. Monthly
temperatures for various locations in the region are provided

110
in Table 2.
Directly related to temperature is the length of the
gr owing seas on, defined as the time between the last and
first freezing temperat ur es of the year. The average len gth
of t h e growing season in the Ti d ewater ranges from 19 0 days
near the f all li n e to 230 days around t h e mouth o f the Bay
(Weeks 1941 : 913; Hubbar d 1941: 111 8; Gibson 1968).
Precipitation is on e of the mos t crucial c limatic
variables since vegetation , wildlife a nd agricultural
potenti al are directly link ed to it. In this r egion,
precipitation is abundant and generall y distributed
throughout th e year with no pronounced dry or wet seasons.
Average annual precipitation ranges from 39 to over 48 inches
(Crockett 1974 ; Moyer 1 974) . As Table 3 il lust ra tes,
greater amounts of precip itati on tend to fall in the summe r
than in the winter. There is considerable var i ation from
year to year in rainfall amounts but major droughts or
periods of exceptional rainfall are not common (Weeks
1941: 913) . Data from the central Chesapeake along the
Potomac River suggest, however, that short term droughts
which cause some crop losses occur about one year in three
(Potter 1982:12).
Because no meteorological data from the 17th Century
Chesapeak e exist and there is little information from
England, it is not possible to directly compar e th e climatic
conditions in the colonization area with conditions in the
homeland. Instead, relianc e must tentatively b e placed on
modern data to gain some insight. Such relianc e is not

Table 2 : Average Monthly Temperatures a t Various Locations in the Chesapeake (OF) ,"
Jan. Feb. Mar. Apr. May June July Aug. Sept. Oct. Nov . Dec . YEAR
Annapoli s, Md. 36.1 36.4 43.1 53.8 64.1 73 .2 77 .5 76 . 0 69.9 59.2 48.1 36.6 56 . 3
Cr isfield 39.3 39.9 46.5 56.9 66.9 75.3 79.4 77 .0 71.1 60. 2 52.1 43 . 2 59.1
Solomons 38.5 39.0 44.8 55.2 64.9 73.1 77.1 75.5 69.4 58.8 48.3 38. 5 56.7
Washinton, D.C. 36.9 37.8 44.8 55.7 65.8 74.2 78.2 76.5 69.7 59.0 47.7 38 . 1 57 . 0
Diamond Spring, Va . 43.7 44 .0 50.0 59.1 67.9 75.7 79.0 77.9 73.2 63.2 53 . 5 44.6 61.0 f-' f-' f-'
Hopewell, Va. 41.5 42.7 49.3 59.7 68.5 76.1 79.2 77.8 7 2 . 2 61.3 51.0 41.9 60.1
Norfolk , Va . 41.2 41.6 48.0 58.0 67.5 75.6 78.8 77.5 72.6 62.0 51. 4 42.3 59.7
Richmond, Va. 38.7 39.9 47.7 57.1 67.0 75.1 78.1 76.8 70.2 58.7 48.5 38.7 58 . 1
*Data taken from Moyer ( 1974 ) and Crockett (1974 )
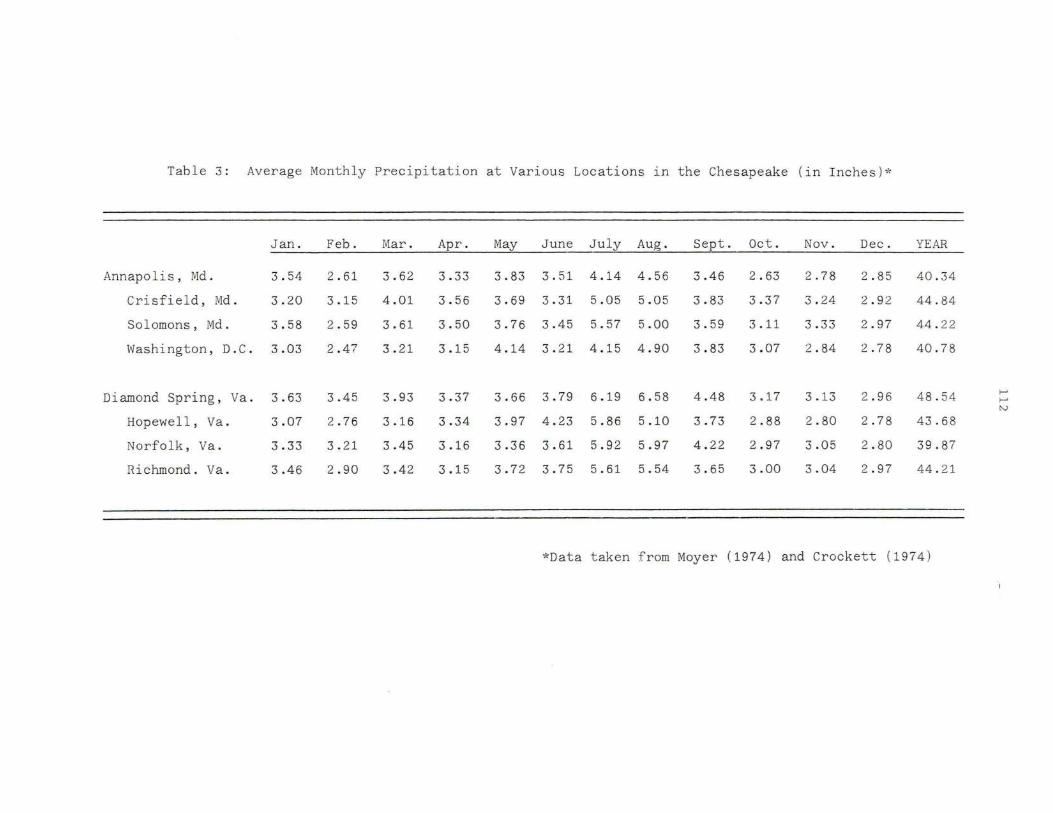
Table 3: Average Mo nthly Precipitation at Various Locations in the Chesapeake (in Inches )*
Jan . Feb. Mar . Apr. May June July Aug. Sept. Oct. Nov. Dec. YEAR
Annapolis, Md. 3.54 2 . 61 3.62 3.33 3.83 3.51 4.14 4.56 3.46 2 .63 2 .78 2 . 85 40 .3 4
Crisfield, Md. 3.20 3.15 4.01 3.56 3.69 3.31 5 .05 5.05 3.83 3.37 3.24 2.92 44 . 84
Solomons, Md. 3.58 2 .59 3.61 3.50 3.76 3.45 5.57 5.00 3.59 3.11 3.33 2 .97 44 . 22
Washington, D.C. 3.03 2.47 3.21 3.15 4.14 3.21 4.15 4.90 3.83 3.07 2 .84 2 .78 40 . 78
Diamond Spring, Va. 3.63 3.45 3.93 3.37 3.66 3.79 6.19 6.58 4.48 3.17 3.13 2 .9 6 48 . 54 f-' f-' N
Hopewell, Va. 3 . 07 2 .76 3.16 3.34 3.97 4.23 5.86 5 . 10 3.73 2.88 2 .80 2 . 78 4 3.6 8
Norfolk, Va. 3.33 3,21 3.45 3.16 3.36 3.61 5.92 5 . 97 4.22 2 . 97 3.05 2 . 80 39.87
Richmond. Va. 3.46 2 .90 3.42 3.15 3.72 3.75 5.61 5.54 3.65 3 . 00 3.04 2 .97 44 . 21
*Data taken from Moyer ( 1974) and Crockett ( 1974 )

1 13
ideal because 1 7 th Century conditions were apparently
sligh tly c oo ler t ha n at present (Lamb 197 7:461 - 6 3 ), b ut b oth
Eu rop e a n d North America appear to have experien c ed these
coo l c ond it io ns at t h e same time. Jo h n Smith re l ated t h at
"In the y e ar e 1607 wa s a n ex traor d i n ary fr os t in most of
Europe and this frost i s found as extreme in Vi r ginia "(Smith
1907:81). Comp a rison of t h e g r owth r ates of bristlecon e pine
trees in California with 17 t h and 18th Centu r y temperatu r e
dat a from cent r al Englan d r eveal a remarkable corresponde nce
which suggest s that the climat i c shift s occu r red on both
continents at about the sam e time (Gates and Mintz 1975:152) .
Although the magnitude of these temperature changes cannot be
determined specifically for the Chesapeake area, it is
unlikely that they were much greater than corresponding
changes found in England.
Comparison of modern temperatures from England and the
Chesapeake is presented in Table 4 and a precipitation
comparison is presented in Table 5 . These comparisons
indicate that the range of temperatures in the Chesapeake is
greater than found in England and temperatures in th e
Chesapeake have more pronounced seasonal shifts. Winter
temperatures differ little but summer temperatures are
markedly higher. Precipitation amounts, on the other hand,
are generally similar, although th e pattern in which
precipitation occurs is different . Peak precipitation in
England is during the autumn and winter with the summer
months having relatively less rain. This situation is
reversed in the Chesapeake where peak rainfall occurs in the

England
Chesapeake
England
Chesapeake
Table 4 : Comparison of Temperatures in England and the Chesapeake (oF)*
.. --
Jan. Feb. Mar . Apr. May June July Aug. Sept. Oct. Nov . Dec. YEAR
38.5 39.4 41.8 46 . 6 52.0 57.5 60.7 59.9 55.9 49.2 42.8 39.6 48 .7
39.5 40.1 46.7 56 . 9 66 . 5 74.7 78.4 76 . 8 71.0 60.3 50 . 0 39. 5 58.5
"'Data taken from Lamb (1972:525), Moyer (1974) and Crockett (1974)
Table 5: Comparison of Precipitation in England and the Chesapeake (in Inch es )*
Jan.
3 . 42
3 . 35
Feb.
2 . 56
2.89
Mar .
2 . 44
3 . 55
Apr.
2 . 20
3 . 32
May June July Aug.
2.40 2.48 3 . 03 3.30
3.76 3 . 60 5 . 31 5.31
Sept. Od.
3.63
3.R4
3.89
3.02
Nov .
3.54
3.02
Dec.
3.5 8
2.88
YEAR
35.90
43 .3 1
*Dat~ taken from Wallen (1970:86), Moyer (1974) and Crockett ( 1974 )
......
......
""

115
s ummer and t h e wi n ter is somewhat drier. These findings
s uggest that adaptation to the Chesapeake climate probably
did not require any major changes b u t t h e min o r climatic
dif f erences were significant. In p articu l ar , the ecol ogical
cycl es which were init iall y u n kn own to the col o ni s ts , s e e m t o
have diffe red fr om t he homeland and i t took time fo r the
colon is t s to lea rn these n ew cyc les. Th e Ches a pe a k e r egi on
wa s no tably wa r mer in t h e summe r bu t as John Sm i th (1907:80)
wrote " The temper a ture of thi s countrie doth agre e well with
Engli s h constitut i ons b eing onc e seas on e d to the count rie " .
Soils
Th e soils found in the Chesapeake r egion are highly
variabl e due to the complex geological proces s es which
create d t hem. Parent materials consist of s e mi - consolida ted
and unconsolidated marine sediments that have been altered by
the action of climate and vegetation . In general, it is a
podzol type of earth which develops under temperate, humid
climat i c conditions and which is usually leached and mildly
acidic in nature (Vokes 1957:149). The combination of
varying parent materials, drainage conditions, ero s ion and
alluvial deposition has produced an intricate patchwork of
soil types in the region. In the uplands, soils range from
sandy clay to loams of medium texture and are generally well
drained except in areas wher e an underlying clay strata or
fragipan exists (Fenneman 1938:25; Glaser 1968; Vokes and
Edwards 1968). Lowland soils consist of loams, sandy loams
and silt loams of light to medium texture that are mostly
116
well drained due to the granular nature of the subsoils
(Vokes and Edwards 1968; Newhouse 1980).
When the English colonists arrived in the early 1600s,
most of these soils were capped with a t hick layer of
exceptiona lly fertile humus. In a description of ear ly
Maryland written in 1635 (Hall 1910:81), J er om e Hawl ey noted
that :
Th e soil generally is very rich ... and in very many places you shall have two foot e of blacke rich mo l d, wherein you shall scarce find a stone, it is like a sifted garden mould ... and under that, there is found good loame ....
Today, this humus cap has been removed by agriculture and
erosional processes so that the soils in the region are
significantly less fertile that those found by the 17th
Century colonists.
Terrestrial Vegetation
A complex mosaic of plant associations and micro -
environments existed in the early Chesapeake but land
clearance, erosion and other factors have acted to
dramatically alter thes e relationships in the past 300 years .
For example, pine is probably much more common today than it
was when the colonists arrived (Braum 1950). In spite of
these changes, it is possibl e to recognize the major
components of the earlier Chesapeake vegetation and these
will be discussed here.
On e of the most pronounced aspects of th e early
Chesapeak e vege tation was the fact that a massive deciduous

117
f or e s t c ov ered t h e land. Descripti on s by the first sett l ers
re vealed somet h ing o f t h e nat ur e of thi s mat u re forest.
Smit h related that:
Virg inia do th aff o r d ma ny excellen t v egitabl e and living Crea t ure s , y et grasse ther e is little or non e bu t wha t groweth in lowe Marshes: for all the Countrey is overgrowne with trees .. . . Th e wood that is most common is Oke a n d Walnut ... (1907: 90) .
A simila r picture is provided by Father Andrew White, who
J ohn
accompanied the first Maryland expedition in 1634. He wrot e
that "All is high woods except where the Indians have clea r ed
for corn" (Hall 1910:45) and that there was:
.... great variety of woods, not choked up with undershrubs but commonly so fare distant from each other as a coach and fower horses may travel without molestation (Hall 1910:40).
Several other colonists also commented upon the lack of thick
understory growth in many areas of the forest (Morgan 1975:56-
58) .
The forest of the Chesapeake Tidewater region is
classified as the Oak-Hickory type by Shelford (1963:56 - 57),
but his work is based upon modern botanical research.
Determining the original composition of this forest is
difficult since there are no uncut stands remaining in the
entire region. Fortunately, one pollen analysis of sediments
from an estuarine pond in St. Mary's City, Maryland has been
conducted and the results can provide some insight. This
palynological record, which extends over a 5000 year period,
indicates that a mixed deciduous forest with some pine
covered the area during the 16th- 18th Centuries (Kraft and

118
Brush 1981:10 - 11). Oak (Quercus sp.) and hickory (Carya sp.)
were the most important genera with maple (Aceri sp.), birch
(Betula sp.), beech (Fagus sp. ) , ash (Fraxinus sp.) and sweet
gum (Liqudamb er sp . ) o f s econdary i mportan c e; toget he r these
genera compri sed the major components o f the forest. Minor
components in the St. Mary 's sample were chestnut (9astanea
sp . ), walnut (Juglans sp.), cedar (Juniperus sp. ) , and a lder
(Alnu s sp.). Based upon a late 19th- early 20th Century
survey of relic stands of timber (Shreve 1910) and modern
vegetat i on in the region (Brush 1980), it i s likely that the
following trees were found in these early forests: whit e
oak, bl ac k oak, pos t oak, southern red oak, chestnut oak,
hickory, sycamore, loblolly pine, virginia pine, red mapl e,
black gum, swee t gum, black locust, tulip p opular , black
walnut and persimmon.
The clear open ground unde r the trees noted by Father
White may have been partia l ly related to the existence of an
old, mature forest setting. It is also likely that the
aboriginal inhabitants contributed to this situation by
periodically burning the fallen leaves, limbs and trees to
drive wild animals or simply to clear out the understory to
facilitate travel (Day 1954). In areas that were excessively
well drained, and thus oft e n dry, this occasional burning
killed the trees along with the other undergrowth and created
small grasslands known as "barrens"(Stone 1982: 13). These
barrens represented another environmental un it that was of
considerable importance because their presence created a
119
forest edge effect which permitted low forage plants to grow.
These forage plants probably ser ved t o increase the number of
de er and other animals that fed upon them (Paradiso
1 969: 171). Amo ng the forest edge species were greenbriars,
maple leaf, viburnum and sassafras. Other non-tree flora
probably included a wid e variety of tho r ns an d haws,
blackberries, strawberries, laurel, pawpaw and black cherry
(Vokes 1957).
Marshes
Wetlan d environment s were and are common in th e
Chesapeake reg i on. They are produced through two processes:
the innundation of land by sea level rise that creates
extensive shallows areas conducive to marsh formation and the
deposition of sediment from upstream land erosion. Two
general types of marsh environments - inland and coastal -
are created by these processes.
Inland marshes or swamps are usually exclusively fresh
water. Most common is a wooded swamp that occurs along
sluggish streams, on low floodplains or in poorly drained
uplands (Lippson 1979:89- 91). These marshes are often
innundated by runoff waters during the spring and summer.
Some of these are characterized by dense growths of deciduous
trees including river birch, sweet gum, black gum, red maple,
willow oak, and swamp oak (Chrysler 1910:163). Other swamps
are more open with fewer large trees but a variety of shrubs
and small trees such as dogwood, alder, black willow and
small red maple (Lippson 1979:89). Less common is an inland
120
open freshwater wetland which is found along the upper
portions of streams in shallow water and above the zone of
tidal ac tion . Plants associated with th is include water
lilies, pondweeds, cattails and a variety of grass es (Lippson
1979: 89).
Coastal marshes tend to be larger, more common and
more diverse than inland marshes; some 20 diffe rent varieties
have been defined (McCormick and Somes 1982). Coastal
marshes are found in large patches today, but geological
evidence from southern Maryland suggests that erosion and
sedimentation caused by land clearance since the 17th Century
have significantly increased the size of some of these
(Froomer 1980). The salinity level of the water is a primary
influence upon coastal marsh vegetation. Wetland plants have
varying tolerances to salt and few are physiologically
adapted to high salinity. Hence, marshes are divided into
fresh, slightly brackish, or brackish types.
Fresh marshes occur in generally shallow waters along
creeks, rivers and bays. They typically occur in the upper
portions of streams where the water is fresh to somewhat
brackish. The soil remains waterlogged year - round and, at
high tide, the bases of plants in them are generally covered
by water (Lippson 1979:88). Plants in these marshes include
a number of grasses or grass - like plants (wildrice, big
cordgrass, common reed, bulrushes, cattails, threesquares),
broad leaved plants (arrow- arum, spatterdock, burreeds,
pickerelweed) and other types including smartweeds, rice
cutgrass and rosemallow (McCormick and Somes 1982). These
121
plants do occur in some pure stands, especially cattail an d
arrow- arum, but they are more c ommonly mixed (Lippson 1979:
88).
Brackish coastal marshes are found along the middle and
lower courses of streams, riv ers and coastal bays. They more
often contain larg e stands of single species than the fresh
marshes, although there is always some mixture of plant
types. Most are high marshes located upon waterlogged soils
which are not innundated except by unusually high tides.
These marshes contain meadow cordgrass/spikegrass, needle
rush, cattail, threesquares, big cordgrass, and marsh elder
(McCormick and Somes 1982:25). Low marshes, on the other
hand, t end to be wholly or partially innundated during daily
high tides. Thes e are typically comprised of large stands of
smooth cordgrass. Water hemp is also a common component of
the low brackish marsh (McCormick and Somes 1982:25;
1969).
Fauna in the Chesapeake Region
In contrast to England, the Chesapeake offered a
Wass
diversity of wildlife to the early colonists. Indeed, the
accounts of John Smith (1907:93 - 95), Andrew White (1910:80-
81), George Alsop (1910:346-348) and other 17th Century
writers emphasized the abundance and variety in which animals
could be found. The Chesapeake ecology has been
significantly altered since that time and many of these
animals can no longer be found in the region. Many of these
now expatriated species,however, are refered to numerous
122
times in historical accounts so that their former presence
can b e established. In the following sections, these species
are discussed in reference to five major habitats found in
t h e Chesapeake region: forests, transitional zones, inland
swamps, c oastal marshes and the aquatic environment .
Chesapeake Mammals
Wil d mammals in the 17th Cen t ur y Chesapeak e were much
more common than in Britain. From the forests, colonists
obtained black bear, several types of squirrels and the
opossum. Comin g out of these woodlands to prey upon domesti c
animal s were gray wolves, bob cats, and an occasional mountain
lion. Along the edges of -s treams, in the barrens, and small
meadows in the forests, and around open fields were found a
few elk, white tailed deer, rabbits, woodchucks and the gray
fox. The wetlands of the Chesapeake yielded beaver, mink,
muskrat and otter. Most of these animals were occasionally
found in the other habitats and one, the raccoon, utilized
all of them (Paradiso 1969; Bailey 1946; Handley and Patton
1947; Lippson 1979). In Table 6, thes e animals are listed by
their primary and secondary habitat preferences and their
scientific names.
The colonists were unfamiliar with most of these
species since England contained so few wild mammals.
Although many of these creatures had been described and
sOllie were even illustrated (cf. Topsell 1607, 1658) it is
unlikely that many of the colonists had any acquaintance
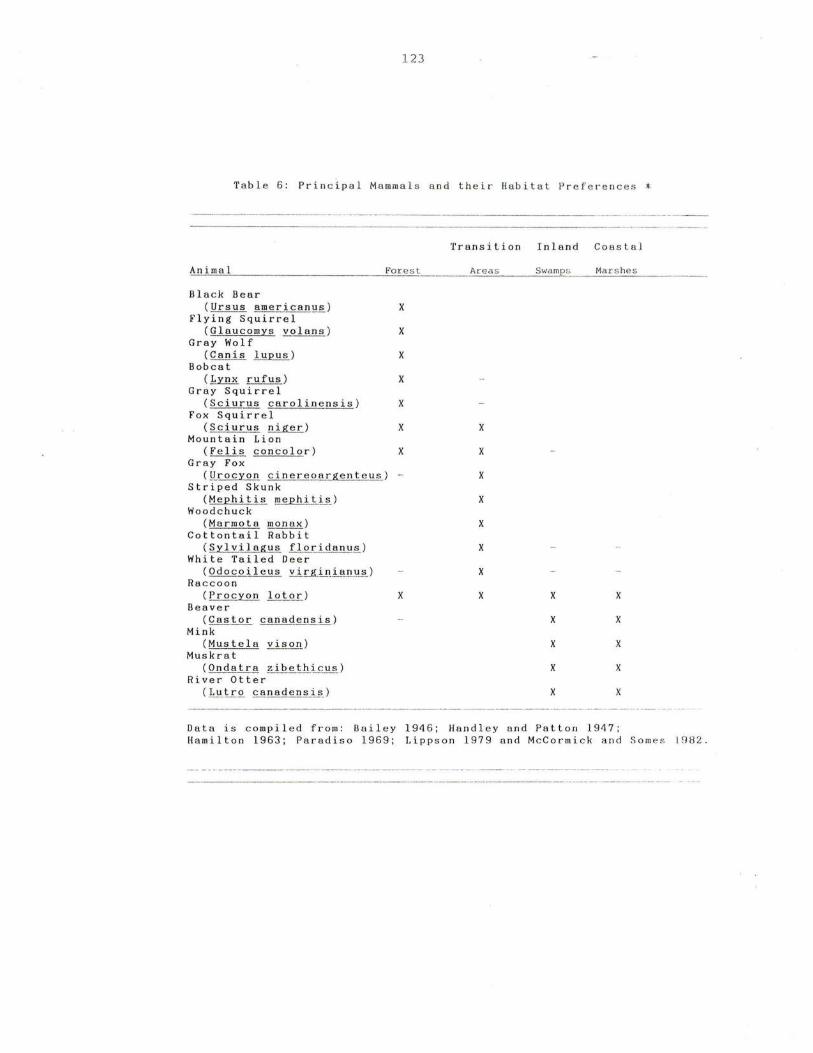
123
Tabl e 6: Prin c ip a l Ma mm als a n d th e ir Ha bit at P r efere nces *
--------------------_._--------- ----------- ----- - ----------_._--_.-
Animal For est
Bla c k Bear (Ursus americanus) X
Flying Squirre- l---(Glaucomys vola~) X
Gray Wolf (Canis lupus) X
Bobcat (Lynx rufus) X
Gray Squirrel (Sciur~ carolinensis) X
Fox Squirrel (Sciurus niger) X
Mountain Lion (Feli~ concolor) X
Gray Fox (Urocyon cinereoargenteus) -
Striped Skunk (Mephi t is mephi t0J
Woodchuck (Marmot a monax)
Cottontail Rabbit (Sylvilagus floridanu~)
White Tailed Deer (Odocoileus vir.1tinia_!!.ll§J
Raccoon ( pro c Y.Q.!!. l.Q.tQ.£)
Beaver (CastoL canadensis)
Mink (Mus tela vis..Q1l)
Muskrat (Onda tra z i b~llii eus)
River Otter (L~tr~ canadensis)
X
Transition Inland Co as t a l
Areas Swamps Mars hes
X
X
X
X
X
X
X
X X x
X X
x X
x x
x x
Data is compiled from: Bailey 1946; Handl e y a nd Patton 1947; Hamilton 1963; Paradiso 1969; Lipp s on 1979 and McCormi c k and S om es 1982 .

124
with them. Exceptions to this were deer , rabbits , and the
f oxe s that were also found in Br itain.
9hesapeake Birds
Many birds were observed by the early colonist s and
some of these were familiar to them while others were
prev i ously unknown. One description of the avifa una appeared
in A Relation o f Maryland (1635)
Of Birds, there is the Eagle, Goshawke,Falcon , Lanner, Sparrow- hawk e and Merlin , also wild Turkeys in great abundanc e, whereof many weigh 50 pounds and upwards ; and of partridge plenty .. . . In Winter ther e is great plenty of Swanes , Cranes, Geese, Herons, Ducke, Teale, Widgeon, Brants, and Pidgeons, with other sorts, whereof there are none in England (Hall 1910:80).
Today there are ov er 380 bird species listed for the
Chesapeake region, and there were probably more in the 17th
century (Gusey 1976:15). Such a large number of species is
found in the region because the Chesapeake is an important
segment of the Atlantic Flyway along which millions of fowl
migrate in the spring and fall of each year. The extensive
marshes and estuarine resources of the Chesapeake attract
many of these birds as feeding and resting grounds during
their annual migrations and some species spend the winter on
the bay (Stewart 1962: Lippson 1979 ) . The principal game
birds are listed in Table 7 .
The largest migratory game birds are the whistling swan
and canada goose, both of which tend to spend most of the
winter on th e bay. Many of th e migratory wat er fowl are ducks

1 25
Table 7: Principal Chesapeake Game Birds by Habitat Preference*
Ope n Fres h Bracki s h Estuar i ne Estua rin e Es tu a rin e In land
Bi rd Bal s Ma r s hes Ma rs hes Swa ml2 s Forest
Whi s tli ng Swan (Olor columbianus) X
Canvasback Duck ( Althla va lisineria) X
Old Squaw (Clangual hlemalis) X
Scoter (Melanitta l2ers]2icillata ) X
Brant (Branta bernicla) X
Ringneck Duck (Althla collaris) X
Coot (Fuli c a americana) X
Redhead Duck (Althla americana ) X
Great er Scaup ( Althla marila) X
Lesser Scaup (Althl a affinis ) X
Canada Goose (Branta canadensis) X X
Mal l ard Duck (Anas ]2latyrhlnchos) X X
Black Duck ( Anas rubril2es) X X X
Green Wing Teal ( Anas carolinensis) X X
Blue Wing Teal (Anas discors) X X
Pintai l Duck ( Anas acuta ) X
Baldpate---( Mareca amer icana) X
Shoveler ( Sl2atula clll2eata ) X
Gadwall ( Anas stre]2era ) X
Wood Duck (A ix sl2onsa ) X
Passenger Pigeon (Ectol2istes migratorius) X
Bobwhite (Colinus virginianus ) X
Mourning Dove (Zenaidura macroura X
Turkey (Mel e agris galloeavo X
X = Primary Habitat - = Se condary Habitat
* Compiled From: Bai l ey 1913; Ste wart a nd Robbins 1958; Ste wart 1962 ; Meanl e y 1975; Lipps on 1979.

126
and these can be divided into two general groups on the basis
of feeding practices and habitat preferences. The diving
ducks feed, as their name implies, by diving under the water
t o obtain submerged aquatic plants, insects, small molluscs
and crustaceans. These birds are found primarily in d eeper,
open water, of te n a considerabl e dis tance fr om sho re . Th ey
i n clude the following ducks: canvasbac k , old squaw, several
types of scoters, the ringneck, a n d the redhead . In
contrast , the surface feeding ducks or dabbl ers seldom dive
f o r food but eat wha t is available within 12 t o 18 inches o f
the water's surface. As a consequenc e, they generally feed
in shallow wat ers close to the shore, e specially in marshy
env ironments. Surface feeders in the Chesapeake incl ud e the
mallard , black duck , baldpate, pintail, shov e l er, a nd gadwall
ducks. Blue and green winged teal also inhabit shallow
waters and are primarily creatures of marsh habitats (Stewart
1962; Robbins and Velzen 1968; Lippson 1979). One extinct
species which had occupied the forests and open woodlands was
the passenger pigeon which traveled through the Chesapeake
region primarily during the fall (Schorger 1973).
Among the avifauna that are found in the region year
round are those that occupy the forests and open woodlands.
Among these are the quail or bobwhite, mourning dove and the
turkey. Oth er birds include water - related species such as
the herons, bit terns, gulls, egrets, ospreys, bald eagle,
red - winged hawk , several types of owls, the t urk ey vultur e,
blackbirds, woodp ec k ers, crows and man y types of songbird s
(S tewart and Robbins 1958).

127
Reptiles and Amphibians
A number of these creatures occur in the Chesapeake Bay
region and most tend to be aquatic. The largest reptile 1S
the atlantic loggerhead turtle that occasionally enters the
Bay from the ocean during the warmer months of the year.
Also found in the water as well as brackish and salt marshes
is the diamond-back terrapin. In freshwater, tidal fresh and
brackish rivers, streams and marshes occur a number of other
turtles including the florida cooter, red bellied terrapin,
snapping turtle, eastern mud turtle and the painted turtle
(McCauley 1945; Schwartz 1967; Hardy 1972a; Bierly 1954).
The only turtle that occupies th e woodlands is the e astern
box turtl e .
Man y oS n a k e s cl w e 11 1 nth e '.I' i rl e w ate r ref( ion, inc L II cl :i. n F{
the blacksnake, kingsoake, milksnake, sev e ral vari e ti e s of
128
water snakes a nd the dangerous copperhead (McCauley 1945). A
large var i ety of s mall a mphibians a lso inhabit the Chesapeake
regi on and these include s mall lizards and s kink s,
salamanders , toads and frogs (Ha rdy 1972b).
Aquatic Animals
The Chesapeake Bay is the most prom inen t natu ral
feature of the reg i on and its waters offered a vast profusion
o f fis h and other crea t ures to the early co lonists.
Ma rylan d settler Jerome Hawley described them.
Th e Sea, the Bayes of Chesopeack ... and generally all the Rivers, doe abound with fish of several sorts; for many of them we have no English names: There are Whales, Sturgeons very large and good, and in great abundance; Grampuses , Porpuses, Mullets, Trouts, Soules, Place, Mackerell , Perch, Crabs, Oysters , Cockles and Mussles; But above all these,the fish that have no English names are the best (Hall 1910:80) .
In 1635,
Modern zoological data support these observations although
the quantity of fish has declined significantly since the
colonial period. Th e most recent tabulation of Chesapeake
fish counts 285 species, but many of these are infrequent
transients from the Atlantic (Musick 1972). The reason for
such abundance is the fact that the Chesapeake is one of the
most productive estuarine systems in the world. Nutrients
brought from the land by the rivers and streams support an
extremely rich flora in the Bay which in turn nourishe s a
diversity of animals. These plants and animals are part of
an extremely complex and dynamic ecosystem with many
variables acting to control their distribution and abundance

129
within t h e system .
The presence of an organism in a particular area of the
Chesapeake is determined by many factors such as temperature,
bottom se dim ent and wa ter t u r b idity, but the most sign ificant
factor is water salinity. Within the estuary, the high
salinity wat ers of the Atlan t ic are gradually diluted b y
fresh water flowing into the Bay from its tributary rive rs.
This dilution effect is obs ervabl e in a salinity gradien t
that extends from the mouth of the Chesapeake up the rivers
to a point just below the fall line. It is possible to
divide this gradient into five zones based upon salt
concentration: 1 ) Tidal Fresh waters « 0.5 parts salt per
thousand of water ("ppt")), 2) Oligohaline waters (0.5 to 5.0
ppt), 3 ) Low Mesohalin e waters (5 .0 to 10.0 ppt), 4) High
Mesoha1ine waters (10.0 to 18.0 ppt) and 5) Polyhaline waters
(18.0 to 30.0 ppt) (Lippson 1979: 14). The significance of
these zones lies in the fact that organisms have varying
salinity tolerances and hence, different species are found
within each zone . As Figures 4 and 5 indicate, the locations
of these salinity zones vary during the year, according to
the quantities of fresh water flowing into th e bay. Salinity
is lowest in the spring when the Tidal Fresh--Oligohaline
boundary may be pushed as much as 20 miles down the bay or a
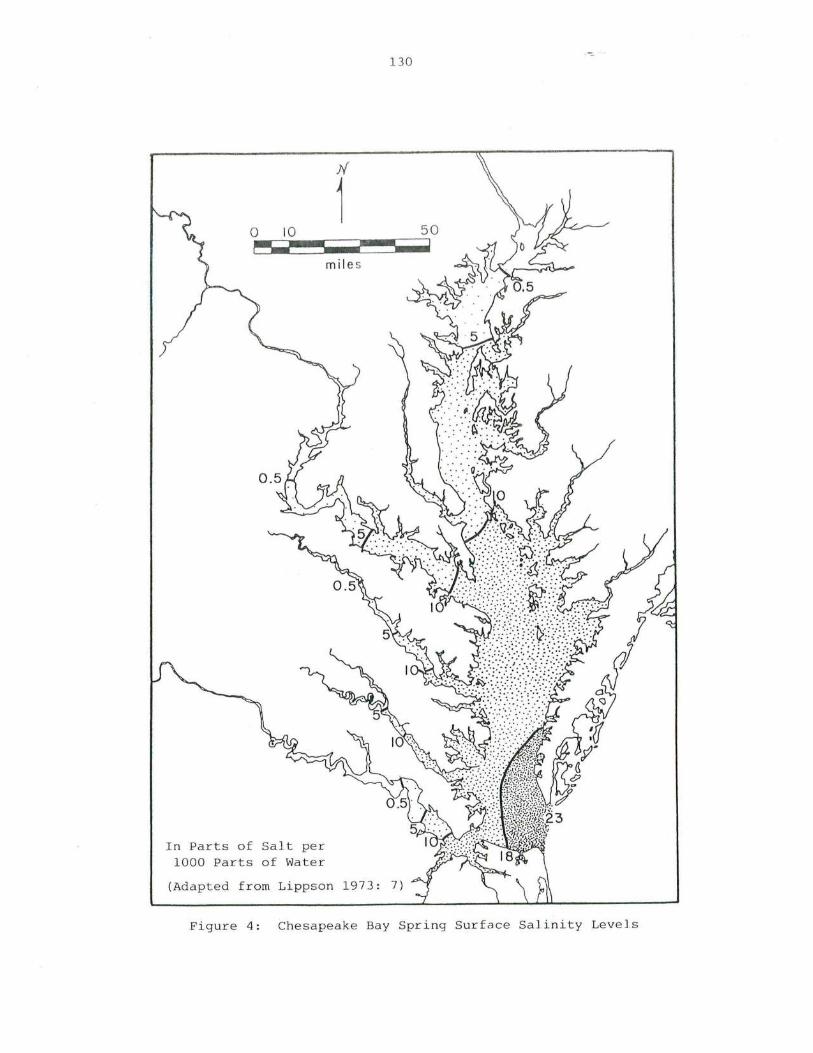
0 10 ~
In Parts of Salt per 1000 Parts of Water
130
;{
1 mil es
(Adapted from Lippson 1973: 7 )
50
Figure 4 : Chesapeake Bay Spring Surface Sal.i n ity Levels
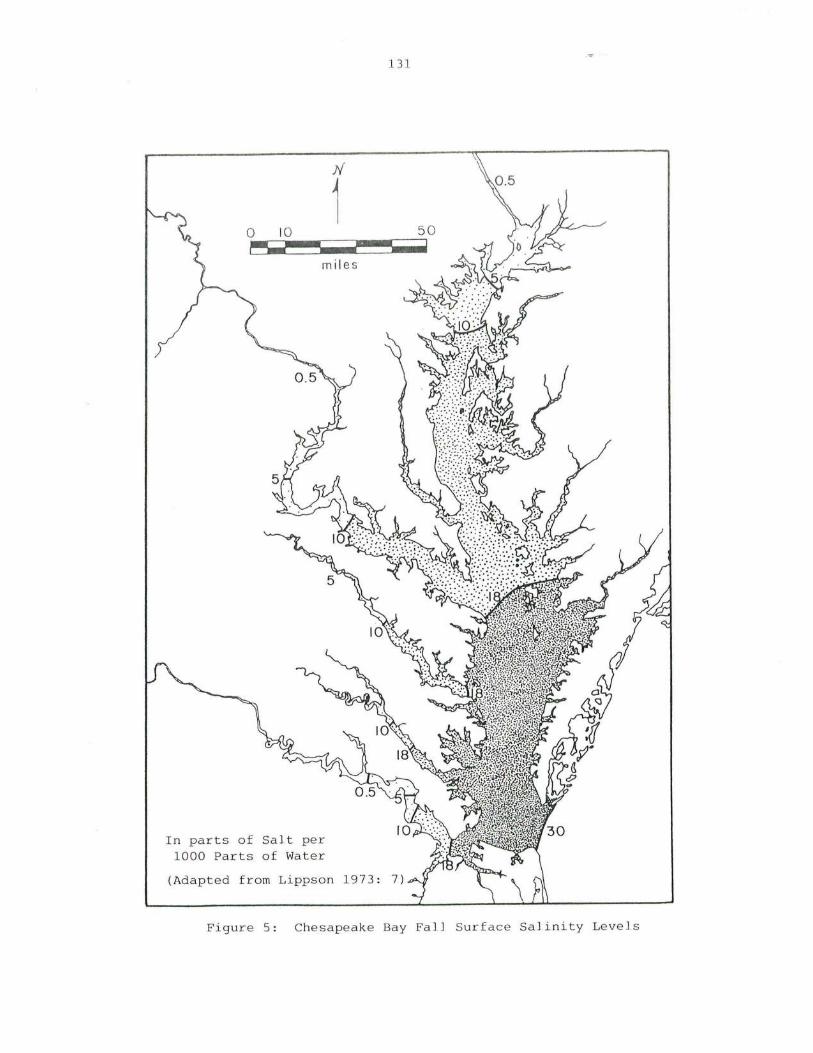
If
1 0 10 ---, r.-
mi l es
In parts of Salt per 1000 Parts of Water
131
(Adapted from Lippson 197 3 : 7)
50
Figure 5 : Chesapeake Bay Fall Surface Salinity Level.s
132
river fr o m its locati o n in the fall. The highest salinitie s
c ommon ly oc c u r in the fall, following dry summer conditions
when the evaporation rate is high.
Te mper ature is the second most influent i al fa ct o r
on Ch e s a peake wildlife. Wa ter temp eratur es cl o sely follow
seasonal changes in a ir t e mp er a t u r e because o f the
sha l lowness of the estuary a nd t r ibutaries (Lipp s o n 1 9 7 9 : 4 7) .
Water tempertur e fluctuat i ons, however, tend t o be much
slower and more moderat e tha n do those of th e air. An i ma l
life cycles a r e closely t ie d to these seasonal shi f ts in
water temperatur e and biolo g ical activity, including f is h
migrations and spawning, is regulated by it. Most animal and
plant activity slows du r in g the lat e autumn and many fish
either migrate from th e bay or move into deeper channe l
habitats where the wat er is warmer. Few aquatic animals ar e
active during the winter. This situation comes to a sudden
end in March as temperatures begin to rise. Animals leave
their winter habitats, other fish enter the bay from the
Atlantic, and spawning begins. Biological activity typically
climbs to a peak between May and September.
Since salinity is the principal determinant of wher e
aquatic species occur, the variable can be employed to divide
the fish into groups. Freshwater fish have a limited salt
tolerance but may occasionally descend into the Oligohaline
zone, especially in the winter and early spring (Lippson
1979:140). Freshwater fish primarily inhabit the upper
portions of rivers and str e ams above th e tidal zone.

13 3
Spawning for these species occurs during the spring and
summe r months in non - tidal waters. Common freshwater species
inc lud e the longnosed gar, cha in picker e l, white sucker,
white catfish, brown bullhead ca tfish, yellow perch, and th e
large mouth bass ( Lippso n 1979; Hilderbrand and Schr oeder
1928).
Estuarine fish, in c ont rast, are adapted to th e full
range of salinities and can go fr om seawater to comple tely
fresh water. They are most c ommon, though , in the
Oligohal ine and higher salinity waters wher e they spawn.
Most of these are small f ish that provide food for preda t o r y
species (Lippson 1979:145). Species include killfishes,
silversides, the bay anchovie, hogchokers, and the oyst er
toadfish .
Dur i ng the warmer months of t he year, many oceanic fish
migrate into the Chesap eak e . Adults occupy the Oligohaline,
Mesohalin e and Polyhaline zones and use the Bay as a feeding
ground. Juveniles may enter the tidal fresh waters during
the early stages of their growth (Lippson 1979:139).
Spawning for these speci es either occurs in the Atlantic or
i n the waters near the mouth of the Bay, and the juvenil es
use the Chesapeake as a nursery area. Among the marine
species are the atlanti c me nhaden, bluefish, spot, atlantic
croaker, sheepshead, weakfish, spotted sea trout, red drum,
black drum, kingfish, and the winter and summer flounders
(Lippson 1979: 155 - 162; Hild ebra nd and Schroeder 1928 ) .
Two additional groups f ound i n the Ch esapeak e ar e the
anadromous and semianadromous fish. Anadromous fish spend

134
most of their lives in the Atlantic but must return to
fresh water to spawn, usually in the spring. After spawning ,
the adults gradually return to t he Atlantic after fee ding in
the bay for a time. Ju veniles remain in the Che sapeak e
durin g th e early stages of their growth. Principal species
of this type are the alewife and blueback herring, the
american and hickory shad, and the atlantic sturgeon (Lippson
1979:164). The semianadromous species are mostly estuarine
oriented, normally resid e in the Oligohaline and Mesohalin e
waters but have spawning behavior similar to the Anadromous
fish. They move into the riverine tidal fresh and fresh
waters during the spring to spawn and then return to the
saltier waters. Chesapeake species ar e the striped bass,
white perch , gizzard shad , and yellow perch (Lippson
1979:164).
Feeding habits form the basis of another important
ecological distinction between fish. Some feed throughout
the water column, often near the surface and are termed
pelagic species. Pelagic types divide into forage fish and
the predator fish that eat them; both tend to live in schools
and can be frequently seen breaking the surface of the water.
Principal forage fish include the killfish, silverside, bay
anchovie and atlantic menhaden, while their predators include
bluefish, striped bass (when young), white p er ch, weakfish,
and spotted seatrout (See Table 8).
Benthic species are oriented toward the bottom of th e
estaury. These types are more common and include the white

l35
Tabl e 8 Distributio n of Major Pelagi c Fish by Sal init y Zone
Species
Longnosed Gar (Lepiaosteus osseus)
Largemouth Bass (Micropterus salmoides)
Pickerel (Esox niger)
Yellow Perch (Perca flavescens)
Bay Anchovie (Anchoa mitchilli)
Atlantic Menhaden (Brevoortia tyrannus)
Silversides (Menidia sp.)
Herring s (Alosa sp.)
American Shad (Alosa sapidissima)
Striped Bass (Morone saxatilis)
White Perch (Morone americana)
Blue Fish (Pomatomus saltatrix)
Kingfish (Menticirrhus sp.)
Weakfish (Cynoscion r e galis)
Spotted Sea Trout (Cynoscion nebulosus)
Tidal Fresh
x
x
x
x
x
x
Salinity Zone
OligoHaline
x
x
x
x
x
x
x
Low High Meso
Haline
x
x
x
x
x
x
x
x
Meso Hal in e
x
x
x
x
x
x
x
x
x
x
x
x = Primary Habitat - = Secondary Habitat
Poly Halin e
x
x
x
x
x
x
x
x
x
x
x
Data Compiled From: Hild e brand a nd Schro ede r 1928; Schwartz 1960, 196 2 , 1964; Lipp so n 1979.

136
Table 9 Distribution of Major Bottom - Oriented Fish and Shellfish
Low High
Species Tidal Fresh
01 igo Haline
Meso Haline
MesoHaline
Poly Halin e
Brown Bullhead (Ictalurus nebulosus)
White Catfish (Ictalurus catus)
White Sucker (Catostomus commersoni)
Gizzard Shad (Dorosoma cepedianum)
Hogchoker (Trinectes maculatus)
Sturgeon (Acipenser oxyrhynchus)
Oyster Toadfish (Opsanus tau)
Spot (Leiostomus xanthurus)
Atlantic Croaker (Micropogon undulatus)
Spade fish (Chaetodipterus faber)
Sheepshead (Archosargus probatocephalus)
Winter Flounder (Pseudpleuronecctes americanus)
Summer Flounder (Paralichthys dentatus)
Black Drum (Pogonias cromis)
Red Drum (Scianops ocellata)
American Oyster (Crassostrea virginica)
Soft-shell Clam (Mya arenaria)
Quahog Clam (Mercenaria mercenaria)
x x
x x
x x
x x x
x x x x
x x x
x x x
x x
x x
x x
x x
x x
x
x
x
x x
x
x = Primary Habitat - = Secondary Habitat Data Compiled From: Hild ebra nd and Schroeder 1928; Richards 1973;
Schwartz 1960, 1962, 1 964 ; Lippson 19 72, 1979.
x
x
x
x
x
x
x
x
x
x
x
x
x
x

1 37
s u c k er , c atf is h , oys t er toa d fish , hogc hok er, sp o t, a tl antic
cro a k e r, she epsh e ad, r e d d r um, bl ac k drum, winter and summer
flound e rs and th e sturgeon. Thes e fish e at th e many benthic
invertebrates such as crustaceans, worms and molluscs
(Hildeb r and and Schroede r 1928; Lippson 1979). Tables 8 and
9 present the distribution s of pelagic and benthic sp e cies by
salinity zones along wi th t he s cientific names fo r each.
Besides fish, the Chesapeake contains a variety of
molluscs and crustacean s which the colonists noted in th e ir
descriptions. Molluscs include the American oyster, hard
clam, and the softshell clam. The largest crustaceans ar e
the blue crab, which is especially prolific in the
Chesapeake, and the horsesho e crab.
These then were th e chief resources available to the
newly arrived settlers. While some of the species resembled
European varieties sufficiently for the colonists to
recognize them, most were unknown. Aside from these new
animals, one of the most striking differences between the
Chesapeake and Britain was the sheer abundance of wildlif e
availabl e . How the colonists utilized these resources will
be investigated in a later chapter, but first there remains
one final element in the Chesapeake environment that has not
yet been consider e d - - th e aboriginal peoples.
The Chesapeake Indians
When th e colonists arrived i n the Bay, they found th e
land sparsely occupied by Algonquian - speaking Indians.
Native peoples ar e of significanc e in this study of

138
colonization for t wo major reas on s. First, they were a
pot ential threat to the colonies existence, a menace that
bec a me a reality during the "1622 Mass acre". The threat
a lon e of hosti le action may have limited or precluded the us e
of certain subsistence resources by t h e colonists. Second,
the Ind ian s h ad developed an efficient adaptation to th e
Chesapeake environment and their expertise regarding th is
natura l environment was of great potential value to the
colon is ts trying to cope with it for the first time. These
Indians were a subjec t o f interest to a number of the
colonists who left a small but d eta iled body of ethnohisto r ic
data which is of gr e a t us e in understanding their culture.
This record has been thoroughly described and studied by
several scholars (McCar y 1957; Garrow 1974; Turner 1976;
Fausz 1977; Feest 1978; Potter 1982) and will not be repeated
in great detail here. Instead, a brief summary of the more
relevant facts concerning Tidewater Algonquian settlement and
subsistence will be provided.
The Indian population of the Tidewater Chesapeake at
the beginning of European settlement has been estimated at
between 20 and 25,000 individuals (Feest 1973). Dispersed
village settlements, sca ttere d along th e rivers and streams
of the Chesapeake characteri ze d the region. The most
distinctive feature of the political organization of the
Virginia Tidewater Indians was a chiefdom that encompassed
the James and York Riv ers and pro bably the Rappahannock
(Turner 1976; Potter 1982) . Th is chiefdom, often incorrectly
referred to as a "confe deracy," was controlled by Powhatan.

l3 9
Under him wer e district chiefs known as "werowances" who
ruled local populations, paid tribute to Powhatan and
supplied him with warriors. Along the Potomac River in
Maryland, the va rious Algonquian - speaking groups were united
under an entity known as th e "Conoy". This was probably
another chiefdom, although much smaller t han that of Powhatan
(Potter 1982: 45-46). The major chief of this group was
called a "tayac" while the less powerful district chiefs were
"wizoes".
In spite of political differences, the Indians of
Maryland and Virginia appear to have been quite similar in
most respects. All lived either in villages where the
Werowance or Wizoes resided or in smaller hamlets.
According to John Smith (1907:101), settlement sizes ranged
from two to 100 houses. Domestic structures were longhouses
which were not tightly grouped together except in fortified
villages. Historical and archaeological evidence indicates
that these villages were located near streams and rivers, on
high ground with freshwater springs and marshland in the
vicinity, and next to or upon lands of good agricultural
potential (Turner 1976:137 - 138).
The subsistence system of the Chesapeake Tidewater
Algonquians was complex and based upon the utilization of a
variety of plants and animals. Domesticated plants, which
occupied a major role in the diet, included corn or "maize,"
beans, squash, pumpkins, gourds and sunflowers. Maize was
probably the most important crop (Garrow 1974; Feest
140
1978:258). Turner (1976:182 - 185) has argued that corn
contributed fifty percent or more of the Indians' annual
diet. Th ese plants were produced through slash- and - burn
cultivation met hods. Trees were girdled nea r their bases by
removing the bark. Later the ground was burned to clear it
of leaves, brush and dead wood . The soil was broken up with
wooden hoes and the seeds planted wi th digging sticks in
April, May and June. Corn and beans were often planted
together in fields that reportedly ranged in size from 20 to
2 0 0 acres (Smith 1907:95 - 96), while the other crops were
grown in smaller gardens.
The seasonal cycle of subsistence incorporated ma ny
wild plants and animals. During the early spring, anadromous
fish , turkeys, some deer, oysters, nuts and acorns were
prominent in the diet. Corn and beans stored from the
previous season were probably still consumed although those
supplies may have been low. In May and June, many wild
berries such as strawberries and mulberries ripened and were
added to the diet (Smith 1907: 102; Garrow 1974). The summer
diet consisted of many kinds of fish, deer, turkeys, crabs,
green corn, nuts, a starchy tuber called tocknough, and
berries.
ripened.
In the late summer, squash and other garden crops
Harvest of the major crops began in September and
continued to November, which was the principal period of
feasting and population aggregation. The diet during this
period included corn and beans, waterfowl, acorns, nuts,
deer and some fish (Garrow 1974:22 - 26). In the late fall and
winter, hunting expeditions went up rivers to th e inland

141
areas where major deer drive s, often using fir e , were
conducted. In addition to ma ny d eer , some b ear a nd sma ll er
mammals were killed in these driv es. Corn and b ean s
continued to be eaten dur ing the winter along with occ asional
turkeys and waterfowl (Garrow 1974:22 - 26; Potter 1982:79 - 82).
Deer and fish were extremely i mportant to the Indians
and a number of methods were employed to obtain them. De er
were taken by stalking, deadfalls, drives and fire surrounds.
Fishing was conducted using weirs, nets, hook and line, bow
and arrrow, and spears. It appears that the natives
primarily utilized the anadromous species, non - migratory Bay
fish and the marine species (Smith 1907:103).
Two Indian activites proved especially fortuitous
for the colonists. The Indian practice of establ is hing
villages, clearing fields, and then moving to a new location
as the soils became exhausted or weed infested created
openings in the forest. These "old Indian fields" were the
f o cus of early colonial settlement wherever they existed
(Pory 19 0 7: 283; Stone 1982; Stephen Potter: Personal
Communication 1983). They provided a c lear e d area upon which
buildings could be easily constructed and the first season's
crops planted, thereby reducing to some extent th e labor
required in beginning a plantation. In addi t ion, these
abandoned fields created a forest edge effect that allowed a
variety of browse plants to grow. This increased the
preferred food supply of the Whit e Tailed Deer and may have
served to increase the abundance of this animal.

142
More widespread, and probably of even greater
significance, was the aboriginal practice of burnin g to d r iv e
game o r clear the forest floor. Several ear ly writers
commen ted upon the open nature of the forest floor ( Smith
1907; Hall 1910:40, 79). Th e ecol ogical effect of this
burning, as noted by Day (1954) and Paradiso (1969), would
have been to greatly enlarge the e dg e environment, thereby
tending to increase the number of edge animals such as deer.
Cronon (1983) has found that the forests of New England were
heavily modified by this pr a ctice and it is probable that the
Chesapeake forests were similarly modified. Hence, the
colonists seem to have entered a woodland environment that
was not completely "primeval", but which had been
purposefully altered and was probably richer in potential
food resources than it would have been otherwise.
Summary
This chapter has considered the nature of the
Chesapeake environment and the plant and animal resources it
offered to the colonists. How different was this from their
homeland of Britain? In general, the Chesapeake shares many
attributes of the British climate. Both are temperate
climates with similar amounts of precipitation, although the
Chesapeake temperatures in the summer were markedly warmer.
The British were accustomed to deciduous forests, even though
their woodlands were open and not directly comparable to the
mature forests of the Chesapeake. Many of the plants and
animals were sufficiently similar to British types for the

14 3
first settlers to recognize them. Mi gratory waterfowl also
vis ite d t h e shores of Britain during the spring and fall of
th e year and portio ns of the Thames and other rivers were
est ua rine.
end.
With these characteristics, however, the similarities
The ecological cycles seem to have been different in
such features as rainfall patterns. As noted in Chapter 2,
most of Britain was pastoral or agrarian with only a few
remnant woodlands of large size. Although the data are
scant, it is likely that most of the Chesapeake settlers came
from these pastoral or agricultural areas (Horn 1979) .
Grappling with a thick, mature forest such as covered the
Chesapeake lands was almost c e rtainly beyond the experience
of most of the colonists. The wide diversity of wild animals
in the Chesapeak e was an even greater contrast from their
homeland, since only a few varieties of land animals existed
in Britain. The most striking differences for the new
settlers, however were probably the unaccustomed abundance of
resources and the presence of an alien human culure within
the area being settled.
In some aspects the Chesapeake was not a completely
unfamiliar, unknown setting for the colonists. A number of
similarities in general aspects of the environment probably
permitted some traditional English practices to be applied.
There was, however, a greater number of differences that
required new approaches. With these differences and
similarities firmly in mind, attention will now be turned to
the colonial society which evolved in this new environment.

CHAPTER 4
17TH CENTURY CHESAPE AKE SOCI ETY AND THE COLONIZATION PRO CESS
The pre v ious section discussed the physical aspects o f
the Chesapeake area but not the society created by the
colonists adapting to it. In this chapter, the major
characteristics of colonia l Chesapeake society and the trends
of change it experienced will be set forth. An attempt will
be made to determine whether these characteristics and
changes correlate with the colonization model presented in
Chapter 1.
Although the broad outlines of Chesapeake history have
long been known, it is only within the past two decades that
systematic research by archaeologists and historians has
explored the evolution of these colonies in an attempt to
understand them in a holistic manner. Archaeological
excavations, which began with the work at Jamestown and St.
Mary's City (Forman 1938; Cotter 1958), have increased in
both number and scale since 1970 and are beginning to provide
a new perspective on colonization in the region (cf. Carson
1981). During the late 1960s, historical study of the
Chesapeake underwent a renaissance and major new invest
igations have been conducted into the nature of economy and
society in the 17th Century colonies (Tate 1979). Utilizing
144

145
th e fra gmentar y do c um en t ary r ec o rd, h is to ria n s h a v e no w
i d entifie d t h e sa li e n t c h aracter is tic s o f t h e Ch e sap e ak e
fron tie r, the r e by p r oviding a f irm b asis of knowl e dg e upon
whi c h t o bu i l d thi s study .
Besides enhan c ing ou r und e rstand i ng of colonial
history, thes e recen t findings are important because th e y
permit the applicability of t he colonization model to the
Chesapeake to be asses s ed. In an earlier study, Lewis (1975)
investigated the colonization process with data from
Jamestown and concluded that a "frontier model" did apply .
However, his study was hampered by insufficient and
unreliable data and a vast quantity of new information has
become available since then. Therefore, it seems appropriate
to review the salient characteristics of the 17th Century
Chesapeake in light of the colonization model presented
earlier.
17th Century Settlement Patterns
One of the most distinctive features of the early
Chesapeake in the eyes of contemporaries was the almost
complete absence of towns or villages and the highly
dispersed nature of settlement. This stood in marked
contrast to much of contemporary Britain and Europe wher e
population concentration in villages and towns was the norm
(Blum 1982). Only two settlements of any size existed in the
region, the colonial c apitals of Jamestown in Virginia and
St. Mary's City in Maryland. In terms of the colonization
model, both can be classified as frontier towns, even though
they were not centers of economic activity. At its peak,
146
Jamestow n had a permanent population of perhaps 5 00 people
wh ile St. Mary's City had about 2 00 residents (Carr 1974:
128). For comparison, the avera ge population of English
villages during this time ha s been esti mated at 200 (Blum
1982:13). Both St. Mary' s City and Jamestown were primarily
political and administrativ e centers with relatively minor
economic roles (Carr 1974).
Most of the colonists lived on isolated farms or
"plantations" scattered along th e shor es of the Tidewater
streams. These plantations were generally not huge estate s
but small farms of a few hundred acres or less, which wer e
typically occupied by the owner. In Maryland, land holdings
generally ranged between 50 and 250 acres (Wyckoff 1937),
although much larger estates of thousands of acres did exist.
In Surry County, Virginia, estates of less than 500 acres
were the most common throughout the 17th Century (Kelly
1972:130). The dispersed nature of the plantations and th e ir
proximity to the water was noted by several contemporary
observers. One Virginia referenc e of 1649 noted that:
They have in th e colony Pinnances, Barkes great and small boats many hundreds, for most of their Plantations stand upon River sides or up little creeks, and but a small way into the land so that for transportation and fishing they use many boats (Wodenth 1947:6).
A 1678 description of th e Maryland settleme nt s by Gov e rnor
Charles Calvert revealed the same coastal orientation and
dispersed natur e of the plantations:

147
The people there not affec tin g to build n ere each other But soe as to hav e their houses nere the Watters for convenienc e of trade and their lands on each Syde of and behynde their houses by which it happ e ns that in most plac es there are not fifty houses in the spac e of Thirty miles (Archives of Maryland 5:266).
The earliest cartographic evidence of the Chesapeake
settlement syst e m is a remarkable map drawn by Au gustine
Herman in 1670. The map illustrated th e entire Chesapeake
Bay region with exceptional detail and clearly indicated
houses scattered along the shores of rivers and creeks. A
portion of this extraordinary document, showing "St. Mary's"
in the upper right hand corner, is presented in Figure 6. A
study of the 2586 houses illustrated on this map revealed
that they were nearly equally distributed along rivers \
(46.9%) and creeks (45.2%) with only 8% found on the
Chesapeake Bay proper (Smolek and Clark 1982).
Archaeological research has recently confirmed the
accuracy of this map and indicated other characteristics of
the settlement pattern. A survey of all known 17th Century
sites in the Bay region revealed that the typical site
location is remarkably close to navigable water. For
Virginia, half of all the sites are within 500 feet of the
modern shorelin e and only 1% occur a mile or mor e away from
water. Maryland sites display a similar pattern with 43%
within 500 feet of th e shore. Confirmed sit es in Virgini a
number 182 and there are 37 sites in Maryland (Smolek and
Clark 1982).

148
I: i g lll 'C G: I'o l 't . i C) l l cd ' i\ II I.', I I S I . i I lL. Il e l ' llI<ln' s I ti 7 () Mal' ( ," (' \ I L'S; i1 H'; ti<l: 1\<1.)'

149
Why did th e Chesap e ak e s e ttlement system dev e lop in
this dispersed pattern and why were there so few towns? The
colonization model pr e d i ct s t hat dispersed settlements should
occur on a frontier, e s p e cially during the early phases, but
villages and towns ar e also expected to develop. In the
Chesapeake, this process of settlement evolution seems to
have been retarded; towns did not prosper until the 18th
Century (Reps 1972). Two principal factors served to
intensify the dispersed settlement pattern and deter town
formation -- the geography of the Chesapeake and the tobacco
economy. The Chesapeake is perhaps the largest natural
harbor in the world and virtually every portion of the
Tidewater region lies within easy access of navigable water.
The fact that this excellent natural transportation system
had an influence upon settlement location was recognized by
the colonists themselves. Robert Beverley, a native born
Virginian, wrote in 1705 that the dispersed settlement
pattern was due to:
The ambition that each man had of being Lord of a vast, tho' unimproved territory, together with the Advantage of the many Rivers, which afford a commodious Road for Shipping at every man's Door (1947:57).
Further enhancing the value of the water routes to Chesapeake
planters was a landscape dissected by numerous creeks and
marshes which made land travel difficult, especially given
the poorly developed road network and small number of
bridges. The fact that tobacco was a bulky crop vulnerable
to damage during land transportation made water conveyance

150
even more desirable (Menard 1975:61).
Partially due to the availability of this water
transportation, a decentralized marketing system developed
wh ich alleviated the need for commercial establishments.
Each year European ships, or smaller vessels, came to each
i nd ivi dua l plantation to collect the annual tobacco crop in
exchange for merchandise, thereby giving practically every
p lanter equal access to the European market. A few l oc al
merchants did attempt to collect some t obacco in central
l oc a tions, and any planter li ving away from the water ha d to
arrange fo r the transportation of hi s crop, often through one
of these merchants. Mos t trade, however, occurred directly
between an English merchant' s agent, often the ship's
captain, and the planter, thus obviating the need for a
middlemen (Carr 1974).
With such a marketing system, and the relatively small
amounts of capital available in the Chesapeake, there were
few stores where goods could be purchased. A planter's needs
for manufactured goods and other merchandise were met by
ships sailing directly from Europe and consequently there was
little local manufacturing which might have contributed to
town development. Few specialized craftsmen worked in the
Chesapeake economy. The only commonly found craftsmen were
joiners, carpenters, and housewrights, who constructed homes
and tobacco barns, along with coopers who produced the large
wooden barrels called hogsheads in which tobacco was shipped.
Such a situation fits precisely with the frontier
characteristic of cultural simplification.
151
Tobacco and the Chesapeake Economy
Tobacco not onl y in fl u e nced the s e ttl e ment system, but
it had a p rofo und effect u p on most o t her aspects of 17th
Cen t ury Chesapeake life. Tobacco was so much the main stay o f
the economy that the region was called the "Tobacco Coast".
Tobacco was an attractive crop to the colonists for several
reasons. Initially, it brought high prices. During the
early years of commercial production, one man's efforts with
tobacco returned about six times more profit than could be
obtained from wheat (Herndon 1957:3). Little equipment was
necessary to grow, harvest, or process the crop, so that
capital outlay for materials was low. It gave a high yield
per acre, an important point because the labor costs of land
clearance were high. The Ch e sapeake climat e was well suited
to its production with sufficient rainfall and proper
temperatures. Tobacco was not so bulky that shipping costs
were prohibitive. Finally, a rapidly expanding market for
the crop existed in Europe.
Dependence upon a single crop as the foundation of the
economy had a major drawback, however, since any variation 1n
price on the European markets had an immediat e and direct
impact upon the entire Chesapeake economy. Besides the
normal agrarian risks of drought and storms, the tobacco
planter's economic welfare was highly susceptible to
downturns in European economic activity, saturation of the
market due to overproduction and international conflicts
which disrupted trade. The overall trend in tobacco prices
throughout the 17th Century was downward, but the prices

152
moved in a distinct cyclical patt ern (Menard 1975:280). From
the first tremendous boom around 1620, the Chesapeake economy
experienced recurring periods of prosperity and depression at
regular intervals of approximately 22 years between boom
times. Prosperity occurred in the mid - 1630s, mid- 1650s, the
late 1670s, around 1700, and about 1720 (Menard 1975:310 -
312). During the depress i ons , attempts were made to limit
production so as to reduce the supply and thereby increase
prices, but these attempts failed each time. Planters
generally responded by producing more tobacco in an attempt
to keep their incomes from falling, thereby pumping still
more tobacco into an already saturated market (Menard 1975:
290) . Half-hearted attempts to diversify the economy were
made during the depressions but for most of the century,
these efforts failed; as soon as prices rose, planters
returned to tobacco. From a careful study of the timing of
these changes in price, Menard (1975) has been able to
demonstrate significant correlations between tobacco profits
and other aspects of the colonial society such as labor
supply, availability of capital and credit, and land
acquisition rates. Cl e arly the pulse of Chesapeake society
was controlled in large measure by the price of tobacco.
The agricultural approach used in tobacco production
was a long term fallow system of shifting cultivation. Since
tobacco rapidly depletes the soil by heavy consumption of
nitrogen and potash, it could only be grown for three or four
years on a plot before the land became exhausted (Craven
153
19 26:32). Alternatives s u ch as manuring were known bu t c ow
d u ng was t hough t to impart a strong taste to the t ob acco that
smokers found unpleasant. Thus, a large quantity of land was
necessary t o grow tobacco and this was readily available in
the Chesapeake. Af ter a fi eld had been depleted from growing
the "sotweed", good corn crops could be obtained from it for
another year or two, and after that, the land was abandoned
for a period of 15 to 20 years. This fallow time permitted
replenishment of the soil's fertility and it could once again
produce good crops of t obacco (Earle 1975:25). One effect of
using an agricultural system which required large amounts of
land was that the distances between individual plantations
tended to be necessarily large, thus accentuating and
prolonging the pattern of disp ersed settlement.
As might be expected, the annual cycle of activities
was dominated by the requirements of tobacco production (cf.
Herndon 1957; Clayton 1965; Earle 1975). The cycle began in
February or March when a seed bed was prepared in which to
start the plants. At the same time, work began to prepare
new land and the already established fields for planting.
Slash- and - burn agriculture was employed to clear the largely
deciduous forest. The colonists probably adopted the method
from the local Indians. Girdling the trees and later burning
the fallen leaves and undergrowth serv e d to clear the land as
well as to release nutrients into the soil. Ground was
broken up and worked with hoes almost exclusively (Earl e
1975:27 - 28), so that th e only essential tools needed for
growing tobacco were hoes and an axe . Plows wer e seldom used

1 54
becau se of the man y tr e e stump s. S in ce only fiv e or six
years worth of crops c o uld be expected from any plot o f land,
there was i nsufficient time f o r the stumps to rot, and t h e
short produ cti o n peri o d d i d n o t warrant t h e e xpendit u r e o f
labo r to remov e t h e m.
Transplan t in g of the s ma ll t ob a cco plant s fr om the se ed
bed occurred in May when they were pl a ced i nto sm a ll "h i lls"
sp a ced a pproximately four feet apart . During the s ummer
months, repeated cultivation and inspection of the plants wa s
nec e ssary to control weeds and tobacco worm infestations. By
July or early August, the upper portions of th e plants ne e d e d
to be broken off or "topped" so tha t seeds would not form,
and the large bottom or ground leaves wer e removed. Thes e
actions caused the plant to put en e rgy into leaf production,
thereby giving a better yield.
By the end of the summer, the tobacco was ready to
harvest. This entailed the severing of each plant at its
base, carrying the plants to a barn where the plants wer e
attached to long stick, and then hanging these sticks in th e
barn to allow the tobacco to slowly air cure. Curing
normally took until late October or early November wh e n the
tobacco was taken down , and the leaves wer e strippe d from the
stalks and packed into large wood e n hogsheads for shipment.
These operations wer e timed f or completion by lat e November
or early December when the ships of the "tobacco fleet "
arrived to collect th e year's c rop.

1 55
What is particularly relevant in the above discussion
is the fact that tobacco production required a great deal of
attention throughout most of the year a n d was an extremely
l a b or intensive cr op. Productivity per worker varie d
a ccord i n g to so il c ondi ti on s , weat h er , and th e me tho ds u sed,
but a crop o f 1500 pounds p e r work e r was con si d e r e d t ypica l
b y the second h a lf o f th e 1 7 t h Centu ry (Men a rd 1975:320;
Morgan 1975:143). Th is me a n t that each laborer had to plant,
cultiv a te, insp e ct, top, and harvest ov e r 10,000 individual
plant s . In addit ion, the sam e worker was ex p ec te d to pl a n t ,
tend, and harvest several a cres of corn and beans .
Immigration and the Labo r SupplY.
Wh e n dependence upon a very labor intensive crop is
combined with the tremendous effort needed to c l e a r a
wilderness and establish a new society, it follows tha t a
labor shortage would occur. The Chesapeak e coloni e s
experienced such a shortage throughout most of the 17th
Century (Menard 1975:90), exactly as predicted by the
colonization model. Labor costs were sharply higher than in
Britain, and wages in th e Chesap e ake were sometimes so high,
th e y n e arly equaled what a worker could be exp e cted to
produce (Carr and Me nard 1979:213). On e example of th e
central rol e of labor comes from Surry County, Virginia. In
that c ounty during the 1680s, it ha s b e en e stimat e d tha t
nearly 90% of the total investment in toba c co production was
for labor (K e lly 1972:213). With land ea s i ly a v a ilab le , and
minimal equipment n e eded to rais e tobac c o, control of a

156
supply of labor was the key to economic success and the real
measure of wealth in the Chesapeake colonies.
Where did the planters obtain these workers? Most of
the laborers in the 17th Century were English indentured
servants. These individuals agreed to work for a specified
period of years, usually four or fi ve, in exchange for their
passage to the New World. Of the estimated 150,000 persons
who immigrated to the Chesapeake colonies in the 1600s,
between 70% and 85% arrived as servants (Menard 1975:162;
Horn 1979:51 - 54). Some individuals were able to pay their
own passage and arrived as free men, but most immigrants had
to spend their first years toiling for a planter who took all
profits of the servants' labor. Families also came to the
Chesapeake, but their numbers were quite small when compared
to th e number of single immigrants.
Much research has been directed toward determining the
origins and character of these servants (Campbell 1959;
Menard 1977a; Salerno 1979; Galenson 1978; Horn 1979), which
has revealed that they came from all portions of England and
Wales, and a few from Scotland and Ireland. Throughout the
century, the ports of London and Bristol were responsible for
the bulk of the servant trade. Liverpool became important
only during the final decades of the century. Lists of
servants sailing from these ports constitute the best
information available regarding their origins, occupations,
and social backgrounds. Although they came from all portions
of Britain, the vast majority of the emmigrants originated in
the southeastern sections of England, near London, and in the

1 57
West c o u ntry, especially the area surrounding Bristol (Horn
1 979:66 ) . Th e Br i stol and Liv e rpool l i st s in dicate th a t
nearly h alf of th e immi gran ts came fro m v i l lages, on e qu a rter
t o on e th i rd f rom s ma ll mar ke t town s , and th e remainder
ori gi nat e d in l a rge r urban commun it i es (Hor n 1979:68) .
The social origin of th e s e serv a n t immigrants h a s b ee n
the subject o f debate, bu t i t is now agreed t ha t mos t were
"commoners" the offsprin g of y e om e n farmers, tradesm e n,
small merchan t s - - not p a upers, convicts, or vagabounds fro m
the lowest stratum of English soc ie ty (Campbell 1959;
Galenson 1978) . One of the f e w me asures of i mmigrant status
comes from the occupations of the immigrants listed in the
port books of Bri s tol and London. The trades of many ar e not
listed and it has been suggested that up to half were only
semi - skilled or unskilled worker s (Gal e nson 1978:502). The
remainder had a wide diversity of occupations with some 66
different trades listed in one register alone. A majority
had agricultural backgrounds (46 . 9%), but a significant
numb e r were skilled in text i l e manufacture (14.5%) and othe r
trades such as leatherworking, construction , and
metalworking. Fe wer immigrants who e mbarked from London had
agricultural backgrounds but they displayed a like diversity
of trades.
Most of th e immigr a nts from English port s we r e young,
single adults. Betw e en 70% and 80% of them we r e l e ss than 25
years of ag e (Horn 1979:6 2 ). I n addition, the population
displayed a pronounced s e xual imbalance, with males greatly

158
predominant. The proportion of male to female servants was
as high as 6: 1 in 1635 and remained at 3:1 or slight l y less
until the end of the century (Menard 1975:194). Whil e a
population skewed t oward young males is typical of frontiers,
i t is likely that the tobacco econ omy intensified and
prolonged thi s general tendency. Young males were considered
capable of gr ea test productivity in the tobacco fields, and
consequently English merchants and ship captains emphasized
recruitment of them (Horn 1979:63).
Recruiting servants was relatively eas y during the
first three quart e rs of the 17th Century, due to several
factors. During the first half of the century, England
experienced a high rate of population growth while a
recurring series of crop failures took place (Craven
1971:20). These events produced a sharp rise in food prices
and a fall in the purchasing power of wages. Unemployment
significantly increased due to increased population, the
enclosure movement, and a major depression in one of
England's prime industries -- textile production (Horn
1979:75; Salerno 1979). All of these factors worked in
unison to propel a stream of migrants to the Chesapeake
colonies in search of better opportunities. While religious
and political persecution helped swell the stream of
immigrants, and specific individual factors, such as the loss
of support through the death of parents, or escaping
prosecution for a crime also contributed to the peopling of
the colonies, lack of economic opportunity was the primary
motivating factor.
1 59
Popul ation growth sl ow ed and the Engl ish econ omy
i mp roved in the mid - 17th Century , thereby reduci n g the
unemployment problem. Consequently , fewer individuals were
willin g to e migrat e from England . At the same time, there
was a constantly increasing demand for mor e labor in the
Chesapeake a s 1 ) indentured servan ts were freed and
replacements were sought, and 2) Free dmen ( ex-servants)
established plantations of their own and sought their own
servants. Th e founding of new colonies in the Carolinas and
Pennsylvania intensified this problem by siphoning off a
significant portion of the servants that were available. The
combined outcome of these factors was a sharp reduction in
the availabil ity of servants from the middling ranks of
English society after about 1670 (Menard 1977b:344).
This problem became acute after 1680 and in response,
recruiters began sending servants of a strikingly different
social origin the poor , the Irish, and convicts -- to meet
the planters' labor needs. These efforts were not totally
successful, however, and the planters began turning to
African slaves for labor. Menard (1975, 1977b) has presented
a convincing argument that this sever e labor problem
accounted for the adoption of slavery in the Chesapeake.
Beginning about 1680, the small population of slaves expanded
dramatically and climbed from roughly 5% of the population to
nearly 20% by 1710 (Menard 1977b:381). Evidence from
Maryland indicates the rapidity with which this transition in
th e labor forc e took plac e. Th e ratio of English servants

160
to slaves in probate inventories dated 1674 - 1679 was 4: 1
while 20 years later it was 1:4 (Menard 1977b:337). During
mos t of the 17th century, though, it wa s English me n a n d
wom en who voluntarily spent years in s ervitude for a chanc e
of soci al and eco nomic advancement in th e New Wo r ld.
Oppo rt unit y is predict e d to b e a k ey c ha racteristic of
c oloni zati on , bu t how real was it for th e British i mmi grants
to the Ch esapeake? The documentary record suggests that
opportuni ty was s ubst a n tial for most of the 17th Century and
th e region was an excellent "p oor man' s country." Car r an d
Menard (19 79) h a v e demonst rat ed that Maryland s erv ants who
be came free during th e middle third of the century had
excellent chances of becoming landowners, establishing
households, and even purchasing servants of their own. New ly
released servants known as "free dmen" could, by working for a
few years as paid laborers or as sharecroppers, accumulate
sufficient capital to purchase land, livestock, and household
necessities. Freed s ervant s also had political opportunities
that wer e far greater than they could have ever expected in
Britain. Maryland freedmen during the 1640 - 1680 p er iod
served on juri es and held many minor goverment offices; some
were elected to the Assembly and two were e ven appoint e d to
the Governor ' s Council (Jordan 1979:266). Virginia
immigrants similarly e xp erienc e d substantial political
opportunity, especially b efore 1670, and several former
servant s we r e elected to th e House of Burgesses and held
other goverment offices (Morgan 1975:209). Immigrants to the
Chesapeak e had excellent prosp ec ts for upward economic and

161
social mob ility, if they lived lo n g e nough .
Li fe ... ~ln~L !.Lea t r! ._Q_~ . _.t.h~ _ ~nl~!§' .~p_~_f! k ~
On e of the most stri k ing asp ects of t h e Ch esapea k e wa s
t h e dramatically high death ra t e experienced by t h e
colonists . High mortality is a common characte ris ti c of
fron t iers but it reached truly ex ceptional proportions in
Maryland and Virginia. All newly arrived colonists und erwent
a "seasoning" period during which they physiologically
adapted to the new disease e nvironment , climate, and di et .
There are no accurate statistics on the number who died
during seasoning, but contemporary accounts suggest that it
was substantial. Walsh (1977:130) estimated that between 20%
and 40% of the indentured servants in Charles County,
Maryland died before completing their terms. In Virginia
between 1618 and 1624, the estimated annual death rate was a
staggering 28%, and it ranged upwards to 37% in the Jamestown
area (Earle 1979: 118). The Jamestown figure was probably
exceptional but mortality still remained at 14% for the next
decade. Even if a servant managed to survive seasoning and
the years of indenture, lif e expect ancy remained short.
Walsh and Menard (1974:220 - 224) have constructed life tables
for Maryland immigrants during the 17th Century which reveal
that a 20-year - old man could only expect to live another 20
to 24 years. Women may hav e experienced slightly longer
lifespans. Life expectancy was less than in England and from
10 to 20 years shorter than an individual c ould expect in the
New England colonies. Child mortality is poorly documented

162
but estimates suggest that from 40% to 55% of the children
born in the Chesapea k e colo n ies died before they reached 20
years .
High mortality rates were probably du e to multipl e
ca uses. Malaria seems to h ave been a major dis ease , striking
be t ween March a nd December wh e n th e mosquito populations were
active (Rutman and Rutman 19 76 ). This disease c ould affect a
large portion of the population during the season of peak
agricultural ac ti vity, thereby potentially disrupting
planting and p ossibly cau sing the ec onomic ruin of a sma l l
planter if he and/or h is servants were stricken . Malaria
itself, howev er , was probably not an especially v irulen t
killer; it served to weaken the body's defenses and mad e the
person more vulnerabl e to other diseases such as typhoid,
influenza, and dysentery (Rutman and Rutman 1976:50); Walsh
and Menard 1974: 225; Earle 1979).
The exceptional death rate has far reaching
implications. The risks and costs of importing servants
wer e increased since the servants might die before any labor
could be extracted from them, thus resulting in a total loss
of th e planters' investment. The social implications,
however, are especially profound. In one Maryland county,
half of all the record e d marriages ended within seven years
du e to death of one of the partners (Walsh 1979:128 ). For
children, nearl y three fourths of thos e studied lost on e
parent befor e th e y reached the age of 21 and almost 20% were
orphans before the age of 13 (Rutman a nd Rutman 1979: 158 ,
161) . A tremendous amount of instability was thus

163
interjected into an already unstable frontier situation. As
a co n sequ e n ce , the maturation of Chesapeake society was mad e
e v e n more difficult and the transmission of c ultu ral
traditions from e lders to youth was severely hindered (Rutman
a nd Rutman 1979 : Walsh 1979).
Despite this death rate, the population of the
colonies expanded at a rapid pace, fueled largely by
immigration. Growth had begun slowly. In 1622, there were
only 1240 Europeans living in Virginia, even though a total
of 4270 people h a d come to the colony (Morgan 1975:101).
From this low, the number of inhabitants climbed to over 8000
by 1640. With the founding of th e Maryland colony,
population growth became even more rapid. Over 35,000
colonists lived in th e Chesap e k e by 1660, a nd the 100,000
mark was reached by the end of the century the increase
fueled partially by immigration and partially by natura l
popUlation growth (Menard 1977a:88).
Annual growth rates reveal the magnitude of this
increase. The Virginia population increased at a rate of
over 33% per y ea r betwee n 1624 and 1634 and remained at
nearly 10% over the next two decades (Morgan 1975:404).
Maryland's experience was n ear ly th e same with an annual
increase of over 25% betwe e n 1648 and 1657 and over 14%
during the 1660s (Menard 1975: 215). By c omparison,
England's population during the lat e 16th and early 17th
Centuri es grew at a rate whi c h averaged 0.4% to 0.5 % annually
(Menard 1977b: 378). Th e c olonization model predi c ts that a

164
frontier society will normally display rapid, even explosive
population growth, and this was undeniably the case in t h e
Chesapeake.
Development of a Stable Socie~
Clearly the Chesapeake colonies displayed many of the
characteristics predicted for a society involved in
colonization. It rema i n s to establish how long the process
continued and when a stable, non -fronti er socie ty developed.
Determination of the beginning point o f the process is a
simple matter for it is the founding da te of the colony. The
ending date, however, is not as precisely defin ed or easily
determined. The coloni zati on model fortunately suggests
several features that should signify th e termination of the
process. One important marker should b e the achievement of
population growth through natural increase, since a key
indicator of adaptiveness is a viable, reproducing
population. Although the Chesapeake colonies grew at a rapid
rate during the 17th Century, this growth was due primarily
to immigration and not to reproduction. Only in the final
decades of the century did the population b eg in to grow by
natural increase (Menard 1975:160; Morgan 1975:409 - 410) . Why
was this crucial achievement in the colonization process
delayed so long?
Four factors seem to hav e been responsible for the slow
accomplishment of reproductive incr ease: 1) high mortality,
2) late age of marriage, 3) the skewed immi gra nt sex ratio,
and 4) low fertility (Menard 1977a:92 ). Th e high death rat e

165
for immigrants clearly hindered reproduction but the nearly
50% death rate for children was cr uci al . The s ho rtage of
women throughout mo st of the centur y obviously limited the
potential for increase. Data from Sou th en Mary land for t he
period 1635 - 1650 indicate that over 60 % of t he men who left
wills wer e unmarried. This number declined appreciably over
the second half of the century , but sti l l over 20% of the men
who died during that time were unmarried (Menard 1977a:95).
Compounding the problem was the fact that most women in the
colony lost a significant portion of their child - bearing
years due to the necessity of working as servants for four or
five years after their arrival. Many of the immigrant women
were in their mid- twenties before they began reproducing
(Carr and Walsh 1977:551). The prevalence of malaria and the
high child mortality rate imply that women exper ienced
chronic ill health, especially during pregnancy, which
almost certainly lowered fertility (Rutman and Rutman 1976;
Menard 1977a: 95). Anyone of these factors could have
limited reproductive increase, but with all of them operating
simultaneously, the reproductive potential of the Chesapeake
population was severely curtailed.
Probably the most significant element ~n the final
achievement of a viably reproducing population was an
increase in th e number of Chesapeake-born individuals (Walsh
and Menard 1974). Although reproductive rates had been low
throughout the century, a significant number of native born
children did survive to adulthod. These individuals were
better adapted to the disease environment and native born men

166
experienced longer lives than their immigrant fat h ers; the
experience of wom e n in this regard is still uncl ear. Th e sex
ratio of native borns wa s essentially equal, and since the
women did not need to spend years completing an indenture,
they could marry much earlier and so had longer reproductive
spans. Historical data suggest that Chesapeake born
indiv iduals increased rapidly durin g the last decades of the
century and they became the majority of the population just
before 1700 (Menard 1977a:98). The establishment of this
native born majority was aided by a decrease in the number of
British immigrants during the last decades of the century and
emigration of many newly freed men from the Chesapeake to the
new colonies of Pennsylvani a and the Carolinas (Menard
1975:417).
Population density should also increase as the frontier
is settled and this is significant because higher densities
allow more community development and greater social
interaction. Data from two portions of the Maryland colony,
St. Mary's County and All Hallow's Parish (near Annapolis)
are available and given in Table 10.
These densities were calculated using the estimated
population and the amount of land purchased and surveyed;
this is the land that was probably a t least marginally
utilized. The large, uninhab i ted, and essentially unused
interior sections have be e n excluded since thes e were not
settled until the 18th Ce ntury. Although there was clearly
regional variation, Maryland data and information from
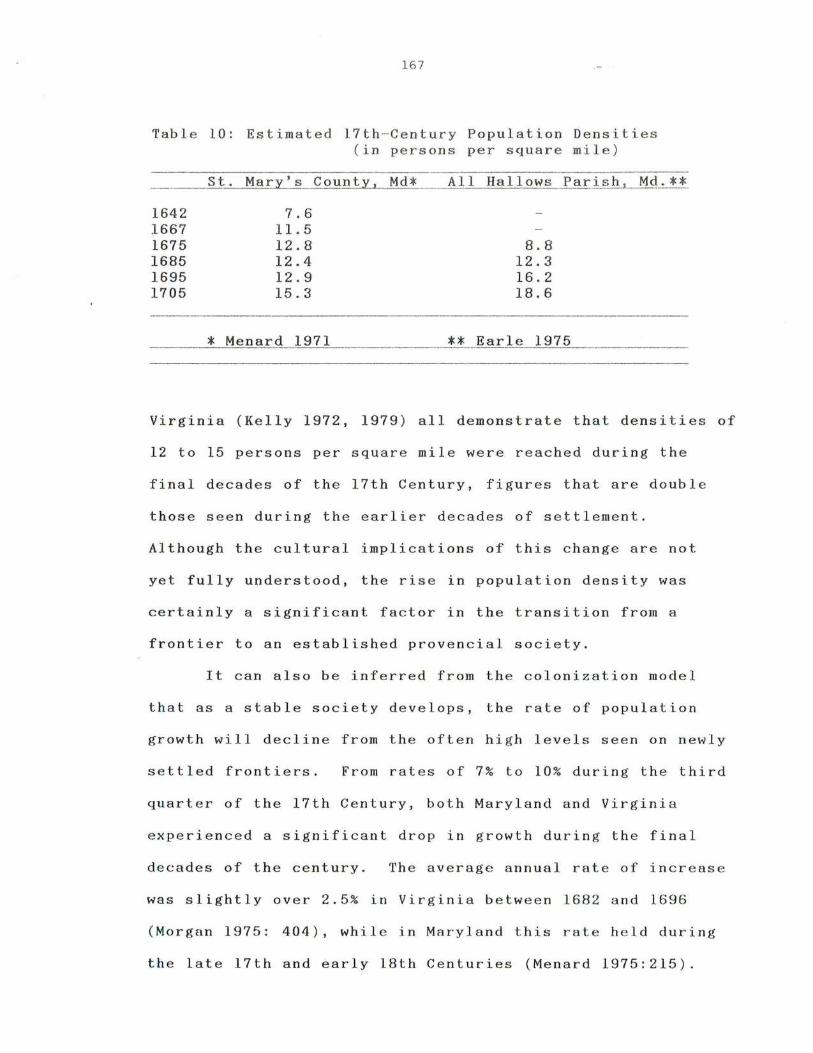
167
Tabl e 10 : Esti mated 17t h- Centu ry Popul at ion De nsitie s (i n per sons pe r s quar e mi le )
___ ---=S:....:t==-.:...-::.::Mc;:a:..::r:....y'--' -=s--,C::....0::cu=n:...:t:"'Y<--L-' ~M:..:::d'-'*'--_-'-'A:...:l"--l=---=.:H:..::a::..:l=-=-l =-.:0 w s Pa r is h . Md . * *
1642 1667 1675 1685 1695 1705
7.6 11.5 12.8 12.4 12.9 15.3
* Menard 1971
8.8 12 . 3 16. 2 18.6
** Earl e 1975
Virginia (K e lly 1972, 1979 ) all demonstrat e that densi tie s of
12 to 15 persons per squar e mile were reached during the
final decades of the 17th Century, figures that are doubl e
those seen during the earlier decades of settlement.
Although the cultural implications of this change are not
yet fully understood, the rise in population density was
certainly a significant factor in the transition from a
frontier to an established provencial society.
It can also be inferred from the colonization model
that as a stable society develops, the rate of population
growth will decline from th e oft e n high l e v e ls seen on newly
settled frontiers. From rates of 7% to 10% during the third
quarter of the 17th Ce ntury, both Maryland and Virgini a
exp e rienced a significant drop in growth during th e final
d e cades of the century. Th e av e rag e annual rat e o f in c r e a se
was slightly over 2.5 % in Virginia between 1682 and 1696
(Morgan 1975 : 404) , whil e i n Ma ryland this rat e h e ld during
the late 17th and early 18th Centuries (Menard 1975:215).

168
When compared to the 25% and 33% growth rates which prevailed
during the early decades of settlement, these late 17th
century figures clearly indicate that a major reduction had
occurred. Thus, all of the available demographic dat a
indicate that the proces s o f colonization was te rminating in
the Tidewater Chesapeake just before 1700.
evidenc e support this?
Does othe r
The colonization model also predicts tha t opportuni ty
in the settled region will decline, social stratification
wil l become more pronounced , and social structure will become
much less flexible as th e process is ending. Historical
research indicates that these changes did, in fact, occur in
the Chesapeake during the late 17th Century. As noted
earlier, the immigrants to this area during the second and
third quarters of the 17th Century experienced substantial
opportunity for social advancement and wealth accumulation.
Maryland in the 1650s and 1660s was a relatively open
society of farmers among whom social distinctions were not
pronounced. Although there were rich men, former servants
and poor immigrants helped form a growing, upwardly mobile
group of "middling" planters (Menard, Harris and Carr
1974 : 182 - 184; Menard 1975:233). Virginia also saw the rise
of planters from humble origins who established plantations
and accumulated substantial estates during the same period
(Morgan 1975). Opportunity began to slowly decline during
the late 1660s, and became pronounced by the 1680s, resulting
in th e emigration of freedmen from the Chesapeake to other

169
c olonies durin g th e late 1680s a n d 1690s (Carr and Menard
1979:233 - 236). A major depression in the tob acco e conomy
1680 clearly influ e nc e d th e magnitud e of this decline in
opportunity and had a major impact upon the entir e Chesapeake
regi on.
This ch ange in opportunity can be measured in several
ways, one of which is the rate of tenancy. During the mid-
1600s, land occupied by tenants in southern Maryland
comprised about 10% of all holdings. For most of these
individuals, this was an intermediate status until they c ould
save money to purchase land of their own. Tenancy was thus
a step of capital a ccumulation in the process o f land
acquisition and eventual economic success. By the early 18th
Century, howeve r, almost 30% of the households wer e on l eased
land; for most of these individuals, the status of tenant was
becoming more or less permanent (Menard 1975: 425 - 426). A
similar decline occurred in Virginia. In Surry County, over
37% of the homes were occupied by tenants in the early 1700s
(Morgan 1975:221).
Another gauge of declining opportunity lies in th e
distribution of labor ownership. In mid-17th Century
Maryland, many small planters wer e able to purchas e a few
servants. Indeed, over half of all the servants listed in
southern Maryland for this period were owned by planters
whose total wealth was less than 200 pounds sterling (Menard
1975:431).
30 years.
This situation alt ere d dramatically over the n ext
By the early 18th Century, more than half of th e
labor supply was in large estates valued at ov er 700 pounds

17 0
sterling and nearly on e third of the workers were on
plantations which owned 20 or more laborers . Three decades
earlier, only 6.5% of the workers were owned by such large
plantations. Labor, th e most direct source of wealth in the
colonial Chesapeak e, b e cam e concen trated in t h e hands of t he
rich over time.
The change in labor distribution wen t hand in hand with
the rise of el it es in the col onies, especially as the native
born individuals inherited est ate s from their parents. This
familial conc en tration of land and power wa s quite clearly
expressed in political affairs. The gap between the elected
rulers and the ruled was not extreme before about 1680. Many
small planters and even newly freed servants sat on juries,
served in goverment offices, and were elected to the
to the Assembly. These individuals had quite extraordinary
political opportunities compared to their counterparts in
England (Jordan 1979:248). As the 17th Century ended,
however, opportunities declined and power became increasingly
concentrated in the hands of the wealthy, native born
planters . The chances for small planters of modest means to
participate in goverment significantly diminished as wealth
and family connections rose to central importance in the
political process. The rapidity of this change is indicated
by the composition of Maryland's elected goverment. Native
born individuals comprised less than 2% of the Assembly
members between 1660 and 1689 but over half of the Assembly
was made up of native born sons by 1700 - 1715 (Jordan
1979:252). These members also began to serve longer terms

17l
and therefore, ha d gr eater opportunities to ac c umulat e
polit ica l power. On e important effect of this longer service
was that a measure of continuity and stability was finally
achieved in provincial politics. These shifts in opportunity
and power can probabl y be considered indicative of a
fundamental change in the nature of social status from be i ng
largely det ermi n ed by achivement to being mo re ascribed
(Menard 1975:434). This change can, in turn, be related to
the development of a more rigid social structure which is
predicted by the colonization model.
These shifts toward greater stability and a more
hierarchical society are important indications of the
compl eti on of the fronti er process. On e significant
characteristic predicted by the model, however, has not yet
been considered - - that of increasing cultural complexity.
Investigation of the colonial economy should provide some
insight regarding this because, over most of the century, the
economy was extremely simple. As noted earlier, a single
money crop, tobacco, dominated commerce and English merchants
controlled the trade. Planters were dependent upon England
for practically all manufactur e d goods. As a result, ther e
was virtually no economic buffer to protect th e colonists
from downturns in th e tobacco trade. Efforts were made to
diversify the economies of Vir ginia and Maryland many times
during the 17th Century, but these met with littl e success
(Morgan 1975; Carr 1974). Onl y during the final decades of
the century did indications of increased eco nomic div ersity

172
and complexity begin to appear.
This can be illustrated by examining a single locality
Al l Hallow's Parish , near Annapolis, Mar yland (Earl e 1975).
Settlement began in the 1650s and this parish was typical of
the tobacco coast with disp ersed plantations and a tobacco
based economy. No evidence exists for craft activity du ring
the first 25 years of settlement in the Par ish. Change
occurred in the late 1680s when the first blacksmith and
millwright started working there . Shipbuilding also began
about this time and by the end of the century, it was a
significant activity in the parish (Earle 1975: 68,93). In
the early 18th Century, woodworking and commercial activities
increased and some concentration of these occurred in the
settlement of Londont6wn. Even more noticeable was a
diversification in farming from just tobacco to other crops,
especially wheat. Wheat was prominent in the parish economy
by the early 18th Century and it made new methods of
agriculture, particularly the use of plows and harrows,
necessary. Estate inventories reveal that plows became
common only after about 1710 (Earle 1975:122). At the same
time, the All Hallow's planters began raising sheep in
greater numbers and tools for the spinning and carding of
wool appear more frequently in inventories. All of this
resulted in a mixed, more diversified economy that was not as
totally at the mercy of the tobacco merchants and the
European market.
Similar efforts at ec onomi c diversification began to
appear throughout Maryland at about this time. Sheep raising
173
a nd wool spinning increased markedly betwe en 1680 an d 1710
and crafts such as shoemaking b ega n to app ear, at l east in
the more wealthy households (Carr a nd Menard 1979:215). Many
Maryland counties a dded whea t to the ir agricultural products
during the last decades of the century (Main 1977:142), and
on the Eastern Shore of Maryland a pattern of economic
diversification and intercolonial trade appeared in the early
169 0 s (Clements 1977:153). Still another signal of greater
economic development was th e establishment in the 1690s of a
few stores operated year - round in Maryland, with greater
numbers of thes e stores appearing after the turn of the 18th
Century (Carr 1974: 143). Shipbuilding activities also
increased in Virginia and Maryland during this period (Evans
1957:26-29). While tobacco remained the mainstay and the
early 18th Century economy cannot be described as fully
diversified, there were important signs of the development of
more local crafts and a more mixed agriculture than had been
t he case during most of the 17th Century.
Increased complexity is also apparent in other aspects
of the culture. One example is the establishment of a
printing press at St. Mary's City in 1685, thus introducing
this highly skilled craft to the region. Regular postal
service was initiated between the Potomac River and
Philadelphia in 1695 (Scharf 1966:361). Creation of
educational institutions is also an indicator of both
cultural stabilization and increased complexity. Virginia
contained an increasing number of private schools by the late
174
17th Century (Ames 1957), and priva t e schools in Maryland
were functioning before t h e 168 0 s (Earle 195 7). Within three
years of each other, Virginia and Maryland established
publicly suppo r ted institutions, t he College of William and
Mary at Williamsburg in 1695, and King William's Free School
(the predecessor of St. John's College) at Annapolis in 1696
(Ames 1957:28; Scharf 1966:353).
All of the available e vidence suggest that a major
transformation occurred in Chesapeake society during the
final decades of the 17th Century . Within 20 years, th e
native born became a majority of the population, natural
population incr ease occurred, and a measure of cul t ural
stability occurred . At the same time, opportunity
significantly declin e d; the economy began to diversify; and
cultural complexity increased while the social structure
became less flexible, and a ruling elite emerged. All of
these changes are predicted as indications of the close of
the colonization process in a region. These factors' nearly
simultaneous appearance throughout the Tidewater Chesapeake
strongly suggests that the process of colonization ended
during the ca. 1680 - 1700 period.
From the above discussion, it is obvious that the model
of colonization presented in Chapter 1 is applicable to the
Chesapeake region. While the 17th Century Chesapeake has
long been recognized as a frontier, clear demonstration that
the colonization process operated the re was necessary before
this study could proceed. This exercise has set forth th e
key attributes of the Chesapeak e culture and e stablished a

175
factual foundation for exploring and attempti n g to und ersta nd
the subsisten ce practices of the colonists. Subsistence and
t h e data used to explore that subject are no w adressed .

CHAPTER 5
SOURCES OF INSIGHT: THE HISTORICAL AND ARCHAEOLOGICAL RECORDS
In this chapter, the data used to test the hypotheses
proposed at the beginning of this dissertation will be
discussed. Relevant historical materials and archaeological
collections will be described and the methods used in
analysis outlined. First, however, some consideration of the
information obtainable in the documentary record is
necessary.
The Need For Archaeological Data
Given the fact that the 17th Century is a period
encompassed by written history, it might be expected that the
documentary record can provide the necessary data to test
subsistence hypotheses. This, however, is not the case.
Much historical data is available pertaining to domestic
foods. Documents reveal that "Indian corn" supplanted
English wheat, rye, and barley, and domestic cattle, swine,
and chickens thrived in the New World environment. Beyond
this, it is difficult to gain a precise knowledg e of the
subsistence system from documents. For example,
contradictory statements regarding the usag e of wild foods
occur. Account s range from promotional literature that speak
of the incredible abundance of game and the ease with which
176
177
it c ould be obtained (cf. Hamor 1957:20 - 21; Rolfe 1971:5 - 6)
to the complaint of Thomas Niccolls in April of 1623 that:
If t h e [Vi rginia] Company would allow to each man a pound of butter and a po. of c heese weekely they would find mo re comfort therein than by all the Deere,Fish, and Fowle is so talke d of in England, of which I can assure you your poore servante haue not had since their coming into the Countrey so much as the s[c]ent ...
(Kingsbury 1935:231 - 232).
Nicolls wrote one year after the 1622 Massacre, which also
decimated the domestic livestock population. Meat from
domesticated animals was in very short supply and wild game
would presumably have been a practical substitute.
The accuracy of these viewpoints and their relationship
to the actual subsistence pattern of the colonists can not be
resolved without substantial and quantifiable data, and such
data are not obtainable from the surviving documentation.
The usage of wild food resources is simply not a topic which
17th Century writers gave much attention. Fortunately,
remains of the actual animals eaten by the colonists are
available from Chesapeake archaeological sites. When
information derived from the study of these materials is
combined with the documentary data, it should be possible to
gain a much more complete and accurate understanding of the
adaptation actually developed by the colonists.
The Historical Data Base
To test the hypotheses, it is necessary to marshal as
wide a variety of information as is possible. The

178
documentary record constitutes one i nfo rmation sourc e and it
can b e divided into two b asic for ms , narrative accounts and
l egal records.
Travelers' journals, personal let ters and publications
describing the colonies compris e the narrative record. Such
documents are not quantifiable because of the idiosyncratic
nature of their creation but they can still provide important
insights regarding husbandry practices, s easonal foods and
methods of food preparation. Two major problems with thi s
source of informat ion are identifying and accounting for the
personal biases of the writer. Comments relating to diet are
often incidental in such accounts and, thus, are probably not
intentionally biased. In other writings, however, especially
promotional literature, descriptions of diet can b e greatly
exaggerated. Therefore, a researcher must investigate the
potential sources of prejudice of each document's author
before utilizing these data. Even meticulous, exhaustive
evaluation cannot "prove" the accuracy of such a document,
but evaluation does greatly reduce the potential for bias and
hence provides a means of improving the reliability of
narrative accounts.
The second class of documentary data, legal records, has
less potential for distortion due to individual bias but must
still be carefully evaluated. The most valuabl e of legal
documents are probate inventories, although transcripts of
court cases can occassionally provide us e ful data. Probat e
inventories in the Chesapeake are a listing of a man's
movable property. Women's estates were rarely inventoried

179
because of women's subordinat e legal status. Inventories
were taken after a man's de a th to insure that the rights of
heirs and creditors would b e protected . Pot e ntial biases in
thi s type of data includ e variation in the reporting rates
among th e various wealth gro ups and shifts in mortality rates
which could alter the structure of the inventoried population
(Carr 1976). Inventories typically reveal the assets of
peopl e at the end of their careers, and thus could suggest to
the unwary scholar that a population was more wealthy than it
actually was . Fortunately for researchers, the high death
rate of the Chesapeake colonists somewhat counteracts this
tendency.
Despite these problems, household inventories offer
invaluable insight regarding domestic foods and food
preparation equipment owned by 17th Century tobacco planters.
This study will focus upon inventories from St. Mary's
County, Maryland. St. Mary's County inventories will be
utilized for the following practical reasons, 1) St. Mary's
was the first county established in Maryland and inventories
survive from 1638 through the 18th Century, 2) All of the
17th and early 18th Century inventories hav e been
transcribed, 3) The entire series of inventories has been
tested for reporting rates and other biases and found to be
generally free of these problems (Menard, Harris and Carr
1974; Walsh and Menard 1974 ; and Menard 1975).

180
Food Remains and the Meat Diet
Food remain s are currently available from a variety of
17th Century archaeological sites in Maryla nd and Virginia
but practically all of these are animal bones. While
flotation samples have b een taken to retrieve floral remains
from several sites, results of on ly one such analysis are
available (Johnson 1978). Prelimi nary sorting of other
samples from sites in St. Ma r y's City, Maryland indicates
that most of the floated material is wood charcoal; few seed,
nu t, or corn cob fragments are present . Because of the
limited amount of floral information, no reliable conclusions
can be drawn . References to the vegetable diet occasionally
appear in documents but these are sporadic and mostly pertain
to domestic crops. This information will be employed where
possible in hypothesis testing but it cannot be considered
a completely reliable data source. Therefore, due to the
paucity of data relating to food plants, this study will
concentrate upon the meat component of the colonial diet.
The archaeological and historical records provide a
large and varied body of data pertaining to the meat diet
that will permit hypothesis testing. Meat is also
appropriate because of its traditional role in British
s ubsistence. As discussed in Chapter 2, meat in Britain had
a high cultural value associated with it, and was a major
factor differentiating the diets of the rich and poor. In
fact,it has been argued that " ... the standard of living
[ i n Britain) was judged to a considerable extent by the

181
amount of mea t eaten" ( Drummon d 1958:102). Given the fact
that the Chesapeake settlers were mostly fro m Britain, it is
lik e ly that these cultural attit udes toward meat were
transferred to the colonies. Thus, not only does the meat
diet comprise the central focus of this study b ecause of the
data base , but it was probably a central foc us of the diet i n
t he minds of the colonists .
Some Necessary Assumptions
Animal remains from archaeological sites constitute the
major information source for this study and to utilize thi s
data, several assumptions regarding the nature of faunal
remains must be made. First, the surviving faunal record is
assumed to be representative of the animals that we re used at
the site. Differential preservation or sever e recovery
problems can completely invalidate this assumption but, as
will be shown, these do not seem to be serious problems with
the Chesapeake data. The second major assumption is that the
relative contribution of species used at a site can be
determined from the faunal assemblage. This assumption can
be invalidated by preservation problems and difficulties with
bone recovery, but again, the nature of th e Chesapeake data
seems to warrant its acceptance.
The final major assumption is that changes in overall
subsistence patterns at sites are related to cultural rather
than natural factors. Of course there can b e seasonal
changes due to annual climatic shifts, and sites in different
ecologi ca l zones may hav e different animals in their
18 2
re specti v e ass emblages. Neve r t h e l e s s, o veral l ch a nges at a
s ite or at mu ltiple sites wit h in t h e same ecolog ical z on e a re
to b e at t r ibute d t o c ultur al fac to rs . Th e tempor a l p e r io d
unde r study i s q u i t e s ho rt - 1 2 5 y ear s - a n d the r e is no
evidence for ma jo r climatic a lte r a t ions with in this pe r iod.
Indeed, the pollen r ec ord from St. Mary's City (Kraft and
Brush 1981) suggests that the climate and vegetation in the
region was reasonably stabl e from c. 1400 to 1800 A.D.,
considerably longer than the period under investigation.
Small - scale changes certainly occurred but none appear to
have been of sufficient magnitude to have altered the faunal
resources in the region.
The Archaeological Data Base
Archaeological materials from 15 sites in the Chesapeake
region are used in this study. They range in time from c.
1620 to c. 1740 and represent 21 separate occupation phases.
Figure 7 illustrates the temporal ranges of these occupation
phases in ascending order beginning with the earliest, and
shows the division of the entire temporal range into three
major study periods: c. 1620 - 1660, c. 1660 - 1700, and c. 1700 -
1740. Each of these 40 year study periods is represented by
faunal remains from six or more sites. Faunal samples were
recovered from more than 50 major features and many smaller
units, and include remains of birds, fish, mammals, reptiles,
amphibians, and crustaceans. Animal remains from all but two
of these sites were analyzed by the author
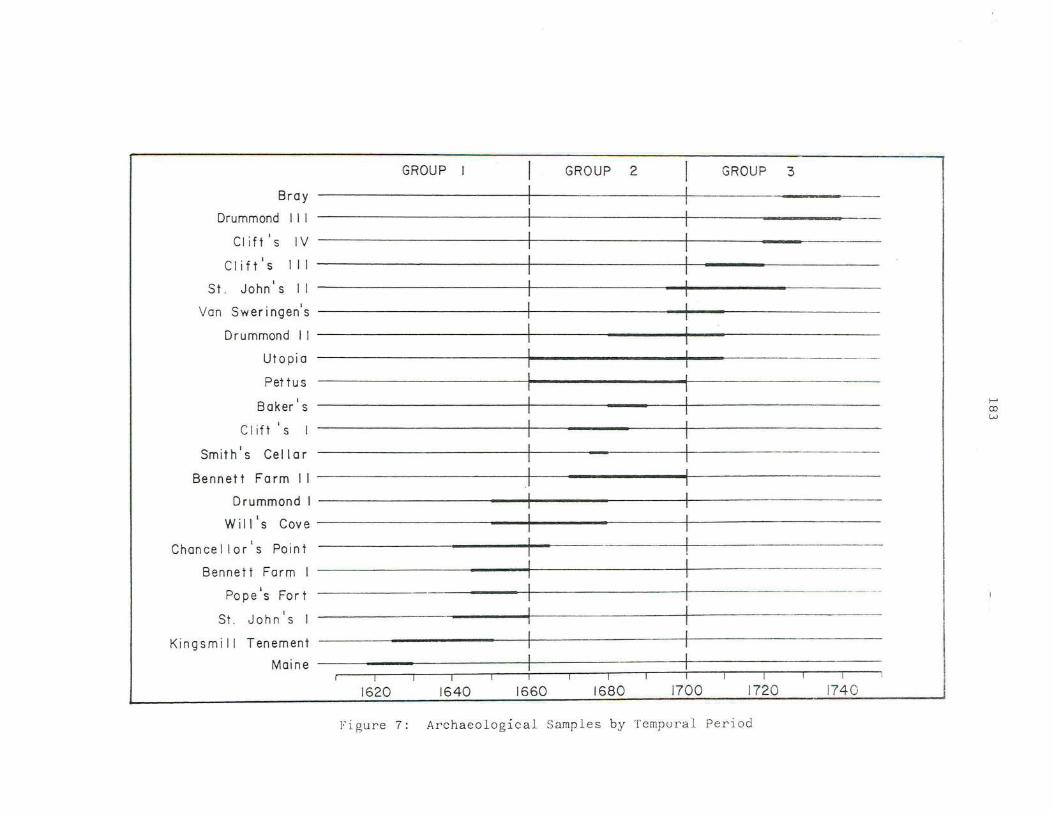
GROUP GROUP 2 GROUP 3
Bray I Drummond I I I I
Clift's IV I C Ii f t 's I I I I
St. John's I I I Van Sweringen 's I
Drummond II I
Utopia I
Pettus I Baker's I
Clift ' s I I Smith's Cellar I
Bennett Farm III
Drummond I I Will's Cove I
Chancellor's Po int I Bennett Farm I I
Pope's Fort I St. John's I I
Kingsmil l Tenement I Maine I
I 1620 1640 1660 1680 1700 1720 174 0
Fi gure 7: Arc haeo l ogic a l Samples by Temp ura l Pe r iod
f-' co w

184
Geographically, these sites divide into two clusters,
those along the Potoma c Riv e r and the Jam e s Riv er (Figur e 8) .
Five of the Potomac sites are located in Maryland's first
capital of St. Mary ' s City while the Clifts Plantation site
lies on the Virginia shore of the Potomac. Most of the lower
Vi rgin ia s ite s occur on the James Rive r near Jamestown.
Except i ons ar e th e Wil ls Cove site, which lies on a small
tributary of the lower James , and Bennett Farm, located on
the Chesapeake Bay nea r the mouth of the York River.
Occupation at all of these sites was domestic. Food
preparation and consumption occurred at each. Most were
private, self- sufficient househo lds. Thr ee of the S t . Mary ' s
City sites also served as "ordinaries" for at least a portion
of their occupations. An "ordinary" in th e 17th Century
provided lodging, drink and an "ordinary" fare to travelers
at a rate established by the goverment. Those in St. Mary's
City, however, served for most of the year as the home of the
innkeeper, his family and servants, and an occasional guest.
Major influxes of visitors only occurred periodically when
the courts met or the Assembly was in session (Carr 1974).
For much of the year, these ordinaries were as much private
dwellings as commercial establishments. Given this fact and
because food serving was a primary purpose of an ordinary, it
seems unlikely that the faunal remains from these
establishments will be so different as to preclude their use
in this study. Identified species, bone counts, and other

0 10 ~
See
See Figure 10
Figure 8:
185
J{
1 5 0
miles
The Two Sample Areas in t he Chesapeake
c:: b
<b CJ
o

186
quantitative data for each of the sites are presented in
Appendix 1.
POTO MAC RIVER SITES (Figure 9 )
St. J ohn's (18 STl-2 3 ), St Mary 's City, Md.
A hous e was constru cted at this site in 1638 by John Lewga r,
Maryland's first Secretary of State, and it served as a
privat e domestic res idence, ordinary, and to b acco plant ation
at various times during its 85 year occupation. The house was
destroyed around 1725. Study of the artifacts and feature
seriation has p e rmitt ed th e archaeological findings to b e
div ided into three phases of occupation. Two of these phases
have adequate faunal samples to be utilized in thi s study.
Phas e I encompasses the p eri od from c. 1638- 1660 during which
the site was occupied by affluent individuals , John Lewga r
and a Dutch merchant named Simon Overzee. During this time,
St. John's a was private home, working tobacco plantation,
and occasional goverment meeting center. Faunal materials
come from a trash filled privy pit, a borrow pit, and
several smaller features. The second sampl e used in this
study, dates to the c. 1695 - 1725 period. During these final
decades of occupation at the site, st. John's was inhabit e d
by a family of middling status who ran it as a tobacco
plantation. Faunal mat eria ls d er iv e from a number of small
units, and two major features - fill layers in the cellar
under the main house and a trash filled pit. All faun a l
materials at this sit e wer e recovered by the scr ee ning of

... : ... . . ...... .
~' ..
~ POTOMAC RIVER SITES 1. st . John's 2 . Van Sweringen 3. Village Center :
Pope's Fort Smith's Ordinary Baker's Ordinary
4. Chancellor 's Point 5 . Clift's Plantation
p 0 O . m a c
J{
1 0 2 3 4 5 e;;
miles
:,}.:.
.>::)<\::\~.: . ·::::::'· :·~:~~«\t:: .-'? / /.-
\': > . :.:.:;. ~
'%·N~!ff ..... . Figure 9: Po tomac River Sites
r
(")
'7 ~
r.f1
o ..::l
~
o ~
~
.. ;.:y?
CD
a
'<
f-' co -..J
188
soils thro u gh one - fourth inch mesh. In add i tion, water
screening of samples through wi ndow mesh was conducted to
provide g r eater c ontrol ov e r r eco v ery . Exca v ations were
co n ducted by t he St . Ma ry' s Cit y Commiss i on ( " SMCC") from
1972 -19 7 5 under the dire c tion of Ga r r y Whee l er Stone .
Pope s Fo rt (18 STl - 13) , St . Mary ' s Ci ty, Md.
Anima l r e mai n s wer e r ec ov ered fr om a la r g e featu re that
excava t ion and analys is h a v e d e mo nstrated i s par t of a f ort
buil t in 1645 when Nathaniel Pop e fortif i ed Leonard Calver t ' s
home. Th e fo rt was e rect ed f o l lowin g a n attack on the
Maryl a nd c olony by a Pro t est a n t privateer but events prov ed
that i s was unn e c e ssary and t h e f o r t stood for only a br ie f
t i me. The ditch component of this fort was filled with
domestic garbage in th e ye a rs b e tween 1645 and c. 1655.
During that t ime, the house wa s occupied by individua l s of
high social status - Governo rs Leonard Calvert and William
Stone . The archaeological sample d e rives from one porti o n of
t h is ditch, located directly behind the house. All soils
were scre e ned through one - fourth inch me sh, and substantial
samples of the soil we r e wate r s c r ee n e d through window me sh.
Excavations were conducted during 1981 - 1982 by SMCC und e r th e
direction of Garry Whe e l e r Ston e and Al e xander Morrison II.
Van Sweringen's -.l18STl - 19), St. Mary's City, Md.
Only on e f e atur e from thi s s i te has b e en analy ze d and it
dates to c. 1700. At tha t tim e , this sit e was occupied by
Garr e tt Va n Swerin ge n, a Dut c h immig r ant, a nd his famil y.
Van Sweringen lived at th e sit e , whi c h also served as a

189
private lodging house used mostly by members of the
Gover nor's Council. Although some brewing activites were
possibly conducted at the si t e, it was, first and foremost, a
private domestic residence. Archaeological explorations of
t h e sit e have been conducted over a long period (1974 - 1983)
by the SMCC u n d er the direction of S to n e and Morri son .
Chancellor's Point (1 8 STl - 62), St . Ma ry's City, Md .
Located approximately 1 .5 miles from the othe r St. Ma r y' s
sites, Chancellor's Point was occupied b et ween ca. 1640 a nd
1680. Th e site wa s a tobacco plantation and possibly th e
location of the first iron forge in Maryland . Artifact
analysis suggests that the res ident s wer e above the median
wealth level i n colonial society but little historical data
e xis t regarding them. Faunal materials derived from several
small features and the fill of a grave. All of these were
sealed by a midden that contained many fragments of c. 1660 -
1680 locally mad e pott ery which indicates that these animal
remains largely deriv e from the first half of the occupation.
Excavations were conducted by the SMCC in 1973 and 1979 under
the direction of Stone and Morrison. All soil s were screened
through on e- fourth inch mes h and samples wer e water screened.
Baker's Ordinary (18 STl-13), St. Mary' s City, Md.
During the late 1670 s and the 1680s, John Bak er l eased
Leonard Calvert's former hom e and ran it as an ordinary.
Baker's Ordinary was on e of th e most prominent lodging places
in th e 17th Century capital. A single sample of faunal
190
materials dating to the Baker period has been obtain e d from a
large pit. Asso ciated artifacts and documentary data suggest
that this feature was filled in t h e period c. 1680 - 1690.
Soils were all screened through one - fourth inc h mesh and
large samples were p rocessed thro ugh window screen by water
scr eening . Ex cavations were c o nducted in 1982 by th e SMCC
under the d irection of Stone a n d Morrison.
Smith's Ordinary (18 STl - 13), St. Mary's City, Md.
In 1667, William Smith cons truct e d several buildings n ear the
center of St. Mar y' s City, one of which was an ordinary.
Following Smith's death in that year , a series of p r opri et o rs
ran the ordinary until i t burned in 1678. Archaeologi cal
materials associated with t his ordinary came from a ne arby
cellar that was filled with garbage in the period c. 1675 -
1680. Artifacts wer e recovered by screening through one -
fourth inch mesh. Excavations were conducted by the SMCC in
1979 and 1982 under the direction of Stone and Morrison.
Clifts Plantation (44 WN rrl, Westmoreland County, Va.
This isolated tobacco plantation was established along t h e
Potomac River about 1670 by Thomas Pop e and occupied almost
continuously by tenants from that time until c. 1730.
Artifact analysis has permitted the seriation of the man y
features at this site into four phases of which three hav e
adequate faunal samples to be incorporated into this study.
These periods ar e Phas e I ( c. 1670 --1685), Phase III (c . 1705 -
1720), and Phas e IV ( c. 1720 - 1730 ) (Neiman 1980 ). Anim al
r e mains deriving from eac h phase we re analyzed by Joann e
1 91
Bo wen ( 1979) . Whil e co mp osite fa un al da ta is a vailabl e f o r
eac h phas e, informati on regarding the composition of b ones
from individual features is not accessible and h e nc e can not
be us e d in t hi s st udy . Among the feat ure s at t his site are
several cellars , borrow pits, a privy, possible storage pits,
and many smaller un its. All soi l wa s screened through on e -
f ou r th inch mesh. Excavations were co nducted by Fraser D .
Ne iman dur ing the period 1976- 19 78 for the Robert E. Lee
Memorial As s ociati on.
JAMES RIVER SITES (F igur e 10)
The Maine (44 JC 41) , James City County, Va.
Thi s early sit e is located approxi ma te ly two miles upr i ver
from Jamestown. Th e Maine is th e ea rli est site in the sampl e
with occupation dating from c. 1618 to 1624, a nd possibly
extending to 1628 (Outlaw 1978) . Th e inhabitants wer e
apparently tenants of the Virginia Company. Analysis of the
faunal remains was conducted by Michael Barber (1978).
Because of the short dur a tion of occupation, h e combined all
the units into one phase and consequently, data regarding the
c omposition of individu a l features at this sit e are
unavailable. Most of the faunal materials derived from s mall
trash filled pits. Artifa c t s were recovered by careful
combing of the excavated soil with a trowel and hand picking
of the exposed obj ec t s . Th e site was exca v ate d under th e

N
1 01234 5 ~
miles
JAMES RIVER SITES 1 . Drummond Plantat i on 2 . The Ma ine Si te 3. Jame s to wn 4 . ~ingsmi ll Tenement 5 . Bray PLantation 6 . Pettus Plantation 7 . uto pia 8 . Bennett Farm 9 . wills Cove
......
Figure 10: James Ri ver Site s
()
;J (0
'" o '0
(0
o 'f ~
co o
"'" f-' \.0 N

19 3
direction of Alain Outlaw for t h e Virginia Historic Landmarks
Commission's Virginia Rese arch Center for Archaeology
(!l VRCA") .
Th e Drummond Site (44 JC 4~, James City County, Va.
Onl y a few hundred feet inland from the Maine site are the
remains of a major plan tation foun d ed by William Drummond
about 1650. Drummond was a major planter and served as th e
Governor of North Carolina. He was also a cen tral figur e in
Bacon's Rebellion of 16 76 . He opposed the Virginia Governo r
and after Bacon's defeat, Drummond was hun g, drawn, a nd
quartered. Drummond's wi fe and family continued to occupy
the sit e until the e arly 18th Century. Ar tifacts suggest
that the family maintained their wealth in the period
following Drummond's deat h a nd continued to operate a
prosperous plantation. After c. 1710, there is no historical
information regarding th e inhabitants, but it is probable
they were tenants (Alain Outlaw: Personal Communication
1983). Becaus e of the long occupation span, the features at
this site have been grouped into three phases: Phase I (c.
1650 - 1680), Phas e II (c. 1680 -- 1710), a nd Phase III (c. 1720 --
1740). Faunal mat e ri als c om e from two cellars, four we lls,
and several trash filled pits. Artifacts were recovered
through troweling and hand picking of excavated materials.
Excavations we r e dir ected by Alain Outlaw of the Virgini a
Research Cent e r for Archa eo logy ("VRCA") betwee n 1977 and
1981.

194
Kingsmill Tenement ._l.!L JC ~~L James City County , Va.
Located approximately five miles downriver from Jamestown
a long a tidal creek, this site dates to the second quarter of
the 17th Century (Kelso 1976) . The occupants were tenants
who leased the property from Richard Kingsmill of Jamestown.
Several exceptional artifacts from the site suggest that the
occupants were probably no t at the bottom of the wealth
scal e, but were of middling status (Carson 1981: 1 7 9-18 0 ).
Faunal materials deri v e from fi v e large trash filled pits and
several smaller features. Rec ov ery methods involved t h e
troweling and h a nd picking of artifac ts from the soil. Th e
excavations wer e directed by Will iam Kelso o f the VRCA in
1972-1974.
Pettus Plantation (44 JC 33), James City County, Va .
This site is located directly on the James River, roughly
seven miles downriver from Jamestown. It was apparently
built in the 1640s by Colonel Thomas Pettus and continued to
be occupied until about 1700 when it burned (Carson 1981:
180) . Pettus was a major landowner and a member of the
Governor's Council; h e was promin e n t in Virginia' s s o cia l
hierarchy (Kelso 1974). Faunal remains came from a well, a
cellar, and several pits. Asso ciated artifacts indicat e that
most of these bon e deposits are from the late r peri ods of th e
occupation and are ass ign e d a c. 1660 - 1700 dat e. Rec ov er y
methods were by t r oweling the soil and hand picking. The site
was ex cavat e d und er the dir ecti on of William Ke lso in 1972 -
1973 for the Virgini a Resea rch Center.
195
UtQ£ia (44 JC 3ll, James City County, Virginia
This house site is also directly on the James , and on e half
mil e downriv er from Pettus . Utopia is located on land owned
by Pettus. An alysis of the artifacts and fau n al materials
suggests that it was occupied by ten ants (Carson 1981: 180).
Artifacts also indicate that th e site was i nhabi ted from c .
1 660 - 1710. Faun al rema in s came fro m two major features - a
cellar under the hous e and a well. Both features contained
artifacts that suggest that these bones were deposited during
the c. 1675 - 1710 portion of th e occupation.
recovery was by tr oweling and hand picking.
Artifact
This site was
excavated under the direction of William Kelso for the VRCA
in 1974 (Kelso 1976).
Bray Plantation, James City County, Va.
Following the end of the Pettus occupation, another large
plantation was established on the same property, just one
quarter of a mil e to the west. The land was acquired by
James Bray II in the early 18th Century through marriage to a
relative of P e ttus. Bray built a large and successful
tobacco planta tio n that survived into the late 18th Century.
Faunal material s come from a large, trash filled pit complex,
probably originally dug for clay in the 1720s and filled
before 1745.
for the VRCA.
William Kelso directed the excavations in 1972
Will§... COVE'~ __ §JL 5§l.., Suffolk County, Va.
Archaeological remains of a 17th Century occupation wer e
found at this site in 1977. Wills Cove is located on th e

196
Nansemond River, approximately five miles from the
confluence of the lower James River and the Nansemond River .
Excavatio n s revealed two large pits which date c. 1650 -1 680 .
Do cumentary research has not been able t o establish the
ident ity or status of t h e occupants of this site, but the
associated artifacts suggest that th ey were not extremely
we althy. Mat erials were recovered by screening through one -
fourth inch mesh. The sit e was exc avat ed by Ke it h Eg loff a nd
Edwa rd Bottoms of the VRCA in 1978.
Benn e tt Farm (44Y068), York County, Va.
This is the only site in th e sample that is not located alo ng
a ma jo r river system. Instead, it is on a s mall inle t
d irectly of f t h e Chesap ea k e Bay an d near the mouth of th e
Yor k Riv er. Occupat i on at this sit e could have begun as
early as 1644, and a structure wa s certainly standing at the
site in 1648 wh en a Humphrey Tompkins acquired t h e land
through marriage. Tompkins lived there until his death in
1673. His son, Samuel, then inheri ted the plantation a nd
occupied it till his death in 1702. Artifa c t analysis
suggests that occupation terminated at that time. His torical
and archaeological evidence both indicate that th e Tompkins
were no t wea lthy and should b e c lassified as "middling
plant er s" of only mod est means (Luccketti 1983). Fiv e l arge
pits and several s mall er featur es yi e lded quantities of
faunal r e ma ins. Most of thes e dat e to th e p erio d 1670 - 1700
but on e larg e , mul tip l e strata pit is ea rlier, dati ng c. 1645 -
1660. Becaus e of this diff e renc e, th e f eat ur es are divid e d
197
i n to tw o p h ases and are assigned t h ese time spans. Artifact
re co very wa s by tro weli n g an d h a n d p ic k i n g. Exca v a t io n s were
d irecte d by Ni cholas Lu cck etti of t h e VRCA in 1 97 7 and 197 8 .
A wid e rang e o f archaeological s i tes and fa unal rema i n s
is thus availabl e for study from the Chesapeake region.
Details r e garding these ar e summarized in Tabl e 11. Ea c h 40
year period is well represented by sites from d i fferent areas
of the Chesapeake. Sample sizes of bones identified to the
genus or species level vary significantly and this must be
borne in mind as the data are discussed. The sites also vary
in regard to th e wealth level of their occupants. This is an
important factor for it will permit evaluation of the diets
of households that presumably had different resources
available to them.
Units of Analysis
Decisions regarding which materials from a site should
be studied and how they should be grouped for analysis will
have an important impact upon the results. In this study,
the decision has been made to utilize only faunal materials
that derive from sealed contexts in features. These features
are not arbitrary but are empirical, culturally produced
components of sites and they will constitut e the basic unit
of analysis. Th e orginal functions of them included storag e
cellars, wells, ditches, clay borrow pits and privies, but
all were ultimately used for the disposal of domestic
garbage. Th e re ar e a number of reason s for c oncentrating
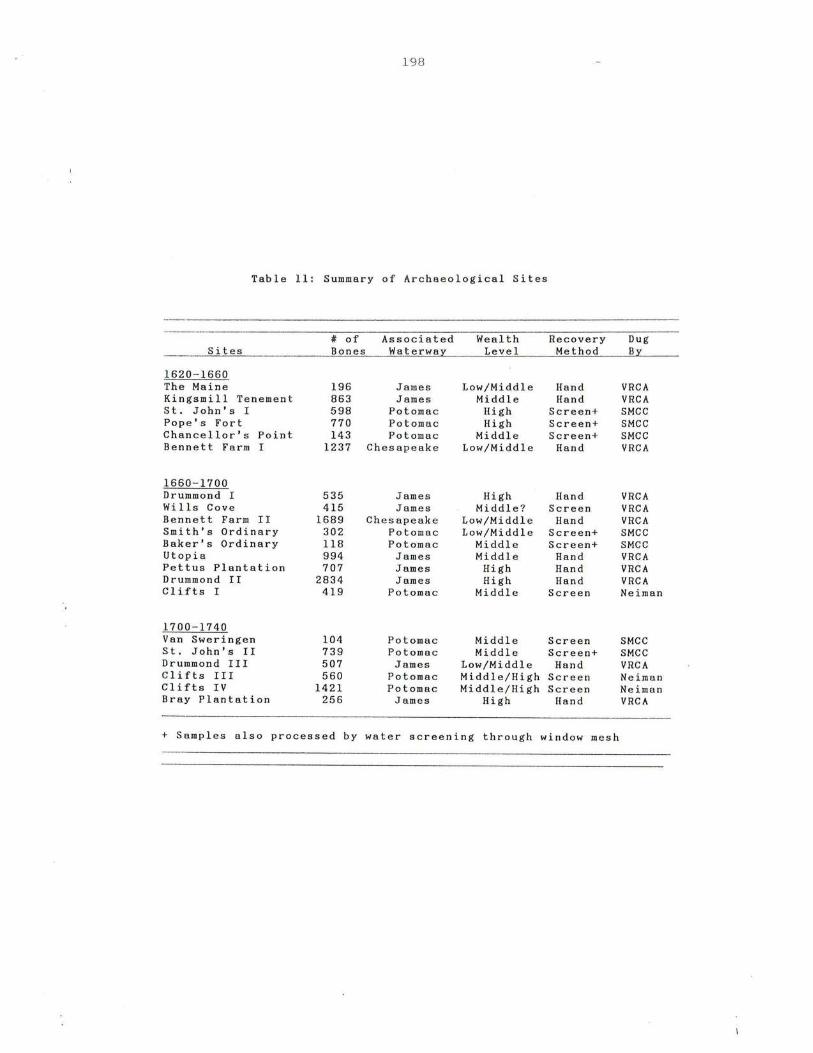
198
Table 11: Summary of Arch ae ological Sites
Sites
1620-1660 The Maine Kingsmill Tenement St. John's I Pope's Fort Chancellor's Point Bennett Farm I
1660-1700 Drummond I Wi 11s Cove Bennett Farm II Smith's Ordinary Baker's Ordinary Utopia Pettus Plantation Drummond II Clifts I
1700-1740 Van Sweringen St. John's II Drummond III Clifts III Clifts IV Bray Plantation
# of Associated Bones Waterway
196 863 598 770 143
1237
535 415
1689 302 118 994 707
2834 419
104 739 507 560
1421 256
James James
Potomac Potomac Potomac
Chesapeak e
James James
Chesapeak e Potomac Potomac
James James James
Potomac
Potomac Potomac
James Potomac Potomac
James
Wealth Level
Low/Middle Middle
High High
Middle Low/Middle
High Middle?
Low/Middle Low/Middle
Middle Middle
High High
Middle
Middle Middle
Low/Middle Middle/High Middle/High
High
Recovery Method
Hand Hand
Screen+ Screen+ Screen+
Hand
Hand Screen
Hand Screen+ Screen+
Hand Hand Hand
Screen
Screen Screen+
Hand Screen Screen
Hand
+ Samples also processed by water screening through window mesh
Dug By
VRCA VRCA SMCC SMCC SMCC VRCA
VRCA VRCA VRCA SMCC SMCC VRCA VRCA VRCA Neiman
SMCC SMCC VRCA Neiman Neiman VRCA

199
upon feature materials; one reason is that deposition took
place over a relatively brief time. Asso c iated artifacts
such as c la y tobacco pipes and bottles permit bone sampl es to
b e tightly dated, frequently d own to periods as short as 5 or
10 years. Wh en investigating change in such a dynamic
situat ion as colonization, s u ch precise temporal co nt rol is
essential.
An eq ually important reason for concentrating upo n
sealed con t ext mate rials is that so me c ont rol over taphon omic
processes can b e obt a ined . Ta pho nom ic processe s res ul t in
the formation of the archaeological record and include ma ny
factors which may bias t h e surviving bon e remains a nd t h eir
research potential (Lyman 1982). Among these are
depositional processes ( hum a n, carnivor e or geological),
breakage and alteration of the bon es (by butchery, carnivore,
or mechanical processes) and pr eservation factors. Any of
these can significantly bias th e faunal record recovered by
archaeologist s and it is necessary to recognize and accoun t
for them to the extent possible (Binford and Bertram 1977 ;
Lyman 1982).
Utilizing only feature mat eria l s will provid e some
control over s e veral of these potential biases . For example,
bone materials from sealed cont ex ts hav e not been brok e n
sinc e their original d ep osition by factors such as
carnivore and r od e nt activity, or mec hani ca l processes such
as human foot traffi c or plowing . Midden materials , In
contrast, were orig ina lly subj e ct to further br eakage du e Lo
foot traffi c . Bones in middens may h a v e also be e n gnawed by

200
dogs. Compounding this problem is plow disturbance, ranging
from eight inches to two feet on a ll of the sites, so that
a ny midden materials have been disturbed and subjected to
pr obable mechani cal break age.
Featur e mat eria l s are also no t subject to physical
weathering in the way that midden art ifact s are. A bon e in a
midden may li e on the surfac e for a period of month s or year s
before being buried . During this time it is exposed to
extremes of moisture and temperature as well as carnivore
destruction. Even after burial , shallow surface middens that
are typical in the Chesapeake area are still subject to
freezing in the win ter, which can further break down f r agile
bones. Freeze depths in the Chesapeake often reach 12 to lR
inches below grade. Feature materials come from depths
generally below this freeze line, and are in a relatively
stable physical environment where changes occur only slowly.
Of particular significance is the fact that faunal
materials from features are primarily deposited by human
activity. All the bones used in this study were found in
association with domestic garbage, such as ceramic and bottl e
glass sherds, and it seems likely that the bones, which
frequently display evidence of butchery, also derived from
domestic activities. Carnivores may have c ontribut e d or
removed bones from a feature prior to its filling but this lS
something for which it is difficult to compensate. Removal
of bones by dogs and similar actions while whil e the d epos it
was expose d cannot be readily determined but evide nc e of

20 1
g n a wi n g o n bon e s was r a re in most f ea tur es, ge n e r al l y
oc u rr ing o n le ss t h a n 1. 0 % of t h e tot a l id e n tified eleme n t s.
Se v eral fe atur es or s tr a t a wer e e nc oun t e r e d in whi c h t h e
bones d is playe d a mu c h h i gh e r f r eq u e n cy of carni vo r e
alt e r a ti on a nd / o r t h e prese n ce of bon es on ly fr om s ma ll ,
inm a tur e ani mals a n d f e w oth e r artifac t s . Th es e appear to
have been p ro d u c e d b y n on - human d e position al p rocesses a nd
a re e xclud e d from t h is st u dy .
Ind i vidual f eat u res a p pe a r t o off er s am ples o f f au nal
r emai ns t ha t d a t e to rela t ivel y br i ef periods . The se
de p os i t s are almost entirel y deposit e d by human activ it y and
th e y se e m to be l e s s bi a s e d b y d es truct i v e proc e ss es tha n
midden or surfac e depos i ts. For these reasons features are
th e most a pprop r ia te un it of s tu dy. How e v e r , sinc e t h e s e
deposits may h a v e be e n fi l l e d over a r e latively short period ,
and many do not contain large samples, a broader analytic
un it is required to g ain a perspective on the overall
subsistence pattern.
In order to gain an overall perspective on animal usage,
materials from various f e atures which dat e to the same period
at a site are comb in e d to produce a sit e faunal assemblag e .
This task is easily achieved at sites occupied for relatively
short periods (15 - 30 y e ars ) by c ombining all o f th e feature
materials. Other sites, however, were occupied for 5 0 to 100
years so this proc e dur e would be inappropriat e without
modification. In th e s e instances individual features hav e
been dated as pr ec is e ly a s possibl e , and th e o c cupation
divided into phases. These phases may not necessarily

202
indicate any break in the actual occupation but offer a means
of temporal discrimination to investigate change. Feature
materials are then grouped by phase and analyzed as a single
assemblage.
Division of the analytic units into site and feature
levels is also necessary since it permits the investigation
of different problems. The overall meat diet and patterns of
resource usage through time are best addressd with the site
level assemblage. While features can be used to study these
questions, they offer the best opportunity for investigating
seasonal shifts in the diet. Additionally, through their
spatial association with structures of identifiable function,
such as the "main house" or "servants' quarter", features
provide excellent data for studying variation in diet related
to status.
Bone Preservation
Bone preservation is related to several factors of which
the most important is soil acidity. Gordon and Buikstra
(1981) have demonstrated a strong positive correlation
between soil ph level and the condition of human remains;
good bone preservation is consistently associated with a high
ph level and alkaline soils. When bone is deposited in soils
with a ph below the neutral level of 7.0, decay through acid
leaching and decalcification becomes a problem. At levels
below 6.3, faunal materials simply do not survive (Cornwall
1956: 204-208).

203
This factor should have serious consequences for faunal
materials in the Chesapeake region where the soils are
naturally acidic (Vokes 1957: 149). But surprisingly, the
faunal materials from most of the sites range from good to
excellent in condition. Fragile fish bones and scales, bones
of immature birds, and even egg shells survived in most of
the features. Examination of feature cross - sections and
soils data indicates that human activity may be directly
responsible for this. Specifically, the introduction of
oyster shell and ash to the sites are the agents that appear
to allow bone to survive in often excellent condition.
Oysters (Crassostrea virginica) were extraordinarily abundant
in the Chesapeake Bay and the colonists consumed them in
large quantities. The shells were also utilized as a source
of lime. Scatters of oyster shell are visible on the surface
of practically every 17th and 18th Century site in the
Tidewater region. After being deposited at a site, these
shells were acted upon by the soil acids which release
calcium carbonate. Movement of this calcium into the soil
served to neutralize acids and raise the ph level of the soil
(John Foss: Personal Communication 1978).
This phenomenon is clearly illustrated by soil data
from two 17th Century sites in St. Mary's City, Maryland.
Some soil samples were taken a considerable distance from the
structures at the St. John's site in areas with little
cultural deposition and low calcium levels. These soils had
ph levels ranging from 4.9 to 5.5 and averaged 5.2; such
values are probably indicative of the original soil
204
conditions. In contrast, the soils in the vicinity of the
structures where many artifacts and oyster shells were
scattered had ph levels averaging 6.9. Still higher ph
levels occurred in features where oyster shells and ash
concentrations were typically scattered throughout the
strata. Four major features at this site in which large
numbers of excellently preserved bones were recovered had
soil ph levels averaging 7.80, 7.76, 7.87 and 7.9.
alkaline soils are very conducive to bone survival.
These
A duplicate pattern occurs at the nearby Van Sweringen
site where soils at the periphery of the site have a ph range
from 5.0 to 6.1 and average 5.46. Cultural features, on the
other hand, yielded soils that ranged from 7.6 to 8.4 in ph.
Clearly the deposition of oyster shells in features at a site
notably affects soil acidity and thus, directly aids in the
preservation of fragile faunal materials.
Ash concentrations occur in many pits and seem to have
originated as hearth sweepings. Although the precise
relationship is unclear, it seems likely that potash and
other chemicals found in the ash also help reduce soil
acidity. A good example comes from the Kingsmill Tenement
site, where several pits were excavated which did not contain
large quantities of oyster shell. Instead, concentrations of
ash were found in most of the strata where the bone survived
in good condition. The ash either changes the acidity of the
surrounding soil or provides a more alkaline matrix in which
the bones can survive.

205
Detailed soils data are not available from sites
outside of St. Mary's City but examination of feature
profiles and excavation notes reveals that most of the
features used in this study contained oyster shell, ash
concentrations, or both. In most cases it is obvious that
these materials were intentionally dumped into the features
along with the bones and other artifacts. Hence, the
widespread presence of shell and ash in features seems to
account for the good to excellent condition of the bones and
means that the use of feature-derived faunal materials can
provide some measure of control over preservation biases.
Despite the generally good condition of the faunal
assemblages, several features were encountered that yielded
poorly preserved bones. Only the more rugged remains of
mammals survived in good condition from these. Excavation
records indicate that the features in question contained few
oyster shells and little ash, and hence soil acidity may have
destroyed the more fragile remains. Because these units are
not comparable with the others, they are either excluded from
analysis or only used in discussion of mammalian remains. /
~ecovery Methods
Two data recovery methods were utilized in the
excavation of sites refered to in this study. The first
involves the screening of feature materials through one -
fourth inch wire mesh. All sites in Maryland and several in
Virginia were excavated with this method. Screening results
in the recovery of many small fish and bird bones and

206
provides a measure of control in the recovery process.
Very small bones nevertheless may be missed with this size of
mesh (Thomas 1969). To check for this potential bias,
samples of soil were water screened through fine window mesh.
Such a procedure has been employed at four sites in St.
Mary's City and the results indicate that while some small
bone fragments are missed, few of these are identifiable to
the genus or species level. The majority of the materials
are small fish ribs and tiny vertebra, mammal and bird bone
splinters, and occassionally an element from a small rodent.
Similar results are apparent from the faunal materials found
in flotation samples from the Drummond site. In summary,
this procedure indicate that recovery is not significantly
biased toward large animals in these sites,
simply not that many small species present.
there are
In the lower Chesapeake, a different method of artifact
recovery is sometimes employed. Soil is carefully picked
through by placing it on a dustpan, breaking it up with a
trowel, and removing the bones and other artifacts that are
visible. Screening procedures are not used. This method can
result in excellent recovery of small bones as evidenced by
the materials from Bennett Farm and the Drummond site.
The time alloted to artifact recovery and the skill of the
excavator, however, can produce radically different recovery
rates. These factors provide the basis for the classic
argument against hand picking soils, but although not widely
recognized, the same holds true for screening. If unskilled
people do the screening or a sample is hurriedly picked over,
207
the loss of cultural data will undoubtedly result. This is
especially true in the situation where the least skilled
people are given the task of screening, with little or no
background in the types of artifacts they are expected to
recognize and retrieve. Screening does make the artifacts
more visible, unless the soil is extremely wet, and so
provides more control in recovery. Nevertheless, where time
and care are taken to meticulously hand pick soils, and
skilled excavators are used, the recovery of bones can be
very good. It is the opinion of Alain Outlaw (Personal
Communication 1983), who directed excavations at the Drummond
site, and Nicholas Luccketti (Personal Communication 1983),
who conducted the Bennett Farm excavations, that the hand
picking procedures used at those sites resulted in the
recovey of practically all of the faunal materials.
Comparison of the frequencies of mammal, bird, fish, and
reptile bones from these sites with carefully screened data
from St. Mary's City (Table 12) fails to reveal any notable
differences in the recovery of these bones and tends to
support the belief that the data from these sites are not
unduely biased.
This difference in recovery methods is a problem, on e of
which the writer has long been aware. The information from
Bennett Farm, Drummond, the Maine, and Kingsmill Te nement
does not appear to differ appreciably from the screened St.
Mary's data although some loss of small bone remains from
these sites seems inevitable. Because this bias does not
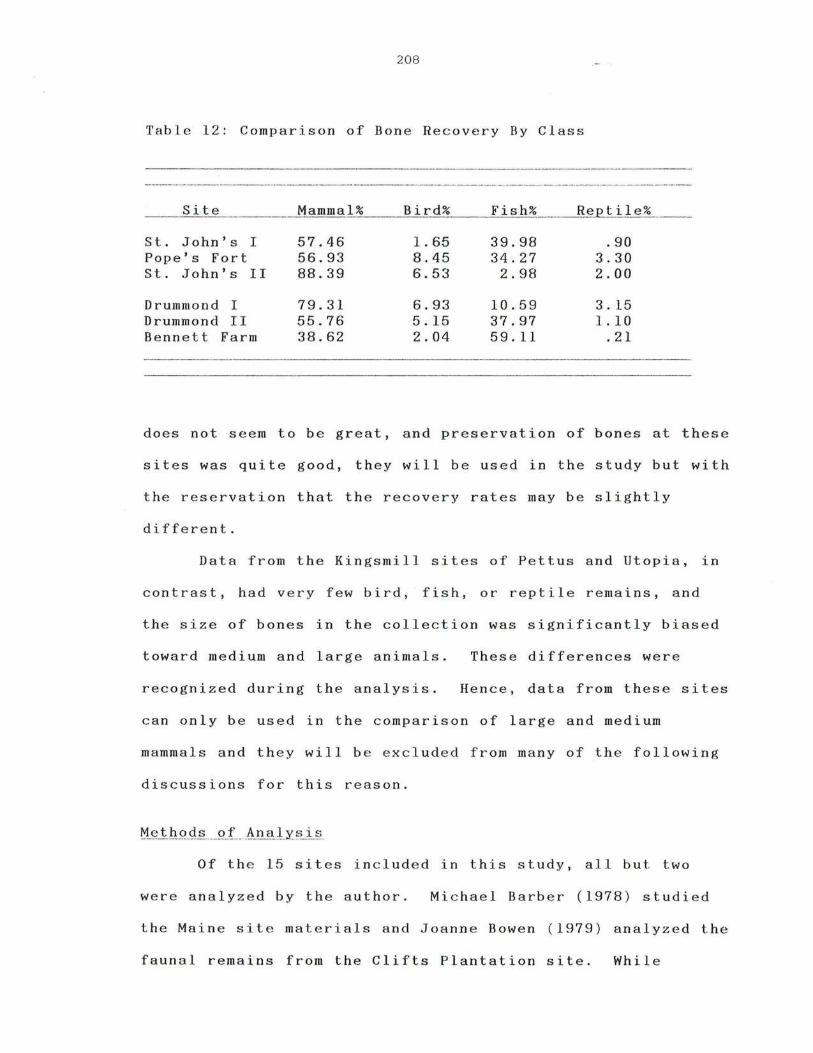
208
Table 12: Comparison of Bone Recovery By Class
-------- _. __ .-
Site Mammal% Bird% Fish% Reptile%
St. John's I 57.46 1. 65 39.98 .90 Pope's Fort 56.93 8.45 34.27 3.30 St. John's II 88.39 6.53 2.98 2.00
Drummond I 79.31 6.93 10.59 3.15 Drummond II 55.76 5.15 37.97 1. 10 Bennett Farm 38.62 2.04 59.11 .21
does not seem to be great, and preservation of bones at these
sites was quite good, they will be used in the study but with
the reservation that the recovery rates may be slightly
different.
Data from the Kingsmill sites of Pettus and Utopia, in
contrast, had very few bird, fish, or reptile remains, and
the size of bones in the collection was significantly biased
toward medium and large animals. These differences were
recognized during the analysis. Hence, data from these sites
can only be used in the comparison of large and medium
mammals and they will be excluded from many of the following
discussions for this reason.
Of the 15 sites included in this study, all but two
were analyzed by the author. Michael Barber (1978) studied
the Maine site materials and Joanne Bowen (1979) analyzed the
faunal remains from the Clifts Plantation site. While

209
methods will always vary slightly between individual
researchers, it has been established through conversations
with Barber and Bowen and by statements in their reports that
the methods they employed are comparable with those used by
this author. Some of their meat calculations have been
adjusted to conform with the other sites, but this is the
only change considered necessary before adding their findings
to the data base.
All faunal data was analyzed by provenience unit.
Materials from strata in a pit were recorded separately, but
if no temporal differences were apparent, the data from that
feature was combined and treated as a single unit. Working
procedures were as follows. All bags of material from a
provenience unit were combined and sorted into identifiable
and unidentifiable components and some attempt was made to
find recent excavation - produced breaks. The materials
unidentifiable to genus or species were then sorted into
zoological classes of mammal, bird, fish, reptile, amphibian,
and crustacean, or an undetermined category, each was
counted, and rebagged. Identifiable bones were then divided
into classes and subgroups by size. Beginning with the
largest mammals, generally cattle, the bones were grouped by
element and an attempt was made to link unfused epiphyses
with their respective bones. No effort was expended to find
glue fits between bone elements unless the breaks were of
modern origin. The type, side, degree of development, and
other attributes of the bone were then recorded on a form.

210
The primary comparative collection used in this analysis
was one developed by the author and housed at the St. Mary's
City Commission. Access to larger samples of mammal, bird,
and reptile skeletons was provided by the Divisions of
Mammals, Birds, and Reptiles, United States National Museum,
Smithsonian Institution, Washington, D.C. These extensive
collections were invaluable in the accurate identification of
the rarer species and provided essential data on the range of
variation present in the more common animals.
In spite of these excellent resources, it was still not
possible to identify many bones to the species level. Among
the domestic animals, sheep and goats are remarkably similar
and are therefore referred to as sheep/goat throughout this
study. It is also very difficult to distinguish 17th Century
domestic turkeys from wild specimens. Because of the
apparent abundance of wild turkeys in the early Chesapeake,
and the sparsity of references to domestic ones in estate
inventories, all turkeys are counted as wild. Wild birds can
be extremely difficult to tell apart, especially ducks. Many
duck species can only be distinguished through careful study
and consideration of size variation. For some, such as the
mallard and black ducks, it is not possible. Hence, while
every effort was made to identify the ducks as accurately as
possible, errors are unavoidable; identification of several
of the duck species should be regarded as best guesses rather
than positive species attributions.
Fish also offer a challenge because of the variety of
species found in the Chesapeake and the lack of any large

211
comparative collections. Through construction of a
collection of the principal species by the author and use of
the small collection at the Division of Fishes, Smithsonian
Institution, it was possible to identify most of the fish
bone. Some remains have probably gone unrecognized due to
the absence of extensive comparative material but these can
only be a very small number.
A major problem addressed during this phase of the
analysis is determination of cultural as opposed to naturally
deposited bone (Thomas 1971). To resolve this, the following
criteria were employed. Only bone that carne from contexts
that were clearly of cultural deposition were utilized. This
was determined by the presence of domestic artifacts such as
ceramics, bottle glass fragments, and pipe sterns in
association with the faunal materials. In addition,
significant numbers of bones in an assemblage had to display
evidence of butchery, burning, or other alteration. A few
strata contained bones but few other artifacts, the bones
displayed no evidence of butchery, and most were of inmature
individuals. These bone deposits may not be of human
creation and, since they did not meet the above criteria,
they were excluded from the analysis. While burials of
animals are often the result of human activity, they have not
been included in this study because the animals were not
eaten and could potentially bias the faunal data recovered
from other contexts.
Finally, bones which displayed radically different
weathering from others in a sample were noted and usually

21 2
omitted from the analysis on sites of long term occupation.
The longer a site is occupied, the greater the potential that
older materials will become mixed with newer bones during the
process of deposition. While these bones were originally
deposited by cultural activity, their presence in a feature
is probably due to redeposition and thus bears no temporal
relationship to the other materials. It is not always
possible to identify these elements and the potential for
contamination of faunal assemblages from later phases at long
inhabited sites is recognized. Methods of identifying such
contamination is clearly a subject that deserves further
study.
Faunal Quantification
In order to derive greater insight from the faunal
assemblage, the analysis must be taken beyond the
construction of a species list. The data must be quantified
and converted into forms that can yield meaning. Several
methods are available for this including fragment counts,
bone weight, bone measurement to estimate the live weights of
the animals, and the minimum numbers of individuals.
these has merits and drawbacks.
Each of
The fragment count is the most elementary method of
quantifying and e valuating an assemblage, and it has been
critized several times (cf. Chaplin 1971; Grayson 1979).
Fragment counting assumes that all species are equally
represented with no differential breakage or' preservation to
bias the sample. The method also gives as much importance to
213
a femur of a rabbit as that of a cow, although they are
clearly not of equal importance in the diet. Nevertheless,
the fragment count can provide insight. When data from
multiple sites are to be compared, the method is of value
because it can reveal general patterns of resource usage.
Some faunal analysts have suggested that weighing the
bone and converting the weight into a meat figure provides a
useful method of determining the importance of a species
(Reed 1963; Uerpmann 1973). Recently, a refinement of this
technique using allometric scaling has been proposed and
utilized to a limited extent (Casteel 1978; Wing and Brown
1979; Reitz 1979; Reitz and Honerkamp 1983). Difficulties
with this approach are twofold. First, comparability can be
a problem at a single site due to differential leaching and
demineralization of bone. When attempting to compare sites
over an entire region with different soils, hydraulic
conditions, and depositional environments, comparability
becomes an even more significant problem. Although most
bones in the Chesapeake samples were well preserved,
variations in weight of the same elements of a species were
observed between features during analysis. Some of this may
result from the cooking method to which the bone had been
subjected (Chaplin 1971: 15 - 18, 68 - 69), but it is even more
likely that small variations in soil ph and water percolation
rates between features will result in differing degrees of
decalcification. Also, since some bones are more dense and
heavier than others (metapodials and teeth as opposed to
scapulas), a concentration of heavy bones in one assemblage

214
and light weight bones in another du e to chance c ould produce
quite different results. Equally serious is the problem of
which meat weight conversion figures to use. Do either
simple weight conversions or those based upon allometry make
accurate predictions for 17th Century livestock if the
baseline data derive from modern, improved breeds? It is
undeniable that recent animal breeding efforts with cattl e
and swine have produced significant changes in biomass
distribution relative to bone. An even more practical and
immediate problem is that the data necessary to employ this
method are unavailable for most of the sites in this study.
Hence, due to the major problems of data comparability, and
other questions regarding this approach, it is not utilized
here.
The final method of estimating the relative importance
of species has several variants but is based upon determining
the minimum number of individuals (ttMNItt) represented in a
faunal assemblage, and calculation of the meat weights they
would have provided . The MNI method was first introduced by
White (1953) and has been modified by Chaplin (1971).
Problems associated with this method derive from several
sources including differences in the way the MNI figure is
c alculat e d, th e units us e d in analysis, and sampl e siz e
variation (Grayson 1973, 1978; Casteel 1977; Lyman 1982 ) .
When the sam e methods and units of analysis ar e employed and
sample sizes ar e similar, however, this method offers results
that are quite comparable from site to site, assuming that

215
preservation and other factors are controlled. It is perhaps
the most widely used method for estimating species importance
(cf. Cleland 1966, 1970; Guilday 1970; Smith 1975; Bowen
1975; Barber 1976; Mudar 1978; Shapiro 1979).
An alternative to the minimum numbers of individuals
method has been proposed by Binford (1978) and Lyman (1979)
which purports to yield better estimates of species
importance. Instead of individual animals, the alternative
method focuses upon an estimated minimum number of "butchery
units" or "anatomical parts" represented in a bone assemblage
such as a forelimb, shank, or hindquarter. The method is
claimed to provide more reliable meat figures because it only
accounts for meat represented by the actual bones in a
sample. Both Binford and Lyman argued that the MNI method
provides less accurate data because hunters may only carry
choice portions of a kill back to camp or, in a complex
market economy, individual cuts may be purchased from a
butcher. In either case, estimating the meat available from
an entire animal will not yield correct figures of what was
actually consumed. In spite of the logic of this, there
remains a number of problems with such a method that are yet
to be resolved. For example, how are butchery units defined
that have relevance for th e cultur e being investigated ? How
many bones or bone fragm e nts are required befor e on e
anatomical portion can be considered present? And what meat
figures should be used for each butchery unit? Lyman uses
data for 20th Century livestock which is almost certainly
inaccurate for the primitive, unimproved livestock of the

21 6
17th and 18th Centuries. Despite these unresolved problems,
Binford and Lyman correctly address a most thorny problem
the differential utilization of an animal. Accordingly,
every faunal analyst must consider carefully the probable
nature of the food supply available to a site's occupants
before selecting the analytic method used to determine
species importance.
Fortunately, historical and archaeological data
provide a clear answer to this problem for the 17th Century
Chesapeake. As discussed in the previous chapter, households
in this region were not involved in a market food economy but
were generally self- sufficient farms or "plantations." They
grew tobacco for a market but only purchased manufactured
goods, salt and luxury items such as spices and liquor - not
basic foodstuffs - from Europe and the West Indies.
Contributing to the necessity for self-sufficiency was the
dispersed settlement pattern that tended to isolate
households, especially in newly settled areas. Little
evidence exists for active local markets, even in the major
settlements of St. Mary's City and Jamestown. Some local
exchange undoubtedly occurred between plantations, and there
was some selling of food as ship provisions, but there is no
evidence for large scale, organized marketing of food. In
Earle's study of All Hallow's Parish, Maryland (1975:64 - 68),
he found that not one commercial butcher is reported for the
entire colonial period. Given these facts, it seems likely
that animals were typically slaughtered at plantations and

217
consumed in their entirety by these households.
Such a proposition can be tested with archaeological
data. If home butchery and consumption were practiced, all
skeletal elements from animals should be found at those
sites. Where a market existed, more meat rich bones might be
expected at domestic sites, but there would be few hoof
elements, mandibles, and other butchery waste. Differential
breakage may render some elements less identifiable than
others with the result that they will be present in lower
frequencies. Of course, samples will tend to vary, but all
elements should be at least minimally represented at sites.
To test this, bone data from selected sites of various time
periods were gathered for cattle and deer and are presented
in Tables 13 and 14 respectively. The results clearly
indicate that all elements from these species are found at
the sites. Examination of the bones from other mammals,
birds and fish reveals that all portions of their skeletons
are also regularly encountered at sites. Since both the
historical and archaeological data indicate that animals were
slaughtered and consumed on - site in the Chesapeake, the
minimum number of individuals method is judged to be the most
appropriate for this study and will be employed here.
The minimum numbers of individuals ( "MNI") was
calculated at two analytic levels - the feature and the site.
One method of MNI determination was used for all features and
all but two of the sites. The procedure follows that
outlined by Chaplin (1971). Individuals were determined by
grouping elements by species, type, and side; taking

218
Table 13: Cattle Oon es Oy Major S k e l etal Elemenl s
Pope' s Kingsmill Wills P e ttus St . John' s Element Fort Te nam e nt Cove Plant. Phase II
Skull 19 116 43 89 118 C . Vertebra 8 17 14 22 7 Scapula 2 9 14 24 12 Humerus 1 5 3 17 8 Radius/Uln a 11 9 7 22 7 Metacarpal 4 5 22 14 Phalanges 16 44 18 48 32 T.V e rt e bra 4 6 3 9 5 L.Vertebra 14 4 8 25 5 Pelvis 2 7 10 25 10 Femur 2 3 5 23 3 Tibia 5 2 6 19 9 Calcaneous 3 3 5 14 1 Astragalus 2 4 3 18 3 Metatars a l 1 4 9 26 11
Table 14: De er Bones By Major Skeletal Elements
Pope's Kingsmil1 St. John's Wi 11s Element Fort Tenament Phas e I Cove
Skull 6 10 3 1 10 C . Vertebra 5 4 2 1 Scapula 16 1 13 Humerus 11 2 5 1 Radius/Ulna 11 10 15 4 Metacarpal 2 4 Phalanges 8 3 1 T.V er t e br a 4 L.Vertebra 6 2 Pelvis 9 1 2 1 Femur 8 5 7 2 Tibia 14 6 18 1 Calcaneous 1 4 4 Astragalu s 1 4 5 1 Met ata rs a l 1 4 4

219
into account size, age, and sex differences, and arriving at
the minimum number which could account for th e assemblag e .
Analysis of both long bone development and dental
eruption/wear criteria were utilized. Within each sample,
all bones from a particular genus or species were inspected
and a comparison of the elements was performed to assure an
accurate MNI calculation.
Grouping of materials at the sit e level varied
according to the length of the occupation . For short term
occupations (les s than 30 ye a rs in most cases), all feature
materials were considered as one sample and were combined to
form the population from which an MNI figure was derived. At
sites where the occupation extended over a 50 - 100 year period
and was divided into phases, all feature materials from the
same phase were combined for MNI determination. It should be
stressed that site or phas e MNI figures are not simpl e
multiples of the individual feature calculations; site and
phase MNI figures were calculated independently. While each
feature probably contained the bones of different animals,
this cannot be assumed.
This procedure was used for all features and sites
except Pettus and Utopia. Insufficient space was available
to layout th e large quantities of bone from these sites at
the same time. Also, since each bon e was not individually
labeled by provenience, there was no mea pable of yielding
MNI data were measured using the methods presented by von den
Driesh (1976). The total site calculations were th e n mad e by
reference to the hotes and measurements.
220
Estimatin~nsumed Meat Weights
In converting MNI data for a species to meat weights,
it is assumed that all edible portions of an animal were
consumed. Lyman (1979) has pointed out the potential error
of such an assumption but it is considered valid for the
Chesapeake region. The British, along with much of Europe,
traditionally consumed most portions of an animal from prime
meat cuts to skulls, lower legs, and organs (Anderson 1971;
Wilson 1973). Blood was saved to make blood pudding and
stomachs and intestines were utilized to hold boiled puddings
and sausages. This tradition was carried by the colonists
to the Chesapeake. The 19th and early 20th century Maryland
descendants of these early settlers are known to have
followed a similar practice, consuming nearly every portion
of an animal (Morgan 1977; Stone 1977). Archaeological data
also support this assumption; butchery marks and evidence of
intentional breakage have been seen on bones from every
portion of an animal's body, even phalanges and mandibles.
Meat weights assigned to each individual are averages
for a species, derived from published zoological data, values
widely used in zooarchaeological literature, data regarding
specimens in comparative collections at the St. Mary's City
Commission and the Smithsonian Institution, and information
collect e d from local Chesapeake fishermen . These are list e d
and discussed in Appendix II. Although some techniques are
available that permit estimation of the live weight of an
individual through bone measurement (Caste e l 1974, 1976;

22 1
Emerson 1978), these "precise" methods are not considered
appropriate. In the rare instances where archaeologists can
isolate the remains of a single meal or a few days' meals
(cf. Huggins 1970:9l ~94), precise estimation of the animals
live weight would be of considerable value. However, most
archaeological bone assemblages represent the accumulation of
many meals over weeks, months, or even years with many
different animals being consumed over such a period. It is
assumed that a given bone sample from a site is
representative of the diet over the period of deposition, and
usually, due to limited samples, to a much longer span of
time. During that period, it is reasonable to assume that
the animals will display a degree of variation in weight.
Both domestic and wild species vary in weight due to
genetics, age, sex, and season of the year, and the actual
individuals incorporated into the diet will display this.
Placing too much emphsis upon the live weights of measurable
individuals within a specific deposit, while displaying
analytical virtuosity, fails to consider that animals of
different sizes were no doubt taken. Indeed, if the bones of
a particularly large or small individual happen to be present
in a particular assemblage, precise live weight data could
skew the overall interpretation. An equally serious problem
with this method is that bones sufficiently intact to yield
good measurements cannot be relied upon to be present in
every feature. Such anomalies become quite serious when
attempting to compare a number of sites. In addition, the

222
relationship between liv e wei ght and bone dimensions has not
yet been worked out for all species. Due to these factors,
it is likely that the use of average weight figures will
yield better results and will also provide a standardized
means of comparing sites.
One of the most crucial problems that must be resolved
before meat weights are calculated is deciding which animals
were actually consumed. Clearly, 20th Century values
concerning what animals are edible cannot be automatically
appli e d to a past context. Fortunately, historical data are
available which identify species not regarded as edible by
the 16th-18th Century British. Simoons (196l) has summarized
most of this, and other data can be gleaned from the writing
of William Harrison (1968), William Shakespeare, and the
Virginia colonists. Animals not considered food species
include horses, dogs, cats, rodents, ravens, crows, buzzards,
falcons, hawks, wolves, foxes, frogs, and snakes. A good
listing of the things the English considered repulsive foods
comes from the "Witches Brew" Shakespeare describes in the
play MacBeth . Ingredients included toads, newt, frog, bat,
dog, snake, lizard, wolf, shark, baboon blood, and tiger.
Descriptions of "The Starving Time"in Virginia add further
evidence of those animals that were culturally unacceptabl e
as food. Hunger was so "sharp" that. th e colonist.s were
forced to eat "Doggs, Catts, Ratts, Snakes, Toadstooles, and
Horse Hides", and even human flesh (Tyler 1907:423).
Clearly, these were animals only to be consumed in the most
extraordinary circumstances . Th e evidence is sufficient to
223
exclude these species from consideration as food animals.
Seasonality
Another goal of analysis is to identify any seasonal
variation in the diet. To detect such variation, discrete
faunal assemblages deposited over a relatively brief time are
necessary. On colonial Chesapeake sites, which are
unquestionably occupied year round, such data can only be
derived from features. This assumes that features would not
be filled at the same time each year and thus, have the
potential to reveal any seasonal shifts in subsistence
behavior which occurred.
Fortunately, the Chesapeake region has an abundance of
seasonal indicator species; data concerning the more
prominent ones are presented in Appendix III. One major
group is the many migratory waterfowl that pass through the
area in the spring and fall of the year. Since the
Chesapeake Bay is an integral part of the Atlantic Flyway,
the bones of these animals can be excellent indicators of the
season of feature filling. Fish are also valuable because
most of them enter the Chesapeake in the late spring and
depart in the fall. Even fish that remain in the bay
throughout the year display some seasonal behavior; they
either migrate to deeper water or stop feeding during the
winter months and are therefore difficult to obtain.
Reptiles and amphibians hibernate during the winter and thus,
tend to be unavailable during that period. The presence or
absence of these species in a feature can therefore enable

22 4
the season of deposition to be established with varying
degrees of confidence.
A second method of seasonal determination is by
identifying the season in which some non-migratory animals
died. Analysis of the growth lines on oyster shells, for
exampl e, will permit the identification of the time of their
harvesting and death to within a few months (Kent 1984). The
season in which male deer were killed can be determined by
studying the degree of antler development. The time at which
young mammals died can be roughly determined through study of
the degree of tooth development since birth (Silver 1963).
Any of these indicators can yield clues regarding when
a pit was filled but establishing the season of deposition
with any degree of certainty requires careful consideration
of all the available data and potential biases.
factors can complicate seasonal identification.
Several
A pit may
not be completely filled and sealed in anyone season but may
remain open for many months and contain a mixture of
indicator species. Only detailed study of the stratigraphic
profile and the associated artifacts can provide control over
this problem. Another difficulty is the potential for
accidental mixture of materials during the filling process.
Soil that was shovelled or that had eroded into a pit may
contain a few bones from earlier in the occupation and of a
different season . The possibility of such admixture
occurring obviously becomes greater with the increasing
length of site occupation. Due to these potential problems,

225
it is imperative that a range of evidence be considered
before the fill period is estimated. To aid in this task,
the following criteria were established and utilized
throughout the study.
a. Artifacts from a feature should reveal no temporal differences between the strata. If so, the strata must be considered separately. In addition, there should be no stratigraphic indications that the pit stood open for a long period.
b. Several different seasonal indicator species should be present for the most reliable seasonal estimates.
c. If only one indicator species is present, however, it must be well represented by bones and by multiple individuals.
By employing these criteria, some control over admixture
problems is achieved and trustworthy seasonal determinations
are possible.
Livestock Aging Methods
Livestock husbandry methods utilized at a site are an
integral part of subsistence behavior. One of the basic
means of investigating this with faunal materials is by
determining the ages at which animals were slaughtered. This
information can be obtained by two means: l)long bone
development and epiphysial fusion, and 2)tooth eruption and
wear. Chaplin's methods (1971) can be used to tabulate the
number of long bones of a species with fused or unfused
epiphyses and the frequency of animals by age group can then
be calculated. Bone fusion ages, and tooth eruption and wear
data are obtained from Silver (1963). Inferring husbandry
practices is difficult under the best of circumstances, but
by carefully weighing all the evidence from multiple sites,

226
valid insights r ega rdin g t his importance aspect of human
subsistence may b e obtained.
With this review of the dat a base and analytic methods
completed, it is now time to turn attention to what actually
happened in the 17th Century Chesapeake colonies and to test
the hypotheses regarding subsistence presented in the first
chapter.

CHAPTER 6
SUBSISTENCE AND CULTURAL IMPOVERISHMENT
In the earlier chapters, information regarding the
British subsistence heritage of the colonists, the ecology of
the Chesapeake Bay region, and the nature of 17th Century
Chesapeake society has been presented. These data provide an
essential foundation from which to investigate the trends of
cultural change and stability in the 17th Century Chesapeake.
They are now put to use with the historical and archaeo-
logical evidence outlined in the previous chapter to test the
six subsistence hypotheses.
The first hypothesis is
During colonization, subsistence practices will tend to be less complex and less specialized than contemporary practices found in the homeland.
This hypothesis is derived from the predicted frontier
characteristics of cultural impoverishment and a labor
shortage. A small population of settlers faced with the
tremendous task of establishing themselves in a new setting
is hypothesized to be unable to support the more specialized
and complex activities which occur in the homeland. The lack
of craftsmen and the simple nature of the Chesapeake economy
has already been noted in Chapter 4, but what about
22 7

228
subsistence practices?
First, a review of the nature of British subsistence
can identify characteristics that might be expected to change
with colonization. The British subsistence system was based
upon intensive animal husbandry and agricultural methods.
Livestock were carefully managed. They were often watched
during the day and, were returned to folds, cowpens, barns,
or sties in the evenings. Fodder was cut and stored along
with grains such as oats to feed them during the winter.
Farmers erected barns, sties and sheep sheds to protect the
animals during the winter. These practices served to
maintain the health of the stock and yielded a better return
for the farmer (Trow-Smith 1957; Thirsk 1967). An intensive,
plow-based agricultural system was utilized with careful
rotation of fields, regulation of livestock grazing to help
fertilize the fields, and cultivation of multiple grain
crops. The colonization model suggests that these complex
animal husbandry practices and agricultural methods would be
simplified in a frontier setting. Were these practices
simplified in the Chesapeake? Unfortunately, archaeological
data cannot be brought to bear on this question but the
historical record provides a variety of relevant evidence.
All sources agree that the colonists brought their
domestic animals and plants with them to America. Cattle,
swine, horses, and poultry thrived in the new environment.
These same data indicate that the colonists not only
simplified, but largely abandoned most of the British
husbandry practices. Cattle, swine, and horses were allowed

229
to run free with little control over their movements.
Numerous estate inventories from the Chesapeake area bear
witness to this practice. For example, inventories from
Southern Maryland taken in the 1660s told there were
2 cowes with calves and one Steere of about fower years ould in the woods and not seene by the appraysers.(SMCC #30)
Item Two Bulls in ye Woods. (SMCC #116)
... also all the Stock of hoggs, being unable att present to make appraisement thereof, the most part being in the woods (SMCC #284).
In 1679, it was necessary before appraising Thomas Stagg's
estate to hire two men for two full days to find and to
"gett up ye Cattle Hoggs and Horses at Chaptico to be Seed"
(SMCC# 526). Identical references to animals "in the Woods"
are found in other inventories from throughout Maryland and
Virgnia. Livestock were distinguished by natural markings as
well as by distinctive patterns of cuts and punctures on the
ears. Apparently, a few colonists attempted to pen their
livestock in the early years of settlement and the more
wealthy hired cowkeepers to tend them (Morgan 1975:136).
These attempts to replicate British practice quickly ended
and nearly every planter turned to the woodland pasture type
of husbandry. A similar use was made of the open woodlands
in Britain but animals in that situation were tended during
the day and returned to enclosures at night (Thirsk 1967).
All evidence from the Chesapeake indicates that the
livestock, with the possible exception of horses, were

23 0
rarely given any care, and were neither tended nor provided
with shelter. Thomas Glover wrote in 1676 that Virginia
cattle:
Might be larger than they are, were the inhabitants as careful in looking after them as they in England are. All that they give their Cattle in winter is only the husks of their Indian Corn ... neither do they give any more of these than will keep them alive, by reason thereof they venture into the marshy grounds and swamps for food, where very many are lost (Glover 1904:18- 19).
A Protestant minister, John Clayton, lived in Virginia during
the 1680s and was appalled at the poor husbandry practices of
the colonists. He wrote regarding the planters
But tis strange in how many things besides they are remise, wch one would think English men should not be Quilty of. They neither house nor milk any of their cows in Winter ... (1965:88).
Clayton continued to offer suggestions as to how husbandry
could be improved and complained that the colonists collect
little or no fodder for the animals, and only gave them a
little corn during the winter. Clayton also confirmed
Glover's observation that many cattle were lost in the spring
when they tried to reach new grass in the marshes.
A French traveler to the Chesapeake in 1687 wrote
regarding livestock that
... it costs nothing to keep or feed them, they do not know what it is to mow hay, Their animals all graze in the woods or on untilled pasture of their plantations, where they seek shelter nightly rather by instinct than from any care given them (Durand 1934:123).
This nearly maintance-free method of husbandry became a

23 1
standard Chesapeake practice. It continued almost unchanged
into the early 18th Century when Robert Beverley, a native
Virginian, wrote regarding cattle that:
I can't forbear charging my Countrey-men with exceeding Ill - Husbandry, in not providing sufficiently for them in Winter, by which means they starve their young cattle, or at least stint their growth, so that they seldom or never grow as large as the y would do, if they were well manag'd .. . (1947:203).
Beverley indicated that swine were treated in the same manner
and given little care for
Hogs swarm like Vermon upon the Earth, and are often accounted such ... The Hogs run where they list, and find their own support in the Woods, without any Care of the Owner (1947:318).
Clearly, animal husbandry was quite different from that
practiced in Britain. It is notable that the British
winters, which necessitated the yeoman to cut and store
fodder and erect structures to protect his livestock, were in
fact no harsher than winters in the Chesapeake. Colonists
did castrate male cattle and swine because steers and barrows
are noted consistently in the inventories. But with only a
few such exceptions, the colonists seem to have largely
practiced a husbandry of neglect. A simpler and less labor
intensive method of livestock management is difficult to
imagine.
While cattle and swine were mentioned in most
inventories and other 17th Century Chesapeake documents,
sheep were virtually absent. This is of note because sheep
had been such an integral element in British subsistence. Of

232
45 St. Mary's County, Maryland inventories from the years
1638- 1665, only 3 inventories listed sheep. Evidence from
Charles and Calvert Counties, Md. and York County, Va.
inventories reveal the same situation; sheep were extremely
rare during the early 17th Century. In Virginia, goats were
apparently kept in some numbers during the first years of
settlement and, as late as 1619, no sheep were listed in the
Virginia colony (Rolfe 1971:14-15; Pory 1907:284). This
situation had changed by 1638 when Virginian Richard Kemp
gave Lord Baltimore ten ewes and a ram from his own flock
(Kemp 1638).
Wolves were apparently a major factor in the absence of
sheep. Thomas Glover noted that "As to sheep, they keep but
few, being discouraged by the wolves, which are allover the
Country, and do much mischief amongst their flocks"
(1904:19). John Clayton confirmed this in the 1680s when he
noted that a few sheep were being kept by the wealthy but the
animal "hitherto has not been much regarded, because of the
Wolves that destroy them ... "(1965:106). Archaeological
support for these statements comes from a ewe skeleton found
at the St. John's site. The ewe was missing most of her hind
quarters and the nature of the bones strongly suggested that
she had been killed by wolves (Miller 1978).
Wolves had been present in medieval England and they
were still found in Scotland during the 17th- century
(Harrison 1968), but this did not stop the British from
raising sheep in huge numbers. Why then did the colonists

233
not succeed at raising sheep? The probable reasons are
labor shortages and time commitments. Sheep could have been
raised in the Chesapeake with little difficulty if the labor
had been so allocated. The colonists, however, chose to
emphasize tobacco production; they did not invest their
limited labor in the management of sheep. Only animals that
required a minimal labor investment , and were able to defend
and care for themselves, became integral elements of the
early Chesapeake subsistence system.
Agricultural practices are another aspect of
subsistence that might be expected to experience
simplification. Historical evidence suggests that
the agricultural system adapted by the colonists was a techno-
logical step backward. Human labor replaced the work of oxen
and horses; the hoe replaced the plow; and a simple, swidden
agriculture replaced the complex field systems used in the
homeland. Even in late 17th Century Virginia, agriculture
was described in this manner:
It is but in very few places that the Plow is made use of, for in their first clearing they never grub up the stumps, but cut the trees down about two or three foot from the Ground; so that all the roots and stumps being left, that ground must be tended with Hoes, and by that time the Stumps are rotten, the Ground is worn out, and having fresh land enough ... they take but little care to recruit the old Fields with Dung (Hartwelll, Blair and Chilton 1964:9).
The near absence of plow agriculture in the early
17th Century Chesapeake is clearly expressed by estate
inventories. For comparison, inventories from the

234
c. 1635 - 1665 period in St. Mary's County, Md., Essex County
England (Steer 1969), and Gloucester County, England (Moore
1976 ) were studied and the number of households with plows
was tabulated. In the Essex sample of 37 inventories, 18 of
the households (48.6%) had plows while ten of 30 Gloucester
households (33.3% ) owned them. In Maryland, a sample of 42
inventories is available but only one plow is listed in any
of them. Significantly, that single plow was owned by Lord
Baltemore.
The hoe was the agricultural tool of the Chesapeake and
it was employed in a long-term fallow system of cultivation.
There are a few late 17th Century references to the
fertilization of small plots of land by the penning of cattle
( Clayton 1965:86; Michel 1916:32), but the standard practice
seems have been to let the soil naturally regain its
fertility through reforestation. This method stands in
marked contrast to the British system where an animals manure
was often prized as much as the animal itself and livestock
pasturage was therefore carefully regulated (Trow-Smith 1957;
Thirsk 1967). The complex British agricultural practices
were unnecessary given the abundance of land in the
Chesapeake, and, due to the labor shortage, such methods were
not practical.
Not only were British agricultural methods largely
abandoned, but so was the production of multiple grain crops.
Early attempts to grow English grain in Virginia met with
some success (Hamor 1957; Rolfe 1971) and nearly every

235
promotional tract describes the abundance of traditional
British grains in the colonies (Hammond 1963: Shrigley 1963).
As early as 1629, however, most of the planters seem to have
focused upon "Indian Corn" or maize. John Smith noted that
the colonists "finde the Indian Corn so much better than
ours, they beginne to leave sowing it (wheat, barley, oats]
(Smith 1910:886). This emphasis upon corn continued and John
Banister wrote in the late 1680s that " ... the staff of the
Country is Mayze or Indian Corn; with it the great part of
the Inhabitants are supported ... "(1965:356). Household
inventories also support this; barrels of corn are listed
quite commonly while wheat, except for very small quantities,
is rare. The Frenchman Durand in 1687 addressed the question
of why more corn than wheat was grown. He wrote that:
In the County of Gloucester [Va.) wheat generally yields ten to onej Indian Corn Two Hundred to one; the farmers reap only about a bushel of wheat each on their plantations for making pies ... As for barley, they grow little of it ... In some places Indian corn yields as much as Five Hundred to one, which I could not have believed had I not seen it (Durand 1934: 115).
He asked the planters why they did not grow more European
grains such as wheat and:
They answered it yielded but ten to one, whereas Indian Corn gave at least two hundred to one . . . (Durand 1934:115).
Corn was apparently a more productive crop in the Chesapeake
environment than wheat. Corn yielded a much greater return
for the labor and, because it was not broadcast sown like the
English grains, it did not require equipment such as plows,

2 3 6
harrows, and reap hooks. In other words, corn was a simpler
and more efficient crop that well suited a labor and
equipment - short frontier setting.
Gardens and orchards were also planted by the
colonists and promotional literature mentioned their
productivity. While the same plants were raised in Britain,
there is some indication that the colonists gardens and
orchards were not as well maintained. A Dutch traveler to
the upper Chesapeake in 1679 reported that:
A few vegetables are planted, but they are of the coarsest kind, and are cultivated in the coarsest manner, without knowledge or care ... (Danckaerts 1913:134).
A Swiss visitor at the beginning of the 18th Century also
commented that "The inhabitants pay little attention to
garden plants, except lettuce ... "(Michel 1916:32). Danckaerts
(1913:137) noted that the orchards " ... all bear well, but are
not properly cultivated". Thomas Glover (1904:15) also
emphasized the abundance and productivity of orchards and
wrote that this occurred " ... without any pains - taking of
digging about them, or pruning them" as was done in England
(1904: 15).
Thus, each of these documentary sources reveals that
the husbandry and agricultural practices of the Chesapeake
colonists were less complex than those in Britain, and in
most cases, they were markedly so.
Food processing and preparation are other aspects of
subsistence that are expected to undergo a loss of complexity
on the frontier. Pertinent data are difficult to obtain
23 7
archaeologically, but household inventories again offer an
alternative. From these listings of household goods, it is
possible to determine whether equipment to perform specific
tasks was available, and thus how common these activities
might have been in the community. Examples were again taken
from two areas of England and St. Mary's County, Md. The
English inventories come from Es sex County in the eastern
lowlands region (Steer 1969) and from Gloucester County in
the West Country (Moore 1976). All inventories were taken
from the same general tim e period (1630 - 1665). Since all of
the Maryland inventories are from self- sufficient
plantations, only English inventories that appear to have
been of food producing, reasonably self- sufficient English
households were selected to ensure data comparability. The
presence or absence of the following equipment was noted:
a. Dairying Equipment (Milk Pans, Butter Pots, Churns)
b. Cheesemaking Equipment (Cheese Press, Cheese Wringer)
c. Boiling Equipment (Kettles, Pots, Skillets)
d. Frying Equipment (Frying Pan)
e. Roasting Equipment (Spit, Dripping Pan)
The findings are presented in Table 15. As was discussed in
Chapter 2, dairy products, especially cheese, were staples of
the English diet. Most farm households maintained a dairy
and processed milk into butter and cheese (Fussel 1966:1971).
The British inventory data support this statement. All but a
small number of the households had some facility for
processing milk and over two - thirds of the households could
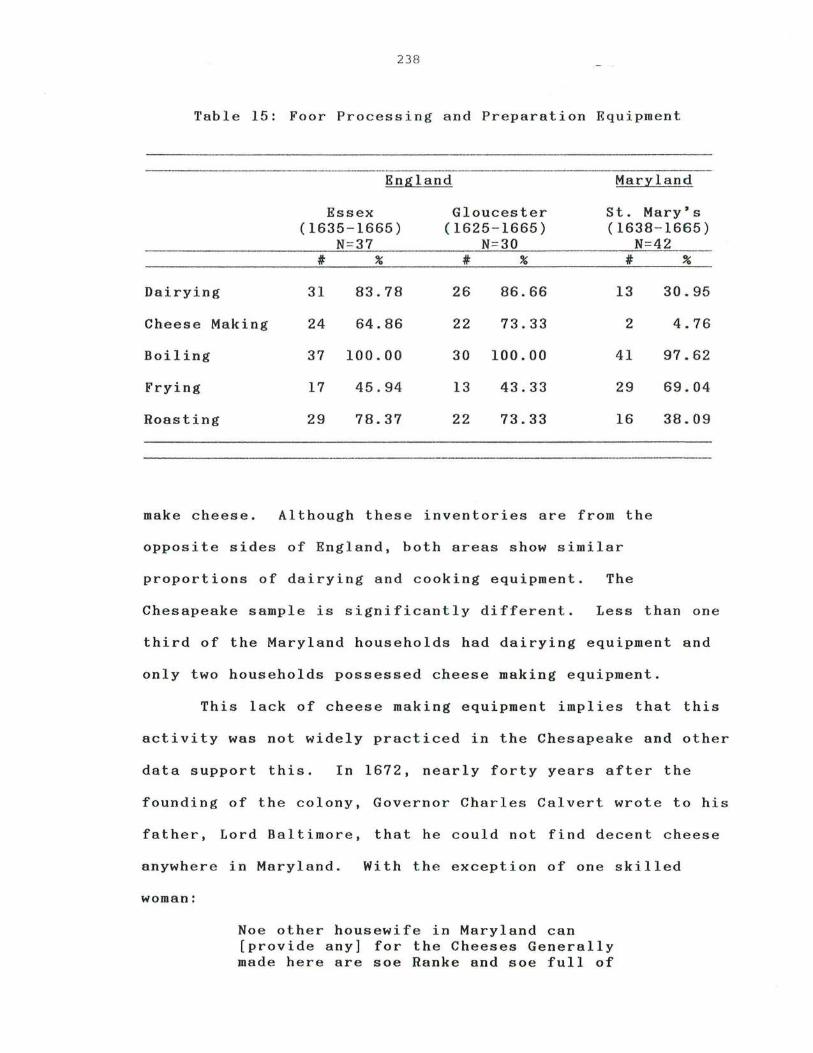
238
Table 15: Foor Processing and Preparation Equipment
England Maryland
Essex Gloucester St. Mary's (1635-1665) (1625-1665) (1638-1665)
N=37 N=30 N=42 # % # % # %
Dairying 31 83.78 26 86.66 13 30.95
Cheese Making 24 64.86 22 73.33 2 4.76
Boiling 37 100.00 30 100.00 41 97.62
Frying 17 45.94 13 43.33 29 69.04
Roasting 29 78.37 22 73.33 16 38.09
make cheese. Although these inventories are from the
opposite sides of England, both areas show similar
proportions of dairying and cooking equipment. The
Chesapeake sample is significantly different. Less than one
third of the Maryland households had dairying equipment and
only two households possessed cheese making equipment.
This lack of cheese making equipment implies that this
activity was not widely practiced in the Chesapeake and other
data support this. In 1672, nearly forty years after the
founding of the colony, Governor Charles Calvert wrote to his
father, Lord Baltimore, that he could not find decent cheese
anywhere in Maryland. With the exception of one skilled
woman:
Noe other housewife in Maryland can [provide any] for the Cheeses Generally made here are soe Ranke and soe full of

239
Eyes that yo' Lordship would be angry wi th me should I send such... (Cal vert 1672:263).
Travelers accounts also indicated that good cheese could not
be found in the Chesapeake (Danckaerts 1913:135; Durand 1934:
122) . The Swiss traveler Michel wrote in 1701 that "Butter
is also made as needed . But most of the people Know nothing
of cheese" (1916:36). This spec i alized activity that was
widespread in Britain and that provided a staple item in the
British diet was largely abandoned in the Chesapeake. Why did
this happen?
Cheesemaking cannot have been abandoned because the
colonists lacked cattle. Indeed, there are more cows with
calves in the Chesapeake inventories than there are in
English inventories. One likely factor is the composition of
the Chesapeake population. Women traditionally did the
gardening, cooking, and dairying in Britain (Hole 1953;
Fussell 1971) and, as John Hammond stated in 1656, women in
the Chesapeake colonies:
... occupie such domestique imployments and housewifery as in England, that is dressing victuals, righting up the house, milking, imployed about dayries, washing, sowing, ec. (1910:290).
A serious shortage of women existed in the 17th Century
Chesapeake, as noted in Chapter 4, and it is possible that
there were simply few women in the colony who could make
cheese. A rigid sexual division of labor existed in the 17th
century and there were probably few men skilled in dairying
since this was a female task. It seems likely that there was
a shortage of people with the skill to produce good cheese.
240
Although most dairying activities are not especially
complex activity, making anything more than soft cottage
cheeses is more demanding. Cheesemaking requires the
addition of rennett, careful monitoring of the process, and
the slow pressing of the whey from the cheese until the
correct moisture content is achieved. Making hard cheese
requires not only skill but time. With the many other
laborious tasks a woman had to do -- tending the fire,
cooking meals, tending the garden, washing, milking
cheesemaking may have required too much labor to be carried
out in most households. The more wealthy households could
probably afford the labor to conduct this, but for most
planters, this seems to have been a British practice that was
inappropriate on the Chesapeake frontier.
Evidence regarding cooking equipment reveals that, as
in England, boiling was the most common method of cookery in
Maryland. In many plantation inventories, an iron pot or
small kettle is the only piece of cooking gear present.
is not unexpected because boiling is the easiest, least
demanding method of food preparation. It is also an
appropriate means of preparing corn and beans, two widely
This
consumed crops in the Chesapeake colonies. The frying and
roasting utensils, however, show some surprising differences.
Frying pans are more common in the Maryland inventories than
in those from England, while roasting gear is less frequent.
Reasons for these differences may also lie in the
availability of labor and cooking skills. After boiling,

241
frying is the easiest method of food preparation and it is
also the quickest. Little skill is required to fry. Frying
permits food to be prepared in a very short amount of time,
and in small quantities appropriate for small frontier
households. Roasting in the traditional manner, on the
other hand, is a longer process, requires frequent attention
and some skill. To roast over an open fire, the cook must
have the skill to properly regulate the size and intensity of
the fire, and know when to turn the meat, how often to baste
it, and when it is cooked thoroughly (Harriet Stout: Personal
Commun ication). Unlike a gently simmering pot of stew, a
roast cannot be left unattended for long periods in open
hearth cookery. The effort and time required for roasting
over an open hearth made it less appropriate on the labor
short frontier. The lack of skilled cooks due to the sexual
division of labor and the skewed sex ratio probably
compounded this problem. In such a situation, an emphasis
upon one pot boiled meals and fried foods is to be expected.
In a detailed study of 17th Century foods and dining
habits using Virginia inventories, Maryellen Spencer
concluded that in comparison to England:
Virginia's cuisine was rough and rudimentary, lacking technical complexity and aesthetic refinement ... (1982:264).
Her statement is precisely in keeping with the findings
discussed above, and summarizes well the culinary standards
of the early Chesapeake.
All of the evidence discussed here indicates that the
17th Century Chesapeake subsistence system was less complex

242
and elaborate than that found in the colonists' homeland.
The wealthier planters may have retained more of the
traditional British practices, but nearly everyone seems to
have employed the woodland pasture form of husbandry, used
hoe agriculture in a long- term fallow system, and dispensed
with at least some of the more complex methods of food
processing. Most planters seem to have prepared their food
in a straight forward, non - elaborate manner. All this
evidence reflects a significant simplification of the
subsistence system in comparison to that of the homeland.
Therefore, the available data strongly support and appear
to confirm the first hypothesis.

CHAPTER 7
CHANGING ADAPTIVE STRATEGIES
This chapter explores the adaptive strategies employed
by the colonists in their struggle to adapt English culture
to the Chesapeake environment and the adaptation which
emerged as the colonization process terminated. The first of
two hypotheses to be tested here states that :
The Adaptive Strategy developed during the early phases of settlement will be of the diffuse type when compared to that of the homeland.
The colonization model predicts that, in the early phases of
settlement, the adaptive strategy will focus upon a broader
range of resources than that which was utilized in the
homeland. A broad, multiple resource strategy is thought to
provide greater security in uncertain environments. A number
of species should be exploited with a variety of procurement
strategies and these species should be utilized in a
scheduled manner. The colonist, however, may not practice a
fully diffuse strategy as defined by Cleland (1976); it may
be a relative increase in niche width in comparison to the
homeland's strategy.
The second hypothesis to be tested concerns the
evolutionary trends in subsistence predicted to occur as the
colonizing culture adapts to new environmental conditions and
243

244
develops a stable and appropriate adaptive strategy for that
setting. The hypothesis is that:
As the available lands are occupied and the population grows, emphasis will be increasingly placed upon dependable resources which can be intensively exploited; gradually the adaptive strategy will become more focal.
Some food resources will be found on a frontier that are
quite dependable and can withstand a high degree of
exploitation due to abundance and a high reproductive rate.
Other resources, however, may have a much lower depletion
threshold. As the colonial population increases, and
additional pressure is put on these resources, their
availability will quickly decline and the costs of their
exploitation will increase. The predicted response of the
colonists to this situation is a concentration upon the the
more dependable and efficiently exploited natural resources,
such as fish, and/or those species for which production can
be controlled, i.e. domestic animals. Given the British
subsistence heritage with its emphasis upon domestic animals,
it is likely that these species would be one focus of the
colonists. These responses should result in the emergence of
an adaptive strategy that is more specialized and focal in
nature with a concentration upon a few major species that
provide both a stable and secure food supply.
To investigate these hypotheses, the archaeological
data from the previously discussed Chesapeake sites will be
utilized. For temporal control, the samples have been
divided into three general periods: Period 1 (1620 - 1660 ) ,

245
Period 2 (1660-1700) and Period 3 (1700-1740). Animals
identified in the samples from each of these periods are
summarized along with their scientific names in Table 16.
From the Period 1 samples, a total of 51 different
animal types was identified. Domesticated animals were
cattle, swine, sheep or goat, chicken, horse, dog and cat.
Forty-four wild species are found in these collections.
Mammals include white tailed deer, raccoon, opossum, gray
fox, gray squirrel, fox squirrel, woodchuck and cottontail
rabbit. Birds were well represented with 18 types
identified. Among these are Canada goose, turkey, brant,
eight types of duck, passenger pigeon, double crested
cormorant, red tailed hawk, and bald eagle. Fish were also
numerous. The 11 species found include Atlantic sturgeon,
striped bass, catfish, sheepshead, black drum, and white
perch. Turtles were present in the samples with five species
identified. The most common of these were the eastern box
turtle and the snapping turtle.
blue crab, was recovered.
Only one crustacean, the
From the Period 2 assemblages, many of the same animals
were found. Additional animal types were gray wolf, several
types of birds such as the coot, a loon, turkey vulture, and
bobwhite. Two types of turtles which occur only in this
phase are the diamondback terrapin and the Atlantic
loggerhead. Some of the same species occurred in Period 3
samples. Additional animals were owl, yellow perch, domestic
goose, and a pigeon or dove.

246
Table 16: Animals Identified From Chesapeake Sites (By Temporal Period)
Animal DOMESTICS
Cattle (Bos taurus)
Swine (Sus scrofa)
Sheep or Goat (Ovis aries or Capra hirca)
Horse (Equis caballus)
Dog (Cani s familiaris
Cat (Felis domesticus)
Chicken (Gallus gallus)
Goose (Anser domesticus)
Duck (Anas sp.)
Pigeon/Dove (Columbidae)
WILD MAMMALS
White Tailed Deer (Odocoileus virginianus)
Beaver (Castor canadensis)
Raccoon (Procyon lotor)
Opossum (Didelphis marsupialis)
Fox Squirrel (Sciurus niger)
Gray Squirrel (Sciurus carolinensis)
Gray Fox (Urocyon cinereoargenteus)
Woodchuck (Marmota monax)
Cottontail Rabbit (Sylvilagus floridanus)
Gray Wolf (Canis lupus)
Rat (Rattus sp.)
Period I
x
x
x
x
x
x
x
x
x
x
x
x
x
x
x
Period 2
x
x
x
x
x
x
x
x
x
x
x
x
x
x
x
x
x
x
Period 3
x
x
x
x
x
x
x
x
x
x
x
x
x
x
x
x
x
x
x
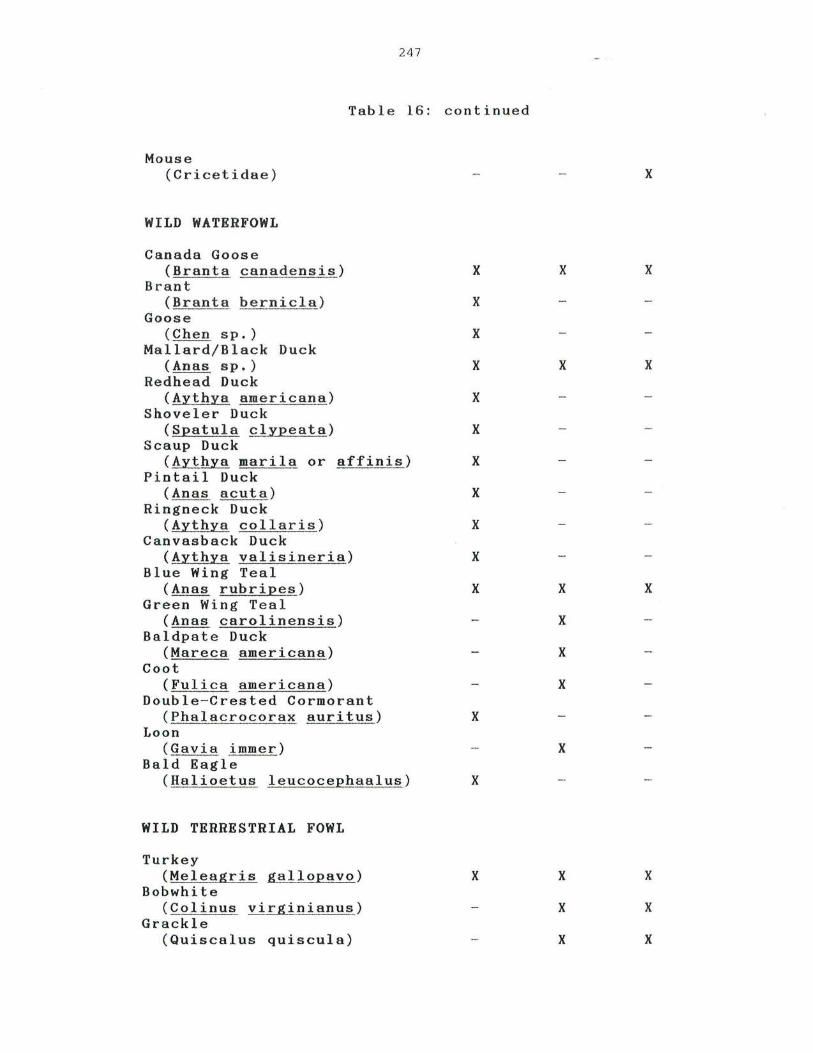
2 47
Table 16: continued
Mouse (Cricetidae)
WILD WATERFOWL
Canada Goose (Branta canadensis)
Brant (Branta bernicla)
Goose (Chen sp.)
Mallard/Black Duck (Anas sp.)
Redhead Duck (Aythya americana)
Shoveler Duck (Spatula clypeata)
Scaup Duck (Aythya marila or affinis)
Pintail Duck (Anas acuta)
Ringneck Duck (Aythya collaris)
Canvasback Duck (Aythya valisineria)
Blue Wing Teal (Anas rubripes)
Green Wing Teal (Anas carolinensis)
Baldpate Duck (Mareca americana)
Coot (Fulica americana)
Double-Crested Cormorant (Phalacrocorax auritus)
Loon (Gavia immer)
Bald Eagle (Halioetus leucocephaalus)
WILD TERRESTRIAL FOWL
Turkey (Meleagris gallopavo)
Bobwhite (Colinus virginianus)
Grackle (Quiscalus quiscula)
x
x
x
x
x
x
x
x
x
x
x
x
x
x
x
x x
x x
x x
x
x
x
x
x x
x x
x x

248
Table 16: Continued
Passenger Pigeon (Ectopistes migratorius)
Mourning Dove (Zenaidura Macroura)
Turkey Vulture (Cathartes aura)
Red-tailed Hawk (Buteo jamaicensis)
Red - shouldered Hawk (Buteo lineatus)
Barred Owl (Strix varia)
Crow, Jay? (Corvidae)
Woodpecker (Picidae)
FISH
Sturgeon (Acipenser oxyrhynchus)
Striped Bass (Morone saxatilis)
White Perch (Morone americana)
Catfish (Ictalurus sp.)
Brown Bullhead (Ictalurus nebulosus)
White Sucker (Catostomus commersoni)
Longnosed Gar (Lepisosteus osseus)
Toadfish (Opsanus tau)
Sheepshead (Archosargus probatocephalus)
Black Drum (Pogonias ~romis)
Red Drum (Scianops ocellata)
Sea Trout (Cynoscion sp.)
Ray or Skate (Rajidae or Myliobatidae)
Yellow Perch (Perea flavescens)
x
x
x
x
x
x
x
x
x
x
x
x
x
x
x
x
x
x
x
x
x x
x x
x x
x x
x
x
x x
x x
x x
x
x
x

249
Table 16: continued
TURTLES
Eastern Box Turtle (Terra:eene carolina) X X
Snapping Turtle (Chelydra serpentina)
Cooter Turtle (Pseudem:ys sp. ) X X
Painted Turtle (Chr:ysem:ys :e icta ) X
Musk Turtle (Sternotherus sp. ) X
Diamondback Terrapin (Malaclem:ys terra:ein) X
Atlantic Loggerhead (Caretta caretta) X
Mud Turtle (Kinosternon sp. ) X
OTHER
Toad (Bufo sp.) X X
Spadefoot Toad (Sca:ehio:eus holbrooki) X
Water Snake (Natrix sp. ) X
Blue Crab (Callinectes sa:e idus ) X X X
Oyster (Crassostrea virginica) X X X
X = Present = Absent

250
Measures of Niche Width
One means of determining the adaptive strategy used at
a site and how the strategies varied between sites is to
calculate the niche width. This concept has been discussed
by Hardesty (1975:71) who refers to it as the "distinctive
ways of using resources for subsistence that set cultural
species apart" . Integral to this concept are the number of
resources utilized and how much dependence is placed upon
each resource. One of the leas t complex means of calculating
niche width is with the formula suggested by Hardesty
(1975:77) which is:
Niche Width = n
IlL (pi) 2
I
where pi is the proportion of the total subsistence base
contributed by resource i and n is the total number of
resources utilized. With this measure, a diffuse strategy
should be indicated by a higher number (i.e. a broader niche
width) while a focal strategy is suggested by a low number.
Niche width estimates for the Chesapeake sites were
calculated using the minimum number of individuals per
species; these results are given in Table 17.
As predicted, some of the largest niche widths are
found in the Period 1 group with the Maine, Kingsmill
Tenement, and Pope's Fort all displaying this. Unexpectedly,
however, the Chancellor's Point and Bennett Farm I
assemblages of this same period have the smallest values
found in the total sample of sites, suggesting that not all
subsistence behavior was as predicted. The Period 2 sites

25 1
Table 17: Niche Width Estimates for Chesapeak e Sites
Site # Species Niche Width PERIOD 1 SITES The Maine 22 15.92 Kingsmill Tenament 30 21. 42 St. John's I 18 6.89 Pope's Fort 28 11. 90 Chancellor's Point 7 4.19 Bennett Farm I 15 2.71
PERIOD 2 SITES Drummond I 30 17.82 Wills Cove 18 12.39 Bennett Farm II 21 7.55 Smith's Ordinary 10 7.07 Baker's Ordinary 8 6.77 Drummond II 33 5.53 Clifts I 13 4.62
PERIOD 3 SITES St. John's II 23 10.00 Van Sweringen's 8 6.26 Drummond III 17 9.13 Clifts III 12 6.85 Clifts IV 23 8.00 Bray 16 9.99
also display a wide range of variation. The Drummond I
assemblage has an especially large niche width, but since
this occupation is the first at the site and it partially
overlaps with Period 1 (the occupation began about 1650),
this is not completely unexpected. Overall, the niche width
estimates appear to correspond to the predictions of
Hypotheses 2 and 3, with the widest niche widths generally
occurring earlier. The variation in width estimates between
sites also displays a notable trend with the largest
variability (2.71 to 21.42) in Period 1, a smaller range
( 4.62 to 17.82) in the Period 2 sites, and the smallest
252
variation (6.26 to 10.00) in the Period 3 assemblages.
To determine whether these niche widths represent more
diffuse strategies than the strategies employed in Britain,
it is necessary to turn to British faunal data.
Unfortunately, there are very few studies of 17th Century
British assemblages available. Several small samples have
been studied from Surry (Ha r man 1975:114- 116), Southampton
(Noddle 1975), and Essex (Chaplin 1970), while reports on
large assemblages are avail a ble from two sites in Edinburgh,
Scotland (Chaplin and Barnetson 1975, 1980). All of these
were analyzed by Chaplin or used his methods (Chaplin 1971),
and since the same methods have been employed in this study,
the results of this analysis are comparable. Regrettably,
the methods of bone recovery are not discussed in any of
these reports and that variable remains an unknown factor.
These sites, nevertheless, provide the best data currently
available from Britain and they will, of necessity, be
utilized here.
Domestic species predominate in all of the British
assemblages with cattle and sheep comprising most of the
individuals. One group from a privy in Essex is especially
interesting because the bones are apparently from a single
meal (Chaplin 1970). The entire remains of this particular
meal, including dining equipage, were deposited in the privy
in 1669, following a raid on the house by authorities for
illegal activites. All of the bones in the assemblage were
domestic and represent cattle, swine, sheep, chicken, rabbit
and duck. The only non-domestic food reported were the

253
shells of a dozen oysters. Another sample from Southampton
further attests to the high domestic composition of the
British diet. Species identified include cattle, sheep,
swine, goat, chicken and teal, the only wild animal (Noddle
1975) . Faunal remains from Richmond Palace, Surry (Harman
1975) included bones from cattle, sheep, chicken, and rabbit.
The only wild creatures were a duck and a badger. Nearly all
of the identified bones were from sheep and chicken.
The best samples come from the city of Edinburgh and
date to the early 17th Century. The species and MNI counts
from the Tron Kirk and St. Mary's Street sites, along with
the Southampton data, are presented in Table 18. Domestic
bones make up most of these assemblages and in terms of
MNI's, cattle and sheep predominate. Swine are very poorly
represented as are wild species, of which there are only
Table 18: British Faunal Data and Niche Widths
MNI's SQecies Tron Kirk St. Mary's SouthamQton
Cattle 10 12 3 Swine 2 2 1 Sheep 44 26 3 Goat 2 2 Horse 1 1+ 1 Hare 2 1+ Rabbit 1 1+ Cat 2 1+ Dog 1+ Chicken 6 1 Goose 3 Teal 1 Bird 1+ Fish 1+ 2 Total 72+ 52+ 12
Niche Width 2.47 3.33 5.54
1+ = Animals only listed as present in reports. Data From: ChaQlin and Barnetson 1975 1 1980 1 i Noddle 1975

25 4
hare, waterfowl and fish. The niche width estimates from
these assemblages are low, and, in comparison to many of the
Chesapeake sites, very low. It is unfortunate that more
17th Century British assemblages from rural sites have not
been analyzed. The available data are mostly urban and
hence, may not indicate of all British practices. However,
this data is in keeping wit h the historical information
regarding Brit i sh subsistence, as discussed in Chapter 2.
Therefore, while addition a l and more appropriate samples are
desirable, these findings appear to match the historical data
on British subsistence, and indicate that the Chesapeake
subsistence strategy utilized many more species and had a
much broader niche width than did the traditional strategy in
the homeland .
This approach in measuring niche width has revealed
differences between subsistence in the homeland and the
colonies, but there are other means of calculating this
statistic. The traditional measure of diversity, the Shannon-
Weaver Information Statistic, can be used by defining niche
width as a relationship between species richness (the number
utilized) and species evenness (how evenly individuals are
distributed among them), two variables which in principle are
distinct.
The Shannon - Weaver formula is:
H = pi (In pi)
where p is the relative proportion of the i'th species.
A measure of evenness is derived from calculation of the

255
maximum value H could have if for a given number of sp e ci es,
it is assumed that all the individuals were evenly
distributed between the species. This is:
H max = ~ (In n / s) n n
= lis (In l i s)
= In s
where s is the number of species (richness) and n is the
total number of individuals in all species (Vandermeer
1981:241). Evenness then becomes:
J = HI H max
= H/ in s
Species richness and evenness can then be considered to be
two potentially orthogonal components of niche width. If
they were always positively correlated, then the diversity
(H) measure could be used alone, but this is probably not
always the case. Both will likely vary according to the
nature of the adaptive strategy being employed and thus, the
relationship must be empirically determined.
It is necessary, however, to recognize a potentially
serious problem with these measures. Indices of both
richness and evenness may be influenced by sample size.
Indeed, Grayson (1981) has empirically demonstrated such a
correlation for diversity. As sample size increases (here
measured as the number of bones identified to a level more
specific than zoological class) the chance for inclusion of
more species in the sample also increases. This relationship
allows for the prediction that there will be a positive

256
corr e lation between sample s i z e and richn e s s . At th e same
t i me, since ecological communities and most spe c i e s of
animals ar e not evenly distributed ( Pielou 1977: 269) , mo st
ecological situations as well as archaeological samples
conta i n a f e w species in abund a nce while most species are
relative l y rare. Therefore, as sample size increases, so do
the chan c es o f sampling the rare r species . It i s un like l y
that the s e ra r e species will be represented by more than a
f ew indiv i du a ls, and thus the evenness e s tima t e wil l dec l ine
accordingly. The expect a tion is that sample size a nd
evennes s wi ll be negatively correlated in some manner.
Using the above formulas, species richness and species
evenness were calculated for the 19 faunal assemblages using
the SAS (Helwig and Council 1979) and SPSS software packages .
The existence of a sample s i ze effect was tested for using
Spearman's r and in both cases, the values are in the
predicted direction and are significant past the .01 level
(Richness: r = .759, significance = .0002; Evenness r = - .785,
significance = . 0 001 ) . Without question, the estimates of
richness and eveness are affected by sample size.
Scatter plots of these measures against sample size
reveal that the relationship is linear. Among the Period 1
sites, Chancellor's Point and Bennett Farm were well below
the trend in evenness suggested by the sample size effect.
These two sites also had the smallest niche widths using the
Hardesty formula. Above the trend line in richness were
three Period I sites and one of the Period 2 sites (The
Maine, Kingsmill Tenement, Pope's Fort and Drummond 1 ) , the
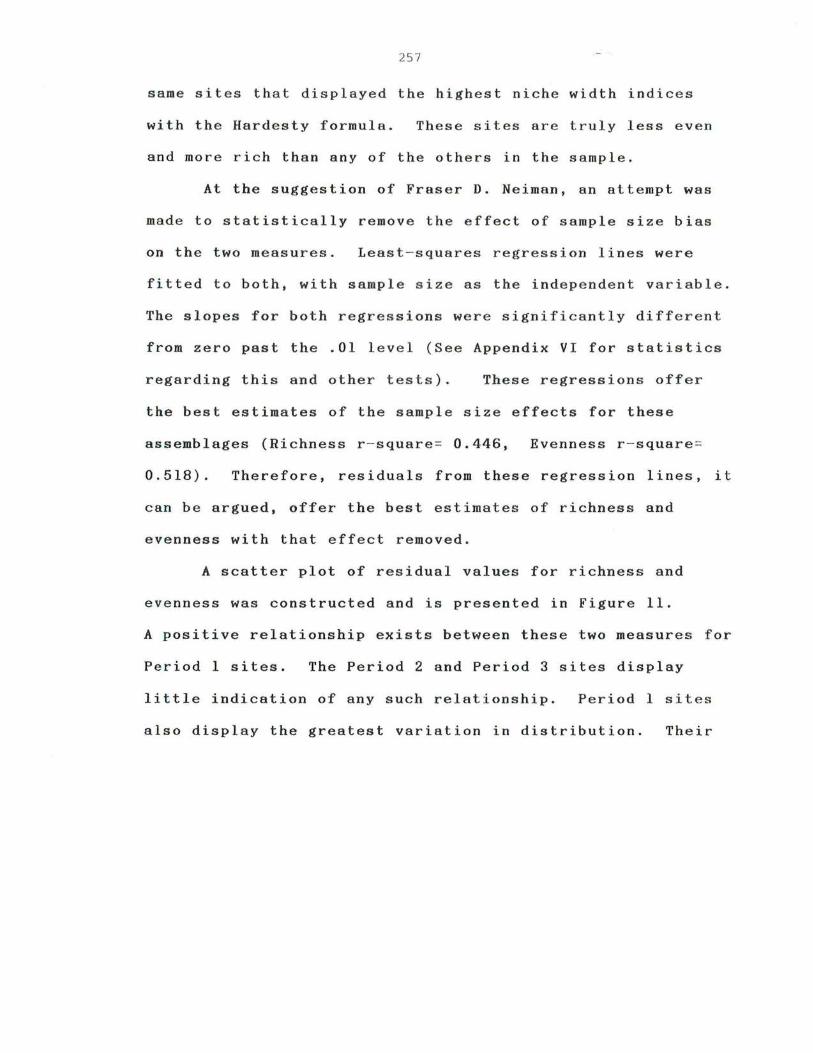
257
same sites that displayed the highest niche width indices
with the Hardesty formula. These sites are truly less even
and more rich than any of the others in the sample.
At the suggestion of Fraser D. Neiman, an attempt was
made to statistically remove the effect of sample size bias
on the two measures. Least - squares regression lines were
fitted to both, with sample s ize as the independent variable.
The slopes for both regres sions were significantly different
from zero past the .01 level (See Appendix VI for statistics
regarding this and other tests) . These regressions offer
the best estimates of the sample size effects for these
assemblages (Richness r - square= 0.446, Evenness r-square =
0.518). Therefore, residuals from these regression lines, it
can be argued, offer the best estimates of richness and
evenness with that effect removed.
A scatter plot of residual values for richness and
evenness was constructed and is presented in Figure 11.
A positive relationship exists between these two measures for
Period 1 sites. The Period 2 and Period 3 sites display
little indication of any such relationship. Period 1 sites
also display the greatest variation in distribution. Their
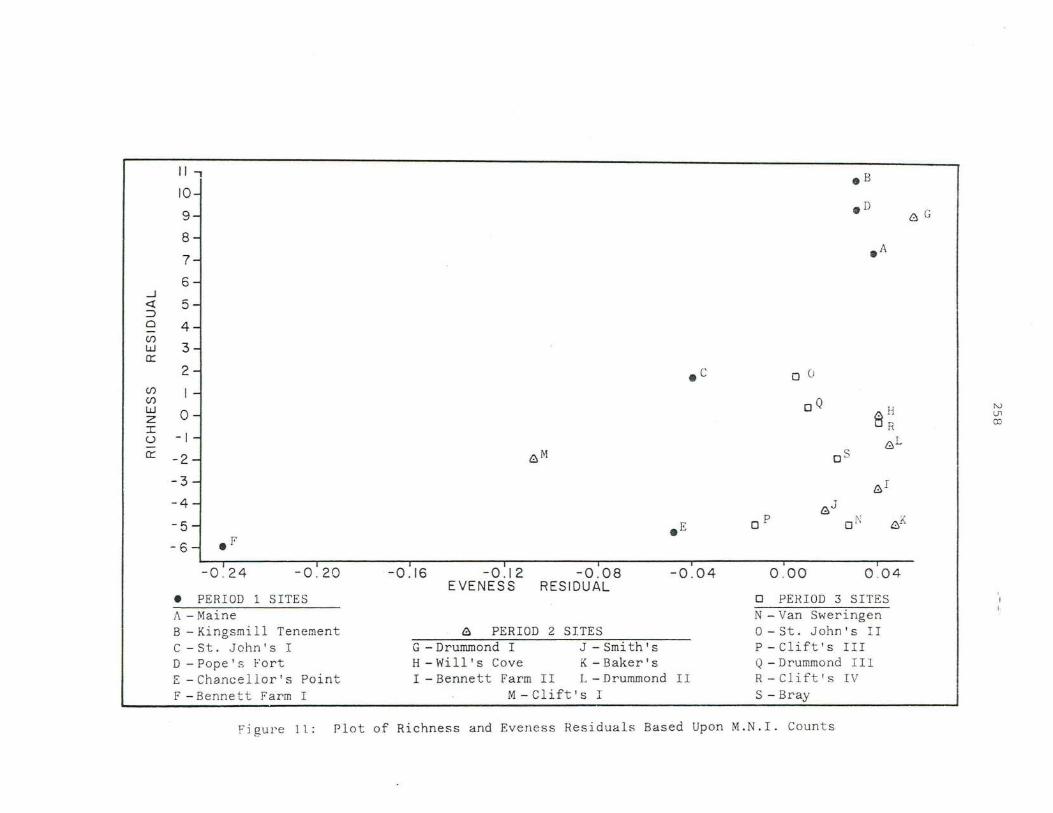
...J <l: :::J 0
(f)
w 0::
(f) (f)
w z :r: U
0::
II, I
10-
9-
8-
7-
6-
5-
4 -
3-
2-
1-
0-
- 1 -
-2 -
- 3-
-4 -
-5~F 6 •
-0 . 20 -0 . 24
• PERIOD 1 SITES /\ - Maine B - King sm i 11 Tenement c - st. John's I D - Pope 's Fort E - Chancellor's Point F - Bennet t Farm I
-0.16 -0.12 EVENESS
& M
-0.08 RESIDUAL
8 PERIOD 2 SITES G - Drummond I J - Smi th' s H - will's Cove K - Baker's
.E
c •
-0 .04
I - Bennett Farm I I L - Drummond I I M- Clift's I
.B
OD
.A
o C!
0 0 eH
R ~L
o S
&I
& J o P o r; e X
0 .00 0 .04
o PERIOD 3 SITES N - Van Sweringen o - st . John's II P - Clift's III o - Drummond III R - C 1 i ft ' s I V
S - Bray
Figure 11 : Plot of Richness and Eveness Residuals Based Upon M. N.I. Counts
~ G
~
U1 OJ

259
distribut i on can be perceived as a continuum of diversity.
The early sit es in the upper right corner of the graph have
both the greatest richness and the highest e v e nness of any
sites in the sample. These sites, The Maine, Kingsmill
Tenement, Pope's Fort and Drummond I, evidence a reliance
upon a broad variety of species including small mammals,
birds, and fish, in short, a more diffuse strategy. Further
along this continuum, a display of moderate richness and
evenness is shown by St. John's I. At the bottom of the
scale are the sites of Chancellor's Point, Bennett Farm I and
the Period 2 site of Clifts I. These sites have low richness
and the lowest evenness of any sites in the sample. These
indices apparently represent strategies that concentrated
upon the exploitation of a few species. Examination of the
identified species and MNI's from these sites (see Appendix
I) suggests that the principal focus of subsistence was upon
three species of large, bottom dwelling fish, the sheepshead,
black drum, and red drum.
The dichotomy between diffuse and specialist strategies
among the early sites is surprising. The variation provides
strong evidence that a diffuse strategy did occur at most
sites during the early decades of settlement. Many different
species were integrated into a generalist strategy at the
early sites (The Maine, Kingsmill Tenement and Pope's Fort)
a strategy that appears to have provided security through
diversity. The low diversity at other early sites, however,
suggests that more specialized adaptive strategies were also
employed during this period. At each site, certain species

26 0
of fish account for a substantial portion of the MNI's.
fish-oriented strategy may have been developed as an
alternative in the Chesapeake as the dependability of the
estuarine resources became known.
This
In contrast, the Period 3 and most Period 2 assemblages
tend to be less rich than the samples from the Period I
generalist sites. The variability between sites is small
compared to the earlier sites and a clustering effect is
apparent. Subsistence may have become more specialized and
have focused upon a smaller number of species. Most of the
households employed this strategy, a trend that was predicted
by Hypothesis 3.
The above findings appear to generally support the
predictions of the hypotheses, but there is a potentially
serious problem with this approach. The traditional means of
measuring diversity is based upon the MNI count. This
measure ignores the differences in the sizes of species, an
obviously crucial variable when evaluating human subsistence
patterns. With the MNI approach, one cow is equally as
important as a small gray squirrel. Clearly, this can create
difficulties in assessing the actual importance of species in
subsistence.
Fortunately, as Hardesty (1975) has pointed out, there
are other means of calculating diversity. The most
appropriate in this instance is the estimated pounds of meat
provided by a species. Of course, the meat estimate is also
based upon the MNI count and is subject to the same problems,
but it has the benefit of adequately compensating for the

26 1
natural size differences between species . . Therefore, the
estimated meats provided by each of the species identified at
the sites were subjected to the same statistical procedures
to calculate richness and evenness.
To test for a sample size effect, Spearman's r was
again employed and it was found to be significant past the
.01 level and in the directions predicted (Richness r =
. 7518, Evenness r = - .5640) . Scatter plots of richness and
evenness against sample size revealed that the relationship
was again linear. Least-squares regression equations were
calculated for each with sample size as the independent
variable. This calculation revealed that sample size
accounted for less of the variation in evenness (Richness r
square = .427, Eveness r-square = .256), but the slopes for
both equations were still significant at the .01 level.
Residuals from the richness and evenness equations were then
plotted against each other. The result presented in Figure
12 is quite different from the MNI plot. One of the most
readily apparent changes is that while the Period 1 sites
still display evidence of a relationship between richness and
evenness, it is negative. The distribution of sites,
however, remains similar with the three earliest occupations
(Maine, Kingsmill Tenement and Pope's Fort) an obvious group
at the upper end of the graph. Drummond 1 still displays the
characteristics of these early sites. St. John's I remains

...J <t :::J 0
if)
w 0::
if)
if)
w Z I 0 -0::
I I
10
9-
8-
7-
6 -
5
4-
3
2 -
I -
0-
-I
-2 -
-3-
-4-
-5 -
-6-
G 6
0° O R
I
-0 .1 2
• IJElllOD !\ - ~1aine
H 6 Q o
-0 .08
SHES
Fl - Ki ngsm i I 1 'l ' em" In E' 1l t·.
e - S t . .John's J
J) - Pore's FC)i"t
E - Chancel lo r's Point F - Benne t l Fa l'm I
.B
.D
.A
.C
S {}, L 0 6 M
6 1
6 ,]
6 K o P
I
-0 .04 0 .00 0 .04 0 .08 EVENESS RESIDUAL
6 PERIOD 2 SITE S C - Drummond 1 J - Smith's H - wi 11' s Cove K - Baker' s I - Bennett Farm II I. - Drummond II
M - cli ft r s I
. E 0 1\
0 . 12 0 .1 6
o PERIOD 2 Sl'fES
N - Van Sweri.ngell o - St . John's 1 J F' - Clift ' s II I Q - Dmummo nd I I I R - Cli.ft 's IV
S - Bray
Figure 12 : Plot of Richness and Eveness Residuals Based Upon Meal Estima t es
•
I\J (j\ I\J

263
in the center while at the bottom is found Chancellor's Point
and Bennett Farm I. Thus, the overall distributional
characteristics of the Period 1 sites have not changed but
the nature of their relationship and their interpretations
have. The earliest sites display high richess but their
evenness is near the trend line and is thus lower than
suggested by the MNI residuals. The two specialist sites
display the highest evenness, whereas they had been the
lowest in the sample for evenness.
Both of these differences exhibit a correlation, but why
should meat weights give a negative correlation while the
MNI relationship was positive? The answer relates to the
types and sizes of animals exploited by the colonists.
Every site yielded, in varying proportions, the remains of
cattle, swine and deer - the largest bodied mammals
available; together they accounted for over 60% of the
estimated meat at all sites. Hence, subsistence richness
was increased in the Chesapeake environment through the
inclusion of smaller animals. With many small animals added
to subsistence, evenness will decrease because of the bias
imparted by the large mammals, and thus, a negative
relationship between richness and evenness is found. At
Kingsmill Tenement, the Maine and Pope's Fort, cattle, swine,
and deer predominated in terms of meat but not in terms of
MNI. Nearly all of the other species, with the exception of
sturgeon, were small creatures, each contributing only a few
pounds of meat.

264
In contrast, at Chancellor's Point and Bennett Farm I,
the assemblages are characterized by low richness and high
evenness. Fewer species are found at these sites and nearly
every species makes an important meat contribution. In both
cases, large bottom- dwelling fish and the large mammals
account for nearly all of the estimated meat. Thus, a
specialization upon select, dependable resources seems to be
evident at these sites.
The distributions of Period 2 and 3 sites are still
difficult to distinguish, but there is some indication of a
negative correlation for the Period 3 assemblages. This
visual impression is produced by the St. John's II, Clifts
IV, and Drummond III assemblages located on the left side of
the graph. These sites have higher richness and lower
evenness indices than any of the other Period 3 sites and
most of the Period 2 sites. While this might suggest a
broadening of resource usage in the early 18th Century,
another possibility must be considered. It may not be
coincidence that each of these assemblages is from the final
phase of long occupations. A process that is certain to
occur on long, intensively occupied sites, but that is seldom
given any consideration, is redeposition . The longer and
more intensively a site is occupied, the greater the chances
that earlier materials will find their way into later
deposits. The effect of this on faunal materials would be
the addition to the assemblage of a few elements from
different species that represent one or two individuals. For
species that remain abundant in these later assemblages such

26 5
as cattle, the inclusion of a few earlier bones would
probably not significantly alter the MNI counts. For
example, the number of swine might be raised from 10 to 11.
For poorly represented speices, however, the earlier
materials could significantly change the MNI estimates, such
as raising the number of sheepshead from none to two.
Richness at the sites would be increased while evenness would
be lowered.
It is essential to recognize the operation of this
phenomenon, even if it is difficult to account for it. If it
occurred, such a process will be best evidenced by the
appearance of other well dated artifacts from earlier phases
in late contexts. At both the St. John's and Clifts sites,
this unquestionably happened. Ceramics from the first phase
of occupation at both were found in later pits. Data from
the Drummond site are not available to determine whether a
similar situation occurred, but it seems likely. Therefore,
the richness indices for these three late sites are probably
artifically inflated due to a recognizable but hard to
control taphonomic process. This suggests that these
assemblages are less rich and more even than indicated by the
residual plot.
This exercise has revealed that there are substantial
differences between the assemblges in this sample. The
Period 1 sites display the greatest variation and tend to
cluster into two groups representing different adaptive
strategies. One is a generalist approach that is in keeping
with the prediction of a diffuse strategy on the frontier

266
while the other appears to be more specialized than expected.
Most Period 2 and 3 assemblages, on the other hand, are
notably less rich and less variable than the earlier samples.
This suggests that, overall, subsistence became more uniform
and focal through time.
The MNI and meat weight residual plots produced
different results but the overall interpretations are
similar. In both, the distinction between the early
generalist and specialist sites is apparent, as is the
greater uniformity of the later sites. These differences are
so pronounced that they were even recognizable with the
simple Hardesty formula for niche width. These statistical
procedures have detected patterning that would have gone
unrecognized by a consideration of diversity alone. The use
of MNI counts and meat weights to measure eveness provides
different perspectives on subsistence and each method is of
value. The meat weight residuals arguably yield a more
detailed and accurate measure since they deal with a variable
of more direct relevance for subsistence than the MNI -- the
amount of food an animal represents in the diet.

267
Seasonality In Subsistence: 1620-1660
While the estimates of niche width indicate that early
17th Century subsistence strategies tended to be diffuse,
additional evidence for a diffuse strategy should be found
in the seasonal variability of the diet. All subsistence
systems undergo some seasonal variation because most plants
and animals have seasonal cycles, but for people employing a
diffuse strategy the carefully scheduled use of resources
throughout the year is crucial. Only in this way can they
exploit a wide variety of resources without rigid dependence
upon any single item ( Cleland 1976). Therefore, if the early
colonists employed a diffuse adaptive strategy, evidence for
marked variations in subsistence throughout the year should
be present.
Archaeologically, the seasonal, scheduled use of
resources will be indicated by variability in the composition
of faunal samples. At permanently occupied sites, detection
of this rests upon the assumptions that features filled at
different portions of the year will contain the remains of
animals utilized during that period and that these seasonal
fill periods can be identified. Of course a feature may not
be completely filled at one season of the year and bones from
an earlier portion of the subsistence cycle could be mixed
in. Moreover, if features are not closely associated in
time, changes in the overall adaptation could be erroneously
interpreted as seasonal changes. Despite these potential
problems, it is probable that evidence for seasonal
variations in the diet can be found in features that appear

268
to have rapidly filled and which date to the same general
period.
Feature data from four sites dating to the pre-1660
period are available (seasonality data along with species
lists for each feature are provided in Appendix III ) . The
earliest site is Kingsmill Tenement from which faunal
materials from five pits have been analyzed. The artifacts
were sufficient to date these pits to a relatively brief
period ( c. 1625-1650), but their precise sequence of
deposition could not be determined. To gain some
preliminary indication as to whether there are any seasonal
differences between these units, the overall composition of
the bone assemblage by zoological class is considered. See
Table 19 below.
Table 19: Class Frequencies in Kingsmill Tenement Pits
Total Feature Bone Mammal% Bird% Fish% Turtle%
425 261 12.26 24.90 54.90 8.42 154 302 67.88 2.65 15.56 13.90 369 203 83.74 7.88 4.43 3.94 393 1077 97.30 1. 67 0.46 0.55 430 148 100.00
Even at this general analytic level, the degree of variation
between these units is striking. Mammal bones display the
largest range of variation but the frequencies of every class
differ importantly from pit to pit. Such variation is

269
expected to be found if the diet altered in a seasonal
manner.
To determine the cause of this variability, the
individual animals present in each feature must be studied.
In order to link the differences to seasonality, various
indicator species should be found in the pits. These are
certain animals available only during specific portions of
the year. The presence of different groups of seasonal
indicators in each of the features, such as crabs and
migratory waterfowl, would strongly suggest that the pits
were filled at different times of the year. This was, in
fact, found to be the case in most of the units and it was
possible to assign seasonal depositional periods to them. The
pits and their estimated fill periods are as follows:
Feature 425 = Late Summer to Fall
Feature 154 = Summer
Feature 369 = Spring to Summer
Feature 393 = Fall to Winter
Feature 430 = Most Likely Winter
Thus, the appearance of different seasonal indicators in
these features strengthens the attribution of variation to
seasonality in subsistence.
If the feature materials do represent different
portions of the yearly subsistence cycle, as seems likely,
the usage of mammals, birds, fish and other animals can be
expected to differ; some indication of this has already been
obtained from consideration of the class frequencies. To
evaluate this, the bones identified to genus or species from

270
each pit have been divided into seven groups: domestic
mammals, domestic fowl, wild fowl, fish, turtle, crab and
wild mammals. This division is based upon recognized
ecological differences and, more importantly, the crucial
distinction between domestic and wild food resources. To
better assess the implications of these differences in terms
of diet, the MNI counts for each species were converted to
estimates of consumed meat. Since the samples are small,
these meat estimates are probably not especially precise, but
they can still provide a rough indication of the overall
emphasis of subsistence at different portions of the year.
The results of this investigation are presented in Figure 13
and Appendix III).
The proportions of both bones and meat vary
substantially among these features. Figure 13 displays the
percentages of animal groups by pit in the order suggested by
seasonal indicators. The spring filled pit is at the top,
the summer deposits are in the middle and the fall or winter
deposits are at the bottom. The high degree of variation in
resource exploitation is striking. In the spring deposit
(Feature 369), domestic bones and meat predominate but wild
species contributed over one third of the bones and estimated
meat. The diversity of animals is even wider in the summer
deposits (Features 154 and 425) and wild species contributed
much of the meat in Pit 425. It should be noted that the
domestic mammal meat estimates in Feature 154 and especially
Feature 425 are probably much too high. Two cattle bone
fragments in Feature 425 displayed some indications of

FEATURE 369
FEATURE 154
FEATURE 425
FEAT URE 393
FEATURE 430
Fo Fo
~ DOMESTIC M - Mammal Fo - Fowl
2 71
BONE %
T - Turtle
C
Fo
Fo
Fo Fo T
T Fo
o WILD
MEAT %
Fi T Fo Fo
T
Fi - Fish C - Crab
Figur'e 13 : Bo n e and Me al Cump o si tion of' Kings mill T(; n ern e n t F'eatures

272
carnivore activity and almost certainly do not indicate that
an entire cow was consumed at that time. This instance
points to a limitation of the MNI method when used with small
bone deposits. Hence, the domestic contributions for these
two units are probably significantly inflated.
The fall-to-winter deposit (Feature 393) differs
dramatically from the summer assemblages by a greatly reduced
proportion of wild animal bones and meat. Only deer were of
any significance. The total absence of wild species in Pit
430 can be interpreted as a continuation of the shift toward
domestic r esources in the fall to winter . Even if the Pit
430 assemblage is biased by unknown preservational factors,
a condition not suggested by the bones, the overall trend is
clear.
Therefore, all of the means of viewing these
assemblages - class composition, seasonal indicators,
bones identified, and meat estimates - revea l substantial
differences between the samples. Since all the pits date to
t he same general time period and contain different seasonal
indi cators, i t is reasonable to attribute t his variability to
seasonal differences in resource use. The magnitude of t his
sh ift is large, judging from the bone frequencies and meat
estimates, a nd provides strong evi dence that resources were
utilized in a scheduled manner.
The subsistence cycle suggested by this data is as
f ollows. In the early spring, reliance was placed upon
domestic cattle and swine, p r obably in the form of preserved
meats , with the consumption of some deer, raccoon, fish and

27 3
wildfowl. With the approach of summer, an even greater
emphasis was placed upon the exploitation of wild animals.
Deer and small mammals continued to be of importance along
with turtles, crabs and a variety of fish. The contribution
of domestic species was relatively minor, especially
considering the likely overemphasis of domestic meats in
these assemblages due to analytic methods. Heavy usage of
wild resources continued into the fall when migratory
waterfowl were added to the diet. During the October-
November period, a major shift in subsistence occurred with
heavy reliance once again placed upon domestic resources.
Late October to early December was the traditional time for
livestock slaughtering in England (Anderson 1971) and
documents (Spencer 1983:112), as well as the archaeological
record indicate that this tradition continued in the
Chesapeake. During this time of the year, deer were the only
wild resource of importance although some wild meat may have
been obtained through the trapping of beaver and raccoon. In
general, the winter diet appears to have been overwhelmingly
domestic in composition.
If subsistence did shift in such a scheduled manner,
evidence for it should be found at other early sites in the
Chesapeake. Bennett Farm is the only other Virginia site
from this period from which feature data are available. One
large multi-layered trash filled pit (Feature 28) from
Bennett Farm dates to c. 1645 - 1660. Although there is
apparently a mixture of materials in this feature, data from
one major stratum (28A) appear to represent an unmixed summer
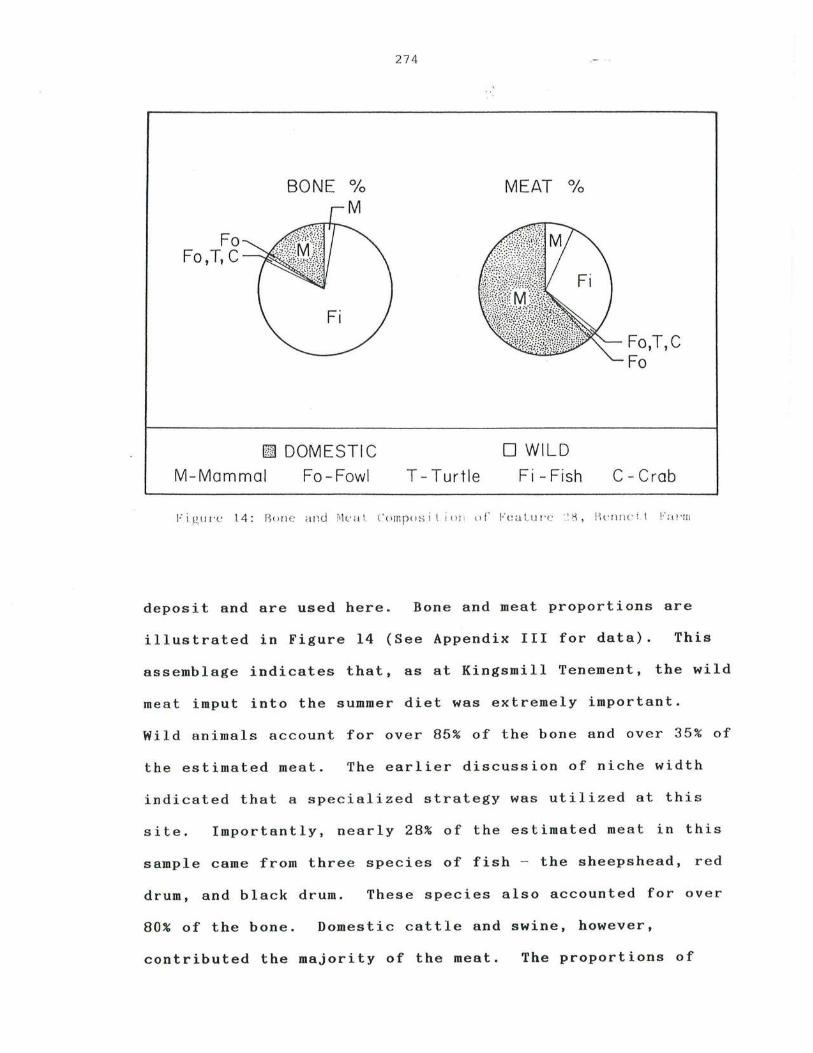
Fo Fo,T, C
BONE 0/0
IZl DOMESTI C
M-Mammal Fo - Fowl
2 7 4
T-Turtle
MEAT 0/0
o WILD
Fi - Fish
FO,T,C Fo
C - Crab
I,' i g , lIl'C l4 : 11() rl C and ~'1 '<1 t (' ()rnp()s iI i () I , tI f' !,'e<.t Lu I ' C :": 8 , I\cn rlc i 1 1,' ;· t!'tr1
deposit and are used here . Bone and meat proportions are
illustrated in Figure 14 (See Appendix III for data). This
assemblage indicates that, as at Kingsmill Tenement, the wild
meat imput into the summer diet was extremely important.
Wild animals account for over 85% of the bone and over 35% of
the estimated meat. The earlier discussion of niche width
indicated that a specialized strategy was utilized at this
site . Importantly, nearly 28% of the estimated meat in this
sample came from three species of fish - the sheepshead, red
drum, and black drum. These species also accounted for over
80% of the bone. Domestic cattle and swine, however,
contributed the majority of the meat. The proportions of

2 75
wild to domestic meat seen here are almost identical to that
found in the spring-to-summer assemblage (369) at Kingsmill
Tenement. While the ecology of these two sites is
different, the same pattern of resource usage, at least for
the summer, is suggested at both.
Does this same pattern occur at early sites in
Maryland? To answer this question, data from two pits at the
St. John's site (dating ca. 1640 - 1660) and one apparently
unmixed stratum from the Pope's Fort ditch (ca. 1645-50) are
available. Unit 50M/50P from St. John's yielded remains of a
variety of species and seems to have been filled sometime
between the late summer and early winter. Nearby Feature
55C/G, originally a privy, was filled with refuse during the
spring or early summer. The single stratum from the Pope's
Fort ditch (l222N/P) contained many species, including a wide
variety of migratory waterfowl, and the stratum seems to be a
summer - to - early- fall deposit. Bone and meat compositions of
these features are graphically displayed in Figure 15 while
the species counts and seasonal evidence can be found in
Appendix III.
The compositions of these units are comparable to those
from the Virginia sites in that many different species are
represented. Feature (55C/G), a probable spring deposit,
shows a heavy reliance upon deer with some fish consumption.
The domestic meat estimate from this feature is nearly 50%.
Since domestic mammals account for only a tiny proportion of
the bones (there are only two elements from the entire
feature and both are of cattle), the possibility exists that
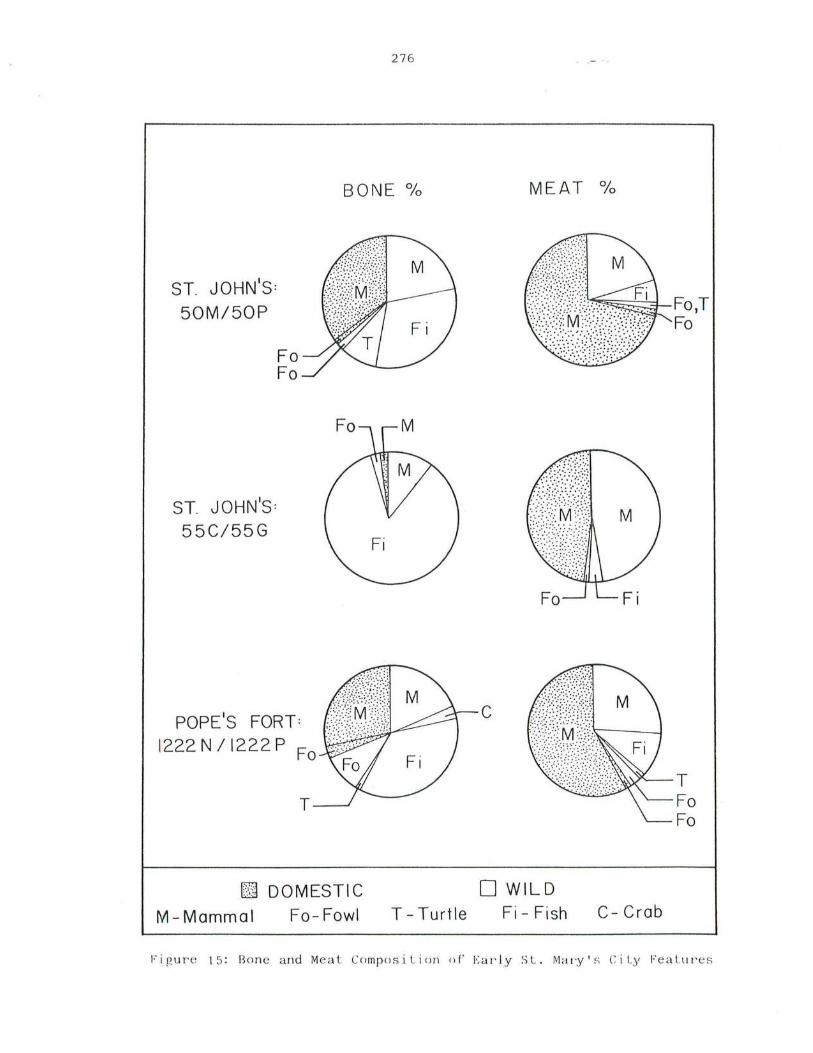
27 6
BONE °10
ST. JOHN'S:
50M/50P
ST. JOHN'S :
55C/55G
Fo Fo
POPE'S FORT :
1222 N 1 1222 P
T
fill DOMESTIC
M-Mammal Fo- Fowl T-Turtle
MEAT °10
~;;;::;::::::;~-::L Fo,T
C
o WILD Fi - Fish C - Crab
Fo
T Fo Fo
Jo' i guf' C 15 : Bon e and Me a t Compo s iLion o f' j':ar'!Y SL. Mar'y ' s C ity Fe a t ll l'es

277
the actual contribution of the domestic animals is greatly
overestimated. The evidence, nevertheless, does indicate
that deer and fish were of importance in the spring diet. The
composition of the other assemblages suggests that the summer
and early fall diets incorportated a wide variety of species
from many sources; almost all of these species were wild .
The meat estimates from 50M/P and 1222N/P are based upon
substantial samples and indicate that deer and fish,
especially sheepshead, were major components of the diet.
The Pope's Fort sample appears more likely to be a summer to
early fall deposition and the quantities of migratory fowl
and fish are greater than seen in Unit 50M/P. Domestic
animals constitute a larger proportion of the meat in Unit
50M/P and the seasonal indicators suggest that deposition in
this feature continued to late November or longer.
Therefore, while the St. Mary's data are slightly more
limited than that from Virginia, the data are sufficient to
demonstrate that similar variations in the diet occurred
during the year. The summer was a period of heavy reliance
upon wild food resources. Comparison of the Pope's Fort and
St. John's features also indicates a trend toward greater
domestic mammal reliance in the late fall.
Investigation of the feature data from early 17th
Century sites in the Chesapeake reveals that the colonists
did exploit resources in a seasonally varying, probably
scheduled, manner. This evidence, along with the data
concerning species richness and evenness presented earlier,
appear to confirm that the adaptive strategy during the early

2 78
decades of settlement was diffuse. Certainly the variety of
resources far exceeded those used in England. Some early
specialization upon certain resources such as deer and
several species of fish is apparent but, in general, the data
indicate that a diffuse strategy prevailed at most sites.
This is as predicted, and hence the available data argue for
the acceptance of Hypothesis 2.
Resource Depletion and Focal Adaptations
Hypothesis 3 predicts that the diffuse adaptation
identified above would gradually shift to a focal adaptive
strategy. As population grows, food requirements increase
and additional pressure is placed upon subsistence resources.
With a much larger population, many of resources upon which
the coloni s ts or i ginally rel i ed would not be s ufficien t t o
meet food needs. Depletion of some resources will almost
certainly occur, and more abundant and dependable resources
would probably be emphasized in the diet. Over time, the
adaptation is predicted to concentrate upon a few highly
reliable and efficiently exploited resources, so that a focal
adaptive strategy will eventually emerge in the area of
colonization.
A necessary step in evaluating this hypothesis is to
ascertain that population increase and resource depletion did
occur. The tremendous and rapid growth of the Chesapeake
population has already been thoroughly discussed in Chapter
4 and need not be further explored here. Evidence regarding
resource depletion, on the other hand, is harder to find.

27 9
A survey of a large number of 17th and early 18th
Century documents has yielded few direct indications of
depleted resources. A lack of documentation is not
unexpected since depletion is a gradual process and probably
attracted little attention. A few references of note,
however, do exist. In 1705, Robert Beverely wrote that while
much wildlife could be obtained, "Deer are commonly sold at
eight, ten or twelve shillings a head, according to the
scarcity"(1947:291). Since deer do not migrate, this implies
that deer were more common in some localities than in others.
Two decades later, Hugh Jones (1956:78) observed that:
Their venison in the lower parts of the country is not so plentiful as it has been, though there be enough and tolerably good; but in the frontier counties they abound with venison, wild turkeys, etc.
The "lower parts of the country" to which he referred is the
Tidewater area, which includes the area from Jamestown
eastward, where all of the Virginia archaeological samples
were excavated. Jones clearly indicated that the deer
population had been depleted in the longest settled areas and
left the impression that turkeys were also less available.
Archaeological evidence of the over - exploitation of
naturally occurring resources is equally difficult to obtain.
Nevertheless, one striking example from a 17th Century
context emerged from a study of oyster shells found at the
St. John's site in St. Mary's City (Kent 1980; Kent and
Miller n.d.). Questions addressed in this study, included
that of harvesting intensity. If the colonists were having

280
an important impact upon the oyster populations near St.
Mary's City, the study predicted that an increase in the
intensity of harvesting would be reflected by a decrease in
the size of oysters. The oysters would be harvested before
they could grow to large sizes. To evaluate this, the height
of the shells (i.e. the longest dimension) was measured from
four features at the site: the privy (55C/G), the circular
pit (50M/P), a large rubbish pit (75C/S), and the cellar of
the main house. Together these samples span the site
occupation from c. 1640- 1720. The results of this analysis
are presented in Figure 16 which shows the distribution of
oysters by modal size class against the human population.
There is a strong inverse relationship between oyster shell
size and human populat i on s ize. Human population fluctu a ted
during the first decades due to political turmoil, but from
the 1650s onward, the number of colonists residing in the St.
Mary's City area rose, and peaked just before 1695 at 200-
300 inhabitants. When the capital was moved to Annapolis in
1695, the human population rapidly declined. Many of the
remaining inhabitants left in the early 18th century when the
county goverment moved to another location. This strong
inverse relationship suggests that the colonists were having
a substantial impact upon the local oyster populations
through over- exploitation. other explanations for this
decline and sudden rise in shell size are unsatisfactory.
Shell shape, an attribute that indicates the habitat from
which the oysters were obtained, remained relatively constant
throughout the century. No indication exists for any
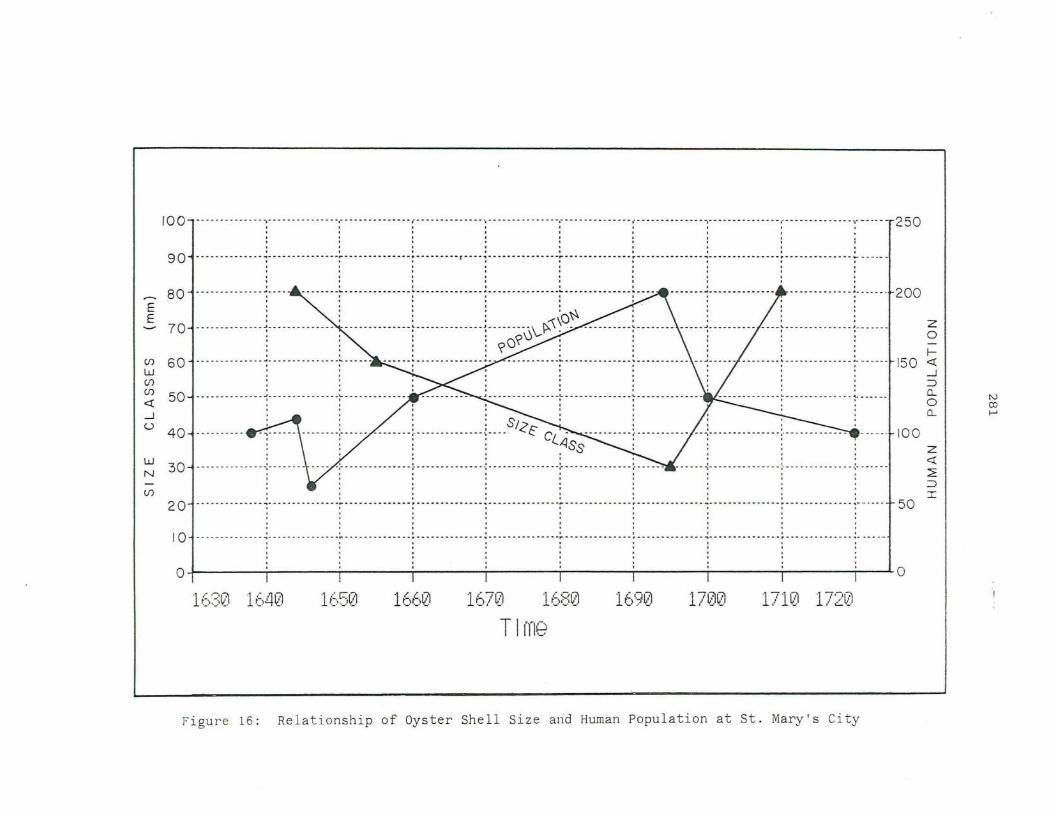
E E
100
90
80
70
(j) 60 w (j)
(j) 50 <{
-.l
U 40
W N 30
(j)
20
• - - .. - - ...... _ .. .. _ .. ...,_ .. - .. .................. .. -,- .............. -- .. .. .... -,' ............ .. .... .. ...... .. " ............................. ,- ............................ t' ............................ -.- ............................ " .............................. - -- -_ .. . . 250
............................ ~- .............. .... ...... .. -:- ...................... .. .... ~ .................. r ........ ~ .......................... .. -:- ............................. : .................. .. ........ ~- ............................ : ............................ ~ ......... .. . 200
z 0
f-
-_._----:--------------;---- ----------j----_. __ ._ -----~~-- ------------:----
-- .. -- .. -.. ---~--- -- - .. --.--- --------------, . ~ : . : : ~____ . ___ ___________ ~--- - - ----. ~\,o- . \. I : : : '" ~ ~ ?O?\)'v . - ---------~- - - . ---- -- - - - ~ - --------- ---- ----- -.-----) .. -.-. -.
, , ______________ ..11 __ _ ______ ___ ___ ... __ ___________ .. ______________ ....
150 <{ -.l ::::> CL 0 CL
100 z <{
~ ::::> I
50
, : : ~ ___ _ S/2t ~-- --+--- - ---/--___ ; ___________ _ . . .... , (~SS ~ .
.J: ::: t:: ::::J.. . .... ' ·.1 ··.·1.·· · .. j ... : I I , • ' , , ' .
- - ----- ',------ -
I 0+· ........ uu~ ... u ... uuu.'uuuuuuu uuuuuuu ... u ...... uu: .·.uuuu uuuuuuu:--u ......... u uuuu I 0
' ' i : i 0' i
1630 1640 1650 1660 1670 1 .' '-;(iI ~)I)I,o~J
T I (fie
i t· >::;i'/) ~)., ~-' I T)lil . ~-' 17ww 1'10 " " " - '
Figure 16 : Relationship of Oyster Shell Size and Human Population at st. Mary's City
N OJ I--'

28 2
year period. Evidence for this comes from the organisms that
grow on the shells and which are sensitive to changes in the
estuarine environment; their frequencies vary little between
the samples.
Other archaeological studies of molluscs have found
similar changes in shell size through time (Klein 1979;
Straus 1980) but never in such a short time span. This
evidence argues strongly that the colonists had a rapid and
pronounced impact upon the oyster resources in the St. Mary's
City area. The precise correlation between human population
and oyster size constitutes a remarkably clear example of the
relationship between population size and harvesting pressure.
The nature of the relationship indicates that the colonists
not only could, but did have, a substantial impact upon the
the naturally occurring resources. Of course, the St. Mary's
City vicinity did experience human population densities
rarely found elsewhere in the 17th Century Chesapeake, and
resource exploitation was therefore more intense in that
locale. The process was not any different in St. Mary's
City, however. The process was only more rapid and
pronounced there. As the Jones reference indicated,
resources were also being depleted elsewhere in the region.
Therefore, even though the data are sparse, they are
sufficient to conclude that depletion of natural resources
was occurring in the longest settled portions of the colonies
by the late 1600s.
283
Trends in Relative Faunal Frequencies
Were there any significant temporal changes in animal
utilization in the Chesapeake, and if so, were these in the
direction predicted by the third hypothesis? To answer these
questions, it is necessary to employ statistical tests to
determine whether any of the perceived changes are truly
significant . Unfortunat e ly, the nature of the data base
makes this a perilous task. To correctly apply inferential
methods, the samples used must be randomly drawn from the
population under investi gation. This is not the case with
the archaeological samples discussed here. Therefore,
strictly speaking, the use of parametric statistical tests
is meaningless. This problem, however, is not unique to the
Chesapeake region but is virtually universal in archaeology .
The seldom stated, but necessary, justifica tion for importing
statistical inference into a domain where its use is
questionable is that the non-random samples are somehow
"representative" of the population and behave sufficiently
as a random sample for the tests to be employed. This
defense is offered here. Determination of the validity of
this assumption is not possible but it is unlikely that the
data from this archaeologically large sample are hopelessly
biased.
To begin evaluation of trends in the relative abundance
of species, bone frequencies were used instead of MNI counts.
Bones are , the primary data base and their use provides much
larger samples than are obtained with the number of
individuals. In addition, by combining species into larger
28 4
groupings (i.e. waterfowl or fish), sample error is lessened.
This action also greatly reduces the number of zero
frequencies and makes it possible in principle to
successfully apply normalizing transformations of the data.
Equally importantly, this approach can help mitigate the
effects of sample size on the estimates of relative
abundance. Abundance estimates of less common animals will
be related to sample size for the same reasons that diversity
measures are.
The species were divided into ten groups or classes for
analysis, based upon habitat preferences of some wild animals
and the domestic nature of others. These classes are Cattle,
Swine, Sheep/Goat, Domestic Fowl, Deer, Small Wild Mammal
(raccoon, opossum, squirrel, etc.), Wild Waterfowl (ducks ,
geese), Wild Terrestrial Fowl (turkey, bobwhite, mourning
dove, passenger pigeon), Turtles, and Fish.
The number of bones in each of these groups was
totalled and converted to relative frequencies. To test for
any sample size effect, the Spearman's r test was again
employed with sample size equalling the total number of
identified elements. None of the correlations was found to
be significant at the .05 level. A reasonable conclusion is
that sample size effects, if they exist for these materials,
are small.
Inspection of normal probability plots and calculation
of the Shapiro - Wilk W statistic (Shapiro and Wilk 1965)
indicate significant departures from normality for all of the
285
variables except Sheep/Goat. Most variables are skewed to
the right, a common phenomenon with archaeological materials.
An arcsine, square root transformation was applied to bring
in the upper tails and to reduce the dependence of variances
upon means, a characteristic associated with proportions. In
addition, the rows of data were not forced to sum to unity
since this practice can produce artificial negative
correlations between variables (Sokal and Rholf 1981: 427-
428; Chayes 1971:3-5). This procedure considerably improved
the forms of the variable distributions although five classes
(Cattle, Domestic Fowl, Deer, Waterfowl and Terrestrial Fowl)
still displayed skewing according to the Shapiro-Wilk W
statistic. Some caution is therefore advisable when
evaluating the results of parametric tests. The transformed
values are listed in Appendix V.
To identify any temporal changes in the relative
frequencies of the classes, the division of the samples into
the three temporal periods was continued. Schematic plots
(Tukey 1977) were constructed for all variables by period,
based upon the transformed relative bone frequencies. Figure
17 displays the plots for Cattle, Swine, and sheep / Goat.
The Deer, Small Mammal, and Fish plots are presented in
Figure 18, and the distributions of the three types of fowl
are illustrated in Figure 19. Since this means of data
presentation may be unfamiliar to the reader, some
explanation is in order. The schematic plot presents
visually the mean, median, and variability around these for
a given group. The box represents the area within which 50%
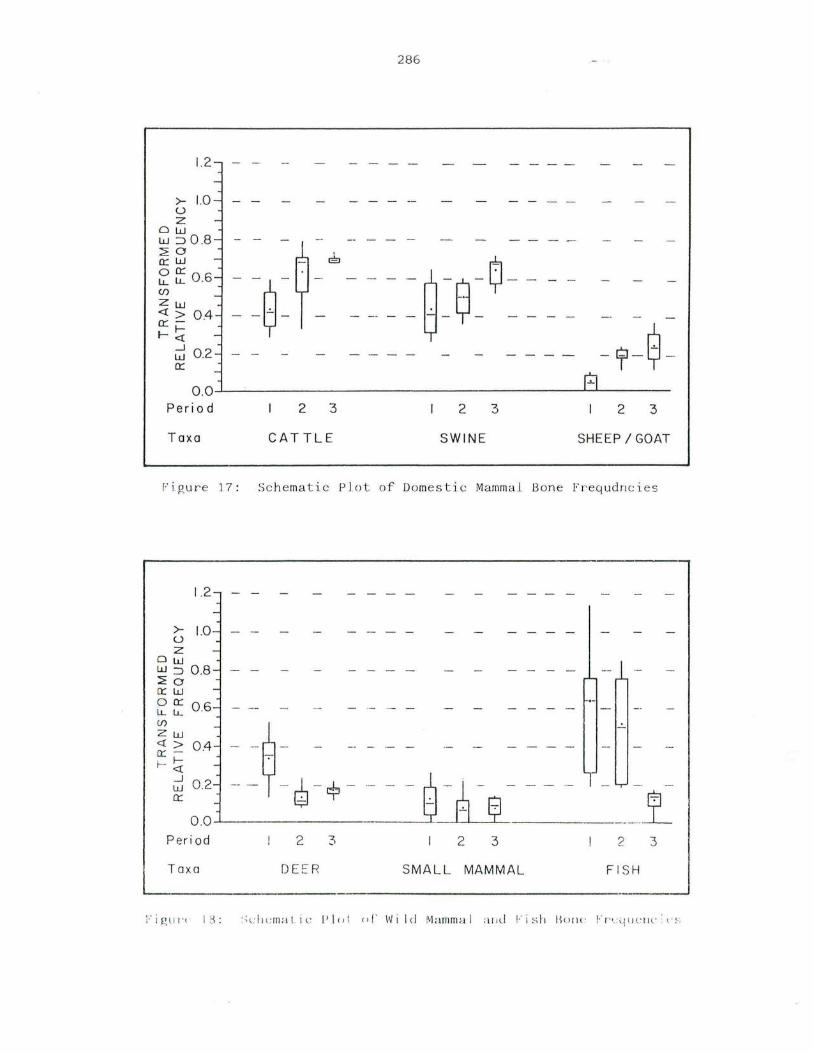
1.2-
-
>- 1.0-u z -
O w w::::>0 .8-20 0::: W -
00::: 06,-LL LL . (f) -Zw ~ > 0.4 -0::: -
I-~ --.J w 0.2-0::: -
286
-rr-$ -R O .O~~------------------------------------~~-------
Period 2 3 2 3 2 3
Taxa CATTLE SWINE SHE EP / GOAT
F i.gur e 1. 7 : Sc h ematic Plo t of Domestic Mamma l Bo n e freq udncies
1.2-
->- LOu z -
Ow w::::> 0 .8-20 o:::w -~ ~ 0 .6-
Zw U) _ ~ ~>0.4- --- ---
~ ~ 02=.- _--7 ~_~ -_~ -_"-- ---l-8-r ~ ---- __ ~ 0 .0-· ---------
Period 2 3 2 3 2 3
Ta xa DE ER SMALL MAMMAL FI SH

12
>-u 10 z
Ow W::J ~ 00.8 O::W 00:: ~ LL 0.6 Z 'w <l:> 0::-04 I- ~ .
-.J W 0:: 0 .2
28 7
O.OJ-----------------------~~~~--------~J-~~~--
Per io d 2 3 2 3 2 3
Taxa DOMESTI C WATER TERRESTIAL
F' i g llr 'e 19 : Sc h e mati c P l ol o f Domestic and wiLd l'owL 130m: I' r c 4 u e nci es
of the sample occurs. Th e mean is indicated by a bar within
the box while the median is represented by a dot. The
single lines extend from the box to the extremes of
variation.
Major changes are apparent in the frequencies of
Cattle, Swine, and Sheep/Goat bones with notable increases
through time. A one - way Analysis of Variance test (ANOVA)
indicates that these differences are all significant above
the .05 level. Since there remains some question regarding
the normality of the data, the Kruskal - Wallis test (a non -
parametric ANOVA based upon variable ranks (Sokal and Rholf
1981: 429-432), was also performed and the results are
essentially the same. Both these statistical tests suggest
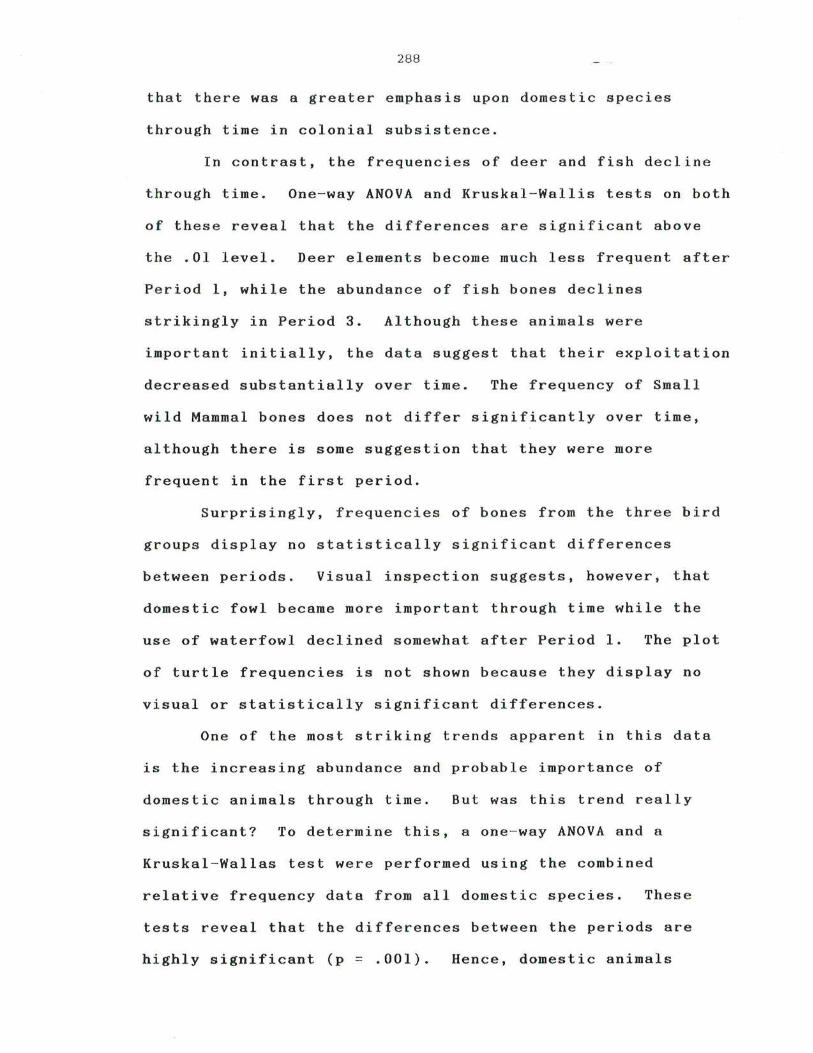
288
that there was a greater emphasis upon domestic species
through time in colonial subsistence.
In contrast, the frequencies of deer and fish decline
through time. One-way ANOVA and Kruskal-Wallis tests on both
of these reveal that the differences are significant above
the .01 level. Deer elements become much less frequent after
Period 1, while the abundance of fish bones declines
strikingly in Period 3. Although these animals were
important initially, the data suggest that their exploitation
decreased substantially over time. The frequency of Small
wild Mammal bones does not differ significantly over time,
although there is some suggestion that they were more
frequent in the first period.
Surprisingly, frequencies of bones from the three bird
groups display no statistically significant differences
between periods. Visual inspection suggests, however, that
domestic fowl became more important through time while the
use of waterfowl declined somewhat after Period 1. The plot
of turtle frequencies is not shown because they display no
visual or statistically significant differences.
One of the most striking trends apparent in this data
is the increasing abundance and probable importance of
domestic animals through time. But was this trend really
significant? To determine this, a one- way ANOVA and a
Kruskal - Wallas test were performed using the combined
relative frequency data from all domestic species. These
tests reveal that the differences between the periods are
highly significant (p = .001). Hence, domestic animals

289
appear to have occupied an increasingly important position in
the overall adaptive strategy of the Chesapeake colonists.
Such a trend is expected because these are controllable,
dependable resources that offer relatively large quantities
of meat per individual. The increasing importance of
deomestic animals is in keeping with the prediction of
Hypothesis 3 that a more specialized and focal adaptation
would arise.
To gain better temporal control over these changes,
comparisons of the group means between Period 1 and 2 and
Periods 2 and 3 were conducted with the use of T-tests.
These tests revealed that there are significant differences
(p= .05 or over) in bone frequencies between Periods 1 and 2
for Cattle, Sheep/Goat, and Deer. The transformed mean
frequency of bones for Cattle rises from .434 to .616, while
for Sheep/Goat, the increase is from .038 to .165. The
increase in Cattle bone frequencies probably reflects the
rarity of this large, slow reproducing animal during the
first decades of settlement and the gradual development of
cattle herds. Sheep/Goat, on the other hand, were apparently
difficult to maintain during the early decades because of
predators, the lack of pastures, and the shortage of labor.
The slow increase can be associated with the elimination of
many of the predators, and perhaps a lessening of the labor
shortage. Deer bone frequencies, in contrast, show a
precipitous decline from .341 to .128. This decline is
likely related to the slow reduction in their populations due
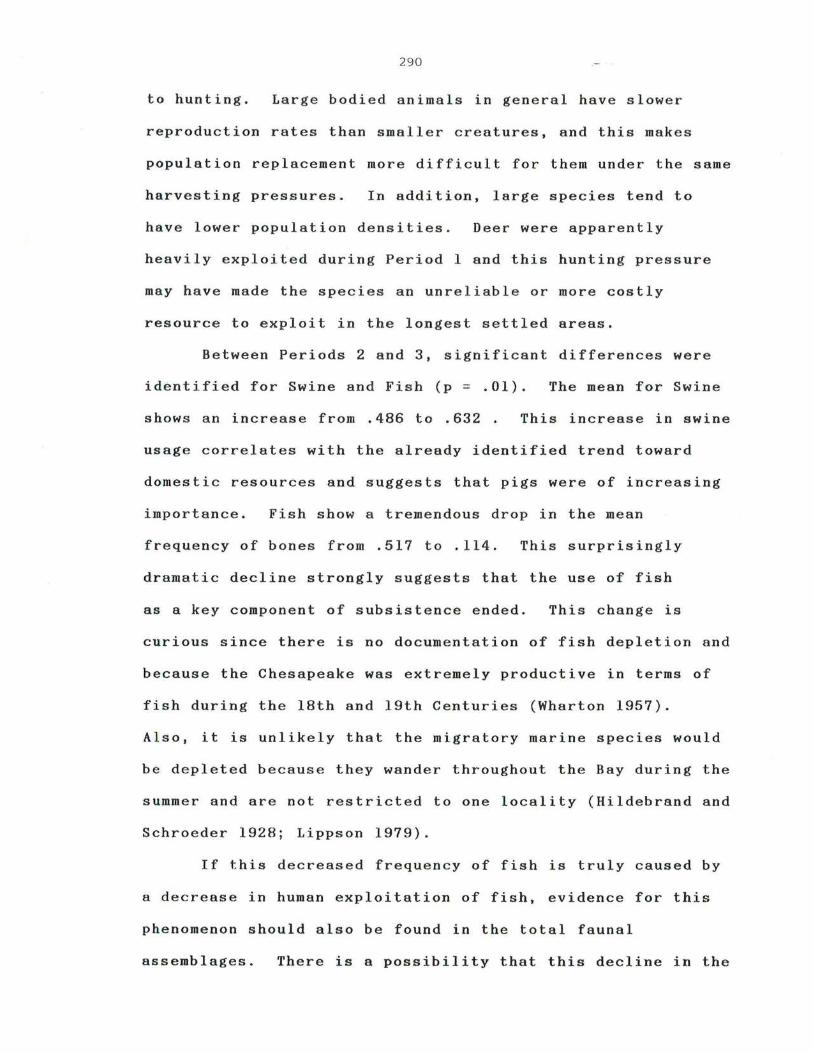
290
to hunting. Large bodied animals in general have slower
reproduction rates than smaller creatures, and this makes
population replacement more difficult for them under the same
harvesting pressures . In addition, large species tend to
have lower population densities. Deer were apparently
heavily exploited during Period 1 and this hunting pressure
may have made the species an unreliable or more costly
resource to exploit in the longest settled areas.
Between Periods 2 and 3, significant differences were
identified for Swine and Fish (p = .01). The mean for Swine
shows an increase from .486 to .632 . This increase in swine
usage correlates with the already identified trend toward
domestic resources and suggests that pigs were of increasing
importance. Fish show a tremendous drop in the mean
frequency of bones from .517 to .114. This surprisingly
dramatic decline strongly suggests that the use of fish
as a key component of subsistence ended. This change is
curious since there is no documentation of fish depletion and
because the Chesapeake was extremely productive in terms of
fish during the 18th and 19th Centuries (Wharton 1957).
Also, it is unlikely that the migratory marine species would
be depleted because they wander throughout the Bay during the
summer and are not restricted to one locality (Hildebrand and
Schroeder 1928; Lippson 1979).
If this decreased frequency of fish is truly caused by
a decrease in human exploitation of fish, evidence for this
phenomenon should also be found in the total faunal
assemblages. There is a possibility that this decline in the

291
number of identified bones could be related to factors other
than reduced exploitation of the resource. A change in
cooking practices, such as chopping up of the fish for stews,
or a shift in depositional behavior such as throwing fish
remains on middens, may have rendered the bones less
identifiable. There could be large quantities of fish bone
in the samples, but few of them may have been identifiable
below the class level. Such a possibility can be tested by
considering the fish bones in the total bone assemblage.
While fish bone can be identified as to class relatively
easily, genus or species identifications are much more
difficult. To determine whether this is the case, the total
fish bone from the sites from each Period was assembled (see
Table 20). Note that these are untransformed values.
The tables data confirm that the same decline seen in
bones identified to the specific level also occurs in the
total samples. Fish bones are rare on sites after 1700
(Period 3), a fact which strengthens the conclusion that a
real decrease in fish usage occurred. The colonists did not
stop eating seafood, for oyster shells and some fish bones
are found in later contexts, but the proportion of fish in
the diet seems to have been greatly reduced from earlier
levels.
These changes in bone frequencies suggest that major
transformations occurred in the colonial subsistence. An
important unanswered question is what impact these apparent
changes had on the diet. Bone frequencies have a general

292
Table 20: Fish Bone In Assemblages By Temporal Period
No. of ___ S=a'-'.!m:...<p:...:l::.-e~ ________ ~F. ish Bon e s Period 1
Maine Kingsmill Tenament st. John's I Pope's Fort Chancellor's Point Bennett Farm I
Period 2
Drummond I Wills Cove Bennett Farm II Smith's Ordinary Baker's Ordinary Drummond II
Period 3
Van Sweringen st. John's II Drummond III Bray
93 262
1643 1252
469 3227
292 234
1552 354
76 3954
36 107 127
11
% of Total
6.90 11.80 39.98 34.27 38.34 78.19
10.59 19.27 38.17
9.20 4.28
37.97
4.64 2.98 4.58 1. 34
relationship to species importance, but analyzing bone
frequencies alone has a major flaw similar to that of MNI
counts -- equal importance is given to every bone. Even
though there are major and clearly important differences in
the dietary implications of a rabbit bone versus that of a
cow, they are counted the same. This problem makes
consideration of estimated meat weights imperative. Meat
estimates are obviously related to both the original bone
counts and to the MNI counts, but they provide a different
perspective on dietary composition by correcting for the size
bias between animals, a bias which can distort perceptions of

29 3
relative species importance in subsistence. If the trends
displayed by relative bone frequencies signify real shifts in
colonial subsistence, then these same trends should also be
apparent in the meat estimates. The meat figures, however,
have not been subjected to statistical transformations to
improve normality distributions. While any body of data can
be transformed, this was considered inadvisable for meat
estimates since biases due to sample size and skewness are
already known to exist with the bone and MNI counts. The
meat weight approach, nevertheless, is the best means
available for evaluating the relative dietary importance of
species. Accordingly, it seems likely that if the major
trends displayed by bone frequencies are real, those trends
should also be expressed in the meat frequencies.
The mean proportions of meat contributed by each of
the previously described ten animal groups were calculated by
temporal period and these proportions are presented in Table
21. Cattle and deer both show major differences between
Periods 1 and 2, parallel ling the changes shown by the bone
freqencies. The contribution of Sheep / Goat also shows an
increase between the first two periods but an equal jump is
evidenced between Periods 2 and 3 that was not apparent in
the bone frequencies. The decline of fish is as clearly
revealed in meat estimates as in bone counts although there
is some suggestion that the decline was greater between
Period land 2 than between Period 2 and 3. As suggested
by the schematic plots of their bone frequencies, domestic
fowl display a tiny but steady increase through time while

294
Table 21: Estimated Meat Frequencies By T~mporal Period
Mean Percentage Animal Group Period 1 Period 2 Period 3
Cattle 44.26 65.39 62.62 Swine 24.65 21.94 25.46 Sheep/Goat .74 1. 95 3.50 Domestic Fowl .18 .30 .35 Deer 16.83 5.38 6.17 Small Mammal 1. 38 .31 .26 Waterfowl .65 .19 .16 Terrestrial Fowl .29 .28 .23 Turtle .25 .32 .23 Fish 10.66 3.92 .90
while Small Wild Mammals and Waterfowl again show a decrease
after Period 1. Terrestrial Fowl and Turtles display no
temporal trends, as is the case with their bones. Hence,
estimated meat frequencies display essentially the same
patterns of change as seen in the transformed bone
frequencies.
To determine whether these differences in meat
proportions are statistically significant, the non-parametric
Kruskal-Wallis test was again employed. The results indicate
that differences in the mean estimated meats for Cattle and
Deer between Periods 1 and 2 are significant above the .05
level while the frequencies of Swine and Fish between Periods
2 and 3 are significantly different at the .05 level. No
statistically meaningful differences occur through time for
Domestic Fowl, Small Wild Mammals, Waterfowl, Terrestrial
Fowl, and Turtles. The differences in Sheep/Goat frequencies

295
through time were not significant but they approached it (p =
.07) . Another K- W test comparing Sheep/Goat frequencies from
Period 1 and Period 3 was conducted and it revealed that the
overall differences were significant (p = .015). To further
confirm the apparent trend toward greater consumption of
domestic animals, the total domestic meat contribution was
combined for each period and was found to be significantly
different (p = .003).
The meat proportion data make it clear that the same
trends detected in the relative frequencies of bones are also
clearly identifiable in the relative frequencies of meat.
Despite the sample size biases and non-normal data
distributions, the bone and meat frequencies reveal the same
general patterns in resource usage. Such close correspond-
ence is somewhat unexpected, but argues strongly that the
identified trends are real. Despite a demonstrated sample
size bias, these findings suggest that the bias does not
conceal the patterns of change that were occurring in
colonial subsistence and imply that meat weight data can also
yield meaningful insights into adaptive strategies.
These archaeologically based discoveries give evidence
of a significant shift in resource usage through time.
Domestic mammals became increasingly important. The Cattle
contribution rose substantially between Periods 1 and 2.
This shift is probably related to the fact that cattle were
difficult to acquire during the early decades of settlement
(Stone 1982:29- 30). Because cattle are large, they are
difficult to transport. They reproduce at a slow rate, and

296
they had a high economic value. Swine, in contrast, quickly
reproduce and are easier to transport. Swine frequencies
display no significant changes between Periods 1 and 2, but
they do alter between Periods 2 and 3. The reasons for this
shift are obscure.
Sheep/goats differ importantly over time and appear to
have become increasingly common. Documents provide evidence
that predators, which were a major problem during the early
decades of settlment, were slowly exterminated. John Clayton
(1965:106) wrote in the 1680s that "Most persons of Estate
Begin to keep Flocks" because the wolves were less of a
problem. The Swiss traveler Michel (1916:37) noted in 1701
that "Sheep are raised in constantly increasing numbers," and
also made reference to the declining number of wolves. An
increased use of wool in home industry is also likely (Carr
and Menard 1979:215).
The trends in domestic animal usage revealed here by
bone and meat frequencies appear to indicate a real
alteration in the colonial subsistence. But are these
findings accurate reflections of the real situation?
Archaeological inferences are rarely verifiable by
independent data, but fortunately such an opportunity is
possible in the Chesapeake region through study of household
inventories. Livestock are listed in nearly every inventory
of the time and this provides the means of comparing
archaeological trends with those in the historical documents.
Therefore, 335 households inventoried in St. Mary's County,

29 7
Maryland from 1638 to 1700 were studied. The numbers of
plantations owning cattle, swine and sheep were tabulated and
the results are presented in Figure 20 as a percentage of the
households in each period that possessed these animals. The
relative frequencies of plantations with these three animals
apparently changed over time. During the early decades,
everyone had swine, but only one third of the householders
owned cattle, and sheep were almost totally absent. This
pattern changed dramatically by the 1660s when cattle were
more commonly owned than swine. By the late 1660s, these two
animals were present in more equal frequencies and despite
some variation, their frequencies remain similar throughout
the rest of the samples. Why swine ownership declined so
prominently in the early 1660s is not yet known, but plague
is a possibility. Close inspection of the figure reveals two
downward fluctuations in households with cattle and swine.
One fluctuation occurred in the early 1670s and the other
downturn is in the 1695-1700 period. The cause of the first
downward shift was probably a major cattle plague in 1672 -
1673 that killed many thousands of animals in Virginia and
Maryland (Craven 1949: 376). The plague prompted Governor
Calvert in 1674 to restrict shipment of "any Corne, Beefe,
Porke or other provisions whatsoever" from the colony without
special provisions whatsoever" from the colony without

G) LJn !1j ~I ,-G) ( -"j
L 'T · '-...l)
~
100 _______ __ : ------ --- ---- CA rrLf- ---- - -~--
e _' ---- --- --- -:. -- --------------;-------- -- --- -- -
-- .-- - - -- _.'" - - - - - - - - - - - -. - - _. - - - - - - - - - - - - - -- - ~- --- .- - - - - - - - - - - _ .. - - - - - - - - - - - - - - - -• I • I , ,
, '''& : : , I I I
• 1 • • • -- -:- - - - - - - - - - - - - - - - - ~ ---------------_.: . - - - - - - - - - - - - - - _.: - - - - - - - - - - _. - - . - -:-- - - - - - - - - - - - - - - - '. - - - - - - - - - - - - . - - -• I • • •
• I , • • ------ --~- ------ ----- -----: ---- ---- --------: ----- ----- ------: -------- --------~- ----- --~ ---: -----, , ,
- ---- -- - -- ---- - -- ---- - ---------- -"" ---- -------- -- ---r-- --- - ---.- - - --- ,.--- --. ---- --- --,---- -- - -. - --- --- .... • • I •
-- '---.. .. :.,. : .. .. ... , .. ... .. . ...... ... : c,,iEE? ···i·· ········j· : .. . ,- -- --------- -~ ------ -- ----- -
ia • :. • -: uu;nnuuuu I
16:30 1640 1650 1660 1r::.7(~
Time 1 .... "·'''~1 t.::oo:::,\~. l i~,Ql'jl --- ," - '
H ,-, I l" ,-, ~l '-" 1 '-'j co I I I' t ~- L I' 1 1'- ' c't '-'. ,-,.1" 1 c: -:?o 1 '(r-,lk I,) _ .21\j I U l._ .. .) (\ .,1 I .... / \j . .) .,LI\j r:.. U,_>C> - / ,,:,) ,_)
1 ~·
1. /(~)O '171 Ii ' _ i 1. \~ .!
Figure 20: Li ve stock Trends in Househ o ld Inventories , s t . Mary's City , Maryland
IV \.0 en

299
special per mi ssi on (Arch i ves of Maryland 15 : 44). Th e sharp
drop in swine population at this same time may i ndi ca te t h at
they wer e affected by the plag ue, but it could also be
attributed to the increased slaughter of pigs to replace the
missing beef. The decline in the late 1690s is explained by
the onset of extremely cold conditions during t h e winters.
During the winter of 1694 - 1695, at least 25,429 cattle and
62,373 swine died in Maryland while the toll for St. Mary's
County was 3551 Cattle and 7758 pigs (Archive s o f Maryland
20:269- 270). Despite these tremendous periods of death, the
trend of subsistence toward domestic animal reliance
continued. Domestic livestock appear to have been
sufficiently dependable that even major plagues or other
causes of de a th did not interject sufficient instability to
cause a return to usage of wild resources.
Sheep frequencies in the inventories correspond very
closely with the pattern indicated by the archaeological
evidence. Sheep were very rare during the early period.
Their numbers slowly increased until the 1680s when an abrupt
increase occured, and by the end of the century over one
third of the inventoried estates owned sheep. It should be
noted that goats were not mentioned, suggesting that most of
the animals in the Sheep/Goat category were Sheep.
The inventory data therefore correlate very well with
the archaeological evidence regarding changes in domestic
livestock. Considerable variability in livestock ownership
is found in the period between 1638 and circa 1675 but,

300
after that date a consistent pattern emerges. The apparent
rarity of cattle during the early period and the increase in
their numbers through time is confirmed by the documents.
The constancy of swine in households is also indicated by
both sets of data. Sheep display a similar pattern of
availability in both data sources, i.e. a slow increase
through time.
It is therefore possible to identify significant
changes in subsistence -- a greater emphasis upon domestic
species and a corresponding decline in the exploitation of
wild resources. Bone and meat frequencies both indicate that
two species -- cattle and swine -- completely dominated the
diet during the post-1700 period. This evidence strongly
supports the prediction that the adaptive strategy would
become more focal through time. To confirm this, however,
the evidence for one other type of change should be present
in the archaeological record - reduced seasonal variability.
A focal adaptation is based upon the intensive exploitation
of a few species throughout the year, rather than the
seasonal, scheduled exploitation of many different animals.

301
Seasonality: 1660-1740
Reduced seasonal variation is one predicted result of a
focalization of the adaptive strategy. Less overall
variation in subsistence through time is also expected,
however, because another trend of the colonization process is
increasing stability and uniformity through time.
Fortunately, it is possible to associate a reduction in
seasonality more closely with the ppearance of a focal
adaptation. While a focal adaptation can display only a
limited amount of seasonality due to the emphasis upon a few
resources, reduced seasonal variation is not necessarily
associated with increased stability. An adaptation can be
stable and yet vary during the year due to a dependence upon
reliable but seasonally available resources.
To investigate this, data derived from features are
necessary, and samples are available from a number of sites.
The earliest site in Period 2 is Drummond I, with three
features dating between ca. 1650 and 1680. Drummond's
occupation therefore overlaps slightly with Period 1 and
indications of seasonal variability might still be expected.
Seasonal indicators from the three features revealed that
each was apparently filled at a different time of the year.
Feature 265 materials were apparently deposited in the
summer. The assemblage from Feature 255 is a winter to
spring deposit and Pit 332 yielded a sample of bones that
suggest a winter fill period (species lists and other data
regarding seasonality are provided in Appendix III).
Comparison of the estimated meats from these features
30 2
(Table 22) reveals that regardless of the season, domestic
mammals predominated with meat inputs ranging from 74% in the
summer deposit to 96% of the total in the winter.
Table 22: Estimated Meat From Features At Drummond I
265 255 332 Summer Winter/Spring Winter
Animal Group Lbs. % Lbs. % Lbs. %
Dom. Mammals 1035 74.66 1035 88.31 2785 96.04 Domestic Fowl 5 0.36 5 0.42 Wild Fowl 11. 5 0.83 31 2.64 14 0.46 Turtle 1.1 0.06 Fish 133.5 9.61 Crab Wild Mammal 200 14.43 100 8.59 100 3.45
Among the domestic mammals, swine and sheep appear to have
contributed a fairly consistent proportion of meat to the
diet with a range of pork from 17% to 21% of the total, and
of sheep from 1.2% to 2.9% of the total. Beef, on the other
hand, varied from 74% in the winter deposit to 50% in the
summer assemblage. Beef was apparently more important in the
cooler months of the year, a not surprising situation since
such a large quantity of meat (about 400 Ibs.) would have
been difficult to preserve during the summer with high
temperatures and the near absence of cooling facilities. The
smaller bodied swine and sheep would have been more
appropriate for summer butchery since they could be consumed
before spoilage occurred.

30 3
Usage of wild animals also varied during the year.
Wild species contributed 24% of Feature 265's estimated meat,
mostly from deer and fish, but in Feature 332 only 3.6% of
the meat was from a wild source. The summer wild input of
nearly 25% is still substantial but less than the 36% to 65%
wild contribution seen in the summer deposits at the earlier
sites. Thus, the data suggest that seasonal variability in
the diet continued into the third quarter of the century but
that the seasonal variability was not as pronounced.
Supporting this is information from the Wills Cove site
on the lower James River. Two large features were excavated
and both date to ca. 1650-1680. Analysis of the seasonal
indicators reveals that Pit 5 was primarily a summer deposit
while Pit 6 was more likely a winter deposition (see Appendix
III) . The frequencies of estimated meat from these features
by animal group are presented in Table 23. Domestic animals
apparently contributed the majority of the meat. Deer is
second in importance while fish only make a contribution
Table 23: Estimated Meat From Features At Wills Cove
Feature 5 Feature 6 (Summer) (Winter)
Animal Group Lbs. % Lbs. %
Domestic Mammal 1120 79.69 2035 90.62 Domestic Fowl 5 .35 Wild Fowl 2 .14 Turtle 10.5 0.46 Fish 60 4.26 Crab Wild Mammal 215 15.30 200 8.91

304
in the summer deposit. The same pattern of greater wild
animal usage in the summer is evidenced here but it accounts
for only 20% of the meat, slightly less than at Drummond I.
While swine input remains the same in both features (17%),
the proportion of beef is lowest in the summer assemblage
(56%) and increases to 71% in the winter deposit, a pattern
similar to that seen at the Drummond site. Overall, the
Wills Cove data support the findings from the Drummond site
and show that seasonal variation during the 1650 to 1675
period is still identifiable although it is less pronounced
than in the earlier sites.
What form did subsistence take during the last quarter
of the 17th Century? Evidence from this period is available
from Bennett Farm II and s everal sites in St. Mary's City.
At Bennett Farm, there are four features dated to this time
Pits 6, 8, 16, and 30. Analysis of seasonal indicators
reveals that all of these pits are summer deposits since the
remains of marine fish (sheepshead, black drum, and red drum)
are present in each. Remains of migratory waterfowl,
however, were also found in Pit 6, which suggests that
some deposition occurred in the spring or fall. Meat weight
estimates are provided in Table 24. Meat input by domestic
animals in these samples varied surprisingly little.
Feature 16 is domestic animal meat input below 90%.
Only in
Fish
remains are found in all of the features, suggesting that
their exploitation continued to be an important adaptive
strategy. The relative contribution of fish ranges from 2%
to 9%, a far smaller percentage than found during the first

Table 24 : Estimated Meat Frequencies from Features at Bennett Farm II
Feature: 6 8 16 30 # % # % # % # %
Domestic : Mammal 1535 92.10 3330 90 .18 2935 84.61 2785 90.26 Fowl a . 0 12 .32 a .0 2.5 . 08
wild: Fowl 2 . 12 7.5 . 20 a . 0 a . 0 w
Turtle a .0 .25 .006 83.85 2.41 a .0 0 LTl
Fish 129 . 5 7.77 219 . 5 5.94 335 9 . 65 83 2.68 Crab a . 0 a .0 0 .0 0 .0 Mammal 0 .0 123 3 . 31 115 3.31 215 6.96
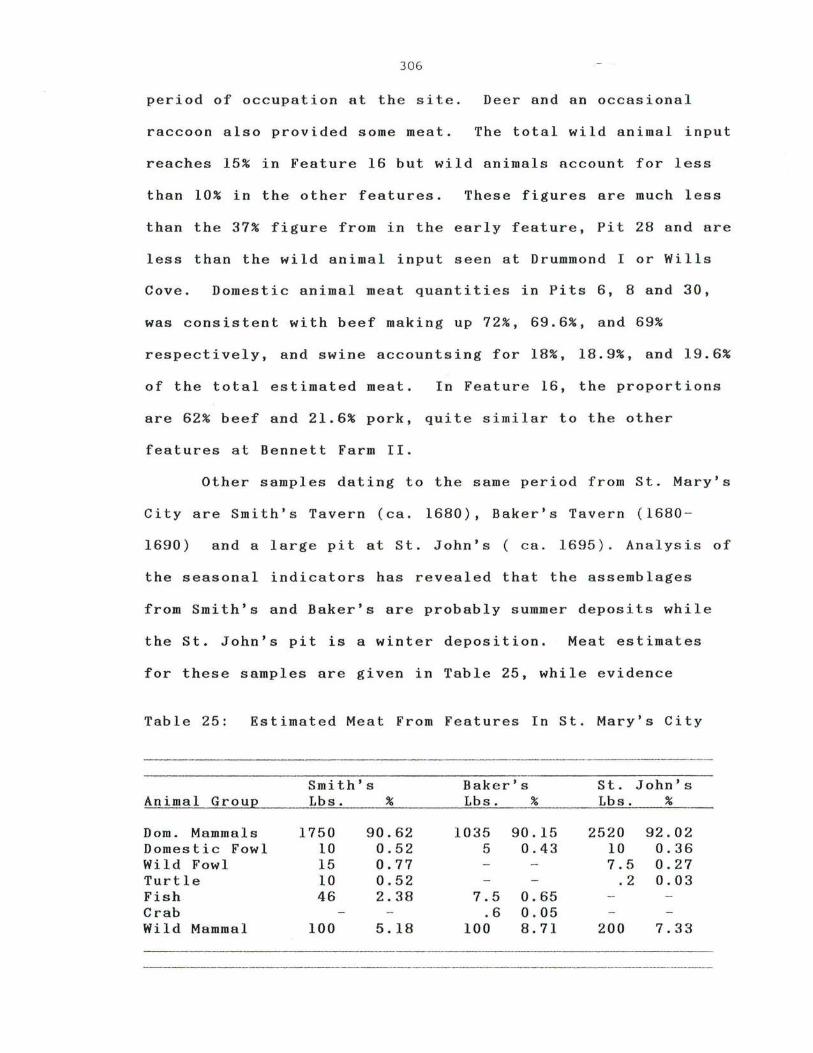
306
period of occupation at the s i te. Deer and an occasional
raccoon also provided some meat. The total wild animal input
reaches 15% in Feature 16 but wild animals Rccount for less
than 10% in the other features. These figures are much less
than the 37% figure from in the early feature, Pit 28 and are
less than the wild animal input seen at Drummond I or Wills
Cove. Domestic animal meat quantities in Pits 6, 8 and 30,
was consistent with beef making up 72%, 69.6%, and 69%
respectively, and swine accountsing for 18%, 18.9%, and 19.6%
of the total estimated meat. In Feature 16, the proportions
are 62% beef and 21.6% pork, quite similar to the other
features at Bennett Farm II.
Other samples dating to the same period from St. Mary's
City are Smith's Tavern (ca. 1680), Baker's Tavern (1680 -
1690) and a large pit at St. John's ( ca. 1695). Analysis of
the seasonal indicators has revealed that the assemblages
from Smith's and Baker's are probably summer deposits while
the St. John's pit is a winter deposition. Meat estimates
for these samples are given in Table 25, while evidence
Table 25: Estimated Meat From Features In St. Mary's City
Smith's Baker's st. John's Animal Group Lbs. % Lbs. % Lbs. %
Dom. Mammals 1750 90.62 1035 90.15 2520 92.02 Domestic Fowl 10 0.52 5 0.43 10 0.36 Wild Fowl 15 0.77 7.5 0.27 Turtle 10 0.52 .2 0 . 03 Fish 46 2.38 7.5 0.65 Crab .6 0.05 Wild Mammal 100 5.18 100 8.71 200 7.33
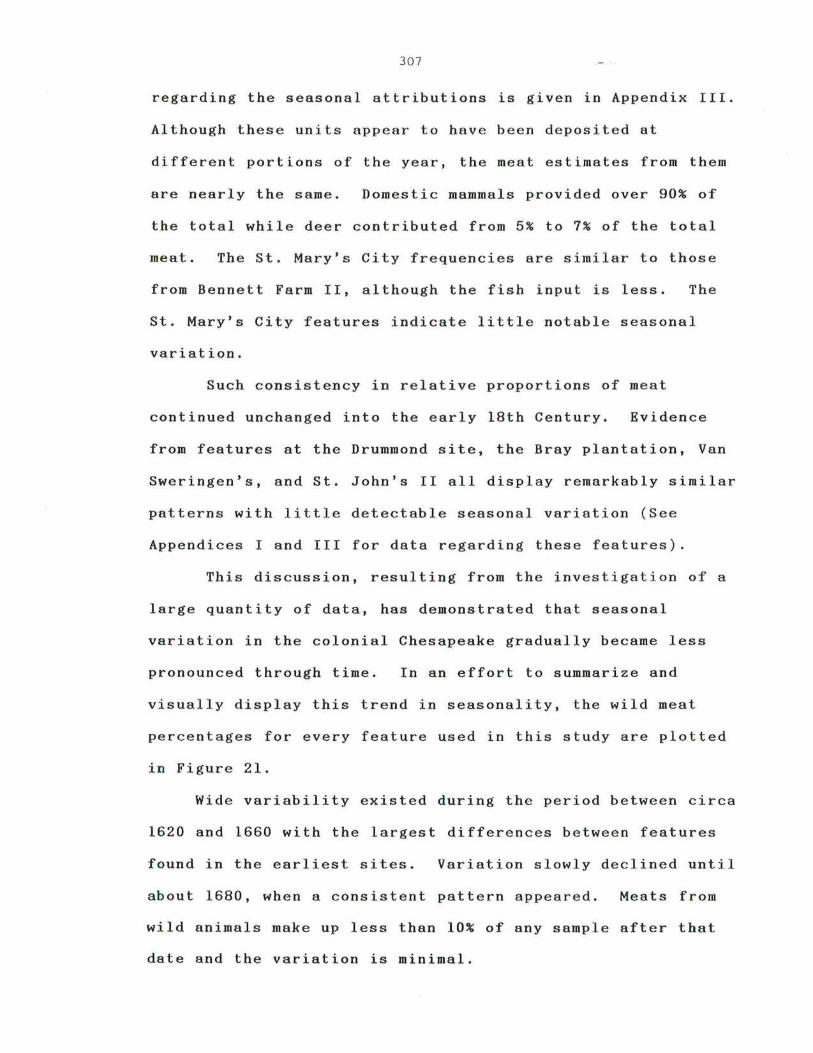
307
regarding the seasonal attributions is given in Appendix III.
Although these units appear to have been deposited at
different portions of the year, the meat estimates from them
are nearly the same. Domestic mammals provided over 90% of
the total while deer contributed from 5% to 7% of the total
meat. The St. Mary's City frequencies are similar to those
from Bennett Farm II, although the fish input is less. The
St. Mary's City features indicate little notable seasonal
variation.
Such consistency in relative proportions of meat
continued unchanged into the early 18th Century. Evidence
from features at the Drummond site, the Bray plantation, Van
Sweringen's, and St. John's II all display remarkably similar
patterns with little detectable seasonal variation (See
Appendices I and III for data regarding these features).
This discussion, resulting from the investigation of a
large quantity of data, has demonstrated that seasonal
variation in the colonial Chesapeake gradually became less
pronounced through time. In an effort to summarize and
visually display this trend in seasonality, the wild meat
percentages for every feature used in this study are plotted
in Figure 21.
Wide variability existed during the period between circa
1620 and 1660 with the largest differences between features
found in the earliest sites. Variation slowly declined until
about 1680, when a consistent pattern appeared. Meats from
wild animals make up less than 10% of any sample after that
date and the variation is minimal.

100
90
80
70
I-<l: w 60 ~
50~ II /\ w 0 0
OJ -l
3 40
~ 0 30
20
10
0 I
1620 1640 1660 1680 1700 1720 1740
Figure 21 : Percentage of Estimated Total wild Meat in Features

3 0 9
Summary
The data presented in this chapter indicate that the
adaptive strategy in the pre - 1660 Chesapeake was, as
predicted, diffuse. A wide variety of species was
incorporated into the diet and these species were used in a
scheduled, seasonal pattern. Evidence indicates that
strategies shifted dramatically during the annual subsistence
cycle from a focus upon domestic species and in some
instances deer, during the winter, to a major emphasis upon
many wild species during the summer and early fall. Most of
the early Period I sites have a high degree of species
diversity, but a few, especially Bennett Farm, have little
diversity and may have specialized upon large, bottom
dwelling fish. Domestic livestock were an important
component of the diet during all periods with cattle and
swine utilized as the major species.
less abundant in the early decades.
Cattle, however, were
During the course of the 17th Century, this diffuse
strategy gave way to a quite focal one. Three domestic
species -- cattle, swine and sheep/goat -- accounted for most
of the bones and all but a minor portion of the estimated
meat in the early 18th Century assemblages. At the same
time, seasonal variation in subsistence was reduced to a very
minor fluctuation. During the late 17th Century, alternative
strategies that had buffered the subsistence system against
failure were gradually abandoned. The abandonment of a
diffuse, seasonally varying strategy was probably due in part
to the depletion of resources. The substantial reduction in

310
use of wild resources that were not depleted, however, is
surprising. This suggests that domestic livestock
populations may have reached a threshold level over which
they became a very dependable food resource and thus,
buffering strategies were no longer necessary. The results
of archaeological and historical analysis therefore indicate
that the predictions of the colonization model did occur in
the 17th Century Chesapeake, thus constituting strong support
for the acceptance of Hypotheses 2 and 3.

CHAPTER 8
PATTERNS OF STABILITY, UNIFORMITY AND COMPLEXITY
The fourth hypothesis states that
Colonial Subsistence will display a directional change toward greater stability and complexity through time.
This hypothesis is based upon the colonization gradient
concept which suggests that a cultural system should become
increasingly complex and specialized over time. In addition,
n ••• the overall process is one of increasing
stability"(Cassagrande 1964:314) so that a more stable
adaptation should develop by the end of colonization.
Archaeologically, the development of a more stable adaptive
strategy might be indicated by the increasingly frequent
appearance of uniform subsistence patterns throughout a
region (Clarke 1968) and the endurance of this pattern over a
period of time. The following indices should be found:
1) the increasing similarity of species content on sites
through time, 2) the integration of only the dependable,
efficiently exploited wild species as subsistence staples,
and 3) the gradual addition of more complex subsistence
activities in areas such as animal husbandry, food
processing, food processing, and cooking methods.
311

31 2
Stability and Uniformity in Subsistence
The remarkable consistency in bone and meat proportions
in features after ca. 1680 has already been presented in
Chapter 7, and these data certainly suggest the appearance of
uniform subsistence patterns. Compared to the pre- 1680
features in which wide variation is found, the later features
are strikingly consistent in content over a 60 year period.
To better determine if a trend toward greater
uniformity operated, the faunal materials at the broadest
analytic level - the zoological class - can be used.
Unbiased by problems of species or genus identification,
these data can reveal to what degree the overall adaptive
strategies became similar at various sites. Therefore,
information regarding the number of bones in each class was
gathered from the sites. These frequencies were converted to
proportions and the means and standard deviations for each
period were calculated to more precisely measure the
variability. The results are presented in Table 26.
These figures reveal that the amount of variation
decreased over time. Standard deviations in all classes are
much lower in Period 3 than in Period 1. Indeed, the
frequencies of bones from the different Period 3 sites are
remarkably homogeneous, a fact which argues for the
appearance of uniform subsistence patterns. Variability in
the faunal materials identified to the genus or species level
also displays a similar trend. This variability will be
discussed in greater detail in Chapter 9, where ecological
and socio - economic factors are considered.

313
Table 26: Variability in Faunal Classes By Period
------ ------
Mammal Bird Fish Reptile
Period 1 Mean 57.15 6.79 34.91 1.12 S.D. 23.19 5.15 24.57 1. 26
Period 2 Mean 74.42 3.76 19.91 1. 88 S.D. 15.36 1. 93 14.87 2.09
Period 3 Mean 89.62 5.80 3.38 1. 16 S. D. 3.29 2.25 1. 56 . 70
Evidence for increasing uniformity might also be
found in animal husbandry practices. Such an issue can be
addressed archaeologically by studying the ages at which
livestock were slaughtered, since the age of death has
important implications regarding the manner in which animals
were utilized. The proportions of cattle killed within given
age ranges were calculated from long bones by employing a
method developed by Chaplin (1971). Remains of swine and
sheep were not consistently present in high enough
frequencies to warrant the use of this approach.
The results for the early sites of Kingsmill Tenement
and Pope's Fort are presented in Figures 22 and 23 (Data used
to construct these figures may be found in Appendix IV).
Although the samples used to calculate these figures are
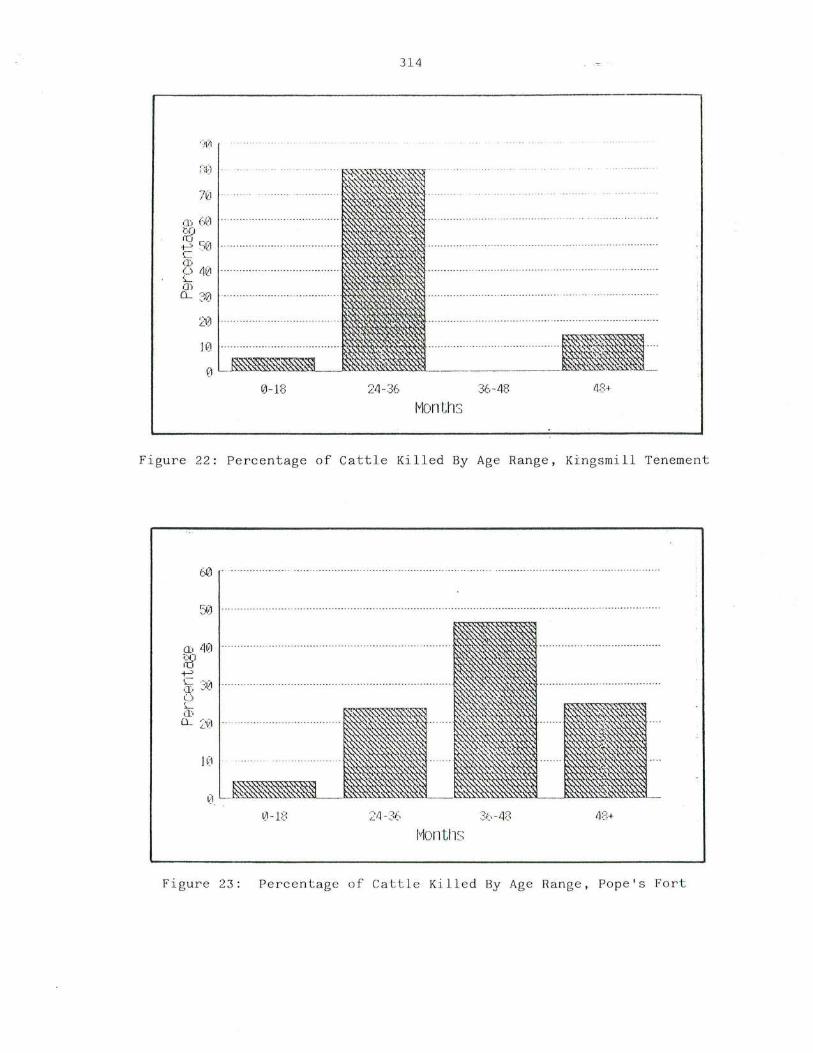
314
7~J
2.'0
l l~ I BL .. · ···=··· · · ·_· ·=·· ··· ·· ·=··· ··· ······ ···· ··~···1I .t 0L~~ 0-1S 24-36 36-48 48+
Ivlonths
Figure 22: Percentage of Cattle Killed By Ag e Rang e , Kin gsmill Tenement
60 . ....... ......... .... ..... .. ....... ... .... ............ ............ .. .. .
~i1 ... ... ..... . -_ .... .. .. ...... ......... ............................. ... .... __ .......... ...... .. -.... -....... .. ....... ....... -..... .. .... ... .
.. ... ....... ....... . ............... ...... .... .. ........... .. .. .. ........ . ~~~'\:~ ..... ....... ...... ... .. .. .... ... ...... .
10 . .. .... .... .
(~ - l t: 2.:1 -36
I'llontll s
Fi gure 23: Percentage of Catt l e Killed By Age Range, Pope ' s Fort

31 5
small, and the results must consequently be used with
caution, they suggest that most of the cattle died before
they reached 48 months of age. This pattern would be
expected if animals were slaughtered at their prime ages for
beef. In such a situation as the early Chesapeake, where
cattle were in short supply, the low frequency of older
animals should not be interpreted as the killing of male and
females before they reached old age. Instead, it is more
likely attributable to the slaughter of male animals and
barren cows for beef and the sale of most of the cows and
some bulls to freedmen or recently arrived colonists starting
their own herds. Unfortunately, the sexes of the animals in
these samples have not and, in most cases, cannot be
determined, and this hypothesis cannot be pursued further.
The differences in the peaks on these two figures may be
partially related to the small bone samples, but they do
suggest that there was variation in the age of slaughter at
different plantations.
Slightly later in date of deposition are materials from
the Drummond Phase 1 occupation (ca. 1650-1680). The cattle
age structure calculated from these bones (presented in
Figure 24) suggests that a change had occurred in husbandry
with nearly half of the sample from cattle older than 48
months at death. Evidence from the second phase of
occupation at Drummond (1680 - 1710) suggests that this trend
continued; nearly 70% of the sample is from cattle older than
48 months (Figure 25). But is this a widespread trend?

W t·n
(W'I . . . .. ..... ..... . .
5QI .... .... ... ......... ........ ... .... .............. ... .
316
!2 40 .. -...... -... . -........ ... . -... ........ ... ............ ..... . -..... -.. ,-ill 2 30 .. ..... ... ......... .. ....... .. .. . .. . .. ...... ... .... ......... .... . (I) CL
L1) .... ...... .............. .. ...... .... .. .......... .................... .
10 .... ... ... .. ..... .... ............... .
10 -18 24-36
Ivlonttls 36-48 43+
Figure 24 : Percentage of Cattle Killed By Age Range, Drummond I
80 ... .... ... ............. ........................ .. ........ ..... ..... .... ....... . .......... .. ..... .. .. ....... .. .... ........... .
70 ......... .. ... .. .......... ..... .... ... .. .......... .... ... .. ..... ............. .... ...... .................... ~m~~~
60 ..
ill t{'. 50 flJ . ~.
~ 40 P ill ~~GI CL ..
~J!l
l0 - -== - -----0-18 48+
Figure 25 : Perce n tage of Cattle Killed By Ag e Range , Drummond II
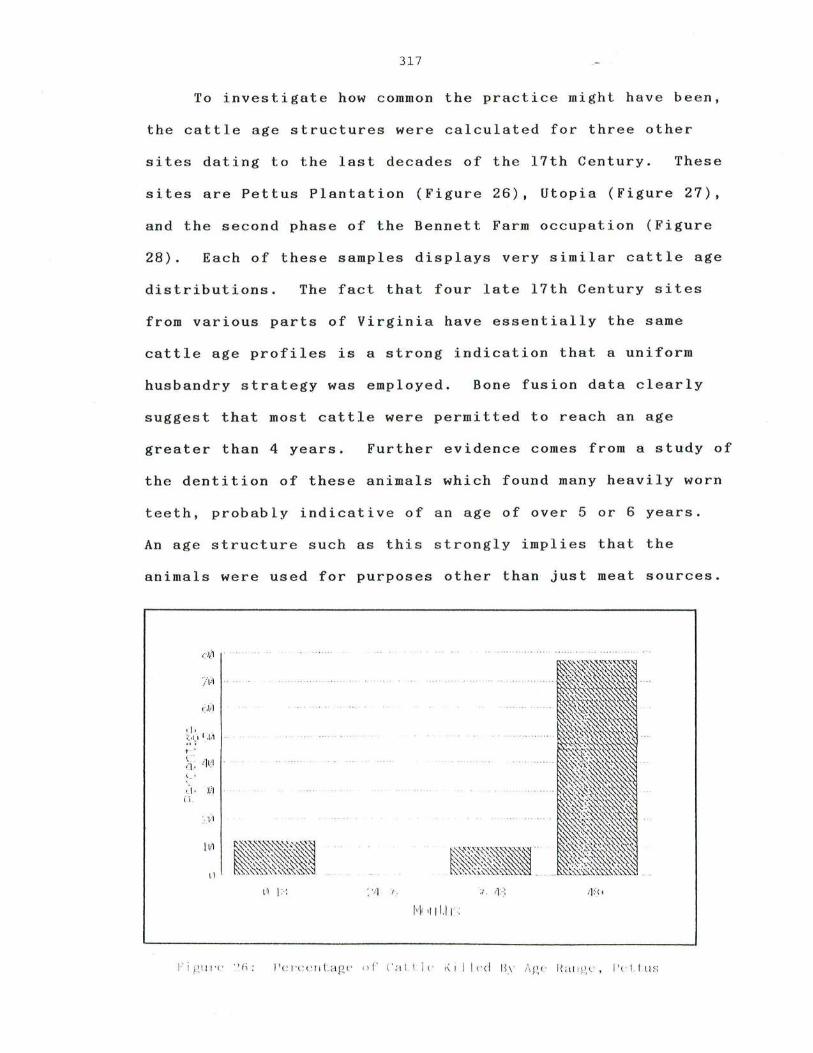
317
To investigate how common the practice might have been,
the cattle age structures were calculated for three other
sites dating to the last decades of the 17th Century. These
sites are Pettus Plantation (Figure 26), Utopia (Figure 27),
and the second phase of the Bennett Farm occupation (Figure
28) • Each of these samples displays very similar cattle age
distributions. The fact that four late 17th Century sites
from various parts of Virginia have essentially the same
cattle age profiles is a strong indication that a uniform
husbandry strategy was employed. Bone fusion data clearly
suggest that most cattle were permitted to reach an age
greater than 4 years. Further evidence comes from a study of
the dentition of these animals which found many heavily worn
teeth, probably indicative of an age of over 5 or 6 years.
An age structure such as this strongly implies that the
animals were used for purposes other than just meat sources.
1.1· I . ;:.'!jl .' l,~
1 - '
\ : ' 1t:1 ( - .
I ~1
II
: '/1 :,-,

31 8
(J) [:" ' (:·0 .)~1 ... .. ..... ... ............ .. ........ ....... .. ...... .... ....... ..... .. .. .... . ru
... ... ............. ....... ......... .. ... 1>.-":",-,-,:""",,,
~'0 .. . .......... .... ..... ..... .... . ....... ... .
10 .. .... .... .. ...... ......... ... .. .... .. ... ......... .... . ........ .. .... -0-18 24-36 36-48 48+
r~olltl-IS
Figure 27: Pe rc entage of Cattle Kill ed By Age Range , utopia
7i~ .... ... .... ........ ......................... ...... .......... .. .. ... ................. ......... ..... ..... . .
f.\ l~ . ... .. ... . . . . . .. .. .. .. . . .. -_ ...... -...... . . -.. .. ..... . . .. . .... .. .
... .... . ............. ........ .. ......... .. ...... .. .. ... ..... ..... . .......... .... ........ .. .. .... ....... ... -20 ·· .......... ........ . .... . .. .... . .... .
·~6- 48
IvlolltllS
Figure 28: Percentage of Cattle Killed By Age Ra nge, Be nnett Farm

319
Cattle bones from occupations dating after 1700 and in
samples large enough to calculate age structures are
available from St. John's II, Drummond III, Clifts III, and
Clifts IV. The results of these calculations are presented
in Figures 29, 30, 31 and 32, respectively. The St. John's
and Drummond assemblages are similar, with the largest group
in the 48+ month class. The concentration of animals in that
class, however, is not as pronounced as seen at the late 17th
Century sites. The Clifts III sample bears some relationship
to the others in that the most well represented group is also
the 48+ month class, but substantial numbers also died in
their second and third years.
The Clifts IV data are completely different from the
other assemblages. The 24-36 month class is the most well
represented. Over one - third of the slaughtered animals are
in the 48+ month class, but this proportion is much lower
than that seen at the other late sites. The Clifts livestock
during this period were apparently raised as much for beef as
for breeding or milking, and hence were used in a manner
different from that seen at the other Virginia sites. The
significance of this variation cannot be evaluated at this
time due to a lack of other 18th Century comparative data.
Only one later 18th Century assemblage is currently available
to the author. The assemblage is from the Kingsmill
Plantation site which is located less than a mile from Pettus
and Utopia . The faunal materials derive from contexts dating
to the 1760's. Cattle bones from this site indicate an age
structure nearly identical to that seen at Pettus and Utopia,
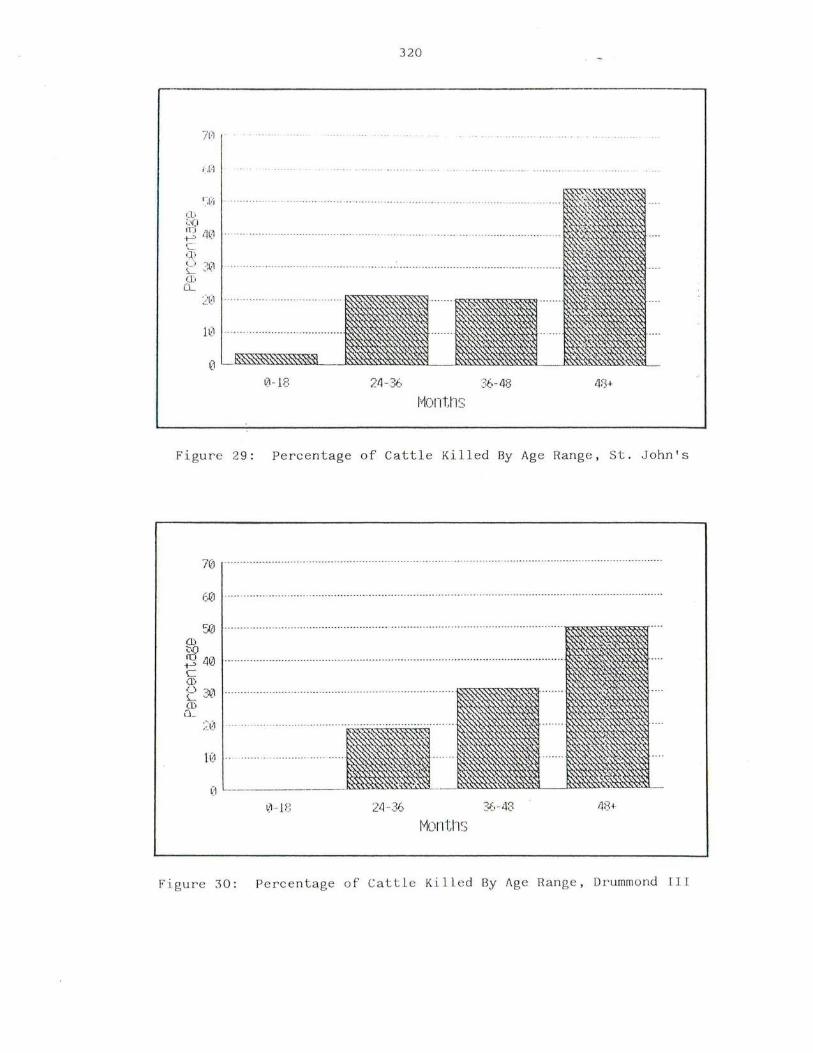
320
2(1 ....... ... ... ... ....... .... .. .. ... f'.""""""""""",""""",,,""'"
1: ··· · ···· · · ······ · · · · ·· ···~·· ·· · =I __ L_ILJ~m 1£1- 18 24-36 36- 48
Figure 29 : Percentage of Cattle Killed By Age Range, st. John ' s
7lO ........ .... ....... ..... ..... ... ................. .. ....... .. ....... .. ... .. ... ---- ...... ........... .. ............. -.... ... .... ... .... .. -_ .. .
(,~1 ..... ... .. . ... .. ........ .. .. . .. ... ........... .. ... ..... ... .............. ... ... .. .... .............. ... .... ..... .... ..... ....... .. ........ ... .
5QJ .. ....... ...... ...... ..... .. ....... ...... .... .. ..... .. .. ....... . ............... ....... ..... ........ .. ....... ~~~~""""<;'S~
J40 ......... ............................................................... ................. ... ........ ........ ~~~~~ c ( ])
t~ 30 CD Q-
:~ 11 .. ........ .. .. . . ..... ..... .
24-36 48 ~·
Figure 30: Percentage of Cattle Killed By Age Rang e , Drummond III
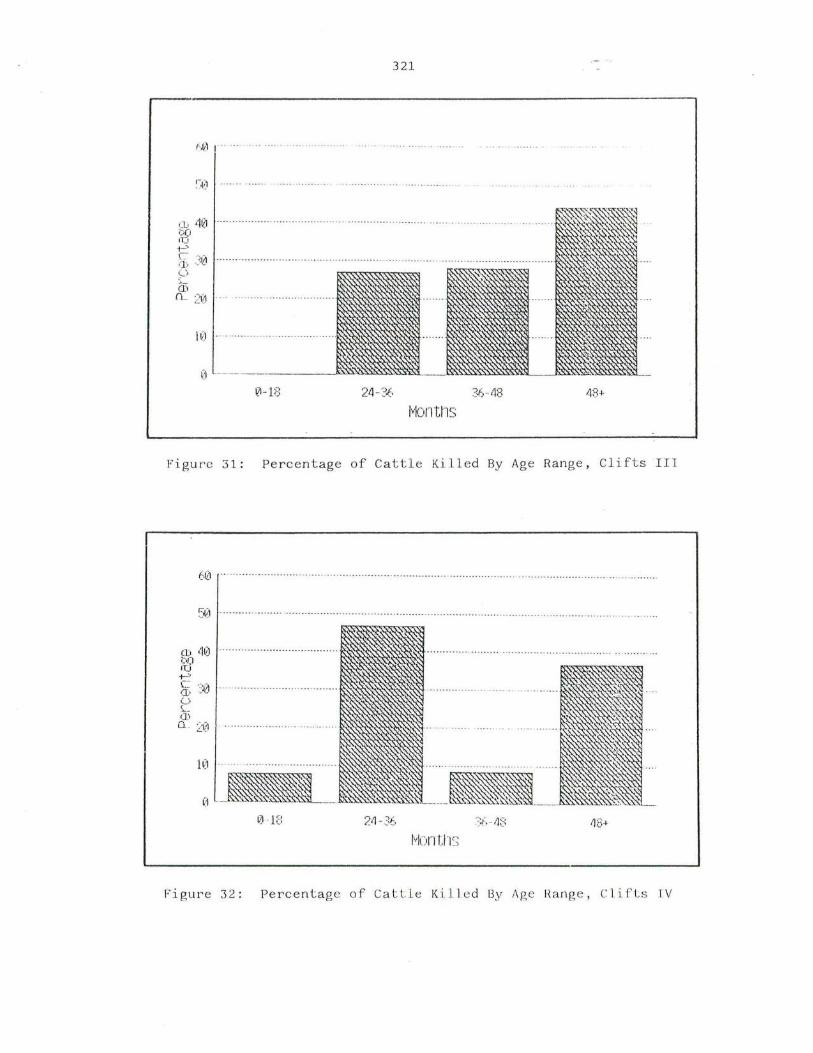
321
1~,1~1 . .•. • . . .. .
Cl, 40 i.:,O 11:1
i -"
1: 30 c'
10 ... . .... ... ... ..... .. ... .... .. .... . .
o 0-18 24-36
Honttls
Figure 31: Percentage of Cattle Killed By Age Rang e , Clifts III
6(1 .. ... ...... ............ .... .... .. ... ........ ... ...... .......... ...... ............. .............. ... .. ......... .... ..... .... .
::';, . ....... ... .. .. ... .. . .. .... . . ... .. .... .. . . ... ..... ... . ... ... . ... . . ... .... ... .. ........ . . .. .... . . . ... . ... . . . . .. . . .... . ... . .
.... ........ .. ... ... ..... ... ... .... .. . ~~~
,1 8+
lvIontll s
Figure 32 : Pe rc e ntage of Cattle Kil l ed By Age Ran ge , Clifts IV

3 22
suggesting that the pattern of cattle usage remained
consistent in that area.
With the exception of the Clifts site, archaeological
data indicate that cattle husbandry practices became
increasingly uniform during the late 17th and early 18th
centuries. Indeed, the patterns obtained from the lower
Virginia sites are remarkably similar, and the St. John's
data are generally comparable. These findings suggest that
cattle were slaughtered at relatively young ages during the
early and mid-17th Century but that this changed during the
last quarter of the century when the cattle were kept to
greater ages.
While these trends seem clear, it is difficult and
dangerous to interpret livestock husbandry practices from
small, potentially biased samples. The critic could argue
that these apparent trends and age structures have no firm
basis in fact. To explore this possibility, an independent
data source is needed; this exists in the form of household
inventories. Nearly every estate in the 17th Century
Chesapeake owned some cattle, but unfortunately the ages of
most animals were not recorded with any consistency. Cow
ages range from three to 12 years while bull ages range from
one to seven years. Only steers (castrated males) are
normally listed by age, however, since steers are the animals
most likely to be kept for meat, any change in their age
structure would probably be reflected in the archaeological
record. Cows and bulls would not be normally killed when
young, unless barren. To investigate this, all household
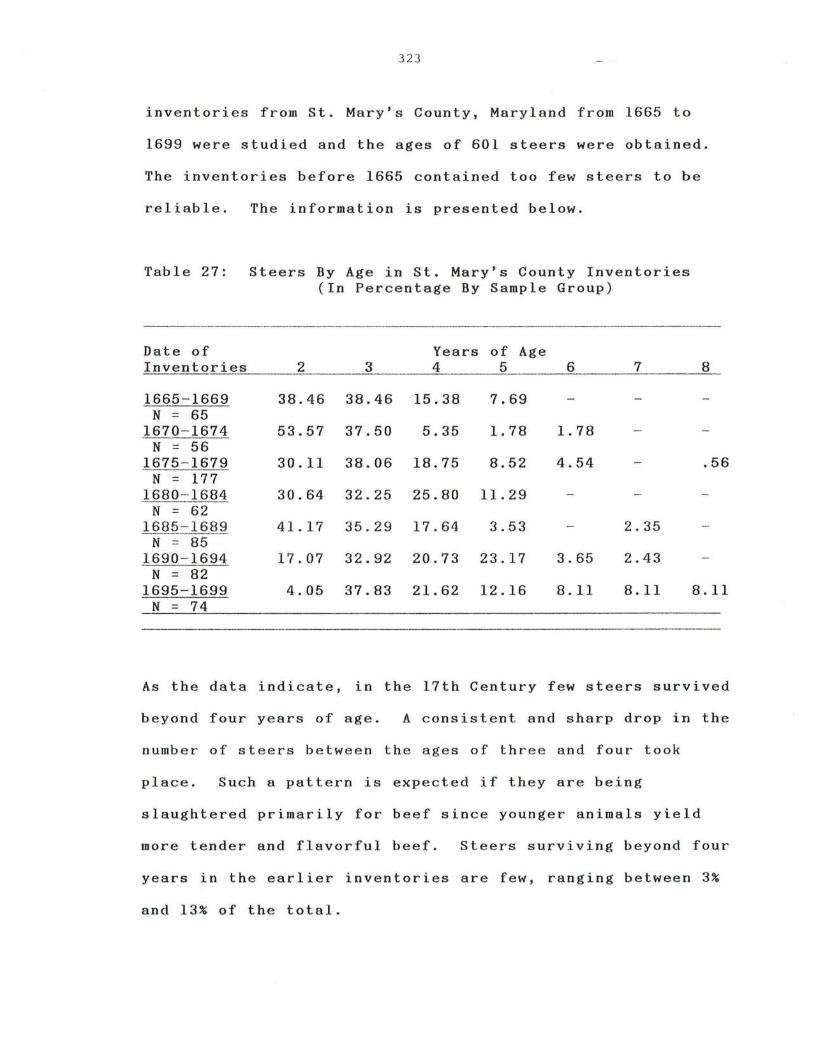
323
inventories from St. Mary's County, Maryland from 1665 to
1699 were studied and the ages of 601 steers were obtained.
The inventories before 1665 contained too few steers to be
reliable. The information is presented below.
Table 27: Steers By Age in St. Mary's County Inventories (In Percentage By Sample Group)
Date of Years of Age Inventories 2 3 4 5 6 7
1665-1669 38.46 38.46 15.38 7.69 N = 65
1670- 1674 53.57 37.50 5.35 1. 78 1. 78 N = 56
1675 - 1679 30.11 38.06 18.75 8.52 4.54 N = 177
1680 - 1684 30.64 32.25 25.80 11. 29 N = 62
1685 - 1689 41 . 17 35 . 29 17.64 3.53 2.35 N = 85
1690 - 1694 17.07 32.92 20.73 23.17 3.65 2.43 N = 82
8
.56
1695-1699 4.05 37.83 21. 62 12.16 8.11 8.11 8.11 N = 74
As the data indicate, in the 17th Century few steers survived
beyond four years of age. A consistent and sharp drop in the
number of steers between the ages of three and four took
place. Such a pattern is expected if they are being
slaughtered primarily for beef since younger animals yield
more tender and flavorful beef. Steers surviving beyond four
years in the earlier inventories are few, ranging between 3%
and 13% of the total.

32 4
A considerable change took place during the 1690s. A
drop in numbers of steers between three and four years
continued but the proportion that survived beyond four years
is striking. In the 1690-1694 sample, almost 30% of the
steers survived beyond four years, and for the period 1695-
1699, older steers comprise 36% of the total. The increase
in the proportion of older steers provides strong evidence
that the slaughter age for steers rose during the late 17th
Century and this increase agrees with the upward trend in
slaughter ages observed in the archaeological record.
Why this change occurred is more difficult to explain.
The most likely reason is that as the colonial society
matured, road systems developed, agricultural methods became
more complex and male cattle again took on the role of draft
animals as they had in Britain. This hypothesis can be
tested by calculating the frequency in which carts, plows
and harrows occur in the inventories. While horses could
also be used for draft purposes, Earle (1975:121) suggests
that steers were preferred for these tasks in the colonial
period. Certainly, the simultaneous appearance of older
steers and greater numbers of carts and plows in the 1690s
would suggest some relationship. Once again, the St. Mary's
County inventories were consulted; the results are given in
Table 28. The inventories indicate that both plows and carts
were rare during most of the 17th Century. A dramatic
change, however, took place by the early 1690s when the
proportion of households owning carts jumped to one- third and
one plantation in five owned plows or harrows.
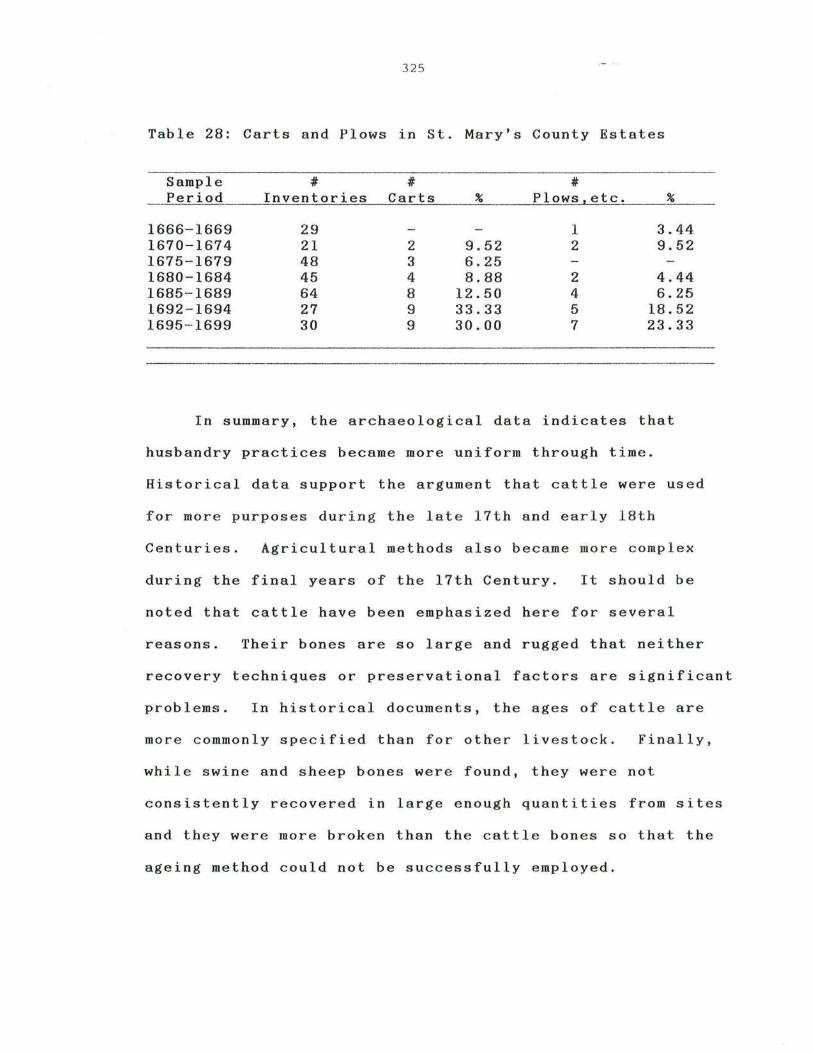
3 25
Table 28: Carts and Plows in St. Mary's County Estates
Sample # # # Period Inventories Carts % Plows,etc. %
1666-1669 29 1 3.44 1670-1674 21 2 9.52 2 9.52 1675-1679 48 3 6.25 1680-1684 45 4 8.88 2 4.44 1685- 1689 64 8 12.50 4 6.25 1692-1694 27 9 33.33 5 18.52 1695-1699 30 9 30.00 7 23.33
In summary, the archaeological data indicates that
husbandry practices became more uniform through time.
Historical data support the argument that cattle were used
for more purposes during the late 17th and early 18th
Centuries. Agricultural methods also became more complex
during the final years of the 17th Century. It should be
noted that cattle have been emphasized here for several
reasons. Their bones are so large and rugged that neither
recovery techniques or preservational factors are significant
problems. In historical documents, the ages of cattle are
more commonly specified than for other livestock. Finally,
while swine and sheep bones were found, they were not
consistently recovered in large enough quantities from sites
and they were more broken than the cattle bones so that the
ageing method could not be successfully employed.

326
Evidence of Increasing Subsistence Co~~exity
Did any changes toward greater complexity in
agricultural methods or cooking practices occur? As just
discussed, there is evidence that plow agriculture became
more common at the end of the 17th Century. Other
documentary data suggest that this movement toward more
complex agricultural methods can be associated with the
addition of wheat and other broadcast sown grains as
plantation crops (Maine 1977:142; Earle 1975:122).
A comparison of data regarding food processing and
cooking equipment in early and late 17th Century inventories
from St. Mary's County is presented below.
Table 29: Comparison of Dairy and Cooking Equipment
1638- 1665 1692-1705 (N = 47) (N = 72)
Eguipment # % # %
Dairying 14 29.78 22 30.55 Cheese Making 2 4.25 2 2.77
Boiling 47 100.00 71 98.61 Frying 30 63.82 45 62.50 Roasting 16 34.04 36 50.00
----- ---------
What is most remarkable about these figures is the almost
complete lack of change. The indicies of dairying and
cheesemaking equipment remain at a low level and boiling
remains the most common means of food preparation. The only
difference of note is that roasting equipment becomes more

32 7
common in the later period. Since roasting is the most time
consuming method of cookery, this change might be associated
with the less pronounced labor shortage. There are also more
frequent references in inventories to specialized dining
equipment such as salts and punchbowls and more specialized
ceramic forms are found in late 17th and early 18th Century
ceramic assemblages from sites.
One unexpected source of evidence regarding increasing
subsistence complexity comes from oyster shells. Through the
study of oyster shells excavated from sites, it is possible
to determine the estuarine environment from which they were
taken . Shells from low salinity environments are generally
thin, and have few indications of external organisms, such as
small burrowing sponges (Cliona sp.), having lived upon them.
Shells from high salinity waters, in contrast, tend to have
much thicker shells. One reason for this is that the oyster
can more easily absorb calcium carbonate from saltier waters.
In addition, oysters in high salinity environments tend to
develop thicker shells as a defense against the many
hostile organisms found there. These shells also display
evidence of more types of organisms that grew on them (Kent
1984).
Historical documents indicate that colonists utilized
oysters harvested in the vicinity of their plantations, and
in a study of colonial fishing, Wharton (1957:41) concluded
that "Consumption of oysters was limited to those who lived
on the spot." Among the historical references supporting
this is a comment by the Frenchman, Durand, who lodged along

32 8
the York River in 1686.
nearly every Saturday.
His host apparently ate oysters
To get them "He had only to send one
of his servants in one of the small boats & two hours after
ebb-tide, he brought it back full"(Durand 1934: 124). Study
of the abundant oysters from St. Mary's City sites also
confirms that they were obtained locally (Kent 1980; Kent and
Miller n.d.).
For colonists living along the upper portions of
rivers, where the waters are oligohaline to tidal fresh,
however, oysters were not readily available. Oysters do not
survive in waters that remain below 5 parts per thousand salt
for any extended period of time (Galtsoff 1964; Andrews
1973) . On the James River, the extreme upper boundary of
oyster distribution is just below Jamestown. Hence, the
inhabitants of the Jamestown vicinity or above had access to
only small quantities of this resource.
Oyster shells from early sites in the Jamestown area
all display the characteristics of locally obtained oysters.
One sample from the Maine site is composed of generally
small, thin shells with half of them displaying no evidence
of burrowing organisms and the others only have a few
polydora and the low salinity sponge 91iona trutti. In
addition, the shells have well defined radial ridges and some
display a purple coloration in these ridge areas. These
features indicate that the oysters were harvested in shallow
waters (Kent 1984). Thus, these shells display all of the
attributes expected of shells from the low salinity waters

3 29
near Jamestown. Growth lines suggest that they were
harvested in the fall or early winter.
Other early samples come from the Phase I features at
the Drummond site. In a well (Feature 332), a group of
shells was found that had the same characteristics as those
from the Maine. These oysters were apparently taken in the
fall and spring and thus represent a mixed group. Shells
were also found in another well (Feature 265), and most of
these were again similar to the Maine collection. Two
shells, however, were thicker and one displayed evidence of
burrowing worms, sponges, and encrusting bryozoans. These
shells were probably obtained from saline waters. Clearly,
most of the oysters came from waters within a few miles of
Jamestown. Growth line evidence is not as clear on these
shells, but most seem to have taken in the spring.
In striking contrast to these are shells from the next
occupation phase at Drummond (ca. 1680- 1710). A large number
of shells was obtained from a cellar (Feature 224) and some
of these possessed the characteristics of locally obtained
oysters. The rest, however, are large thick shells.
Many of these shells were infested with organisms
indicative of an origin in high salinity waters. Among these
are burrowing sponges, some polydora, and an unidentified
genus of burrowing clam. This variety of clam is especially
important because it leaves large, readily identified holes
in the shell and is only found in waters with a salinity of
over 15 ppt. None of these occurs in the samples from St.
Mary's City where the salinity ranges from 9 to 15 ppt over
33 0
the year. Neither are these clam marked shells recovered
from 18th Century contexts at Yorktown, Virginia, where the
sea water ranges from 14 to 20 ppt of salt. This information
suggests that these shells derive from the lower James near
its mouth or from the Chesapeake Bay proper, where salinity
levels are 16 to 22 ppt or higher. This distance is, at a
minimum, over 45 miles from the Drummond site.
As a check to see if these shells represented a rare,
perhaps unique importation of oysters, a shell sample from
the Phase III occupation at the Drummond site was studied.
These shells display the same characteristics as those in the
earlier sample. The number and unbroken condition of these
shells indicates that they are not merely a redeposition of
some Phase 2 materials. The shells are thick and heavy, and
display the same large burrowing clam holes. Identical
shells have also been found at sites on Jamestown Island.
Since these shells were found in different contexts,
separated by several decades of time and certainly deposited
by different individuals, it is improbable that they
represent a single temporal event or a practice engaged in by
only one family. The fact that the shells came from high
waters and were deposited in features on sites at and above
Jamestown suggest some type of marketing. While a servant or
slave might be sent in a small boat a few miles down river to
to collect a few bushels of oysters, as the Durand quote
indicated, getting oysters from 40 or 50 miles distance was
an entirely different matter. First, the time expenditure

33 1
would be substantial since currents and unpredictable winds
can make travel on the James River a lengthy affair; at l e ast
several days of time would be involved. Secondly, shipping
quantities of oysters would require a vessel of some size,
since oysters are a bulky and heavy commodity. A vessel of
any size would require more than one person, so that a
considerable expenditure of labor and equipment would be
needed. Only once a year did large ships enter the bay in
any frequency, when the Tobacco Fleet arrived in late
November or e ar ly December. Perhaps the crews of these ships
collected oysters as they sailed upriver to supplement their
wages. This hypothesis, however, is quickly rejected because
a study of the oyster growth lines indicates that the shells
were collected in the spring, a time when the Tobacco Flee t
ships had already departed for England.
More likely, the oysters were collected by smaller,
colony owned vessels, perhaps those which carried on a trade
with the West Indies. The existence of this oyster marketing
is completely undocumented. Only one reference, from Thomas
Glover in 1676, might be germane. Glover described the
incredible numbers of oysters around the Elizabeth and lower
James Rivers and noted that "Here are such plenty of Oysters
as they may load ships with them"(1904:6). The archaeo-
logical discovery is the earliest evidence for oyster
marketing in the Chesapeake region and was not specifically
predicted by the colonization model. However, oyster
marketing indicates that subsistence was becoming more
complex during the late 17th Century, as imports began to

332
supplement the more locally available resources.
Summary
The evidence presented in this chapter indicates that
subsistence patterns did become more uniform through time.
The small variation in bone frequencies and the strong
similarity between sites in meat estimates discussed earlier
all argue that a more uniform, and probably more stable
adaptive strategy developed in the Chesapeake. Indications
for increased complexity are also found in both the
archaeological and historical records. The addition of other
crops, especially wheat, entailed the use of different and
more complex agricultural methods. In turn, cattle were
utilized for an increasing number of purposes, as reflected
in the archaeologically- obtained husbandry data as well as
the estate inventories. Marketing of foods within the
colonies also suggests a growing level of economic and
subsistence complexity. In other aspects, however, such as
food processing and cooking, there is only slight evidence of
change. Overall, increased complexity seems to have occurred
but it was not pronounced. The continued persistence of the
one crop tobacco economy may have hindered the development of
greater complexity in subsistence. Reasonably self-
sufficient plantations remained the typical form of
settlement and there were few towns to stimulate production
of marketable foodstuffs. The available data, nevertheless,
suggests that greater uniformity, stability and complexity
occurred through time and thus, supports Hypothesis 4.
CHAPTER 9
VARIATION IN SUBSISTENCE BEHAVIOR
In this chapter, the final two hypotheses will be
addressed. The first to be considered is Hypothesis 5
which predicts that
The general pattern of subsistence change will be the same throughout the area of colonization.
Colonization is a pervasive cultural process. Every
household on the frontier participates in the process and
must cope with similar problems in occupying the new habitat.
Some variation can be expected due to ecological differences
but within a specific geographic region, the same general
trends should be expressed in all faunal assemblages.
Another potential source of variation is the cultural
heritage of the colonists, but since nearly all of the
planters in the Chesapeake came from Britain, this should not
be of importance here.
Since significant differences have been identified in
the total site samples across time, similar patterns of
change should have occurred in the sub - regions of the
Chesapeake. It is possible, however, that by combining all
the faunal samples from the same period, significant
333

33 4
differences between areas could be masked. The plot of
residuals for diversity discussed in Chapter 7 reveal e d that
Period 1 sites were the most variable, but that notable
differences also occurred in samples from Period 2. Is this
variation geographically related? Trends that are expected
to occur in all areas are: 1) the increasing importance of
domestic species through time, especially a substantial
increase in the cattle between Periods 1 and 2, 2) a
pronounced decrease in deer frequencies between the same
periods, and 3) a decline in fish frequencies across time
with a major drop in Period 3. To investigate this, the mean
frequencies of bone and estimated meat from sites along the
James and Potomac Rivers were calculated by period, and are
presented in Tables 30 and 31. Note that while the actual
bone frequencies are used here with the meat figures, the
transformed bone frequencies displayed the same patterns (See
Appendix V).
The trends indicated by both bone frequencies and meat
weights are similar. Domestic species in all but one
instance comprise more of the bone and meat in Period 3 than
in the first period. The exception is the proportion of
estimated pork in the James River sample, which was higher in
Period 1. Cattle show substantial increases between the
first and second periods in both samples and sheep increase
at a slow but constant rate in bone and meat frequencies.
Deer decline markedly between Periods 1 and 2 in both areas,
although this is more pronounced in the Potomac sample. Use

Peri od:
Cattle
Swine
Sheep/Goat
Deer
F i sh
Period :
Cattle
Swine
Sheep / Goat
Dee r
Fish
335
T ab I. (' :l () : Me <-l n 13 () II C I; 1"(.; q U l! Il l' I (; S by l; (' () g r' a p II i c ,\ r e i:l
a nd Tc mpol'al PC I' i r) ci
James Riv er Potomac Riv e r
1 2 3 1 2 3
20.79 33 . 3 5 40.1 3 19.01 29. 20 40.7 5
30.96 16.1 3 38.37 13. 27 27.10 32 . 03
0.48 3.10 6.56 0.27 3.06 5 . 67
11.03 2 .81 1.36 16.13 1.07 4 . 75
10 . 96 20.01 0.68 39.39 29.49 1. 53
Table 31: Mean Mea t Freque nci e s by Geographic Area and Temporal Period
James River Potomac River
1 2 3 1 2 3
37.10 68.67 60 . 57 49.95 62.64 63.64
37.78 19.76 26.71 16 . 95 23.93 24 . 84
1.44 2 . 00 3 . 37 0.52 1. 88 3 . 57
13.31 5.07 6.06 22 .7 5 6.64 6. 23
5.16 3 . 24 1. 63 7 . 98 3.49 0.54
336
fish also diminishes through time along the James and
Potomac Rivers, with one exception. Fish bon e in the Period
2 sample from the James River sites displays a marked
increase. Reference to the individual site data indicates
that this anomaly was produced by a huge quantity of catfish
bones found in a cellar at the Drummond site. Although these
accounted for 32% of the tot al bones from th e Drummond II
occupation and represent a minimum of 100 individuals, their
meat contribution was minimal, making up less than 2% of the
total . Comparison of the estimated mea t frequencies provided
by fish during this period with the Drummond I sample
suggests that their subsistence contribution actually
declined slightly.
These dat a indicate that the same general patterns of
change occurred at settlements on both the Potomac and James
Rivers. Differences in the scale of these changes, however,
may be related to ecological variation. While the
terrestrial environments in both areas were similar, the
aquatic environments were not. All but one of the James
River sites come from the Jamestown area where the waters are
tidal fresh to low oligohaline in nature. Spring salinities
are well below 1 ppt of salt and the salinity content seldom
rises above 3 or 4 ppt in the fall (Lippson 1973: 7). The
Potomac sites occur along waters that have a much higher salt
content with spring salinity ranging from 5 to 10 ppt and
which rise to 12 to 16 ppt in the autumn. Due to this, the
colonists along the James had available to them only the
337
s mall freshwater fish, and the anadro mous and semianadromous
species. The Potomac River inhabitants, in contrast, had
access to many marine fish, especially the large, bottom
dwelling species, in addition to the anadrornous and
semianadromous fish.
The size differences between these fish species are
substantial. The principal marin e fish taken along the
Potomac - - the sheepshead, black drum, and red drum
provided an estimated 7.5 Ibs., 25 Ibs. and 18 Ibs. per
individual. In contrast, the fish available to the Jame s
River colonists were generally smaller: the striped bass was
one of the larger varieties with an estimated meat weight of
7.5 Ibs. More common were catfish that averaged two
Ibs.each, and wh ite perch a nd whit e suckers which yielded
about one lb. each. The only really large fish available in
the Jamestown area was the sturgeon that averaged about 100
Ibs., but this animal could also be obtained in the Potomac.
Therefore, in general, the larger fish could only be obtained
in saltier waters.
Tables 30 and 31 indicate that fish bone and meat
frequencies are higher on the Potomac sites, suggesting that
the residents of the Potomac concentrated more effort on the
exploitation of fish resources than did their James River
counterparts. The data suggest that a procurement strategy
focusing upon large, and presumably dependable fish was
incorporated into the early adaptation along the Potomac.
The ease with which the large, bottom - dwelling fish could be
procured is revealed in a 1676 observation by Thomas Glover

338
r e g a rd i n g s h eeps h e ad. He wrot e that
A Plant e r do e s oft e ntimes tak e a do z en o r fourteen in an hours time with hook and line (1904:5).
Glov e r also not e d that ther e wer e a great many "Drum" t hat
we re easily obtained , at least du r ing th e warm months of the
year. Because of a high r e turn, low cost and dependab ili ty,
these species we re focused upon.
If correc t , it is expected that subsisten c e s t r a t e gi e s
at sites in the higher salinity zones, wher e these mar i n e
species were mo re abundant, would have focus e d even mor e
intensely upon them. Fortunately, one sample from this high
salinity environment, the Bennett Farm site, is available.
The site is located along waters with sprin g salin i ties of 15
or 16 ppt and autumn salini te s o f over 21 ppt, wh ich ar e
substantially higher than for any of the other sit e s in this
study. Relative frequencies of bone and meat for the Pe r iod
1 and 2 assemblages from this site are given below.
Table 32: Frequencies of Bone and Meat at Bennett Farm
--------_. Period 1 Period 2
Animal Bone% Meat% Bone% Meat%
Cattle 8.56 41.49 42.21 63 . 78 Swine 7.43 21 . 51 20.13 22.54 Sheep/Goat 2 . 84 1. 99
Deer 1. 9 4 6.14 1. 18 2.58 Fish 79.93 29.67 30.48 7.20
---.--.----~------

33 9
Bennett Fa rm d i splay s t h e same gener a l tr e nd s of c h a n ge a s
seen at the oth e r s ites with the increasing import a nc e o f
domesticated anim a ls and th e decline of both d e er and fi s h
over tim e . Fish bone and meat frequencies, how e v e r, ar e far
higher th a n f ound on comp a rabl e James or Potomac Rive r
sites. Only thre e sp e cies account for this fish i n put -
sheepshead, b l a ck d r um, and red drum. Even though t h e us age
of fish decline s i mportantly, the Period 2 contribution is
still higher than tha t f ound in the James River sampl e s f rom
Period 1 and is similar to that seen on the Period I sit es
along the Potomac. Thus, whil e Bennett Farm conforms to all
the major shifts in subsistence detected at other sites, it
displays a g r eat e r e mph a sis upon fish exploitation. Thi s
difference sug g est s that at sites located along the mor e
saline waters, the availability of extremely dependable and
cost efficient resources in the form of specific varieties of
fish permitted a more focal adaptive strategy at a tim e when
a more diffuse adaptation would otherwise be predicted.
Certainly in terms o f the MNI based niche width calculations,
Bennett Farm is more focal than any other Period I site . The
niche width calculated using meat weights also indicated that
this site had a higher evenness of resource usage than the
others. Fish apparently provided suffici e nt s e curity against
subsistence f a ilur e du e to their dependability. Other
factors such a s ec onomic status might b e involv e d in the high
frequency of fish at Bennett Farm, but th e general
asso c iation of high e r fish usag e with higher salin i ty wat e rs
3 4 0
suggests that this trend was related to Chesapeake ecology.
Overall, the data from the James and Potomac River s and
the Chesapeake Bay indicate that the same trends of chang e
occurred in each area. Variability does occur and some of it
may be related to site location and the resources available .
Although some variation remains to be explained, the
similarity of changes throughout the Chesapeak e is pronounced
and this supports the acceptance of Hypothe sis 5.
Resource Exploitation and Wealth
The preceeding discussions have addressed the trends of
change in subsistence at the regional and sub-regional
levels, and identified variability which may be related to
ecological differences. Variation between households
possibly resulted from differences in the wealth of the
occupants as well. This possibility is addressed by the
final hypothesis which pred i cts that:
Increasing differentiation in Subsistence Strategies and Diet will occur between socio / economic groups in the area of colonization over time.
The basis for this hypothesis is that opportunity declines as
a frontier is settled and the tendency is for differences
between social and/or wealth groups to become more pronounced
and fixed over time. Plentiful opportunity and a fluid
social structure during the initial decades of settlement
should be reflected in minimal differences between wealth
groups. Over time, however, the chances for upward social
and economic mobility decline and wealth/status differ e nces
tend to be accentuated (Williams 1977). Such a tendency has
341
already b ee n ident ified in hou se ho ld i nv e ntori es i n St .
Mary's County where diff erenc es in material cultur e b et wee n
wealth groups becomes increasingly apparent during the lat e
17th and early 18th Centuries (Carson and Carson 1976).
Since a central element in the definition of status is
differential access to resources (Fried 1974), and wealth and
status we re closely link ed in the colon ial Chesapeake, it is
reasonable to expect that this would be expressed in
subsistence. With an open environment during the early
phases of settlement, there should be little restriction upon
resource usage. As available land is occupied and population
grows, however, resources will tend to be less available and
differential access to them should occur. Although the
overall trend in faunal assemblages seems to have been toward
increased similarity through time, wealth related differences
may have been masked by the procedure of combining sites into
temporal or geographical groups.
Before looking at possible wealth related variation, it
is important to have som e insight into whether households
established at different times in the colonization process
undergo similar patterns of change. Sinc e each household on
a frontier is subject to similar environmental and social
conditions, it is expected that they will undergo similar
patterns of change. Sites occupied during the initial phase
of settlement should display these changes to the fullest
extent, but what about those homes established 15 or 20 years
later in the same general area? Does the same sequence of
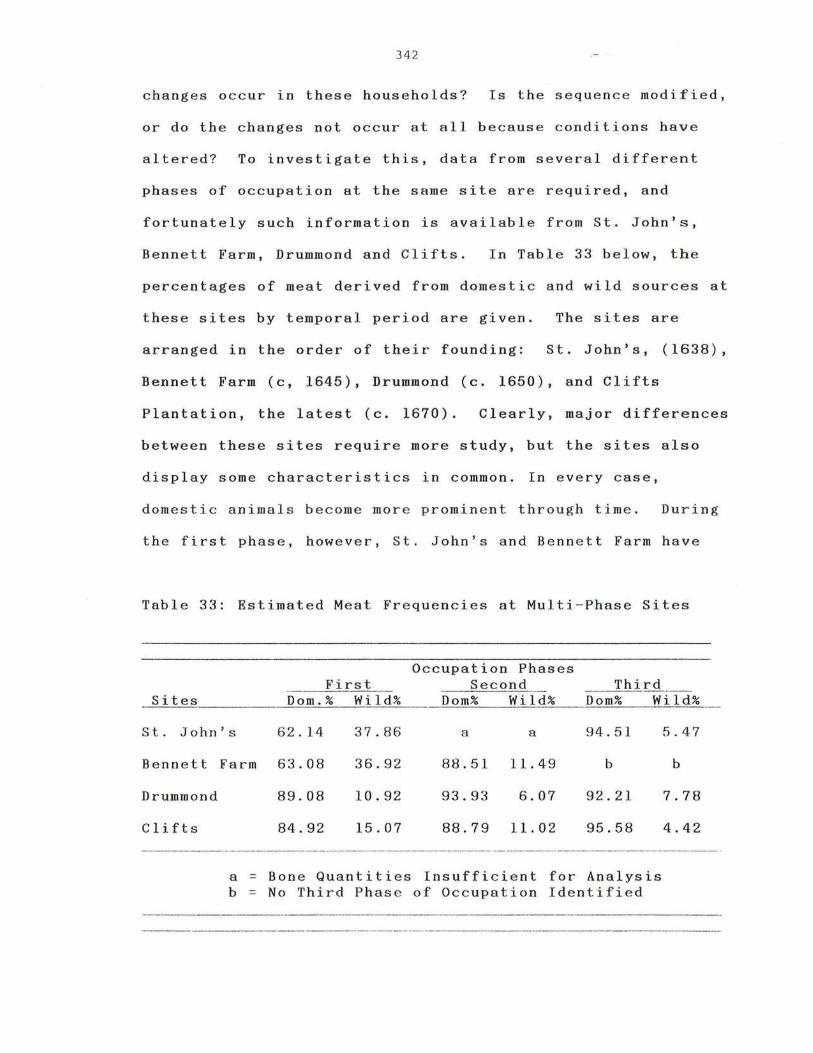
342
changes occur in these households? Is the sequence modified,
or do the changes not occur at all because conditions have
altered? To investigate this, data from several different
phases of occupation at the same site are required, and
fortunately such information is available from St. John's,
Bennett Farm, Drummond and Clifts. In Table 33 below, the
percentages of meat derived from domestic and wild sources at
these sites by temporal period are given. The sites are
arranged in the order of their founding: St. John's, (1638),
Bennett Farm (c, 1645), Drummond (c. 1650), and Clifts
Plantation, the latest (c. 1670). Clearly, major differences
between these sites require more study, but the sites also
display some characteristics in common. In every case,
domestic animals become more prominent through time. During
the first phase, however, St. John's and Bennett Farm have
Table 33: Estimated Meat Frequencies at Multi - Phase Sites
Occupation Phases First Second Third -
Sites Dom.% Wild% Dom% Wild% Dom% Wild%
St. John's 62.14 37.86 a a 94.51 5.47
Bennett
Drummond
Clifts
Farm 63.08 36.92 88.51 11.49 b
89.08 10.92 93.93 6.07 92.21
84.92 15.07 88.79 11. 02 95.58
a = Bone Quantities Insufficient for Analysis b = No Third Phase of Occupation Identified
b
7.78
4.42

343
domestic frequencies that are appreciably less than found at
Drummond or Clifts. Since both Drummond and Clifts were
settled somewhat later, these figures may reflect the
scarcity of domestic animals during the initial period OT
settlement. Meats derived from wild animals display a
pronounced decline in frequency from the first phase of
occupation at all sites. This drop is most clearly expressed
in the earlier settled sites, but even Clifts displays a
decrease in wild resource usage through time. Notably,
Drummond was occupied by an extremely wealthy family, while
the Clifts residents were tenants, and yet both households
display similar patterns of change. These differences
suggest that households founded at different times during
colonization underwent the same patterns of subsistence
change, but the magnitude of these changes decreased through
time.
To gain a better perspective on household variation
through time and by wealth group, it is necessary to look at
all of the sites, beginning with the earliest - The Maine and
Kingsmill Tenement. The Maine was occupied by tenants of the
Virginia Company and that Kingsmill Tenement was also
occupied by individuals who did not own the land. Artifacts
suggest that neither group was exceedingly poor, and their
wealth levels can be best described as low to middle. In the
absence of historical data, a more precise estimate is not
possible.
Cattle occur in quite different frequencies at these

344
sites, making up 11% of the total at the Maine but 30% at
Kingsmill Tenement. In terms of meat, beef accounts for
25.95% at the Maine, and it is from a single animal. This
beef frequency is the lowest for any site in the entire
sample. In contrast, beef represents 48% of the meat at
Kingsmill Tenement. This substantial difference may be
explained by the difference in the dates of initial site
occupation.
Cattle multiplied slowly during the early decades of
settlement in Virginia and it took time to develop large
herds. Virginia Company tenants probably had only limited
access to what beef was slaughtered. The scarcity of cattle
was made even worse by the 111622 Massacrellin which the
Indians not only killed many colonists but a large number o f
their livestock. The low frequency of beef at the Maine,
whose occupation spans the massacre time, may be partially
related to this event and the consequent shortage of cattle.
If this is correct, however, it seems that recovery was
rapid, for cattle contributed an important portion of the
meat at Kingsmill Tenement.
Swine, in contrast, accounted for a larg e numb er o f t h e
bones and a large amount of meat at both sites. At the
Maine, pork was more important than beef, making up 38.93% of
the total estimated meat. Pork was not as prominent as beef
at Kingsmill Tenement but it still contributed 36.64% of the
meat.
pork.
These figures clearly indicate a heavy dependence upon
Indeed, they are the highest frequencies obtained from
any sites in the sample. Why such an emphasis upon pork at

345
these early sites?
The answer again appears to relate to the reproductive
capabilities of the animal. On a new frontier, livestock are
available in an inverse proportion to their size. Cattle
were more expensive than swine, harder to obtain and more
difficult to transport. Cattle also reproduced more slowly
than swine (Stone 1982:30). Swine are much more prolific
than cattle, often having two litters a year with five or six
pigs in each. In addition, pigs were splendid foragers in
the forests and swamps of the Chesapeake region. Swine would
have been more abundant and more quickly ready for slaughter
due to a faster growth rate. Hence, swine would be the
animal of choice for a newly established or poor household.
A period of years would be required for a cattle herd to
increase and the new animals to reach butchering size, but
after that, the slaughter of steers and older cows would have
been feasible. From the inventories of freedmen who had not
yet established plantations of their own, it is obvious that
acquisition of livestock and the development of a herd were
essential preliminary steps for starting a household; such
herd development often began well before a plantation was
purchased.
Wild animals at The Maine and Kingsmill Tenement are
well represented with nearly half of the bones at The Maine
and 40% of those at Kingsmill Tenement from wild species. In
terms of estimated meat, wild animals contributed 32.69% and
14.35%, respectively. The significance of wild game at

346
Kingsmill Tenement is lower, principally because cattle were
of much greater importance at this site.
If this pattern of domestic animal use is typical of
newly established households, it should be found at other
sites in the Chesapeake region. To explore this possibility,
the frequencies of bones and estimated meats in assemblages
known to represent the first decades of a household's
existence were collected and compared to The Maine and
Kingsmill Tenement sites in Table 34. For cattle, there is
considerable variation in the bone and meat frequencies.
None of the other beef frequencies is as low as seen at The
Maine, perhaps supporting the massacre-related hypothesis.
Drummond I has an unusually high beef frequency, but the
remaining sites are quit e consist e nt with a range of less
than ten percent between them. With swine, however, there
Table 34: Bone and Meat Frequencies from the First Phase Of Occupation at Sites
Cattle Swine Total Wild Bone% Meat% Bone% Meat% Bone% Meat%
The Maine 11.22 25.95 34.69 38.93 49.50 32.69 Kingsmill 30.36 48.26 27.23 36.64 40.56 14.35
St. John's I 15.55 42.55 13.20 17.91 69.74 37.86 Pope's Fort 17.01 49.36 8.83 11.22 70.27 38.96 Bennett FarmI 8.56 41.49 7.43 21.51 83.85 36.93 Drummond I 38.32 67.73 21.30 19.14 34.42 10.92 Clifts I 10.26 48.35 29.59 36.26 58.70 15.09

347
is a striking division between the sites. Swine bone and
meat frequencies are high at two early and one later
occupation. Clifts is the only later sample in which pork
frequencies equal those found at The Maine and Kingsmill
Tenement. All of the sites yielded substantial quantities of
wild animal bones. Meat frequencies, however, vary widely
from 10% to nearly 39% of the estimated total. Each of these
assemblages differs from the Maine and Kingsmill Tenement
sites, with the notable exception of Clifts. Clifts
surprisingly yielded frequencies of beef, pork, and total
wild game that are virtually identical to Kingsmill Tenement.
How are these differences between households to be
explained? One clue comes from comparing the Clifts and
Kingsmill Tenement sites. In spite of the fact that nearly
50 years separate the founding dates of these two sites,
they have nearly identical beef, pork, and wild meat
frequencies. Both sites were established in localities with
little previous occupation and, importantly, both were
inhabited by tenants. All other sites in the above sample,
except the Maine, were occupied by the owners, and, with the
exception of Bennett Farm, these plantation owners were also
members of the colonial elite.
St. John's was built by John Lewger, the Secretary of
the Maryland colony, and the site later served as the
residence of a wealthy Dutch merchant. Maryland's first
governors lived within Pope's Fort, and Drummond was occupied
by one of the wealthiest men in Virginia, who later served as
the governor of North Carolina. Only the Bennett Farm

348
residents were planters of modest means. Bennett Farm has
the lowest beef frequency of the four, although marginally
so, and a high wild meat imput, primarily from fish. As
previously noted, however, the difference in its ecological
setting from the other sites may warrant caution in comparing
Bennett Farm with them.
The fact that Kingsmill Tenement and Clifts are
identical in not just one, but three frequencies is
unexpected. Since these sites were founded decades apart,
similar forces and constraints appear to have been operating
upon subsistence. This similarity implies that the phase of
household development may be an important variable
influencing subsistence behavior, at least for households
that are not extremely wealthy. The emphasis upon swine is
reasonable given the reproductive and growth capabilities of
that animal. Surprisingly, however, wild resource usage at
Kingsmill Tenement and Clifts is lower than seen at the other
newly founded sites.
The highest wild inputs are found at Pope's Fort and
st. John's. Beef is also quite significant at both of these
sites, but pork, in contrast, accounts for less of the
estimated meat than seen at any other site in the entire
sample. Inspection of the faunal tables (Appendix I)
indicates that venison makes up the major portion of the wild
meats estimated for both sites . Deer contributed 31% of the
total meat at St. John's and 22% at Pope's Fort, the largest
of any of the sites. Why are these proportions so high?
349
Investigation of the historical documents from the
early 17th Century provides a likely answer. In Maryland
during January of 1643, a license was granted " ... to an
Indian called Peter to carry a gonne for vse of John Lewger"
(Archives of Maryland 3: 143). A professional hunter was
thus employed at the St.John's site and research by Stone
(1982) suggests that Governor Calvert probably also employed
a hunter. Many of the wealthier households apparently hired
Indians and provided them with "gonne, powder and shott" to
hunt deer. Evidence indicates that this practice, which
required a license from the Governor, became widespread and
resulted in so large a number of Indians possessing firearms
that fears were raised. Consequently, Governor Stone in 1650
banned the practice in Maryland (Archives of Maryland 3:
260) .
A high percentage of deer meat was also evidenced at
the Maine site in Virginia. The suggestion has been made
that before the Massacre of 1622, deer were probably obtained
as much through trade with the Indians as by actual hunting
(Lorena Walsh: Personal Communication, 1983), and this may
account for the high frequency of deer at The Maine.
Distrust of the Indians after the 1622 Massacre almost
certainly ended this practice. The wealthy continued
exploiting deer by employing experienced Englishmen, known as
"Woodsmen", to hunt for them.
from Norfolk County, Virginia.
One revealing document comes
In August of 1640, an
agreement was made for a wealthy planter to hire a
professional hunter named William Burrougs who would kill:
350
... so many deer as there are weeks between this present date and Christmas, killing every week one deer and one turkey. .. (Norfo lk Coun t y Records 1640: 136).
In return, the hunter was to receive food, drink, lodging,
powder, and shot. This suggests that hiring a hunter was
was a common practice in the more wealthy households.
For those who could afford the labor and/or other
expenditures, deer could be focused upon as a major
subsistence resource. An important but previously
unrecognized factor of wild animal usage in the Chesapeake is
thus indicated. The high frequency of deer remains at St.
John's and Pope's Fort suggests that this resource may have
constituted an important buffering strategy against
subsistence failure in the poorly known environment. As the
deer were more heavily exploited, however, their populations
would have been depleted in a given area. Continued usage of
this resource would have necessitated more time for hunting
and travel, as well as increasing problems of transportation
as the deer were killed at greater distances from the
plantation. The lack of evidence for any such deer emphasis
at later sites may indicate that continued reliance upon such
a strategy was too costly.
For households with limited labor, such as tenants or
small scale planters, this time consuming and somewhat
unpredictable practice may not have been feasible. Instead,
the persistent but low frequencies of deer and small mammals
on most Period 1 and Period 2 sites may indicate a more

351
casual taking of these animals rather than active hunting.
In the 17th Century as today, deer, raccoons, squirrels and
opossums enter corn and bean fields to eat the crops.
Indeed, deer foraging has been found to be especially heavy
on small fields surrounded by woods (Flyger and Thoerig
1962:51), precisely the situation produced by 17th Century
agrarian practices. These animals could have been taken as
they came to the fields to feed, rather than being
purposefully hunted. Such a practice is similar to what has
been called "Garden Hunting" in South America (Linares 1976),
where gardens and fields serve to concentrate artificially
the densities of various species by attracting them to feed
on the crops. This presumably unintentional effect of 17th-
Century agriculture would have acted to bring a variety of
game to the planter and hence reduce the time needed for
hunting.
Faunal materials indicate that the tenants at Kingsmill
Tenement and Clifts occasionally took game but apparently the
occupants of neither site concentrated upon deer. The Clifts
planters took the easily caught sheepshead while the
inhabitants of Kingsmill Ten e ment exploited a wid e variety of
game but did not concentrate upon any single group of
animals. For tenant planters, swine probably provided the
most dependable meat supply since pigs required little care,
bred rapidly and, with occassional feeding of household
waste, could be kept near the plantation. Through time,
however, as evidenced by the Clifts III sample, livestock
herds developed and beef occupied a more prominent position

352
in subsistence. Swine continued to be important but their
contribution was less than found during the initial phase of
settlement.
Drummond I is the one site that does not fit the above
explanations. Drummond I displays a higher beef proportion
and less wild game than any of the other newly founded
households. Beef accounts for 67.73% of the estimated meat
and pork is 19%, but all wild resources make up only 10.92%.
Domestic usage increases in the next phase and wild usage
declines, and hence the broad subsistence trends are still
apparent. Nevertheless, the difference between this sample
and the other first phase assemblages is substantial. One
essential factor is that when the Drummond plantation was
established in the early 1650s, the area had already been
occupied by colonists for over 40 years and nearby Jamestown
had the highest population density of any location in
Virginia. Wild game, especially deer, were probably more
depleted in that area than anywhere else in the colony. Many
wild species are present in the faunal assemblage but most
are migratory fowl and fish that are not as susceptible to
depletion.
Another significant factor, which may help explain this
assemblage is that William Drummond lived in Virginia for a
number of years before constructing a plantation at the site.
With his wealth, he probably acquired cattle soon after his
arrival and may have had well established herds before moving
to the site. Hence, the early reliance upon swine may have
been either unnecessary because of his wealth or may have

353
occurred at a previously occupied site. By the 1650s and
1660s, sizeable cattle herds were abundant in Virginia.
The above discussion indicates that there is a wide
range of variation among the early faunal assemblages,
although all display the same general trends of subsistence
change. Tenants during the first phases of settlement seem
to have consumed larger quantities of pork than land owners,
along with a substantial quantity of beef, but a relatively
small amount of wild meats. Very wealthy households in
Maryland and Virginia seem to have emphasized cattle and deer
over pork. At Bennett Farm, a "middling planter" site,
domestic animal usage was comparable to that at the wealthy
Maryland sites but the exploitation of easily-obtained fish
resources was emphasized rather than deer. Does this
variation persist and become more pronounced through time as
predicted by the hypothesis?
Several sites from Period 2 are available to elucidate
this. The most wealthy sample from this period is Drummond
II, which was still a major plantation occupied by the
Drummond family. At the other end of the wealth scale are
the Bennett Farm and Wills Cove sites, both of which were
apparently occupied by people of low to middling wealth. In
addition, there are two assemblages from St. Mary's City,
Smith's Ordinary and John Baker's Ordinary. The same
variables used in discussing the early sites are again
employed here, with the data provided in Table 35. Some
variability is evident between these sites, especially in

354
bone frequencies. If the Drummond II sample is removed,
however, there is greater consistency. The bone proportions
from Drummond are so distinctly different because of the
large number of catfish bones found there, a situation
previously discussed. In terms of meat, however, the sites
display relatively little variation. Ranges between these
samples in cattle, swine and wild meats are 9%, 5% and 5%
Table 35. Cattle, Swine, and Wild Animal Frequencies in Period 2 Assemblages
Cattle Swine Total Wild Sites Bone% Meat% Bone% Meat% Bone% Meat%
Drummond II 22.45 72.16 11. 44 19.36 57.42 6.08 Benn. Farm II 42.21 63.78 20.13 22.54 33.58 11.51 Wills Cove 39.28 66.14 15.66 20.78 37.84 11.00 Smith's 32.45 69.91 27.15 18. 12 26.80 8.85 Baker's 44.91 69.68 24.57 17.42 21.19 9.41
respectively. Considering the degree of sample size
variation, there is a remarkable regularity between the
sites. Wild resources may have been somewhat more important
at the middling wealth sites of Bennett Farm and Wills Cove.
The lower percentage of wild meat at Drummond might also be
related to resource depletion in the Jamestown area, but
additional samples are necessary before this suggestion can
be tested.
The archaeological samples from the two ordinaries in
St. Mary's City are similar to the faunal remains from the
other sites. This similarity indicates that subsistence

3 5 5
patterns at ordinaries did not differ appreciably from
private homes, suggesting that the identification of a 17th
Century ordinary on the basis of faunal materials will be
very difficult if not impossible.
Data presented thus far suggest that socio-economic
related differences in faunal remains between sites were not
substantial. It is significant, however, that none of the
later sites discussed above was a plantation occupied by
tenants, and it was the tenant sites that displayed the
greatest differences in Period 1. Fortunately, data from two
quite comparable sites are available and can be used to
investigate tenant versus major planter subsistence in the
late 17th Century. The two comparable sites are the Pettus
Plantation and Utopia. Pettus is located just downriver from
Jamestown and was the home of a very wealthy planter and his
family. Utopia stood half a mile away on land owned by
Pettus. Agreement has been reached that a tenant occupied
the Utopia site (Carson 1981). The differences between these
two sites in architecture and ceramics are substantial. The
main structure complex at Pettus was large with the ground
floor covering some 2500 square feet of space (Kelso 1974),
while the single structure at Utopia was much smaller,
covering only 550 square feet. In ceramics, large quantities
of high quality imported wares in specialized forms were
recovered from the Pettus site, but fewer vessels were found
at Utopia. Utopia lacked specialized vessel forms and a
substantial portion of the pottery was locally manufactured.
Thus, there seems little doubt that the Utopia occupants were

356
poorer than the residents of Pettus.
Due to possible data recovery problem for small bones
at these two sites, they have not been compared with the
others. Since the excavation methods at each were similar,
however, the data from them, especially the remains of large
mammals, can be compared. Artifacts indicate that the
faunal assemblages from both sites date primarily to the last
quarter of the 17th Century.
Species found at these sites are similar, with cattle,
swine, sheep / goat, chicken, turkey, deer, raccoon, opossum,
and cooter turtle identified at both (See Appendix I for
species lists, bone counts and other data). More varieties
of fish were found at Utopia, suggesting that this resource
may have been more important there. In Figure 33, the
frequency of cattle, swine, sheep / goat and total wild animal
b o ne fr o m each site is graphically presented, and only minor
differences are apparent. Swine remains are somewhat more
abundant at Pettus but the difference is small.
Proceeding to a higher analytic level, the minimum
numbers of individuals were calculated and converted to
estimated meat frequencies. The meat frequencies from the
two sites are compared in Figure 34. Once again, the sites
are quite similar, but with even less variation than in the
bone counts. Beef comprised most of the meat at both sites
and pork accounted for a quarter of the total but sheep/goat
made only a small contribution. Wild meats make up 4.7% of
the estimated total at Pettus and 6.2% at Utopia. These

357
Figur-e :n : Compar i son of Bon e Pr- eq u e n c 'i es Fr'orn Pelt'.u s and lJtopi.a

35 8
percentages are s urprisin gly close to the 6.08% wild
c ontribution found at the nearby Drumm o nd site .
The similarity b etween these sites in bon e and meat
frequencies is notabl e and unexpected. The possibility
remains, however, tha t there were significant differences in
t h e quality of the meats cons umed. Perhaps t h e Utopia
resi dents ate the poor er cuts and sol d th e higher quality
portions in nearby Jam estown. To determin e whether there
wer e any notable differen ces, the bones of c attl e and swin e
were divided in to three categories:
1) skull and n eck elements;
2) meat - rich bon es from the main body ; and
3) lower leg and hoof elements.
This division allows a rough comparison of the high quality
versus low quality cuts present.
presented in Figures 35 and 36.
The results for cattle are
Clearly, high quality
elements make up the majority of the bones at both sites with
little difference between them. A higher proportion of hoof
elements was present at Utopia, but the proportions of
skull/neck bones were identical. Incidentally, th e cattle
age structures at these sites were also nearly identical,
suggesting similar husbandry practices (see Chapter 8).
Swine bones (Figures 37 and 38) also provide evidence of the
two sites" similarity. In terms of the mea t - ri c h hon es from
the body, there is only a 6% differenc e b e tween the two.

(-.[J --
Skull
359
Body
PGttus Plantati on Hoof
Figu re 35 : Cattle Bones By Body Section : Pet tus Plantation
r~. l~1 - - - ------ .--- --.
5\:1 .- ... ... - .... ... -... -.. .. "--' .... -.. .... - .. -.. .. - .. . .. .. -... .. - -- . -- - -.. -.. .... ... - . - ..
SI:ull
Utop l Ci
FL gure 36 : Ca ttLe Bones By f30dy ::,ection : Utor i Cl
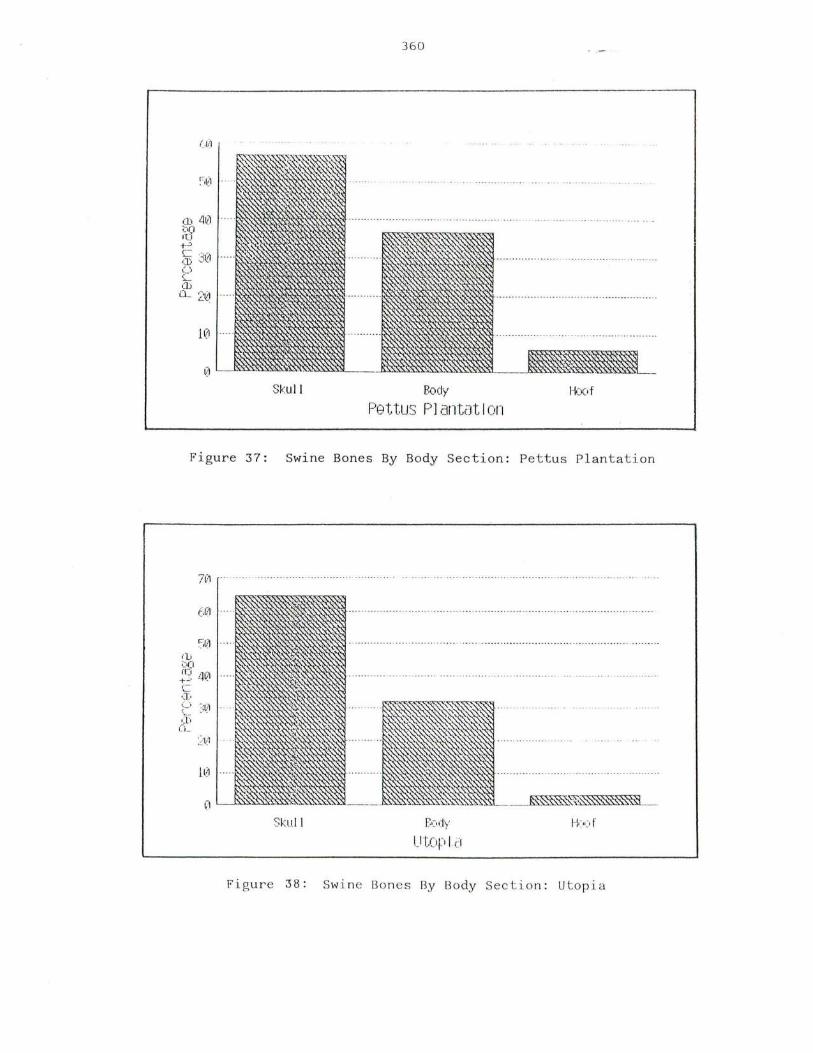
360
.~~~--- -- ---- - -- --- -- -- - - ----- ----- - - - - ----- - -- - - --- -.-. --- ... . -.. _-
~~~.-- - ----- - - - - - - . - .... -.. -.. ... .. ... ... . -
.~~~----- - --- .. .. - --- ... ------ .- .- .... -...... .... .... -.
ll?)I~=~=m .......... .. .. .. ....... . oLm
S~: ul l 80(1" HoM F'ettus F'] antat I on
Figure 37: Swine Bone s By Body Sect ion: Pe ttu s Plantation
7 (,1 .. - . .. .. .. ... .... .. .... ....... . -... .. . . -.- .... -... --.. - .--. --- -..• ... . ..... .... ... .. .. ... .... .... .. ... ...... . .. -... ... -..
S ~: Lll I 8e,dy
Ll to j) l.iJ
Figure 3 8 : Swin e 80 nes By Body Section: u to p ia

361
Pettus and Utopia share a remarkable degree of similarity in
meat consumption patterns that is surprising, giv e n the
prominent differences between them in architecture and
ceramics. This finding suggests that reduced, instead OT
increasing, differentiation between the meat diets of wealthy
and poorer planters occurred during the late 1600s. To
further clarify this, data from Period 3 must be addressed.
From the post-1700 period, samples are available from
two tenant households (Clifts III and IV, and Drummond III),
a middling planter's house (St. John's II), a prosperous inn-
keeper's home (Van Sweringen's), and a major James River
plantation (Bray). The bone and meat frequencies of cattle,
swine and total wild animals from these sites are presented
in Table 36, which shows only a small degree of variation
among them. Although bone frequencies show greater
variation, the proportions of estimated meat display a high
degree of similarity. Cattle meat estimates vary by only
Table 36: Period 3 Bones and Meat Frequencies of Cattle, Swine, and Combined Wild Animals
----- -~---------
---Cattle Swine Wild
Bone% Meat% Bone% Meat% Bone% Meat%
Clifts III 37.67 59.95 40.18 24.98 12.14 11 . 18 Clifts IV 47.78 67.99 38.63 26.06 9.66 4.18 Drummond III 39.64 60.99 39.25 28.89 13.63 7.80 St. John's 39.10 65.81 26.26 25.53 22.33 5.48 Van Sweringen 38.46 60.83 23.07 22.81 8.64 8 . 9:~ Bray 40.62 60.15 37.50 24.51 7.41 9.76
----- --------_ .. _------._---------- ----

36 2
8%, swine by 6%, and wild animal by 7%. Differences between
a major planter and a tenant in these samples are minimal,
and hence the Period 3 data support the findings from Pettus
and Utopia.
All investigated site data from the late 17th and early
18th centuries indicate that differences in subsistence
between households were minor. Overall utilization of
domestic and natural resources appears to have been nearly
the same at middling and wealthy plantations, as well as in
ordinaries. Independent planters, regardless of their wealth
level, seem to have had sufficient resources to maintain
comparable meat diets.
Nevertheless, important documented differences in
status existed between individuals within the colonial
society, and it seems improbable that these would not be at
least suggested by archaeological findings. Review of the
historical record indicates that the most clearly demarcated
status distinctions were between masters and their servants
and/or slaves. For much of the 17th Century, these
differences were not expressed in a rigid manner. The
boundary between servants and mast e rs was real, but not
always emphasized, partially because they often carne from the
same social background, and on smaller plantations, they
worked side by side in the fields and lived in the same
house. Additionally, servants could expect one day to be
planters themselves, and the masters could later anticipate
dealing with their freed servants as peers. Toward the end

363
of the 17th Century, however, the social distanc e b e tw ee n
mast e r and serv a nt increas e d. This sh i ft was partially d u e
to a change in the character of the servants. The more
recent immigrants tend e d to be from poor, rather than
middling backgrounds and included convicts and the Irish. By
the 1690s, African slaves were also increasingly common. At
the same time, the children of planters were inher it ing
estates. These native born individuals had l e ss in common
with the servants and nothing in common with the slaves.
This widening gap has been archaeologically identified at the
Clifts Plantation through a study of architectural change
(Neiman 1978,1980), and it seems equally likely that these
changes should be reflected in subsistence. The recognition
of these status differ e nces, however, requires a fin e r focu s
than an entire s ite.
Unfortunately, no faunal data are availabl e from
isolated servant or slave quarters to compare with other
sites. There is one means by which this data might be
obtained - by comparing feature materials associated with
different structures at th e same site. Th e centr a l
assumption is that pits dir e ctly relat e d to th e ma in hous e a t
a plantation will contain materials originating from within,
while features associated with outbuildings will contain
mat e rials deposited by the occupants of those structures,
perhaps servants or slaves. Although such an assumption is
not always warranted with archa e ological ma ter ial s , it is
possible for meaningful insights to be obtained regarding
status differences if the features are carefully selected.
36 4
Two features from the Drummond site seem well qualified
for this type of comparison. Both are the same type of
feature (wood lined wells later used as trash receptacles),
yielded similar faunal sample sizes, and yet th e y differ in
artifact content and location. The first well (Unit 347)
dates about 1700 and was situated near the main house. The
well yielded a dazzling collection of high quality artifacts
including Venetian- style glass and a delftware plate
decorated with the images of Willam and Mary (Alain Outlaw :
Personal Communication 1982). Well 326, on the other hand,
was near an outbuilding and only yielded such ordinary
artifacts as locally made earthenware. The latter well was
built in 1690, according to a dendrochronological analysis of
the wood lining, and was filled by about 1710. Although
preservation in Well 347 was not good for fragile materials,
the bones of mammals survived in good condition, and hence
these remains can be compared. Identified species and bone
counts are provided in Table 37.
Differences between these features are apparent. The
main house well (Unit 347) yi e ld e d the remains of cattle,
swine, sheep/goat, and deer. Well 326 produced bones from
cattle and swine, but lacked sheep or deer. The well
associated with the outbuilding also contained several
additional species, but some of this differenc e may hav e b ee n
produced by preservation factors. Bones of at least two
opossums were found in Well 326 and this is noteworthy
because these are the only elements from this species

365
Table 37: Faunal Materials From Drummond Wells 326 and 347
326 347 Species Bones % Bones %
Cattle 36 36.73 53 68.83 Swine 34 34.69 12 15.58 Sheep/Goat 11 14.28 Chicken 3 3.06
Deer 1 1. 29 Opossum 6 6.12 Rat 1 1. 02 Catfish 12 12.24 Crab 2 2.04 Cooter Turtle 4 4.08
identified in the Drummond II assemblage . Cellar 224
contained a bone sample over 25 times larger than the
collection from Well 326 and yet not a single opossum bone
was found in it.
Variation in the quantity of bone from cattle and swine
is also visible between these two units. In the main house
well, cattle bones make up 68% of the assemblage and swine
comprise 15%, while in the outbuilding well, both accounted
for approximately 35% of the bone. To aid in determining
whether there differences are significant, a chi square test
was performed, which indicates that these differences are
significant at the .01 level. This finding suggests that
beef was of greater importance in the diet of the main house
residents.
The quality of meat cuts consumed is another aspect of

3 6 6
subsistence that might differ betwe e n status groups . To
evaluate this, the cattl e bones were divided into two
categories: 1) high meat value elements (thoracic and lumbar
vertebrae, the scapulae, humeri, radii, ulnae, pelvic bones,
femurs, and tibias) and 2) low meat value elements (skull
bones, mandibles, cervical vertebrae, metapodials, astragali,
calcanei and the phalanges). This comparison also shows
considerable differences between the two features, with we ll
347 containing 31 high quality and 22 low quality elements
and the outbuilding well yielding 10 high quality and 26 low
quality bones. A chi square test reveals that these
differences are also significant at the .01 level.
Thus, important differences exist between these faunal
assemblages in species content, bone frequency, and the types
of meat cuts pr e sent. Sinc e the t wo we lls are spatially
separated and yielded quite different artifact assemblages,
it is probable that these samples represent the diets of
distinct social groups at the Drummond site. Materials from
Well 347 suggest that the more wealthy residents of the main
structure had a diet primarily composed of beef, especially
the higher quality cuts, supplement e d with pork, mutton and
venison. The outbuilding assemblage, probably deposited by
servants or slaves, indicates a meat diet composed of beef
and pork in more equal ratios, with beef cuts of lower
quality than in the main house assemblage. Small mammals
such as opossums, it is implied, we re added to the diet of
this group. This diet bears a close resemblance to that of
the Chesapeake slaves, as suggested by the documentary record

367
(Miller 1979: 160 - 161). If this interpretation is correct,
these faunal materials constitute the first archaeological
evidence for status distinctions in 17th Century subsistence.
Importantly, these samples also date from the end of the
century when the documents indicate that social distance
between master and servant was increasing. References to
servants and slaves being housed in separate quarters and
being fed differently from the planters' family, while by no
means unknown throughout most of the 17th Century, become
increasingly common during the late 1600s and early 1700s
(cf. Danckaerts 1913:111; Durand 1934:116; Michel 1916:114;
Jones 1956:78). These contemporary observations correlate
well with the data from the Drummond site.
Therefore, while the archaeological data are limited,
there is some evidence that the diets of different social
groups living on plantations were different and may have
become increasingly so through time. Certainly by the 18th
Century, when slaves comprised much of the labor force, the
differences in subsistence between planters and their slaves
were pronounced ecf. Noel Hume 1978: 15 - 19).
Discussion
For the most part, the findings discussed above
contradict the expectations of Hypothesis 6. While there is
some archaeological evidence for differences in subsistence
between status groups on plantations, little variation is
apparent between wealthy and the middling to poor households.
In resource usage, most of the late 17th and all of the early
368
18th Century assemblages investigated are remarkably alike.
One problem in this investigation is that these samples tend
to be from the larger and richer sites in the region. Data
from the poorest households are notably lacking for every
period because these sites have not been located or
excavated. There are, however, samples available from small
to middling scale plantations, and since the gap between
these and the extremely wealthy estates was large and growing
larger by the late 1600s, the lack of differentiation in
subsistence between them is significant.
Subsistence, rather than becoming more differentiated
through time, became less so. During the first period the
most pronounced differences between households occurred.
Most prominent of these is the usage of large mammals.
Cattle appear to have been an important source of meat in all
households while the contribution of swine was more
variable. During the early decades, wealthy households seem
to have invested labor in the exploitation of deer. In areas
where the natural resources had been heavily utilized,
however, the wealthy apparently placed greater reliance upon
cattle and used what wild animals could be found.
Land and natural resources were abundant and readily
available on the early Chesapeake frontier but two culturally
controlled resources were not -- domestic cattle and human
labor. The more wealthy households could afford to purchase
breeding stock soon after the colonist' arrival in the
colony, probably in some quantity, while a newly released

369
servant just beginning his plantation would probably not be
able to purchase livestock as soon or in as large a number.
In a study of the first decades of the Maryland colony, Stone
(1982) found that cattle were very difficult to obtain and
only the most wealthy owned herds of any size. Throughout
the 17th century, cattle were worth much more than other
livestock and, for many planters, cattle accounted for a
major portion of their personal wealth, as revealed through
the study of inventories. The emphasis upon swine at tenant
sites is probably related as much to the original cost and
the slow growth rate of cattle as to the rapid growth and
high reproductive potential of swine. Hence, economic
factors probably had to be carefully weighed before a cow or
steer could be slaughtered.
Equally important to a householder was the labor supply
available. The wealthy controlled more labor and could
apparently afford to expend some of it on exploitation of
specific natural resources, such as deer. Poorer households
with limited labor appear to have exploited natural resources
in a less intensive and less labor consuming manner. They
appear to have merely taken animals as the opportunity arose
rather than concentrating upon specific resources, unless
these resources were unusually abundant or easily obtained.
Thus, wealth differences in the early period did have a
notable impact upon the types of subsistence strategies
employed.
Later, as livestock herds grew, cattle comprised a much
greater proportion of the meat diet, while the input of swine
3 70
rose only moderately. Us a g e of wild resources continued but
at a greatly reduced level when compared to the early sites.
By the end of the 17th Century, no evidence for significant
variations in subsistence between households is apparent in
the archaeological record. Of course, there certainly were
differences in the quality of foods served between rich and
poor households. The wealthy could afford a wider range of
spices, sugar, specialized cooking equipment, baking ovens,
imported wines, and spirits, as well as the labor and
facilities with which to prepare elegant dishes. As Robert
Beverley (1947:291) wrote in 1705:
The Gentry pretend to have their Victuals drest, and serv'd up as Nicely as at the best Tables in London.
The Swiss traveler Michel (1916:140), however, apparently
found the more elegantly prepared foods of the wealthy not
always good, for he made the curious comment that:
One must, however, be surprized when lodging with poor people, for better food is frequently met with there than am o ng the rich.
Regardless of the means of food preparation, overall meat
subsistence patterns appear to have differed minimally
between the rich and poorer planters. Documentary support
for this comes from the writings of Durand (1934:123), who
observed in 1686 that:
As to cattle raised for food, however rapidly they may multiply, their number is kept down, for there is not a house so poor that they do not salt an ox, a cow and five or six large hogs.
Using the meat figures employed in this study, the number of

371
slaughtered livestock Dur a nd give s f o r a poor hous e hold
yields an estimated 61% beef and 38% pork. Although
difficult to give these percentages much credence, it is
curious that the only sites in the archaeological sampl e for
whi c h similar frequencies can be calcul ate d are Kingsmill
Tenement, Clifts I, and Bennett Farm I and II, the poorest
occupations.
The evidence indicates that Hypothesis 6 should be
rejected. Archaeological evidence indicates that by the late
1600s, there was little difference in subsistence activities
among the colonists who managed their own households. Only
in the non - free households, where subsistence strategies and
food consumption was controlled by others, do indications of
the stratified Chesapeake society appear.

CHAPTER 10
SUMMARY AND CONCLUSIONS
In this study, many different aspects of subsistence in
the colonial Chesapeake have been addressed. Evidence for
extensive and rapid changes in subsistence patterns has been
presented. In the following sections, the overall study is
briefly summarized and some aspects of Chesapeake subsistence
that warrant further attention are discussed.
Summary
This study has been concerned with the process by which
new lands are settled with specific attention given to the
expansion of a European society into North America. In the
first chapter, the characteristics of this process were
identified and a model of colonization was presented. Since
subsistence is one of the most crucial aspects in adaptation,
it is expected to undergo change on frontiers in a manner
commensurate with the process. For this reason, human
subsistence is discussed and the criteria used in selecting
appropriate adaptive strategies are considered. Hypotheses
regarding subsistence change during colonization, derived
from the model, are presented for testing with data from the
17th Century Chesapeake.
37 2

37 3
In the second chapter, the nature of subsistence in the
colonists' British homeland during the late 16th and early
17th Centuries is investigated, and two major subsistence
patterns identified: 1) the lowland pattern, with intensive
grain agriculture and some livestock husbandry, especially of
sheep and cattle, and 2) the upland pattern with an emphasis
upon livestock husbandry, and agriculture of only secondary
importance. Overall, British subsistence was highly focused
upon a few types of grains and livestock.
of minor importance except for some fish.
Wild species were
Cattle, sheep and
swine were the principal animals and husbandry practices,
complex in both the Upland and Lowland regions, required
careful livestock management. In terms of late 16th and
early 17th Century British dietary preferences, meat was
regarded as a high status food and the standard of living was
judged to a large extent by the amount consumed.
The study area of the Chesapeake Bay is next discussed
and compared to Britain in Chapter 3. The two regions had
generally comparable climates and vegetation although the
Chesapeake was notably warmer in the summer than Britain and
the ecological cycles were different. The primary
difference between the two lands, however, was in the natural
resources. Unlike Britain, the Chesapeake was covered with a
mature decidious forest, and wild food resources were
tremendously more abundant and diverse. The Chesapeake was
also inhabited by a native people whose culture was radically
different from that of the colonists.

374
In the f ou r th chap ter , the hi s to ry of s e t t leme nt in th e
Che s ap e ak e i s reviewed a nd th e c hi e f characteri s tics of t his
frontier society are delineat e d. Historical documents reveal
that the major features of th i s society wer e in keeping with
the predictions of the colonization model. Key among these
during the early decades of set t lement are abundant
opportunity, a fluid social s tructure, biased sex and a ge
structures, reduced cultu r al complexity and a s e vere labor
shortage. Also detected are temporal trends toward
demographic maturity, cultural stability, increasing
complexity, reduced opportunity and a more rigidly stratified
social structure, as predicted by the model.
The data sources used to test the hypotheses are
presented in the fifth chapter . Although historical
documents are integrated i nto the study, the primary data
base is archaeological. Animal remains from 15 sites and 21
separate occupations, dating from circa 1620 to about 1740,
are utilized in the investigation. Only faunal materials
fr om well dated, sealed contexts were selected for inclusion.
Recov e ry methods, analytic procedures and the units of
analysis are all discussed in detail to provide a basis f or
comparison with other studies.
Testing of the hypotheses begins in Chapter 6. The
first hypothesis, supported by th e findings of this study,
predicts that ev i dence for cultural impoverishment should b e
found. Animal husbandry practices in the colonies we r e
greatly simplified to a woodland pasture method that required
minimal labor . Agriculture was greatly simplified as well,

375
with the near abandonment of grain crops which required
plows. Instead, native American crops were grown using slash
and burn methods in a long term fallow system, an approach
the colonists may have learned from the Indians.
The prediction that the early adaptive strategy would
be of the diffuse type is verified in Chapter 7. Early
colonial subsistence practices emphasized a much wider range
of animals than in Britain and utilized them in a
distinctive, seaonally variable pattern. Differences in
resource usage due to ecological and wealth variables are
detected in the early samples. A trend toward increased
utilization of a few, select resources is also apparent in
the data with a more focal subsistence pattern emerging by
the late 1600s which emphasized two domestic species - cattle
and swine. Fewer wild resources were exploited through time,
and seasonal variation in subsistence was greatly reduced by
the early 1700s.
Evidence is presented in Chapter 8 regarding increasing
stability, uniformity and complexity in colonial subsistence.
More uniform subsistence patterns are found at later sites ,
with the assemblages dating from c. 1680 - 1740 being very
similar in the utilization of cattle, swine and wild
resources. Increased uniformity and complexity are also
indicated by changing cattle husbandry practices. Quite
similar patterns are found at late 17th Century Virginia
sites, and the age structure of the slaughtered animals
suggests that cattle began to be used for purposes other

3 76
than meat. Historical data s uppor t this obs ervation and
provide evidence that plow agriculture was more widely
practiced toward the end of the 17th Century. Finally,
indications of increased complexity are present in the form
of the earliest oyster marketing in the Chesapeake, which
apparently began along the James River in the late l600s.
Evaluation of the faunal materials from different
portions of the Chesapeake in Chapter 9 reveals that the same
trends of change in subsistence occurred throughout the
region, as predicted by the fifth hypothesis. However, the
data also indicate that through time, variability between
households at different wealth levels declined, rather than
increased, as predicted in Hypothesis 6.
Overall, the findings in this study of subsistence
confirm the predictions of the colonization model. The
findings also demonstrate that this cultural process can be
recognized in the archaeological record. Three remaining
subjects deserve more discussion: 1) the factors underlying
the move to the extremely focal adaptive strategy; 2) the
lack of status/ wealth related subsistence variation; and 3)
the timing and explanation of various frontier related
changes in the cultural system.
Discussion
Chesapeake subsistence clearly underwent rapid change
from a more generalized strategy to one which increasingly
emphasized only a few domestic resources. The emergence of a
more focal subsistence pattern is predicted, but what is

377
surprising is the d egree to which specific resources wer e
focused upon. Domestic animal bone frequencies increased
dramatically from 38% of th e identified e lements in early
assemblages to 88% in the post - 1700 samples. At the same
time, the domestic cont ributi on of estimated meat rose from
69% to 92%, most of which is attributable to just two animals
cattle and swine.
The move to a more focal economy was not propelled by
the general depletion of natural resources alone. Some
resources such as deer and turkeys were probably over
harvested, but others were almost certainly not, especially
the migratory fish and waterfowl. Even at Bennett Farm,
where the fish resources were apparently readily available
throughout the period under study, there is evidence for a
major decline in utilization. Why was exploitation of these
abundant and dependable natural resources nearly abandoned?
Cattle and swine were generally dependable resources in
the Chesapeake environment. The shift to near total reliance
upon them, however, occurred in the face of major plague
outbreaks and a series of severe winters that claimed the
lives of several hundred thousand animals in the region.
Obviously, reliance upon a domestic resource base did not
completely remove the potential for subsistence failure.
One factor likely to be involved is cost. In Chapter
1, this subject was discussed and the assumption was made
that selection of subsistence strategies usually involved the
least cost principle. The Chesapeake strategy which
developed supports this assumption. From the historical

378
docum e nt s pertai n i n g to h usban dr y p r a ct ic es i n the ear l y 18t h
Century ( Be v erley 1947; Gray 1958) , it is app ar e nt that t her e
was littl e change from the 17t h Ce ntury . Animals were g i ven
s li ghtly mor e c a r e bu t overal l , t h e y were p ermi t ted to r oam
freely and for a g e for thei r f ood. Little inv e stment was mad e
in facilities such as barns or in fodde r cutting. In
e s sence, allowing animal s t o r oam freely was one o f the l east
costly means of l i vestock ma nagement possible, and it
produced a large and dependable meat supply.
Factors other than food acquisition possibly we r e
involved in the development of this focal strategy because
cattle and swine also served other cultural needs. Livestock
provided subsistence security, but also s erved as a for m of
economic secur i ty in colon i al society. On th e self-
sufficient plantations, wild resources such as fish had
little value except as food. Livestock, on the other hand,
possessed an economic value in addition to their food value .
In Maryland, a cow and calf during the late 1600s were worth
over 2 pounds sterling (Menard 1975: 486-488); the
equivalant of 600 to 700 Ibs. of tobacco, or over one - third
the amount of tobacco a man was expected to grow in a year.
Consequently, in most inventories from the period livestock
made up a major portion of a household's assets (Menard 1975;
Kelly 1972) . For example, in Surry County, Virginia dur i ng
the late 1600s, livestock accounted on the average for half
of the total personal property owned by planters (Kelly 1972:
166). Unlike tobacco production, livestock production

3 7 9
required very little labor. A great deal o f land for grazing
was n eeded , t h o ug h . Li v es to ck were , in ef fe c t, a lan d
exte n sive rather t h an a labo r int es iv e resource , and land was
far mor e a vail abl e t h a n l a bo r in the early Chesape a ke. I n
e ffe c t , l ivest o ck s er v ed as a s o rt o f e conomic buff e r against
th e unpredictabl e tobacco market, and the difficulties o f
acqui r ing an d k eepin g l a bo r. Although v ery poorly
documented , the re is e vidence tha t a trade in beef and p o r k
was developin g by the ea r ly 18 th Ce ntury with the West
Indi es, along wit h the s a le of som e s a lt beef and pork as
ship provisions (Carrier 1957:30) . Cattle and swine cou l d
also be sold to other planters within the small but growing
local economy (Menard, Ca rr and Walsh 1983).
Probabl y of equal i mpo r tance was the ability of
l i vestock to s erv e as a me ans o f providing children with an
inheritance. Given the high death rate, it was unlikely that
a planter would live to see his children grown. Housing was
generally of an impermanent nature, lasting for perhaps one
generation before replacement was necessary, and hence, i t
was an ineffective means of transferring wealth to one's
children. Tobacco would not store for any period of time ,
bound labor was an unreliable inheritance because of the high
mortality rate and there were limitations on the length of
indentured servants' terms. Only land could be transferred
with certainty to th e following generation. Livestock, while
perhaps not as certain, were of considerable value and had
the advantage over land of returning a high rate of in t erest
through reproduction. Given minimal care, cattle and swine
380
could increase quickly, so that the gift of a cow and calf t o
a child could become a sizable herd by the time that child
reached adulthood. An animal still migh t die, but the
chances of an entire herd dying wer e p r obably small. Hen ce,
livestock offered an important alternative to reliance on
tobacco and helped provide economic as well as subsistence
security, both to the planter and his heirs.
Discussion of inheritance raises another subject of
relevance for understanding the domestic animal focus in
subsistence. As previously noted, it was only during the
closing decades of the 17th Century that a native born
majority was established in the Chesapeake colonies. The
effect of this demographic transition on subsistence was that
most later households did not begin at the minimal level
necessary for the first generation. Instead, most of these
households probably started with cooking equipment and
animal herds inherited from their parents. In addition,
these individuals had the advantage of knowing the natural
environment and benefitting from the experiences of their
parents or guardians regarding subsistence. The native
borns' greater knowledge is an expected corollary of the
development of a stable population. Attention must be given
to this generational effect in the evaluation of subsistence
patterns, which occurs not only in frontier settings,
although it may be most clearly expressed in that setting.
When studying relatively short temporal periods, as in
Historical Archaeology, the phases of household development

381
can potent ial ly have an important effect upon the composition
of archaeol og ical assemblages and are worthy of seriou s
study.
Finally, the development of thi s focal strat egy can
also be viewed as the successful reestablishment of
traditional British subsistence practices. As Thompson
(1973) has noted, one of the goals of colonists is to
reestablish familiar cultural practices to the extent
possible. Tradition is obviously a powerful force in
subsistence behavior and it certainly had an important role
in shaping the colonial Chesapeake subsistence pattern. The
basic reliance upon domestic animals is apparent in the
earliest archaeological samples and becomes more pronounced
through time. Tradition was not the only factor , however,
for many differences are apparent between British and
Chesapeake subsistence. Certainly, husbandry practices were
quite different from those employed in Britain, with
livestock in" the colonies essentially allowed to run free.
Cattle and swine were apparently much more common in the
Chesapeake while sheep were extremely rare in comparison to
the huge flocks found in England. One of the major dietary
staples in Britain, cheese, was nearly absent in Chesapeake
subsistence. Real differences, probably attributable to both
environmental and cultural factors, existed.
The focal adaptation that emerged in the late 1600s
was a produrit of many forces. Certainly the dependability of
domestic animals and the low cost of keeping them in the
Chesapeake is at the heart of their acceptance as the

382
subsistence bas e. Other factors, however, probably served to
intensify and focus reliance upon cattle and swine. In
In addition to meat, dairy products, and cooking fats, cattle
and swine also provided a secondary source of income, a
buffer against economic difficulty, and a means of improving
the lives of one's children through inheritance. The British
heritage of the colonists was also relevant in shaping the
adaptiv e strategy because cattle and swine were central
elements in British subsistence. That the evaluation of
colonial subsistence must include other factors than jus t
food acquisition is abundantly clear. Cattle and swine were
of major significance for subsistence but they also
functioned in other contexts. In complex societies, to
evaluate an adaptive pattern only in terms of food
acquisition likely will lead to erroneous conclusions. The
explanation offered here for the emergence of a very focal
adaptation is thus multi - dimensional, reflecting the
complexity of variables involved in the process by which an
adaptive strategy is selected.
Perhaps the most unexpected discovery of this study is
the lack of evidence for status/wealth related differences in
subsistence during the late 17th and early 18th Centuries.
While some indication of subsistence variation between social
groups was found at the Drummond site, comparison of faunal
samples from other households dating to that period reveals
little variation. The greatest evidence for variation is
found in the early period, just the reverse of the

383
pre d iction, and these differences were at least partial l y
r elated to wealth . The more wealthy c ou ld affor d t o put
l a b or toward the exploitation of high ret u r n , but h igh ri sk
re s ou r c es (i. e. deer ) , while the p oo rer hous e holds took t h e m
o n ly occas ion ally . Another factor was t h e high cost o f
cattle, which could be mo re r e adily acquir e d and in grea te r
number s b y weal t hy r a t h er t han p oo r i ndiv i duals . Thus,
subsistence var iation i n t h e e a rly period wa s produced in
part by limited resources, but these were no t n a tura l
resources , they were thos e under cultural co ntrol.
Th e rationale fo r the pr e diction that incre a sed
variation should occur through time was related to resource
scarcity. As the population increased (which it did, and at
a rapid r a te), food requi r ement s would rise (which they
obviously did), and pressure on subsistenc e r e sources would
lead to depletion or reduced availability of many of them.
Some evidence suggests that this phenomenon also occurred.
The next step in this line of reasoning, and the crucial one
for Hypothesis 6, was that in the stratified Chesapeake
society, differences in subsistenc e would occur due to the
differing access of various wealth groups to th e means
(largely labor and equipment) for exploiting the
increasingly scarce resources. Other studies of faunal
materials from stratified colonial societies (Cumba 1975;
Reitz 1979) have found e videnc e for significant status
related differences in the exploitation of both wild and
domestic resources. Why in th e Chesapeak e , wh e re ther e is
abundant evidence for increasing social stratification, are

384
in d ications o f subsis t enc e variatio n minimal?
Th e answer lies in the fact t hat hous eholds, whether
rich or poor, were highly s elf- sufficient in the Chesapeake.
The focal a daptiv e strategy that emerged in the late 1600s
seems to have b een based upon key resources that were not
depleted. Livest ock husband ry practices were not l a bor
intensive bu t they were land extensi ve, requiring large
amounts of woodl an d pastur e to support cattle and swine.
Little equipment, facilities, or labor investment was
necessary , so that the subs is tence strategy did not
necessitate th e expenditure of much capital or labor. Thes e
key factors are normally expected to produce socio-economic
differentiation in subsistence. Although l an d was not as
available as it had been in the early 17th Century, land
could still be obtained and plantations wer e generally large
to include abundant woodland pasture. In early 18th Century
Maryland, the median plantation size ranged from 200 to 300
acres with few plantations below 100 acres in size (Menard
1975: 423) . Since one laborer could tend only two or three
acres of tobacco and two acres of corn a year, much of a
planter's land was either in forest or "old fields" under -
going revegetation. Even on small plantations, there would
have been abundant land for livestock to graz e . Furthermore,
since property boundaries were not fenced, the land available
for grazing was in reality even larger. Thus, the critical
resources for successfully employing this focal strategy were
two - livestock and land - and neither was limited. All but

385
th e po o rest in divi dua l co ul d ex p ect to rais e li v est o ck in
quantity. Therefore , while t h e c olon ia l soci e ty b e came
in creasi ngl y strati fi e d socially a n d ec onomi cal ly, the k ey
s ub sistence r es ourc es d id not b ecome u neq u a lly di stri but e d ,
at least not d u r i n g the t im e peri od u n d er s tudy.
Th e impl i cation o f thi s is import a n t b e cause
d i f f e re nt i al ac cess t o re s ources, espec ia l ly f ood, is a
cent r al elem e n t in the d e f initi on of s tatus. The late 1 7t h
and e arly 18th Ce n t u r y Chesap eake provide s a clear ex a mp le of
a s tra t if ied socie t y where t h e ar c hae ological rema i n s
rel a ting to sub s istence f a i l to show any differe nces. S ince
it is typic a lly assumed wh e n investigating a highly
stratified society that these differences will be present,
this discovery poin t s ou t t ha t s uch an a ssumpt i on may no t
necess ar ily b e valid.
The situa t ion evid e nced here may be a feature of
frontier settings where there is an unusual abundance of
available land. A much longe r period of time may be
necessary for access to land to become sufficiently
restricted that status/we alth differences in the meat die t
appear. Clearly, faunal materials from later 18th and 19th
Century sites in the Ch e sapeake must be employed to fully
investigate this subject. This finding, nevertheless, is
significant because it refutes th e commonly held assumption
that differential access to foods, espcially meat, is an
inevitabl e featur e of social stratification.
Still another important subject is the t i ming of
various changes in the colonial society. The rise of th e

386
mo re foca l adaptive strategy and re du ced seasonal variability
in t h e diet became p ron o unced during t h e last decades of t h e
17 t h Ce ntu r y. Th i s sh ift c o rrelates well wit h ma n y o t h er
cha n ges in the co lon ial s ociety disc u ssed in Ch apte r 4 an d
which a r e pred i c ted to oc c u r as th e c o l oniz a tion p r oce ss
ends. Among these indices a re popul ati on g rowth t hrou g h
natu r al reproduct i on, e c onomic d i versificat ion, es tab lis h me n t
of a na t ive born majority , risin g popu la t i on den si tie s a nd
declinin g opportunity. All o f t hese facto rs a re import a nt
eleme nts in the e s tablishment o f a stable a nd viab le soc iet y.
The colonization process took from 60 to 80 year s from
the date of original settlement to th e e stablishment of a
viable, stabl e society. This seemingly lengthy process was
hindered and prolonged by exceptiona l ly high mortality ra t e s
and the virtually continuous immigration of new colonists
into the region. Particularily surprising is the fact that
both Virginia and Maryland experienced the same changes at
approximately the same time, even though both colonies were
founded 27 years apart. Certainly some regional variation,
which only recently has become a topi c of research, existed
but the onset of natural population increase, the development
of native elites and the stabilization of cultural processes
in aspects as varied as subsistence and politics appear to
have occurred only slightly ea r l i er in Vi r ginia. Among the
sevepal factors probably responsible for this situation is
the conflict ridden e arly years of Virginia settlement.
During the first years, there was little effort to establish

387
a reliabl e subsistence base and several disasters destroyed
many o f the domestic animals. Colonization efforts wer e not
really successful in any prominent way un til after the demise
of th e Virgini a Company in 1624, just a d eca d e be fore
Maryland's founding. The Maryland colonists also had the
benefit of obt ai nin g livestock from Virgini a i nstead of
having to transport them fro m England. Mor e importantly, the
Marylanders apparently learned from the experiences, and
benef itted from the mistakes of the Virg inia settlers, and
hence they were able to adapt more rapidly to the Chesapeak e .
Thus, the temporal di fference in development between the two
colonies was not as great as might be surmised from a
consideration of founding dates alone.
Colonial Chesapeake society seems to have gone through
a major transition du ring the final decades of the 17th
Century and, as noted above, the timing of thi s transition
seems to have been similar in both colonies. Many change s
appear to have been nearly contemporaneous . Explanation of
them, however, has taken two courses. The first, and the one
advanced here, is that the cultural process associated with
colonization is the key factor in these many changes . Th e
second approach has been to study each change in detail and
produce specific historical explanations for them. For
example, declining opportunity and economic diversification
have been attributed to the over production of tobacco and a
major depression in the tobacco economy beginning in the
1680s (Menard 1975). Such a specific historical exp lanation
is correct and appropriate in the sense that every event is

388
the product of a uniqu e set of circumstances, a nd clearly,
ec onomic factors are of central importan ce . An e mph asis upo n
the specif ic explanat ion for each phenomenon, how eve r, can
ob sc u re perception o f commonality and the operat ion o f
broader cu lt u ral processes .
Th e operat ion of such a process i s not only suggested
by the presence of features predicted by the col onizat ion
model but by the timing of their app earance. For example ,
decline in economic opportunity and the achievement of a
natura lly reproducing population are separate events, bu t
according to the model, they should be contemporaneous
because they mark the termination of the colonization
process. The actual date of their appearance, however, is
expected to vary geographically because the process should b e
most advanced in the longest settled area. On th e other
hand, if economic factors associated with the tobacco economy
were solely responsible for these changes, then they should
occur throughout the frontier at the same time. All planters
participated in essentially the same marketing system.
Historical evidence suggests that these events occurred
at varying times in the Chesapeake. Opportunity can be
demonstrated to have declined earliest in the first settled
areas of the Maryland colony (Carr and Meanrd 1979:233).
Opportunity also declined first in the longest settl e d ar e a
of Virginia, where limits to land acquisition existed by the
last third of th e century (Morgan 1975:225- 230). Even during
the depths of the 1680s depression, however, a freedman could

389
apparently still find opportun i ty to obtain land, e stablish a
household and build a modest estat e in the unsettled frontier
areas such as the interior of Surry County (Kelly 1979: 19 7 -
199). Thus , there is a relationship between the d ate of
settlement and the decline of opportunity which implies an
association with t he frontier process. Economic depressi on
undeniably ha d an impact and probably intensified the speed
and d epth o f the decl ine , but it is incorrect to say that
ma rket condi tions were the sole or even major cause.
The appearance of a naturally increasing population
also seems closely rel ated to t he date of settlement. In
Maryland, which has been more thoroughly studied in this
regard, this achievement occurred earliest in the first
settled area of southern Maryland, and later on the Eastern
Shore. Menard (1975:200) fo und that natural population
increase occurred some ten to twenty years earlier in the
counties of southern Maryland, settled in the 1640s and
1650s, than it did in those areas of the Eastern Shore first
occupied in the 1660s and 1670s.
This variability in timing strongly suggests that these
changes are related to the process of frontier settlement.
The decline in opportunity is characteristic of frontiers.
As the choisest resources and lands are claimed, the chances
of success for newcomers decline proportionately.
Achievement of natural population increase is an indication
of demographic maturity and a demonstration that a viable
population has been established. Th e economic depression
certainly intensified but was not necessarily the cause of
390
the decli ne in opportunity or economic diversification. The
correspondence of mul tiple changes and their similarity to
t h e predictions of th e colonization mod el argue otherwise .
These changes were part of a c u lt ura l process that h a d been
set in motion with the founding of the colonies.
Specific historical explanations for each change are
both important and neces sary. Economic cond iti ons,
immigration rates and demographic factors all help explain
various aspects of change . A single crop economy certainl y
had a profound impact upon the character of th e Chesapeak e
society. Only by taking a broader perspective, however ,
can the relationship of features and patterns of change to a
major cultural process become apparent. When men and women
arrived, determined to settle the Chesapeake frontier, they
unleashed an adaptive process with a dynamic of its own. Any
attempt to understand a colonizing situation without
reference to this process can never be successful.
Conclusions
The goal of this study has been to test a model of
colonization with archaeological data. focusing upon the
expression of this process in subsistence patterns on
frontiers. Colonization is one process by which humans adapt
to new environmental situations . Study of colonization can
yield insights regarding how human adaptive strategies change
in response to new conditions as well as the processual
patterns associated with these changes.
This investigation has revealed that subsistenc e
39 1
strategies o n fro n tie r s und ergo rap id a nd pronounced c h ang e,
and the d irec t ion a n d na t u re of t hi s c hang e c an b e p r e d i ct e d
f r om t h e co l oniz a t i on mo del and a k nowledge of h uman
s ub s istence b e havio r . Subsistence on a newly set tled
fron tie r wi ll te nd to b e generali z e d, wit h a diffuse adapt iv e
st rate gy tha t ut ili ze s many d ifferent res ources in a
sche d ul ed manner . Vari ab i l it y in t h e u se o f f ood re sou rces
was due to ecology and t he hum an res ource s a vai lab le to a
household. The heritage of the coloni sts also i nf l u e n c e s
sub s i stence b ehavior . I n the Chesapeak e, domestic cattle a nd
swine were emphasized fro m the b e ginning of settlement,
indicating a continuation of Bri t ish practice.
The model predicts th a t through time , the co l oniz i n g
soc iet y, and its subs ist enc e sys t e m, will b ec om e mo re stabl e
and uniform. Subsistenc e theory p e rmit s the prediction tha t
the adaptive strategy wil l become mor e focal in na t ure.
archaeological and historical evidenc e support the s e
predictions and demonstrate tha t they occurred in the
Chesapeake. Indeed, subsistence becam e so highly focus e d
Both
upon two species of domesti c animals that othe r e qu a lly
dependable and efficiently exploited resources wer e releg a ted
to a very minor position in th e ov e rall adaptiv e strategy.
Clarke (1968) has sugg e sted that the development of a stable
adaptive strat e gy would b e e vide n ce d in the archa e olog i c a l
record by the appearan ce of uniform subsistenc e patterns
within a region. To th i s should b e added the crit e ria o f
persistence of the un i form subsistenc e pattern through time .
392
Analysis of d ata from the Chesapeake can be consid e red a
test of this proposition and a demon s tration of its
c o rre c t n ess . Th e r e is a n u nm istakable trend in t h e data
t owa rd grea t er uniformity and this un iform ity appears to last
for a c ons i d erable period o f time, su g gesti ng that t h e
measu r ement o f uniform i t y can b e an impo r t an t tool by whic h
to as ses s the s tab i l it y o f a c u lt u r al adaptation i n the past .
Analysi s of th e h ist o r ical data also reveals that the
strategy sel e cted b y th e c olon ist s a t the te rmin at ion of
colonization r e qu i red min i mal cos t s. Th e least - cost
principle is a commonly a ss um e d f a ctor in resource sel e ct i on
but it is seldom possible to verify it. The focus upon two
domestic species that could survive with extremely simpl e
husbandry practices seems to reflect the operation of this
principle. Th e Chesapeake colonists focused upon two high
yield but very low cost resources that not only provided
ample food but which had other economic and cultural values.
Significantly, the same trends of change are apparent in
all of the archaeological samples. All households were
participating in the same cultural process. Differences in
the degree to which these trends are expressed at sites,
however, vary according to differences in the wealth of
households, as well as the time of household establishment on
a frontier.
Unexpectedly, wealth related subsistence variation
became less pronounced through time in the Chesapeake sample .
Indeed, there are few if any significant differenc e s in th e
samples dating to the post - 16BO period. Given the fact that

393
th e c ol onial so ci ety became i ncreas in gly stratifi e d d u ri ng
t his per i od , th e lack of wealth - rel a te d variab ility is
n o t e wor t hy. Acc e s s to t h e key resources for subsiste n c e was
no t lim i t e d i n t h is ot h erwi se stra t ified s o c i e ty .
Di ff eren tia l access to subs i s tence resourc e s i s no t
necessarily an a t tribute of stratified societ ie s. Assuming
tha t t h e r e mus t hav e been subs i stence differences when any
evidence for status or wealth differentiation is found in
mate ri al cultur e is not necessarily valid. If valid , this
must be demonstrated with fauna l and floral evidence rather
than being an assumed, inevitable attribut e of all stratified
societies.
This seemingly rare situation may be an attribute of
colonization where population densities and population - to
resource ratios are lower than found in most other settings.
In the Chesapeake example, a focal adaptive strategy was
selected that relied upon unusually abundant resources - land
and livestock - and required few costs, which may not be
possible in many situations. Still, the minimal evi denc e for
wealth variation in these samples is an un expected discovery,
and stands as one of the only such examples reported in
archaeology.
In this study, it ha s been possibl e to el ucidate the
regularities displayed during the operation of a major
c ultu ral process, and to d emonstrate concl usiv ely that this
process is recognizable in the arc haeological record. A
mod el of this process has been dev e loped and the predictive

394
ability of the model in one aspect o f culture has been
successfully tested. This research is a first step, however,
for only through t h e study of colo n izat ion in other settings
an d the recognition of var iati on can the predictive abi lity
of t h e model be improved and, more importantly, a greater
unders tandi ng of human adaptive behavior emerge . The
possibil it ies for such studies can be found in diverse
settings ranging fr om grasslands to jungles, for the process
is wo rldwide. Study of colonization posses ses grea t
potential f or elucidating huma n behavior and cultural
processes, but it remains a large ly unexplored research
frontier.

APPENDICES

Appendix I
Table 38: Faunal Remains From the Maine Site (Data Brom Barber 1978)
No. Species Bone % M.N.I.
Cattle Bos taurus Swine Sus scrofa Sheep/Goat Ovis aries or Capra hirca Cat Felis domest~ -----
Chicken-Gall us g~nus
Deer Odocoileus virginianus Raccoon Procyon lotor Woodchuck Marmota monax Gray Fox Urocyon cinereoargenteus Fox Squirrel Sciurus niger Turkey Meleagris gallopavo Canada Goose Branta canadensis Goose Chen sp. Mallard/Black Duck Anas sp. Duck Anas sp. Teal Anas sp. Bald Eagle Halioetus leucocephaalus catfish Ictalurus sp. Longnosed Gar Lepi s osteus osseus Sturgeon Acipenser sturio Box Turtle Terrapene carolina Snapping Turtle Chelydra serpentina Cooter Turtle Chrysemys sp.
22 68
1 4 4
31 4 1 1 1 5 7 1 1 7 1 1 3 5 8 9 3 8
196
11. 22 34.69
0.51 2.04 2.04
15.81 2.04 0.51 0.51 0.51 2.55 3.57 0.51 0.51 3.57 0.51 0.51 1. 53 2.55 4.08 4.59 1. 53 4.08
99.97
1 6 1 1 1
3 2 1 1 1 2 2 1 1 2 1 1 2 2 1 2 1 1
37
Mg~t
400 600
35
2.5
300 30
5
1 15 12
6 2 4 1
4 10
100 0.5
10 3
1541
%
25.95 38.93
2.27
0.16
19.47 1.94 0.32
0.06 0.97 0.78 0.39 0.13 0.26 0.06
0.26 0.65 6.49 0.03 0.65 0.19
99.97
w ~ U1

Table 39: Faunal Remains From the Kingsmill Tenement Site
Species
Cattle Bos taurus Swine Sus scrofa Sheep/Goat Ovis aries or Capra hirca Chicken Gal~gaIIUS -----
Deer Odocoileus v irginianus Beaver Castor canadensis Raccoon Procyon lotor Opossum Didelphis-IDarsupialis Rabbit Sylvilagus floridanus Gray Squirrel Sciurus carolinensis Turkey Meleagris gallopavo Canada Goose Branta cffiiadensis Red Shouldered Hawk Buteo lineatus Duck Anas sp. Duck AYthya sp. Cormorant Phalacrocorax auritus Sturgeon Acipenser . -stur~ -Longnosed Gar Lepisosteus osseus white Perch Morone americana Brown Bullhead catfish Ictalurus nebulosus Catfi sh Ictalurus sp . Striped Bass Morone saxatilis Black Drum Pog'onias cromis Sea Trout Cynoscion sp. Box Turtle Terrapene carolina Snapping Turtle Chelydra serpentina Cooter Turtle Chrysemys sp.
No. Bone
262 235
4 12
54 15 26 12
2 3 4 2
12 4 1 6 5
35 16 14
7 36
5 1
31 20
3
%
30.36 27.23 0.46 1. 39
6.25 1. 74 3.01 1.39 0.23 0.34 0.46 0.23 1.39 0.46 0.11 0.69 0.58 4.05 1. 85 1.62 0.81 4.17 0.58 0.11 3.59 2.32 0.34
M.N.I.
8 22
1 3
4 3 5 3 1 1 1 1 2 2 1 1 1 1 5 4 1 2 1 1
5 3 1
Lbs. Meat
2700 2050
35 7.5
400 75 75 24
2 0.8 7.5 6
4 1.5 5
100 5 5 8 2
15 25
5 1. 25
30 3
%
48.26 36.64 0.62 0.13
7.15 1. 34 1.34 0.43 0.03 0.01 0.13 0.10
0.07 0.02 0.09 1. 78 0.09 0.09 0.14 0.03 0.26 0.45 0.09 0.02 0.53 0.05
W \.0 (j)

Table 39: Continued
No. Species Bone
Painted Turtle Chrysemys picta 1 Musk Turtle Sternotherus sp. 11 Blue Crab Callinectes sapidus 24
863
% M.N.I.
0.11 1 1.27 1 2.78 6
99.92 92
Lbs. Meat
0.25
1.2 5594
%
0.004
0.02 99.91
w I.D -...J
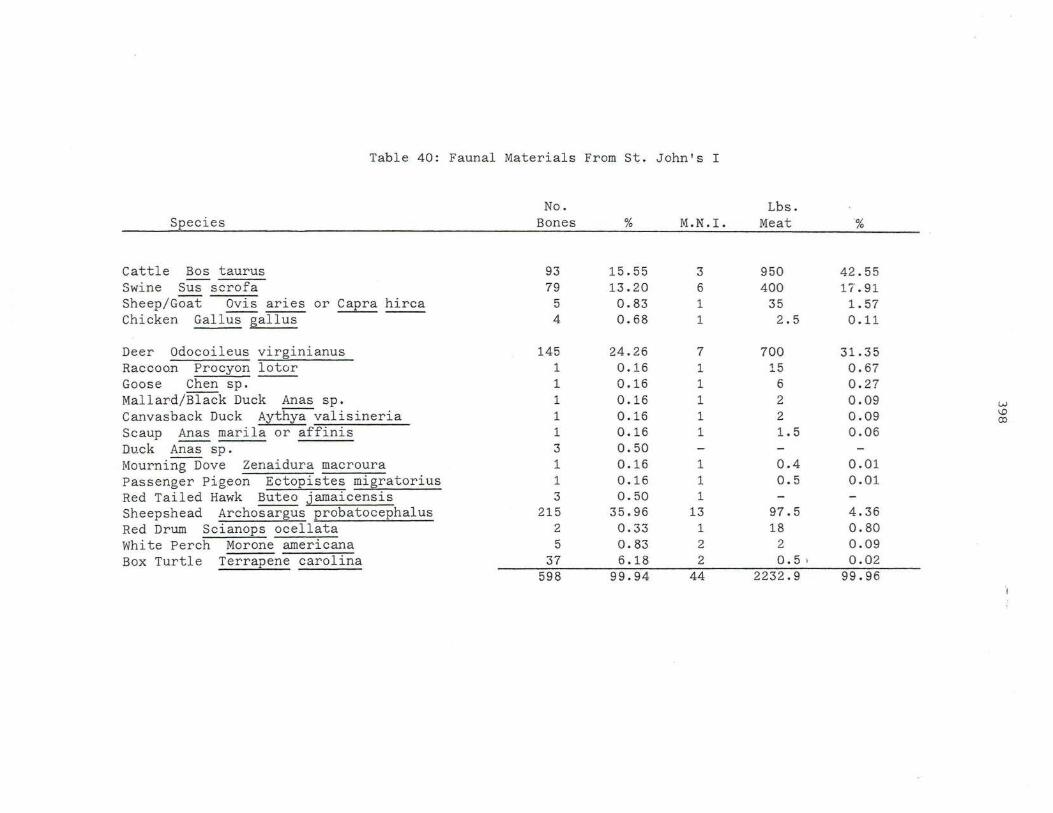
Table 40: Faunal Materials Fram st. Jahn's I
No.. Lbs. Species Banes % M.N.I. Meat %
Cattle Bas taurus 93 15.55 3 950 42.55 Swine Sus scrafa 79 13.20 6 400 17.91 Sheep/Gaat Ovis aries or Capra hirca 5 0.83 1 35 1. 57 Chicken Gallus gallus ----- 4 0.68 1 2.5 0.11
Deer Odacaileus virginianus 145 24.26 7 700 31.35 Raccaon Pracyon lotor 1 0.16 1 1.5 0.67 Goose Chen sp. 1 0.16 1 6 0.27 Mallard/Black Duck Anas sp. 1 0.16 1 2 0.09 w Canvasback Duck Aythya valisineria 1 0.16 1 2 0.09 \.0
OJ
Scaup Anas marila ar affinis 1 0.16 1 1.5 0.06 ----Duck Anas sp. 3 0.50 Maurning Dave Zenaidura macroura 1 0.16 1 0.4 0.01 Passenger Pigean Ectapistes migratorius 1 0.16 1 0.5 0.01 Red Tailed Hawk Buteo. jamaicensis 3 0.50 1 Sheep shead Archasargus prabatacephalus 215 35.96 13 97.5 4.36 Red Drum Scianaps acellata 2 0.33 1 18 0.80 white Perch Marane americana 5 0.83 2 2 0.09 Box Turtle Terrapene caralina 37 6.18 2 0.5 ) 0.02
598 99.94 44 2232.9 99.96
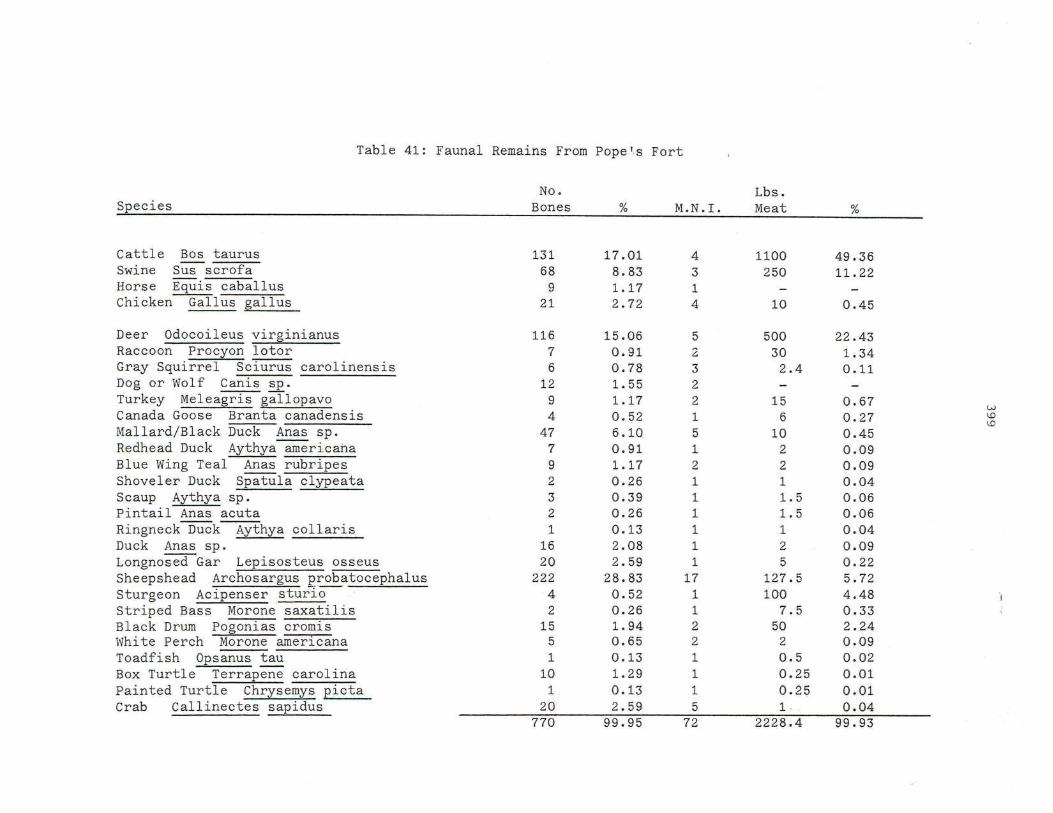
Table 41: Faunal Remains From Pope's Fort
No. Lbs. Species Bones % M.N.I. Meat %
Cattle Bos taurus 131 17.01 4 1100 49.36 Swine Sus scrofa 68 8.83 3 250 11. 22 Horse Equis caballus 9 1.17 1 Chicken ~lus ~allus 21 2.72 4 10 0.45
Deer odocoileus virginianus 116 15.06 5 500 22.43 Raccoon Procyon lotor 7 0.91 2 30 1.34 Gray Squirrel Sciurus carolinensis 6 0.78 3 2.4 0.11 Dog or Wolf Canis sp. 12 1. 55 2 Turkey Meleagris gallopavo 9 1.17 2 15 0.67 w Canada Goose Branta canadensis 4 0.52 1 6 0.27 \!l
Mallard/Black Duck \!l
Anas sp. 47 6.10 5 10 0.45 Redhead Duck Aythya americana 7 0.91 1 2 0.09 Blue Wing Teal Anas rubripes 9 1.17 2 2 0.09 Shoveler Duck Spatula clypeata 2 0.26 1 1 0.04 Scaup Aythya sp. 3 0.39 1 1.5 0.06 Pintail Anas acuta 2 0.26 1 1.5 0.06 Ringneck Duck Aythya collaris 1 0.13 1 1 0.04 Duck Anas sp. 16 2.08 1 2 0.09 Longnosed Gar Lepisosteus osseus 20 2.59 1 5 0.22 Sheep shead Archosargus probatocephalus 222 28.83 17 127.5 5.72 Sturgeon Acipenser stur'l-o- 4 0.52 1 100 4.48 Striped Bass Morone saxatilis 2 0.26 1 7.5 0.33 Black Drum Pogonias cromis 15 1. 94 2 50 2.24 White Perch Morone americana 5 0.65 2 2 0.09 Toadfish Opsanus tau 1 0.13 1 0.5 0.02 Box Turtle Terrapene carolina 10 1. 29 1 0.25 0.01 Painted Turtle Chrysemys picta 1 0.13 1 0.25 0.01 Crab Callinectes sapidus 20 2.59 5 1. 0.04
770 99.95 72 2228.4 99.93

Table 42: Faunal Remains From Chancellor's Point
No . Lbs. Species Bones % M.N.I. Meat %
Cat tle Bos taurus 35 24.47 2 800 57.96 Swine Sus Scrofa 25 17.48 3 300 21. 73 Chicken Gallus gallus 3 2.09 1 2.5 0 . 18
Deer Odocoileus virginianus 13 9.09 2 200 14.49 Sheep shead Archosargus probatocephalus 65 45.45 7 52.5 3.80 Black Drum Pogonias cromis 1 0.69 1 25 1. 81 Box Turtle Terrapene carolina 1 0.69 1 0.25 0.02
143 99.96 17 1380.25 99.98
"'" 0 0

Table 43: Faunal Remains From Bennett Farm I
No. Lbs . ~ecies Bones % M.N.I. Meat %
Cattle Bos taurus 106 8.56 4 1350 41.49 Swine Sus ·scrofa 92 7.43 7 700 21. 51 Chicken Gallus gallus 2 0.16 1 2.5 0.07
Deer Odocoileus virginianus 24 1.94 2 200 6.14 Raccoon Procyon lotor 1 0.08 1 15 0.46 Opossum Didelphis-marsupialis 4 0.32 1 8 0.24 Sray Fox Urocyon cinereoargenteus 5 0.40 1 Goose Chen sp. 2 0.16 1 6 0.18 ~
Duck Anas sp. 2 0.16 1 2 0.06 0 I-'
Brant Branta bernicla 1 0.08 1 3 0.09 Sheep shead Archosargus probatocephalus 843 68.14 69 517.5 15.90 Black Drum Pogonias cromis 35 2.82 5 125 3.84 Red Drum Scianops ocellata 111 8.97 18 324 9.95 Box Turtle Terrapene ca~olina 5 0.40 1 0.25 0.007 Blue Crab Callinectes sapidus 5 0.40 2 0.4 0.01
1237 99.94 115 3253.65 99.94

Table 44: Faunal Remains From Drummond, Phase I
Species
Cattle Bos taurus Swine Sus scrofa Sheep/Goat Ovis aries or Capra hirca Horse Equis-C-aba~ -----Cat Felis domesticus Chicken--Gallus gallus
Deer odocoileus virginianus Gray Squirrel Sciurus carolinensis Gray Fox Urocyon cinereoargenteus Rat Rattus sp. Turkey Meleagris gallopavo Mallard/Black Duck Anas sp. Duck Anas sp. Duck AYthya sp. Canada Goose Branta canadens is Bobwhite Colinus virginianus Teal Anas sp. Coot FUIIca americana Grackle Quiscalus quiscula Loon Gavia immer Sturgeon AcIPeDSer sturio Striped Bass Morone saxatilis White Perch Morone americana white Sucker Catostomus commersoni catfish Ictalurus sp. Box Turtle Terrapene carolina D.B. Terrapin Malaclemys terrapin Toad Bufo sp. Spadefoot Toad Scaphiopus holbrooki
No. Bones
205 114
18 4 2 8
14 2 2 1 7 4 7 1
10 1 1 8 3 1
1 7 3 1
21 22 49
2 2
535
%
38.32 21.30 3.36 0.74 0.37 1.49
2.62 0.37 0.37 0.18 1.30 0.74 1.30 0.18 1.86 0.18 0.18 1.49 0.56 0.18 0.18 1.30 0.56 0.18 3.92 4.12 9.15 0.37 0.37
99.93
M.N.I.
7 7 2 2 1 2
2 1 1 1 1 1 2 1 2 1 1
2 1 1 1 1
2 1 4 2 1 1 1
55
Lbs. Meat
2300 650
70
5
200 0.8
7.5 2 4 2
12 0.5 1 2 0.4 4
100 7.5 2 1
8 O. 5 ~'
0.6
3395.8
%
67.73 19.14 2.06
0.15
5.89 0.02
0.22 0.06 0.12 0.06 0.35 0.01 0.02 0.06 0.01 0.12 2.94 0.22 0.06 0.02 0.23 0.01 -0.01
99.94
..,. o tv
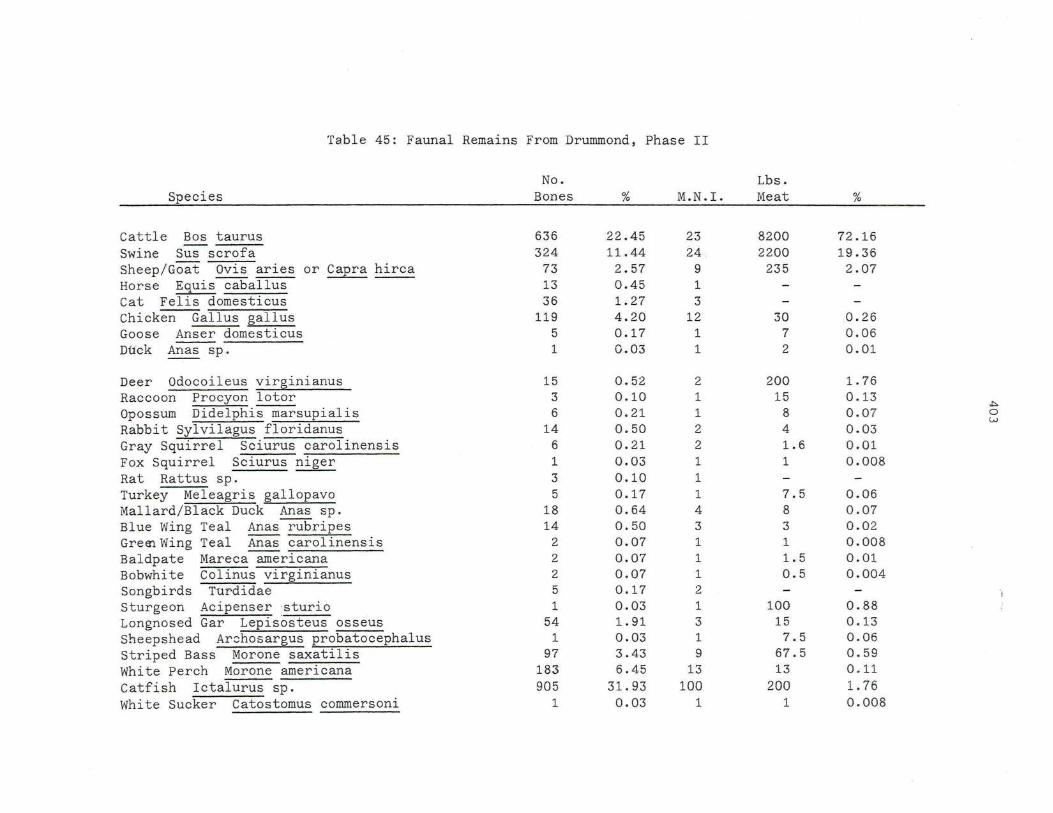
Table 45: Faunal Remains From Drummond, Phase II
Species
Cattle Bos taurus Swine Sus scrofa Sheep/Goat Ovis aries or Capra hirca Horse Equis cabal Ius Cat Felis domesticus Chicken--Gallus gallus Goose Anser domesticus DUck Anas sp.
Deer Odocoileus virglnlanus Raccoon Procyon lotor Opossum Didelphis:marsupialis Rabbit Sylvilagus floridanus Gray Squirrel Sciurus carolinensis Fox Squirrel Sciurus niger Rat Rattus sp. Turkey Meleagris gallopavo Mallard/Black Duck Anas sp. Blue Wing Teal Anas-rubripes GremWing Teal Anas carolinensis Baldpate Mareca-affiericana Bobwhite Colinus virginianus Songbirds Turdidae Sturgeon Acipensersturio Longnosed Gar Lepisosteus osseus Sheepshead Ar8hosargus probatocephalus Striped Bass Morone saxatilis White Perch Morone americana Catfish Ictalurus sp. White Sucker Catostomus commersoni
No. Bones
636 324
73 13 36
119 5 1
15 3 6
14 6 1 3 5
18 14
2 2 2 5 1
54 1
97 183 905
1
%
22.45 11.44
2.57 0.45 1.27 4.20 0.17 0.03
0.52 0.10 0.21 0.50 0.21 0.03 0.10 0.17 0.64 0.50 0.07 0.07 0.07 0.17 0.03 1. 91 0.03 3.43 6.45
31. 93 0.03
M.N.I.
23 24 .
9 1
3 12
1 1
2 1 1 2 2 1 1 1 4 3 1 1 1 2 1
3 1
9
13 100
1
Lbs. Meat
8200 2200
235
30 7 2
200 15
8 4 1.6 1
7.5 8 3 1
1.5 0.5
100 15
7.5 67.5 13
200 1
%
72.16 19.36
2.07
.0.26 0.06 0.01
1. 76 0.13 0.07 0.03 0.01 0.008
0.06 0.07 0.02 0.008 0.01 0.004
0.88 0.13 0.06 0.59 0.11 1. 76 0.008
~ o w

Species
Blue Crab Callinectes sapidus Box Turtle Terrapen~ carolina Snapping Turtle Chelydra serpentina Cooter Turtle Chrysemys sp.
Table 45: Continued
No . Bones
186 3
60 40
2834
%
6.56 0.10 2.11 1.41
99.94
Lbs. M.N .I. Meat
42 8.4 1 0.25 2 20 2 6
272 11,363.75
%
0.07 0.002 0.17 0.05
99.93
,j:::.
o ,j:::.
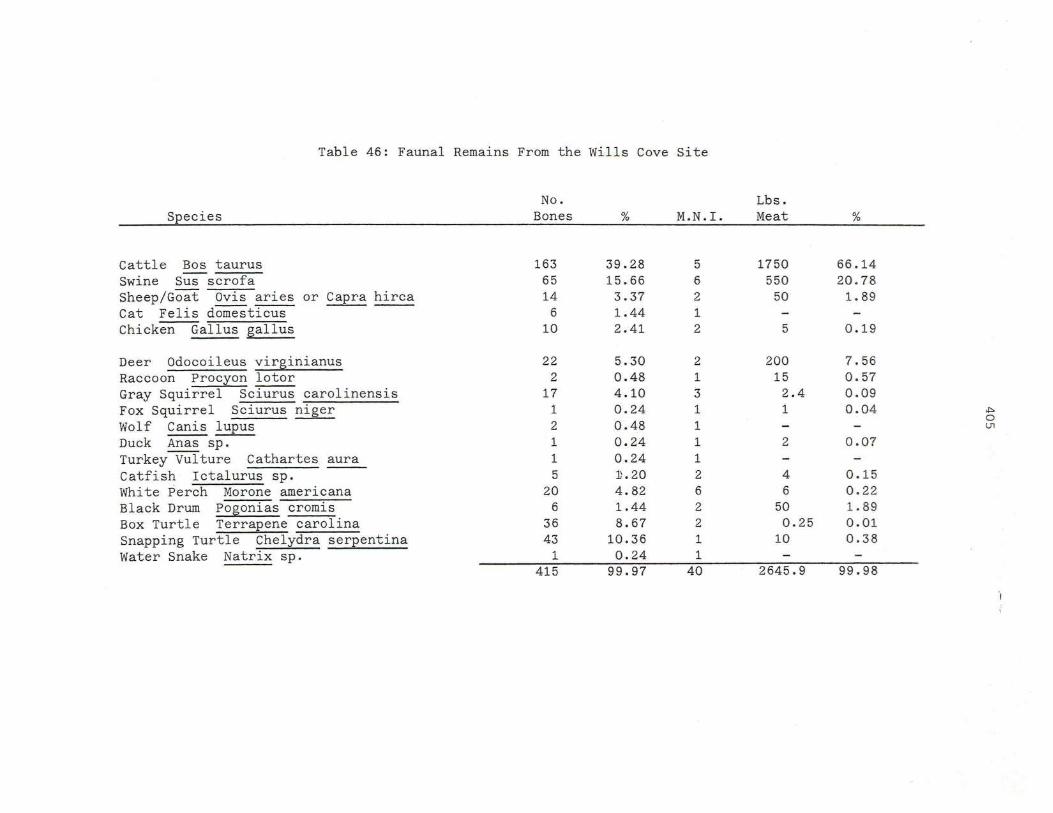
Table 46: Faunal Remains From the Wills Cove Site
Species
Cattle Bos taurus Swine Sus scrofa Sheep/Goat Ovis aries or Capra hirca Cat Felis domest~ -----Chicken--Gallus gallus
Deer Odocoileus virginianus Raccoon Procyon lotor Gray Squirrel ScIUrUS carolinensis Fox Squirrel Sciurus niger Wolf Canis lupus Duck Anas s-p-.---Turkey Vulture Cathartes aura Catfish Ictalurus sp. White Perch Morone americana Black Drum Pogonias cromis Box Turtle Terrapene carolina Snapping Turtle Chelydra serpentina Water Snake Natrix sp.
No. Bones
163 65 14
6
10
22 2
17 1 2 1 1 5
20 6
36 43
1 41 5
%
39.28 15.66 3.37 1.44 2.41
5.30 0.48 4.10 0.24 0.48 0.24 0.24 1).20 4.82 1.44 8.67
10.36 0.24
99.97
M.N.I.
5 6 2 1 2
2 1 3 1 1 1 1 2 6 2 2 1 1
40
Lbs. Meat
1750 550
50
5
200 15 2.4 1
2
4 6
50 0.25
10
2645.9
%
66.14 20.78
1. 89
0.19
7.56 0.57 0.09 0.04
0.07
0.15 0.22 1. 89 0.01 0.38
99.98
.I'> o U1
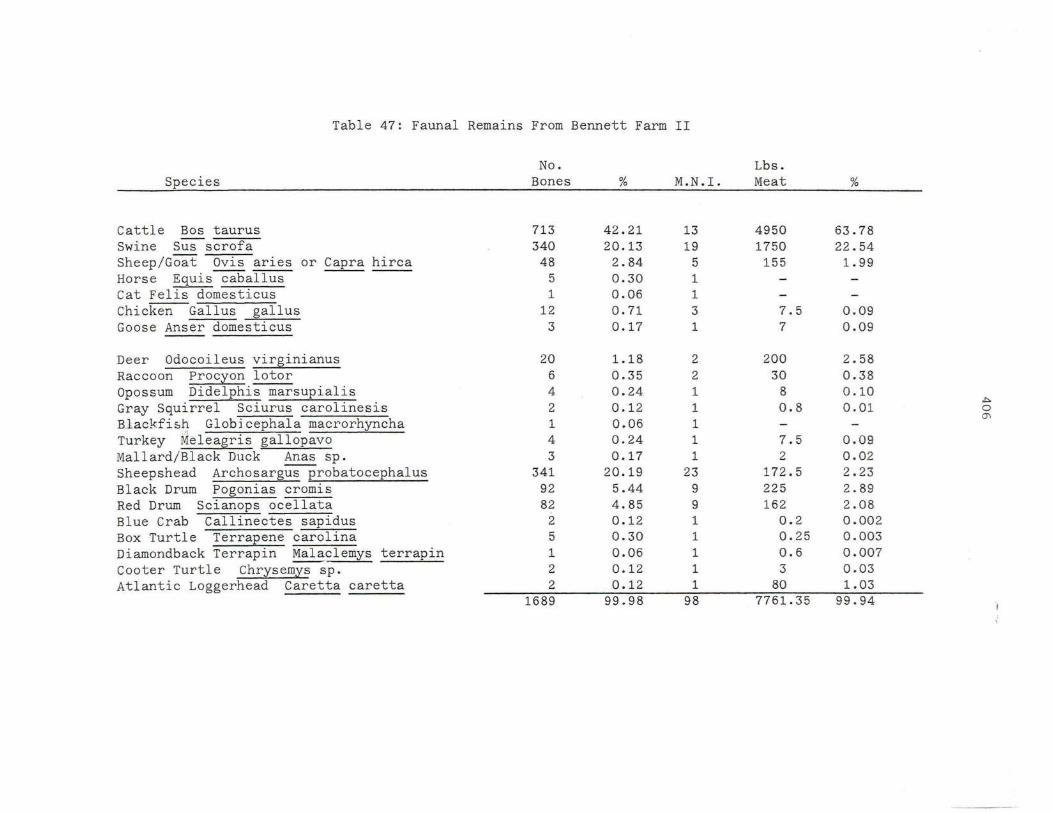
Table 47: Faunal Remains From Bennett Farm II
Species
Cattle Bos taurus Swine Sus scrofa Sheep/Goat Ovis aries or Capra hirca Horse Equis-caba~ -----Cat Felis domesticus Chicken Gallus gallus Goose Anser domesticus
Deer Odocoileus virglnlanus Raccoon Procyon lotor Opossum Didelphis marsupialis Gray Squirrel Sciurus carolinesis Blackfish Globjcephala macrorhyncha Turkey Meleagris gallopavo Mallard/Black Duck Anas sp. Sheepshead Archosargus probatocephalus Black Drum Pogonias cromis Red Drum Scianops ocellata Blue Crab Callinectes sapidus Box Turtle Terrapene carolina Diamondback Terrapin Malaclemys terrapin Cooter Turtle Chrysemys sp. Atlantic Loggerhead Caretta caretta
No. Bones
713 340
48 5 1
12 3
20 6 4 2 1 4
3 341
92 82
2 5 1 2 2
1689
%
42.21 20.13 2.84 0.30 0.06 0.71 0.17
1.18 0.35 0.24 0.12 0.06 0.24 0.17
20.19 5.44 4.85 0.12 0.30 0.06 0.12 0.12
99.98
M.N.I.
13 19
5 1 1 3
1
2 2 1 1 1 1 1
23 9
9 1 1 1 1 1
98
Lbs. Meat
4950 1750
155
7.5 7
200 30
8 0.8
7.5 2
172.5 225 162
0.2 0.25 0.6 3
80 7761.35
%
63.78 22.54 1.99
0.09 0.09
2.58 0.38 0.10 0.01
0.09 0.02 2.23 2.89 2.08 0.002 0.003 0.007 0.03 1.03
99.94
.I::> o (j\
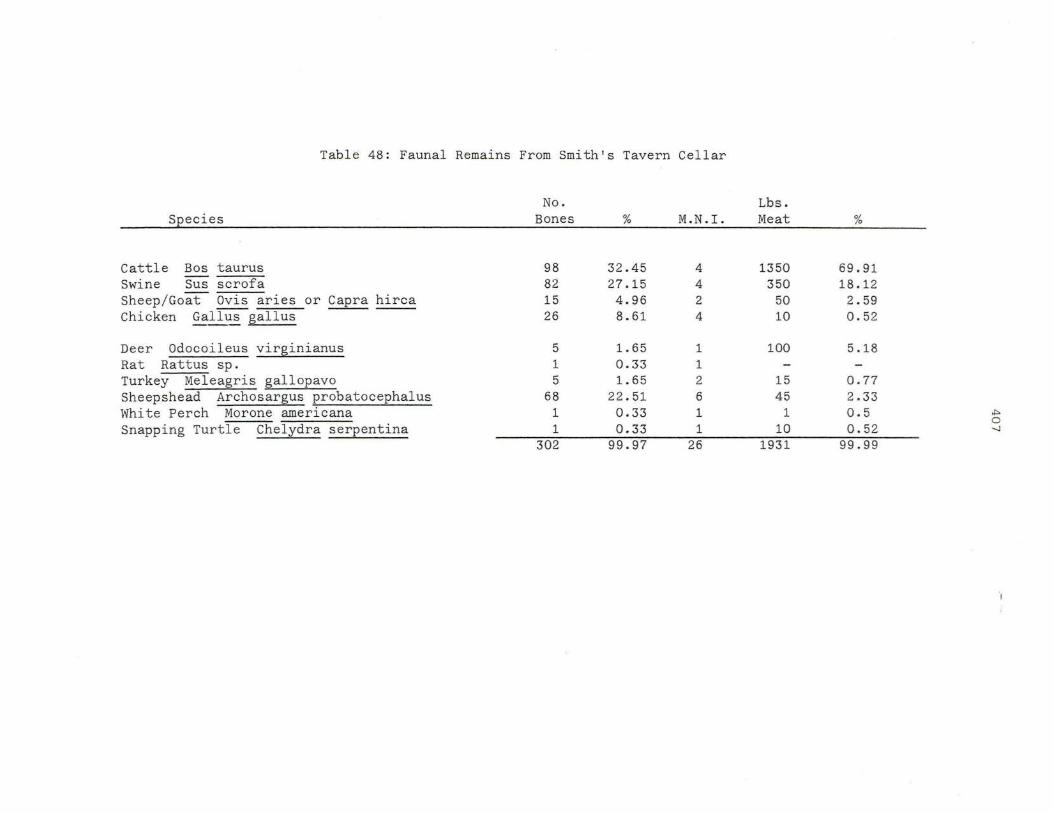
Table 48: Faunal Remains From Smith's Tavern Cellar
No. Lbs. ~ecies Bones % M.N.I. Meat %
Cattle Bos taurus 98 32.45 4 1350 69.91 Swine Sus scrofa 82 27.15 4 350 18.12 Sheep / Goat avis aries or Capra hirca 15 4.96 2 50 2 .59 Chicken Gallus gallus ----- 26 8.61 4 10 0 .52
Deer Odocoileus virginianus 5 1. 65 1 100 5.18 Rat Rattus sp. 1 0.33 1 Turkey Meleagris gallopavo 5 1. 65 2 15 0.77 Sheepshead Archosargus probatocephalus 68 22.51 6 45 2 .33 White Perch Morone americana 1 0.33 1 1 0 . 5 .t:>
Snapping Turtle Chelydra serpentina 0.33 0
1 1 10 0.5 2 -.J
302 99.97 26 1931 99.99

Table 49:
Species
Cattle Bos taurus Swine Sus scrofa Sheep/ Goat Ovis aries or Capra hirca Chicken Gallus gallus -----
Deer Odocoileus virginianus Sheep shead Archosargus probatocephalus Blue Cr8b Callinectes sapidus Ray or Skate Rajidae or Myliobatida~
Faunal Remains From Baker's Tavern
No. Bones % M.N.I.
53 . 44.91 2 29 24.57 2
5 4.24 1 6 5.08 2
1 0.85 1 11 9.32 1 12 10.17 3
1 0.85 1 118 99.99 13
Lbs. Meat
800 200
35 5
100 7.5 0.6 I
1148.1
%
69.68 17.42
3.05 0.43
8.71 0.65 0.05
99.99 .,. o CD
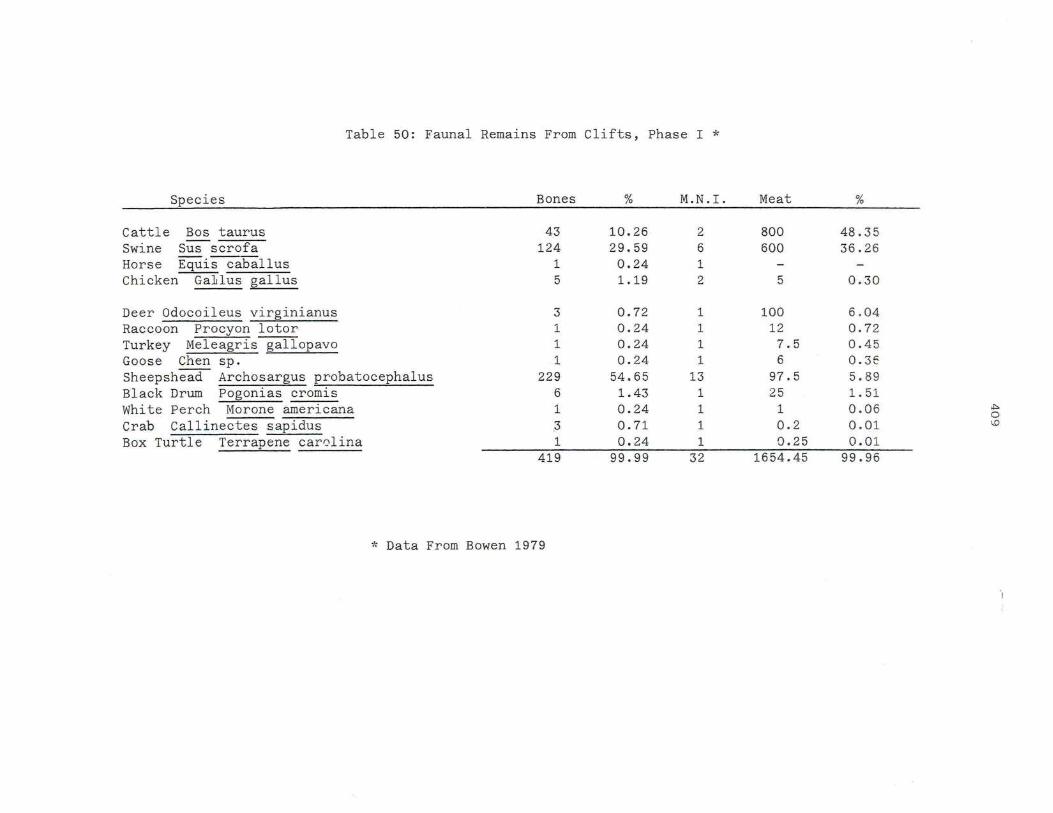
Table 50: Faunal Remains From Clifts, Phase I *
Species Bones % M.N.I. Meat %
Cattle Bos taurus 43 10.26 2 800 48.35 Swine Sus scrofa 124 29.59 6 600 36.26 Horse Equis caballus 1 0.24 1 Chicken~lus gallus 5 1.19 2 5 0.30
Deer odocoileus virginianus 3 0.72 1 100 6 . 04 Raccoon Procyon lotor 1 0.24 1 12 0.72 Turkey Meleagris gallopavo 1 0.24 1 7.5 0.45 Goose Chen sp. 1 0.24 1 6 0.3E Sheep shead Archosargus probatocephalus 229 54.65 13 97.5 5 . 89 Black Drum Pogonias cromis 6 1.43 1 25 1. 51 white Perch Morone americana 1 0.24 1 1 0 . 06 ~
0
Crab Callinectes sapidus ,3 0.71 1 0.2 0 . 01 \.D
Box Turtle Terrapene carolina 1 0.24 1 0.25 0.01 419 99.99 32 1654.45 99.96
* Data From Bowen 1979

Table 51: Faunal Remains From Pettus Plantation
~ecies Bones % M.N .r. Meat %
Cattle Bos taurus 405 57.28 13 4700 65.87; Swine SuS-Scrofa 226 31. 97 21 2000 28.02 Sheep/Goat Ovis aries or Capra hirca: 25 3.54 3 85 1.18 Horse Equis caballus 4 0.56 1 Cat Felis domesticus 2 0.28 1 ChickerlGallus gallus 2 0.28 1 2 .5 0.03
Deer Odocoileus virginianus 21 2 .97 3 300 4.1 9 Raccoon Procyon lotor 6 0.84 1 15 0. 21 Opossum Didelphis marsupialis 3 0.42 1 8 0.11 Rabbit Sylvilagus floridanus 6 0.84 1 2 0.02 .to> Turkey Meleagris gallopavo 2 0.28 1 7.5 0.10 .....
0
Catfish Ictalurus sp . 1 0.14 1 2 0.02 Snapping Turtle Chelydra serpentina 1 0.14 1 10 0.14 Cooter Chrysemys sp. 3 0.14 1 3 0.04
707 99.96 50 7135 99.98

Table 52: Faunal Remains From Utopia
No. Lbs. ~ecies Bones % M.N. I. Meat %
Cattle Bos taurus 556 55.93 16 53 50 67.06 Swine Sus scrofa 232 23.34 22 1950 24.45 Sheep/Goat Ovis aries or Capra hirca 45 4 .53 6 160 2.01 Horse Equis caballus -- --- 35 3.52 3 Dog Canis familiaris 4 0.40 1 Cat Felis dome s ticus 39 3 . 92 2 Chicken Gallus gallus 8 0.80 2 5 0.06
Deer Odocoileus virginianus 22 2.21 3 300 3.76 Raccoon Procyon lotor. 9 0.90 2 30 0.37
Didelphis-IDarsupialis ."
Opossum 3 0. 30 1 8 0.10 I-' I-'
Gray Squirrel Sciurus carolinensis 3 0.30 1 0.8 0.01 Duck Anas sp. 1 0.10 1 2 0.02 Turkey -:Meleagris gallopavo 7 0.70 1 7.5 0.09 Goose Chen sp. 1 0.10 1 7 0.08 sturgeon--Acipenser sturio 4 0.40 1 100 1.25 Longnosed Gar Lepisosteus osseus 5 0.50 2 10 0.12 Striped Bass Morone saxatilis 9 0.90 1 7.5 0.09 Red Drum Scianops ocellata 5 0.50 2 36 0.45 Box Turtle Terrapene carolina 5 0.50 2 0.5 0.006 Cooter Chrysemys sp. 1 0.10 1 3 0.03
994 99.95 71 7977 .3 99 .95
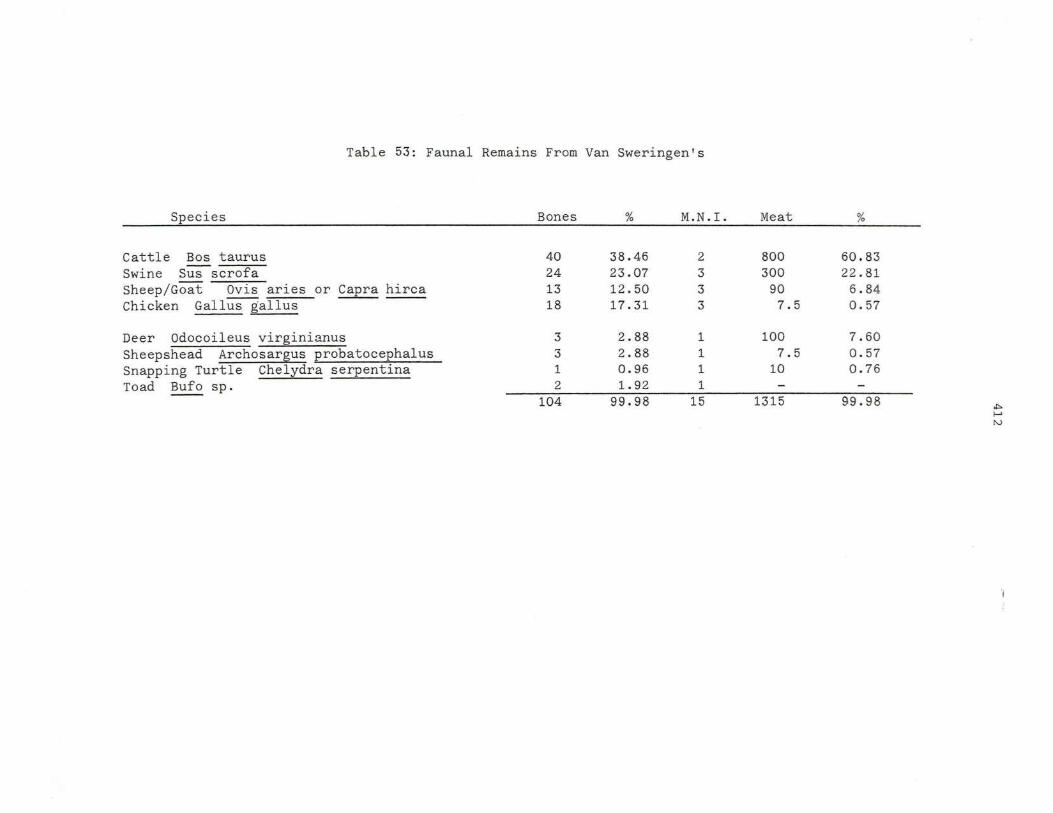
Table 53: Faunal Remains From Van Sweringen's
Species Bones % M.N.I. Meat %
Cattle Bos taurus 40 38.46 2 800 60.83 Swine Sus scrofa 24 23.07 3 300 22.81 Sheep/Goat Ovis aries or Capra hirca 13 12.50 3 90 6.84 Chicken Gallus gallus ----- ----- 18 17.31 3 7.5 0.57
Deer Odocoileus virginianus 3 2.88 1 100 7.60 Sheep s head Archosargus probatocephalus 3 2.88 1 7.5 0 .57 Snapping Turtle Chelydra serpentina 1 0.96 1 10 0.76 Toad Bufo sp. 2 1.92 1
104 99.98 15 1315 99.98 ." I--' ~

Table 54: Faunal Remains From st. John's II
Species
Cattle Bos taurus Swine Sus scrofa Sheep/Goat Ovis aries or Capra hirca Dog Canis farnIIi~ -----Horse Equis caballus Chicken~lus gallus Goose Anser domesticus
Deer Odocoileus virginianus Raccoon Procyon lotor Rabbit Sylvilagus-fIOridanus Opossum Gray Squirrel Sciurus carolinensis Rat Rattus sp. Rodentiea Turkey Meleagris gallop avo Goose Chen sp. Mallard or Black Duck Anas sp. Woodpecker Picidae Sheepshead Archosargus probatocephalus White Perch Morone americana Blue Crab Callinectes sapidus Box Turtle Terrapene carolina Snapping Turtle Chelydra serpentina
Bones
289 194
45 1 1
43 1
25 2 3 2 5
26 6
20 4 4 1
3 3 3
50 8
739
%
39.10 26.26
6.09 0.13 0.13 5.83 0.13
3.39 0.27 0.40 0.27 0.68 3.52 0.81 2.70 0.54 0.54 0.13 0.40 0.40 0.40 6.76 1.08
99.96
M.N .1.
8 15
4 1 1 6 1
3 1 1 1 2 5 1 2 1 2 1 2 1 1 4 1
64
Meat
3350 1300
140
15 7
200 15
2 8 1.4
15 6 4
15 1 0.2 1
10 5090.6
%
65.81 25.53
2.75
0.29 0.14
3.93 0.29 0.04 0.15 0.03
0.29 0.12 0.08
0.29 0.02 0.003 0.02 0.19
99.97
.,. f-> W

Table 55: Faunal Remains From the Clifts, Phase III *
Species Bones % M.N.I. Meat %
Cattle Bos taurus 211 37.67 6 2400 59.95 Swine Sus scrofa 225 40.18 10 1000 24.98 Sheep/Goat Ovis aries or Capra hirca 16 2.85 4 140 3.50 Horse Equis caballus ----- 3 0.53 2 Cat Felis domesticus 24 4.28 2 Chicken--Gallus gallus 11 1.96 3 7.5 0.18
Deer Odocoileus virginianus 54 9.65 4 400 9.99 Raccoon Procyon lotor 1 0.18 1 12 0.30 Goose 2 0.36 1 7 0.17 Longnosed Gar Lepisosteus osseus 11 1.96 1 5 0.09 ..,. Sheep shead Archosargus probatocephalus 1 0.18 1 7.5 0.18 I--' ..,. Black Drum Pogonias cromis 1 0.18 1 25 0.62
560 99.98 36 4003 99.96
* Data From Bowen 1979

Table 56: Faunal Remains From the Clifts, Phase IV *
No. Lbs. ~ecies Bones % M.N.I. Meat %
Cattle Bos taurus 679 47.78 15 6000 67.99 Swine Sus scrofa 549 38.63 23 2300 26.06 Sheep/ Goat Ovis aries or Capra hirca 18 1.26 3 105 1.19 Horse Equis caballus 6 0.42 2 Chicken Gallus gallus 24 1. 69 3 7.5 0.08
Deer Odocoileus virginianus 44 3.09 3 300 3.40 Raccoon Procyon lotor 3 0.21 2 30 0 . 31 Opossum Didelphis marsupialis 2 0.14 1 8 0.09 Gray Squirrel Sciurus carolinensis 7 0.49 2 1.6 0.01 Fox Squirrel Sciurus niger 1 0.07 1 1 0 . 01 Turkey Meleagris gallopavo 8 0.56 3 22.5 0.25 Goose Chen ? 2 0.14 2 12 0 .1 3 Duck Anas sp.? 6 0.42 2 4 0 . 04 .!»
I-'
Bobwhite Colinus virginianus 5 0.35 5 2.5 0.02 V1
Passenger Pigeon Ectopistes migratorius 1 0.07 1 0.5 0.005 Corvidae 1 0.07 1 Sheep shead Archosargus probatocephalus 13 0.91 2 15 0.17 white Perch Morone americana 13 0.91 2 2 0.02 Yellow Perch Perca flavescens 1 0.07 1 1 0.01 Striped Bass Morone saxatilis 2 0.14 1 7.5 0.08 Sciaenidae 1 0.07 1 9.6 0.11 Blue Crab Callinectes sapidus 34 2.39 7 1.4 0.01 Box Turtle Terrapene carolina 1 0.07 1 0.25 0.002
1421 99.95 84 8831. 35 99.99
* Data From Bowen 1979

Table 57: Faunal Remains From Drummond, Phase III
No. Lbs. ~ecies Bones % M.N.I. Meat %
Cattle Bos taurus 201 39.64 6 1900 60.99 Swine Sus scrofa 199 39.25 9 900 28.89 Sheep/Goat Ovis aries or Capra hirca 23 4.54 3 105 2.07 Horse Equis caballus ----- ----- 3 0.59 2 Chicken Gallus gallus 12 2.37 3 7.5 0.24
Deer Odocoileus virginianus 2 0.39 1 100 3.21 Opossum Didelphis marsupialis 1 0.19 1 8 0.25 Rabbit Sylvilagus floridanus 2 0.39 1 2 0.06 Turkey Meleagris gallopavo 14 2.76 2 15 0.48 Duck Anas sp. 4 0.79 1 2 0 . 06 Canada Goose Branta canadensis 5 0.99 2 12 0 . 38
~ f-"
Teal Anas sp. 2 0.39 1 1 0. 03 (j\
Owl Strix varia 1 0.19 1 Sturgeon--Acipenser sturio 3 0.59 1 100 3 . 21 catfish Ictalurus sp. 4 0.79 1 2 0.06 Box Turtle Terrapene carolina 29 5.72 2 0.25 0 . 008 Mud Turtle Kinosternon sp. 2 0.39 1
507 99.97 38 3154.75 99.94

Table 58: Faunal Remains From Bray Plantation
Species No.
Bones % M.N.I. Mg~t %
Cattle Bos taurus 104 40.62 4 135-0 60.15 Swine Susscrofa 96 37.50 6 550 24.51 Sheep/Goat Ovis aries or Capra hirca 22 8.60 3 105 4.67 Horse Equis caballus 1 0.39 1 Cat Felis domesticus 1 0.39 1 Chicken--Gallus gallus 6 2.34 2 5 0.22 Goose Anser domesticus 6 2.34 2 14 0.62 Dove columbidae 1 0.39 1 0.4 0.01
Deer Odocoileus virginianus 6 2.34 2 200 8.91 Turkey Meleagris gallopavo 1 0.39 1 7.5 0.33 >I:>
f-'
Gray Fox Uroycon cinereoargenteus 1 0.39 1 -.-J
Gray Squirrel Sciurus narolinensis 3 1.17 2 1.6 0.07 Hawk Buteo sp. 1 0.39 1 Box Tur~ Terrapene carolina 4 1. 56 1 0.25 0.01 Snapping Turtle Chelydra serpentina 3 1.17 1 10 0.44
256 99.98 29 2244.15 99.94

APPENDIX II
Estimated Me at Weights of Species
Estimating the amount of meat provided by animals is an
integral component of the analytic process in faunal studies.
In the following section, the weights of animals used in this
study are presented. These weights were arrived at through
consultation of a wide variety of information sources with
many pertaining specifically to the Chesapeake region. The
average meat weights contributed by wild animals were
compiled from the following sources:
Bailey 1946; Patton 1947; Taylor 1965.
Cleland 1966;
Mammals
Cleland 1966; Hamilton 1963; Handley and Llewellyn and Handley 1945; Paradiso 1969;
Birds
Kortright 1943; Mosby 1943; Schorger 1973.
Goode 1903; Hildebrand and Schroeder 1928; McClane 1965; Menzel 1943; Richards 1973; Schwartz 1961, 1962a, 1964; Simmons and Brewer 1962; Truitt, Bean and Fowler 1929.
Turtles
Babcock 1971; Cleland 1966; Schwartz 1962b.
In addition to these published references, information
regarding fish and waterfowl was also obtained from hunters
and commercial fishermen in the Chesapeake area.
For domestic animals, determining the average weights is
a more difficult task because data regarding 17th Century
418

419
livestock is not readily available. Modern livestock weights
are inappropriate because these animals are significantly
improved when compared to 17th Century livestock. The larger
size of modern animals is due to several centuries of
control led b reeding and maintenance on a d iet nutritionally
superior to that of colonial li vestock. Because of this
problem, it is necessary to review the limited his t o ri ca l
information regarding livestock sizes and meat yields.
One of the most well known early statements regarding
the average weights of slaughtered animals is Gregory Ki ng's
estimate for London in 1710. King wrote that cattle averaged
370 pounds, calves 50 pounds, sheep 28 pounds, and lambs 18
pounds (Rice 1942:21); he was apparently referring to dressed
weights. A late 17th Century Irish account gives a live
weight of 700 to 800 pounds for a fully grown ox (Trow-Smith
1957: 240), which would yield a dressed weight of 400 to 500
pounds. Utilizing 16th and 17th Century cattle weights from
various locations in Western Europe, an average dressed
weight of 400 pounds can be calculated (Lois Carr: Personal
Communication 1982). This is supported by data from New
England where Bidwell and Falconer (1925: 108) estimate that
the average dressed weight of old cows and oxen was 400 to
500 pounds during the 18th Century. From Pennsylvania in the
1730s, the average dressed weight of 9 slaughtered steers and
cows was 412 pounds and they ranged in size from 337 to 507
pounds (Lemon 1967:63). Based upon this and other 18th
Century Pennsylvania data, Lemon (1972:153) estimates that
450 pounds of meat was an average for cattle. Hence, 400

420
pounds seems to be a reasonable average for the free ranging,
p oo rly tended cattle in the 17th Century Chesapeake.
While s uch a weight is probably a good approximation for
mature animals, it is obviously much too high for calves or
i nm a tu r e beas t s . Th e r efo r e, a weight of 5 0 pounds i s
emp l oyed for very young c al v es ( wi t h unfuse d b ones and only
slightly worn d e c i dious t ee t h ). A weight of 150 pounds is
us e d for inmatu r e cattl e les s tha n two years old (Animal s
with worn decidious teeth and pa r tially fu s ed bones). By
dist i nguishing where possible between calves , inma ture
cattle, and matur e cattle, consumption of younger animals c a n
be recognized and a more accurat e estimate of the total
amount of beef available can be achieved. Since livestock
slaughter is controlled by human action, this permits the
selection and usage of veal or young beef to be accounted for
in the overall evaluation of an assemblage.
Information regarding sheep weights is more difficult to
obtain. For 18th Century New England, a dressed weight of 10
to 15 pounds per quarter is estimated by Bidwell and Falconer
(1925:110). Lemon (1972:153) gives an estimate of 50 pounds
as an average live weight for sheep in 18th Century
Pennsylvania, which would convert to about 30 pounds dressed.
Given this range, an average of 35 pounds is used for
calculations in this study. Information regarding lambs is
even more scarce but an estimate of 15 pounds may be a good
approximation .
Information on swin e weights is somewhat more available.

421
An early reference to swine weights is found in a 1612
English farm account book (Trow- Smith 1957:251) in which the
effects of fattening the animals on beans and peas is
discussed. In this experiment, the animals weights increased
significantly with the best h o g finishing off at 140 pounds
dressed carcass weight. Th is permits the inference that the
average British hog weighed s ub stantially less. Swine weight
f igures from the 17th Cen tury Chesapeake are found in a
number of documen t s and these references give an average of
109 pounds per animal (Loi s Carr: Personal Communication
1982). Two farm accounts from 18th Century Virginia h ave
also been located and they provide comparable data. In
February of 1760, George Washington slaughtered 15 hogs. The
dressed weights of these animals indicate an average weight
of 107 pounds with a range between 70 and 142 pounds
(Washington 1925:123). From the plantation of Garrett inor,
the weights of 41 swine slaughtered between 1771 and 1774 are
available. The mean dressed weight of these animals was
96.29 pounds with a range from 65 to 140 pounds (True 1976).
These figures suggest that a weight of 100 pounds is a
reasonable estimate for swine. Since some of these animals
may have been selected for slaughter while young, however, an
effort has been made to account for this. Where it was
possible to determine that a swine was less than one year of
age, usually on the basis of dentition, a weight of 50 pounds
was utilized.
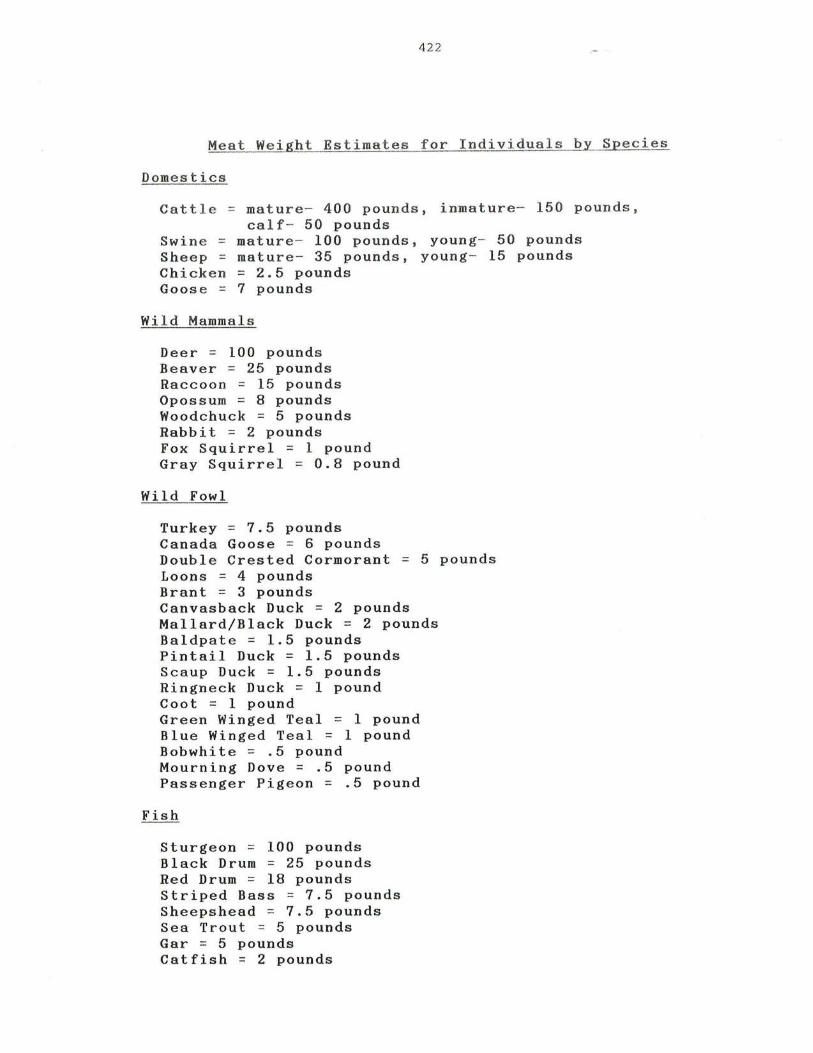
422
Meat Weight Estimates for Individuals by Species
Domestics
Cattle = mature- 4 00 pounds, inmature- 150 pounds, calf- 50 pounds
Swin e = mature - 100 pounds, young- 50 pounds Sheep = mature- 35 pounds, young- 15 pounds Ch icken = 2.5 pounds Goo se = 7 pounds
Wild Mammals
Deer = 100 pounds Beaver = 25 pounds Raccoon = 15 pounds Opossum = 8 pounds Woodchuck = 5 pounds Rabbit = 2 pounds Fox Squirrel = 1 pound Gray Squirrel = 0.8 pound
Wild Fowl
Turkey = 7.5 pounds Canada Goose = 6 pounds Double Crested Cormorant = 5 pounds Loons = 4 pounds Brant = 3 pounds Canvasback Duck = 2 pounds Mallard/Black Duck = 2 pounds Baldpate = 1.5 pounds Pintail Duck = 1.5 pounds Scaup Duck = 1.5 pounds Ringneck Duck = 1 pound Coot = 1 pound Green Winged Teal = 1 pound Blue Winged Teal = 1 pound Bobwhite = .5 pound Mourning Dove = .5 pound Passenger Pigeon = .5 pound
Sturgeon = 100 pounds Black Drum = 25 pounds Red Drum = 18 pounds Striped Bass = 7.5 pounds Sheepshead = 7.5 pounds Sea Trout = 5 pounds Gar = 5 pounds Catfish = 2 pounds

Sucker = 1 pound White Perch = 1 pound Yellow Perch = 1 pound Toadf ish = .5 pound Crab = .2 pound
Turtles
423
Atlantic Loggerhead = 80 pounds Snapping Turtle = 10 pounds Cooter = 3 pounds Diamond Back Terrapene = .6 pound Box Turtle = .25 pound Painted Turtle = .25 pound.

Appendix III
Seasonal Indicators in the Chesapeake Region
The te mperate cl imate of the Chesapeake region displays
ma rke d seasonal variation and, consequently, t h e availability
of animal species also varies. Th is fact is of significance
to the archaeologist becaus e it provides a mean s of
evaluating seasonal changes in human subsistence activities.
Through the us e of various indicator s pecies, it is often
possible to determine the season of site occupation and/o r
the periods during which features were filled. In thi s
section, data will be presented regarding the chief seasonal
indicators found to be of utility in the Tidewater Chesapeake
region. The principle animal groups are migratory fowl,
fish, and reptiles along with crab and deer.
The migratory fowl commonly found in colonial sites
tend to be water oriented. The location of the Chesapeak e on
the Atlantic Flyway means that a huge variety of birds
migrate through the region in the spring and fall periods. A
few fowl begin to appear in the region during late February
and the peak time of spring migration is from early March to
mid-April. Nearly all of the birds depart by the middle of
May. Fall migrants begin to appear in early September (the
Pintail, Gadwall and Teals), but most start arriving in early
October . Peak migration occurs from late October to th e end
of November. During the winter, water fowl leave the
Chesapeake, with the exception of Loons, Teals, and a few
424

425
Coots, Canada Geese, and Mallard Ducks .
Of the t e rrestrially based bir d s, the Passenger Pige o n
is one of the best indicators because their migrati on was
primar il y dur i ng t h e October - November period. On their
no r thward migration in the spring, most of the Passenger
Pigeons apparentl y took a mor e we sterly route, beyond the
Chesapeake region ( Schor ger 1973:268).
To s ummariz e t h e dat a re garding the major bird species ,
their availability periods are graphically presented in
Figure 39. Information used in constructi ng th is figu re
derive s from the fo llowin g sources: Lipp s on, et al 1979;
Robbins and Van Velzen 1968; Rives 1890 ; Schorger 1973; a nd
St e wart 1962. It should be noted that these availability
dat es are ave rages. The exact p eri od o f availability tends
to vary slightly from yea r to year and may differ by as much
as one month between the southern and northern ends of the
Chesapeak e.
Th e seasonal availabil ity of fish in the Chesapeak e is
dir ect ly related to water temp e rature . Many of the specie s
ex ploited by the colonists are migrants that e nter the Bay
during April, wh e n the water warms, and r e main until October
or early November, wh e n they depart for the Atlantic. Among
these species ar e the Black Drum, Herring, Red Drum, Shad ,
Sheep s h ead, Sea Tro ut, and Sturgeon. Estua r in e species such
as Whit e Perch, and Striped Bas s remain in the Chesapeak e
during the winter but th e y move to de eper , warm er water wh e r e
they are difficult to obtain. Some fresh to brackish wat e r

Jan Feb Mar Apr May J un Jul Aug Sep Oc t Nov De c
Baldpate
Brant
Blue Wing Teal .................... .... .. _------- --1 ____ --...... .. ... .. .
Canada Goose ................. .... ---11 .... - ~---I--- ....... .......
Coo t ........ .................. ------Double Cres t ed Cormorant ................................ ----~ ....... ---- .. .. ..... .. ..... .
Gadwall
Gre en Wing Teal ............ .......... .....:-.. ........ ....:-Loon
Mallards ................... --_1--- -----... - . .....
Mergansers
Osprey
Passenger Pigeon
Pintai l
Redhead
Ringneck
Ruddy Neck
Scaups I
Swan
Widgeon
wood Duck I I I I ~
Availability : ......... ... Sporadic Pre s en t _ Abundant
Fig ure 39: Avai l ability Periods of Common Wildfowl i n t he Chesapeake .
.I:> :v 0-,
Ii
42 7
species, such as s uck ers can be obtained throughout mos t
of the year. Catfish can be taken from Ma rch to mid-
Nov e mb er but during the c oldest months, they eat very little
and apparently e nter a state of semi-hibernation (Menzel
1 943:22) . Still another aquatic animal of importance is the
Blue Crab. Crabs becom e activ e in late Apri l o r early May
and can be obtained till the end of Oct ob er , when they
hibernate.
I nformati o n rega r ding the availabi l ity of some majo r
fish species in the Chesapeake is graphically s ummarized i n
Figure 40. The data used to construct this comes from the
f ollowing sou rces: Hildebrand and Schroeder 1928 ; Hoagman ,
et al 1974; Lippson, et al 1979 ; Ma nsueti 1961 ; Men zel 1943;
Quittmeyer and Andrews 1966; Richards 1973; Schwartz 1961,
1962a; and Truit t 1939.
Snakes and turtles are also of importance in seasonal
determination because they hib er nate during the winter
period. Most emerge in late Mar c h and April and remain
active until th e end of October (Hardy 1972; Hardy and
Mansueti 1962; McCauley 1945; Mitchell 1974; Schwa r tz 1962b).
Hence, they hibernate for approximately five months of th e
year and should be excellent s ea sonal indicators.
Unfortunately, human activities can invalidate the use of
turtles for s easonal det erminat i on. This is because it i s
possible to obtain snapping turtles, cooters and other
species during the winter by locating them in the mud by
probing and collecting the hibernating animals by hand o r
with tongs. This was c ommon in Maryland until recently
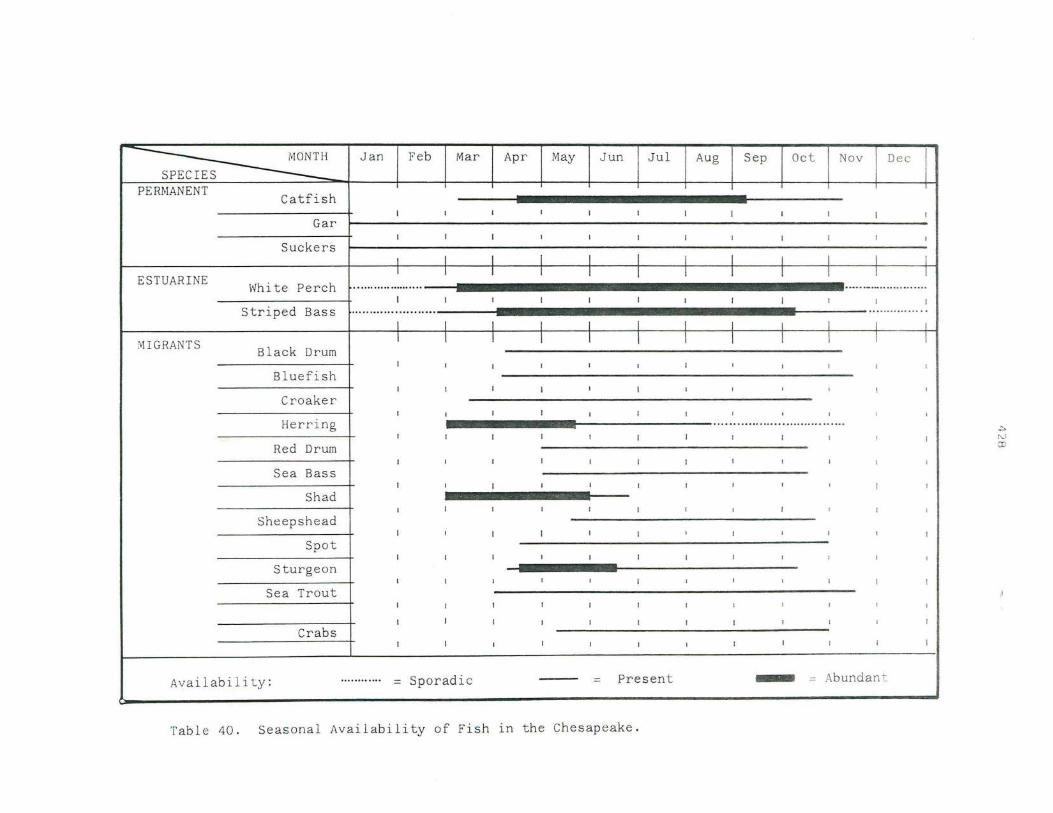
~1 Jan Feb Mar Apr May J un Ju l SPEC IES
PERMAN ENT Catfish
I 1 1 1 I I
Gar I I I 1 1 I
Suckers I I I I I I
ESTUARINE I I I I I
White Perch . .......... ....... ... I I 1 I I I
Striped Bass ... ...... ..... ... ....... I I I I I I
MIGRANTS I I I I I I Black Drum
I 1 I 1 1 , Bluefi s h
I I 1 I 1 I
Cr oaker I 1 I I , I
Herring I I I I I I
Red Drum I , I I I I
Sea Bass I , I , , I
Sh ad I I I I I I
Sheep s head I , I I I ,
s pot I I I , I I
St urge on , I , , , I
Sea Trout I I I I I I
I I , I I I
Crabs I I I I I I
Availabi l i 1:Y : .... .... ... . = Sporad ic --- = Pre sent
Tab le 40 . Se as ona l Av ail abili t y of Fish i n the Che sapeake .
I
I
I I
1
I I
I
1
I
I
I
I
, ,
I
,
I
I
,
Aug Sep Oc t Nov Dec
I I I I I
1 I I I 1
I I I I I I I I I I
. ... .. _ .......... ... ... .. I I I I I
... ..... ... ... ..
I I I I I
I I I 1 I
, , 1 I 1
, , , I ,
, , , , , .... .. ... ....... ..... .. ....... . ....
, I I I I
I , I I , , I I I , , , I I , , , , ,
I
I I I I , , , I I I
: I I , , I I I I I
I I I , I
- = Abundant
.;:, N CD
429
(McCauley 1945:50; Silas Hu rry: Personal Communication 19 7 8),
a n d it may be a colonial or perhaps even a pre- colonial
practice. Thus, while turtles may indicate a warm weather
d ep osition period, t h is cannot be automatically ass um ed a n d
turtl e remai n s are b est c o nsi d er ed sup po r t in g data ra the r
t han a p r imary ind i c ato r of seasona lity.
Anoth e r valuabl e s pecies is t he Wh i t e Ta iled Deer. Th e
antlers o f t h e mal e unde rg o a n a nnual s equenc e o f growth an d
loss and thu s , th e condi ti on of antlers found in
archaeologic a l s i t es can pr o v i d e a n i mpo rt ant clue to the
season in which the deer wa s k i lled. Thi s s equence has been
studied by Wis l ocki ( 1942 ) who f ound that growth o f the
antler begins in late Mayor early June. In early July, the
bas e of the antle r begins to calcify and ful l growth and
calcification is achieved by late September. Dat a from
Virgini a (Mirarchi, et al 1973) indicates that most deer shed
their antlers between late December and late January. Hence,
the recovery of a deer skull or antlers can permit some
assessment of the period during which the animal was killed.
By carefully utilizing these indicato r species along
with other data, it is possible to estimate the season in
which bone deposits were created. In th e following section,
faunal assemblages from features utilized in this study are
presented along with the estimated f il l p e riods and evidenc e
for this. Common names are utilized to reduce the space
required and permit the s e asonal e s t imat e to appear on th e
same page with the data.

430
Table 59: Kingsmill Tenement : Fe ature 154
No . Lbs. Animal Bones % M. N. I. Meat %
Cattle 2 1. 54 1 400 45.67 Swine 16 12. 30 2 150 17.13 Ch i ck en 5 3.84 1 2.5 0.2 8
Dee r 5 3.84 2 200 22.84 Raccoo n 14 10 . 77 4 60 6 .85 Opossum 7 5.38 2 16 1. 83 Rabbi t 2 1. 54 1 2 0.23 Gray Squirrel 1 0.77 1 0.8 0.09 Turkey 1 0.77 1 7.5 0.85 Bullhead Catfish 14 10.77 3 6 0.68 Catfish 6 4.61 1 2 0.2 3 White Perch 12 9.23 3 3 0.3 4 Sea Tr out 1 0 . 77 1 5 0.57 Box Turtl e 9 6.92 2 0.5 0 . 05 Snapping Turtle 16 12.30 2 20 2.28 Musk Tur tle 11 8.46 1 Crab 8 6.15 2 0 . 04 0 . 04
Total 130 99.96 30 875.7 99.96
Estimated Deposition Period: Summer
Evidence: Crabs are present which indicates a May to November fill period. The sea trout is a marine species that would not be found far up the James River until the summer when water salinity had risen well above the low springtime levels. Catfish and Perch are well represented. Finally, thre e species of turtles are present and multipl e individuals h a ve been identified of two of thes e.

431
Table 60: Kingsm ill Tenement : Feature 369
No . Lbs. Animal Bones % M. N. I. Meat %
Cattle 13 16.45 1 400 40.60 Sw ine 32 4 0 .50 2 200 20.30 Sheep/Goat 1 1. 26 1 35 3.55 Ch icken 4 5.06 1 2.5 0.25
Deer 5 6.33 2 200 20.30 Raccoon 4 5.06 2 30 3 . 04 Opossum 2 2.53 1 8 0.81 Branta 1 1. 26 1 3 0 . 30 Duck 2 2.53 1 2 0.20 Sturgeon 5 6.33 1 100 10.15 White Perch 1 1. 26 1 1 0.10 Crab 2 2.53 1 0 .2 0 . 02 Box Turtle 5 6.33 1 0.25 0.02 5 Cooter 1 1. 26 1 3 0 . 30 Painted Turtle 1 1. 26 1 0.25 0.02
Total 79 99.95 18 985.2 99.96
Estimated Deposition Period: Spring to Summer
Evidence: Migratory water fowl are present. Brants are available from late February to Mid-April and late October to early December. A few crab claws are also present and they indicate a May to November deposition. Remains of sturgeon were recovered, a species which appears in April and remains until September. From the accounts of John Smith, the sturgeons were most abundant in April and May along the James.

432
Table 61 : Kingsmill Tenem en t: Feature 393
No. Lbs. Animal Bone s % M. N. I. Meat %
Cattle 174 41.72 5 15 00 42.62 Swine 169 40.52 17 1600 45.46
Deer 36 8.63 3 300 8.52 Beaver 15 3.60 3 75 2.1 3 Raccoon 7 1. 68 2 30 0.85 Gray Squirrel 1 0. 24 1 0.8 0 . 0 2 Hawk 9 2.15 1 Box Tur tle 2 0.48 1 0.25 0.007 Cooter 2 0.48 1 3 0.08 Snapping Tu rtle 2 0 . 28 1 10 0.28
Total 417 99.98 35 3519.05 99.97
Estimated Deposition Period: Fall to Winter
Evidence: There is an almost total absence of fish and migratory bird remains. Only turtles are presen t but their value as a seasonal indicator has been questioned. The recovery of a minimum of three beaver in the pit is suggestive of a late fall or winter deposit. It is likely that they were trapped for their fur and the pelt is of best quality during the late fall and winter.
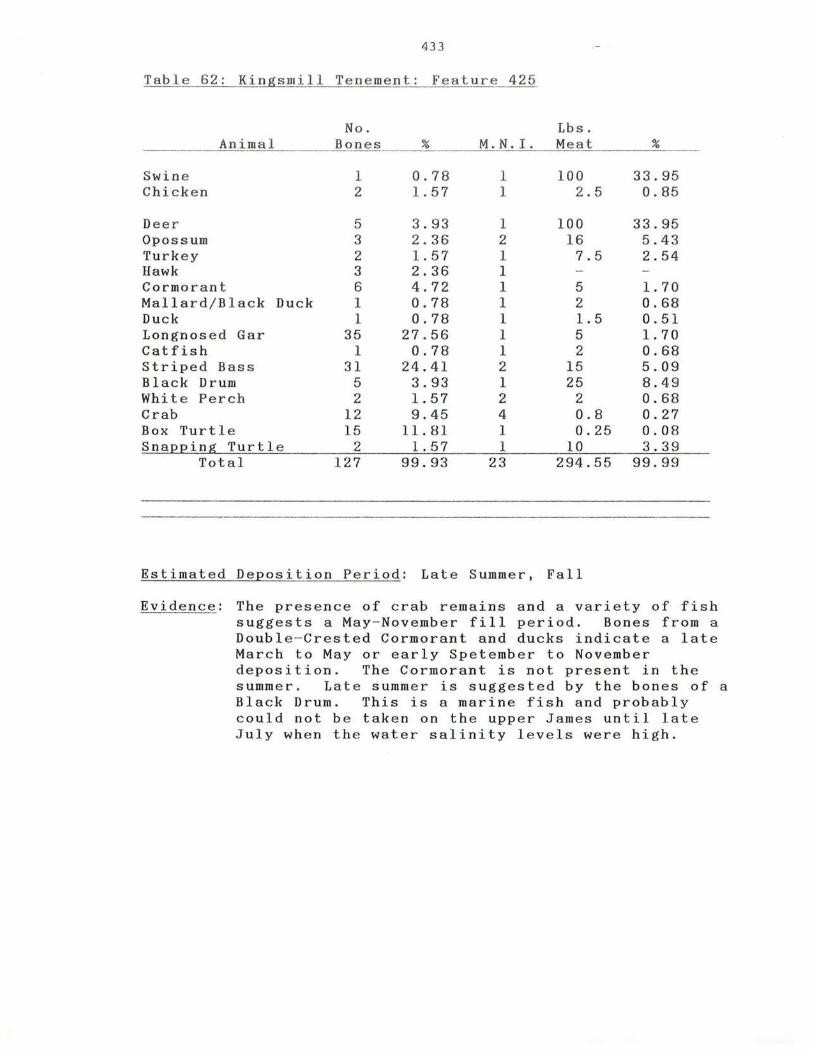
433
Table 62: Kingsmill Tenement: Feature 425
No. Lbs. Animal Bones % M. N. I. Meat %
Swin e 1 0.78 1 100 33.95 Chicken 2 1. 57 1 2.5 0 .85
Deer 5 3.93 1 100 33.95 Opossum 3 2.36 2 16 5.43 Turkey 2 1. 57 1 7. 5 2.54 Hawk 3 2.36 1 Cormo rant 6 4.72 1 5 1. 70 Malla r d/B lack Duck 1 0.78 1 2 0.68 Duck 1 0.78 1 1.5 0.51 Longnosed Gar 35 27 . 56 1 5 1. 70 Catfish 1 0.78 1 2 0.68 Striped Bass 31 24.41 2 15 5.09 Black Drum 5 3.93 1 25 8.49 Whit e Perch 2 1. 57 2 2 0.68 Crab 12 9.45 4 0.8 0.27 Box Turtl e 15 11.8 1 1 0.25 0.08 Snapping Turtle 2 1. 57 1 10 3.39
Total 127 99.93 23 294.55 99.99
Estimated Deposition Per iod : Late Summer, Fall
Evidence: The presence of crab remains and a variety of fish suggests a May - November fill period. Bones from a Double - Crested Cormorant and ducks indicate a late March to Mayor early Spetember to November deposition. The Cormorant is not present in the summer. Late summer is suggested by the bones of a Black Drum. This is a marine fish and probably could not be taken on the upper James until late July when the water salinity lev e ls were high.

434
Tab le 6 3: Kingsm i l l Te n e me n t: Fea tu re 430
No. Lb s. Animal Bon es % M. N. I. Mea t %
Cat t l e 44 95. 66 3 1 200 92 . 30 Swine 2 4 . 34 1 100 7.70
Total 46 100.00 4 1300 100.00
Estimated Depostion Period: Winter?
Evidence: The total absence of bird, fish and turtle bone is notable. Examination of the bones does not suggest preservation is a problem here.

43 6
Table 64: St. John's: Feature 50M/50P
No. Lbs. Animal Bones % M. N. I. Meat %
Cattle 8 1 20.56 3 950 53.00 Swine 56 14.21 3 3 00 16.74 Sheep/Goat 3 0.76 1 35 1. 95 Ch icken 1 0 . 25 1 2.5 0.14
Dee r 86 21.82 4 4 00 22.31 Raccoon 1 0.25 1 15 0 . 83 Canv asback Duck 1 0.25 1 2 0 .11 Duck 1 0 . 25 1 Mourn i ng Dove 1 0 . 25 1 0.5 0 . 02 Passenger Pigeon 1 0.25 1 0.4 0.02 Red Tailed Hawk 2 0.51 1 Sheepshead 121 30.71 9 67.5 3 . 76 Red Drum 1 0.25 1 18 1. 00 Box Turtl e 37 9.39 1 0.25 0.01
Total 394 99.96 29 1792.65 99 . 97
Estimated Deposition Period: Late Summer to Early Winter
Evidence: The large quantity of Sheepshead bones along with the remains of a Red Drum indicate a May to October deposition. Three types of ducks were also found and they are generally available in March-April and October to December of the year. Of particular importance is the fact that the Canvasback duck does not appear in the Chesapeake area until late October and is only common from mid - November to mid December. One bone from a Passenger Pigeon was recovered and this species was generally only available during the fall period. Analysis of oyster shell growth lines indicates that most of oysters in this pit were collected during the fall. Finally, a deer skull in the feature had a fully developed antler, still firmly attached to the cranium. This indicates that the animal was killed between Septembe r and lat e January.

437
Table 65: St. John's : Featu re 55C,55G
No. Lbs. Animal Bones % M. N. I. Mea t %
Cattle 2 2.08 1 400 47. 73
Deer 10 10. 42 4 400 47.7 3 Snow Goose? 2 2. 08 1 6 0.7 2 Sheepshead 78 81 . 25 4 30 3.58 Wh ite Perch 4 4.16 2 2 0.24
Total 96 9 9 .99 12 838 100.00
Estimat ed Depos ition Date : Spr ing, earl y Summer
Evidenc e : An abundance o f sheepshead bones were recovered from t his feature. Analysis of fish scales by David A. Singer indicates that they were taken during the Sp rin g, probably May- June. The bones of a wild goose suggests a Spring or Fall deposit. Finally, analysis of the oyster shell growth lines by Bretton Kent reveals that the oysters were mostly collected during the spring.

438
Table 66: Pope's Fort: Strata 1222 P and N
No. Lbs. Animal Bones % M. N. I. Meat %
Cattle 96 18 . 46 3 950 48.91 Swine 42 8.07 3 200 10.29 Horse 9 1. 73 1 Chic ken 14 2.69 2 5 0.25
Deer 88 16.92 5 500 25.74 Raccoon 5 0.96 1 15 0 . 77 Gray Squirrel 4 0.77 2 1.6 0.08 Turkey 9 1. 73 2 15 0.77 Canada Goos e 3 0.58 1 6 0.3 1 Redhead Duck 7 1. 34 1 2 0.10 Blue Wing Te al 7 1. 34 2 2 0.10 Mallard/Blac k Duck 10 1. 9 2 2 4 0 .2 0 Scaup Duck 3 0.5 8 1 1.5 0.07 Pintail Duck 2 0 . 38 1 1.5 0 . 07 Duck 10 1. 92 Sturgeon 1 0 .19 1 100 5.15 Sheepshead 15 9 30.58 13 97.5 5. 0 2 Striped Bass 2 0.38 1 7.5 0.38 Black Drum 11 2.1 1 1 25 1. 28 Longnosed Gar 13 2.50 1 5 0.25 White Perch 2 0.38 2 2 0.10 Toadfish 1 0.19 1 0.5 0.02 Crab 16 3.07 4 0.8 0.04 Box Turtle 6 1. 15 1 0.25 0.01
Total 520 99.94 51 1942.15 99.91
Estimated Deposition Period: Summer, early Fall
Evidence: The abundant Sheepshead remains, bones of Black Drum, and crab claws all suggest a May to October period of deposition. Six types of migratory waterfowl are also present, indicating a spring or fall period. Two of these, the Blue Wing Teal and the Pintail are the earliest appearing waterfowl, arriving in lat e August , a full month before most of the others . Study of the oyster shell growth lines suggests that mos t were harvested in the fall period.

4 39
Table 67: Benn ett Farm I: Feature 28A
No . Lbs. Ani mal Bones % M. N. 1. Meat %
Ca t tle 3 0 5. 05 2 5 50 3 7 .1 5 Sw ine 54 9. 0 9 4 4 00 27. 0 2 Chick en 1 0 .1 7 1 2 .5 0. 17 Goo se 1 0. 17 1 7 0. 4 7
Deer 12 2. 0 2 1 100 6. 75 Gr ay Fox 5 0 . 84 1 Opo s sum 1 0 . 17 1 8 0.5 4 Sheepshe a d 41 2 69.36 34 255 17 . 22 Black Drum 13 2.18 2 50 3.38 Red Drum 65 10.94 6 108 7.29
Total 594 99.99 52 1480.5 99.9 9
Estimated Deposition Period: Summer
Evidence: The predominance of migratory fish in the assemblage and the absence of any spring or fal l indicator species.
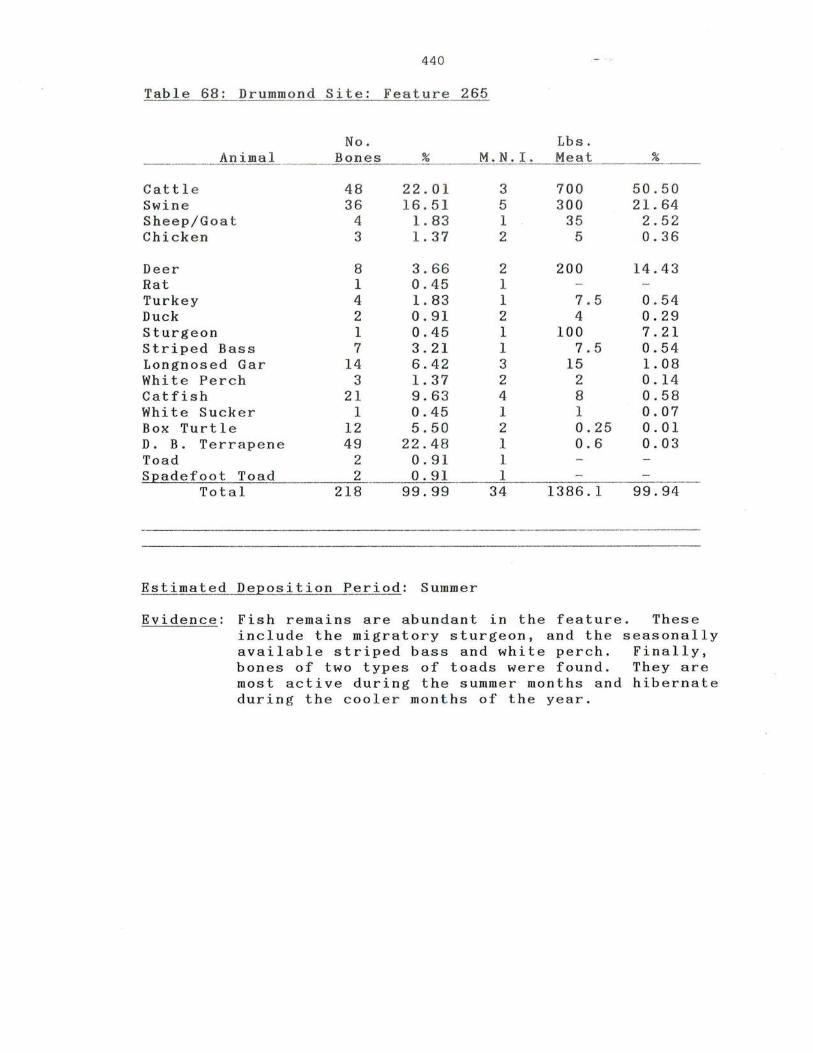
440
Table 68: Drummond Site: Feature 2 65
No. Lbs. Animal Bones % M. N. 1. Meat %
Cattl e 48 22.01 3 700 50.50 Swine 36 16.51 5 3 00 21. 64 Sheep/Goat 4 1. 83 1 35 2.52 Chicken 3 1. 37 2 5 0.36
Deer 8 3 .66 2 200 14.43 Rat 1 0.45 1 Turkey 4 1. 83 1 7.5 0.54 Duck 2 0.91 2 4 0.29 Sturgeon 1 0.45 1 100 7.21 Striped Bass 7 3.21 1 7 .5 0.54 Longnosed Gar 14 6.42 3 15 1. 08 White Perch 3 1. 37 2 2 0.14 Catfish 21 9.63 4 8 0.58 White Sucke r 1 0.45 1 1 0.07 Box Turtle 12 5.50 2 0.25 0.01 D. B . Terrapene 49 22.48 1 0.6 0.03 Toad 2 0.91 1 Spadefoot Toad 2 0.91 1
Total 218 99.99 34 1386.1 99.94
Estimated Deposition Period: Summer
Evidence: Fish remains are abundant in the feature. These include the migratory sturgeon, and the seasonally available striped bass and white perch. Finally, bones of two types of toads were found. They are most active during the summer months and hibernate during the cooler months of the year.

441
Tab l e 69: Dr ummond Si t e: Feature 25 5
No . Lbs . Ani mal Bon es % M. N. I. Meat %
Ca t t le 56 46.66 2 8 00 68 .27 Swin e 19 15. 8 3 2 200 17 . 06 Sheep/Goat 1 0. 83 1 35 2.98 Chicken 5 4 .1 6 2 5 0 . 42
Deer 3 2.5 0 1 100 8.5 3 Gray Sq u ir r e l 2 1. 66 1 0 . 8 0 . 06 Gray Fo x 2 1. 66 1 Turkey 2 1. 66 1 7.5 0.64 Canada Goose 10 8.33 2 12 1. 02 Duck (Aythya sp. ) 1 0.83 1 2 0.17 Mallard / Black Duck 4 3 . 33 1 2 0.17 Duck (Anas sp . ) 3 2 . 50 2 4 0.34 Teal 1 0.83 1 1 0.08 Coot 8 6.66 2 2 0.17 Grackl e 3 2.50 1 0.5 0.04
Total 120 99.94 20 1171.8 99.95
Estimated Deposition Period: Winter to Spring
Evidence: This feature lacks the remains of fish and reptil e s but yielded a diversity of bones from migrato r y waterfowl. These include three type s of ducks, teal, coot, and canada geese. The birds suggest a September to December or March to May deposition. Th e latter is more probable becaus e there is stratigraphic evidence that the bird remains becom e mor e common in th e upper levels of the feature.

442
Tabl e 70: Drummond Site: Feature 332
No. Lbs. Animal Bones % M. N. 1. Meat %
Cattle 10 1 51.79 6 2150 74.15 Swine 57 29.23 7 600 20.69 Sheep/Goat 13 6.66 1 35 1. 20 Horse 4 2 . 05 1 Cat 2 1. 02 2
Deer 3 1. 53 1 100 3.45 Turkey 1 0.5 1 1 7.5 0.26 Bobwhite 1 0.51 1 0.5 0 . 01 Duck 2 1. 02 1 2 0.06 Loon 1 0.51 1 4 0 . 13 Box Turtle 10 5.12 1 0.25 0.00 8
Total 195 99.95 23 2899.25 99.95
Estimated Deposition Period: Winter?
Evidence: No identifiable fish remains were recovered from this feature. Migratory birds consist of duck and a loon. The loon is of interest because it is one of the few birds that winters in the Chesapeake . Ther e is also a predominanc e of domest ic bones.

443
Table 71 : Wills Cove Site: Feature 5
No. Lbs. Animal Bon es % M. N. I. Meat %
Cattle 29 19.86 2 800 56.92 Swine 37 25 .34 3 250 17.79 Sheep/Goat 11 7.53 2 70 4.98 Chicken 10 6.84 2 5 0.35
Deer 5 3.42 2 200 14.23 Raccoon 2 1. 36 1 15 1. 07 Gray Squ irrel 17 11. 63 3 2.4 0.17 Fox Squi rre l 1 0.68 1 1 0.07 Duck 1 0.68 1 2 0.14 Turkey Vulture 1 0.68 1 Black Drum 6 4.11 2 50 3.55 White Perch 20 13.43 6 6 0.43 White Catfish 5 3.42 2 4 0 . 28 Water Snake 1 0.68 1
Total 146 99.94 29 1405.4 99.98
Estimated Deposition Period: Spring/Summer or Summer/Fall
Evidence: The presence of three species of fish represented by multiple individuals is a strong summer indicator. In the total bone sample, fish account for over 30% of the fragments. In addition, the water snake could only be found during the warmer months of the year. The single duck may indicate that deposition began during the late spring or extended into the early fall.
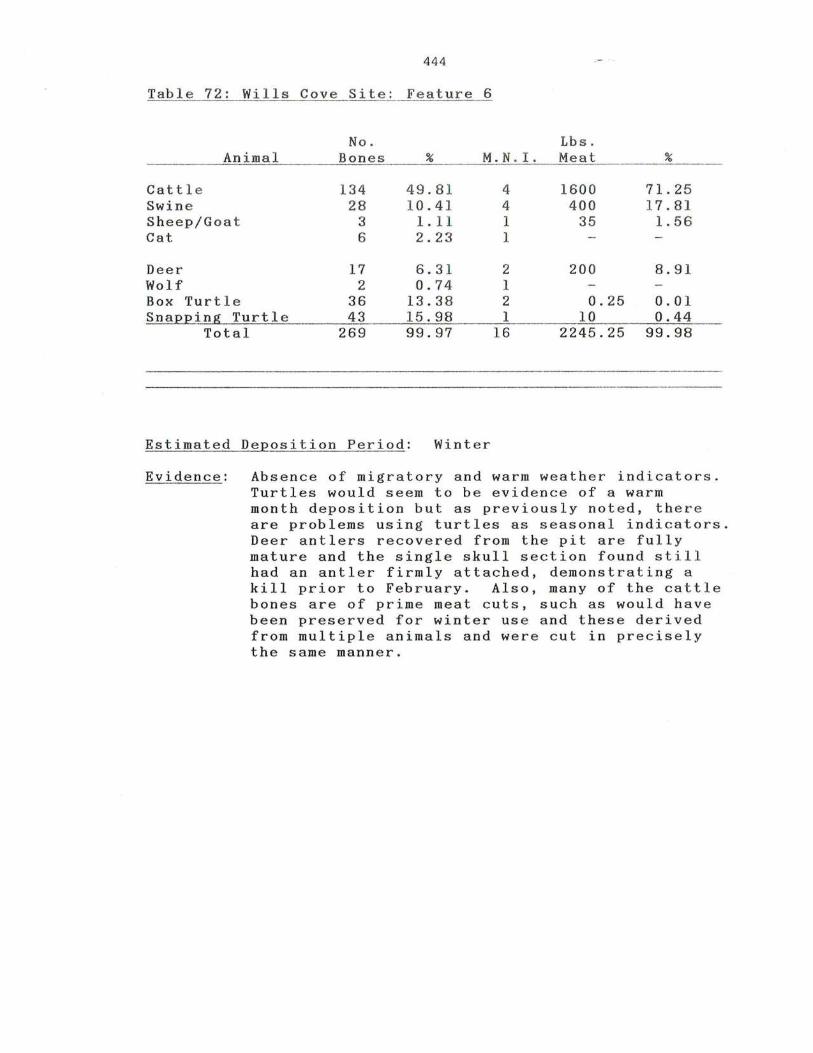
444
Table 72 : Wills Cove Site : Feature 6
No. Lbs. Animal Bones % M. N. I. Meat %
Catt l e 134 49.81 4 1600 71.25 Swin e 28 10.41 4 400 17.81 Sheep/Goat 3 1. 11 1 35 1. 56 Cat 6 2.23 1
Deer 17 6.31 2 200 8.9 1 Wolf 2 0.74 1 Box Turtle 36 13.38 2 0.25 0.0 1 Snapping Turtle 43 15.98 1 10 0.44
Total 269 99.97 16 2245.25 99.98
Estimated Deposi ti on Period: Winter
Evidence: Absence of migratory and warm weather indicators . Turtles would seem to be evide nce of a warm month deposition but as previously noted, ther e are problems using turtles as seasonal indicators. Deer antlers recovered from the pit are fully mature and the single skull section found still had an antler firmly attached, demonstrating a kill prior to February. Also, many of the cattle bones are of prime meat cuts, such as would have been preserved for winter us e and these derived from mUltiple animals and were cut in precisely the same manner.
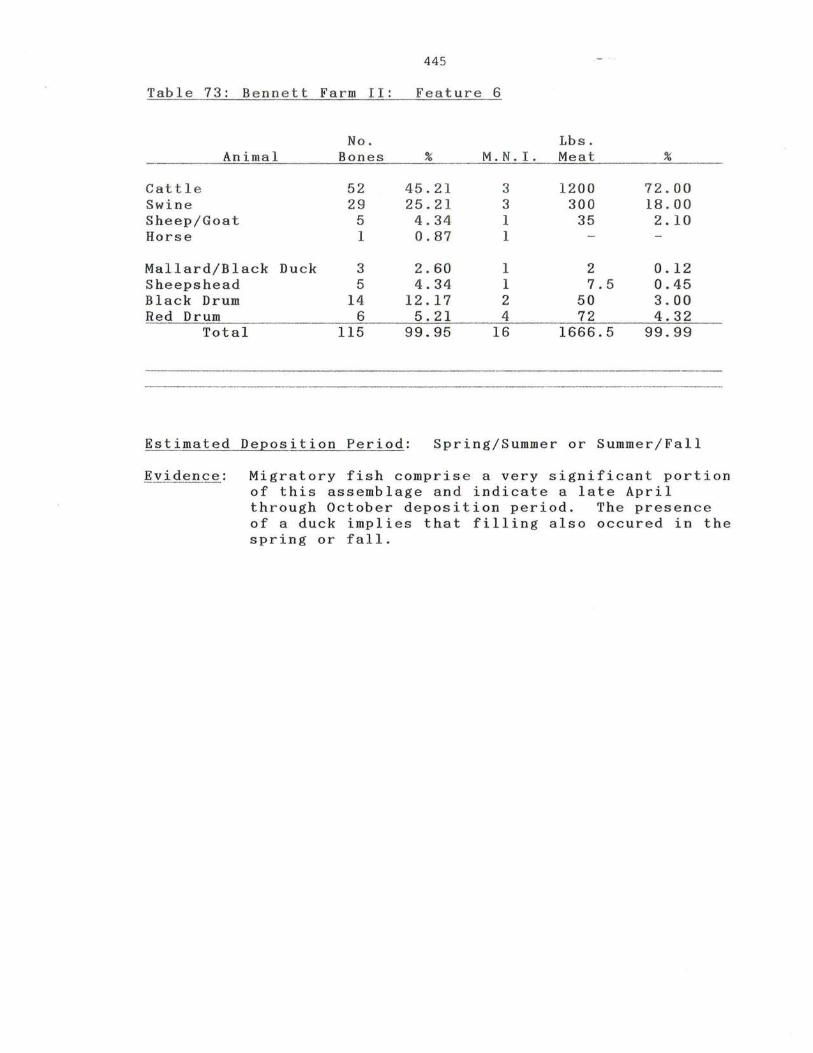
445
Table 73: Bennett Farm I I: Feature 6
No. Lbs. Animal Bones % M. N. I. Mea t %
Cattle 52 45.2 1 3 1200 72 . 00 Swine 29 25 .21 3 300 18 . 00 Sheep/Goat 5 4.34 1 35 2.10 Horse 1 0.87 1
Mallard/Black Duck 3 2.60 1 2 0.12 Sheepshead 5 4.34 1 7.5 0.45 Black Drum 14 12.17 2 50 3.00 Red Drum 6 5.21 4 72 4.32
Total 115 99.95 16 1666.5 99.99
Estimated Deposition Period: Spring/Summer or Summer/Fall
Evidence: Migratory fish compris e a very significant portion of this assemblage and indicate a late April through October deposition period. The presence of a duck implies that filling also occured in the spring or fall.

446
Tabl e 74: Bennett Farm II: Feat u re 8
No. Lb s . Animal Bon es % M. N. 1. Me a t %
Catt l e 20 3 47.99 7 25 5 0 69 . 08 Swine 13 3 31 .44 8 700 18.96 She e p /Goat 30 7 . 09 4 80 2 . 16 Horse 2 0.47 1 Chick e n 5 1. 18 2 5 0.1 3 Goose 3 0.71 1 7 0.17
Deer 2 0. 47 1 100 2.70 Raccoon 1 0.2 4 1 15 0.40 Opossum 1 0.24 1 8 0.2 1 Turkey 4 0.94 1 7.5 0.20 Sheepshe ad 13 3.07 3 22.5 0.60 Black Drum 16 3.78 5 125 3.38 Red Drum 9 2 . 12 4 72 1. 95 Box Turtle 1 0.24 1 0.25 0.006
Total 423 99 . 98 40 3692.25 99.96
Estimated Deposition Period: Summer
Evidence: Presence of migratory fish and th e absence of migratory waterfowl.

447
Tabl e 75: Bennett Farm I I: Feature 16
No. Lbs. Animal Bon es % M.N .I. Meat %
Cattle 183 42.26 6 2 150 6 1 .98 Swin e 56 12.93 8 750 2,1.62 Sheep/Goat 4 0 . 92 1 35 1. 00
Deer 6 1. 38 1 100 2.88 Raccoon 2 0 . 46 1 15 0.43 Sheepshead 69 15. 93 4 30 0 . 86 Black Drum 46 10.62 5 125 3.60 Red Drum 57 13.16 10 180 5.18 Box Turtle 4 0.92 1 0.25 0.007 D.B. Terrapen e 1 0.23 1 0.6 0.01 Cooter 2 0.46 1 3 0.08 Atlantic Loggerhead 2 0.46 1 80 2.30 Atlantic Blackfish 1 0.23 1
Total 433 99.96 41 3468 . 85 99.94
Estimated Deposition Period: Summer
Evidence: The large quantities of migratory fish in this assemblage strongly suggest a summer deposit. The recovery of remains of four species of turtles, especially the Atlantic Loggerhead, also supports a summer deposit.

448
Tabl e 76: Be n nett Fa rm I I : Feat u re 30
No . Lb s. An i ma l s Bo ne s % M. N. I. Meat %
Cat t le 155 58.4 9 6 215 0 69. 68 Sw i n e 64 24. 15 7 600 19 . 44 Sh e ep/Goat 1 0. 37 1 35 1. 13 Hors e 1 0.37 1 Ca t 1 0 . 37 1 Chick e n 1 0.37 1 2. 5 0.0 8
De er 10 3.77 2 200 6. 4 8 Raccoon 2 0.75 1 15 0.48 Sheepshead 17 6.41 2 15 0.48 Black Drum 12 4.52 2 50 1. 62 Red Drum 1 0.37 1 18 0.58
Total 265 99.94 25 3085 .5 99 . 97
Estimated Deposit i on Period: Summer
Evidence: The presence of migratory fish represented by multiple individuals and th e absence of migratory waterfowl.

449
Table 77: Smith's Ordinary Cellar
No. Lbs. Animal Bones % M. N. 1. Meat %
Cattle 98 32.45 4 1350 69.91 Swine 82 27.15 4 350 18.12 Sheep/Goat 15 4.96 2 50 2.59 Chicken 26 8.61 4 10 0.52
Deer 5 1. 65 1 100 5.18 Rat 1 0.33 1 Turkey 5 1. 65 2 15 0.77 Sheepshead 68 22.51 6 45 2.33 White Perch 1 0.33 1 1 0.05 Snapping Turtle 1 0.33 1 10 0.52
Total 302 99.97 26 1931 99.99
Estimated Deposition Period: Summer
Evidence: The presence of many bones and multiple identified individuals of Sheepshead, a migrant, suggests a deposition in the summer. This is supported by recovery of White Perch and Snapping Turtle bones.
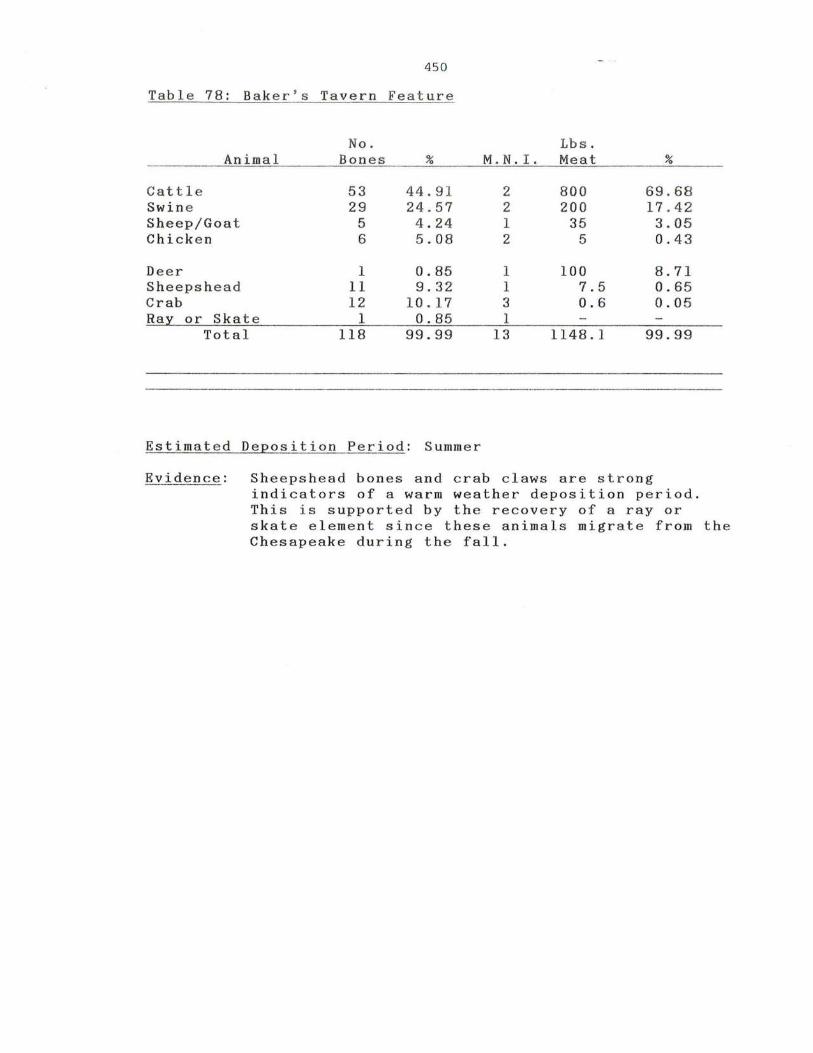
450
Tab le 78: Ba k er's Ta v e r n Featu r e
No. Lbs . An i mal Bon es % M. N. r. Meat %
Cat tle 5 3 44.91 2 800 69. 68 Swin e 29 24. 57 2 200 17 . 42 Sheep/Goa t 5 4 .24 1 35 3 . 05 Chicken 6 5 .08 2 5 0.43
Deer 1 0.85 1 100 8.7 1 Sheepshead 11 9 . 32 1 7.5 0.65 Crab 1 2 10. 17 3 0.6 0.05 Ray or Skate 1 0.85 1
Total 118 99.99 13 1148.1 99.99
Estimated Deposition Period: Summer
Evidence: Sheepshead bones and crab claws are strong indicators of a warm weather deposition period. This i s supported by the recov e ry of a ray or skate element since these animals migrate from th e Chesapeake during the fall .

451
Table 79: St. John's II: Large Circular Pit
No. Lbs. Animal Bones % M. N. 1. Meat %
Cattl e 161 57.29 5 2000 73 . 03 Swin e 64 22.77 5 450 16.43 Sheep/Goa t 21 7.47 2 70 2.56 Chicken 13 4.63 4 10 0.36
Deer 16 5.70 2 200 7.30 Gray Squirrel 1 0.36 1 0.8 0.03 Turkey 3 1. 07 1 7.5 0.27 Box Turtle 2 0.71 1 0.25 0.009
Total 281 100.00 21 2738.55 99.98
Estimated Deposition Period: Winter?
Evidence: Total absence of fish remains and the predominance of prime meat portions from several cattle implies that they were preserved sections. Both facts suggest a cold weather deposit. However, the evidence is not as conclusive as in some other features.

452
Table 80: Van Sweringe n Feature
No. Lbs. Animal Bones % M. N. 1. Me at %
Cattle 40 38.46 2 800 60.83 Swine 24 23 . 07 3 300 22.81 Sheep/Goat 13 12.50 3 90 6.84 Chicken 18 17.31 3 7.5 0.57
Deer 3 2.88 1 100 7 . 60 Sheepshead 3 2.88 1 7.5 0 . 57 Snapping Turtl e 1 0.96 1 10 0.76 Toad 2 1. 9 2 1
Total 104 99.98 15 1315 99.98
Es t imat e d Deposition Period: Summer?
Evidence: Presence of Sheepshead, Snapping Turtl e and a Toad.

453
Table 81 : St. John' s II: Cellar
No . Lbs. Analysis Bone % M. N. 1. Meat %
Cattl e 114 34.34 4 1600 61. 43 Swine 75 22. 60 8 750 28.79 Sheep /Goa t 19 5. 72 2 70 2.69 Dog 1 0.30 1 Chicken 19 5.72 3 7.5 0.29 Goose 1 0.30 1 7 0 .27
Dee r 9 2. 7 1 1 100 3.84 Raccoon 1 0.30 1 15 0.58 Opossum 3 0.90 1 8 0.31 Gray Fox 1 0 . 30 1 Gray Squirrel 3 0.90 2 1.6 0.06 Rabbit 1 0 .3 0 1 2 0.0 7 Rat 18 5.42 4 Turkey 3 0.90 1 7.5 0.2 9 Duck 3 0.90 2 4 0 . 15 Goose 4 1. 20 1 6 0.23 Sheepshead 3 0.90 2 15 0.58 Crab 1 0 . 30 1 0.2 0 .007 Box Turtle 45 13.55 3 0.75 0.03 Snapping Turtle 8 2.41 1 10 0.38
Total 332 99.97 41 2604.55 99.99
Estimated Deposition Period: Summer - Fall?
~vide~ce: The fish, turtles and crab suggest a summer fill period while the migratory waterfowl indicate a spring or fall deposit. The recovery of one fully mature deer antler with a portion of the skull still attached suggests that fall is likely.
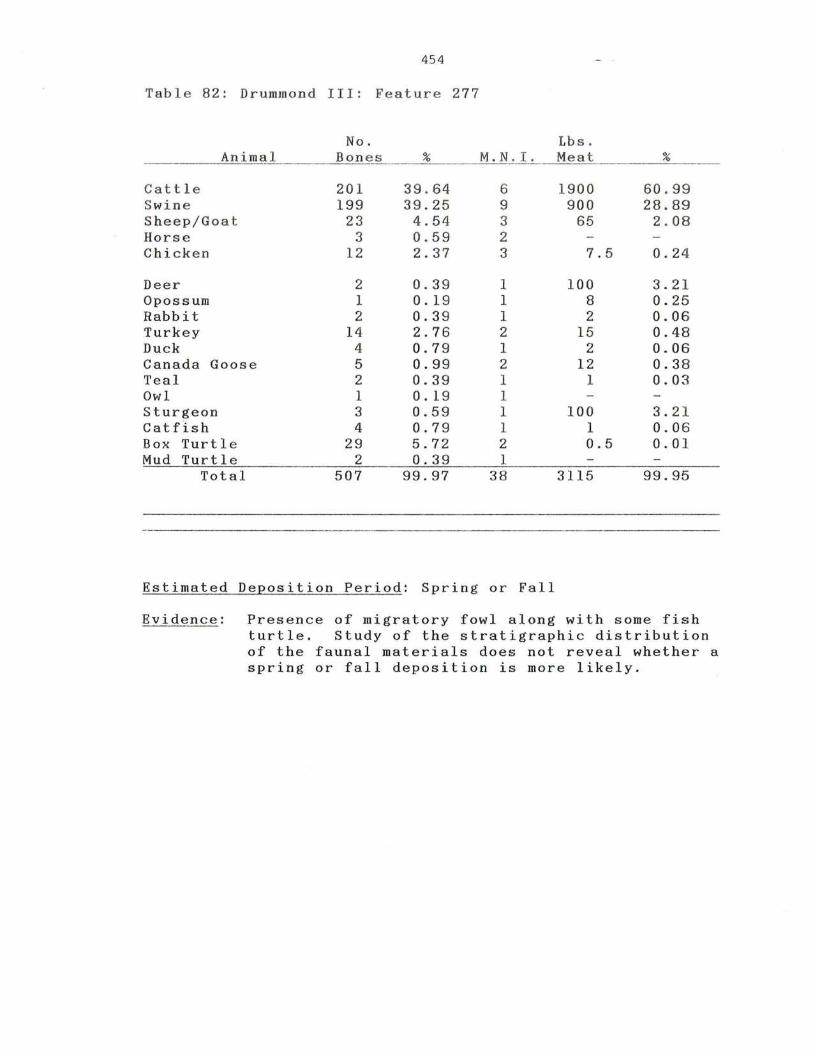
454
Table 82: Drummond III: Feature 277
No. Lbs. Animal Bon es % M. N. I. Meat %
Cattle 20 1 39.64 6 1900 60 . 99 Swine 199 39.25 9 900 28.89 Sheep/Goat 23 4.54 3 65 2 . 08 Horse 3 0.59 2 Chicken 12 2.37 3 7.5 0.2 4
Deer 2 0.39 1 100 3.21 Opossum 1 0 . 19 1 8 0.25 Rabbit 2 0 . 3 9 1 2 0.06 Turkey 14 2 . 76 2 15 0.48 Duck 4 0.79 1 2 0.06 Canada Goose 5 0.99 2 12 0.38 Teal 2 0.39 1 1 0.03 Owl 1 0.19 1 Sturgeon 3 0.59 1 100 3.2 1 Catf1sh 4 0.79 1 1 0.06 Box Turtle 29 5.72 2 0.5 0.01 Mud Turtle 2 0.39 1
Total 507 99.97 38 3115 99 . 95
Estimated Deposition Period: Spring or Fall
Evidence: Presence of migratory fowl along with some fish turtle. Study of the stratigraphic distribution of the faunal materials does not reveal whether a spring or fall deposition is more likely.

455
Table 83: Bray Plantation: Feature 10
No. Lbs. Animal Bones % M.N.!. Mea t %
Cattle 61 43.26 3 1200 65.48 Swine 58 41.13 5 450 24.55 Sheep/Goat 14 9.93 2 70 3.82 Chicken 2 1. 42 1 2.5 0.13
Deer 4 2.84 1 100 5.45 Gray Fox 1 0 . 71 1 Snapping Turtle 1 0.71 1 10 0.54
Total 141 100.00 14 1832.5 99.97
Estimated Deposition Period: ? Winter?
Evidence: There is little evidence for seasonal evaluation. The absence of fish and migratory fowl might be indicative of a winter period.

Appendix IV
Bone Fusion Data For Catt le
Table 84: Cattle Bone Fusion Dat a From Kingsmill Tenement
0-18 Months
First Phalange Second Phalange Humerus - distal Radius - proximal
Total Bone Percentage of Age Range
24-36 Months
Metacarpal - distal Metatarsal - distal Tibia - distal
Total Bone Percentage of Age Range
36-48 Months
Femur - proximal Radius - distal Ulna - proximal Femur - distal Tibia - proximal
Total Bone Percentage of Age Range
Fused
15 15
3 1
34 94.4%
1
1 14.2%
1 1 1 1 4
44.4%
456
Unfused
2
2 5.5%
4 1 1 6
85.7%
1 2 1 1
5 55.5%
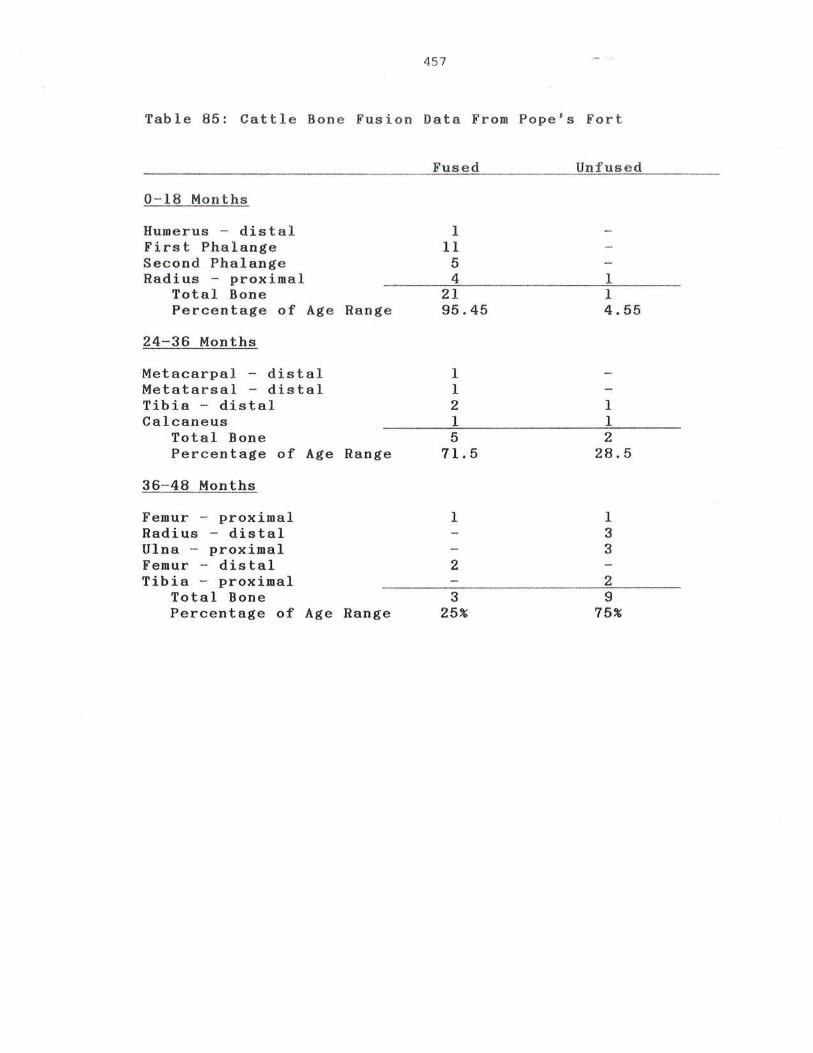
4 5 7
Table 85: Ca t tle Bone Fusion Data Fr om Pop e 's Fort
0 - 18 Months
Humerus - dist a l First Phalange Second Phalange Radius - proxima l
Total Bone Percentage of Ag e Rang e
24- 36 Months
Metacarpal - distal Metata rs al - di s tal Tibia - dista l Calcaneus
Total Bone Percentage of Age Range
36- 48 Months
Femur - proximal Radius - distal Ulna - proximal Femur - distal Tibia - proximal
Total Bone Percentage of Age Range
Fuse d
1 11
5 4
21 95.45
1 1 2 1 5
71.5
1
2
3 25%
Unfused
1 1 4.55
1 1 2
28.5
1 3 3
2 9
75%

458
Table 86: Cattl e Bone Fusion Data From Drummond I
0-18 Months
First Phalange Second Phalange Humerus - distal Radius - proxima l
Total Bone Percentage of Age Range
24-36 Months
Metacarpal - distal Metatarsal - distal Tibia - distal
Total Bone Percentage of Age Range
36-48 Months
Femur - proximal Radius - distal Ulna - proximal Femur - distal Tibia - proximal Humerus - proximal
Total Bone Percentage of Age Range
Fused
15 7 1 7
30 100%
2 3 4 9
81. 81%
1 1 1 1 3 1 8
50%
Unfused
o
2
2 18.18%
1 1 1
3 2 8
50%
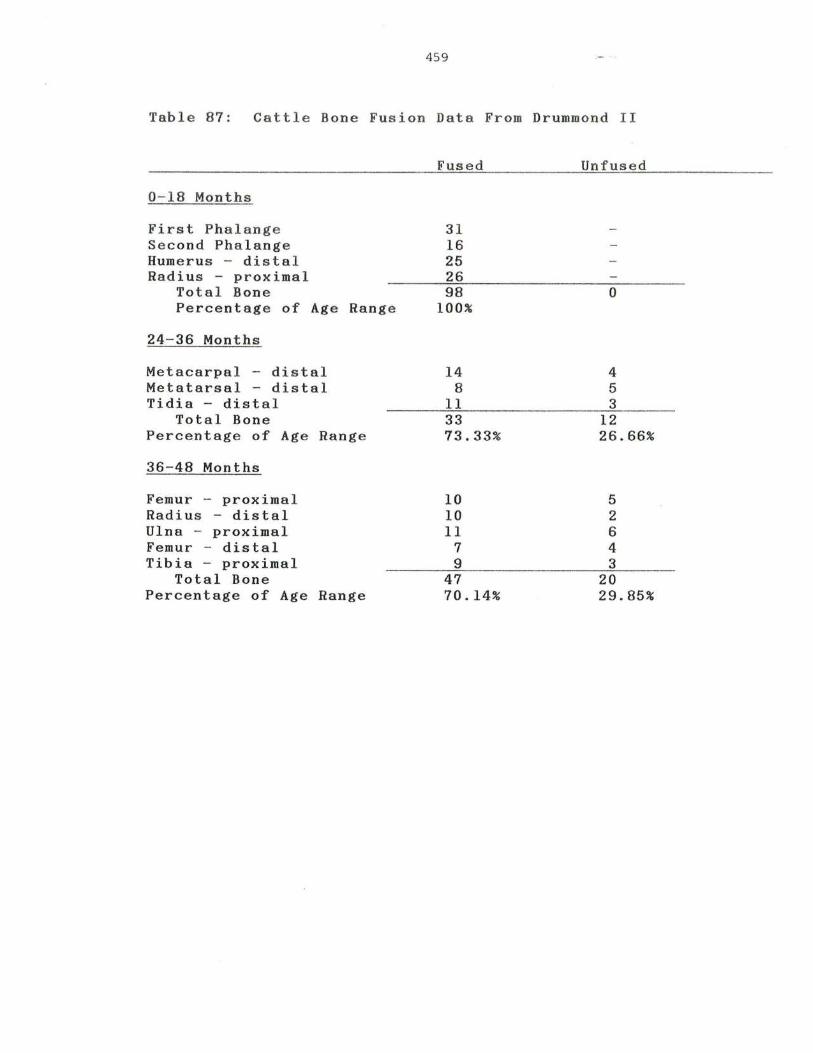
459
Table 8 7 : Cattle Bone Fusion Data From Drummond II
0 - 1 8 Mon t hs
First Ph alange Second Pha l a nge Humerus - di s tal Ra dius - p r oximal
To t a l Bone Percentage o f Age Rang e
24 - 36 Months
Metacarpa l - di s tal Metatarsal - d i stal Tidia - di s tal
Total Bone Percentage of Age Range
36 - 48 Months
Femur - proximal Radius - distal Ulna - proximal Femur - distal Tibia - proximal
Total Bone Percentage of Age Range
Fuse d
31 16 25 26 98
100 %
14 8
11 33 73.33%
10 10 11
7 9
47 70.14%
Unfuse d
o
4 5 3
12 26 . 66%
5 2 6 4 3
20 29 . 85%

460
Table 88: Cattle Bone Fusion Data From Pettus Plantation
0-18 Months
First Phalange Second Phalange Humerus - distal Radius - proximal
Total Bone Percentage of Age Range
24-36 Months
Metacarpal - distal Metatarsal - distal Tibia - distal
Total Bone Percentage of Age Range
36-48 Months
Femur - proximal Radius - distal Ulna - proximal Femur - distal Tibia - proximal
Total Bone Percentage of Age Range
Fus ed
23 7
14 7
51 100%
10 11 10 31 91.10%
8 5 6 5 6
30 76.9%
Unfused
o
2 1
3 8.90%
3 1
2 3 9
23.0%

46 1
Tabl e 89: Ca t tle Bon e Fusi o n Data From Utop ia
0 - 18 Months
F i rst Phalange Second Phalange Humerus - distal Radius - proxima l
Total Bone Percentage of Age Range
24-36 Months
Metacarpa l - distal Metatarsal - distal Tibia - distal
Total Bone Percentage of Age Range
36-48 Months
Femur - proximal Radius - distal Ulna - proximal Femur - distal Tibia - proximal Humerus - proximal
Total Bone Percentage of Age Range
3 6 1 1 3 2
Fus e d
29 17
5 5
53 96.00 %
20 22
2 44 93.00%
16 76.00%
1 3 1
Unfused
2
2 4.00%
2 1
3 7.00%
5 24.00%

462
Table 90 : Cattle Bone Fusion Data From Bennett Farm II
Fused Un f used
0-18 Months
First Phalange 25 Second Phalang e 25 Humerus - dis t al 22 Radius - prox i mal 26
Total Bone 98 0 Percentage of Age Range 100.00% 0.0%
24-36 Months
Metacarpa l - distal 26 4 Metatarsal - di s tal 25 5 Tibia - distal 24 2
Total Bone 75 11 Pe r centage of Age Range 87.20% 17.79%
36-48 Months
Femur - proxima l 1 1 Radius - distal 14 5 Ulna - proximal 5 Femur - distal 4 2 Tibia - proximal 4 3 Humerus - proximal 2
Total Bone 30 11 Percentage of Age Range 73.16% 26.82%

463
Table 91: Cattle Bone Fus i on Data From St. John's II
Fused Unfused
0- 18 Months
First Phalange 14 Second Phalange 8 Humerus - distal 1 1 Radius - proximal 2 Scapula 4
Total Bone 29 1 Percentage of Age Range 96.66% 3.33%
24 - 36 Months
Metacarpal - distal 6 Metatarsal - distal 4 2 Tibia - distal 1 2 Calcaneus 1
Total Bone 12 4 Percentage of Age Range 75.00% 25.00%
36- 48 Months
Femur - proximal 1 Radius - distal 1 1 Ulna - proximal 1 1 Femur - distal 1 Tibia - proximal 2 Humerus - proximal 2 1
Total Bone 6 5 Percentage of Age Range 54.50% 45.50%

464
Tabl e 92: Catt l e Bone Fusio n Data From Dr ummond II I
Fused Un f used
0- 18 Months
First Phalange 10 Second Phalange 7 Radius - proximal 4
Total Bone 22 0 Percentage of Age Range 100.00% 0.0%
24-36 Months
Metacarpal - distal 5 1 Metatarsal - distal 4 1 Tibia - distal 3 1
Total Bone 12 3 Percentage of Age Range 80.00% 20.00%
36-48 Months
Femur - proximal 1 1 Radius - proximal 2 Ulna - proximal 1 1 Femur - distal 1 1 Tibia - proximal 2
Total Bone 5 5 Percentage of Age Range 50.00% 50.00%
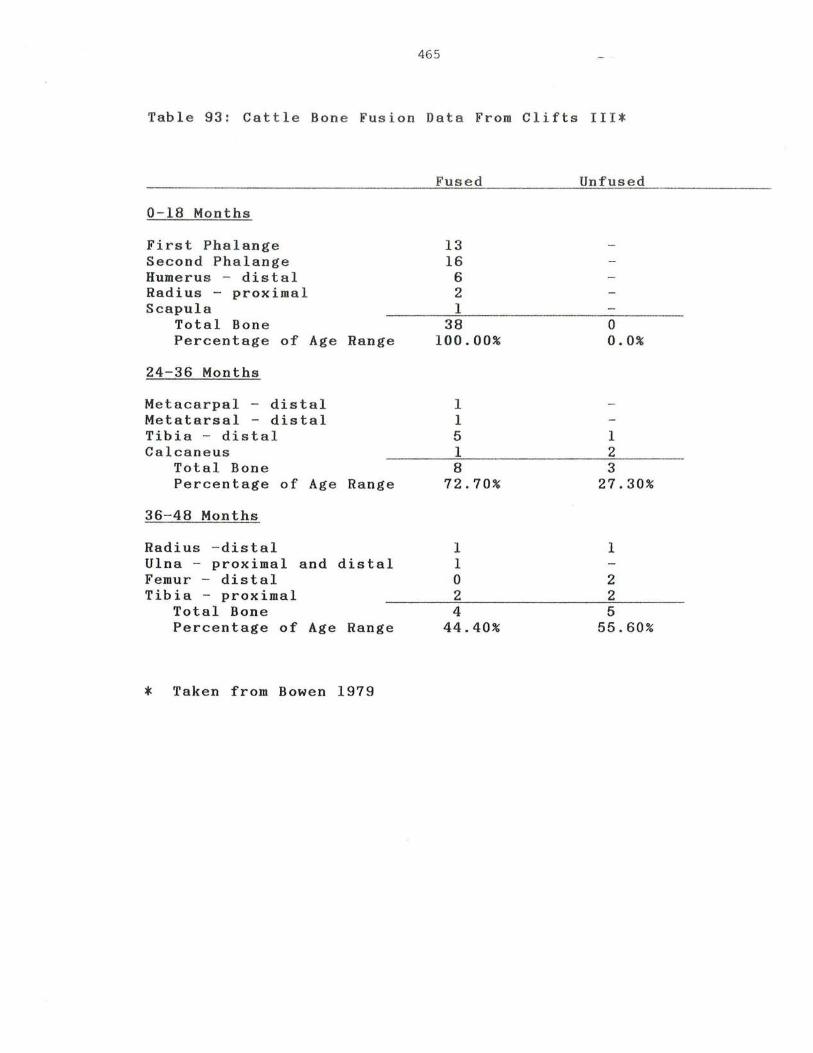
465
Table 93: Cattle Bon e Fusion Data From Cl i fts III*
0 - 18 Months
First Phalange Second Phalange Humerus - distal Radius - proximal Scapula
Total Bone Percentage of Age Range
24-36 Months
Metacarpal - distal Metatarsal - distal Tibia - distal Calcaneus
Total Bone Percentage of Age Range
36- 48 Months
Radius -distal Ulna - proximal and distal Femur - distal Tibia - proximal
Total Bone Percentage of Age Range
* Taken from Bowen 1979
Fused
13 16
6 2 1
38 100.00%
1 1 5 1 8
72.70%
1 1 o 2 4
44.40%
Unfused
o 0.0%
1 2 3
27.30%
1
2 2 5
55.60%

466
Tabl e 94: Cattle Bone Fusion Data From Clift s IV*
0 -1 8 Mo nths
First Phalange Humerus - distal Radius - proximal Scapu la
Total Bone Percentage of Age Range
24-36 Months
Metacarpal - di stal Metatarsal - distal Tibia - distal Calcaneus
Total Bone Percentage of Age Range
36- 48 Months
Femur - proximal and distal Radius - distal Ulna - proximal and distal Tibia - proximal
Total Bone Percentage of Age Range
* Taken From Bowen 1979
Fused
92 4 4 8
108 92.30%
15 14
9 1
39 45.30%
2 4 1
7 36.80%
Un fused
8 1
9 7.70%
6 15
7 19 47 54.70%
5 3 2 2
12 63.20%
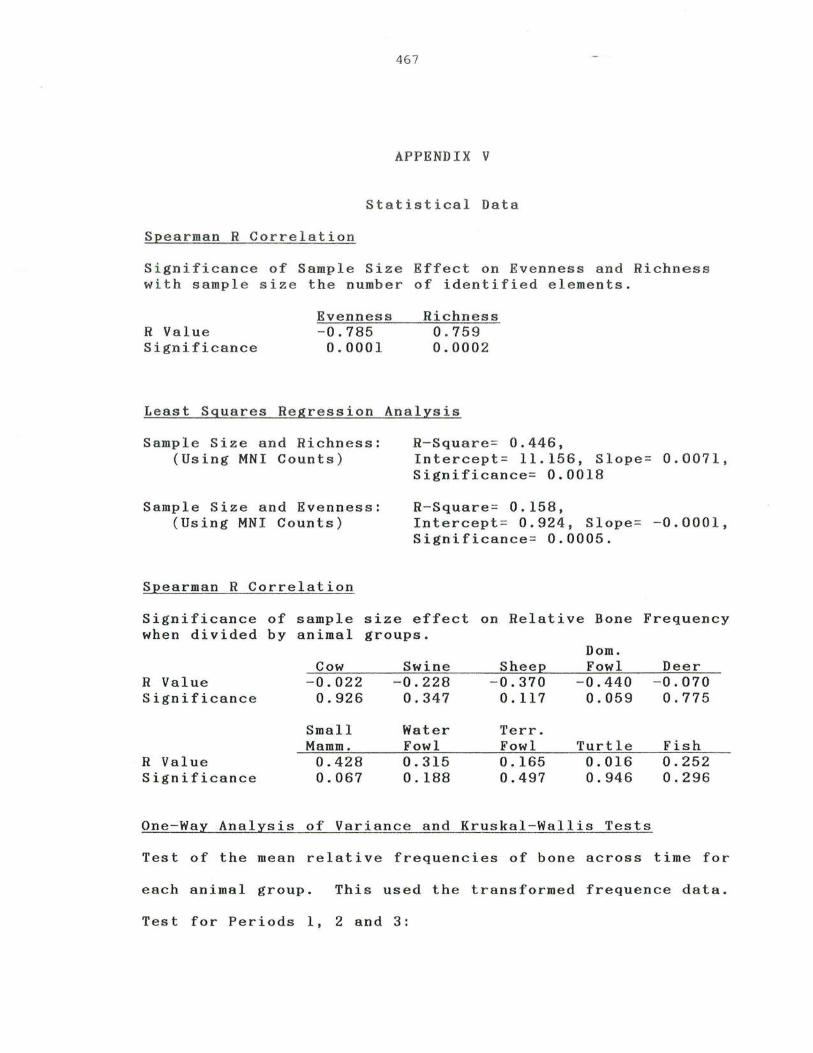
467
APPENDIX V
Statistical Data
Spearman R Correlation
S i gni ficance of Sample Size Effect on Evenness and Richness with sample size the number of identified elements.
R Value Significance
Evenness - 0.785
0 . 0001
Richness 0.759 0.000 2
Least Squares Regression Analysis
Sample Size and Richness: (Us i ng MNI Counts)
Sample Size and Evenness: (Using MNI Counts)
Spearman R Correlation
R- Square = 0.446, Intercept = 11.156, Slope= 0.0071, Significance= 0.0018
R- Square= 0.158, Intercept = 0.924, Slope= -0.0001, Significance= 0.0005.
Significance of sample size effect on Relative Bone Frequency when divided by animal groups.
R Value Significance
R Value Significance
Cow - 0.022
0.926
Small Mamm.
0.428 0.067
Swine -0.228
0.347
Water Fowl 0.315 0.188
Dom. Sheep Fowl
-0.370 - 0.440 0.117 0.059
Terr. Fowl Turtle 0.165 0.016 0.497 0.946
One - Way Analysis of Variance and Kruskal - Wallis Tests
Deer - 0.070
0.775
Fish 0.252 0.296
Test of the mean relative frequencies of bone across time for
each animal group. This used the transformed frequence data.
Test for Periods 1, 2 and 3:
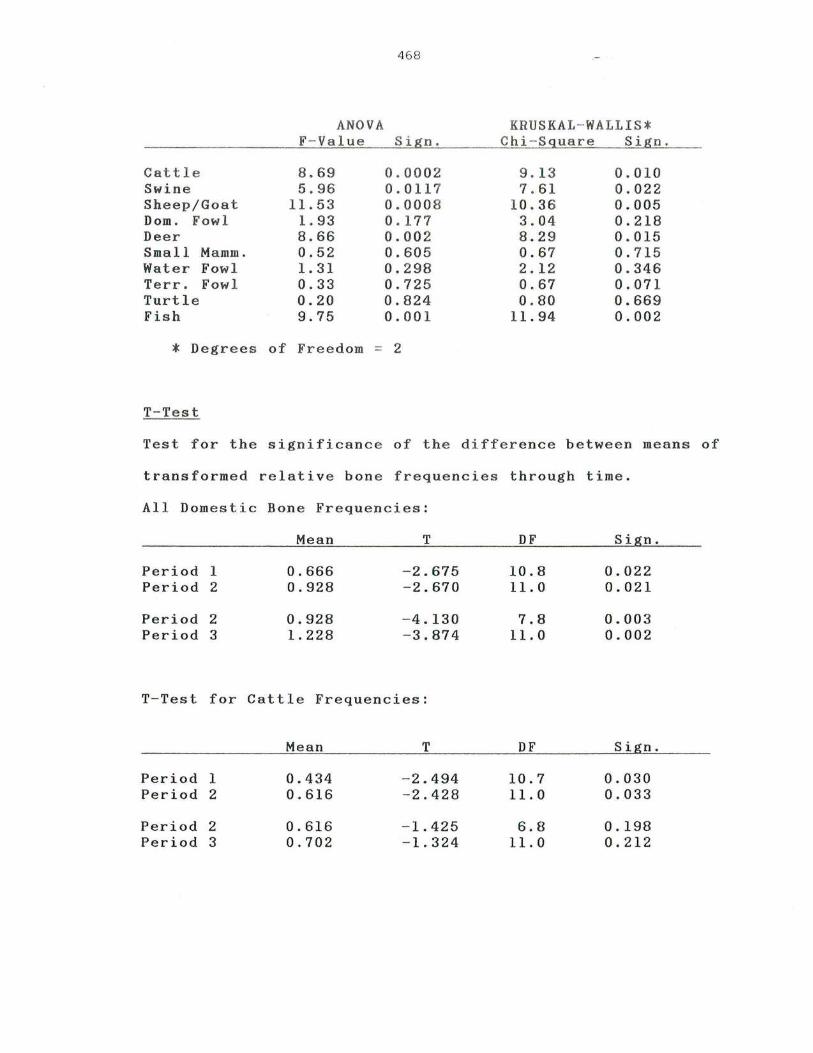
468
ANOVA KRU SKAL - WALLIS* F- Va lue S i gn. Ch i-S qua r e S ign.
Cattle 8 . 69 0 . 00 0 2 9 . 13 0.010 Swine 5.96 0.0 1 17 7 . 6 1 0.022 Sheep/Goat 11. 53 0 . 000 8 10.36 0.005 Dom. Fow l 1. 93 0 .1 7 7 3.04 0.218 Deer 8 . 66 0.00 2 8.29 0.015 Small Mamm . 0 . 52 0.60 5 0.67 0.715 Water Fowl 1. 31 0.298 2.12 0.346 Terr. Fow l 0.33 0.725 0 . 67 0.071 Turtle 0.20 0.824 0.80 0.669 Fish 9.75 0.001 11.94 0.002
* Degrees of Freedom = 2
T- Test
Test for the significance of the d i fference between means of
transformed relative bone frequencies through time.
All Domestic Bbne Frequencies:
Mean T OF Sign.
Period 1 0.666 -2.675 10.8 0.022 Period 2 0.928 -2.670 11. 0 0.021
Period 2 0.928 - 4.130 7.8 0.003 Period 3 1.228 -3.874 11.0 0.002
T-Test for Cattle Frequencies:
Mean T OF Sign.
Period 1 0.434 -2.494 10.7 0.030 Period 2 0.616 -2.428 11.0 0.033
Period 2 0.616 -1. 425 6.8 0.198 Period 3 0.702 -1.324 11.0 0.212

469
T- Tes t for Swine Frequencies:
Mean T DF Sign.
Period 1 0 . 432 - 0.830 7. 6 0.431 Peri od 2 0.486 - 0.868 11. 0 0.403
Period 2 0.486 - 3.23 1 10.6 0.008 Period 3 0 . 632 - 3.237 11. 0 0.007
T- Test for Sheep/Goat Frequenc ies:
Mean T DF Sign.
Period 1 0 .038 - 3.737 9.7 0.004 Period 2 0.165 - 3.581 11. 0 0.004
Period 2 0 .1 65 -1.550 9.9 0.152 Period 3 0.237 - 1.571 11. 0 0.144
T-Test for Deer Frequenc ies:
Mean T DF Sign.
Period 1 0.341 3.638 6.5 0.009 Period 2 0.128 3.861 11.0 0.002
Period 2 0.128 -1. 303 8.5 0.227 Period 3 0.180 -1.346 11. 0 0.205
T-Test for Fish Frequencies:
Mean T DF Sign.
Period 1 0.642 0.854 9.5 0.414 Period 2 0.517 0.870 11. 0 0.402
Period 2 0.517 4.448 7.0 0.002 Period 3 0.114 4.140 11. 0 0.001
Least Squares Regression Analysis
Sample Size and Richness: (Using Meat Weights)
Sample Size and Evenness: (Using Meat Weights)
R value= .653, R-Squared= .427, Intercept = 11.181, Slope= .0068, Significance = . 0012 .
R value = - .506, R- Squared= .256, Intercept = .507, Slope= - .007, Significance= .0133
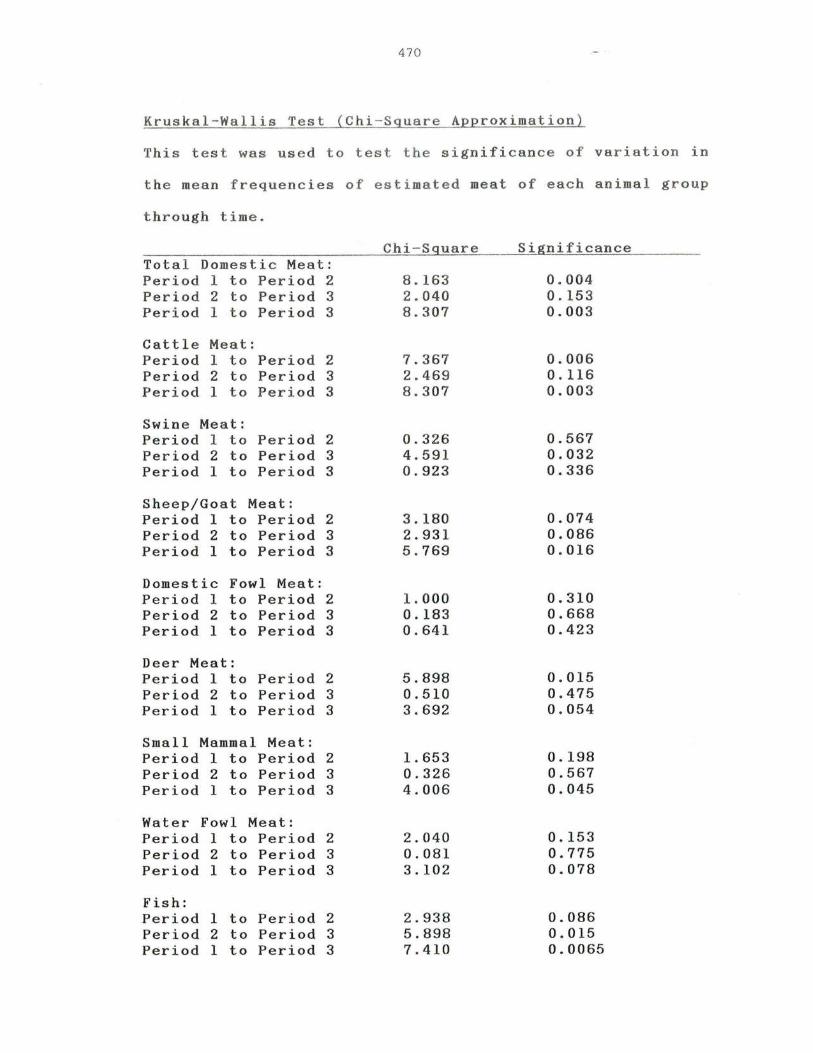
470
Kruskal-Wallis Test (Chi-Square Approximation)
This test was used to test the significance of variation in
t he mean frequencies of estimated meat of each animal group
through time.
Tota l Domestic Mea t : Period 1 t o Pe ri od 2 Period 2 to Peri o d 3 Per i o d 1 to Peri o d 3
Cattl e Meat: Per i od 1 to Per i o d 2 Perio d 2 t o Pe r iod 3 Peri od 1 to Period 3
Swin e Me a t : Period 1 t o Period 2 Pe r iod 2 to Period 3 Period 1 to Per i od 3
Sheep/Goat Meat : Period 1 to Period 2 Period 2 to Period 3 Period 1 to Period 3
Domestic Fowl Meat: Period 1 to Period 2 Period 2 to Period 3 Period 1 to Period 3
Deer Meat: Period 1 to Period 2 Period 2 to Period 3 Period 1 to Period 3
Small Mammal Meat: Period 1 to Period 2 Period 2 to Period 3 Period 1 to Period 3
Water Fowl Meat: Period 1 to Period 2 Period 2 to Period 3 Period 1 to Period 3
Fish: Period 1 to Per i od 2 Period 2 to Period 3 Period 1 to Period 3
Chi-Square
8.163 2.040 8.3 07
7.3 67 2.469 8.3 07
0.3 2 6 4. 591 0. 923
3.1 80 2 . 931 5 . 769
1 .000 0.183 0.641
5.898 0.510 3.692
1.653 0.326 4.006
2.040 0 . 081 3.102
2.938 5.898 7 . 410
Signifi c ance
0.004 0 .153 0.00 3
0.006 0.116 0 . 00 3
0.567 0.032 0.336
0.074 0.086 0.016
0.310 0.668 0.423
0.015 0.475 0.054
0.198 0.567 0.045
0 . 153 0.775 0.078
0.086 0.015 0.0065

BIBLIOGRAPHY
Al lan d , Alexan d e r J r . 1975 "Ada p t a ti on" , An nual Revi ew o f An t h r o p o l ogy Vol.
4:59- 73.
Ge or g e Al s op, 1910 "A Cha r a cter o f t he Province of Ma ryl a nd", In
Na rratives of Ear ly Ma r yland, Clayton Ha ll, editor. Pp . 335 - 388 .
Ames, Susie M. 1957 Reading. Writing an d Ar ithmetic i n Virgini a .
1607 - 1699. Jam e stown 350th Anniversary Historical Booklets , No. 15.
Anderson, Aven M. 1973 "Effects of Hurricane Agnes on the Environment
and Organisms of Chesapeake Bay" . Natural Resources Institut e Contributions # 529. Chesapeake Biological Laboratory,Solomons Island, Maryland.
Anderson, Jay 1971 A Solid Sufficiency: An Ethnography of Yeoman
Foodways in Stuart England. Unpublished Ph.D. Dissertation, University of Pennsylvania.
Archives of Maryland Maryland Colonial Records. Society, Baltimore.
Ashley, William
Maryland Historical
1928 The Bread of Our Forefathers. Oxford, England.
Avery, 1688
Susanna Manuscript Still Room Book. Falls Village, Conn.
Reprinted 1950.
Aylett, Mary and Olive Ordish 1965 First Catch Your Hare. London.
Babcock, Harold L. 1971 Turtles of the Northeastern United States. Dover
Publications reprint of the 1919 edition.
Bailey, 1913
Harold H. The Birds of Virginia . J.P. Bell Company. Lynchburg, Virginia.
47 1

472
Ba il e y , J.W. 1946 The Mammals of Virginia. Williams Printing Co.
Richmond.
Banister, John 197 0 John Banister and His Natural History of
Virginia: 1678- 1692 . Joseph and Nesta Ewan, editors. University of Illinoi s Press. Urbana.
Barber, 1976
1978
Michael "The Vertebrate Fauna from a Late Eighteenth Century Well: The Bray Pl an tation, Kingsmill, Virgini a" . Historical Archaeology 10: 68- 73 .
Faunal Remains From the Maine Site. Manuscript on file, St. Mary's City Commission and Virgini a Research Center for Archaeology.
Barlett, Peggy F. 1980 "Adaptive Strategies in Peasan t Agricultural
Production". Annual Review of Anthropology 19: 545-573.
Baxter , 1926
Richard "The Reverend Richard Baxter's Last Treatise". Bulletin of the John Ryland's Library Volume 10, No.1: 21-39.
Bennett, John W. 1976 "Anticipation, Adaptation, and the Concept of
Culture in Anthropology". Science Vol. 192: 847 -853.
Beverley, Robert 1947 The History and Present State of Virginia.
Edited by Louis B. Wright. University of North Carolina Press, Chapel Hill. Original 1705.
Bidwell, Percy Wells and John I. Falconer 1925 History of Agriculture in the Northern United
States: 1620-1860. Carnegie Institution of Washington, No. 358. Washington, D.C.
Bierly, E.J. 1954 "Turtles in Maryland and Virginia". Atlantic
Naturalist 9, No.5: 244-249.
Billington, Ray Allen 1967 "The American Frontier", In Beyond the Frontier:
Social Processes and Cultural Change, pp. 3-24. Edited by Paul Bohannan and Fred Plog. Natural History Press, Garden City.

473
Binford, Lewis R. 1968 "A Consideration of Archaeological Research
Design", In An Archaeological Perspective, pp. 135 - 162 . Seminar Press . New York .
1978 Nunamiut Ethnoarchaeology. Academic Press. New York .
Binford, Lewi s R. and J.B . Bertram 1977 "Bo ne Frequencies and Attritional Processes", In
For Theory Buildin g in Archaeo logy, pp. 77 -1 13. Edited by L.R. Binford. Academic Press, New York.
Blum, Jerome, ed itor 1982 Our Fo rgotten Past: Seven Centuries of Life on
the Land. Thames and Hud s on, New York.
Bohannan, Pau l and Fred Plog, editors 1967 Beyon d t he Frontie r: Social Process and Cultura l
Change. The Natural History Press. Ga r den City, New York.
Boserup, . E. 1965 The Conditions of Agr i cultural Growth: The
Economics of Agrarian Change Under Population Pressure. Aldine Press, Chicago.
Bowen, 1975
1979
Braun, 1974
Braun, 1950
Brush, 1980
Joanne V. "Probate Inventories: An Evaluation from the Perspective of Zooarchaeology and Agricultural History at Mott Farm". Historical Archaeology 9: 11-25.
"Analysis of the Faunal Remains From Clifts Plantation", In Field Archaeology of the Clifts Plantation Site by Fraser D. Neiman. Unpublished Manuscript on file , St. Mary's City Commission.
D.P. "Explanatory Models for the Evaluation of Coastal Adaptation in Prehistoric New England". American Antiquity 39: 582 - 596.
E. Lucy Deciduous Forests of Eastern North America. Blackiston and Company, Philadephia.
Grace S., Cecilia Lenk and Joanne Smith "The Natural Forests of Maryland: An Explanation of the Vegetation Map of Maryland". Ecological Monographs 50: 77 - 92.

474
Calvert, Charles 1672 "Letter to Cecilius, Lord Baltimore, 26 April,
1672", In Calvert Papers , Maryland Historical Society Fund Publication No. 28: 252-276.
Campbell, Mildred 1942 The English Yeoman under Elizabeth and the Early
Stuarts. Yale University Press, New Haven.
1959 "Social Origins of Some Early Americans", In 17th-Century America, pp. 63-89. Edited by James Morton Smith. University of North Carolina Press, Chapel Hill.
Cancian, F. 1972 Change and Uncertainty in a Peasant Economy.
Stanford University Press.
Carr, Lois Green 1974 "The Metropolis of Maryland: A Comment on Town
Development Along the Tobaco Coast", Maryland Historical Magazine 69: 124-145.
1976 "The Uses of Inventories: A Warning", The Conference on Historic Sites Archaeology Papers 1976. Volume 11:64-68.
Carr, Lois Green and Lorena S. Walsh 1977 "The Planter's Wife: The Experiences of White
Women in Seventeenth Century Maryland", The William and Mary Quarterly 34: 542-571.
Carr, Lois Green, Russell R. Menard and Louis Peddicord 1978 Maryland. . at the beginning. St. Mary's City
Commission, Annapolis.
Carr, 1979
Lois Green and Russell R. Menard "Immigration and Opportunity: The Freedman in Early Colonial Maryland", In The Chesapeake in the Seventeenth Century, pp. 206-242. University North Carolina Press. Chapel Hill.
Carrier, Lyman 1957 Agriculture In Virginia, 1607-1699. Jamestown
350th Anniversary Historical Booklet, No. 14. Williamsburg, Virginia.
Carson, 1976
Barbara and Cary Carson Styles and Standards of Living in Southern Maryland, 1670-1752. Paper presented to the Annual Meeting of the Southern Historical Association. Copy on file, St. Mary's City Commission.
475
Carson, Cary, Norman F. Barka, William M. Kelso, Garry Wheeler Stone, and Dell Upton
1981 "Impermanent Ar chi tecture in the Southern American Colonies", Winterthur Portfolio 16, No. 2-3.
Casagrande, Joseph B, Stephen Thompson and Philip Young 1964 "Colonization as a Research Frontier", In
Process and Pattern in Culture, Essays in Honor of Juli an H. Steward, pp. 281 - 325. Edited by Robert A. Manners. Aldine Publishing Company, Chicago.
Casteel, Richard W. 1974 "A Method fo r Estimation of Live Weight of Fish
From the Size of Skeletal Elements", American Antiquity 39:94-98.
1976 "Comparison of Colum n and Whole Unit Samples For Recovering Fish Rem ains ", World Archaeology 8, No.2: 192 - 196.
1977 "Characterization of Faunal Assemblages and the Minimum Number of Individuals determined from Paired Elements: Continuing Problems in Archaeology", Journal of Archaeological Science 4: 125-134.
1978 "Faunal Assemblages and the 'wiegemethode' or weight method", Journal of Field Archaeology 5: 71 - 77.
Chalklin, C.W. 1965 Seventeenth Century Kent: A Social and Economic
History. Longmans Green and Company. London.
Chaplin, R.E. 1970 "Animal Bones", in Excavations at Stewardstone
Street, Waltham Abbey, Essex 1966. PostMedieval Archaeology 3: 47-99.
1971 The Study of Animal Bones From Archaeological Sites. Seminar Press. London.
Chaplin, R.E. and Linda Barnetson 1975 "Animal Bones", in Excavations Within the Tron
Kirk, Edinburgh. Post-Medieval Archaeology 9: 137-163.
1980 "The Animal Bones", in Excavations at St. Mary's Street, Edinburgh. Post-Medieval Archaeology 14: 157 - 184.
Chayes, F. 1971 Ratio Correlation. University of Chicago Press.
476
Christenson , Andrew L. 1980 "Change in the Human Niche in Response to
Population Growth", In Modeling Change in Prehistoric Subsistence Economies, pp.31 - 72. Academic Press. New York .
Chrysler, M.A. 1910 "The Ecological Plant Geography of Maryland
Coastal Zone, West Shore District". Maryland Weather Service, Special Publication 3: 149- 197.
Clark, C. 1967 Population Growth and Land Use. St. Martin's
Press. New York.
Clarke, David L. 1968 Analytical Archaeology. Methuen, London.
Clayton, John 1965 The Reverend John Clayton: A Parson With a
Scientific Mind. University Press of Virginia. Charlottesville.
Cleland, Charles E. 1966 The Prehistoric Animal Ecology and Ethnozoology
of the Upper Great Lakes Region. University of Michigan Museum ·of Anthropology, Anthropology Papers No. 29.
1970 "Comparison of the Faunal Remains From French and British Refuse Pits at Fort Michilimackinac: A Study in Changing Subsistence Patterns". Canadian Historic Sites Occasional Papers in Archaeology and History No.3. Ottawa.
1976 "The Focal-Diffuse Model: An Evolutionary Perspective on the Prehistoric Cultural Adaptations of the Eastern United States". Mid-continental Journal of Archaeology 1, No.1: 59-76.
Clements, Paul G.E. 1977 "Economy and Society on Maryland's Eastern
Shore, 1689-1733". In Law, Society and Politics In Early Maryland. Edited by Aubrey Land, Lois Green Carr and Edward Papenfuse. The Johns Hopkins University Press. Baltimore.
Cohen, M.M. 1977 The Food Crisis in Prehistory. Yale University
Copley, 1638
Press. New Haven.
Thomas "Letter to Lord Baltimore, April 3, 1638", In The Calvert Papers, Maryland Historical Society

477
Fund Publication No. 28. Published 1889.
Cornwall, I.W. 1956 Bones For the Archaeologist. Phoenix House .
London.
Cotter, John 1958 Archaeological Excavations At Jamestown Colonial
Nationa l Historical Park, Virginia. National Pa rk Service Archaeological Research Series 4. Washington, D.C.
Craven , 1926
Craven, 1949
Avery Odelle Soil Exhaustion as a Factor in the Agricultural History of Virginia and Maryland, 1606- 1860. University of Illinoi s Studies in the Social Sciences, Vol. 13, No.1. Urbana.
We s ley Frank The Southern Colonies in the Seventeenth Century 1607-1689. Louisiana State University Press.
1971 White, Red and Black: The Seventeenth- Century Virginian. The University Press of Virginia. Charlottesville.
Crockett, Curtis W. 1974 "The Climate of Virginia", In Climates of the
States, Vol. 1: 398-421 . Water Information Center, Port Washington, New York.
Cronon, 1983
Cumba, 1975
Curtin, 1968
William Changes in the Land: Indians, Colonists, and the Ecology of New England. Hill and Wang.
Stephen L. Patterns of Resource Use and Cross-Cultural Dietary Change in the Spanish Colonial Period. Unpublished Ph.D. Dissertation, University of Florida.
Philip D. "Epidemiology and the Slave Trade", Science Quarterly 83: 190-199.
Political
Danckaerts, Jasper 1913 Journal of Jasper Danckaerts. Edited by Bartlett
B. James and J. Franklin Jameson. Charles Scribner's Sons. New York.
Day, Gordon M. 1954 "The Indians as an Ecological Factor in the
Northeast Forests", Ecology 32: 329 - 346.

478
Dobzhansky, T. 1968 "On Some Fundamental Concepts of Darwinian
Biology" , Evolutionary Biology 2: 1-34.
Doolittle, G. H. 1973 "Culture and Environment on the Cumberland
Frontier", Papers in Anthropology 14, No.1: 31 - 43. University of Oklahoma. Norman.
Driesch, A. von den 1976 "A Guide to the Measurement of Animal Bones
From Archaeological Sites", Peabody Museum Bulletin 1.
Drummond, J.C. 1958 The Englishman's Food: A History of Five
Centuries of English Diet. Jonathan Cape. London.
Drury, 1973
Durand, 1934
Earle, 1975
1979
Earle, 1980
G.H. The British Isles. Harper and Row. New York.
of Dauphine A Huguenot Exile in Virginia. Chinard. New York.
Carville, V.
Edited by Gilbert
The Evolution of a Tidewater Settlement System: All Hallows' Parish. Maryland, 1650-1783. Research Paper No. 170. Department of Geography, The University of Chicago.
"Environment, Disease and Mortality in Early Virginia, In The Chesapeake in the Seventeenth Century, pp. 96-125. Edited by Thad Tate and David Ammerman. University of North Carolina Press. Chapel Hill.
Timothy K. "A Model of Subsistence Change", In Modeling Change in Prehistoric Subsistence Economies, pp. 1- 30. Academic Press. New York.
Ekstrom, J. P. 1975 "Responding to a New Ecology: Adaptations of
Colonists in Eastern Ecuador", Papers in Anthropology Vol. 16, No . 1: 25-38. University of Oklahoma. Norman.
Emerson, T . E. 1978 "A New Method for Calculating the Live Weight
of the Northern White-Tailed Deer From Osteo archaeological material", Mid- Continental Journal of Archaeology 3: 35 - 44.
Emery, 1973
Evans , 1957
479
F.V . "England c irca 1600 ". In A New Historical Geography of England , pp. 248 - 301. Edited by H.C . Darby. Cambridge University Press.
Cerinda W. Some Notes on Shipping and Shipbuilding in Colonial Virginia. Jamestown 350th Anniversary Historical Booklets, No. 22. Williamsburg.
Everitt, Alan 1967 "Farm Laborers". In
England and Wales, University Press.
The Agrarian History of pp. 396-465. Cambridge
Fausz, 1977
J. Frederick The Powhatan Uprising of 1622: A Historical Study of Ethnocentrism and Cultural Conflict. Unpublished Ph.D. Dissertation. College of William and Mary.
Feest, Christian F. 1973 "Seventeenth Century Virginia Algonquian
Population Estimates", Quarterly Bulletin, Archaeological Society of Virginia, Vol. 28: 66-79.
1978 Virginia Algonquians, In Handbook of North American Indians Vol. 15:253-270. Smithsonian Institution. Washington, D.C.
Fenneman, Nevin M. 1938 Physiography of the Eastern United States.
McGraw-Hill. New York.
Firth, C.H. 1921 Cromwell's Army. Methuen and Co. London.
Flyger, 1962
Forde, 1949
Forman, 1938
Vagn and Theodore Thoerig "Crop Damage Caused By Maryland Deer", Proc. 16th Annual Conference, Southeastern Association of Game and Fish Commissioners. Pp. 45-51.
Daryll Habitat, Company.
Economy and Society. New York.
Henry Chandlee
E.P. Dutton and
Jamestown and St. Mary's: Buried Cities of Romance. The Johns Hopkins Press. Baltimore.
Fried, Morton H. 1974 "On the Evolution of Social Stratification and
the State", In The Rise and Fall of Civilization, pp. 26-41. Edited by J.A. Sabloff

480
a n d C. C . Lamberg-Karlovsky. Cummings Pr ess.
Froomer, Norman L. 198 0 "S ea Le vel Changes in the Chesapeake Bay Duri n g
Histor ic Times " , Mari n e Ge o lo gy 3 6 : 289-30 5 .
Fu l ler, Th omas 193 8 The Ho ly Stat e and the Profane State . Ed ited b y
M. Wa l t e n. New Yo rk. Or igi na l 1642 .
Fussell, George E. 1949 The En g lish Ru r al Labourer. Th e Batchwort h
Press. London .
1966 The English Dairy Fa rmer 1500- 1900. London.
1971 The English Countrywoman: A Farmhous e Social History A.D. 1500- 1900. New York.
Galenson, David W. 1978 "Middling People or Common Sort?: The Social
Origins of Some Early Americans Reexamined", The William and Mary Quarterly Vol.35, No.3: 499- 540.
Galtsoff, P.S. 1964 The American Oyster, Crassostrea virginica.
Fisheries Bulletin No. 64. U.S. Fish and Wildlife Service. Washington.
Gardiner, Richard 1603 Instructions For Manurin~. Sowin~. and Planting
of Kitchen Gardens. London. Reprinted by
Garine, 1972
Garrow, 1974
Gates, 1975
Gerard, 1633
DE CAPO Press. Amsterdam 1973.
Igor De "The Socio - Cultural Aspects of Nutrition", Ecology of Food and Nutrition 1: 143-163.
Patrick H. "An Ethnohistorical Study of the Powhatan Tribes", The Chesopiean 12, No. 1- 2.
W. Lawrence and Yale Mintz Understanding Climatic Change: A Program Action. National Academy of Sciences. Washington, D.C.
John
For
The Herbal or General History of Plants. London. Dover Publications Reprint, 1975.
Gibson, Joseph W. 1978 Soil Survey of St. Mary's County, Maryland.
Soil Conservation Service. Washington, D.C.
481
Glaser, John D. 1968 Coastal Plain Ge o logy of Southern Maryland.
Glover, 1904
Maryland Geo logical Survey Guidebook No.1.
Thomas An Acc ount of Virginia. B.H. Blackwel l , Oxford . Origina l 1676, London.
Goode, George Br own 190 3 Amer ican Fishes . L . C . Page and Co . Boston .
Go ody , J. 197 1 Deve l opmental Cy c le in Domestic Groups.
Ca mbridg e Unive rsi ty Press. New Yo r k.
Gordon , Cl a i r e C. and Jane E. Buikst ra 198 1 "Soil PH, Bon e Preservation , and Sampl in g Bi a s
a t Mortuary Sites", Amer i can Antiquity 46: 56 6-570.
Gran t , V. 1963 The Origi n o f Adapt at ion s . Columbi a Unive rs ity
P r e s s. New Yo r k.
Gray, Lewis C. 1958 His t ory o f Agricul tur e in the Southern United
States to 1860. Carnagie Institution of Washington Publication No. 430.
Grayson, D.K. 1973 "On the Methodology of Faunal Analys is",
American Antiquity 39: 432 - 439.
1978
1979
1981
Green, 1980
Gugl e r, 1973
"Minimum Numbers and Sampling Size In Vertebrate Faunal Analysis", American Antiquity 43: 53 - 65 .
"On the Quantification of Vertebrate Archaeofaunas", In Advances In Archaeological Method and Theory, Vol. 2: 199- 237. Edited by Michael Schiffer. Academic Press. New York.
"The effe ct of Sample Size on Some Derived Measures in Vertebrate Faunal Analysis", Journal of Archaeological Science 8:77- 88 .
Stanton W. "Broadening Least - Cost Models for Expanding Agricultu r al Systems", In Modeling Change in Prehistoric Subsistence Economies, pp. 209- 242. Academic Press. New York.
Stephen K. "The Philippine Frontier", Papers In Anthro pology, pp. 53 - 68. University of Oklahoma. Norman .
482
Guilday, J.E. 1970 "Animal Remains from Archaeological Excavations
at Fort Ligioner " , Annals of the Carnagie Museum 43: 177- 186.
Gusey, William F. 1976 The Fish and Wildlife Resources of the Middle
Atlant ic Bight. Shell Oil Company. Houston.
Hack, John T. 1957 "Submerged River Systems of the Chesapeake Bay",
Bulletin of the Geological Society of America 68:817- 830.
Hall, Clayton Colman, editor 1910 Narratives of Early Maryland 1633 - 1684. Barnes
and Noble, Inc. New York.
Hall, Richard L. 1973 Soil Survey of Wo r cester County , Maryland. Soil
Conservation Service. Washington, D.C.
Hamilton, William J. 1963 The Mammals of Eastern United States. Hafner
Publishing Co. New York.
Hammond, John 1963 "Leah and Rachel, or The Two Fruitfull Sisters
Virginia and Mary-land", In Peter Force's Tracts and Other Papers, Volume 3. Gloucester, Mass. Original Published 1656.
Hamor, 1957
Ralph A True Discourse of the Present State of Virginia. Virginia State Library. Richmond. Original Published 1615.
Handley, c.o. and C.P. Patton 1941 Wild Mammals of Virginia. Commonwealth of
Virginia Commission of Game and Inland Fisheries. Richmond.
Hardesty, Donald L. 1975 "The Niche Concept: Suggestions for Its Use
in Human Ecology", Human Ecology Vol.3, No.2: 71 - 85.
1977 Ecological Anthropology. John Wiley and Sons. New York.
Hardy, Jerry D. 1972a "Reptiles of the Chesapeake Bay Region",
Chesapeake Science Vol . 13, supplement: 128- 134.
1972b "Amphibians of the Chesapeake Bay Region",
Hardy, 1962
Harman, 1975
Harris, 1979
483
Chesapeake Science Vol.13, supplement: 123 -1 28.
Jerry D. and Romeo J . Mansue ti Checklis t of the Amphibians and Reptiles of Calvert County. Maryland. Chesapeake Biological Laboratory, Solomon s Island, Maryland.
Mary "The Anima l Bones", In Excavat ion s at Richmond Palace, Surry. Post - Medieval Archaeology 9: 103- 116.
Marvin Cultural Materialism: The Struggle for a Science of Culture. Random House. New York.
Harrison, William 1968 The Description of England. Cornell University
Press. Ithica, New York. Reprint of the 1587 edition.
1964 The Present State of Virginia and the College. University of Virginia Press. Charlottesville. Original 1697.
Helwig, J.T. and K.A. Council 1979 S.A.S. Users Guide. S.A.S.Institute. Raleigh,
North Carolina.
Herndon, Melvin 1957 Tobacco In Colonial Virginia. Jamestown 350th
Anniversary Historical Booklet No. 20. Williamsburg.
Hildebrand, S.F. and W.C. Schroeder 1928 The Fishes of Chesapeake Bay. Bulletin of the
United States Bureau of Fisheries. Vol. XLIII. Washington, D.C.
His Majesties Council 1963 "A Declaration of the State of the Colonie and
Affairs in Virginia", In Peter Force's Tracts and Other Papers. Volume 3. Gloucester, Mass. Original Published 1620.
Hoagman, Walter J. 1974 Biology and Management of River Herring and
Shad in Virginia. Virginia Institute of Marine Science. Gloucester Point, Virginia.
Hole, Christina 1953 The English Housewife in the 17th Century.
London.

484
Horn, James 197 9 "Servant Emigrati on to the Chesapeake in the
Seventeenth Century", In The Chesapeake In The Seventeenth Century, pp. 51 - 95. Edited b y Thad Tate a nd David Ammerman . Un iversity o f Nor th Carolina Press. Chapel Hill.
Hubb a rd , Fo y N. 1941 "Cl im a te o f Virginia " , In Climat e a nd Ma n : Th e
Yea r boo k o f Agr icultur e, pp. 1159- 1169. Was h i n gt on, D.C.
Huds on , Jo h n C. 197 7 "Theory and Me thodo l ogy in Comparative Front ie r
Studies", In The Frontier: Comparative Studies, pp. 11- 32. Unive rsi ty of Oklahoma Press. Norman .
Huggin s , P.J. 1970 "Excavations at Stewa rds tone St r eet, Waltham
Abb e y, Es sex 1966", Post - Medieval Archaeology 3: 47 - 99.
Jochim, Michael 1976 Hunter- Gatherer Subsistence and Settlement: a
Predictive Model . Academic Press. New York.
Joerg , 1932
Wolfgang Louis Editor "Pioneer Settlement: Twenty-Six Authors". American Geographical Society Special Publication, No. 14.
Johnson, Deborah 1978 "Floral Remains From the Maine Site". In
Governor's Land Archaeological District Excavations: The 1976 Season, pp. 158-159. By Alain C. Outlaw. Manuscript on File:
Jones, 1956
Jordan, 1979
Kelly, 1972
Virginia Research Center For Archaeology and the St. Mary's City Commission.
Hugh The Present State of Virginia. Richard L. Morton, editor. University of North Carolina Press. Chapel Hill . Original 1724 .
David W. "Political Stability and the Emergence of a Native Elite in Maryland", In The Chesapeake in the Seventeenth Century, pp. 243 - 273. Thad Tate and David Ammerman, editors. University of North Carolina Press. Chapel Hill.
Kevin P. Economic and Social Development of Seventeenth Century Surry County, Virginia. Unpublished Ph.D. Dissertation. University of Washington.
485
197 9 "'In Dispers'd County Plantations', Settlement Patt erns in Seventeenth Century Su rry County, Virgini a " , In The Chesapeake in the Seventeenth Centu ry, pp. 183-205. Thad Tate and David Amme rman, editors. University of North Carolin a Press . Chape l Hill.
Kelso, William M. 1974 Historical Archaeology at Kingsmill: The 1973
Season. An Interim Report~ Manuscript on file, Virginia Research Center for Archaeology.
1976 Historical Archaeology at Kingsmill: The 1974 Season. An Interim Report. Manuscript on file, Virginia Research Center for Archaeology.
Kemp, Richard 1638 "Letter to Lord Baltimore, January 1638". In
The Calvert Papers. Maryland Historical Society Fund Publication No. 28. 1889.
Kent, Bretton W. 1980 Patterns of Oyster Utilization In St. Mary's
City, Maryland Between 1640 and 1740. Report Submitted to the Seagrant Program, University of Maryland. Copy on File, St. Mary's City Commission.
1984 Making Dead Oysters Talk: Techniques for Analyzing Oyster Shells From Archaeological Sites. Maryland Historical Trust. Annapolis.
Kent, Bretton W. and Henry M. Miller n.d. Making Old Oysters Talk: Patterns of
Exploitation at St. Mary's City, Maryland 1640-1740. Manuscript on File, St. Mary's City Commission.
Klein, R.G. 1979 "Stone- Age Exploitation of Animals in Southern
Africa". American Scientist 67: 151-160.
Kingsbury, Susan M. 1935 Records of the Virginia Company. Washington.
Kirch, 1980
Patrick V. "The Archaeological Study of Adaptation: Theoretical and Methodological Issues", In Advances in Archaeological Method and Theory. Michael Schiffer, editor. Volume 3: 101-156.
Kortright, F.H. 1943 The Ducks, Geese and Swans of North America.
American Wildlife Institute. Washington, D.C.

486
Kraft, John C. and Grace S. Brush 1981 A Geological - Paleoenvironmental Analysis of the
Sediments in St. John's Pond and the Nearshore Zone Ne ar Howard's Wharf at S t . Mary ' s City, Maryland . Unpublished Manuscript on File, st . Mary's City Commission.
Lamb , H.H. 197 2 Cl i ma te : Presen t, Past a n d Future, Volume 1 .
Methuen and Comp an y , Lt d. Lo n d o n.
1977 Clima t e: Pres e n t, Past a n d Fu t ure, Vo lume 3. Me thuen an d Comp a ny , Ltd. London.
Laslett, Peter 1973 The World We Hav e Lost . Char l e s Scribne r's
Sons. New York. Second Edition.
Leffert s , H. L. Jr. 197 7 "Fron t ier Demo grap h y: An Introduction", The
Frontier: Comparative Studies , pp. 33-55. University of Okl a h ama P r ess. Norm a n.
Lemon, 1967
James T. "Household Consumption in Eighteenth- Century America and i ts Relationship to Production and Trade: The Si t uation Among Farmer s in Southeastern Pennsylvania", Agricultural History XLI: 59- 70 .
1972 The Best Poor Man' s Country. John s Hopkins
Lewis, 1973
1975
1977
University Press. Baltimore.
Kenneth E. "An Archaeological Consideration of the Frontier", Papers in Anthropology Vol. 14, No.1: 84- 103. University of Oklahoma.
The Jamestown Frontier: An Archaeological View of Colonization. Unpublished Ph . D. Dissertation. University of Oklahoma.
"An Archaeological Perspective on Social Change: The Virginia Frontier". In The Frontier: Comparative Studies, pp. 139- 159. University of Oklahoma Press.
Leyburn, James G. 1935 Frontier Folkways. Yale Univers i ty Press.
New Haven.
Limp, W.F . and V.A. Reidhead 1979 "An Economic Evaluation of the Potential of
Fish Utilization in Riverine Environments",
487
American Antiquity 44: 70 - 78.
Linares, Olga 1976 "Garden Huntin g in the American Tropics". Human
Ecology Volume 4, No.4: 331-349.
Lippson, Alice 1973 The Ches apeake Bay
Natural Resources. Press. Baltimore.
In Mary land: An Atlas of The John s Hopkins Universit y
Lippso n, Alice, et. al. 1979 Environmental Atlas of the Potomac Estuary.
Environmental Center, Martin Marietta Corp. Prepared for the Power Plant Siting Program, Maryland Department of Natural Resources.
Llewellyn, L.M. and C.O. Handley 1945 "The Cottontail Rabbits of Virginia". Journal
of Mamma10gy 26: 379-390.
Lowie, 1938
Robert H. "Subsistence", In General Anthropology, 324. Edited by Franz Boas.
Luccketti, Nicholas 1983 "17th- Century Planters in 'New Pocosin':
pp . 282 -
Excavations at Bennett Farm and River Creek". Notes on Virginia, No.23: 26-29.
Luthy, J. 1961 "Colonization and the Making of Mankind",
Journal of Economic History 21: 483-495.
Lyman, R. Lee 1979 "Available Meat From Faunal Remains: A
Consideration of Techniques", American Antiquity 44: 536-546.
1982 "Archaeofaunas and Subsistence Studies". In Advances in Archaeological Method and Theory Volume 5: 331-393. Edited by M. B. Schiffer. Academic Press. New York.
Main, Gloria L. 1977 "Maryland and the Chesapeake Economy, 1670-
1720", In Law, Society, and Politics in Early Maryland, pp. 134-152. Edited by Aubrey Land, Lois Green Carr, and Edward Papenfuse. The Johns Hopkins University Press. Baltimore.

488
Ma ns ueti, Romeo J. 196 1 "Movements, Reproduction and Mor t ality of the
White Pe rch, Roccus americanus , in the Patuxent Estuary , Maryland", Chesapeake Science 2: 142-205 .
Markham, Gervase 1615 The English Hus - wi fe. London. Reprinted by
DE CAPO Press. Amsterdam. 1973.
1648 Cheape and Good Husbandry. Seventh Edition. London.
McCary, Ben C. 1957 Indians in Seventeenth Century Virginia.
Jamestown 350th Anniversary Historical Booklets, No. 18. Williamsburg.
McCauley, Robert H. 1945 The Repti les of Maryland and the District of
Columbia. Free Pres s Printing Co. Burlington, Vermont .
McClane, A.J. 1965 Field Guide to Saltwater Fishes of North
America. Holt, Rinehart and Winston. New York.
McCormick, Jack and Horace A. Somes, Jr. 1982 The Coastal Wetlands of Maryland. Jack McCormick
and Associates. Chevy Chase, Maryland.
McMillan, R.B. 1976 "The Dynamics of Cultural and Environmental
Change at Rodgers Shelter, Missouri", In Prehistoric Man and His Environment, pp. 211-232. Academic Press. New York.
Meanley, Brooke 1975 Birds and Marshes of the Chesapeake Bay Country.
Tidewater Publishers. Cambridge, Maryland.
Menard, Russell R. 1971 Population Growth and Land Distribution in St.
Mary's County: 1634-1710. Manuscript on File, St. Mary's City Commission.
1975 Economy and Society in Early Colonial Maryland. Unpublished Ph.D. Dissertation. University of Iowa.
1977a "Immigrants and Their Increase: The Process of Population Growth in Early Colonial Maryland". In Law, Society, and Politics in Early Maryland, pp. 88-110. Edited by Aubrey Land, Lois Green Carr, and Edward Papenfuse. The Johns Hopkins

489
Uni versi t y Press . Baltimore.
197 7b " From Servants to Slaves : The Tran sformation of t he Chesapeake Labor System", Southern St udi es 16: 355-3 90.
Me n a r d, 1974
Men a rd, 1983
Menzel, 1943
Michel, 1916
Russe ll R., P .M.G.Harris, and Lois Gree n Carr " Oppo rtun i t y a nd Ine qu a li t y: The Distribu ti on o f We a lth on the Lowe r Wes t ern Sho re o f Mary l an d 1638- 1705", Mary l and Histo r ical Ma gaz ine 69, No.2: 169- 184.
Rus se l l R. "A Sma ll Planter' s P ro f its: The Co l e Est a te a nd the Growth of the Ea rly Chesape a ke Economy", The William and Mary Quarterly XL: 171 - 196.
Robert W. Notes on the Biology an d Commerci a l Fishery of the Catfish on the James River. Unpublished Masters Thesis. College of William and Mary.
Francis Loui s "Report on the Journey of Francis Louis Michel from Berne, Switzerland to Virginia, October 2, l701-December 1,1702". Virginia Magazine of History and Biography 24:1-43 and 113 - 141.
Miller, Austin 1967 "Climate, Vegetation and Soils", In Great
Britain: Geographical Essays, pp . 17 - 32. Edited by J.B . Mitchell. Cambridge University Press.
Miller, David H. and Jerome o. Steffen, Editors 1977 The Frontier: Comparative Studies I. University
of Oklahoma Press. Norman.
Miller, 1983
Miller, 1978
1979
George L. and Silas D. Hurry "Ceramic Supply in an Economically Isolated Frontier Community: Portage County of the Ohio Western Reserve; 1800-1825". Historical Archae ology 17, No.2: 80-92.
Henry M An Analysis of 17th-Century Sheep Burials From the St. John's Site, St. Mary's City, Maryland. Manuscript on File, St. Mary's City Commission.
"Pettus and Utopia: A Comparison of the Faunal Remains From Two Late Seventeenth Century Virginia Households", The Conference on Historic Site Archaeology Papers 13: 158- 180.
Mirarchi, R.E., P . F. Scanlon and R.L. Kirkpatrick 1973 "Observations on the Shedding of Antler by White
490
Tailed Deer in Virginia", The Virginia Journal of Science 24, No.3: 112.
Mitchell, Joseph C. 19 74 "The Snakes of Vi rginia", Virginia Wildlife
February and April. Virginia Commissioners of Game and Inland Fisheries. Richmond.
Moore, 1976
John S. The Good s and Chattels of Our Forefathers. Phillimore and Company. Lon don .
Morgan, Edmund S. 1975 American Slavery, American Free dom: The Ordeal
of Colonial Virginia. W.W. Norton and Company. New York.
Morgan, Mitchell 1977 Ora l History Interview. Typescript on File,
St. Mary' s City Commis sion.
Mosby, Henry S. 1943 The Wild Turkey in Virginia: Its Status, Life
History and Management. Richmond.
Moyer, 1974
Mudar, 1978
W.J. "The Climate of Maryland", In Climates of the States. Volume 1: 157 -1 74. Water Information Center. Port Washington, New York.
Karen "The Effects of Socio- Cultural Variables on Food Preferences in Early 19th Century Detroit". The Conference on Historic Site Archaeology Papers 12: 323-391.
Murdock, George 1969 "Correlations of Exploitative and Settlement
Patterns", In Contributions in Anthropology:
Musick, 1972
Neiman, 1978
1980
Ecological Essays. National Museum of Canada Bulletin No. 230: 129- 150.
J.A. "A Checklist of Fishes of Chesapeake Bay and the adjacent Coastal Plain", In A Checklist of the Biota of Lower Chesapeake Bay, Chapter 5. Virginia Institute of Marine Science. Gloucester Point, Virginia.
Fraser D. "The Social Context of Early Virginia Building". Northern Neck of Virginia Historical Magazine 28, No.1: 2096 - 3128.
The "Manner House" Before Stratford. Robert E.

491
Lee Memorial Ass ociation. Stratfo rd, Virgin i a.
Ne who use, Mi chael E. 1980 Soil Survey o f Gloucester Co un ty, Vi rgi n ia.
Soi l Conserva t ion Ser v ice. Wash i n gto n , D. C .
Noddl e , Barb ara 1975 "The Animal Bones", In Excavation s in Medi eval
South a mpt on 1953 =1969 , Vo l ume 1: 332 - 340. Le icester Univers i t y P r e ss.
No e l Hume, Aud re y 1978 Fo od. Colonial Wi l l i a ms burg Arch aeo logical
Serie s No . 9 . Wi lliams burg.
Norfolk 1932
County Records Lower Norfolk Coun ty Records for 1640 . Vir g inia Magazine of History and Bio g raphy . XL, No . 1: 133- 146.
Odum, Eugene P. 1969 "The Strategy of Ecosystem Development".
Orwin, 1967
Science Vol. 164, No. 3877: 262-270.
C.S. and S.C. Orwin The Open Fields. London.
Osborn, A.J. 1977 "Strandloopers, Mermaids, and other Fairy Tales:
Ecological Determinants of Marine Resource Ut i lization - the Peruvian Case", In For Theory Building in Archaeology, pp. 157-205. Edited by Lewis R. Binford. Academic Press. New York.
Outlaw, Alain C. 1978 Governor's Land Archaeological District Excav
ations: The 1976 Season; An Interim Report. Manuscript on File, Virginia Research Center for Archaeology and the St. Mary's City Commission.
Paradiso, John L. 1969 Mammals of Maryland. North American Fauna, No.
66. Bureau of Sport Fisheries and Wildlife. Washington, D.C.
Pelzer, 1954
Pielou, 1977
Karl J. "Pioneer Settlement in the Asiatic Tropics", American Geographical Society Special Publication No . 29.
E.C. Mathematical Ecology. John Wiley and Sons . New York.

492
Prit char d , D.W. 1967 "What Is An Estuary?: Phys i cal Vi ewpoint " , In
Estuaries, pp . 3 - 5. Edited by G.H. Lauff. Ameri c an Association for the Advanceme n t of Science Publication 83. Washington, D.C .
Pory, J o h n 190 7 "A Lett e r o f John Po r y 1619". In Narrat ives
of Ea rly Virginia 16 06 - 1625 , pp. 279- 288. Edited by Lyon G. Tyler. Ba r ne s and Noble. New Yo r k .
Stephen Rober t Potter, 1982 An Analys i s of Chi c a co an Se t tl ement Pat te rn s .
Unpublishe d Ph.D. Disse rtation. Univ e rsity of North Carol i na. Ch a pe l Hill.
Pyne, Stephen J. 1982 Fire in America. P r in c e ton Un iversity P r ess.
Princeton , Ne w Jerse y .
Quittmeyer, C.L . and J.D. An d r ews 1966 Chesapeake Bay Fisher i e s of Maryland. Wye
Institute. Easton Publishing Co. Easton, Md.
Rappaport, Roy A. 1968 Pigs for the Ancestors: Ritual in the Ecology
of a New Guinea People. Yale University Press. New Haven.
Reed, C.A. 1963 "Osteo-archaeology", In Science in Archaeology,
pp. 204 - 216. Edited by Donald Brothwell and E. Higgs. Thames and Hudson. London.
Reidhead, Van A. 1980 "The Economics of Subsistence Change: A Test of
an Optimization Model", In Modeling Change in Prehistoric Subsistence Economies, pp. 141 - 186. Academic Press. New York.
Reitz, 1979
Reitz, 1983
Elizabeth J. Spanish and British Subsistence Strategies at St. Augustine, Florida and Frederica, Georgia Between 1565 and 1783. Unpublished Ph.D. Dissertation. University of Florida.
Elizabeth and Nicholas Honerkamp "British Colonial Subsistence Strategy on Southeastern Coastal Plain". Historical Archaeology 17: 64-79.
the
Reps, John W. 1972 Tidewater Towns: City Planning in Colonial
Virginia and Maryland. University Press of

4 9 3
Virginia . Char lottesville.
Rice, Vic to r A. 1942 Br e eding and Imp rov ement of Farm Ani mals .
McGraw - Hill . New York.
Ri c hards , C. E. 19 73 "A ge, Gr ow t h an d Di stribution of the Black
Drum (Pogoni a s c r om is ) in Virg inia". Virginia In s titut e of Marine Science Contribution No. 491. Glouce s ter Poin t , Virg i n ia.
Ri chers on, P. J. 1977 "Ecology and Human Eco l o g y: A Comparison of
Theories in the Bio l o g ical and Social Sciences". American Ethnologist 4: 1-26.
Rives, 1890
William C. "A Catalogue of the Birds of the Virginias", Proceedin g s of the Newport Natural History Society, Document 7. Newport, Rhode Island.
Robbins, Chandler and Willet Van Velzen 1968 Birds of Maryland. Maryland Avifauna No.2.
Maryland Ornithologica l Society. Baltimore.
Rolfe, John 1971 A True Relation of the State of Virginia
Lefte by Sir Thomas Dale Knight in May Last 1616. University Press of Virginia. Charlottesville.
Rutman, 1976
1979
Darrett B. and Anita H. Rutman "Of Agues and Fevers: Malaria in the Early Chesapeake", William and Mary Quarterly 33 : 31 - 60.
"'Now Wives and Sons - in- Law': Parental Death in a Seventeenth Century Virginia County". In The Chesapeake in the Seventeenth Century, pp. 153- 182. Edited by Thad Tate and David Ammerman. University of North Carolina Press. Chapel Hill.
Sahlins, Marshall 1964 "Culture and Environment", In Horizons of
Anthropology. Edited by Sol Tax. Aldine Press. Chicago .
Sahlins, Marshall and Elmar Service 1960 Evolution and Culture. University of Michigan
Press . Ann Arbor.
Salerno, Anthony 1979 "The Social Background of Seventeenth- Century
Emigration to America", The Journal of British
494
Studies 19: 31 - 52.
Savage, W.W. and S . I. Thompson, Editors 1979 The Frontier: Comparati ve Studies II. University
of Oklahoma Press. Norman.
Scharf , J . Th omas 1966 History of Maryland. Volume 1. Tradit ion Press.
Hatboro, Pennsylvania. Orig i nal 1879.
Schwartz, Frank 1961 "Catfishes", Maryland Conservationist 38, No.5:
21 - 26.
1962a "Suckers", Chesapeake Biological Laboratory Educational Series No. 58. Solomons Island.
1962b Maryland Turtles. University of Maryland Natural Resources Institite Educational Series No. 79.
1964 "Several Maryland Fishes are Close to Extinction", Maryland Conservationist 12, No.3: 8- 12.
Schorger, A.W. 1973 The Passenger Pigeon: It's Natural History and
Extinction. University of Oklahoma Press. Norman.
Shammas, Carole 1983 "Food Expenditures and Economic Well-Being in
Early-Modern England", The Journal of Economic History XLIII, No.1: 89-100.
Shapiro, S.S. and M.B. Wilk 1965 "An Analysis of Variance Test for Normality
(Complete Samples)", Biometrika 52: 591-611.
Shapiro, Gary 1979 "Early British Subsistence Strategy at Michili
mackinac: A Case Study in Systematic Particularism", The Conference on Historic Sites Archaeology Papers 13: 315-353.
Shelford, Victor E. 1963
Shreve, 1910
The Ecology of North America. University of Illinois Press. Urbana. F., M.A. Chrysler, F.H. Blodgett, F.W. Besley The Plant Life of Maryland. Maryland Weather Service, Volume 3. The Johns Hopkins University Press. Baltimore.
Shrigley, Nathaniel 1963 "A True Relation of Virginia and Mary-land".

Silver, 1963
495
In Peter Force's Tracts and Other Papers. Vol. 3. Gloucester, Mass. Original 1669.
r. A. "The Aging of Domestic Animals". In Science In Archaeology, pp. 250 - 267 . Edited by Donald Brothwell and Eric Higgs. Basic Books. New York.
Simmons, Ernest and Joseph P. Breuer 1962 "A Study of Redfish (Sciaenops ocellata )
Linn ae u s and Black Drum (Pogonias cromis)", Publications of the Institute of Marine Science 80 : 184- 2 11.
Simon, 1957
H.A. Models of Man: Social and Rational. Wiley and Sons. New York.
Simoons, Frederi ck J. 1961 Eat Not This Flesh. Univers ity of Wisconsin
Press. Madison.
Smith, 1975
Bruce D. Middle Mississippi Exploitation of Animal Populations. University of Michigan, Museum of Anthropology Papers 57. Ann Arbor.
Smith, John 1907 "A True Relation", In Narratives of Early
Virginia 1606-1625. Barnes and Noble. New York.
1910 Travels and Works of Captain John Smith. Edited by Edward Arber and A.G. Bradley. John Grant, Edinburgh.
Smith, Nigel J.H. 1981 "Colonization Lessons From a Tropical Forest",
Science 124: 755-761.
Smolek, Michael A. and Wayne E. Clark 1982 Spatial Patterning of 17th-Century Plantations
in the Chesapeake. Paper Presented at the Society for Historical Archaeology Meeting, Philadelphia. Copy on File, St. Mary's City Commission.
Spencer, Maryellen 1982 Food in Seventeenth-Century Tidewater Virginia:
A Method for Studying Historical Cuisines. Unpublished Ph.D. Dissertation. Virginia Polytechnic Institute and State University, Blacksburg.
Spicer, Edward H. Editor 1962 Perspectives in American Indian Culture Change.

496
Un i versity of Chicago Pre s s. Chicago .
Sokal , R. R. and F.J. Roh lf 198 1 Biome t er y . Second Edition . Freeman and Co.
St e e r , 1969
San Francisco .
Francis W. Farm and Co ttage In v e nt ories of Mid- Essex. Phil limo re. Lo nd on.
St eward, Julian H. 195 5 Theory of Cu l ture Chan ge. Un i versity o f Illinoi s
Pr e s s. Urb ana.
St ewart, Robe rt E . 1962 Waterfowl Popu l at i on s i n the Uppe r Chesapeake
Region . Bureau of Sp o r t Fisheries and Wildl i f e, Special Scientif i c Re po r t - Wildlife No. 65. Washington, D. C.
stewart, Robert E . and Chandle r S. Robbins 1958 Birds of Maryland and the District of Columbia.
stone, 1982
Stone, 1977
Straus, 1980
North Amer ica n Faun a No. 62. U.S. Fi s h and Wildlife Service. Washington , D.C.
Garry Wheeler Society , Housing, and Architecture in Early Maryland: John Lewger's St. John's . Unpublished Ph.D. Dissertation. University of Pennsylvania .
Mary "Down Home Eatin, Maryland Style". The Mulberry Tree Papers. Vol. 4, No. 1:8- 15. st. Mary's City.
L.G., G.A. Clark, J. Altuna and J. Ortea "Ice- Age Subsistence In Northern Spain", Scientific American 242: 142 - 152.
Sylvester, David 1969 The Rural Landscape of the Welsh Borderland.
London.
Tansley, A.G. 1949 The British Isles and Their Vegetation.
Cambridge University Press.
Tate, Thad W. 1979 "The Sev e nteenth- Century Chesapeake and Its
Modern Historians". In The Chesapeake in the Seventeenth Century, pp. 3 - 50. Edited by Tate and David Ammerman . University of North Carolina Press. Chapel Hill .

497
Taylor, Walte r P. 1965 The Deer of North America. Wildlife Management
Institute. Washington , D.C.
Thacker , Robert 1894 The History of the Standing British Army.
Thirsk, 1967
Cli ff ord Walton . London.
Joan, Edito r The Ag r arian Histo ry of England and Wal es: 15 00 -1640. Volume 4. Cambridge Univers i ty Press.
Thirsk, Joan and J.P. Cooper 1972 Seventeenth Centu ry Economic Documents.
Clar e ndon Press . Oxford .
Thoday, J.M. 1953 "Components of Fitness", Symposia of the Society
for Experimental Biology. 7: 96-113.
Thomas. David H. 1969 "Great Basin Hun ti ng Patterns: A Quantitati ve
Method for Tr eating Faunal Remains", American Antiquity 34: 392 - 401.
1971 "On Distinguishing Natural From Cultura l Bone In Archaeological S i tes", American Antiquity 36: 366-371.
Thompson. Stephen I. 1970 San Juan Yapacani: A Japanese Pioneer Community
in Eastern Bolivia. Unpublished Ph.D. Dissertation. University of Illinois. Urbana.
1973 Pioneer Colonization: A Cross-Cultural View. Addison-Wesley Module in Anthropology. No.33.
1975 "Success and Failure in Colonization: The Human Factor", Papers in Anthropology 16, No.1: 1- 9. University of Oklahoma.
Topsell, Edward 1607 The Historie of four-footid beastes collected
out of all the volumes of C. Gesner. London.
Trow- Smith, Robert 1957 A History of British Livestock Husbandry to
1700. Routledge and Kegan Paul. London. True, Ransom B.
1976 "Notes on Hogs from the Account of Garrett Minor, 1771 - 1774". Manuscript on File, St. Mary's City Commission.
Truitt, 1929
Reginald, Barton Bean and Henry Fowler The Fishes of Maryland. State of Maryland
Truitt, 1939
498
Conservation Dep artment, Conservation Bulletin No.3 . Annapolis.
Reginald "The Blue Crab of the Chesapeake Bay", In Our Water Resources and Their Conservation. Chesapeake Biological Laboratory Contribution No. 27. Solomons, Maryland.
Tuk ey, J. 1977 Exploratory Dat a Analysis . Addison-Wes ley.
Turner, 1976
Turner, 1893
Tusser, 1812
Reading, Mass.
E. Randolph An Archaeological and Ethnohistorica l Study on the Evolution of Rank Societies in the Virginia Coastal Plain. Unpublished Ph.D. Dissertation. Pennsylvani a State University .
Frederick Jackson "The Significance of the Frontier in American History". Annual Report of the American Historical Association, pp. 199-227.
Thomas Five Hundred Points of Good Husbandry. Edited by William Maver. London. Original 1573.
Tyler, Lyon Gardiner Editor 1907 Narratives of Early Virginia 1606- 1625. Barnes
and Noble. New York
Uerpmann, Hans-Peter 1973 "Animal Bone Finds and Economic Archaeology: A
Critical Study of 'Osteo-Archaeological' Method", World Archaeology 4, No.3: 307-322.
Vandermeer, J. 1981 Elementary Mathematical Ecology. John Wiley
and Sons. New York.
Vokes, 1957
Vokes, 1968
Harold Geography and Geolo~y of Maryland. Waverley Press. Baltimore.
Harold and J. Edwards Geography and Geology of Maryland. Maryland Geological Survey Bulletin 19. Baltimore.
Von Bertalanfly, Ludwic 1968 General Systems Theory. Braziller Press.
New York.
Wallen, C.C. 1970 Climates of Northern and Western Europe. World

499
Survey of Cli matology. Vol. 5,. Elsevier Publis h ing Company. Ams t erdam.
Wal sh , Lo ren a S . 197 7 »Servitude and Op p ortunity in Ch arles Coun ty,
Maryland , 1658-1 705» , I n Law, So ciet y a nd Poli tic s i n Ea r ly Maryl and , pp . 111 - 133 . Edi ted b y Aubre y Land , Loi s Gre en Car r and Edwa r d Papenfuse. Th e John s Hopkins Un i v ersity Press. Baltimore.
197 9 »Ti ll Deth Us Do Part : Ma rri ag e a n d Fami l y in Sev e nt e enth- Century Maryland " , In The Chesapeake I n th e Seventeen th Century, pp .126- 15 2. Ed it ed b y Th a d Tat e and Da vid Ammerman . Uni versity of Nort h Car o lina Press . Chapel Hil l .
Wa lsh, 1 974
Loren a S. and Russel l R. Mena rd "D e a th in t h e Chesapeake: Two Life Tables f o r Men in Early Co l onial Mar y land", Ma ry land Histor i c al Mag a zine 69, No . 2 : 2 11 - 22 7 .
Wash i ngton, Ge o rge 1925 Diaries o f Geor ge Washi n gton . Edi t e d by W. C.
Fitzpatrick. Volume 1. Bost on.
Wass, Marvin L. 1969 Coastal We tlands o f Vi rgi n i a. Special Repo r t
in Applied Marine Science , No. 10. Virginia Institute of Marine Sc i ence, Gloucester Point, Virginia.
Webb, Walter Prescott 1952 The Great Frontier. Hou ghton Mifflin. Boston .
Weeks, 1941
John R. "Climate of Maryland and Delaware", In Climate and Man: The Yearbook o f Agriculture, pp. 904-913. U.S. Departmen t of Ag r iculture. Washington, D.C.
Wharton, James 1957 The Bounty of the Chesapeake: Fishing in
Colonial Virginia. Jamestown 350th Anniversary Historical Booklet, No. 13. Williamsburg.
White, 1910
White, 1959
Andrew "A Relat i on of Maryland" , In Narratives of Early Maryland, pp. 63 - 112. Edited by Clayton Coleman Hall. Barnes a nd Noble. New York.
Leslie The Evolution o f Culture. Mc Graw- Hi ll . New York.

White, 1953
500
T.E. "A Method of Calculating the Die tary Percentage of Various Food Animals Utilized by Aboriginal Peoples " , American Antiguity 18: 396- 398.
Williams, Emilio 1977 "Social Change on the Latin American Frontier",
In The Frontier: Comparati v e Stud ies I, pp. 259-273. Un iversity of Oklahoma Press. No rman.
Wilson, 1973
C. Anne Food and Dri nk in Britain. Penquin Books . Middlesex, England.
Wing, E.S. and A.B. Brown 197 9 Paleonutrition: Method and Theory in Prehistoric
Foodways. Academic Pres s. New York.
Wislocki, George B. 1942 "Studies on the Growth of Deer Antlers I: on
the Structure and Histogensis of the Antlers of the Virginia Deer", American Journal of Anatomy 71: 371 - 415.
Wodenoth, Richard 1947 "A Perfect Description of Virginia", In Peter
Forces Tracts and Other Papers. Peter Smith. New York. Original 1649.
Wolman, 1968
M. Gordon "The Chesapeake Bay: Geology and Geography", Proceedings of the Second Governor's Conference on the Chesapeake Bay 2: 15-17. Annapolis.
Wyckoff, Vertrees J. 1937 "The Sizes of Plantations in Seventeenth
Century Maryland", Maryland Historical Magazine 32: 331 - 339.
Wyman, 1957
Walker D. and Clifton B. Kroeber Editors The Frontier in Perspective. University of Wisconsin Press. Madison.
Related Documents