Universiteit Gent Faculteit Wetenschappen Vakgroep Anorganische en Fysische Chemie Collo¨ ıdale halfgeleider nanokristallen: van synthese tot fotonische toepassingen Colloidal Semiconductor Nanocrystals: From Synthesis to Photonic Applications Iwan Moreels Proefschrift tot het behalen van de graad van Doctor in de Toegepaste Wetenschappen: Toegepaste Natuurkunde Academiejaar 2008-2009

Welcome message from author
This document is posted to help you gain knowledge. Please leave a comment to let me know what you think about it! Share it to your friends and learn new things together.
Transcript
Universiteit GentFaculteit Wetenschappen
Vakgroep Anorganische en Fysische Chemie
Colloıdale halfgeleider nanokristallen:van synthese tot fotonische toepassingen
Colloidal Semiconductor Nanocrystals:From Synthesis to Photonic Applications
Iwan Moreels
Proefschrift tot het behalen van de graad vanDoctor in de Toegepaste Wetenschappen:
Toegepaste NatuurkundeAcademiejaar 2008-2009

Promotoren:prof. dr. ir. Z. Hens Universiteit Gent,
Anorganische en fysische chemieprof. dr. ir. D. Van Thourhout Universiteit Gent, INTEC
Overige leden van de examencommissie:prof. dr. ir. D. Dezutter, voorzitter Universiteit Gent, INTECdr. ir. G. Roelkens, secretaris Universiteit Gent, INTECprof. dr. J. Martins Universiteit Gent,
Organische chemieprof. dr. ir. P. Kockaert Universite Libre de Bruxellesprof. dr. W. Heiss Johannes Kepler Universitat
Linz, Austriadr. A. Houtepen Technische universiteit Delft,
Nederland
Universiteit GentFaculteit Wetenschappen
Vakgroep Anorganische en fysische chemieKrijgslaan 281–S129000 GentBELGIUM
Dit werk kwam tot stand in het kader van een specialisatiebeurstoegekend door het instituut voor de aanmoediging van innovatiedoor wetenschap en technologie in Vlaanderen (IWT–Vlaanderen).


Preface
Over the past five years, I have had the wonderful opportunity towork in the relatively new field of nanoscience and -technology,with all the diversity and challenges that are associated with it.When I entered the world of colloidal nanocrystals, many aspectsof their properties and potential applications were yet unexplored,and with the freedom given to me by my supervisors Zeger andDries, I started a journey which led to a diverse range of topics.Needless to say that, when this freedom seemed to yield morequestions than answers, they were always there for me with adviceand ideas which put me back on the right track.
Off course, when tackling this diversity, collaboration is thekey. I would not have been able to compile this text withoutthe fruitful collaborations that were set up over the last few years.With the ever present risk of forgetting someone, I would thereforelike to thank the many people for their contributions to this work.My one month stay with nanoMIR group of prof. Wolfgang Heiss,where Maksym helped me out with the optical investigation ofmid-infrared emitting PbSe nanocrystals, gave a great impulse tomy research. I must admit that working in a different environment,with new people and new ideas, proved to be very valuable. Inthis respect, I also thank prof. Michael Forst for giving me theopportunity to investigate the hybrid photonic devices during astay of one week in his research group in Aachen.
Closer to home, two other groups have always made me feelvery welcome when I was working there. The investigation ofthe nonlinear optical properties could not have been performed
i
Preface
without the close collaboration with prof. Pascal Kockaert of theOpera group in Brussels, and for the NMR measurements I couldstrongly rely on the support –on many fronts– of prof. Jose Mar-tins and his group here in Ghent. Finally, I would also like tothank the people from the Lumilab of prof. Dirk Poelman, whereI have measured my absorbance and luminescence spectra duringthe first three years of my research. The absorbance spectrum ofa suspension of colloidal nanocrystals is one of the most basic andessential measurements in our field, yet our NIR equipment waslimited at that time, so I am most grateful for their support.
Some of the data or measurements presented here are con-tributed by fellow colleagues and students from our group. I wouldtherefore like to thank Karel for his dedicated TEM measurementsand for providing me the data on the Q-InP sizing curve, Tom forhis work on the PbS nanocrystal synthesis and Z-scan measure-ments, Timucin, Ruben and Guillaume for their work on the syn-thesis of core-shell nanocrystals and Bram for providing the PbTenanocrystal absorbance spectra and the simulations of the waveg-uide mode profiles. Some external partners also provided valuableinput: ICP-MS measurements on our particles were performed byDavid (department of analytical chemistry, UGent), and the RBSmeasurements were performed by Dries (research team nuclear andradiation physics, K.U. Leuven). The time-resolved luminescencespectra were measured in collaboration with prof. Rik Van Deun(department of chemistry, K.U. Leuven). In order to comparethe optical properties of our nanocrystals with theoretical data,prof. Guy Allan (IEMN, ISEN Department, Lille, France) kindlyprovided me the results of his tight-binding calculations.
I would also like to mention two technicians who gave muchappreciated assistance. For XRD measurements, I could handin my samples to Olivier and rest assured that a few days later,I would receive a mail with the resulting data. In addition, inour department Bart was always prepared to fabricate the mostdemanding custom-made equipment, such as sample holders andoptical cells, to ensure that experiments could be performed underjust the right conditions.
ii

But all of this would not have been possible without the strongsupport of my family and friends. I thank my parents, my sistersand my good friend Jelle from the bottom of my heart for believingin me, listening to me when I tried to convince them that colloidalnanocrystals might one day change the world, and helping me topursue my dream.
And to you, my sweet Joke, I dedicate this work. More thanever, I realize that I would never have been able to complete itwithout your everlasting love, help and friendship.
Iwan MoreelsGent, 02 februari 2009
iii

iv
Nederlandstalige samenvatting
1 Introductie: Synthese van colloıdale na-nokristallen
We hebben Q-PbS en Q-PbSe nanokristallen gesynthetiseerd vianatte chemische technieken. Hun kristalstructuur wordt bepaaldmet X-stralen diffractie en hoge resolutie transmissie elektronenmicroscopie (TEM), waaruit we kunnen besluiten dat de nano-kristallen dezelfde structuur en roosterconstante hebben als hunrespectievelijke bulk materialen. De TEM metingen laten ons bo-vendien toe om de gemiddelde diameter en standaardafwijking tebepalen. De diameter van de nanokristallen is vervolgens gecor-releerd aan de verboden zone van het materiaal. Via deze ijklijnkan de nanokristal diameter rechtsreeks bepaald worden uit eeneenvoudige bepaling van de spectrale positie van de eerste absorp-tiepiek.
We berekenen de molaire extinctiecoefficient door het opmetenvan de atomaire concentratie van anionen en kationen met behulpvan inductief gekoppeld plasma massaspectrometrie (ICP-MS). Inhet geval van Q-PbS zijn we niet in staat om de anion concentratieop te meten. We gebruiken daarom Rutherford terugverstrooiingspectroscopie om de Pb:S verhouding te bepalen. Uit de atomaireconcentraties wordt de concentratie aan nanokristallen berekend.De absorbantie van een gelijke hoeveelheid nanokristallen geeftdan de molaire extinctiecoefficient. Hiermee kan vervolgens denanokristal concentratie bepaald worden uit de absorbantie, viade wet van Beer–Lambert.
v

Nederlandstalige samenvatting
Q-PbS zijn stabiel onder atmosferische omstandigheden, ter-wijl Q-PbSe snel oxideren. Om dit te vermijden, groeien we eenanorganische CdSe schil rond de Q-PbSe. Metingen van de ab-sorbantie tonen inderdaad aan dat de blauw verschuiving van deeerste absorptiepiek sterk afneemt na bescherming van de deeltjesmet een CdSe schil.
2 Oppervlakchemie
Organische liganden maken een essentieel deel uit van een col-loıdaal nanokristal. De oppervlakchemie van de nanokristallenwordt zorgvuldig bestudeerd met behulp van nucleaire magne-tische resonantiespectroscopie (NMR). We hebben verschillendeNMR technieken (kwantitatieve 1H NMR, correlatie, diffusie ge-controleerde en nucleaire Overhauser effect spectroscopie) toege-past om de liganden te identificeren en hun dynamica te bepalen.
Q-InP zijn bedekt met tri-n-octylfosfine oxide (TOPO), sterkgebonden aan het nanokristal oppervlak. De bedekkingsgraadbedraagt 20% van de beschikbare adsorptieplaatsen. We stelleneen adsorptie/desorptie evenwicht vast tussen vrij en gebondenTOPO, wat gemodelleerd wordt door een Fowler isotherm.
Q-PbSe zijn bedekt door sterk gebonden oleınezuur (OA) li-ganden. Het aantal OA liganden komt overeen met het aantalexces Pb atomen op het oppervlak van het nanokristal. Het Pb-exces wordt bepaald uit ICP-MS metingen, in combinatie met eenniet-stoichiometrisch model van het nanokristal. TOP ligandenobserveren we niet, wat overeenstemt met de afwezigheid van Seatomen op het oppervlak van het nanokristal.
In tegenstelling met Q-InP en Q-PbSe, tonen de oleylamineliganden van de Q-PbS nanokristallen een snelle dynamica tus-sen vrij en gebonden toestand. Als gevolg hiervan kunnen we zemakkelijk uitwisselen voor sterk gebonden OA liganden. Na deuitwisseling, verhoogt de luminescentie van Q-PbS met een factor3–6.
vi

3 Optische eigenschappen
De optische eigenschappen van colloıdale lood chalcogenide nano-kristallen worden onderzocht met behulp van het Maxwell-Garnett(MG) model. De absorptiecoefficient µ wordt bepaald uit het ab-sorbantie spectrum, via de gekende diameter en concentratie vande deeltjes. Bij energieen ver boven de verboden zone, tonen zo-wel de Q-PbS als de Q-PbSe data aan dat µ niet beınvloed wordtdoor kwantum opsluiting. De experimentele waarden stemmengoed overeen met de theoretische absorptiecoefficient, bepaald uitbulk halfgeleider waarden voor de dielektrische functie.
We observeren echter sterke kwantum opsluitingseffecten voorde optische transitie over de verboden zone. Naast een blauw ver-schuiving met afnemende diameter, neemt de absorptiecoefficientkwadratisch toe, wat aantoont dat kleinere deeltjes efficienter lichtabsorberen. De oscillator sterkte fif van de transitie wordt bere-kend uit µ. De experimentele data komen goed overeen met the-oretische berekeningen; beide vertonen een lineaire groei van fif
met de diameter van de deeltjes. De waarden voor Q-PbS zijn ech-ter 37% kleiner dan voor Q-PbSe, mogelijk door kleinere kwantumopsluitingseffecten in PbS.
We berekenen de dielektrische functie ε van colloıdale nano-kristallen via de Kramers-Kronig relaties. Door het niet-lineaireverband tussen µ en ε moeten we een iteratieve procedure ont-wikkelen om ε te berekenen. The optische dielektische constanteis vergelijkbaar met bulk voor de drie materialen, wat aantoontdat kwantum opsluiting hier geen rol speelt. We observeren ech-ter sterke kwantum opsluitingseffecten voor de E0 en E1 transitie.E1 vertoont een blauw verschuiving met afnemende diameter. Bo-vendien, in het geval van Q-PbSe en Q-PbTe, neemt de oscillatorsterkte van de transitie toe in vergelijking met de E2 transitie.
De niet-lineaire eigenschappen van de nanokristallen wordenbepaald met de Z-scan techniek. Het n2-spectrum is duidelijkgecorreleerd aan het absorbantie spectrum van de deeltjes, voorzowel Q-PbS als Q-PbSe. Dit suggereert reeds dat het opvullenvan het eerste energieniveau met elektronen aanleiding geeft tot
vii
Nederlandstalige samenvatting
een sterke niet-lineaire brekingsindex. De elektronische oorsprongvan n2 wordt verder bevestigd door de observatie van verzadigingvan de verandering in brekingsindex, en verzadiging van de ab-sorptiecoefficient bij hoge optische intensiteiten.
Q-PbS en Q-PbSe hebben beide een vergelijkbaar prestatie–kengetal (gelijk aan 3–4) rond 1550 nm. Deze waarde is eengrootte-orde hoger dan de waarde voor Si (0.37) of GaAs (0.1)rond deze golflengten, wat aantoont dat lood chalcogenide nano-kristallen efficiente niet-lineaire materialen zijn.
4 Integratie met Silicium fotonische com-ponenten
Doordat de chemische synthese een suspensie van deeltjes oplevert,kunnen verschillende natte depositie technieken gebruikt wordenom de nanokristallen op een substraat te deponeren. We onder-zoeken er drie:
We kunnen een monolaag van Q-PbSe succesvol lokaal afzettenop vlakke substraten en SOI componenten, via Langmuir-Blodgettdepositie, in combinatie met optische lithografie. Jammer genoegtoont een TEM studie aan dat de nanokristallen samensmeltentijdens de vorming van de laag, wat ongunstig is voor de optischeeigenschappen van het materiaal.
De lokale depositie van een dichtst-gepakte laag van Qdots, viahet bevloeien van een substraat met een Qdot suspensie en het la-ten verdampen van het solvent, is ook succesvol. Echter, wanneerze afgezet worden op de SOI componenten, ontstaan scheuren inde laag. Deze hybride componenten zullen bijgevolg veel optischeverliezen vertonen, wat evenmin gewenst is.
Het spincoaten van Qdot gedopeerde polystyreen filmen geeftde beste resultaten. We bekomen optisch vlakke en homogene dun-ne filmen. Ze worden afgezet op een SOI band-sper filter en detransmissie karakteristieken van deze hybride componenten wor-den onderzocht. Via de transmissiespectra berekenen we de trans-missie per circulatie a en transmissie van de koppel sectie t van demicro-ring resonator. We observeren een duidelijk verband tussen
viii

het verlies van de ring en de absorptiecoefficient van de nanokris-tallen, wat aantoont dat het licht dat propageert door de fotonischegolfgeleider, een sterke interactie vertoont met de afgezette Qdots.
Bij hoge optische intensiteiten tonen de Qdot–SOI hybride fil-ters een blauw verschuiving van de resonantie, in combinatie meteen toename van a. Echter, in het geval van Q-PbSe, is deze blauwverschuiving permanent, en in het geval van Q-PbS evolueert hetspectrum slechts traag terug naar het oorspronkelijke spectrum,opgemeten bij lage intensiteit. Beide resultaten doen vermoedendat de nanokristallen in de dunne film opladen, wat in het gevalvan Q-PbSe mogelijk zelfs aanleiding geeft tot een snelle oxidatievan de deeltjes.
Het werk wordt besloten met verschillende suggesties om deniet-lineaire eigenschappen van Qdot–SOI hybride componentente verbeteren.
ix

x

English summary
1 Introduction: Colloidal nanocrystal syn-thesis
Q-PbS and Q-PbSe nanocrystals are synthesized using the chem-ical hot injection method. We determine their crystal structurewith X-ray diffraction and high resolution transmission electronmicroscopy (TEM), from which we conclude that the nanocrystalshave the same structure and lattice parameter as their respectivebulk materials. In addition, TEM measurements allow us to de-termine the mean nanocrystal diameter and size dispersion. Thenanocrystal size is correlated with the band gap of the material toconstruct a sizing curve.
We determine the molar extinction coefficient by measuringatomic anion and cation concentrations with inductively coupledplasma mass spectrometry (ICP-MS). In the case of Q-PbS, weare not able to determine the anion concentration with ICP-MS.Therefore, we use Rutherford backscattering spectroscopy to de-termine the Pb:S ratio. Knowing the atomic concentrations, thenanocrystal concentration is calculated. The absorbance of anequal amount of nanocrystals then yields the molar extinction co-efficient. Both the sizing curve and the molar extinction coefficientenable us to conveniently determine the particle size, size disper-sion and concentration from a single absorbance measurement.
Q-PbS are air-stable, while Q-PbSe show a fast oxidation un-der ambient conditions. To prevent this, we grow an inorganicCdSe shell around the Q-PbSe by a cation exchange mechanism.
xi
English summary
Absorbance measurements indeed reveal that the blue shift of thefirst absorption peak of Q-PbSe is strongly reduced after protec-tion of the particles by a CdSe shell.
2 Surface Chemistry
The organic ligands are an essential part of a colloidal nanocrystal.Therefore, we carefully study the nanocrystal surface chemistry,using nuclear magnetic resonance spectroscopy (NMR). SeveralNMR techniques (quantitative 1H NMR, correlation spectroscopy,diffusion ordered spectroscopy and nuclear Overhauser effect spec-troscopy) are applied to identify and quantify the nanocrystal li-gands and ligand dynamics.
Q-InP are capped by tri-n-octylphosphine oxide (TOPO),tightly bound to the nanocrystal surface. The ligand surfacecoverage amounts to 20% of the available adsorption sites. Weobserve an adsorption/desorption equilibrium between free andbound TOPO, which is modeled by a Fowler isotherm.
Q-PbSe are capped by tightly bound oleic acid (OA) ligands.The number of OA ligands agrees with the number of excess Pbatoms present on the nanocrystal surface. The Pb-excess is de-termined from the ICP-MS measurements, in combination with anon-stoichiometric nanocrystal model. We detect no TOP ligands,in agreement with the absence of surface Se atoms.
In contrast to Q-InP and Q-PbSe, the oleylamine ligands ofQ-PbS show a fast ligand dynamics. Consequently, we achieve afacile ligand exchange to tightly bound OA. After ligand exchange,the Q-PbS luminescence yield is boosted by a factor of 3-6.
3 Optical properties
We investigate the optical properties of colloidal lead chalcogenidenanocrystals, using the Maxwell-Garnett (MG) model. The nano-crystal absorption coefficient µ is determined from the absorbancespectrum, knowing the particle size and concentration. At energiesfar above the band gap, both Q-PbS and Q-PbSe data show that
xii
µ is not influenced by quantum confinement. Experimental valuesagree well with the theoretical absorption coefficient, determinedusing bulk values for the dielectric function.
In contrast, we observe strong quantum confinement effects forthe band gap transition. In addition to a blue shift with decreas-ing size, the absorption coefficient increases quadratically, showingthat smaller particles are more efficient absorbers. The oscillatorstrength fif of the band gap transition is calculated from µ. Ex-perimental data agree well with theoretical tight-binding calcula-tions, demonstrating that fif increases linearly with the particlesize. Values for Q-PbS are however 37% smaller than for Q-PbSe,possibly due to a reduced quantum confinement effect in PbS.
We calculate the dielectric function ε of colloidal lead chalcoge-nide nanocrystals using the Kramers-Kronig relations. Due to thenonlinear relation between µ and ε, we have to develop an iterativeprocedure to calculate ε. The optical dielectric constant is compa-rable to bulk values for all three materials, showing that quantumconfinement plays no role here. However, we observe strong quan-tum confinement effects for the E0 and E1 transition. E1 showsa blue shift with decreasing size. In the case of Q-PbSe and Q-PbTe, this is accompanied by an increase in oscillator strengthwith respect to the E2 transition.
We determine the nonlinear optical properties of colloidal leadchalcogenide nanocrystals using the Z-scan technique. The n2-spectrum is clearly correlated with the nanocrystal absorbancespectrum, for both Q-PbS and Q-PbSe. This suggests that state-filling of the quantum dots discrete energy levels leads to a high,and tunable, nonlinear refractive index. The electronic origin isfurther confirmed by the observation of a saturation of the changein refractive index and a saturation of the absorption coefficientat high optical intensities.
Both Q-PbS and Q-PbSe have a comparable figure of merit (of3-4) around 1550 nm. This value is an order of magnitude largerthan the value of Si (0.37) or GaAs (0.1) around these wavelengths,showing that colloidal lead chalcogenide nanocrystals are efficientnonlinear materials.
xiii

English summary
4 Integration with Silicon-on-Insulatorphotonic devices
As the chemical synthesis yields a suspension of particles, variouswet deposition techniques can be used to deposit the nanocrystalson a substrate. We examine three techniques:
Langmuir-Blodgett (LB) deposition of a monolayer of Q-PbSeon flat substrates and SOI devices is successfully combined withoptical lithography to deposit the particles on specific areas of asubstrate. Unfortunately, a TEM study of a typical monolayerreveals that the particles fuse together during LB layer formation.
Local dropcasting of a thick close-packed Qdot layer on a flatsubstrate is again successful. However, when depositing them ontop of SOI devices, cracks appear in the layer. These hybrid de-vices experience severe optical losses, which is again undesirable.
Spincoating of Qdot doped polystyrene films produces the bestresults. We obtain optically flat and homogeneous thin films. Wedeposit them on an SOI racetrack notch filter and investigate thetransmission characteristics of these hybrid devices. We use thetransmission spectra to calculate the transmission per round tripa and transmission of the coupling section t of the micro-ring res-onator. We observe a clear correlation between the loss of the ringand the nanocrystal absorption coefficient, demonstrating thatthe light propagating through the photonic wire strongly inter-acts with the deposited Qdots.
At high optical intensities, the Qdot–SOI hybrid notch filtersshow a blue shift of the resonance wavelength, in combination withan increase in a. However, in the case of Q-PbSe, this blue shiftis permanent, and in the case of Q-PbS, the spectrum only slowlyevolves back to the original low intensity transmission spectrum.Both results suggest a charging of the Qdot doped thin film, inthe case of Q-PbSe possibly even leading to a fast oxidation of theparticles.
The work is concluded by several suggestions to improve thenonlinear properties of Qdot–SOI hybrid devices.
xiv

English text


Contents
Preface i
Nederlandstalige samenvatting v
English summary xi
Contents xvii
List of Figures xxv
List of Tables xxxi
List of Acronyms xxxiii
I General introduction 11.1 History of nanotechnology . . . . . . . . . . . . . 11.2 Quantum effects in semiconductor nanocrystals . 21.3 Outline of the thesis . . . . . . . . . . . . . . . . 5
Bibliography 8
Part 1: Synthesis of colloidal lead chalcogenide nanocrystals 10
II Synthesis of PbSe nanocrystals 132.1 Near-infrared PbSe nanocrystals . . . . . . . . . 13
2.1.1 Synthesis . . . . . . . . . . . . . . . . . . 132.1.2 Structure analysis . . . . . . . . . . . . . 142.1.3 Optical properties . . . . . . . . . . . . . 15
xvii
Contents
2.1.4 Sizing curve . . . . . . . . . . . . . . . . . 152.2 Determination of the Q-PbSe concentration . . . 19
2.2.1 Sample purity . . . . . . . . . . . . . . . . 192.2.2 ICP-MS measurements . . . . . . . . . . . 212.2.3 The molar extinction coefficient . . . . . . 23
2.3 Mid-infrared PbSe nanocrystals . . . . . . . . . . 242.3.1 Evolution of the Q-PbSe size and concen-
tration . . . . . . . . . . . . . . . . . . . . 242.3.2 Synthesis of MIR Q-PbSe . . . . . . . . . 27
2.4 Improving the Q-PbSe stability . . . . . . . . . . 282.4.1 PbSe|CdSe core-shell nanocrystal synthesis 282.4.2 Structure analysis . . . . . . . . . . . . . 302.4.3 Stability under ambient atmosphere . . . 32
2.5 Conclusions . . . . . . . . . . . . . . . . . . . . . 33
III Synthesis of PbS nanocrystals 353.1 Q-PbS synthesis . . . . . . . . . . . . . . . . . . 353.2 Structure analysis . . . . . . . . . . . . . . . . . 373.3 Optical properties . . . . . . . . . . . . . . . . . 383.4 Sizing Curve . . . . . . . . . . . . . . . . . . . . 393.5 Concentration determination . . . . . . . . . . . 40
3.5.1 Rutherford backscattering spectroscopy . 403.5.2 The molar extinction coefficient . . . . . . 43
3.6 Conclusions . . . . . . . . . . . . . . . . . . . . . 44
Bibliography 47
Part 2: Surface chemistry of colloidal semiconductor nanocrys-tals 50
IV Surface chemistry of InP nanocrystals 594.1 Q-InP synthesis and elemental properties . . . . 594.2 Identification of the Q-InP ligands . . . . . . . . 61
4.2.1 Introduction . . . . . . . . . . . . . . . . 614.2.2 Diffusion NMR . . . . . . . . . . . . . . . 63
xviii

4.2.3 Ligand identification . . . . . . . . . . . . 664.2.4 Disorder in the capping layer . . . . . . . 67
4.3 Quantification of the Q-InP ligands . . . . . . . . 684.3.1 TOPO ligand density . . . . . . . . . . . 684.3.2 Adsorption/desorption equilibrium . . . . 70
4.4 Fowler isotherm . . . . . . . . . . . . . . . . . . . 714.5 Conclusions . . . . . . . . . . . . . . . . . . . . . 75
V Surface chemistry of PbSe nanocrystals 775.1 Ligand identification: only OA ligands . . . . . . 77
5.1.1 1H NMR spectra . . . . . . . . . . . . . . 775.1.2 Diffusion NMR . . . . . . . . . . . . . . . 795.1.3 Ligand identification . . . . . . . . . . . . 805.1.4 Influence of OA on the Q-PbSe synthesis 82
5.2 Ligand Quantification . . . . . . . . . . . . . . . 835.2.1 Ligand density . . . . . . . . . . . . . . . 835.2.2 Q-PbSe surface composition . . . . . . . . 83
5.3 Oxidation of a Q-PbSe suspension . . . . . . . . 865.4 Conclusions . . . . . . . . . . . . . . . . . . . . . 88
VI Surface chemistry of PbS nanocrystals 916.1 Introduction . . . . . . . . . . . . . . . . . . . . . 916.2 Fast ligand dynamics: theoretical basis . . . . . . 92
6.2.1 Fast dynamics in 1H NMR and DOSY . . 926.2.2 The nuclear Overhauser effect . . . . . . . 94
6.3 Q-PbS Ligand identification . . . . . . . . . . . . 976.3.1 1H NMR and DOSY . . . . . . . . . . . . 976.3.2 Qdot NOE spectra . . . . . . . . . . . . . 97
6.4 Capping exchange to OA . . . . . . . . . . . . . 1006.4.1 Q-PbS synthesis with added TOP . . . . 1006.4.2 OA capped Q-PbS . . . . . . . . . . . . . 1016.4.3 Q-PbS luminescence . . . . . . . . . . . . 103
6.5 Conclusions . . . . . . . . . . . . . . . . . . . . . 103
Bibliography 109
xix
Contents
Part 3: Optical properties of colloidal semiconductor nanocrys-tals 112
VII Linear optical properties of colloidal lead chalcogenide nano-crystals 115
7.1 Introduction . . . . . . . . . . . . . . . . . . . . . 115
7.2 The Maxwell-Garnett model . . . . . . . . . . . . 1167.2.1 Basics optics . . . . . . . . . . . . . . . . 1167.2.2 Derivation of µ using the MG model . . . 117
7.3 The Q-PbSe absorption coefficient . . . . . . . . 1207.3.1 Absorption coefficient at high energies . . 1207.3.2 Absorption coefficient at the band gap . . 123
7.4 The oscillator strength . . . . . . . . . . . . . . . 1247.4.1 Theoretical calculation . . . . . . . . . . . 1247.4.2 Experimental results . . . . . . . . . . . . 126
7.5 Comparison with Q-PbS . . . . . . . . . . . . . . 1277.5.1 Q-PbS absorption coefficient at high ener-
gies . . . . . . . . . . . . . . . . . . . . . 1277.5.2 Optical properties at the band gap . . . . 1287.5.3 The oscillator strength . . . . . . . . . . . 129
7.6 Conclusions . . . . . . . . . . . . . . . . . . . . . 130
VIII The dielectric function of colloidal lead chalcogenide nano-crystals 131
8.1 Interpretation of the Qdot absorption spectrum . 1318.1.1 Importance of the local field factor . . . . 1318.1.2 Problems with second derivative analysis 132
8.2 The Kramers–Kronig relations . . . . . . . . . . 1368.2.1 Introduction . . . . . . . . . . . . . . . . 1368.2.2 Continuous KK-relations . . . . . . . . . 1368.2.3 Discrete KK-relations . . . . . . . . . . . 1378.2.4 Calculation of the dielectric function:
Iterative Matrix Inversion method . . . . 139
8.3 Application to lead chalcogenide nanocrystals . . 143
xx
8.3.1 Optical properties of bulk lead chalcoge-nides . . . . . . . . . . . . . . . . . . . . . 144
8.3.2 Expansion of the nanocrystal absorption co-efficient . . . . . . . . . . . . . . . . . . . 145
8.3.3 IMI calculation for bulk PbS and PbTe . 1468.3.4 Results on colloidal nanocrystals . . . . . 147
8.4 Conclusions . . . . . . . . . . . . . . . . . . . . . 151
IX Nonlinear optical properties of colloidal lead chalcogenide na-nocrystals 1539.1 Introduction . . . . . . . . . . . . . . . . . . . . . 1539.2 Optical nonlinearities in semiconductors . . . . . 1549.3 The Z-scan technique . . . . . . . . . . . . . . . . 156
9.3.1 Theory . . . . . . . . . . . . . . . . . . . 1569.3.2 Laser beam characterization . . . . . . . . 1589.3.3 Derivation of n2 and β from the Z-scan . 1609.3.4 Practical calculations . . . . . . . . . . . 1639.3.5 Thermal effects . . . . . . . . . . . . . . . 164
9.4 The n2-spectrum of lead chalcogenide nanocrystals 1659.4.1 Introduction . . . . . . . . . . . . . . . . 1659.4.2 Femtosecond pulsed excitation . . . . . . 1669.4.3 Picosecond pulsed excitation . . . . . . . 1689.4.4 Thermal nonlinearities . . . . . . . . . . . 168
9.5 Electronic origin of n2 . . . . . . . . . . . . . . . 1709.5.1 Saturation of the change in refractive index 1709.5.2 Absorption saturation . . . . . . . . . . . 174
9.6 Conclusions . . . . . . . . . . . . . . . . . . . . . 175
Bibliography 181
Part 4: Integration of colloidal semiconductor nanocrystals withSilicon-on-Insulator photonic devices 184
X Deposition techniques 18710.1 Introduction . . . . . . . . . . . . . . . . . . . . . 18710.2 Langmuir-Blodgett deposition . . . . . . . . . . . 187
xxi
Contents
10.2.1 Deposition on flat substrates . . . . . . . 18710.2.2 Local deposition on silicon and SOI devices 18910.2.3 Oriented attachment . . . . . . . . . . . . 190
10.3 Nanocrystal dropcasting . . . . . . . . . . . . . . 19010.4 Quantum dot – polymer composite spincoating . 192
10.4.1 Thin film thickness determination . . . . 19210.4.2 Nanocrystal incorporation . . . . . . . . . 19410.4.3 Calculation of the Qdot volume fraction . 195
10.5 Conclusions . . . . . . . . . . . . . . . . . . . . . 197
XI Colloidal quantum dot – Silicon-on-Insulator hybrid photonicdevices 19911.1 Introduction . . . . . . . . . . . . . . . . . . . . . 19911.2 Transmission spectrum of an uncoated SOI notch
filter . . . . . . . . . . . . . . . . . . . . . . . . . 20011.2.1 Derivation of the notch filter transmission
characteristics . . . . . . . . . . . . . . . . 20011.3 Transmission of a hybrid Qdot–SOI notch filter . 202
11.3.1 Deposition and characterization . . . . . . 20211.3.2 Efficient tuning of the transmission . . . . 205
11.4 Theoretical evaluation of the optical nonlinearities 20711.4.1 Nonlinear refractive index . . . . . . . . . 20711.4.2 Absorption saturation . . . . . . . . . . . 209
11.5 Pitfalls at high optical intensities . . . . . . . . . 21011.5.1 Thermal effects in SOI ring resonators . . 21011.5.2 Quantum dot charging . . . . . . . . . . . 21111.5.3 Prospects . . . . . . . . . . . . . . . . . . 213
11.6 Conclusions . . . . . . . . . . . . . . . . . . . . . 214
Bibliography 217
XII General Conclusions 21912.1 Nanocrystal synthesis . . . . . . . . . . . . . . . 21912.2 Surface chemistry . . . . . . . . . . . . . . . . . . 22012.3 Optical properties . . . . . . . . . . . . . . . . . 223
xxii
12.3.1 Linear optical properties . . . . . . . . . . 22312.3.2 Nonlinear optical properties . . . . . . . . 225
12.4 Integration with SOI photonic devices . . . . . . 226
List of Publications 229
xxiii

xxiv
List of Figures
1.1 Series of luminescent CdSe nanocrystals . . . . . 31.2 Number of nanocrystal publications . . . . . . . 4
2.1 Q-PbSe XRD pattern and HR-TEM image . . . 142.2 Q-PbSe series of absorbance spectra and lumines-
cence spectrum . . . . . . . . . . . . . . . . . . . 162.3 Q-PbSe TEM overview and size determination . 172.4 Q-PbSe sizing curve . . . . . . . . . . . . . . . . 182.5 Sample purity determination with NMR . . . . . 212.6 Q-PbSe molar extinction coefficient . . . . . . . . 232.7 Q-PbSe evolution of size and size dispersion . . . 252.8 Q-PbSe evolution of concentration . . . . . . . . 262.9 Mid-infrared Q-PbSe nanocrystals . . . . . . . . 272.10 Q-PbSe core-shell nanocrystals . . . . . . . . . . 292.11 Q-PbSe core-shell HR-TEM images . . . . . . . . 312.12 Q-PbSe stability under ambient atmosphere . . . 33
3.1 Q-PbS absorbance spectra . . . . . . . . . . . . . 363.2 Q-PbS XRD pattern and HR-TEM image . . . . 373.3 Q-PbS series of absorbance spectra and lumines-
cence spectrum . . . . . . . . . . . . . . . . . . . 383.4 Q-PbS sizing curve . . . . . . . . . . . . . . . . . 393.5 Sample purity determination with NMR . . . . . 403.6 Q-PbS Rutherford backscattering spectrum . . . 413.7 Q-PbS molar extinction coefficient . . . . . . . . 43
xxv
List of Figures
1 Principle of NMR . . . . . . . . . . . . . . . . . . 542 1H NMR spectrum of oleic acid in chloro-d1 . . . 553 T1 and T2 relaxation in NMR . . . . . . . . . . . 564 COSY and HSQC spectrum of oleic acid in chloro-
d1 . . . . . . . . . . . . . . . . . . . . . . . . . . 57
4.1 Q-InP elemental properties . . . . . . . . . . . . 604.2 1H NMR spectra of TOPO, TOP and Q-InP in tol-
d8 . . . . . . . . . . . . . . . . . . . . . . . . . . 624.3 Diffusion filtered spectra and DOSY spectrum of
Q-InP . . . . . . . . . . . . . . . . . . . . . . . . 644.4 Q-InP hydrodynamic diameter . . . . . . . . . . 664.5 Q-InP HSQC spectrum . . . . . . . . . . . . . . 674.6 Q-InP hole burning spectrum . . . . . . . . . . . 684.7 Determination of the TOPO ligand coverage . . . 694.8 Q-InP Langmuir isotherm . . . . . . . . . . . . . 714.9 Schematic representation of an InP nanocrystal
with TOPO ligands . . . . . . . . . . . . . . . . . 74
5.1 1H NMR spectra of OA, TOP and Q-PbSe in tol-d8 785.2 DOSY spectrum and hydrodynamic diameter of Q-
PbSe . . . . . . . . . . . . . . . . . . . . . . . . . 795.3 HSQC spectra of OA and Q-PbSe . . . . . . . . 815.4 TOP:OA ligand ratio and influence of OA on the
Q-PbSe synthesis . . . . . . . . . . . . . . . . . . 825.5 Q-PbSe stoichiometry and structural model . . . 845.6 1H NMR and DOSY spectra of oxidized Q-PbSe 87
6.1 NOESY spectra of OA and Q-PbSe . . . . . . . . 966.2 1H NMR, HSQC and DOSY spectra of OLA and
Q-PbS in tol-d8 . . . . . . . . . . . . . . . . . . . 986.3 NOESY spectra of OLA and Q-PbS . . . . . . . 996.4 Quantitative 1H NMR spectrum of Q-PbS prepared
with added TOP . . . . . . . . . . . . . . . . . . 1006.5 1H NMR and DOSY spectra of OA capped Q-PbS 1016.6 Luminescence spectra of OLA and OA capped Q-
PbS . . . . . . . . . . . . . . . . . . . . . . . . . 103
xxvi
7.1 Schematic representation of the Maxwell-Garnettmodel . . . . . . . . . . . . . . . . . . . . . . . . 118
7.2 Q-PbSe molar extinction coefficient and absorptioncoefficient at 400 nm . . . . . . . . . . . . . . . . 121
7.3 Refractive index of CCl4 and C2Cl4 . . . . . . . . 1217.4 Influence of the solvent on the Q-PbSe absorbance 1227.5 Molar extinction coefficient and absorption coeffi-
cient of Q-PbSe at the band gap . . . . . . . . . 1247.6 Q-PbSe oscillator strength . . . . . . . . . . . . . 1267.7 Comparison of Q-PbSe and Q-PbS absorption co-
efficient . . . . . . . . . . . . . . . . . . . . . . . 1287.8 Q-PbS oscillator strength . . . . . . . . . . . . . 129
8.1 Comparison of the Q-PbSe absorption coefficientwith bulk PbSe . . . . . . . . . . . . . . . . . . . 132
8.2 Bulk PbSe absorption coefficient compared to theabsorption coefficient in an MG geometry . . . . 133
8.3 Second derivative of a Q-PbSe absorbance spec-trum . . . . . . . . . . . . . . . . . . . . . . . . . 134
8.4 Demonstration of the validity of the discreteKramers–Kronig relations . . . . . . . . . . . . . 138
8.5 Schematic representation of the iterative matrix in-version method . . . . . . . . . . . . . . . . . . . 141
8.6 Demonstration of the validity of the iterative pro-cedure . . . . . . . . . . . . . . . . . . . . . . . . 142
8.7 Subsequent steps during the optimization of thedielectric function using the iterative procedure . 143
8.8 Dielectric function for bulk PbSe . . . . . . . . . 1448.9 Expansion of the PbS and Q-PbS absorption coef-
ficient over the entire wavelength range . . . . . 1468.10 Dielectric function of PbS and PbTe, calculated us-
ing the IMI method . . . . . . . . . . . . . . . . 1478.11 Dielectric function of typical colloidal lead chalco-
genide nanocrystals . . . . . . . . . . . . . . . . . 1488.12 Optical dielectric constant of colloidal lead chalco-
genide nanocrystals . . . . . . . . . . . . . . . . . 149
xxvii
List of Figures
8.13 Imaginary part of the dielectric function of leadchalcogenide nanocrystals . . . . . . . . . . . . . 150
9.1 Nonlinear optical properties of colloidal nanocrys-tals using the KK-relations . . . . . . . . . . . . 155
9.2 Z-scan setup . . . . . . . . . . . . . . . . . . . . . 1569.3 Simulated Z-scan traces . . . . . . . . . . . . . . 1589.4 Calculation of the beam waist and Rayleigh length 1599.5 Typical OAI and TBI traces for Q-PbS and Q-
PbSe . . . . . . . . . . . . . . . . . . . . . . . . . 1669.6 Q-PbSe n2-spectra and concentration dependence 1679.7 Q-PbS and Q-PbSe values of n2 around 1550 nm 1699.8 The thermo-optical coefficient dn/dT . . . . . . . 1699.9 Intensity dependence of the change in refractive in-
dex . . . . . . . . . . . . . . . . . . . . . . . . . . 1709.10 Q-PbSe luminescence decay and δn as a function
of the fraction of excited nanocrystals . . . . . . 1719.11 Bi-exciton effect on the n2-spectrum of colloidal na-
nocrystals . . . . . . . . . . . . . . . . . . . . . . 1739.12 Nonlinear absorption coefficient of Q-PbS . . . . 174
10.1 Typical LB isotherm for the compression of a Q-PbSe monolayer . . . . . . . . . . . . . . . . . . . 188
10.2 AFM images of typical Q-PbSe monolayers on mica 18910.3 Local deposition of a Q-PbSe monolayer . . . . . 19010.4 Oriented attachment of Q-PbSe during monolayer
deposition . . . . . . . . . . . . . . . . . . . . . . 19110.5 Local deposition of a dropcasted Q-PbSe layer . 19110.6 PMMA thin film spincoating . . . . . . . . . . . 19210.7 Absorbance spectra of Q-PbSe doped PMMA and
PS thin films . . . . . . . . . . . . . . . . . . . . 19410.8 Stability of the Q-PbS–PS–toluene suspension . . 19510.9 Absorbance spectra of Q-PbSe doped PS thin films 196
11.1 SEM image and transmission of an SOI racetrackresonator . . . . . . . . . . . . . . . . . . . . . . 200
xxviii
11.2 Calculation of the transmission properties of anotch filter . . . . . . . . . . . . . . . . . . . . . 201
11.3 Mode profile of an SOI wire . . . . . . . . . . . . 20311.4 Transmission characteristics of coated SOI notch
filters . . . . . . . . . . . . . . . . . . . . . . . . 20511.5 Absorption coefficient of Q-PbSe covered notch fil-
ters and transmission characteristics of Q-PbS cov-ered notch filters . . . . . . . . . . . . . . . . . . 206
11.6 Transmission of a coated notch filter with constantextinction ratio . . . . . . . . . . . . . . . . . . . 207
11.7 Simulation of optical bistability for a notch filtercoated with a saturable absorber . . . . . . . . . 210
11.8 Thermal nonlinearities for uncoated SOI notch fil-ters . . . . . . . . . . . . . . . . . . . . . . . . . . 211
11.9 Nonlinear transmission spectra of a Q-PbSe notchfilter . . . . . . . . . . . . . . . . . . . . . . . . . 212
11.10Nonlinear transmission spectra of a Q-PbS notchfilter and time-resolved transmission trace . . . . 213
xxix

xxx

List of Tables
2.1 Q-PbSe ICP-MS results . . . . . . . . . . . . . . 22
3.1 Q-PbS RBS results . . . . . . . . . . . . . . . . . 423.2 Q-PbS ICP-MS results . . . . . . . . . . . . . . . 42
4.1 T1 and T2 relaxation times of TOPO and Q-InP 654.2 Langmuir and Fowler isotherm parameters . . . . 73
5.1 Diffusion coefficients in a Q-PbSe suspension . . 795.2 T1 and T2 relaxation times in a Q-PbSe suspension 80
6.1 Q-PbS ligand coverage . . . . . . . . . . . . . . . 102
9.1 n2, β and FOM for typical materials . . . . . . . 1549.2 Characteristics of the lasers used for the Z-scan ex-
periments . . . . . . . . . . . . . . . . . . . . . . 1599.3 Summary of the different samples used for the Z-
scan experiments. . . . . . . . . . . . . . . . . . . 165
11.1 Thin film properties of the coated notch filters . 204
xxxi

xxxii

List of commonly usedAcronyms
NIR near-infraredMIR mid-infraredQdot(s) quantum dot(s)Q-PbS lead sulfide nanocrystal(s)Q-PbSe lead selenide nanocrystal(s)Q-PbTe lead telluride nanocrystal(s)Q-InP indium phosphide nanocrystal(s)
DPE diphenyl etherODE octadeceneMeOH methanolBuOH butanolPbCl2 lead chloridePbOA2 lead oleateCdOA2 cadmium oleateOA oleic acidOLA oleylamineTOP tri-n-octylphosphineTOPO tri-n-octylphosphine oxideTOPS tri-n-octylphosphine sulfideTOPSe tri-n-octylphosphine selenideCCl4 carbon tetrachlorideC2Cl4 tetrachloroethyleneCH2Br2 dibromo methane
xxxiii

List of Acronyms
chloro-d1 deuterated chloroformtol-d8 deuterated toluenePMMA polymethylmetacrylatePS polystyreneSOI Silicon-on-Insulator
AFM atomic force microscopy(HR-)TEM (high resolution) transmission electron microscopySEM scanning electron microscopyXRD X-ray diffractionEDX energy dispersive X-ray (analysis)XPS X-ray photo-electron spectroscopyICP-MS inductively coupled plasma mass spectrometryRBS Rutherford backscattering spectroscopyNMR nuclear magnetic resonance spectroscopyCOSY correlation spectroscopyHSQC heteronuclear single quantum coherence spectroscopyDOSY diffusion ordered spectroscopyNOESY nuclear Overhauser effect spectroscopyLB Langmuir-Blodgett (deposition)IMI iterative matrix inversion
a lattice parameterRB bulk exciton Bohr radiusd (mean) nanocrystal diameterσd nanocrystal size dispersionc0 nanocrystal concentrationN number of atoms per particle
Eg bulk semiconductor band gapE0 nanocrystal band gapσeV peak width of the first absorption peakT transmittanceA(400) absorbance (at 400 nm)ε(400) molar extinction coefficient (at 400 nm)MG Maxwell-Garnett (model)
xxxiv

fLF local field factorα absorption coefficient (for bulk)µ absorption coefficient (in an MG geometry)fif oscillator strengthε(eff) (effective) dielectric constantεR(I) real (imaginary) part of the dielectric functionn(eff) (effective) refractive indexk(eff) (effective) extinction coefficientf volume fraction
I0 optical intensityTPA two-photon absorptionOAI on-axis intensityTBI total beam intensityw0 beam waistzR Rayleigh length∆φ0 nonlinear phase shiftn2 third-order nonlinear refractive indexδn change in refractive indexdn/dT thermo-optical coefficientFOM figure of merit
(1H) δ (proton) chemical shiftT1 spin-lattice relaxation timeT2 spin-spin relaxation timeσ cross-relaxation rateτc rotational correlation timeδ gradient pulse duration∆ diffusion delayG gradient pulse strengthD diffusion coefficientη solvent viscositydH hydrodynamic diameterkex ligand exchange rateτm NMR time scale
xxxv

xxxvi
Chapter I
General introduction
“Angier: Then why isn’t the machine working?Tesla: Because exact science, Mr. Angier, is not anexact science. The machine simply does not operate asexpected. It needs continued examination.”
“The Prestige”, by Christopher Nolan (2006)
1.1 History of nanotechnology
Nanoscience and -technology are hot research topics nowadays.Its roots however go deeper than one might expect. They canbe traced back as far as the Greco-Roman period,1 where a lead-based hair dye formula, used to dye light or gray hair black, wasbased on the formation of PbS nanocrystals. In Medieval times,blades forged from Damascus steel were highly praised for theirexceptional strength and the ability to remain ultra-sharp.2 Lit-tle did warriors know that this was due to the growth of carbonnanotubes and cementite nanowires inside the steel. As a morepeaceful example, during the same period, metallic nanoparticlesgave stained glass church windows their vibrant colors.3
Off course, in none of these cases people were aware that theywere using nanotechnology. Yet, it always has been among us,
1
I. General introduction
moving silently through the centuries, just waiting to be discov-ered.
1.2 Quantum effects in semiconductor na-nocrystals
A deeper understanding of the changes (semiconductor) materialsundergo when scaling them down to the nanoscale started withthe pioneering work of L. Brus4,5 and A. Efros6,7 in the 1980’s.They investigated small semiconductor crystals, a few nanometerin size, either synthesized as a colloidal suspension (L. Brus) orgrown in a dielectric matrix (A. Efros). They discovered thatthe semiconductor absorption edge shifts to smaller wavelengthswith decreasing particle size, and that discrete absorption peaksappear in the absorption spectra. Both are the result of what isnow commonly described as quantum confinement. Due to thesmall particle size, the nanocrystal can be regarded as a three-dimensional potential well, or quantum dot (Qdot). Consequently,the electron eigen energies no longer form quasi-continuous bandsas in bulk semiconductors, but they are compressed into discreteenergy levels. One may compare the system with a particle-in-a-box (with box length L), where confinement of a particle withmass m leads to discrete energy levels with eigenenergies En:
En =~2π2
2mL2.n2 (1.1)
Equation 1.1 also shows that, as the box becomes smaller, theenergy of the first level increases.
In the case of semiconductor nanocrystals, a similar calculationhas led to the Brus-equation,5 which describes the blue shift of theband gap for semiconductor nanocrystals with radius R:
E = Eg +~2π2
2µexR2− 1.786e2
εR(1.2)
µex equals the reduced exciton effective mass and ε the dielectricconstant. In addition to the particle-in-a-box energy, a Coulomb
2

1.2. Quantum effects in semiconductor nanocrystals
Figure 1.1: Series of luminescent CdSe nanocrystal suspen-sions. By merely decreasing the CdSe particle size, the colorcan be tuned from red to blue as a consequence of quantumconfinement.
energy is included to account for the electron-hole interaction.This equation immediately highlights a major advantage of semi-conductor nanocrystals. Due to the dependence of the band gapon the nanocrystal radius R, optical properties can be tuned overa wide spectral range by merely varying the size of the particles.This is beautifully demonstrated by the size-dependent lumines-cence of colloidal CdSe nanocrystals (figure 1.1).
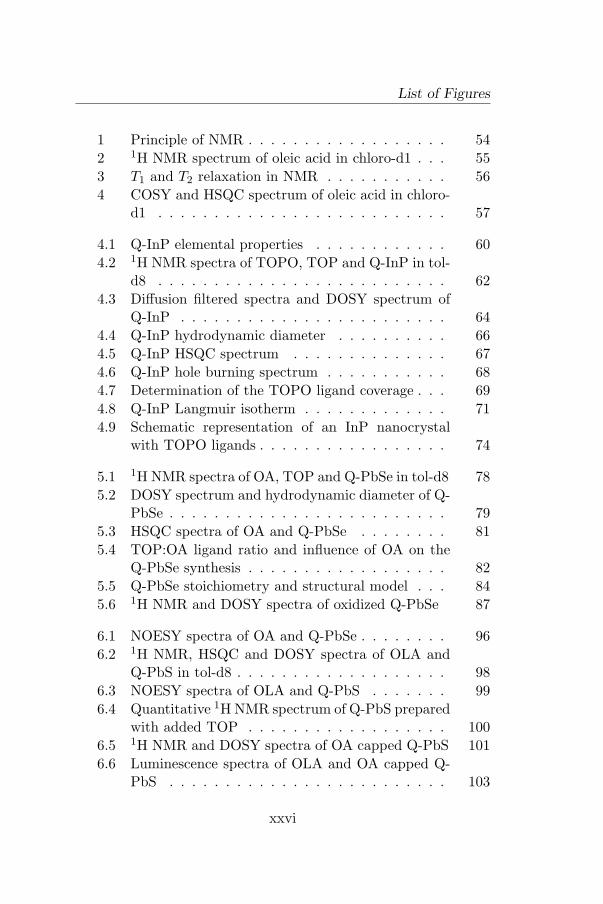
A quantum leap in research on colloidal nanocrystals was takenwhen, in 1993, C. Murray, D. Norris and M. Bawendi publishedthe organo-metallic synthesis of colloidal cadmium chalcogenidenanocrystals.8 Their hot injection method allows for a facile pro-duction of large quantities of highly monodisperse nanocrystal sus-pensions. It is based on the injection of organometallic precursormolecules into a hot coordinating organic solvent. After injection,a strong nucleation event produces small CdSe nuclei, which areallowed to grow up to a desired size. When necessary, size-selectiveprecipitation reduces the size dispersion of the particles, resultingin highly monodisperse suspensions. Following their publication,numerous research groups joined in on nanoscience, leading to aburst in publications in the following years (figure 1.2).
Nowadays, research on nanocrystals has diverted into a widerange of fundamental and application oriented studies. The blueshift of the band gap due to quantum confinement is now well
3

I. General introduction
12000
10000
8000
6000
4000
2000
0Num
ber
of
pap
ers
200520001995199019851980Year
Figure 1.2: Evolution of the number of papers publishedeach year, containing the keywords ‘nanocrystal*’ or ‘quan-tum dot*’, as listed on ISI web of science. From 1990 on, thenumber increases steadily, reaching more than 10.000 paperspublished in 2008.
understood and demonstrated for a wide range of near-UV, visi-ble and infrared semiconductor materials, hereby covering a hugespectral range.9–11 Synthesis of colloidal nanocrystals has shiftedfrom the production of small spherical particles to more exoticshapes, such as rods, wires, tetrapods and even tear drops.12 Toprotect the nanocrystal from oxidation, strategies have been de-veloped to coat the particles.13,14
Nanocrystals can now be produced with a high photolumi-nescence efficiency, enabling applications in biolabeling15,16 or aslight sources in lasers and light-emitting devices.10,17 Due to theirdiscrete energy spectrum, their potential as saturable absorbersin mode-locked lasers is also currently explored,18 and very re-cently, multiple exciton generation (from the absorption of a sin-gle high energy photon, multiple excitons are created) has sparkedan increased interest in their application in next-generation solarcells.19
However, not all fundamental nanocrystal properties are un-raveled yet, and consequently, not all potential application areashave been explored. In this work, I have summarized our con-tribution toward a better understanding of these novel materials,with the aim of applying them in nonlinear photonic devices.
4
1.3. Outline of the thesis
1.3 Outline of the thesis
The work is divided into four parts:
In Part one (chapters II and III) we describe the colloidalsynthesis of near- and mid-infrared lead chalcogenide nano-crystals (PbS and PbSe). In addition, we briefly discuss theelemental characteristics of the resulting suspensions, suchas the structural and optical properties of the nanocrystals,and the method to determine the molar extinction coefficientand particle concentration in suspension.
In Part two (chapters IV to VI) we investigate the sur-face chemistry of colloidal nanocrystals. Using nuclear mag-netic resonance spectroscopy, we focus on the intimate inter-play between the nanocrystal surface and the organic ligandsbinding to it.
In Part three (chapters VII to IX), we discuss the opticalproperties of colloidal nanocrystals. Starting from the ab-sorption spectrum of a colloidal suspension, we derive thenanocrystal absorption coefficient and dielectric function.After analysis of the linear optical properties, we study thenonlinear refractive index and absorption coefficient with theZ-scan technique.
In Part four (chapters X and XI), we investigate several de-position techniques, with the aim of integrating the nano-crystals with Silicon-on-Insulator technology. Hereafter, wediscuss the linear and nonlinear transmission properties ofthe resulting hybrid Silicon-on-Insulator notch filters.
In Chapter XII, we summarize the most important results ofthis work, and give some prospects toward future research.
For clarity, instead of writing one large introduction coveringall research fields of this thesis, each part contains its specific in-troduction on the topic of interest. For the same reason, each part
5

I. General introduction
also contains its own bibliography. Throughout the work however,various references to other chapters will highlight the strong rela-tions between results of the various studies.
6

Bibliography
[1] P. Walter et al., Early use of PbS nanotechnology for an an-cient hair dyeing formula, Nano Lett. 2006, 6 , 2215–2219.
[2] M. Reibold et al., Materials: Carbon nanotubes in an ancientDamascus sabre, Nature 2006, 444 , 286.
[3] D. Jembrih-Simburger et al., The colour of silver stained glass- analytical investigations carried out with XRF, SEM/EDX,TEM, and IBA, J. Anal. Atom. Spectrom. 2002, 17 , 321–328.
[4] L. E. Brus, Electron electron and electron-hole interactionsin small semiconductor crystallites - the size dependence ofthe lowest excited electronic state, J. Chem. Phys. 1984, 80 ,4403–4409.
[5] L. Brus, Electronic wave-functions in semiconductor clusters- experiment and theory , J. Phys. Chem. 1986, 90 , 2555–2560.
[6] A. L. Efros and A. L. Efros, Interband absorption of lightin a semiconductor sphere, Sov. Phys. Semicond. 1982, 16 ,772–775.
[7] A. I. Ekimov, A. L. Efros and A. A. Onushchenko, Quantumsize effect in semiconductor microcrystals, Solid State Com-mun. 1985, 56 , 921–924.
[8] C. B. Murray, D. J. Norris and M. G. Bawendi, Synthesisand characterization of nearly monodisperse CdE (E = S, Se,Te) semiconductor nanocrystallites, J. Am. Chem. Soc. 1993,115 , 8706–8715.
[9] C. D. Donega, P. Liljeroth and D. Vanmaekelbergh, Physic-ochemical evaluation of the hot-injection method, a synthesisroute for monodisperse nanocrystals, Small 2005, 1 , 1152–1162.
[10] E. H. Sargent, Infrared quantum dots, Adv. Mater. 2005, 17 ,515–522.
[11] C. Burda et al., Chemistry and properties of nanocrystals ofdifferent shapes, Chem. Rev. 2005, 105 , 1025–1102.
7
[12] Y. Yin and A. P. Alivisatos, Colloidal nanocrystal synthesisand the organic-inorganic interface, Nature 2005, 437 , 664–670.
[13] J. J. Li et al., Large-scale synthesis of nearly monodisperseCdSe/CdS core/shell nanocrystals using air-stable reagentsvia successive ion layer adsorption and reaction, J. Am.Chem. Soc. 2003, 125 , 12567–12575.
[14] J. M. Pietryga et al., Utilizing the lability of lead selenideto produce heterostructured nanocrystals with bright, stableinfrared emission, J. Am. Chem. Soc. 2008, 130 , 4879–4885.
[15] M. Bruchez et al., Semiconductor nanocrystals as fluorescentbiological labels, Science 1998, 281 , 2013–2016.
[16] X. Michalet et al., Quantum dots for live cells, in vivo imag-ing, and diagnostics, Science 2005, 307 , 538–544.
[17] A. L. Rogach et al., Infrared-emitting colloidal nanocrystals:Synthesis, assembly, spectroscopy, and applications, Small2007, 3 , 536–557.
[18] M. Brumer et al., Nanocrystals of PbSe core, PbSe/PbS,and PbSe/PbSexS1-x core/shell as saturable absorbers in pas-sively Q-switched near-infrared lasers, Appl. Optics 2006, 45 ,7488–7497.
[19] R. J. Ellingson et al., Highly efficient multiple exciton gen-eration in colloidal PbSe and PbS quantum dots, Nano Lett.2005, 5 , 865–871.
8

Part 1
Synthesis of colloidal leadchalcogenide nanocrystals

Introduction
The colloidal semiconductor nanocrystals used for this work aresynthesized using wet chemical methods. In contrast with typicalsolid state techniques (metalorganic chemical vapor deposition,molecular beam epitaxy), it does not require a substrate to growthe nanocrystals on, and therefore a large variety of materials, sizesand shapes can be synthesized using similar synthesis routes.1–4
In this method, metalorganic precursor molecules are dissolvedin high boiling point organic solvents, which are subsequently in-jected into a hot (non-)coordinating organic solvent. Due to thehigh temperature, small semiconductor clusters nucleate. As thesynthesis time progresses, the nanocrystal nuclei grow larger untila desired size is reached and the reaction is quenched. The na-nocrystals are then separated from the growth solution by addinga nonsolvent (typically a short alcohol, like methanol or ethanol).This causes a precipitation of the nanocrystals, which are collectedby centrifugation and decantation of the solvent. After this pro-cedure, the nanocrystals can be stored dry or resuspended in forinstance toluene or chloroform.
Lead chalcogenide nanocrystals are of particular interest fornear-infrared applications due to the small band gap of their re-spective bulk materials (PbS: 0.41 eV, PbSe: 0.278 eV). Due toquantum confinement, PbS and PbSe nanocrystals can thereforespan the entire near-infrared (NIR) telecom wavelength range. Inthe case of PbSe nanocrystals, this range can even be expandedinto the 2-3 µm mid-infrared (MIR) range.
Practically all research on nanocrystals requires the knowledge
11

Introduction
of the particle size, size dispersion and particle concentration insuspension. In this part, we show that these properties can all bedetermined from a single measurement of the absorbance spectrumby means of the sizing curve and molar extinction coefficient.
12

Chapter II
Synthesis of PbSe nanocrystals
2.1 Near-infrared PbSe nanocrystals
2.1.1 Synthesis
PbSe nanocrystals (Q-PbSe) are synthesized based on the pro-cedure developed by Murray et al.,5 referred to as the Murraysynthesis hereafter. It is entirely carried out under a nitrogen at-mosphere to avoid oxidation. In flask 1, we mix 0.38 g of leadacetate with 1.3 mL of oleic acid (OA) and 6.3mL of diphenylether (DPE) (132 mM Pb solution). In flask 2, we dissolve 0.8 gof selenium powder in 10 mL of tri-n-octyl phosphine (TOP) (1MSe solution). Both flasks are heated to 150� for one hour whilestirring. This leads to the formation of lead oleate (PbOA2) andTOP-selenide (TOPSe), respectively. After one hour, both flasksare cooled down to room temperature; 2.85mL of flask 2 is thor-oughly mixed with the contents of flask 1 and the mixture is loadedinto a syringe. This is then swiftly injected into a three-neck flaskcontaining 10 mL of DPE at 175�. Following the injection of thecold precursor solution, the temperature drops to 130�. This tem-perature is maintained during the reaction time. The nanocrystalsare typically allowed to grow for 20 seconds up to 10 minutes, de-pending on the desired nanocrystal size. Hereafter, the reactionis quenched by addition of 20mL of butanol (BuOH) and 10 mL
13
II. Q-PbSe Synthesis
Counts
100806040202q (°)
(a) (b)
2 nm
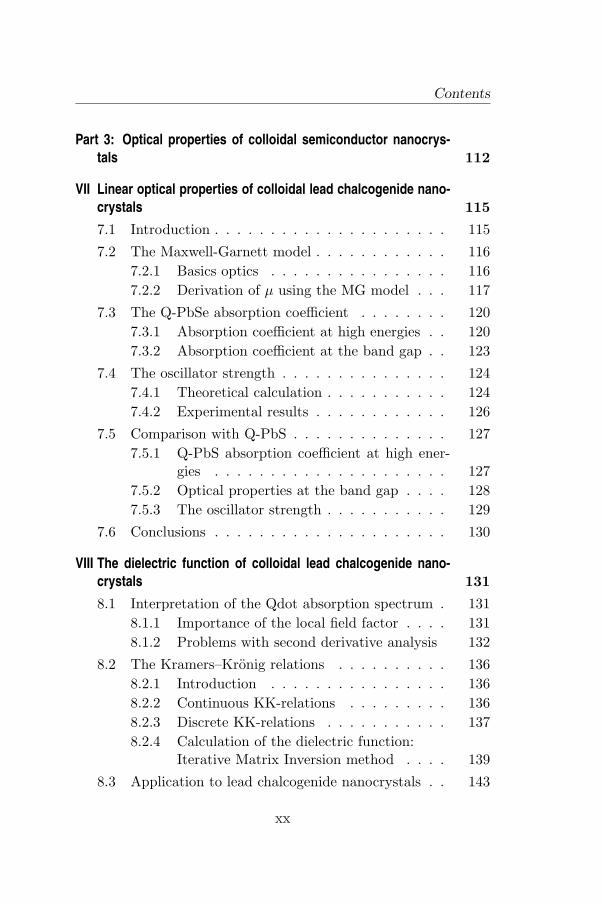
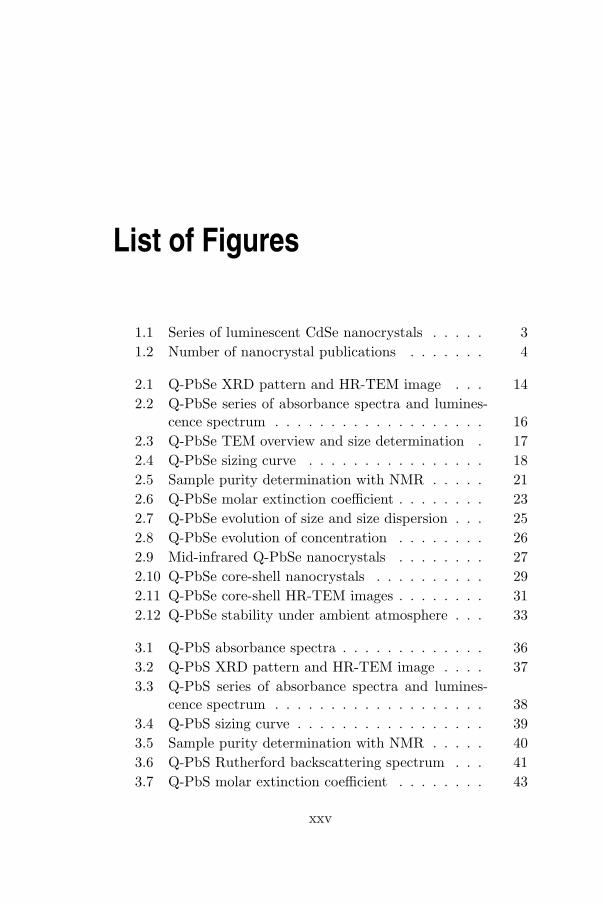
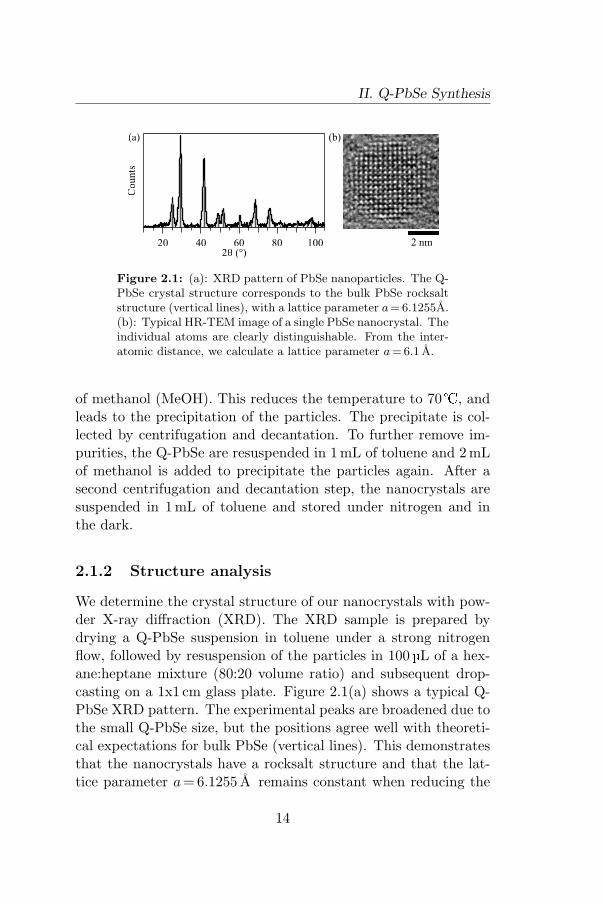
Figure 2.1: (a): XRD pattern of PbSe nanoparticles. The Q-PbSe crystal structure corresponds to the bulk PbSe rocksaltstructure (vertical lines), with a lattice parameter a = 6.1255A.(b): Typical HR-TEM image of a single PbSe nanocrystal. Theindividual atoms are clearly distinguishable. From the inter-atomic distance, we calculate a lattice parameter a = 6.1 A.
of methanol (MeOH). This reduces the temperature to 70�, andleads to the precipitation of the particles. The precipitate is col-lected by centrifugation and decantation. To further remove im-purities, the Q-PbSe are resuspended in 1 mL of toluene and 2 mLof methanol is added to precipitate the particles again. After asecond centrifugation and decantation step, the nanocrystals aresuspended in 1 mL of toluene and stored under nitrogen and inthe dark.
2.1.2 Structure analysis
We determine the crystal structure of our nanocrystals with pow-der X-ray diffraction (XRD). The XRD sample is prepared bydrying a Q-PbSe suspension in toluene under a strong nitrogenflow, followed by resuspension of the particles in 100 µL of a hex-ane:heptane mixture (80:20 volume ratio) and subsequent drop-casting on a 1x1 cm glass plate. Figure 2.1(a) shows a typical Q-PbSe XRD pattern. The experimental peaks are broadened due tothe small Q-PbSe size, but the positions agree well with theoreti-cal expectations for bulk PbSe (vertical lines). This demonstratesthat the nanocrystals have a rocksalt structure and that the lat-tice parameter a= 6.1255 A remains constant when reducing the
14
2.1. Near-infrared PbSe nanocrystals
size from bulk to the nanoscale. The result is confirmed by highresolution transmission electron microscopy (HR-TEM) images onindividual nanocrystals. TEM samples are prepared by dipcoat-ing a TEM grid in a suspension containing a small amount ofnanocrystals (typically 0.5–1 µM). Figure 2.1(b) shows a typicalimage, where we look down on the (100) planes of the nanocrys-tal. The nanocrystals are fully crystalline, showing no structuraldefects or amorphous regions. After analysis of the distance be-tween the atoms for several nanocrystals, we obtain a lattice pa-rameter a= 6.1± 0.1 A, in agreement with the XRD result. Themeasurements also reveal that Q-PbSe prepared by this methodhave typically a faceted, quasi-spherical shape.
2.1.3 Optical properties
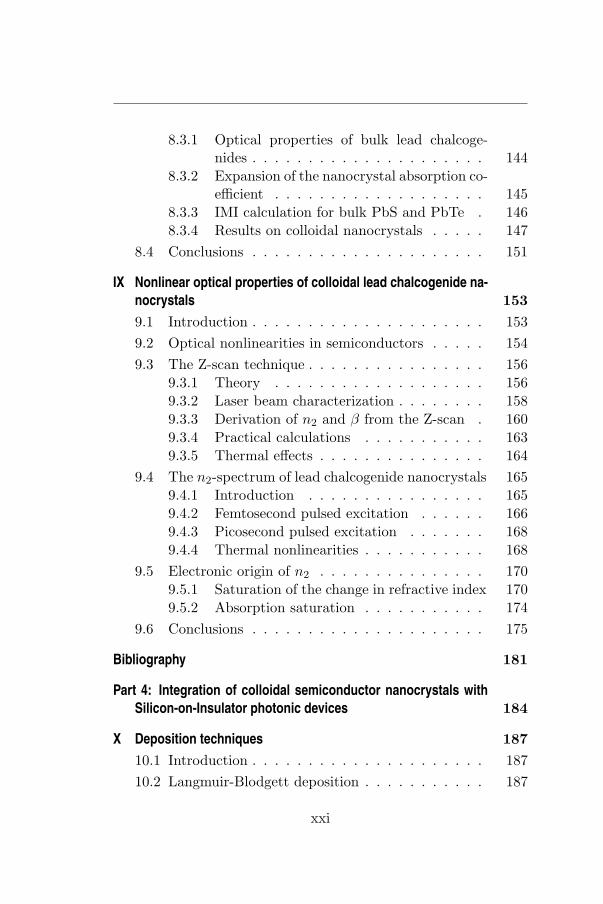
Bulk PbSe has a band gap of only 0.278 eV (absorption edge at4460 nm) at room temperature and its exciton Bohr radius is par-ticularly large (RB =46 nm). This implies that small PbSe na-nocrystals are in the strong confinement regime. Consequently,we observe a strong blue shift of the band gap with decreasing Q-PbSe size (figure 2.2(a)). Also, up to three absorption features areclearly visible in the absorbance spectrum (figure 2.2(b)), whichcan be assigned to transitions between the discrete energy levelsof the quantum dot.6–10
Several research groups have reported that Q-PbSe are highlyluminescent, with a quantum yield of up to 80%.6,7 In accordancewith their data, our nanocrystals also show a good luminescence(figure 2.2(c)). The small Stokes shift between the absorbanceand luminescence peak indicates that the luminescence arises fromband edge emission, as emission from surface trap states wouldresult in a larger Stokes shift.11
2.1.4 Sizing curve
TEM is also used to determine the mean size d and standard de-viation σd (also called size dispersion) of a Q-PbSe suspension.Figure 2.3(a) shows a typical TEM overview image. Due to the
15

II. Q-PbSe Synthesis
Ab
sorb
ance
200016001200800Wavelength (nm)
Ab
s./L
um
.
200016001200800Wavelength (nm)
Ab
sorb
ance
200016001200800Wavelength (nm)
(a) (b)
(c)
Figure 2.2: (a) Series of absorbance spectra for differentlysized Q-PbSe (offset for clarity). We observe large blue shiftwith decreasing size. (b) Due to the strong quantum confine-ment and small sample heterogeneity, up to three absorptionfeatures can be observed. (c) A strong photoluminescence peak(black curve), with a small Stokes shift, indicates efficient bandedge luminescence.
spherical shape and narrow size distribution, isolated Q-PbSe arefound next to small hexagonally close-packed islands. We use mul-tiple images to measure the area of, in total, 200-400 particles,from which the equivalent circular diameter is calculated. Figure2.3(b) shows the resulting size histogram, with a Gaussian peakfitted to the data. The mean size and size dispersion are calculateddirectly from the individual sizes. For this suspension, we obtaind =4.65 nm and σd =0.25 nm (5.3%). The results agree with themean size and size dispersion given by the fitted Gaussian peak.
Due to quantum confinement, the nanocrystal size determinesthe band gap of the material. This relation can be convenientlyused to determine the size directly from the absorbance spectrum,avoiding a lengthy TEM analysis for each Q-PbSe suspension thatwe synthesize. We refer to the resulting calibration curve as thesizing curve.
The nanocrystal band gap E0 is determined from the absor-
16

2.1. Near-infrared PbSe nanocrystals
50
40
30
20
10
0
Counts
6.05.04.03.0Size (nm)
Ab
sorb
ance
1.61.41.21.00.80.6Energy (eV)
(c)
(a) (b)
10nm
Figure 2.3: (a) Typical TEM overview image of a Q-PbSenanocrystal suspension. (b) Histogram of the particle size,with a Gaussian peak fitted to the data. The mean size equals4.65 nm, with a size dispersion of 5.3%. (c) The absorbancespectrum of the same Q-PbSe (full line) is fitted with a sumof four Gaussian peaks, superimposed on a broad background(dashed line: fit; gray curves: individual contributions of thepeaks and background).
bance spectrum by fitting the spectrum to a sum of four Gaus-sian peaks (two Gaussian peaks have to be used for the thirdabsorption peak), superimposed on an empirical polynomial back-ground of the form a0 +a1.eV
b1 +a2.eVb2 +a3.eV
b3 , with b1 ≈ 1,b2 ≈ 2 and b3 ≈ 4 (figure 2.3(c)). In the example shown here,the 4.65 nm particles have a band gap E0 =0.84 eV and a peakwidth σeV =66 meV (full width at half maximum). We have mea-sured the size and band gap for 9 samples in total, and resultsare shown in figure 2.4 (dots) together with literature data (opencircles).5–8,12–19 The dotted line represent the bulk PbSe band gapEg =0.278 eV. A fit yields following result (full line, valid in the
17

II. Q-PbSe Synthesis
2.0
1.5
1.0
0.5
0.0
Ban
d g
ap (
eV)
151050Size (nm)
Figure 2.4: The sizing curve relates the Q-PbSe band gapE0 to the nanocrystal size d as measured with TEM. The dot-ted line denotes the bulk PbSe band gap. Our results (dots),together with literature data (open circles), are fitted to anempirical expression (full line), which allows us to determinethe Q-PbSe size directly from the absorbance spectrum.
range 2–20 nm):
E0 = 0.278 +1
0.0156.d2 + 0.209.d + 0.445(2.1)
The literature values for the small particles shown in the top leftcorner (band gap > 1.5 eV) come from a single paper13 and theresults are not confirmed by other measurements. They are there-fore not included in the fit.
Our experimental results are in good agreement with recenttight binding calculations of the Q-PbSe band gap.20 From boththe theoretical and experimental results, we can conclude that theband gap mainly varies with 1/d, in contrast with the quadraticsize dependence predicted by the Brus-equation 1.2 (the Coulombterm can be neglected here due to the small effective mass and thehigh dielectric constant of PbSe).
In addition to the mean particle size, the sizing curve can alsobe used to evaluate the particle size dispersion σd. Assuming thatthe heterogeneous line width σeV of the first absorption peak ismuch larger than the homogeneous line width, the width of theabsorption peak must reflect the particle size distribution. For asmall size dispersion, the sizing curve can be linearized around the
18
2.2. Determination of the Q-PbSe concentration
mean size d, which implies that a Gaussian absorption peak (onan energy scale) corresponds to a Gaussian size distribution. Thelinearization results in the following relation between σd and σeV :
σeV
2√
2 ln 2=∣∣∣∣dE0
dd
∣∣∣∣σd (2.2)
A factor 2√
2 ln 2 has to be taken into account because we definedσeV as the full width at half maximum of the first absorptionpeak, while σd equals the standard deviation on the particle size.For the example given in figure 2.3, the 66 meV peak width yieldsσd =0.25 nm, in accordance with the TEM results.
2.2 Determination of the Q-PbSe concen-tration
Practically all research on and applications of colloidal nanocrystalsuspensions require the knowledge of the particle concentrationc0. Through Beer’s law, it can be calculated from the absorbanceA if the sample length L and the molar extinction coefficient εare known: A = ε.c0.L. L is fixed by the length of the opticalcell. We determine the Q-PbSe molar extinction coefficient bymeasuring the absorbance of a particle suspension of known c0. c0
is calculated from the Pb and Se atomic concentration, determinedby inductively coupled plasma mass spectrometry (ICP-MS), andthe particle size d, determined from the sizing curve.
2.2.1 Sample purity
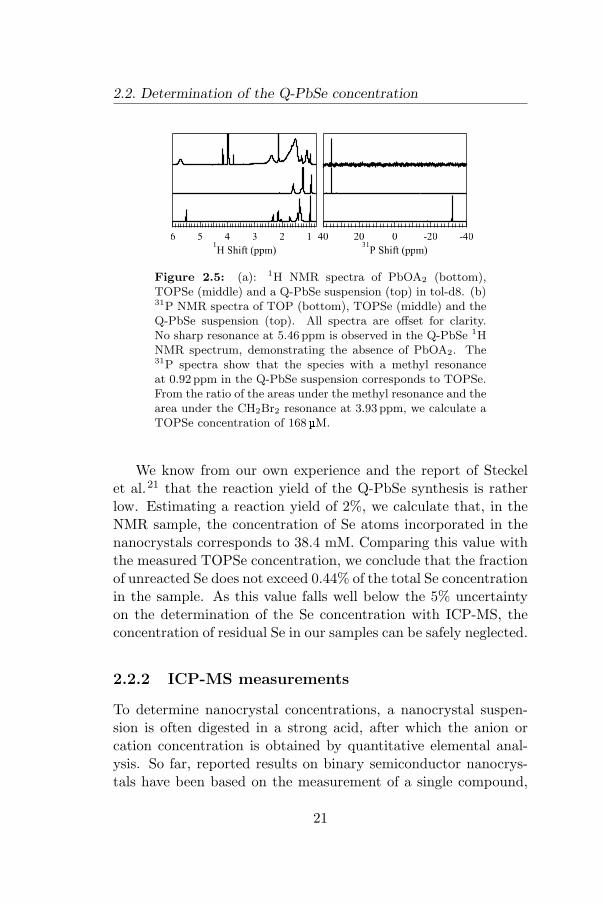
As the Q-PbSe concentration is determined from the atomic Pband Se concentrations, it is crucial that the samples are free ofany unreacted PbOA2 or TOPSe precursors. We check this byproton (1H) and phosphorous (31P) nuclear magnetic resonancespectroscopy (NMR). An NMR sample is prepared by drying aQ-PbSe suspension under a strong nitrogen flow, followed by re-suspension in 750 µL of deuterated toluene (tol-d8). To identifyunreacted PbOA2 and TOPSe in the Q-PbSe suspension, we also
19

II. Q-PbSe Synthesis
prepare solutions of PbOA2 and of TOPSe in tol-d8. Absoluteconcentrations of all organic species are determined by adding aknown amount (2 µL) of CH2Br2 to the Q-PbSe suspension as aconcentration standard. To ensure that the area under each res-onance in the spectrum corresponds exactly to the concentrationof the respective protons in the sample, we apply a sufficientlylong delay d1 between scans in the experiment (the sum of d1 andthe acquisition time AQ has to be as long as five times the T1
relaxation rate for a 99% signal recovery). We measure the T1 re-laxation rates of all species of interest (PbOA2, TOPSe, CH2Br2,and the resonances in the Q-PbSe suspension) using the T1 inver-sion recovery sequence and chose d1 =45 s to fulfill the conditiond1+AQ > 5T1,max, with T1,max being the maximal relaxation ratemeasured over all samples and resonances (T1,max =9.5 s, corre-sponding to the CH2Br2 resonance). As the synthesis is carriedout with a 1 M solution of TOPSe in TOP, we measure 31P NMRspectra to distinguish between both species.
In figure 2.5(a) we show the 1H NMR spectra of PbOA2 (bot-tom), TOPSe (middle) and the Q-PbSe suspension (top). Thesharp multiplet at 5.46 ppm in the PbOA2 spectrum, correspond-ing to the alkene protons of OA, is not observed in the Q-PbSeNMR spectrum. Instead, we see a broad signal at 5.67 ppm lack-ing any fine structure. This resonance corresponds to the alkeneprotons of the OA ligands attached to the nanocrystals. The ab-sence of a sharp alkene signal shows that we have no free PbOA2
(and therefore no unreacted Pb atoms) in our sample. The NMRspectrum of TOPSe and the Q-PbSe both show a sharp triplet at0.92 ppm, corresponding to the methyl protons of TOPSe and/orTOP. In a 31P spectrum however (figure 2.5(b)), TOP has a reso-nance at -32 ppm (bottom), while TOPSe has a resonance around35 ppm (middle). For the Q-PbSe suspension, we observe a sin-gle resonance at 35.3 ppm (top), indicating that we have only freeTOPSe in our Q-PbSe suspension and no TOP. From the ratio ofthe area under the 0.92 ppm resonance in the 1H spectrum andthe area under the 3.93 ppm resonance, corresponding to CH2Br2,we then calculate a TOPSe concentration of 168 µM.
20
2.2. Determination of the Q-PbSe concentration
6 5 4 3 2 11H Shift (ppm)
40 20 0 -20 -4031
P Shift (ppm)
Figure 2.5: (a): 1H NMR spectra of PbOA2 (bottom),TOPSe (middle) and a Q-PbSe suspension (top) in tol-d8. (b)31P NMR spectra of TOP (bottom), TOPSe (middle) and theQ-PbSe suspension (top). All spectra are offset for clarity.No sharp resonance at 5.46 ppm is observed in the Q-PbSe 1HNMR spectrum, demonstrating the absence of PbOA2. The31P spectra show that the species with a methyl resonanceat 0.92 ppm in the Q-PbSe suspension corresponds to TOPSe.From the ratio of the areas under the methyl resonance and thearea under the CH2Br2 resonance at 3.93 ppm, we calculate aTOPSe concentration of 168µM.
We know from our own experience and the report of Steckelet al.21 that the reaction yield of the Q-PbSe synthesis is ratherlow. Estimating a reaction yield of 2%, we calculate that, in theNMR sample, the concentration of Se atoms incorporated in thenanocrystals corresponds to 38.4 mM. Comparing this value withthe measured TOPSe concentration, we conclude that the fractionof unreacted Se does not exceed 0.44% of the total Se concentrationin the sample. As this value falls well below the 5% uncertaintyon the determination of the Se concentration with ICP-MS, theconcentration of residual Se in our samples can be safely neglected.
2.2.2 ICP-MS measurements
To determine nanocrystal concentrations, a nanocrystal suspen-sion is often digested in a strong acid, after which the anion orcation concentration is obtained by quantitative elemental anal-ysis. So far, reported results on binary semiconductor nanocrys-tals have been based on the measurement of a single compound,
21
II. Q-PbSe Synthesis
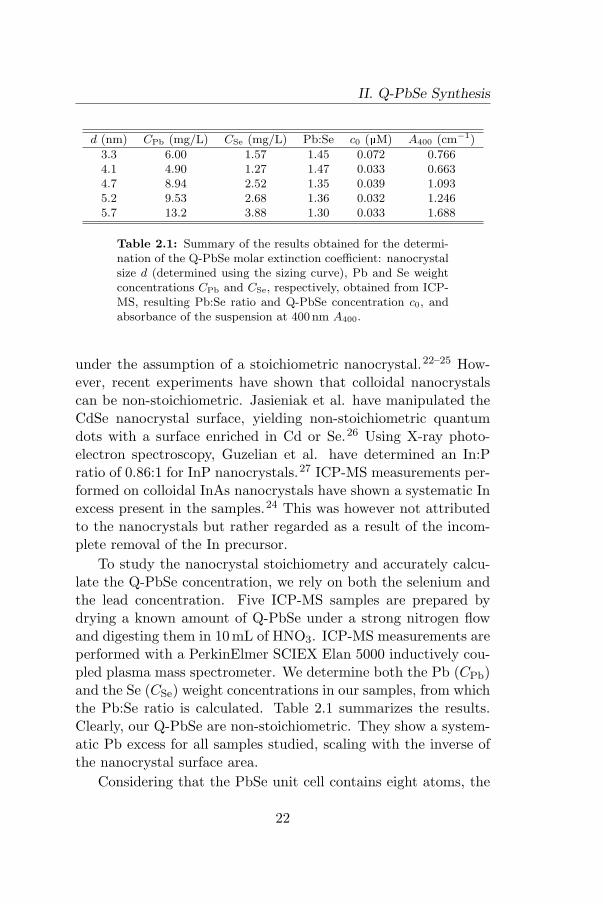
d (nm) CPb (mg/L) CSe (mg/L) Pb:Se c0 (µM) A400 (cm−1)
3.3 6.00 1.57 1.45 0.072 0.7664.1 4.90 1.27 1.47 0.033 0.6634.7 8.94 2.52 1.35 0.039 1.0935.2 9.53 2.68 1.36 0.032 1.2465.7 13.2 3.88 1.30 0.033 1.688
Table 2.1: Summary of the results obtained for the determi-nation of the Q-PbSe molar extinction coefficient: nanocrystalsize d (determined using the sizing curve), Pb and Se weightconcentrations CPb and CSe, respectively, obtained from ICP-MS, resulting Pb:Se ratio and Q-PbSe concentration c0, andabsorbance of the suspension at 400 nm A400.
under the assumption of a stoichiometric nanocrystal.22–25 How-ever, recent experiments have shown that colloidal nanocrystalscan be non-stoichiometric. Jasieniak et al. have manipulated theCdSe nanocrystal surface, yielding non-stoichiometric quantumdots with a surface enriched in Cd or Se.26 Using X-ray photo-electron spectroscopy, Guzelian et al. have determined an In:Pratio of 0.86:1 for InP nanocrystals.27 ICP-MS measurements per-formed on colloidal InAs nanocrystals have shown a systematic Inexcess present in the samples.24 This was however not attributedto the nanocrystals but rather regarded as a result of the incom-plete removal of the In precursor.
To study the nanocrystal stoichiometry and accurately calcu-late the Q-PbSe concentration, we rely on both the selenium andthe lead concentration. Five ICP-MS samples are prepared bydrying a known amount of Q-PbSe under a strong nitrogen flowand digesting them in 10 mL of HNO3. ICP-MS measurements areperformed with a PerkinElmer SCIEX Elan 5000 inductively cou-pled plasma mass spectrometer. We determine both the Pb (CPb)and the Se (CSe) weight concentrations in our samples, from whichthe Pb:Se ratio is calculated. Table 2.1 summarizes the results.Clearly, our Q-PbSe are non-stoichiometric. They show a system-atic Pb excess for all samples studied, scaling with the inverse ofthe nanocrystal surface area.
Considering that the PbSe unit cell contains eight atoms, the
22
2.2. Determination of the Q-PbSe concentration
0.001
0.01
0.1
1
Ab
sorb
ance
3.02.52.01.51.0Energy (eV)
6
5
4
3
2
1
0
e4
00 (
cm-1
/ m
M)
6543210Size (nm)
(a)
(b)
Figure 2.6: (a) The Q-PbSe molar extinction coefficient at400 nm ε400 scales with the nanocrystal volume, implying thatthe absorbance at this wavelength is no longer influenced byquantum confinement. (b) Absorbance spectra of the five sam-ples used. At energies well above the band gap, all spectracoincide. This confirms that quantum confinement effects areabsent at these energies.
total number of atoms within a nanocrystal of size d is given by(assuming a spherical particle, as shown by TEM measurements):
N =4π
3(d
a)3 (2.3)
From N , CPb and CSe, and the molar masses of Pb (MPb) and Se(MSe), the Q-PbSe concentration c0 (in µM) can then be calcu-lated:
c0 =103
N(CPb
MPb+
CSe
MSe) (2.4)
The Q-PbSe concentrations are listed in table 2.1.
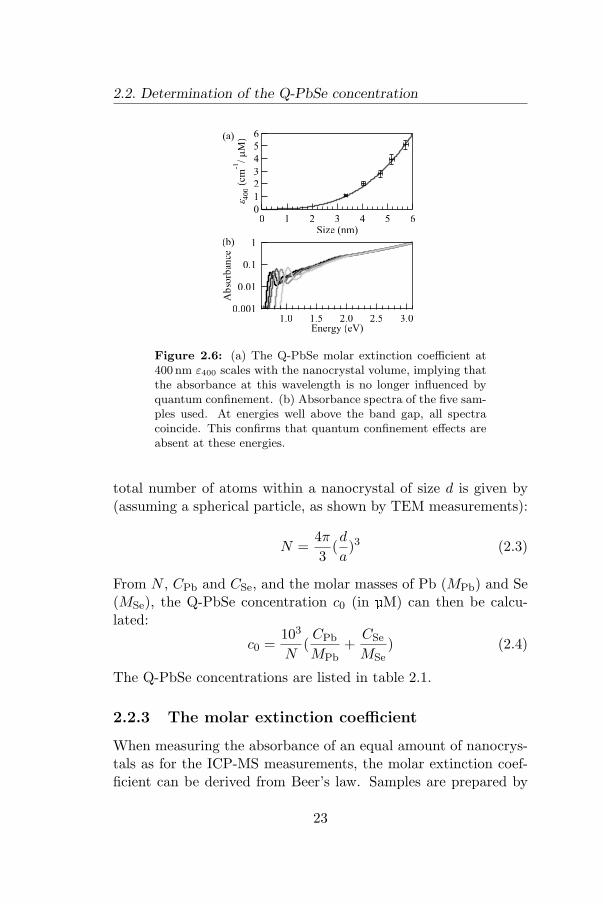
2.2.3 The molar extinction coefficient
When measuring the absorbance of an equal amount of nanocrys-tals as for the ICP-MS measurements, the molar extinction coef-ficient can be derived from Beer’s law. Samples are prepared by
23

II. Q-PbSe Synthesis
drying an equal amount of nanocrystals, and suspending them in1 mL of CCl4. The absorbance is measured using a L= 1 cm blackwalled self masking optical cell. This cell ensures a linear increaseof the absorbance with nanocrystal concentration, even at highabsorbances. The absorbance at 400 nm A400 (in cm−1) is listedin table 2.1. At this wavelength, the molar extinction coefficientscales with the nanocrystal volume (figure 2.6(a)):
ε400 = (0.0277± 0.0005).d3 cm−1/µM (2.5)
The Q-PbSe size d is defined in nm. The cubic size dependenceshows that only the number of PbSe units present, and not the sizeof the nanocrystals, determines the extinction coefficient of a Q-PbSe suspension at these wavelengths. Consequently, ε400 is alsoindependent of size dispersion. Figure 2.6(b) shows the absorbancespectra of the five samples, normalized to one at 3.1 eV (400 nm).In accordance with results obtained above, at high photon energiesall spectra coincide, again showing that optical properties in thisspectral region are no longer influenced by quantum confinement.
In conclusion, the experimental determination of the molarextinction coefficient ε allows us to conveniently calculate the na-nocrystal concentration directly from the absorbance spectrum, asthe nanocrystal size can also be determined from the same spec-trum through the sizing curve. We chose to evaluate ε at 400 nm,as at this wavelength, it only depends on the nanocrystal volumeand is no longer influenced by quantum confinement.
2.3 Mid-infrared PbSe nanocrystals
2.3.1 Evolution of the Q-PbSe size and concentra-tion
With the sizing curve and molar extinction coefficient, we havetwo powerful tools in hand to evaluate the evolution of the na-nocrystal size and concentration during synthesis. To study thechange in size and size dispersion, we take several aliquots duringa Q-PbSe synthesis and measure the absorbance spectrum (figure
24

2.3. Mid-infrared PbSe nanocrystals
Ab
sorb
ance
200018001600140012001000800
Wavelength (nm)
6
5
4
3
Siz
e (n
m)
20151050
Time (min)
(b)
1401201008060s
eV (
meV
)
20151050Time (min)
(d)
1098765
sd (
%)
20151050Time (min)
(c)
x 1.5(a)
Figure 2.7: (a) Series of absorbance spectra for differentaliquots taken during a Q-PbSe synthesis. All spectra are nor-malized to one and the first spectrum is multiplied by 1.5 here-after for clarity. (b) A rapid Q-PbSe growth is followed by analmost linear increase in size after 2–3 minutes. (c) From thistime on, the nanocrystal size dispersion σd also starts to in-crease. (d) The peak width σeV of the first absorption peakhowever remains constant.
2.7(a)). All spectra are normalized to one at 400nm, except thespectrum of the first aliquot, which is multiplied by 1.5 after nor-malization for clarity. After a fast initial Q-PbSe growth to a sizeof 5 nm during the first 2–3 minutes of the reaction, the increase insize clearly slows down to an almost linear regime (figure 2.7(b)).From this moment on, the relative size dispersion σd also starts toincrease (figure 2.7(c)), although the peak width σeV remains con-stant (figure 2.7(d)). This effect can be understood from relation2.2 between σd and σeV . Due to the decreasing slope of the sizingcurve (reducing the derivative dE0/dd as d increases), a constant
25
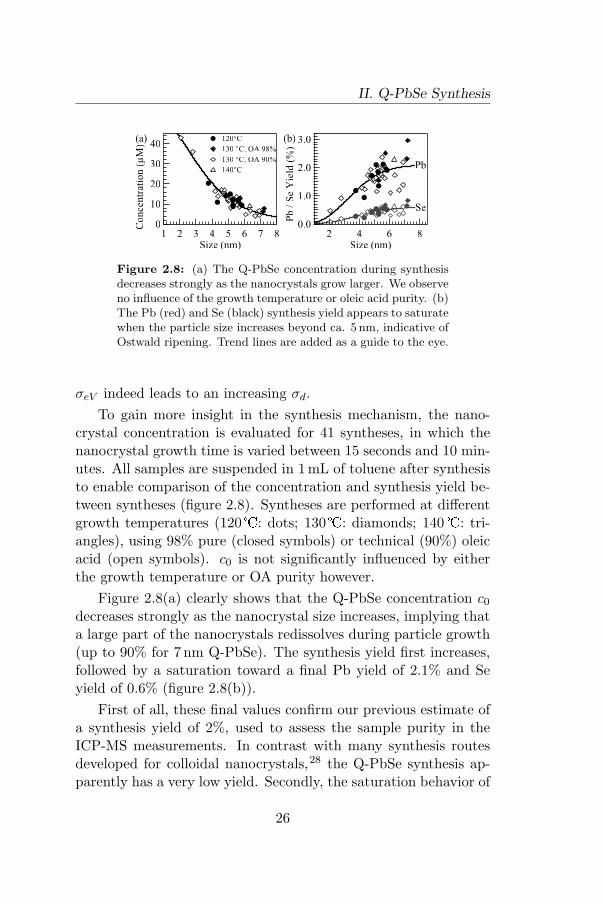
II. Q-PbSe Synthesis
40
30
20
10
0Co
nce
ntr
atio
n (
µM
)
87654321Size (nm)
3.0
2.0
1.0
0.0
Pb /
Se
Yie
ld (
%)
8642Size (nm)
(b)
Pb
Se
(a) 120°C
130 °C, OA 98%
130 °C, OA 90%
140°C
Figure 2.8: (a) The Q-PbSe concentration during synthesisdecreases strongly as the nanocrystals grow larger. We observeno influence of the growth temperature or oleic acid purity. (b)The Pb (red) and Se (black) synthesis yield appears to saturatewhen the particle size increases beyond ca. 5 nm, indicative ofOstwald ripening. Trend lines are added as a guide to the eye.
σeV indeed leads to an increasing σd.To gain more insight in the synthesis mechanism, the nano-
crystal concentration is evaluated for 41 syntheses, in which thenanocrystal growth time is varied between 15 seconds and 10 min-utes. All samples are suspended in 1 mL of toluene after synthesisto enable comparison of the concentration and synthesis yield be-tween syntheses (figure 2.8). Syntheses are performed at differentgrowth temperatures (120�: dots; 130�: diamonds; 140�: tri-angles), using 98% pure (closed symbols) or technical (90%) oleicacid (open symbols). c0 is not significantly influenced by eitherthe growth temperature or OA purity however.
Figure 2.8(a) clearly shows that the Q-PbSe concentration c0
decreases strongly as the nanocrystal size increases, implying thata large part of the nanocrystals redissolves during particle growth(up to 90% for 7 nm Q-PbSe). The synthesis yield first increases,followed by a saturation toward a final Pb yield of 2.1% and Seyield of 0.6% (figure 2.8(b)).
First of all, these final values confirm our previous estimate ofa synthesis yield of 2%, used to assess the sample purity in theICP-MS measurements. In contrast with many synthesis routesdeveloped for colloidal nanocrystals,28 the Q-PbSe synthesis ap-parently has a very low yield. Secondly, the saturation behavior of
26
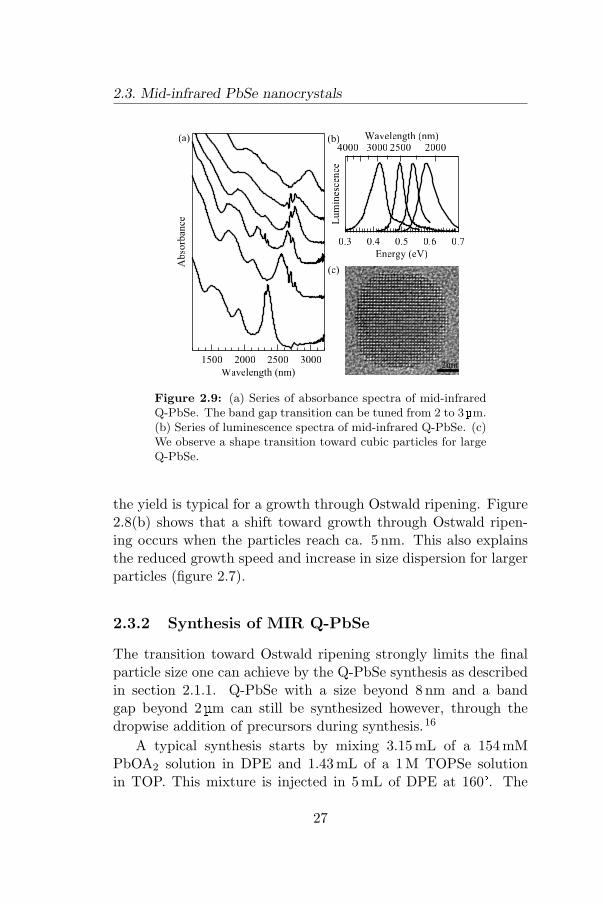
2.3. Mid-infrared PbSe nanocrystals
Lum
ines
cence
0.70.60.50.40.3
Energy (eV)
4000 3000 2500 2000Wavelength (nm)
Ab
sorb
ance
3000250020001500
Wavelength (nm)
(a)
2nm
(c)
(b)
Figure 2.9: (a) Series of absorbance spectra of mid-infraredQ-PbSe. The band gap transition can be tuned from 2 to 3µm.(b) Series of luminescence spectra of mid-infrared Q-PbSe. (c)We observe a shape transition toward cubic particles for largeQ-PbSe.
the yield is typical for a growth through Ostwald ripening. Figure2.8(b) shows that a shift toward growth through Ostwald ripen-ing occurs when the particles reach ca. 5 nm. This also explainsthe reduced growth speed and increase in size dispersion for largerparticles (figure 2.7).
2.3.2 Synthesis of MIR Q-PbSe
The transition toward Ostwald ripening strongly limits the finalparticle size one can achieve by the Q-PbSe synthesis as describedin section 2.1.1. Q-PbSe with a size beyond 8 nm and a bandgap beyond 2 µm can still be synthesized however, through thedropwise addition of precursors during synthesis.16
A typical synthesis starts by mixing 3.15mL of a 154mMPbOA2 solution in DPE and 1.43mL of a 1M TOPSe solutionin TOP. This mixture is injected in 5 mL of DPE at 160°. The
27
II. Q-PbSe Synthesis
temperature drops to 120°, but is raised again to 150° after fourminutes. After five minutes, a mixture of 9.45mL of PbOA2 and4.35mL of TOPSe is added dropwise to the synthesis during 6–7minutes. Depending on the desired size, the reaction is quenchedafter an additional 0 to 10 minutes.
Figure 2.9(a) shows a series of absorbance spectra of MIR Q-PbSe. The spectral position of the first absorption peak variesfrom 2.35 µm to 3 µm. The sharp peaks in the spectra arise fromminor organic impurities. The nanocrystals are still luminescent(figure 2.9(b)), although the photoluminescence efficiency is re-ported to drop below 4% for Q-PbSe larger than 12 nm.16 Inter-estingly, we observe a transformation toward cubic shaped nano-crystals (figure 2.9(c)). Whereas the shape of small Q-PbSe isdictated by a minimization of the surface free energy, resulting inspheres, larger Q-PbSe transform into cubes, as the shape is ap-parently no longer governed by thermodynamics, but results fromthe disappearance of fast growing (111) lattice planes.
2.4 Improving the Q-PbSe stability
2.4.1 PbSe|CdSe core-shell nanocrystal synthesis
A major drawback for applications of PbSe nanocrystals is theirstrong sensitivity to oxygen. This problem can be overcome how-ever, by growing an inorganic shell of semiconductor material witha larger band gap around the PbSe core. This reduces the interac-tion of the electron and hole wavefunction with the particle surface(as both carriers are confined to the core material), rendering themoptically stable even when the surface is oxidized during storageor application under ambient atmosphere. A very compatible ma-terial for PbSe is CdSe. It has a cubic crystal structure, with asimilar lattice parameter a=6.077A as PbSe (a= 6.1255A). Thiswill strongly reduce strain at the PbSe|CdSe interface. In addi-tion, cubic CdSe has a bulk band gap of 1.74 eV, large enough tocompletely enclose the Q-PbSe band gap.
The CdSe shell is grown by means of a cation exchange re-
28
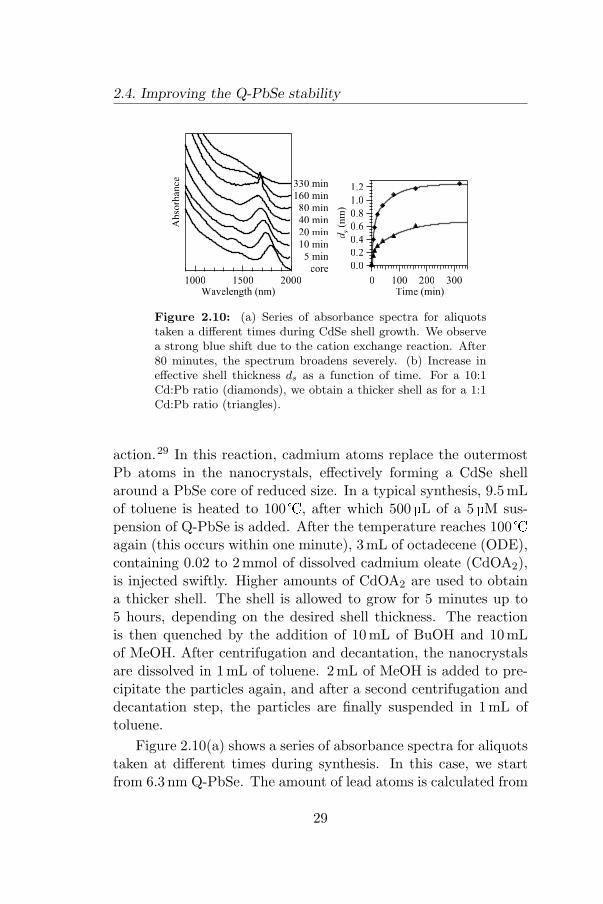
2.4. Improving the Q-PbSe stability
Ab
sorb
ance
200015001000Wavelength (nm)
1.2
1.0
0.8
0.6
0.4
0.2
0.0
ds
(nm
)
3002001000Time (min)
330 min
160 min
80 min
40 min
20 min
10 min
5 min
core
Figure 2.10: (a) Series of absorbance spectra for aliquotstaken a different times during CdSe shell growth. We observea strong blue shift due to the cation exchange reaction. After80 minutes, the spectrum broadens severely. (b) Increase ineffective shell thickness ds as a function of time. For a 10:1Cd:Pb ratio (diamonds), we obtain a thicker shell as for a 1:1Cd:Pb ratio (triangles).
action.29 In this reaction, cadmium atoms replace the outermostPb atoms in the nanocrystals, effectively forming a CdSe shellaround a PbSe core of reduced size. In a typical synthesis, 9.5 mLof toluene is heated to 100�, after which 500 µL of a 5 µM sus-pension of Q-PbSe is added. After the temperature reaches 100�again (this occurs within one minute), 3 mL of octadecene (ODE),containing 0.02 to 2 mmol of dissolved cadmium oleate (CdOA2),is injected swiftly. Higher amounts of CdOA2 are used to obtaina thicker shell. The shell is allowed to grow for 5 minutes up to5 hours, depending on the desired shell thickness. The reactionis then quenched by the addition of 10 mL of BuOH and 10 mLof MeOH. After centrifugation and decantation, the nanocrystalsare dissolved in 1 mL of toluene. 2 mL of MeOH is added to pre-cipitate the particles again, and after a second centrifugation anddecantation step, the particles are finally suspended in 1mL oftoluene.
Figure 2.10(a) shows a series of absorbance spectra for aliquotstaken at different times during synthesis. In this case, we startfrom 6.3 nm Q-PbSe. The amount of lead atoms is calculated from
29

II. Q-PbSe Synthesis
the nanocrystal concentration and we use a 1:1 Cd:Pb molar ratiofor the shell growth (sample A). Immediately after injection, weobserve a blue shift of the absorption peak. The first 4 aliquots,up to a time of 40 minutes, still show a sharp first absorptionpeak. From aliquot 5 (80 minutes) on however, severe broadeningstarts to cloak the absorption features. Similar absorption spectraare obtained when performing a shell growth with a 10:1 Cd:Pbratio, using 6.9 nm Q-PbSe (sample B). In this case, we observe astronger blue shift of the band gap. As the initial size d0 of bothsyntheses is slightly different, results are compared by calculatingthe effective size d from the spectral position of the first absorptionpeak, and deriving the effective shell thickness ds:
2ds = d0 − d (2.6)
Compared to the band gap of an organic ligand shell (ca. 5 eV30),the expected reduced band gap of a inorganic CdSe shell willreduce the potential well surrounding the PbSe core and allowfor a larger evanescent tail of the electron and hole wavefunction.Therefore, this calculation will possibly overestimate the core size;nevertheless, it still allows for a semi-quantitative comparison ofthe shell thickness. Figure 2.10(b) clearly shows a faster shellgrowth and an increased final shell thickness when using a 10:1Cd:Pb ratio. Consequently, the Cd:Pb ratio can be varied to tunethe CdSe shell thickness.
2.4.2 Structure analysis
The last aliquot of sample B, taken after 5 hours and 20 minutes, isused for a TEM comparison of the particles before and after shellgrowth. The measurements confirm the cation exchange mecha-nism. The total particle size remains constant (we measure a sizedifference of only 3.6 A between core and core-shell nanocrystals,figure 2.11(b)), and we observe a clearly different crystal struc-ture in the core part of the nanocrystal (figure 2.11(c)). Energydispersive X-ray (EDX) analysis confirms the presence of bothPb and Cd in the nanocrystals (figure 2.11(d)). After analysis of
30
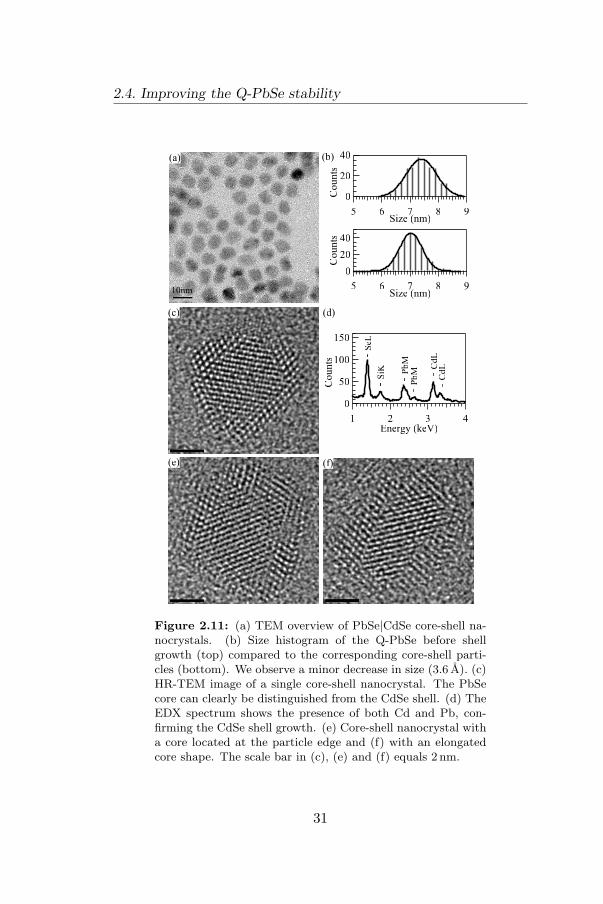
2.4. Improving the Q-PbSe stability
40
20
0Counts
98765Size (nm)
40
20
0
Counts
98765Size (nm)
150
100
50
0
Counts
4321Energy (keV)
- S
eL
- S
iK
- P
bM - C
dL
- C
dL
- P
bM
(a)
(c) (d)
(e) (f)
(b)
10nm
Figure 2.11: (a) TEM overview of PbSe|CdSe core-shell na-nocrystals. (b) Size histogram of the Q-PbSe before shellgrowth (top) compared to the corresponding core-shell parti-cles (bottom). We observe a minor decrease in size (3.6 A). (c)HR-TEM image of a single core-shell nanocrystal. The PbSecore can clearly be distinguished from the CdSe shell. (d) TheEDX spectrum shows the presence of both Cd and Pb, con-firming the CdSe shell growth. (e) Core-shell nanocrystal witha core located at the particle edge and (f) with an elongatedcore shape. The scale bar in (c), (e) and (f) equals 2 nm.
31
II. Q-PbSe Synthesis
multiple images, we observed that the PbSe core location variesstrongly among particles. It can be situated in the center of theparticle (figure 2.11(c)), as well as near the particle edge (fig-ure 2.11(e)). We also observe strong core shape variations (figure2.11(f)). These strong fluctuations in both shape and locationmight explain the broad absorption features for this sample.
2.4.3 Stability under ambient atmosphere
To study the evolution of the absorbance spectrum when storedunder ambient atmosphere, a PbSe|CdSe core-shell nanocrystalsuspension is prepared starting from 6.1 nm Q-PbSe, using a 10:1Cd:Pb ratio and growing the CdSe shell for 6 minutes. Figure2.12(a) shows the absorbance spectra of the original core andthe corresponding core-shell nanoparticles (black curves). Fromthe spectral positions of the absorption peak, we calculate a shellthickness of 1.1 nm.
Absorbance spectra are measured at different times duringstorage of the nanocrystals under ambient atmosphere. The ab-sorption peak of the Q-PbSe core particles shows a 127 nm blueshift after 26 days (figure 2.12(a), top curves). From the band gap,an effective size is determined using the sizing curve. The resultsyield a final decrease in effective size of 6.8 A after 26 days, whichis somewhat more than a single monolayer (figure 2.12(b)). Incontrast, the core-shell nanocrystal stability is strongly enhancedunder similar conditions. We observe no more than a 26 nm blueshift of the absorbance peak (figure 2.12(a), bottom curves), cor-responding to a decrease in effective size of 1.3 A(figure 2.12(c)).
The minor shift still observed for the core-shell nanocrystalsmight be the result of the short time during which the shell isallowed to grow. This could lead to a minor fraction of Pb atomsnear the nanocrystal surface which have not yet been replaced,consequently shifting the absorption peak upon oxidation.
32
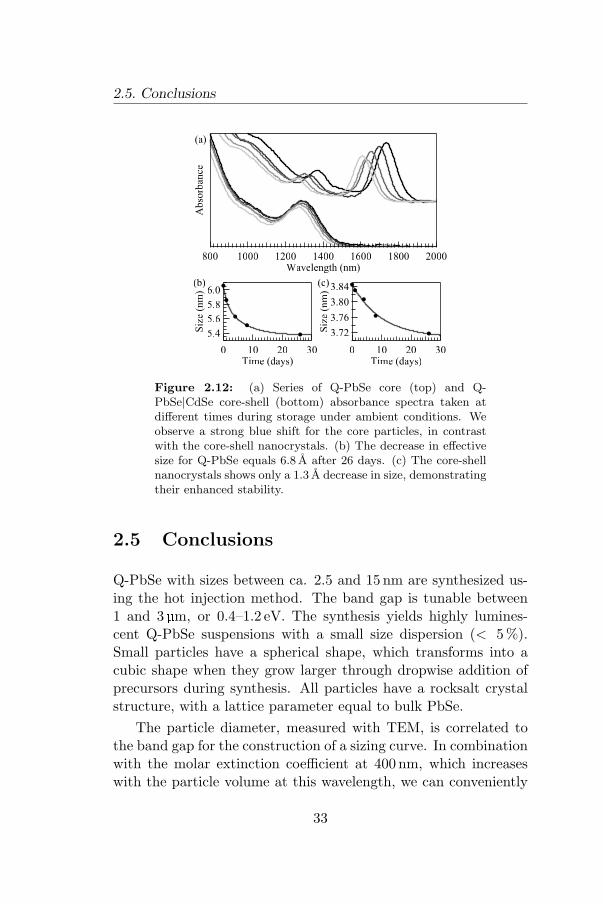
2.5. Conclusions
Ab
sorb
ance
200018001600140012001000800Wavelength (nm)
6.0
5.8
5.6
5.4Siz
e (n
m)
3020100Time (days)
(b) 3.84
3.80
3.76
3.72Siz
e (n
m)
3020100Time (days)
(c)
(a)
Figure 2.12: (a) Series of Q-PbSe core (top) and Q-PbSe|CdSe core-shell (bottom) absorbance spectra taken atdifferent times during storage under ambient conditions. Weobserve a strong blue shift for the core particles, in contrastwith the core-shell nanocrystals. (b) The decrease in effectivesize for Q-PbSe equals 6.8 A after 26 days. (c) The core-shellnanocrystals shows only a 1.3 A decrease in size, demonstratingtheir enhanced stability.
2.5 Conclusions
Q-PbSe with sizes between ca. 2.5 and 15 nm are synthesized us-ing the hot injection method. The band gap is tunable between1 and 3 µm, or 0.4–1.2 eV. The synthesis yields highly lumines-cent Q-PbSe suspensions with a small size dispersion (< 5 %).Small particles have a spherical shape, which transforms into acubic shape when they grow larger through dropwise addition ofprecursors during synthesis. All particles have a rocksalt crystalstructure, with a lattice parameter equal to bulk PbSe.
The particle diameter, measured with TEM, is correlated tothe band gap for the construction of a sizing curve. In combinationwith the molar extinction coefficient at 400 nm, which increaseswith the particle volume at this wavelength, we can conveniently
33

II. Q-PbSe Synthesis
derive both the particle size and concentration directly from theabsorbance spectrum.
Q-PbSe show a fast oxidation under ambient conditions. Theparticle stability is drastically improved however by growing aninorganic CdSe shell around the PbSe core through a cation ex-change mechanism.
34

Chapter III
Synthesis of PbS nanocrystals
3.1 Q-PbS synthesis
Our Q-PbS synthesis is inspired by the procedure described byCademartiri et al.25 As for the Q-PbSe synthesis, the entire syn-thesis is carried out under a nitrogen atmosphere to avoid oxida-tion. First, a stock solution of 0.16 g (5mmol) of sulfur, dissolvedin 15mL of oleylamine (OLA), is heated to 120� for 30 minutesand afterward cooled down to room temperature. In a three-neckflask, 0.56 g (2 mmol) of PbCl2 is mixed with 10mL of oleylamine(OLA) and heated to 75�–150�. After 30 minutes, 3 mL of thesulfur stock solution is mixed with 3 mL of OLA and swiftly in-jected into the three-neck flask. When the desired growth time isreached, the reaction is quenched by addition of 20 mL of BuOHand 10mL of MeOH. After centrifugation and decantation, thenanocrystals are suspended in toluene and stored under nitrogenand in the dark.
Absorbance spectra of aliquots taken at different times (be-tween 1 and 20 minutes) during a synthesis with an injection tem-perature of 125�, are shown in figure 3.1(a). We obtain a sharpfirst absorption peak, but observe only a small red shift (100 nm)with increasing growth time. Changing the injection temperatureto 150� or 75� does not significantly widen the available sizerange, as the first absorption peak for all absorbance spectra falls
35
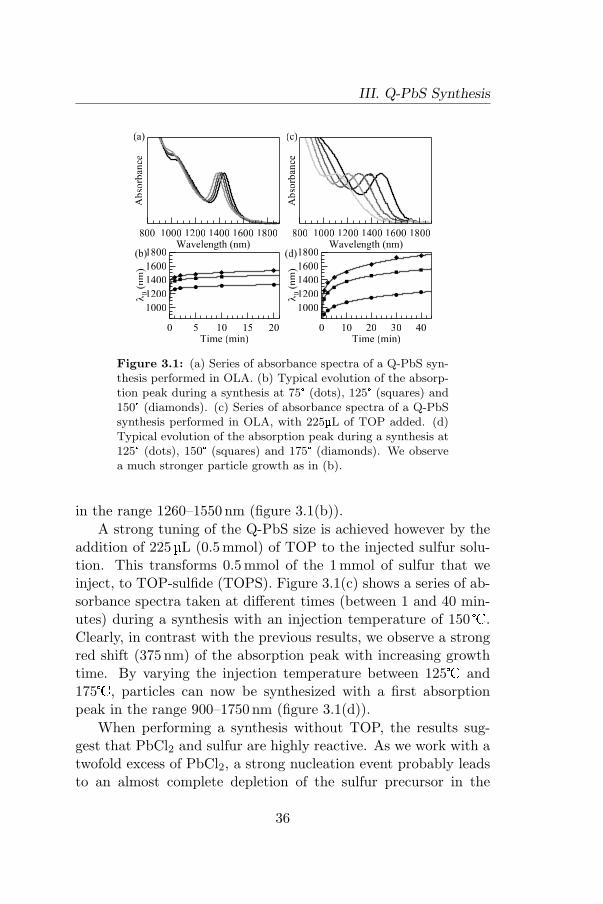
III. Q-PbS Synthesis
Ab
sorb
ance
18001600140012001000800Wavelength (nm)
Ab
sorb
ance
18001600140012001000800Wavelength (nm)
(c)
1800
1600
1400
1200
1000
l0 (
nm
)
20151050Time (min)
(b) 1800
1600
1400
1200
1000
l0 (
nm
)
403020100Time (min)
(d)
(a)
Figure 3.1: (a) Series of absorbance spectra of a Q-PbS syn-thesis performed in OLA. (b) Typical evolution of the absorp-tion peak during a synthesis at 75° (dots), 125° (squares) and150° (diamonds). (c) Series of absorbance spectra of a Q-PbSsynthesis performed in OLA, with 225µL of TOP added. (d)Typical evolution of the absorption peak during a synthesis at125° (dots), 150° (squares) and 175° (diamonds). We observea much stronger particle growth as in (b).
in the range 1260–1550 nm (figure 3.1(b)).A strong tuning of the Q-PbS size is achieved however by the
addition of 225 µL (0.5 mmol) of TOP to the injected sulfur solu-tion. This transforms 0.5 mmol of the 1 mmol of sulfur that weinject, to TOP-sulfide (TOPS). Figure 3.1(c) shows a series of ab-sorbance spectra taken at different times (between 1 and 40 min-utes) during a synthesis with an injection temperature of 150�.Clearly, in contrast with the previous results, we observe a strongred shift (375 nm) of the absorption peak with increasing growthtime. By varying the injection temperature between 125� and175�, particles can now be synthesized with a first absorptionpeak in the range 900–1750 nm (figure 3.1(d)).
When performing a synthesis without TOP, the results sug-gest that PbCl2 and sulfur are highly reactive. As we work with atwofold excess of PbCl2, a strong nucleation event probably leadsto an almost complete depletion of the sulfur precursor in the
36
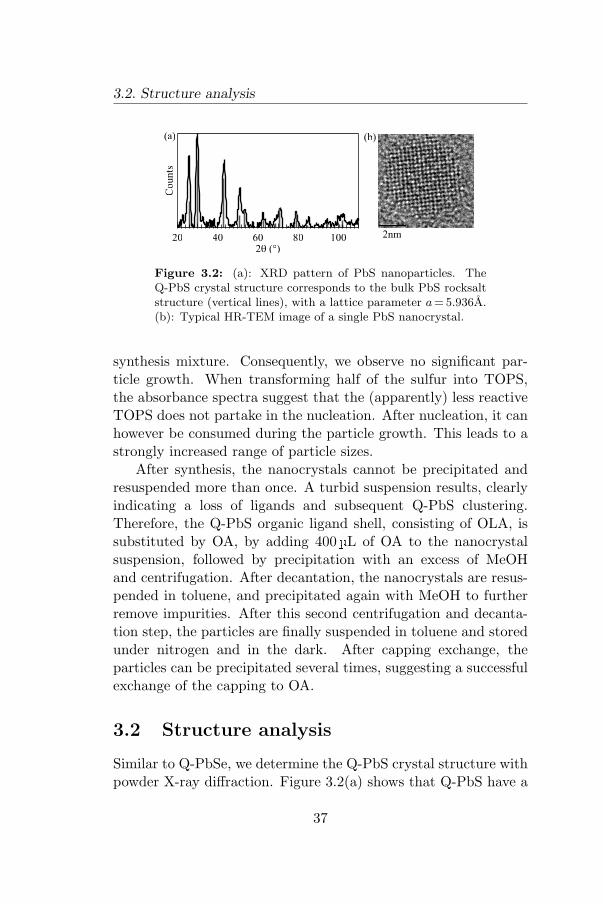
3.2. Structure analysis
Counts
100806040202q (°)
2nm
(b)(a)
Figure 3.2: (a): XRD pattern of PbS nanoparticles. TheQ-PbS crystal structure corresponds to the bulk PbS rocksaltstructure (vertical lines), with a lattice parameter a = 5.936A.(b): Typical HR-TEM image of a single PbS nanocrystal.
synthesis mixture. Consequently, we observe no significant par-ticle growth. When transforming half of the sulfur into TOPS,the absorbance spectra suggest that the (apparently) less reactiveTOPS does not partake in the nucleation. After nucleation, it canhowever be consumed during the particle growth. This leads to astrongly increased range of particle sizes.
After synthesis, the nanocrystals cannot be precipitated andresuspended more than once. A turbid suspension results, clearlyindicating a loss of ligands and subsequent Q-PbS clustering.Therefore, the Q-PbS organic ligand shell, consisting of OLA, issubstituted by OA, by adding 400 µL of OA to the nanocrystalsuspension, followed by precipitation with an excess of MeOHand centrifugation. After decantation, the nanocrystals are resus-pended in toluene, and precipitated again with MeOH to furtherremove impurities. After this second centrifugation and decanta-tion step, the particles are finally suspended in toluene and storedunder nitrogen and in the dark. After capping exchange, theparticles can be precipitated several times, suggesting a successfulexchange of the capping to OA.
3.2 Structure analysis
Similar to Q-PbSe, we determine the Q-PbS crystal structure withpowder X-ray diffraction. Figure 3.2(a) shows that Q-PbS have a
37
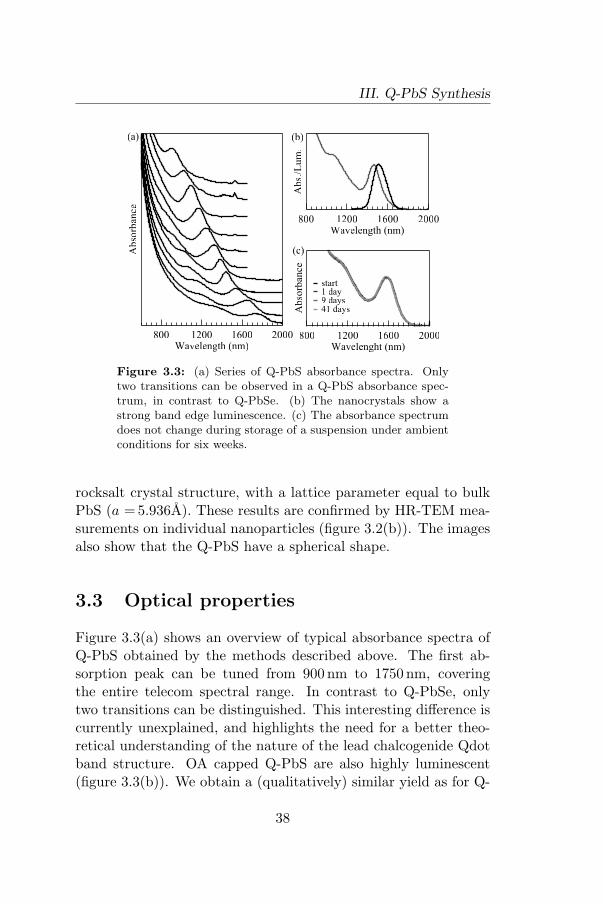
III. Q-PbS Synthesis
Ab
sorb
ance
200016001200800Wavelength (nm)
Ab
sorb
ance
200016001200800Wavelenght (nm)
start 1 day 9 days 41 days
(c)
Abs.
/Lum
.
200016001200800Wavelength (nm)
(b)(a)
Figure 3.3: (a) Series of Q-PbS absorbance spectra. Onlytwo transitions can be observed in a Q-PbS absorbance spec-trum, in contrast to Q-PbSe. (b) The nanocrystals show astrong band edge luminescence. (c) The absorbance spectrumdoes not change during storage of a suspension under ambientconditions for six weeks.
rocksalt crystal structure, with a lattice parameter equal to bulkPbS (a = 5.936A). These results are confirmed by HR-TEM mea-surements on individual nanoparticles (figure 3.2(b)). The imagesalso show that the Q-PbS have a spherical shape.
3.3 Optical properties
Figure 3.3(a) shows an overview of typical absorbance spectra ofQ-PbS obtained by the methods described above. The first ab-sorption peak can be tuned from 900 nm to 1750 nm, coveringthe entire telecom spectral range. In contrast to Q-PbSe, onlytwo transitions can be distinguished. This interesting difference iscurrently unexplained, and highlights the need for a better theo-retical understanding of the nature of the lead chalcogenide Qdotband structure. OA capped Q-PbS are also highly luminescent(figure 3.3(b)). We obtain a (qualitatively) similar yield as for Q-
38
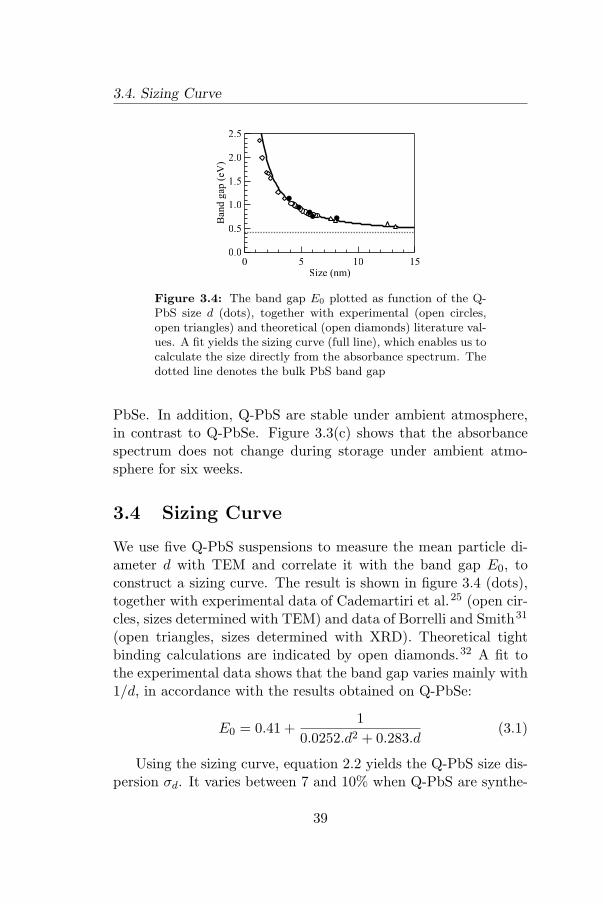
3.4. Sizing Curve
2.5
2.0
1.5
1.0
0.5
0.0
Ban
d g
ap (
eV)
151050Size (nm)
Figure 3.4: The band gap E0 plotted as function of the Q-PbS size d (dots), together with experimental (open circles,open triangles) and theoretical (open diamonds) literature val-ues. A fit yields the sizing curve (full line), which enables us tocalculate the size directly from the absorbance spectrum. Thedotted line denotes the bulk PbS band gap
PbSe. In addition, Q-PbS are stable under ambient atmosphere,in contrast to Q-PbSe. Figure 3.3(c) shows that the absorbancespectrum does not change during storage under ambient atmo-sphere for six weeks.
3.4 Sizing Curve
We use five Q-PbS suspensions to measure the mean particle di-ameter d with TEM and correlate it with the band gap E0, toconstruct a sizing curve. The result is shown in figure 3.4 (dots),together with experimental data of Cademartiri et al.25 (open cir-cles, sizes determined with TEM) and data of Borrelli and Smith31
(open triangles, sizes determined with XRD). Theoretical tightbinding calculations are indicated by open diamonds.32 A fit tothe experimental data shows that the band gap varies mainly with1/d, in accordance with the results obtained on Q-PbSe:
E0 = 0.41 +1
0.0252.d2 + 0.283.d(3.1)
Using the sizing curve, equation 2.2 yields the Q-PbS size dis-persion σd. It varies between 7 and 10% when Q-PbS are synthe-
39
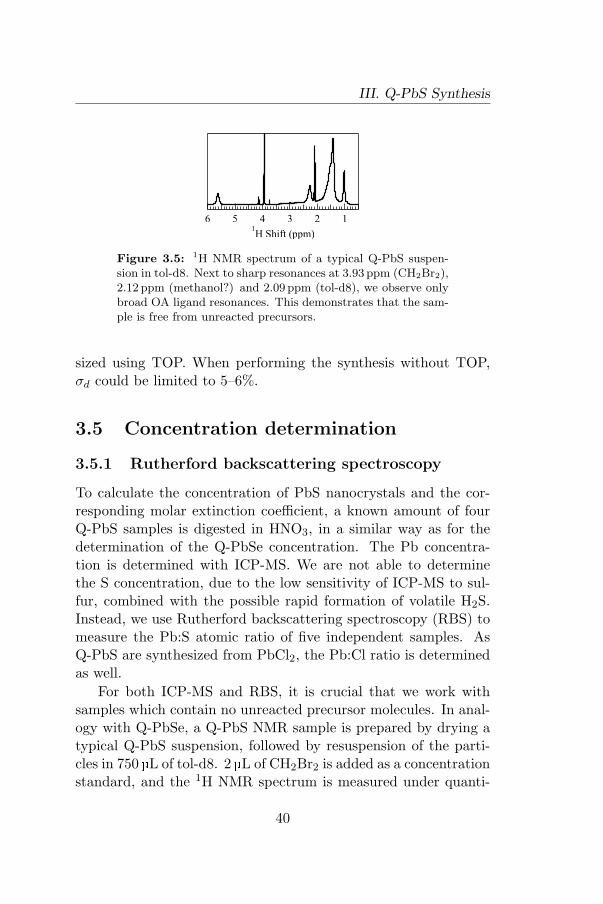
III. Q-PbS Synthesis
6 5 4 3 2 11H Shift (ppm)
Figure 3.5: 1H NMR spectrum of a typical Q-PbS suspen-sion in tol-d8. Next to sharp resonances at 3.93 ppm (CH2Br2),2.12 ppm (methanol?) and 2.09 ppm (tol-d8), we observe onlybroad OA ligand resonances. This demonstrates that the sam-ple is free from unreacted precursors.
sized using TOP. When performing the synthesis without TOP,σd could be limited to 5–6%.
3.5 Concentration determination
3.5.1 Rutherford backscattering spectroscopy
To calculate the concentration of PbS nanocrystals and the cor-responding molar extinction coefficient, a known amount of fourQ-PbS samples is digested in HNO3, in a similar way as for thedetermination of the Q-PbSe concentration. The Pb concentra-tion is determined with ICP-MS. We are not able to determinethe S concentration, due to the low sensitivity of ICP-MS to sul-fur, combined with the possible rapid formation of volatile H2S.Instead, we use Rutherford backscattering spectroscopy (RBS) tomeasure the Pb:S atomic ratio of five independent samples. AsQ-PbS are synthesized from PbCl2, the Pb:Cl ratio is determinedas well.
For both ICP-MS and RBS, it is crucial that we work withsamples which contain no unreacted precursor molecules. In anal-ogy with Q-PbSe, a Q-PbS NMR sample is prepared by drying atypical Q-PbS suspension, followed by resuspension of the parti-cles in 750 µL of tol-d8. 2 µL of CH2Br2 is added as a concentrationstandard, and the 1H NMR spectrum is measured under quanti-
40
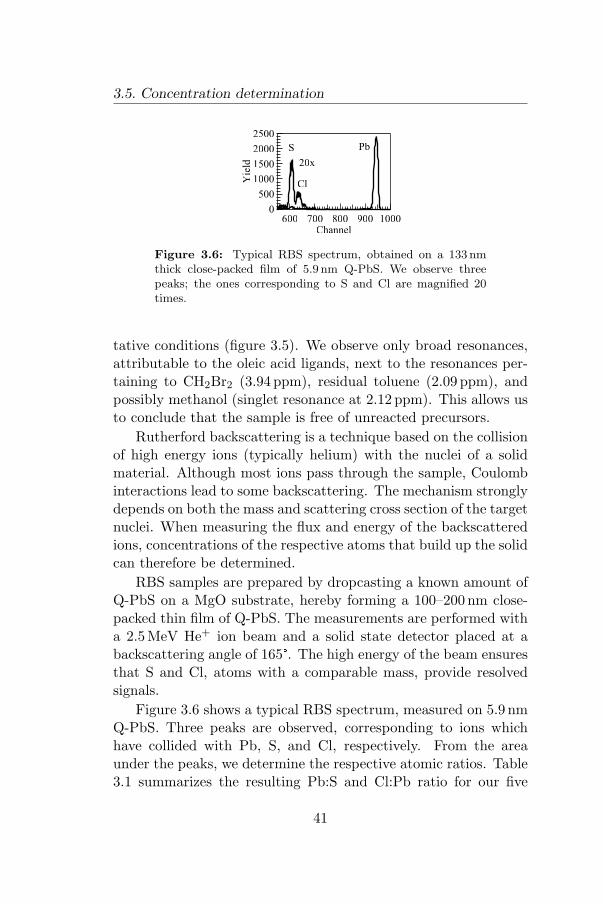
3.5. Concentration determination
2500
2000
1500
1000
500
0
Yie
ld
1000900800700600Channel
S Pb
Cl
20x
Figure 3.6: Typical RBS spectrum, obtained on a 133 nmthick close-packed film of 5.9 nm Q-PbS. We observe threepeaks; the ones corresponding to S and Cl are magnified 20times.
tative conditions (figure 3.5). We observe only broad resonances,attributable to the oleic acid ligands, next to the resonances per-taining to CH2Br2 (3.94 ppm), residual toluene (2.09 ppm), andpossibly methanol (singlet resonance at 2.12 ppm). This allows usto conclude that the sample is free of unreacted precursors.
Rutherford backscattering is a technique based on the collisionof high energy ions (typically helium) with the nuclei of a solidmaterial. Although most ions pass through the sample, Coulombinteractions lead to some backscattering. The mechanism stronglydepends on both the mass and scattering cross section of the targetnuclei. When measuring the flux and energy of the backscatteredions, concentrations of the respective atoms that build up the solidcan therefore be determined.
RBS samples are prepared by dropcasting a known amount ofQ-PbS on a MgO substrate, hereby forming a 100–200 nm close-packed thin film of Q-PbS. The measurements are performed witha 2.5 MeV He+ ion beam and a solid state detector placed at abackscattering angle of 165°. The high energy of the beam ensuresthat S and Cl, atoms with a comparable mass, provide resolvedsignals.
Figure 3.6 shows a typical RBS spectrum, measured on 5.9 nmQ-PbS. Three peaks are observed, corresponding to ions whichhave collided with Pb, S, and Cl, respectively. From the areaunder the peaks, we determine the respective atomic ratios. Table3.1 summarizes the resulting Pb:S and Cl:Pb ratio for our five
41

III. Q-PbS Synthesis
d (nm) Pb:S Cl:Pb
3.7 1.37 0.494.1 1.23 0.384.9 1.26 0.375.9 1.27 0.326.8 1.28 0.34
Table 3.1: Size d of the five samples used for RBS, togetherwith the Pb:S and Cl:Pb ratio obtained. All Q-PbS samplesshow a Pb excess.
d (nm) CPb (mg/L) Pb:S c0 (µM) A400 (cm−1)
3.6 5.78 1.37 0.054 0.5634.5 7.08 1.26 0.033 0.7075.4 7.65 1.26 0.021 0.7616.5 4.98 1.26 0.008 0.504
Table 3.2: Size d, weight concentration CPb, obtained withICP-MS, Pb:S ratio (obtained from RBS), resulting nano-crystal concentration c0 and absorbance of the suspension at400 nm A400.
samples. We estimate the error on the data to be 2.5%. Thesample with the smallest size shows a Pb:S ratio of 1.37:1. Forall other samples however, within experimental error, we obtainan average ratio of 1.26:1. These results demonstrate that, likeQ-PbSe, Q-PbS are non-stoichiometric, showing a systematic Pbexcess. Interestingly, a significant amount of Cl is also present,at ratios which are consistent with results of Cademartiri et al.33
Most likely, the Cl-atoms reside at the nanocrystal surface.
Taking the Pb:S stoichiometry into account, the Pb weightconcentration, determined with ICP-MS, yields the nanocrystalconcentration (see section 2.2 for calculations). Table 3.2 showsthe results for the four samples measured. Note that, in accor-dance with the RBS measurements, we take a Pb:S ratio of 1.37:1for the 3.6 nm Q-PbS, while for the other samples, a ratio of 1.26:1is used.
42

3.5. Concentration determination
6
4
2
0e4
00 (
cm-1
/ m
M)
76543210Size (nm)
(a)
0.01
0.1
1
Ab
sorb
ance
3.02.01.0Energy (eV)
(b)
Figure 3.7: (a) The Q-PbS molar extinction coefficient at400 nm ε400 (circles) scales with the nanocrystal volume, im-plying that the absorbance at this wavelength is no longer in-fluenced by quantum confinement. (b) Normalized absorbancespectra of the four samples used to determine ε. At energieswell above the band gap, all spectra coincide. This confirmsthat quantum confinement effects are absent at these energies.
3.5.2 The molar extinction coefficient
From the absorbance of an equal amount of nanocrystals, the mo-lar extinction coefficient is again derived using Beer’s law. Samplesare prepared by drying a known amount of Q-PbS, and suspendingthem in 1 mL of C2Cl4. The absorbance at 400 nm A400 (in cm−1)is listed in table 3.2. At this wavelength, the molar extinctioncoefficient scales with the nanocrystal volume (figure 3.7(a)):
ε400 = (0.0233± 0.0001).d3 cm−1/µM (3.2)
The Q-PbS size d is defined in nm. As with Q-PbSe, the cubicsize dependence demonstrates that the Q-PbS optical propertiesat energies well above the band gap are not influenced by quan-tum confinement. This result is also apparent from the absorbancespectra, normalized at 400 nm, as all spectra coincide at high en-ergies (figure 3.7(b)).
43
III. Q-PbS Synthesis
3.6 Conclusions
Spherical Q-PbS with sizes varying between 2.9 and 7.2 nm aresynthesized using a hot injection method. The size range enables atuning of the band gap between 900 and 1750 nm, or 0.71–1.38 eV.As with Q-PbSe, the particles have a rocksalt structure with alattice parameter equal to bulk material.
The Q-PbS sizing curve and molar extinction coefficient alsoshow much resemblance to Q-PbSe, most probably due to theirsimilar band structure. In both cases, the sizing curve varies withd−1, in accordance with theoretical calculations. In addition, themolar extinction coefficient at 400 nm increases with the particlevolume, indicating that the optical properties are bulk-like at thesewavelengths. Luminescence properties are also comparable to Q-PbSe.
Q-PbS have an additional benefit with respect to Q-PbSe how-ever. They are much more resistant against oxidation, showing nosignificant blue shift of the optical properties after storage underambient conditions for six weeks.
44
Bibliography
[1] C. D. Donega, P. Liljeroth and D. Vanmaekelbergh, Physi-cochemical evaluation of the hot-injection method, a synthesisroute for monodisperse nanocrystals, Small 2005, 1 , 1152–1162.
[2] E. H. Sargent, Infrared quantum dots, Adv. Mater. 2005, 17 ,515–522.
[3] C. Burda et al., Chemistry and properties of nanocrystals ofdifferent shapes, Chem. Rev. 2005, 105 , 1025–1102.
[4] Y. Yin and A. P. Alivisatos, Colloidal nanocrystal synthesisand the organic-inorganic interface, Nature 2005, 437 , 664–670.
[5] C. B. Murray et al., Colloidal synthesis of nanocrystals andnanocrystal superlattices, IBM J. Res. Dev. 2001, 45 , 47–56.
[6] B. L. Wehrenberg, C. J. Wang and P. Guyot-Sionnest, Inter-band and intraband optical studies of PbSe colloidal quantumdots, J. Phys. Chem. B 2002, 106 , 10634–10640.
[7] H. Du et al., Optical properties of colloidal PbSe nanocrystals,Nano Lett. 2002, 2 , 1321–1324.
[8] P. Liljeroth et al., Density of states measured by scanning-tunneling spectroscopy sheds new light on the optical tran-sitions in PbSe nanocrystals, Phys. Rev. Lett. 2005, 95 ,086801.
[9] J. M. An et al., The peculiar electronic structure of PbSequantum dots, Nano Lett. 2006, 6 , 2728–2735.
[10] R. Koole et al., Optical investigation of quantum confinementin PbSe nanocrystals at different points in the Brillouin zone,Small 2008, 4 , 127–133.
[11] M. J. Bowers, J. R. McBride and S. J. Rosenthal, White-lightemission from magic-sized cadmium selenide nanocrystals, J.Am. Chem. Soc. 2005, 127 , 15378–15379.
[12] T. Okuno et al., Size-dependent picosecond energy relaxationin PbSe quantum dots, Appl. Phys. Lett. 2000, 77 , 504–506.
[13] A. Sashchiuk et al., Synthesis and characterization of PbSe
45

and PbSe/PbS core-shell colloidal nanocrystals, J. Cryst.Growth 2002, 240 , 431–438.
[14] J. S. Steckel et al., 1.3 mu m to 1.55 µm tunable electrolumi-nescence from PbSe quantum dots embedded within an organicdevice, Adv. Mater. 2003, 15 , 1862–1866.
[15] B. L. Wehrenberg and P. Guyot-Sionnest, Electron and holeinjection in PbSe quantum dot films, J. Am. Chem. Soc.2003, 125 , 7806–7807.
[16] J. M. Pietryga et al., Pushing the band gap envelope: Mid-infrared emitting colloidal PbSe quantum dots, J. Am. Chem.Soc. 2004, 126 , 11752–11753.
[17] W. W. Yu et al., Preparation and characterization ofmonodisperse PbSe semiconductor nanocrystals in a nonco-ordinating solvent , Chem. Mat. 2004, 16 , 3318–3322.
[18] M. Law et al., Structural, optical, and electrical propertiesof PbSe nanocrystal solids treated thermally or with simpleamines, J. Am. Chem. Soc. 2008, 130 , 5974–5985.
[19] A. Lipovskii et al., Synthesis and characterization of PbSequantum dots in phosphate glass, Appl. Phys. Lett. 1997,71 , 3406–3408.
[20] G. Allan and C. Delerue, Confinement effects in PbSe quan-tum wells and nanocrystals, Phys. Rev. B 2004, 70 , 245321.
[21] J. S. Steckel et al., On the mechanism of lead chalcogenidenanocrystal formation, J. Am. Chem. Soc. 2006, 128 , 13032–13033.
[22] O. Schmelz et al., Supramolecular complexes from CdSe nano-crystals and organic fluorophors, Langmuir 2001, 17 , 2861–2865.
[23] W. W. Yu et al., Experimental determination of the extinctioncoefficient of CdTe, CdSe, and CdS nanocrystals, Chem. Mat.2003, 15 , 2854–2860.
[24] P. R. Yu et al., Absorption cross-section and related opticalproperties of colloidal InAs quantum dots, J. Phys. Chem. B2005, 109 , 7084–7087.
46

[25] L. Cademartiri et al., Size-dependent extinction coefficientsof PbS quantum dots, J. Am. Chem. Soc. 2006, 128 , 10337–10346.
[26] J. Jasieniak and P. Mulvaney, From Cd-rich to Se-rich - Themanipulation of CdSe nanocrystal surface stoichiometry , J.Am. Chem. Soc. 2007, 129 , 2841–2848.
[27] A. A. Guzelian et al., Synthesis of size-selected, surface-passivated InP nanocrystals, J. Phys. Chem. 1996, 100 ,7212–7219.
[28] J. van Embden and P. Mulvaney, Nucleation and growth ofCdSe nanocrystals in a binary ligand system, Langmuir 2005,21 , 10226–10233.
[29] J. M. Pietryga et al., Utilizing the lability of lead selenideto produce heterostructured nanocrystals with bright, stableinfrared emission, J. Am. Chem. Soc. 2008, 130 , 4879–4885.
[30] G. Pellegrini, G. Mattei and P. Mazzoldi, Finite depth squarewell model: Applicability and limitations, J. Appl. Phys.2005, 97 , 073706.
[31] N. F. Borrelli and D. W. Smith, Quantum Confinement ofPbS Microcrystals in Glass, J. Non-cryst. Solids 1994, 180 ,25–31.
[32] R. S. Kane, R. E. Cohen and R. Silbey, Theoretical study ofthe electronic structure of PbS nanoclusters, J. Phys. Chem.1996, 100 , 7928–7932.
[33] L. Cademartiri et al., Multigram scale, solventless, anddiffusion-controlled route to highly monodisperse PbS nano-crystals, J. Phys. Chem. B 2006, 110 , 671–673.
47

48

Part 2
Surface chemistry of colloidalsemiconductor nanocrystals

Introduction
Most colloidal nanocrystals come with a capping of organicligands, and the chemistry of this organic|inorganic interfacestrongly affects their physical and chemical properties. Recently,interest in this intimate interplay between the ligands and thenanocrystal surface has grown considerably. For instance, by lim-iting the growth rate of specific lattice planes during synthesis, theligands determine the size and shape of the nanocrystals, leadingto the growth of quantum rods, wires, tetrapods or even teardrops.1 In addition, the ligands ensure colloid stability by sterichindrance, and the type of ligands (hydrophobic vs hydrophilic)determines the nanocrystal solubility.2 A good ligand shell alsopassivates surface states efficiently, yielding nanocrystals with ahigh photoluminescence quantum yield.3
The examples make it clear that the ligands play an essentialrole in the nanocrystal synthesis and processing. Yet, at present,a major problem hampering the routine chemical investigation ofthe organic|inorganic interface is the lack of well-established meth-ods to identify and quantify the nanocrystal ligands and the corre-sponding ligand dynamics.1 As a result, the role of the ligands andthe effect of ligand engineering have mostly been demonstrated byindirect means.
Observation of nanocrystal ligands
In several studies, the role of the ligand is probed indirectly bystudying a change in luminescence.4–7 Starting from a given na-nocrystal suspension, typically an excess of new ligands is added,
51
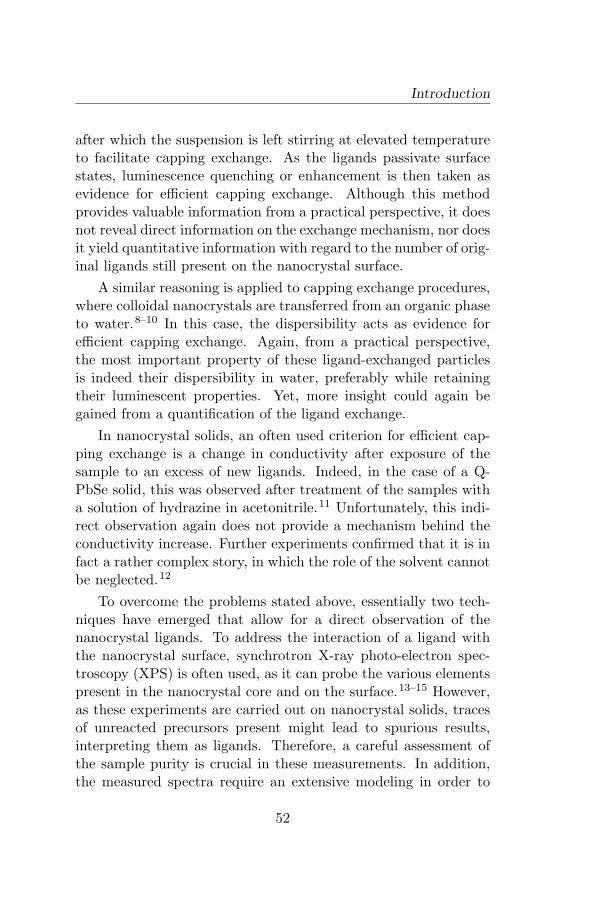
Introduction
after which the suspension is left stirring at elevated temperatureto facilitate capping exchange. As the ligands passivate surfacestates, luminescence quenching or enhancement is then taken asevidence for efficient capping exchange. Although this methodprovides valuable information from a practical perspective, it doesnot reveal direct information on the exchange mechanism, nor doesit yield quantitative information with regard to the number of orig-inal ligands still present on the nanocrystal surface.
A similar reasoning is applied to capping exchange procedures,where colloidal nanocrystals are transferred from an organic phaseto water.8–10 In this case, the dispersibility acts as evidence forefficient capping exchange. Again, from a practical perspective,the most important property of these ligand-exchanged particlesis indeed their dispersibility in water, preferably while retainingtheir luminescent properties. Yet, more insight could again begained from a quantification of the ligand exchange.
In nanocrystal solids, an often used criterion for efficient cap-ping exchange is a change in conductivity after exposure of thesample to an excess of new ligands. Indeed, in the case of a Q-PbSe solid, this was observed after treatment of the samples witha solution of hydrazine in acetonitrile.11 Unfortunately, this indi-rect observation again does not provide a mechanism behind theconductivity increase. Further experiments confirmed that it is infact a rather complex story, in which the role of the solvent cannotbe neglected.12
To overcome the problems stated above, essentially two tech-niques have emerged that allow for a direct observation of thenanocrystal ligands. To address the interaction of a ligand withthe nanocrystal surface, synchrotron X-ray photo-electron spec-troscopy (XPS) is often used, as it can probe the various elementspresent in the nanocrystal core and on the surface.13–15 However,as these experiments are carried out on nanocrystal solids, tracesof unreacted precursors present might lead to spurious results,interpreting them as ligands. Therefore, a careful assessment ofthe sample purity is crucial in these measurements. In addition,the measured spectra require an extensive modeling in order to
52
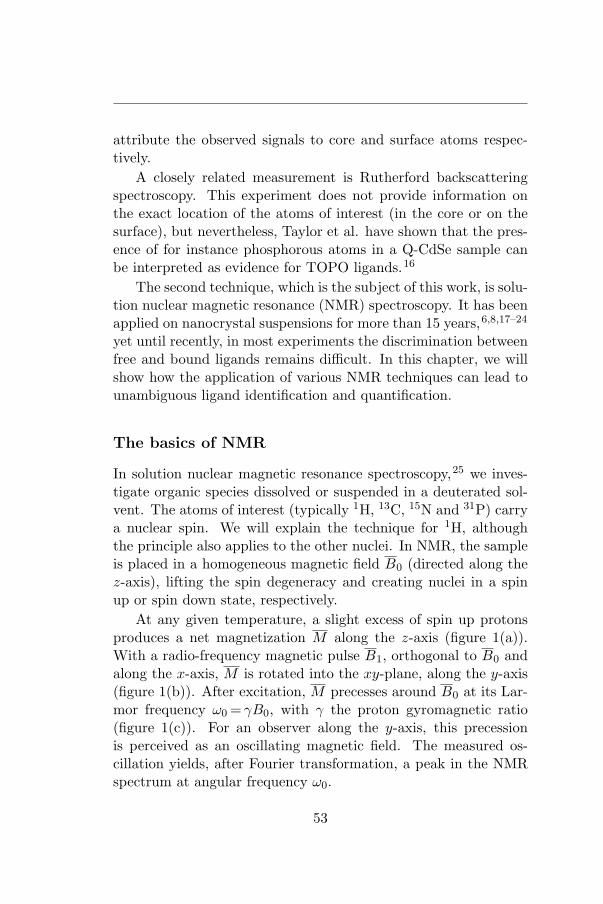
attribute the observed signals to core and surface atoms respec-tively.
A closely related measurement is Rutherford backscatteringspectroscopy. This experiment does not provide information onthe exact location of the atoms of interest (in the core or on thesurface), but nevertheless, Taylor et al. have shown that the pres-ence of for instance phosphorous atoms in a Q-CdSe sample canbe interpreted as evidence for TOPO ligands.16
The second technique, which is the subject of this work, is solu-tion nuclear magnetic resonance (NMR) spectroscopy. It has beenapplied on nanocrystal suspensions for more than 15 years,6,8,17–24
yet until recently, in most experiments the discrimination betweenfree and bound ligands remains difficult. In this chapter, we willshow how the application of various NMR techniques can lead tounambiguous ligand identification and quantification.
The basics of NMR
In solution nuclear magnetic resonance spectroscopy,25 we inves-tigate organic species dissolved or suspended in a deuterated sol-vent. The atoms of interest (typically 1H, 13C, 15N and 31P) carrya nuclear spin. We will explain the technique for 1H, althoughthe principle also applies to the other nuclei. In NMR, the sampleis placed in a homogeneous magnetic field B0 (directed along thez-axis), lifting the spin degeneracy and creating nuclei in a spinup or spin down state, respectively.
At any given temperature, a slight excess of spin up protonsproduces a net magnetization M along the z-axis (figure 1(a)).With a radio-frequency magnetic pulse B1, orthogonal to B0 andalong the x-axis, M is rotated into the xy-plane, along the y-axis(figure 1(b)). After excitation, M precesses around B0 at its Lar-mor frequency ω0 = γB0, with γ the proton gyromagnetic ratio(figure 1(c)). For an observer along the y-axis, this precessionis perceived as an oscillating magnetic field. The measured os-cillation yields, after Fourier transformation, a peak in the NMRspectrum at angular frequency ω0.
53
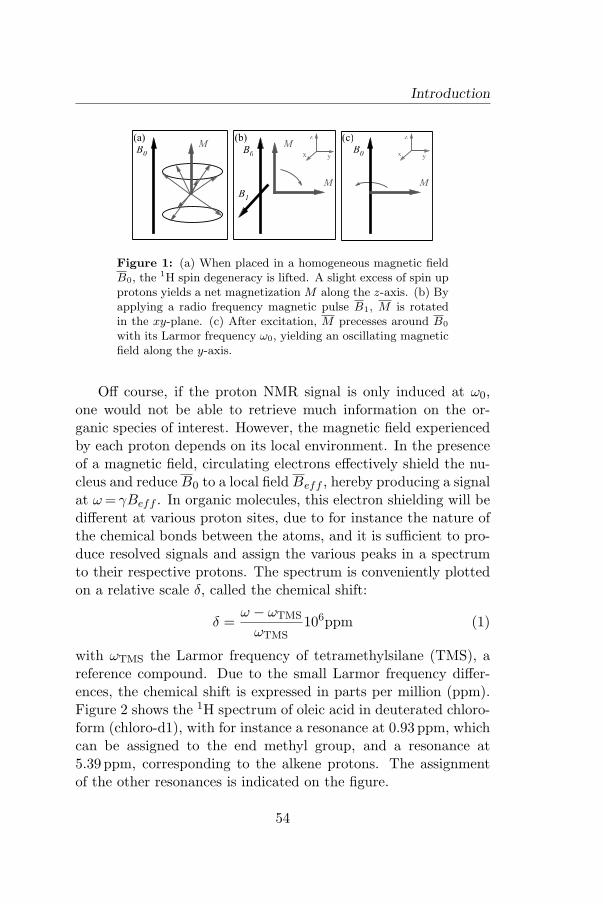
Introduction
M M
M M
x
z
y yx
z
B0 B0 B0
B1
(a) (b) (c)
Figure 1: (a) When placed in a homogeneous magnetic fieldB0, the 1H spin degeneracy is lifted. A slight excess of spin upprotons yields a net magnetization M along the z-axis. (b) Byapplying a radio frequency magnetic pulse B1, M is rotatedin the xy-plane. (c) After excitation, M precesses around B0
with its Larmor frequency ω0, yielding an oscillating magneticfield along the y-axis.
Off course, if the proton NMR signal is only induced at ω0,one would not be able to retrieve much information on the or-ganic species of interest. However, the magnetic field experiencedby each proton depends on its local environment. In the presenceof a magnetic field, circulating electrons effectively shield the nu-cleus and reduce B0 to a local field Beff , hereby producing a signalat ω = γBeff . In organic molecules, this electron shielding will bedifferent at various proton sites, due to for instance the nature ofthe chemical bonds between the atoms, and it is sufficient to pro-duce resolved signals and assign the various peaks in a spectrumto their respective protons. The spectrum is conveniently plottedon a relative scale δ, called the chemical shift:
δ =ω − ωTMS
ωTMS106ppm (1)
with ωTMS the Larmor frequency of tetramethylsilane (TMS), areference compound. Due to the small Larmor frequency differ-ences, the chemical shift is expressed in parts per million (ppm).Figure 2 shows the 1H spectrum of oleic acid in deuterated chloro-form (chloro-d1), with for instance a resonance at 0.93 ppm, whichcan be assigned to the end methyl group, and a resonance at5.39 ppm, corresponding to the alkene protons. The assignmentof the other resonances is indicated on the figure.
54

5 4 3 2 11H Shift (ppm)
1
2
36
4
5
HOC
O 1 2 3 4 5 5 4 3 6
Figure 2: 1H NMR spectrum of oleic acid in chloro-d1. Theresonance at 0.93 ppm for instance, can be assigned to themethyl protons.
Two mechanisms lead to relaxation of the nuclear spins. T1, orspin-lattice relaxation, describes the restoration of thermal equi-librium. This corresponds to the recovery of the magnetizationalong the z-axis, when spins relax back to their ground state afterexcitation:
Mz = Mz,eq(1− e−t/T1) (2)
The main relaxation path is through the loss of energy to vibra-tional and rotational modes of the surrounding medium (the lat-tice).
T2, or spin-spin relaxation describes the decay of net magneti-zation in the xy-plane:
Mxy = Mxy,0e−t/T2 (3)
Neglecting the instrumental field inhomogeneity, they arise fromlocal field fluctuations due to rotational motions of the protons.This leads to a dephasing of the individual nuclear spins and con-sequently a reduction of the magnetization in the xy-plane (figure3(a)). It results in an exponential decay of the observed NMRsignal, with a corresponding line width F (full width at half max-imum) after Fourier transformation equal to:
F =1
πT2(4)
55

Introduction
T1 /
T2
tc
T1
T2
M
yx
z
B0
(a) (b)
Figure 3: (a) T2 relaxation occurs due to the dephasing ofindividual nuclear spins, causing an exponential decay of themagnetization in the xy-plane. (b) Typical evolution of T1 andT2 with increasing rotational correlation time τc. T1 shows aminimum, while T2 decreases monotonically.
T1 and T2 relaxation depend strongly on the proton rotationalmobility, characterized by the rotational correlation time τc:
τc =η
kBT
πd3H
6(5)
with η the solvent viscosity and dH the hydrodynamic diameter.Note that a large τc corresponds to a small rotational mobility.
Without going into further detail, figure 3(b) shows the typicalevolution of T1 and T2 as τc increases.
2D experiments
In general, a single 1H NMR spectrum does not provide sufficientinformation to assign each NMR resonance and resolve the struc-ture of an organic molecule, but the NMR spectroscopist has amyriad of 2D techniques available which assist in a complete as-signment.25 We highlight two of them, used in the context of ourresearch, without going into further detail on the exact pulse se-quences used.
The first technique, correlation spectroscopy (COSY), mapsscalar through-bond interactions between protons which are no fur-ther apart than three chemical bonds. In practice, this typicallyimplies protons which are bonded to two adjacent carbon atomsin an organic molecule. The measurement results in a 2D COSY
56
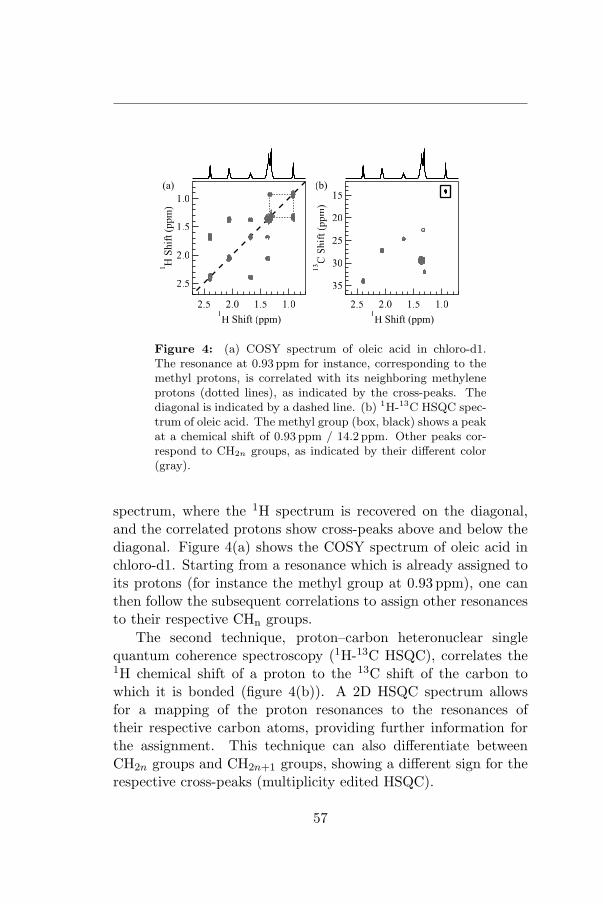
2.5 2.0 1.5 1.01H Shift (ppm)
35
30
25
20
15
13C
Shif
t (p
pm
)
(b)
2.5
2.0
1.5
1.0
1H
Sh
ift
(pp
m)
2.5 2.0 1.5 1.01H Shift (ppm)
(a)
Figure 4: (a) COSY spectrum of oleic acid in chloro-d1.The resonance at 0.93 ppm for instance, corresponding to themethyl protons, is correlated with its neighboring methyleneprotons (dotted lines), as indicated by the cross-peaks. Thediagonal is indicated by a dashed line. (b) 1H-13C HSQC spec-trum of oleic acid. The methyl group (box, black) shows a peakat a chemical shift of 0.93 ppm / 14.2 ppm. Other peaks cor-respond to CH2n groups, as indicated by their different color(gray).
spectrum, where the 1H spectrum is recovered on the diagonal,and the correlated protons show cross-peaks above and below thediagonal. Figure 4(a) shows the COSY spectrum of oleic acid inchloro-d1. Starting from a resonance which is already assigned toits protons (for instance the methyl group at 0.93 ppm), one canthen follow the subsequent correlations to assign other resonancesto their respective CHn groups.
The second technique, proton–carbon heteronuclear singlequantum coherence spectroscopy (1H-13C HSQC), correlates the1H chemical shift of a proton to the 13C shift of the carbon towhich it is bonded (figure 4(b)). A 2D HSQC spectrum allowsfor a mapping of the proton resonances to the resonances oftheir respective carbon atoms, providing further information forthe assignment. This technique can also differentiate betweenCH2n groups and CH2n+1 groups, showing a different sign for therespective cross-peaks (multiplicity edited HSQC).
57

58
Chapter IV
Surface chemistry of InPnanocrystals
4.1 Q-InP synthesis and elemental proper-ties
InP nanocrystals are synthesized according to established litera-ture methods.13,26 The entire synthesis is carried out under a ni-trogen atmosphere to avoid oxidation. Briefly, indium trichlorideand tris(trimethylsilyl) phosphine precursor solutions are injectedin a mixture of TOP and TOPO at elevated temperatures. Aftergrowing the particles for six days, the reaction is quenched to roomtemperature by the addition of cold toluene. The procedure yieldsa polydisperse suspension of InP nanocrystals. After precipitationof the particles and resuspension in toluene, the size dispersion isreduced by size-selective precipitation. Upon addition of methanol(a solvent in which the particles cannot be suspended), larger par-ticles tend to cluster and precipitate more easily than smaller ones,due to the larger van der Waals interactions between them. Whenadding only a small amount of methanol to the suspension, thiseffect can be exploited to selectively precipitate the largest par-ticles while keeping the smaller ones suspended. After repeatedmethanol addition, precipitation and decantation steps, typically
59

IV. Q-InP surface chemistry
Ab
sorb
ance
800700600500400Wavelength (nm)
Counts
806040202q (°)
2.4
2.0
1.6
Ban
d g
ap (
eV)
4.54.03.53.0Size (nm)
6
4
2
0
e3
50 (
cm-1
/µM
)
543210Size (nm)
Figure 4.1: (a) Series of Q-InP absorbance spectra. The firstabsorption peak can be tuned from 550 nm to 700 nm. (b) TheQ-InP XRD pattern shows that the nanocrystals have a zincblend crystal structure, with a lattice parameter equal to bulkInP. (c) Sizing curve for Q-InP. In contrast with lead chalco-genide nanocrystals, we observe a quadratic size dependence.(d) The Q-InP molar extinction coefficient at 350 nm showsa cubic size dependence (dots: data obtained by Talapin etal.27).
20 to 25 fractions are obtained from a single synthesis. The nano-crystals are finally suspended in toluene and stored under nitrogenand in the dark.
A typical series of Q-InP absorbance spectra is shown in figure4.1(a). Bulk InP has a band gap of 1.35 eV (absorption edge at961 nm). Due to quantum confinement, the Q-InP absorption peakvaries between 550 nm and 700 nm. The XRD pattern in figure4.1(b) demonstrates that Q-InP have a zinc blend crystal struc-ture, with a lattice parameter equal to bulk InP (a= 5.8687 A).
TEM sizes are correlated with the Q-InP band gap (figure4.1(c)), to which we fit following sizing curve:
E0 = 1.35 +1
0.119.d2(4.1)
60
4.2. Identification of the Q-InP ligands
In contrast with the results obtained on lead chalcogenide nano-crystals, Q-InP show a quadratic size dependence. When calculat-ing the size dispersion using equation 2.2, we find values of 8–10%.
Q-InP concentrations are determined from literature data ofTalapin et al. on the molar extinction coefficient (figure 4.1(d)).27
A cubic power law fitted to the data yields following relation:
εInP,350 = 0.0386 . d3 cm−1/µM (4.2)
Both equations enable us to conveniently determine the Q-InP sizeand concentration directly from the absorbance spectrum.
4.2 Identification of the Q-InP ligands
4.2.1 Introduction
As stated in the introduction of this part, we study the or-ganic ligands with solution nuclear magnetic resonance spec-troscopy. NMR measurements are performed on a Bruker DRX500 equipped with a 5mm TBI Z gradient probe head, operatingat 1H and 13C frequencies of 500.13 and 125.76 MHz respectively.We perform all experiments at a temperature of 295 K unlessstated otherwise. To identify the molecules in suspension, weuse different NMR techniques. 1H and 31P NMR spectra arealready briefly touched upon in section 2.2.1. In this part, wecombine these measurements with pulsed field gradient diffusionordered spectroscopy (DOSY),28–30 1H-1H COSY and 1H-13CHSQC. DOSY measurements are performed using the standardbipolar LED (BPP-LED) sequence without temperature control,hereby avoiding convection artifacts. For an adequate samplingof the slowest diffusing species, we use a gradient pulse durationδ of 5-6ms and a diffusion delay ∆ of 200-300 ms. The gradientstrength G is varied between 2 and 95% of the maximal strengthof 56.3G/cm.
With DOSY, one can measure diffusion-weighted 1H spectra,selectively filtering out fast diffusing species with a magnetic fieldgradient. The signal attenuation is given by the Stejskal-Tanner
61
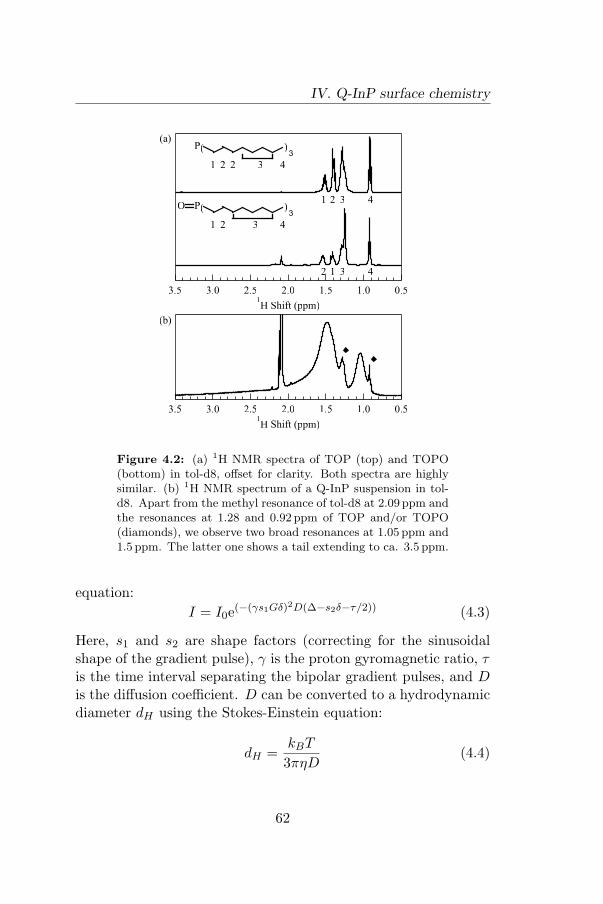
IV. Q-InP surface chemistry
3.5 3.0 2.5 2.0 1.5 1.0 0.51H Shift (ppm)
3.5 3.0 2.5 2.0 1.5 1.0 0.51H Shift (ppm)
(b)
2 3 4
(
1
)3
P
2 2 3 4
(
1
)3
P
O
12 3 4
21 3 4
(a)
Figure 4.2: (a) 1H NMR spectra of TOP (top) and TOPO(bottom) in tol-d8, offset for clarity. Both spectra are highlysimilar. (b) 1H NMR spectrum of a Q-InP suspension in tol-d8. Apart from the methyl resonance of tol-d8 at 2.09 ppm andthe resonances at 1.28 and 0.92 ppm of TOP and/or TOPO(diamonds), we observe two broad resonances at 1.05 ppm and1.5 ppm. The latter one shows a tail extending to ca. 3.5 ppm.
equation:I = I0e(−(γs1Gδ)2D(∆−s2δ−τ/2)) (4.3)
Here, s1 and s2 are shape factors (correcting for the sinusoidalshape of the gradient pulse), γ is the proton gyromagnetic ratio, τis the time interval separating the bipolar gradient pulses, and Dis the diffusion coefficient. D can be converted to a hydrodynamicdiameter dH using the Stokes-Einstein equation:
dH =kBT
3πηD(4.4)
62
4.2. Identification of the Q-InP ligands
4.2.2 Diffusion NMR
Q-InP NMR samples are prepared by drying a nanocrystal suspen-sion of known concentration, followed by resuspension in 750 µLof deuterated toluene (tol-d8). As Q-InP are synthesized in a co-ordinating mixture of TOP and TOPO, these molecules are thelikely candidates to serve as capping agents. Figure 4.2(a) showsthe 1H NMR spectra of TOP and TOPO, dissolved in tol-d8, withthe resonances assigned to their respective protons. The spectrumof a typical Q-InP suspension is shown in figure 4.2(b). The sharpresonances at 1.28 and 0.92 ppm can be attributed to TOP and/orTOPO. As they are undistinguishable in the 1H NMR spectra ofQ-InP, from here on we will refer to these resonances as TOPOresonances, keeping in mind that in fact it might also be TOP.At 2.09 ppm, the methyl resonance of residual protons in tol-d8appears (tol-d8 is 99.96% deuterated). Apart from the sharp sig-nals, two broad resonances at 1.05 and 1.5 ppm can be observed,the latter one having a tail which extends to ca. 3.5 ppm.
Diffusion-weighted spectra of a Q-InP suspension are shown infigure 4.3(a). A sample with a slightly higher excess of free TOPOis chosen to demonstrate the effect of the gradient strength. Thesharp TOPO resonances quickly vanish, being undetectable froma gradient strength of 43% on. The broad resonances howeverare still clearly observable up to G =71%. These measurementsalready indicate that the broad resonances arise from a specieswith a small diffusion coefficient, i.e. the nanocrystal ligands.
An unambiguous confirmation that the broad resonances areattributable to the nanocrystal ligands follows from a calcula-tion of the diffusion coefficient D using the Stejskal-Tanner equa-tion. When it is calculated for each resonance and plotted as afunction of the chemical shift, the result is called a DOSY spec-trum. Figure 4.3(b) shows a typical DOSY spectrum for Q-InPin toluene, measured using δ =6 ms and ∆ =300 ms. The diffu-sion coefficients for all species are determined by fitting the sig-nal decay to the Stejskal-Tanner equation (figure 4.3(c)). Threedifferent diffusion regimes can be discerned. Tol-d8 shows a diffu-sion coefficient of 2.25 10−9 m2/s and for the TOPO resonances
63

IV. Q-InP surface chemistry
2.0 1.8 1.6 1.4 1.2 1.0 0.81H Shift (ppm)
7 6 5 4 3 2 11H Shift (ppm)
10-10
2
4
10-9
2
4
D (
m2/s
)
(b)
(1)
(2)
(3)
-3
-2
-1
0
log
I /
I0
2520151050
(s1G d)2(D - s2d -t/2) (10
9 s/m
2)
(c)
3.5 3.0 2.5 2.0 1.5 1.01H Shift (ppm)
(d)
02% 14% 20% 25% 33% 43% 56% 71%
(a)
Figure 4.3: (a) Series of diffusion filtered spectra for a Q-InPsuspension. The sharp resonances quickly vanish, while thebroad ones remain observable up to G = 71%. (b) DOSY spec-trum of a Q-InP suspension. Three diffusion regimes can bediscerned (dotted lines), attributable to tol-d8 (1), free TOPO(2) and the Q-InP ligands (3). (c) Signal decay at 1.4 ppm(dashed line in (b)), with a bi-expontial fit to the data. (d)In the diffusion filtered spectrum (G = 71%), the resonancesaround 2.5–3.5 ppm are not observed.
we find D =8.37 10−10 m2/s, equal to the result of a measure-ment of pure TOPO in tol-d8. The broad resonances finally yieldD = 1.39 10−10 m2/s.
Careful inspection of the DOSY spectrum shows that the reso-nances around 2.5–3.5 ppm are not observed (figure 4.3(d)). Thisis not only due to the smaller 1H signal strength. Spin-spin, or T2
relaxation and spin-lattice, or T1 relaxation in fact both limit the
64
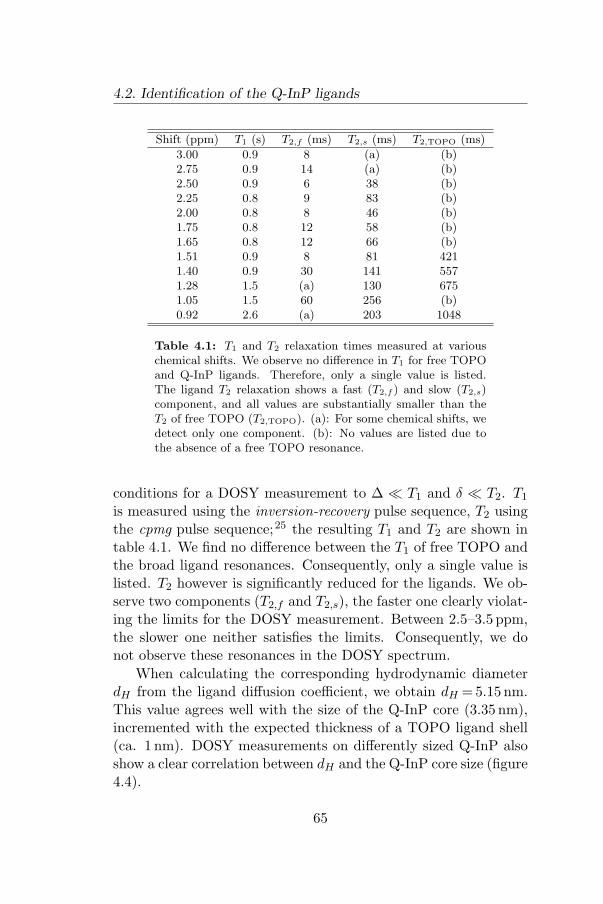
4.2. Identification of the Q-InP ligands
Shift (ppm) T1 (s) T2,f (ms) T2,s (ms) T2,TOPO (ms)
3.00 0.9 8 (a) (b)2.75 0.9 14 (a) (b)2.50 0.9 6 38 (b)2.25 0.8 9 83 (b)2.00 0.8 8 46 (b)1.75 0.8 12 58 (b)1.65 0.8 12 66 (b)1.51 0.9 8 81 4211.40 0.9 30 141 5571.28 1.5 (a) 130 6751.05 1.5 60 256 (b)0.92 2.6 (a) 203 1048
Table 4.1: T1 and T2 relaxation times measured at variouschemical shifts. We observe no difference in T1 for free TOPOand Q-InP ligands. Therefore, only a single value is listed.The ligand T2 relaxation shows a fast (T2,f ) and slow (T2,s)component, and all values are substantially smaller than theT2 of free TOPO (T2,TOPO). (a): For some chemical shifts, wedetect only one component. (b): No values are listed due tothe absence of a free TOPO resonance.
conditions for a DOSY measurement to ∆ � T1 and δ � T2. T1
is measured using the inversion-recovery pulse sequence, T2 usingthe cpmg pulse sequence;25 the resulting T1 and T2 are shown intable 4.1. We find no difference between the T1 of free TOPO andthe broad ligand resonances. Consequently, only a single value islisted. T2 however is significantly reduced for the ligands. We ob-serve two components (T2,f and T2,s), the faster one clearly violat-ing the limits for the DOSY measurement. Between 2.5–3.5 ppm,the slower one neither satisfies the limits. Consequently, we donot observe these resonances in the DOSY spectrum.
When calculating the corresponding hydrodynamic diameterdH from the ligand diffusion coefficient, we obtain dH =5.15 nm.This value agrees well with the size of the Q-InP core (3.35 nm),incremented with the expected thickness of a TOPO ligand shell(ca. 1 nm). DOSY measurements on differently sized Q-InP alsoshow a clear correlation between dH and the Q-InP core size (figure4.4).
65
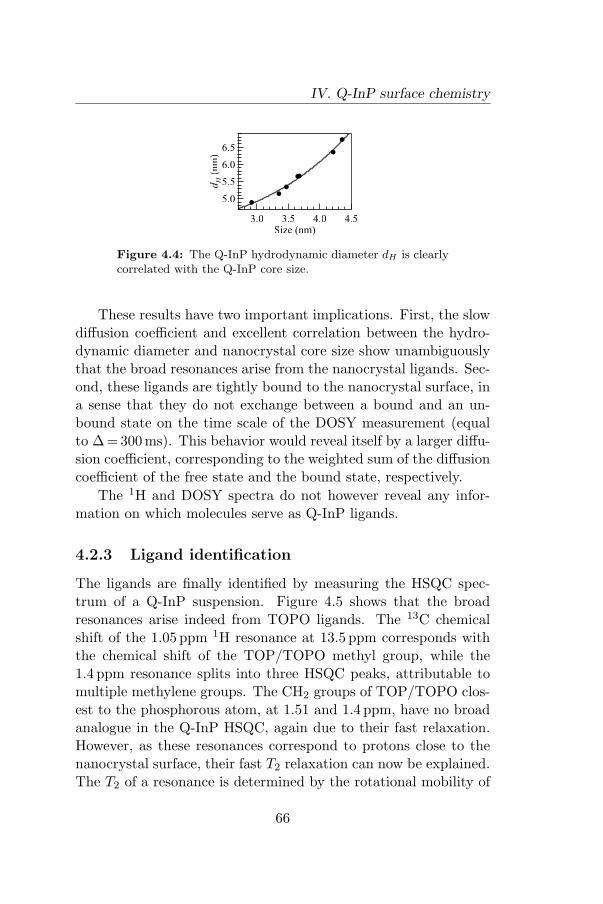
IV. Q-InP surface chemistry
6.5
6.0
5.5
5.0
dH
(n
m)
4.54.03.53.0Size (nm)
Figure 4.4: The Q-InP hydrodynamic diameter dH is clearlycorrelated with the Q-InP core size.
These results have two important implications. First, the slowdiffusion coefficient and excellent correlation between the hydro-dynamic diameter and nanocrystal core size show unambiguouslythat the broad resonances arise from the nanocrystal ligands. Sec-ond, these ligands are tightly bound to the nanocrystal surface, ina sense that they do not exchange between a bound and an un-bound state on the time scale of the DOSY measurement (equalto ∆ =300 ms). This behavior would reveal itself by a larger diffu-sion coefficient, corresponding to the weighted sum of the diffusioncoefficient of the free state and the bound state, respectively.
The 1H and DOSY spectra do not however reveal any infor-mation on which molecules serve as Q-InP ligands.
4.2.3 Ligand identification
The ligands are finally identified by measuring the HSQC spec-trum of a Q-InP suspension. Figure 4.5 shows that the broadresonances arise indeed from TOPO ligands. The 13C chemicalshift of the 1.05 ppm 1H resonance at 13.5 ppm corresponds withthe chemical shift of the TOP/TOPO methyl group, while the1.4 ppm resonance splits into three HSQC peaks, attributable tomultiple methylene groups. The CH2 groups of TOP/TOPO clos-est to the phosphorous atom, at 1.51 and 1.4 ppm, have no broadanalogue in the Q-InP HSQC, again due to their fast relaxation.However, as these resonances correspond to protons close to thenanocrystal surface, their fast T2 relaxation can now be explained.The T2 of a resonance is determined by the rotational mobility of
66
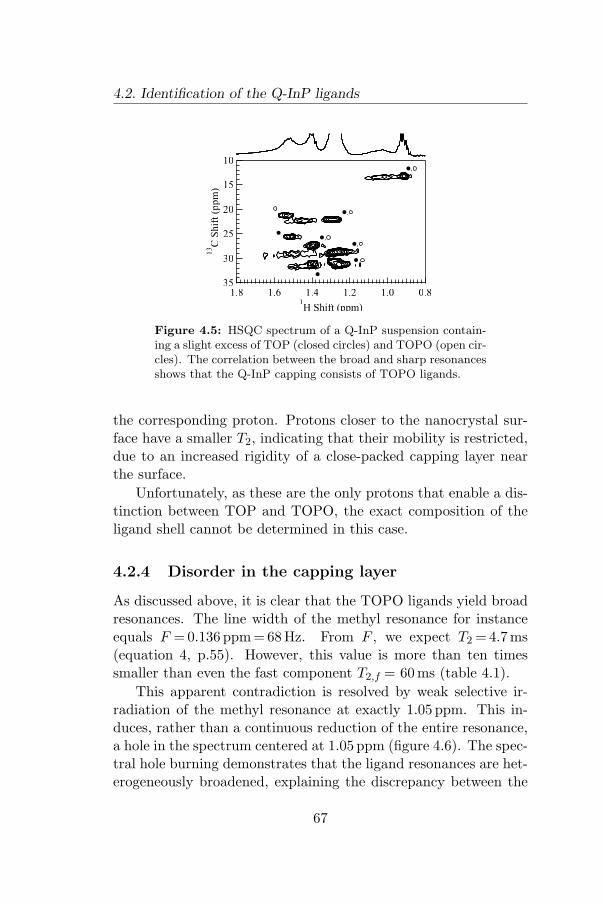
4.2. Identification of the Q-InP ligands
1.8 1.6 1.4 1.2 1.0 0.81H Shift (ppm)
35
30
25
20
15
10
13C
Shif
t (p
pm
)
,
,
,
,
,
Figure 4.5: HSQC spectrum of a Q-InP suspension contain-ing a slight excess of TOP (closed circles) and TOPO (open cir-cles). The correlation between the broad and sharp resonancesshows that the Q-InP capping consists of TOPO ligands.
the corresponding proton. Protons closer to the nanocrystal sur-face have a smaller T2, indicating that their mobility is restricted,due to an increased rigidity of a close-packed capping layer nearthe surface.
Unfortunately, as these are the only protons that enable a dis-tinction between TOP and TOPO, the exact composition of theligand shell cannot be determined in this case.
4.2.4 Disorder in the capping layer
As discussed above, it is clear that the TOPO ligands yield broadresonances. The line width of the methyl resonance for instanceequals F =0.136 ppm = 68Hz. From F , we expect T2 =4.7 ms(equation 4, p.55). However, this value is more than ten timessmaller than even the fast component T2,f = 60 ms (table 4.1).
This apparent contradiction is resolved by weak selective ir-radiation of the methyl resonance at exactly 1.05 ppm. This in-duces, rather than a continuous reduction of the entire resonance,a hole in the spectrum centered at 1.05 ppm (figure 4.6). The spec-tral hole burning demonstrates that the ligand resonances are het-erogeneously broadened, explaining the discrepancy between the
67
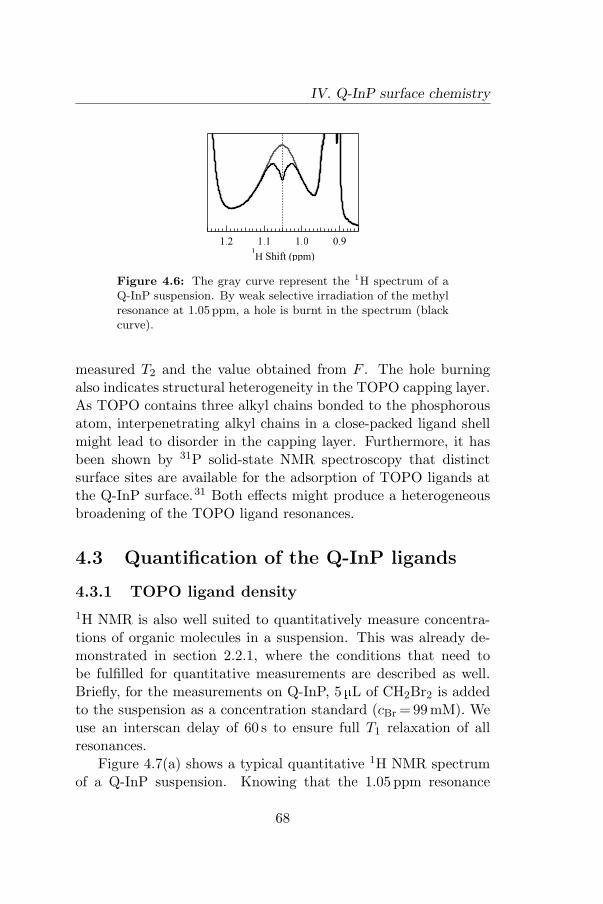
IV. Q-InP surface chemistry
1.2 1.1 1.0 0.91H Shift (ppm)
Figure 4.6: The gray curve represent the 1H spectrum of aQ-InP suspension. By weak selective irradiation of the methylresonance at 1.05 ppm, a hole is burnt in the spectrum (blackcurve).
measured T2 and the value obtained from F . The hole burningalso indicates structural heterogeneity in the TOPO capping layer.As TOPO contains three alkyl chains bonded to the phosphorousatom, interpenetrating alkyl chains in a close-packed ligand shellmight lead to disorder in the capping layer. Furthermore, it hasbeen shown by 31P solid-state NMR spectroscopy that distinctsurface sites are available for the adsorption of TOPO ligands atthe Q-InP surface.31 Both effects might produce a heterogeneousbroadening of the TOPO ligand resonances.
4.3 Quantification of the Q-InP ligands
4.3.1 TOPO ligand density
1H NMR is also well suited to quantitatively measure concentra-tions of organic molecules in a suspension. This was already de-monstrated in section 2.2.1, where the conditions that need tobe fulfilled for quantitative measurements are described as well.Briefly, for the measurements on Q-InP, 5 µL of CH2Br2 is addedto the suspension as a concentration standard (cBr = 99mM). Weuse an interscan delay of 60 s to ensure full T1 relaxation of allresonances.
Figure 4.7(a) shows a typical quantitative 1H NMR spectrumof a Q-InP suspension. Knowing that the 1.05 ppm resonance
68
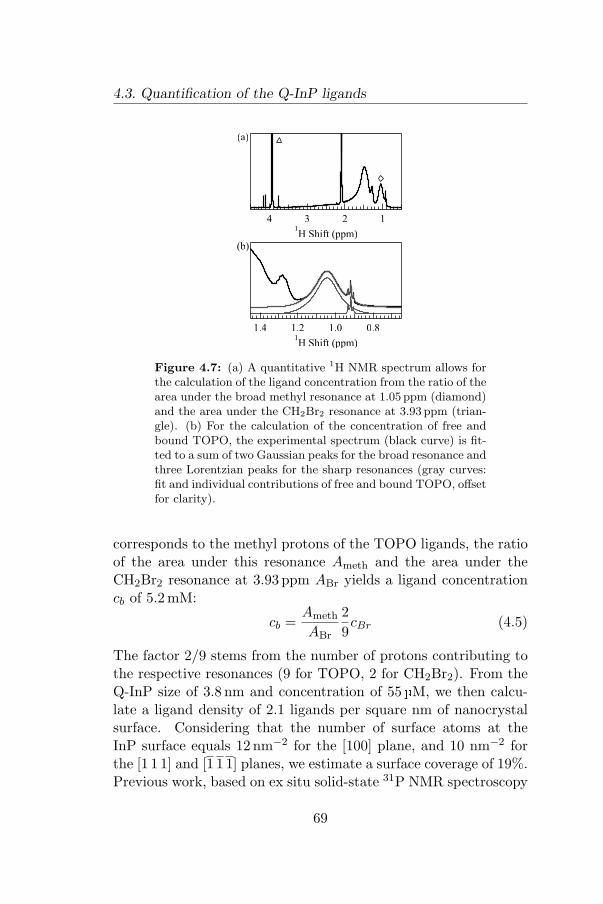
4.3. Quantification of the Q-InP ligands
d
1.4 1.2 1.0 0.81H Shift (ppm)
d
4 3 2 11H Shift (ppm)
(a)
(b)
Figure 4.7: (a) A quantitative 1H NMR spectrum allows forthe calculation of the ligand concentration from the ratio of thearea under the broad methyl resonance at 1.05 ppm (diamond)and the area under the CH2Br2 resonance at 3.93 ppm (trian-gle). (b) For the calculation of the concentration of free andbound TOPO, the experimental spectrum (black curve) is fit-ted to a sum of two Gaussian peaks for the broad resonance andthree Lorentzian peaks for the sharp resonances (gray curves:fit and individual contributions of free and bound TOPO, offsetfor clarity).
corresponds to the methyl protons of the TOPO ligands, the ratioof the area under this resonance Ameth and the area under theCH2Br2 resonance at 3.93 ppm ABr yields a ligand concentrationcb of 5.2mM:
cb =Ameth
ABr
29cBr (4.5)
The factor 2/9 stems from the number of protons contributing tothe respective resonances (9 for TOPO, 2 for CH2Br2). From theQ-InP size of 3.8 nm and concentration of 55 µM, we then calcu-late a ligand density of 2.1 ligands per square nm of nanocrystalsurface. Considering that the number of surface atoms at theInP surface equals 12 nm−2 for the [100] plane, and 10 nm−2 forthe [1 1 1] and [1 1 1] planes, we estimate a surface coverage of 19%.Previous work, based on ex situ solid-state 31P NMR spectroscopy
69
IV. Q-InP surface chemistry
on a vacuum-dried Q-InP powder, reported a comparable surfacecoverage of about 20%.31
4.3.2 Adsorption/desorption equilibrium
The small amount of unbound TOPO still present in the NMRsample suggests that the ligands partake in an adsorption/desorp-tion equilibrium between free and bound species. This is furtherinvestigated using quantitative NMR, by preparing a series of di-lutions of the Q-InP suspension. Samples are prepared 24 hoursprior to measurements. The concentrations of free (cf ) and bound(cb) TOPO are calculated from the area under their respectivemethyl resonances (figure 4.7(b)). For the two most dilute sam-ples, the free TOPO resonance could not be integrated reliably;these data points are shown in figures 4.8(a) and 4.8(b), but areomitted from the analysis.
The concentrations cf and cb, and the dilution ∆ are not in-dependent (note: ∆ =0.1 means a ten times diluted sample). Foreach measurement i, an experimental dilution ∆i can be definedby
∆i =cf,i + cb,i
cf,0 + cb,0(4.6)
As experimental errors lead to deviations between ∆i and the cal-culated dilution ∆i, the data have to be made self-consistent priorto fitting. Since the samples are diluted with high accuracy, wechoose to correct the concentrations obtained from the NMR mea-surements. For each sample, a reference dilution ∆i,fit is obtainedby fitting a line with unity slope to a plot of ∆i versus ∆i. Aself-consistent data set is then obtained by multiplying the con-centrations cf,i and cb,i by the ratio ∆i,fit/∆i. In figure 4.8, theself-consistent data are shown. Typical corrections are 5% or less,except for the two measurements at highest dilution.
Since free TOPO and the nanocrystals are diluted together,one would expect a proportional decrease of both concentrationsin absence of an equilibrium between free and bound TOPO. Inpractice, we see that this is only true for the highest concentrations
70
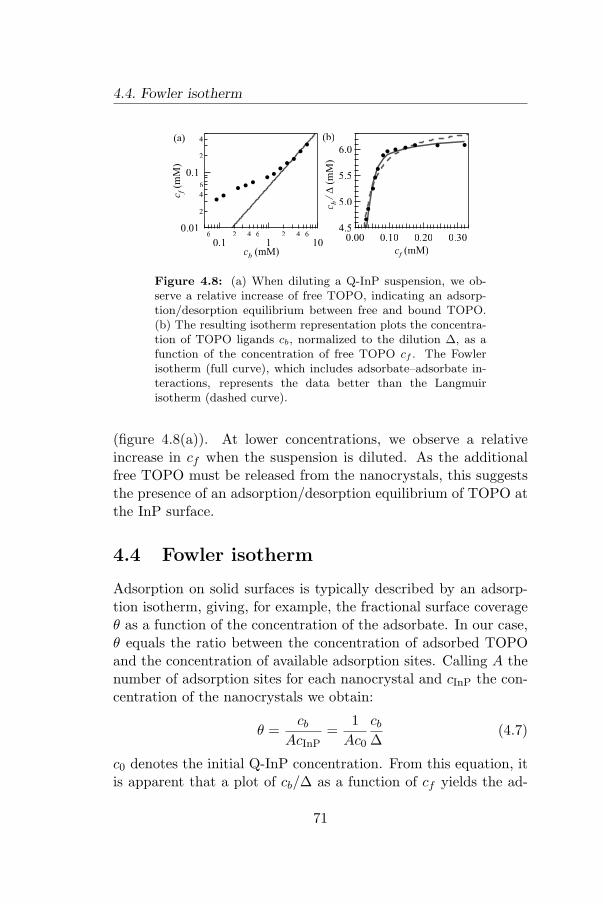
4.4. Fowler isotherm
6.0
5.5
5.0
4.5
c b / D
(m
M)
0.300.200.100.00
cf (mM)
0.01
2
4
6
0.1
2
4
c f (m
M)
6
0.12 4 6
12 4 6
10cb (mM)
(a) (b)
Figure 4.8: (a) When diluting a Q-InP suspension, we ob-serve a relative increase of free TOPO, indicating an adsorp-tion/desorption equilibrium between free and bound TOPO.(b) The resulting isotherm representation plots the concentra-tion of TOPO ligands cb, normalized to the dilution ∆, as afunction of the concentration of free TOPO cf . The Fowlerisotherm (full curve), which includes adsorbate–adsorbate in-teractions, represents the data better than the Langmuirisotherm (dashed curve).
(figure 4.8(a)). At lower concentrations, we observe a relativeincrease in cf when the suspension is diluted. As the additionalfree TOPO must be released from the nanocrystals, this suggeststhe presence of an adsorption/desorption equilibrium of TOPO atthe InP surface.
4.4 Fowler isotherm
Adsorption on solid surfaces is typically described by an adsorp-tion isotherm, giving, for example, the fractional surface coverageθ as a function of the concentration of the adsorbate. In our case,θ equals the ratio between the concentration of adsorbed TOPOand the concentration of available adsorption sites. Calling A thenumber of adsorption sites for each nanocrystal and cInP the con-centration of the nanocrystals we obtain:
θ =cb
AcInP=
1Ac0
cb
∆(4.7)
c0 denotes the initial Q-InP concentration. From this equation, itis apparent that a plot of cb/∆ as a function of cf yields the ad-
71
IV. Q-InP surface chemistry
sorption isotherm, except a scaling factor. Figure 4.8(b) shows thisisotherm representation. It clearly demonstrates that the surfacecoverage of the nanocrystals drops when the concentration of freeTOPO is reduced, confirming the idea of an adsorption/desorptionequilibrium.
Having the experimental adsorption isotherm, the possibilityexists of obtaining more insight into the adsorption/desorptionprocess from a thermodynamic and molecular point of view, bycomparing it with model isotherms based on a particular viewon the adsorption reaction and the structure of the adsorbedlayer. The most simple representation of adsorption/desorptionof TOPO at the InP surface is that of a free TOPO moleculeattaching to a free adsorption site (InP•) to yield an adsorbedTOPO ligand:
TOPO + InP• TOPO− InP (4.8)
Denoting the activity of the adsorbed molecules as ab and that ofthe free adsorption sites a•, thermodynamic equilibrium will bereached when:
K =ab
cfa•(4.9)
Here, K denotes the equilibrium constant of the adsorption reac-tion. When the activities ab and a• are identified with the respec-tive fractional surface coverages θ and 1-θ, Equation 4.9 reducesto the well-known Langmuir isotherm:
θ =Kcf
1 + Kcf(4.10)
In figure 4.8(b), the best fit of our data to a Langmuir isothermis represented (dashed curve), omitting, as discussed above, thetwo measurements with the lowest free TOPO concentration. Ta-ble 4.2 summarizes the fitted Langmuir isotherm parameters. Al-though the general trend of the experimental isotherm is repro-duced by the Langmuir model, significant deviations exist. Com-pared to Langmuir adsorption, the plateau of full coverage per-sists longer with decreasing cf and once desorption starts, the
72
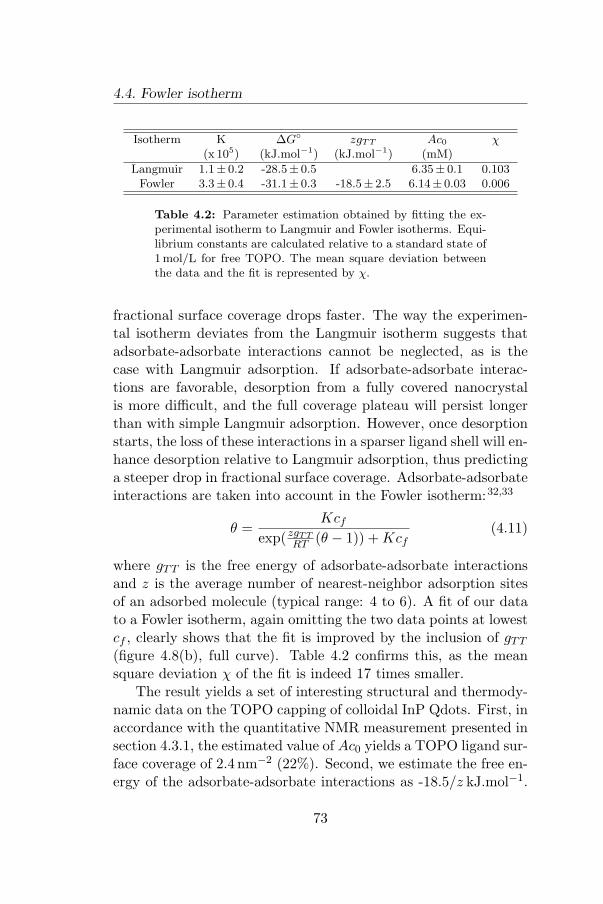
4.4. Fowler isotherm
Isotherm K ∆G◦ zgTT Ac0 χ(x 105) (kJ.mol−1) (kJ.mol−1) (mM)
Langmuir 1.1± 0.2 -28.5± 0.5 6.35± 0.1 0.103Fowler 3.3± 0.4 -31.1± 0.3 -18.5± 2.5 6.14± 0.03 0.006
Table 4.2: Parameter estimation obtained by fitting the ex-perimental isotherm to Langmuir and Fowler isotherms. Equi-librium constants are calculated relative to a standard state of1mol/L for free TOPO. The mean square deviation betweenthe data and the fit is represented by χ.
fractional surface coverage drops faster. The way the experimen-tal isotherm deviates from the Langmuir isotherm suggests thatadsorbate-adsorbate interactions cannot be neglected, as is thecase with Langmuir adsorption. If adsorbate-adsorbate interac-tions are favorable, desorption from a fully covered nanocrystalis more difficult, and the full coverage plateau will persist longerthan with simple Langmuir adsorption. However, once desorptionstarts, the loss of these interactions in a sparser ligand shell will en-hance desorption relative to Langmuir adsorption, thus predictinga steeper drop in fractional surface coverage. Adsorbate-adsorbateinteractions are taken into account in the Fowler isotherm:32,33
θ =Kcf
exp( zgTTRT (θ − 1)) + Kcf
(4.11)
where gTT is the free energy of adsorbate-adsorbate interactionsand z is the average number of nearest-neighbor adsorption sitesof an adsorbed molecule (typical range: 4 to 6). A fit of our datato a Fowler isotherm, again omitting the two data points at lowestcf , clearly shows that the fit is improved by the inclusion of gTT
(figure 4.8(b), full curve). Table 4.2 confirms this, as the meansquare deviation χ of the fit is indeed 17 times smaller.
The result yields a set of interesting structural and thermody-namic data on the TOPO capping of colloidal InP Qdots. First, inaccordance with the quantitative NMR measurement presented insection 4.3.1, the estimated value of Ac0 yields a TOPO ligand sur-face coverage of 2.4 nm−2 (22%). Second, we estimate the free en-ergy of the adsorbate-adsorbate interactions as -18.5/z kJ.mol−1.
73
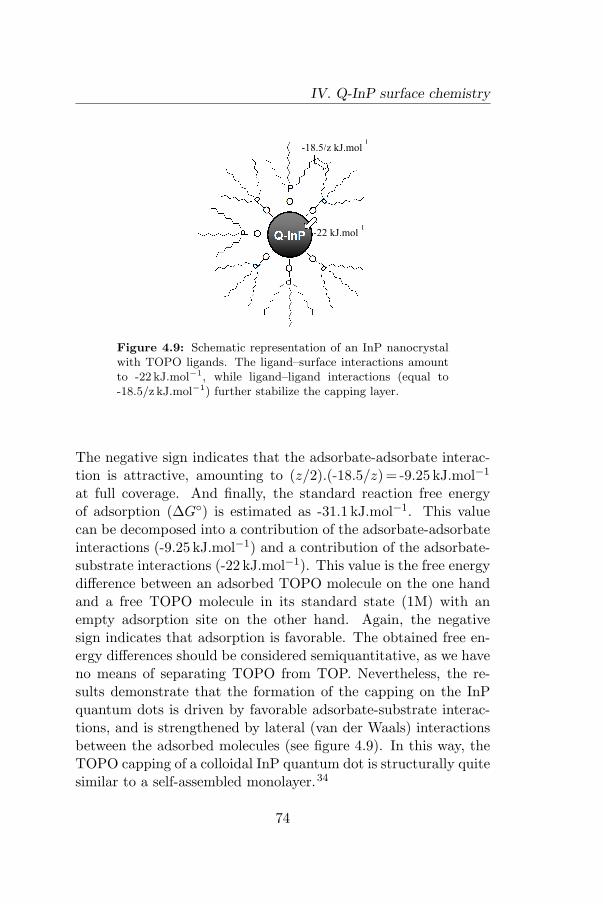
IV. Q-InP surface chemistry
-18.5/z kJ.mol-1
-22 kJ.mol-1
Figure 4.9: Schematic representation of an InP nanocrystalwith TOPO ligands. The ligand–surface interactions amountto -22 kJ.mol−1, while ligand–ligand interactions (equal to-18.5/z kJ.mol−1) further stabilize the capping layer.
The negative sign indicates that the adsorbate-adsorbate interac-tion is attractive, amounting to (z/2).(-18.5/z) = -9.25 kJ.mol−1
at full coverage. And finally, the standard reaction free energyof adsorption (∆G◦) is estimated as -31.1 kJ.mol−1. This valuecan be decomposed into a contribution of the adsorbate-adsorbateinteractions (-9.25 kJ.mol−1) and a contribution of the adsorbate-substrate interactions (-22 kJ.mol−1). This value is the free energydifference between an adsorbed TOPO molecule on the one handand a free TOPO molecule in its standard state (1M) with anempty adsorption site on the other hand. Again, the negativesign indicates that adsorption is favorable. The obtained free en-ergy differences should be considered semiquantitative, as we haveno means of separating TOPO from TOP. Nevertheless, the re-sults demonstrate that the formation of the capping on the InPquantum dots is driven by favorable adsorbate-substrate interac-tions, and is strengthened by lateral (van der Waals) interactionsbetween the adsorbed molecules (see figure 4.9). In this way, theTOPO capping of a colloidal InP quantum dot is structurally quitesimilar to a self-assembled monolayer.34
74
4.5. Conclusions
4.5 Conclusions
InP nanocrystals are synthesized using the hot injection methodand after size-selective precipitation, the elemental properties aredetermined using methods described in chapters II and III.
The nanocrystal ligands are thoroughly studied with nuclearmagnetic resonance spectroscopy. First, the ligands are distin-guished from free molecules by DOSY. The hydrodynamic diam-eter, calculated from the diffusion coefficient of the broad NMRresonances, is clearly related to the Q-InP core size, from whichwe can conclude that they pertain to tightly bound nanocrystalligands. The ligands are then identified using HSQC, demonstrat-ing that Q-InP are capped with TOPO.
Using quantitative NMR, the ligand density is calculatedand related to the number of surface atoms, leading to a sur-face coverage of ca. 20%. In addition, performing quantitativeNMR on a series of diluted Q-InP suspensions, we observe anadsorption/desorption equilibrium. We fit a Fowler isothermto the experimental data, yielding an adsorption energy of-31.1 kJ.mol−1. In addition, ligand–ligand van der Waals in-teractions, amounting to -9.25 kJ.mol−1, further strengthen theligand shell.
The thermodynamic view on the capping is of interest in dif-ferent ways. Knowledge of the free energy of adsorption is ofimportance for the design of new synthesis schemes, yet here is nogenerally accepted method to determine it.1 In addition, charac-terizing the ligand structure with one or two macroscopic quan-tities could make it possible to study structural changes in thecapping. Such changes have been proposed as the origin of lu-minescence antiquenching,35 but have not been directly demon-strated so far. In a more general context, we provide an exampleof the observation and the analysis of an adsorption/desorptionphenomenon at suspended solid nanoparticles in situ and directlywith 1H NMR spectroscopy. This approach can be of use to otherfields where adsorption of molecules at solid particles is an issue,a typical example being catalysis by soluble nanoparticles.36–38
75

76
Chapter V
Surface chemistry of PbSenanocrystals
5.1 Ligand identification: only OA ligands
5.1.1 1H NMR spectra
In this chapter, we will use the NMR techniques developed in chap-ter IV to unravel the composition of the Q-PbSe capping layer. Inaddition, we will couple the results to the ICP-MS measurementson Q-PbSe, which will allow us to build a complete structuralmodel of the nanocrystals. NMR samples are again prepared bydrying a known amount of Q-PbSe under a strong nitrogen flow,followed by resuspension in 750 µL of tol-d8.
The Murray synthesis is based on the formation of PbSe nano-crystals from TOPSe and PbOA2, in presence of an excess of TOPand OA. This yields TOP and OA as the most likely ligands. Their1H NMR spectrum in tol-d8 is shown in figure 5.1(a). The methyland methylene resonances of TOP all show up in the aliphatic re-gion of the 1H spectrum (1-2 ppm), and there is a strong overlapwith the methyl and methylene resonances of OA. Still, OA can bedistinguished from TOP by the resonances at 5.46 and 12.03 ppm,corresponding to the alkene protons and the carboxylic proton,respectively.
77
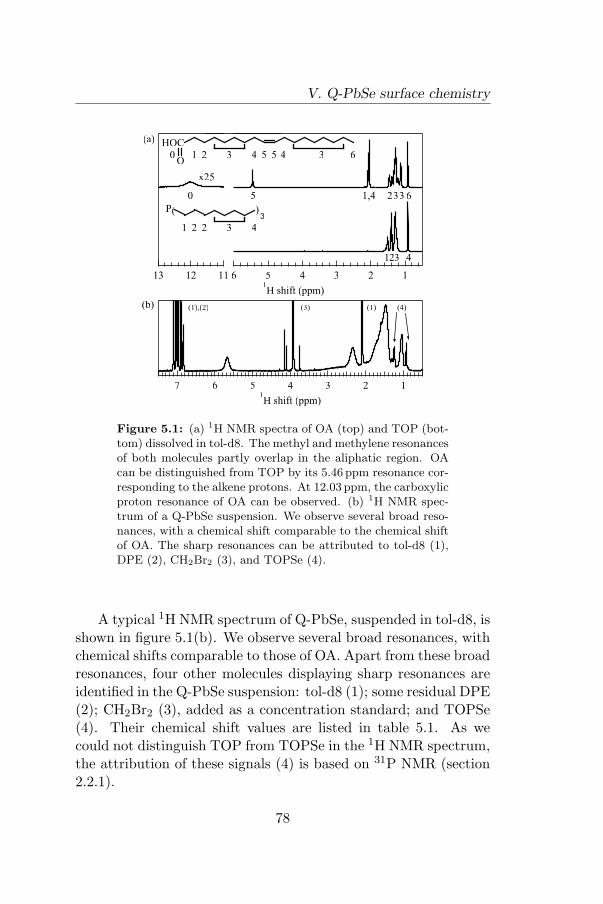
V. Q-PbSe surface chemistry
6 5 4 3 2 11H shift (ppm)
13 12 11
7 6 5 4 3 2 11H shift (ppm)
(b) (1),(2) (3) (4)(1)
61,4
2
33
1 3 4
2
1 2 3 4 50
50
2 2 3 4
(
1
)3
HOC
O
P
5 4 3 6
x25
(a)
Figure 5.1: (a) 1H NMR spectra of OA (top) and TOP (bot-tom) dissolved in tol-d8. The methyl and methylene resonancesof both molecules partly overlap in the aliphatic region. OAcan be distinguished from TOP by its 5.46 ppm resonance cor-responding to the alkene protons. At 12.03 ppm, the carboxylicproton resonance of OA can be observed. (b) 1H NMR spec-trum of a Q-PbSe suspension. We observe several broad reso-nances, with a chemical shift comparable to the chemical shiftof OA. The sharp resonances can be attributed to tol-d8 (1),DPE (2), CH2Br2 (3), and TOPSe (4).
A typical 1H NMR spectrum of Q-PbSe, suspended in tol-d8, isshown in figure 5.1(b). We observe several broad resonances, withchemical shifts comparable to those of OA. Apart from these broadresonances, four other molecules displaying sharp resonances areidentified in the Q-PbSe suspension: tol-d8 (1); some residual DPE(2); CH2Br2 (3), added as a concentration standard; and TOPSe(4). Their chemical shift values are listed in table 5.1. As wecould not distinguish TOP from TOPSe in the 1H NMR spectrum,the attribution of these signals (4) is based on 31P NMR (section2.2.1).
78

5.1. Ligand identification: only OA ligands
7 6 5 4 3 2 11H shift (ppm)
4
10-10
2
4
10-9
2
4
D (
m2/s
)
11
10
9
8
7
dH
(nm
)
7.06.05.04.0Size (nm)
(b)
(a)
Figure 5.2: (a) DOSY spectrum of a Q-PbSe suspension.The species associated with the broad resonances diffuses witha diffusion coefficient of 6.96 10−11 m2/s. (b) Plot of the hydro-dynamic diameter dH of Q-PbSe nanocrystals in tol-d8 versusnanocrystal core size.
5.1.2 Diffusion NMR
The attribution of the broad resonances to surface-bound ligands isagain firmly established using DOSY. When measuring the signalattenuation as a function of G at fixed δ =5 ms and ∆ =200 ms,the diffusion coefficient of all resonances observed in the 1H NMRspectrum of the Q-PbSe suspension is obtained from the Stejskal-
Shift (ppm) D (10−10 m2/s)
tol-d8 6.9-7.1, 2.09 21.3DPE 6.8-7.0 15.2
CH2Br2 3.98 26.1TOPSe 0.9-1.4 7.95broad 5.67, 1.0-2.6 0.696
Table 5.1: Chemical shifts and diffusion coefficients D fortol-d8, DPE, CH2Br2, TOPSe, and the broad resonances.
79
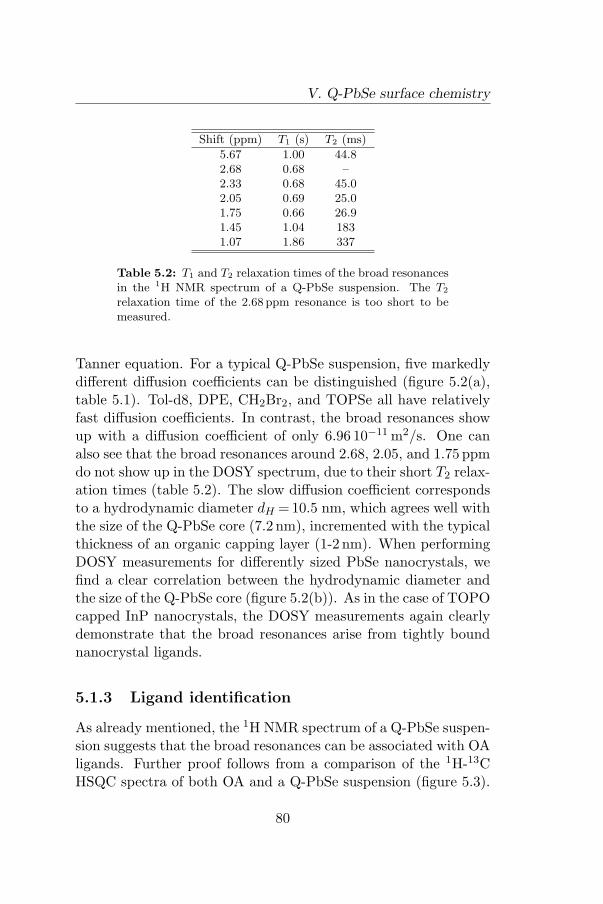
V. Q-PbSe surface chemistry
Shift (ppm) T1 (s) T2 (ms)
5.67 1.00 44.82.68 0.68 –2.33 0.68 45.02.05 0.69 25.01.75 0.66 26.91.45 1.04 1831.07 1.86 337
Table 5.2: T1 and T2 relaxation times of the broad resonancesin the 1H NMR spectrum of a Q-PbSe suspension. The T2
relaxation time of the 2.68 ppm resonance is too short to bemeasured.
Tanner equation. For a typical Q-PbSe suspension, five markedlydifferent diffusion coefficients can be distinguished (figure 5.2(a),table 5.1). Tol-d8, DPE, CH2Br2, and TOPSe all have relativelyfast diffusion coefficients. In contrast, the broad resonances showup with a diffusion coefficient of only 6.96 10−11 m2/s. One canalso see that the broad resonances around 2.68, 2.05, and 1.75 ppmdo not show up in the DOSY spectrum, due to their short T2 relax-ation times (table 5.2). The slow diffusion coefficient correspondsto a hydrodynamic diameter dH =10.5 nm, which agrees well withthe size of the Q-PbSe core (7.2 nm), incremented with the typicalthickness of an organic capping layer (1-2 nm). When performingDOSY measurements for differently sized PbSe nanocrystals, wefind a clear correlation between the hydrodynamic diameter andthe size of the Q-PbSe core (figure 5.2(b)). As in the case of TOPOcapped InP nanocrystals, the DOSY measurements again clearlydemonstrate that the broad resonances arise from tightly boundnanocrystal ligands.
5.1.3 Ligand identification
As already mentioned, the 1H NMR spectrum of a Q-PbSe suspen-sion suggests that the broad resonances can be associated with OAligands. Further proof follows from a comparison of the 1H-13CHSQC spectra of both OA and a Q-PbSe suspension (figure 5.3).
80
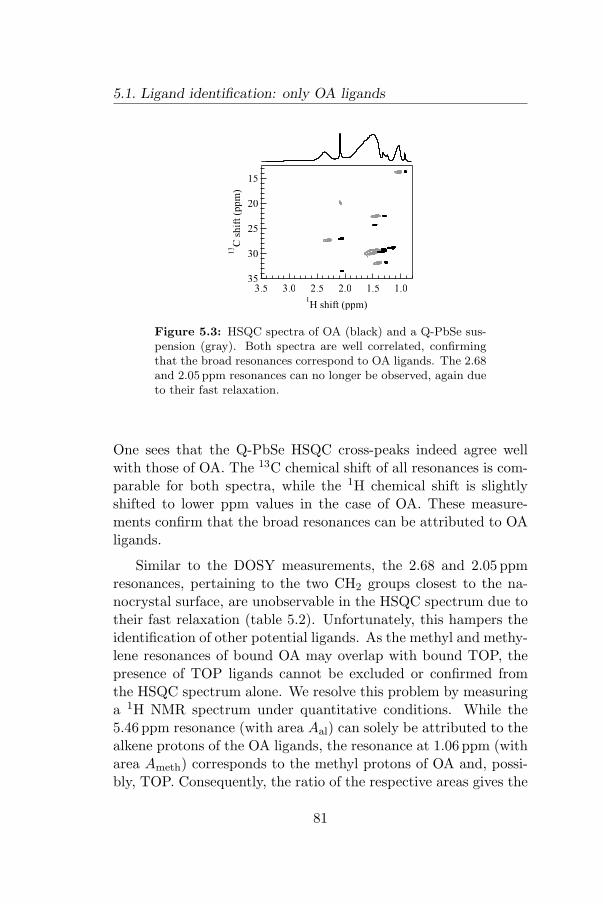
5.1. Ligand identification: only OA ligands
3.5 3.0 2.5 2.0 1.5 1.01H shift (ppm)
35
30
25
20
15
13C
shif
t (p
pm
)
Figure 5.3: HSQC spectra of OA (black) and a Q-PbSe sus-pension (gray). Both spectra are well correlated, confirmingthat the broad resonances correspond to OA ligands. The 2.68and 2.05 ppm resonances can no longer be observed, again dueto their fast relaxation.
One sees that the Q-PbSe HSQC cross-peaks indeed agree wellwith those of OA. The 13C chemical shift of all resonances is com-parable for both spectra, while the 1H chemical shift is slightlyshifted to lower ppm values in the case of OA. These measure-ments confirm that the broad resonances can be attributed to OAligands.
Similar to the DOSY measurements, the 2.68 and 2.05 ppmresonances, pertaining to the two CH2 groups closest to the na-nocrystal surface, are unobservable in the HSQC spectrum due totheir fast relaxation (table 5.2). Unfortunately, this hampers theidentification of other potential ligands. As the methyl and methy-lene resonances of bound OA may overlap with bound TOP, thepresence of TOP ligands cannot be excluded or confirmed fromthe HSQC spectrum alone. We resolve this problem by measuringa 1H NMR spectrum under quantitative conditions. While the5.46 ppm resonance (with area Aal) can solely be attributed to thealkene protons of the OA ligands, the resonance at 1.06 ppm (witharea Ameth) corresponds to the methyl protons of OA and, possi-bly, TOP. Consequently, the ratio of the respective areas gives the
81

V. Q-PbSe surface chemistry
0.05
0.04
0.03
0.02
0.01
0.00
TO
P:O
A r
atio
7.06.05.04.0Size (nm)
0.001
0.01
0.1
Ab
sorb
ance
2400200016001200800Wavelength (nm)
(b)(a)
Figure 5.4: (a) The TOP:OA ligand ratio does not exceed0.05 for all samples studied. (b) Normalized absorbance spec-tra of syntheses performed with an OAe:Pb ratio of 0.65 (fullline), 1.5 (dashed line), and 2.4:1 (dotted line). Decreasing theOAe:Pb ratio leads to larger nanocrystals.
TOP:OA ligand ratio:
TOP : OA =2Ameth/Aal − 3
9(5.1)
Figure 5.4(a) shows the TOP:OA ratio for differently sized Q-PbSe. As it does not exceed 0.05, we can conclude that the cappingof colloidal PbSe nanocrystals, produced by the Murray synthesis,consists almost exclusively of OA ligands.
5.1.4 Influence of OA on the Q-PbSe synthesis
Knowing that OA acts as the principle ligand, we hypothesizethat it may be essential in terminating the nanocrystal growthduring synthesis. We verify this by growing Q-PbSe using dif-ferent amounts of excess oleic acid (OAe) (with respect to thePb precursor). With a 4 min reaction time, and OAe:Pb ratiosof 0.65, 1.5, and 2.4:1, we observe a strong red shift of the Q-PbSe band gap transition with decreasing OAe:Pb ratio (figure5.4(b)). This result shows that the particle size is very sensitiveto the OAe:Pb ratio. At high ratios, fast termination of the growthkeeps the particles small, whereas relatively slow termination leadsto large particles at low OAe:Pb ratios. Figure 5.4(b) shows thatby decreasing the OAe:Pb ratio to 0.65:1, 9.5 nm Q-PbSe can besynthesized. Consequently, this approach allows for the one-step
82
5.2. Ligand Quantification
synthesis of large (>10 nm) Q-PbSe, avoiding the need to addextra precursors during synthesis (section 2.3.2).
5.2 Ligand Quantification
5.2.1 Ligand density
When adding 2 µL of CH2Br2 to a Q-PbSe suspension as a con-centration standard (CBr =38 mM), the number of OA ligands inthe suspension can be quantified. From the ratio of the area underthe CH2Br2 resonance at 3.98 ppm and the area under the alkeneresonance at 5.46 ppm, the OA ligand concentration in five NMRsamples is determined. Knowing the Q-PbSe concentration, thenumber of OA ligands per nanocrystal is calculated. After divid-ing this by the nanocrystal surface area, we find a size-independentgrafting density of 4.2± 0.6 OA ligands per square nanometer ofQ-PbSe surface.
5.2.2 Q-PbSe surface composition
In section 2.2, we reported that PbSe nanocrystals are non-stoichiometric. Determination of the Pb:Se ratio of the nanocrys-tals with ICP-MS yielded a Pb excess for all samples studied. Inthis section we take a closer look at these experimental results.
A plot of the Pb:Se ratio as a function of Q-PbSe size d showsthat it scales with the inverse of d (figure 5.5(a), triangles). Thispoints toward a Pb surface excess. To explain the trend, we builda structural model of our Q-PbSe (figure 5.5(b)). Starting from acentral Pb or Se atom, we add subsequent shells of atoms until adesired size is reached. This yields faceted spherical particles, inaccordance with the experimental TEM observations (left model).The Pb:Se ratio however is scattered around one for this model,as expected (figure 5.5(a), dots and dotted line). Next, a Pb ter-minated surface is created by adding Pb atoms to each surface Se,until all Se have six Pb neighbors, just as in the bulk (right model).The Pb excess Pbe is then defined as the difference between thenumber of Pb atoms and Se atoms per nanocrystal. For these
83
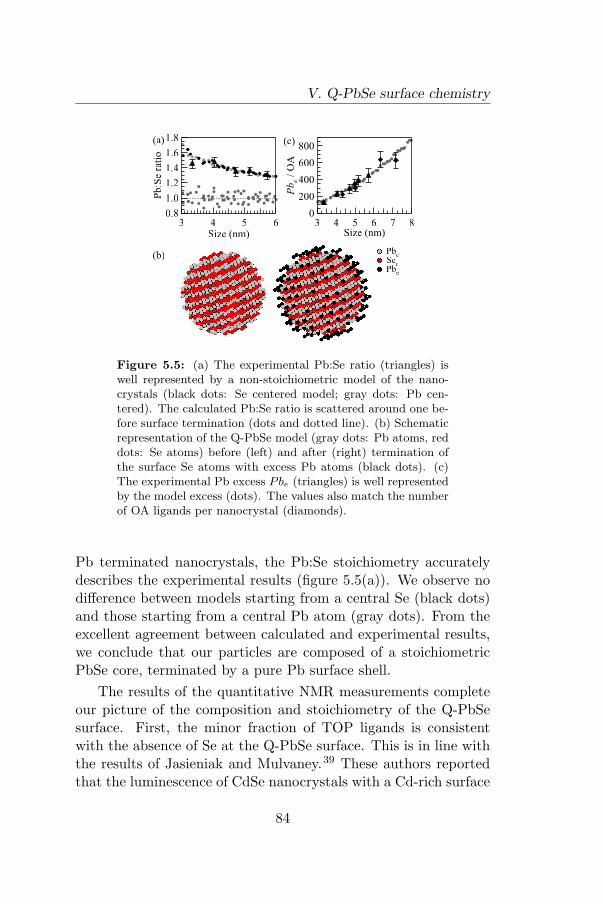
V. Q-PbSe surface chemistry
800
600
400
200
0
Pbe
/ O
A
876543Size (nm)
1.8
1.6
1.4
1.2
1.0
0.8
Pb
:Se
rati
o
6543Size (nm)
(a)
Pbe
Sec
Pbc
(c)
(b)
Figure 5.5: (a) The experimental Pb:Se ratio (triangles) iswell represented by a non-stoichiometric model of the nano-crystals (black dots: Se centered model; gray dots: Pb cen-tered). The calculated Pb:Se ratio is scattered around one be-fore surface termination (dots and dotted line). (b) Schematicrepresentation of the Q-PbSe model (gray dots: Pb atoms, reddots: Se atoms) before (left) and after (right) termination ofthe surface Se atoms with excess Pb atoms (black dots). (c)The experimental Pb excess Pbe (triangles) is well representedby the model excess (dots). The values also match the numberof OA ligands per nanocrystal (diamonds).
Pb terminated nanocrystals, the Pb:Se stoichiometry accuratelydescribes the experimental results (figure 5.5(a)). We observe nodifference between models starting from a central Se (black dots)and those starting from a central Pb atom (gray dots). From theexcellent agreement between calculated and experimental results,we conclude that our particles are composed of a stoichiometricPbSe core, terminated by a pure Pb surface shell.
The results of the quantitative NMR measurements completeour picture of the composition and stoichiometry of the Q-PbSesurface. First, the minor fraction of TOP ligands is consistentwith the absence of Se at the Q-PbSe surface. This is in line withthe results of Jasieniak and Mulvaney.39 These authors reportedthat the luminescence of CdSe nanocrystals with a Cd-rich surface
84
5.2. Ligand Quantification
is not affected by the addition of TOP, from which they concludedthat TOP does not bind to surface Cd atoms (which are the onlyatoms present on the surface). Second, figure 5.5(c) shows analmost exact match between the number of OA ligands per na-nocrystal (diamonds), determined by NMR, and Pbe, determinedby ICP-MS (triangles) and by the nanocrystal model (dots). Onaverage, we find an OA:Pbe ratio of 0.97± 0.06.
This result is quite surprising. It shows that we should notconceive a PbSe nanocrystal as composed of Pb2+, Se2−, and twoOA− ligands per excess lead atom to ensure charge neutrality.Rather, we should see them as made of Pb, Se, and one OA ligandper excess lead atom. This non-stoichiometric Q-PbSe model hasinteresting consequences. For instance, recent experimental resultshave shown that Q-PbSe form linear aggregates in suspension40
and that PbSe nanowires can be grown through oriented attach-ment of PbSe nanocrystals.41 Both results are explained throughthe existence of a permanent dipole moment. However, as ourmodel is centro-symmetric, the origin of the permanent dipolemoment in Q-PbSe is far from obvious, and further research willbe needed to bring both results together. From a theoretical pointof view, the optical properties of colloidal nanocrystals have al-ways been calculated with quasi-stoichiometric models, using ap-propriate ligand potentials or pseudo-hydrogen atoms to passivatesurface states.42,43 We now present a more realistic Q-PbSe modelfor both the nanocrystal core and the ligand shell, which couldimprove the comparison between theoretical calculations and ex-perimental results.
These calculations could also reveal why Q-PbSe are highlyluminescent,3 in spite of the excess of Pb atoms at the surface.Indeed, inspired by our results, Francescetti recently calculatedthe optical properties of unpassivated non-stoichiometric Q-PbSe,showing that they possess a large density of surface states in theband gap, in contrast with unpassivated stoichiometric particles.44
As these states will quench the band edge luminescence, moretheoretical work on the surface passivation is clearly needed toexplain experimental results.
85
V. Q-PbSe surface chemistry
5.3 Oxidation of a Q-PbSe suspension
In section 2.4.3 we have already shown that the Q-PbSe opticalproperties are highly sensitive to oxidation. This is also confirmedby Stouwdam et al.45 To understand the mechanism behind theoxidation process, we use NMR to monitor the evolution of a Q-PbSe suspension, stored under ambient conditions. The suspen-sion is prepared under nitrogen, loaded in an NMR tube with atightly closed screw cap and stored under ambient conditions. Atdifferent time intervals after sample preparation, 1H NMR andDOSY spectra are measured (figure 5.6).
After 1 week, additional resonances start to appear, at aslightly lower chemical shift than the ligand resonances. DOSYshows that these resonances have a diffusion coefficient of1.07 10−10 m2/s, which is 35% larger than the Q-PbSe diffu-sion coefficient (figure 5.6(b)). Over 1 month, these resonancesgradually increase in intensity (figure 5.6(a), top curve), and theassociated diffusion coefficient increases to 2.85 10−10 m2/s (figure5.6(b)). Since Q-PbSe suspensions prepared under ambient condi-tions and loaded in an NMR tube with an ordinary cap show thesame evolution in a matter of days, we conclude that these trendsreflect the oxidation of the Q-PbSe sample, albeit at a slower pacein the case of the screw cap due to the reduced inflow of oxygen.
In figure 5.6(a), we also show the 1H NMR spectrum of purePbOA2 (bottom curve). The major difference with the spectrum ofOA (figure 5.1(a)) is the chemical shift of the protons closest to thecarboxylic head groups, equaling 2.29 ppm instead of 2.05 ppm. Inthe oxidized Q-PbSe spectrum, these protons show a resonance ata chemical shift of 2.32 ppm, a value close to that of PbOA2. Thissuggests that oxidation leads to the loss of ligands and Pb atomsfrom the nanocrystal surface, which could explain the observedsize reduction of oxidized Q-PbSe (section 2.4.3). Quantitatively,about 30% of the ligands are released from the nanocrystal surfaceafter 1 month.
Looking at the DOSY spectrum in more detail, we find thatthe diffusion coefficient of the PbOA2 resonances in the oxidized
86
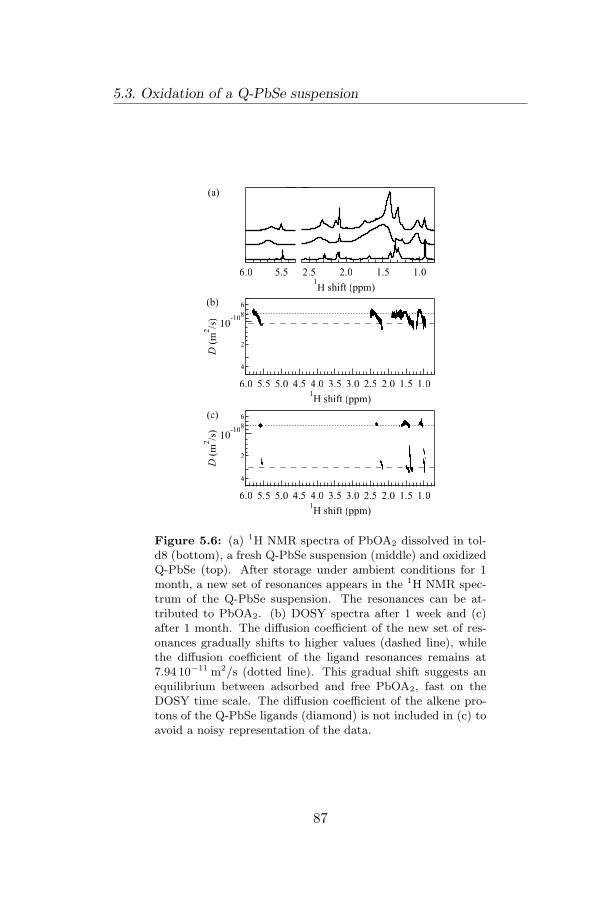
5.3. Oxidation of a Q-PbSe suspension
2.5 2.0 1.5 1.01H shift (ppm)
6.0 5.5
(a)
6.0 5.5 5.0 4.5 4.0 3.5 3.0 2.5 2.0 1.5 1.01H shift (ppm)
6
8
10-10
2
4
D (
m2/s
)
(c)
6.0 5.5 5.0 4.5 4.0 3.5 3.0 2.5 2.0 1.5 1.01H shift (ppm)
6
8
10-10
2
4
D (
m2/s
)
(b)
Figure 5.6: (a) 1H NMR spectra of PbOA2 dissolved in tol-d8 (bottom), a fresh Q-PbSe suspension (middle) and oxidizedQ-PbSe (top). After storage under ambient conditions for 1month, a new set of resonances appears in the 1H NMR spec-trum of the Q-PbSe suspension. The resonances can be at-tributed to PbOA2. (b) DOSY spectra after 1 week and (c)after 1 month. The diffusion coefficient of the new set of res-onances gradually shifts to higher values (dashed line), whilethe diffusion coefficient of the ligand resonances remains at7.94 10−11 m2/s (dotted line). This gradual shift suggests anequilibrium between adsorbed and free PbOA2, fast on theDOSY time scale. The diffusion coefficient of the alkene pro-tons of the Q-PbSe ligands (diamond) is not included in (c) toavoid a noisy representation of the data.
87
V. Q-PbSe surface chemistry
Q-PbSe suspension is smaller than that of a pure PbOA2 solutionin tol-d8 (5.00 10−10 m2/s). Moreover, as the PbOA2 resonancesincrease in intensity over time, their diffusion coefficient also in-creases slowly. After 1 month, it reaches a value that is 1.8 timessmaller than the diffusion coefficient of pure PbOA2. These ob-servations point toward a chemical equilibrium between adsorbedand free PbOA2, with an exchange rate between both states that isfast on the DOSY time scale (� 5 s−1). In this case, the measureddiffusion coefficient Deff equals the weighted sum of the diffusioncoefficient of adsorbed (Dads) and free (Dfr) PbOA2,
Deff = (1− x)Dads + xDfr (5.2)
where x is the fraction of time the exchanging ligand spends in itsfree state, and Dads is the diffusion coefficient of the nanocrystals.The increase in measured diffusion coefficient shows that the gen-erated PbOA2 spends more time free in suspension as the surfaceoxidation progresses, amounting to 46% of the time after 1 month.
5.4 Conclusions
The NMR techniques developed in chapter IV are successfully ap-plied to identify and quantify the organic ligands of colloidal PbSenanocrystals. We demonstrate that they are passivated almostexclusively by tightly bound oleic acid ligands. Although TOP isalso used during synthesis, we find only a minor fraction of TOPon the nanocrystal surface. This knowledge enables us to tunethe nanocrystal size during synthesis by simply varying the OAligand concentration, leading for instance to 9.5 nm Q-PbSe whenreducing the amount of OA.
The Pb:Se ratio, obtained with ICP-MS, already showed thatthe particles are Pb-rich. In this chapter, we construct a struc-tural model of the nanoparticles, which quantitatively explainsthe observed Pb:Se ratio. It shows that the nanocrystals consistof a stoichiometric PbSe core, terminated by a pure Pb surfaceshell. In addition, the number of excess Pb atoms on the sur-face agrees well with the number of OA ligands. The quantitative
88

5.4. Conclusions
NMR results, combined with the Pb:Se ratio from ICP-MS there-fore allows us to obtain a complete view on the structure of theQ-PbSe nanocrystal core and organic ligand shell.
89

90
Chapter VI
Surface chemistry of PbSnanocrystals
6.1 Introduction
Q-PbS are synthesized using an amine-based synthesis (chapterIII). In contrast with, for instance, carboxylic acids such as oleicacid (chapter V), amines are known to be relatively weak andhighly dynamic ligands.4–7 Indeed, in section 3.1 we already high-lighted that OLA capped Q-PbS can only be precipitated andresuspended once (contrary to OA capped Q-PbS and Q-PbSe).This indicates a facile loss of ligands during particle processingand it can be remedied by adding a small amount of extra aminesto the nanocrystal suspension to improve stability.
As already stated in the introduction of this part, ligand dy-namics are often studied indirectly, by tracking for instance theparticle luminescence during and after capping exchange. In thisrespect, amine capped Q-CdSe have recently received much atten-tion, and the experimental studies provide valuable information oncapping exchange procedures and ligand dynamics at room tem-perature and elevated temperatures.4–7
However, knowledge on the subject can still be improvedgreatly, by a more direct observation of the nanocrystal ligands.In this chapter, we use OLA capped Q-PbS to highlight the
91
VI. Q-PbS surface chemistry
capabilities of NMR in the study of ligands in fast exchange.
6.2 Fast ligand dynamics: theoretical basis
6.2.1 Fast dynamics in 1H NMR and DOSY
When a ligand exchanges between its free and bound state, itschemical environment can change drastically. This is especiallytrue for the cases studied here: as we work in toluene, a free li-gand experiences an aromatic environment, while it is surroundedby other aliphatic molecules in the bound state. In the 1H spec-tra of chapters IV and V, we already observed that this inducesa downfield shift (aromatic solvent induced shift, ASIS) of the li-gand resonances for TOPO capped Q-InP and OA capped Q-PbSe.With respect to DOSY measurements, ligand exchange betweenfree and bound states induces strong changes in the ligand dif-fusion coefficient. Indeed, up to a tenfold decrease in diffusioncoefficient has been observed for the Q-PbSe and Q-InP ligands.
These cases however pertain to ligands showing slow, or evenno ligand dynamics, as we observe separate resonances and diffu-sion coefficients for the free and bound states of TOPO cappedQ-InP, and no free OA is observed for OA capped Q-PbSe.
In case of ligand exchange, we can write the adsorption/desorp-tion process as (L: free ligand; Qdot•: free surface site; L-Qdot:bound ligand):
L + Qdot• L−Qdot (6.1)
Denoting θ the fractional surface coverage and A the maximalnumber of adsorption sites per nanocrystal (section 4.4), the ad-sorption process is described by a second-order rate equation inthe free ligand concentration cf and the concentration of free ad-sorption sites A(1 − θ)c0, with an adsorption rate constant kon.Similarly, the desorption process is described by a first order rateequation in the bound ligand concentration θAc0, with a desorp-
92
6.2. Fast ligand dynamics: theoretical basis
tion rate constant koff :
ron = koncfA(1− θ)c0
roff = koffAθc0 (6.2)
ron and roff denote the adsorption and desorption rate, respec-tively. The 1H NMR signal strength of the free ligand is pro-portional to the concentration of free ligands cf . Similarly, forthe bound ligand it is proportional to the concentration of boundligands Aθc0. Taking the adsorption and desorption rates into ac-count, the lifetime τ of the 1H NMR signal in the free (τf ) andbound (τb) state, respectively, can be written as:
τ−1f = konA(1− θ)c0
τ−1b = koff (6.3)
However, for practical measurements, it is more convenient tocharacterize the exchange process by a single lifetime τ−1
ex = τ−1b +
τ−1f , with an exchange rate constant:
kex = koff + konA(1− θ)c0 (6.4)
Knowing that the equilibrium constant K is given by (section 4.4):
K =kon
koff=
θ
cf (1− θ)(6.5)
the exchange rate can be more conveniently written as:
kex = koff (1 +Aθc0
cf) = koff (1 +
xb
xf) (6.6)
with xb and xf the mole fraction of the bound and free ligand, re-spectively. Note that, when free ligands are present in considerableexcess (xf � xb), kex tends to koff .
In NMR, the presence of fast or slow exchange is now deter-mined by the value kex, with respect to the inverse of the NMRtime scale of interest τm.46–48 Fast exchange implies kex � τ−1
m ,while slow exchange conditions apply when kex � τ−1
m .
93

VI. Q-PbS surface chemistry
In slow exchange, both the bound and free state will yieldseparate NMR observables P (chemical shift, diffusion coefficient)for free (Pf ) and bound (Pb) states, respectively. This has alreadybeen demonstrated for Q-InP and Q-PbSe in chapters IV and V.In fast exchange however, both signals merge and yield a single,population averaged observable Pavg:47,48
Pavg = xfPf + xbPb (6.7)
This case has already been briefly discussed in section 5.3.In a measurement of the 1H NMR spectrum, careful analysis
of the exchange process shows that τ−1m is given by the angular
frequency difference between the free ωf and bound ωb ligand res-onances:47
τ−1m =
ωf − ωb
2=
ωTMS
106
δf − δb
2(6.8)
with δf and δb the chemical shift of the free and bound state,respectively.
For DOSY, the timescale of interest equals the diffusion delay∆:48
τ−1m = ∆−1 (6.9)
6.2.2 The nuclear Overhauser effect
Under conditions of slow or no exchange, the NMR methods devel-oped in chapters IV and V – quantitative 1H NMR, DOSY, HSQC– are well suited to study the bound organic ligands, as their res-onances are broad, well resolved from unbound signals, and havea small diffusion coefficient. The previous section has shown thateven for ligands in fast exchange, information can be obtained fromPavg, if one can estimate Pf and Pb. However, these nanocrystalsuspensions are typically stabilized by an excess of free ligands.This will strongly shift Pavg toward Pf , yielding results which aredominated by the free state. Although this makes ligand identi-fication less trivial, we will show that nuclear Overhauser effect(NOE) spectroscopy provides a solution.
The nuclear Overhauser effect (NOE) between 1H nuclei isbest known from its application in structural and conformational
94
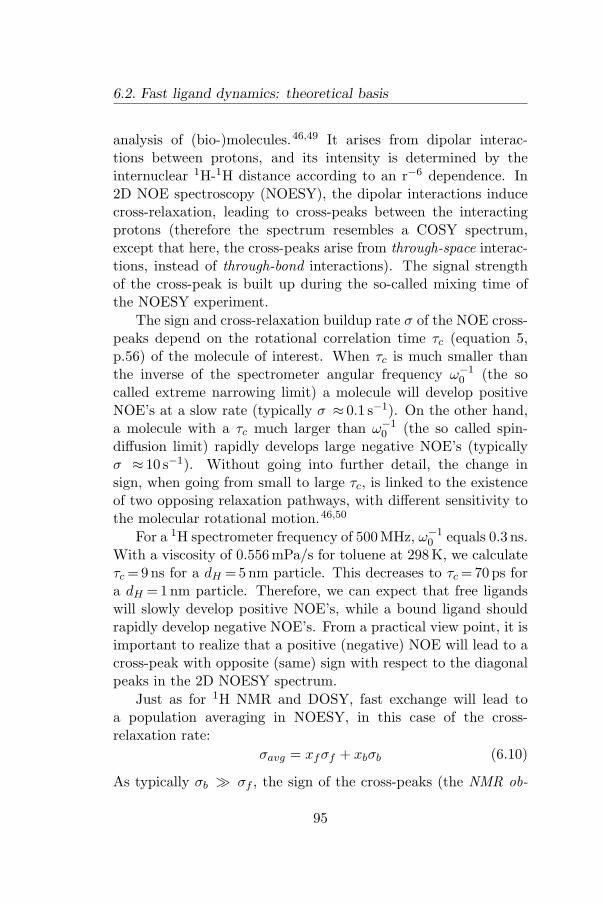
6.2. Fast ligand dynamics: theoretical basis
analysis of (bio-)molecules.46,49 It arises from dipolar interac-tions between protons, and its intensity is determined by theinternuclear 1H-1H distance according to an r−6 dependence. In2D NOE spectroscopy (NOESY), the dipolar interactions inducecross-relaxation, leading to cross-peaks between the interactingprotons (therefore the spectrum resembles a COSY spectrum,except that here, the cross-peaks arise from through-space interac-tions, instead of through-bond interactions). The signal strengthof the cross-peak is built up during the so-called mixing time ofthe NOESY experiment.
The sign and cross-relaxation buildup rate σ of the NOE cross-peaks depend on the rotational correlation time τc (equation 5,p.56) of the molecule of interest. When τc is much smaller thanthe inverse of the spectrometer angular frequency ω−1
0 (the socalled extreme narrowing limit) a molecule will develop positiveNOE’s at a slow rate (typically σ ≈ 0.1 s−1). On the other hand,a molecule with a τc much larger than ω−1
0 (the so called spin-diffusion limit) rapidly develops large negative NOE’s (typicallyσ ≈ 10 s−1). Without going into further detail, the change insign, when going from small to large τc, is linked to the existenceof two opposing relaxation pathways, with different sensitivity tothe molecular rotational motion.46,50
For a 1H spectrometer frequency of 500 MHz, ω−10 equals 0.3 ns.
With a viscosity of 0.556mPa/s for toluene at 298K, we calculateτc =9 ns for a dH =5 nm particle. This decreases to τc = 70ps fora dH = 1nm particle. Therefore, we can expect that free ligandswill slowly develop positive NOE’s, while a bound ligand shouldrapidly develop negative NOE’s. From a practical view point, it isimportant to realize that a positive (negative) NOE will lead to across-peak with opposite (same) sign with respect to the diagonalpeaks in the 2D NOESY spectrum.
Just as for 1H NMR and DOSY, fast exchange will lead toa population averaging in NOESY, in this case of the cross-relaxation rate:
σavg = xfσf + xbσb (6.10)
As typically σb � σf , the sign of the cross-peaks (the NMR ob-
95
VI. Q-PbS surface chemistry
6 5 4 3 2 11H Shift (ppm)
6
5
4
3
2
1
1H
Sh
ift
(pp
m)
(a)
1.6 1.2 0.81.61.41.21.00.8
6 5 4 3 2 11H Shift (ppm)
6
5
4
3
2
1
1H
Sh
ift
(pp
m)
(b)
Figure 6.1: NOESY spectra of OA (a) and Q-PbSe (b) intol-d8 (100ms mixing time). We observe no NOE cross-peaksfor free OA. The anti-resonances, enlarged in the inset, arisefrom ZQC artifacts. In contrast, a NOESY spectrum of Q-PbSe shows strong and negative NOE cross-peaks between theOA ligand resonances, confirming that the increased τc yieldsnegative NOE’s.
servable in the NOE spectrum) will be dominated by the boundligand, even when free ligands are present in considerable excess.
To demonstrate that bound ligands show negative NOE cross-peaks, figure 6.1 shows the NOESY spectra of free OA and aQ-PbSe suspension. Due to short the mixing time (100ms) andslow cross-relaxation rate, we observe no NOE cross-peaks for freeOA (figure 6.1(a)), as expected. Some residual anti-resonancesare still discernible, but these are zero-quantum coherence (ZQC)artifacts. In contrast, the NOESY spectrum for the Q-PbSe sus-pension clearly shows strong and negative NOE cross-peaks (fig-ure 6.1(b)), confirming that bound ligands indeed induce negativeNOE’s due to their increased rotational correlation time τc.
96
6.3. Q-PbS Ligand identification
6.3 Q-PbS Ligand identification
6.3.1 1H NMR and DOSY
The NMR methods already developed are now routinely appliedto investigate the Q-PbS ligand shell. Samples are prepared bydrying a known amount of Q-PbS under a strong nitrogen flow,followed by resuspension in 750 µL of tol-d8. 2 µL of CH2Br2 isadded as a concentration standard.
Figure 6.2(a) shows a typical NMR spectrum of a Q-PbS sam-ple, prepared using OLA as the synthesis solvent (gray). Thespectrum compares well with a spectrum of OLA dissolved in tol-d8 (black), and the 1H-13C spectrum confirms that the Q-PbSresonances indeed arise from OLA (figure 6.2(b)).
However, in contrast with previous results on TOPO capped Q-InP and OA capped Q-PbSe, the NMR resonances are not stronglybroadened with respect to the free OLA resonances and, while weobserve a downfield shift for the 2.53 ppm and 1.42 ppm resonance(corresponding to the protons closest to the NH2 head group), theother resonances do not reveal a significant shift. In addition, theQ-PbS DOSY spectrum (measured with δ =3 ms and ∆ = 125ms,figure 6.2(c), black) shows a single value for the OLA diffusioncoefficient (D =8.9 10−10 m2/s), only reduced by 20 % with respectto the diffusion coefficient of free OLA (D =11.1 10−10 m2/s, gray).
6.3.2 Qdot NOE spectra
The 1H NMR and DOSY spectra do not unambiguously show thatOLA is bound to the nanocrystal surface, although the resultsalready suggest an interaction. To confirm that OLA indeed actsas a ligand, NOESY spectra are measured.
Figure 6.3 shows NOESY spectra for free OLA and a Q-PbSsuspension. As for OA, we observe no NOE cross-peaks in theOLA NOESY spectrum for a 100ms mixing time (figure 6.3(a)).When the NOE mixing time is extended to 600 ms, the ZQC ar-tifacts have diminished and weak positive NOE’s appear (figure6.3(b)). The NOESY spectrum of the Q-PbS suspension however
97
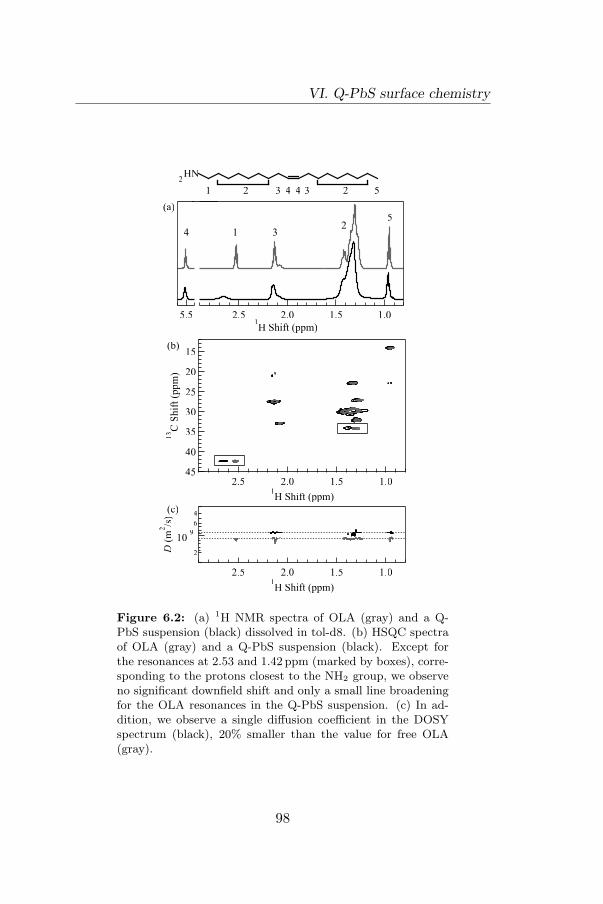
VI. Q-PbS surface chemistry
2.5 2.0 1.5 1.01H Shift (ppm)
45
40
35
30
25
20
15
13C
Shif
t (p
pm
)
2.5 2.0 1.5 1.01H Shift (ppm)
5.5
HN
1 2 3 4 4 3 2 5
2
12
34
5(a)
(b)
2.5 2.0 1.5 1.01H Shift (ppm)
4
6
10-9
2D (
m2/s
)
(c)
Figure 6.2: (a) 1H NMR spectra of OLA (gray) and a Q-PbS suspension (black) dissolved in tol-d8. (b) HSQC spectraof OLA (gray) and a Q-PbS suspension (black). Except forthe resonances at 2.53 and 1.42 ppm (marked by boxes), corre-sponding to the protons closest to the NH2 group, we observeno significant downfield shift and only a small line broadeningfor the OLA resonances in the Q-PbS suspension. (c) In ad-dition, we observe a single diffusion coefficient in the DOSYspectrum (black), 20% smaller than the value for free OLA(gray).
98
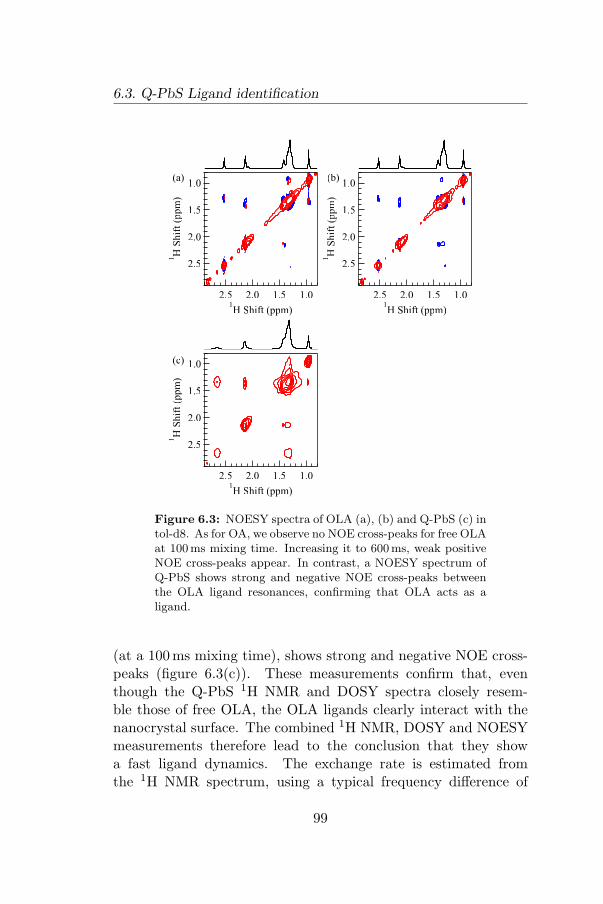
6.3. Q-PbS Ligand identification
2.5 2.0 1.5 1.01H Shift (ppm)
2.5
2.0
1.5
1.0
1H
Sh
ift
(pp
m)
2.5 2.0 1.5 1.01H Shift (ppm)
2.5
2.0
1.5
1.0
1H
Sh
ift
(pp
m)
2.5 2.0 1.5 1.01H Shift (ppm)
2.5
2.0
1.5
1.0
1H
Sh
ift
(pp
m)
(a)
(c)
(b)
Figure 6.3: NOESY spectra of OLA (a), (b) and Q-PbS (c) intol-d8. As for OA, we observe no NOE cross-peaks for free OLAat 100ms mixing time. Increasing it to 600ms, weak positiveNOE cross-peaks appear. In contrast, a NOESY spectrum ofQ-PbS shows strong and negative NOE cross-peaks betweenthe OLA ligand resonances, confirming that OLA acts as aligand.
(at a 100 ms mixing time), shows strong and negative NOE cross-peaks (figure 6.3(c)). These measurements confirm that, eventhough the Q-PbS 1H NMR and DOSY spectra closely resem-ble those of free OLA, the OLA ligands clearly interact with thenanocrystal surface. The combined 1H NMR, DOSY and NOESYmeasurements therefore lead to the conclusion that they showa fast ligand dynamics. The exchange rate is estimated fromthe 1H NMR spectrum, using a typical frequency difference of
99
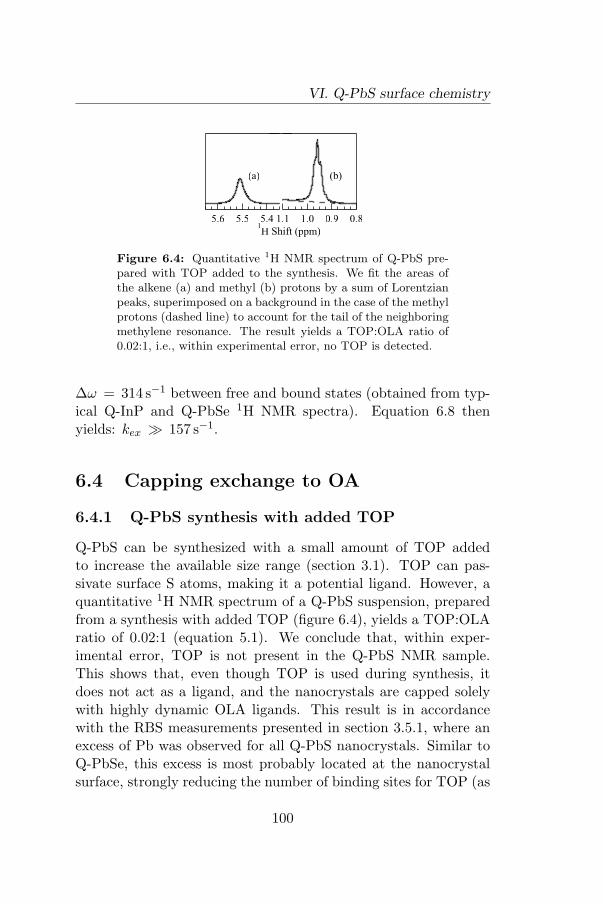
VI. Q-PbS surface chemistry
5.6 5.5 5.4 1.1 1.0 0.9 0.81H Shift (ppm)
(a) (b)
Figure 6.4: Quantitative 1H NMR spectrum of Q-PbS pre-pared with TOP added to the synthesis. We fit the areas ofthe alkene (a) and methyl (b) protons by a sum of Lorentzianpeaks, superimposed on a background in the case of the methylprotons (dashed line) to account for the tail of the neighboringmethylene resonance. The result yields a TOP:OLA ratio of0.02:1, i.e., within experimental error, no TOP is detected.
∆ω = 314 s−1 between free and bound states (obtained from typ-ical Q-InP and Q-PbSe 1H NMR spectra). Equation 6.8 thenyields: kex � 157 s−1.
6.4 Capping exchange to OA
6.4.1 Q-PbS synthesis with added TOP
Q-PbS can be synthesized with a small amount of TOP addedto increase the available size range (section 3.1). TOP can pas-sivate surface S atoms, making it a potential ligand. However, aquantitative 1H NMR spectrum of a Q-PbS suspension, preparedfrom a synthesis with added TOP (figure 6.4), yields a TOP:OLAratio of 0.02:1 (equation 5.1). We conclude that, within exper-imental error, TOP is not present in the Q-PbS NMR sample.This shows that, even though TOP is used during synthesis, itdoes not act as a ligand, and the nanocrystals are capped solelywith highly dynamic OLA ligands. This result is in accordancewith the RBS measurements presented in section 3.5.1, where anexcess of Pb was observed for all Q-PbS nanocrystals. Similar toQ-PbSe, this excess is most probably located at the nanocrystalsurface, strongly reducing the number of binding sites for TOP (as
100
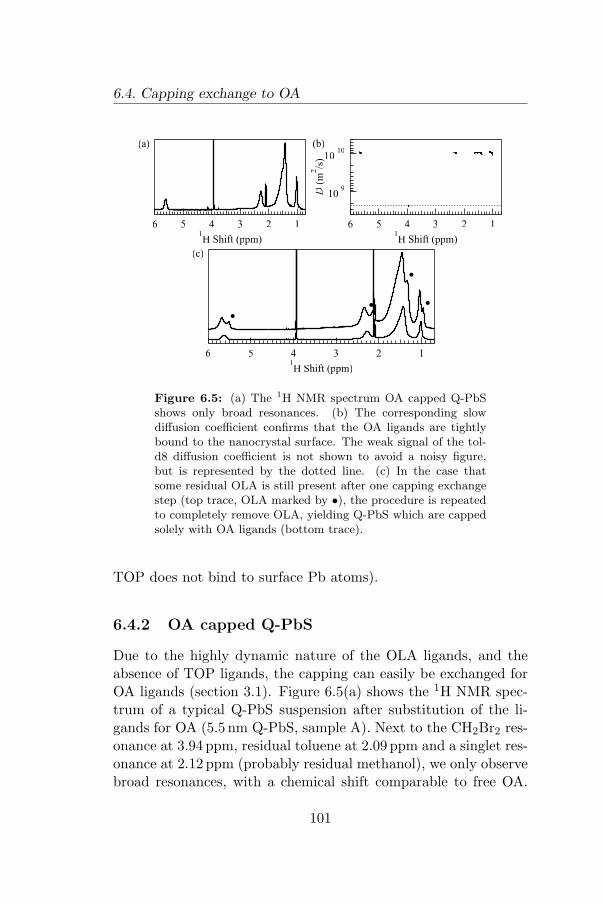
6.4. Capping exchange to OA
6 5 4 3 2 11H Shift (ppm)
(a)
6 5 4 3 2 11H Shift (ppm)
10-10
10-9D
(m
2/s
)
(b)
6 5 4 3 2 11H Shift (ppm)
(c)
Figure 6.5: (a) The 1H NMR spectrum OA capped Q-PbSshows only broad resonances. (b) The corresponding slowdiffusion coefficient confirms that the OA ligands are tightlybound to the nanocrystal surface. The weak signal of the tol-d8 diffusion coefficient is not shown to avoid a noisy figure,but is represented by the dotted line. (c) In the case thatsome residual OLA is still present after one capping exchangestep (top trace, OLA marked by •), the procedure is repeatedto completely remove OLA, yielding Q-PbS which are cappedsolely with OA ligands (bottom trace).
TOP does not bind to surface Pb atoms).
6.4.2 OA capped Q-PbS
Due to the highly dynamic nature of the OLA ligands, and theabsence of TOP ligands, the capping can easily be exchanged forOA ligands (section 3.1). Figure 6.5(a) shows the 1H NMR spec-trum of a typical Q-PbS suspension after substitution of the li-gands for OA (5.5 nm Q-PbS, sample A). Next to the CH2Br2 res-onance at 3.94 ppm, residual toluene at 2.09 ppm and a singlet res-onance at 2.12 ppm (probably residual methanol), we only observebroad resonances, with a chemical shift comparable to free OA.
101

VI. Q-PbS surface chemistry
d (nm) N Pbe OA OA:Pbe
A 5.5 3314 380 284 0.75B 7.1 7228 829 554 0.67
Table 6.1: Q-PbS size d, number of atoms N (equation 2.3),excess Pb atoms Pbe (assuming a Pb:S ratio of 1.26:1), OAligands per nanocrystals (determined with NMR), and corre-sponding OA:Pbe ratio.
The DOSY spectrum (figure 6.5(b), measured with δ =5 ms and∆ = 250ms), shows that the OA ligand diffusion coefficient equals9.3 10−11 m2/s, yielding a hydrodynamic diameter dH =8.0 nm.This value agrees well with the Q-PbS core size of 5.5 nm, in-cremented with the typical thickness of the OA capping layer(1.25 nm, agreeing with typical values obtained for OA cappedQ-PbSe, figure 5.2).
In some cases, a little amount of OLA is still present afterone capping exchange step (figure 6.5(c), top trace). When thisis observed, we simply repeat the exchange procedure. The bot-tom trace shows that the second exchange step indeed removesthe residual OLA, yielding nanocrystals which are capped solelyby OA (7.1 nm Q-PbS, sample B). Although these results appeartrivial, they nevertheless highlight the importance of using NMRas a feedback tool for capping exchange procedures.
Quantitative NMR measurements on samples A and B yield aOA coverage of 3.0 and 3.5 ligands per nm2 of nanocrystal surface,respectively. Interestingly, this value is much smaller than the 4.2ligands per nm2 observed for Q-PbSe nanocrystals, even thoughthe smaller PbS lattice parameter suggests that the ligand densityshould increase. The lower ligand density could be the result ofthe smaller number of excess Pb atoms present on the Q-PbS sur-face with respect to Q-PbSe (sections 2.2.2 and 3.5.1). However,taking a Pb:S ratio of 1.26:1, the number of excess Pb atoms stillexceeds the number of OA ligands per nanocrystal (table 6.1). Thepresence of Cl atoms, most probably located on the nanocrystalsurface as PbCl2, might reduce the number of binding sites for OAligands, leading to the observed rather low ligand density.
102

6.5. Conclusions
Lum
ines
cence
17001600150014001300Wavelength (nm)
(a)4.7nm
Lum
ines
cence
17001600150014001300Wavelength (nm)
(b)5.3nm
Figure 6.6: Luminescence spectra of OLA (dashed curve) andOA (full curve) capped Q-PbS. The spectra are corrected fordifferences in optical density. After capping exchange to OA,we observe a 6- and 3-fold enhancement in photo-luminescenceyield for 4.7 nm (a) and 5.3 nm (b) Q-PbS, respectively.
In addition, the ratio of the area of the OA alkene resonanceto the area of the methyl resonance confirms the absence of TOPon the Q-PbS surface. Using equation 5.1, averaged over bothsamples, we find a TOP:OA ratio of 0.6%.
6.4.3 Q-PbS luminescence
Just as for OA capped Q-PbSe, the NMR measurements show thatthe OA ligands are tightly bound to the Q-PbS surface. Despitethe reduced surface coverage, OA ligands still provide an improvedsurface passivation with respect to OLA, resulting in a 3 to 6fold increase in photo-luminescence quantum yield after cappingexchange to OA (figure 6.6, measurements corrected for differencesin optical density at the excitation wavelength of 400 nm).
6.5 Conclusions
OLA capped Q-PbS are studied with NMR as an example of li-gands exhibiting a fast dynamical behavior. For ligands in fastexchange, ligand identification based on the methods describedin previous chapters is hampered by the observation of popula-tion averaged 1H NMR resonances and diffusion coefficients, oftenstrongly shifted toward the free state. However, by extending the
103

VI. Q-PbS surface chemistry
techniques with NOESY, unambiguous identification remains pos-sible, and a lower limit on the exchange rate can be determined.
Although we restrict ourselves to OLA capped Q-PbS in thischapter, similar results are obtained on octylamine capped Q-CdTe, dodecylamine capped Q-ZnO and pyridine capped Q-InP(although no NOESY spectra have yet been recorded for the Q-InPsamples). Taking complementary literature data into account, weconclude that generally, nanocrystals capped with amine ligandsshow fast ligand dynamics.
As a result, OLA capped Q-PbS are poorly passivated, lead-ing to a low photo-luminescence quantum yield. The fast liganddynamics however leads to a facile exchange with OA. The OAligands are again tightly bound to the nanocrystal surface, herebystrongly enhancing the luminescence yield.
104
Bibliography
[1] Y. Yin and A. P. Alivisatos, Colloidal nanocrystal synthesisand the organic-inorganic interface, Nature 2005, 437 , 664–670.
[2] W. W. Yu et al., Preparation and characterization ofmonodisperse PbSe semiconductor nanocrystals in a nonco-ordinating solvent , Chem. Mat. 2004, 16 , 3318–3322.
[3] H. Du et al., Optical properties of colloidal PbSe nanocrystals,Nano Lett. 2002, 2 , 1321–1324.
[4] C. Bullen and P. Mulvaney, The effects of chemisorption onthe luminescence of CdSe quantum dots, Langmuir 2006, 22 ,3007–3013.
[5] N. Pradhan et al., Surface ligand dynamics in growth of na-nocrystals, J. Am. Chem. Soc. 2007, 129 , 9500–9509.
[6] X. H. Ji et al., Ligand bonding and dynamics on colloidalnanocrystals at room temperature: The case of alkylamineson CdSe nanocrystals, J. Am. Chem. Soc. 2008, 130 , 5726–5735.
[7] R. Koole et al., Time-dependent photoluminescence spec-troscopy as a tool to measure the ligand exchange kineticson a quantum dot surface, ACS Nano 2008, 2 , 1703–1714.
[8] J. Aldana, Y. A. Wang and X. G. Peng, Photochemical in-stability of CdSe nanocrystals coated by hydrophilic thiols, J.Am. Chem. Soc. 2001, 123 , 8844–8850.
[9] B. R. Hyun et al., Near-infrared fluorescence imaging withwater-soluble lead salt quantum dots, J. Phys. Chem. B 2007,111 , 5726–5730.
[10] D. V. Talapin et al., Synthesis and surface modification ofamino-stabilized CdSe, CdTe and InP nanocrystals, ColloidSurf. A-Physicochem. Eng. Asp. 2002, 202 , 145–154.
[11] D. V. Talapin and C. B. Murray, PbSe nanocrystal solidsfor n- and p-channel thin film field-effect transistors, Science2005, 310 , 86–89.
[12] M. Law et al., Structural, optical, and electrical properties
105
of PbSe nanocrystal solids treated thermally or with simpleamines, J. Am. Chem. Soc. 2008, 130 , 5974–5985.
[13] A. A. Guzelian et al., Synthesis of size-selected, surface-passivated InP nanocrystals, J. Phys. Chem. 1996, 100 ,7212–7219.
[14] A. Lobo et al., Photoelectron spectroscopic investigations ofchemical bonding in organically stabilized PbS nanocrystals,J. Phys. Chem. B 2005, 109 , 17422–17428.
[15] S. Sapra et al., Unraveling internal structures of highly lu-minescent PbSe nanocrystallites using variable-energy syn-chrotron radiation photoelectron spectroscopy , J. Phys. Chem.B 2006, 110 , 15244–15250.
[16] J. Taylor, T. Kippeny and S. J. Rosenthal, Surface stoichiom-etry of CdSe nanocrystals determined by Rutherford backscat-tering spectroscopy , J. Clust. Sci. 2001, 12 , 571–582.
[17] J. R. Sachleben et al., NMR-studies of the surface structureand dynamics of semiconductor nanocrystals, Chem. Phys.Lett. 1992, 198 , 431–436.
[18] S. A. Majetich et al., 1H NMR characterization of the CdSenanocrystallite surface, J. Phys. Chem. 1994, 98 , 13705–13710.
[19] J. R. Sachleben et al., Solution-state NMR studies of the sur-face structure and dynamics of semiconductor nanocrystals,J. Phys. Chem. B 1998, 102 , 10117–10128.
[20] F. Ribot et al., In situ evaluation of interfacial affinityin CeO2 based hybrid nanoparticles by pulsed field gradientNMR, Chem. Commun. 2005, 1019–1021.
[21] L. Van Lokeren et al., Characterization of titanium dioxidenanoparticles dispersed in organic ligand solutions by using adiffusion-ordered spectroscopy-based strategy , Chem. Eur. J.2007, 13 , 6957–6966.
[22] L. Shen et al., Pulsed field gradient NMR studies of polymeradsorption on colloidal CdSe quantum dots, J. Phys. Chem.B 2008, 112 , 1626–1633.
[23] L. Polito et al., Resolving the structure of ligands bound to
106

the surface of superparamagnetic iron oxide nanoparticles byhigh-resolution magic-angle spinning NMR spectroscopy , J.Am. Chem. Soc. 2008, 130 , 12712–12724.
[24] J. S. Owen et al., Reaction chemistry and ligand exchange atcadmium–selenide nanocrystal surfaces, J. Am. Chem. Soc.2008, 130 , 12279–12281.
[25] T. D. W. Claridge, High-resolution NMR techniques in or-ganic chemistry , Elsevier 1999.
[26] O. I. Micic et al., Synthesis and characterization of InP, GaP,and GaInP2 quantum dots, J. Phys. Chem. 1995, 99 , 7754–7759.
[27] D. V. Talapin et al., Etching of colloidal InP nanocrystalswith fluorides: Photochemical nature of the process resultingin high photoluminescence efficiency , J. Phys. Chem. B 2002,106 , 12659–12663.
[28] D. H. Wu, A. D. Chen and C. S. Johnson, An im-proved diffusion-ordered spectroscopy experiment incorporat-ing bipolar-gradient pulses, J. Magn. Reson. Ser. A 1995,115 , 260–264.
[29] W. S. Price, Pulsed-field gradient nuclear magnetic resonanceas a tool for studying translational diffusion .1. Basic theory ,Concepts Magn. Resonance 1997, 9 , 299–336.
[30] W. S. Price, Pulsed-field gradient nuclear magnetic resonanceas a tool for studying translational diffusion. 2. Experimentalaspects, Concepts Magn. Resonance 1998, 10 , 197–237.
[31] M. Tomaselli et al., NMR study of InP quantum dots: Surfacestructure and size effects, J. Chem. Phys. 1999, 110 , 8861–8864.
[32] R. H. Fowler, Adsorption isotherms. Critical conditions,Math. Proc. Cambridge 1936, 32 , 144–151.
[33] R. Peierls, Statistical theory of adsorption with interactionbetween the adsorbed atoms, Math. Proc. Cambridge 1936,32 , 471–476.
[34] E. Delamarche et al., Thermal stability of self-assembledmonolayers, Langmuir 1994, 10 , 4103–4108.
107
[35] S. F. Wuister et al., Temperature antiquenching of the lumi-nescence from capped CdSe quantum dots, Angew. Chem. Int.Edit. 2004, 43 , 3029–3033.
[36] H. Bonnemann et al., Nanoscale colloidal metals and alloysstabilized by solvents and surfactants: Preparation and use ascatalyst precursors, J. Organomet. Chem. 1996, 520 , 143–162.
[37] A. Roucoux, J. Schulz and H. Patin, Reduced transition metalcolloids: A novel family of reusable catalysts? , Chem. Rev.2002, 102 , 3757–3778.
[38] C. A. Stowell and B. A. Korgel, Iridium nanocrystal synthesisand surface coating-dependent catalytic activity , Nano Lett.2005, 5 , 1203–1207.
[39] J. Jasieniak and P. Mulvaney, From Cd-rich to Se-rich - Themanipulation of CdSe nanocrystal surface stoichiometry , J.Am. Chem. Soc. 2007, 129 , 2841–2848.
[40] M. Klokkenburg et al., Dipolar structures in colloidal disper-sions of PbSe and CdSe quantum dots, Nano Lett. 2007, 7 ,2931–2936.
[41] K. S. Cho et al., Designing PbSe nanowires and nanoringsthrough oriented attachment of nanoparticles, J. Am. Chem.Soc. 2005, 127 , 7140–7147.
[42] X. Y. Huang, E. Lindgren and J. R. Chelikowsky, Surfacepassivation method for semiconductor nanostructures, Phys.Rev. B 2005, 71 , 165328.
[43] J. M. An et al., The peculiar electronic structure of PbSequantum dots, Nano Lett. 2006, 6 , 2728–2735.
[44] A. Franceschetti, Structural and electronic properties of PbSenanocrystals from first principles, Phys. Rev. B 2008, 78 ,075418.
[45] J. W. Stouwdam et al., Photostability of colloidal PbSe andPbSe/PbS core/shell nanocrystals in solution and in the solidstate, J. Phys. Chem. C 2007, 111 , 1086–1092.
[46] F. Ni, Recent developments in transferred NOE methods,Prog. Nucl. Mag. Res. Sp. 1994, 26 , 517–606.
108
[47] A. D. Bain, Chemical exchange in NMR, Prog. Nucl. Mag.Res. Sp. 2003, 43 , 63–103.
[48] E. J. Cabrita and S. Berger, HR-DOSY as a new tool for thestudy of chemical exchange phenomena, Magn. Reson. Chem.2002, 40 , S122–S127.
[49] G. M. Clore and A. M. Gronenborn, Theory and applicationsof the transferred nuclear Overhauser effect to the study of theconformations of small ligands bound to proteins, J. Magn.Reson. 1982, 48 , 402–417.
[50] I. Solomon, Relaxation Processes in a System of Two Spins,Phys. Rev. 1955, 99 , 559.
109

110
Part 3
Optical properties of colloidalsemiconductor nanocrystals

Introduction
With the steady progress of nanoscience toward application ori-ented research, a proper knowledge of the optical properties, suchas the dielectric function and the complex refractive index, be-comes essential. Lasing applications1–3 for instance require knowl-edge of the refractive index of the medium in order to tune thecavity thickness to a desired output wavelength, and recently, theinternal quantum efficiency of a Q-PbSe solar cell was calculatedusing the effective refractive index neff of a close-packed Q-PbSethin film.4 neff was measured with ellipsometry, with unfortu-nately a low signal-to-noise ratio in the near-infrared.
Despite 25 years of research, the optical properties of colloidalquantum dots are still not fully understood. The effect of quan-tum confinement on the shift of the band gap transition to smallerwavelengths with decreasing size is by now well studied, both onan experimental5–7 and a theoretical level8–11. In contrast, lessconsistent literature data exists on absolute values of the molarextinction or the absorption coefficient.12–17 In this case, the ef-fects of quantum confinement are not completely unraveled yet.
In this part, we quantify the optical properties of colloidal leadchalcogenide nanocrystals. We derive the absorption coefficient ofthe quantum dots, and, at the band gap, calculate the correspond-ing oscillator strength. We demonstrate that at energies far abovethe band gap, quantum dots absorb essentially just as bulk ma-terial, showing no confinement effects. In contrast, we observestrong confinement effects at the band gap.
Next, we obtain the complex dielectric function and refractive
113
Introduction
index from the absorption coefficient of colloidal quantum dots insuspension, using the Kramers–Kronig relations and the Maxwell-Garnett model18,19 of small particles dispersed in a transparentdielectric host.
In the concluding chapter of this part, we shift focus to thenonlinear optical properties of colloidal lead chalcogenide nano-crystals. Using the Z-scan technique,20 we will show that theQdots possess a high nonlinear refractive index, and that theybehave as saturable absorbers.
114
Chapter VII
Linear optical properties ofcolloidal lead chalcogenidenanocrystals
7.1 Introduction
An important quantity in colloidal nanocrystal research is the mo-lar extinction coefficient ε. In combination with the absorbancespectrum and Beer’s law, it provides the most convenient way todetermine the concentration of dispersed quantum dots (sections2.2.3 and 3.5.2). From a theoretical point of view, ε gives insightin the spectral position and the oscillator strength of the inter-band transitions of colloidal quantum dots, and their evolutionwith size.
The dependence of the spectral position of the band gap tran-sition on the nanocrystal size is by now well understood, and excel-lent agreement between experiment and theory has been demon-strated for many different materials.5–11 In contrast, the resultsof experimental studies on extinction coefficients and oscillatorstrengths of electronic transitions in colloidal quantum dots areless clear. On the basis of the maximum value of the band gapabsorption, an increase of ε with increasing particle size has been
115

VII. Linear optical properties
reported for materials such as CdTe,15 CdS,15 CdSe,13,15 InAs16
and PbS.17 Very often, this size dependence takes the form of apower law, but the exponents vary widely from material to ma-terial and, in the case of CdTe, even for the same material (Yuet al.15 report a cubic dependence, while Rajh et al.12 found thatε is size-independent). The fact that the maximum of the bandgap absorption depends on the size dispersion of the sample isanticipated in more recent reports, in which calibrated15 or inte-grated14,17 absorbances are used.
For comparison with theory, the oscillator strength is a moreattractive quantity because it only depends on intrinsic quantumdot properties. However, literature does not yield a standard pro-cedure to calculate the oscillator strength of the band gap transi-tion from the absorbance spectrum. Many authors work with rela-tive oscillator strengths, assuming that the oscillator strength hasthe same size-dependence as the extinction coefficient per parti-cle12 or the wavelength integrated extinction coefficient.14,17 Onlyin the case of InAs quantum dots, the oscillator strength is quan-tified starting from the frequency integrated absorption cross sec-tion.16 However, none of these reports establish a quantitativeagreement between the experimental oscillator strength and theo-retical calculations.
In section 2.2.3 and 3.5.2, we have already shown that the mo-lar extinction coefficient of Q-PbS and Q-PbSe show a cubic sizedependence at 400 nm, indicating the absence of quantum confine-ment. In this chapter, we extend this to a deeper experimentaland theoretical study on the absorption coefficient and oscillatorstrength of spherical lead chalcogenide quantum dots at energiesfar above the band gap and at the band gap transition.
7.2 The Maxwell-Garnett model
7.2.1 Basics optics
Before we derive the optical properties of dispersed nanoparticlesusing the Maxwell–Garnett (MG) model, we give a brief overview
116
7.2. The Maxwell-Garnett model
of the relevant optical quantities.A material is characterized by its complex dielectric function
ε = εR + i εI . The real and imaginary part of ε are related to thecomplex refractive index n + i k through:
εR = n2 − k2
εI = 2nk (7.1)
The extinction coefficient k can be derived from the absorptioncoefficient α of the material at any given wavelength λ (or, equiv-alently, any frequency ω):
α =4π
λk =
2ω
ck (7.2)
If k is known over the entire spectral domain, n can be determinedat any frequency ω by a Kramers–Kronig transformation:
n(ω) = 1 +2π
P
∫ ∞
0
ω′k(ω′)ω′2 − ω2
dω′ (7.3)
P denotes the Cauchy principal value.To avoid confusion, we will use an alternative notation for the
absorption coefficient of a material consisting of small sphericalparticles, dispersed in a dielectric host; we define it as µ, given by:
µ =4π
λkeff (7.4)
with keff the effective extinction coefficient of the composite ma-terial. For the composite, equations 7.1 and 7.3 still hold, keepingin mind that in this case, the material is described by an effec-tive dielectric function εR,eff + i εI,eff and an effective complexrefractive index neff + i keff .
7.2.2 Derivation of µ using the MG model
A dilute suspension of semiconductor nanocrystals in a (trans-parent) organic solvent is a good example of a composite with a
117
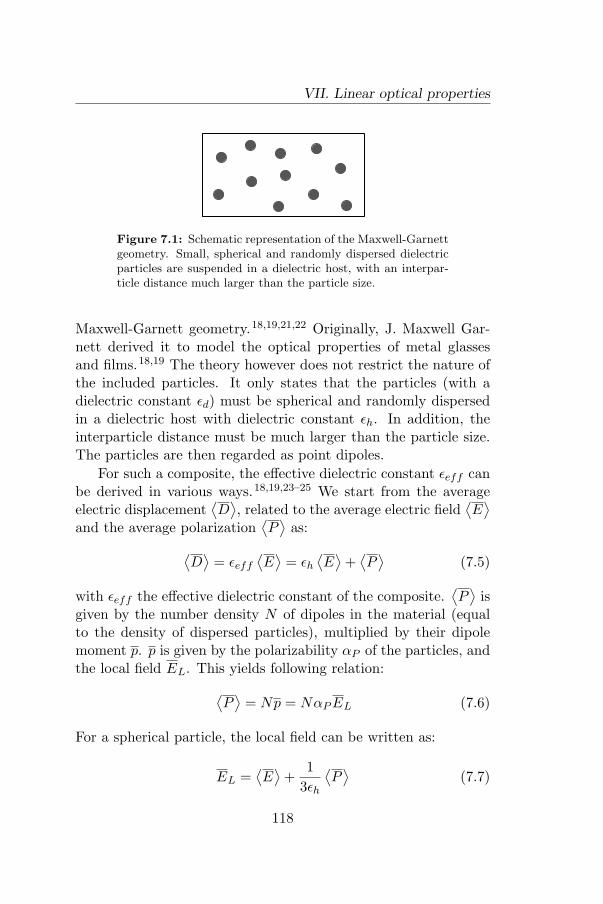
VII. Linear optical properties
Figure 7.1: Schematic representation of the Maxwell-Garnettgeometry. Small, spherical and randomly dispersed dielectricparticles are suspended in a dielectric host, with an interpar-ticle distance much larger than the particle size.
Maxwell-Garnett geometry.18,19,21,22 Originally, J. Maxwell Gar-nett derived it to model the optical properties of metal glassesand films.18,19 The theory however does not restrict the nature ofthe included particles. It only states that the particles (with adielectric constant εd) must be spherical and randomly dispersedin a dielectric host with dielectric constant εh. In addition, theinterparticle distance must be much larger than the particle size.The particles are then regarded as point dipoles.
For such a composite, the effective dielectric constant εeff canbe derived in various ways.18,19,23–25 We start from the averageelectric displacement
⟨D⟩, related to the average electric field
⟨E⟩
and the average polarization⟨P⟩
as:⟨D⟩
= εeff
⟨E⟩
= εh
⟨E⟩
+⟨P⟩
(7.5)
with εeff the effective dielectric constant of the composite.⟨P⟩
isgiven by the number density N of dipoles in the material (equalto the density of dispersed particles), multiplied by their dipolemoment p. p is given by the polarizability αP of the particles, andthe local field EL. This yields following relation:⟨
P⟩
= Np = NαP EL (7.6)
For a spherical particle, the local field can be written as:
EL =⟨E⟩
+1
3εh
⟨P⟩
(7.7)
118
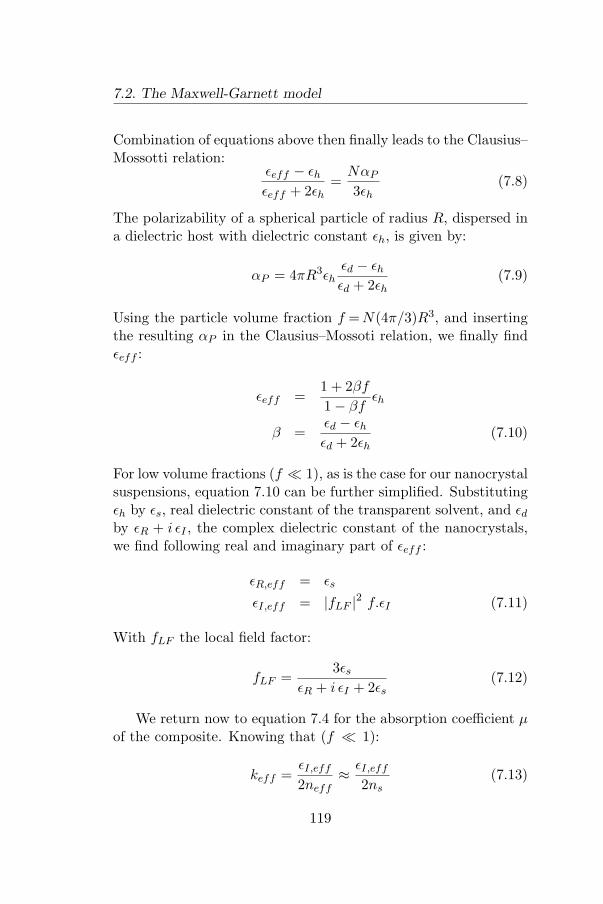
7.2. The Maxwell-Garnett model
Combination of equations above then finally leads to the Clausius–Mossotti relation:
εeff − εh
εeff + 2εh=
NαP
3εh(7.8)
The polarizability of a spherical particle of radius R, dispersed ina dielectric host with dielectric constant εh, is given by:
αP = 4πR3εhεd − εh
εd + 2εh(7.9)
Using the particle volume fraction f = N(4π/3)R3, and insertingthe resulting αP in the Clausius–Mossoti relation, we finally findεeff :
εeff =1 + 2βf
1− βfεh
β =εd − εh
εd + 2εh(7.10)
For low volume fractions (f � 1), as is the case for our nanocrystalsuspensions, equation 7.10 can be further simplified. Substitutingεh by εs, real dielectric constant of the transparent solvent, and εd
by εR + i εI , the complex dielectric constant of the nanocrystals,we find following real and imaginary part of εeff :
εR,eff = εs
εI,eff = |fLF |2 f.εI (7.11)
With fLF the local field factor:
fLF =3εs
εR + i εI + 2εs(7.12)
We return now to equation 7.4 for the absorption coefficient µof the composite. Knowing that (f � 1):
keff =εI,eff
2neff≈
εI,eff
2ns(7.13)
119
VII. Linear optical properties
with ns =√
εs the refractive index of the solvent, we can derive µfrom equations 7.4 and 7.11:
µ =2π
λns|fLF |2 f.εI (7.14)
This equation shows that, for spherical particles dispersed in atransparent host, the absorption coefficient µ can be derived fromthe dielectric function of the inclusions εR + iεI and the refrac-tive index ns, or equivalently the real dielectric function εs, of thehost material. As the effective absorption coefficient increases lin-early with the particle volume fraction, we can define an intrinsicabsorption coefficient from µ= f.µintr, a property independent ofnanocrystal concentration.
In order to experimentally determine µintr of suspended Qdots,it is conveniently related to the molar extinction coefficient ε ofdispersed particles (see sections 2.2.3, 3.5.2 and 4.1). Both aredefined by the transmittance T of a sample of length L:
− log T = cεL
− lnT = fµintrL (7.15)
f can be calculated from the particle concentration c and size d:
f = cNAπd3
6(7.16)
with NA Avogadro’s constant. Combination of equations 7.15 and7.16 leads to following relation:
µintr =ε ln 10NA
6πd3
(7.17)
For simplicity, we will continue with the intrinsic absorptioncoefficient in the remainder of this work, and drop the subscript.
7.3 The Q-PbSe absorption coefficient
7.3.1 Absorption coefficient at high energies
Five Q-PbSe samples are prepared for ICP-MS measurements andthe calculation of ε (section 2.2.3). Spectra of ε are shown in figure
120
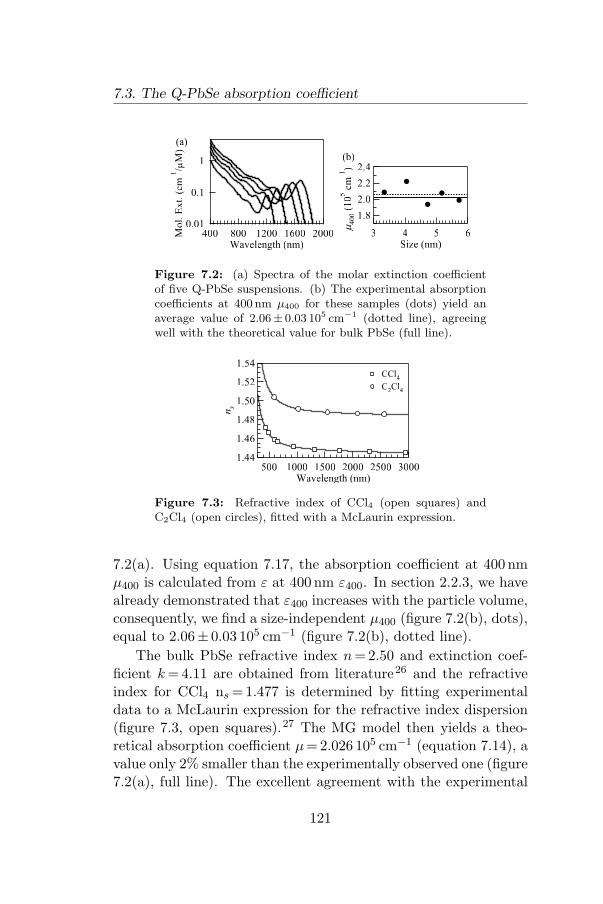
7.3. The Q-PbSe absorption coefficient
2.4
2.2
2.0
1.8
m4
00 (
10
5 c
m-1
)
6543Size (nm)
(b)
0.01
0.1
1
Mo
l. E
xt.
(cm
-1/µ
M)
200016001200800400Wavelength (nm)
(a)
Figure 7.2: (a) Spectra of the molar extinction coefficientof five Q-PbSe suspensions. (b) The experimental absorptioncoefficients at 400 nm µ400 for these samples (dots) yield anaverage value of 2.06± 0.03 105 cm−1 (dotted line), agreeingwell with the theoretical value for bulk PbSe (full line).
1.54
1.52
1.50
1.48
1.46
1.44
ns
30002500200015001000500Wavelength (nm)
CCl4 C2Cl4
Figure 7.3: Refractive index of CCl4 (open squares) andC2Cl4 (open circles), fitted with a McLaurin expression.
7.2(a). Using equation 7.17, the absorption coefficient at 400 nmµ400 is calculated from ε at 400 nm ε400. In section 2.2.3, we havealready demonstrated that ε400 increases with the particle volume,consequently, we find a size-independent µ400 (figure 7.2(b), dots),equal to 2.06± 0.03 105 cm−1 (figure 7.2(b), dotted line).
The bulk PbSe refractive index n =2.50 and extinction coef-ficient k =4.11 are obtained from literature26 and the refractiveindex for CCl4 ns =1.477 is determined by fitting experimentaldata to a McLaurin expression for the refractive index dispersion(figure 7.3, open squares).27 The MG model then yields a theo-retical absorption coefficient µ= 2.026 105 cm−1 (equation 7.14), avalue only 2% smaller than the experimentally observed one (figure7.2(a), full line). The excellent agreement with the experimental
121
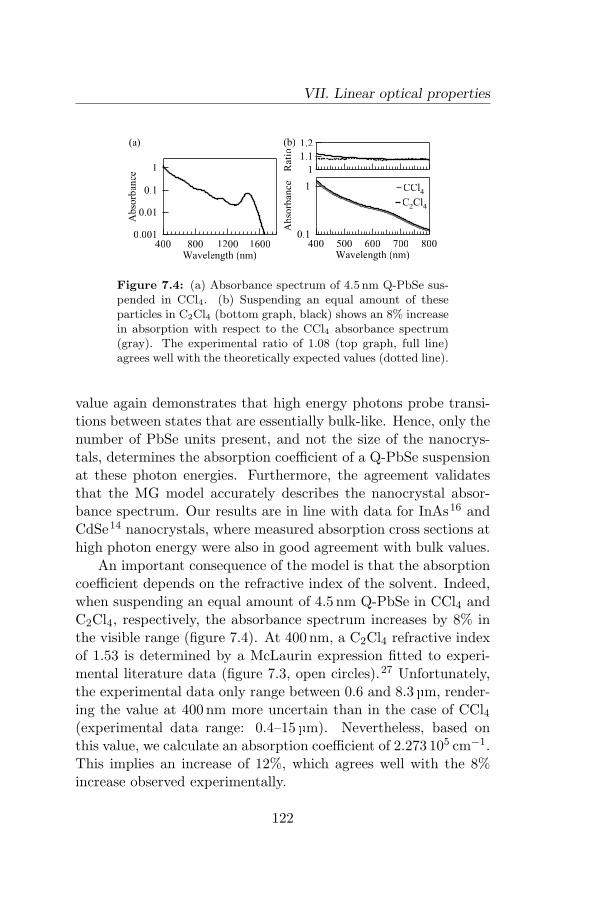
VII. Linear optical properties
0.001
0.01
0.1
1
Ab
sorb
ance
16001200800400Wavelength (nm)
(a) 1.2
1.1
1Rat
io
800700600500400
(b)
0.1
1
Ab
sorb
ance
800700600500400Wavelength (nm)
CCl4C2Cl4
Figure 7.4: (a) Absorbance spectrum of 4.5 nm Q-PbSe sus-pended in CCl4. (b) Suspending an equal amount of theseparticles in C2Cl4 (bottom graph, black) shows an 8% increasein absorption with respect to the CCl4 absorbance spectrum(gray). The experimental ratio of 1.08 (top graph, full line)agrees well with the theoretically expected values (dotted line).
value again demonstrates that high energy photons probe transi-tions between states that are essentially bulk-like. Hence, only thenumber of PbSe units present, and not the size of the nanocrys-tals, determines the absorption coefficient of a Q-PbSe suspensionat these photon energies. Furthermore, the agreement validatesthat the MG model accurately describes the nanocrystal absor-bance spectrum. Our results are in line with data for InAs16 andCdSe14 nanocrystals, where measured absorption cross sections athigh photon energy were also in good agreement with bulk values.
An important consequence of the model is that the absorptioncoefficient depends on the refractive index of the solvent. Indeed,when suspending an equal amount of 4.5 nm Q-PbSe in CCl4 andC2Cl4, respectively, the absorbance spectrum increases by 8% inthe visible range (figure 7.4). At 400 nm, a C2Cl4 refractive indexof 1.53 is determined by a McLaurin expression fitted to experi-mental literature data (figure 7.3, open circles).27 Unfortunately,the experimental data only range between 0.6 and 8.3 µm, render-ing the value at 400 nm more uncertain than in the case of CCl4(experimental data range: 0.4–15 µm). Nevertheless, based onthis value, we calculate an absorption coefficient of 2.273 105 cm−1.This implies an increase of 12%, which agrees well with the 8%increase observed experimentally.
122
7.3. The Q-PbSe absorption coefficient
7.3.2 Absorption coefficient at the band gap
Literature data are less consistent with respect to the molar extinc-tion coefficient of colloidal nanocrystals at the band gap.12–17,28
Expanding the procedure used by Cademartiri et al.,17 we calcu-late an energy integrated molar extinction coefficient εgap,eV forthe band gap transition, by doubling the integrated low energy halfof the first absorption peak. By using the integrated value insteadof the peak value, we avoid the need to calibrate the absorbancefor samples with markedly different size dispersions. Figure 7.5(a)shows the size-dependence of the energy integrated molar extinc-tion coefficient, for the ICP-MS samples (dots) and samples forwhich we calculated the concentration using the molar extinctioncoefficient ε400 (open circles). Fitting a power law through theexperimental data yields (d in nm):
εgap,eV = 3.1d0.9 (cm−1meV) (7.18)
As the error on the exponent is equal to 0.1, we can conclude thatan approximately linear increase of εgap,eV with size is found.
As an alternative, one could take the wavelength as the vari-able of integration. Because the absorbance peak is narrow, theresulting wavelength integrated extinction coefficient, εgap,λ is re-lated to εgap,eV through the sizing curve E0:
εgap,λ =hc
eE0(d)2εgap,eV (7.19)
As confirmed by Figure 7.5(b), the above relation implies thatεgap,λ and εgap,eV have a different size dependence. This showsthat the different results on the size dependence of the molar ex-tinction coefficient reported in the literature12–17,28 may be dueto the method used to calculate it. From εgap,eV , the (energy)integrated absorption coefficient µgap is derived in a similar wayas µ400. Figure 7.5(c) shows µgap as a function of size. In con-trast with the absorption coefficient at high energy, µgap is notsize-independent. A one-parameter fit yields:
µgap = 1.85 107.d−2 (cm−1meV) (7.20)
123
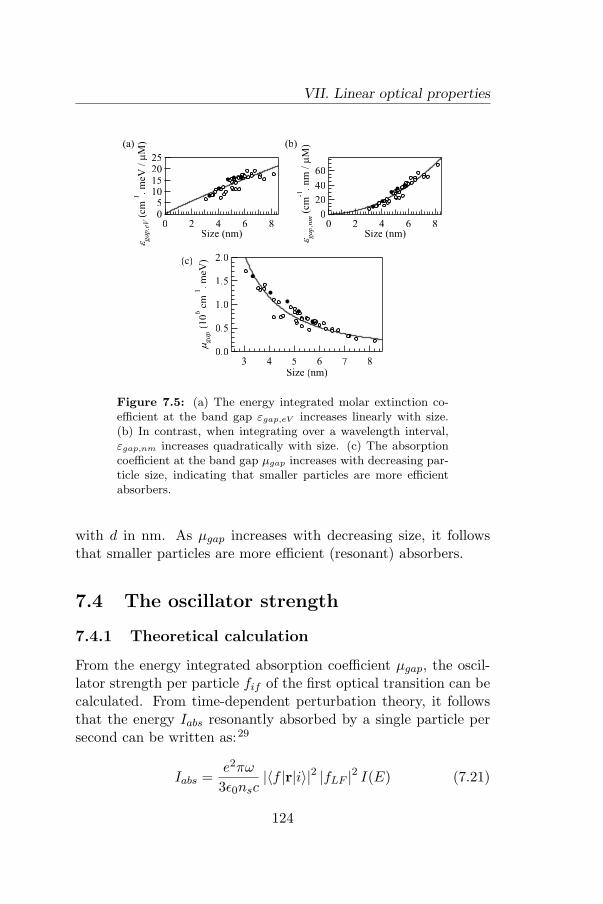
VII. Linear optical properties
2.0
1.5
1.0
0.5
0.0
mgap (
10
6 c
m-1
. m
eV)
876543Size (nm)
(c)
60
40
20
0
egap,nm
(cm
-1.
nm
/ m
M)
86420Size (nm)
(b)
2520151050
egap,eV (
cm-1
. m
eV /
mM
)
86420Size (nm)
(a)
Figure 7.5: (a) The energy integrated molar extinction co-efficient at the band gap εgap,eV increases linearly with size.(b) In contrast, when integrating over a wavelength interval,εgap,nm increases quadratically with size. (c) The absorptioncoefficient at the band gap µgap increases with decreasing par-ticle size, indicating that smaller particles are more efficientabsorbers.
with d in nm. As µgap increases with decreasing size, it followsthat smaller particles are more efficient (resonant) absorbers.
7.4 The oscillator strength
7.4.1 Theoretical calculation
From the energy integrated absorption coefficient µgap, the oscil-lator strength per particle fif of the first optical transition can becalculated. From time-dependent perturbation theory, it followsthat the energy Iabs resonantly absorbed by a single particle persecond can be written as:29
Iabs =e2πω
3ε0nsc|〈f |r|i〉|2 |fLF |2 I(E) (7.21)
124
7.4. The oscillator strength
Here, ε0 denotes the electric constant, |i〉 and |f〉 denote the ini-tial and final state of the system, I(E) is the light intensity perunit photon energy and E = ~ω is the energy of the resonantlyabsorbed photons. Using the momentum-position relation, theoscillator strength fif of the transition from |i〉 to |f〉 is given by:
fif =2meω
3~|〈f |r|i〉|2 (7.22)
With me the free electron mass. Consequently, we can write Iabs
as:
Iabs =e2π~
2meε0nscfif |fLF |2 I(E) (7.23)
We write the concentration of quantum dots absorbing photonswith energy between E and E + dE as c(E)dE. In that case, theinfinitesimal light intensity loss dI(E) in a slice of suspension withunit surface area and thickness dL by absorption of photons withenergy between E and E + dE is given by:
dI(E) = c(E)NAIabs dL (7.24)
Using expression 7.23 for the absorbed energy per particle, weobtain:
1I(E)
dI(E)dL
= c(E)π
2e2~NA |fLF |2
meε0nscfif (7.25)
The left hand side corresponds to ln(10)A(E)L−1, where A(E) isthe measured absorbance of the suspension in the energy range[E,E + dE] and L is the sample length. Hence, we can write:
A(E) = Lc(E)π
2 ln(10)e2~NA |fLF |2
meε0nscfif (7.26)
Integrating the left hand and the right hand side over the photonenergy (in eV), and assuming that the oscillator strength is con-stant in the narrow energy range of the first exciton transition, weobtain: ∫
A(E)dE = Lc0π
2 ln(10)e~NA |fLF |2
meε0nscfif (7.27)
125
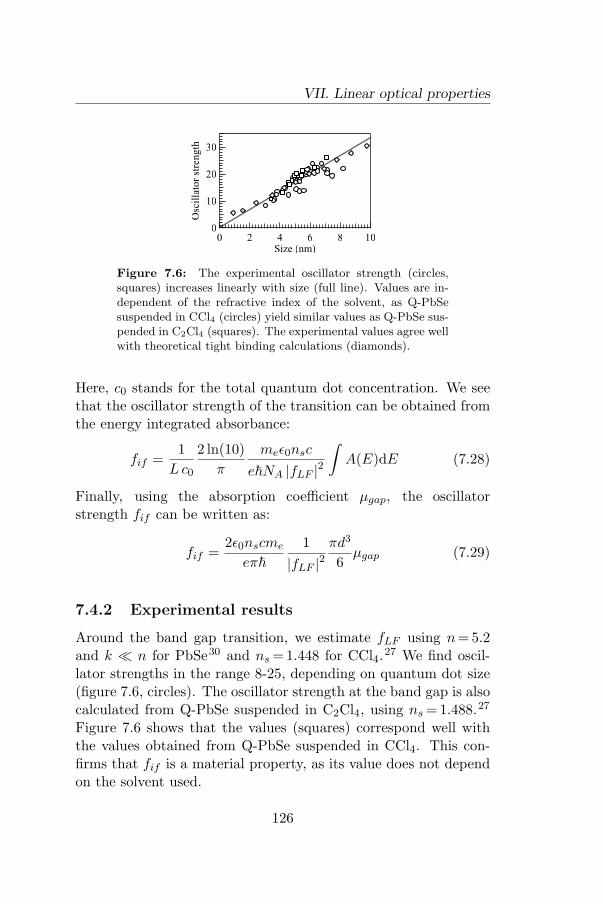
VII. Linear optical properties
30
20
10
0
Osc
illa
tor
stre
ngth
1086420Size (nm)
Figure 7.6: The experimental oscillator strength (circles,squares) increases linearly with size (full line). Values are in-dependent of the refractive index of the solvent, as Q-PbSesuspended in CCl4 (circles) yield similar values as Q-PbSe sus-pended in C2Cl4 (squares). The experimental values agree wellwith theoretical tight binding calculations (diamonds).
Here, c0 stands for the total quantum dot concentration. We seethat the oscillator strength of the transition can be obtained fromthe energy integrated absorbance:
fif =1
Lc0
2 ln(10)π
meε0nsc
e~NA |fLF |2
∫A(E)dE (7.28)
Finally, using the absorption coefficient µgap, the oscillatorstrength fif can be written as:
fif =2ε0nscme
eπ~1
|fLF |2πd3
6µgap (7.29)
7.4.2 Experimental results
Around the band gap transition, we estimate fLF using n = 5.2and k � n for PbSe30 and ns =1.448 for CCl4.27 We find oscil-lator strengths in the range 8-25, depending on quantum dot size(figure 7.6, circles). The oscillator strength at the band gap is alsocalculated from Q-PbSe suspended in C2Cl4, using ns =1.488.27
Figure 7.6 shows that the values (squares) correspond well withthe values obtained from Q-PbSe suspended in CCl4. This con-firms that fif is a material property, as its value does not dependon the solvent used.
126

7.5. Comparison with Q-PbS
It is therefore more relevant to compare the experimental os-cillator strength with theory than for instance the absorption co-efficient. The experimental values show a good agreement withtight binding calculations of the oscillator strength (figure 7.6,diamonds).10 While the effective mass approximation predicts asize-independent oscillator strength per particle,31,32 both the ex-perimental and theoretical data show that fif scales linearly withthe nanocrystal size. Note that the theoretical oscillator strengthsare plotted as a function of an effective Q-PbSe size, determinedfrom the calculated band gap using the sizing curve (equation2.1). This way, experimental and theoretical results are comparedon the basis of a similar band gap.
The fact that fif exceeds 1 for Q-PbSe does not violate theThomas-Reiche-Kuhn sum rule (also called f-sum rule). First, theupper valence band level of Q-PbSe is 8-fold degenerate, whichmeans that summing the oscillator strength over all final one-electron states should give a value of 8. Second, the upper valenceband level is not the lowest energy one electron state. As a conse-quence, the Thomas-Reiche-Kuhn sum contains negative terms aswell, and the value of an individual oscillator strength may exceedthe sum of all oscillator strengths.
7.5 Comparison with Q-PbS
7.5.1 Q-PbS absorption coefficient at high energies
The Q-PbS extinction coefficient was determined from four Q-PbS suspensions in C2Cl4. The dependence of ε400 on thenanocrystal volume already demonstrated that the Q-PbS op-tical properties are not influenced by quantum confinement atthese wavelengths. Using equation 7.17, we calculate the cor-responding Q-PbS absorption coefficient. On average, we find:µ400 =1.696 105 cm−1. The theoretical Q-PbS absorption coef-ficient is again given by equation 7.14. Using bulk PbS valuesn =3.96 and k =3.34,33 and a C2Cl4 refractive index ns =1.53,27
we obtain: µ=1.710 105 cm−1. Both values differ by less than 1%,
127
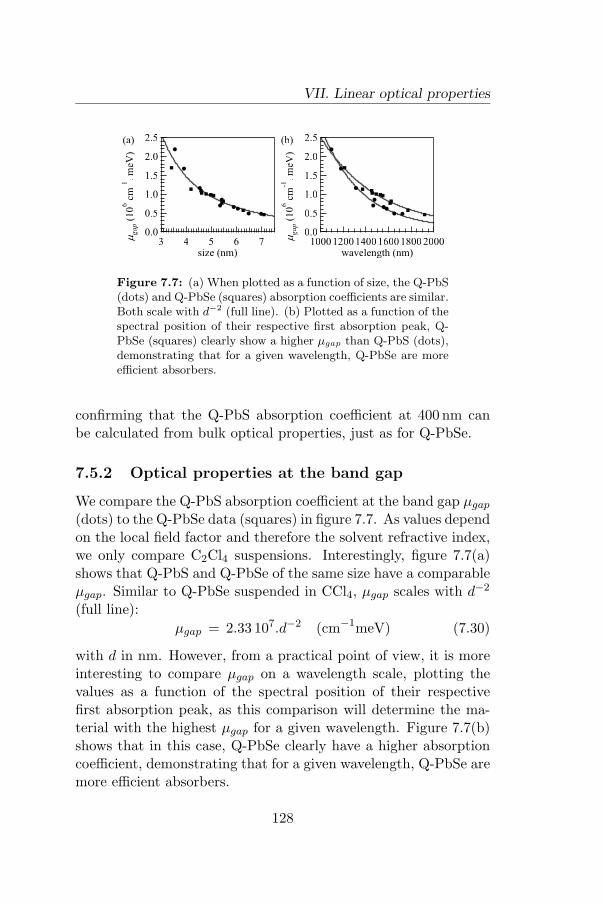
VII. Linear optical properties
2.5
2.0
1.5
1.0
0.5
0.0
mgap (
10
6 c
m-1
. m
eV)
200018001600140012001000wavelength (nm)
(b)2.5
2.0
1.5
1.0
0.5
0.0
mgap (
10
6 c
m-1
. m
eV)
76543size (nm)
(a)
Figure 7.7: (a) When plotted as a function of size, the Q-PbS(dots) and Q-PbSe (squares) absorption coefficients are similar.Both scale with d−2 (full line). (b) Plotted as a function of thespectral position of their respective first absorption peak, Q-PbSe (squares) clearly show a higher µgap than Q-PbS (dots),demonstrating that for a given wavelength, Q-PbSe are moreefficient absorbers.
confirming that the Q-PbS absorption coefficient at 400 nm canbe calculated from bulk optical properties, just as for Q-PbSe.
7.5.2 Optical properties at the band gap
We compare the Q-PbS absorption coefficient at the band gap µgap
(dots) to the Q-PbSe data (squares) in figure 7.7. As values dependon the local field factor and therefore the solvent refractive index,we only compare C2Cl4 suspensions. Interestingly, figure 7.7(a)shows that Q-PbS and Q-PbSe of the same size have a comparableµgap. Similar to Q-PbSe suspended in CCl4, µgap scales with d−2
(full line):µgap = 2.33 107.d−2 (cm−1meV) (7.30)
with d in nm. However, from a practical point of view, it is moreinteresting to compare µgap on a wavelength scale, plotting thevalues as a function of the spectral position of their respectivefirst absorption peak, as this comparison will determine the ma-terial with the highest µgap for a given wavelength. Figure 7.7(b)shows that in this case, Q-PbSe clearly have a higher absorptioncoefficient, demonstrating that for a given wavelength, Q-PbSe aremore efficient absorbers.
128
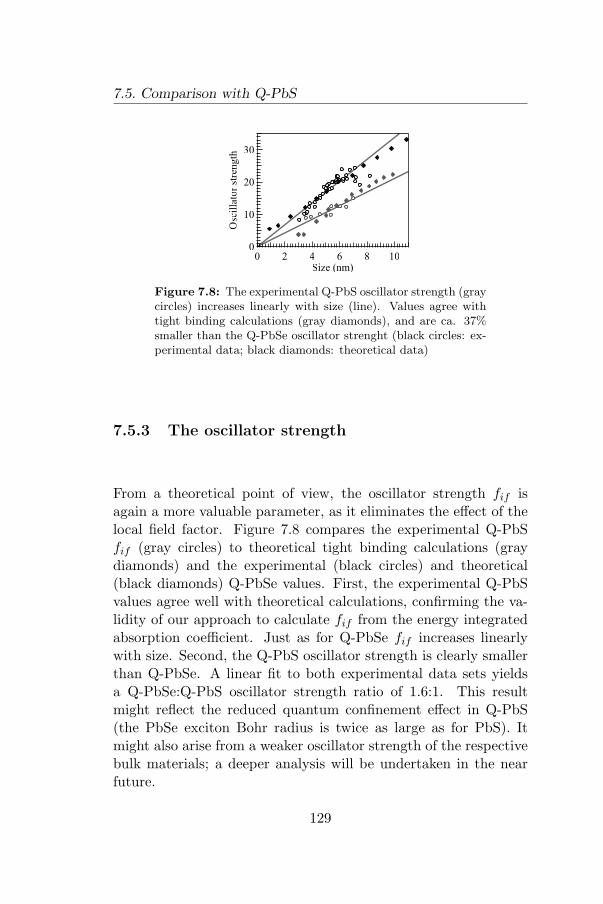
7.5. Comparison with Q-PbS
30
20
10
0
Osc
illa
tor
stre
ngth
1086420Size (nm)
Figure 7.8: The experimental Q-PbS oscillator strength (graycircles) increases linearly with size (line). Values agree withtight binding calculations (gray diamonds), and are ca. 37%smaller than the Q-PbSe oscillator strenght (black circles: ex-perimental data; black diamonds: theoretical data)
7.5.3 The oscillator strength
From a theoretical point of view, the oscillator strength fif isagain a more valuable parameter, as it eliminates the effect of thelocal field factor. Figure 7.8 compares the experimental Q-PbSfif (gray circles) to theoretical tight binding calculations (graydiamonds) and the experimental (black circles) and theoretical(black diamonds) Q-PbSe values. First, the experimental Q-PbSvalues agree well with theoretical calculations, confirming the va-lidity of our approach to calculate fif from the energy integratedabsorption coefficient. Just as for Q-PbSe fif increases linearlywith size. Second, the Q-PbS oscillator strength is clearly smallerthan Q-PbSe. A linear fit to both experimental data sets yieldsa Q-PbSe:Q-PbS oscillator strength ratio of 1.6:1. This resultmight reflect the reduced quantum confinement effect in Q-PbS(the PbSe exciton Bohr radius is twice as large as for PbS). Itmight also arise from a weaker oscillator strength of the respectivebulk materials; a deeper analysis will be undertaken in the nearfuture.
129
VII. Linear optical properties
7.6 Conclusions
In order to quantify the optical properties of colloidal nanocrys-tals, the absorption coefficient is calculated from the absorbancespectrum. We demonstrate that, at high energies, µ400 is size-independent for both Q-PbSe and Q-PbS. This reveals that op-tical properties are bulk-like at these wavelengths. We compareexperimental results to theoretical calculations, derived using aMaxwell-Garnett model of small dielectric particles dispersed in atransparent dielectric host. At short wavelengths, the Qdot ab-sorption coefficient is well described by the theoretical results, ob-tained using the bulk semiconductor refractive index n and extinc-tion coefficient k, and the solvent refractive index ns. This con-firms the absence of quantum confinement at these wavelengths.
In contrast, the energy integrated absorption coefficient at theband gap shows a strong size-dependence. For both Q-PbS andQ-PbSe, we can conclude that smaller particles are more efficientabsorbers. From a practical point of view however, when com-paring nanocrystals having the same band gap, Q-PbSe possess ahigher µgap than Q-PbS.
The experimental oscillator strength, derived from µgap, showsa linear increase with size, in contrast with earlier results predict-ing a size-independent fif . The experimental values agree wellwith theoretical tight-binding calculations, and reveal that the Q-PbS fif is slightly reduced (by ca. 37%) with respect to Q-PbSevalues.
The MG model and corresponding calculations presented inthis chapter are applied to colloidal lead chalcogenide nanocrys-tals, but are generally valid. Consequently, a robust method tocalculate the absorption coefficient and oscillator strength is pre-sented here, which should allow for the quantitative comparison ofa whole range of semiconductor nanocrystal materials and sizes.
130

Chapter VIII
The dielectric function ofcolloidal lead chalcogenidenanocrystals
8.1 Interpretation of the Qdot absorptionspectrum
8.1.1 Importance of the local field factor
The starting point in chapter VII, the Maxwell-Garnett model,has proved to accurately describe the absorption coefficient µ ofsmall spherical particles dispersed in a dielectric medium. Com-paring the absorption coefficient for different Q-PbSe suspensionsin CCl4 with µ calculated using the bulk PbSe values for n andk 26,30 and the CCl4 refractive index ns
27 (figure 8.1), we observethe well-known effect of quantum confinement: the band gap (E0)transition, situated at the L point in the Brillouin zone, and theE1 transition, along the Σ direction, are both shifted to higher en-ergies. From 2.5 eV (500 nm) onward however, all curves coincide.This has lead us to two conclusions. First, at these short wave-lengths, n and k for bulk PbSe and Q-PbSe are identical, whichsuggests that high-energy transitions (in the visible and near-UV,essentially the E2 and E3 transitions along the ∆ direction) in
131
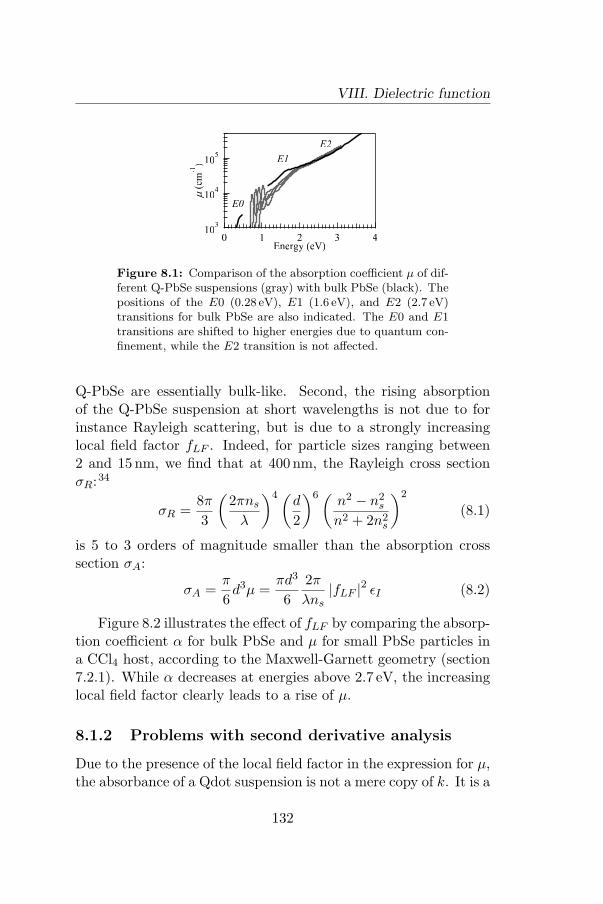
VIII. Dielectric function
103
104
105
m (
cm-1
)
43210Energy (eV)
E0
E1
E2
Figure 8.1: Comparison of the absorption coefficient µ of dif-ferent Q-PbSe suspensions (gray) with bulk PbSe (black). Thepositions of the E0 (0.28 eV), E1 (1.6 eV), and E2 (2.7 eV)transitions for bulk PbSe are also indicated. The E0 and E1transitions are shifted to higher energies due to quantum con-finement, while the E2 transition is not affected.
Q-PbSe are essentially bulk-like. Second, the rising absorptionof the Q-PbSe suspension at short wavelengths is not due to forinstance Rayleigh scattering, but is due to a strongly increasinglocal field factor fLF . Indeed, for particle sizes ranging between2 and 15 nm, we find that at 400 nm, the Rayleigh cross sectionσR:34
σR =8π
3
(2πns
λ
)4(d
2
)6( n2 − n2s
n2 + 2n2s
)2
(8.1)
is 5 to 3 orders of magnitude smaller than the absorption crosssection σA:
σA =π
6d3µ =
πd3
62π
λns|fLF |2 εI (8.2)
Figure 8.2 illustrates the effect of fLF by comparing the absorp-tion coefficient α for bulk PbSe and µ for small PbSe particles ina CCl4 host, according to the Maxwell-Garnett geometry (section7.2.1). While α decreases at energies above 2.7 eV, the increasinglocal field factor clearly leads to a rise of µ.
8.1.2 Problems with second derivative analysis
Due to the presence of the local field factor in the expression for µ,the absorbance of a Qdot suspension is not a mere copy of k. It is a
132

8.1. Interpretation of the Qdot absorption spectrum
0.0
0.5
1.0
1.5
a / µ
(1
06 c
m-1
)
4.54.03.53.02.52.01.5
Energy (eV)
10
5
0
-5
Sec. d
er. (10
6 cm-1/eV
2)
x8
Figure 8.2: Top: Absorption coefficient α (diamonds) forbulk PbSe and corresponding µ for PbSe particles in CCl4(squares). Due to fLF , µ continues to rise at energies above2.7 eV. Bottom: Second derivative of α (diamonds) and µ(squares, 8 times enlarged). The 1.6 eV dip is blue shiftedby 50 meV and the 2.7 eV dip has vanished in the case of µ.
rather complex combination of n and k. This introduces difficultieswhen performing a detailed assignment of the absorption peaks totransitions between the quantum dot energy levels through secondderivative analysis.17,35–37 Although it increases feature resolutionand improves the comparison of experiment with theory in bulk-like absorption spectra, it cannot be used in our case, as µ alsodepends on n, in contrast with α.
To assess the meaning of second derivative analysis, we willconsider the case of a discrete transition (like the first excitontransition) and that of a bulk-like transition (like those above2.5 eV in the case of PbSe) for a Qdot suspension with a certainsize dispersion. In order to understand the absorbance A(E) of aQdot suspension at a given energy E, we introduce the concentra-tion distribution c(E) and the molar extinction coefficient ε(E, E).These quantities have the following meaning: the product c(E)dEyields the concentration of Qdots with a transition energy in therange [E , E + dE ], and ε(E, E) gives the extinction coefficient at Eof Qdots with a transition energy E . With these definitions, A(E)can be written as:
A(E) =∫
ε(E, E)c(E)dE (8.3)
133
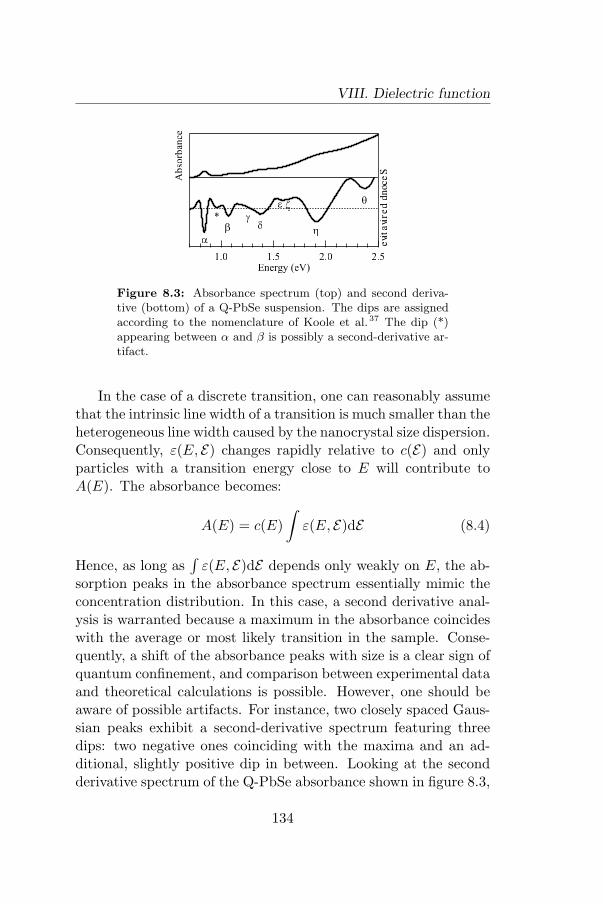
VIII. Dielectric function
Ab
sorb
ance
2.52.01.51.0Energy (eV)
Seco
nd d
erivativ
ea
b
* gd
e q
h
z
Figure 8.3: Absorbance spectrum (top) and second deriva-tive (bottom) of a Q-PbSe suspension. The dips are assignedaccording to the nomenclature of Koole et al.37 The dip (*)appearing between α and β is possibly a second-derivative ar-tifact.
In the case of a discrete transition, one can reasonably assumethat the intrinsic line width of a transition is much smaller than theheterogeneous line width caused by the nanocrystal size dispersion.Consequently, ε(E, E) changes rapidly relative to c(E) and onlyparticles with a transition energy close to E will contribute toA(E). The absorbance becomes:
A(E) = c(E)∫
ε(E, E)dE (8.4)
Hence, as long as∫
ε(E, E)dE depends only weakly on E, the ab-sorption peaks in the absorbance spectrum essentially mimic theconcentration distribution. In this case, a second derivative anal-ysis is warranted because a maximum in the absorbance coincideswith the average or most likely transition in the sample. Conse-quently, a shift of the absorbance peaks with size is a clear sign ofquantum confinement, and comparison between experimental dataand theoretical calculations is possible. However, one should beaware of possible artifacts. For instance, two closely spaced Gaus-sian peaks exhibit a second-derivative spectrum featuring threedips: two negative ones coinciding with the maxima and an ad-ditional, slightly positive dip in between. Looking at the secondderivative spectrum of the Q-PbSe absorbance shown in figure 8.3,
134
8.1. Interpretation of the Qdot absorption spectrum
this is exactly what one gets between the first and the second ab-sorption peak.
A different reasoning applies to bulk-like transitions. In thatcase, the extinction coefficient ε(E, E) is independent of nanocrys-tal size and will be a function of E only. The absorbance becomes(c0 is the total Qdot concentration):
A(E) = ε(E)∫
c(E)dE = ε(E)c0 (8.5)
Now, the absorbance of a Qdot suspension at a given energy E isdirectly proportional to the total Qdot concentration, and its sec-ond derivative spectrum will correspond to the second derivativespectrum of ε(E), or equivalently µ(E). At this point, the use ofsecond derivative analysis becomes problematic because µ(E) isnot a direct copy of the spectrum of electronic transitions, due tofLF . We can illustrate this point by considering the absorptionspectrum and second derivative of bulk PbSe at high energies.For bulk PbSe, it is known that α shows pronounced peaks at1.6 and 2.7 eV (E1 and E2 transition, respectively). As shown infigure 8.2, in contrast with the second derivative of α, the secondderivative of µ does not reproduce these features. The 1.6 eV dipis shifted by 50meV to higher energies, the 2.7 eV dip has van-ished and a spurious dip appears at 4.1 eV. Hence, with bulk-liketransitions, the use of second derivative analysis of the Qdot ab-sorption spectrum to magnify features in the absorption coefficientis problematic and should be avoided.
The local field effect can be removed however, by a calculationof the nanocrystal dielectric function ε. In the next sections, wewill show how we can obtain ε from the nanocrystal absorptioncoefficient µ. Although we will not aim for a second derivativeanalysis of the resulting spectra, we will show that ε yields valuableinformation regarding the assignment of the absorption peaks, notonly with respect to the determination of their spectral position,but also with respect to their oscillator strength.
135
VIII. Dielectric function
8.2 The Kramers–Kronig relations
8.2.1 Introduction
Typically, the refractive index n and extinction coefficient k, orequivalently the real and imaginary part of the dielectric functionε, of bulk materials can be determined from a Kramers-Kronig(KK) analysis of the absorption coefficient α, measured with ab-sorbance spectroscopy. k is directly related to α, and if k can bedetermined over a wide enough spectral range, n can be calcu-lated (section 7.2.1). However, in the case of a colloidal nanocrys-tal suspension, matters are more complicated, as the absorptioncoefficient is determined by both n and k simultaneously. In thissection, we will show how this issue is resolved, allowing for thedetermination of the real and imaginary part of ε and correspond-ing n and k over the entire spectral range (from energies belowthe band gap to energies far above).
8.2.2 Continuous KK-relations
The KK-relations are a consequence of causality, which in sim-ple terms states that a system cannot respond before an input isgiven. In the framework of optical properties, this implies thatthe polarization of a material P cannot precede the electric fieldE by which it is caused.
Both are related through the susceptibility χe: P = χeE.A rigorous analysis, performed in the frequency domain, ofχe(ω) =χR(ω) + i χI(ω) yields following conditions for causal-ity:
χR(ω) =2π
P
∫ ∞
0
ω′χI(ω′)ω′2 − ω2
dω′
χI(ω) = −2ω
πP
∫ ∞
0
χR(ω′)ω′2 − ω2
dω′ (8.6)
where P stands for the Cauchy principal value. In these equa-tions, called the Kramers-Kronig relations, the reality conditionis already taken into account as well. It states that, as χe(t) is
136
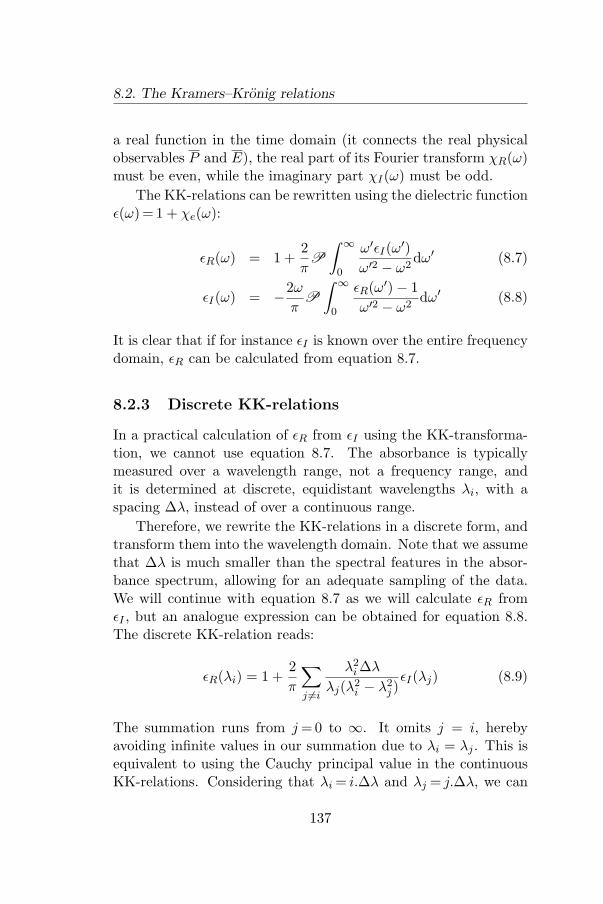
8.2. The Kramers–Kronig relations
a real function in the time domain (it connects the real physicalobservables P and E), the real part of its Fourier transform χR(ω)must be even, while the imaginary part χI(ω) must be odd.
The KK-relations can be rewritten using the dielectric functionε(ω) = 1 + χe(ω):
εR(ω) = 1 +2π
P
∫ ∞
0
ω′εI(ω′)ω′2 − ω2
dω′ (8.7)
εI(ω) = −2ω
πP
∫ ∞
0
εR(ω′)− 1ω′2 − ω2
dω′ (8.8)
It is clear that if for instance εI is known over the entire frequencydomain, εR can be calculated from equation 8.7.
8.2.3 Discrete KK-relations
In a practical calculation of εR from εI using the KK-transforma-tion, we cannot use equation 8.7. The absorbance is typicallymeasured over a wavelength range, not a frequency range, andit is determined at discrete, equidistant wavelengths λi, with aspacing ∆λ, instead of over a continuous range.
Therefore, we rewrite the KK-relations in a discrete form, andtransform them into the wavelength domain. Note that we assumethat ∆λ is much smaller than the spectral features in the absor-bance spectrum, allowing for an adequate sampling of the data.We will continue with equation 8.7 as we will calculate εR fromεI , but an analogue expression can be obtained for equation 8.8.The discrete KK-relation reads:
εR(λi) = 1 +2π
∑j 6=i
λ2i ∆λ
λj(λ2i − λ2
j )εI(λj) (8.9)
The summation runs from j =0 to ∞. It omits j = i, herebyavoiding infinite values in our summation due to λi = λj . This isequivalent to using the Cauchy principal value in the continuousKK-relations. Considering that λi = i.∆λ and λj = j.∆λ, we can
137
VIII. Dielectric function
2.0
1.5
1.0
0.5
0.0
eR
5004003002001000Wavelength
(b)2.0
1.5
1.0
0.5
0.0
eI
5004003002001000Wavelength
(a)
Figure 8.4: (a) Imaginary part of the dielectric function ofa virtual material exhibiting two Lorentz peaks. The full lineshows the continuous data, the circles represent εI evaluatedat 500 discrete wavelengths. (b) Real part of the dielectricfunction, calculated from the continuous KK-relations 8.7 (fullline) and the discrete KK-relations 8.10 (circles). The agree-ment shows that the discrete KK-relations are valid, even whentaking the summation over a finite wavelength interval, whenextending it well into the transparent region (εI = 0).
simplify equation 8.9 into:
εR(i) = 1 +2π
∑j 6=i
i2
j(i2 − j2)εI(j) (8.10)
Interestingly, we obtain a generic equation stating that, if εI isknown for an (in theory) infinite set of equidistant wavelengths, εR
can be calculated, independent of ∆λ. We can rephrase equation8.10 in a more convenient matrix formalism, writing εR and εI ascolumn vectors:
εR = 1 +2π
A.εI
with Ai,j =i2
j(i2 − j2)Ai,i = 0 (8.11)
To demonstrate that our approach is valid, figure 8.4(a) showsεI for a virtual material, exhibiting two Lorentz peaks, plottedon a wavelength scaling (denoted the TLP particle). On top ofthe continuous data, we show the discrete data (500 data points
138
8.2. The Kramers–Kronig relations
are used). The continuous data are transformed using equation8.7, the discrete data using equation 8.10, albeit that we nowconsider a sum over the finite wavelength range shown in figure8.4. As εR coincides for both techniques, we can conclude that thediscrete KK-transformation indeed provides an accurate methodto calculate εR. In addition, we show that the infinite sum can bereplaced by a finite one, at least when extending the wavelengthrange well into the transparent region (εI =0).
8.2.4 Calculation of the dielectric function:Iterative Matrix Inversion method
Knowing how to calculate εR at a given wavelength from εI (knownat all other wavelengths), we now return to the expression 7.14for the absorption coefficient, written in terms of the dielectricfunction of the nanocrystal εR and εI , and the refractive index ofthe solvent ns, at a given wavelength λi:
µ =2π
λins
9n4s
(εR + 2n2s)2 + ε2I
εI (8.12)
For clarity, the index (i) is omitted, but we keep in mind thatthis equation is valid at any given λi. The direct calculation of εI
from µ, at N given wavelengths, requires solving 2N equations (Ngiven by 8.12, and N given by 8.10), N of which are of the fourthorder in εR and quadratic in εI .
Instead of attempting the huge task of a direct calculation of ε,we therefore develop an iterative approach to solve the problem.The goal of the procedure is to find an εI which, in combina-tion with εR calculated from the KK-relations, yields the correctabsorption coefficient µ, with ns known from independent mea-surements.
Starting from a trial function εI,0, we calculate εR,0 using equa-tion 8.10. Both then yield an initial estimate of the absorptioncoefficient µ0 from equation 8.12 (obviously, µ0 6= µ). Using the
139
VIII. Dielectric function
equalities:
εI = εI,0 + ∆εI
εR = εR,0 + ∆εR (8.13)
with ∆εI and ∆εR the difference between the trial function andthe true values, we can then rewrite equation 8.12 into:
µ =2π
λns
9n4s
((εR,0 + ∆εR) + 2n2s)2 + (εI,0 + ∆εI)2
(εI,0 + ∆εI)
(8.14)A first order Taylor series expansion yields following equation:
µ
µ0− 1 =
(1
εI,0−
2εI,0
(εR,0 + 2n2s)2 + ε2I,0
)∆εI
−2(εR,0 + 2n2
s
)(εR,0 + 2n2
s)2 + ε2I,0
∆εR (8.15)
This equation, although only correct up to a first order, is linearin ∆εI and ∆εR. Using the matrix formalism, we can rewrite thisinto:
M = C∆εI + D∆εR (8.16)
with:
Mi =µ
µ0− 1
Ci,i =
(1
εI,0−
2εI,0
(εR,0 + 2n2s)2 + ε2I,0
)
Di,i = −2(εR,0 + 2n2
s
)(εR,0 + 2n2
s)2 + ε2I,0
Ci,j = Di,j = 0 (8.17)
Just as for the dielectric function ε, the change ∆ε must obeya similar discrete KK-relation (written in the matrix formalism):
∆εR =π
2A∆εI (8.18)
140

8.2. The Kramers–Kronig relations
eI,0
eI,k KK e
R,k MG mk
Conv?
c < 10-6
MIDeI
eI,k+1
= eI,k
+ DeI
eI , e
R
START
SOLUTION
LOOP
no yes
Figure 8.5: Schematic representation of the iterative matrixinversion method. Starting from a trial function εI,0, the di-electric function is iteratively optimized until the calculatedabsorption coefficient µk equals the experimental data.
With the matrix elements of A already defined in equation 8.11.Combination of 8.16 and 8.18 allows us to easily calculate ∆εI byfollowing matrix inversion:
∆εI = (C +π
2DA)−1M (8.19)
As already stated, due to the Taylor expansion, the correctedtrial function εI,1 = εI,0 + ∆εI does not yet lead to an absorptioncoefficient µ1 equal to µ. However, by iterating the procedureoutlined above, the absorption coefficient calculated at each stepµk will eventually converge to µ. The iteration is halted once theroot-mean-square error χ:
χ =
√√√√√√N∑
i=1
(µk(i)− µ(i))2
N(8.20)
is reduced to values below 10−6.The iterative matrix inversion (IMI) method is summarized
in figure 8.5. We start from our trial function εI,0. In the loop,
141
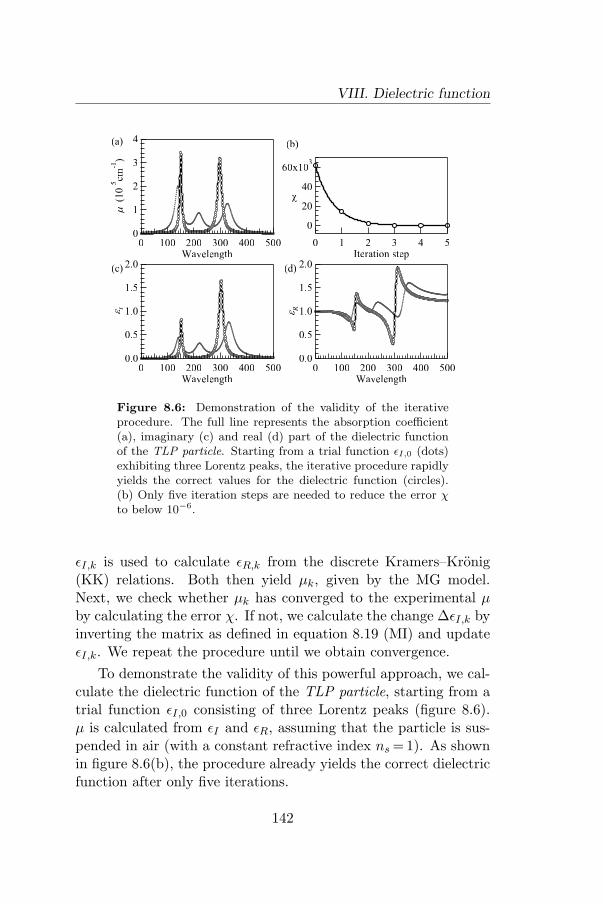
VIII. Dielectric function
2.0
1.5
1.0
0.5
0.0
eR
5004003002001000Wavelength
(d)
4
3
2
1
0
m
(10 5
cm-1
)
5004003002001000Wavelength
(a)
2.0
1.5
1.0
0.5
0.0
eI
5004003002001000Wavelength
(c)
60x103
40
20
0
c
543210Iteration step
(b)
Figure 8.6: Demonstration of the validity of the iterativeprocedure. The full line represents the absorption coefficient(a), imaginary (c) and real (d) part of the dielectric functionof the TLP particle. Starting from a trial function εI,0 (dots)exhibiting three Lorentz peaks, the iterative procedure rapidlyyields the correct values for the dielectric function (circles).(b) Only five iteration steps are needed to reduce the error χto below 10−6.
εI,k is used to calculate εR,k from the discrete Kramers–Kronig(KK) relations. Both then yield µk, given by the MG model.Next, we check whether µk has converged to the experimental µby calculating the error χ. If not, we calculate the change ∆εI,k byinverting the matrix as defined in equation 8.19 (MI) and updateεI,k. We repeat the procedure until we obtain convergence.
To demonstrate the validity of this powerful approach, we cal-culate the dielectric function of the TLP particle, starting from atrial function εI,0 consisting of three Lorentz peaks (figure 8.6).µ is calculated from εI and εR, assuming that the particle is sus-pended in air (with a constant refractive index ns =1). As shownin figure 8.6(b), the procedure already yields the correct dielectricfunction after only five iterations.
142
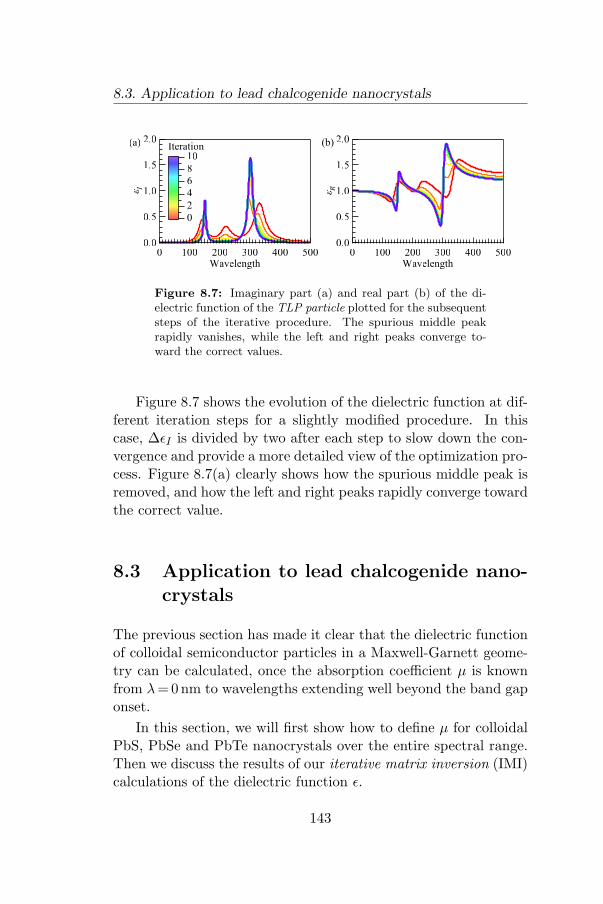
8.3. Application to lead chalcogenide nanocrystals
2.0
1.5
1.0
0.5
0.0
eR
5004003002001000Wavelength
(b)2.0
1.5
1.0
0.5
0.0
eI
5004003002001000Wavelength
10
8
6
4
2
0
Iteration(a)
Figure 8.7: Imaginary part (a) and real part (b) of the di-electric function of the TLP particle plotted for the subsequentsteps of the iterative procedure. The spurious middle peakrapidly vanishes, while the left and right peaks converge to-ward the correct values.
Figure 8.7 shows the evolution of the dielectric function at dif-ferent iteration steps for a slightly modified procedure. In thiscase, ∆εI is divided by two after each step to slow down the con-vergence and provide a more detailed view of the optimization pro-cess. Figure 8.7(a) clearly shows how the spurious middle peak isremoved, and how the left and right peaks rapidly converge towardthe correct value.
8.3 Application to lead chalcogenide nano-crystals
The previous section has made it clear that the dielectric functionof colloidal semiconductor particles in a Maxwell-Garnett geome-try can be calculated, once the absorption coefficient µ is knownfrom λ = 0nm to wavelengths extending well beyond the band gaponset.
In this section, we will first show how to define µ for colloidalPbS, PbSe and PbTe nanocrystals over the entire spectral range.Then we discuss the results of our iterative matrix inversion (IMI)calculations of the dielectric function ε.
143
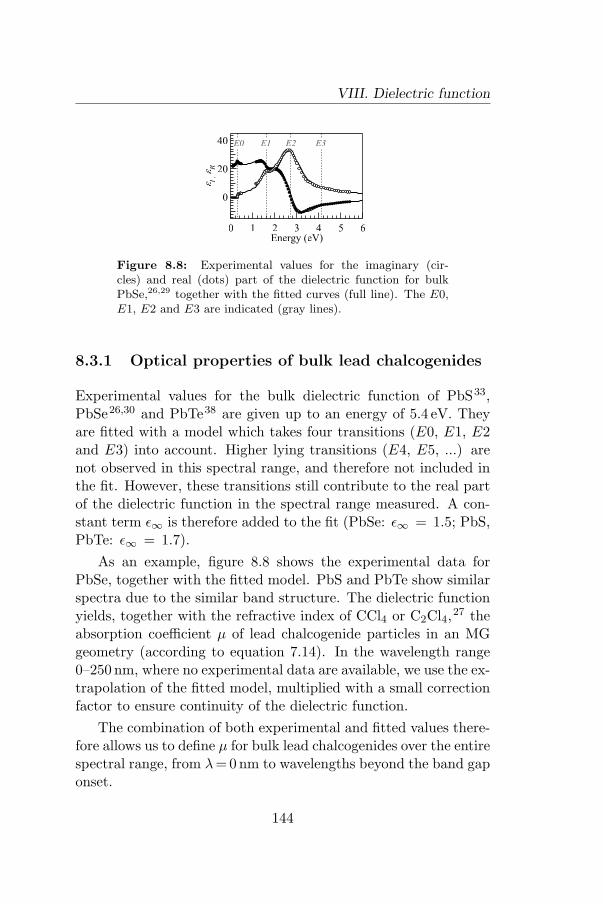
VIII. Dielectric function
40
20
0eI
, eR
6543210Energy (eV)
E0 E1 E2 E3
Figure 8.8: Experimental values for the imaginary (cir-cles) and real (dots) part of the dielectric function for bulkPbSe,26,29 together with the fitted curves (full line). The E0,E1, E2 and E3 are indicated (gray lines).
8.3.1 Optical properties of bulk lead chalcogenides
Experimental values for the bulk dielectric function of PbS33,PbSe26,30 and PbTe38 are given up to an energy of 5.4 eV. Theyare fitted with a model which takes four transitions (E0, E1, E2and E3) into account. Higher lying transitions (E4, E5, ...) arenot observed in this spectral range, and therefore not included inthe fit. However, these transitions still contribute to the real partof the dielectric function in the spectral range measured. A con-stant term ε∞ is therefore added to the fit (PbSe: ε∞ = 1.5; PbS,PbTe: ε∞ = 1.7).
As an example, figure 8.8 shows the experimental data forPbSe, together with the fitted model. PbS and PbTe show similarspectra due to the similar band structure. The dielectric functionyields, together with the refractive index of CCl4 or C2Cl4,27 theabsorption coefficient µ of lead chalcogenide particles in an MGgeometry (according to equation 7.14). In the wavelength range0–250 nm, where no experimental data are available, we use the ex-trapolation of the fitted model, multiplied with a small correctionfactor to ensure continuity of the dielectric function.
The combination of both experimental and fitted values there-fore allows us to define µ for bulk lead chalcogenides over the entirespectral range, from λ =0 nm to wavelengths beyond the band gaponset.
144
8.3. Application to lead chalcogenide nanocrystals
8.3.2 Expansion of the nanocrystal absorption coef-ficient
For the colloidal nanocrystals, µ is determined experimentallyfrom 400 nm to wavelengths well into the transparent region bythe absorbance spectrum of a particle suspension (Q-PbSe aresuspended in CCl4, Q-PbS and Q-PbTe are suspended in C2Cl4).To reduce the number of data points, we use ∆λ =4–10 nm. Forwavelengths below 400 nm, we extend the absorption coefficientby using bulk values for the dielectric function and calculatingµ from equation 8.12, as we have already demonstrated that thenanocrystal optical properties are equal to bulk material in thisspectral region. Between 400 and 250 nm, experimental data for εare used; the values in the range 0–250 nm are obtained from theextrapolation of the fit to ε.
In the wavelength range 0–400 nm, ns merely serves to calcu-late µ from the known bulk dielectric function (equation 8.12) andneed not correspond to experimental values. This can convenientlybe exploited to overcome a practical problem when using the IMImethod. Taking a more detailed look at the coefficients Cii inequation 8.17, we notice that Cii ≈ 0 when εR,0 + 2n2
s ≈±εI,0.This will lead to a singular matrix, which cannot be inverted. Forlead chalcogenides, this can indeed occur in the 0–300 nm rangewhen using small ns (typically ns≈ 1–2). However, by stronglyincreasing ns, the singularity is easily avoided and convergence ofthe IMI method is ensured. Practically, in the range 0–250 nm(0–300 nm for PbTe) we set ns =30. At longer wavelengths, ex-perimental values of ns are used.
Figure 8.9 shows the resulting absorption coefficient of bulkPbS and a typical Q-PbS suspension in C2Cl4. The discontinu-ity at short wavelengths is due to the sudden increase of ns to30; in the range 0–400 nm both spectra coincide because bulk val-ues are used to extend the Q-PbS absorption coefficient to theseshort wavelengths. The figure shows that, by the methods outlinedabove, µ is obtained over the entire spectral range of interest.
145

VIII. Dielectric function
102
104
106
m (c
m-1
)
3000200010000
Wavelength (nm)
Figure 8.9: Bulk PbS absorption coefficient (gray), obtainedfrom interpolating the experimental values in the range 250–4000 nm and extending it to 0–250 nm by the fit to the bulkdielectric function. The discontinuity at 250 nm is due to thesudden increase of ns to 30. The Q-PbS absorption coefficient(black) is given by experimental values from 400 nm on. Thedata are extended to the range 0–400 nm by using bulk values.
8.3.3 IMI calculation for bulk PbS and PbTe
In accordance with the inclusion of ε∞ in the analysis of the bulkdielectric function, the discrete KK relation 8.11 is slightly ad-justed for the practical calculation of ε, to account for the higherlying transitions:
εR = ε∞ +2π
A.εI (8.21)
First, to demonstrate again the validity of our approach, theabsorption coefficient µ of PbS and PbTe is calculated from aninterpolation of the dielectric function (∆λ = 4nm) and the C2Cl4solvent refractive index (see figure 8.9 for µPbS). Next, εI and εR
are calculated using the IMI method, starting from a trial functionequal to the experimental εI . Figure 8.10 shows the result of thecalculation. A calculation for PbSe is not attempted due to a largegap in the experimental data between 1100 and 2500 nm (figure8.8). Numerical instabilities still persist to some extent in ourcalculations, therefore, if necessary, we reduced the ∆εI valuesobtained after each step to maintain convergence.
The calculated values (full line) agree well with the experi-mental data (dots). Note that, as the experimental εR and εI
are obtained independently from each other, their values are notrequired to uphold the KK-relations, while our calculated result
146
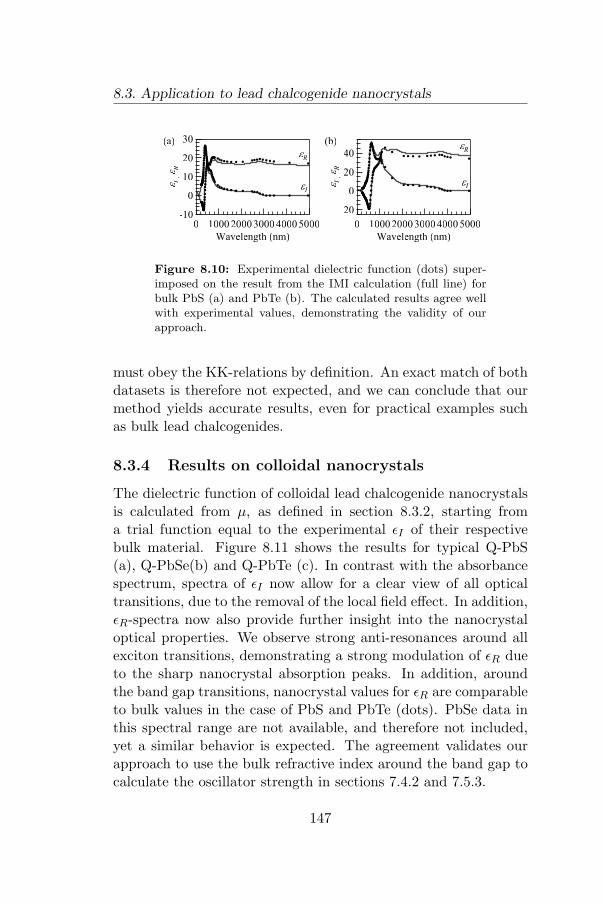
8.3. Application to lead chalcogenide nanocrystals
30
20
10
0
-10
eI
, eR
500040003000200010000
Wavelength (nm)
eI
eR
(a)
40
20
0
-20
eI
, eR
500040003000200010000
Wavelength (nm)
eI
eR(b)
Figure 8.10: Experimental dielectric function (dots) super-imposed on the result from the IMI calculation (full line) forbulk PbS (a) and PbTe (b). The calculated results agree wellwith experimental values, demonstrating the validity of ourapproach.
must obey the KK-relations by definition. An exact match of bothdatasets is therefore not expected, and we can conclude that ourmethod yields accurate results, even for practical examples suchas bulk lead chalcogenides.
8.3.4 Results on colloidal nanocrystals
The dielectric function of colloidal lead chalcogenide nanocrystalsis calculated from µ, as defined in section 8.3.2, starting froma trial function equal to the experimental εI of their respectivebulk material. Figure 8.11 shows the results for typical Q-PbS(a), Q-PbSe(b) and Q-PbTe (c). In contrast with the absorbancespectrum, spectra of εI now allow for a clear view of all opticaltransitions, due to the removal of the local field effect. In addition,εR-spectra now also provide further insight into the nanocrystaloptical properties. We observe strong anti-resonances around allexciton transitions, demonstrating a strong modulation of εR dueto the sharp nanocrystal absorption peaks. In addition, aroundthe band gap transitions, nanocrystal values for εR are comparableto bulk values in the case of PbS and PbTe (dots). PbSe data inthis spectral range are not available, and therefore not included,yet a similar behavior is expected. The agreement validates ourapproach to use the bulk refractive index around the band gap tocalculate the oscillator strength in sections 7.4.2 and 7.5.3.
147
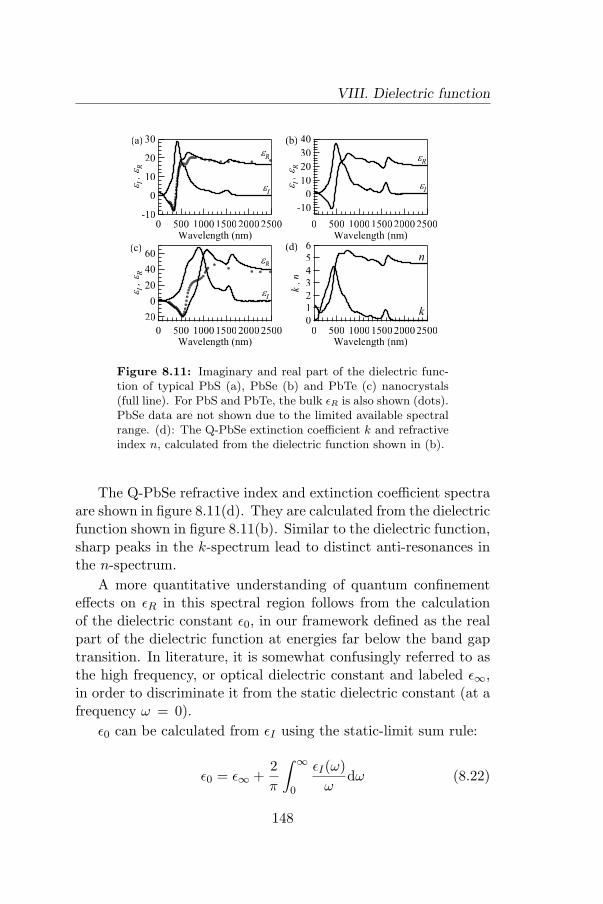
VIII. Dielectric function
60
40
20
0
-20
eI , e
R
25002000150010005000Wavelength (nm)
(c)
eI
eR
40
30
20
10
0
-10
eI , e
R
25002000150010005000Wavelength (nm)
(b)
eI
eR
30
20
10
0
-10
eI , e
R
25002000150010005000Wavelength (nm)
(a)
eI
eR
6
5
4
3
2
1
0
k , n
25002000150010005000Wavelength (nm)
(d)
k
n
Figure 8.11: Imaginary and real part of the dielectric func-tion of typical PbS (a), PbSe (b) and PbTe (c) nanocrystals(full line). For PbS and PbTe, the bulk εR is also shown (dots).PbSe data are not shown due to the limited available spectralrange. (d): The Q-PbSe extinction coefficient k and refractiveindex n, calculated from the dielectric function shown in (b).
The Q-PbSe refractive index and extinction coefficient spectraare shown in figure 8.11(d). They are calculated from the dielectricfunction shown in figure 8.11(b). Similar to the dielectric function,sharp peaks in the k-spectrum lead to distinct anti-resonances inthe n-spectrum.
A more quantitative understanding of quantum confinementeffects on εR in this spectral region follows from the calculationof the dielectric constant ε0, in our framework defined as the realpart of the dielectric function at energies far below the band gaptransition. In literature, it is somewhat confusingly referred to asthe high frequency, or optical dielectric constant and labeled ε∞,in order to discriminate it from the static dielectric constant (at afrequency ω = 0).
ε0 can be calculated from εI using the static-limit sum rule:
ε0 = ε∞ +2π
∫ ∞
0
εI(ω)ω
dω (8.22)
148
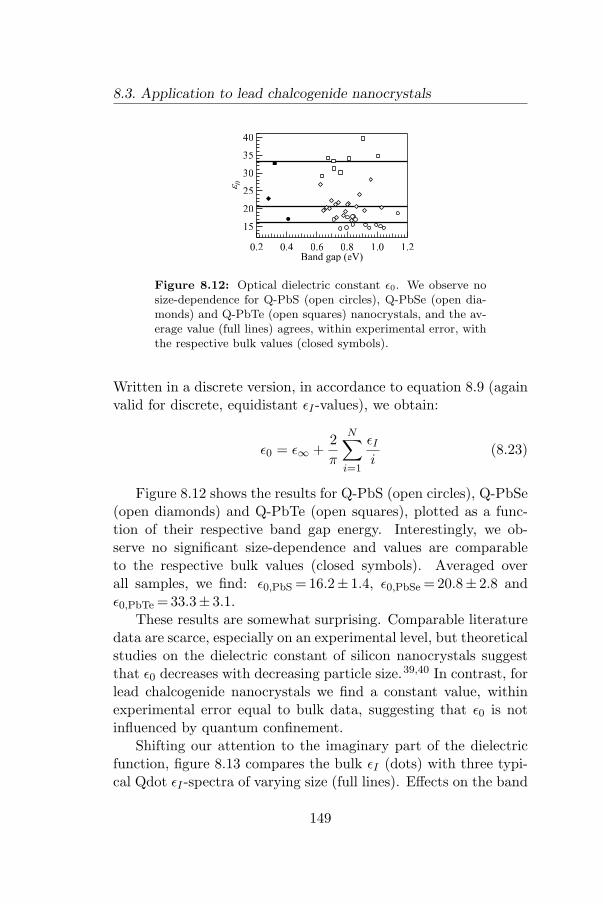
8.3. Application to lead chalcogenide nanocrystals
40
35
30
25
20
15e0
1.21.00.80.60.40.2Band gap (eV)
Figure 8.12: Optical dielectric constant ε0. We observe nosize-dependence for Q-PbS (open circles), Q-PbSe (open dia-monds) and Q-PbTe (open squares) nanocrystals, and the av-erage value (full lines) agrees, within experimental error, withthe respective bulk values (closed symbols).
Written in a discrete version, in accordance to equation 8.9 (againvalid for discrete, equidistant εI -values), we obtain:
ε0 = ε∞ +2π
N∑i=1
εI
i(8.23)
Figure 8.12 shows the results for Q-PbS (open circles), Q-PbSe(open diamonds) and Q-PbTe (open squares), plotted as a func-tion of their respective band gap energy. Interestingly, we ob-serve no significant size-dependence and values are comparableto the respective bulk values (closed symbols). Averaged overall samples, we find: ε0,PbS = 16.2± 1.4, ε0,PbSe = 20.8± 2.8 andε0,PbTe = 33.3± 3.1.
These results are somewhat surprising. Comparable literaturedata are scarce, especially on an experimental level, but theoreticalstudies on the dielectric constant of silicon nanocrystals suggestthat ε0 decreases with decreasing particle size.39,40 In contrast, forlead chalcogenide nanocrystals we find a constant value, withinexperimental error equal to bulk data, suggesting that ε0 is notinfluenced by quantum confinement.
Shifting our attention to the imaginary part of the dielectricfunction, figure 8.13 compares the bulk εI (dots) with three typi-cal Qdot εI -spectra of varying size (full lines). Effects on the band
149

VIII. Dielectric function
80
60
40
20
0
eI
2000150010005000Wavelength (nm)
E2E1
(c) bulk
8.9nm
6.4nm
3.8nm
40
30
20
10
0
eI
2000150010005000Wavelength (nm)
E2
E1
(b) bulk
7.3nm
5.3nm
3.5nm
30
20
10
0
eI
2000150010005000Wavelength (nm)
E2
E1
(a) bulk
6.6nm
5.6nm
4.1nm
Figure 8.13: Imaginary part of the dielectric function εI forthree nanocrystal sizes (full lines) superimposed on bulk data(dots) in the case of Q-PbS (a), Q-PbSe (b) and Q-PbTe (c).Focusing on the E1 and E2 transitions, we observe that E2 issize-independent, while E1 is clearly blue shifted for all threematerials. In addition, for Q-PbSe we observe an increase of E1with respect to E2, an effect which is even more pronouncedin the case of Q-PbTe. The expansion of Qdot absorptioncoefficient by bulk values (0–400 nm), is indicated by a grayzone.
gap transition have already been addressed in chapter VII; herewe focus on the E1 and E2 transitions. As has already been sug-gested by the analysis of the absorption coefficient, the oscillatorstrength and spectral position of the E2 transition show no con-finement effects, as all Qdot E2-peaks are comparable to bulk forall three materials. A slight increase and red shift is observed forthe smallest Q-PbSe (figure 8.13(b)), but this might be due to themerging of the E1 and E2 transition.
In contrast, we observe strong quantum confinement effects inall three lead chalcogenides for the E1 transition. In the case ofQ-PbS, the transition shifts to shorter wavelengths with decreas-ing nanocrystal size. In the case of Q-PbSe, the results suggest
150
8.4. Conclusions
that the blue shift is accompanied by an increase of the oscillatorstrength of the E1 transition with respect to the E2 transition.This effect is even more pronounced in the case of Q-PbTe, wherethe E1 transition clearly increases as the particle size decreases.
The results presented here agree with experimental and the-oretical data on the dielectric function of 2D PbSe nanocrystals,electro-deposited on gold surfaces, where a blue shift and relativeincrease of the E1 transition with decreasing nanocrystal heighthas also been observed.41
8.4 Conclusions
Following the results of chapter VII, we discuss the problems withregard to the interpretation of the absorbance spectrum of a na-nocrystal spectrum, emphasizing that assignment of absorptionpeaks by the use of second derivative analysis is not straightfor-ward, due to the local field factor.
This effect is removed however by calculating the nanocrystaldielectric function. The Maxwell-Garnett model inhibits a directcalculation, as the local field factor gives rise to a fourth-orderequation relating the absorption coefficient to the dielectric func-tion. To resolve this problem, we develop an elegant, yet powerfuliterative procedure (the IMI method). We verify the validity bythe calculation of the dielectric function of a virtual material con-sisting of two Lorentz oscillators, and bulk PbS and PbTe.
The dielectric function of Q-PbS, Q-PbSe and Q-PbTe yieldsseveral new insights in the optical properties of colloidal quan-tum dots. First, the real part of the dielectric function showsstrong anti-resonances around the band gap, due to sharp excitonabsorption peaks. The magnitude of the slowly evolving back-ground however, is comparable to bulk. This is confirmed by thecalculation of the optical dielectric constant. The values for thenanocrystals are equal to bulk for all three materials, suggestingthat quantum confinement has no influence on ε0.
Second, we observe strong quantum confinement effects for theimaginary part of the dielectric function. The blue shift and os-
151
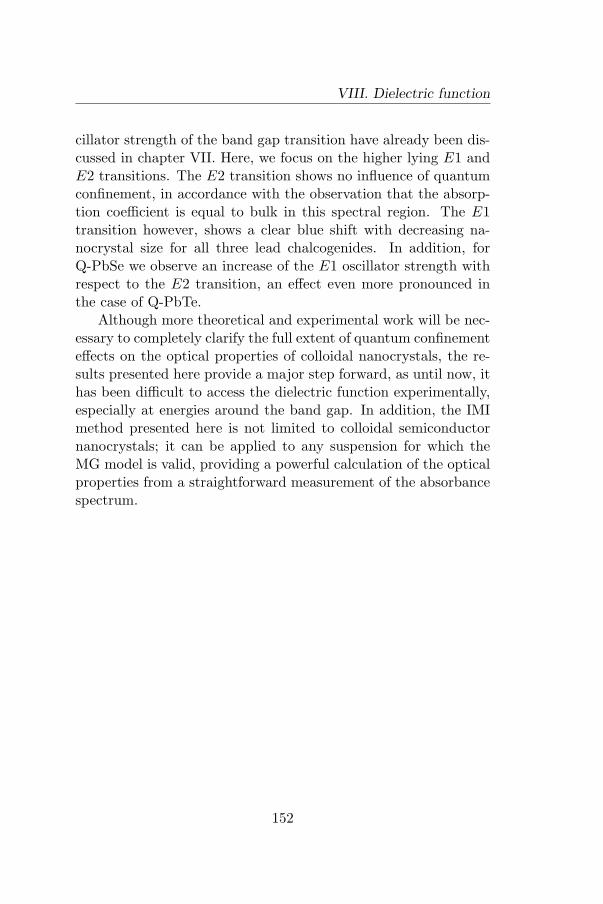
VIII. Dielectric function
cillator strength of the band gap transition have already been dis-cussed in chapter VII. Here, we focus on the higher lying E1 andE2 transitions. The E2 transition shows no influence of quantumconfinement, in accordance with the observation that the absorp-tion coefficient is equal to bulk in this spectral region. The E1transition however, shows a clear blue shift with decreasing na-nocrystal size for all three lead chalcogenides. In addition, forQ-PbSe we observe an increase of the E1 oscillator strength withrespect to the E2 transition, an effect even more pronounced inthe case of Q-PbTe.
Although more theoretical and experimental work will be nec-essary to completely clarify the full extent of quantum confinementeffects on the optical properties of colloidal nanocrystals, the re-sults presented here provide a major step forward, as until now, ithas been difficult to access the dielectric function experimentally,especially at energies around the band gap. In addition, the IMImethod presented here is not limited to colloidal semiconductornanocrystals; it can be applied to any suspension for which theMG model is valid, providing a powerful calculation of the opticalproperties from a straightforward measurement of the absorbancespectrum.
152
Chapter IX
Nonlinear optical properties ofcolloidal lead chalcogenidenanocrystals
9.1 Introduction
In chapters II and III we have already shown that colloidal na-nocrystals possess a high photo-luminescence efficiency, makingthem attractive candidates as light sources in biological applica-tions,42,43 or in LED’s44,45 or lasers1–3. However, other applica-tions might benefit from yet another promising property.
All-optical signal processing46,47 (spectral filtering, opticalswitching, etc.) requires materials with a large third-order nonlin-ear susceptibility χ(3), or equivalently a large third-order nonlinearrefractive index n2 (also called Kerr nonlinear refractive index).At telecom wavelengths (1.55 µm), silicon has only a small n2
48
(table 9.1), so it is not very suitable to achieve a strong opticalKerr effect. To overcome these problems and implement all-opticaldevices on a Si platform, a hybrid approach will therefore be mostefficient, in which materials with a strong n2 are integrated withSi devices. In this chapter, we will show that a promising class ofmaterials consists of colloidal nanocrystals.
153
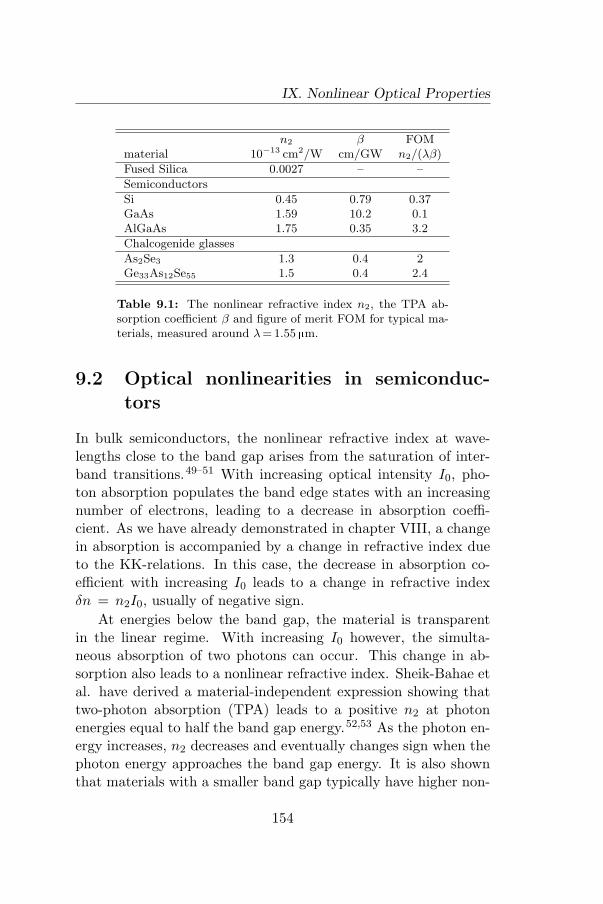
IX. Nonlinear Optical Properties
n2 β FOMmaterial 10−13 cm2/W cm/GW n2/(λβ)
Fused Silica 0.0027 – –
Semiconductors
Si 0.45 0.79 0.37GaAs 1.59 10.2 0.1AlGaAs 1.75 0.35 3.2
Chalcogenide glasses
As2Se3 1.3 0.4 2Ge33As12Se55 1.5 0.4 2.4
Table 9.1: The nonlinear refractive index n2, the TPA ab-sorption coefficient β and figure of merit FOM for typical ma-terials, measured around λ = 1.55µm.
9.2 Optical nonlinearities in semiconduc-tors
In bulk semiconductors, the nonlinear refractive index at wave-lengths close to the band gap arises from the saturation of inter-band transitions.49–51 With increasing optical intensity I0, pho-ton absorption populates the band edge states with an increasingnumber of electrons, leading to a decrease in absorption coeffi-cient. As we have already demonstrated in chapter VIII, a changein absorption is accompanied by a change in refractive index dueto the KK-relations. In this case, the decrease in absorption co-efficient with increasing I0 leads to a change in refractive indexδn = n2I0, usually of negative sign.
At energies below the band gap, the material is transparentin the linear regime. With increasing I0 however, the simulta-neous absorption of two photons can occur. This change in ab-sorption also leads to a nonlinear refractive index. Sheik-Bahae etal. have derived a material-independent expression showing thattwo-photon absorption (TPA) leads to a positive n2 at photonenergies equal to half the band gap energy.52,53 As the photon en-ergy increases, n2 decreases and eventually changes sign when thephoton energy approaches the band gap energy. It is also shownthat materials with a smaller band gap typically have higher non-
154
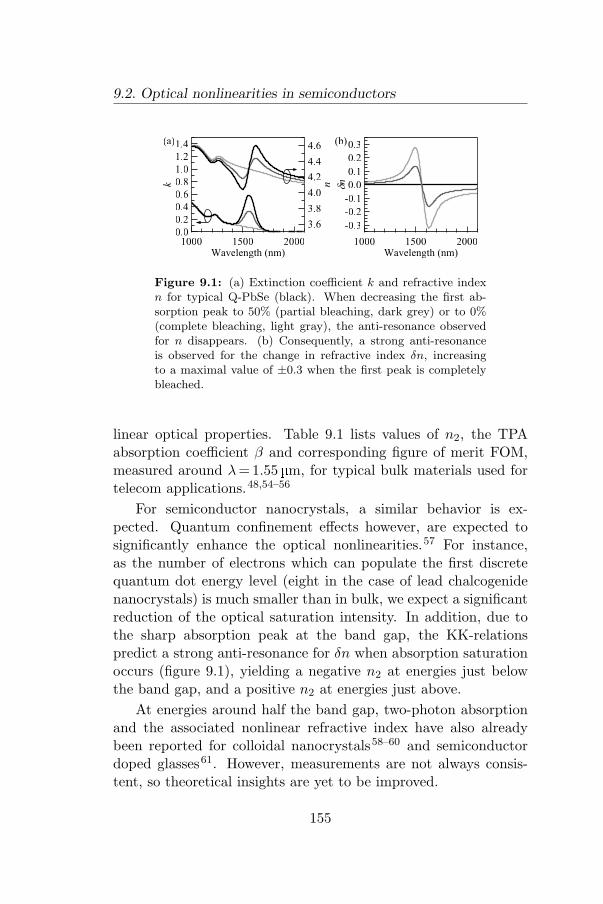
9.2. Optical nonlinearities in semiconductors
-0.3
-0.2
-0.1
0.0
0.1
0.2
0.3
dn
200015001000Wavelength (nm)
(b)4.6
4.4
4.2
4.0
3.8
3.6
n
200015001000Wavelength (nm)
1.4
1.2
1.0
0.8
0.6
0.4
0.2
0.0
k
(a)
Figure 9.1: (a) Extinction coefficient k and refractive indexn for typical Q-PbSe (black). When decreasing the first ab-sorption peak to 50% (partial bleaching, dark grey) or to 0%(complete bleaching, light gray), the anti-resonance observedfor n disappears. (b) Consequently, a strong anti-resonanceis observed for the change in refractive index δn, increasingto a maximal value of ±0.3 when the first peak is completelybleached.
linear optical properties. Table 9.1 lists values of n2, the TPAabsorption coefficient β and corresponding figure of merit FOM,measured around λ =1.55 µm, for typical bulk materials used fortelecom applications.48,54–56
For semiconductor nanocrystals, a similar behavior is ex-pected. Quantum confinement effects however, are expected tosignificantly enhance the optical nonlinearities.57 For instance,as the number of electrons which can populate the first discretequantum dot energy level (eight in the case of lead chalcogenidenanocrystals) is much smaller than in bulk, we expect a significantreduction of the optical saturation intensity. In addition, due tothe sharp absorption peak at the band gap, the KK-relationspredict a strong anti-resonance for δn when absorption saturationoccurs (figure 9.1), yielding a negative n2 at energies just belowthe band gap, and a positive n2 at energies just above.
At energies around half the band gap, two-photon absorptionand the associated nonlinear refractive index have also alreadybeen reported for colloidal nanocrystals58–60 and semiconductordoped glasses61. However, measurements are not always consis-tent, so theoretical insights are yet to be improved.
155
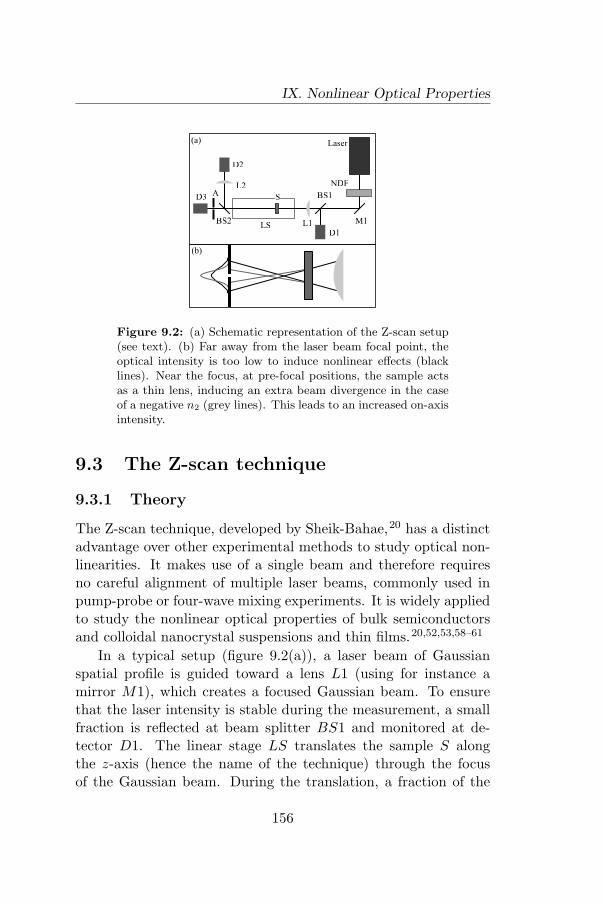
IX. Nonlinear Optical Properties
(b)
D1
D2
D3
BS2 M1
BS1
Laser
NDF
L1
L2
S
LS
A
(a)
Figure 9.2: (a) Schematic representation of the Z-scan setup(see text). (b) Far away from the laser beam focal point, theoptical intensity is too low to induce nonlinear effects (blacklines). Near the focus, at pre-focal positions, the sample actsas a thin lens, inducing an extra beam divergence in the caseof a negative n2 (grey lines). This leads to an increased on-axisintensity.
9.3 The Z-scan technique
9.3.1 Theory
The Z-scan technique, developed by Sheik-Bahae,20 has a distinctadvantage over other experimental methods to study optical non-linearities. It makes use of a single beam and therefore requiresno careful alignment of multiple laser beams, commonly used inpump-probe or four-wave mixing experiments. It is widely appliedto study the nonlinear optical properties of bulk semiconductorsand colloidal nanocrystal suspensions and thin films.20,52,53,58–61
In a typical setup (figure 9.2(a)), a laser beam of Gaussianspatial profile is guided toward a lens L1 (using for instance amirror M1), which creates a focused Gaussian beam. To ensurethat the laser intensity is stable during the measurement, a smallfraction is reflected at beam splitter BS1 and monitored at de-tector D1. The linear stage LS translates the sample S alongthe z-axis (hence the name of the technique) through the focusof the Gaussian beam. During the translation, a fraction of the
156
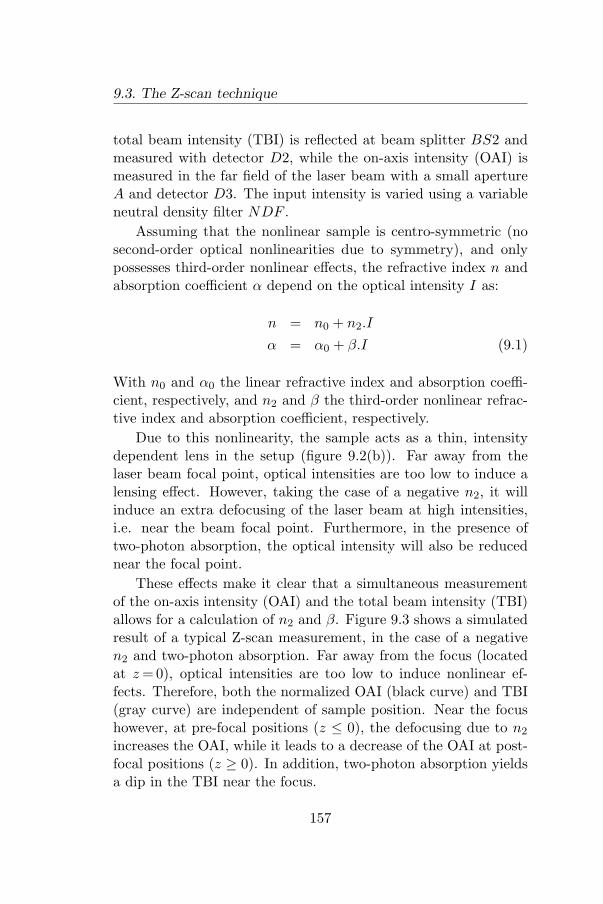
9.3. The Z-scan technique
total beam intensity (TBI) is reflected at beam splitter BS2 andmeasured with detector D2, while the on-axis intensity (OAI) ismeasured in the far field of the laser beam with a small apertureA and detector D3. The input intensity is varied using a variableneutral density filter NDF .
Assuming that the nonlinear sample is centro-symmetric (nosecond-order optical nonlinearities due to symmetry), and onlypossesses third-order nonlinear effects, the refractive index n andabsorption coefficient α depend on the optical intensity I as:
n = n0 + n2.I
α = α0 + β.I (9.1)
With n0 and α0 the linear refractive index and absorption coeffi-cient, respectively, and n2 and β the third-order nonlinear refrac-tive index and absorption coefficient, respectively.
Due to this nonlinearity, the sample acts as a thin, intensitydependent lens in the setup (figure 9.2(b)). Far away from thelaser beam focal point, optical intensities are too low to induce alensing effect. However, taking the case of a negative n2, it willinduce an extra defocusing of the laser beam at high intensities,i.e. near the beam focal point. Furthermore, in the presence oftwo-photon absorption, the optical intensity will also be reducednear the focal point.
These effects make it clear that a simultaneous measurementof the on-axis intensity (OAI) and the total beam intensity (TBI)allows for a calculation of n2 and β. Figure 9.3 shows a simulatedresult of a typical Z-scan measurement, in the case of a negativen2 and two-photon absorption. Far away from the focus (locatedat z = 0), optical intensities are too low to induce nonlinear ef-fects. Therefore, both the normalized OAI (black curve) and TBI(gray curve) are independent of sample position. Near the focushowever, at pre-focal positions (z ≤ 0), the defocusing due to n2
increases the OAI, while it leads to a decrease of the OAI at post-focal positions (z ≥ 0). In addition, two-photon absorption yieldsa dip in the TBI near the focus.
157

IX. Nonlinear Optical Properties
1.02
1.01
1.00
0.99
0.98O
AI
- T
BI
-10 -5 0 5 10z / zR
Figure 9.3: Simulated Z-scan traces. In the case of a negativen2, the OAI shows an anti-resonance with a peak-valley shape(black curve). For n2 > 0, the anti-resonance would have avalley-peak shape. The TBI shows a dip near the focus inthe case of two-photon absorption (gray curve). A peak wouldindicate absorption saturation.
9.3.2 Laser beam characterization
The qualitative description of the Z-scan measurement alreadystresses the importance of a proper beam characterization. Non-linear effects occur only near the focus, and depend on the opticalintensity.
A focused Gaussian beam is spatially characterized by twoparameters: the beam waist w0 (the beam radius at the focus),defined by the radius of the beam at an intensity equal to 1/e2
of the maximal intensity, and the corresponding Rayleigh lengthzR, defined by the distance from the waist where the beam radiusis enlarged by a factor
√2. For a Gaussian beam, at a given
wavelength λ, both are related through:
zR =πw2
0
λ(9.2)
We determine w0 and zR with a beam profiler. The beamradius w is plotted as a function of z-position, and fitted with:
w(z) = w0
√1 +
(z
zR
)2
(9.3)
Figure 9.4 shows a typical result, for a Gaussian beam atλ = 1550 nm. The resulting beam waist w0 = 53 µm and Rayleighlength zR =5.8 mm indeed obey relation 9.2.
158
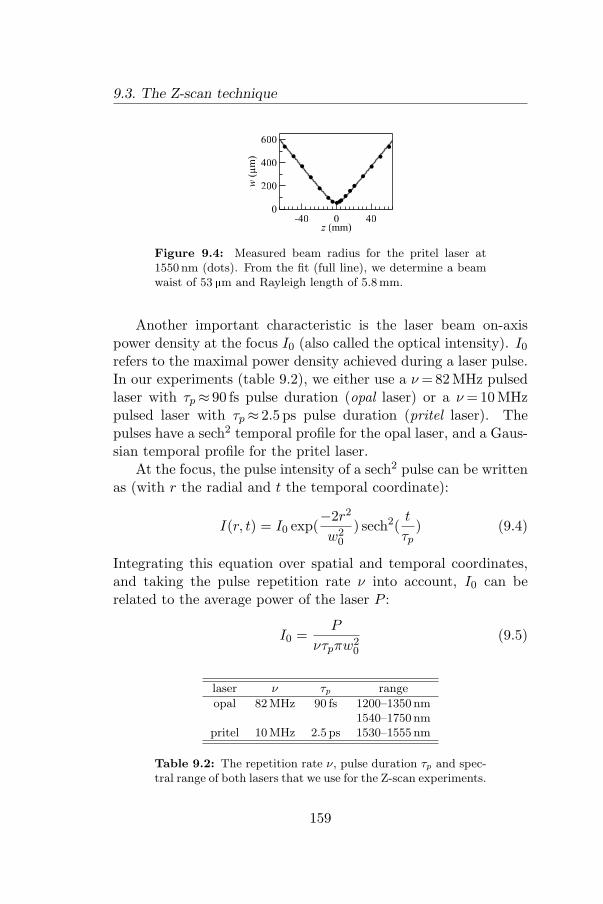
9.3. The Z-scan technique
600
400
200
0
w (µ
m)
-40 0 40z (mm)
Figure 9.4: Measured beam radius for the pritel laser at1550 nm (dots). From the fit (full line), we determine a beamwaist of 53 µm and Rayleigh length of 5.8 mm.
Another important characteristic is the laser beam on-axispower density at the focus I0 (also called the optical intensity). I0
refers to the maximal power density achieved during a laser pulse.In our experiments (table 9.2), we either use a ν =82 MHz pulsedlaser with τp≈ 90 fs pulse duration (opal laser) or a ν =10 MHzpulsed laser with τp≈ 2.5 ps pulse duration (pritel laser). Thepulses have a sech2 temporal profile for the opal laser, and a Gaus-sian temporal profile for the pritel laser.
At the focus, the pulse intensity of a sech2 pulse can be writtenas (with r the radial and t the temporal coordinate):
I(r, t) = I0 exp(−2r2
w20
) sech2(t
τp) (9.4)
Integrating this equation over spatial and temporal coordinates,and taking the pulse repetition rate ν into account, I0 can berelated to the average power of the laser P :
I0 =P
ντpπw20
(9.5)
laser ν τp range
opal 82MHz 90 fs 1200–1350 nm1540–1750 nm
pritel 10MHz 2.5 ps 1530–1555 nm
Table 9.2: The repetition rate ν, pulse duration τp and spec-tral range of both lasers that we use for the Z-scan experiments.
159
IX. Nonlinear Optical Properties
An analogue expression can be derived for the Gaussian shapedpulses:
I(r, t) = I0 exp(−2r2
w20
) exp(−t2
τ2p
) (9.6)
Here we find:
I0 =2√π
P
ντpπw20
(9.7)
The laser pulse duration τp is determined with an optical auto-correlator. Knowing τp, we can then calculate I0 from the mea-sured average laser power P .
9.3.3 Derivation of n2 and β from the Z-scan
A calculation of n2 and β starts from the differential equationswhich describe the attenuation and phase change of an electricfield E(z′, r) as it passes through a nonlinear sample with lengthL (the optical intensity equals I(z′, r) = |E(z′, r)|2).20 The coordi-nate z′ describes the distance that the light has traveled throughthe sample (z′ = 0 equals the position where the light enters thesample), not to be confused with the z-coordinate used for the po-sition of the sample along the axis of the focused laser beam. Forsimplicity, we will assume that the sample only possesses a third-order nonlinearity. We will also assume that the sample length Lis much smaller than the Rayleigh length (L � zR, thin sampleapproximation).
∂I(z′, r)∂z′
= −α0I(z′, r)− βI(z′, r)2 (9.8)
∂φ
∂z′=
2πn2
λI(z′, r) (9.9)
Defining the input intensity I(0, r) = Iin, and defining an effectivesample length:
Leff =1− exp(−α0L)
α0(9.10)
160
9.3. The Z-scan technique
The differential equations yield the electric field at the exit planeof the sample:
Eex(z, r) = E(z, r) exp(−α0L
2)(1 + βIinLeff )((i2πn2)/(λβ)−1/2)
(9.11)The intensity at the exit plane is consequently given by:
Iex = Iinexp(−α0L)
1 + βIinLeff(9.12)
We can write the input intensity Iin as a function of the beamradius at position z:
Iin =I0w
20
w(z)2exp(− 2r2
w(z)2) (9.13)
with I0 the on-axis optical intensity at the focus. Using the fol-lowing substitutions: q = βI0Leff and x = z/zR, and integratingover the spatial coordinate r, we find following normalized TBItrace:
TTBI(x) =Iex
limI0→0
Iex
=(1 + x2)
qln(1 +
q
1 + x2) (9.14)
This allows us to determine q, and therefore the nonlinear absorp-tion coefficient β, from a fit to the TBI trace.
Knowing how to calculate β, we now return to equation 9.11.When neglecting the contribution of β in this equation, we obtainfollowing electric field at the exit plane of the sample:
Eex(z, r) = E(z, r) exp(−αL
2) exp(i
2πn2IinLeff
λ) (9.15)
In principle, a zeroth order Hankel transform of Eex allows usto calculate the electric field Eap at the position of the aperture(located at a distance d from the laser beam focal point). From Eap
the OAI trace can be determined. However, this requires extensive
161
IX. Nonlinear Optical Properties
numerical calculations. The problem is revolved by decomposingEex into a series of Gaussian components. The Hankel transformof a Gaussian beam can be solved analytically. Taking equation9.13 into account, Eex is expanded into:
Eex(z, r) = E(z, r) exp(−αL
2)∞∑
m=0
Fm exp(− 2mr2
w(z)2)
Fm =1m!
(i2πn2I0Leffw2
0
λw(z)2
)m
(9.16)
Fm can be simplified by defining the on-axis phase shift at thefocus ∆φ0:
∆φ0 =2πn2I0Leff
λ(9.17)
Using the Hankel transform for a Gaussian beam, the electric fieldat the aperture, evaluated at r =0 (as we are only interested inthe on-axis intensity), is given by:
Eap(d, 0) = E(z, 0) exp(−αL
2).
∞∑m=0
(i∆φ0w2
0w(z)2
)mw0,m(1 + 2iαm)
m!wm√
1 + αm(9.18)
w20,m =
w(z)2
1 + 2m
αm =(1 + d/R(z))dm
d
wm = w0,m
√(1 +
d
R(z)
)2
+(
d
dm
)2
dm =π(1 + 2m)
λw(z)2
R(z) = z
(1 +
z2R
z2
)As we measure the OAI far away from the laser beam focus, theapproximation d � z, zR allows us to simplify the equation into
162
9.3. The Z-scan technique
following normalized OAI (using x= z/zR):
TOAI(x) =Iap
limI0→0
Iap(9.19)
= (1 + x2)
∣∣∣∣∣∞∑
m=0
(i∆φ0)m(2m + 1 + ix)m!(1 + x2)m((2m + 1)2 + x2)
∣∣∣∣∣2
For practical calculations, we limit ourselves to an approximationup to the third order in ∆φ0:
TOAI(x) = 1 +4x
(x2 + 1)(x2 + 9)∆φ0 (9.20)
+4(3x2 − 5)
(x2 + 1)2(x2 + 9)(x2 + 25)∆φ2
0
+32x(x2 − 11)
(x2 + 1)3(x2 + 9)(x2 + 25)(x2 + 49)∆φ3
0
Simulations show that the first order approximation is valid up to∆φ0 ≈ 0.2, the second order up to ∆φ0 ≈ 1 and the third order upto ∆φ0 ≈ 1.75. Equation 9.20 allows to determine ∆φ0 from a fitto the OAI trace, after which n2 can be calculated using equation9.17.
9.3.4 Practical calculations
The OAI is derived in the limit r = 0 (true on-axis intensity). Inpractical measurements however, the finite aperture size has to betaken into account. This reduces the measured ∆φ0 by a factor(1− S)0.25, with S given by:20
S = 1− exp(−2r2
a
w2a
)(9.21)
with ra the aperture radius and wa the beam radius at the apertureplane. Consequently, in equation 9.17, ∆φ0 has to be replaced by∆φ0/(1− S)0.25.
163
IX. Nonlinear Optical Properties
In case of a fast nonlinear effect, we have to take the temporalshape of the pulse into account as well. Weaker optical intensi-ties at the start and end of the pulse lead to a reduction of themeasured nonlinear phase shift ∆φ0. As we calculate n2 fromthe maximal optical intensity at the focus I0, we will thereforeunderestimate n2, unless it is multiplied by a pulse shape factor,amounting to 3/2 for a sech2 pulse, and
√2 for a Gaussian pulse.
9.3.5 Thermal effects
When performing Z-scan measurements on a light-absorbing ma-terial, the absorbed energy can be converted to heat. The cor-responding increase in absolute temperature T (K) of the sampleleads to a change in refractive index:
n(T ) = n0 +dn
dTT (9.22)
with dn/dT the thermo-optical coefficient. In the center of thelaser beam, the higher optical intensity leads to a stronger in-crease in temperature than at the edges of the laser beam. Takingheat diffusion throughout the material into account, a steady state(spatial) temperature profile will develop at t � tc, with tc thecharacteristic profile buildup time:
tc = w(z)Cpρ
4κ(9.23)
Cp equals the heat capacity of the sample, ρ the density and κthe thermal conductivity. Due to the thermo-optical coefficient,the refractive index will follow the temperature profile, leadingto a thermal lensing effect (similar to the electronic lensing effectdescribed above).62
The resulting OAI will therefore also show an anti-resonance.Taking only linear absorption into account, i.e. neglecting nonlin-ear processes such as two-photon absorption, the thermal OAI canbe described by:
TOAI,th(x) = 1 + θ arctan(
2x
x2 + 3
)(9.24)
164
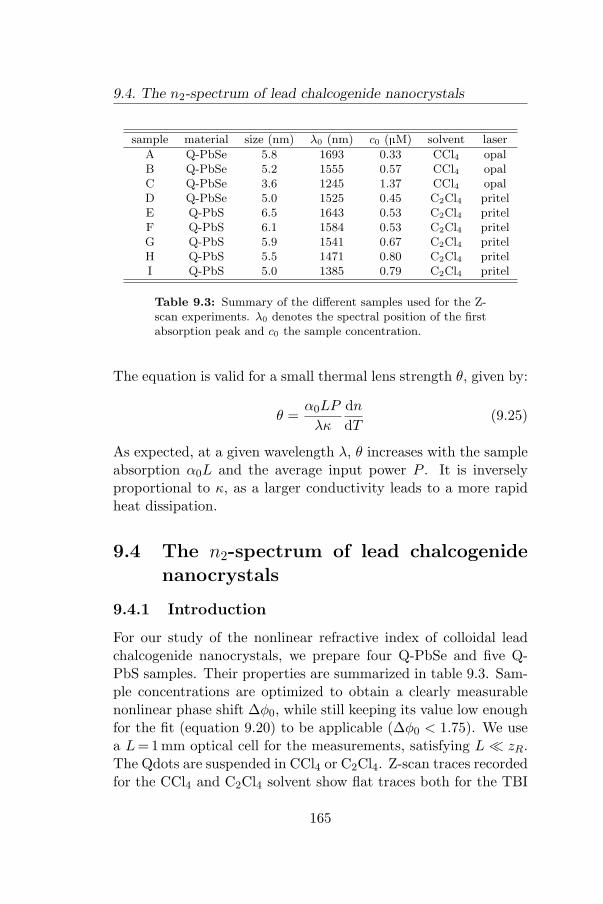
9.4. The n2-spectrum of lead chalcogenide nanocrystals
sample material size (nm) λ0 (nm) c0 (µM) solvent laser
A Q-PbSe 5.8 1693 0.33 CCl4 opalB Q-PbSe 5.2 1555 0.57 CCl4 opalC Q-PbSe 3.6 1245 1.37 CCl4 opalD Q-PbSe 5.0 1525 0.45 C2Cl4 pritelE Q-PbS 6.5 1643 0.53 C2Cl4 pritelF Q-PbS 6.1 1584 0.53 C2Cl4 pritelG Q-PbS 5.9 1541 0.67 C2Cl4 pritelH Q-PbS 5.5 1471 0.80 C2Cl4 pritelI Q-PbS 5.0 1385 0.79 C2Cl4 pritel
Table 9.3: Summary of the different samples used for the Z-scan experiments. λ0 denotes the spectral position of the firstabsorption peak and c0 the sample concentration.
The equation is valid for a small thermal lens strength θ, given by:
θ =α0LP
λκ
dn
dT(9.25)
As expected, at a given wavelength λ, θ increases with the sampleabsorption α0L and the average input power P . It is inverselyproportional to κ, as a larger conductivity leads to a more rapidheat dissipation.
9.4 The n2-spectrum of lead chalcogenidenanocrystals
9.4.1 Introduction
For our study of the nonlinear refractive index of colloidal leadchalcogenide nanocrystals, we prepare four Q-PbSe and five Q-PbS samples. Their properties are summarized in table 9.3. Sam-ple concentrations are optimized to obtain a clearly measurablenonlinear phase shift ∆φ0, while still keeping its value low enoughfor the fit (equation 9.20) to be applicable (∆φ0 < 1.75). We usea L=1 mm optical cell for the measurements, satisfying L � zR.The Qdots are suspended in CCl4 or C2Cl4. Z-scan traces recordedfor the CCl4 and C2Cl4 solvent show flat traces both for the TBI
165
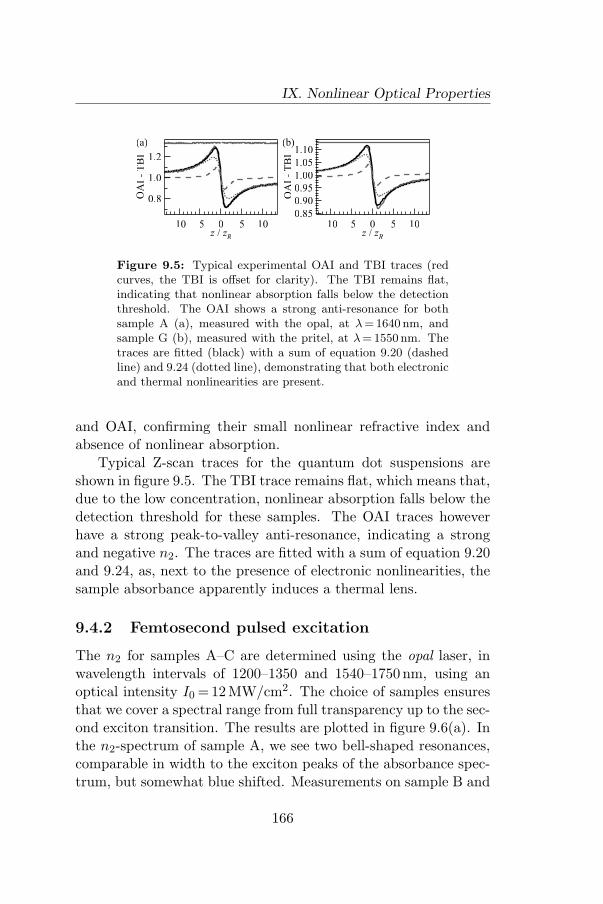
IX. Nonlinear Optical Properties
1.10
1.05
1.00
0.95
0.90
0.85
OA
I -
TB
I
-10 -5 0 5 10z / zR
(b)
1.2
1.0
0.8OA
I -
TB
I
-10 -5 0 5 10z / zR
(a)
Figure 9.5: Typical experimental OAI and TBI traces (redcurves, the TBI is offset for clarity). The TBI remains flat,indicating that nonlinear absorption falls below the detectionthreshold. The OAI shows a strong anti-resonance for bothsample A (a), measured with the opal, at λ = 1640 nm, andsample G (b), measured with the pritel, at λ = 1550 nm. Thetraces are fitted (black) with a sum of equation 9.20 (dashedline) and 9.24 (dotted line), demonstrating that both electronicand thermal nonlinearities are present.
and OAI, confirming their small nonlinear refractive index andabsence of nonlinear absorption.
Typical Z-scan traces for the quantum dot suspensions areshown in figure 9.5. The TBI trace remains flat, which means that,due to the low concentration, nonlinear absorption falls below thedetection threshold for these samples. The OAI traces howeverhave a strong peak-to-valley anti-resonance, indicating a strongand negative n2. The traces are fitted with a sum of equation 9.20and 9.24, as, next to the presence of electronic nonlinearities, thesample absorbance apparently induces a thermal lens.
9.4.2 Femtosecond pulsed excitation
The n2 for samples A–C are determined using the opal laser, inwavelength intervals of 1200–1350 and 1540–1750 nm, using anoptical intensity I0 =12 MW/cm2. The choice of samples ensuresthat we cover a spectral range from full transparency up to the sec-ond exciton transition. The results are plotted in figure 9.6(a). Inthe n2-spectrum of sample A, we see two bell-shaped resonances,comparable in width to the exciton peaks of the absorbance spec-trum, but somewhat blue shifted. Measurements on sample B and
166
9.4. The n2-spectrum of lead chalcogenide nanocrystals
-40
-20
0n2 (
10
-12 c
m2/W
)
1800160014001200Wavelength (nm)
-40
-20
0
-40
-20
0
25
0
Ab
s. coeff. (1
0-3m
m-1)
25
0
25
0
(a)
A
B
C
-60
-40
-20
0
n2 (
10
-12 c
m2/W
)
806040200Volume fraction (10
-6)
(b)
Figure 9.6: (a) n2-spectra of samples A–C, superimposedon the respective absorption coefficient of the suspension. Weobserve bell-shaped resonances, strongly correlated with theabsorption spectrum. (b) n2 increases linearly with the Q-PbSe volume fraction (sample A). From the fit, we determinean intrinsic n2 = -7 10−7 cm2/W.
sample C yield similar results. For sample C, we also observe a cur-rently unexplained small peak around 1700 nm. A measurementof the absorbance spectrum after the Z-scan experiments showsthat the blue shift of the n2-spectrum is not due to oxidation ofthe Q-PbSe nanocrystals, as samples B and C are stable (no blueshift of the absorption peak), while the 46 nm blue shift observedfor sample A is not sufficient to completely account for the blueshift of the n2-spectrum.
The correlation between the n2-spectrum and the absorptionspectrum already indicates that the electronic nonlinear refrac-tive index is indeed related to transitions between the discretequantum dot energy levels. Its values can therefore be optimizedat any NIR wavelength by choosing the appropriate Q-PbSe size.Maximal n2-values correspond to -3 to -4 10−11 cm2/W for ca.1 µM suspensions, exceeding typical bulk values (table 9.1) at these
167
IX. Nonlinear Optical Properties
wavelengths by two orders of magnitude.As the measured n2 pertains to (dilute) Q-PbSe suspensions,
its value depends on the Q-PbSe volume fraction f (figure 9.6(b)):
n2,eff = fn2,P bSe (9.26)
Determination of n2 for different concentrations of sample Aat λ = 1640 nm yields an intrinsic nonlinear refractive indexn2,P bSe =- 7 10−7 cm2/W.
9.4.3 Picosecond pulsed excitation
We obtain similar results for samples D–I (figure 9.7), us-ing the pritel laser in a wavelength interval 1530–1555 nm atI0 = 4MW/cm2. The n2-values are again clearly correlated withthe nanocrystal absorption coefficient. Comparing the Q-PbSesamples A–C with sample D, we find similar n2 values usingfemtosecond and picosecond pulsed excitation. To compare theresults of Q-PbSe and Q-PbS under picosecond pulsed excitation,the figure of merit (FOM)
FOM =n2I0
λα0(9.27)
is a more suitable parameter, as it is a material property, indepen-dent of the nanocrystal volume fraction. The FOM reflects themaximal nonlinear phase shift which can be achieved when lightpropagates through a sample, before absorption reduces its inten-sity too much for nonlinear effects to occur. For Q-PbSe sample Dwe find an average FOM= 3.9± 0.3. For the Q-PbS samples E–I,averaged over all samples and measurements, we find a compara-ble FOM= 3.2± 0.8. These values are comparable to the FOMof AlGaAs and exceed all other materials from table 9.1, demon-strating that colloidal lead chalcogenide nanocrystals are efficientnonlinear materials.
9.4.4 Thermal nonlinearities
Figure 9.8 shows the thermo-optical coefficient dn/dT obtainedfor Q-PbSe sample B (opal laser) and Q-PbS sample G (pritel
168
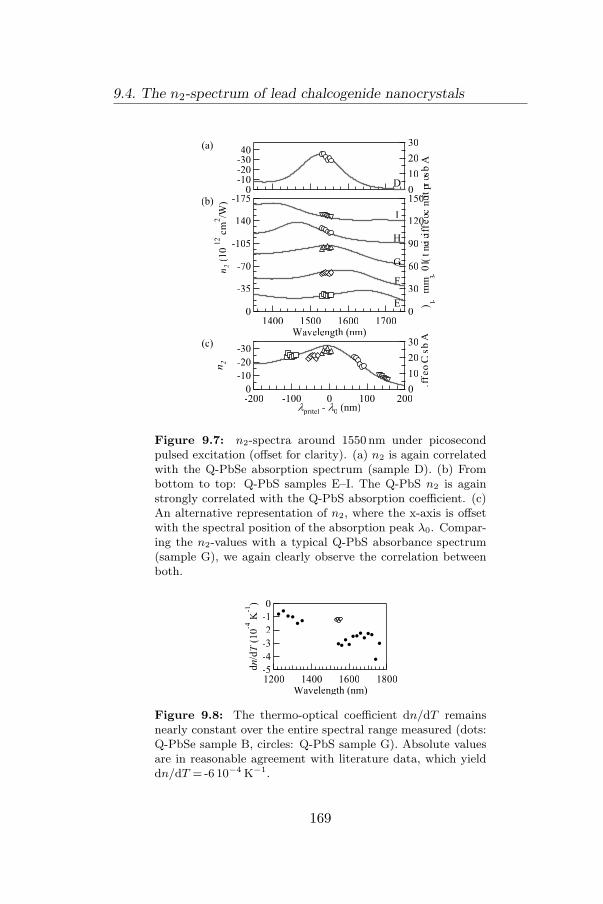
9.4. The n2-spectrum of lead chalcogenide nanocrystals
-40-30-20-10
0
n2 (
10
-12 c
m2/W
)
30
20
10
0
Ab
sorp
tion
coefficien
t (10
-3 mm
-1)
(a)
D
-175
-140
-105
-70
-35
0
x10
-12
1700160015001400Wavelength (nm)
150
120
90
60
30
0
x10
-3
(b)
E
F
G
H
I
30
20
10
0
Abs. C
oeff.
-200 -100 0 100 200lpritel - l0 (nm)
-30
-20
-10
0
n2
(c)
Figure 9.7: n2-spectra around 1550 nm under picosecondpulsed excitation (offset for clarity). (a) n2 is again correlatedwith the Q-PbSe absorption spectrum (sample D). (b) Frombottom to top: Q-PbS samples E–I. The Q-PbS n2 is againstrongly correlated with the Q-PbS absorption coefficient. (c)An alternative representation of n2, where the x-axis is offsetwith the spectral position of the absorption peak λ0. Compar-ing the n2-values with a typical Q-PbS absorbance spectrum(sample G), we again clearly observe the correlation betweenboth.
-5
-4
-3
-2
-1
0
dn/dT
(1
0-4
K-1
)
1800160014001200Wavelength (nm)
Figure 9.8: The thermo-optical coefficient dn/dT remainsnearly constant over the entire spectral range measured (dots:Q-PbSe sample B, circles: Q-PbS sample G). Absolute valuesare in reasonable agreement with literature data, which yielddn/dT = -6 10−4 K−1.
169
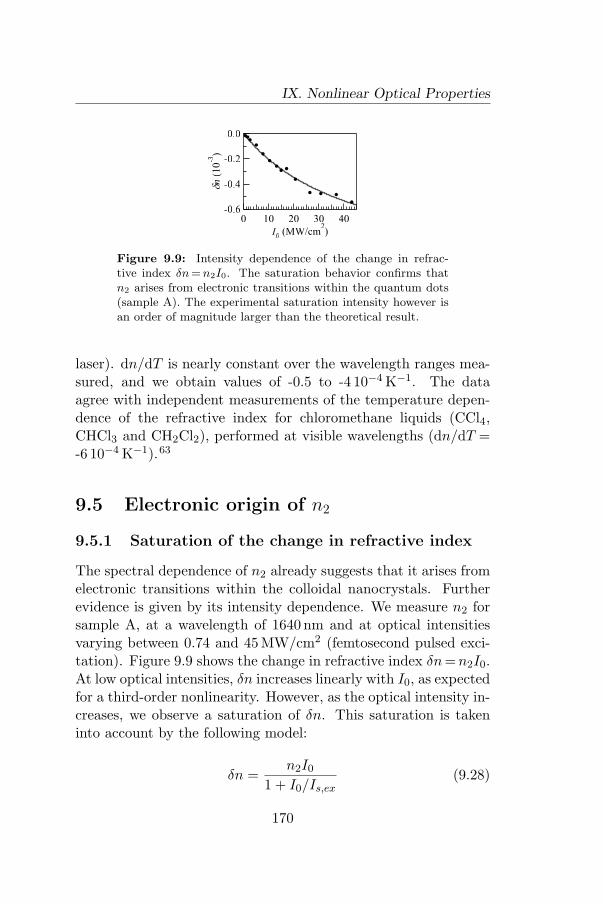
IX. Nonlinear Optical Properties
-0.6
-0.4
-0.2
0.0
dn
(1
0-3
)403020100
I0 (MW/cm2)
Figure 9.9: Intensity dependence of the change in refrac-tive index δn = n2I0. The saturation behavior confirms thatn2 arises from electronic transitions within the quantum dots(sample A). The experimental saturation intensity however isan order of magnitude larger than the theoretical result.
laser). dn/dT is nearly constant over the wavelength ranges mea-sured, and we obtain values of -0.5 to -4 10−4 K−1. The dataagree with independent measurements of the temperature depen-dence of the refractive index for chloromethane liquids (CCl4,CHCl3 and CH2Cl2), performed at visible wavelengths (dn/dT =-6 10−4 K−1).63
9.5 Electronic origin of n2
9.5.1 Saturation of the change in refractive index
The spectral dependence of n2 already suggests that it arises fromelectronic transitions within the colloidal nanocrystals. Furtherevidence is given by its intensity dependence. We measure n2 forsample A, at a wavelength of 1640 nm and at optical intensitiesvarying between 0.74 and 45MW/cm2 (femtosecond pulsed exci-tation). Figure 9.9 shows the change in refractive index δn = n2I0.At low optical intensities, δn increases linearly with I0, as expectedfor a third-order nonlinearity. However, as the optical intensity in-creases, we observe a saturation of δn. This saturation is takeninto account by the following model:
δn =n2I0
1 + I0/Is,ex(9.28)
170
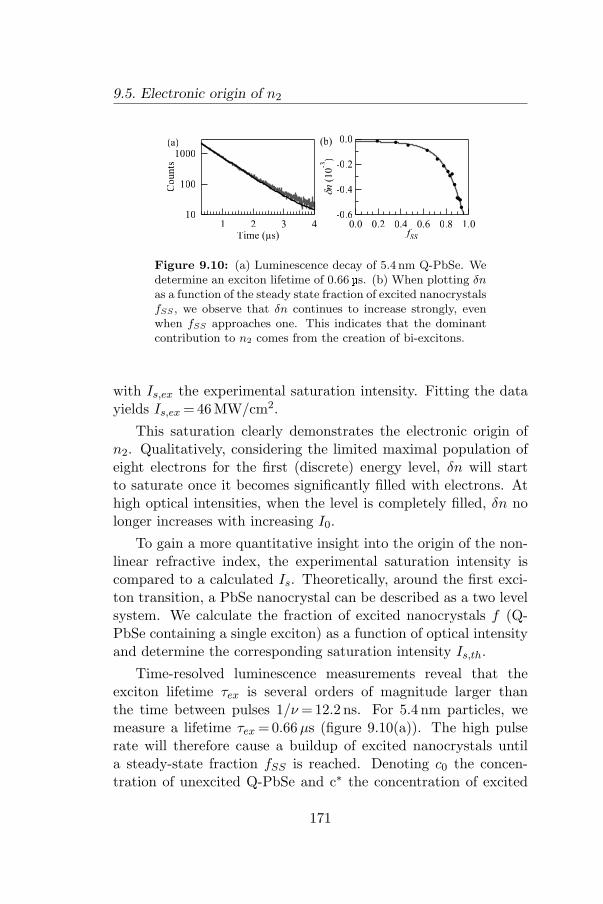
9.5. Electronic origin of n2
10
100
1000
Counts
4321Time (µs)
(a)
-0.6
-0.4
-0.2
0.0
dn
(1
0-3
)
1.00.80.60.40.20.0fSS
(b)
Figure 9.10: (a) Luminescence decay of 5.4 nm Q-PbSe. Wedetermine an exciton lifetime of 0.66µs. (b) When plotting δnas a function of the steady state fraction of excited nanocrystalsfSS , we observe that δn continues to increase strongly, evenwhen fSS approaches one. This indicates that the dominantcontribution to n2 comes from the creation of bi-excitons.
with Is,ex the experimental saturation intensity. Fitting the datayields Is,ex =46 MW/cm2.
This saturation clearly demonstrates the electronic origin ofn2. Qualitatively, considering the limited maximal population ofeight electrons for the first (discrete) energy level, δn will startto saturate once it becomes significantly filled with electrons. Athigh optical intensities, when the level is completely filled, δn nolonger increases with increasing I0.
To gain a more quantitative insight into the origin of the non-linear refractive index, the experimental saturation intensity iscompared to a calculated Is. Theoretically, around the first exci-ton transition, a PbSe nanocrystal can be described as a two levelsystem. We calculate the fraction of excited nanocrystals f (Q-PbSe containing a single exciton) as a function of optical intensityand determine the corresponding saturation intensity Is,th.
Time-resolved luminescence measurements reveal that theexciton lifetime τex is several orders of magnitude larger thanthe time between pulses 1/ν =12.2 ns. For 5.4 nm particles, wemeasure a lifetime τex = 0.66 µs (figure 9.10(a)). The high pulserate will therefore cause a buildup of excited nanocrystals untila steady-state fraction fSS is reached. Denoting c0 the concen-tration of unexcited Q-PbSe and c∗ the concentration of excited
171
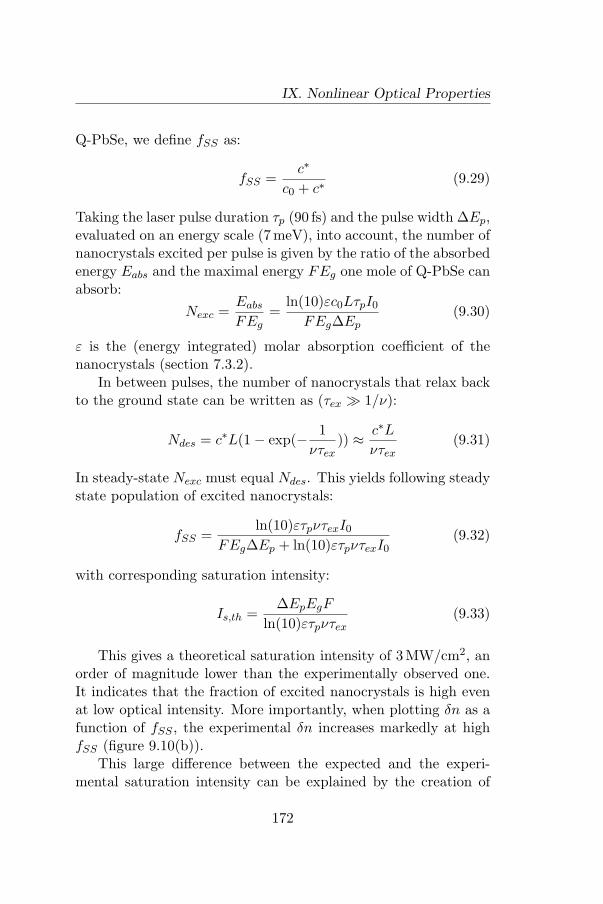
IX. Nonlinear Optical Properties
Q-PbSe, we define fSS as:
fSS =c∗
c0 + c∗(9.29)
Taking the laser pulse duration τp (90 fs) and the pulse width ∆Ep,evaluated on an energy scale (7meV), into account, the number ofnanocrystals excited per pulse is given by the ratio of the absorbedenergy Eabs and the maximal energy FEg one mole of Q-PbSe canabsorb:
Nexc =Eabs
FEg=
ln(10)εc0LτpI0
FEg∆Ep(9.30)
ε is the (energy integrated) molar absorption coefficient of thenanocrystals (section 7.3.2).
In between pulses, the number of nanocrystals that relax backto the ground state can be written as (τex � 1/ν):
Ndes = c∗L(1− exp(− 1ντex
)) ≈ c∗L
ντex(9.31)
In steady-state Nexc must equal Ndes. This yields following steadystate population of excited nanocrystals:
fSS =ln(10)ετpντexI0
FEg∆Ep + ln(10)ετpντexI0(9.32)
with corresponding saturation intensity:
Is,th =∆EpEgF
ln(10)ετpντex(9.33)
This gives a theoretical saturation intensity of 3 MW/cm2, anorder of magnitude lower than the experimentally observed one.It indicates that the fraction of excited nanocrystals is high evenat low optical intensity. More importantly, when plotting δn as afunction of fSS , the experimental δn increases markedly at highfSS (figure 9.10(b)).
This large difference between the expected and the experi-mental saturation intensity can be explained by the creation of
172
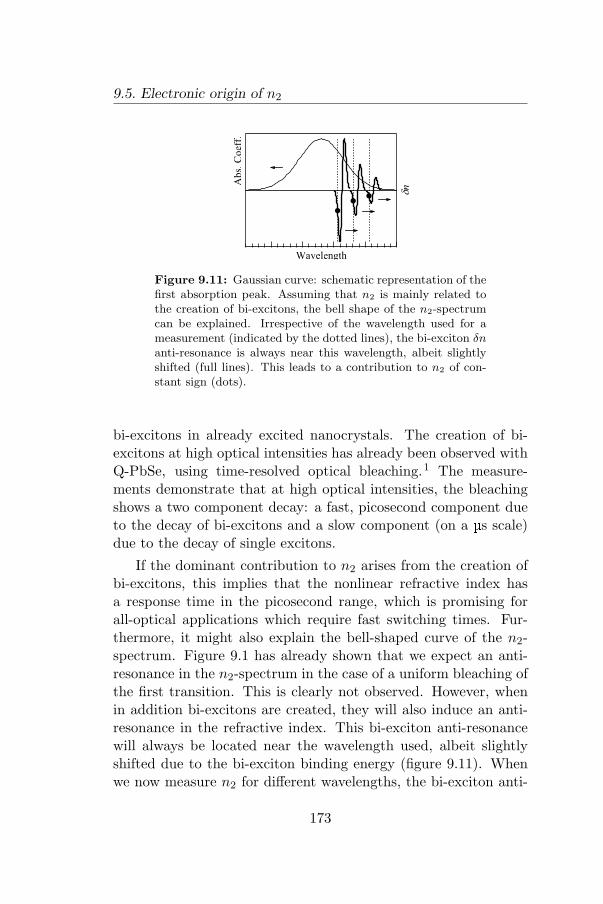
9.5. Electronic origin of n2
Abs.
Coef
f.
Wavelength
dn
Figure 9.11: Gaussian curve: schematic representation of thefirst absorption peak. Assuming that n2 is mainly related tothe creation of bi-excitons, the bell shape of the n2-spectrumcan be explained. Irrespective of the wavelength used for ameasurement (indicated by the dotted lines), the bi-exciton δnanti-resonance is always near this wavelength, albeit slightlyshifted (full lines). This leads to a contribution to n2 of con-stant sign (dots).
bi-excitons in already excited nanocrystals. The creation of bi-excitons at high optical intensities has already been observed withQ-PbSe, using time-resolved optical bleaching.1 The measure-ments demonstrate that at high optical intensities, the bleachingshows a two component decay: a fast, picosecond component dueto the decay of bi-excitons and a slow component (on a µs scale)due to the decay of single excitons.
If the dominant contribution to n2 arises from the creation ofbi-excitons, this implies that the nonlinear refractive index hasa response time in the picosecond range, which is promising forall-optical applications which require fast switching times. Fur-thermore, it might also explain the bell-shaped curve of the n2-spectrum. Figure 9.1 has already shown that we expect an anti-resonance in the n2-spectrum in the case of a uniform bleaching ofthe first transition. This is clearly not observed. However, whenin addition bi-excitons are created, they will also induce an anti-resonance in the refractive index. This bi-exciton anti-resonancewill always be located near the wavelength used, albeit slightlyshifted due to the bi-exciton binding energy (figure 9.11). Whenwe now measure n2 for different wavelengths, the bi-exciton anti-
173
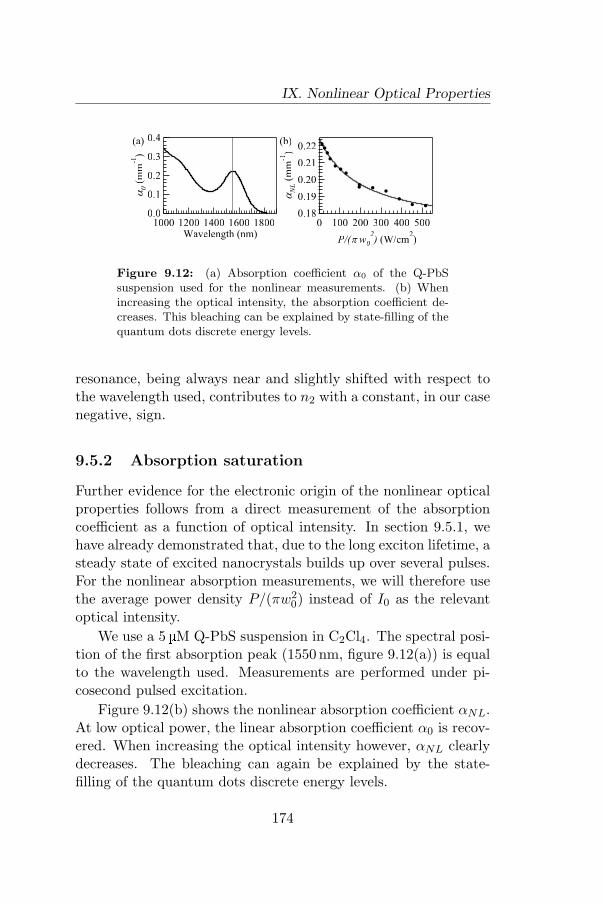
IX. Nonlinear Optical Properties
0.4
0.3
0.2
0.1
0.0
a0 (
mm
-1)
18001600140012001000Wavelength (nm)
(a)0.22
0.21
0.20
0.19
0.18
aN
L (
mm
-1)
5004003002001000
P/(p w0
2) (W/cm
2)
(b)
Figure 9.12: (a) Absorption coefficient α0 of the Q-PbSsuspension used for the nonlinear measurements. (b) Whenincreasing the optical intensity, the absorption coefficient de-creases. This bleaching can be explained by state-filling of thequantum dots discrete energy levels.
resonance, being always near and slightly shifted with respect tothe wavelength used, contributes to n2 with a constant, in our casenegative, sign.
9.5.2 Absorption saturation
Further evidence for the electronic origin of the nonlinear opticalproperties follows from a direct measurement of the absorptioncoefficient as a function of optical intensity. In section 9.5.1, wehave already demonstrated that, due to the long exciton lifetime, asteady state of excited nanocrystals builds up over several pulses.For the nonlinear absorption measurements, we will therefore usethe average power density P/(πw2
0) instead of I0 as the relevantoptical intensity.
We use a 5 µM Q-PbS suspension in C2Cl4. The spectral posi-tion of the first absorption peak (1550 nm, figure 9.12(a)) is equalto the wavelength used. Measurements are performed under pi-cosecond pulsed excitation.
Figure 9.12(b) shows the nonlinear absorption coefficient αNL.At low optical power, the linear absorption coefficient α0 is recov-ered. When increasing the optical intensity however, αNL clearlydecreases. The bleaching can again be explained by the state-filling of the quantum dots discrete energy levels.
174

9.6. Conclusions
As a change in absorption must be accompanied by a changein refractive index (section 9.2), we have hereby indirectly demon-strated that the nanocrystals possess an electronic n2. Similareffects have been observed on Q-PbSe core and core-shell suspen-sions, and further studies are undertaken.
9.6 Conclusions
We study the nonlinear optical properties of colloid lead chalco-genide nanocrystals with the Z-scan technique as a function ofwavelength, optical intensity and sample concentration. To cor-rectly fit the experimental data, the electric field at the aperture isexpanded up to the third order in the nonlinear phase shift ∆φ0,and thermal effects are taken into account.
As we measure the nonlinear refractive index for absorbingparticles, the absorbed energy is partly converted to heat, leadingto thermal lensing. The resulting thermo-optical coefficient dn/dTagrees with literature data.
Under femtosecond pulsed excitation, the Q-PbSe electronicn2-spectrum shows bell-shaped resonances, clearly correlated withthe nanocrystal absorption coefficient. Under picosecond pulsedexcitation, similar results are obtained, and comparison of Q-PbSand Q-PbSe n2-values around 1550 nm shows that the Q-PbSefigure of merit is comparable to Q-PbS.
The electronic origin of the nonlinear refractive index is furtherconfirmed by the saturation of the change in refractive index δn(for Q-PbSe, using femtosecond pulses) and by the observation ofabsorption saturation (for Q-PbS, using picosecond pulses). Bothcan be explained by state-filling of the quantum dots discrete en-ergy levels. However, the calculated saturation intensity is anorder of magnitude smaller than the experimentally observed one.This suggests that the creation of bi-excitons leads to a furtherincrease in δn.
In conclusion, we demonstrate that colloidal lead chalcogenidenanocrystals are efficient nonlinear materials, opening pathwaysfor all-optical signal processing on a Si platform.
175
Bibliography
[1] R. D. Schaller, M. A. Petruska and V. I. Klimov, Tunablenear-infrared optical gain and amplified spontaneous emis-sion using PbSe nanocrystals, J. Phys. Chem. B 2003, 107 ,13765–13768.
[2] V. I. Klimov et al., Single-exciton optical gain in semiconduc-tor nanocrystals, Nature 2007, 447 , 441–446.
[3] A. V. Malko et al., From amplified spontaneous emission tomicroring lasing using nanocrystal quantum dot solids, Appl.Phys. Lett. 2002, 81 , 1303–1305.
[4] M. Law et al., Determining the internal quantum efficiency ofPbSe nanocrystal solar cells with the aid of an optical model ,Nano Lett. 2008, 8 , 3904–3910.
[5] C. D. Donega, P. Liljeroth and D. Vanmaekelbergh, Physic-ochemical evaluation of the hot-injection method, a synthesisroute for monodisperse nanocrystals, Small 2005, 1 , 1152–1162.
[6] E. H. Sargent, Infrared quantum dots, Adv. Mater. 2005, 17 ,515–522.
[7] C. Burda et al., Chemistry and properties of nanocrystals ofdifferent shapes, Chem. Rev. 2005, 105 , 1025–1102.
[8] L. Brus, Electronic wave-functions in semiconductor clusters- experiment and theory , J. Phys. Chem. 1986, 90 , 2555–2560.
[9] A. D. Yoffe, Low-dimensional systems - quantum-size effectsand electronic-properties of semiconductor microcrystallites(zero-dimensional systems) and some quasi-2-dimensionalsystems, Adv. Phys. 1993, 42 , 173–266.
[10] G. Allan and C. Delerue, Confinement effects in PbSe quan-tum wells and nanocrystals, Phys. Rev. B 2004, 70 , 245321.
[11] J. M. An et al., The peculiar electronic structure of PbSequantum dots, Nano Lett. 2006, 6 , 2728–2735.
[12] T. Rajh, O. I. Micic and A. J. Nozik, Synthesis and charac-terization of surface-modified colloidal CdTe quantum dots, J.
176
Phys. Chem. 1993, 97 , 11999–12003.[13] O. Schmelz et al., Supramolecular complexes from CdSe nano-
crystals and organic fluorophors, Langmuir 2001, 17 , 2861–2865.
[14] C. A. Leatherdale et al., On the absorption cross section ofCdSe nanocrystal quantum dots, J. Phys. Chem. B 2002, 106 ,7619–7622.
[15] W. W. Yu et al., Experimental determination of the extinctioncoefficient of CdTe, CdSe, and CdS nanocrystals, Chem. Mat.2003, 15 , 2854–2860.
[16] P. R. Yu et al., Absorption cross-section and related opticalproperties of colloidal InAs quantum dots, J. Phys. Chem. B2005, 109 , 7084–7087.
[17] L. Cademartiri et al., Size-dependent extinction coefficientsof PbS quantum dots, J. Am. Chem. Soc. 2006, 128 , 10337–10346.
[18] J. C. Maxwell Garnett, Colours in metal glasses and in metal-lic films, Philos. Tr. R. Soc.–A 1904, 203 , 385–420.
[19] J. C. Maxwell Garnett, Colours in metal glasses, in metallicfilms, and in metallic solutions. II , Philos. Tr. R. Soc.–A1906, 205 , 237–288.
[20] M. Sheikbahae et al., Sensitive measurement of optical non-linearities using a single beam, IEEE J. Quantum Electron.1990, 26 , 760–769.
[21] D. Ricard, M. Ghanassi and M. C. Schanneklein, Dielectricconfinement and the linear and nonlinear-optical propertiesof semiconductor-doped glasses, Opt. Commun. 1994, 108 ,311–318.
[22] P. Mallet, C. A. Guerin and A. Sentenac, Maxwell-Garnettmixing rule in the presence of multiple scattering: Derivationand accuracy , Phys. Rev. B 2005, 72 , 014205.
[23] D. E. Aspnes, Local-field effects and effective-medium theory:A microscopic perspective, Am. J. Phys. 1982, 50 , 704–709.
[24] R. J. Gehr and R. W. Boyd, Optical properties of nanostruc-
177
tured optical materials, Chem. Mat. 1996, 8 , 1807–1819.[25] A. Sihvola, Two main avenues leading to the Maxwell Garnett
mixing rule, J. Electromagnet. Wave 2001, 15 , 715–725.[26] N. Suzuki, K. Sawai and S. Adachi, Optical properties of
PbSe, J. Appl. Phys. 1995, 77 , 1249–1255.[27] H. H. Marvin, The selective transmission and the dispersion
of the liquid chlorides, Phys. Rev. 1912, 34 , 161.[28] T. Vossmeyer et al., CdS nanoclusters - synthesis, character-
ization, size-dependent oscillator strength, temperature shiftof the excitonic-transition energy, and reversible absorbencyshift , J. Phys. Chem. 1994, 98 , 7665–7673.
[29] E. Merzbacher, Quantum mechanics, Wiley InternationalEdition, New York 1970, 2nd ed.
[30] J. N. Zemel, J. D. Jensen and R. B. Schoolar, Electrical andoptical properties of epitaxial films of PbS PbSe PbTe andSnTe, Phys. Rev. 1965, 140 , A330–A342.
[31] Y. Kayanuma, Quantum-size effects of interacting elec-trons and holes in semiconductor microcrystals with sphericalshape, Phys. Rev. B 1988, 38 , 9797–9805.
[32] Y. Wang and N. Herron, Nanometer-sized semiconductorclusters - materials synthesis, quantum size effects, and pho-tophysical properties, J. Phys. Chem. 1991, 95 , 525–532.
[33] H. Kanazawa and S. Adachi, Optical properties of PbS , J.Appl. Phys. 1998, 83 , 5997–6001.
[34] A. J. Cox, A. J. DeWeerd and J. Linden, An experiment tomeasure Mie and Rayleigh total scattering cross sections, Am.J. Phys. 2002, 70 , 620–625.
[35] A. I. Ekimov et al., Absorption and intensity-dependent pho-toluminescence measurements on CdSe quantum dots: assign-ment of the first electronic transitions, J. Opt. Soc. Am. B1993, 10 , 100.
[36] R. J. Ellingson et al., Highly efficient multiple exciton gen-eration in colloidal PbSe and PbS quantum dots, Nano Lett.2005, 5 , 865–871.
178

[37] R. Koole et al., Optical investigation of quantum confinementin PbSe nanocrystals at different points in the Brillouin zone,Small 2008, 4 , 127–133.
[38] N. Suzuki and S. Adachi, Optical properties of PbTe, Jpn. J.Appl. Phys. 1994, 33 , 193–198.
[39] L.-W. Wang and A. Zunger, Dielectric constants of siliconquantum dots, Phys. Rev. Lett. 1994, 73 , 1039.
[40] C. Delerue, M. Lannoo and G. Allan, Concept of dielectricconstant for nanosized systems, Phys. Rev. B 2003, 68 .
[41] Z. Hens et al., Effect of quantum confinement on the dielectricfunction of PbSe, Phys. Rev. Lett. 2004, 92 .
[42] M. Bruchez et al., Semiconductor nanocrystals as fluorescentbiological labels, Science 1998, 281 , 2013–2016.
[43] X. Michalet et al., Quantum dots for live cells, in vivo imag-ing, and diagnostics, Science 2005, 307 , 538–544.
[44] J. S. Steckel et al., Color-saturated green-emitting QD-LEDs,Angew. Chem.-Int. Edit. 2006, 45 , 5796–5799.
[45] A. Rogach et al., Light-emitting diodes with semiconductornanocrystals, Angew. Chem.-Int. Edit. 2008, 47 , 6538–6549.
[46] G. Priem et al., Design of all-optical nonlinear functionalitiesbased on resonators, IEEE J. Sel. Top. Quantum Electron.2004, 10 , 1070–1078.
[47] C. Koos et al., Nonlinear silicon-on-insulator waveguides forall-optical signal processing , Opt. Express 2007, 15 , 5976–5990.
[48] M. Dinu, F. Quochi and H. Garcia, Third-order nonlinearitiesin silicon at telecom wavelengths, Appl. Phys. Lett. 2003, 82 ,2954–2956.
[49] A. A. Said et al., Determination of bound-electronic and free-carrier nonlinearities in ZnSe, GaAs, CdTe, and ZnTe, J.Opt. Soc. Am. B 1992, 9 , 405–414.
[50] F. de Rougemont and R. Frey, Two-level approach to satu-ration properties in semiconductor materials, Phys. Rev. B1988, 37 , 1237.
179
[51] A. Melikyan and G. Minasyan, Saturation of interband ab-sorption in semiconductors, Semiconductors 2000, 34 , 386–388.
[52] M. Sheikbahae et al., Dispersion of bound electronic nonlinearrefraction in solids, IEEE J. Quantum Electron. 1991, 27 ,1296–1309.
[53] M. Sheikbahae, D. J. Hagan and E. W. Vanstryland, Disper-sion and band-gap scaling of the electronic kerr effect in solidsassociated with 2-photon absorption, Phys. Rev. Lett. 1990,65 , 96–99.
[54] A. Villeneuve et al., Nonlinear Refractive-Index and 2Photon-Absorption near Half the Band-Gap in AlGaAs, Appl.Phys. Lett. 1993, 62 , 2465–2467.
[55] G. Lenz et al., Large Kerr effect in bulk Se-based chalcogenideglasses, Opt. Lett. 2000, 25 , 254–256.
[56] T. G. Juliet et al., Third order nonlinearities in Ge-As-Se-based glasses for telecommunications applications, J. Appl.Phys. 2004, 96 , 6931–6933.
[57] S. Schmittrink, D. A. B. Miller and D. S. Chemla, Theory ofthe linear and nonlinear optical-properties of semiconductormicrocrystallites, Phys. Rev. B 1987, 35 , 8113–8125.
[58] G. L. Tan et al., Linear and non-linear optical properties ofcapped CdTe nanocrystals prepared by mechanical alloying ,Opt. Mater. 2004, 27 , 579–584.
[59] N. Venkatram, D. N. Rao and M. A. Akundi, Nonlinearabsorption, scattering and optical limiting studies of CdSnanoparticles, Opt. Express 2005, 13 , 867–872.
[60] J. He et al., Observation of interband two-photon absorptionsaturation in CdS nanocrystals, J. Phys. Chem. B 2005, 109 ,19184–19187.
[61] G. Banfi, V. Degiorgio and D. Ricard, Nonlinear optical prop-erties of semiconductor nanocrystals, Adv. Phys. 1998, 47 ,447–510.
[62] M. Falconieri, Thermo-optical effects in Z-scan measurementsusing high-repetition-rate lasers, J. Opt. A–Pure Appl. Op.
180

1999, 1 , 662–667.[63] S. Valkai, J. Liszi and I. Szalai, Temperature dependence of
the refractive index for three chloromethane liquids at 514.5nm and 632.8 nm wavelengths, J. Chem. Thermodyn. 1998,30 , 825–832.
181

182

Part 4
Integration of colloidalsemiconductor nanocrystals
with Silicon-on-Insulatorphotonic devices

Introduction
Silicon-on-Insulator (SOI) photonics provides a strong platformfor all-optical signal processing. It is compatible with CMOStechnology, and devices can be miniaturized down to the micronscale. Consequently, several passive devices have already been de-monstrated using SOI rib waveguides and/or photonic crystals.1–3
Working on a silicon platform has major drawbacks however. Witha band gap of 1.12 eV (absorption edge at 1.1 µm), silicon is notsuitable for light detection at telecom wavelengths of 1.3 and1.55 µm. Furthermore, the indirect band gap prohibits efficientlight emission, and the intrinsic nonlinear optical properties of sil-icon and the corresponding figure of merit are small.4 As a resultof these restraints, active photonic devices will most probably beof a hybrid nature,5 where a strongly luminescent and/or nonlin-ear material with the appropriate band gap is combined with theadvantages of SOI (although all-silicon solutions are intensivelystudied as well2,6–8).
Promising candidates for this approach are colloidal semicon-ductor nanocrystals or quantum dots. We have already shownthat they possess a high photoluminescence efficiency and highnonlinear refractive index. In this part, we first explore differentdeposition techniques in order to integrate colloidal lead chalco-genide nanocrystals with SOI technology. Next, we describe thelinear and nonlinear transmission characteristics of the resultinghybrid photonic devices.
185

186

Chapter X
Deposition techniques
10.1 Introduction
Colloidal nanocrystals are synthesized using wet chemical tech-niques (chapters II and III). This has a distinct advantage: thetechnique does not rely on a substrate to grow the particles on.Consequently, a large variety of materials and sizes can be synthe-sized using similar methods,9–12 and subsequent processing of thenanocrystals can be decoupled from the synthesis. Since colloidalnanoparticles are suspended in a solvent, a whole set of wet deposi-tion techniques is available, ranging from dip-13 and spincoating toLangmuir-Blodgett deposition of monolayers of nanocrystals. Inthis chapter, we will explore three techniques: Langmuir-Blodgettdeposition for the formation of a monolayer of nanocrystals on asubstrate, dropcasting for the deposition of a thick, close-packedlayer, and spincoating of a quantum dot doped polymer hybridmaterial.
10.2 Langmuir-Blodgett deposition
10.2.1 Deposition on flat substrates
Monolayers of Q-PbSe are deposited on various substrates by theLangmuir-Blodgett (LB) technique. All depositions are performed
187
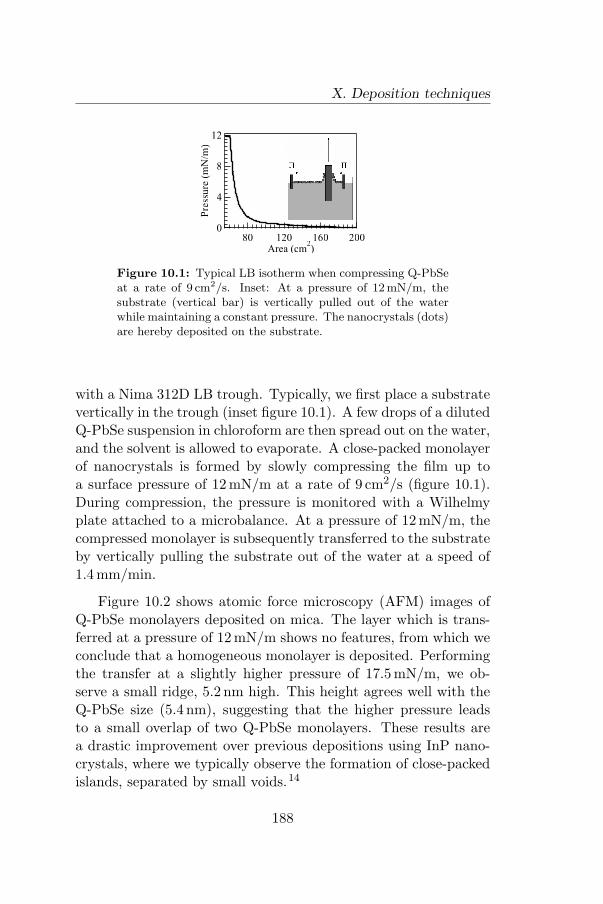
X. Deposition techniques
12
8
4
0
Pre
ssure
(m
N/m
)
20016012080Area (cm
2)
Figure 10.1: Typical LB isotherm when compressing Q-PbSeat a rate of 9 cm2/s. Inset: At a pressure of 12 mN/m, thesubstrate (vertical bar) is vertically pulled out of the waterwhile maintaining a constant pressure. The nanocrystals (dots)are hereby deposited on the substrate.
with a Nima 312D LB trough. Typically, we first place a substratevertically in the trough (inset figure 10.1). A few drops of a dilutedQ-PbSe suspension in chloroform are then spread out on the water,and the solvent is allowed to evaporate. A close-packed monolayerof nanocrystals is formed by slowly compressing the film up toa surface pressure of 12 mN/m at a rate of 9 cm2/s (figure 10.1).During compression, the pressure is monitored with a Wilhelmyplate attached to a microbalance. At a pressure of 12 mN/m, thecompressed monolayer is subsequently transferred to the substrateby vertically pulling the substrate out of the water at a speed of1.4mm/min.
Figure 10.2 shows atomic force microscopy (AFM) images ofQ-PbSe monolayers deposited on mica. The layer which is trans-ferred at a pressure of 12 mN/m shows no features, from which weconclude that a homogeneous monolayer is deposited. Performingthe transfer at a slightly higher pressure of 17.5 mN/m, we ob-serve a small ridge, 5.2 nm high. This height agrees well with theQ-PbSe size (5.4 nm), suggesting that the higher pressure leadsto a small overlap of two Q-PbSe monolayers. These results area drastic improvement over previous depositions using InP nano-crystals, where we typically observe the formation of close-packedislands, separated by small voids.14
188

10.2. Langmuir-Blodgett deposition
10µm5µm
12840
12840h
(n
m)
(a) (b)
Figure 10.2: (a) Typical AFM image of a Q-PbSe monolayerdeposited on mica at a pressure of 12 mN/m. No features canbe distinguished, demonstrating the homogeneity of the layer.(b) When depositing a monolayer at an increased pressure of17.5 mN/m, we observe a ridge of 5.2 nm, indicating two over-lapping monolayers.
10.2.2 Local deposition on silicon and SOI devices
Integration of colloidal nanocrystals in various devices often re-quires deposition at very specific places on a substrate. This weachieve by Langmuir-Blodgett deposition of a nanocrystal mono-layer on a silicon substrate, partly protected by photoresist. A1 µm photoresist layer is spincoated on the substrate, and we useoptical lithography to define patterns. After LB deposition of theQ-PbSe on the patterned substrate, the resist is removed by sub-sequently dipping the sample in acetone (60 s), isopropanol (45 s)and distilled water (30 s). After photoresist removal, the samplesare measured with scanning electron microscopy (SEM). Figure10.3(a) shows the local deposition of a 50x50 µm Q-PbSe mono-layer. A homogeneous deposition is obtained, with a sharp edgeseparating the layer from the bare silicon substrate. This indicatesboth the efficient filling of the pattern with a monolayer and thecomplete removal of the nanocrystals which were on top of thephotoresist.
This technique is also applicable for the deposition of a mono-layer on top of SOI devices, as shown in figure 10.3(b) by a localdeposition on one arm of a Mach-Zehnder interferometer.
189
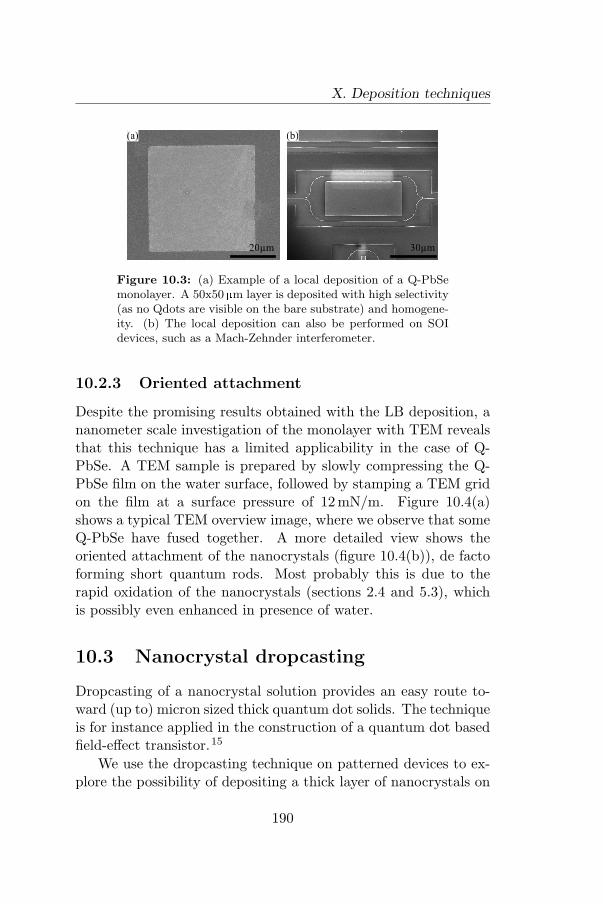
X. Deposition techniques
20µm
(a)
30µm
(b)
Figure 10.3: (a) Example of a local deposition of a Q-PbSemonolayer. A 50x50 µm layer is deposited with high selectivity(as no Qdots are visible on the bare substrate) and homogene-ity. (b) The local deposition can also be performed on SOIdevices, such as a Mach-Zehnder interferometer.
10.2.3 Oriented attachment
Despite the promising results obtained with the LB deposition, ananometer scale investigation of the monolayer with TEM revealsthat this technique has a limited applicability in the case of Q-PbSe. A TEM sample is prepared by slowly compressing the Q-PbSe film on the water surface, followed by stamping a TEM gridon the film at a surface pressure of 12 mN/m. Figure 10.4(a)shows a typical TEM overview image, where we observe that someQ-PbSe have fused together. A more detailed view shows theoriented attachment of the nanocrystals (figure 10.4(b)), de factoforming short quantum rods. Most probably this is due to therapid oxidation of the nanocrystals (sections 2.4 and 5.3), whichis possibly even enhanced in presence of water.
10.3 Nanocrystal dropcasting
Dropcasting of a nanocrystal solution provides an easy route to-ward (up to) micron sized thick quantum dot solids. The techniqueis for instance applied in the construction of a quantum dot basedfield-effect transistor.15
We use the dropcasting technique on patterned devices to ex-plore the possibility of depositing a thick layer of nanocrystals on
190
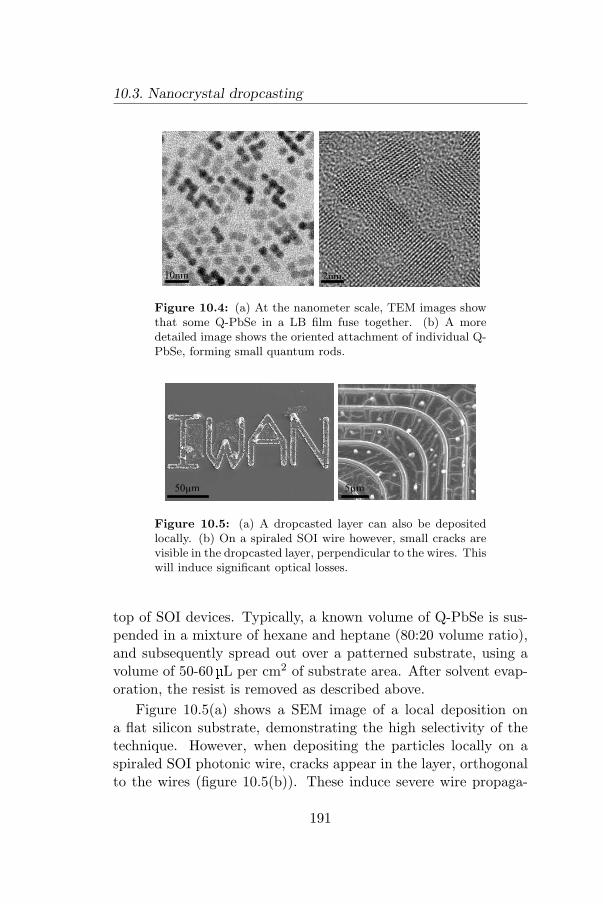
10.3. Nanocrystal dropcasting
10nm 2nm
Figure 10.4: (a) At the nanometer scale, TEM images showthat some Q-PbSe in a LB film fuse together. (b) A moredetailed image shows the oriented attachment of individual Q-PbSe, forming small quantum rods.
5µm50µm
Figure 10.5: (a) A dropcasted layer can also be depositedlocally. (b) On a spiraled SOI wire however, small cracks arevisible in the dropcasted layer, perpendicular to the wires. Thiswill induce significant optical losses.
top of SOI devices. Typically, a known volume of Q-PbSe is sus-pended in a mixture of hexane and heptane (80:20 volume ratio),and subsequently spread out over a patterned substrate, using avolume of 50-60 µL per cm2 of substrate area. After solvent evap-oration, the resist is removed as described above.
Figure 10.5(a) shows a SEM image of a local deposition ona flat silicon substrate, demonstrating the high selectivity of thetechnique. However, when depositing the particles locally on aspiraled SOI photonic wire, cracks appear in the layer, orthogonalto the wires (figure 10.5(b)). These induce severe wire propaga-
191
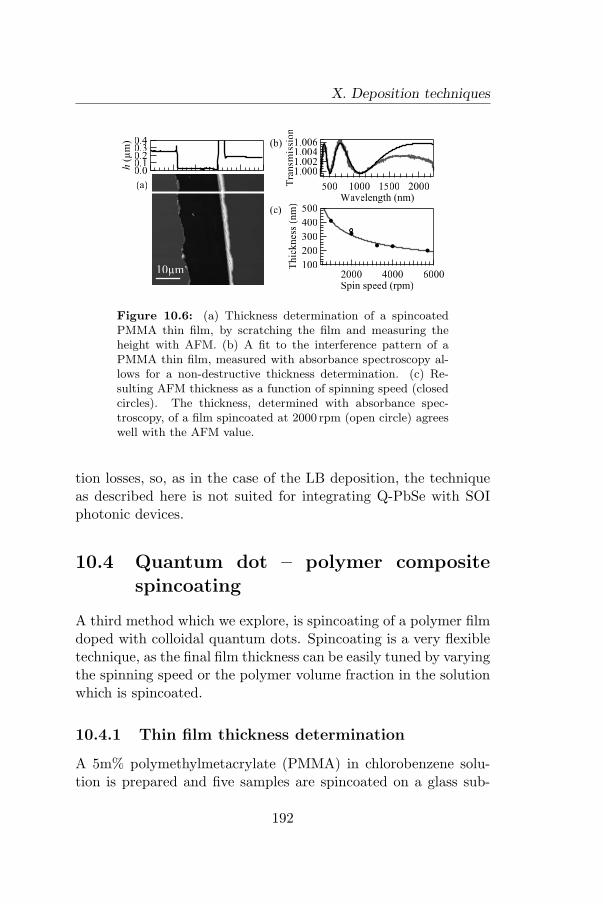
X. Deposition techniques
0.40.30.20.10.0h
(µ
m)
10µm
1.0061.0041.0021.000
Tra
nsm
issi
on
200015001000500Wavelength (nm)
500
400
300
200
100Th
ick
nes
s (n
m)
600040002000Spin speed (rpm)
(a)
(b)
(c)
Figure 10.6: (a) Thickness determination of a spincoatedPMMA thin film, by scratching the film and measuring theheight with AFM. (b) A fit to the interference pattern of aPMMA thin film, measured with absorbance spectroscopy al-lows for a non-destructive thickness determination. (c) Re-sulting AFM thickness as a function of spinning speed (closedcircles). The thickness, determined with absorbance spec-troscopy, of a film spincoated at 2000 rpm (open circle) agreeswell with the AFM value.
tion losses, so, as in the case of the LB deposition, the techniqueas described here is not suited for integrating Q-PbSe with SOIphotonic devices.
10.4 Quantum dot – polymer compositespincoating
A third method which we explore, is spincoating of a polymer filmdoped with colloidal quantum dots. Spincoating is a very flexibletechnique, as the final film thickness can be easily tuned by varyingthe spinning speed or the polymer volume fraction in the solutionwhich is spincoated.
10.4.1 Thin film thickness determination
A 5m% polymethylmetacrylate (PMMA) in chlorobenzene solu-tion is prepared and five samples are spincoated on a glass sub-
192
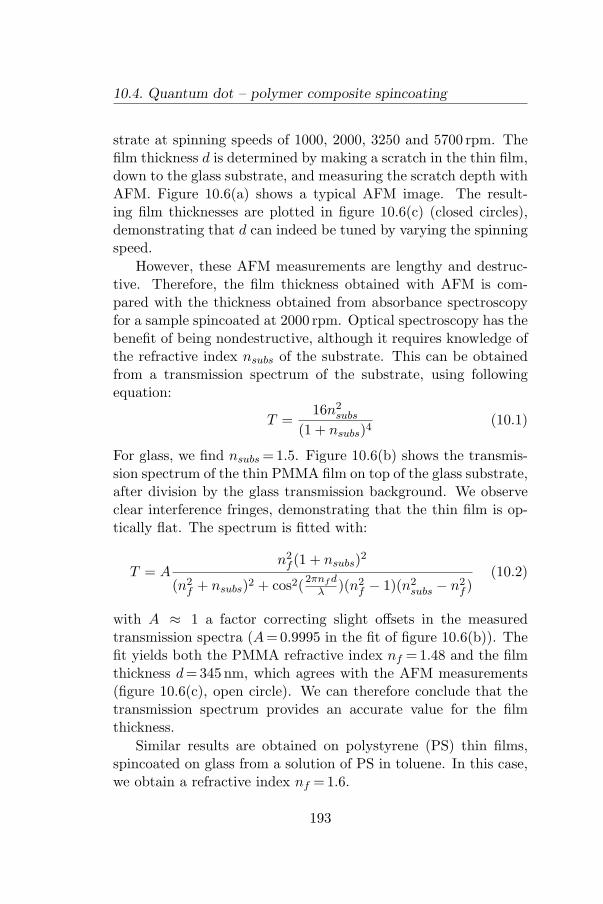
10.4. Quantum dot – polymer composite spincoating
strate at spinning speeds of 1000, 2000, 3250 and 5700 rpm. Thefilm thickness d is determined by making a scratch in the thin film,down to the glass substrate, and measuring the scratch depth withAFM. Figure 10.6(a) shows a typical AFM image. The result-ing film thicknesses are plotted in figure 10.6(c) (closed circles),demonstrating that d can indeed be tuned by varying the spinningspeed.
However, these AFM measurements are lengthy and destruc-tive. Therefore, the film thickness obtained with AFM is com-pared with the thickness obtained from absorbance spectroscopyfor a sample spincoated at 2000 rpm. Optical spectroscopy has thebenefit of being nondestructive, although it requires knowledge ofthe refractive index nsubs of the substrate. This can be obtainedfrom a transmission spectrum of the substrate, using followingequation:
T =16n2
subs
(1 + nsubs)4(10.1)
For glass, we find nsubs =1.5. Figure 10.6(b) shows the transmis-sion spectrum of the thin PMMA film on top of the glass substrate,after division by the glass transmission background. We observeclear interference fringes, demonstrating that the thin film is op-tically flat. The spectrum is fitted with:
T = An2
f (1 + nsubs)2
(n2f + nsubs)2 + cos2(2πnf d
λ )(n2f − 1)(n2
subs − n2f )
(10.2)
with A ≈ 1 a factor correcting slight offsets in the measuredtransmission spectra (A =0.9995 in the fit of figure 10.6(b)). Thefit yields both the PMMA refractive index nf =1.48 and the filmthickness d =345 nm, which agrees with the AFM measurements(figure 10.6(c), open circle). We can therefore conclude that thetransmission spectrum provides an accurate value for the filmthickness.
Similar results are obtained on polystyrene (PS) thin films,spincoated on glass from a solution of PS in toluene. In this case,we obtain a refractive index nf = 1.6.
193
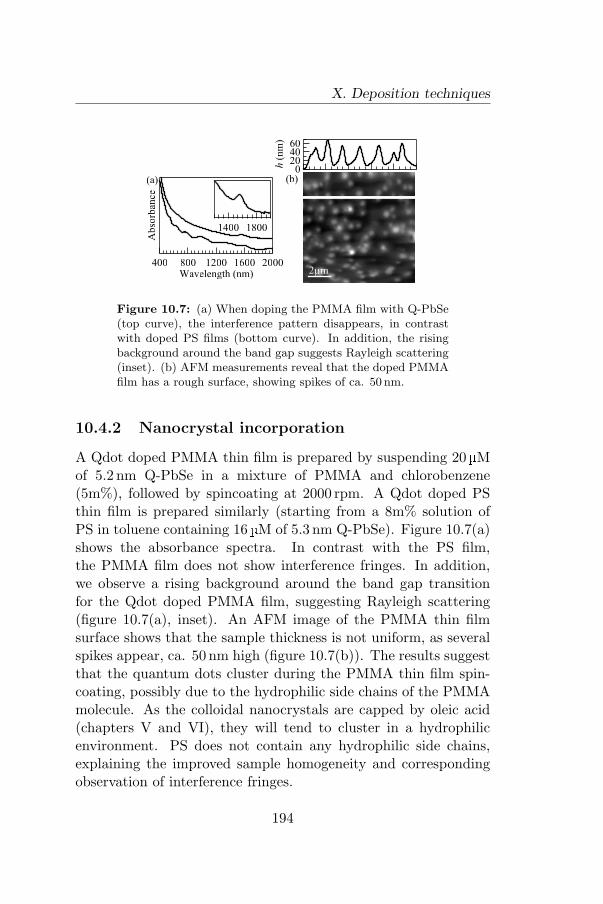
X. Deposition techniques
6040200h
(n
m)
(b)
2µm
Ab
sorb
ance
200016001200800400Wavelength (nm)
(a)
18001400
Figure 10.7: (a) When doping the PMMA film with Q-PbSe(top curve), the interference pattern disappears, in contrastwith doped PS films (bottom curve). In addition, the risingbackground around the band gap suggests Rayleigh scattering(inset). (b) AFM measurements reveal that the doped PMMAfilm has a rough surface, showing spikes of ca. 50 nm.
10.4.2 Nanocrystal incorporation
A Qdot doped PMMA thin film is prepared by suspending 20 µMof 5.2 nm Q-PbSe in a mixture of PMMA and chlorobenzene(5m%), followed by spincoating at 2000 rpm. A Qdot doped PSthin film is prepared similarly (starting from a 8m% solution ofPS in toluene containing 16 µM of 5.3 nm Q-PbSe). Figure 10.7(a)shows the absorbance spectra. In contrast with the PS film,the PMMA film does not show interference fringes. In addition,we observe a rising background around the band gap transitionfor the Qdot doped PMMA film, suggesting Rayleigh scattering(figure 10.7(a), inset). An AFM image of the PMMA thin filmsurface shows that the sample thickness is not uniform, as severalspikes appear, ca. 50 nm high (figure 10.7(b)). The results suggestthat the quantum dots cluster during the PMMA thin film spin-coating, possibly due to the hydrophilic side chains of the PMMAmolecule. As the colloidal nanocrystals are capped by oleic acid(chapters V and VI), they will tend to cluster in a hydrophilicenvironment. PS does not contain any hydrophilic side chains,explaining the improved sample homogeneity and correspondingobservation of interference fringes.
194
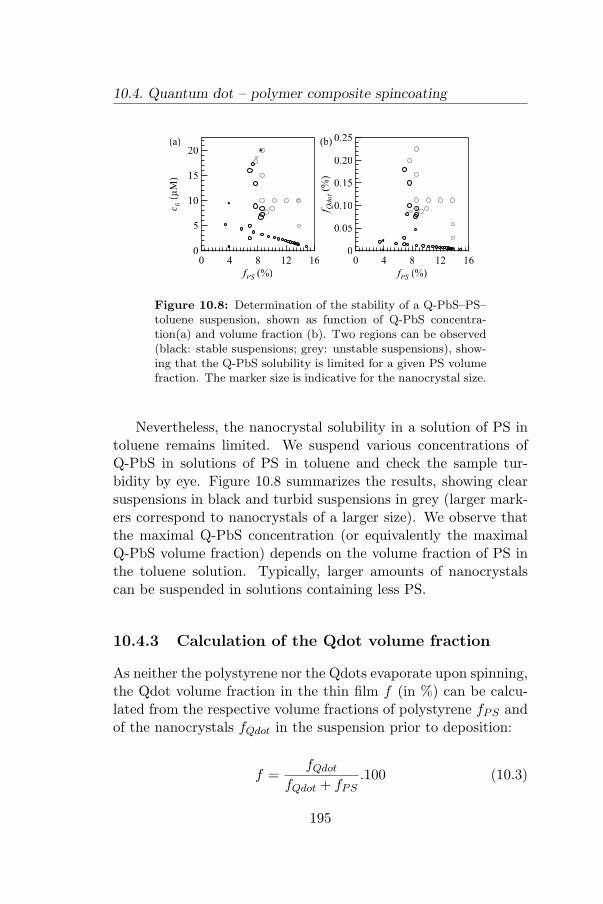
10.4. Quantum dot – polymer composite spincoating
0.25
0.20
0.15
0.10
0.05
0
f Qdot (
%)
1612840
fPS (%)
(b)20
15
10
5
0
c 0 (
µM
)
1612840
fPS (%)
(a)
Figure 10.8: Determination of the stability of a Q-PbS–PS–toluene suspension, shown as function of Q-PbS concentra-tion(a) and volume fraction (b). Two regions can be observed(black: stable suspensions; grey: unstable suspensions), show-ing that the Q-PbS solubility is limited for a given PS volumefraction. The marker size is indicative for the nanocrystal size.
Nevertheless, the nanocrystal solubility in a solution of PS intoluene remains limited. We suspend various concentrations ofQ-PbS in solutions of PS in toluene and check the sample tur-bidity by eye. Figure 10.8 summarizes the results, showing clearsuspensions in black and turbid suspensions in grey (larger mark-ers correspond to nanocrystals of a larger size). We observe thatthe maximal Q-PbS concentration (or equivalently the maximalQ-PbS volume fraction) depends on the volume fraction of PS inthe toluene solution. Typically, larger amounts of nanocrystalscan be suspended in solutions containing less PS.
10.4.3 Calculation of the Qdot volume fraction
As neither the polystyrene nor the Qdots evaporate upon spinning,the Qdot volume fraction in the thin film f (in %) can be calcu-lated from the respective volume fractions of polystyrene fPS andof the nanocrystals fQdot in the suspension prior to deposition:
f =fQdot
fQdot + fPS.100 (10.3)
195
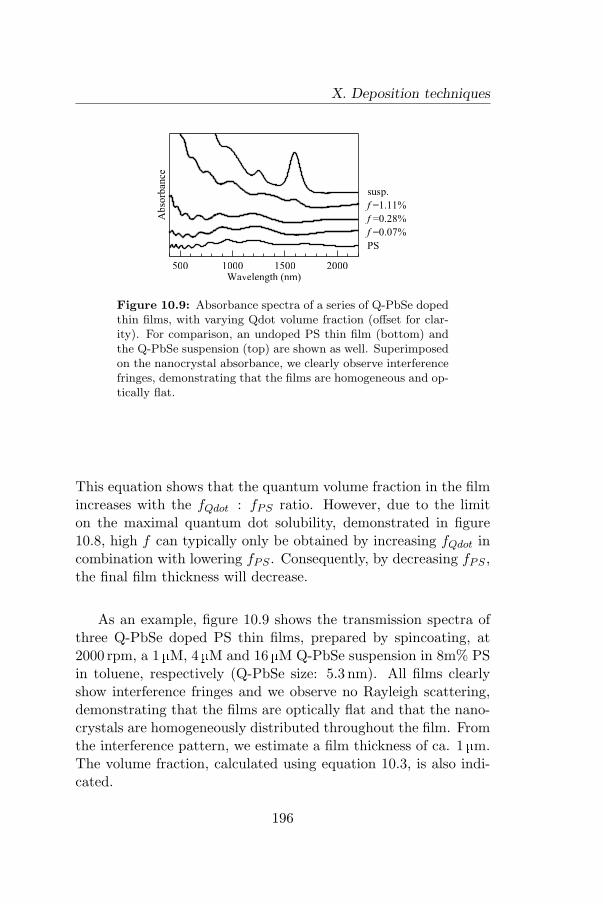
X. Deposition techniques
Ab
sorb
ance
200015001000500Wavelength (nm)
susp.
f =1.11%
f =0.28%
f =0.07%
PS
Figure 10.9: Absorbance spectra of a series of Q-PbSe dopedthin films, with varying Qdot volume fraction (offset for clar-ity). For comparison, an undoped PS thin film (bottom) andthe Q-PbSe suspension (top) are shown as well. Superimposedon the nanocrystal absorbance, we clearly observe interferencefringes, demonstrating that the films are homogeneous and op-tically flat.
This equation shows that the quantum volume fraction in the filmincreases with the fQdot : fPS ratio. However, due to the limiton the maximal quantum dot solubility, demonstrated in figure10.8, high f can typically only be obtained by increasing fQdot incombination with lowering fPS . Consequently, by decreasing fPS ,the final film thickness will decrease.
As an example, figure 10.9 shows the transmission spectra ofthree Q-PbSe doped PS thin films, prepared by spincoating, at2000 rpm, a 1 µM, 4 µM and 16 µM Q-PbSe suspension in 8m% PSin toluene, respectively (Q-PbSe size: 5.3 nm). All films clearlyshow interference fringes and we observe no Rayleigh scattering,demonstrating that the films are optically flat and that the nano-crystals are homogeneously distributed throughout the film. Fromthe interference pattern, we estimate a film thickness of ca. 1 µm.The volume fraction, calculated using equation 10.3, is also indi-cated.
196

10.5. Conclusions
10.5 Conclusions
Several techniques are explored to deposit a nanocrystal layer ontop of flat substrates and SOI devices. Langmuir-Blodgett depo-sition and dropcasting both have their specific drawbacks. Thesedo not fundamentally limit their applicability. Further optimiza-tion of the LB technique might resolve the problems of orientedattachment, by using for instance more stable nanocrystals like Q-PbS. Also, recently published work on Q-PbSe solar cells describestechniques to deposit a thick homogeneous close-packed layer, bylayer-by-layer dipcoating.13
Good results are obtained by depositing a quantum dot dopedpolymer thin film by spincoating. In this case, the choice of poly-mer remains crucial, as doped PS thin films show a markedly im-proved film flatness and Qdot homogeneity with respect to dopedPMMA thin films. However, depending on the desired thin filmproperties, a trade-off must be made between obtaining a highfilm thickness (high fPS) and a high quantum dot volume frac-tion in the film (high fQdot), due to the limited solubility of thenanocrystals in PS-toluene mixtures.
197

198

Chapter XI
Colloidal quantum dot –Silicon-on-Insulator hybridphotonic devices
11.1 Introduction
In this chapter, we describe the integration of colloidal lead chalco-genide nanocrystals with SOI technology to create a hybrid Qdot–SOI notch filter. We will show that the light propagating throughthe silicon wires strongly interacts with the Qdots in a doped PSthin film, spincoated on top of the wires. The optical losses of thecoated notch filters are calculated from the transmission spectrumand compared to the Qdot absorption coefficient. Efficient tuningof the output characteristics of the Qdot–SOI hybrid notch filterby varying the Qdot size and volume fraction is demonstrated.Measurements of optical nonlinearities are initiated, but variouspitfalls are discussed which have to be overcome before an efficientnonlinear device can be obtained.
199

XI. Hybrid photonic devices
-12
-8
-4
0
Loss
(dB
)
1554.41554.21554.01553.8Wavelength (nm)
(a) (b)
Figure 11.1: (a) Scanning electron microscope image of atypical SOI notch filter. (b) Transmission spectrum of a notchfilter around 1.55 µm. The ring length equals 39.4µm; thecoupling section Lc measures 4 µm, with a gap of ca. 200 nmbetween the ring and the photonic wire.
11.2 Transmission spectrum of an uncoatedSOI notch filter
The devices studied here consist of an SOI racetrack ring resonatorcoupled to a straight photonic wire (figure 11.1(a)). Typically, thewire has a width of 450 nm and a height of 220 nm. The ring hasa length L of 39.4 µm, with a coupling section Lc = 4 µm and abend radius of 5 µm. The gap between the ring resonator and thephotonic wire equals ca. 200 nm.
Only when the effective length of the ring resonator is equalto an integral number of wavelengths, efficient coupling to thering resonator mode occurs, hereby creating a band-stop, or notchfilter. A typical transmission resonance for our SOI notch filter isshown in figure 11.1(b). For this resonance, we obtain a Q-factorof ca. 14000 and extinction ratio ER = -12.5 dB.
11.2.1 Derivation of the notch filter transmissioncharacteristics
To gain more insight into the elements determining this Q-factorand extinction ratio, we write the resonance line width F (fullwidth at half maximum, equal to λ0/Q) and the normalized reso-nance depth D (equal to 10ER/10) in terms of the field amplitudetransmission a per round trip of the light in the ring, and the
200

11.2. Transmission spectrum of an uncoated SOI notch filter
Figure 11.2: Calculation of the transmission properties of anotch filter using the transfermatrix model. a1, aR, b1 and bR
denote the respective electric field amplitudes.
field amplitude transmission t of the ring–wire coupling section.16
Here, a=1 implies a lossless ring resonator, and t = 1 means thatall light is transmitted through the coupling section, i.e. no lightis coupled into the ring resonator.
The transfermatrix model for a notch filter, which couples theinput field amplitude a1 and the amplitude aR in the ring to theoutput amplitude b1 and bR, can be written as (figure 11.2):16[
b1
bR
]=[
t ikik t
] [a1
aR
](11.1)
The transfermatrix is unitary, which means that t2 + k2 = 1. Theamplitude aR after a round trip in the ring is related to bR through:
aR = a.bR exp(iφ) (11.2)
With φ the increase in phase after a round trip, given by:
φ =2πLneff (λ)
λ(11.3)
Note that we explicitly state that the effective index of the wireneff is wavelength-dependent. When normalizing all amplitudesto an input a1 =1, we obtain following output field power Ipass =|b1|2:
Ipass(λ) =a2 − 2 at cos
(2πLneff
λ
)+ t2
a2t2 − 2 at cos(
2πLneff
λ
)+ 1
(11.4)
201
XI. Hybrid photonic devices
This already demonstrates that a resonance occurs when
Lneff
λres= m (11.5)
with m the resonance mode number. When the resonance linewidth F is much smaller than the resonance wavelength λres, aTaylor series expansion up to first order of equation 11.4 yields(around a single resonance):
Ipass(λ) = 1− 1−D
1 + 4(λ−λres)2
F 2
(11.6)
F =(1− at)λ2
res
πLng
√at
D =(a− t)2
(1− at)2
The group index ng = neff−λ.dneff/dλ is obtained from the spec-tral positions of the ring resonances and the free spectral rangeFSR (distance between subsequent ring resonances):
ng =λ2
res
L.FSR(11.7)
For the uncoated ring, we find ng = 4.38, which yields a ≈t =0.99 from a fit to the resonance at 1554.1 nm using equation11.6. Clearly, the low loss and high transmission result in the highQ-factor, while the large extinction ratio is due to critical coupling(a= t).
11.3 Transmission of a hybrid Qdot–SOInotch filter
11.3.1 Deposition and characterization
The propagating mode in a photonic wire is not fully confinedto the silicon core. A simulation of the mode profile, of a wirecoated with a PS cladding, demonstrates that the evanescent tail
202
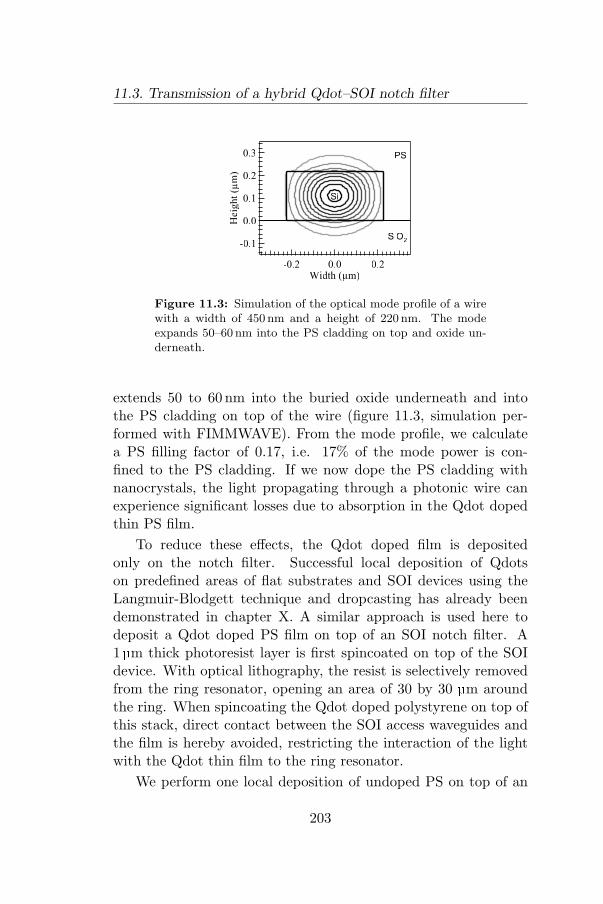
11.3. Transmission of a hybrid Qdot–SOI notch filter
0.3
0.2
0.1
0.0
-0.1H
eig
ht
(µm
)
-0.2 0.0 0.2Width (µm)
PS
Si
SiO2
Figure 11.3: Simulation of the optical mode profile of a wirewith a width of 450 nm and a height of 220 nm. The modeexpands 50–60 nm into the PS cladding on top and oxide un-derneath.
extends 50 to 60 nm into the buried oxide underneath and intothe PS cladding on top of the wire (figure 11.3, simulation per-formed with FIMMWAVE). From the mode profile, we calculatea PS filling factor of 0.17, i.e. 17% of the mode power is con-fined to the PS cladding. If we now dope the PS cladding withnanocrystals, the light propagating through a photonic wire canexperience significant losses due to absorption in the Qdot dopedthin PS film.
To reduce these effects, the Qdot doped film is depositedonly on the notch filter. Successful local deposition of Qdotson predefined areas of flat substrates and SOI devices using theLangmuir-Blodgett technique and dropcasting has already beendemonstrated in chapter X. A similar approach is used here todeposit a Qdot doped PS film on top of an SOI notch filter. A1 µm thick photoresist layer is first spincoated on top of the SOIdevice. With optical lithography, the resist is selectively removedfrom the ring resonator, opening an area of 30 by 30 µm aroundthe ring. When spincoating the Qdot doped polystyrene on top ofthis stack, direct contact between the SOI access waveguides andthe film is hereby avoided, restricting the interaction of the lightwith the Qdot thin film to the ring resonator.
We perform one local deposition of undoped PS on top of an
203
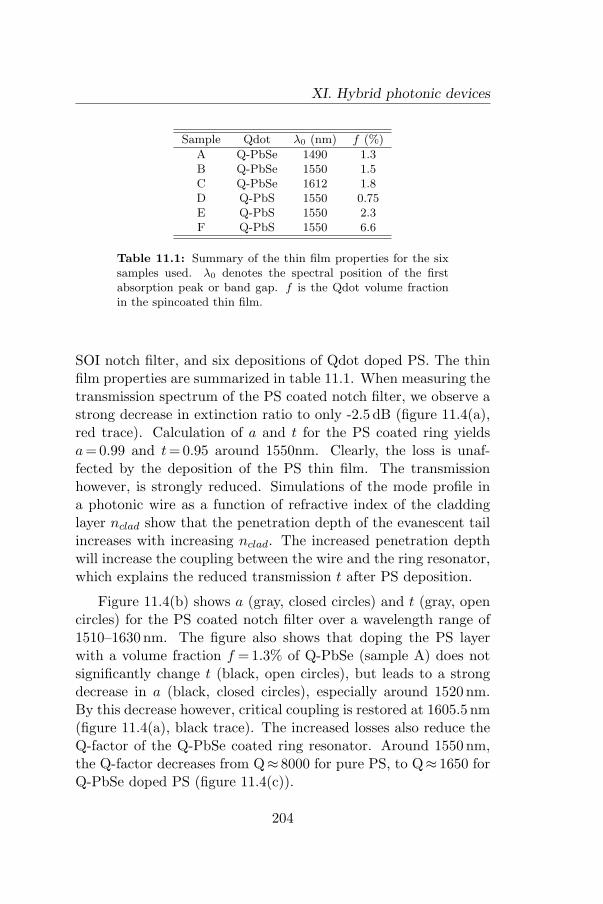
XI. Hybrid photonic devices
Sample Qdot λ0 (nm) f (%)
A Q-PbSe 1490 1.3B Q-PbSe 1550 1.5C Q-PbSe 1612 1.8D Q-PbS 1550 0.75E Q-PbS 1550 2.3F Q-PbS 1550 6.6
Table 11.1: Summary of the thin film properties for the sixsamples used. λ0 denotes the spectral position of the firstabsorption peak or band gap. f is the Qdot volume fractionin the spincoated thin film.
SOI notch filter, and six depositions of Qdot doped PS. The thinfilm properties are summarized in table 11.1. When measuring thetransmission spectrum of the PS coated notch filter, we observe astrong decrease in extinction ratio to only -2.5 dB (figure 11.4(a),red trace). Calculation of a and t for the PS coated ring yieldsa=0.99 and t =0.95 around 1550nm. Clearly, the loss is unaf-fected by the deposition of the PS thin film. The transmissionhowever, is strongly reduced. Simulations of the mode profile ina photonic wire as a function of refractive index of the claddinglayer nclad show that the penetration depth of the evanescent tailincreases with increasing nclad. The increased penetration depthwill increase the coupling between the wire and the ring resonator,which explains the reduced transmission t after PS deposition.
Figure 11.4(b) shows a (gray, closed circles) and t (gray, opencircles) for the PS coated notch filter over a wavelength range of1510–1630 nm. The figure also shows that doping the PS layerwith a volume fraction f = 1.3% of Q-PbSe (sample A) does notsignificantly change t (black, open circles), but leads to a strongdecrease in a (black, closed circles), especially around 1520 nm.By this decrease however, critical coupling is restored at 1605.5 nm(figure 11.4(a), black trace). The increased losses also reduce theQ-factor of the Q-PbSe coated ring resonator. Around 1550 nm,the Q-factor decreases from Q≈ 8000 for pure PS, to Q≈ 1650 forQ-PbSe doped PS (figure 11.4(c)).
204
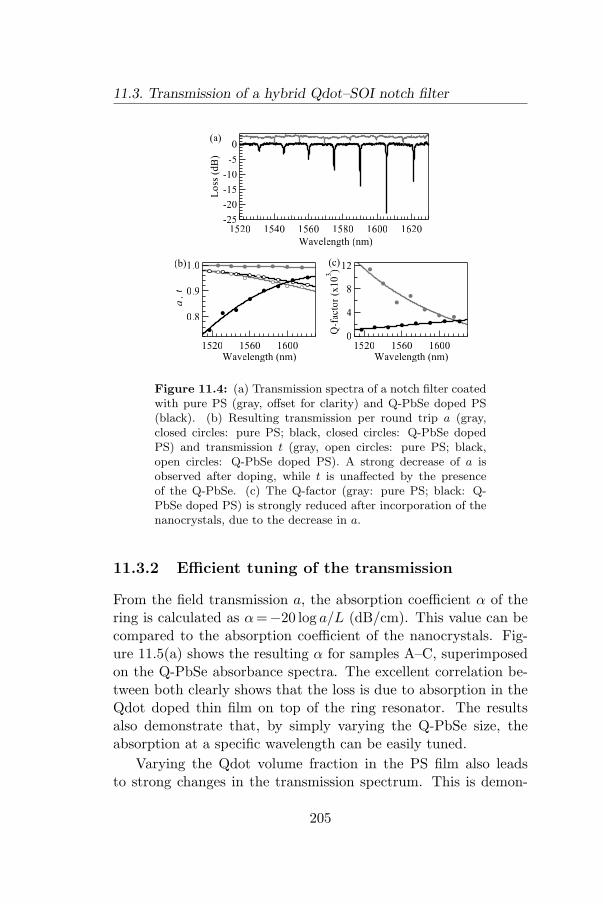
11.3. Transmission of a hybrid Qdot–SOI notch filter
-25
-20
-15
-10
-5
0
Loss
(dB
)
162016001580156015401520
Wavelength (nm)
12
8
4
0Q
-fac
tor
(x1
03)
160015601520Wavelength (nm)
(c)1.0
0.9
0.8
a ,
t
160015601520Wavelength (nm)
(b)
(a)
Figure 11.4: (a) Transmission spectra of a notch filter coatedwith pure PS (gray, offset for clarity) and Q-PbSe doped PS(black). (b) Resulting transmission per round trip a (gray,closed circles: pure PS; black, closed circles: Q-PbSe dopedPS) and transmission t (gray, open circles: pure PS; black,open circles: Q-PbSe doped PS). A strong decrease of a isobserved after doping, while t is unaffected by the presenceof the Q-PbSe. (c) The Q-factor (gray: pure PS; black: Q-PbSe doped PS) is strongly reduced after incorporation of thenanocrystals, due to the decrease in a.
11.3.2 Efficient tuning of the transmission
From the field transmission a, the absorption coefficient α of thering is calculated as α =−20 log a/L (dB/cm). This value can becompared to the absorption coefficient of the nanocrystals. Fig-ure 11.5(a) shows the resulting α for samples A–C, superimposedon the Q-PbSe absorbance spectra. The excellent correlation be-tween both clearly shows that the loss is due to absorption in theQdot doped thin film on top of the ring resonator. The resultsalso demonstrate that, by simply varying the Q-PbSe size, theabsorption at a specific wavelength can be easily tuned.
Varying the Qdot volume fraction in the PS film also leadsto strong changes in the transmission spectrum. This is demon-
205
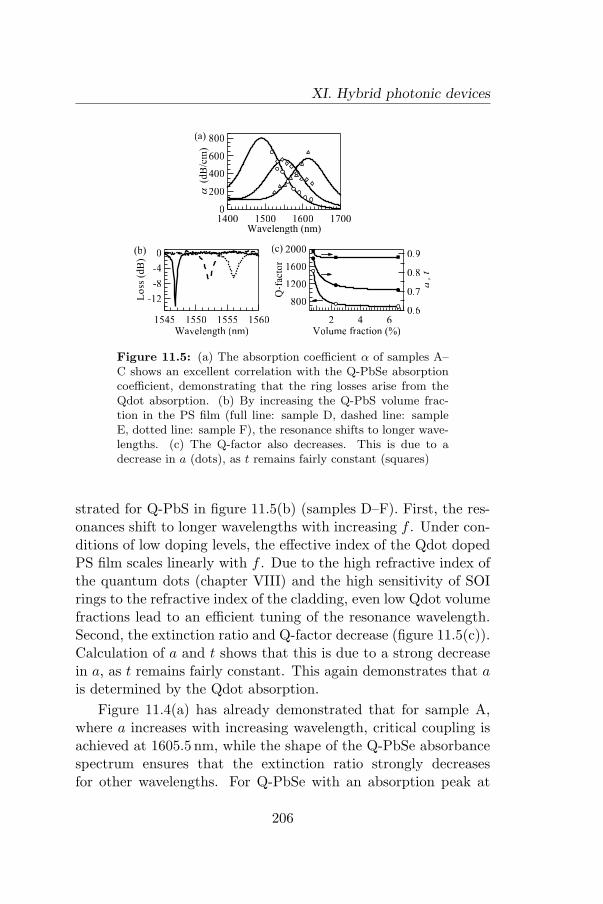
XI. Hybrid photonic devices
800
600
400
200
0a
(
dB
/cm
)
1700160015001400Wavelength (nm)
-12
-8
-4
0
Loss
(dB
)
1560155515501545Wavelength (nm)
(b) 2000
1600
1200
800
Q-f
acto
r
642Volume fraction (%)
0.9
0.8
0.7
0.6
a , t
(c)
(a)
Figure 11.5: (a) The absorption coefficient α of samples A–C shows an excellent correlation with the Q-PbSe absorptioncoefficient, demonstrating that the ring losses arise from theQdot absorption. (b) By increasing the Q-PbS volume frac-tion in the PS film (full line: sample D, dashed line: sampleE, dotted line: sample F), the resonance shifts to longer wave-lengths. (c) The Q-factor also decreases. This is due to adecrease in a (dots), as t remains fairly constant (squares)
strated for Q-PbS in figure 11.5(b) (samples D–F). First, the res-onances shift to longer wavelengths with increasing f . Under con-ditions of low doping levels, the effective index of the Qdot dopedPS film scales linearly with f . Due to the high refractive index ofthe quantum dots (chapter VIII) and the high sensitivity of SOIrings to the refractive index of the cladding, even low Qdot volumefractions lead to an efficient tuning of the resonance wavelength.Second, the extinction ratio and Q-factor decrease (figure 11.5(c)).Calculation of a and t shows that this is due to a strong decreasein a, as t remains fairly constant. This again demonstrates that ais determined by the Qdot absorption.
Figure 11.4(a) has already demonstrated that for sample A,where a increases with increasing wavelength, critical coupling isachieved at 1605.5 nm, while the shape of the Q-PbSe absorbancespectrum ensures that the extinction ratio strongly decreasesfor other wavelengths. For Q-PbSe with an absorption peak at
206
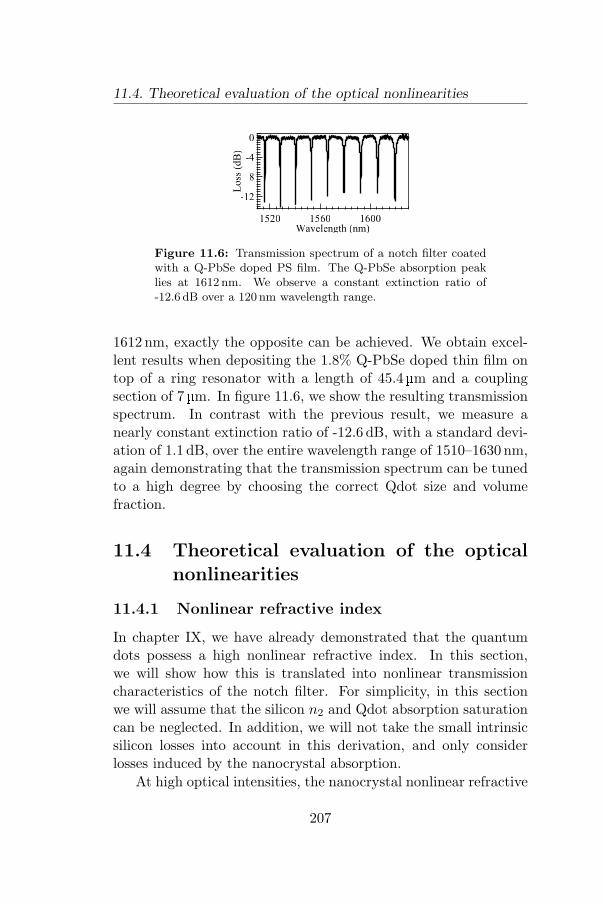
11.4. Theoretical evaluation of the optical nonlinearities
-12
-8
-4
0
Loss
(dB
)
160015601520Wavelength (nm)
Figure 11.6: Transmission spectrum of a notch filter coatedwith a Q-PbSe doped PS film. The Q-PbSe absorption peaklies at 1612 nm. We observe a constant extinction ratio of-12.6 dB over a 120 nm wavelength range.
1612 nm, exactly the opposite can be achieved. We obtain excel-lent results when depositing the 1.8% Q-PbSe doped thin film ontop of a ring resonator with a length of 45.4 µm and a couplingsection of 7 µm. In figure 11.6, we show the resulting transmissionspectrum. In contrast with the previous result, we measure anearly constant extinction ratio of -12.6 dB, with a standard devi-ation of 1.1 dB, over the entire wavelength range of 1510–1630 nm,again demonstrating that the transmission spectrum can be tunedto a high degree by choosing the correct Qdot size and volumefraction.
11.4 Theoretical evaluation of the opticalnonlinearities
11.4.1 Nonlinear refractive index
In chapter IX, we have already demonstrated that the quantumdots possess a high nonlinear refractive index. In this section,we will show how this is translated into nonlinear transmissioncharacteristics of the notch filter. For simplicity, in this sectionwe will assume that the silicon n2 and Qdot absorption saturationcan be neglected. In addition, we will not take the small intrinsicsilicon losses into account in this derivation, and only considerlosses induced by the nanocrystal absorption.
At high optical intensities, the nanocrystal nonlinear refractive
207
XI. Hybrid photonic devices
index n2,Qdot will induce a change in refractive index of the dopedpolymer film, and therefore a change in the effective index of thecoated wire. We define this change ∆n. Using equation 11.5, ∆nis related to a change of the resonance wavelength ∆λ:
∆n
ng=
∆λ
λres(11.8)
In other words, n2,Qdot will induce a shift of the resonance wave-length of the notch filter at high optical intensities.
We can assume that ∆n increases with increasing Qdot volumefraction f and optical intensity in the ring Iring (in agreement withthe results obtained on Qdot suspensions, chapter IX).
At resonance, Iring is enhanced with respect to the input in-tensity I0:
PE =Iring
I0=
a2(1− t2)(1− at)2
(11.9)
with PE the power enhancement. This leads to:
∆n = fn2,I PE I0 (11.10)
with n2,I the intrinsic nonlinear refractive index of the coated wire,i.e. at f = 1. Using this equation, we can write the wavelengthshift as:
∆λ =λres
ngfn2,I PE I0 (11.11)
Efficient nonlinear optical switching will however only be ob-tained when ∆λ becomes larger than the resonance line width F ,making ∆λ/F the quantity of interest. Taking into account thata higher volume fraction f decreases the round trip transmissiona (as already demonstrated in the linear regime):
− 2 ln a = fαIL (11.12)
with αI the intrinsic absorption coefficient of the wire per unitlength, we finally obtain:
∆λ
F=
n2,II0
αIλres
π√
at(−2 ln a)a2(1− t)2
(1− at)3(11.13)
208
11.4. Theoretical evaluation of the optical nonlinearities
We see that this equation consists of two parts. The first partequals the figure of merit (FOM), already defined in equation 9.27for quantum dot suspensions, which is a material property andcannot be altered (note however that, in this case, the FOM isdefined for a coated SOI wire as a whole, not just for a Qdotthin film or suspension). The second part is completely definedby the notch filter design, as it contains only the parameters aand t. These can be optimized by choosing the appropriate ringlength L, length of the coupling section, and quantum dot volumefraction.
When evaluating the second part, we can conclude that max-imal shifts are obtained for a ≈ t ≈ 1, i.e. for short rings, closeto critical coupling, and with a PS cladding layer containing fewquantum dots. In this limit, equation 11.13 can be approximatedby:
∆λ
F= FOM.
π
4(11.14)
Under these conditions, we need a figure of merit larger than 4/πif we want a shift at least equal to the resonance line width. Inchapter IX, we derived a FOM of 3–4 for lead chalcogenide Qdotsuspensions, clearly sufficient to achieve a large nonlinear shift.However, at present it is not clear yet how the FOM of a Qdotsuspension under pulsed excitation (in the Z-scan experiments)is to be translated into a FOM of the hybrid notch filter undercontinuous-wave excitation (in the measurements presented in thischapter). Further study is needed to resolve this issue.
11.4.2 Absorption saturation
On the other hand, nonlinear transmission characteristics can alsobe obtained when taking the absorption saturation of the quantumdots into account (section 9.5.1). For simplicity, in this section weneglect the nonlinear refractive index of the quantum dots andfocus only on the absorption saturation, modeled by:
α =α0
1 + Iring/Is(11.15)
209
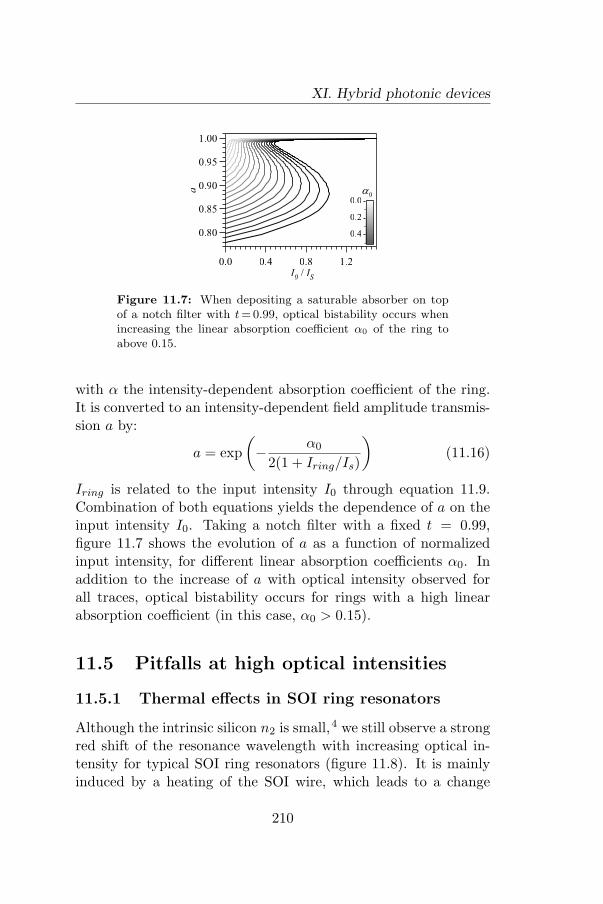
XI. Hybrid photonic devices
1.00
0.95
0.90
0.85
0.80
a
1.20.80.40.0 I0 / IS
0.4
0.2
0.0a
0
Figure 11.7: When depositing a saturable absorber on topof a notch filter with t = 0.99, optical bistability occurs whenincreasing the linear absorption coefficient α0 of the ring toabove 0.15.
with α the intensity-dependent absorption coefficient of the ring.It is converted to an intensity-dependent field amplitude transmis-sion a by:
a = exp(− α0
2(1 + Iring/Is)
)(11.16)
Iring is related to the input intensity I0 through equation 11.9.Combination of both equations yields the dependence of a on theinput intensity I0. Taking a notch filter with a fixed t = 0.99,figure 11.7 shows the evolution of a as a function of normalizedinput intensity, for different linear absorption coefficients α0. Inaddition to the increase of a with optical intensity observed forall traces, optical bistability occurs for rings with a high linearabsorption coefficient (in this case, α0 > 0.15).
11.5 Pitfalls at high optical intensities
11.5.1 Thermal effects in SOI ring resonators
Although the intrinsic silicon n2 is small,4 we still observe a strongred shift of the resonance wavelength with increasing optical in-tensity for typical SOI ring resonators (figure 11.8). It is mainlyinduced by a heating of the SOI wire, which leads to a change
210

11.5. Pitfalls at high optical intensities
-30
-25
-20
-15
-10
Tra
ns
(dB
)
1554.31554.01553.7Wavelength (nm)
(a)
-25
-20
-15
-10
-5
Tra
ns.
(dB
)
1554.61554.31554.0Wavelength (nm)
(b)
Figure 11.8: Increasing the optical intensity in an SOI ringresonator leads to a red shift of the resonance transmission.(a): notch filter with L = 39.4µm and Lc = 4µm. (b) notchfilter with L = 32.8 µm and Lc = 7µm.
in refractive index due to the silicon thermo-optical coefficientdn/dT =1.86 10−4 K−1.17
Two absorption mechanisms account for the heating.17 As thewires have a high surface-to-volume ratio, significant surface stateabsorption occurs. In addition, free carrier absorption, by carrierscreated through two-photon absorption, further enhances the totalenergy that is absorbed. Nonradiative carrier recombination thenheats up the SOI wire, leading to an increase of the refractiveindex and consequently a red shift of the resonance wavelength.
An analysis of the linear transmission spectra of the notchfilters shown in figure 11.8 yields a≈ t≈ 0.99 for both devices.Taking the power enhancement in the ring into account, the onsetof thermal effects (top curve) corresponds to a power (in the ring)of the order of 20 mW. We obtain similar results on a PS coatedring, where the onset corresponds to a power of 40-60 mW.
11.5.2 Quantum dot charging
In order to observe nonlinear effects, a Qdot–SOI hybrid notch willtherefore have to show a significant shift of the resonance wave-length at powers below ca. 20 mW. Figure 11.9(a) shows a typicalseries of transmission spectra of a Q-PbSe coated ring resonator.A blue shift is clearly observed with increasing optical intensity,changing to a red shift at higher I0 due to thermal effects (figure11.9(b)). In addition, the losses decrease, suggesting a bleaching
211
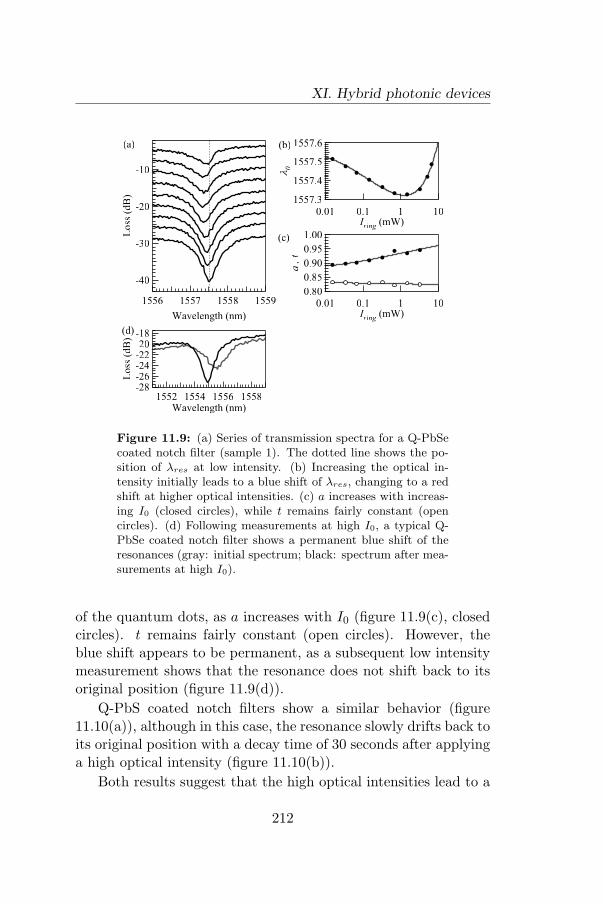
XI. Hybrid photonic devices
-40
-30
-20
-10
Loss
(dB
)
1559155815571556
Wavelength (nm)
(a)
1.00
0.95
0.90
0.85
0.80a , t
0.01 0.1 1 10Iring (mW)
(c)
1557.6
1557.5
1557.4
1557.3
l0
0.01 0.1 1 10Iring (mW)
(b)
-28-26-24-22-20-18
Loss
(dB
)
1558155615541552Wavelength (nm)
(d)
Figure 11.9: (a) Series of transmission spectra for a Q-PbSecoated notch filter (sample 1). The dotted line shows the po-sition of λres at low intensity. (b) Increasing the optical in-tensity initially leads to a blue shift of λres, changing to a redshift at higher optical intensities. (c) a increases with increas-ing I0 (closed circles), while t remains fairly constant (opencircles). (d) Following measurements at high I0, a typical Q-PbSe coated notch filter shows a permanent blue shift of theresonances (gray: initial spectrum; black: spectrum after mea-surements at high I0).
of the quantum dots, as a increases with I0 (figure 11.9(c), closedcircles). t remains fairly constant (open circles). However, theblue shift appears to be permanent, as a subsequent low intensitymeasurement shows that the resonance does not shift back to itsoriginal position (figure 11.9(d)).
Q-PbS coated notch filters show a similar behavior (figure11.10(a)), although in this case, the resonance slowly drifts back toits original position with a decay time of 30 seconds after applyinga high optical intensity (figure 11.10(b)).
Both results suggest that the high optical intensities lead to a
212
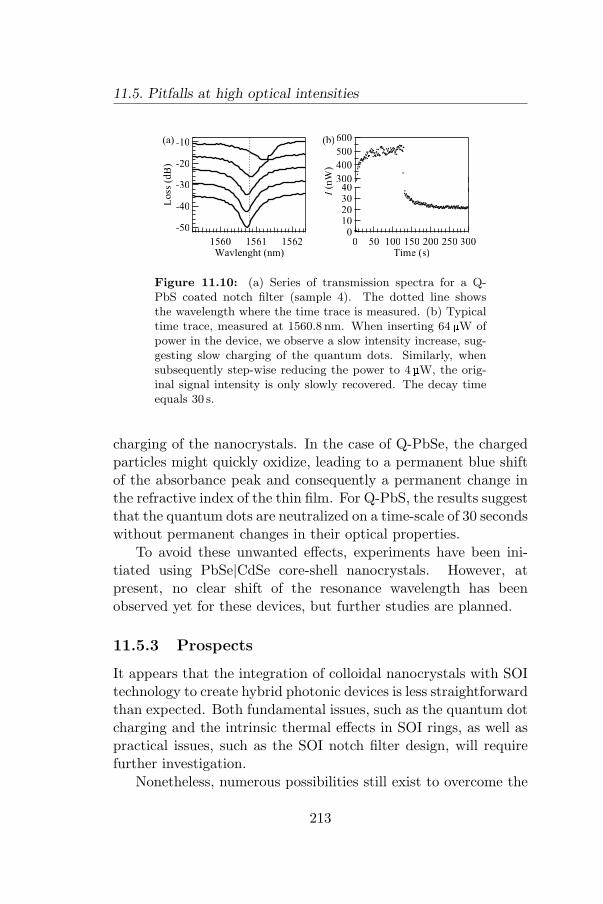
11.5. Pitfalls at high optical intensities
403020100
x10
-6
300250200150100500Time (s)
600
500
400
300
I (n
W)
(b)
-50
-40
-30
-20
-10
Loss
(dB
)
156215611560Wavlenght (nm)
(a)
Figure 11.10: (a) Series of transmission spectra for a Q-PbS coated notch filter (sample 4). The dotted line showsthe wavelength where the time trace is measured. (b) Typicaltime trace, measured at 1560.8 nm. When inserting 64 µW ofpower in the device, we observe a slow intensity increase, sug-gesting slow charging of the quantum dots. Similarly, whensubsequently step-wise reducing the power to 4µW, the orig-inal signal intensity is only slowly recovered. The decay timeequals 30 s.
charging of the nanocrystals. In the case of Q-PbSe, the chargedparticles might quickly oxidize, leading to a permanent blue shiftof the absorbance peak and consequently a permanent change inthe refractive index of the thin film. For Q-PbS, the results suggestthat the quantum dots are neutralized on a time-scale of 30 secondswithout permanent changes in their optical properties.
To avoid these unwanted effects, experiments have been ini-tiated using PbSe|CdSe core-shell nanocrystals. However, atpresent, no clear shift of the resonance wavelength has beenobserved yet for these devices, but further studies are planned.
11.5.3 Prospects
It appears that the integration of colloidal nanocrystals with SOItechnology to create hybrid photonic devices is less straightforwardthan expected. Both fundamental issues, such as the quantum dotcharging and the intrinsic thermal effects in SOI rings, as well aspractical issues, such as the SOI notch filter design, will requirefurther investigation.
Nonetheless, numerous possibilities still exist to overcome the
213
XI. Hybrid photonic devices
problems stated above. For instance, the SOI notch filters can bestudied under pulsed excitation, increasing peak optical intensi-ties while keeping the average power small, hereby avoiding theintrinsic thermal effects. Initial experiments have been started,and will be continued in the future. Also, more work will be per-formed on the core-shell nanocrystals, as, even though we havenot observed a nonlinear shift yet, its absence, in a sense, alreadyindicates that the charging issues might be resolved. In addition,all samples have been optimized for the observation of a nonlinearshift of the resonance wavelength, which requires moderate volumefractions of nanocrystals to maintain a high power enhancement.Therefore, the optically bistability due to absorption saturation,which requires a high linear absorption and therefore a high Qdotvolume fraction, has not been investigated yet.
From the perspective of photonic devices, we are not restrictedto coated SOI wires as described above. We can switch to slot-ted devices,18 where the optical field is compressed into a narrowair-filled gap. This reduces the optical intensity in the siliconwires, hereby avoiding the thermal nonlinearities. It would alsoenhance Qdot nonlinear effects when the gap is filled with nano-crystals. The thermal problem can also be overcome by using aMach-Zehnder interferometer, as both arms of the interferometercan be expected to heat up equally. By coating one of the armswith nanocrystals, Qdot nonlinear effects can again be expected.
11.6 Conclusions
Q-PbSe and Q-PbS nanocrystals are mixed with polystyrene andspincoated on top of an SOI notch filter. We use the transmis-sion spectra of the coated devices to calculate the transmissionper round trip a and transmission of the coupling section t. Theloss of the coated rings is due to absorption in the quantum dotdoped thin film. Consequently, as is demonstrated with notch fil-ters coated with Q-PbSe doped PS, varying the Qdot size leads toa strong modification of the transmission spectrum. For particleswith an absorption peak at 1490 nm, we achieve a high extinction
214
11.6. Conclusions
ratio of -23.7 dB only for a single resonance, while, when usingparticles with a peak at 1612 nm, a nearly constant extinction ra-tio of -12.6 dB can be achieved over a 1510–1630 nm wavelengthrange. In addition, as is demonstrated using Q-PbS doped PS, theresonance wavelengths of the notch filter can be efficiently tunedby varying the quantum dot concentration in the film. Control-ling both the size and concentration of the nanocrystals in the thinfilms therefore leads to a high degree of control over the transmis-sion characteristics of these quantum dot – SOI hybrid devices.
Measurements at high optical intensities reveal that uncoatedSOI notch filters show a strong red shift of the resonance wave-length due to an increase in temperature of the photonic device.When coating the notch filters with Q-PbSe or Q-PbS doped thinfilms, we observe a permanent or slowly recovering blue shift, prob-ably related to charging of the quantum dots.
Finally, suggestions are given to optimize the measurements,and the quantum dot material and photonic device design. Thisshould allow us to observe the theoretically modeled nonlineareffects, such as a strong shift of the resonance wavelength, due to achange in refractive index, or optical bistability, due to absorptionsaturation.
215
Bibliography
[1] W. Bogaerts et al., Compact wavelength-selective functions insilicon-on-insulator photonic wires, IEEE J. Sel. Top. Quan-tum Electron. 2006, 12 , 1394–1401.
[2] P. Dumon et al., Linear and nonlinear nanophotonic devicesbased on silicon-on-insulator wire waveguides, Jpn. J. Appl.Phys. Part 1 2006, 45 , 6589–6602.
[3] W. Bogaerts et al., Nanophotonic waveguides in silicon-on-insulator fabricated with CMOS technology , J. LightwaveTechnol. 2005, 23 , 401–412.
[4] M. Dinu, F. Quochi and H. Garcia, Third-order nonlinearitiesin silicon at telecom wavelengths, Appl. Phys. Lett. 2003, 82 ,2954–2956.
[5] C. Koos et al., Nonlinear silicon-on-insulator waveguides forall-optical signal processing , Opt. Express 2007, 15 , 5976–5990.
[6] L. Pavesi, Will silicon be the photonic material of the thirdmillenium? , J. Phys.-Condes. Matter 2003, 15 , R1169–R1196.
[7] G. Priem et al., Design of all-optical nonlinear functionalitiesbased on resonators, IEEE J. Sel. Top. Quantum Electron.2004, 10 , 1070–1078.
[8] M. A. Foster et al., Nonlinear optics in photonic nanowires,Opt. Express 2008, 16 , 1300–1320.
[9] C. D. Donega, P. Liljeroth and D. Vanmaekelbergh, Physi-cochemical evaluation of the hot-injection method, a synthesisroute for monodisperse nanocrystals, Small 2005, 1 , 1152–1162.
[10] E. H. Sargent, Infrared quantum dots, Adv. Mater. 2005, 17 ,515–522.
[11] C. Burda et al., Chemistry and properties of nanocrystals ofdifferent shapes, Chem. Rev. 2005, 105 , 1025–1102.
[12] Y. Yin and A. P. Alivisatos, Colloidal nanocrystal synthesisand the organic-inorganic interface, Nature 2005, 437 , 664–
216

670.[13] J. M. Luther et al., Structural, optical and electrical properties
of self-assembled films of PbSe nanocrystals treated with 1,2-ethanedithiol , ACS Nano 2008, 2 , 271–280.
[14] K. Lambert et al., Quantum dot micropatterning on Si , Lang-muir 2008, 24 , 5961–5966.
[15] D. V. Talapin and C. B. Murray, PbSe nanocrystal solidsfor n- and p-channel thin film field-effect transistors, Science2005, 310 , 86–89.
[16] A. Yariv, Universal relations for coupling of optical powerbetween microresonators and dielectric waveguides, Electron.Lett. 2000, 36 , 321–322.
[17] G. Priem et al., Optical bistability and pulsating behaviour inSilicon-On-Insulator ring resonator structures, Opt. Express2005, 13 , 9623–9628.
[18] V. R. Almeida et al., Guiding and confining light in voidnanostructure, Opt. Lett. 2004, 29 , 1209–1211.
217

218
Chapter XII
General Conclusions
“Angier: So the machine was working?Tesla: These things never quite work as you expectthem to, Mr. Angier. That’s one of the principal beau-ties of science.”
“The Prestige”, by Christopher Nolan (2006)
Throughout this work, we touched upon many different top-ics, ranging from the synthesis and surface chemistry of colloidalnanocrystals to their nonlinear optical properties and applicationson a silicon platform. Yet, although the range of subjects appearsdiverse, the knowledge gained in each part provided us essentialfeedback for the advancement in other areas. In this chapter, wesummarize the results obtained and highlight the intimate inter-play between the different research topics.
12.1 Nanocrystal synthesis
Q-PbS and Q-PbSe nanocrystals are synthesized using the hot-injection method. We determine their crystal structure with XRDand HR-TEM, from which we conclude that colloidal nanocrystalshave the same structure and lattice parameter as their respectivebulk materials. In addition, TEM measurements allow us to de-termine the mean nanocrystal diameter and size dispersion.
219
XII. General Conclusions
The particle size determines the band gap of the material dueto quantum confinement. We correlate both to construct a siz-ing curve. This curve then conveniently enables us to calculatethe particle size and size dispersion from the spectral position andwidth of the first absorption peak, obtained through a straightfor-ward measurement of the absorbance of a nanocrystal suspension.
The particle concentration in a Qdot suspension is another im-portant practical parameter. Again, it can be calculated from theabsorbance spectrum if we know the nanocrystal molar extinctioncoefficient. We determine it using ICP-MS (for the determinationof absolute atomic concentrations of the cation and, if possible theanion) and RBS (for the determination of the cation:anion atomicratio, in case this is not obtainable with ICP-MS). Knowing theparticle size and lattice parameter, atomic concentrations and ra-tios are converted to nanocrystal concentrations, from which wedetermine the molar extinction coefficient at 400 nm through theabsorbance of an equal amount of nanocrystals.
The Q-PbS synthesis yields particles that are air-stable; weobserve no blue shift of the absorption peaks during storage underambient atmosphere. In contrast, Q-PbSe show a strong blue shiftof more than 100 nm, corresponding to a particle size reduction of6.8 A. The oxidation can be avoided by growing an inorganic CdSeshell around the PbSe core nanocrystals. We use a cation exchangemechanism to replace the outermost Pb atoms by Cd, forming aprotective CdSe layer around the particles. During storage un-der ambient conditions, the blue shift is limited to a mere 26 nm.Further optimizing the shell growth might even eliminate the blueshift completely; this remains to be investigated.
12.2 Surface chemistry
The organic ligands are an essential part of a colloidal nanocrystal.Not only do they limit the particle growth during synthesis anddetermine their final size and shape; a proper choice of ligandsalso ensures that the nanocrystals are highly luminescent, thatthe particle suspension is stable and that they can be processed
220
12.2. Surface chemistry
into various 2D or 3D superstructures.A proper surface passivation, and the further processing of our
nanocrystals are both of great importance for this work, thereforewe carefully study the nanocrystal surface chemistry. Using Q-InPas a prototypic example, several NMR techniques are applied toidentify and quantify the nanocrystal ligands and ligand dynamics.
A typical 1H NMR spectrum of Q-InP in tol-d8 shows twobroad resonances, next to sharp signals arising from free molecules.The key measurement to assign these broad resonances to organicligands, is DOSY. Using DOSY, we can filter out fast diffusingspecies, leaving only the ligand resonances to appear in a diffusionfiltered spectrum due to the slow nanocrystal diffusion coefficient.After confirmation that the broad NMR resonances pertain to thenanocrystal ligands, they are identified by HSQC. The broad NMRresonances in the 1H NMR spectrum are assigned to TOPO li-gands on the Q-InP surface. When adding a known amount ofCH2Br2 to the nanocrystal suspension as a concentration stan-dard, subsequent quantitative 1H NMR measurements then allowus to calculate the ligand concentration, which, in combinationwith the known nanocrystal concentration, gives a ligand surfacecoverage of ca. 20%.
However, for all samples that we prepare, a small amount offree TOPO is still detected. This suggests that the TOPO ligandsare in equilibrium with free TOPO in solution. Indeed, whenperforming quantitative 1H measurements on a series of dilutedQ-InP samples, we observe an adsorption/desorption equilibrium.A Fowler isotherm is fitted to the data, yielding the equilibriumconstant and corresponding free energy of adsorption.
Next, the techniques developed using Q-InP are applied to in-vestigate the surface chemistry of Q-PbSe. Again, we observe sev-eral broad resonances, which are assigned to OA ligands, tightlybound to the Q-PbSe surface. In this case however, an unam-biguous assignment is not possible with HSQC, as the OA andTOP ligands strongly overlap, and the resonances of interest donot show up in an HSQC spectrum due to their fast relaxation. Aquantitative 1H NMR spectrum however reveals that TOP does
221
XII. General Conclusions
not bind to the Q-PbSe. The measurement also yields an OAdensity of 4.2 ligands per square nm of nanocrystal surface.
ICP-MS measurements not only give the nanocrystal concen-tration, the Pb:Se stoichiometry also provides valuable informa-tion on the nanocrystal structure. The experimental results are inclose agreement with a non-stoichiometric structural model, con-sisting of a quasi-stoichiometric nanocrystal core, terminated witha pure Pb surface shell. The NMR measurements are correlatedwith this model. The absence of TOP ligands agrees with themodel, as the absence of surface Se atoms inhibits efficient bind-ing of TOP to the Q-PbSe. The number of excess Pb atoms inturn agrees well with the number of OA ligands per nanocrystal.
Q-PbS nanocrystals are prepared using a synthesis based onoleylamine. In contrast with TOPO capped Q-InP and OA cappedQ-PbSe, the synthesis yields ligands exhibiting fast ligand dynam-ics. Free and bound NMR observables (such as the 1H chemicalshift and diffusion coefficient) are no longer resolved in this case,but a single population-averaged value is observed. Moreover, typ-ical Q-PbS suspensions are only stable in presence of an excess ofOLA ligands, which tends to shift the NMR observables towardthe free state. This hampers ligand identification based on 1HNMR, DOSY and HSQC. However, NOESY still provides valu-able insights. Due to the fast buildup time and negative sign ofthe NOE cross-peaks, ligands can clearly be distinguished fromfree molecules (which display positive cross-peaks), even when theligands are in fast exchange and a considerable excess of ligandsis present. Using this technique, we observe a clear interactionbetween OLA and the Q-PbS surface. Just as for the Q-PbSe, wedetect no TOP ligands, even though it is used during synthesis.
Due to the fast ligand dynamics, OLA capped Q-PbS arepoorly passivated, yielding particles with a low photo-lumines-cence quantum yield. The same fast dynamics however allows fora facile ligand exchange, as demonstrated by substituting OLAfor tightly bound OA ligands. After ligand exchange, the lumines-cence yield is boosted by a factor of 3–6.
Considering that the results are obtained on three substantially
222

12.3. Optical properties
different material systems, we can conclude that NMR providesvery powerful tools to study the organic nanocrystal ligands.
12.3 Optical properties
12.3.1 Linear optical properties
We investigate the optical properties of colloidal lead chalcogenidenanocrystals, using the Maxwell-Garnett model for small parti-cles dispersed in a transparent dielectric host. Most importantly,the model shows that the resulting absorption coefficient dependsstrongly on the local field factor.
From an experimental point of view, the nanocrystal absorp-tion coefficient µ is determined from the absorbance spectrum,knowing the particle size and concentration. At energies far abovethe band gap, both Q-PbS and Q-PbSe data show that µ is size-independent. Experimental values agree well with the theoreticalabsorption coefficient, determined from the MG model using bulkvalues for the dielectric function. This demonstrates that opticalproperties far above the band gap are not influenced by quantumconfinement.
In contrast, we observe strong quantum confinement effectsfor the band gap transition. In addition to the blue shift with de-creasing size, the energy integrated absorption coefficient increasesquadratically, showing that smaller particles are more efficient ab-sorbers. Comparing Q-PbS with Q-PbSe, we find that, from apractical point of view, Q-PbSe have a higher absorption coeffi-cient than Q-PbS (for particles with an equal band gap energy).
The absorption coefficient however depends on the solvent re-fractive index. Therefore, the oscillator strength of the band gaptransition provides a more quantitative means for comparison. Asdemonstrated for Q-PbSe suspended in CCl4 and C2Cl4, respec-tively, its value indeed does not depend on the solvent refractiveindex. Experimental data for both Q-PbS and Q-PbSe agree wellwith theoretical tight-binding calculations, demonstrating that theoscillator strength increases linearly with particle size. Values for
223
XII. General Conclusions
Q-PbS are 37% smaller than for Q-PbSe, possibly due to the re-duced quantum confinement in PbS, as the exciton Bohr radius is2 times smaller in PbS (23 nm), than in PbSe (46 nm).
As already stated, due to the local field factor, the nanocrystalabsorption coefficient is not a mere copy of its extinction coeffi-cient k. It leads to a strong rise of the absorption coefficient withincreasing photon energy, and hampers the identification of the na-nocrystal absorption peaks. Therefore, we calculate the dielectricfunction ε using the Kramers–Kronig relations. They are rewrit-ten in a discrete version to allow a numerical calculation of ε. Dueto the nonlinear relation between µ and ε, a direct calculation isnot straightforward. Instead, we develop an iterative procedureto calculate ε. The IMI method is proved to be accurate by thecalculation of the dielectric function of a virtual material and bulkPbS and PbTe.
The dielectric function of colloidal lead chalcogenide nanocrys-tals reveals several intriguing insights. First, the optical dielectricconstant (real part of the dielectric function at energies far belowthe band gap) is comparable to bulk values for all three lead chal-cogenide materials, showing that quantum confinement plays norole here. This observation also validates using the bulk refrac-tive index in the calculation of the oscillator strength of the bandgap transition. Second, we observe strong quantum confinementeffects for the E0 and E1 transition of all three materials. Thespectral position and oscillator strength of the E2 transition issize-independent, in accordance with the size-independence of theabsorption coefficient. Focusing on the E1 transition, we observea blue shift with decreasing size for all three materials. In thecase of Q-PbSe and Q-PbTe, this is accompanied by an increasein oscillator strength with respect to the E2 transition. Resultsare in accordance with data on electro-deposited PbSe quantumdots, and further theoretical work is planned to yield more insightinto the nanocrystal optical properties.
224

12.3. Optical properties
12.3.2 Nonlinear optical properties
Having a good knowledge of the linear optical properties, we de-termine the nonlinear refractive index of colloidal lead chalcoge-nide suspensions, using the Z-scan technique. Literature data aremostly fitted using a linear approximation of the Z-scan trace,only valid for a small nonlinear phase shift ∆φ. To increase therange of phase shifts that can be fitted, the equations are there-fore expanded up to a third-order approximation in ∆φ, valid upto ∆φ ≈ 1.75. Thermal nonlinearities are also taken into account.
The n2-spectrum is clearly correlated with the nanocrystal ab-sorbance spectrum, for both Q-PbS and Q-PbSe. This alreadysuggests that state-filling of the quantum dots discrete energy lev-els leads to a high, and tunable, nonlinear refractive index. Theelectronic origin is further confirmed by the observation of a sat-uration of the change in refractive index and a saturation of theabsorption coefficient at high optical intensities.
The experimental saturation intensity is however an order ofmagnitude larger than the calculated result. This suggests thatthe creation of bi-excitons in already excited nanocrystals leads toa further enhancement of the nonlinear optical properties. Thismechanism would also explain the bell-shaped n2-spectrum, as theKK-relations predict an anti-resonance in the n2-spectrum.
From a practical point of view, the figure of merit is more im-portant than absolute n2-values. It reflects the maximal nonlinearphase shift that can be obtained before the optical intensity is toolow for nonlinear effects to occur. Under picosecond excitation,both Q-PbS and Q-PbSe have a comparable figure of merit (of3–4) around 1550 nm. This value is an order of magnitude largerthan the value of Si (0.37) or GaAs (0.1) around these wavelengths,showing that colloidal lead chalcogenide nanocrystals are efficientnonlinear materials.
225
XII. General Conclusions
12.4 Integration with SOI photonic devices
Following these promising results, the particles are integrated withSOI technology to create a nonlinear Qdot–SOI hybrid photonicdevice. As the chemical synthesis yields a suspension of parti-cles, various wet deposition techniques can be used to deposit theparticles on a substrate. We examine three techniques:
Langmuir-Blodgett deposition of a monolayer of Q-PbSe on flatsubstrates and SOI devices is successful, and can be combined withoptical lithography to deposit the particles on specific areas of thesubstrate. Unfortunately, a HR-TEM study of a typical monolayerreveals that the particles fuse together during deposition, probablydue to their fast oxidation. As the optical properties will not bemaintained after the oriented attachment, this technique is notsuitable for the integration of Q-PbSe on a silicon platform.
We also investigate dropcasting of a thick close-packed layerof Q-PbSe. Although a local deposition is again successful ona flat substrate, deposition on top of SOI devices leads to theappearance of cracks in the layer. These hybrid devices experiencesevere optical losses, which is again undesirable.
Finally, spincoating Qdot doped polymer films produces thebest results. The choice of polymer is still important, as Qdotdoped PMMA yields inhomogeneous thin films, probably due tounfavorable interactions between the hydrophobic ligands and thehydrophilic PMMA side chains, leading to nanocrystal clustering.Using PS however leads to optically flat and homogeneous thinfilms. Before spincoating, the maximal particle concentration inthe Qdot–PS–toluene suspension is still limited, so a trade-off mustbe made between a highly doped film of limited thickness, or athicker film, with consequently a reduced Qdot volume fraction.
We deposit the Qdot doped PS thin films on SOI racetracknotch filters to investigate the transmission characteristics of thesehybrid devices. We use the transmission spectra to calculate thetransmission per round trip a and transmission of the couplingsection t of the micro-ring resonator. By varying the Q-PbSe sizein the Qdot doped PS films, we observe a clear correlation between
226
12.4. Integration with SOI photonic devices
the loss of the ring and the nanocrystal absorption coefficient. Asimilar result is obtained by varying the Q-PbS concentration inthe films. Both demonstrate that the light propagating throughthe photonic wire strongly interacts with the deposited Qdots.
This enables us to efficiently tune the output characteristicsof the hybrid notch filter. For instance, for Q-PbSe with anabsorption peak at 1490 nm, we achieve a high extinction ratioof -23.7 dB only for a single resonance, while, when using parti-cles with a peak at 1612 nm, a nearly constant extinction ratio of-12.6 dB is achieved over a 1510-1630 nm wavelength range.
At high optical intensities, the Qdot hybrid notch filters showa blue shift of the resonance wavelength, in combination with anincrease in a. However, in the case of Q-PbSe, this blue shift ispermanent, and in the case of Q-PbS, the spectrum only slowlyevolves back to the original low intensity transmission spectrum.Both results suggest a charging of the Qdot doped thin film, inthe case of Q-PbSe possibly even leading to a fast oxidation ofthe particles. Using PbSe|CdSe core-shell nanocrystals, these ef-fects are not observed, although at first no shift is detected at all.Further studies are still necessary to clarify these issues, and sev-eral suggestions are made to improve the nonlinear properties ofQdot–SOI hybrid devices.
227

228
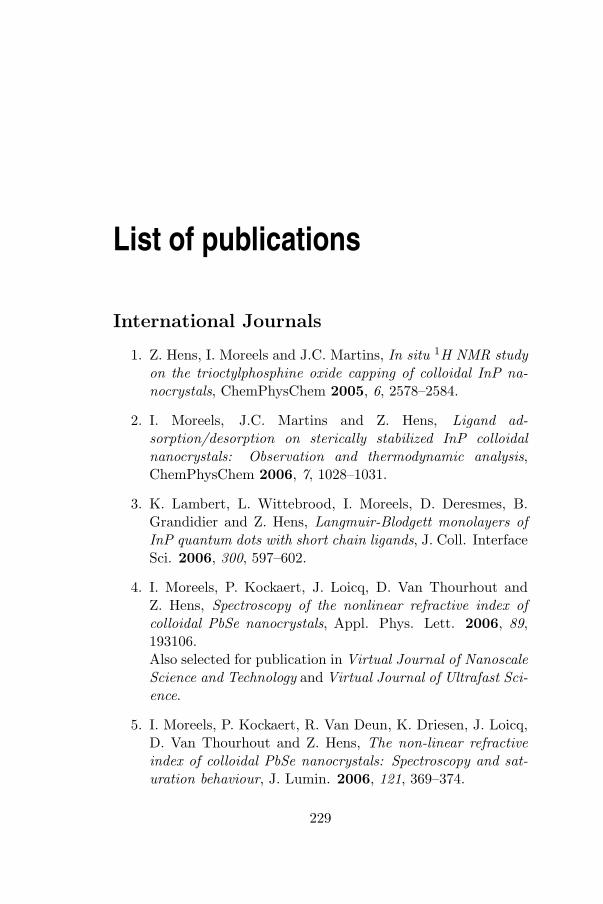
List of publications
International Journals
1. Z. Hens, I. Moreels and J.C. Martins, In situ 1H NMR studyon the trioctylphosphine oxide capping of colloidal InP na-nocrystals, ChemPhysChem 2005, 6, 2578–2584.
2. I. Moreels, J.C. Martins and Z. Hens, Ligand ad-sorption/desorption on sterically stabilized InP colloidalnanocrystals: Observation and thermodynamic analysis,ChemPhysChem 2006, 7, 1028–1031.
3. K. Lambert, L. Wittebrood, I. Moreels, D. Deresmes, B.Grandidier and Z. Hens, Langmuir-Blodgett monolayers ofInP quantum dots with short chain ligands, J. Coll. InterfaceSci. 2006, 300, 597–602.
4. I. Moreels, P. Kockaert, J. Loicq, D. Van Thourhout andZ. Hens, Spectroscopy of the nonlinear refractive index ofcolloidal PbSe nanocrystals, Appl. Phys. Lett. 2006, 89,193106.Also selected for publication in Virtual Journal of NanoscaleScience and Technology and Virtual Journal of Ultrafast Sci-ence.
5. I. Moreels, P. Kockaert, R. Van Deun, K. Driesen, J. Loicq,D. Van Thourhout and Z. Hens, The non-linear refractiveindex of colloidal PbSe nanocrystals: Spectroscopy and sat-uration behaviour, J. Lumin. 2006, 121, 369–374.
229
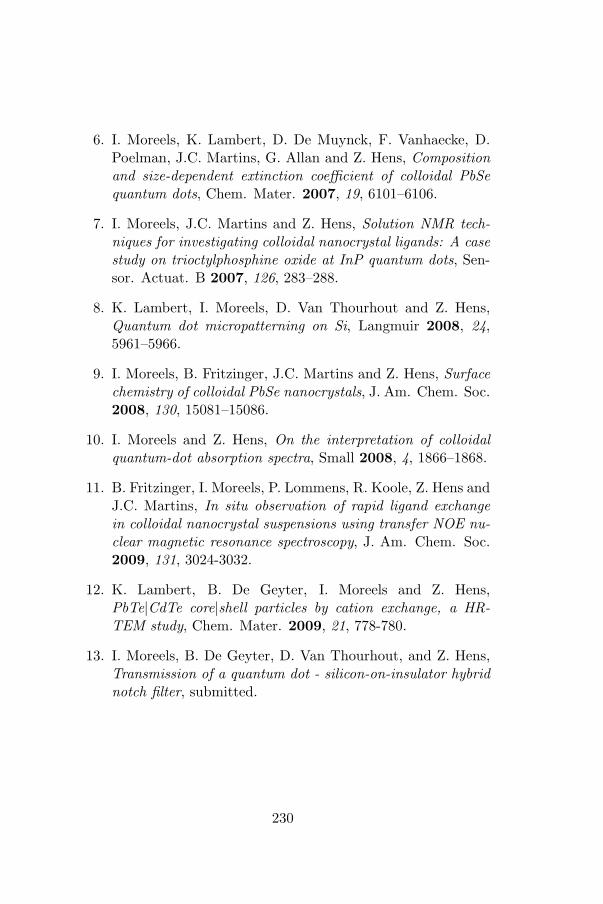
6. I. Moreels, K. Lambert, D. De Muynck, F. Vanhaecke, D.Poelman, J.C. Martins, G. Allan and Z. Hens, Compositionand size-dependent extinction coefficient of colloidal PbSequantum dots, Chem. Mater. 2007, 19, 6101–6106.
7. I. Moreels, J.C. Martins and Z. Hens, Solution NMR tech-niques for investigating colloidal nanocrystal ligands: A casestudy on trioctylphosphine oxide at InP quantum dots, Sen-sor. Actuat. B 2007, 126, 283–288.
8. K. Lambert, I. Moreels, D. Van Thourhout and Z. Hens,Quantum dot micropatterning on Si, Langmuir 2008, 24,5961–5966.
9. I. Moreels, B. Fritzinger, J.C. Martins and Z. Hens, Surfacechemistry of colloidal PbSe nanocrystals, J. Am. Chem. Soc.2008, 130, 15081–15086.
10. I. Moreels and Z. Hens, On the interpretation of colloidalquantum-dot absorption spectra, Small 2008, 4, 1866–1868.
11. B. Fritzinger, I. Moreels, P. Lommens, R. Koole, Z. Hens andJ.C. Martins, In situ observation of rapid ligand exchangein colloidal nanocrystal suspensions using transfer NOE nu-clear magnetic resonance spectroscopy, J. Am. Chem. Soc.2009, 131, 3024-3032.
12. K. Lambert, B. De Geyter, I. Moreels and Z. Hens,PbTe|CdTe core|shell particles by cation exchange, a HR-TEM study, Chem. Mater. 2009, 21, 778-780.
13. I. Moreels, B. De Geyter, D. Van Thourhout, and Z. Hens,Transmission of a quantum dot - silicon-on-insulator hybridnotch filter, submitted.
230

International Conference Proceedings
14. G. Priem, I. Moreels, P. Dumon, Z. Hens, D. Van Thourhout,G. Morthier, R. Baets, InP-nanocrystal monolayer deposi-tion onto Silicon-on-Insulator Structures, LEOS ANNUAL2005, Australia 2005, p.TuB1.
15. J.C. Martins, I. Moreels, Z. Hens, Solution NMR spec-troscopy as a useful tool to investigate colloidal nanocrystaldispersions from the capping ligand’s point of view, Mater.Res. Soc. Symp. Proc. 2007, 984 0984–MM14–07.
16. I. Moreels, P. Kockaert, D. Van Thourhout, Z. Hens, Newmaterials for nonlinear optical applications: The nonlinearrefractive index of colloidal PbSe quantum dots, IEEE/LEOSSymposium Benelux Chapter, Brussel 2007, 43–46.
17. B. De Geyter, I. Moreels, A. Meijerink, D. Van Thourhout,Z. Hens, Type-II core/shell colloidal quantum dots for siliconcompatible lasers, IEEE/LEOS Symposium Benelux Chap-ter, Enschede 2008, 143–146.
18. I. Moreels, P. Kockaert, B. De Geyter, D. Van Thourhout, Z.Hens, Colloidal semiconductor quantum dots: from synthesisto photonic applications, IEEE/LEOS Symposium BeneluxChapter, Enschede 2008, 191–194.
231

232


Related Documents