SECOND HALF 2010 Accelerating success. GLOBAL OFFICE REAL ESTATE REVIEW

Colliers International Global Office Real Estate Review Year-End 2010
Aug 20, 2015
Welcome message from author
This document is posted to help you gain knowledge. Please leave a comment to let me know what you think about it! Share it to your friends and learn new things together.
Transcript

SECOND HALF 2010
Accelerating success.
GLOBAL OFFICEREAL ESTATE REVIEW

The information contained herein has been obtained from sources deemed reliable. While every reasonable effort has been made to ensure its accuracy, we cannot guarantee it. No responsibility is assumed for any inaccuracies. Readers are encouraged to consult their professional advisors prior to acting on any of the material contained in this report. This publication is the copyrighted property of Colliers International and/or its licensor(s).
©2011 Colliers International. All rights reserved.

Global Summary and Regional Synopses 1 – 6
GLOBAL OFFICE MARKETSEurope, Middle East & Africa (EMEA) 7 – 8North America 8 – 9Asia Pacific and Latin America 9
CONSTRUCTION AND VACANCYEMEA 10 – 11North America 11 – 12Asia Pacific and Latin America 12
CENTRAL BUSINESS DISTRICT SURVEYEMEA – Occupancy Costs 13 – 14North America – Occupancy Costs 14 – 15Asia Pacific and Latin America – Occupancy Costs 15EMEA – U.S. Dollars Occupancy Costs/Sales Prices/Cap Rates 16 – 17North America – U.S. Dollars Occupancy Costs/Sales Prices/Cap Rates 17 – 18Asia Pacific and Latin America – U.S. Dollars Occupancy Costs/Sales Prices/Cap Rates 18
SUBURBAN/OUT-OF-TOWN SURVEYEMEA – Occupancy Costs 19North America – Occupancy Costs 20 – 21Asia Pacific and Latin America – Occupancy Costs 21EMEA – U.S. Dollars Occupancy Costs/Sales Prices/Cap Rates 22North America – U.S. Dollars Occupancy Costs/Sales Prices/Cap Rates 23 – 24Asia Pacific and Latin America – U.S. Dollars Occupancy Costs/Sales Prices/Cap Rates 24
Glossary 25
AMERICASRoss [email protected]
EUROPE, MIDDLE EAST & AFRICAThomas [email protected]
Mark CharltonUnited [email protected]
Damian Harrington Central and Eastern [email protected]
Renaud [email protected]
Andreas TrumppGermany [email protected]
ASIA PACIFICSimon [email protected]
Amit [email protected]
Nerida ConisbeeAustralia/New [email protected]
Yumiko [email protected]
TABLE OF CONTENTSwww.colliers.com
GLOBAL MARKET ANALYSIS AND FORECASTS
RESEARCH CONTACTS
GLOBAL OFFICE REAL ESTATE REVIEW | SECOND HALF 2010
Cover photo: Basel, Switzerland (iStockphoto)


GLOBAL OFFICE REAL ESTATE REVIEW | SECOND HALF 2010
COLLIERS INTERNATIONAL | P. 1 Contact: Ross Moore—[email protected]
ROSS J. MOORE CHIEF ECONOMIST | USA
Office space markets around the world continued to make gains in the second half of 2010. Most regions showed further signs that the worst of the global financial crisis had passed, and tenants were back in the market with a renewed appetite for office space. Leasing activity was up from the prior six-month period and was also an improvement from a year ago. In particular, many parts of Asia Pacific, Latin America, Canada and major markets in the United States and Europe all posted healthy growth rates in the second half of 2010. Parts of the United States and much of Europe, however, chalked up another six-month period of tepid demand. With the exception of Asia Pacific, all regions reported lower or stable vacancies while rents were more mixed. Construction remains concentrated in Asia Pacific with year-end data showing 165.6 million square feet, or 42 percent of global construction underway within this rapidly growing region. By comparison, five years ago just 91.1 million square feet was under construction in Asia Pacific.
As we anticipated, midyear 2010 will be remembered as an inflection point for the global office market and the second half of the year will mark the beginning of the next up-cycle. Office investment sales activity in the second half of 2010 was up again, relative to both the first half of the year and also the same period a year ago. This suggests investors continue to get more comfortable with pricing and the prospect of firming market fundamentals in the near- and medium-term.
The outlook for 2011 is for continued growth, but the recent surge in energy prices and the geopolitical tensions in the Middle East and North Africa are reasons for concern. Higher oil prices represent a fairly significant headwind for all regions of the world, and could derail what appears to be a reasonably strong recovery. However, because of the usual lags, any future deceleration won’t be apparent until the second half of the year. In the interim, leasing markets are expected to strengthen and investment sales activity to increase further.
EUROPE, MIDDLE EAST & AFRICA (EMEA)
With improving economic conditions across most parts of Europe, the Middle East and Africa, the EMEA average vacancy rate dropped slightly to 12.27 percent at year end. This was a decrease of 11 basis points since midyear, but an increase of 26 basis points over the past 12 months. Indeed, just over half of the 63 markets which make up EMEA recorded lower vacancies in the second half of the year. The drop in vacancy was felt across the region, but was particularly acute in Birmingham, Bratislava, Glasgow, Johannesburg, Kyiv, Moscow, Riga, Stockholm and Tallinn, all of which saw their respective vacancy rates decrease by two percentage points or more in the second half of 2010. Seventeen EMEA cities still have vacancy rates in excess of 15 percent and six markets have vacancy over 20.0 percent. While the regional vacancy rate remains elevated, vacancies in key markets including Berlin, Brussels, central London, Manchester, Moscow, Tel Aviv and Warsaw all fell during second half of the year. With vacancy showing signs of stabilizing, Class A rents increased by 0.4 percent in the second half of 2010. This was on the heels of a 1.4 percent increase in the first half of 2010. Notable cities registering increases in asking rents included Berlin, Geneva, London City, Paris,
Office Markets Continue To Bounce BackInvestors Anxious To Piggyback on Global Economic Recovery
OFFICE CONSTRUCTION – TOP 50 CITIES
MARKET (Ranked by December 2010)
DEC. 2010
JUNE 2010
DEC. 2009
Shanghai 37.5 37.0 23.7Moscow 30.2 30.2 43.5Ho Chi Minh City 29.1 7.2 –Tokyo 23.1 23.1 11.5Riyadh 18.5 11.2 –Guangzhou 18.1 26.9 34.7Mexico City 14.8 12.5 11.3São Paulo 13.8 12.0 16.1Dubai 10.8 28.0 24.0Athens 8.5 1.6 –Beijing 8.5 9.3 9.9Sofia 7.7 7.2 2.7Chennai 7.6 4.1 2.1Singapore 6.2 7.6 8.3Delhi/Gurgaon/Noida 5.2 3.9 1.5Jakarta 5.0 6.1 7.3Saint Petersburg 5.0 6.9 3.4Paris 4.9 7.5 11.8Milan 4.9 4.9 –Abu Dhabi 4.3 12.9 13.1Seoul 4.2 4.2 6.7Hamburg 3.9 3.8 5.3Frankfurt 3.9 3.1 3.9Washington, DC 3.8 5.6 6.0Istanbul 3.4 3.0 2.6Kyiv 3.4 3.2 1.6Madrid 3.3 3.6 3.8Bangalore 3.3 4.0 5.4Amsterdam 3.2 3.5 2.7Johannesburg 3.2 2.6 2.7Bucharest 2.9 2.9 3.2Zurich 2.9 3.2 1.6Melbourne 2.9 1.2 0.9Bogotá 2.8 2.4 3.6Berlin 2.8 1.5 1.5Sydney 2.8 2.5 1.9Munich 2.8 2.9 5.2Chengdu 2.7 – –Santiago 2.7 1.4 0.2New York – Downtown Manhattan 2.6 2.6 6.6Calgary 2.5 3.0 4.5Vienna 2.5 2.5 1.6Toronto 2.3 0.9 1.8Houston 2.1 2.2 2.2Mumbai 2.1 2.1 –Brussels 1.9 6.5 6.5Minsk 1.9 1.6 –Düsseldorf 1.9 1.7 2.2Seattle/Puget Sound 1.9 2.5 3.0Budapest 1.8 1.1 4.0
UNDER CONSTRUCTION (MILLION SQUARE FEET)

P. 2 | COLLIERS INTERNATIONAL
GLOBAL OFFICE REAL ESTATE REVIEW | SECOND HALF 2010
GLOBAL VACANCY RATES (%)
MONTH/YEAR EMEA
ASIAPACIFIC USA
LATIN AMERICA
Dec. 2003 11.3 13.4 15.1 15.2June 2004 10.7 12.4 14.9 12.4Dec. 2004 11.7 14.0 14.2 12.2June 2005 9.7 8.6 14.2 11.5Dec. 2005 8.3 8.2 13.5 9.2June 2006 8.0 7.6 13.1 7.3Dec. 2006 7.4 7.1 12.6 7.6June 2007 6.8 7.7 12.4 5.2Dec. 2007 6.7 8.1 12.6 3.8June 2008 7.1 7.7 13.2 2.6Dec. 2008 8.5 8.7 14.2 2.7June 2009 11.3 11.4 15.5 5.8Dec. 2009 11.9 12.2 16.2 5.8June 2010 12.3 11.9 16.3 5.9Dec. 2010 12.2 12.4 16.1 5.9
EMEA VACANCY RATES (%)
MONTH/YEAR
LONDON – WEST END PARIS FRANKFURT MOSCOW
Dec. 2003 11.7 4.6 15.0 6.7June 2004 10.8 5.5 16.1 6.8Dec. 2004 10.7 5.7 17.7 6.6June 2005 10.9 5.5 16.7 6.3Dec. 2005 8.8 5.8 16.7 5.8June 2006 7.5 5.2 16.9 3.1Dec. 2006 6.4 5.2 15.6 2.4June 2007 5.2 5.0 15.3 2.6Dec. 2007 4.1 4.8 15.2 4.5June 2008 5.4 5.0 15.3 1.0Dec. 2008 6.1 5.4 14.7 9.5June 2009 9.9 6.4 15.9 16.9Dec. 2009 9.5 7.0 16.5 16.5June 2010 9.4 7.0 17.3 14.6Dec. 2010 8.2 7.0 17.8 12.0
ASIA PACIFIC VACANCY RATES (%)
MONTH/YEAR
HONG KONG SHANGHAI SYDNEY TOKYO
Dec. 2003 13.8 11.0 9.5 8.0June 2004 10.0 10.0 10.3 7.5Dec. 2004 6.2 7.2 11.2 7.0June 2005 5.6 6.1 10.1 6.0Dec. 2005 5.0 5.0 9.6 5.0June 2006 4.2 5.4 9.4 4.0Dec. 2006 3.8 3.7 7.9 3.9June 2007 3.8 3.1 5.6 3.9Dec. 2007 1.7 2.5 3.7 2.5June 2008 1.5 5.5 4.3 3.5Dec. 2008 4.0 10.3 5.4 4.0June 2009 5.1 14.1 7.8 6.5Dec. 2009 5.1 15.2 8.2 7.5 June 2010 4.0 12.9 8.5 8.2 Dec. 2010 3.1 13.1 8.2 8.5
Stockholm and Tel Aviv. London again retained its position as the most expensive office market in the region, with current average Class A asking rents in the West End sub-market at $133.00 USD/£86.00 GBP per square foot per year; Paris, London City, London Southbank and Geneva rounded out the top five most expensive office rental markets in the region.
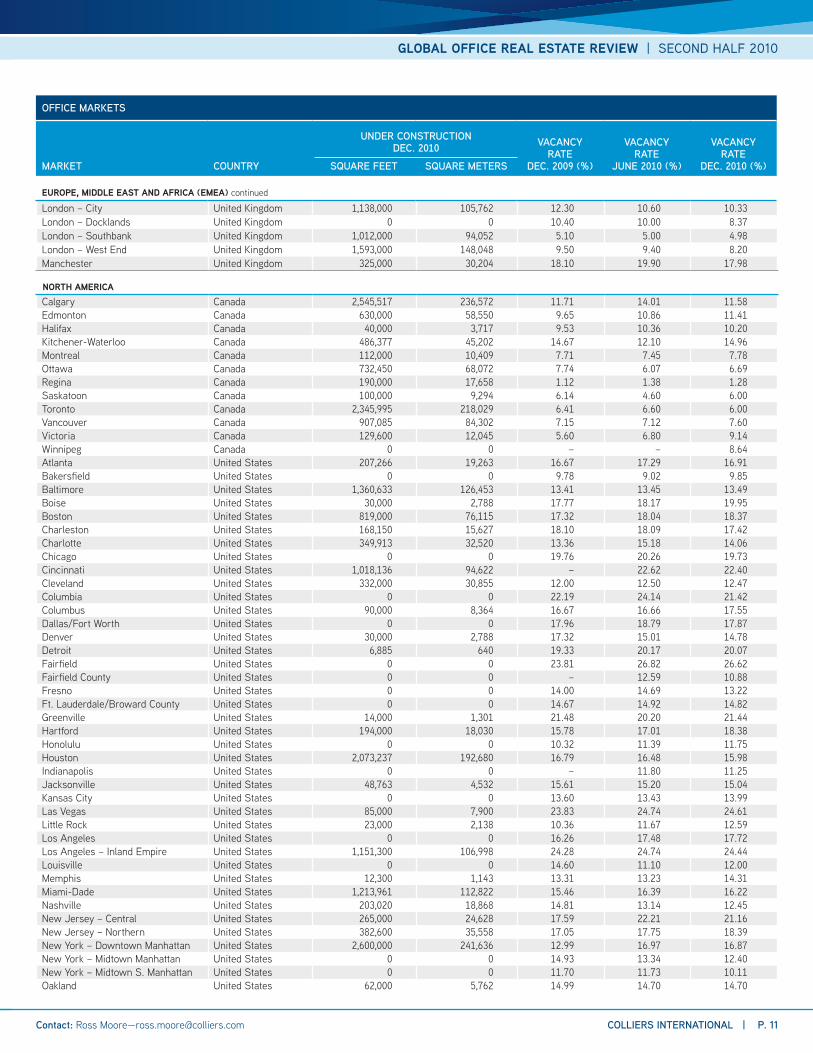
Office space under construction at year-end was down modestly from midyear: at year-end, development totaling 163.0 million square feet was underway, compared with 178.4 million square feet at midyear. Big drops were recorded in Dubai and Abu Dhabi, with their combined development pipeline declining by 25.8 million square feet. Cities with still-high levels of construction included Moscow, Riyadh and Dubai (even after dropping from midyear).
ASIA PACIFIC
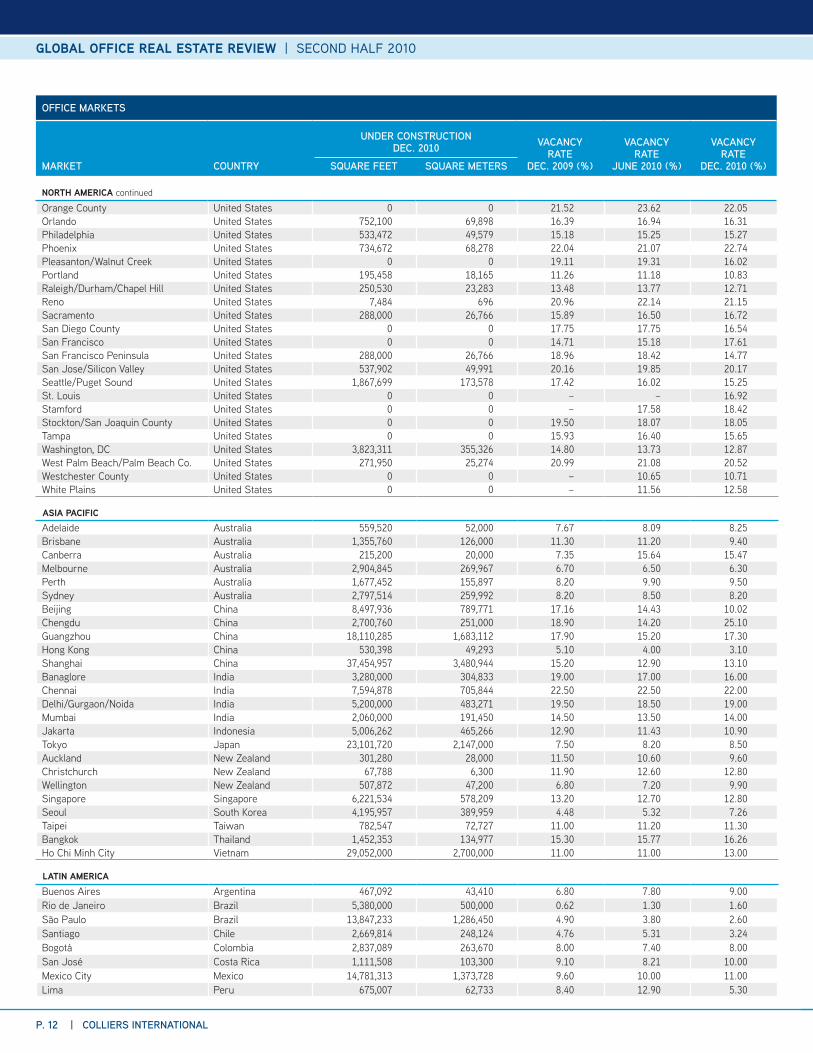
The Asia Pacific region posted modestly weaker results during the latter half of 2010 with the regional vacancy rate up 44 basis points to 12.36 percent. Excluding Chengdu, which saw a sharp jump in vacancy, average vacancy across the region held steady relative to midyear. In contrast to the first half of the year, mainland China vacancy rates drifted higher while Australian cities generally recorded lower availability. India was mixed, with two out of four cities recording higher vacancy.
Chengdu posted the highest vacancy rate in the region at 25.1 percent, followed by Chennai, Delhi, Guangzhou, Bangkok, Bangalore and Canberra all with vacancy rates at or above 15 percent. Hong Kong recorded the region’s lowest vacancy rate at just 3.1 percent. After hitting bottom at the end of 2009, office rents moved modestly higher in both the first and second halves of 2010, increasing an average of 4.6 percent in the latter six-month period and 11.4 percent for the year. Cities recording significant increases during the second half of 2010 included Beijing, Guangzhou, Ho Chi Minh City, Hong Kong, Seoul, Shanghai, and Singapore. Modest declines were limited to just two cities: Perth and Wellington, where rents fell 7.4 percent and 8.7 percent respectively.
The Asia Pacific region remains characterized by high levels of office construction with Beijing, Chennai, Delhi, Guangzhou, Ho Chi Minh City, Jakarta, Shanghai, Singapore and Tokyo all with at least five million square feet of construction underway. Construction in these nine cities totaled 140.2 million square feet at year-end.
On the demand side, the region is expected to continue leading the world in economic expansion. China and India are expected to continue registering robust growth in 2011, with rapid increases also anticipated in Indonesia and the Philippines. At press time, we cannot gauge the effects of the March 11 earthquake and tsunami on Japan’s economy in 2011. However, its growth had previously been forecast at 1.5 percent, the lowest in the region. In a ranking of highest office occupancy costs (average Class A gross rents) Hong Kong again took the top spot, both within the region and the world, at $192.00 USD per square foot per year/$125.00 HKD per square foot per month, while Tokyo was second (third spot worldwide) at $105.00 USD per square foot/¥92,000 JPY per square meter per year.
Looking through to the end of 2011, Asia Pacific is anticipated to remain the engine of growth for the global economy. Although economic expansion is expected to be below 2010 levels—due to attempts by China to slow growth, and the impact of higher energy costs—growth in the region is still anticipated

GLOBAL OFFICE REAL ESTATE REVIEW | SECOND HALF 2010
COLLIERS INTERNATIONAL | P. 3 Contact: Ross Moore—[email protected]
to be well ahead of that seen in either the United States or Europe. Leasing markets are expected to remain relatively robust, driven by both domestic and multi-national corporations. The emergence of a growing middle class in many of the countries within the region remains a dominant theme and one that is unlikely to end anytime soon. The continued delivery of office space will act as a drag on any material growth in rents; however, a trend towards higher occupancy costs is expected to hold for most cities in the region.
UNITED STATES/CANADA
The United States office market finished the year on a relative high note. Aided by modest expansion in the economy and a further improvement in business conditions, office leasing activity was reasonably robust throughout the July-December period. The latter half of the year had many of the hallmarks of an inflection point, and given the momentum going into 2011, fundamentals are positioned to improve markedly by the end of the year. Despite better leasing markets, both Canadian and U.S. office vacancies only managed a slight drop during the last six months of the year, with U.S. markets recording mildly positive absorption while Canadian markets registered more substantial growth.
With very limited new office construction, the overall U.S. office vacancy rate dropped by 30 basis points to finish the year at 16.1 percent. With leasing activity up, rents began to show signs of stabilizing; however, in all but a select few markets, excess supply continued to place downward pressure on rents. Tenant inducements and free rent were little-changed during the latter half of the year, suggesting any upward move in rents is still some time away. U.S. office markets are benefiting from a steady rise in office-using jobs, but companies continue to be very cautious about taking on any additional office real estate.
Canadian office markets demonstrated slightly more strength, but Canadian office users also continued to be very cautious. Construction continued to wind down in Toronto and Calgary, helping to bring vacancy levels lower in those two cities. In contrast to the U.S., however, the Canadian marketplace continues to benefit from significant job growth and an economy powered by commodities including oil. Across the continent, Midtown Manhattan continued to hold top spot for office occupancy costs with average Class A rents of $65.00 USD per square foot, followed by Washington at $54.00 USD and Vancouver $53.00 USD/$53.00 CAD.
GLOBAL OFFICE OCCUPANCY COSTS – TOP 50 CITIES
MARKET (Ranked by December 2010)
DEC. 2010
JUNE 2010
DEC. 2009
Hong Kong 191.97 161.42 141.52London – West End 133.02 129.58 139.43Tokyo 105.00 100.76 101.24Paris 102.15 91.82 83.19London City 99.77 94.17 99.46Rio de Janeiro 94.74 73.44 95.62São Paulo 78.73 68.50 73.31London Southbank 75.02 73.08 83.48Singapore 73.51 58.08 53.71Geneva 69.10 55.63 55.47Perth 68.54 64.42 66.34Stockholm 68.45 55.91 58.13Brisbane 65.57 58.05 43.54New York, NY – Midtown Manhattan 65.04 62.76 62.37Sydney 64.42 55.83 51.42Delhi 64.02 58.60 51.69London - Docklands 63.42 61.77 72.82Mumbai 62.24 59.64 59.11Milan 62.15 58.38 66.56Ho Chi Minh City 60.63 48.00 –Moscow 60.15 68.33 77.55Bristol 54.91 53.49 61.28Washington, DC 53.59 51.26 51.00Vancouver 52.99 43.69 44.79Birmingham 52.59 51.23 55.74Edinburgh 52.59 51.23 54.95Glasgow 52.59 51.23 52.56Toronto 51.29 51.07 48.56Manchester 50.27 48.97 59.50Frankfurt 50.21 46.28 60.70Zurich 49.36 45.36 41.16Melbourne 48.43 44.46 43.54Ottawa 48.31 46.26 47.17Saint Petersburg 48.18 49.10 51.08Boston 46.01 45.51 47.90Rome 44.31 43.07 50.58Munich 44.31 40.84 48.75Rome 44.31 43.07 50.58New York – Midtown S. Manhattan 43.21 42.42 40.59Miami-Dade 41.52 42.01 43.25Adelaide 40.66 36.58 36.07Madrid 40.61 36.75 43.16Tel Aviv 40.07 35.57 32.3Shanghai 40.02 37.86 39.41Minsk 39.88 42.20 –New York – Downtown Manhattan 39.68 39.82 38.85Calgary 39.49 49.60 40.02Abu Dhabi 39.34 52.94 60.16Canberra 39.29 33.40 34.83Beijing 39.10 33.06 31.53
NORTH AMERICA VACANCY RATES (%)
MONTH/YEAR
WASHINGTON, DC – CBD
NEW YORK –MIDTOWN
TORONTO – CBD
SAN FRANCISCO
Dec. 2003 7.8 11.8 11.7 16.9June 2004 7.2 11.4 11.1 17.0Dec. 2004 7.4 10.5 11.0 15.4June 2005 6.7 9.6 10.1 14.6Dec. 2005 7.3 8.0 9.2 13.2June 2006 7.2 7.4 8.9 12.4Dec. 2006 7.1 6.5 8.0 11.6June 2007 7.2 6.4 5.2 11.1Dec. 2007 7.4 6.8 4.6 9.9June 2008 7.9 8.2 4.0 10.4Dec. 2008 7.8 10.2 4.0 12.6June 2009 9.6 13.7 4.7 14.1Dec. 2009 11.6 14.9 6.4 14.7June 2010 11.7 13.3 6.6 15.2Dec. 2010 11.1 12.4 6.0 17.6
CLASS A/PRIME SPACE (USD PER SQUARE FOOT)

P. 4 | COLLIERS INTERNATIONAL
GLOBAL OFFICE REAL ESTATE REVIEW | SECOND HALF 2010
U.S. and Canadian office markets are expected to continue strengthening as the year unfolds. Both countries are creating jobs, both have very little construction coming to the market and both should see the economy grow by approximately 3.0 percent. Canadian markets are expected to be propelled by companies tied to natural resources, while U.S. leasing markets should benefit from businesses tied to either technology and/or media. Headwinds include the recent rise in oil prices and job cuts by state and local governments, which present a significant potential drag on the overall economy. Interest rates are expected to remain relatively low in both countries.
LATIN AMERICA
For the fourth consecutive six-month period the Latin America region registered vacancies near the six percent level. Looking at major markets in the region, the office vacancies largely held steady during the latter half of 2010, finishing the year at 5.91 percent. Rio de Janeiro again posted the lowest office vacancy rate in the region at just 1.6 percent. At the other end of the spectrum, Mexico City’s vacancy rate increased a full percentage point to average 11.00 percent at year-end. The Latin American region continues to register very robust growth rates. Led by Peru with GDP growth of 8.7 percent in 2010 and 5.1 percent in 2011, the rest of the region including Argentina, Brazil, Chile and Colombia, are home to some of the fastest-growing economies in the world. This growth is expected to once again push vacancies lower and rents higher.
Office construction remained concentrated in Mexico City and São Paulo, with 26.8 million square feet currently underway in the two cities. In the third spot was Rio de Janeiro with 5.4 million square feet under construction, which should help relieve extremely tight leasing conditions in that market—the most expensive office market in the region, with average Class A gross rents of $95.00 USD per square foot (sixth-highest worldwide).
GLOBAL INVESTMENT SALES
Global office investment sales increased for the third consecutive six-month period, with second half 2010 sales totaling $88.7 billion USD. This was an increase of 52 percent from the first six months of the year and a 32 percent increase from the same period a year ago. EMEA was the most active region,
LATIN AMERICA VACANCY RATES (%)
MONTH/YEAR
MEXICO CITY
SãO PAULO
BUENOS AIRES BOGOTÁ
Dec. 2003 16.2 14.7 18.2 4.0June 2004 15.9 14.2 14.0 1.6Dec. 2004 15.4 15.5 9.9 2.1June 2005 16.5 14.8 7.6 2.1Dec. 2005 13.1 11.0 3.0 1.8June 2006 11.7 8.8 2.4 2.4Dec. 2006 10.4 7.6 1.8 1.6June 2007 8.0 5.9 2.9 1.3Dec. 2007 7.6 3.3 1.4 0.9June 2008 8.5 2.7 1.5 1.3Dec. 2008 6.1 4.0 2.9 3.2June 2009 5.1 5.7 6.2 7.3Dec. 2009 9.6 4.9 6.8 8.0June 2010 10.0 3.8 7.8 7.4Dec. 2010 11.0 2.6 9.0 8.0
LARGEST INCREASE IN VACANCY RATES – TOP 50 CITIES
MARKET
CHANGE IN VACANCY JUNE 2010-DEC. 2010
(Basis Points)
Riyadh 1,400 Chengdu 1,090 Durban 1,000 Dubai 500 Sofia 440 Madrid 320 Kitchener-Waterloo 286 Wellington 270 San Francisco 244 Victoria 235 Guangzhou 210 Ho Chi Minh City 200 Seoul 194 San José 179 Boise 177 Phoenix 168 Istanbul 143 Saskatoon 140 Hartford 138 Belgrade 130 Greenville 124 Buenos Aires 120 Memphis 108 White Plains 102 Tirana 100 Mexico City 100 Little Rock 92 Louisville 90 Columbus 89 Stamford 84 Bakersfield 83 Hamburg 80 New Jersey – Northern 64 Ottawa 63 Bogotá 60 Toulouse 60 Kansas City 56 Edmonton 55 Frankfurt 50 Delhi/Gurgaon/Noida 50 Mumbai 50 Bangkok 49 Vancouver 47 Honolulu 36 Boston 34 Montreal 33 San Jose/Silicon Valley 33 Helsinki 30 Tokyo 30 Rio de Janeiro 30

GLOBAL OFFICE REAL ESTATE REVIEW | SECOND HALF 2010
COLLIERS INTERNATIONAL | P. 5 Contact: Ross Moore—[email protected]
with office sales volume of $33.7 billion, followed by the Americas at $32.8 billion, and Asia Pacific at $22.2 billion. The Americas, however, saw the biggest increase in volume in the second half of the year, more than doubling to rise 134 percent relative to the first six months of the year. EMEA office sales increased 30 percent and Asia Pacific sales were up 21 percent.
Office prices by region were more mixed in second half of the year. In contrast to the first half of the year when prices were up across all three regions, in the latter half prices appeared to move up sharply in the Americas, hold steady in Asia Pacific, and take a step back in Asia Pacific. Office capitalization rates/yields in the Americas moved 131 basis points lower while EMEA yields dropped by just 2 basis points. Asia Pacific yields, however, increased by 31 basis points. Despite these three quite different data points, the general trend in cap rates/yields remains down. Sample bias is somewhat responsible for the mixed results highlighted by the Americas, where most sales have been prime real estate in top-tier markets. A more robust global economy combined with improved financial markets is clearly boosting both transaction volume and also pricing. While access to debt is still a challenge in certain markets, and much uncertainty remains as to the sustainability of the economic expansion (and job growth in particular), real estate markets around the world appear to be shaking off the difficulties created by the global financial crisis and once again are on the buy list of investors. Cross-border investment, however, is still relatively subdued compared to 2007, but a trend of rising foreign investment is regaining momentum. The EMEA region is expected to see the most cross-border investment in the 2011, but the U.S is also expected to witness a significant increase as the market recovers.
LATIN AMERICA VACANCY RATES (%)
MONTH/YEAR
MEXICO CITY
SãO PAULO
BUENOS AIRES BOGOTÁ
Dec. 2003 16.2 14.7 18.2 4.0June 2004 15.9 14.2 14.0 1.6Dec. 2004 15.4 15.5 9.9 2.1June 2005 16.5 14.8 7.6 2.1Dec. 2005 13.1 11.0 3.0 1.8June 2006 11.7 8.8 2.4 2.4Dec. 2006 10.4 7.6 1.8 1.6June 2007 8.0 5.9 2.9 1.3Dec. 2007 7.6 3.3 1.4 0.9June 2008 8.5 2.7 1.5 1.3Dec. 2008 6.1 4.0 2.9 3.2June 2009 5.1 5.7 6.2 7.3Dec. 2009 9.6 4.9 6.8 8.0June 2010 10.0 3.8 7.8 7.4Dec. 2010 11.0 2.6 9.0 8.0
COUNTRY GROWTH RATES
COUNTRY (Ranked by 2011)
2010 2011(Forecast)
China 10.3 9.0India 9.1 9.0Indonesia 5.9 6.0Chile 5.1 6.0Philippines 6.9 5.4Argentina 8.2 5.2Turkey 8.1 5.2Peru 8.7 5.1Hong Kong 6.6 4.7Colombia 3.9 4.5Brazil 7.7 4.3Malaysia 6.8 4.3Russia 3.7 4.3Poland 3.8 4.2Singapore 14.8 4.1South Korea 6.1 3.9Saudi Arabia 3.8 3.9South Africa 2.8 3.7Sweden 5.2 3.6Israel 3.7 3.6Mexico 5.0 3.5Taiwan 10.1 3.3Slovakia 4.2 3.3Australia 2.9 3.2Latvia -0.5 3.2United States 2.9 3.1Estonia 1.5 2.9Lithuania -0.2 2.9Germany 3.5 2.6Finland 3.1 2.6Canada 2.9 2.6New Zealand 1.8 2.6Switzerland 2.7 2.1Czech Republic 2.1 2.0Denmark 2.0 2.0Hungary 1.0 2.0Belgium 2.0 1.8Austria 1.7 1.8Britain 1.6 1.8Netherlands 1.8 1.7France 1.5 1.5Norway -0.2 1.5Italy 1.1 1.1Spain -0.2 0.4Ireland -1.0 -0.9Greece -3.9 -3.3Japan 4.2 –
Blue = G7 CountriesSource: Economist Intelligence Group, February 2011
CHANGE IN GROSS DOMESTIC PRODUCT (%)
GLOBAL INVESTMENT SALES OFFICE PROPERTIES – TOP 20 CITIES
MARKET
2010 VOLUME
(Million USD)
2009VOLUME
(Million USD)
CHANGE 2009-2010
(%)London Metro 15,340 15,347 0.0Tokyo 11,638 11,262 3.3NYC Metro 8,536 2,667 220.1Paris 7,649 7,527 1.6Hong Kong 7,171 3,088 132.2Washington, DC Metro 5,675 2,481 128.8San Francisco Metro 4,222 1,101 283.6Moscow 3,697 2,995 23.4Seoul 3,494 4,756 -26.5Sydney 2,982 1,229 142.7Beijing 2,835 1,899 49.2Chicago 2,604 434 500.2Singapore 2,598 589 340.9Frankfurt 2,563 524 389.1Stockholm 2,559 598 328.1Los Angeles Metro 2,419 1,263 91.5São Paulo 2,115 319 563.2Boston 1,912 815 134.5Toronto 1,768 731 141.9Brisbane 1,667 577 189.0
Source: Real Capital Analytics. Based on independent reports of properties and portfolios $10 million and greater.

P. 6 | COLLIERS INTERNATIONAL
GLOBAL OFFICE REAL ESTATE REVIEW | SECOND HALF 2010
An analysis of office sales activity by city for 2010 shows London took top spot at $15.3 billion USD followed by Tokyo at $11.7 billion and New York at $8.5 billion. Rounding out the top five were Paris at number four with $7.7 billion in office trades and Hong Kong at $7.2 billion. New York registered the largest year-over-year increase, with sales up 220 percent. Hong Kong also saw a large increase, with sales more than doubling; while Tokyo, London and Paris all saw 2010 investment volume little changed from 2009.
While average capitalization rates/yields in the three regions were mixed in the second half of the year, prime yields were lower in almost all markets. In Asia Pacific major markets such as Guangzhou, Hong Kong, Shanghai, Sydney, Taipei and Tokyo all reported lower yields. In the EMEA region Berlin, Frankfurt, Madrid, Paris, Stockholm, Vienna, Warsaw and Zurich all saw capitalization rates move lower. In North America most top-tier markets saw lower cap rates, including Boston, New York, San Francisco, Washington and all of the major Canadian metros. In secondary and tertiary markets, however, yields are beginning to edge downwards, but not with any conviction.
Office real estate in almost all regions of the world continues to make progress towards a more balanced market with supply and demand more evenly matched. Investors are also wading back into the market as debt is once again becoming more available and there is a reasonable prospect of rising cash flows. Real estate has long been a place to store wealth, and as financial markets rebound, demand for income-producing real estate is sure to follow. Investors may get frustrated with pricing, bearing in mind still-weak leasing markets, but the move back into office real estate is almost certain to gain strength as 2011 unfolds.
GLOBAL CAPITALIZATION RATES/INTIAL YIELDS – 50 LOWEST CITIES
MARKET (Ranked by December 2010)
DEC. 2010
JUNE 2010
DEC. 2009
Taipei 2.90 3.20 3.50Hong Kong 3.30 3.35 3.00Vienna 3.50 3.50 3.50Geneva 4.00 4.00 4.50Zurich 4.10 4.40 4.40Singapore 4.20 3.80 3.85London – West End 4.50 4.50 4.75Munich 4.50 4.50 4.75Tokyo 4.70 4.80 4.80Paris 4.75 5.10 5.75Hamburg 4.80 4.80 5.00Copenhagen 5.00 5.00 5.00New York – Midtown S. Manhattan 5.00 6.00 6.00New York – Midtown Manhattan 5.00 6.50 6.50Stockholm 5.00 5.50 5.50Shanghai 5.10 5.40 5.80Düsseldorf 5.25 5.50 5.50Berlin 5.30 5.50 5.30Frankfurt 5.30 5.40 5.40Stuttgart 5.40 5.50 5.50London – City 5.50 5.50 6.00Milan 5.50 5.50 5.50Birmingham 5.75 5.75 5.75Helsinki 5.75 6.25 6.50London – Docklands 5.75 5.75 6.25London – Southbank 5.75 5.75 6.25Madrid 5.75 6.00 6.00Manchester 5.75 5.75 5.75Vancouver 5.75 6.00 5.75Glasgow 5.85 5.85 5.85Bristol 6.00 6.00 6.00Edinburgh 6.00 6.00 6.00Rome 6.00 6.00 6.00Warsaw 6.00 6.70 7.00Brussels 6.10 6.20 6.30Belfast 6.25 6.25 –Guangzhou 6.26 6.69 6.00Lyon 6.30 6.30 6.50Victoria 6.35 6.50 6.50Amsterdam 6.50 6.50 6.50Boston 6.50 6.50 7.50Calgary 6.50 6.63 7.50Beijing 6.60 6.50 7.40New York – Downtown Manhattan 6.90 6.00 6.00Bratislava 7.00 9.00 9.00Istanbul 7.00 7.00 7.00Melbourne 7.00 7.40 7.40Montreal 7.00 7.25 7.50Prague 7.00 7.00 7.00Seoul 7.00 5.50 6.30
CBD CAP RATE (%)
HIGHEST VACANCY RATES
MARKETDEC. 2010
(%)Riyadh 40.0 Dubai 35.0 Fairfield 26.6 Budapest 25.7 Sofia 25.4 Chengdu 25.1 Las Vegas 24.6 Los Angeles – Inland Empire 24.4 Phoenix 22.7 Cincinnati 22.4
LOWEST VACANCY RATES
MARKETDEC. 2010
(%)Regina 1.3Rio de Janeiro 1.6Geneva 2.5São Paulo 2.6Hong Kong 3.1Santiago 3.2London – Southbank 5.0Vienna 5.0Lima 5.3Zurich 5.3

GLOBAL OFFICE REAL ESTATE REVIEW | SECOND HALF 2010
COLLIERS INTERNATIONAL | P. 7 Contact: Ross Moore—[email protected]
OFFICE MARKETS
MARKET COUNTRY POPULATION SQUARE FEET SQUARE METERSGEOGRAPHIC
AREA
EUROPE, MIDDLE EAST AND AFRICA (EMEA)Tirana Albania 343,078 860,800 80,000 CBDVienna Austria 1,687,271 118,360,000 11,000,000 MetroMinsk Belarus 1,834,200 3,977,972 369,700 MetroAntwerp Belgium 985,332 22,111,800 2,055,000 CBDBrussels Belgium 1,048,491 139,880,000 13,000,000 MetroSofia Bulgaria 1,247,059 14,181,680 1,318,000 MetroZagreb Croatia 691,724 7,338,320 682,000 MetroPrague Czech Republic 1,233,211 28,944,400 2,690,000 MetroCopenhagen Denmark 1,636,749 60,906,980 5,660,500 MetroTallinn Estonia 398,594 5,008,780 465,500 MetroHelsinki Finland 576,632 90,384,000 8,400,000 MetroBordeaux France 232,260 21,928,880 2,038,000 MetroLyon France 472,305 49,496,000 4,600,000 MetroMarseille France 4,882,913 30,128,000 2,800,000 MetroMontpellier France 253,712 10,760,000 1,000,000 MetroNantes France 282,853 26,900,000 2,500,000 MetroParis France 10,000,000 538,000,000 50,000,000 MetroStrasbourg France 272,975 32,280,000 3,000,000 MetroToulouse France 439,453 37,425,400 3,478,197 MetroBerlin Germany 3,416,255 192,604,000 17,900,000 MetroDüsseldorf Germany 581,122 83,390,000 7,750,000 MetroFrankfurt Germany 659,021 126,968,000 11,800,000 MetroHamburg Germany 1,770,629 139,901,520 13,002,000 CBDMunich Germany 1,311,573 242,794,020 22,564,500 MetroStuttgart Germany 597,176 79,946,800 7,430,000 MetroAthens Greece 597,176 72,630,000 6,750,000 MetroBudapest Hungary 1,702,297 25,824,000 2,400,000 MetroDublin Ireland 1,045,769 38,144,200 3,545,000 MetroTel Aviv Israel 2,203,700 26,900,000 2,500,000 MetroMilan Italy 1,299,633 129,690,280 12,053,000 MetroRome Italy 2,718,768 103,296,000 9,600,000 MetroRiga Latvia 713,016 5,427,667 504,430 MetroVilnius Lithuania 546,733 3,609,980 335,500 MetroAmsterdam Netherlands 755,605 78,548,000 7,300,000 MetroWarsaw Poland 1,707,981 36,368,800 3,380,000 MetroLisbon Portugal 2,575,000 47,783,299 4,440,827 MetroBucharest Romania 1,931,838 16,355,200 1,520,000 MetroMoscow Russia 10,470,318 134,500,000 12,500,000 MetroSaint Petersburg Russia 4,568,047 15,386,800 1,430,000 MetroRiyadh Saudi Arabia 4,087,152 9,552,793 887,806 CBDBelgrade Serbia 1,120,092 7,080,080 658,000 MetroBratislava Slovakia 428,791 15,064,000 1,400,000 MetroCape Town South Africa 3,497,097 21,584,442 2,005,989 MetroDurban South Africa 3,468,086 2,152,000 200,000 MetroJohannesburg South Africa 5,827,524 27,976,000 2,600,000 MetroMadrid Spain 6,271,638 157,849,200 14,670,000 MetroStockholm Sweden 1,889,945 17,915,400 1,665,000 MetroGeneva Switzerland 438,177 47,505,400 4,415,000 MetroZurich Switzerland 1,307,567 114,056,000 10,600,000 MetroIstanbul Turkey 12,573,836 25,413,861 2,361,883 MetroKyiv Ukraine 2,765,531 13,019,600 1,210,000 MetroAbu Dhabi United Arab Emirates 630,000 21,520,000 2,000,000 MetroDubai United Arab Emirates 1,354,980 50,572,000 4,700,000 MetroBelfast United Kingdom 277,459 8,000,000 743,494 CBDBirmingham United Kingdom 2,284,093 15,600,000 1,449,814 CBDBristol United Kingdom 551,066 12,250,000 1,138,476 CBDEdinburgh United Kingdom 446,110 10,400,000 966,543 CBDGlasgow United Kingdom 634,680 14,000,000 1,301,115 CBD
CBD = Central Business District Metro = Metropolitan Area
EXISTING INVENTORY DEC. 2010

P. 8 | COLLIERS INTERNATIONAL
GLOBAL OFFICE REAL ESTATE REVIEW | SECOND HALF 2010
London – City United Kingdom 7,556,900 95,700,000 8,894,052 CBDLondon – Docklands United Kingdom 7,556,900 19,000,000 1,765,799 CBDLondon – Southbank United Kingdom 7,556,900 18,900,000 1,756,506 CBDLondon – West End United Kingdom 7,556,900 80,700,000 7,500,000 CBDManchester United Kingdom 2,244,931 17,400,000 1,617,100 CBD
NORTH AMERICACalgary Canada 1,079,310 61,079,232 5,676,509 Metro Edmonton Canada 1,034,945 19,440,159 1,806,706 Metro Halifax Canada 372,679 11,110,476 1,032,572 Metro Kitchener-Waterloo Canada 451,235 5,662,569 526,261 Metro Montreal Canada 3,635,571 73,049,523 6,788,989 Metro Ottawa Canada 1,130,761 35,551,293 3,304,024 Metro Regina Canada 179,246 4,174,172 387,934 Metro Saskatoon Canada 202,340 2,072,000 192,565 CBDToronto Canada 5,113,149 186,302,280 17,314,338 Metro Vancouver Canada 2,116,581 53,115,194 4,936,356 Metro Victoria Canada 337,411 8,483,363 788,417 Metro Winnipeg Canada 1,155,584 18,037,762 1,676,372 MetroAtlanta United States 5,376,285 248,432,869 23,088,557 Metro Bakersfield United States 800,458 8,934,432 830,338 Metro Baltimore United States 2,667,117 125,602,243 11,673,071 Metro Boise United States 599,753 14,124,971 1,312,730 Metro Boston United States 4,522,858 164,821,950 15,318,025 Metro Charleston United States 644,506 10,538,928 979,454 Metro Charlotte United States 1,701,799 92,313,935 8,579,362 Metro Chicago United States 9,569,624 235,818,530 21,916,220 Metro Cincinnati United States 2,138,528 37,449,432 3,480,430 Metro Cleveland United States 2,096,471 126,379,624 11,745,318 Metro Columbia United States 728,063 9,858,083 916,179 Metro Columbus United States 1,773,120 47,628,143 4,426,407 Metro Dallas/Fort Worth United States 6,300,006 303,168,968 28,175,555 Metro Denver United States 2,506,626 142,159,493 13,211,849 Metro Detroit United States 4,425,110 130,250,611 12,105,075 Metro Fairfield United States 409,900 41,010,798 3,811,412 Metro Fairfield County United States – 3,708,357 344,643 Metro Fresno United States 909,153 21,084,869 1,959,560 Metro Ft. Lauderdale/Broward County United States 1,912,200 51,891,067 4,822,590 Metro Greenville United States 624,715 7,415,647 689,187 Metro Hartford United States 1,190,512 21,995,716 2,044,212 Metro Honolulu United States 905,034 15,737,240 1,462,569 Metro Houston United States 5,728,143 194,905,576 18,113,901 Metro Indianapolis United States 1,990,000 71,036,294 6,601,886 Metro Jacksonville United States 1,313,228 59,284,522 5,509,714 Metro Kansas City United States 482,299 88,673,096 8,240,994 Metro Las Vegas United States 1,865,746 42,198,330 3,921,778 Metro Little Rock United States 675,069 14,013,196 1,302,342 Metro Los Angeles United States 12,872,808 21,937,800 2,038,829 Metro Los Angeles – Inland Empire United States 12,872,808 197,915,500 18,393,634 Metro Louisville United States 1,244,696 52,141,803 4,845,892 Metro Memphis United States 1,285,732 36,523,955 3,394,420 Metro Miami-Dade United States 5,414,772 82,154,975 7,635,221 Metro Nashville United States 605,473 54,407,185 5,056,430 Metro New Jersey – Central United States 2,347,200 65,848,588 6,119,757 Metro New Jersey – Northern United States 2,137,600 95,669,640 8,891,230 Metro New York – Downtown Manhattan United States 19,006,798 87,332,830 8,116,434 CBDNew York – Midtown Manhattan United States 19,006,798 200,280,479 18,613,427 CBDNew York – Midtown S. Manhattan United States 19,006,798 71,892,582 6,681,467 CBDOakland United States 404,155 32,768,363 3,045,387 Metro
OFFICE MARKETS
MARKET COUNTRY POPULATION SQUARE FEET SQUARE METERSGEOGRAPHIC
AREA
EUROPE, MIDDLE EAST AND AFRICA (EMEA) continued
EXISTING INVENTORY DEC. 2010

GLOBAL OFFICE REAL ESTATE REVIEW | SECOND HALF 2010
COLLIERS INTERNATIONAL | P. 9 Contact: Ross Moore—[email protected]
Orange County United States 3,029,000 77,351,300 7,188,783 Metro Orlando United States 2,054,574 67,099,364 6,236,000 Metro Philadelphia United States 5,838,471 150,949,155 14,028,732 Metro Phoenix United States 4,281,899 129,434,405 12,029,220 Metro Pleasanton/Walnut Creek United States 130,314 42,318,529 3,932,949 Metro Portland United States 2,207,462 68,598,969 6,375,369 Metro Raleigh/Durham/Chapel Hill United States 1,088,765 83,301,034 7,741,732 Metro Reno United States 414,784 6,853,027 636,898 Metro Sacramento United States 2,109,832 90,905,354 8,448,453 Metro San Diego County United States 3,001,072 77,790,969 7,229,644 Metro San Francisco United States 4,274,531 33,518,410 3,115,094 CBDSan Francisco Peninsula United States 4,274,531 83,434,169 7,754,105 Metro San Jose/Silicon Valley United States 1,819,198 61,647,407 5,729,313 Metro Seattle/Puget Sound United States 3,344,813 128,308,129 11,924,547 Metro St. Louis United States 2,816,710 76,934,304 7,150,028 Metro Stamford United States 121,026 18,556,604 1,724,591 CBDStockton/San Joaquin County United States 672,388 8,499,818 789,946 CBDTampa United States 2,733,761 80,027,348 7,437,486 Metro Washington, DC United States 4,255,400 447,715,054 41,609,206 Metro West Palm Beach/Palm Beach Co. United States 536,521 38,941,410 3,619,090 Metro Westchester County United States – 37,942,242 3,526,231 CBDWhite Plains United States – 8,262,299 767,872 Metro
ASIA PACIFICAdelaide Australia 1,105,840 14,019,860 1,302,961 CBDBrisbane Australia 1,763,132 21,982,809 2,043,012 CBDCanberra Australia 350,000 7,313,088 679,655 CBDMelbourne Australia 3,592,590 43,982,727 4,087,614 CBDPerth Australia 1,445,077 15,769,609 1,465,577 CBDSydney Australia 4,119,191 52,127,250 4,844,540 CBDBeijing China 10,300,723 51,194,219 4,757,827 Metro Chengdu China 5,800,000 5,495,014 510,689 Metro Guangzhou China 7,547,467 23,035,933 2,140,886 Metro Hong Kong China 7,097,600 22,665,048 2,106,417 CBDShanghai China 13,793,900 40,604,345 3,773,638 CBDBanaglore India 4,301,326 67,297,675 6,254,431 MetroChennai India 4,343,645 51,635,195 4,798,810 MetroDelhi/Gurgaon/Noida India 9,879,172 59,794,158 5,557,078 MetroMumbai India 11,978,450 84,228,000 7,827,881 MetroJakarta Indonesia 8,222,515 45,865,705 4,262,612 CBDTokyo Japan 13,050,000 681,764,360 63,361,000 CBDAuckland New Zealand 1,303,068 14,475,912 1,345,345 CBDChristchurch New Zealand 4,367,079 4,610,413 428,477 CBDWellington New Zealand 448,959 13,711,694 1,274,321 CBDSingapore Singapore 5,076,700 50,041,371 4,650,685 CBDSeoul South Korea 10,464,051 20,537,160 1,908,658 Metro Taipei Taiwan 2,607,428 51,868,719 4,820,513 CBDBangkok Thailand 8,900,000 84,981,318 7,897,892 Metro Ho Chi Minh City Vietnam 8,500,000 12,912,000 1,200,000 Metro
LATIN AMERICABuenos Aires Argentina 13,028,000 41,426,172 3,850,016 CBDRio de Janeiro Brazil 11,711,233 48,049,781 4,465,593 CBDSão Paulo Brazil 19,672,582 63,947,616 5,943,087 CBDSantiago Chile 6,061,185 40,870,741 3,798,396 CBDBogotá Colombia 7,243,698 16,403,071 1,524,449 MetroSan José Costa Rica 1,547,760 8,592,936 798,600 Metro Mexico City Mexico 19,239,910 63,152,538 5,869,195 Metro Lima Peru 8,445,211 4,143,289 385,064 Metro
OFFICE MARKETS
MARKET COUNTRY POPULATION SQUARE FEET SQUARE METERSGEOGRAPHIC
AREA
NORTH AMERICA continued
EXISTING INVENTORY DEC. 2010

P. 10 | COLLIERS INTERNATIONAL
GLOBAL OFFICE REAL ESTATE REVIEW | SECOND HALF 2010
OFFICE MARKETS
MARKET COUNTRY SQUARE FEET SQUARE METERS
VACANCY RATE
DEC. 2009 (%)
VACANCY RATE
JUNE 2010 (%)
VACANCY RATE
DEC. 2010 (%)
EUROPE, MIDDLE EAST AND AFRICA (EMEA)Tirana Albania 281,912 26,200 12.00 13.00 14.00 Vienna Austria 2,474,800 230,000 5.00 5.00 5.00 Minsk Belarus 1,893,760 176,000 14.00 12.00 12.00 Antwerp Belgium 215,200 20,000 8.30 8.00 7.75 Brussels Belgium 1,936,800 180,000 11.30 12.30 11.80 Sofia Bulgaria 7,736,440 719,000 17.90 21.00 25.40 Zagreb Croatia 1,276,136 118,600 6.00 7.00 7.00 Prague Czech Republic 1,398,800 130,000 11.80 13.80 13.20 Copenhagen Denmark 1,076,000 100,000 9.60 10.30 9.30 Tallinn Estonia 0 0 18.50 19.50 17.00 Helsinki Finland 1,183,600 110,000 10.50 12.50 12.80 Bordeaux France – – 6.20 6.40 6.00 Lyon France 570,280 53,000 10.00 10.00 6.60 Marseille France 699,400 65,000 7.00 7.00 7.00 Montpellier France 0 0 6.50 6.50 6.50 Nantes France 215,200 20,000 5.00 5.50 5.50 Paris France 4,949,600 460,000 7.00 7.00 7.00 Strasbourg France 538,000 50,000 6.50 6.70 5.60 Toulouse France 215,200 20,000 5.50 6.80 7.40 Berlin Germany 2,797,600 260,000 8.40 8.70 8.40 Düsseldorf Germany 1,878,696 174,600 10.00 11.50 11.50 Frankfurt Germany 3,852,080 358,000 16.50 17.30 17.80 Hamburg Germany 3,873,600 360,000 8.30 9.00 9.80 Munich Germany 2,766,794 257,137 7.40 7.90 7.90 Stuttgart Germany 1,088,912 101,200 6.10 6.50 6.50 Athens Greece 8,500,400 790,000 10.00 12.00 12.00 Budapest Hungary 1,764,640 164,000 21.90 26.10 25.70 Dublin Ireland 322,800 30,000 23.00 22.00 22.00 Tel Aviv Israel 1,076,000 100,000 9.75 7.80 6.20 Milan Italy 4,895,800 455,000 8.55 8.80 8.60 Rome Italy 1,614,000 150,000 6.40 6.50 6.10 Riga Latvia 61,257 5,693 26.00 22.00 18.50 Vilnius Lithuania 69,940 6,500 20.00 13.30 13.00 Amsterdam Netherlands 3,228,000 300,000 18.50 18.50 18.70 Warsaw Poland 1,345,000 125,000 7.30 8.00 7.00 Lisbon Portugal 973,371 90,462 8.30 11.00 11.20 Bucharest Romania 2,937,480 273,000 18.21 20.00 20.00 Moscow Russia 30,160,280 2,803,000 16.47 14.60 12.00 Saint Petersburg Russia 4,971,120 462,000 18.00 19.00 18.00 Riyadh Saudi Arabia 18,470,713 1,716,609 23.00 26.00 40.00 Belgrade Serbia 570,280 53,000 17.00 19.90 21.20 Bratislava Slovakia 1,721,600 160,000 12.50 13.60 9.80 Cape Town South Africa 307,811 28,607 7.90 8.15 8.20 Durban South Africa 914,600 85,000 15.00 10.00 20.00 Johannesburg South Africa 3,160,061 293,686 11.50 16.80 9.30 Madrid Spain 3,335,600 310,000 8.10 7.70 10.90 Stockholm Sweden 0 0 10.00 10.00 6.50 Geneva Switzerland 430,400 40,000 3.00 2.50 2.50 Zurich Switzerland 2,905,200 270,000 4.00 5.20 5.30 Istanbul Turkey 3,443,200 320,000 10.28 9.99 11.42 Kyiv Ukraine 3,357,120 312,000 20.00 16.00 14.00 Abu Dhabi United Arab Emirates 4,304,000 400,000 2.00 8.00 7.00 Dubai United Arab Emirates 10,760,000 1,000,000 30.00 30.00 35.00 Birmingham United Kingdom 0 0 18.40 20.80 18.64 Bristol United Kingdom 213,000 19,796 18.40 17.70 16.79 Edinburgh United Kingdom 190,000 17,658 16.00 15.50 15.05 Glasgow United Kingdom 50,000 4,647 14.70 14.10 11.64
UNDER CONSTRUCTION DEC. 2010
GLOBAL OFFICE REAL ESTATE REVIEW | SECOND HALF 2010
COLLIERS INTERNATIONAL | P. 11 Contact: Ross Moore—[email protected]
London – City United Kingdom 1,138,000 105,762 12.30 10.60 10.33 London – Docklands United Kingdom 0 0 10.40 10.00 8.37 London – Southbank United Kingdom 1,012,000 94,052 5.10 5.00 4.98 London – West End United Kingdom 1,593,000 148,048 9.50 9.40 8.20 Manchester United Kingdom 325,000 30,204 18.10 19.90 17.98
NORTH AMERICACalgary Canada 2,545,517 236,572 11.71 14.01 11.58 Edmonton Canada 630,000 58,550 9.65 10.86 11.41 Halifax Canada 40,000 3,717 9.53 10.36 10.20 Kitchener-Waterloo Canada 486,377 45,202 14.67 12.10 14.96 Montreal Canada 112,000 10,409 7.71 7.45 7.78 Ottawa Canada 732,450 68,072 7.74 6.07 6.69 Regina Canada 190,000 17,658 1.12 1.38 1.28 Saskatoon Canada 100,000 9,294 6.14 4.60 6.00 Toronto Canada 2,345,995 218,029 6.41 6.60 6.00 Vancouver Canada 907,085 84,302 7.15 7.12 7.60 Victoria Canada 129,600 12,045 5.60 6.80 9.14 Winnipeg Canada 0 0 – – 8.64 Atlanta United States 207,266 19,263 16.67 17.29 16.91 Bakersfield United States 0 0 9.78 9.02 9.85 Baltimore United States 1,360,633 126,453 13.41 13.45 13.49 Boise United States 30,000 2,788 17.77 18.17 19.95 Boston United States 819,000 76,115 17.32 18.04 18.37 Charleston United States 168,150 15,627 18.10 18.09 17.42 Charlotte United States 349,913 32,520 13.36 15.18 14.06 Chicago United States 0 0 19.76 20.26 19.73 Cincinnati United States 1,018,136 94,622 – 22.62 22.40 Cleveland United States 332,000 30,855 12.00 12.50 12.47 Columbia United States 0 0 22.19 24.14 21.42 Columbus United States 90,000 8,364 16.67 16.66 17.55 Dallas/Fort Worth United States 0 0 17.96 18.79 17.87 Denver United States 30,000 2,788 17.32 15.01 14.78 Detroit United States 6,885 640 19.33 20.17 20.07 Fairfield United States 0 0 23.81 26.82 26.62 Fairfield County United States 0 0 – 12.59 10.88 Fresno United States 0 0 14.00 14.69 13.22 Ft. Lauderdale/Broward County United States 0 0 14.67 14.92 14.82 Greenville United States 14,000 1,301 21.48 20.20 21.44 Hartford United States 194,000 18,030 15.78 17.01 18.38 Honolulu United States 0 0 10.32 11.39 11.75 Houston United States 2,073,237 192,680 16.79 16.48 15.98 Indianapolis United States 0 0 – 11.80 11.25 Jacksonville United States 48,763 4,532 15.61 15.20 15.04 Kansas City United States 0 0 13.60 13.43 13.99 Las Vegas United States 85,000 7,900 23.83 24.74 24.61 Little Rock United States 23,000 2,138 10.36 11.67 12.59 Los Angeles United States 0 0 16.26 17.48 17.72 Los Angeles – Inland Empire United States 1,151,300 106,998 24.28 24.74 24.44 Louisville United States 0 0 14.60 11.10 12.00 Memphis United States 12,300 1,143 13.31 13.23 14.31 Miami-Dade United States 1,213,961 112,822 15.46 16.39 16.22 Nashville United States 203,020 18,868 14.81 13.14 12.45 New Jersey – Central United States 265,000 24,628 17.59 22.21 21.16 New Jersey – Northern United States 382,600 35,558 17.05 17.75 18.39 New York – Downtown Manhattan United States 2,600,000 241,636 12.99 16.97 16.87 New York – Midtown Manhattan United States 0 0 14.93 13.34 12.40 New York – Midtown S. Manhattan United States 0 0 11.70 11.73 10.11 Oakland United States 62,000 5,762 14.99 14.70 14.70
OFFICE MARKETS
MARKET COUNTRY SQUARE FEET SQUARE METERS
VACANCY RATE
DEC. 2009 (%)
VACANCY RATE
JUNE 2010 (%)
VACANCY RATE
DEC. 2010 (%)
EUROPE, MIDDLE EAST AND AFRICA (EMEA) continued
UNDER CONSTRUCTION DEC. 2010
P. 12 | COLLIERS INTERNATIONAL
GLOBAL OFFICE REAL ESTATE REVIEW | SECOND HALF 2010
Orange County United States 0 0 21.52 23.62 22.05 Orlando United States 752,100 69,898 16.39 16.94 16.31 Philadelphia United States 533,472 49,579 15.18 15.25 15.27 Phoenix United States 734,672 68,278 22.04 21.07 22.74 Pleasanton/Walnut Creek United States 0 0 19.11 19.31 16.02 Portland United States 195,458 18,165 11.26 11.18 10.83 Raleigh/Durham/Chapel Hill United States 250,530 23,283 13.48 13.77 12.71 Reno United States 7,484 696 20.96 22.14 21.15 Sacramento United States 288,000 26,766 15.89 16.50 16.72 San Diego County United States 0 0 17.75 17.75 16.54 San Francisco United States 0 0 14.71 15.18 17.61 San Francisco Peninsula United States 288,000 26,766 18.96 18.42 14.77 San Jose/Silicon Valley United States 537,902 49,991 20.16 19.85 20.17 Seattle/Puget Sound United States 1,867,699 173,578 17.42 16.02 15.25 St. Louis United States 0 0 – – 16.92 Stamford United States 0 0 – 17.58 18.42 Stockton/San Joaquin County United States 0 0 19.50 18.07 18.05 Tampa United States 0 0 15.93 16.40 15.65 Washington, DC United States 3,823,311 355,326 14.80 13.73 12.87 West Palm Beach/Palm Beach Co. United States 271,950 25,274 20.99 21.08 20.52 Westchester County United States 0 0 – 10.65 10.71 White Plains United States 0 0 – 11.56 12.58
ASIA PACIFICAdelaide Australia 559,520 52,000 7.67 8.09 8.25 Brisbane Australia 1,355,760 126,000 11.30 11.20 9.40 Canberra Australia 215,200 20,000 7.35 15.64 15.47 Melbourne Australia 2,904,845 269,967 6.70 6.50 6.30 Perth Australia 1,677,452 155,897 8.20 9.90 9.50 Sydney Australia 2,797,514 259,992 8.20 8.50 8.20 Beijing China 8,497,936 789,771 17.16 14.43 10.02 Chengdu China 2,700,760 251,000 18.90 14.20 25.10 Guangzhou China 18,110,285 1,683,112 17.90 15.20 17.30 Hong Kong China 530,398 49,293 5.10 4.00 3.10 Shanghai China 37,454,957 3,480,944 15.20 12.90 13.10 Banaglore India 3,280,000 304,833 19.00 17.00 16.00 Chennai India 7,594,878 705,844 22.50 22.50 22.00 Delhi/Gurgaon/Noida India 5,200,000 483,271 19.50 18.50 19.00 Mumbai India 2,060,000 191,450 14.50 13.50 14.00 Jakarta Indonesia 5,006,262 465,266 12.90 11.43 10.90 Tokyo Japan 23,101,720 2,147,000 7.50 8.20 8.50 Auckland New Zealand 301,280 28,000 11.50 10.60 9.60 Christchurch New Zealand 67,788 6,300 11.90 12.60 12.80 Wellington New Zealand 507,872 47,200 6.80 7.20 9.90 Singapore Singapore 6,221,534 578,209 13.20 12.70 12.80 Seoul South Korea 4,195,957 389,959 4.48 5.32 7.26 Taipei Taiwan 782,547 72,727 11.00 11.20 11.30 Bangkok Thailand 1,452,353 134,977 15.30 15.77 16.26 Ho Chi Minh City Vietnam 29,052,000 2,700,000 11.00 11.00 13.00
LATIN AMERICABuenos Aires Argentina 467,092 43,410 6.80 7.80 9.00 Rio de Janeiro Brazil 5,380,000 500,000 0.62 1.30 1.60 São Paulo Brazil 13,847,233 1,286,450 4.90 3.80 2.60 Santiago Chile 2,669,814 248,124 4.76 5.31 3.24 Bogotá Colombia 2,837,089 263,670 8.00 7.40 8.00 San José Costa Rica 1,111,508 103,300 9.10 8.21 10.00 Mexico City Mexico 14,781,313 1,373,728 9.60 10.00 11.00 Lima Peru 675,007 62,733 8.40 12.90 5.30
OFFICE MARKETS
MARKET COUNTRY SQUARE FEET SQUARE METERS
VACANCY RATE
DEC. 2009 (%)
VACANCY RATE
JUNE 2010 (%)
VACANCY RATE
DEC. 2010 (%)
NORTH AMERICA continued
UNDER CONSTRUCTION DEC. 2010

GLOBAL OFFICE REAL ESTATE REVIEW | SECOND HALF 2010
COLLIERS INTERNATIONAL | P. 13
LOCAL MEASURE/CURRENCY CBD RENTS
MARKET COUNTRYQUOTED
CURRENCY UNITTIME
PERIOD
EXCHANGE RATE (USD)
DEC. 31, 2010
CLASS A NET
RENT
CLASS A GROSS RENT
GROSS RENT
ANNUAL CHG. (%)
TOP CLASS A
NET RENT
TOP CLASS A GROSS RENT
EUROPE, MIDDLE EAST AND AFRICA (EMEA)Tirana Albania EUR SM Month 0.75 15.00 – – 24.00 –Vienna Austria EUR SM Month 0.75 18.00 23.00 4.5 25.00 28.00 Minsk Belarus EUR SM Month 0.75 24.00 27.00 -12.9 31.00 34.00 Antwerp Belgium EUR SM Month 0.75 10.42 13.75 3.1 11.50 15.00 Brussels Belgium EUR SM Month 0.75 15.00 20.00 -12.7 20.83 24.58 Sofia Bulgaria EUR SM Month 0.75 9.80 – – 22.00 –Zagreb Croatia EUR SM Month 0.75 11.00* – – 16.50 –Prague Czech Republic EUR SM Month 0.75 17.00* – – 21.00 –Copenhagen Denmark DKK SM Month 5.62 108.33 133.33 -15.8 141.67 166.67 Tallinn Estonia EUR SM Month 0.75 12.50 14.50 0.0 16.00 18.00 Helsinki Finland EUR SM Month 0.75 21.50 24.50 -2.0 24.00 27.00 Bordeaux France EUR SM Month 0.75 13.33 19.17 -2.1 15.00 20.83 Lyon France EUR SM Month 0.75 16.67 22.50 0.0 20.83 26.67Marseille France EUR SM Month 0.75 17.50 23.33 – 20.83 26.67 Montpellier France EUR SM Month 0.75 13.33 19.17 – 13.33 19.17 Nantes France EUR SM Month 0.75 14.17 20.00 4.3 14.58 20.42 Paris France EUR SM Month 0.75 62.50 69.17 31.7 69.17 75.83 Strasbourg France EUR SM Month 0.75 14.17 20.00 – 16.67 22.50 Toulouse France EUR SM Month 0.75 – – – 16.67 22.50 Berlin Germany EUR SM Month 0.75 19.00 23.50 -2.5 23.00 28.00 Düsseldorf Germany EUR SM Month 0.75 18.40 21.90 5.5 25.00 28.50 Frankfurt Germany EUR SM Month 0.75 30.00 34.00 -5.6 37.00 43.00 Hamburg Germany EUR SM Month 0.75 22.00 24.00 0.0 24.00 27.00 Munich Germany EUR SM Month 0.75 26.00 30.00 -1.6 35.00 39.00 Stuttgart Germany EUR SM Month 0.75 14.90 17.80 -2.6 20.80 24.80 Athens Greece EUR SM Month 0.75 15.00* – – 21.00 –Budapest Hungary EUR SM Month 0.75 12.50* – – 18.00 –Dublin Ireland EUR SM Month 0.75 20.00 30.00 -10.0 30.00 40.00 Tel Aviv Israel NIS SM Month 3.55 82.80 127.80 16.2 110.00 155.00 Milan Italy EUR SM Month 0.75 39.58 42.08 1.0 43.75 46.25 Rome Italy EUR SM Month 0.75 27.50 30.00 -5.3 31.67 34.17 Riga Latvia EUR SM Month 0.75 14.00 17.00 41.7 15.00 18.00 Vilnius Lithuania EUR SM Month 0.75 12.16 15.06 20.5 14.48 17.67 Amsterdam Netherlands EUR SM Month 0.75 17.10 18.80 0.3 27.50 30.25 Warsaw Poland EUR SM Month 0.75 20.50* – – 26.00 –Lisbon Portugal EUR SM Month 0.75 17.30 19.80 -10.0 22.00 24.50 Bucharest Romania EUR SM Month 0.75 15.00* – – 20.00 –Moscow Russia EUR SM Month 0.75 29.40* 40.73* – 47.80 66.34 Saint Petersburg Russia EUR SM Month 0.75 23.30* 32.62* – 28.70 40.18 Riyadh Saudi Arabia SAR SM Month 3.75 105.25 115.75 – – –Belgrade Serbia EUR SM Month 0.75 13.00* – – 16.00 –Bratislava Slovakia EUR SM Month 0.75 11.00* – – 15.00 –Cape Town South Africa ZAR SM Month 6.65 70.00 95.00 – 115.00 140.00 Durban South Africa ZAR SM Month 6.65 85.00 105.00 23.5 95.00 120.00 Johannesburg South Africa ZAR SM Month 6.65 45.00 65.00 0.0 50.00 70.00 Madrid Spain EUR SM Month 0.75 24.50 27.50 -3.5 28.00 32.00 Stockholm Sweden SEK SM Month 6.78 375.00 416.67 11.1 408.33 450.00 Geneva Switzerland CHF SM Month 0.94 54.17 58.33 12.9 83.33 91.67 Zurich Switzerland CHF SM Month 0.94 39.17 41.67 8.7 70.00 72.50 Istanbul Turkey USD SM Month 1.00 27.80 32.00 – 49.00 52.00 Kyiv Ukraine USD SM Month 1.00 32.00* – – 45.00 –Abu Dhabi United Arab Emirates USD SM Month 1.00 32.10 35.30 -34.6 48.80 53.80 Dubai United Arab Emirates USD SM Month 1.00 19.60 21.50 -68.4 46.40 51.10 Belfast United Kingdom GBP SF Year 0.65 12.50 20.50 – 14.00 22.50Birmingham United Kingdom GBP SF Year 0.65 21.00 34.00 -2.9 27.50 42.50Bristol United Kingdom GBP SF Year 0.65 23.50 35.50 2.9 27.00 40.00Edinburgh United Kingdom GBP SF Year 0.65 21.00 34.00 -1.4 27.50 39.00Glasgow United Kingdom GBP SF Year 0.65 23.00 34.00 3.0 29.00 40.00
MEASURE
* Indicates Class A Rent shown represents A-B average for the market

P. 14 | COLLIERS INTERNATIONAL
GLOBAL OFFICE REAL ESTATE REVIEW | SECOND HALF 2010
London – City United Kingdom GBP SF Year 0.65 48.50 64.50 15.2 57.50 75.00London – Docklands United Kingdom GBP SF Year 0.65 25.00 41.00 0.0 35.00 51.00London – Southbank United Kingdom GBP SF Year 0.65 32.50 48.50 3.2 40.00 56.00London – West End United Kingdom GBP SF Year 0.65 70.00 86.00 9.6 85.00 101.00Manchester United Kingdom GBP SF Year 0.65 20.50 32.50 -3.0 27.00 42.00
NORTH AMERICACalgary Canada CAD SF Year 1.00 22.00 39.50 -6.0 26.00 49.80 Edmonton Canada CAD SF Year 1.00 22.17 38.48 -11.3 25.60 41.91 Halifax Canada CAD SF Year 1.00 17.40 31.56 0.3 20.86 35.02 Kitchener-Waterloo Canada CAD SF Year 1.00 13.27 24.78 -6.5 14.63 26.14 Montreal Canada CAD SF Year 1.00 16.47 35.00 13.9 34.47 53.00 Ottawa Canada CAD SF Year 1.00 25.77 48.32 -2.4 29.67 52.22 Regina Canada CAD SF Year 1.00 20.00 34.94 0.5 25.85 40.79 Saskatoon Canada CAD SF Year 1.00 19.89 34.00 7.9 25.89 40.00 Toronto Canada CAD SF Year 1.00 20.13 51.30 0.7 17.07 67.13 Vancouver Canada CAD SF Year 1.00 33.50 53.00 12.8 42.50 62.00 Victoria Canada CAD SF Year 1.00 23.00 37.00 0.0 29.00 43.00 Winnipeg Canada CAD SF Year 1.00 16.00 29.97 – 17.00 30.97 Atlanta United States USD SF Year 1.00 9.76 21.41 0.1 25.35 37.00 Bakersfield United States USD SF Year 1.00 9.44 17.40 0.0 13.04 21.00 Baltimore United States USD SF Year 1.00 – 22.99 -6.0 – –Boise United States USD SF Year 1.00 12.00 18.00 0.0 16.00 22.00 Boston United States USD SF Year 1.00 – 46.01 -3.9 – 65.00 Charleston United States USD SF Year 1.00 19.72 28.72 20.3 26.00 35.00 Charlotte United States USD SF Year 1.00 – 24.97 -10.1 – –Chicago United States USD SF Year 1.00 11.75 32.00 0.0 34.75 55.00 Cincinnati United States USD SF Year 1.00 12.39 21.89 6.0 27.50 37.00 Cleveland United States USD SF Year 1.00 – 20.43 6.2 – –Columbia United States USD SF Year 1.00 12.41 19.81 16.5 14.60 22.00 Columbus United States USD SF Year 1.00 7.75 19.30 -23.6 15.84 27.39 Dallas/Fort Worth United States USD SF Year 1.00 17.70 25.20 -7.5 28.50 36.00 Denver United States USD SF Year 1.00 11.15 27.00 18.3 20.65 36.50 Detroit United States USD SF Year 1.00 – 23.00 – – 24.60 Fresno United States USD SF Year 1.00 16.60 24.60 0.0 23.80 31.80 Ft. Lauderdale/Broward County United States USD SF Year 1.00 13.79 31.79 -2.2 20.00 38.00 Greenville United States USD SF Year 1.00 10.24 19.49 -3.8 15.75 25.00 Hartford United States USD SF Year 1.00 11.07 23.02 -0.9 14.05 26.00 Honolulu United States USD SF Year 1.00 19.33 35.31 -1.6 25.18 41.16 Houston United States USD SF Year 1.00 22.32 34.61 -7.4 28.16 40.45 Indianapolis United States USD SF Year 1.00 9.36 19.19 – 17.17 27.00 Jacksonville United States USD SF Year 1.00 9.80 18.90 -7.8 10.89 19.99 Kansas City United States USD SF Year 1.00 9.07 17.07 – 12.00 20.00 Las Vegas United States USD SF Year 1.00 19.57 34.57 -4.0 21.00 36.00 Little Rock United States USD SF Year 1.00 9.85 16.50 1.5 15.35 22.00 Los Angeles United States USD SF Year 1.00 23.00 39.00 -0.6 24.44 40.44 Louisville United States USD SF Year 1.00 – 22.33 11.8 – –Memphis United States USD SF Year 1.00 9.40 17.65 4.7 12.75 21.00 Miami-Dade United States USD SF Year 1.00 20.52 41.52 -4.0 25.50 46.50 Nashville United States USD SF Year 1.00 13.19 23.69 – 20.50 31.00 New York – Downtown Manhattan United States USD SF Year 1.00 – 39.68 2.1 – 65.00 New York – Midtown Manhattan United States USD SF Year 1.00 37.54 65.04 4.3 122.50 150.00 New York – Midtown S. Manhattan United States USD SF Year 1.00 18.21 43.21 6.5 40.00 65.00 Oakland United States USD SF Year 1.00 17.34 30.84 -5.2 25.50 39.00 Orlando United States USD SF Year 1.00 12.93 23.93 -3.3 24.00 35.00
LOCAL MEASURE/CURRENCY CBD RENTS
MARKET COUNTRYQUOTED
CURRENCY UNITTIME
PERIOD
EXCHANGE RATE (USD)
DEC. 31, 2010
CLASS A NET
RENT
CLASS A GROSS RENT
GROSS RENT
ANNUAL CHG. (%)
TOP CLASS A
NET RENT
TOP CLASS A GROSS RENT
EUROPE, MIDDLE EAST AND AFRICA (EMEA) continued
MEASURE

GLOBAL OFFICE REAL ESTATE REVIEW | SECOND HALF 2010
COLLIERS INTERNATIONAL | P. 15 Contact: Ross Moore—[email protected]
Philadelphia United States USD SF Year 1.00 14.23 26.10 1.3 25.63 37.50 Phoenix United States USD SF Year 1.00 15.13 28.23 7.5 26.90 40.00 Pleasanton/Walnut Creek United States USD SF Year 1.00 – 26.28 -2.2 – 32.40 Portland United States USD SF Year 1.00 13.15 24.67 1.2 24.98 36.50 Raleigh/Durham/Chapel Hill United States USD SF Year 1.00 – 23.22 -10.6 – –Reno United States USD SF Year 1.00 12.40 23.40 5.4 13.00 24.00 Sacramento United States USD SF Year 1.00 25.45 32.75 11.9 22.70 30.00 San Diego County United States USD SF Year 1.00 13.82 28.68 -8.8 15.74 30.60 San Francisco Peninsula United States USD SF Year 1.00 17.31 35.97 – 46.34 65.00 San Jose/Silicon Valley United States USD SF Year 1.00 19.52 34.32 -7.6 21.20 36.00 Seattle/Puget Sound United States USD SF Year 1.00 19.55 30.50 17.3 34.05 45.00 St. Louis United States USD SF Year 1.00 7.63 17.63 -9.8 12.00 22.00 Stamford United States USD SF Year 1.00 24.94 37.94 – 45.00 58.00 Stockton/San Joaquin County United States USD SF Year 1.00 17.46 21.12 -2.2 26.34 30.00 Tampa United States USD SF Year 1.00 13.91 22.91 0.1 21.00 30.00 Washington, DC United States USD SF Year 1.00 33.59 53.59 5.1 50.00 70.00 West Palm Beach/Palm Beach Co. United States USD SF Year 1.00 17.12 36.62 -6.0 35.50 55.00 White Plains United States USD SF Year 1.00 15.41 28.41 – 27.00 40.00
ASIA PACIFICAdelaide Australia AUD SM Year 1.02 345.00 445.00 2.3 420.00 525.00 Brisbane Australia AUD SM Year 1.02 600.00 717.50 36.7 675.00 800.00 Canberra Australia AUD SM Year 1.02 360.00 430.00 2.4 390.00 460.00 Melbourne Australia AUD SM Year 1.02 425.00 530.00 1.0 523.00 650.00 Perth Australia AUD SM Year 1.02 605.00 750.00 -6.3 713.00 873.00 Sydney Australia AUD SM Year 1.02 544.00 705.00 13.7 946.00 1,118.00 Beijing China RMB SM Month 6.61 201.95 231.95 20.0 230.00 260.00 Chengdu China CNY SM Month 6.61 126.50 144.70 – 145.00 167.00 Guangzhou China RMB SM Month 6.61 136.00 188.00 46.9 180.00 246.00 Hong Kong China HKD SF Month 7.80 107.93 124.78 35.9 179.94 204.32 Shanghai China RMB SM Month 6.61 215.85 237.42 15.0 258.54 284.39 Banaglore India INR SF Month 45.55 60.00 70.00 7.7 68.00 80.00 Chennai India INR SF Month 45.55 51.00 60.00 9.1 60.00 70.00 Delhi/Gurgaon/Noida India INR SF Month 45.55 206.00 243.00 20.3 277.00 326.00 Mumbai India INR SF Month 45.55 218.00 236.25 2.3 248.00 292.00 Jakarta Indonesia IDR SM Month 9,107.47 110,266.00 164,733.00 6.6 234,000.00 274,000.00 Tokyo Japan JPY SM Year 81.55 – 92,208.00 -8.3 – 145,200.00 Auckland New Zealand NZD SM Year 1.30 307.00 436.00 -4.2 430.00 570.00 Christchurch New Zealand NZD SM Year 1.30 305.00 368.00 – 358.00 415.00 Wellington New Zealand NZD SM Year 1.30 353.00 441.00 -4.3 415.00 518.00 Singapore Singapore SGD SF Month 1.29 6.18 7.91 24.6 8.13 10.20 Seoul South Korea KRW SM Month 1,133.79 26,851.00 36,640.00 11.1 30,851.00 42,915.00 Taipei Taiwan NTD Ping Month 29.40 2,447.00 2,936.00 -0.7 3,500.00 4,200.00 Bangkok Thailand THB SM Month 30.19 659.00 705.00 1.3 800.00 856.00 Ho Chi Minh City Vietnam USD SM Month 1.00 44.00 54.40 16.6 56.00 67.60
LATIN AMERICABuenos Aires Argentina USD SM Month 1.00 29.80 34.10 16.8 36.00 43.30 Rio de Janeiro Brazil REAL SM Month 1.67 120.00 142.00 20.9 128.00 159.00 São Paulo Brazil REAL SM Month 1.67 91.00 118.00 2.6 124.00 139.00 Santiago Chile USD SM Month 1.00 25.19 28.46 14.8 30.68 34.66 Bogotá Colombia USD SM Month 1.00 29.00 31.90 11.9 36.50 40.10 San José Costa Rica USD SM Month 1.00 18.00 19.00 – 18.75 20.00 Mexico City Mexico USD SM Month 1.00 27.00 30.00 9.1 29.00 32.00 Lima Peru USD SM Month 1.00 17.69 19.57 4.1 16.59 18.59
LOCAL MEASURE/CURRENCY CBD RENTS
MARKET COUNTRYQUOTED
CURRENCY UNITTIME
PERIOD
EXCHANGE RATE (USD)
DEC. 31, 2010
CLASS A NET
RENT
CLASS A GROSS RENT
GROSS RENT
ANNUAL CHG. (%)
TOP CLASS A
NET RENT
TOP CLASS A GROSS RENT
NORTH AMERICA continued
MEASURE

P. 16 | COLLIERS INTERNATIONAL
GLOBAL OFFICE REAL ESTATE REVIEW | SECOND HALF 2010
U.S. DOLLARS CBD MARKETS
MARKET COUNTRY
CLASS A NET RENT
(USD PSF YR.)
CLASS A GROSS RENT
(USD PSF YR.)
TOP CLASS A NET RENT
(USD PSF YR.)
TOP CLASS A
GROSS RENT (USD PSF YR.)
CBD SALES PRICE
(USD PSF)
CBD CAP RATE/
INITIAL YIELD (%)
10-YEAR GOVT. BONDS
(%)
EUROPE, MIDDLE EAST AND AFRICA (EMEA)Tirana Albania 22.15 – – – 126.73 14.00 –Vienna Austria 26.58 33.97 36.92 41.35 608.06 3.50 3.65Minsk Belarus 35.45 39.88 45.78 50.21 189.17 15.00 –Antwerp Belgium 15.38 20.31 16.98 22.15 169.88 7.25 4.23Brussels Belgium 22.15 29.54 30.77 36.31 290.74 6.10 4.23Sofia Bulgaria 14.47 0.00 32.49 0.00 128.70 9.00 –Zagreb Croatia 16.25* – 24.37 – 144.47 9.00 –Prague Czech Republic 25.11* – 31.01 – 287.09 7.00 3.98Copenhagen Denmark 21.48 26.44 28.09 33.04 343.90 5.00 3.52Tallinn Estonia 18.46 21.41 23.63 26.58 184.74 6.00 –Helsinki Finland 31.75 36.18 35.45 39.88 442.09 5.75 3.51Bordeaux France 19.69 28.31 22.15 30.77 210.19 7.50 3.67Lyon France 24.61 33.23 30.77 39.38 312.79 6.30 3.67Marseille France 25.85 34.46 30.77 39.38 275.88 7.50 3.67Montpellier France 19.69 28.31 19.69 28.31 210.19 7.50 3.67Nantes France 20.92 29.54 21.54 30.15 239.28 7.00 3.67Paris France 92.31 102.15 102.15 112.00 1,555.71 4.75 3.67Strasbourg France 20.92 29.54 24.61 33.23 223.33 7.50 3.67Toulouse France – – 24.61 33.23 – 7.50 3.67Berlin Germany 28.06 34.71 33.97 41.35 423.86 5.30 3.31Düsseldorf Germany 27.17 32.34 36.92 42.09 414.38 5.25 3.31Frankfurt Germany 44.31 50.21 54.64 63.51 669.25 5.30 3.31Hamburg Germany 32.49 35.45 35.45 39.88 541.91 4.80 3.31Munich Germany 38.40 44.31 51.69 57.60 683.13 4.50 3.31Stuttgart Germany 22.01 26.29 30.72 36.63 326.24 5.40 3.31Athens Greece 22.15* – 31.01 – 244.60 7.25 11.16Budapest Hungary 18.46* – 26.58 – 197.06 7.50 7.41Dublin Ireland 29.54 44.31 44.31 59.08 305.12 7.75 8.5Tel Aviv Israel 25.96 40.07 34.49 48.60 250.39 8.30 4.11Milan Italy 58.46 62.15 64.61 68.31 850.93 5.50 4.75Rome Italy 40.61 44.31 46.77 50.46 541.91 6.00 4.75Riga Latvia 20.68 25.11 22.15 26.58 194.74 8.50 –Vilnius Lithuania 17.96 22.24 21.39 26.09 169.20 8.50 –Amsterdam Netherlands 25.25 27.77 40.61 44.68 311.05 6.50 3.49Warsaw Poland 30.28* – 38.40 – 403.97 6.00 6.28Lisbon Portugal 25.55 29.24 32.49 36.18 302.48 6.80 7.26Bucharest Romania 22.15* – 29.54 – 221.69 8.00 –Moscow Russia 43.42* 60.15* 70.59 97.98 331.42 10.50 5.48Saint Petersburg Russia 34.41* 48.18* 42.39 59.34 212.08 13.00 5.48Riyadh Saudi Arabia 31.27 34.39 – – 243.08 10.30 –Belgrade Serbia 19.20* – 23.63 – 170.82 9.00 –Bratislava Slovakia 16.25* – 22.15 – 185.60 7.00 3.75Cape Town South Africa 11.74 15.93 19.28 23.47 89.49 10.50 8.44Durban South Africa 14.25 17.61 15.93 20.12 87.77 13.00 8.44Johannesburg South Africa 7.55 10.90 8.38 11.74 54.91 11.00 8.44Madrid Spain 36.18 40.61 41.35 47.26 503.78 5.75 5.29Stockholm Sweden 61.61 68.45 67.08 73.93 986.43 5.00 3.46Geneva Switzerland 64.16 69.10 98.72 108.59 1,284.20 4.00 1.87Zurich Switzerland 46.40 49.36 82.92 85.88 905.93 4.10 1.87Istanbul Turkey 30.98 35.66 54.61 57.95 354.33 7.00 9.26Kyiv Ukraine 35.66* – 50.15 – 259.57 11.00 –Abu Dhabi United Arab Emirates 35.77 39.34 54.39 59.96 220.17 13.00 –Dubai United Arab Emirates 21.84 23.96 51.71 56.95 194.14 9.00 –Belfast United Kingdom 19.33 31.71 21.66 34.80 247.49 6.25 3.97Birmingham United Kingdom 32.48 52.59 42.54 65.74 451.93 5.75 3.97Bristol United Kingdom 36.35 54.91 41.76 61.87 484.66 6.00 3.97

GLOBAL OFFICE REAL ESTATE REVIEW | SECOND HALF 2010
COLLIERS INTERNATIONAL | P. 17 Contact: Ross Moore—[email protected]
Edinburgh United Kingdom 32.48 52.59 42.54 60.32 433.10 6.00 3.97Glasgow United Kingdom 35.58 52.59 44.86 61.87 486.51 5.85 3.97London – City United Kingdom 75.02 99.77 88.94 116.01 1,091.19 5.50 3.97London – Docklands United Kingdom 38.67 63.42 54.14 78.89 538.01 5.75 3.97London – Southbank United Kingdom 50.27 75.02 61.87 86.62 699.42 5.75 3.97London – West End United Kingdom 108.28 133.02 131.48 156.23 1,924.89 4.50 3.97Manchester United Kingdom 31.71 50.27 41.76 64.97 441.17 5.75 3.97
NORTH AMERICACalgary Canada 22.00 39.49 25.99 49.79 339.93 6.50 3.54Edmonton Canada 22.17 38.47 25.59 41.90 275.03 6.42 3.54Halifax Canada 17.40 31.55 20.86 35.01 – – 3.54Kitchener-Waterloo Canada 13.27 24.78 14.63 26.13 159.97 8.00 3.54Montreal Canada 16.47 34.99 34.46 52.99 274.95 7.00 3.54Ottawa Canada 25.76 48.31 29.66 52.21 269.95 7.25 3.54Regina Canada 20.00 34.93 25.84 40.78 212.96 7.45 3.54Saskatoon Canada 19.89 33.99 25.88 39.99 239.95 7.20 3.54Toronto Canada 20.13 51.29 17.07 67.12 243.95 – 3.54Vancouver Canada 33.49 52.99 42.49 61.99 399.92 5.75 3.54Victoria Canada 23.00 36.99 28.99 42.99 324.94 6.33 3.54Winnipeg Canada 16.00 29.96 17.00 30.96 154.97 7.75 3.54Atlanta United States 9.76 21.41 25.35 37.00 81.00 8.66 3.64Bakersfield United States 9.44 17.40 13.04 21.00 – – 3.64Baltimore United States – 22.99 – – – – 3.64Boise United States 12.00 18.00 16.00 22.00 – – 3.64Boston United States – 46.01 – 65.00 540.00 6.50 3.64Charleston United States 19.72 28.72 26.00 35.00 250.00 8.00 3.64Charlotte United States – 24.97 – – – – 3.64Chicago United States 11.75 32.00 34.75 55.00 220.00 7.25 3.64Cincinnati United States 12.39 21.89 27.50 37.00 – – 3.64Cleveland United States – 20.43 – – – – 3.64Columbia United States 12.41 19.81 14.60 22.00 – – 3.64Columbus United States 7.75 19.30 15.84 27.39 98.00 8.50 3.64Dallas/Fort Worth United States 17.70 25.20 28.50 36.00 – – 3.64Denver United States 11.15 27.00 20.65 36.50 210.00 7.80 3.64Detroit United States – 23.00 – 24.60 – – 3.64Fresno United States 16.60 24.60 23.80 31.80 160.00 9.00 3.64Ft. Lauderdale/Broward County United States 13.79 31.79 20.00 38.00 283.63 6.40 3.64Greenville United States 10.24 19.49 15.75 25.00 – – 3.64Hartford United States 11.07 23.02 14.05 26.00 – – 3.64Honolulu United States 19.33 35.31 25.18 41.16 – – 3.64Houston United States 22.32 34.61 28.16 40.45 191.50 7.50 3.64Indianapolis United States 9.36 19.19 17.17 27.00 – – 3.64Jacksonville United States 9.80 18.90 10.89 19.99 85.00 9.25 3.64Kansas City United States 9.07 17.07 12.00 20.00 – – 3.64Las Vegas United States 19.57 34.57 21.00 36.00 – – 3.64Little Rock United States 9.85 16.50 15.35 22.00 88.00 9.50 3.64Los Angeles United States 23.00 39.00 24.44 40.44 – – 3.64Los Angeles – Inland Empire United States – – – – 332.00 6.00 3.64Louisville United States – 22.33 – – – – 3.64Memphis United States 9.40 17.65 12.75 21.00 – – 3.64Miami-Dade United States 20.52 41.52 25.50 46.50 175.55 5.75 3.64Nashville United States 13.19 23.69 20.50 31.00 – – 3.64New York – Downtown Manhattan United States – 39.68 – 65.00 89.00 6.90 3.64New York – Midtown Manhattan United States 37.54 65.04 122.50 150.00 675.00 5.00 3.64New York – Midtown S. Manhattan United States 18.21 43.21 40.00 65.00 542.00 5.00 3.64
U.S. DOLLARS CBD MARKETS
MARKET COUNTRY
CLASS A NET RENT
(USD PSF YR.)
CLASS A GROSS RENT
(USD PSF YR.)
TOP CLASS A NET RENT
(USD PSF YR.)
TOP CLASS A
GROSS RENT (USD PSF YR.)
CBD SALES PRICE
(USD PSF)
CBD CAP RATE/
INITIAL YIELD (%)
10-YEAR GOVT. BONDS
(%)
EUROPE, MIDDLE EAST AND AFRICA (EMEA) continued

P. 18 | COLLIERS INTERNATIONAL
GLOBAL OFFICE REAL ESTATE REVIEW | SECOND HALF 2010
Oakland United States 17.34 30.84 25.50 39.00 – 8.00 3.64Orlando United States 12.93 23.93 24.00 35.00 – – 3.64Philadelphia United States 14.23 26.10 25.63 37.50 112.00 9.00 3.64Phoenix United States 15.13 28.23 26.90 40.00 212.00 – 3.64Pleasanton/Walnut Creek United States – 26.28 – 32.40 112.50 8.00 3.64Portland United States 13.15 24.67 24.98 36.50 179.75 7.20 3.64Raleigh/Durham/Chapel Hill United States – 23.22 – – – – 3.64Reno United States 12.40 23.40 13.00 24.00 – – 3.64Sacramento United States 25.45 32.75 22.70 30.00 180.00 8.10 3.64San Diego County United States 13.82 28.68 15.74 30.60 111.49 – 3.64San Francisco Peninsula United States 17.31 35.97 46.34 65.00 314.00 6.20 3.64San Jose/Silicon Valley United States 19.52 34.32 21.20 36.00 – – 3.64Seattle/Puget Sound United States 19.55 30.50 34.05 45.00 161.30 6.00 3.64St. Louis United States 7.63 17.63 12.00 22.00 100.00 9.00 3.64Stamford United States 24.94 37.94 45.00 58.00 350.00 8.00 3.64Stockton/San Joaquin County United States 17.46 21.12 26.34 30.00 130.00 8.50 3.64Tampa United States 13.91 22.91 21.00 30.00 – – 3.64Washington, DC United States 33.59 53.59 50.00 70.00 688.77 – 3.64West Palm Beach/Palm Beach Co. United States 17.12 36.62 35.50 55.00 – – 3.64White Plains United States 15.41 28.41 27.00 40.00 350.00 8.00 3.64
ASIA PACIFICAdelaide Australia 31.53 40.66 38.38 47.98 320.06 7.50 5.75Brisbane Australia 54.83 65.57 61.68 73.11 741.45 7.32 5.75Canberra Australia 32.90 39.29 35.64 42.04 480.09 7.50 5.75Melbourne Australia 38.84 48.43 47.79 59.40 531.58 7.00 5.75Perth Australia 55.29 68.54 65.16 79.78 708.71 7.50 5.75Sydney Australia 49.71 64.42 86.45 102.16 782.69 7.07 5.75Beijing China 34.04 39.10 38.77 43.82 517.13 6.59 4.01Chengdu China 21.32 24.39 24.44 28.15 – 7.80 4.01Guangzhou China 22.92 31.69 30.34 41.46 365.50 6.26 4.01Hong Kong China 166.05 191.97 276.83 314.34 2,794.87 3.31 2.88Shanghai China 36.38 40.02 43.58 47.94 – 5.10 4.01Banaglore India 15.81 18.44 17.91 21.08 219.54 9.50 8.36Chennai India 13.44 15.81 15.81 18.44 197.59 9.00 8.36Delhi/Gurgaon/Noida India 54.27 64.02 72.97 85.88 987.93 9.00 8.36Mumbai India 57.43 62.24 65.33 76.93 724.48 10.00 8.36Jakarta Indonesia 13.49 20.16 28.63 33.53 201.54 9.21 4.92Tokyo Japan – 105.00 – 165.35 2,309.65 4.70 1.32Auckland New Zealand 21.92 31.13 30.70 40.69 256.54 8.68 5.58Christchurch New Zealand 21.77 26.27 25.56 29.63 276.47 7.88 5.58Wellington New Zealand 25.20 31.48 29.63 36.98 306.41 8.22 5.58Singapore Singapore 57.43 73.51 75.55 94.79 1,383.10 4.20 2.61Seoul South Korea 26.39 36.02 30.32 42.18 399.34 7.00 4.72Taipei Taiwan 27.74 33.29 39.68 47.62 985.22 2.90 1.36Bangkok Thailand 24.32 26.02 29.53 31.59 – – 3.63Ho Chi Minh City Vietnam 49.04 60.63 62.41 75.34 – – –
LATIN AMERICABuenos Aires Argentina 33.21 38.00 40.12 48.26 334.57 10.50 –Rio de Janeiro Brazil 80.06 94.74 85.40 106.08 712.16 10.50 6.16São Paulo Brazil 60.71 78.73 82.73 92.74 612.01 11.00 6.16Santiago Chile 28.07 31.72 34.19 38.63 214.87 9.58 2.90Bogotá Colombia 32.32 35.55 40.68 44.69 251.95 10.00 4.79San José Costa Rica 20.06 21.17 20.90 22.29 195.17 12.00 –Mexico City Mexico 30.09 33.43 32.32 35.66 269.52 9.00 7.44Lima Peru 19.71 21.81 18.49 20.72 – 12.50 –
U.S. DOLLARS CBD MARKETS
MARKET COUNTRY
CLASS A NET RENT
(USD PSF YR.)
CLASS A GROSS RENT
(USD PSF YR.)
TOP CLASS A NET RENT
(USD PSF YR.)
TOP CLASS A
GROSS RENT (USD PSF YR.)
CBD SALES PRICE
(USD PSF)
CBD CAP RATE/
INITIAL YIELD (%)
10-YEAR GOVT. BONDS
(%)
NORTH AMERICA continued

GLOBAL OFFICE REAL ESTATE REVIEW | SECOND HALF 2010
COLLIERS INTERNATIONAL | P. 19 Contact: Ross Moore—[email protected]
LOCAL MEASURE/CURRENCY SUBURBAN/OUT-OF-TOWN RENTS
MARKET COUNTRYQUOTED
CURRENCY UNITTIME
PERIOD
EXCHANGE RATE (USD)
DEC. 31, 2010
CLASS A NET
RENT
CLASS A GROSS RENT
GROSS RENT
ANNUAL CHG. (%)
TOP CLASS A
NET RENT
TOP CLASS A GROSS RENT
EUROPE, MIDDLE EAST AND AFRICA (EMEA)
Tirana Albania EUR SM Month 0.75 15.00 – – – –
Minsk Belarus EUR SM Month 0.75 22.00 25.00 27.00 30.00
Antwerp Belgium EUR SM Month 0.75 8.33 11.67 -6.7 9.58 12.92
Brussels Belgium EUR SM Month 0.75 10.42 13.33 -3.0 12.50 15.00
Copenhagen Denmark DKK SM Month 5.62 83.33 100.00 14.3 108.33 125.00
Tallinn Estonia EUR SM Month 0.75 8.00 10.00 0.0 12.00 14.00
Helsinki Finland EUR SM Month 0.75 10.00 13.00 0.0 14.00 17.00
Bordeaux France EUR SM Month 0.75 11.67 17.50 2.4 13.33 19.17
Lyon France EUR SM Month 0.75 12.08 17.92 -15.7 13.75 19.58
Marseille France EUR SM Month 0.75 12.08 17.92 – 14.17 20.00
Montpellier France EUR SM Month 0.75 11.67 17.50 – 12.50 18.33
Nantes France EUR SM Month 0.75 10.83 16.67 1.5 11.67 17.50
Paris France EUR SM Month 0.75 37.50 44.17 0.0 49.17 55.83
Strasbourg France EUR SM Month 0.75 10.83 16.67 – 14.17 20.00
Toulouse France EUR SM Month 0.75 11.67 17.50 – 15.00 20.83
Berlin Germany EUR SM Month 0.75 9.00 12.00 0.0 12.50 15.50
Düsseldorf Germany EUR SM Month 0.75 15.60 18.60 0.0 22.50 26.80
Frankfurt Germany EUR SM Month 0.75 14.00 16.50 0.0 16.50 20.00
Hamburg Germany EUR SM Month 0.75 12.00 15.00 7.1 15.00 18.00
Munich Germany EUR SM Month 0.75 9.50 11.50 -11.5 17.50 19.50
Stuttgart Germany EUR SM Month 0.75 13.40 16.00 3.1 15.90 18.90
Dublin Ireland EUR SM Month 0.75 12.00 20.00 -11.1 14.00 15.00
Tel Aviv Israel NIS SM Month 3.55 57.00 95.00 13.1 69.50 107.50
Milan Italy EUR SM Month 0.75 15.00 18.75 7.1 20.00 23.75
Rome Italy EUR SM Month 0.75 12.50 14.17 -5.6 15.00 16.67
Riga Latvia EUR SM Month 0.75 9.00 12.00 20.0 10.00 13.00
Vilnius Lithuania EUR SM Month 0.75 9.27 10.86 16.8 10.14 11.82
Amsterdam Netherlands EUR SM Month 0.75 15.00 16.65 -0.1 25.50 28.35
Lisbon Portugal EUR SM Month 0.75 12.10 14.60 10.6 22.30 23.30
Riyadh Saudi Arabia SAR SM Month 3.75 59.92 65.92 – 67.75 74.58
Cape Town South Africa ZAR SM Month 6.65 85.00 100.00 – 120.00 145.00
Durban South Africa ZAR SM Month 6.65 95.00 105.00 10.5 105.00 120.00
Johannesburg South Africa ZAR SM Month 6.65 110.00 140.00 0.0 130.00 160.00
Madrid Spain EUR SM Month 0.75 13.00 16.00 -8.6 16.50 19.50
Stockholm Sweden SEK SM Month 6.78 158.33 191.67 0.0 183.33 208.33
Geneva Switzerland CHF SM Month 0.94 33.33 35.83 7.0 50.00 53.33
Istanbul Turkey USD SM Month 1.00 17.70 19.50 -2.5 30.00 32.00
Belfast United Kingdom GBP SF Year 0.65 10.00 16.00 – 11.00 17.00
Birmingham United Kingdom GBP SF Year 0.65 16.00 29.00 0.0 20.00 33.00
Bristol United Kingdom GBP SF Year 0.65 16.50 29.00 – 21.00 33.00
Edinburgh United Kingdom GBP SF Year 0.65 15.00 27.00 0.0 17.00 29.00
Glasgow United Kingdom GBP SF Year 0.65 16.00 26.00 4.0 17.00 27.00
MEASURE

P. 20 | COLLIERS INTERNATIONAL
GLOBAL OFFICE REAL ESTATE REVIEW | SECOND HALF 2010
Calgary Canada CAD SF Year 1.00 21.50 35.00 29.6 26.50 40.00 Edmonton Canada CAD SF Year 1.00 – 25.76 -12.9 – –Halifax Canada CAD SF Year 1.00 14.62 26.74 -1.8 17.48 29.60 Kitchener-Waterloo Canada CAD SF Year 1.00 12.83 23.74 -9.8 18.59 29.50 Montreal Canada CAD SF Year 1.00 10.63 26.00 5.1 14.63 30.00 Ottawa Canada CAD SF Year 1.00 16.00 32.00 9.2 24.00 40.00 Regina Canada CAD SF Year 1.00 16.73 28.50 15.9 11.23 23.00 Toronto Canada CAD SF Year 1.00 – 30.52 7.6 – 47.50 Vancouver Canada CAD SF Year 1.00 23.50 38.00 38.2 32.50 47.00 Victoria Canada CAD SF Year 1.00 27.50 41.50 25.8 29.00 43.00 Atlanta United States USD SF Year 1.00 11.56 21.46 -2.5 25.10 35.00 Bakersfield United States USD SF Year 1.00 15.60 24.00 0.0 18.00 26.40 Baltimore United States USD SF Year 1.00 – 26.04 – – –Boise United States USD SF Year 1.00 12.50 18.00 -1.4 16.50 22.00 Boston United States USD SF Year 1.00 13.77 25.77 3.2 38.00 50.00 Charleston United States USD SF Year 1.00 15.99 23.49 4.4 20.50 28.00 Charlotte United States USD SF Year 1.00 – 20.32 – – –Chicago United States USD SF Year 1.00 17.83 27.33 -0.9 25.50 35.00 Cincinnati United States USD SF Year 1.00 12.52 20.40 – 19.88 27.76 Cleveland United States USD SF Year 1.00 – 22.02 2.0 – –Columbia United States USD SF Year 1.00 9.89 16.99 -2.8 14.90 22.00 Columbus United States USD SF Year 1.00 8.20 17.87 -2.3 12.78 22.45 Dallas/Fort Worth United States USD SF Year 1.00 13.95 24.75 -1.0 26.95 37.75 Denver United States USD SF Year 1.00 4.75 20.75 -1.2 12.00 28.00 Detroit United States USD SF Year 1.00 – 22.17 -3.7 – 22.77 Fairfield United States USD SF Year 1.00 21.65 34.65 32.5 35.00 48.00 Fairfield County United States USD SF Year 1.00 – 25.92 – – 35.40 Fresno United States USD SF Year 1.00 17.20 25.20 0.0 23.80 31.80 Ft. Lauderdale/Broward County United States USD SF Year 1.00 12.38 27.88 1.0 19.50 35.00 Greenville United States USD SF Year 1.00 9.58 17.58 -1.0 14.00 22.00 Hartford United States USD SF Year 1.00 10.33 20.33 -2.5 15.50 25.50 Houston United States USD SF Year 1.00 16.08 27.11 -0.6 22.50 33.53 Indianapolis United States USD SF Year 1.00 11.11 18.32 – 49.93 57.14 Jacksonville United States USD SF Year 1.00 10.47 19.32 -3.4 19.46 28.31 Kansas City United States USD SF Year 1.00 11.58 21.08 – 22.50 32.00 Las Vegas United States USD SF Year 1.00 18.31 32.31 -6.6 28.60 42.60 Little Rock United States USD SF Year 1.00 11.88 18.53 1.5 13.65 20.30 Los Angeles United States USD SF Year 1.00 14.84 24.84 -30.1 24.20 34.20 Los Angeles – Inland Empire United States USD SF Year 1.00 16.28 32.28 19.0 56.00 72.00 Louisville United States USD SF Year 1.00 – 20.03 – – –Memphis United States USD SF Year 1.00 13.03 21.68 -0.4 18.94 27.59 Miami-Dade United States USD SF Year 1.00 15.59 32.09 -1.2 27.50 44.00 Nashville United States USD SF Year 1.00 13.33 22.33 6.3 19.50 28.50 New Jersey – Central United States USD SF Year 1.00 – 23.29 -10.8 – 42.00 New Jersey – Northern United States USD SF Year 1.00 – 24.43 -14.0 – 38.00 Oakland United States USD SF Year 1.00 12.18 25.68 -0.9 22.50 36.00 Orange County United States USD SF Year 1.00 11.66 26.16 -11.4 54.50 69.00
LOCAL MEASURE/CURRENCY SUBURBAN/OUT-OF-TOWN RENTS
MARKET COUNTRYQUOTED
CURRENCY UNITTIME
PERIOD
EXCHANGE RATE (USD)
DEC. 31, 2010
CLASS A NET
RENT
CLASS A GROSS RENT
GROSS RENT
ANNUAL CHG. (%)
TOP CLASS A
NET RENT
TOP CLASS A GROSS RENT
NORTH AMERICA
MEASURE

GLOBAL OFFICE REAL ESTATE REVIEW | SECOND HALF 2010
COLLIERS INTERNATIONAL | P. 21 Contact: Ross Moore—[email protected]
Orlando United States USD SF Year 1.00 13.91 22.91 -2.1 27.00 36.00 Philadelphia United States USD SF Year 1.00 13.18 24.03 -1.4 26.57 37.42 Phoenix United States USD SF Year 1.00 15.44 23.94 -5.6 29.00 37.50 Pleasanton/Walnut Creek United States USD SF Year 1.00 – 23.64 -6.2 – 40.80 Portland United States USD SF Year 1.00 11.57 23.20 1.5 21.37 33.00 Raleigh/Durham/Chapel Hill United States USD SF Year 1.00 – 21.55 – – –Reno United States USD SF Year 1.00 9.42 19.92 -7.8 25.50 36.00 Sacramento United States USD SF Year 1.00 17.89 23.79 -5.6 26.98 32.88 San Diego County United States USD SF Year 1.00 19.07 31.80 -8.0 34.07 46.80 San Francisco United States USD SF Year 1.00 17.66 32.16 – 105.50 120.00 San Jose/Silicon Valley United States USD SF Year 1.00 21.18 34.68 -3.5 61.50 75.00 Seattle/Puget Sound United States USD SF Year 1.00 18.19 28.42 3.5 16.27 26.50 St. Louis United States USD SF Year 1.00 11.68 21.68 – 22.00 32.00 Tampa United States USD SF Year 1.00 15.55 23.30 -4.8 21.25 29.00 Washington, DC United States USD SF Year 1.00 17.31 31.31 1.8 43.00 57.00 West Palm Beach/Palm Beach Co. United States USD SF Year 1.00 13.33 30.08 -1.2 23.25 40.00 Westchester County United States USD SF Year 1.00 14.23 27.23 – 32.00 45.00
ASIA PACIFIC
Adelaide Australia AUD SM Year 1.02 275.00 335.00 17.5 300.00 415.00 Brisbane Australia AUD SM Year 1.02 382.50 450.00 12.5 465.00 525.00 Canberra Australia AUD SM Year 1.02 335.00 400.00 0.0 345.00 415.00 Melbourne Australia AUD SM Year 1.02 251.00 302.00 4.1 280.00 330.00 Sydney Australia AUD SM Year 1.02 365.00 455.00 1.1 570.00 675.00 Beijing China RMB SM Month 6.61 192.27 222.27 14.1 238.17 268.17 Guangzhou China RMB SM Month 6.61 83.00 115.00 90.00 123.00 Hong Kong China HKD SF Month 7.80 36.07 45.22 22.6 55.56 66.67 Shanghai China RMB SM Month 6.61 103.40 115.20 124.71 144.65 Banaglore India INR SF Month 45.55 30.00 35.00 16.7 34.00 40.00 Chennai India INR SF Month 45.55 27.00 32.00 0.0 34.00 40.00 Delhi/Gurgaon/Noida India INR SF Month 45.55 110.00 129.00 18.3 170.00 200.00 Mumbai India INR SF Month 45.55 102.00 120.00 2.6 218.00 257.00 Jakarta Indonesia IDR SM Month 9,107.47 97,000.00 158,079.00 0.2 162,000.00 192,000.00 Auckland New Zealand NZD SM Year 1.30 256.00 310.00 -3.4 270.00 322.00 Singapore Singapore SGD SF Month 1.29 5.22 6.80 26.2 5.88 7.50 Bangkok Thailand THB SM Month 30.19 365.00 391.00 -3.0 466.00 499.00 Ho Chi Minh City Vietnam USD SM Month 1.00 25.00 31.50 -2.8 33.00 40.30
LATIN AMERICA
Buenos Aires Argentina USD SM Month 1.00 21.00 25.00 14.7 24.50 29.10 Rio de Janeiro Brazil REAL SM Month 1.67 75.00 94.00 -18.3 94.00 120.00São Paulo Brazil REAL SM Month 1.67 63.00 90.00 5.9 90.00 116.00 San José Costa Rica USD SM Year 1.00 17.75 19.00 – 19.75 22.00 Mexico City Mexico USD SM Month 1.00 21.00 24.00 3.9 23.00 26.00 Lima Peru USD SM Month 1.00 13.50 15.30 -13.1 16.96 19.16
LOCAL MEASURE/CURRENCY SUBURBAN/OUT-OF-TOWN RENTS
MARKET COUNTRYQUOTED
CURRENCY UNITTIME
PERIOD
EXCHANGE RATE (USD)
DEC. 31, 2010
CLASS A NET
RENT
CLASS A GROSS RENT
GROSS RENT
ANNUAL CHG. (%)
TOP CLASS A
NET RENT
TOP CLASS A GROSS RENT
NORTH AMERICA continued
MEASURE

P. 22 | COLLIERS INTERNATIONAL
GLOBAL OFFICE REAL ESTATE REVIEW | SECOND HALF 2010
U.S. DOLLARS SUBURBAN/OUT-OF-TOWN MARKETS
MARKET COUNTRY
CLASS A NET RENT
(USD PSF YR.)
CLASS A GROSS RENT
(USD PSF YR.)
TOP CLASS A NET RENT
(USD PSF YR.)
TOP CLASS A
GROSS RENT (USD PSF YR.)
SUBURBAN SALES PRICE
(USD PSF)
SUBURBAN CAP RATE/
INITIAL YIELD (%)
10-YEAR GOVT. BONDS
(%)
EUROPE, MIDDLE EAST AND AFRICA (EMEA)Tirana Albania 22.15 0.00 0.00 0.00 104.32 17.00 –Minsk Belarus 32.49 36.92 39.88 44.31 153.01 17.00 –Antwerp Belgium 12.31 17.23 14.15 19.08 127.13 7.75 4.23Brussels Belgium 15.38 19.69 18.46 22.15 178.49 6.90 4.23Sofia Bulgaria 0.00 0.00 0.00 0.00 115.87 10.00 –Zagreb Croatia 0.00 0.00 0.00 0.00 130.06 10.00 –Prague Czech Republic 0.00 0.00 0.00 0.00 243.42 8.50 3.98Copenhagen Denmark 16.52 19.83 21.48 24.78 220.45 6.00 3.52Tallinn Estonia 11.82 14.77 17.72 20.68 111.28 8.50 –Helsinki Finland 14.77 19.20 20.68 25.11 168.91 7.00 3.51Bordeaux France 17.23 25.85 19.69 28.31 183.92 7.50 3.67Lyon France 17.85 26.46 20.31 28.92 204.09 7.00 3.67Marseille France 17.85 26.46 20.92 29.54 190.49 7.50 3.67Montpellier France 17.23 25.85 18.46 27.08 153.27 9.00 3.67Nantes France 16.00 24.61 17.23 25.85 160.11 8.00 3.67Paris France 55.38 65.23 72.61 82.46 777.85 5.70 3.67Strasbourg France 16.00 24.61 20.92 29.54 170.78 7.50 3.67Toulouse France 17.23 25.85 22.15 30.77 183.92 7.50 3.67Berlin Germany 13.29 17.72 18.46 22.89 156.49 6.80 3.31Düsseldorf Germany 23.04 27.47 33.23 39.58 318.01 5.80 3.31Frankfurt Germany 20.68 24.37 24.37 29.54 254.66 6.50 3.31Hamburg Germany 17.72 22.15 22.15 26.58 202.69 7.00 3.31Munich Germany 14.03 16.98 25.85 28.80 167.65 6.70 3.31Stuttgart Germany 19.79 23.63 23.48 27.91 277.95 5.70 3.31Athens Greece – – – – 213.68 8.30 11.16Budapest Hungary – – – – 164.21 9.00 7.41Dublin Ireland 17.72 29.54 20.68 22.15 162.15 8.75 8.5Tel Aviv Israel 17.87 29.78 21.79 33.70 168.32 8.50 4.11Milan Italy 22.15 27.69 29.54 35.08 272.85 6.50 4.75Rome Italy 18.46 20.92 22.15 24.61 211.13 7.00 4.75Riga Latvia 13.29 17.72 14.77 19.20 106.41 10.00 –Vilnius Lithuania 13.69 16.04 14.97 17.45 109.58 10.00 –Amsterdam Netherlands 22.15 24.59 37.66 41.87 272.85 6.50 3.49Warsaw Poland – – – – 302.97 8.00 6.28Lisbon Portugal 17.87 21.56 32.93 34.41 302.97 8.00 7.26Bucharest Romania – – – – 186.69 9.50 –Moscow Russia – – – – 278.35 12.50 5.48Saint Petersburg Russia – – – – 196.91 14.00 5.48Riyadh Saudi Arabia 17.80 19.59 20.13 22.16 129.57 11.00 –Belgrade Serbia – – – – 146.38 10.50 –Bratislava Slovakia – – – – 162.57 8.00 3.75Cape Town South Africa 14.25 16.77 20.12 24.31 108.66 10.50 8.44Durban South Africa 15.93 17.61 17.61 20.12 115.93 11.00 8.44Johannesburg South Africa 18.44 23.47 21.80 26.83 164.06 9.00 8.44Madrid Spain 19.20 23.63 24.37 28.80 227.71 6.75 5.29Stockholm Sweden 26.01 31.49 30.12 34.23 347.08 6.00 3.46Geneva Switzerland 39.48 42.44 59.23 63.18 711.25 5.00 1.87Istanbul Turkey 19.73 21.73 33.43 35.66 210.56 7.50 9.26Kyiv Ukraine – – – – 203.93 14.00 –Belfast United Kingdom 15.47 24.75 17.01 26.30 17.04 6.75 3.97Birmingham United Kingdom 24.75 44.86 30.94 51.04 – – 3.97Bristol United Kingdom 25.52 44.86 32.48 51.04 – – 3.97Edinburgh United Kingdom 23.20 41.76 26.30 44.86 – – 3.97Glasgow United Kingdom 24.75 40.22 26.30 41.76 – – 3.97

GLOBAL OFFICE REAL ESTATE REVIEW | SECOND HALF 2010
COLLIERS INTERNATIONAL | P. 23 Contact: Ross Moore—[email protected]
Calgary Canada 21.50 34.99 26.49 39.99 334.93 7.25 3.54Edmonton Canada – 25.75 – – – – 3.54Halifax Canada 14.62 26.73 17.48 29.59 – – 3.54Kitchener-Waterloo Canada 12.83 23.74 18.59 29.49 109.98 7.75 3.54Montreal Canada 10.63 25.99 14.63 29.99 189.96 7.75 3.54Ottawa Canada 16.00 31.99 24.00 39.99 144.97 7.60 3.54Regina Canada 16.73 28.49 11.23 23.00 – – 3.54Toronto Canada – 30.51 – 47.49 173.97 – 3.54Vancouver Canada 23.50 37.99 32.49 46.99 299.94 6.50 3.54Victoria Canada 27.49 41.49 28.99 42.99 289.94 6.75 3.54Winnipeg Canada – – – – 134.97 7.75 3.54Atlanta United States 11.56 21.46 25.10 35.00 157.00 9.15 3.64Bakersfield United States 15.60 24.00 18.00 26.40 116.00 – 3.64Baltimore United States – 26.04 – – – – 3.64Boise United States 12.50 18.00 16.50 22.00 – – 3.64Boston United States 13.77 25.77 38.00 50.00 – – 3.64Charleston United States 15.99 23.49 20.50 28.00 135.00 11.00 3.64Charlotte United States – 20.32 – – – – 3.64Chicago United States 17.83 27.33 25.50 35.00 120.00 8.00 3.64Cincinnati United States 12.52 20.40 19.88 27.76 168.00 – 3.64Cleveland United States – 22.02 – – – – 3.64Columbia United States 9.89 16.99 14.90 22.00 – – 3.64Columbus United States 8.20 17.87 12.78 22.45 135.00 – 3.64Dallas/Fort Worth United States 13.95 24.75 26.95 37.75 180.00 7.00 3.64Denver United States 4.75 20.75 12.00 28.00 155.00 8.40 3.64Detroit United States – 22.17 – 22.77 – – 3.64Fairfield United States 21.65 34.65 35.00 48.00 250.00 8.00 3.64Fairfield County United States – 25.92 – 35.40 – – 3.64Fresno United States 17.20 25.20 23.80 31.80 160.00 8.50 3.64Ft. Lauderdale/Broward County United States 12.38 27.88 19.50 35.00 142.23 9.80 3.64Greenville United States 9.58 17.58 14.00 22.00 – – 3.64Hartford United States 10.33 20.33 15.50 25.50 – – 3.64Honolulu United States – – – – 226.00 6.50 3.64Houston United States 16.08 27.11 22.50 33.53 139.50 8.00 3.64Indianapolis United States 11.11 18.32 49.93 57.14 – – 3.64Jacksonville United States 10.47 19.32 19.46 28.31 120.00 8.75 3.64Kansas City United States 11.58 21.08 22.50 32.00 – – 3.64Las Vegas United States 18.31 32.31 28.60 42.60 122.71 – 3.64Little Rock United States 11.88 18.53 13.65 20.30 110.00 9.25 3.64Los Angeles United States 14.84 24.84 24.20 34.20 230.00 – 3.64Los Angeles – Inland Empire United States 16.28 32.28 56.00 72.00 280.00 8.00 3.64Louisville United States – 20.03 – – – – 3.64Memphis United States 13.03 21.68 18.94 27.59 – – 3.64Miami-Dade United States 15.59 32.09 27.50 44.00 166.02 – 3.64Nashville United States 13.33 22.33 19.50 28.50 60.70 – 3.64New Jersey – Central United States – 23.29 – 42.00 – – 3.64New Jersey – Northern United States – 24.43 – 38.00 – – 3.64Oakland United States 12.18 25.68 22.50 36.00 – 9.00 3.64Orange County United States 11.66 26.16 54.50 69.00 155.00 8.50 3.64Orlando United States 13.91 22.91 27.00 36.00 160.31 9.10 3.64Philadelphia United States 13.18 24.03 26.57 37.42 117.00 9.00 3.64
U.S. DOLLARS SUBURBAN/OUT-OF-TOWN MARKETS
MARKET COUNTRY
CLASS A NET RENT
(USD PSF YR.)
CLASS A GROSS RENT
(USD PSF YR.)
TOP CLASS A NET RENT
(USD PSF YR.)
TOP CLASS A
GROSS RENT (USD PSF YR.)
SUBURBAN SALES PRICE
(USD PSF)
SUBURBAN CAP RATE/
INITIAL YIELD (%)
10-YEAR GOVT. BONDS
(%)
NORTH AMERICA – –

P. 24 | COLLIERS INTERNATIONAL
GLOBAL OFFICE REAL ESTATE REVIEW | SECOND HALF 2010
Phoenix United States 15.44 23.94 29.00 37.50 92.00 8.25 3.64Pleasanton/Walnut Creek United States – 23.64 – 40.80 87.50 8.50 3.64Portland United States 11.57 23.20 21.37 33.00 149.65 8.40 3.64Raleigh/Durham/Chapel Hill United States – 21.55 – – – – 3.64Reno United States 9.42 19.92 25.50 36.00 – – 3.64Sacramento United States 17.89 23.79 26.98 32.88 134.44 8.30 3.64San Diego County United States 19.07 31.80 34.07 46.80 174.80 8.45 3.64San Francisco United States 17.66 32.16 105.50 120.00 250.00 6.50 3.64San Jose/Silicon Valley United States 21.18 34.68 61.50 75.00 – – 3.64Seattle/Puget Sound United States 18.19 28.42 16.27 26.50 395.92 6.70 3.64St. Louis United States 11.68 21.68 22.00 32.00 127.00 8.50 3.64Tampa United States 15.55 23.30 21.25 29.00 103.26 10.00 3.64Washington, DC United States 17.31 31.31 43.00 57.00 – – 3.64West Palm Beach/Palm Beach Co. United States 13.33 30.08 23.25 40.00 213.00 – 3.64Westchester County United States 14.23 27.23 32.00 45.00 250.00 8.00 3.64
ASIA PACIFIC
Adelaide Australia 25.13 30.61 27.41 37.92 320.06 7.50 5.75Brisbane Australia 34.95 41.12 42.49 47.98 741.45 7.32 5.75Canberra Australia 30.61 36.55 31.53 37.92 480.09 7.50 5.75Melbourne Australia 22.94 27.60 25.59 30.16 531.58 7.00 5.75Perth Australia – – – – 708.71 7.50 5.75Sydney Australia 33.35 41.58 52.09 61.68 782.69 7.07 5.75Beijing China 32.41 37.46 40.14 45.20 517.13 6.59 4.01Chengdu China – – – – – 7.80 4.01Guangzhou China 13.99 19.38 15.17 20.73 365.50 6.26 4.01Hong Kong China 55.49 69.57 85.48 102.57 2,794.87 3.31 2.88Shanghai China 17.43 19.42 21.02 24.38 – 5.10 4.01Banaglore India 7.90 9.22 8.96 10.54 219.54 9.50 8.36Chennai India 7.11 8.43 8.96 10.54 197.59 9.00 8.36Delhi/Gurgaon/Noida India 28.98 33.98 44.79 52.69 987.93 9.00 8.36Mumbai India 26.87 31.61 57.43 67.71 724.48 10.00 8.36Jakarta Indonesia 11.87 19.34 19.82 23.49 201.54 9.21 4.92Tokyo Japan – – – – 2,309.65 4.70 1.32Auckland New Zealand 18.28 22.13 19.28 22.99 256.54 8.68 5.58Christchurch New Zealand – – – – 276.47 7.88 5.58Wellington New Zealand – – – – 306.41 8.22 5.58Singapore Singapore 48.51 63.19 54.64 69.70 1,383.10 4.20 2.61Seoul South Korea – – – – 399.34 7.00 4.72Taipei Taiwan – – – – 3,296.28 2.90 1.36Bangkok Thailand 13.47 14.43 17.20 18.42 – – 3.63Ho Chi Minh City Vietnam 27.86 35.11 36.78 44.91 – – –
LATIN AMERICA
Buenos Aires Argentina 23.40 27.86 27.30 32.43 185.87 10.50 –Rio de Janeiro Brazil 50.04 62.71 62.71 80.06 422.84 10.50 6.16São Paulo Brazil 42.03 60.05 60.05 77.39 389.46 11.00 6.16Santiago Chile – – – – 137.36 11.25 2.90San José Costa Rica 19.78 21.17 22.01 24.52 213.75 12.05 –Mexico City Mexico 23.40 26.75 25.63 28.98 269.52 9.00 7.44Lima Peru 15.05 17.05 18.90 21.35 – 12.50 –
U.S. DOLLARS SUBURBAN/OUT-OF-TOWN MARKETS
MARKET COUNTRY
CLASS A NET RENT
(USD PSF YR.)
CLASS A GROSS RENT
(USD PSF YR.)
TOP CLASS A NET RENT
(USD PSF YR.)
TOP CLASS A
GROSS RENT (USD PSF YR.)
SUBURBAN SALES PRICE
(USD PSF)
SUBURBAN CAP RATE/
INITIAL YIELD (%)
10-YEAR GOVT. BONDS
(%)
NORTH AMERICA continued

GLOBAL OFFICE REAL ESTATE REVIEW | SECOND HALF 2010
COLLIERS INTERNATIONAL | P. 25 Contact: Ross Moore—[email protected]
Class A Gross Rent – The average rent quoted per square foot per annum for a class A office building within the CBD plus additional costs such as property taxes, service charges or operating expenses.
Class A Net Rent – The average rent quoted per square foot per annum for a class A office building within the CBD.
Class A (Prime) Buildings – Most prestigious buildings competing for premier office users with rents above average for the area. Buildings have high quality standard finishes, state of the art systems, exceptional accessibility and a definite market presence.
� Characterized by: Prime central location; first-class tenant im-provements; on-site parking; state of the art elevators and HVAC systems; concrete and steel construction; contemporary design and architecture; high quality of upkeep and maintenance; ability to command a premium rent within the relevant market. The class A building designation implies that the size of the building is “signifi-cant” in accordance with the market.
Population – The latest population statistics for the metropolitan region.
Quoted Currency – The currency quoted locally in all lease transac-tions, not necessarily national currency. (Note: Chile utilizes Unidad de Fomento, which equals USD 24.30)
Sales Price – The average sales price paid for a class A office building within the CBD.
Time Period – The standard way in which leases are quoted. Usually on a per month or per year basis.
Top Class A Gross Rent – The top/ highest rent quoted per square foot per annum for office floor space within the CBD plus additional costs such as property taxes, service charges or operating expenses.
Top Class A Net Rent – The top/highest rent quoted per square foot per annum for office floor space within the CBD.
Total Inventory – Existing office floor space (classes A, B and C) within each city’s CBD (central business district).
Under Construction – The total office floor space (classes A, B and C) within each city’s CBD (central business district) which is under construction, but not yet completed, giving an indication of the develop-ment pipeline for each market. This includes both available and pre-let floor space.
Unit – The normal convention locally in which area is measured. Usu-ally on a per square foot or per square meter basis.
Vacancy Rate (%) – The percentage of the inventory (total completed office floor space, classes A, B and C, within the CBD) which is unoc-cupied.
Yield (%) – The average prime yield (or capitalization rate), expressed as a percentage, for a Class A office building within the CBD.
Note: SF = Square Feet
SM = Square Meter
PSF = Per Square Feet
PSM = Per Square Meter
CBD = Central Business District
Glossary

PREMIER FASHION RETAIL CORRIDOR RENTS (US$PSF/YEAR)
www.colliers.com
Related Documents


