“Colleges and universities have never been as important as they are today. Economic competitiveness depends upon a state’s ability to educate and train its citizens and attract and retain talent.” National Governors Association Center For Best Practices The Knowledge Economy

Welcome message from author
This document is posted to help you gain knowledge. Please leave a comment to let me know what you think about it! Share it to your friends and learn new things together.
Transcript

“Colleges and universities have never been as important as they are today. Economic competitiveness depends upon a state’s ability to educate and train its citizens and attract and retain talent.”
National Governors Association Center For Best Practices
The Knowledge Economy
21,600
30,800
35,700
37,600
49,900
59,500
70,400
95,700
Less than HS
HS Diploma
Some College
Associate's
Bachelor's
Master's
Doctorate
Prof. Deg.
Education Earnings
Source: Education Pays 2004, College Board
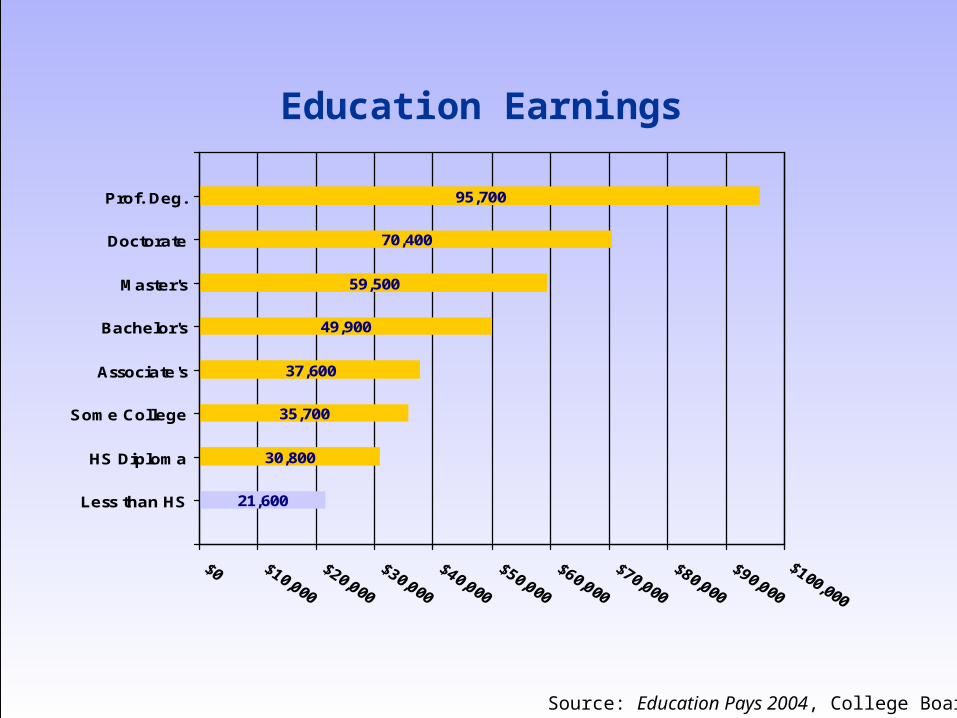
Average Annual Income for Families by Educational Attainment of Householder - 1967 to 2004
Source: Postsecondary Education Opportunity
2004
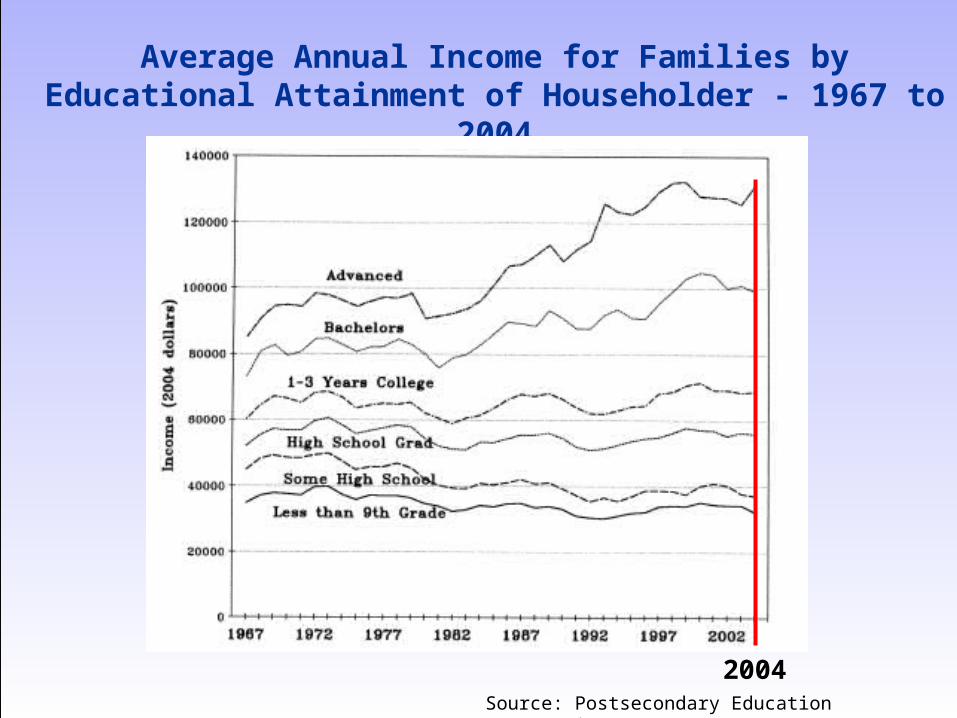
15
12
18
21
20
22
36
18
0 10 20 30 40 50
Total
Work Experience/OJT
Postsecondary vocational certificate
Bachelor's degree
Bachelor's degree plus work experience
Master's degree
Doctorate
Professional degree
Source: Louisiana: Featured Facts, 2005, SREB
Projected Increases in Job Openings by Education or Training Required - United States, 2002 -2012
%
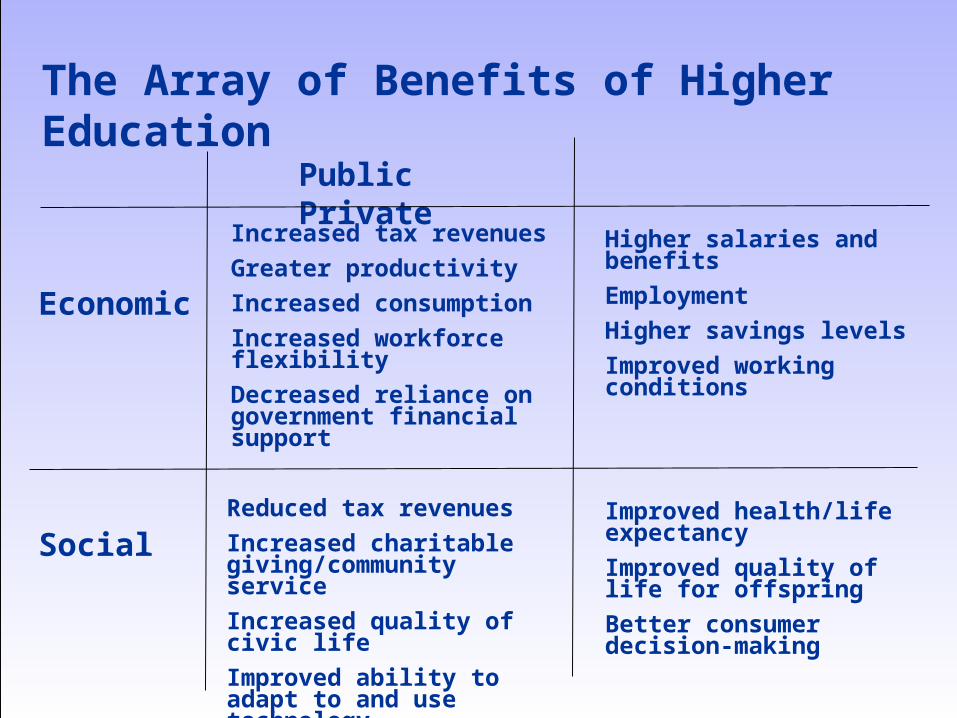
The Array of Benefits of Higher Education
Increased tax revenues
Greater productivity
Increased consumption
Increased workforce flexibility
Decreased reliance on government financial support
Public Private
Economic
SocialReduced tax revenues
Increased charitable giving/community service
Increased quality of civic life
Improved ability to adapt to and use technology
Higher salaries and benefits
Employment
Higher savings levels
Improved working conditions
Improved health/life expectancy
Improved quality of life for offspring
Better consumer decision-making
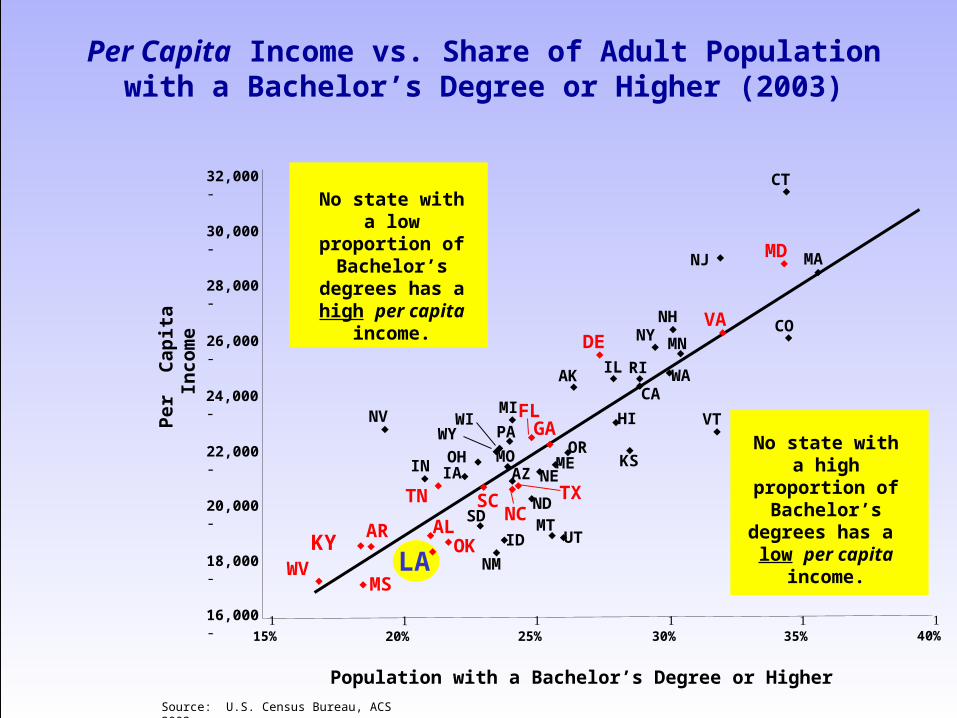
Source: U.S. Census Bureau, ACS 2003
Population with a Bachelor’s Degree or Higher
32,000 -
28,000 -
30,000 -
26,000 -
24,000 -
22,000 -
20,000 -
18,000 -
16,000 - 15%
25%
20%
30%
40%
35%
Per
C
apit
a I
nc
om
e
No state with a low proportion of
Bachelor’s degrees has a high per capita
income.
No state with a high proportion of Bachelor’s
degrees has a low per capita
income.◆
◆ ◆
◆◆ ◆
◆
◆
◆
◆
◆
◆◆
◆
◆◆
◆◆◆
◆
◆◆
◆◆
◆◆
◆
◆
◆◆◆
◆
◆
◆
◆
◆◆
◆◆
◆
◆
◆
◆
◆ ◆
◆
◆ ◆◆
◆
WV
CT
IDARKY
MS
ALOK
LA NM
TN
IN
NV
SDMTND
NCSC TX
AZ
WY
OHIA
UT
FLMI
PAWI
MEOR
GA
MONE
WA
VTHI
KS
VA
CA
IL
DE
AK RI
MN
NHNY
NJ MD MA
CO
Per Capita Income vs. Share of Adult Population with a Bachelor’s Degree or Higher (2003)
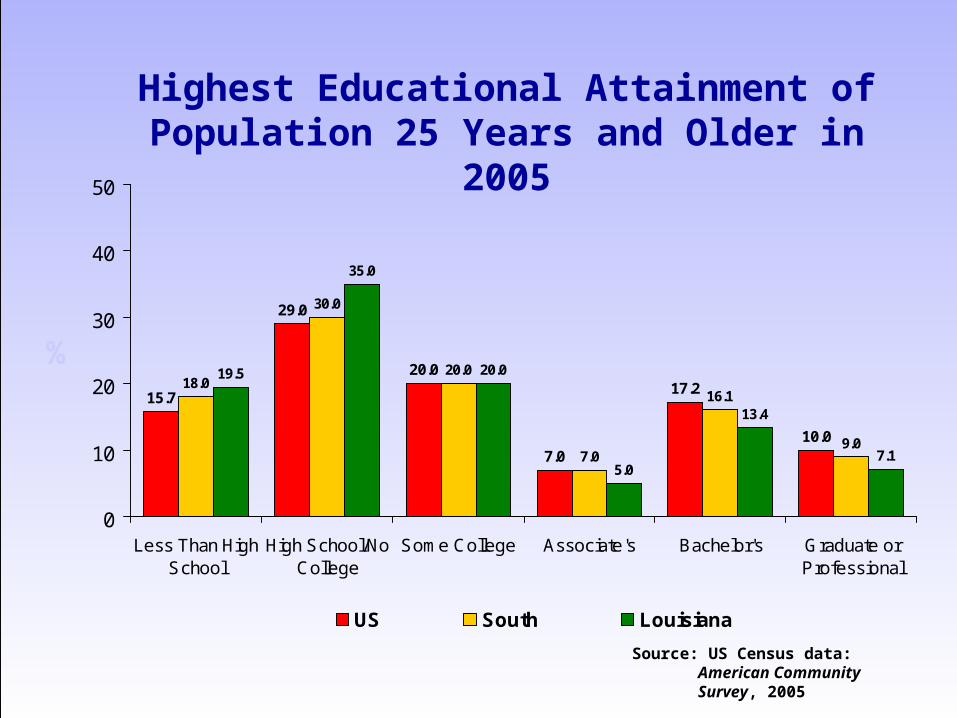
15.7
29.0
20.0
7.0
17.2
10.0
18.0
30.0
20.0
7.09.0
19.5
35.0
20.0
5.07.1
16.113.4
0
10
20
30
40
50
Less Than HighSchool
High School/NoCollege
Some College Associate's Bachelor's Graduate orProfessional
US South Louisiana
Source: US Census data: American Community Survey, 2005
Highest Educational Attainment of Population 25 Years and Older in 2005
%
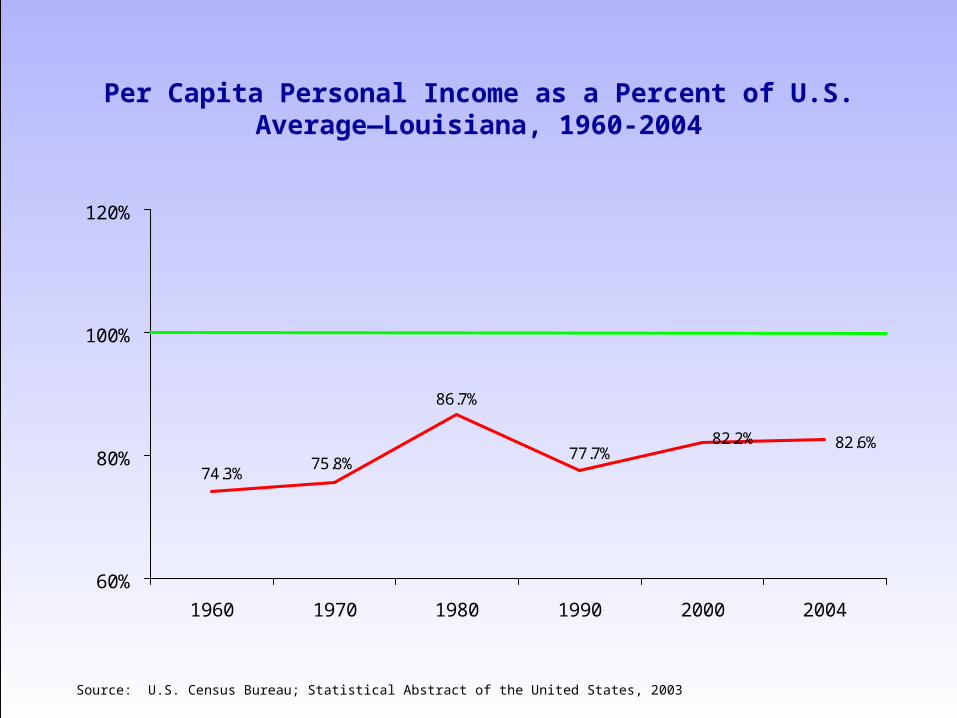
Per Capita Personal Income as a Percent of U.S. Average—Louisiana, 1960-2004
Source: U.S. Census Bureau; Statistical Abstract of the United States, 2003
82.6%82.2%
74.3%77.7%
86.7%
75.8%
60%
80%
100%
120%
1960 1970 1980 1990 2000 2004
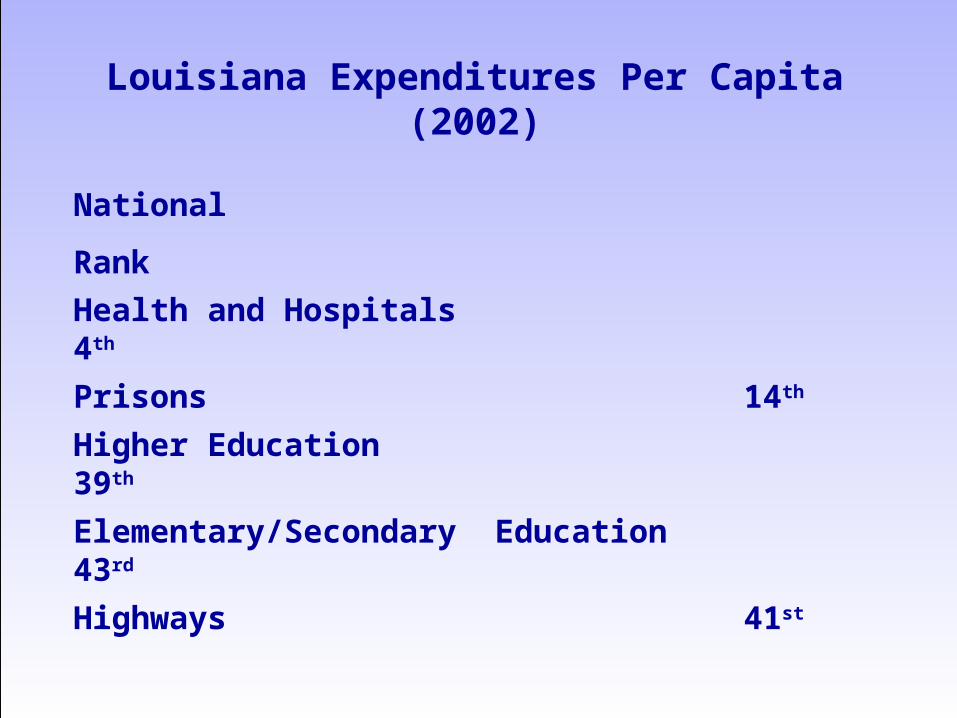
Louisiana Expenditures Per Capita (2002)
National Rank
Health and Hospitals 4th
Prisons 14th
Higher Education 39th
Elementary/Secondary Education 43rd
Highways 41st

“To close the economic gap, Louisiana must close the education gap.”
Source: Miles to Go, Southern Education Foundation (2006)

Main Points:
• The economy is rapidly changing.
• Economic prosperity (employment opportunity, competitive salaries, progressive public investments) is dependent on knowledge-based jobs.
The Issue:
Louisiana’s ability to compete in this economic environment demands ever larger numbers of highly-trained and educated workers.

Recent Progress
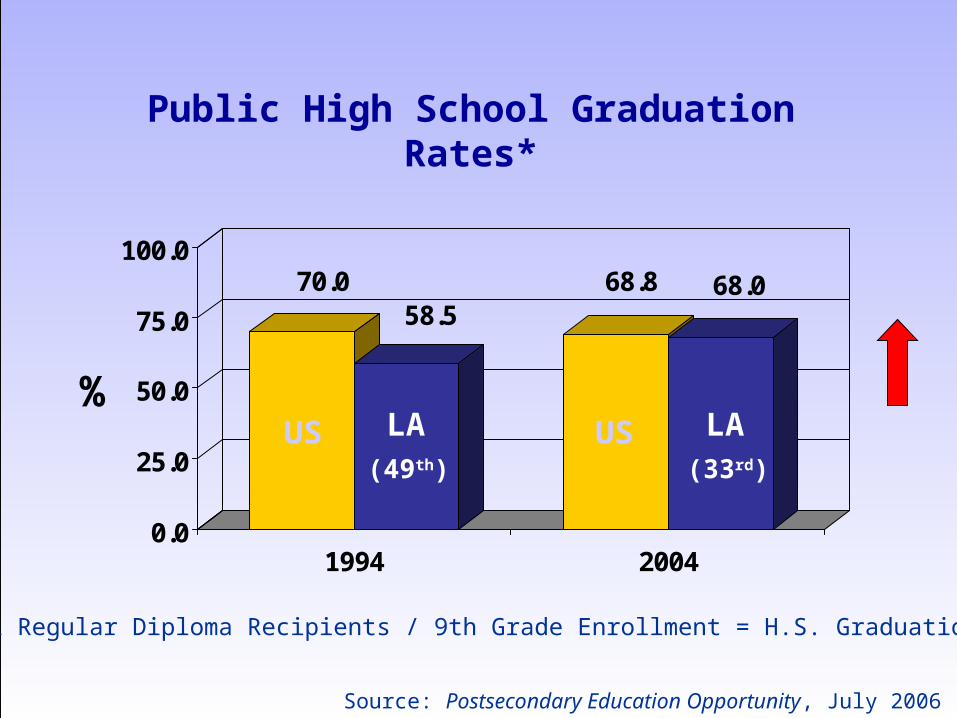
Public High School Graduation Rates*
70.058.5
68.8 68.0
0.0
25.0
50.0
75.0
100.0
1994 2004
%US LA US LA
(49th)
Source: Postsecondary Education Opportunity, July 2006
*Total Regular Diploma Recipients / 9th Grade Enrollment = H.S. Graduation Rate
(33rd)
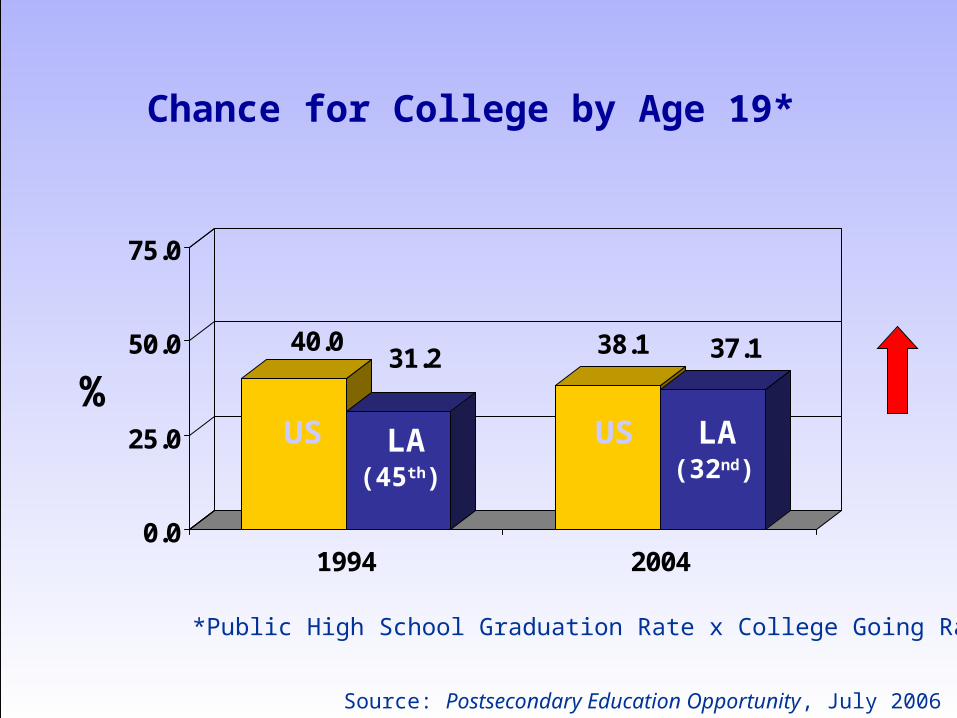
40.031.2 38.1 37.1
0.0
25.0
50.0
75.0
1994 2004
%US LA US LA
(45th)
Source: Postsecondary Education Opportunity, July 2006
Chance for College by Age 19*
*Public High School Graduation Rate x College Going Rate
(32nd)
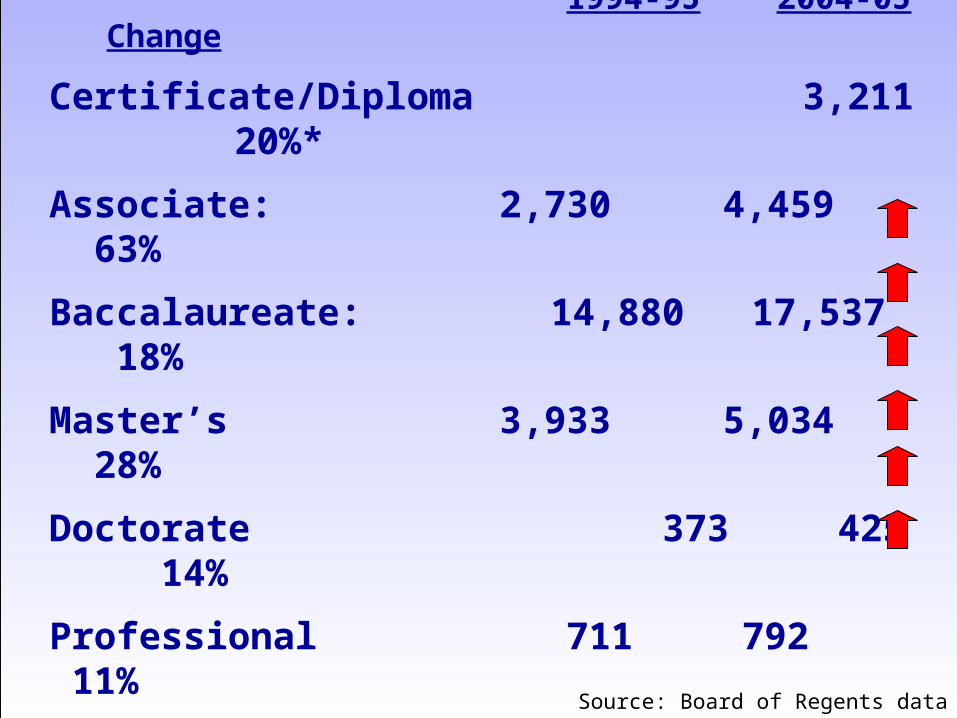
Degrees Awarded
1994-95 2004-05 Change
Certificate/Diploma 3,211 20%*
Associate: 2,730 4,459 63%
Baccalaureate: 14,880 17,537 18%
Master’s 3,933 5,034 28%
Doctorate 373 425 14%
Professional 711 792 11%
*LTC data were incorporated in 2003. The increase in certificates/diplomas awarded is for the two-year period 2003-2005.
Source: Board of Regents data
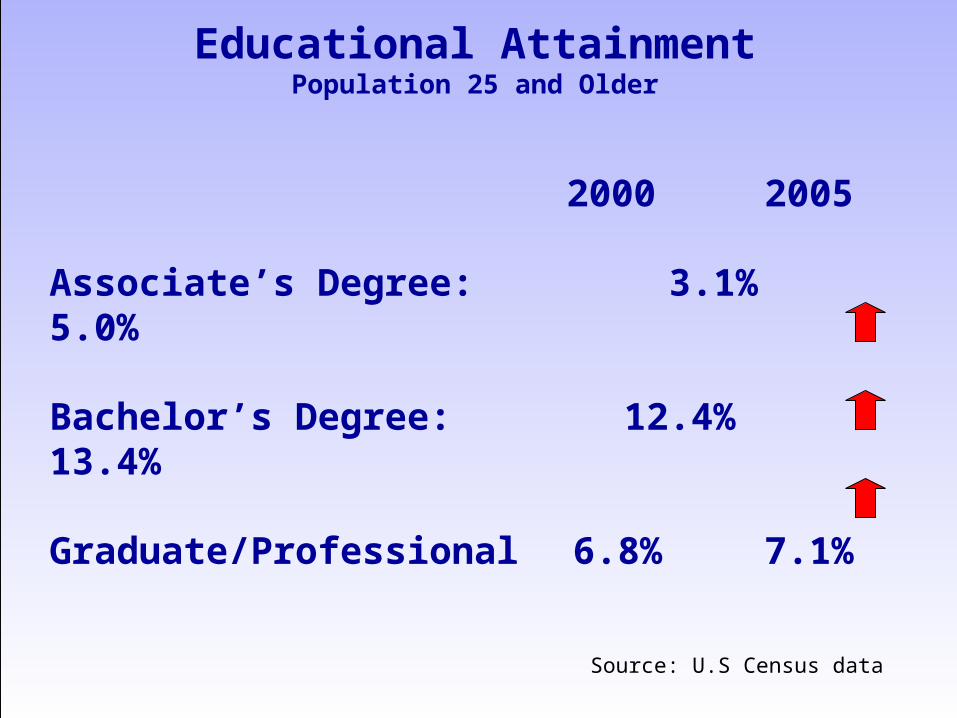
Educational AttainmentPopulation 25 and Older
2000 2005
Associate’s Degree: 3.1% 5.0%
Bachelor’s Degree: 12.4% 13.4%
Graduate/Professional 6.8% 7.1%
Source: U.S Census data
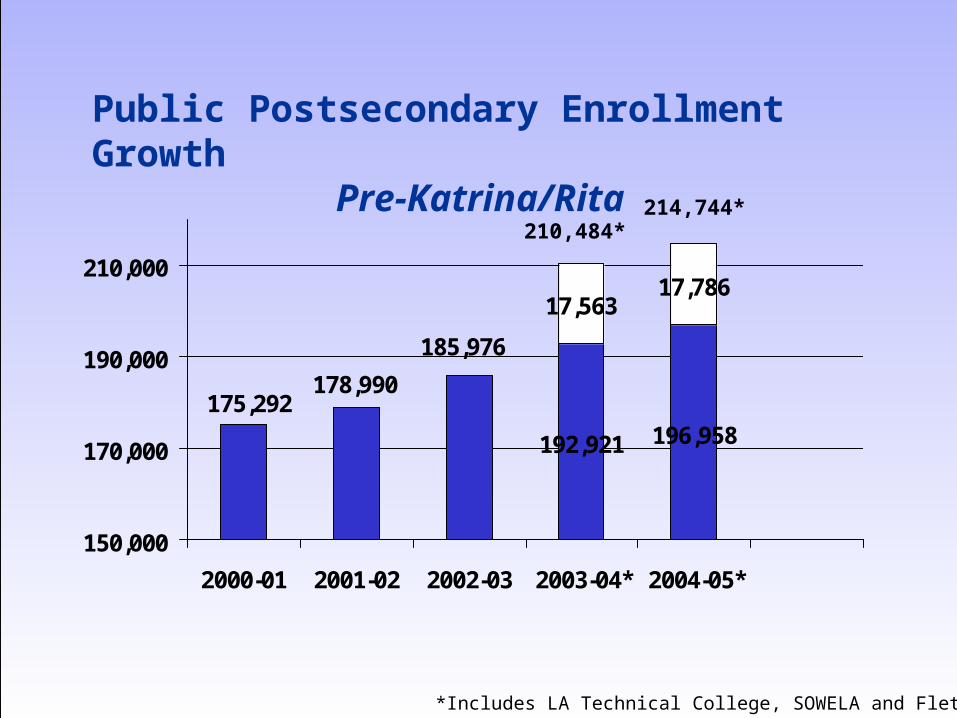
Public Postsecondary Enrollment GrowthPre-Katrina/Rita
*Includes LA Technical College, SOWELA and Fletcher
17,56317,786
192,921 196,958
185,976
178,990175,292
150,000
170,000
190,000
210,000
2000-01 2001-02 2002-03 2003-04* 2004-05*
210,484*214,744*
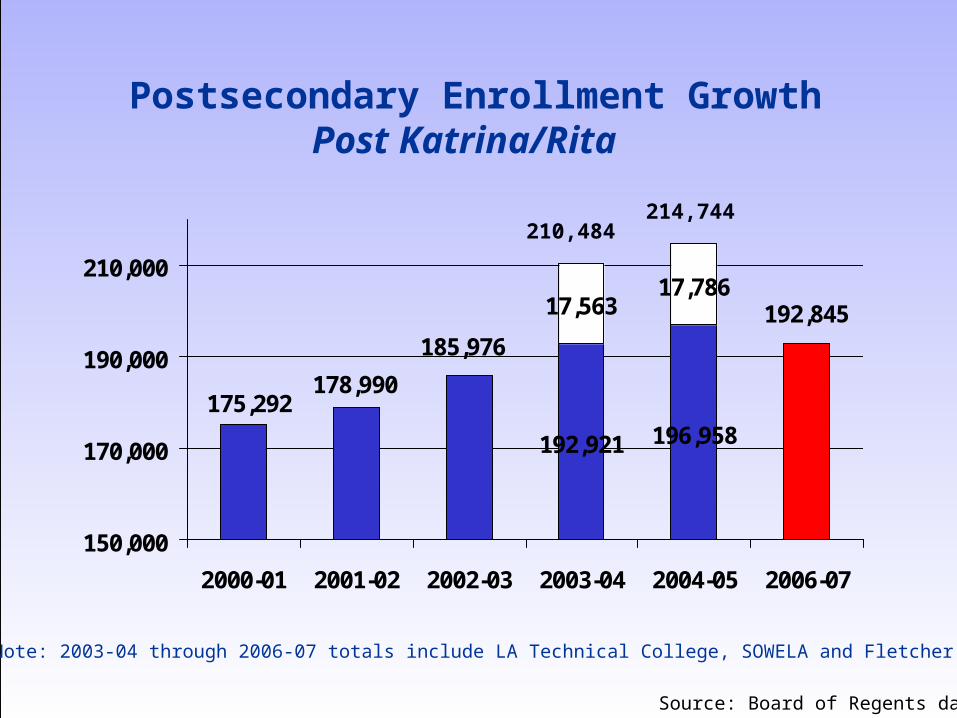
Postsecondary Enrollment GrowthPost Katrina/Rita
Note: 2003-04 through 2006-07 totals include LA Technical College, SOWELA and Fletcher
17,56317,786
192,845
192,921 196,958
185,976
178,990175,292
150,000
170,000
190,000
210,000
2000-01 2001-02 2002-03 2003-04 2004-05 2006-07
210,484214,744
Source: Board of Regents data
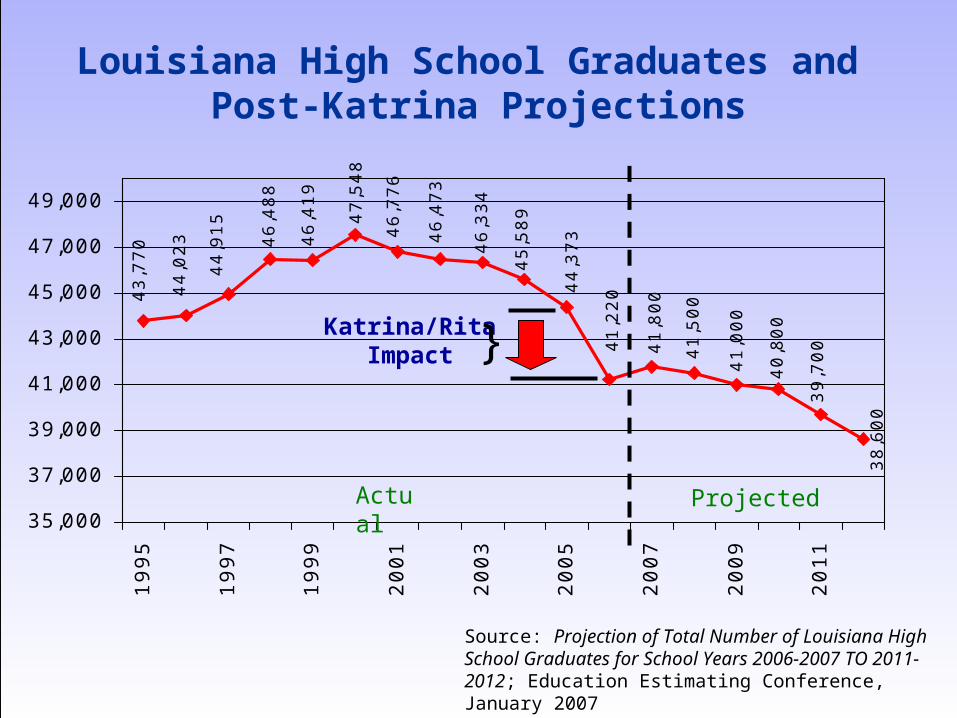
Louisiana High School Graduates and Post-Katrina Projections
38,600
39,700
40,800
41,000
41,500
41,80044,373
41,220
45,589
46,334
46,473
46,776
47,548
46,419
46,488
44,915
44,023
43,770
35,000
37,000
39,000
41,000
43,000
45,000
47,000
49,000
1995
1997
1999
2001
2003
2005
2007
2009
2011
Source: Projection of Total Number of Louisiana High School Graduates for School Years 2006-2007 TO 2011-2012; Education Estimating Conference, January 2007
Actual Projected
Katrina/RitaImpact }
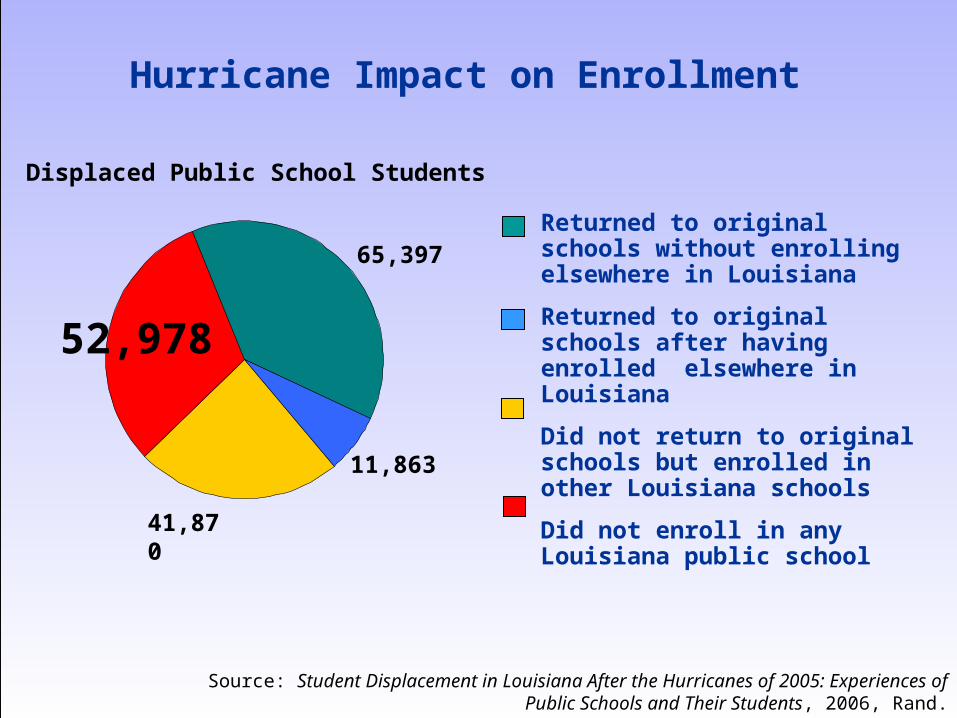
Hurricane Impact on Enrollment
Source: Student Displacement in Louisiana After the Hurricanes of 2005: Experiences of Public Schools and Their Students, 2006, Rand.
Returned to original schools without enrolling elsewhere in Louisiana
Returned to original schools after having enrolled elsewhere in Louisiana
Did not return to original schools but enrolled in other Louisiana schools
Did not enroll in any Louisiana public school
65,397
11,863
41,870
52,978
Displaced Public School Students

To recover and improve economically, Louisiana must expand the participation of our remaining population in higher education:
• Traditional Pathway
• Non-traditional Pathway
“The data make it very clear that the largest pool of potential college students is the population of low- and moderate-income youth who do not complete high school college-qualified.”
Postsecondary Education Opportunity, March 2007
“The federal Advisory Committee on Student Financial Assistance estimates that cost factors prevent 22 percent of college-qualified high school graduates from attending college.”
Empty Promises: The Myth of College Access in America, Advisory Committee on Student Financial Assistance, 2002
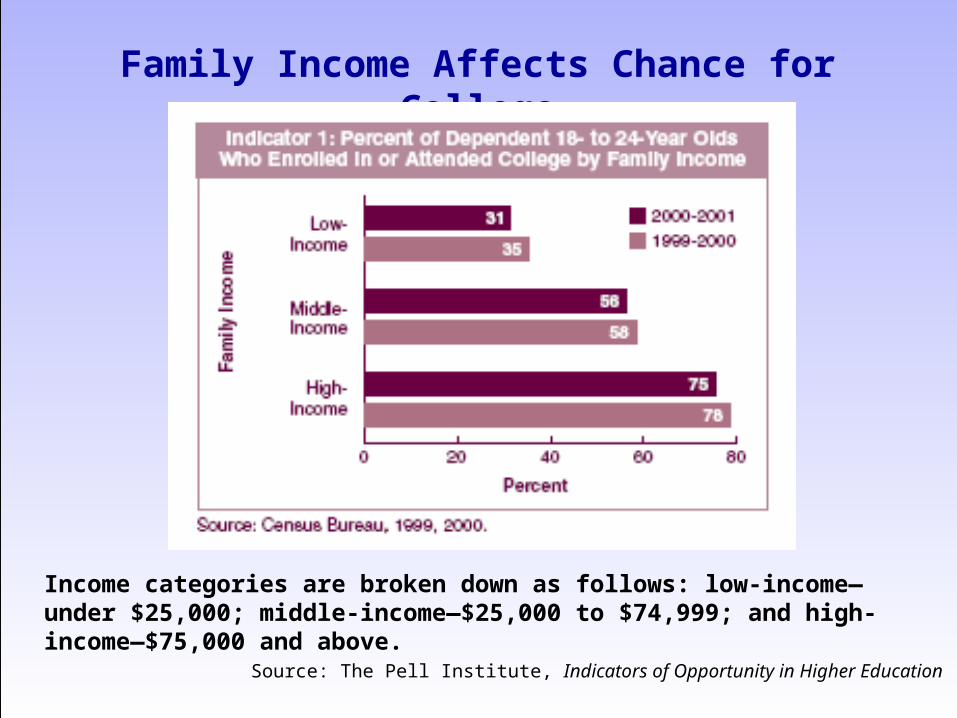
Family Income Affects Chance for College
Source: The Pell Institute, Indicators of Opportunity in Higher Education
Income categories are broken down as follows: low-income—under $25,000; middle-income—$25,000 to $74,999; and high-income—$75,000 and above.
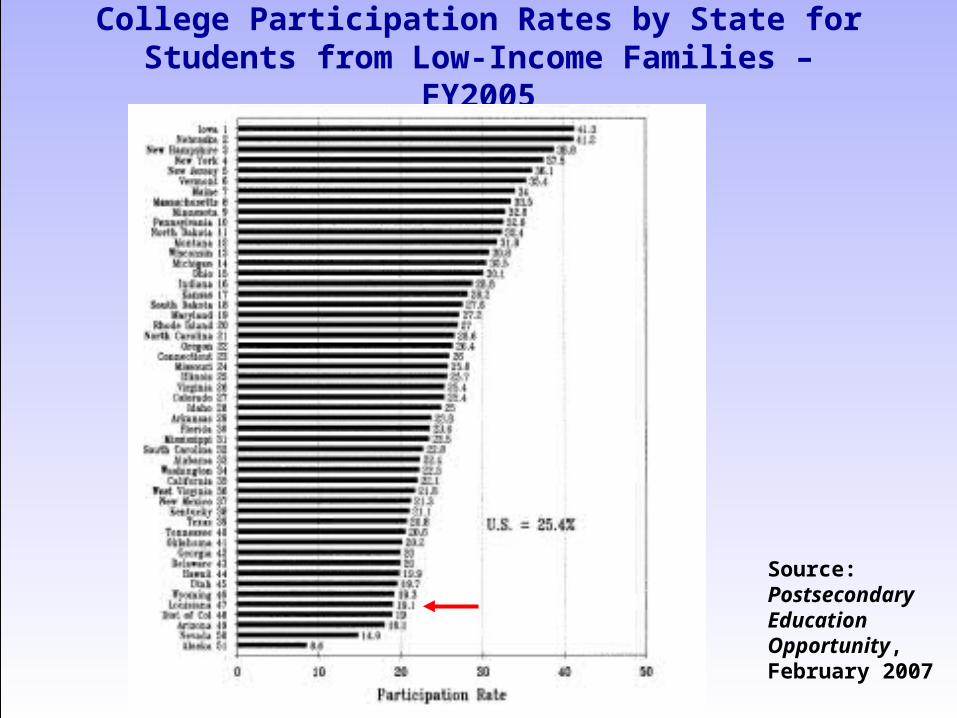
College Participation Rates by State for Students from Low-Income Families – FY2005
Source: Postsecondary Education Opportunity, February 2007
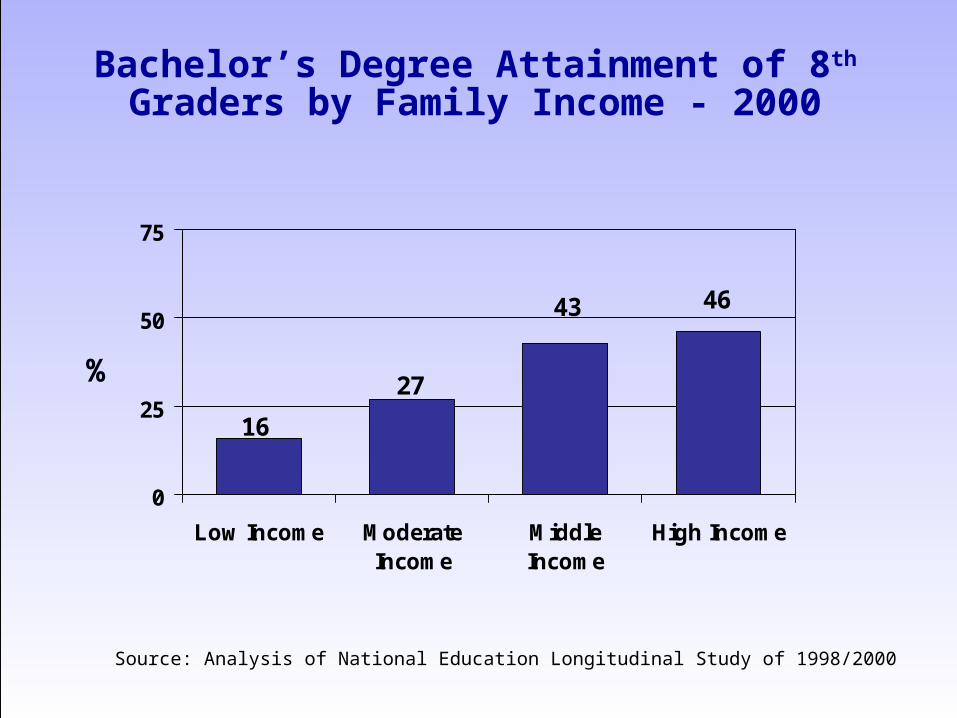
Bachelor’s Degree Attainment of 8th Graders by Family Income - 2000
%
16
4643
27
0
25
50
75
Low Income ModerateIncome
MiddleIncome
High Income
Source: Analysis of National Education Longitudinal Study of 1998/2000
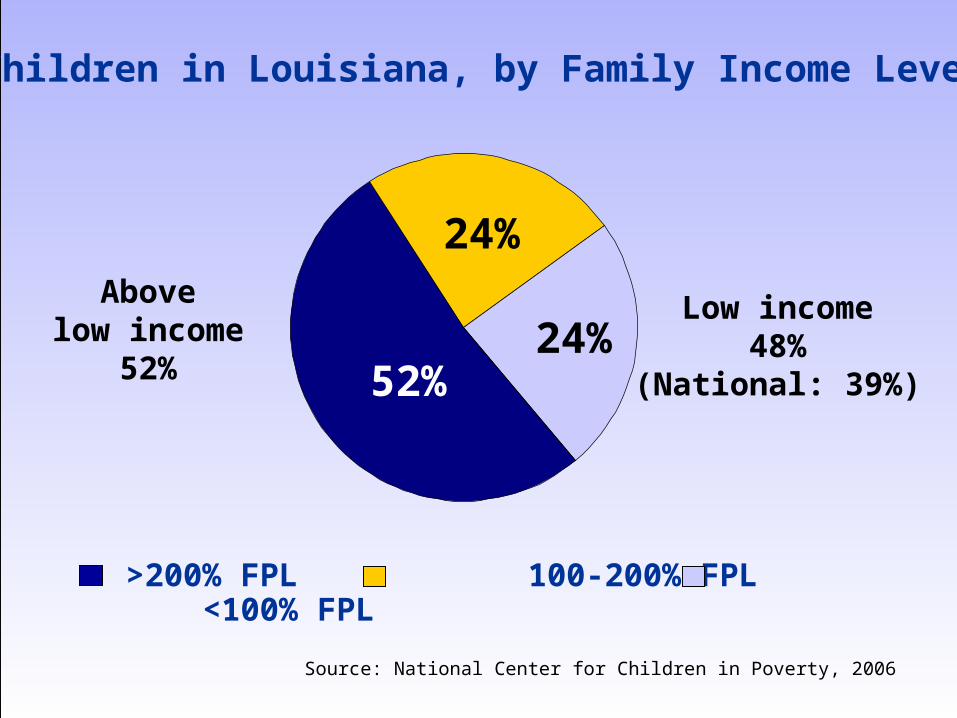
Children in Louisiana, by Family Income Level
Source: National Center for Children in Poverty, 2006
>200% FPL 100-200% FPL <100% FPL
24%
24%52%
Abovelow income
52%
Low income48%
(National: 39%)
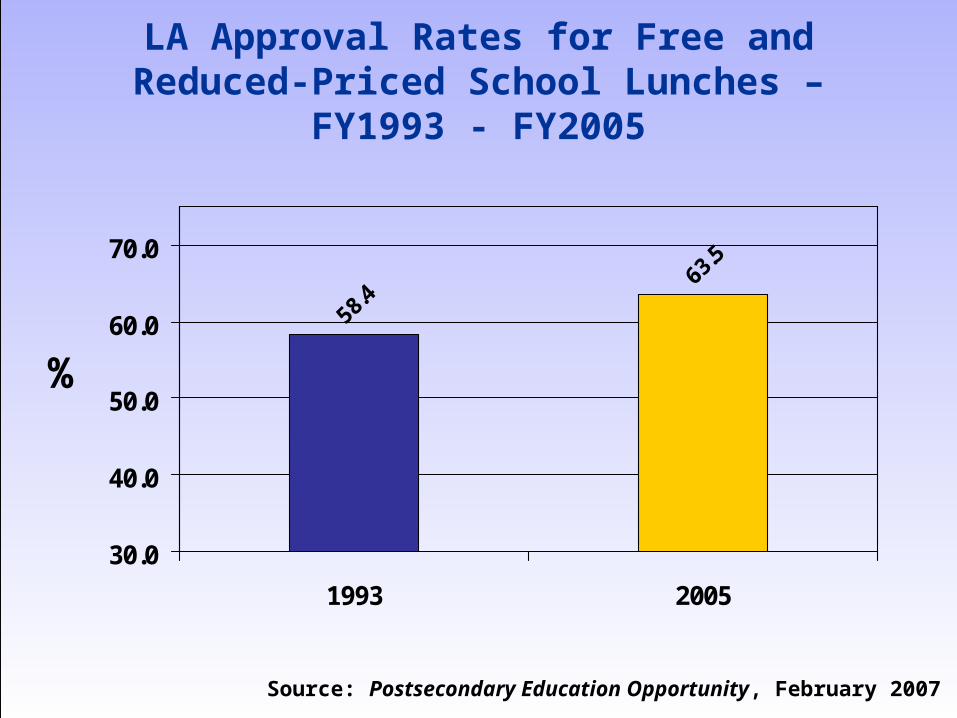
LA Approval Rates for Free and Reduced-Priced School Lunches – FY1993 - FY2005
30.0
40.0
50.0
60.0
70.0
1993 2005
%
Source: Postsecondary Education Opportunity, February 2007
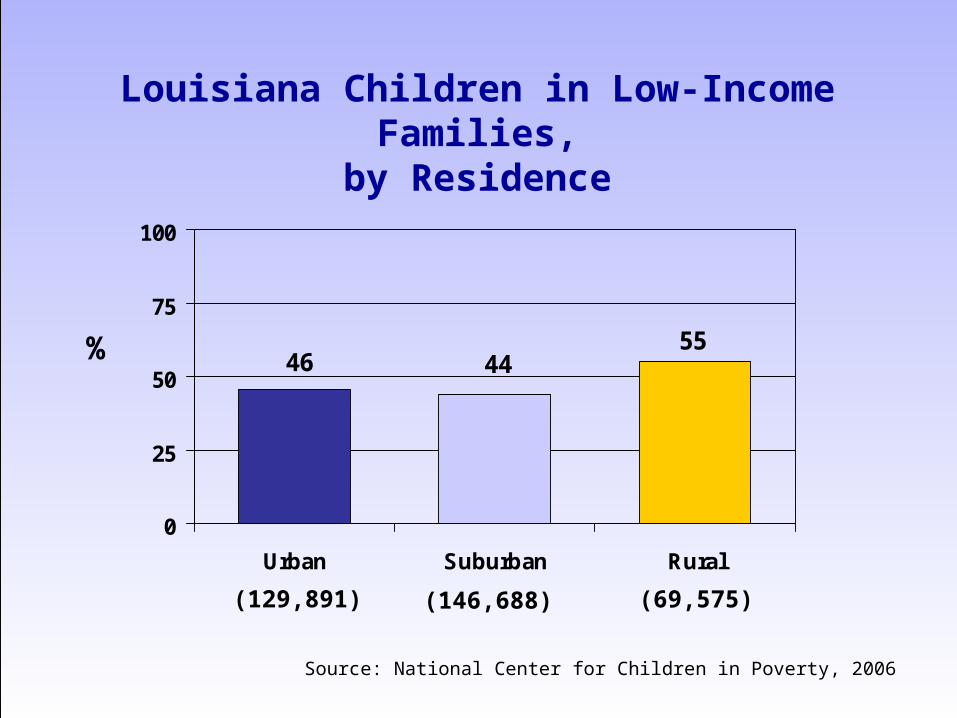
Louisiana Children in Low-Income Families,by Residence
% 4655
44
0
25
50
75
100
Urban Suburban Rural
(129,891) (146,688) (69,575)
Source: National Center for Children in Poverty, 2006
Primary obstacles to access and success for low- and moderate-income students:
– Inadequate academic preparation
– Insufficient information, guidance and encouragement
– Unmet financial need
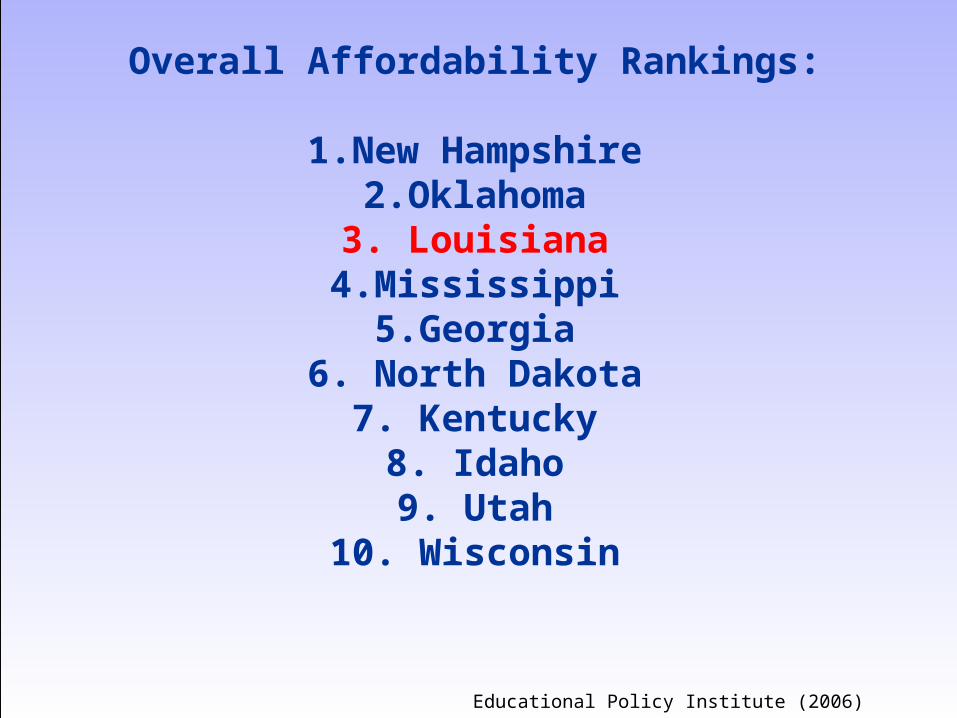
Overall Affordability Rankings:
1.New Hampshire2.Oklahoma3. Louisiana4.Mississippi
5.Georgia6. North Dakota
7. Kentucky8. Idaho9. Utah
10. Wisconsin
Educational Policy Institute (2006)

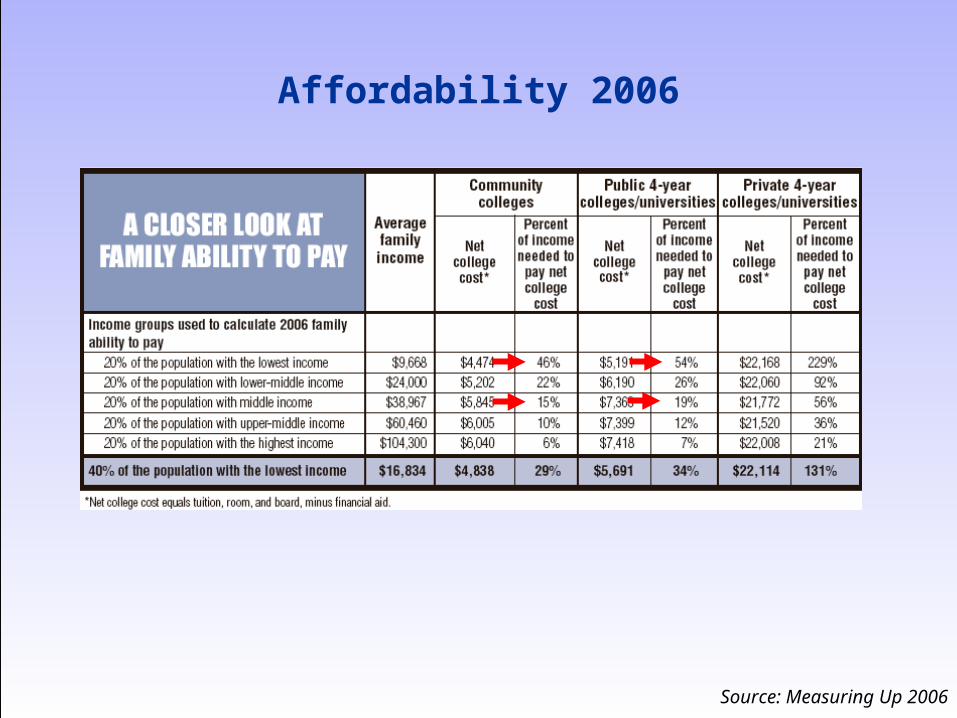
Affordability 2006
Source: Measuring Up 2006
Affordability 2006
Source: Measuring Up 2006

Adults

Louisiana Adult Participation in Postsecondary Education
– 2.3% of working population (47th)
Source: National Center for Public Policy and Higher Education
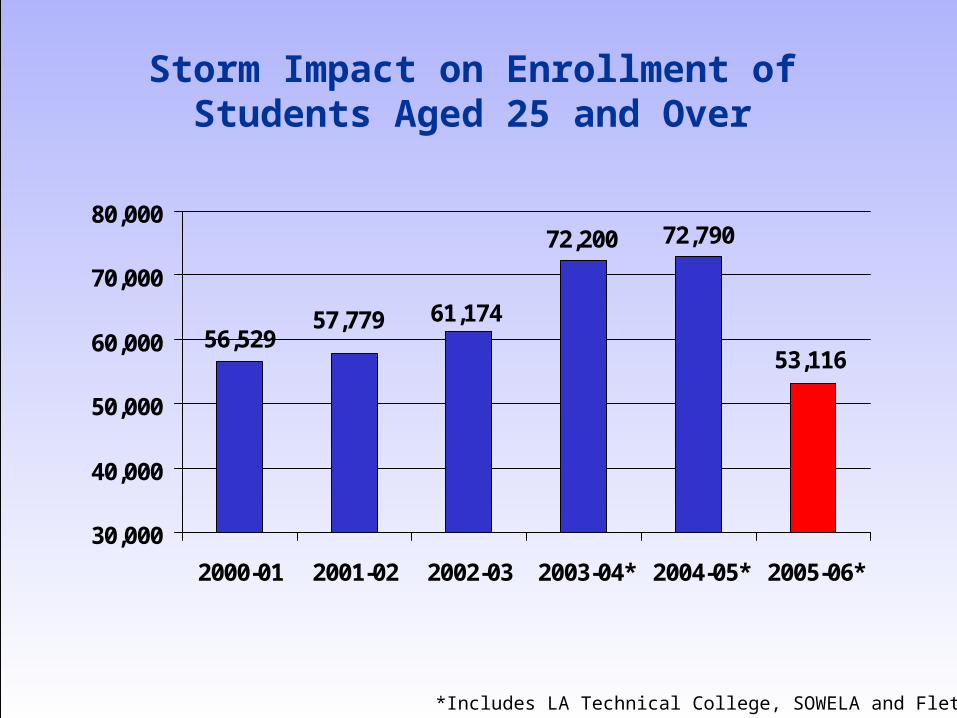
Storm Impact on Enrollment of Students Aged 25 and Over
53,116
72,200 72,790
61,17457,77956,529
30,000
40,000
50,000
60,000
70,000
80,000
2000-01 2001-02 2002-03 2003-04* 2004-05* 2005-06*
*Includes LA Technical College, SOWELA and Fletcher

Loan Debt
Student Loan Debt
“At public universities, debt levels for graduating seniors with student loans has more than doubled in the past decade.”
Project on Student Debt, National Center for Education Statistics (NCES), 2006
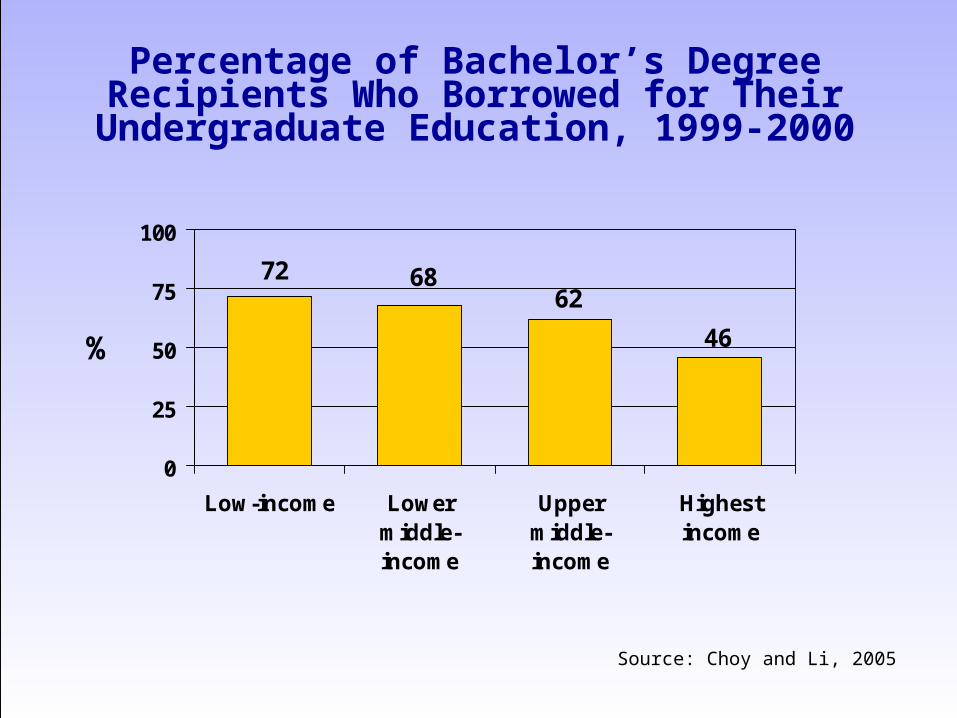
Percentage of Bachelor’s Degree Recipients Who Borrowed for Their Undergraduate
Education, 1999-2000
%
72
46
6268
0
25
50
75
100
Low-income Lowermiddle-income
Uppermiddle-income
Highestincome
Source: Choy and Li, 2005
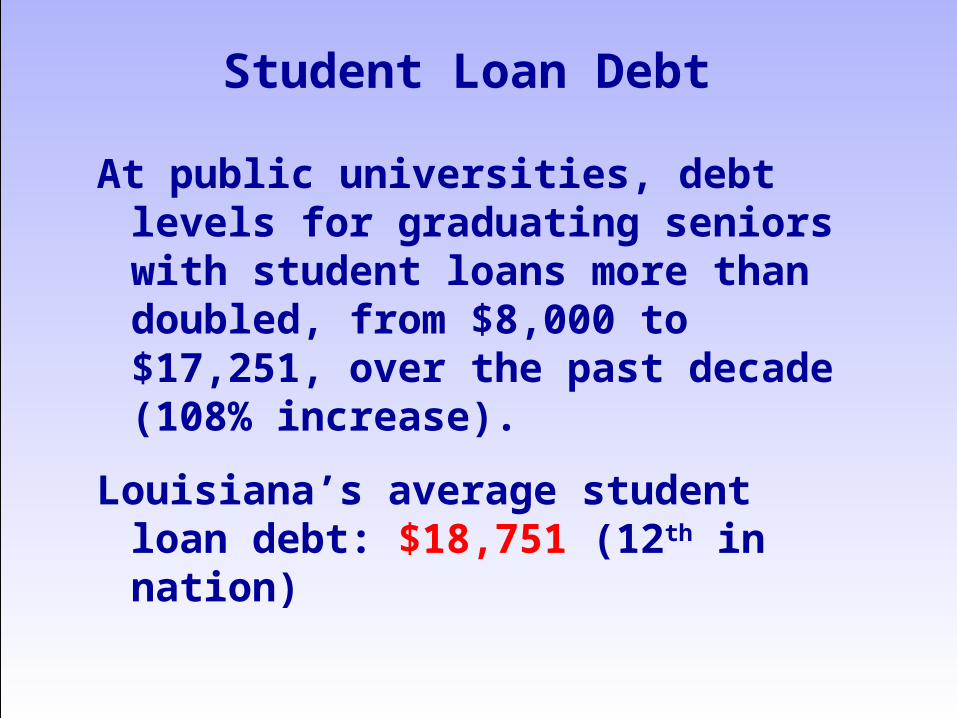
Student Loan Debt
At public universities, debt levels for graduating seniors with student loans more than doubled, from $8,000 to $17,251, over the past decade (108% increase).
Louisiana’s average student loan debt: $18,751 (12th in nation)
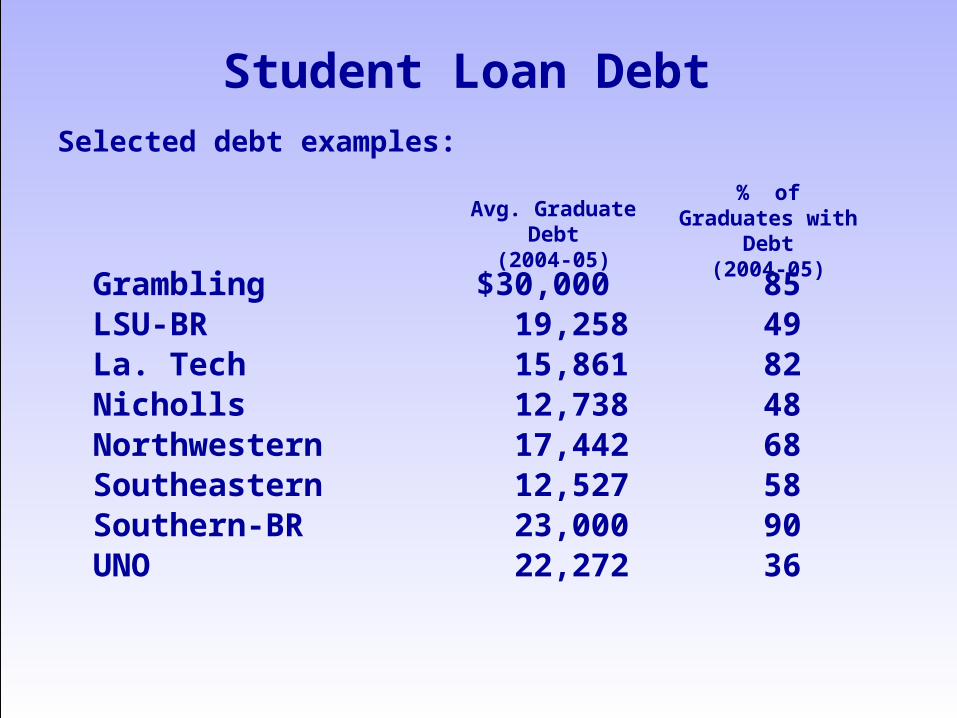
Student Loan DebtSelected debt examples:
Grambling $30,000 85LSU-BR 19,258 49La. Tech 15,861 82Nicholls 12,738 48Northwestern 17,442 68Southeastern 12,527 58Southern-BR 23,000 90UNO 22,272 36
Avg. Graduate Debt(2004-05)
% of Graduates with Debt(2004-05)

“The most efficient way for a state to expand access to postsecondary education is to increase its investment in need-based grant aid.”
Expanding College Access: The Impact of State Finance Strategies, Lumina (2004)
“Need-based grants have a positive association with high school graduation rates and a substantial positive influence on college enrollment rates.”
Perne and Titus (2002)
“Lack of financial aid is one of the major barriers preventing low-wage workers from enrolling in and successfully completing postsecondary education.”
Lumina Foundation for Education
“Low-income adults receive less overall financial assistance and fewer grants than tradition-age students…Yet the majority of state financial aid policies are also not well suited for adult workers.
Workforce Strategy Center, December 2006
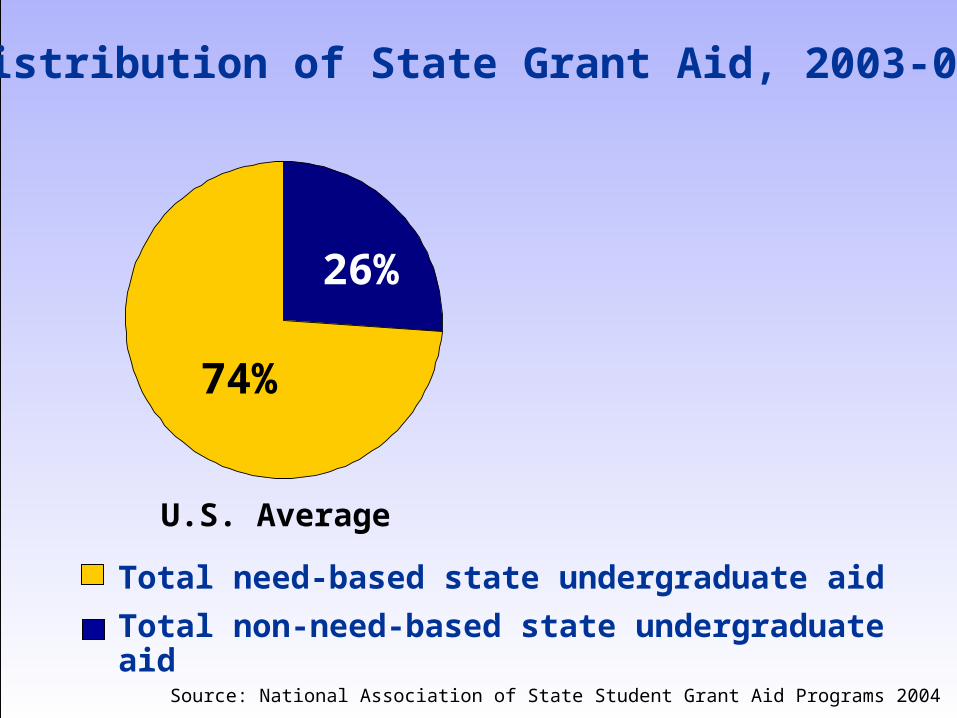
Distribution of State Grant Aid, 2003-04
Source: National Association of State Student Grant Aid Programs 2004
Total need-based state undergraduate aid
Total non-need-based state undergraduate aid
26%
74%
U.S. Average
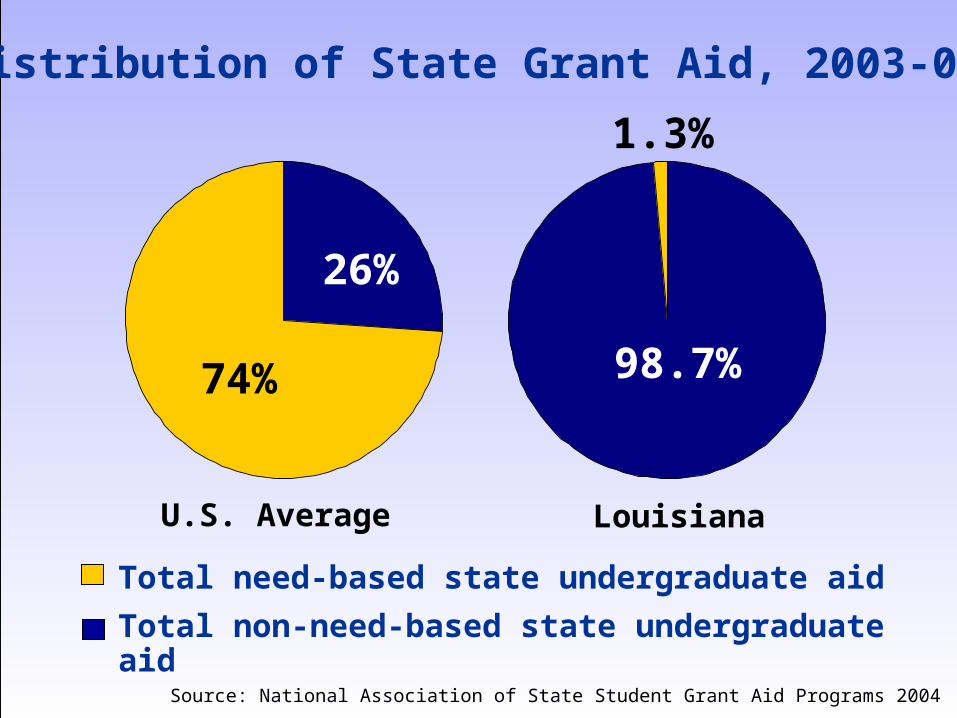
Distribution of State Grant Aid, 2003-04
Source: National Association of State Student Grant Aid Programs 2004
Total need-based state undergraduate aid
Total non-need-based state undergraduate aid
24%26%
74%
LouisianaU.S. Average
98.7%
1.3%

Undergraduate Grant Dollars/FTEState Rankings
Louisiana
Merit-Based: $640 – 13th
Need-Based: $8 – 47th
Source: USDOE, National Center for Educational Statistics (NCES) Integrated Postsecondary Data System (IPEDS), 2004

Louisiana Need Based Financial Assistance Program for Low-
and Moderate-Income Students
Louisiana “GO Grant”
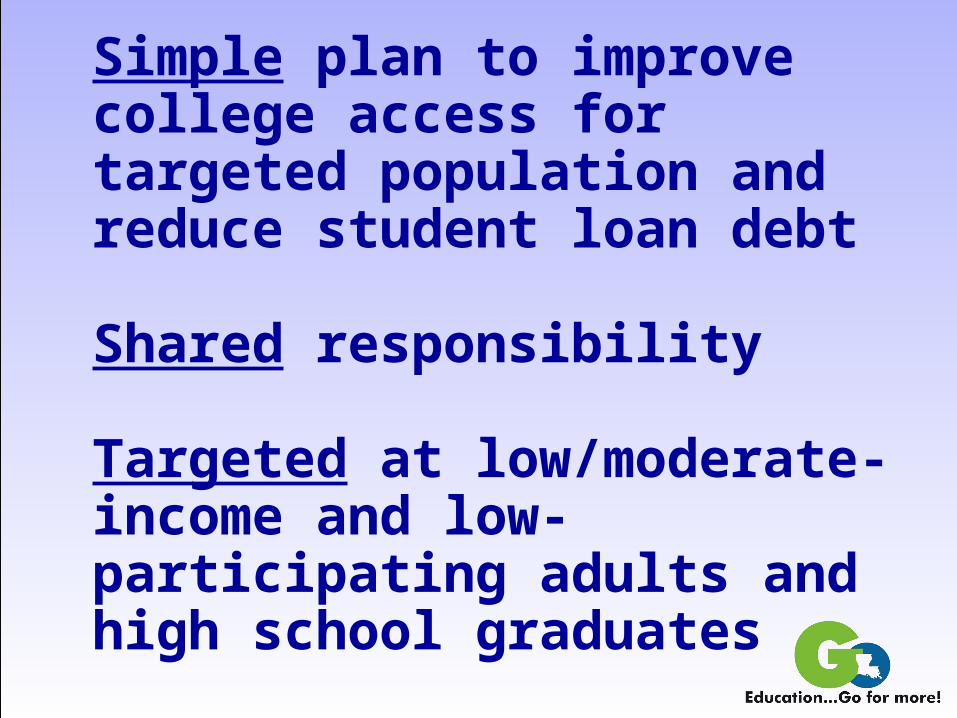
Simple plan to improve college access for targeted population and reduce student loan debt
Shared responsibility
Targeted at low/moderate-income and low-participating adults and high school graduates

Eligibility Criteria
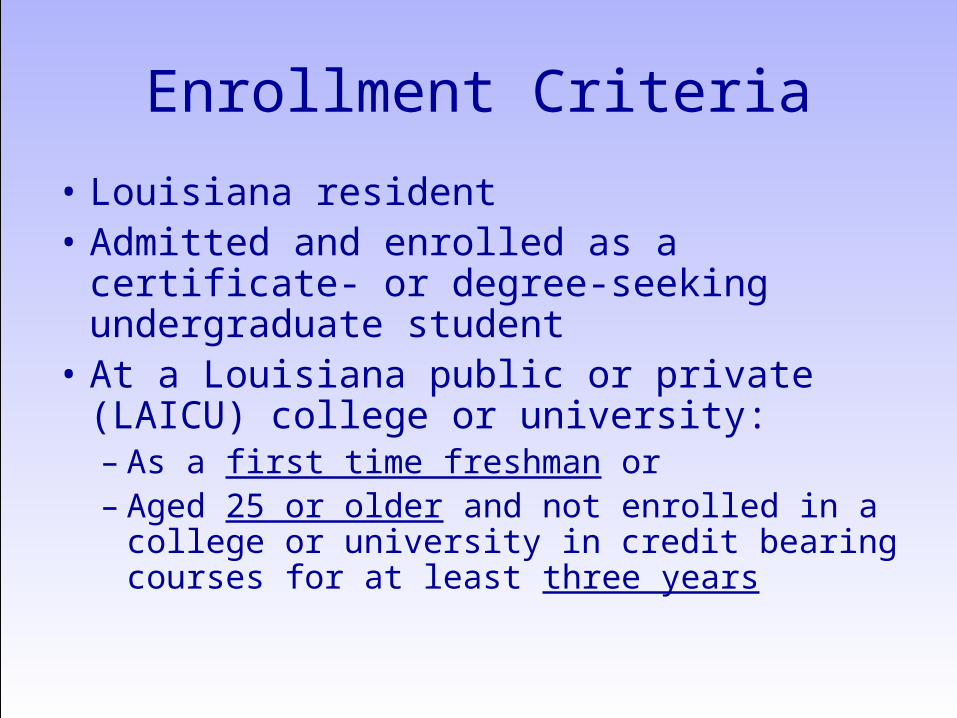
Enrollment Criteria
• Louisiana resident• Admitted and enrolled as a certificate- or
degree-seeking undergraduate student• At a Louisiana public or private (LAICU)
college or university:– As a first time freshman or– Aged 25 or older and not enrolled in a college
or university in credit bearing courses for at least three years
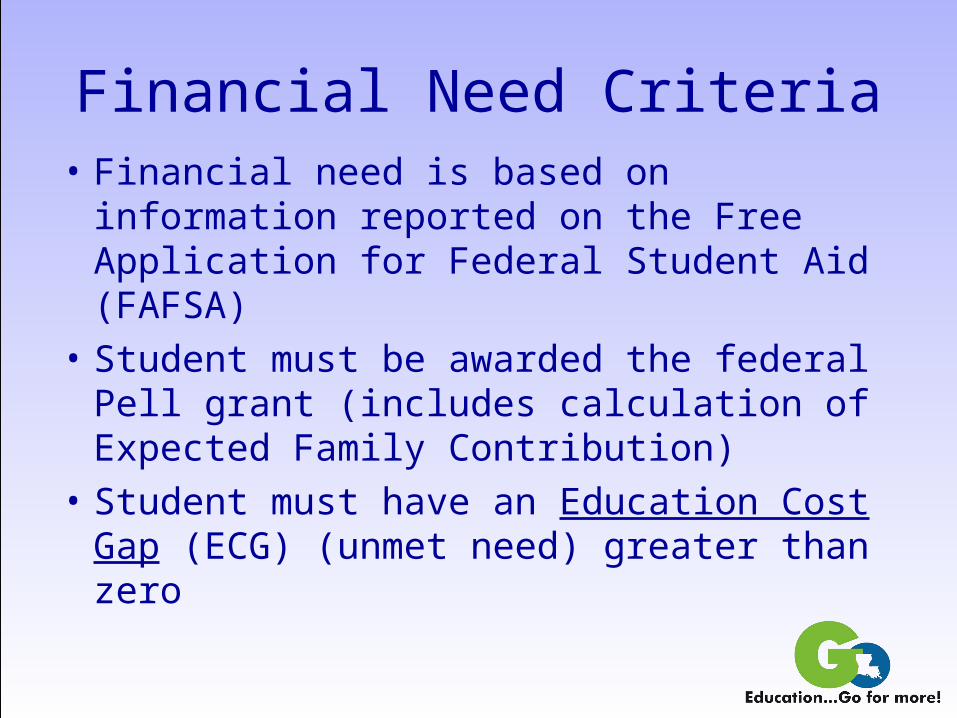
Financial Need Criteria• Financial need is based on information
reported on the Free Application for Federal Student Aid (FAFSA)
• Student must be awarded the federal Pell grant (includes calculation of Expected Family Contribution)
• Student must have an Education Cost Gap (ECG) (unmet need) greater than zero
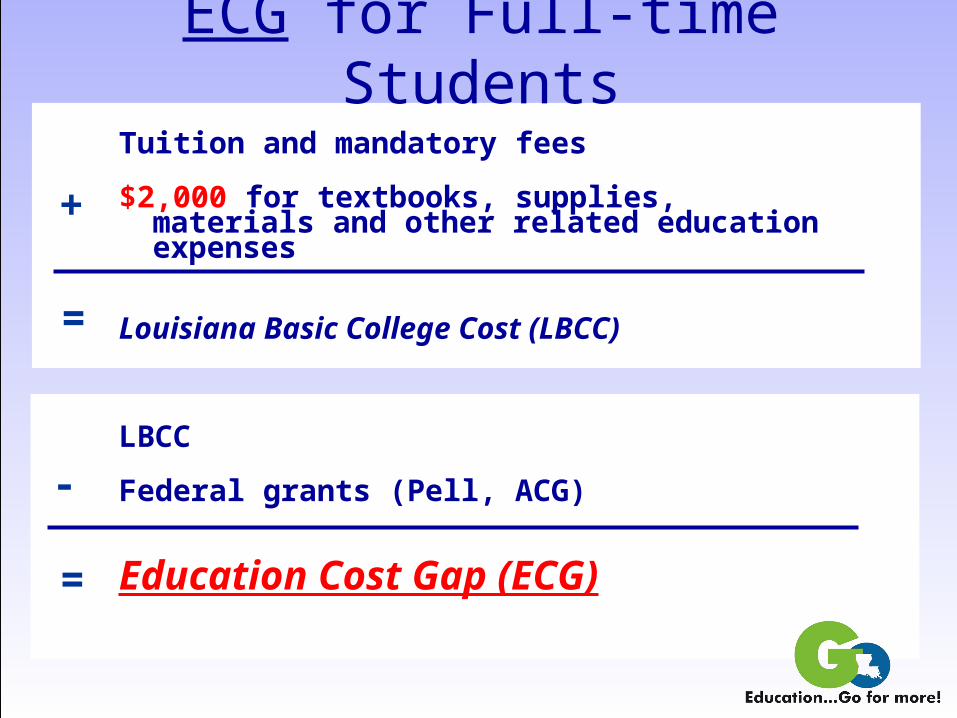
ECG for Full-time Students
Tuition and mandatory fees
$2,000 for textbooks, supplies, materials and other related education expenses
Louisiana Basic College Cost (LBCC)
LBCC
Federal grants (Pell, ACG)
Education Cost Gap (ECG)
+
-
=
=
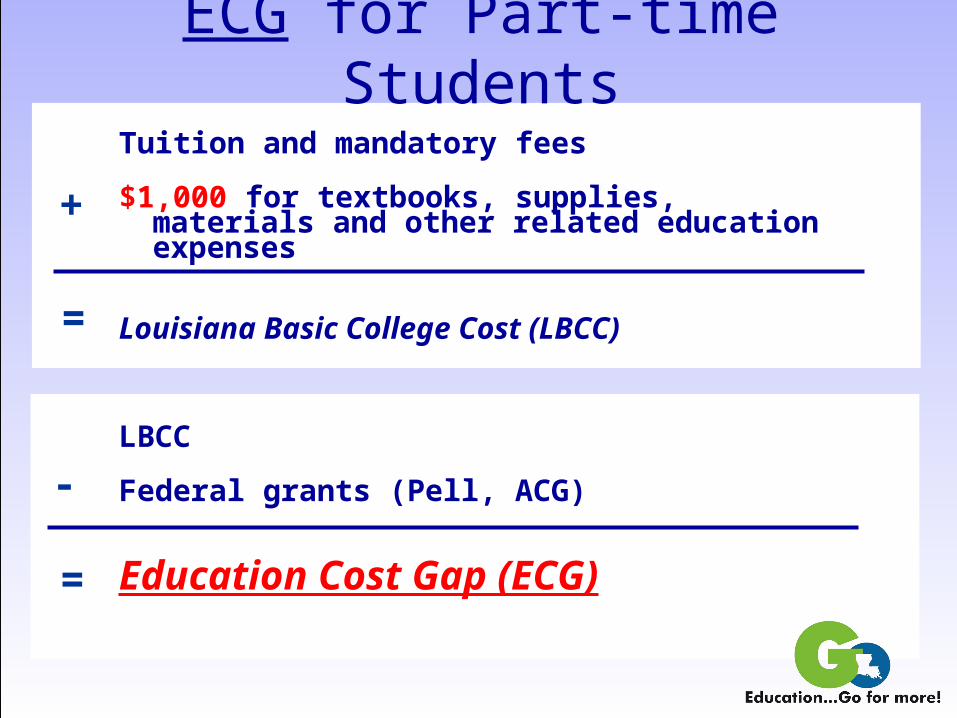
ECG for Part-time Students
Tuition and mandatory fees
$1,000 for textbooks, supplies, materials and other related education expenses
Louisiana Basic College Cost (LBCC)
LBCC
Federal grants (Pell, ACG)
Education Cost Gap (ECG)
+
-
=
=
Award Amount
• Annual award of – $2,000 for fulltime students– $1,000 for part-time students

Renewal Eligibility Criteria
• Student eligibility will be reevaluated annually, using the ECG formula, for students with continued Pell eligibility who meet satisfactory academic progress (consistent with federal guidelines)
Projections
• Approximately 10,000 eligible first-time freshmen– 25% of incoming class
• Additional 1,000 students (estimated) aged 25 and older who have been out of school 3 years
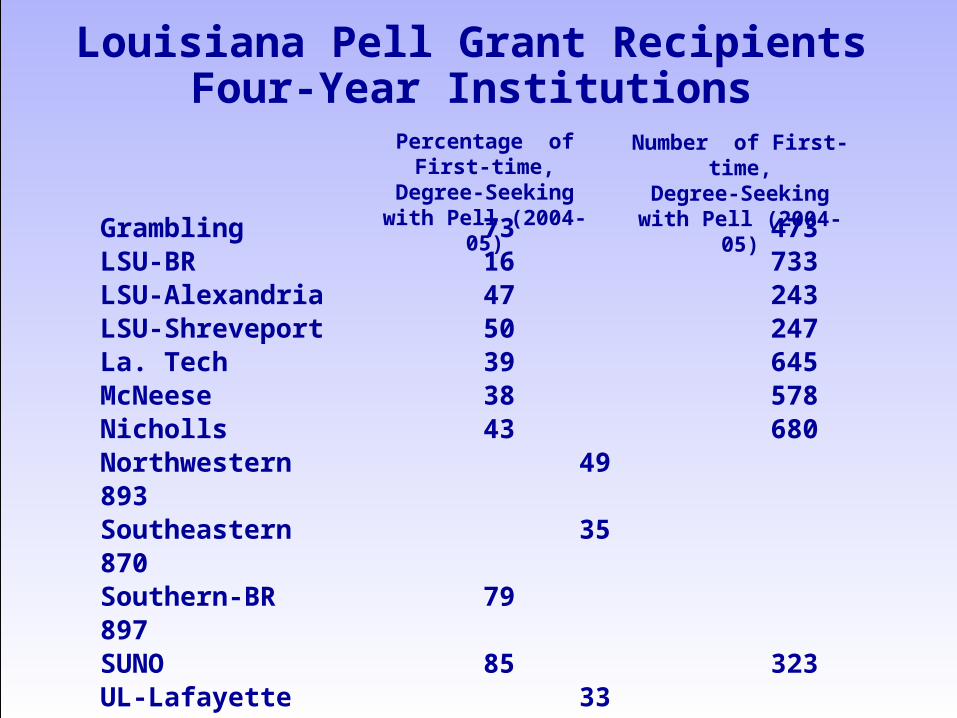
Louisiana Pell Grant RecipientsFour-Year Institutions
Grambling 73 473LSU-BR 16 733LSU-Alexandria 47 243LSU-Shreveport 50 247La. Tech 39 645McNeese 38 578Nicholls 43 680Northwestern 49 893Southeastern 35 870Southern-BR 79 897SUNO 85 323UL-Lafayette 33 865UL-Monroe 46 644UNO 60 1137
Percentage of First-time, Degree-Seeking
with Pell (2004-05)
Number of First-time,Degree-Seeking
with Pell (2004-05)
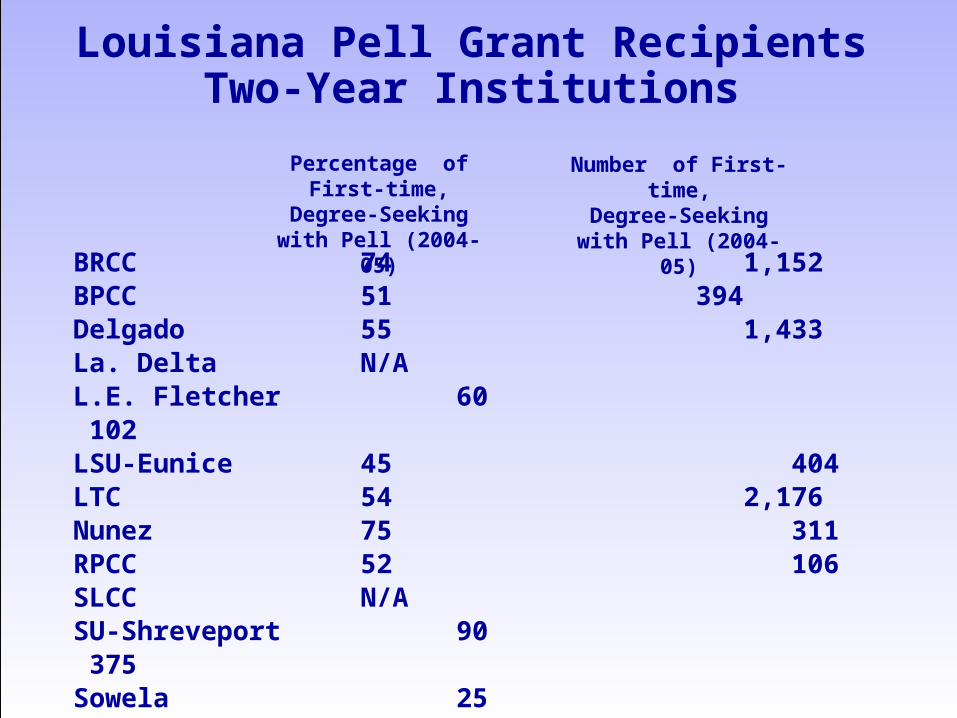
Louisiana Pell Grant RecipientsTwo-Year Institutions
BRCC 74 1,152BPCC 51 394Delgado 55 1,433La. Delta N/AL.E. Fletcher 60 102LSU-Eunice 45 404LTC 54 2,176Nunez 75 311RPCC 52 106SLCC N/ASU-Shreveport 90 375Sowela 25 332
Percentage of First-time, Degree-Seeking
with Pell (2004-05)
Number of First-time,Degree-Seeking
with Pell (2004-05)

Pell Grant Participation Rate for Dependent Undergraduates by Parental Income
Source: Postsecondary Education Opportunity, March 2007
Louisiana MedianHousehold Income
$36,729

“Helping more Americans earn a degree is not only important for our economic standing, it’s essential to reinforcing what our country stands for.”
Secretary of Education Margaret Spellings, March 2007
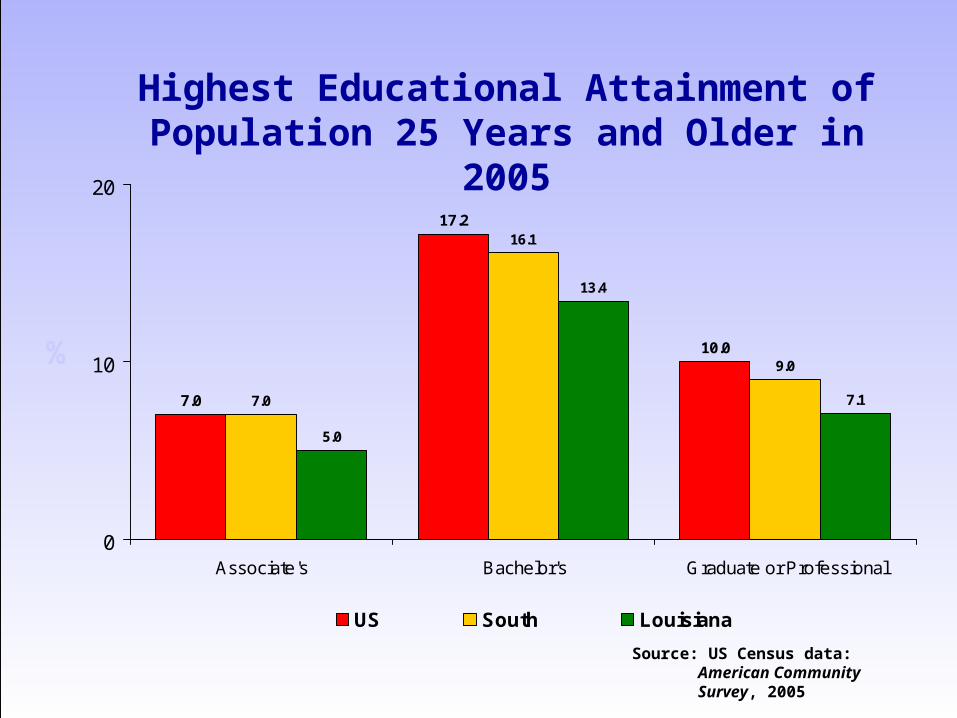
7.0
17.2
10.0
7.0
16.1
9.0
5.0
13.4
7.1
0
10
20
Associate's Bachelor's Graduate or Professional
US South Louisiana
Source: US Census data: American Community Survey, 2005
Highest Educational Attainment of Population 25 Years and Older in 2005
%
Related Documents