Formative Assessment for College Readiness 1 Running Head: FORMATIVE ASSESSMENT FOR COLLEGE READINESS Formative Assessment for College Readiness: Measuring Skill and Growth in Five Key Cognitive Strategies Associated with Postsecondary Success David Conley, PhD Allison Lombardi, MA Mary Seburn, PhD Charis McGaughy, PhD Educational Policy Improvement Center 720 E. 13 th Ave., Suite 202 Eugene, OR 97401 541-346-6153 [email protected] [email protected] Presented at the annual conference of the American Educational Research Association San Diego, California April 2009

Welcome message from author
This document is posted to help you gain knowledge. Please leave a comment to let me know what you think about it! Share it to your friends and learn new things together.
Transcript
Formative Assessment for College Readiness 1
Running Head: FORMATIVE ASSESSMENT FOR COLLEGE READINESS
Formative Assessment for College Readiness:
Measuring Skill and Growth in Five Key Cognitive Strategies
Associated with Postsecondary Success
David Conley, PhD
Allison Lombardi, MA
Mary Seburn, PhD
Charis McGaughy, PhD
Educational Policy Improvement Center
720 E. 13th Ave., Suite 202
Eugene, OR 97401
541-346-6153
Presented at the annual conference of the American Educational Research Association
San Diego, California
April 2009
Formative Assessment for College Readiness 2
Abstract
This study reports the preliminary results from a field test of the College-readiness
Performance Assessment System (C-PAS), a large-scale, 6th-12th grade criterion-referenced
assessment system that utilizes classroom-embedded performance tasks to measure student
progress toward the development of key cognitive skills associated with success in college. A
sample of 1,795 students completed C-PAS performance tasks in English and mathematics at 13
New York City high schools in grades 9-12 during Fall 2007. The performance tasks were
derived from construct maps and “task shells” designed to elicit the key cognitive strategies.
Teachers administered the tasks to students and scored the tasks using standardized scoring
guides. Preliminary analyses using Item Response Theory (IRT) yielded evidence that C-PAS
measures the acquisition of college readiness cognitive thinking skills in both math and English.
The study is significant because it suggests that cognitive strategies important to college
readiness can be measured discretely and within separate subject areas. Additionally, the study
suggests that complex performance assessments can be utilized to systematically contribute
useful information on student performance to help improve student learning. This is important
given the current search for ways to address some of the limitations of current large-scale testing
methods and systems.

Formative Assessment for College Readiness 3
Formative Assessment for College Readiness: Measuring Skill and Growth in Five Key
Cognitive Strategies Associated with Postsecondary Success
Introduction
The proportion of high school graduates pursuing postsecondary education has increased
consistently over time, yet evidence suggests that many admitted students are unprepared to
succeed in college-level instruction (Greene & Foster, 2003). The 2005 National Education
Summit on High Schools termed this problem the “preparation gap” (American Diploma Project,
2006). While 67% of high school completers pursue some form of postsecondary education
immediately after high school (National Center for Education Statistics, 2005), 30% to 60% of
these students require remediation in math or English, or both (California State University
System, 2007; Conley, 2005). These shortcomings cut across all racial and ethnic lines (Venezia,
Kirst, & Antonio, 2004), but are most pronounced among first-generation college attendees, a
group that overly represents low income and minority students.
This design of C-PAS seeks to address the “preparation gap” by providing feedback on
the degree to which students are developing key cognitive strategies essential for success in
entry-level college courses. Descriptions of high school instruction paint a consistent picture of
classrooms in which students complete prescribed tasks that require little cognitive engagement,
often in order to prepare for state tests that may not align well with college readiness (Angus &
Mirel, 1999; Brown & Conley, 2007). In an accountability-driven era, few high school teachers
appear to have the time or inclination to develop student-thinking skills. As a result entering
college students often show difficulty retaining, understanding, transferring, and applying much
of the knowledge they have been taught, a phenomenon termed “fragile knowledge syndrome”
(Perkins, 1992; Perkins, Jay, & Tishman, 1993; Perkins & Salomon, 1989).

Formative Assessment for College Readiness 4
College faculty nationwide, regardless of the selectivity of the institution, expressed near
universal agreement that most students arrive unprepared for the intellectual demands and
expectations of post-secondary environments (Conley, 2003). College instructors appear to
accept the fact that many incoming students may not have retained content knowledge taught to
them previously, and those who teach entry-level courses appear to be willing to reteach as new
material much of what has been taught previously in high school (Conley, et al., 2008; Conley,
McGaughy, Cadigan, Forbes, & Young, 2009). However, they also expect students to make
inferences, interpret results, analyze conflicting source documents, support arguments with
evidence, solve complex problems that have no obvious answer, reach conclusions, offer
explanations, conduct research, engage in the give-and-take of ideas, and generally think deeply
about what they are being taught (National Research Council, 2002). Students who have little
prior experience developing these cognitive strategies struggle when confronted with content
knowledge they have not retained well that they are now expected to process and manipulate in
much more complex ways.
Researchers have analyzed high school transcripts and found that rigorous academic
preparation as represented by the titles of high school courses taken is the most significant
explanatory variable for persistence to college graduation (Adelman, 1999; Bedsworth, Colby, &
Doctor, 2006). A different approach is to analyze the content of college courses and then
determine what should be occurring in high school courses to align with what will be
encountered in college courses. Research in this area has identified key attributes of college
readiness, most notably a series of metacognitive strategies and essential content knowledge
(Conley, 2005). The C-PAS assessment model is based on elements of this research, most
importantly, the notion that effective college preparation must include development of key

Formative Assessment for College Readiness 5
cognitive strategies and that those strategies must be developed while studying essential content
knowledge.
Objectives
The purpose of this study was to field-test the College-readiness Performance
Assessment System (C-PAS) in order to determine the validity of its conceptual design and
constructs and to evaluate its ability to measure five Key Cognitive Strategies (KCS): problem
solving, research, interpretation, reasoning, and precision with accuracy. The College-readiness
Performance Assessment System (C-PAS) was designed to enable teachers to monitor the
acquisition of the KCS through rich content-specific performance tasks embedded into the
curriculum. Postsecondary preparedness is the reference point for this criterion-based
measurement system. The five Key Cognitive Strategies (KCS) are always learned and practiced
in the context of challenging content knowledge. The variance in tasks is limited by a focus on
the five KCS, which are measured through common scoring guides. The study employs item-
response models to report the preliminary results from the psychometric analysis of the field test
data.
Performance assessment, also known as authentic assessment, seeks to measure student
knowledge or skills through products that result from their engagement in and completion of a
task rather than their responses to a series of test items. Performance-based assessments have
undergone study in a variety of settings over the past 20+ years with varying results. They were
used extensively in the early 1990s during the first wave of educational standards and were
found to be difficult to use for high-stakes accountability purposes (Koretz, Stecher, & Deibert,
1993), interest in performance assessment is reviving as the limitations of current large-scale
assessment methods are being recognized, particularly the lack of connection between tests and
Formative Assessment for College Readiness 6
classroom instruction and the emphasis such tests place on recall and simple application items
that tend to gauge lower-level cognitive functioning. The concern is that this type of testing is
driving classroom teaching in the wrong direction, away from complex thinking and toward
simple recall without understanding.
Performance assessment does theoretically have the potential to provide more meaningful
feedback to students and teachers (Cohen & Pecheone, 2008) in ways that inform teaching
behaviors because the assessments themselves are deeply embedded within the instructional
process. Further, performance tasks allow students to demonstrate much more complex and
diverse thinking than do multiple-choice item tests, and they provide opportunities for students to
actively apply skills and knowledge to real life situations rather than simply selecting the “right”
answer from among several choices or in the context of an artificial problem or situation (Cohen
& Pecheone, 2008; Wilson, 2005).
Theoretical Framework
The C-PAS model is grounded in three theoretical frames: a dispositional-based theory of
intelligence, cognitive learning theory, and competency theory. A dispositional or
characterological view of intelligence builds on incremental theories of intelligence that believe
intelligence is malleable and recognizes that ability is a continuously expandable repertoire of
skills, that through increasing efforts, intelligence can grow incrementally (Bransford, Brown, &
Cocking, 2000; Costa & Kallick, 2000). The second conceptual frame derives from emerging
cognitive learning theory, referred to as the “New Science of Learning.” This contemporary view
of learning asserts that people construct new knowledge and understandings based on what they
already know and believe. Perkins (1992) condenses this fundamental understanding into a
single sentence: “Learning is a consequence of thinking. Retention, understanding, and the active

Formative Assessment for College Readiness 7
use of knowledge can be brought about only by learning experiences in which learners think
about and think with what they are learning” (p. 8).
Competency theory provides the final element of the conceptual frame and serves to
bridge between developmentally appropriate student cognition and assessment (Baxter & Glaser,
1997). Competency theory is guided by the expert-novice literature and suggests that novices
(students) benefit from models of how experts approach problem solving, especially if they
receive coaching in using similar models (Bransford, et al., 2000). Competency research also
creates developmental models of learning that note the typical progression and significant
milestones as a learner advances from novice to competent to expert and describe the types of
experiences that lead to change (Boston, 2003).
Conceptual Model
The C-PAS is built around the five key constructs associated with success in
postsecondary education. These are contained in Figure 1. Others have developed similar
classification systems. Ritchhart (2002), in his book Intellectual Character, identified eight such
lists ranging from five to sixteen individual dispositions, or habits of mind. After an extensive
literature review that considered Ritchhart’s models along with findings on college readiness by
recent researchers in the field (Conley, 2003, 2004, 2005, 2007; Conley, Aspengren, & Stout,
2006; Conley, Aspengren, Stout, & Veach, 2006), the five Key Cognitive Strategies were
selected and organized into the construct model presented in Figure 1. In the model, each
construct has three dimensions (aspects) that can be explicitly scored.
<insert Figure 1>
Formative Assessment for College Readiness 8
The C-PAS tasks and scoring rubrics are derived directly from the conceptual framework
contained in Figure 1. The tasks are designed to progress in challenge level along a
developmental continuum that is backward-mapped from the skills and habits necessary to
succeed in entry-level college courses. Tasks are geared to measure student progression starting
at 6th grade and measured by scoring guides keyed to the 8th, 10th and 12th grade benchmark
levels.
Method
Instrument
The College-readiness Performance Assessment System (C-PAS) was designed to enable
teachers to monitor the acquisition of five key cognitive strategies through the use of content-
specific performance tasks that teachers embed into their curriculum. Teachers select tasks from
an online task bank that contains information on task characteristics, including benchmark level
and cognitive dimensions measured. Teachers administer one task in the fall and another in the
spring. Students complete a task over a period of several days to one or two weeks, much of
which is out-of-class time, and teachers score each submitted piece of student work on up to five
key cognitive strategies, depending on the task in question, using standardized scoring guides.
This approach has three significant characteristics distinguishing it from other
performance assessment systems typically utilized in high school, such as senior projects or
exhibitions: (1) C-PAS uses postsecondary preparedness as the reference point for its criterion-
based measurement system; (2) the five KCS are always the reference point for performance and
must be developed in the context of challenging content knowledge, not in isolation; (3) the
measurement error is constrained in a number of ways including the use of tasks designed based

Formative Assessment for College Readiness 9
on task shells, the use of common scoring guides, and requirements that a proportion of student
work be rescored externally from the school (moderated).
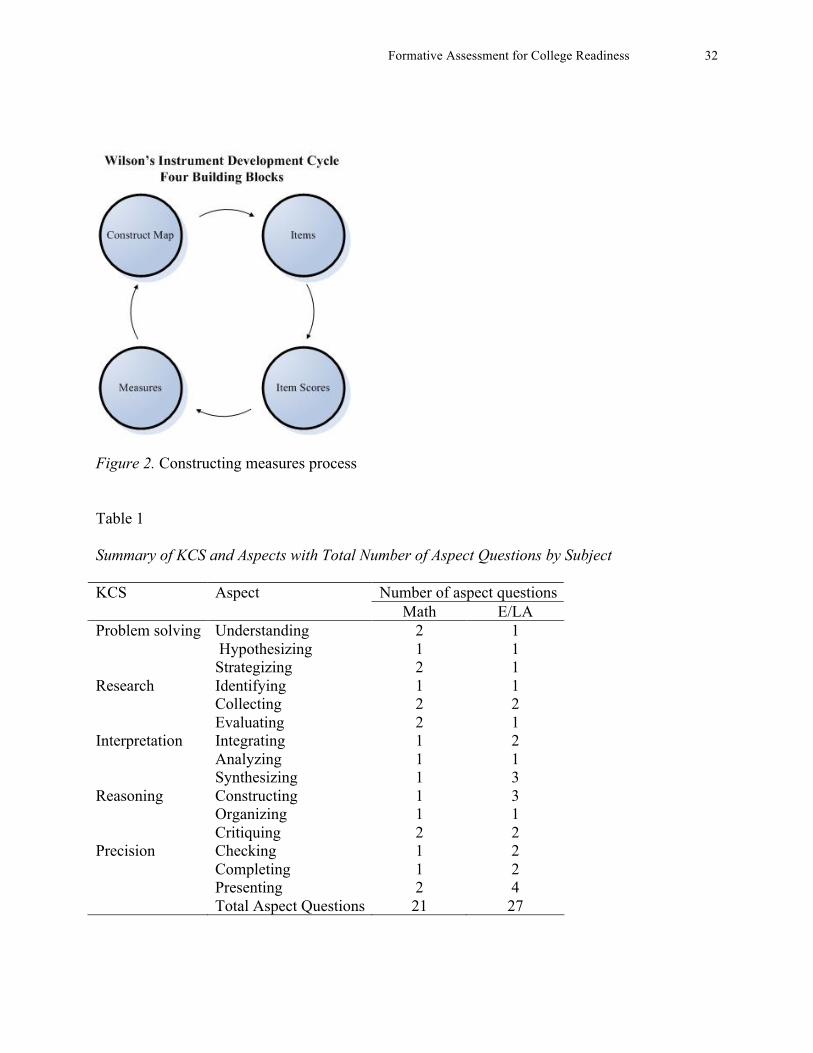
Instrument development. Construct modeling is at the heart of constructing an assessment
system of this nature. Concepts modeling leads to concept maps that form the foundation for an
item-response modeling approach of this nature that determines how an instrument works
through measured constructs (Wilson, 2005). According to Wilson (2005), construct modeling
includes four components: construct maps, items, item responses, and measures. The C-PAS
design process embodies the four components of Wilson’s instrument development cycle to
develop and analyze construct maps, a process depicted in Figure 2.
<insert Figure 2>
We followed Wilson’s model by initially creating the construct maps based on the five KCS. The
construct maps were used to develop items and an accompanying item-scoring system that
translated the constructs into assessable formats. These formats included task shells, performance
tasks, and scoring guides. Teams of content experts used the task shells to create performance
tasks that measured the constructs. These tasks were then tested on participants in order to
validate the construct maps. The scoring process was designed concurrently, including scoring
guides, decision criteria, evidence maps, and an online reporting and scoring moderation system.
Participants
Field test data was obtained from 1,795 students in 13 high schools within the Urban
Assembly network of small high schools in the New York City Public Schools. It is worth noting
that these schools serve a population composed almost entirely of students who would be the
first in their families to attend college.

Formative Assessment for College Readiness 10
Scoring. Teachers were trained in task administration and scoring and then administered
C-PAS tasks in English/Language Arts (E/LA) and Mathematics classrooms in grades 9-12
during a six-week period in the Fall (October/November) of 2007. Students in grades 9 and 10
were scored using the 10th grade benchmark scoring guide (N = 1,245), and students in grades 11
and 12 were scored using the 12th grade benchmark scoring guide (N = 550).
Each task comprises between three and five aspects, and each aspect consists of between
one and four aspect questions. These are summarized in Table 1 below and are described in
detail in Appendix A.
<insert Table 1>
In addition to submitting 100% of the student scores, teachers submitted 25% of student
performance task responses (work samples) to the research staff for rescoring. These selected
pieces of student work were scored again by “scoring moderators” or outside consultants, a
group of experienced postsecondary mathematics and English/Language Arts (E/LA) faculty.
Prior to scoring student work, scoring moderators were given an overview of the C-PAS
theoretical construct maps and were trained on the scoring guides. The purpose of the moderated
scoring was to gauge the reliability of teacher scoring and to improve the scoring methods.
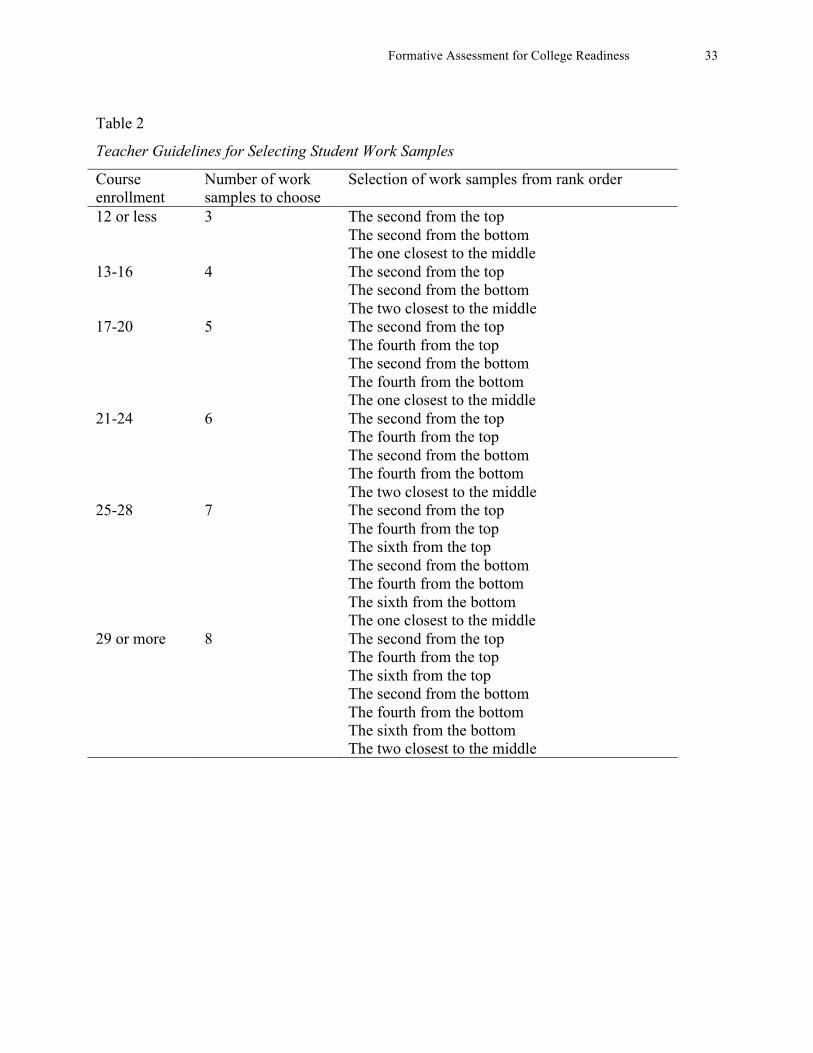
Student Work Sample Selection. To ensure submitted student work samples represented a
full range of student work, teachers were instructed to choose student work samples for
submission based on a purposive sampling design. First, they were asked to rank order the CPAS
student work samples for each class by total score from the highest to lowest. Then, teachers
Formative Assessment for College Readiness 11
selected specific work samples from the ranked pile. Teachers followed the sampling plan listed
below in Table 2.
<insert Table 2>
Analytic Approach
Item-Response Theory (IRT) is particularly applicable to performance assessment data
because it permits student-to-item comparisons and allows for determination and evaluation of
item characteristics. Item parameters do not depend on the particular sample of students from the
population included in the sample, and student ability parameter estimates do not depend on the
specific items a student responds to. In IRT, standard errors extend beyond the test to describe
the precision with which each score is estimated. IRT is well suited to address the technical
challenges associated with developing performance assessment systems, such as guiding the
system to gauge complex learning and establishing the technical adequacy and quality of such
systems (Shavelson, Baxter, & Pine, 1992).
Item difficulty and student proficiency estimates will be generated based on teacher
scores using the Rasch model (Rasch, 1960) and ACER ConQuest 2.0 software (Wu, Adams, &
Wilson, 1998). Item and person fit statistics were generated and estimates of test reliability were
obtained. Second, rater reliability was calculated between teachers and scoring moderators using
the raw scores and SPSS software (SPSS, 2006). Finally, preliminary cut points were established
using the difficulty estimates from ConQuest.
Parameter Estimation. ConQuest software uses an expectation/maximization (EM)
algorithm to estimate Marginal Maximum Likelihood (MML). While Joint Maximum Likelihood
Formative Assessment for College Readiness 12
(JML), MML, and Conditional Maximum Likelihood (CML) are all iterative processes, MML is
different from JML and CML mainly because it improves the expected frequencies for trait level
and correct responses with each iteration (Embretson & Reise, 2000). Along with JML and
CML, MML can be used to calculate maximum likelihood with unknown person parameters, the
case we have with this particular study. However, unlike JML and CML, MML assumes data are
randomly sampled from an initial hypothesized population distribution. The resulting standard
errors are asymptotic and ConQuest sets the mean of the item parameters to zero.
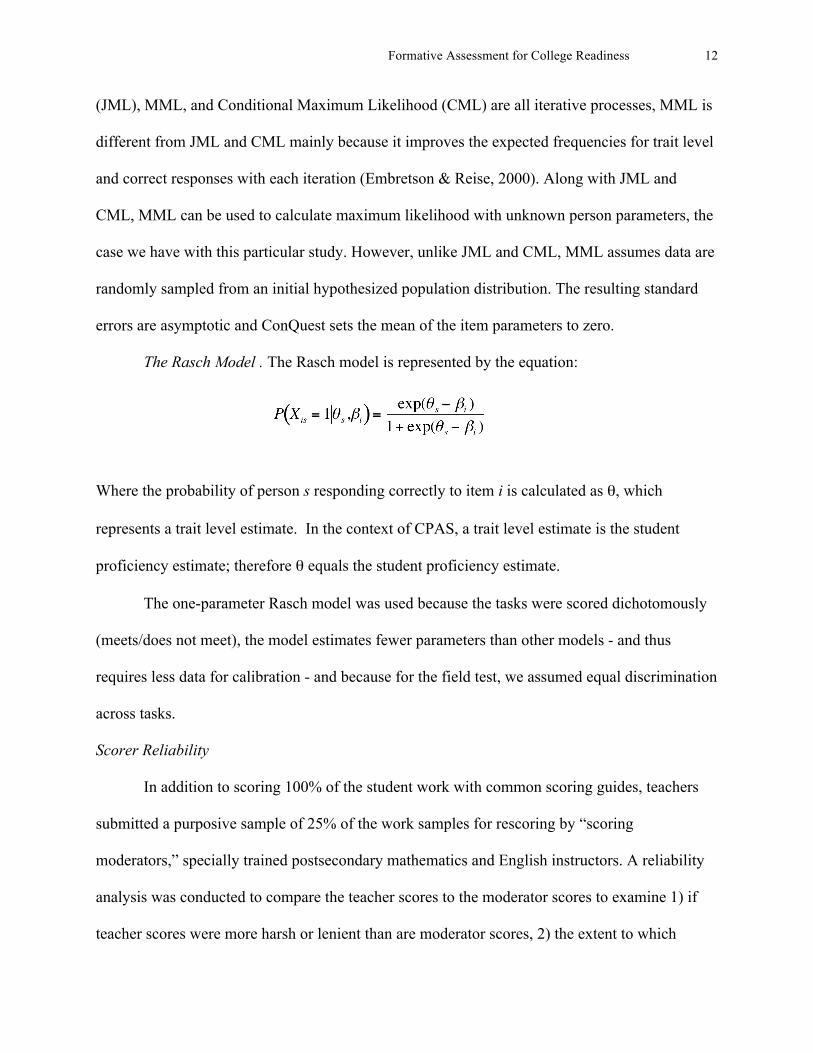
The Rasch Model . The Rasch model is represented by the equation:
Where the probability of person s responding correctly to item i is calculated as θ, which
represents a trait level estimate. In the context of CPAS, a trait level estimate is the student
proficiency estimate; therefore θ equals the student proficiency estimate.
The one-parameter Rasch model was used because the tasks were scored dichotomously
(meets/does not meet), the model estimates fewer parameters than other models - and thus
requires less data for calibration - and because for the field test, we assumed equal discrimination
across tasks.
Scorer Reliability
In addition to scoring 100% of the student work with common scoring guides, teachers
submitted a purposive sample of 25% of the work samples for rescoring by “scoring
moderators,” specially trained postsecondary mathematics and English instructors. A reliability
analysis was conducted to compare the teacher scores to the moderator scores to examine 1) if
teacher scores were more harsh or lenient than are moderator scores, 2) the extent to which

Formative Assessment for College Readiness 13
teachers and moderators scored consistently, and 3) the nature of the differences in scores when
such differences are observed. The reliability analysis described in this study consisted of 1,154
students.
Results
Data included in the analysis met the following criteria:
1. Only tasks with 30 or more student scores were included (20 total for 10th grade and 12
total for 12th grade),
2. Only aspect questions (or items) with 4 or more scores were included
3. Only students with 8 or more aspect scores were included, and
4. Only teacher scores were included, not scoring moderators
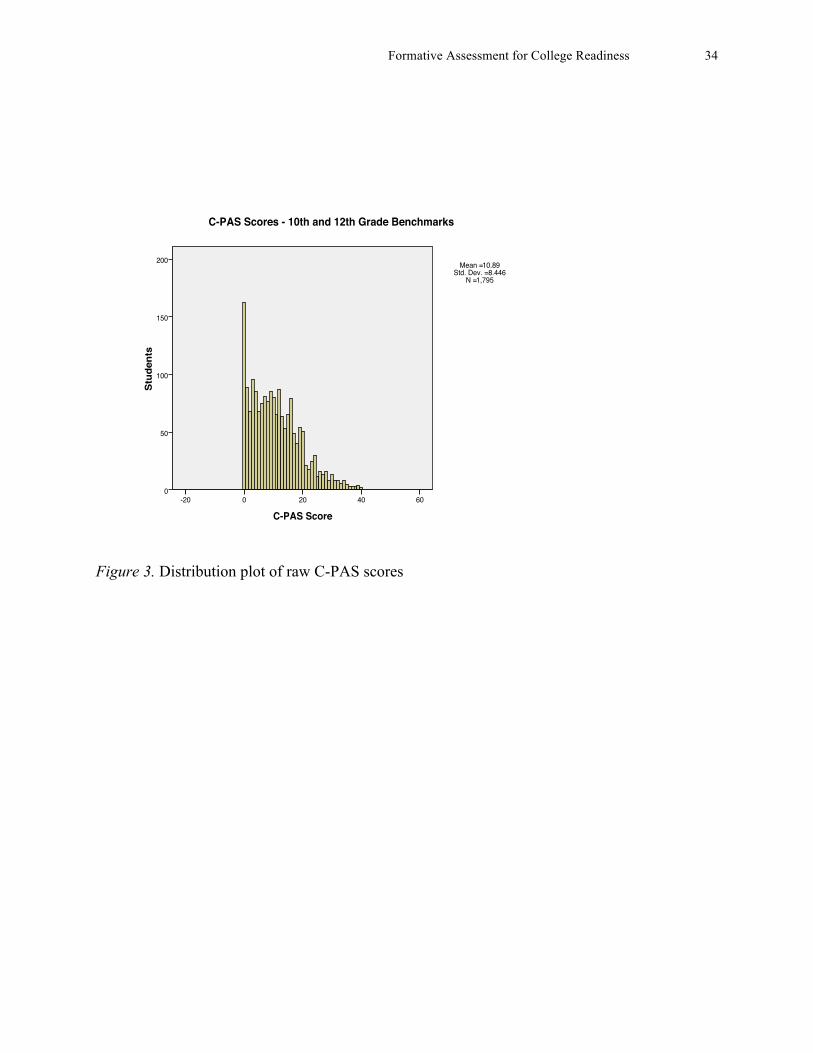
A total of 1,670 student cases met these criteria. At the tenth grade benchmark (which included
both ninth and tenth grade students), there were 1,122 students across 20 different tasks (8 Math
and 12 English/Language Arts). At the twelfth grade benchmark (which includes both 11th and
12th grade students) there were 548 total student cases across 12 different tasks (6 Math and 6
English/Language Arts). Figure 3 shows the distribution plot of raw total C-PAS scores for all
students included in the analyses.
<insert Figure 3>
Item Response Model Results
Separate calibrations were conducted on the aspect scores, one for each benchmark.
While the tasks were delivered in the context of math and English/Language Arts content, only a
single dimension – the cognitive thinking skills most relevant to college readiness - was
measured by the instrument. Math and ELA scoring guides included the same construct mapping

Formative Assessment for College Readiness 14
design; both scoring guides included the five KCS and subsequent aspects and aspect questions
within each KCS. Since cognitive thinking skills were the only dimension measured by the
instrument, tasks from Math and ELA were combined during calibration within each benchmark.
See Appendix A for a complete list of aspect questions scored in both Math and ELA tasks.
The average proficiency estimate for students scored at the tenth grade benchmark was -
0.06 (SD=.84) and for students scored at the twelfth grade benchmark was 0.76 (SD =.81).
Scores of “No evidence” were excluded from the IRT analyses. IRT analyses were run in
ConQuest, and yielded promising results, described below.
Task Difficulty. Table 3 describes task difficulties for the tasks in each benchmark. Task
difficulties are based on the average item difficulties for all of the aspect questions assessed by
the task. The logit zone (range of difficulty) for the 10th grade benchmark tasks was -2.47 to 4.43
(20 tasks) and the logit zone for the 12th grade benchmark was -2.04 to 1.96 (12 tasks).
<insert Table 3>
The most difficult items at both benchmarks were mathematics tasks, and average
difficulty was higher for math than it was for ELA ( = .78 ( = .19) for math versus ( = -.35 (
= .21) for ELA at the tenth grade benchmark and = .63, = .27 for math versus = -.46,
= .29 for ELA at the twelfth grade benchmark). This could suggest a need for the development
of more challenging C-PAS tasks for ELA, or may indicate only that the more challenging ELA
tasks did not meet the selection criteria and are not included in the current analysis.
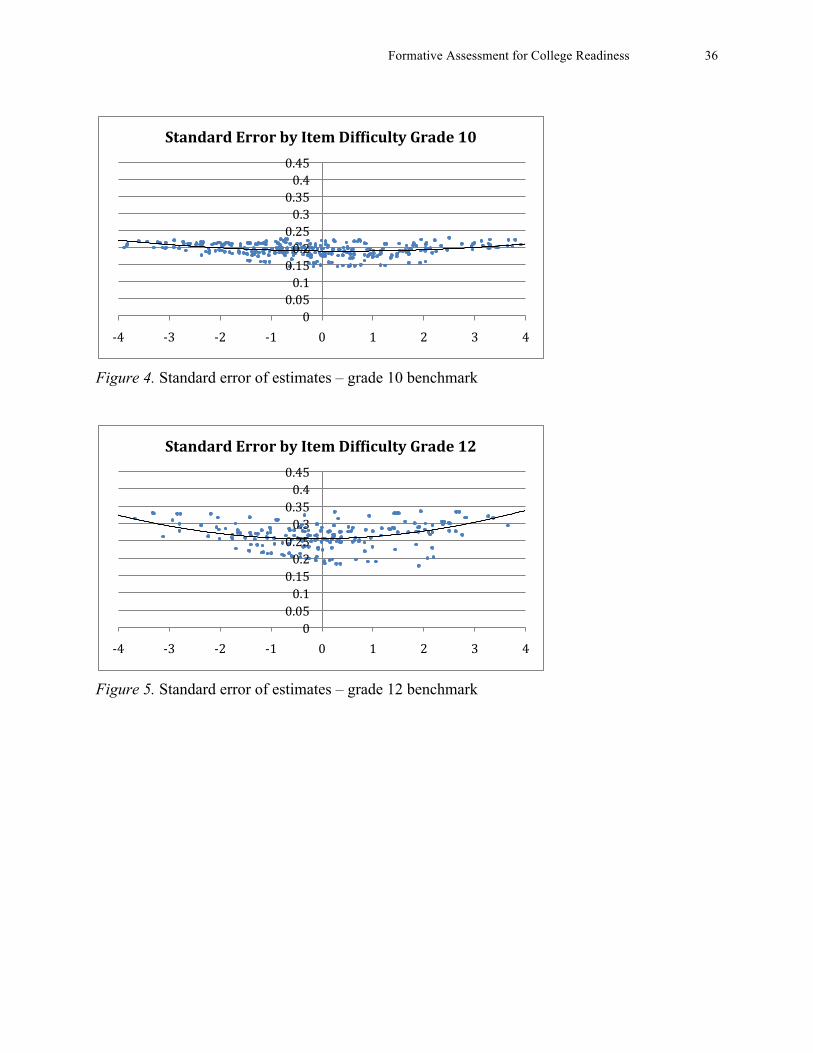
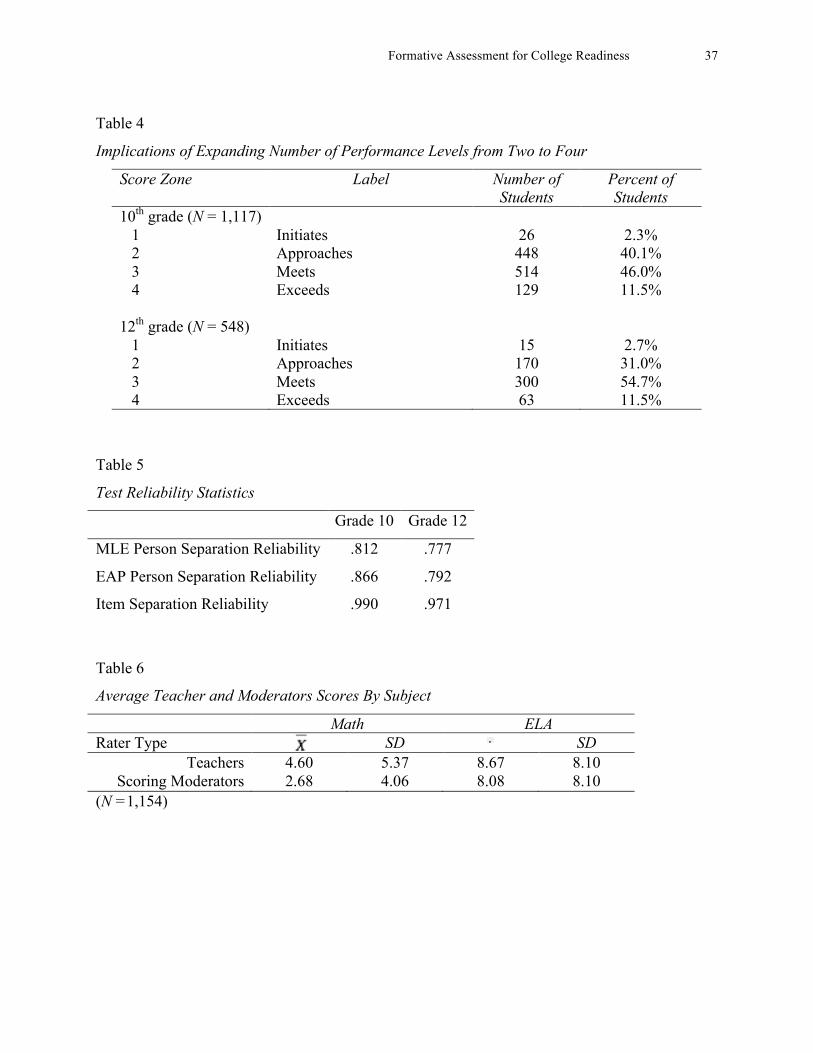
The standard errors of the difficulty estimates are described in Figure 4 and 5. As is
commonly found in assessment data, the standard errors tended to be slightly smaller in the
Formative Assessment for College Readiness 15
middle of the distribution and slightly larger at the extreme ends of the proficiency distribution.
It is promising however, that this difference is quite small. Standard errors were slightly larger at
the twelfth grade benchmark ( =.267) than at the tenth grade benchmark ( =.196). This
suggests that C-PAS is able to assess college readiness across a range of proficiencies with little
loss in precision at the ends of the proficiency distribution.
<insert Figure 4>
<insert Figure 5>
Establishing Cut Points. Preliminary cut points were established based on the Wright
Maps, which were used to determine the extent to which the number of score categories could be
expanded from the dichotomous Meets and Does Not Meet. The maps indicated a normal
distribution of items and students in the logit zone, and the majority of the items and students fell
into the middle score zones, with enough falling in to the outside areas to warrant expansion of
the dichotomous score scale to four criterion zones and four score categories instead of two. The
Wright Maps are provided in the Appendix and the implications for expanding the number of
performance levels from two to four are described below in Table 4. Subsequent scoring guides
for C-PAS now include four levels –Initiates, Approaches, Meets, Exceeds, with a category to
indicate items that teachers are unable to score (due to blank student responses or unfinished
work).
<insert Table 4>
Formative Assessment for College Readiness 16
Item Fit. Weighted MNSQ item fit statistics identified 18 of 338 items at the Grade 10
benchmark with significant misfit (weighted absolute t-value > 2) and 18 of 215 items at the
Grade 12 benchmark. This represents five and eight percent of the total number of items, rates
very close to what is expected by chance alone. The misfitting items were spread equally across
Math and ELA. Many of the 36 items with misfit were from the Precision/Accuracy (n=14) and
Reasoning (n=13) aspects.
IRT Test Reliability. The item and person separation reliability estimates (described in
Table 5) were quite strong, which indicates a high precision of measurement. High item
separation reliability (Wright & Stone, 1979) indicates a high probability that items with high
difficulty estimates are more difficult than items with lower difficulty estimates. These results
are evidence the C-PAS instrument is a highly precise and internally consistent measure of the
key cognitive strategies.
<insert Table 5>
Scorer Reliability
Harshness/Leniency in Scoring. Teachers were more lenient than scoring moderators in
Math, where there was an average difference between raters of nearly 2 points. This leniency
was not observed in English/Language Arts (E/LA), where teachers and moderators scores were
more similar, with an average difference of less than one point. Average scores for teacher and
moderators are provided in Table 6.
Formative Assessment for College Readiness 17
<insert table 6>
Correlations between Teacher and Moderator Scores. Table 7 describes correlations
between teacher and moderator scores on the two most popular tenth grade benchmark tasks for
math and E/LA. Results show moderate correlations between teacher and moderator scores
across the four tasks. The square of the coefficient (or R2) is equal to the percent of the variation
in one score that is related to the variation in the other. For the two tasks described in the table
below, between 15 and 58 percent of the variance is shared.
<insert table 7>
Teacher and Scoring Moderator Scoring Differences. Comparing average raw scores from
teachers and moderators, we identified some areas of difference. Tasks with at least two teacher
and moderator scores and at least fifteen student scores were included in the analyses. At the
tenth grade benchmark, ten tasks total met these criteria – eight E/LA and two Math. At the
twelfth grade benchmark, seven tasks met these criteria – five E/LA and two Math. The tasks and
aspects described below in Table 6 are those where the average difference was one full point or
more. There were many more differences on E/LA tasks, where the average difference was more
than one point on a 3-point scale between teachers and moderators (1=No evidence, 2=Does not
meet, 3=Meets). These findings are consistent with the increased variability in E/LA scores
(described in Table 8).

Formative Assessment for College Readiness 18
<insert Table 8>
Discussion
Summary of Findings
Analyses from the C-PAS field test yielded positive findings. Results showed that the C-
PAS assessed cognitive skills necessary for college with precision over a range of student
proficiency levels. The math tasks included in this analysis were of greater difficulty than the
E/LA tasks. Standard errors increased only slightly at the extreme ends of the range of student
proficiency assessed. Data supported expansion of the dichotomous scoring to a polytomous
scoring model with four categories. Except for a small number of items that would be expected
by chance alone, the aspect questions fit the model with little misfit. Reliability estimates were
high, providing evidence that C-PAS measures the cognitive skills with precision and is
internally consistent.
Scorer reliability was established, although areas of improvement were identified. At
both benchmarks, teacher scores were more lenient than moderators on math tasks but were
comparable to moderator scores on E/LA tasks. Differences in scores were not large, but did
differ for math and E/LA. Although the average differences were much smaller, the standard
errors for E/LA were much higher than for math, suggesting increased variability. Moderate
correlations were observed in the raw scores between teacher and moderators, and greater
differences were identified in scores for E/LA tasks than Math tasks.

Formative Assessment for College Readiness 19
Implications and Future Directions
Future studies might include more targeted sampling plans where data collection efforts
are focused on building score data in specific tasks or KCS so that enough scores can be
collected in order to run an inter-rater Item Response model. The inter-rater models will be based
on more complex scoring and IRT models.
Future analyses will include additional data for additional tasks, and difficulty of tasks
will be compared across content area. Future task development will be guided by these results
and will ensure equivalent challenge levels across content area.
Additional studies will be undertaken to evaluate and improve scorer reliability. Scorer
reliability results reported here were derived from preliminary analyses based on field test data
and did not reflect any possible changes caused by subsequent improvements in scoring process
and materials. Additional analyses are warranted on scores resulting from recently enhanced
scoring materials to make sure teachers and moderator scores are similar, with little variance.
Additional studies will also investigate the higher proportion of misfitting items observed
from Precision/Accuracy and Reasoning aspects to see if improvements are needed to better
assess these skills.
These findings have greater implications for the use of performance assessments as
indicators of criterion-referenced constructs. The scores adequately measure the five key
cognitive strategies, and the teachers demonstrated the ability to use the scoring guides
consistently to rate student work. Also, these findings suggest the five key cognitive strategies
can be measured equally well in math and English/Language Arts.
Given the fact that the empirical research to date on the effectiveness of performance-
based assessment is somewhat mixed, especially in the area of systems that measure the
Formative Assessment for College Readiness 20
development of cognitive thinking skills, this study provides a revealing glimpse at the
possibilities of performance assessment in these areas. This very initial study suggests that the C-
PAS approach appears to be feasible as a means to gauge student capabilities in relation to five
key cognitive strategies associated with college readiness and success. The findings provide
sufficient evidence for continued field-testing of C-PAS and for broader implementation trials to
take place, using the results of these preliminary analyses to guide plans for further development,
revision, and improvement of the assessment.
The findings are also notable in the context of the current educational policy environment
where the effects of large-scale assessments on educational improvement are being more closely
examined. One argument against the current crop of standardized tests is that such instruments
encourage educational practices that are not consistent with the broader goals of a citizenry
prepared for the challenges and opportunities of the 21st century. By employing measurement
methods that require the reduction of complex content and concepts to a “grain size” sufficiently
small to measure via one of several specified item types, the connections among knowledge
within a subject area are lost along with evidence of more complex cognitive skills. Both of these
characteristics, understanding the structure of knowledge in a subject area and proficiency with a
range of cognitive strategies, are critically important to success in most modern endeavors, be
they economic, political, or social. Complex performance tasks may be a way to measure these
important aspects of learning and to gear teaching toward them.
National education policy is undergoing a reexamination to determine whether current
assessment and accountability measures are sufficient and appropriate to improve teaching and
learning dramatically so that US students are among the best in the world. Additional insight into
the potential effectiveness of complex performance assessment as a supplement but not

Formative Assessment for College Readiness 21
necessarily a replacement to existing testing methods and formats may be useful in informing
this discussion and in helping to identify additional options for assessing student readiness for
postsecondary learning.

Formative Assessment for College Readiness 22
References Adelman, C. (1999). Answers in the Tool Box: Academic Intensity, Attendance Patterns, and
Bachelor's Degree Attainment. Washington, D.C.: U.S. Department of Education.
Angus, D. L., & Mirel, J. E. (1999). The Failed Promise of the American High School. New
York: Teachers College Press.
Baxter, G. P., & Glaser, R. (1997). An approach to analyzing the cognitive complexity of science
performance assessments. Los Angeles: National Center for Research on Evaluation,
Standards, and 7 Student Testing (CRESST) and Center for the Study of Evaluation
(CSE) in the GraduateSchool of Education & Information Studies, University of
California, Los Angeles.
Bedsworth, W., Colby, S., & Doctor, J. (2006). Reclaiming the American Dream. Boston, MA:
Bridgespan.
Boston, C. (2003). Cognitive science and assessment. College Park, Maryland: Office of
Educational Research and Improvement.
Bransford, J. D., Brown, A. L., & Cocking, R. R. (Eds.). (2000). How People Learn: Brain,
Mind, Experience, and School. Expanded Edition: National Academy of Sciences -
National Research Council Washington DC. Commission on Behavioral and Social
Sciences and Education, US Department of Education, Washington, DC.
Brown, R. S., & Conley, D. (2007). Comparing State High School Assessments to Standards for
Success in Entry-Level University Courses. Journal of Educational Assessment, 12(3),
137-160.
California State University System (2007). Proficiency reports of students entering the CSU
system. from http://www.asd.calstate.edu/performance/proficiency.shtml.
Formative Assessment for College Readiness 23
Cohen, L., & Pecheone, R. (2008). Performance-based assessment. Education Week. Retrieved
from http://www.edweek.org/chat/transcript_07_01_08.html
Conley, D. (2003). Understanding University Success. Eugene, OR: Center for Educational
Policy Research, University of Oregon.
Conley, D. (2004). Proficiency-based admissions. In W. J. Camara & E. W. Kimmel (Eds.),
Choosing students: Higher education Tools for the 21st century. Mahwah, New Jersey:
Lawrence Erlbaum Associates.
Conley, D. (2005). College Knowledge: What It Really Takes for Students to Succeed and What
We Can Do to Get Them Ready. San Francisco: Jossey-Bass.
Conley, D. (2007). Toward a comprehensive conception of college readiness. Eugene, OR:
Educational Policy Improvement Center.
Conley, D., Aspengren, K., & Stout, O. (2006). Advanced Placement Best Practices Study:
Biology, Chemistry, Environmental Science, Physics, European History, US History,
World History. Eugene, Oregon: Educational Policy Improvement Center.
Conley, D., Aspengren, K., Stout, O., & Veach, D. (2006). College Board Advanced Placement
Best Practices Course Study Report. Eugene, Oregon: Educational Policy Improvement
Center.
Conley, D., McGaughy, C., Cadigan, K., Flynn, K., Forbes, J., & Veach, D. (2008). Texas
college readiness initiative phase II: Examining the alignment between the Texas college
and career readiness standards and entry-level courses at Texas postsecondary
institutions. Eugene, OR: Educational POlicy Improvement Center.

Formative Assessment for College Readiness 24
Conley, D., McGaughy, C., Cadigan, K., Forbes, J., & Young, B. (2009). Texas college and
career readiness initiative: Texas career and etchnical education phase I alignment
analysis report. Eugene, OR: Educational Policy Improvement Center.
Costa, A., & Kallick, B. (2000). Discovering & Exploring Habits of Mind. A Developmental
Series, Book 1. Alexandria VA: Association for Supervision and Curriculum
Development
Embretson, S. E., & Reise, S. P. (2000). Item response theory for psychologists. Mahweh, New
Jersey: Lawrence Erlbaum Associates.
Greene, J., & Foster, G. (2003). Public high school graduation and college readiness rates in the
United States: Manhattan Institute, Center for Civic Information.
Koretz, D., Stecher, B., & Deibert, E. (1993). The Reliability of Scores from the 1992 Vermont
Portfolio Assessment Program (Tech report No. 355): CRESST; Center for the Study of
Evaluation, University of California, Los Angeles.
National Center for Education Statistics (2005). Student efforts and educational progress: Table
22-1 postsecondary preparation and attainment among traditional-age students. from
http://nces.ed.gov/programs/coe/2005/section3/table.asp?tableID=273.
National Research Council (2002). Learning and Understanding: Improving Advanced Study of
Mathematics and Science in U.S. High Schools. Washington, DC: National Academy
Press.
Perkins, D. (1992). Smart Schools: Better Thinking and Learning for Every Child. New York:
The Free Press.

Formative Assessment for College Readiness 25
Perkins, D., Jay, E., & Tishman, S. (1993). Assessing thinking: A framework for measuring
critical thinking and problem solving skills at the college level (Report): Harvard
University.
Perkins, D., & Salomon, G. (1989). Are Cognitive Skills Context-Bound? Educational
Researcher, 16-25.
Rasch, G. (1960). Probabilistic models for some intelligence and attainment tests. Chicago:
University of Chicago Press.
Ritchhart, R. (2002). Intellectual Character : What It Is, Why It Matters, and How to Get It. San
Francisco: Jossey-Bass.
Shavelson, R., Baxter, G., & Pine, J. (1992). Performance Assessments: Political Rhetoric and
Measurement Reality. Educational Researcher, 21(4), 22-27.
SPSS, I. (2006). SPSS for Windows (Version 16.0): Lead Technologies.
Venezia, A., Kirst, M. W., & Antonio, A. (2004). Betraying the college dream: How
disconnected K-12 and postsecondary systems undermine student aspirations. San
Francisco: Jossey-Bass.
Wilson, M. (2005). Constructing measures: an item response modeling approach. Mahwah, New
Jersey: Lawrence Erlbaum Associates.
Wright, B. D., & Stone, M. H. (1979). Best test design. Rasch measurement. Chicago: MESA
Press.
Wu, M., Adams, R., & Wilson, M. (1998). The generalised rasch model. Acer conquest.

Formative Assessment for College Readiness 26
Appendix A
Table A1
Math Aspect Questions
KCS Aspect Aspect Question
Problem solving Understanding 1. Restatement of the problem
2. Explores variables in the problem
Hypothesizing 1. Outcomes of the problem
Strategizing 1. Plan to address the problem
2. Potential strategy for solving the problem
Research Identifying 1. Information required to perform the research
1. Method for collecting data Collecting
2. Visual or written presentation of the data
Evaluating 1. Reflection on the data collected
2. Reflection on the research methodology
Interpretation Integrating 1. Organization of data
Analyzing 1. Description of patterns or main points in the data
Synthesizing 1. Meaning or implications of results
Reasoning Constructing 1. Complete solution to the problem
Organizing 1. Organization of the complete solution
Critiquing 1. Critical reflection on the strategy used
2. Improvement across drafts
Precision Checking 1. Overall accuracy
Completing 1. Inclusion of components and follows directions
Presenting 1. Overall visual appeal
2. Correct use of terminology, symbols, and notation

Formative Assessment for College Readiness 27
Table A2
English/Language Arts Aspect Questions
KCS Aspect Aspect Question
Problem solving Understanding 1. Explorations into the meaning of the problem
Hypothesizing 1. Statement of potential outcomes, thesis, or
answers to the problem
Strategizing 1. Explanation of a strategy for solving the
problem
Research Identifying 1. Process for choosing sources
1. Breadth and level of sources used in data
collection
Collecting
2. Organizational strategy for recording data or
information
Evaluating 1. Critical analysis of the sources or information
collected
Interpretation Integrating 1. Choice of sources or evidence to include in the
analysis
2. Ability to organize the evidence for analysis
Analyzing 1. Explanation of the main points in sources, notes,
or other forms of evidence
Synthesizing 1. Connections made between the evidence and the
topic
2. Connections made between the pieces of
evidence
3. Conclusions made based on the evidence
Reasoning Constructing 1. Connection of the argument or line of reasoning
to the question or topic
2. Use of appropriate evidence to support an
argument or line or reasoning
3. Strength of the introduction and conclusion
Organizing 1. Order and flow of reasons supporting the
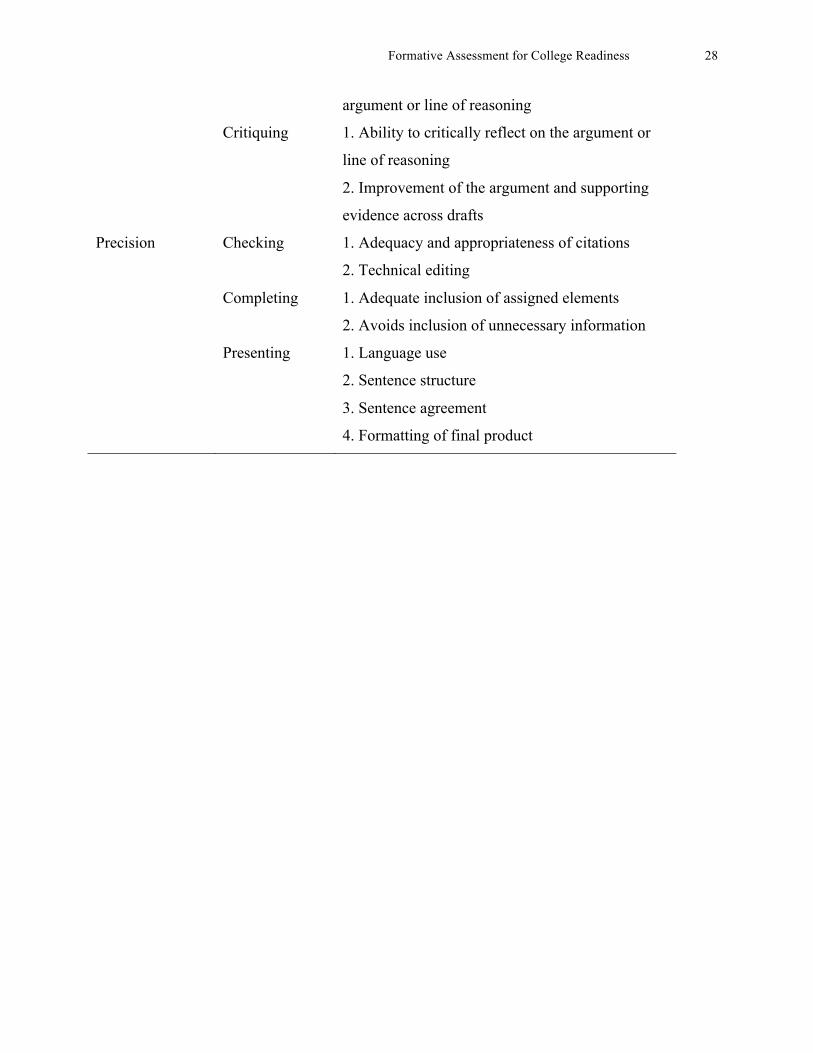
Formative Assessment for College Readiness 28
argument or line of reasoning
Critiquing 1. Ability to critically reflect on the argument or
line of reasoning
2. Improvement of the argument and supporting
evidence across drafts
Precision Checking 1. Adequacy and appropriateness of citations
2. Technical editing
Completing 1. Adequate inclusion of assigned elements
2. Avoids inclusion of unnecessary information
Presenting 1. Language use
2. Sentence structure
3. Sentence agreement
4. Formatting of final product

Formative Assessment for College Readiness 29
Figure A1. Item and latent distribution map, 10th grade benchmark
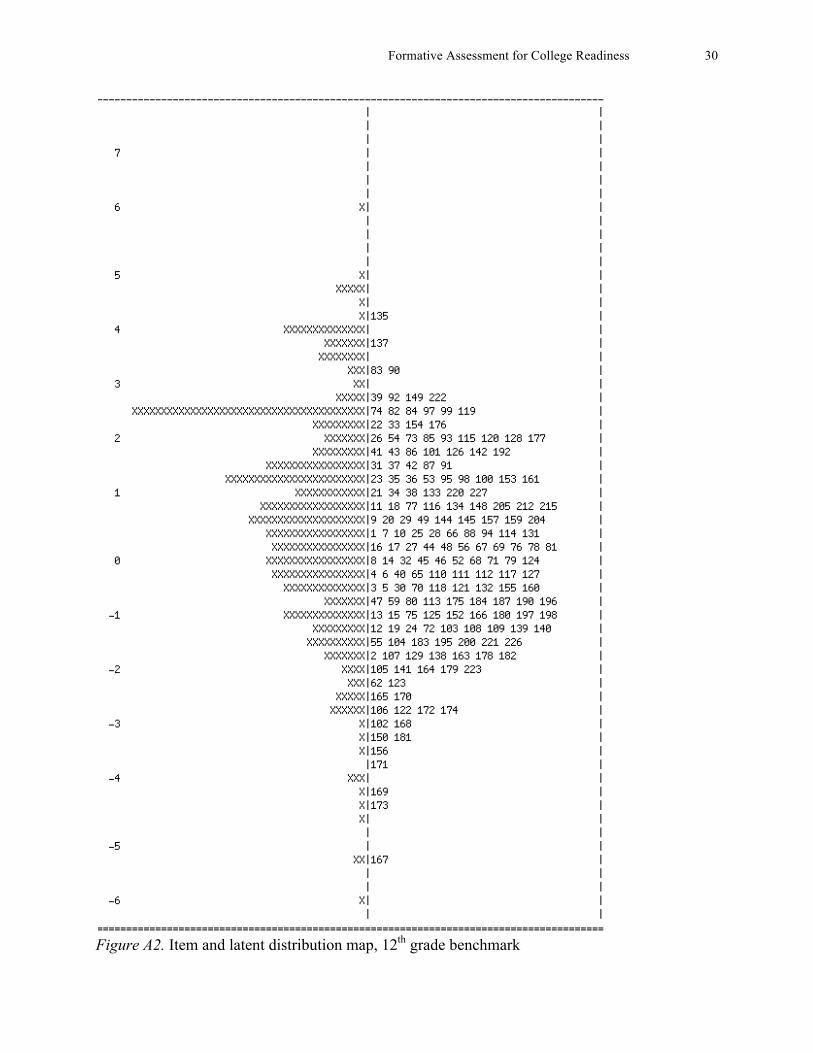
Formative Assessment for College Readiness 30
Figure A2. Item and latent distribution map, 12th grade benchmark

Formative Assessment for College Readiness 31
Figures and Tables
Figure 1. Model of key cognitive strategies (KCS)
Formative Assessment for College Readiness 32
Figure 2. Constructing measures process Table 1 Summary of KCS and Aspects with Total Number of Aspect Questions by Subject
Number of aspect questions KCS Aspect Math E/LA
Problem solving Understanding Hypothesizing Strategizing
2 1 2
1 1 1
Research Identifying Collecting Evaluating
1 2 2
1 2 1
Interpretation Integrating Analyzing Synthesizing
1 1 1
2 1 3
Reasoning Constructing Organizing Critiquing
1 1 2
3 1 2
Precision Checking Completing Presenting
1 1 2
2 2 4
Total Aspect Questions 21 27
Formative Assessment for College Readiness 33
Table 2
Teacher Guidelines for Selecting Student Work Samples
Course enrollment
Number of work samples to choose
Selection of work samples from rank order
12 or less 3 The second from the top The second from the bottom The one closest to the middle
13-16 4 The second from the top The second from the bottom The two closest to the middle
17-20 5 The second from the top The fourth from the top The second from the bottom The fourth from the bottom The one closest to the middle
21-24 6 The second from the top The fourth from the top The second from the bottom The fourth from the bottom The two closest to the middle
25-28 7 The second from the top The fourth from the top The sixth from the top The second from the bottom The fourth from the bottom The sixth from the bottom The one closest to the middle
29 or more 8 The second from the top The fourth from the top The sixth from the top The second from the bottom The fourth from the bottom The sixth from the bottom The two closest to the middle
Formative Assessment for College Readiness 34
Figure 3. Distribution plot of raw C-PAS scores
C-PAS Score
6040200-20
Stu
de
nts
200
150
100
50
0
C-PAS Scores - 10th and 12th Grade Benchmarks
Mean =10.89
Std. Dev. =8.446 N =1,795
Page 1

Formative Assessment for College Readiness 35
Table 3
Task Difficulty Levels Ranked from Least to Most Difficult
Benchmark Task Name Subject Difficulty 10th grade Trauma E/LA -2.47 Best Price Math -2.14 Author Research E/LA -2.06 Mythology E/LA -1.32 Viewpoint E/LA -1.31 Outfits Math -0.85 Of Mice and Men E/LA -0.77 Deal or No Deal Math -0.73 Tell Tale E/LA -0.54 Understanding Characters E/LA -0.52 Talk Show E/LA 0.17 Round and Square Math 0.36 Characters E/LA 0.39 Holes E/LA 0.62 Where Does the Time Go? Math 0.68 You Are What You Speak E/LA 1.46 Worst Invention E/LA 1.56 Circle Graphs Math 2.19 Tower of Hanoi Math 2.69 Overtime Pay Math 4.43 12th grade Stats Social Science Math -2.04 Trifles E/LA -0.70 Understanding Characters E/LA -0.50
Characters E/LA -0.25 Altitudes Math -0.10 Modest Solution E/LA 0.01 Societal Conflicts E/LA 0.02 Prison Debate E/LA 0.04 Smarter Packaging Math 0.15 Best Price Math 0.36 Candy Box Math 1.16 Tower of Hanoi Math 1.96
Formative Assessment for College Readiness 36
Figure 4. Standard error of estimates – grade 10 benchmark
Figure 5. Standard error of estimates – grade 12 benchmark
0 0.05 0.1 0.15 0.2 0.25 0.3 0.35 0.4 0.45
‐4 ‐3 ‐2 ‐1 0 1 2 3 4
Standard Error by Item Dif2iculty Grade 10
0 0.05 0.1 0.15 0.2 0.25 0.3 0.35 0.4 0.45
‐4 ‐3 ‐2 ‐1 0 1 2 3 4
Standard Error by Item Dif2iculty Grade 12
Formative Assessment for College Readiness 37
Table 4
Implications of Expanding Number of Performance Levels from Two to Four
Score Zone Label Number of Students
Percent of Students
10th grade (N = 1,117) 1 Initiates 26 2.3% 2 Approaches 448 40.1% 3 Meets 514 46.0% 4 Exceeds 129 11.5% 12th grade (N = 548) 1 Initiates 15 2.7% 2 Approaches 170 31.0% 3 Meets 300 54.7% 4 Exceeds 63 11.5%
Table 5
Test Reliability Statistics
Grade 10 Grade 12
MLE Person Separation Reliability .812 .777
EAP Person Separation Reliability .866 .792
Item Separation Reliability .990 .971
Table 6
Average Teacher and Moderators Scores By Subject
Math ELA Rater Type SD SD
Teachers 4.60 5.37 8.67 8.10 Scoring Moderators 2.68 4.06 8.08 8.10
(N =1,154)

Formative Assessment for College Readiness 38
Table 7
Continuous and Categorical Correlations of Four Popular C-PAS Tasks
Math E/LA Correlation Type
Tasks
r
N
p<
Tasks
r
N
p<
Continuous
Tower of Hanoi Where Does the Time Go?
.57
.73
52 60
. 01
. 01
Understanding Characters Worst Invention
.60 .39
49 25
. 01 . 01
Categorical Tower of Hanoi Where Does the Time Go?
.53
.63
52 60
. 01
. 01
Understanding Characters Worst Invention
.76 .60
25 47
.01 . 05
Table 8
Summary of Aspect Questions with Substantial Differences (more than one point) in Average Teacher and Moderator Scores
KCS Aspect Aspect Question Bench-mark
Number of tasks
ELA Problem solving
Strategizing Explanation of a strategy for solving the problem
12 2 of 5
Research Identifying Process for choosing sources 12 2 of 5 Research
Collecting 1 Breadth and level of sources used in data collection
12 2 of 5
Research Collecting 2 Organizational strategy for recording data or information
12 2 of 5
Reasoning Critiquing 2 Improvement of the argument across multiple drafts
10 12
2 of 8 2 of 5
Interpretation Integrating 2 Ability to organize the evidence for analysis
10 2 of 8
Interpretation Synthesizing 2 Connections made between the pieces of evidence
10 12
1 of 8 2 of 5
Precision Presenting 3 Sentence agreement 10 2 of 8
Math Reasoning Critiquing 2 Improvement across drafts 10
12 2 of 2 1 of 2
*10th grade benchmark includes 9th and 10th grade students; 12th grade benchmark includes students at the 11th and 12th grades.
Related Documents