College Majors, Unemployment & Earnings ANTHONY P. CARNEVALE HARD TIMES BAN CHEAH 2013 2013 COLLEGE MAJORS, UNEMPLOYMENT AND EARNINGS

Welcome message from author
This document is posted to help you gain knowledge. Please leave a comment to let me know what you think about it! Share it to your friends and learn new things together.
Transcript
College Majors, U
nemploym
ent & Earnings
1
ANTHONY P. CARNEVALE
HARD TIMES
BAN CHEAH
2013
2013
COLLEGE MAJORS, UNEMPLOYMENT AND EARNINGS

Colle
ge M
ajor
s, U
nem
ploy
men
t & E
arni
ngs
2
May 2013
Cover photo credit:© Early Sunday Morning by Edward Hopper/Corbis

College Majors, U
nemploym
ent & Earnings
3
While graduates, parents, and journalists raise thoughtful questions about the worth of a college degree, this update confirms what we’ve said all along: it still pays to earn one. As we recovered from the recession during 2010 and 2011, college graduates fared better than less educated workers. Overall unemployment rates during this period were 9–10 percent for non-college graduates compared to 4.6–4.7 percent for college graduates 25 years of age or older. However, recent college graduates with a Bachelor’s degree or better are still bearing the greatest unemployment risk, with unemployment rates ranging from a low of 4.8 percent to a high of 14.7 percent depending on their major. Despite the slow recovery, the overall unemployment rate for recent college graduates is 7.9 percent and the overall unemployment rate for graduate degree holders is 3.3 percent.
It Still Pays to Earn a College Degree But Not All College Degrees are created Equal
HARD TIMES
Colle
ge M
ajor
s, U
nem
ploy
men
t & E
arni
ngs
4
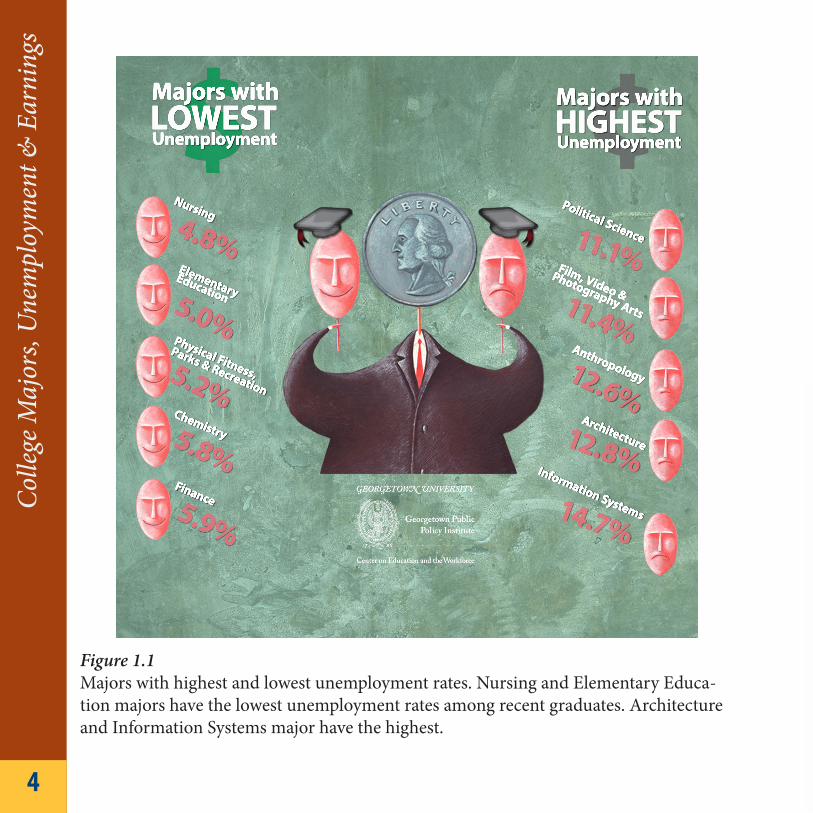
Figure 1.1Majors with highest and lowest unemployment rates. Nursing and Elementary Educa-tion majors have the lowest unemployment rates among recent graduates. Architecture and Information Systems major have the highest.
¢ Majors with HIGHEST
Unemployment$
14.7%
12.8%
12.6%
11.4%
11.1%
Political Science
Film, Video &Photography Arts
Anthropology
Architecture
Information Systems
4.8%
5.0%
5.2%
5.8%
5.9%
ElementaryEducation
Nursing
Physical Fitness,
Parks & Recreation
Chemistry
Finance
Majors with
Unemployment LOWEST

College Majors, U
nemploym
ent & Earnings
5
Just as Education Matters, So Does Field of Study The higher than average unemployment rates for recent college graduates tend to be concentrated in specific majors:
Unemployment is highest for film, video, and photographic arts (11.4%); commercial art and graphic design (10.5%); and fine arts (10.1 %). Within this sector drama and theater arts experienced the lowest unemployment at 6.4 percent.
Unemployment is highest in anthropology and archeology (12.6%); only slightly higher than the overall economy average of nine percent for English language and literature (9.8%); and for history, philosophy and religious studies majors (9.5%). Liberal Arts and foreign languages majors fared best with unemployment rates of 8.1 percent.
High unemployment rates are evenly spread across economics (10.4%); political science and government (11.1%); and sociology (9.9%). As with those in computer and mathematics, there is a brighter outlook for experienced Bachelor’s degree-holders and those with a Master’s degree or better.
Unemployment seems mostly concentrated in information systems (14.7 %) compared with computer science (8.7%) and mathematics (5.9%). As noted in an earlier report, hiring tends to be slower for users of information compared to those who write programs and create software applications. Moreover, the relatively low unemployment rates for experienced Bachelor’s degree-holders and those with a Master’s degree or better seem to indicate these majors have a stable employment outlook.
ARTSCOMPUTER &
MATHEMATICS
HUMANITIES & LIBERAL ARTS
SOCIAL SCIENCES

Colle
ge M
ajor
s, U
nem
ploy
men
t & E
arni
ngs
6
No Relief from Sector Specific Shocks
Hard Times During the Recovery
When workers are sorted by occupation and educational attainment, the risk of unemployment can be greater for workers in sectors affected by the recession than for recent college graduates employed elsewhere. For instance, the fallout from the real estate bubble of 2007 still haunts architecture majors whose unemployment rates are highest among all workers in related sectors. As disappointing as high unemployment rates for recent college graduates can be, a graduate degree or work experience sometimes shelters them from higher unemployment rates. For instance, the unemployment rate for recent architecture graduates was 12.8 percent, while the unemployment rate for graduates with experience in the field was 9.3 percent, the same rate for the economy overall. The unemployment rate decreased even further to 6.9 percent for those with a graduate degree.
During the recession even workers with a graduate degree in fields most affected by the recession were most vulnerable. For instance, recent college graduates who majored in education had a lower unemployment rate than those with a Master’s degree or better who majored in architecture for their undergraduate degree. However, graduate degree-holders still usually fared better. Except for architecture, the more educated, more experienced worker had a lower unemployment rate than the average worker in the overall economy.
Hard times could still be ahead for the current college students about to select a major. This report reconfirms a harsh reality: not all college degrees are created equal. Specific fields and the higher technical skills associated with these fields can and often do offer lower unemployment and higher earnings; however, as can be seen for architecture majors, certain fields of study can result in higher unemployment risk after graduation.

College Majors, U
nemploym
ent & Earnings
7
UNEMPLOYMENT RATES DECREASE AS RECENT COLLEGEGRADUATES GAIN EXPERIENCE AND GRADUATE EDUCATION
UNEMPLOYMENT RATES, 2010-2011
AG
RICU
LTU
RE A
ND
NAT
URA
L RE
SOU
RCES
COM
MU
NIC
ATIO
NS
AN
D JO
URN
ALI
SM
COM
PUTE
RS A
ND
M
ATH
EMAT
ICS
HU
MA
NIT
IES
AN
DLI
BERA
L A
RTS
LAW
AN
D P
UBL
ICPO
LICY
PSYC
HO
LOG
Y A
ND
SO
CIA
L W
ORK
SCIE
NCE
—LI
FE/P
HYS
ICA
L
SOCI
AL
SCIE
NCE
IND
UST
RIA
L A
RTS
ARC
HIT
ECTU
RE
ART
S
RECENT COLLEGE GRADUATE EXPERIENCED COLLEGE GRADUATE GRADUATE DEGREE HOLDER
BUSI
NES
S
EDU
CATI
ON
ENG
INEE
RIN
G
HEA
LTH
RECR
EATI
ON
2.3%
3.4%
6.1%
5.6%
6.9%
9.8%
6.9%
9.3%
12.8%
4.2%
6.0%
7.8%
3.6%
4.8%
9.1%
2.0%
4.0%
5.7%
3.0%
4.4%
7.4%
2.0%
2.6%
6.1%
3.0%
6.3%
9.0%
4.6%
8.2%
4.1%
4.8%
9.2%
3.4%
6.6%
8.8%
2.1%
4.8%
7.3%
4.0%
5.7%
10.3%
4.5%
5.2%
4.3%
5.2%
7.3%

Colle
ge M
ajor
s, U
nem
ploy
men
t & E
arni
ngs
8
EARNINGS INCREASE AS RECENT COLLEGEGRADUATES GAIN EXPERIENCE AND GRADUATE EDUCATION
MEDIAN EARNINGS, 2010-2011
AG
RICU
LTU
RE A
ND
NAT
URA
L RE
SOU
RCES
COM
MU
NIC
ATIO
NS
AN
D JO
URN
ALI
SM
COM
PUTE
RS A
ND
M
ATH
EMAT
ICS
HU
MA
NIT
IES
AN
DLI
BERA
L A
RTS
LAW
AN
D P
UBL
ICPO
LICY
PSYC
HO
LOG
Y A
ND
SO
CIA
L W
ORK
SCIE
NCE
—LI
FE/P
HYS
ICA
L
SOCI
AL
SCIE
NCE
IND
UST
RIA
L A
RTS
ARC
HIT
ECTU
RE
ART
S
BUSI
NES
S
EDU
CATI
ON
ENG
INEE
RIN
G
HEA
LTH
RECR
EATI
ON
33K
51K
67K
30K
48K
55K
36K
65K
72K
33K
54K
64K
45K
76K
91K
33K
44K
57K
54K
83K
101K
43K
65K
81K
30K
51K
66K
41K
71K
33K
56K
70K
30K
46K
60K
30K
60K
90K
36K
61K
84K
29K
50K
39K
63K
83K
RECENT COLLEGE GRADUATE EXPERIENCED COLLEGE GRADUATE GRADUATE DEGREE HOLDER

College Majors, U
nemploym
ent & Earnings
9
UNEMPLOYMENT RATES EARNINGS
MAJOR GROUP
AGRICULTURE AND NATURAL RESOURCES
ARCHITECTURE
ARTS
BUSINESS
ARCHITECTURE
FINE ARTSDRAMA AND THEATERARTSMUSICVISUAL AND PERFORMING ARTSCOMMERCIAL ART AND GRAPHIC DESIGNFILM VIDEO ANDPHOTOGRAPHIC ARTSSTUDIO ARTS
GENERAL BUSINESS
ACCOUNTINGBUSINESSMANAGEMENT AND ADMINISTRATIONBUSINESS ECONOMICSMARKETING AND MARKETING RESEARCHFINANCE
GENERAL AGRICULTURE
ANIMAL SCIENCES
PLANT SCIENCEAND AGRONOMY
NATURAL RESOURCES MANAGEMENT
MAJOR RECENT
COLLEGE GRADUATE
EXPERIENCEDCOLLEGE
GRADUATE
GRADUATEDEGREE HOLDER
RECENT COLLEGE
GRADUATE
EXPERIENCEDCOLLEGE
GRADUATE
GRADUATEDEGREE HOLDER
2.8%
4.1%
2.7%
4.7%
9.3%
7.3%
7.6%
5.1%
9.3%
6.7%
6.5%
7.3%
4.7%
5.1%
5.6%
5.9%
5.8%
4.4%
6.9%
6.0%
5.9%
4.8%
6.4%
3.9%
3.6%
4.7%
5.9%
4.0%
12.8%
10.1%
6.4%
8.6%
10.5%
11.4%
7.6%
8.8%
7.8%
6.6%
5.9%
$49,000
$46,000
$50,000
$55,000
$65,000
$48,000
$46,000
$46,000
$38,000
$50,000
$51,000
$38,000
$62,000
$66,000
$60,000
$75,000
$65,000
$72,000
$72,000
$55,000
$56,000
$55,000
$61,000
$84,000
$89,000
$77,000
$81,000
$98,000
$36,000
$29,000
$25,000
$30,000
$33,000
$30,000
$38,000
$43,000
$36,000
$36,000
$44,000
DETAILED UNEMPLOYMENT AND EARNINGS FOR COLLEGE MAJORS

Colle
ge M
ajor
s, U
nem
ploy
men
t & E
arni
ngs
10
UNEMPLOYMENT RATES EARNINGS
MAJOR GROUP
COMMUNICATIONS & JOURNALISM
COMPUTERS &MATHEMATICS
HUMAN RESOURCES AND PERSONNEL MANAGEMENTINTERNATIONAL BUSINESSHOSPITALITY MANAGEMENT
MISCELLANEOUSBUSINESS & MEDICALADMINISTRATION
COMMUNICATIONS
JOURNALISMMASS MEDIAADVERTISING AND PUBLIC RELATIONSFAMILY & CONSUMERSCIENCESCOMMUNICATIONTECHNOLOGIESINFORMATIONSYSTEMSCOMPUTER SCIENCE
INFORMATION SCIENCE
MANAGEMENT INFORMATION SYSTEMS ANDSTATISTICS
MAJOR RECENT
COLLEGE GRADUATE
EXPERIENCEDCOLLEGE
GRADUATE
GRADUATEDEGREE HOLDER
RECENT COLLEGE
GRADUATE
EXPERIENCEDCOLLEGE
GRADUATE
GRADUATEDEGREE HOLDER
6.0%
8.2%
7.0%
8.9%
7.3%
6.4%
14.7%
8.7%
5.4%
4.0%
4.3%
7.9%
5.9% 5.1%
6.0%
5.4%
7.9%
5.8%
5.6%
6.7%
4.4%
4.7%
5.2%
4.4%
4.2%
6.2%
3.9%
5.4%
3.6%
$30,000
$33,000
$32,000
$31,000
$33,000
$30,000
$40,000
$50,000
$70,000
$66,000
$69,000
$53,000
$58,000
$97,000
$81,000
$52,000
$57,000
$60,000
$58,000
$58,000
$76,000
$56,000
$51,000
$57,000
$57,000
$43,000
$66,000
$81,000
$71,000
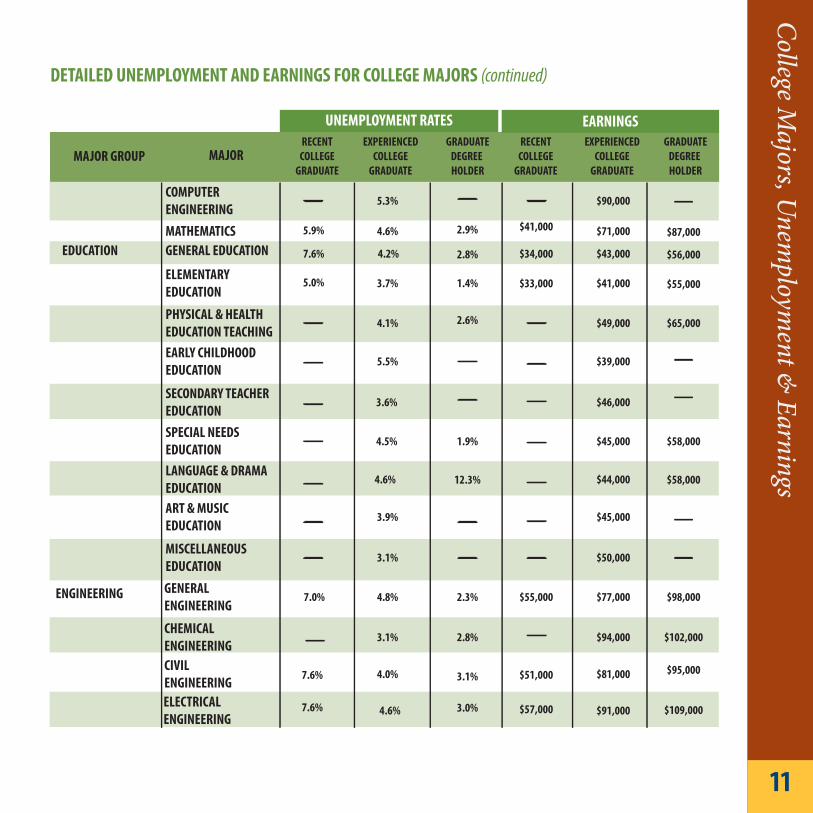
DETAILED UNEMPLOYMENT AND EARNINGS FOR COLLEGE MAJORS (continued)
College Majors, U
nemploym
ent & Earnings
11
UNEMPLOYMENT RATES EARNINGS
MAJOR GROUP
EDUCATION
ENGINEERING
COMPUTER ENGINEERINGMATHEMATICSGENERAL EDUCATION
PHYSICAL & HEALTHEDUCATION TEACHINGEARLY CHILDHOODEDUCATION
SECONDARY TEACHEREDUCATIONSPECIAL NEEDS EDUCATIONLANGUAGE & DRAMAEDUCATIONART & MUSICEDUCATION
MISCELLANEOUSEDUCATIONGENERAL ENGINEERING
CHEMICALENGINEERINGCIVILENGINEERINGELECTRICALENGINEERING
ELEMENTARY EDUCATION
MAJOR RECENT
COLLEGE GRADUATE
EXPERIENCEDCOLLEGE
GRADUATE
GRADUATEDEGREE HOLDER
RECENT COLLEGE
GRADUATE
EXPERIENCEDCOLLEGE
GRADUATE
GRADUATEDEGREE HOLDER
7.6%
7.0%
4.2%
3.7%5.0%
4.1%
4.6% 2.9%
2.8%
1.4%
2.6%
5.9%
5.3%
5.5%
3.6%
4.5%
4.6%
3.9%
3.1%
4.8%
3.1%
4.0%7.6%
1.9%
12.3%
2.3%
2.8%
3.1%
3.0%
$34,000
$33,000
$41,000
$55,000
$51,000
$57,000
$58,000
$58,000
$102,000
$98,000
$109,000
$95,000
$43,000
$90,000
$71,000
$39,000
$49,000 $65,000
$41,000
$56,000
$87,000
$55,000
$46,000
$45,000
$44,000
$50,000
$45,000
$77,000
$94,000
$81,000
4.6%7.6% $91,000
DETAILED UNEMPLOYMENT AND EARNINGS FOR COLLEGE MAJORS (continued)

Colle
ge M
ajor
s, U
nem
ploy
men
t & E
arni
ngs
12
UNEMPLOYMENT RATES EARNINGS
MAJOR GROUP
HEALTH
INDUSTRIAL &MANUFACTURING ENGINEERINGMECHANICALENGINEERING
MISCELLANEOUS ENGINEERING
INDUSTRIAL PRODUCTION TECHNOLOGIESMISCELLANEOUS ENGINEERING TECHNOLOGIESGENERAL MEDICAL& HEALTH SERVICES
HEALTH & MEDICAL ADMINISTRATIVESERVICESMEDICAL TECHNOLOGIES TECHNICIANS
NURSING
PHARMACY PHARMACUETICAL SCIENCES AND ADM.
TREATMENT THERAPYPROFESSIONS
ELECTRICAL ENGINEERING TECHNOLOGY
MAJOR RECENT
COLLEGE GRADUATE
EXPERIENCEDCOLLEGE
GRADUATE
GRADUATEDEGREE HOLDER
RECENT COLLEGE
GRADUATE
EXPERIENCEDCOLLEGE
GRADUATE
GRADUATEDEGREE HOLDER
5.8%
5.7%
2.5%
3.4% 2.9%8.1%
5.1%
7.1%
3.9%
4.6%
2.8%
2.3%4.8%
2.5% 2.9%
2.1%
1.7%
$57,000
$48,000
$76,000
$80,000
$86,000
$66,000
$70,000
$70,000
$101,000
$56,000
$55,000
$61,000
$108,000 $110,000
$65,000 $81,000
$65,000
DETAILED UNEMPLOYMENT AND EARNINGS FOR COLLEGE MAJORS (continued)

College Majors, U
nemploym
ent & Earnings
13
UNEMPLOYMENT RATES EARNINGS
MAJOR GROUP
HUMANITIES &LIBERAL ARTS
AREA ETHNIC &CIVILIZATION STUDIES
LINGUISTICS &COMPARATIVELANGUAGEFRENCH, GERMANLATIN AND OTHERCOMMON FOREIGN LANGUAGES
LIBERAL ARTS
HUMANITIES
INTERDISCIPLINARYSTUDIESINTERCULTURAL &INTERNATIONAL STUDIESPHILOSOPHY &RELIGIOUS STUDIES
THEOLOGY &RELIGIOUS STUDIESANTHROPOLOGY &ARCHEOLOGYART HISTORY &CRITICISM
ENGLISH LANGUAGE& LITERATURE
MAJOR RECENT
COLLEGE GRADUATE
EXPERIENCEDCOLLEGE
GRADUATE
GRADUATEDEGREE HOLDER
RECENT COLLEGE
GRADUATE
EXPERIENCEDCOLLEGE
GRADUATE
GRADUATEDEGREE HOLDER
5.0%
6.3%
6.7%
3.1%
3.9%
4.0%
4.0%
7.3%
8.1%
7.2% 3.9%
9.8%
9.8%
8.1%
8.5%
7.4%
7.3%9.5%
3.9%
12.6% 6.7% 4.6%
8.3%
3.2%
$29,000
$52,000
$55,000 $73,000
$54,000
$48,000
$51,000
$52,000
$63,000
$68,000
$65,000
$30,000
$31,000
$31,000
$45,000
$54,000
$48,000
$45,000$27,000 $63,000
$41,000 $48,000
$62,000
$48,000
HISTORY 5.8% 3.7%9.5% $55,000 $76,000$32,000
DETAILED UNEMPLOYMENT AND EARNINGS FOR COLLEGE MAJORS (continued)
Colle
ge M
ajor
s, U
nem
ploy
men
t & E
arni
ngs
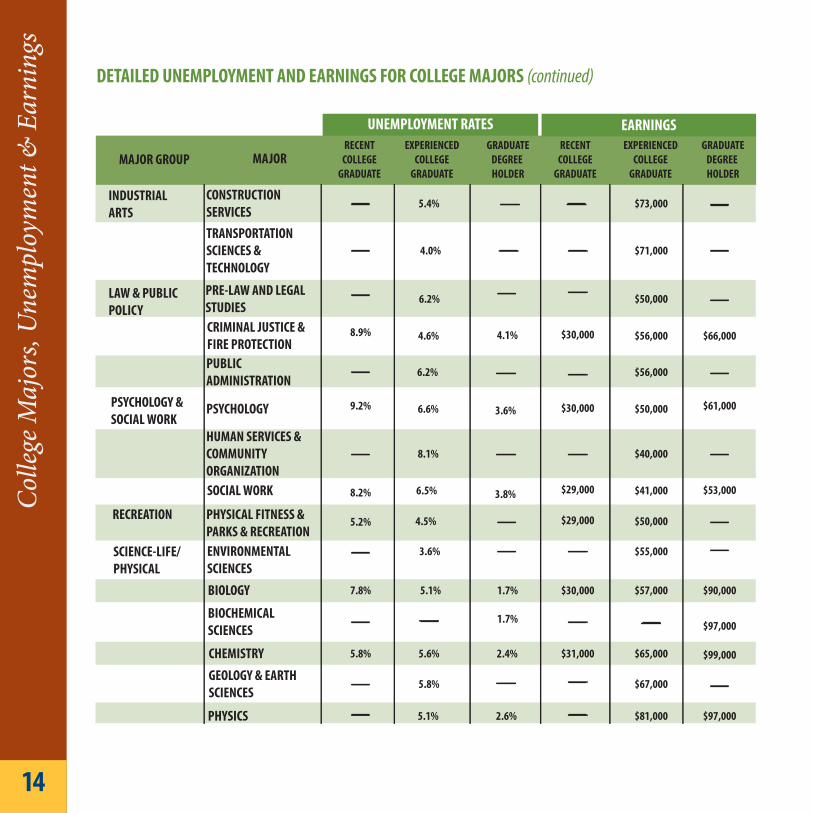
14
UNEMPLOYMENT RATES EARNINGS
MAJOR GROUP
INDUSTRIAL ARTS
LAW & PUBLICPOLICY
PSYCHOLOGY &SOCIAL WORK
RECREATION
SCIENCE-LIFE/PHYSICAL
CONSTRUCTIONSERVICESTRANSPORTATION SCIENCES &TECHNOLOGY
PRE-LAW AND LEGALSTUDIES
PUBLICADMINISTRATION
PSYCHOLOGY
HUMAN SERVICES &COMMUNITY ORGANIZATIONSOCIAL WORK
PHYSICAL FITNESS & PARKS & RECREATIONENVIRONMENTAL SCIENCES
BIOLOGY
BIOCHEMICAL SCIENCES
CRIMINAL JUSTICE &FIRE PROTECTION
MAJOR RECENT
COLLEGE GRADUATE
EXPERIENCEDCOLLEGE
GRADUATE
GRADUATEDEGREE HOLDER
RECENT COLLEGE
GRADUATE
EXPERIENCEDCOLLEGE
GRADUATE
GRADUATEDEGREE HOLDER
6.2%
4.6%
6.2%
4.1%
3.8%
4.0%
5.4%
6.6% 3.6%
8.9%
9.2%
8.1%
6.5%
4.5%5.2%
8.2%
3.6%
7.8% 5.1% 1.7%
1.7%
$29,000
$29,000
$50,000
$73,000
$71,000
$50,000
$56,000
$56,000 $66,000
$61,000$30,000
$30,000
$40,000
$41,000
$50,000
$57,000$30,000 $90,000
$55,000
$53,000
CHEMISTRY 5.6% 2.4%5.8% $65,000
$97,000
$31,000
GEOLOGY & EARTHSCIENCES
5.8% $67,000
$99,000
PHYSICS 5.1% 2.6% $81,000 $97,000
DETAILED UNEMPLOYMENT AND EARNINGS FOR COLLEGE MAJORS (continued)

College Majors, U
nemploym
ent & Earnings
15
DETAILED UNEMPLOYMENT AND EARNINGS FOR COLLEGE MAJORS (continued)
UNEMPLOYMENT RATES EARNINGS
MAJOR GROUP
SOCIAL SCIENCE
MULTI-DISCIPLINARYOR GENERAL SCIENCE
INTERDISCIPLINARYSOCIAL SCIENCES
GENERAL SOCIAL SCIENCES
GEOGRAPHY
INTERNATIONAL RELATIONSPOLITICAL SCIENCE &GOVERNMENT
SOCIOLOGY
ECONOMICS
MAJOR RECENT
COLLEGE GRADUATE
EXPERIENCEDCOLLEGE
GRADUATE
GRADUATEDEGREE HOLDER
RECENT COLLEGE
GRADUATE
EXPERIENCEDCOLLEGE
GRADUATE
GRADUATEDEGREE HOLDER
7.5%
5.3%
5.5%
4.2%
4.2%
3.6%
6.4%
3.9% 2.3%6.6%
6.8% 3.7%
10.4%
11.1% 5.8%
6.1%9.9% $30,000
$35,000
$51,000
$56,000 $83,000$35,000
$45,000
$68,000
$60,000
$75,000 $102,000
$95,000
$46,000
$65,000
$50,000 $61,000
$87,000
Colle
ge M
ajor
s, U
nem
ploy
men
t & E
arni
ngs
16
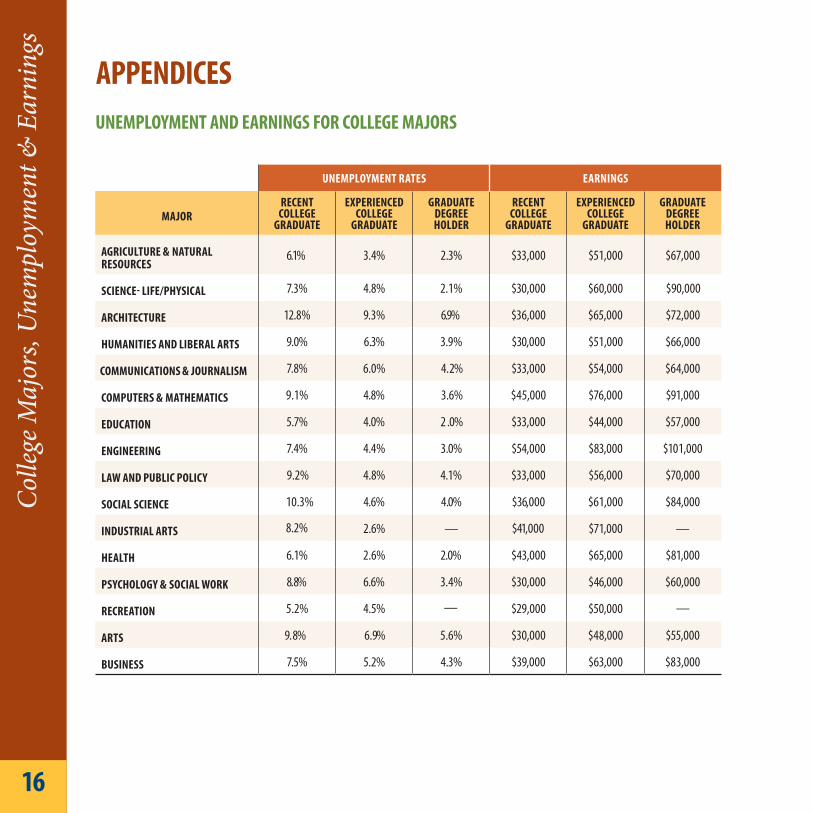
APPENDICESUNEMPLOYMENT AND EARNINGS FOR COLLEGE MAJORS
UNEMPLOYMENT RATES EARNINGS
MAJORRECENT
COLLEGE GRADUATE
EXPERIENCED COLLEGE
GRADUATE
GRADUATE DEGREE HOLDER
RECENT COLLEGE
GRADUATE
EXPERIENCED COLLEGE
GRADUATE
GRADUATE DEGREE HOLDER
AGRICULTURE & NATURAL RESOURCES
6.1% 3.4% 2.3% $33,000 $51,000 $67,000
SCIENCE LIFE/PHYSICAL 7.3% 4.8% 2.1% $30,000 $60,000 $90,000
ARCHITECTURE 12.8% 9.3% 6.9% $36,000 $65,000 $72,000
HUMANITIES AND LIBERAL ARTS 9.0% 6.3% 3.9% $30,000 $51,000 $66,000
COMMUNICATIONS & JOURNALISM 7.8% 6.0% 4. 2% $33,000 $54,000 $64,000
COMPUTERS & MATHEMATICS 9.1% 4.8% 3.6% $45,000 $76,000 $91,000
EDUCATION 5.7% 4.0% 2 .0% $33,000 $44,000 $57,000
ENGINEERING 7.4% 4.4% 3.0% $54,000 $83,000 $101,000
LAW AND PUBLIC POLICY 9.2% 4.8% 4.1% $33,000 $56,000 $70,000
SOCIAL SCIENCE 10.3% 4.6% 4.0% $36,000
$41,000
$61,000 $84,000
INDUSTRIAL ARTS 2.6%8.2% — $71,000 —
HEALTH 6.1% 2.6% 2.0% $43,000 $65,000 $81,000
PSYCHOLOGY & SOCIAL WORK 8. 8% 6.6% 3.4% $30,000 $46,000 $60,000
RECREATION 5.2% 4.5% $29,000 $50,000
ARTS 9. 8% 6 . 9% 5.6% $30,000 $48,000 $55,000
BUSINESS 7.5% 5.2% 4.3% $39,000 $63,000 $83,000
——
College Majors, U
nemploym
ent & Earnings
17
Methodology
Acknowledgements
Data from the American Community Survey for the years 2010 and 2011 were pooled to provide a larger sample size for the estimates. The unemployment rates were then computed for each of the three groups by dividing the total unemployed with the total employed and unemployed. The earnings used are median earnings in 2010 dollars rounded to the nearest $1,000. The three groups are: recent college graduates (those between ages 22 and 26 with bachelor degrees), experienced college graduates (those between ages 30 and 54), and graduate degree holders (those with master’s degrees or higher and are between 30 and 54). Median earnings are based on those who worked more than 35 hours a week and at least 50 weeks a year. All calculations use the survey weights provided by the Census Bureau.
We would like to express our gratitude to the individuals and organizations that have made this report possible. First we thank Lumina Foundation, Bill and Melinda Gates Foundation and the Joyce Foun-dation for their support of our research over the past few years, and in particular we are grateful for the support of Jamie Merisotis, Holly Zanville, Daniel Greenstein, Elise Miller and Whitney Smith. We are honored to be partners in their mission of promoting postsecondary access and completion for all Americans.
Special thanks to Andrea Porter who provided superb research and editorial assistance throughout. We would also like to thank Ana Castanon – the report’s designer, Stephanie Soutouras-Schlick– the report’s editor and Isabel Macdonald - the report’s translator.
Many have contributed their thoughts and feedback throughout the production of this report. That said, all errors, omissions, and views remain the responsibility of authors.
The views expressed in this publication are those of the authors and do not necessarily represent those of Lumina Foundation, Bill and Melinda Gates Foundation or Joyce Foundation, their officers, or employees.
Related Documents