Learn More www.dstsystems.com COLLECTIVE INVESTMENT TRUSTS – A PERFECT STORM A DST White Paper: March 2017 By Erach Desai and Jason Dauwen Investments RETIREMENT

Welcome message from author
This document is posted to help you gain knowledge. Please leave a comment to let me know what you think about it! Share it to your friends and learn new things together.
Transcript

Learn More www.dstsystems.com
COLLECTIVE INVESTMENT TRUSTS – A PERFECT STORMA DST White Paper: March 2017
By Erach Desai and Jason DauwenInvestments
RETIREMENT

2Learn More www.dstsystems.com
Table of ContentsCollective Investment Trusts – A Perfect Storm ..............................................................................................................................3
Executive Summary ............................................................................................................................................................................ 3
Defining the Landscape ........................................................................................................................................................................4The History of Collective Investment Trusts .................................................................................................................................... 5
Nature of CITs: Just Another Investment Vehicle? .......................................................................................................................... 6
Operational Logistics for CITs ........................................................................................................................................................... 7
Pros & Cons: Vis-à-Vis Mutual Funds .............................................................................................................................................. 11
What’s Driving CIT Adoption in Today’s Market? ........................................................................................................................... 14Retirement Market Opportunity ....................................................................................................................................................... 15
Cost Advantage: Playing to the Fiduciary Duty .............................................................................................................................. 18
Pricing Flexibility: A Structural Advantage ...................................................................................................................................... 20
Investment Design Flexibility: Customized, Outcome-Driven Portfolios ...................................................................................... 21
Profitable . . . At Smaller Plan Sizes ................................................................................................................................................ 22
Key Findings and Looking to the Future ......................................................................................................................................... 23
Appendices .......................................................................................................................................................................................... 26About This White Paper ................................................................................................................................................................... 26
Bibliography of Reference Materials .............................................................................................................................................. 27

3Learn More www.dstsystems.com
Executive SummaryCollective Investment Trusts (CITs) have been around for generations – nearly as long as mutual funds. Yet for the vast majority of their existence, they were available only in Defined Benefits (DB) plans, allowing mutual funds to race ahead and become the vehicle of choice in the Defined Contributions (DC) market.
But all of that is changing dramatically.
After entering the DC market in 2006, CITs have become the fastest growing investment vehicle within 401(k) plans over the past seven years. Now, we believe that a combination of factors, including their inherent cost advantages and growing regulatory compliance requirements, may be creating the perfect storm for CITs—one that will enable them to become a dominant investment vehicle in the defined contribution market as well.
Based on our analysis, CITs are already outpacing the overall retirement market, growing at a 7-year CAGR of 14.4%, compared with less than 9 percent for the overall retirement market over the same time period. In the 401(k) market in particular, CITs have been gaining even more steam: They have been growing at a CAGR of 18.3 percent, greatly outpacing both mutual funds and the expansion of 401(k) plans overall.
Looking ahead, DST kasina believes CITs could reach $3.1 trillion in total retirement assets by the end of 2018, up from $1.9 trillion at the end of 2015. And perhaps most significantly, that is only a small measure of the vehicle’s potential. Based on our analysis of market data, CITs represented less than 14% of assets in all CIT-eligible plans in 2015, which means there is still ample headroom left for CITs to grow in the years to come. (For DST kasina’s detailed analysis of the size and growth of the CIT market, see pages 14-17).
Some fundamental changes are driving this growth. CITs have overcome many of the historical disadvantages they once faced against mutual funds in several essential categories, like transparency, daily pricing and investor education. In fact, many of the traits that separate CITs from mutual funds are increasingly turning out to be compelling advantages, especially in the areas of pricing flexibility, broader investment options and flexibility of portfolio design.
Our discussions with senior executives in the retirement market confirmed many of these observations. From speaking with DCIO operations executives and asset managers in the DC space, we learned that:
• Most plan sponsors, based on our interviews, are effectively considering CITs as one of the investment option sleeves for their 401(k) plans. The primary reason is that CITs have a structural cost advantage over mutual funds, costing less from both a compliance and advertising standpoint.
• Our panel of experts was generally confident that the relative cost savings of CITs over mutual funds stood in the 10 to 30 basis point range.
• The pricing flexibility of CITs is universally considered to be a great advantage for CITs over mutual funds, making them more like institutional separate accounts.
• The breadth of investment options and the flexibility to customize outcome-driven plans are also considered to be a major advantage of CITs.
• Plan size does have a bearing on which investment vehicle should be utilized. Based on our interviews, most new CIT strategies are now breakeven to slightly profitable in the $25mm to $50mm range, compared to ~$250mm 10 years ago. Efficiencies in tracking, trading, operations and extending the reach of the portfolio management team have helped make CITs more profitable on a smaller scale.
In other words, the sweet spot for CITs in the retirement market is expanding across the defined contribution market to include medium and large plans. To be clear, we are not predicting the demise of mutual funds in the retirement market, especially not for institutional and R6 share classes. Seismic shifts do not occur overnight.
But major changes in the investment landscape—including the cost savings of CITs, a decade plus of litigation against plan sponsors charging excessive fees, and most recently the Department of Labor Fiduciary Rule requiring investments “in the best interest of” plan participants—are enabling CITs to eclipse mutual funds in the defined contributions market in the years ahead.

4Learn More www.dstsystems.com
Defining the LandscapeOrigin and History of CITs: Destined for defined contribution plans?Although Collective Investment Trusts (CITs) have been available since the 1920s, they were initially only permitted in Defined Benefit (DB) plans (when Congress amended the IRS code in 1936). CITs then gained widespread adoption in the 1950s when the Federal Reserve authorized banks to pool together funds from pensions, corporate profit-sharing plans and stock bonus plans. The IRS also granted these plans tax-exempt (deferred) status.
The first collective trust was actually created in 1927. The timing could not have been more challenging. Two years later, when the stock market crashed, some market observers blamed these newly-created pooled funds. The mere perception of how CITs may have contributed to the crash led to severe restrictions being imposed. Thus, by a curious twist of fate, CITs were restricted to being offered to only trust clients under the umbrella of an employee benefit plan.
With the advent of 401(k) plans in the 1980s, CITs initially gained adoption and traction in the surge of defined contribution (DC) plans. However, CITs were generally not required to ascertain (and publish) their net asset value more often than on a quarterly basis at the time—and they rarely did. Mutual funds—with simple-to-understand features like daily valuations and trading, choices of investment styles and strong branding—started their foray into the DC market and have ended up as the dominant investment vehicle deployed in the DC market today.
Collective Investment Trusts are also known as:• Collective Investment Funds (official term-
comptroller's handbook)
• Common Trust Funds
• Common Funds
• Collective Trusts
• Commingled Trusts

5Learn More www.dstsystems.com
First Collective
Investment Trust
1927
CITs seen as a
contributor to market
crash
1929Stock Market
Crash
CITs restricted
to DB plans
1936Congress
amends IRS code
CITs gain widespread adoption in
DB plans
1950sFederal Reserve
authorizes banks to pool
funds from pensions, corporate
profit-sharing plans, and stock
bonus plans
CITS in Defined
Contribu-tion plans—mainly sta-ble value
funds
1980sAdvent of
401(k) plans
NSCC trad-ing of CITs; uncommit-ted 401(k) funds go to QDIAs (TDFs)
2000s2000—NSCC adds CITs to mutual fund
trading platform
2006—Pension Protection Act triggers DOL
to set QDIA as default
CIT adoption in DC plans
Current2016—DOL
release fiduciary rule
resulting in fee pressure
The History of Collective Investment Trusts
Source: DST kasina with data from Department of Labor, Investment Company Institute
Two important developments for CITs occurred in the 2000s—both of which cleared some of the historical barriers for CITs in the defined contribution market:
• In 2000, the National Securities Clearing Corporation (NSCC) added CITs to its mutual fund trading platform. Based on data provided by the Coalition of Collective Investment Trusts, DST kasina believes that the vast majority of CITs trade and price daily.
• In 2006, President Bush signed the Pension Protection Act that triggered the U.S. Department of Labor (DOL) to “bless” Qualified Default Investment Alternatives
(QDIAs). At a simplistic level, this ruling required retirement plan sponsors (companies) to automatically invest uncommitted 401(k) dollars into QDIAs—which are dominated by Target Date Funds (TDFs).
Not all Target Date Funds are implemented as CITs (many initially were, and still are, mutual funds). But, the CIT “wrapper”—a more flexible investment structure that is better suited to longer-term, outcome-based strategies—has enabled ERISA-compliant TDFs to proliferate. We will explore the investment design flexibilities of CITs later in this white paper.
6Learn More www.dstsystems.com
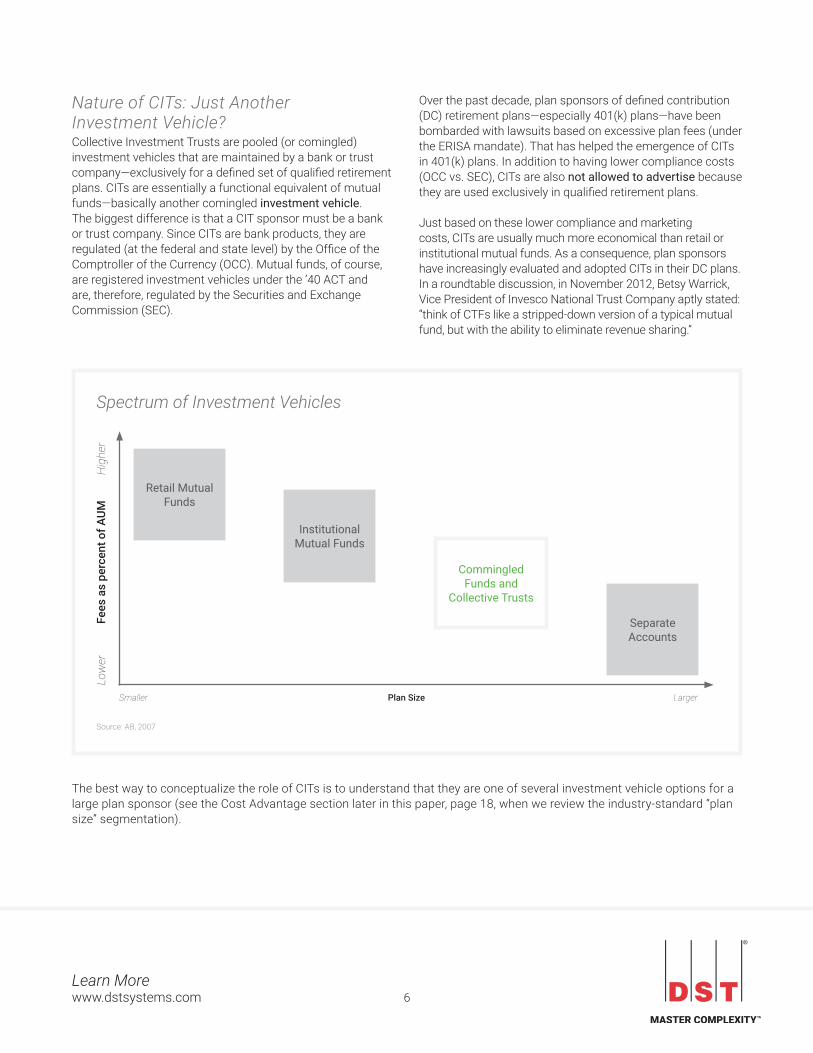
Nature of CITs: Just Another Investment Vehicle?Collective Investment Trusts are pooled (or comingled) investment vehicles that are maintained by a bank or trust company—exclusively for a defined set of qualified retirement plans. CITs are essentially a functional equivalent of mutual funds—basically another comingled investment vehicle. The biggest difference is that a CIT sponsor must be a bank or trust company. Since CITs are bank products, they are regulated (at the federal and state level) by the Office of the Comptroller of the Currency (OCC). Mutual funds, of course, are registered investment vehicles under the ’40 ACT and are, therefore, regulated by the Securities and Exchange Commission (SEC).
Over the past decade, plan sponsors of defined contribution (DC) retirement plans—especially 401(k) plans—have been bombarded with lawsuits based on excessive plan fees (under the ERISA mandate). That has helped the emergence of CITs in 401(k) plans. In addition to having lower compliance costs (OCC vs. SEC), CITs are also not allowed to advertise because they are used exclusively in qualified retirement plans.
Just based on these lower compliance and marketing costs, CITs are usually much more economical than retail or institutional mutual funds. As a consequence, plan sponsors have increasingly evaluated and adopted CITs in their DC plans. In a roundtable discussion, in November 2012, Betsy Warrick, Vice President of Invesco National Trust Company aptly stated: “think of CTFs like a stripped-down version of a typical mutual fund, but with the ability to eliminate revenue sharing.”
The best way to conceptualize the role of CITs is to understand that they are one of several investment vehicle options for a large plan sponsor (see the Cost Advantage section later in this paper, page 18, when we review the industry-standard “plan size” segmentation).
Spectrum of Investment Vehicles
Low
er
Fees
as
perc
ent o
f AUM
H
ighe
r
Retail Mutual Funds
Institutional Mutual Funds
Commingled Funds and
Collective Trusts
Separate Accounts
Smaller Plan Size Larger
Source: AB, 2007

7Learn More www.dstsystems.com
Source: Code of Federal Regulations for Banks and Banking
Two Types of Collective Investment Trust
A1 A2
Grouped assets contributed for the purpose of investment or
reinvestment as part of a trust, or guardianship, or custodian under the
Uniform Gift to Minor Act (UGMA)
Grouped assets contributed solely for retirement, pension, profit sharing, stock bonus, or other trusts that are
exempt from federal income tax.
Operational Logistics for CITs CITs are similar to other pooled (or comingled) investments in that qualified investors with similar objectives merge their assets into a single portfolio. The portfolio manager, or sub-advisor, hired by the bank / trust company then invests the assets according to the set investment objectives. Unlike mutual funds, CITs are not governed by the SEC under the Investment Company Act of 1940, but are primarily regulated by the OCC (the Department of Labor and Internal Revenue Service, have secondary oversight).
CITs are created because an asset management firm determines that this is an efficient investment vehicle for a particular investment strategy. But the actual offering of a CIT
has to come from a trust company, or bank, that maintains the trust documents (and other legal documents). In some cases, the trust company may be an affiliate of the asset management company.
This is one key distinction between a mutual fund and a CIT: a mutual fund can be launched (and seeded) by an asset management firm without outside investors. However, a CIT can only be launched based on a specific request from a fund sponsor to a bank / trust company, and can only be funded with qualified outside assets.
The table on the following page shows the major differences between CITs, Mutual Funds, and ETFs.
Technically there are two types of collective investment trusts as defined under Code of Federal Regulations for Banks and Banking. This white paper will focus on the latter CIT category and its progress in the retirement market.

8Learn More www.dstsystems.com
Source: Code of Federal Regulations for Banks and Banking
Feature/Characteristic
CollectiveInvestmentTrust(CIT)
MutualFund(MF)
Exchange-TradedFund(ETF)
TypeofInvestmentVehicle
PooledHeld at Bank or Trust Co.Exclusive to certain DC plans—not available to individual investors
PooledHeld by Asset Management Company
PooledHeld by Authorized Participant
SalesChannel Institutional only Institutional and Retail Institutional and Retail
MarketingMaterials
Fact Sheets: Performance DataNo advertising allowed
Prospectus and various literature
Prospectus and various literature
TradingandValuation
Most can trade via NSCC NSCC tradingDaily valuation
Exchange TradedIntra-Day valuation
Share/UnitClasses
Multiple Multiple Single
FeeStructure Negotiated with Plan Sponsor Set by Asset Manager Set by Asset Manager
OversightandRegulation
Office of the Comptroller of Currency (OCC), IRS, and DOLFund Trustee subject to ERISA standards
SEC and Investment Company Act of 1940Manager not held to ERISA standards
SEC and Investment Company Act of 1940Manager not held to ERISA standards
GoverningDocuments
Declaration of Trust and OCC Asset Management Handbook
Prospectus and additional filings Prospectus and additional filings
FinancialReporting Audited Financial StatementsForm 5500 optional, but usually filed by trustee
Annual reportForm 5500 required
Annual ReportForm 5500 required
LaunchingParty Must come from Plan Sponsor to a Bank of Trust Company
Asset Management Company Fund or Trust
Portability Must be liquidated to rollover Possible to rollover seamlessly Seamless rollover
ManagementCostandPricingFlexibility
Commonly lower compliance, administrative, advertising, and marketing costs allows plan level pricing flexibility and may vary in assessing operating and management expenses
Increased regulatory scrutiny on costs and fees. Higher fees due to compliance, administration, advertising, and marketing. Pricing breaks cannot be done at the plan level
Generally lower expense rations than similar actively managed mutual funds
Comparing CITs with Mutual Funds and ETFs
9Learn More www.dstsystems.com
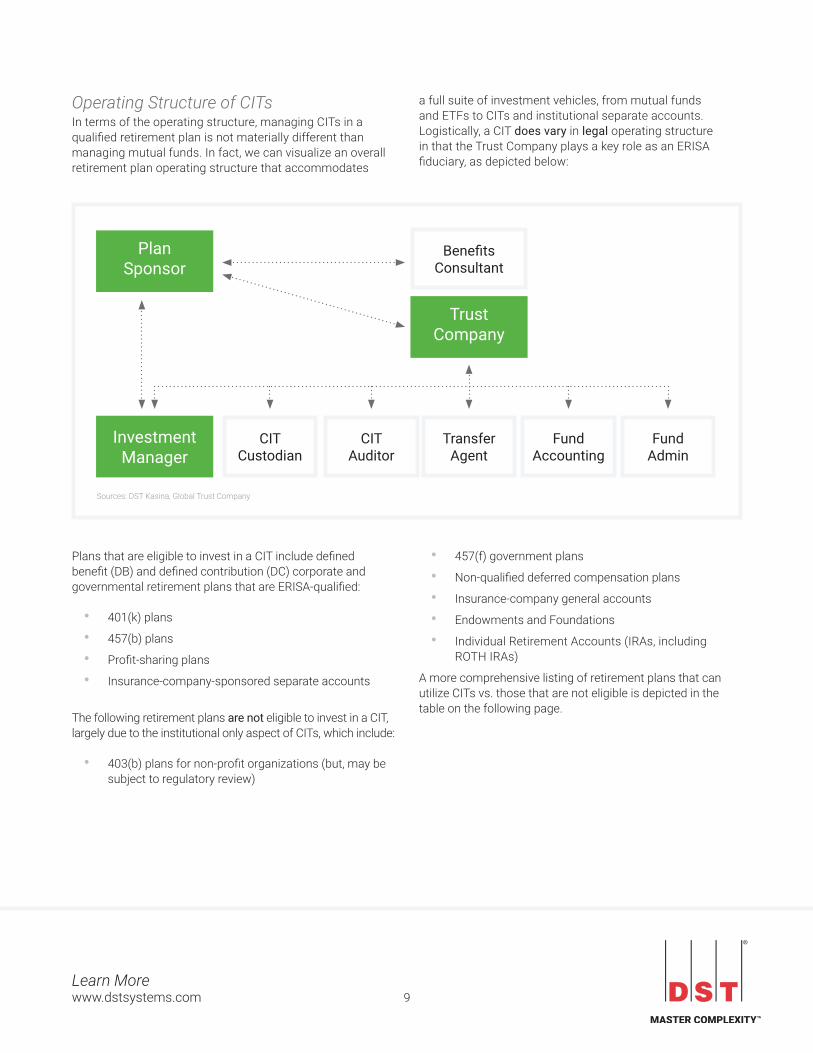
Operating Structure of CITsIn terms of the operating structure, managing CITs in a qualified retirement plan is not materially different than managing mutual funds. In fact, we can visualize an overall retirement plan operating structure that accommodates
a full suite of investment vehicles, from mutual funds and ETFs to CITs and institutional separate accounts. Logistically, a CIT does vary in legal operating structure in that the Trust Company plays a key role as an ERISA fiduciary, as depicted below:
Sources: DST Kasina, Global Trust Company
Plan Sponsor
Investment Manager
Trust Company
Benefits Consultant
CITAuditor
CIT Custodian
Transfer Agent
Fund Accounting
Fund Admin
Plans that are eligible to invest in a CIT include defined benefit (DB) and defined contribution (DC) corporate and governmental retirement plans that are ERISA-qualified:
• 401(k) plans
• 457(b) plans
• Profit-sharing plans
• Insurance-company-sponsored separate accounts
The following retirement plans are not eligible to invest in a CIT, largely due to the institutional only aspect of CITs, which include:
• 403(b) plans for non-profit organizations (but, may be subject to regulatory review)
• 457(f) government plans
• Non-qualified deferred compensation plans
• Insurance-company general accounts
• Endowments and Foundations
• Individual Retirement Accounts (IRAs, including ROTH IRAs)
A more comprehensive listing of retirement plans that can utilize CITs vs. those that are not eligible is depicted in the table on the following page.

10Learn More www.dstsystems.com
Sources: DST kasina with information from Global Trust Company and the Coalition of Collective Investment Trusts
Eligible NotEligible
Qualified 401(k) plans 403(b) plans (may change given recent regulation)
401(a) government plans 457(f) government plans
457(b) government plans IRAs and Keoghs
Qualified profit sharing and cash balance plans Endowment plans
Qualified stock bonus plans Foundation plans
Qualified pension plans Health & Welfare Benefit plans
Certain separate accounts and contracts of insurance companies Non-qualified deferred compensation plans
Taft Hartley plans (multi-employer or union plans) Voluntary Employee Benefit Association (VEBA) plans
Which Retirement Plans Can Use Collective Investment Trusts?

11Learn More www.dstsystems.com
Pros & Cons: Vis-à-vis Mutual FundsMutual funds have dominated the DC market as the investment vehicle of choice largely because of timing and flexibility.
When 401(k) plans burst onto the scene in the 1980s, mutual funds were also taking off. Early 401(k) plans did have some index and stable value funds in a CIT wrapper. But the flexibility and ease-of-use of mutual funds in the retail market were more appealing. The general consensus at the time was that 401(k) plans would typically complement private defined benefit plans. As it turned out, DC plans quickly evolved to become the primary source of retirement funds for the average American (in addition to social security benefits), as more and more private companies abandoned defined benefit (pension) plans over the past two decades.
Source: DST kasina with information from the Coalition of Collective Investment Trusts
No Longer Your Grandfather's CIT
EARLY CITs
Lack of pricing flexibility at the plan level
Limited product offerings (stable value and passively managed options were most common)
Quarterly valuations
Not traded daily; not traded through NSCC
Manual processing of investor contributions and withdrawals
Limited performance calculations based on quarterly valuations
Limited availability of fund data
Used almost exclusively in Defined Benefit (DB) plans
Plan-level pricing flexibility often available
Expanded universe of investment objectives
Daily valuation
Traded daily; NSCC trading available
Potential for more standardized and automated daily processing
Performance generally available due to daily valuations
Fund fact sheets and enhanced data reporting
Used in both DB and Defined Contribution (DC) plans
MODERN CITs
Early CITs were historically at a disadvantage to mutual funds on four fronts. Despite these historical disadvantages, however, modern CITs have seen substantial improvements that have enhanced their utility.
• Transparency and reporting: Mutual funds have been more transparent for investors because of their disclosure and reporting requirements imposed by
the SEC (specifically related to discussions of risk, holdings, investment design, etc.). In many ways these regulations have been beneficial for the retail investor. By contrast, the disclosure burden on CITs, due to the OCC as regulator and the institutional-only nature of the investment vehicle, has been quite minimal. Historically, that has made CITs less appealing to investors.

12Learn More www.dstsystems.com
Source: DST kasina with information from the Coalition of Collective Investment Trusts
CIT Flows Through DTCC/NSCC
$200,000.00
$180,000.00
$160,000.00
$140,000.00
$120,000.00
$100,000.00
$80,000.00
$60,000.00
$40,000.00
$20,000.00
$0.00
3,500,000
3,000,000
2,500,000
2,000,000
1,500,000
1,000,000
500,000
02008 2009 2010 2011 2012 2013
Total Settlement DollarsLinear (Total Settlement Dollars)Transactions
Trad
ing
Volu
mne
($M
illio
ns)
Transactions
Mutual funds are tracked in obsessive detail by database vendors, like Morningstar, providing a window of access and scrutiny to the retail and institutional investment market. The good news for CITs is that Morningstar has increased the number of CIT funds that it tracks by 55% since 2006, according to the Coalition of Collective Investment Trusts (CCIT). DST kasina estimates that Morningstar currently covers upwards of 95% of the CITs being offered. And other third-party providers have been getting into the CIT tracking business, including eVestment, Callan Associates, Cambridge Advisors, Segal RogersCasey, and Zephyr. Not surprisingly, this is a two-way street, as investment managers brought on to launch CITs are increasingly and proactively providing information to level the playing field with mutual funds.
• Daily valuation and trading liquidity: Unlike mutual funds, CITs have had no regulatory obligation to provide daily pricing to investors (and still do not). For some asset managers, that was a distinct advantage, since one of the benefits of CITs is the flexibility to invest in some alternative and somewhat illiquid investments. But the lack of daily pricing also hurt the competitiveness of CITs in the defined
contribution market, used to the daily pricing of mutual funds. However, for the vast majority of CITs in the market, daily pricing is no longer an issue. Now, most asset managers provide daily pricing
• Lack of portability: One of the hallmarks of mutual funds in 401(k) plans has been their portability. We have all heard statistics like “the average American worker now holds 11 jobs by age 44.” Generationally, we have moved from an era of lifetime employment at one firm to this new reality. Part and parcel of that “new normal” is that one’s retirement assets (typically a 401(k) plan) can be rolled over, either to the new employer’s plan, or an IRA. CITs do not have that portability, which means that to effectuate a rollover, a plan participant must first liquidate the funds to cash, and then rollover to a qualified account.
Implicit in the notion of mutual funds being portable is that one’s mutual fund positions can “seamlessly” be rolled over to the new plan. The reality is that most rollovers are rarely so seamless. Based on surveys, funds are predominantly liquidated before being re-deployed in the new employer’s plan, or a rollover IRA plan.

13Learn More www.dstsystems.com
CITs, by their very nature, are customized to a given employer’s retirement plan and, therefore, would need to be liquidated and then rolled over as cash. It is also worth noting that as the DOL Fiduciary Rule goes into full effect in 2017, the pace of 401(k) rollovers is likely to slow (a thread that we will elaborate on later).
• Familiarity and education: Although awareness about CITs has improved since 2006, there are still opportunities to provide education more broadly for the DC market players. For those introducing their first CIT, this will be even more important -- to ensure that
consultants, recordkeepers, financial advisors and plan sponsors are aware of the operational aspects of the CIT. Historically, the lack of extensive and structured CIT offerings on DC recordkeeping platforms and the profitability of CITs at lower assets have prevented smaller plans from taking advantage of CITs. As CITs move down the plan scale and recordkeepers and consultant are more knowledgeable about the operational issues with CITs, we see this becoming less of a hurdle going forward.
We would be remiss not to also discuss the role of ETFs in DC plans.
In the 1Q 2016 Product Strategy Compass published by DST kasina, we noted that several firms are offering ETFs within 401(k) plans. The larger players are Capital One Financial Corp’s Sharebuilder 401k, Invest N Retire, WisdomTree, iShares, Vanguard, TD Ameritrade and perhaps the most significant, Charles Schwab, with an all-ETF option as part of its Schwab Index Advantage platform. Additionally, all of these firms have invested in technology that helps ETFs function similarly to mutual funds on a DCIO platform.
The bottom line is that ETFs are very cost competitive—perhaps even more so than CITs, for smaller DC plans. However, defined contribution plans are inherently more active investment platforms and will continue to predominantly utilize active investment vehicles. By and large, ETFs are passive investments. Moreover, ETFs still comprise less than roughly 5% of DC assets today.
Ultimately, we believe that the usage of ETFs within DC plans will grow, but not at the expense of active products. In fact, we do see and will continue to see some broad-based ETFs deployed within specific CIT strategies.
Source: DST kasina with information from the Coalition of Collective Investment Trusts
• Less reporting available vs. mutual funds
• Database vendors not tracking CITs
Transparency andReporting
• No regulatory burden to price daily
• Not traded via NSCC
Daily Valuation and Trading Liquidity
• Average American will have 10+ jobs (rollovers)
• Cannot roll over CIT assets to in-kind vehicle
Lack of Portability
• Lack of information sharing about CITs
• Lack of CITs seen as only benefiting large plans
Familiarity and Education
Historical CIT Disadvantages
14Learn More www.dstsystems.com
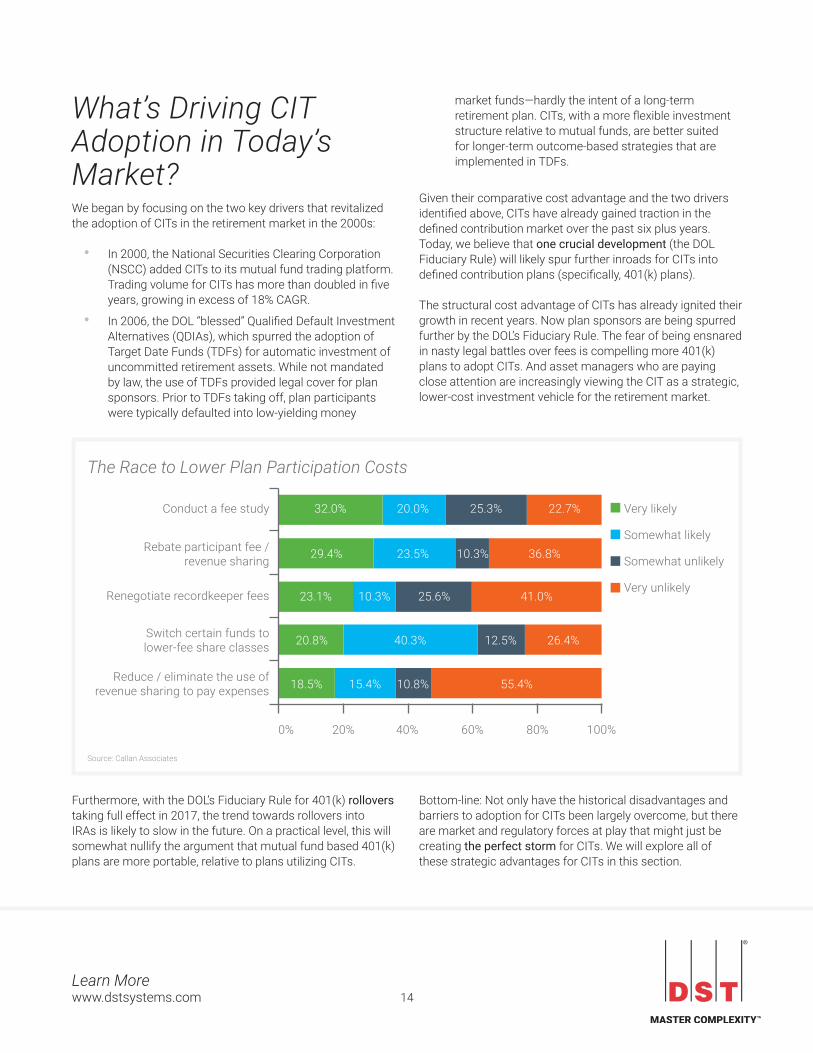
What’s Driving CIT Adoption in Today’s Market? We began by focusing on the two key drivers that revitalized the adoption of CITs in the retirement market in the 2000s:
• In 2000, the National Securities Clearing Corporation (NSCC) added CITs to its mutual fund trading platform. Trading volume for CITs has more than doubled in five years, growing in excess of 18% CAGR.
• In 2006, the DOL “blessed” Qualified Default Investment Alternatives (QDIAs), which spurred the adoption of Target Date Funds (TDFs) for automatic investment of uncommitted retirement assets. While not mandated by law, the use of TDFs provided legal cover for plan sponsors. Prior to TDFs taking off, plan participants were typically defaulted into low-yielding money
market funds —hardly the intent of a long-term retirement plan. CITs, with a more flexible investment structure relative to mutual funds, are better suited for longer-term outcome-based strategies that are implemented in TDFs.
Given their comparative cost advantage and the two drivers identified above, CITs have already gained traction in the defined contribution market over the past six plus years. Today, we believe that one crucial development (the DOL Fiduciary Rule) will likely spur further inroads for CITs into defined contribution plans (specifically, 401(k) plans).
The structural cost advantage of CITs has already ignited their growth in recent years. Now plan sponsors are being spurred further by the DOL’s Fiduciary Rule. The fear of being ensnared in nasty legal battles over fees is compelling more 401(k) plans to adopt CITs. And asset managers who are paying close attention are increasingly viewing the CIT as a strategic, lower-cost investment vehicle for the retirement market.
Source: Callan Associates
The Race to Lower Plan Participation Costs
32.0% 20.0% 25.3% 22.7%
29.4% 23.5% 10.3% 36.8%
23.1% 10.3% 25.6% 41.0%
20.8% 40.3% 12.5% 26.4%
18.5% 15.4% 10.8% 55.4%
Conduct a fee study
Rebate participant fee / revenue sharing
Renegotiate recordkeeper fees
Switch certain funds to lower-fee share classes
Reduce / eliminate the use of revenue sharing to pay expenses
Very likely
Somewhat likely
Somewhat unlikely
Very unlikely
0% 20% 40% 60% 80% 100%
Furthermore, with the DOL’s Fiduciary Rule for 401(k) rollovers taking full effect in 2017, the trend towards rollovers into IRAs is likely to slow in the future. On a practical level, this will somewhat nullify the argument that mutual fund based 401(k) plans are more portable, relative to plans utilizing CITs.
Bottom-line: Not only have the historical disadvantages and barriers to adoption for CITs been largely overcome, but there are market and regulatory forces at play that might just be creating the perfect storm for CITs. We will explore all of these strategic advantages for CITs in this section.

15Learn More www.dstsystems.com
Retirement Market Opportunity Let’s take a step back and look at the bigger picture—the retirement market opportunity and the CIT growth opportunity within that context.
The chart below provides a trend line overview of the overall U.S. retirement market assets. At the end of 2015, we estimate that total retirement assets stood at $25.5 trillion. Some key observations:
• The overall retirement market has been growing at a CAGR of 8.8%. The fastest growing categories have been 401(k) plans (12.2% CAGR) and IRAs (11.2% CAGR).
• Total defined contribution assets (DC plans plus IRAs) have risen to 58.5% of overall assets in 2015, compared to 51.1% of overall retirement assets at the end of 2008.
• We estimate that CIT-eligible plans (government and private DB plans, 457(b), and 401(k) plans) had $14.0 trillion in assets at the end of 2105, or comprised ~55% of the overall retirement assets.
Looking at a breakdown of the investment vehicles deployed in the 401(k) market, it’s apparent that this market has been fertile ground for CITs. We estimate that the overall 401(k) market stood at $4,910 billion in assets at the end of 2015. Notable takeaways are:
• CITs have been the fastest growing investment vehicle in 401(k) plans, with a CAGR of 18.3% over the past
seven years. Mutual funds, on the other hand, have been keeping pace with the overall 401(k) market growth, at a CAGR of 12.5%.
• We estimate that CITs represented ~$1,312 billion of the 401(k) market in 2015, representing just under 27% of overall assets, compared to being just over 18% of assets in 2008.
Source: DST kasina analysis of data from Investment Company Institute, Federal Reserve Board, Department of Labor, National Association of Government Defined Contribution Administrators, American Council of Life Insurers, and Internal Revenue Service Statistics of Income Division
Retirement Market Opportunity
Asse
ts ($
Trill
ions
)
30
25
20
15
10
5
02008 2009 2010 2011 2012 2013 2014 2015E
1.4
3.5
2.0
3.7
1.3
2.2
1.5
3.8
2.2
4.5
1.5
2.7
1.7
4.1
2.5
5.0
1.6
3.1
1.7
4.1
2.5
5.0
1.6
3.1
1.8
4.3
2.7
5.8
1.7
3.5
2.0
4.9
2.9
6.8
2.0
4.2
2.1
5.2
3.0
7.3
2.1
4.6
2.2
5.4
3.1
7.8
2.2
4.9
401(k) DC Plans Other DC Plans IRAs Private DB Plans Government Pension Plans* Annuities
CIT Eligible Plans

16Learn More www.dstsystems.com
To build out a more complete picture, we looked at the CIT assets that are being tracked by Morningstar—both in DC and DB plans, as Morningstar does not provide this breakdown of CIT assets between DC and DB plans. What we do glean from this data is a breakdown by category, which is yet another way to segment the market. Notably:
• The largest sub-category is in Taxable Bonds, comprising just above 43% of all CITs, followed by US Equity and Allocation.
• The fastest growing sub-categories have been Commodities (CAGR of 60%), but on a much smaller scale, followed by Allocation (CAGR of nearly 40%).
Source: DST kasina analysis of data from ICI
U.S. 401(k) Market Assets by Investment Vehicle
6,000
5,000
4,000
3,000
2,000
1,000
02008 2009 2010 2011 2012 2013 2014 2015E
188
405
378
1,229
135
502
462
1,601
110
620
527
1,843
48
726
496
1,830
16
820
526
2,138
73
905
576
2,646
82
1,046
631
2,841
98
1,312
696
2,804
Asse
ts ($
Billi
ons)
Mutual Funds Separate Accounts (estimated) CITs Other

17Learn More www.dstsystems.com
Armed with this data, let us summarize what we know about the state of the CIT market as it stood at the end of 2015 based on our measures:
• CITs have been growing at a 7-year CAGR of 14.4% in the overall retirement market.
• CITs currently represent just under 14% of assets available in all CIT-eligible assets.
• CITs in 401(k) plans comprise ~69% of overall CITs, and have been growing at a CAGR of 18.3%.
• In other words, CITs have been growing faster in 401(k) plans compared to DB plans (where they originally started).
CIT Assets (in Billions) by Category
Source: DST kasina analysis of data from ICI
$2,000
$1,900
$1,800
$1,700
$1,600
$1,500
$1,400
$1,300
$1,200
$1,100
$1,000
$900
$800
$700
$600
$500
$400
$300
$200
$100
$02008 2009 2010 2011 2012 2013 2014 2015
Total Assets: $759B $551B $956B $1.02T $1.48T $1.26T $1.31T $1.91T
YoY Growth: - (27.4%) 73.5% 6.3% 45.7% (14.6%) 3.6% 46.0%
Category CAGR
Unclassified -
US Equity 9.6%
Taxable Bond 12.0%
Sector Equity 11.6%
Municipal Bond 7.4%
Money Market 15.8%
International Equity 12.0%
Commodities 60.2%
Alternatives 20.6%
Allocation 39.8%
$242
$372
$95$36
$82
$358
$66$36
$254
$544
$126
$69
$240
$629
$167
$201
$205
$638
$110
$319
$458
$825
$217
$373
$254
$450
$161
$76
$285
$903
$156
$93

18Learn More www.dstsystems.com
Cost Advantage: Playing to the Fiduciary DutyCITs are certainly less expensive to create and offer to plan sponsors, and their fee structures may be more flexible when compared to mutual funds. In this section, we will focus on the cost side of the equation.
Factors that contribute to lower costs for CITs include:
• Reduced regulatory requirements (OCC vs. SEC) imply lower compliance and administrative expenses
• Lower marketing and sales expenses (even when compared to institutional mutual funds, due to no advertising expense)
• No revenue sharing
During the course of our research we used several efforts to quantify the cost savings for CITs compared to mutual funds. Some of the more definitive ones included:
• The median fees for select institutional strategies in basis points were [source: eVestment, 2014]:
• Mutual funds = 105
• CITs = 80
• Separate Accounts = 60
• Morningstar’s data suggests that the average CIT fee is about 26 basis points less than the average retail mutual fund [source: benefitspro.com, 2014]
• One large value manager for 401(k) plan sponsors charges 0.89% for a mutual fund and as little as 0.30% for assets greater than $140 million in a collective trust [source: Mercer LLC, March 2013]
• The CIT expense advantage in basis points based on strategies were [source: SEI, eVestment, ICI, April 2012]:
• Hybrid/Target Date Fund = 19-20
• Domestic Equity = 10-15
• Global/Foreign Equity = 10-13
In order to gain additional insight on the cost savings, we also spoke to several industry experts, specifically DCIO operations executives and heads of product strategy at asset managers.
With the caveat that there are always outlier situations, our panel of experts was generally confident about a cost savings of 10 to 30 basis points for of CITs over mutual funds. That is what their real-world experience in launching and deploying CITs has revealed compared to launching similar mutual funds. Perhaps
more striking was their feedback that even a half to two basis point difference in cost was often sufficient for a plan sponsor to opt for a CIT—purely due to their fiduciary obligations.
Of course, 401(k) costs are a function of plan size. A key factor in the deployment of various investment vehicles utilized in retirement plans is to segment the market by “plan size.” This is very important in understanding the cost structure of these vehicles, and in determining how scale drives down expenses at a plan participant level.
There is general agreement in the retirement industry in terms of segmenting plan sizes from Micro to Mega, as outlined in the accompanying chart. Not surprisingly, the Mega plans garner the most assets for any category (nearly 36%), and predominantly deploy institutional Separate Accounts as the investment vehicle of choice. The opportunity for CITs—going forward—is expanding out from the large plans, in both directions. We expound on this in the Key Findings & Looking to the Future section (pages 23-25).
Given the various plan sizes, let’s dig into what we found for the cost structure for a 401(k) plan. Since this data is largely skewed towards the usage of mutual funds, it should give us a great sense of how CITs and SMAs can indeed be lower cost investment vehicles.
401(k) Assets by Plan Size (2015)
Micro Plans (<$5mm)
Small Plans (>$5mm - $50mm)
Medium Plans (>$50mm - $200mm)
Large Plans (>$200mm - $1b)
Mega Plans (>$1b)
11%
20%
16%17%
36%
Source: DST kasina analysis of data from ICI

19Learn More www.dstsystems.com
The table above is derived from the 2012 401(k) Averages Book, with costs calculated for a plan participant with a $50k balance—across micro, small and medium plans. This cost analysis gives us a reasonable breakdown of the key cost drivers within a mutual fund wrapper. Without getting into the nuances of these standard cost categories (which should be familiar to our audience), we can conclude the following:
• Trustee costs are effectively a fixed dollar amount per plan participant
• Record keeping costs do scale with AUM, but we would still categorize this as a quasi-fixed cost
• There is uniformity on net investment cost, which is where the investment management firm gets
compensated; for medium plans and below, this appears to be 0.54% of AUM (likely a bit lower in 2016)
• The true variable cost comes in at the revenue sharing expense line
Given that CITs do not have any traditional revenue sharing expenses, we can postulate that at the medium and large plan size, CITs would have a cost advantage of up to 32 basis points—just from a revenue sharing savings standpoint—compared to mutual funds. For the newly-ramped R6 shares of mutual funds, that particular cost savings becomes less of a differentiator. However, the additional legal and compliance burdens of mutual funds still remain.
Sources: 401ksource.com's 401(k) Averages Book for 2012, as reported by Bankrate.com; analyzed by DST kasina. 401k source.com analyzed this data for 182 products across 64 plan providers and averaged expenses across all share classes offered.
PlanSize TrusteeCost RecordkeepingCost
NetInvestmentCost
RevenueSharingExpense
General Cost Model Fixed $ Amount Quasi-fixed % of AUM % of AUM
Micro Plans(<$5mm)
1 bps 6 bps 54 bps 68 bps
Small Plans(>$5mm - $50mm)
1 bps 3.6 bps 54 bps 51 bps
Medium Plans(>$50mm - $200mm)
1 bps 1 bps 54 bps 32 bps
Large Plans(>$200mm - $1b)
Negotiated Negotiated Customized Customized
Mega Plans(>$1b)
Negotiated Negotiated Customized Customized
Dissecting Cost Structure of a 401(k) Plan

20Learn More www.dstsystems.com
Pricing Flexibility: A Structural AdvantageAnother intriguing aspect of our discussions with senior executives at asset management firms came on the topic of CIT pricing flexibility. Across the board, the ability to flexibly set price—depending on the size of the plan sponsor and the demographics of its workforce—was cited as a great advantage for CITs. In economics this is known as (legal) price discrimination, as our audience is well aware.
One simple way to grasp this concept is to think of CITs less as mutual funds than as smaller versions of institutional separate accounts (or separately managed accounts, SMAs). All SMAs end up being proprietary to the fund sponsor and uniquely priced. The pricing flexibility for SMAs comes from breakpoints on a classical “supply” curve. The same principle applies to CITs.
Not all CITs are proprietary, however. Once launched at the behest of a singular plan sponsor, the investment manager
can make it more broadly available on a trust company’s DCIO platform. In these cases, the flexibility in pricing comes from plan size, plus workforce demographics, and any additional customization that the asset manager is able to provide.
[T]hink of CITs less as mutual funds than as smaller versions of institutional separate accounts (or separately managed accounts, SMAs). All SMAs end up being proprietary to the fund sponsor and uniquely priced.

21Learn More www.dstsystems.com
Investment Design Flexibility: Customized, outcome-driven portfoliosBeyond pricing flexibility, our conversations with asset management executives working with CITs got most animated when we discussed the flexible investment options available within the CIT wrapper.
Historically, CITs were largely created as index funds and stable value funds. Many of the CITs that have come to market over the past decade have been straight-forward extensions of their mutual fund cousins: the same investment strategy or target-date fund, replicated in a CIT wrapper and designed to lower expenses due to fiduciary pressures.
CITs provide the ability to structure risk and investment management to the unique workforce demographics and specific plan goals—much like institutional separate accounts—but at medium and large plan sizes, not just for mega plans. Moreover, CIT providers can tailor the funds to the unique investment and risk preferences of plan sponsors. In this way, CITs can help plan sponsors move from one-size-fits-all products, like age-based Target Date Funds (TDFs), to customized portfolios.
Providers of CITs can also help plan sponsors move from one-size-fits-all products like TDFs with a pre-determined glide path to custom TDFs and broadly diversified investment portfolios that are situationally adjusted. Just to be clear, we are talking about three different dynamics:
• Customized TDFs: From a retirement security standpoint, the issue is broader than simply age-driven equity/bond allocations. It’s also critical to assess likely spending rates during retirement, draw-down rates, geographic location and alternate sources of income. Custom TDFs implemented in CITs can be better tailored to specific plan participants and their individual needs.
• Alternative investments: Unlike 1940 Act mutual funds, CITs have much more leeway to invest in alternatives like TIPS, real estate, commodities, high-yield bonds and hedge funds. Retirement funds naturally tend towards longer investment horizons, and this flexibility can be leveraged for potentially superior long-term returns. Multi-Asset class mutual fund products have certainly been in vogue over the past few years, but these are still restricted in terms of the breadth of investment options. CITs enable the creation of truly complex multi-asset class funds to attain both diversity and allocation objectives.
For asset managers that operate under the umbrella of a life insurance company, CITs may well prove to be an optimal retirement plan investment vehicle. As plan participants get to the draw-down stage of retirement, the use of fixed and indexed annuities for part of the portfolio can be quite strategic. The right mix and laddering of annuities can enable retirees to effectively navigate required minimum distributions through equity market volatility. The CIT wrapper allows for fixed and indexed annuities to be incorporated in a retirement TDF for timing optimal cash flow during the required minimum distribution (RMD) phase.
• Dynamic allocation: In addition to customization at the investment level, portfolios can be rebalanced more frequently and in a more customized manner than in a more traditional mutual-fund based DC plan. Plus, traditional TDFs allocate (and rebalance) assets on a valuation-indifferent basis. With Treasuries currently at record lows, for instance, this might not be the ideal time for being forced into Treasury bonds with every rebalance.
Another key distinction between CITs and mutual funds relates to the issue of maintaining daily liquidity. Unlike the 1940 Act products in which no more than 15% of assets can be invested in illiquid securities, CITs have no specific guidelines. The OCC handbook makes reference to CITs adhering to ERISA fiduciary standards and prudent liquidity levels, but does not specify any quantitative metrics about maintaining cash at hand.
The flexibility to be “fully invested”– rather than being worried about maintaining certain cash levels for mutual funds – was another benefit cited by our panel of experts, resulting in better returns. “Cash drag” has long been known as one of the primary reasons active managers tend to lag passive benchmarks. Moreover, with new liquidity reporting requirements about to be imposed on mutual funds, the regulatory burden is only going to become more onerous, raising the cost of compliance.
The important takeaways are that CITs have a broader palette of investments to select from, without being subject to short-term liquidity requirements. They also can be instrumental in the creation of customized TDFs (as qualified default investment alternatives) that can be more dynamic in nature.

22Learn More www.dstsystems.com
Profitable … at Smaller Plan SizesIn our discussions, we learned that the minimum strategy size for launching a new CIT is in the $25mm to $50mm range. What this means is that most new CIT strategies are breakeven to slightly profitable in the $25mm to $50mm range. As other plan sponsors utilize this same or similar CIT strategy, the profitability of the investment manager rises. By way of perspective, the minimum size for launching a new CIT strategy 10 years ago was ~$250mm, based on our research. Efficiencies in tracking, trading, operations and extending the reach of the portfolio management team (from being investment vehicle specific, i.e. mutual funds only, to investment vehicle agnostic) have contributed to this lower scale dynamic.
Since we broached the subject, it is best to follow-up and expand on the distinction between CIT strategy size and plan size. If the overall plan size for a given plan sponsor (company) is $50mm and needs to be spread across multiple strategies (equity long-only, fixed-income, multi-asset class, alternatives, etc.), a CIT wrapper will likely not be economically feasible. However, a $100mm plan that would like to invest $25mm in an existing CIT, as an allocation sleeve, should be able to utilize that strategy.
Multiple employer plans (MEPs) have also been in the news. The smallest retirement plans (micro plans, as we have identified earlier) face the biggest challenges in terms of fees and service. These are typically professional trade associations
and other networks of small employers. MEPs pull together a group of small businesses and cover them under one retirement plan, thereby lending scale. Sometimes these are state-sponsored 401(k) plans under the small business administration (SBA) banner. With pooled assets in the $100mm+ range, such plans will also be able to utilize CITs.
In conclusion, the structure of non-proprietary CITs (the vast majority of CITs) allows greater flexibility in pricing structure for the asset manager. The same CIT strategy can be priced differently for a plan utilizing a $50mm CIT sleeve within: a) a larger plan size with an aging demographic, b) a smaller plan size for a company with a younger workforce, and c) a larger plan size that utilizes other CIT strategy sleeves from the same asset manager.
The smallest retirement plans . . . face the biggest challenges in terms of fees and service. These are typically professional trade associations and other networks of small employers.

23Learn More www.dstsystems.com
Key Findings and Looking to the FutureLooking to the future, we begin with summarizing some of the key findings that arose in our phone conversations with senior industry executives whose firms are active in the retirement market. Clearly, we sought out individuals who are very familiar with CITs and consequently we believe that we have filtered the responses to counter any inherent bias. In summary: • Most fund managers are inherently investment
vehicle agnostic on the institutional side: first picking the strategy, and then determining the applicable investment vehicles. They are increasingly organizing their portfolio management teams around an investment strategy and, implementing each strategy in all viable and applicable wrappers: ETFs, Mutual Funds, CITs and institutional separate accounts.
• Clearly, plan size does have a bearing on which investment vehicle can be utilized, with large to mega plans being an optimal audience for CITs. In general, irrespective of the size of the asset manager, we learned that a CIT strategy (for a given plan sponsor) has to be minimally in the $25mm to $50mm range.
• Very few plan sponsors are NOT considering CITs as an option. While we did not directly speak to any plan sponsors, our research and the public evidence is clear. The fiduciary burden of being a plan sponsor is compelling them to look hard at costs, in some
cases at the exclusion of other choices. And most roads seem to be pointing towards exploring CITs. This is also borne out in the advice being given to plan sponsors by retirement plan consultants (like Mercer, Celent, etc.). They are uniformly recommending that their clients consider CITs as an option for their defined contribution plans.
• Our panel of experts was generally confident about the relative cost savings of CITs over mutual funds being in the 10 to 30 basis point range. Our own analysis suggests that ~30 basis points may be attributed to having no revenue sharing. The rest comes from pricing the net investment cost on a plan size and complexity basis.
• The pricing flexibility of CITs—on a breakpoint based on plan size and complexity—is universally considered to be a great advantagefor CITs over mutual funds from an asset manager’s standpoint. In this aspect, CITs are considered to be closer to the “pricing on a curve” that is used for institutional separate accounts.
• Ultimately, the breadth of investment options and the flexibility to customize outcome-driven plans are considered to be the biggest advantage of CITs. Most CITs will not have esoteric investments that are challenging to price daily. However, the option to include TIPS, commodities, hedge funds, and annuities in a complex multi-asset class structure enabled CIT-based target date funds to be customized to the unique needs and demographics of a plan sponsor’s workforce.
24Learn More www.dstsystems.com
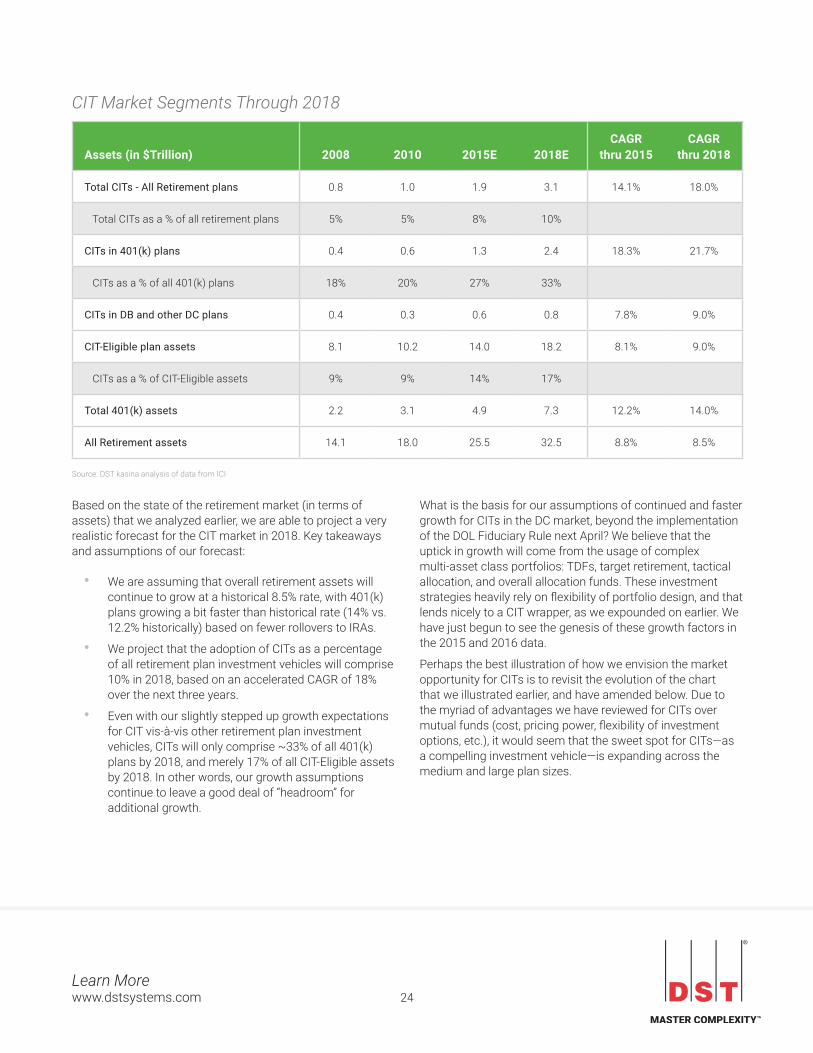
Based on the state of the retirement market (in terms of assets) that we analyzed earlier, we are able to project a very realistic forecast for the CIT market in 2018. Key takeaways and assumptions of our forecast:
• We are assuming that overall retirement assets will continue to grow at a historical 8.5% rate, with 401(k) plans growing a bit faster than historical rate (14% vs. 12.2% historically) based on fewer rollovers to IRAs.
• We project that the adoption of CITs as a percentage of all retirement plan investment vehicles will comprise 10% in 2018, based on an accelerated CAGR of 18% over the next three years.
• Even with our slightly stepped up growth expectations for CIT vis-à-vis other retirement plan investment vehicles, CITs will only comprise ~33% of all 401(k) plans by 2018, and merely 17% of all CIT-Eligible assets by 2018. In other words, our growth assumptions continue to leave a good deal of “headroom” for additional growth.
What is the basis for our assumptions of continued and faster growth for CITs in the DC market, beyond the implementation of the DOL Fiduciary Rule next April? We believe that the uptick in growth will come from the usage of complex multi-asset class portfolios: TDFs, target retirement, tactical allocation, and overall allocation funds. These investment strategies heavily rely on flexibility of portfolio design, and that lends nicely to a CIT wrapper, as we expounded on earlier. We have just begun to see the genesis of these growth factors in the 2015 and 2016 data.
Perhaps the best illustration of how we envision the market opportunity for CITs is to revisit the evolution of the chart that we illustrated earlier, and have amended below. Due to the myriad of advantages we have reviewed for CITs over mutual funds (cost, pricing power, flexibility of investment options, etc.), it would seem that the sweet spot for CITs—as a compelling investment vehicle—is expanding across the medium and large plan sizes.
Source: DST kasina analysis of data from ICI
Assets(in$Trillion) 2008 2010 2015E 2018ECAGR
thru2015CAGR
thru2018
Total CITs - All Retirement plans 0.8 1.0 1.9 3.1 14.1% 18.0%
Total CITs as a % of all retirement plans 5% 5% 8% 10%
CITs in 401(k) plans 0.4 0.6 1.3 2.4 18.3% 21.7%
CITs as a % of all 401(k) plans 18% 20% 27% 33%
CITs in DB and other DC plans 0.4 0.3 0.6 0.8 7.8% 9.0%
CIT-Eligible plan assets 8.1 10.2 14.0 18.2 8.1% 9.0%
CITs as a % of CIT-Eligible assets 9% 9% 14% 17%
Total 401(k) assets 2.2 3.1 4.9 7.3 12.2% 14.0%
All Retirement assets 14.1 18.0 25.5 32.5 8.8% 8.5%
CIT Market Segments Through 2018

25Learn More www.dstsystems.com
Again, we are not predicting the demise of mutual funds in the retirement market, especially not so for institutional and R6 share classes. It would be foolish to assume that the mutual fund side of the business will not evolve and pivot based on competitive and regulatory pressure. It would also be naïve to assume that ever-vigilant regulators would be blind to the uptake of CITs in the retirement market. In fact, the biggest risk to our assessment of the CIT market opportunity would be unforeseen regulatory challenges and documentation requirements at the hands of regulators.
Ultimately, the proof of the pudding is in the eating. The defined contribution market (especially 401(k) plans) has been dominated by retail and institutional mutual funds for the past 30 years. The fact that most individual participants have not been successful in saving sufficiently for retirement through contributions and growth is perhaps one reason for the regulatory scrutiny that has befallen the industry to date. To the extent that CITs can deliver on the ultimate raison d’être of investing—the ability to retire and live comfortably off defined contribution nest eggs—they will flourish and succeed.
Source: DST kasina
The Sweet Spot for CITs is Expanding
Micro Plans(<$5mm)
Small Plans(>$5mm - $50mm)
Medium Plans(>$50mm - $200mm)
Large Plans(>$200mm - $1b)
Mega Plans(>$1b)
ETFs and Retail Mutual Funds
Low
er
Rela
tive
Inve
stm
ent C
ost
Hig
her
Least Flexibility of Investment Options Greatest
Plan Size (log scale)
Institutional and R-Share
Mutual Funds
Institutional Separate Accounts
Collective Investment
Trusts
26Learn More www.dstsystems.com
About this White Paper The premise of our methodology was straightforward: we wanted to leverage and advance the body of knowledge and history about Collective Investment Trusts (CITs). And, ultimately, we wanted to provide our assessment of where the Defined Contribution (DC) and overall retirement markets may be headed in terms of deployment of various investment vehicles—with an eye on the specific prospects for CITs.
In terms of leveraging the existing body of knowledge, and historical perspective, we culled through various sources of information, including Morningstar CIT data, ICI retirement data, and information listed in the bibliography below.
We also conducted one-on-one phone interviews with participants in the CIT market—from trust sponsors to DC plan managers and asset managers—to dig deeper into the nuances and extract insights about the underlying trends. We are extremely grateful to these thought leaders and appreciate their contribution to advancing the conversation about CITs in the overall retirement space.
ALPS Fund Services, Inc. is a subsidiary of ALPS Holdings, Inc. and DST Systems, Inc. and is affiliated with certain registered broker-dealer and investment adviser companies within ALPS and DST.
The material contained in the white paper, which may be considered advertising, is for general information and reference purposes only and is not intended to provide or be construed as legal, tax, accounting, investment, financial or other professional advice on any matter, and is not to be used as such. This white paper is a financial promotion. This white paper, and the statements contained herein, is not an offer or solicitation to buy or sell any products (including financial products) or services or to participate in any particular strategy mentioned and should not be construed as such. This white paper is not intended for distribution to, or use by, any person or entity in any jurisdiction or country in which such distribution or use would be contrary to local law or regulation. Similarly, this white paper may not be distributed or used for the purpose of offers or solicitations in any jurisdiction or in any circumstances in which such offers or solicitations are unlawful or not authorized, or where there would be, by virtue of such distribution, new or additional registration requirements. Persons into whose possession this white paper comes are required to inform themselves about and to observe any restrictions that apply to the distribution of this document in their jurisdiction. The information contained in this white paper is for use by institutional clients only and is not to be relied upon by retail clients.
Any discussion of tax matters contained in this white paper is not intended to constitute tax advice and is not intended or written to be used, and cannot be used, for the purpose of avoiding tax or penalties imposed under the United States Internal Revenue Code or promoting, marketing or recommending to another party any transaction or matter. For tax advice, you should consult an independent tax advisor for advice based on your particular facts and circumstances.
The contents may not be comprehensive or up-to-date, and ALPS/DST will not be responsible for updating any information contained within this white paper. Some information contained in this white paper has been obtained from third party sources and has not been independently verified. ALPS/DST makes no representation as to the accuracy or completeness of the information provided in this white paper. ALPS/DST recommends that professional consultation should be obtained before using any service offered by ALPS/DST.
The views expressed within this white paper are those of the contributors only and not those of ALPS/DST or any of its subsidiaries or affiliates.
ALPS assumes no liability whatsoever (direct or consequential or any other form of liability) for any action taken in reliance on the information contained in this white paper, or for resulting from use of this white paper, its content, or services. Any unauthorized use of material contained in this white paper is at the user’s own risk. Reproduction, distribution, republication and retransmission of material contained in this white paper is prohibited without the prior consent of ALPS/DST.
Trademarks, service marks and logos belong to their respective owners.
© 2017 DST SYSTEMS, INC. All rights reserved.

27Learn More www.dstsystems.com
Bibliography of Reference Materials:Investment Management Services—Comptroller’s Handbook; August 2001; Office of the Comptroller of the Currency, Administrator of National Banks Keeping 401(k) Costs Reasonable: The Return of the Collective Investment Trust; February 2007; Richard A. Davies, Sr. Managing Director—Defined Contribution Services, AllianceBernstein Defined Contribution / 401(k) Fee Study; June 2009; Conducted by Deloitte for the Investment Company Institute The Workings of the “Open” Multiple Employer 401(k) Plan; 2011; Robert J. Toth, Jr., TAG Resources, LLC The Re-Emergence of Collective Investment Trust Funds; June 2011; Manning & Napier Advisors, LLC Getting Ahead of the CIT Boom: Aligning Capabilities to Capture DC Market Share; April 2012; SEI 401(k) fees: A breakdown of 401(k) plan costs; September 9, 2012; on-line post by Sheyna Steiner at Bankrate.com based on 401ksource.com’s 401k Averages Book for 2012 Retirement Roundtable: Defined Contribution Plan Investment Vehicles: How Fee Disclosure is Changing the Conversation; Nov 2012; Invesco’s Defined Contribution Institute Collective Investment Trusts as Investment Options in Qualified Plans, Considerations for Plan Sponsors; 2013; T. Rowe Price
The BrightScope/ICI Defined Contribution Plan Profile: A Close Look at 401(k) Plans, 2013; December 2013; BrightScope & Investment Company Institute
Comptroller’s Handbook—Asset Management—Collective Investment Funds; May 2014, Office of the Comptroller of Currency DC Fiduciary Focus—Fees: Winfield Evens, Aon Hewitt; In the Fourth Quarter 2014 Benefits Quarterly published by International Society of Certified Employee Benefit Specialists PLANSPONSOR Defined Contribution Survey 2015 The 101’s of Collective Investment Trusts; April 2015; presentation by Coalition of Collective Investment Trusts White Paper on Collective Investment Trusts; April 2015 Prepared by the Coalition of Collective Investment Trusts ICI Research Perspective: The Economics of Providing 401(k) Plans; July 2015; Investment Company Institute 2016 Defined Contribution Trends; Callan Associates PLANSPONSOR Defined Contribution Survey 2016 Collective Investment Trust Services—Discussion; 2016; Global Trust Company, wholly owned subsidiary of Northeast Retirement Services Trends and Best Practices for Addressing Automatic Participant Rollovers; January 2016; Wealth Management Systems, Inc., DST Systems Collective Investment Trusts: Lower Costs and Greater Flexibility; January 2016; State Street Global Advisors ETFs in Retirement Accounts: The Next Growth Opportunity? Jun 2016, Matthew Fronczke, DST kasina

Learn More www.dstsystems.com
AM-WP-CollectiveInvestmentTrusts-030216
© 2017 DST Systems, Inc.
DST Systems, Inc.333 W. 11th StreetKansas City, MO 64105816.435.1000
Related Documents


