Forschungsinstitut zur Zukunft der Arbeit Institute for the Study of Labor DISCUSSION PAPER SERIES Collective Bargaining and the Evolution of Wage Inequality in Italy IZA DP No. 10293 October 2016 Francesco Devicienti Bernardo Fanfani Agata Maida

Welcome message from author
This document is posted to help you gain knowledge. Please leave a comment to let me know what you think about it! Share it to your friends and learn new things together.
Transcript

Forschungsinstitut zur Zukunft der ArbeitInstitute for the Study of Labor
DI
SC
US
SI
ON
P
AP
ER
S
ER
IE
S
Collective Bargaining and the Evolution ofWage Inequality in Italy
IZA DP No. 10293
October 2016
Francesco DevicientiBernardo FanfaniAgata Maida

Collective Bargaining and the Evolution of
Wage Inequality in Italy
Francesco Devicienti University of Turin,
Collegio Carlo Alberto and IZA
Bernardo Fanfani
University of Turin
Agata Maida University of Milan
Discussion Paper No. 10293 October 2016
IZA
P.O. Box 7240 53072 Bonn
Germany
Phone: +49-228-3894-0 Fax: +49-228-3894-180
E-mail: [email protected]
Any opinions expressed here are those of the author(s) and not those of IZA. Research published in this series may include views on policy, but the institute itself takes no institutional policy positions. The IZA research network is committed to the IZA Guiding Principles of Research Integrity. The Institute for the Study of Labor (IZA) in Bonn is a local and virtual international research center and a place of communication between science, politics and business. IZA is an independent nonprofit organization supported by Deutsche Post Foundation. The center is associated with the University of Bonn and offers a stimulating research environment through its international network, workshops and conferences, data service, project support, research visits and doctoral program. IZA engages in (i) original and internationally competitive research in all fields of labor economics, (ii) development of policy concepts, and (iii) dissemination of research results and concepts to the interested public. IZA Discussion Papers often represent preliminary work and are circulated to encourage discussion. Citation of such a paper should account for its provisional character. A revised version may be available directly from the author.

IZA Discussion Paper No. 10293 October 2016
ABSTRACT
Collective Bargaining and the Evolution of Wage Inequality in Italy*
In this paper we study the evolution of the Italian wage inequality, and of its determinants, using two decades of matched employer-employee data covering the entire population of private-sector workers and firms in the Veneto region. We find that wage inequality has increased since the mid-1980s at a relatively fast pace, and we decompose this trend by means of wage regression models that account for both worker and firm fixed effects. We show that the observed and unobserved heterogeneity of the workforce has been a major determinant of the overall wage dispersion and of its evolution. Instead, we find that the importance of the dispersion in firm-specific wage policies has declined over time. Finally, we show that the growth in wage dispersion has almost entirely occurred between job titles (livelli di inquadramento) for which a set of minimum wages is bargained at the nation-wide sectoral level. We conclude that, even in the presence of the underlying market forces, trends in wage inequality have been channelled through the rules set by the country’s fairly centralized system of industrial relations. JEL Classification: J00, J5, J31, J40 Keywords: wage inequality, collective bargaining, two-way fixed effects,
employer-employee data Corresponding author: Bernardo Fanfani University of Turin via Real Collegio 30 10024 Moncalieri (TO) Italy E-mail: [email protected]
* We would like to thank David Card, Lia Pacelli, participants at the 2016 European Association of Labour Economists Conference, 2016 Conference of the European Society of Population Economics, and Collegio Carlo Alberto workshops for useful comments and feedbacks.

1. Introduction
Wage inequalities have risen in most Western Countries during the last decades of the
past century. Several hypotheses have been put forward to rationalize this secular trend.1
Some authors have pointed out that technological progress is largely responsible for the
increased wage dispersion. A commonly held view is that advances in the production
process may have led to a growth in the demand for skills that, due to demographic and
schooling developments, outpaced their supply, eventually resulting in an increase of the
returns to unevenly distributed workers’ skills (e.g. Katz and Murphy [1992]).2 Instead,
other theories state that changes in labour market institutions, such as declining minimum
wages and union strength (e.g. Di Nardo, Fortin, and Lemieux [1996]), or changes in social
norms (e.g Piketty and Saez [2003]) are the main drivers behind the observed secular rise
in wage differentials.
More recently, several studies analysing matched worker-firm databases have pointed out
that one important component of pay inequality is represented by differences in the wage
policies between observationally similar firms (e.g. Abowd, Kramarz, and Margolis [1999]).
Card, Heining, and Kline [2013] have recently shown that the firm-specific component of
wage variation can explain up to one fourth of the wage variance increase that has occurred
in West Germany between the late-1980s and the beginning of the new century. Moreover,
they show that the sorting of high skilled workers into high-paying firms can account for
another 30% of the variance increase. They attribute the rise in the dispersion of firms’
wage premiums to the changes that have occurred in the wage bargaining system since the
early 1990s. Indeed, during these years, and despite the prevalent role of industry-wide
collective bargaining, German firms were given the possibility of opting-out from national
contractual agreements, often resorting to establishment-level wage negotiations. Dust-
1For a recent review of the vast literature on wage inequality see Acemoglu and Autor [2011]. Dueto limited data availability, most studies focus on the post-1970s inequality evolution. An assessment oflong-run trends in income dispersion for several Western countries is provided by Piketty and Saez [2006].
2An alternative hypothesis discussed in the literature, which is also related to technological progress,is that recent advances in the production process may have modified the demand for routine versus non-routine based occupations. This process could have led to increased polarization of the wage structure (seefor example Autor, Katz, and Kearney [2008]).
2

mann, Fitzenberger, Schonberg, and Spitz-Oener [2014] argue that this decentralization in
the wage setting process has been one of the main engines fostering the German economic
growth during the last decade, since the new system has allowed to cut unit labour costs
and to improve international competitiveness.
In this paper, we apply the methodology of Card, Heining, and Kline [2013] on Italian
matched employer-employee data from administrative sources, which cover the entire pop-
ulation of private-sector workers and firms in the Veneto region. We study the evolution
over time of the following components of pay dispersion: time-varying characteristics of
the workforce, time-constant individual characteristics, firm-specific wage premiums, along
with the contribution arising from the the correlation between each of these components.
Moreover, we apply a related variance decomposition method, in order to test whether
the growth in wage inequality has occurred mostly within or between the fine job title
categories defined by the country’s collective bargaining institutions.
An in-depth analysis of the Italian case is interesting in itself, but it also offers insights for
evaluating the relevance of the various theories rationalizing the secular growth in wage
inequality experienced elsewhere. Like other Western Countries, the Italian economy has
been exposed to international competition and has experienced the challenges posed by
the introduction of new technologies. The manufacturing sector is very large in Italy, and
particularly in Veneto,3 a feature that makes its economy quite similar to the German
one. Moreover, Italy is characterized by a wage setting mechanism highly centralized at
the sector-wide level, which has not undergone the same renewal processes that charac-
terized the German labour market during the 1990s.
Our analysis shows that Italian pay dispersion has grown at a similar pace than the Ger-
man one during the period considered, even if Italy did not experience the same growth
in firms’ wage premiums dispersion that Card, Heining, and Kline [2013] document for
Germany. The results suggest that the amount of wage flexibility at the firm level granted
by the system has even reduced over time. Indeed, during the overall period considered,
3In Veneto, during the pre-2009 crisis years, the manufacturing sector represented around 30% of thetotal value added.
3
Italian firms have been unable to opt-out, or diverge in any other significant way, from
the wage dynamics settled within the relevant industry-wide collective agreements.
As we report below, a large proportion of the growth in earning dispersion over the en-
tire period considered is attributed to raising heterogeneity (observed and unobserved)
in the portable component of a worker’s pay, namely the part of the wage attributable
to individual-specific characteristics equally rewarded across employers. In principle, the
raising contribution of workers’ heterogeneity may simply reflect the underlying dynamics
of supply and demand factors. However, we show that in practice this component of in-
equality is closely linked to the wage pay scales and seniority wage increments bargained
at the industry level by the main union confederations and employers’ associations. Hence,
we tend to interpret the finding of rising workers’ heterogeneity as yet another outcome
induced by the Italian system of industrial relations, which seems to impose significant
constraints on wage dynamics.
To substantiate our claim, we divide the variance of (log) wages and of workers’ observed
and unobserved heterogeneity into a within and a between job titles part. Job titles (called
livelli di inquadramento in Italian) are occupations defined by the relevant sectoral col-
lective agreements, for which a minimum wage applies regardless of a worker’s union
membership. We find that the growth in the between-variance component virtually ex-
plains the entire inequality trend observed in the data. To the best of our knowledge, this
growing trend in the between job title dispersion of wages has never been so extensively
documented before, partly owing to data limitations in past research on Italian wage in-
equality.4
Finally, we find that another important component of the wage inequality growth has
been the increased positive sorting between firms’ pay premiums and the human capi-
tal of the workforce. Despite the level of the correlation between these two components
4A nice feature of our data is that they contain job-title information for every worker in the sample. Thedatasets used in previous Italian studies, e.g. the Bank of Italy’s Survey on Household Income and Wealthused by Manacorda [2004], do not contain individual-level information on livelli di inquadramento or, whenthey do, cover only a specific sector (metalworkers) and area (the province of Milan), e.g. Erickson andIchino [1995]. Using Portuguese data, Torres, Portugal, Addison, and Guimaraes [2013] find that job titlefixed effects in wage regressions explain around 10% of the total wage variance. However, they do notexplicitly focus on the contribution of these effects in explaining the evolution of inequality in Portugal.
4

is generally low in each time period, a clear increasing tendency emerges from our esti-
mates. Although we were unable to present conclusive evidence on the determinants of
such trend, it is tempting to associate greater assortative matching to the general labour
market deregulation experienced by Italy during the last few decades. Indeed, during
the overall period considered, the presence of trade unions at the firm level has been de-
clining, a tendency which has reduced the overall amount of rent sharing, particularly
among low skilled employees. Moreover, some of the 1980s and 1990s reforms, such as the
liberalization of the hiring process, the weakening in employment protection legislation,
the abolition of egalitarian practices embedded in the wage indexation mechanisms (i.e.,
the so-called Scala Mobile) and in the wage setting institutions, had the potential to un-
dermine the bargaining power of workers at the bottom of the wage distribution and to
reduce matching frictions.5
Our paper is connected to a (moderately-sized) literature that has previously studied the
Italian wage distribution and its changes over time, using either social security data (see,
among others, Cappellari [2004] and Leonardi, Pellizzari, and Tabasso [2015]) or earnings
data collected in household surveys (e.g., Brandolini, Cipollone, and Sestito [2002], Man-
acorda [2004], Naticchioni and Ricci [2009]). Nevertheless, our use of the decomposition
methodology proposed by Card, Heining, and Kline [2013] is entirely new in the Italian
context.6 To the best of our knowledge, our finding of a negative contribution of the
firm-specific wage premiums to the trends in overall wage inequality is also novel, and
potentially interesting, beyond Italy.
The paper is organized as follows. In the next section, we review the existing evidence on
the evolution of wage inequality in Italy, providing also a brief institutional framework. In
Section 3, we describe the database and the sampling choices that have been made, and
we present some preliminary results on pay dispersion. Section 4 reviews the main econo-
metric model employed in the analysis and discusses its assumptions. Section 5 presents
5As we discuss later in the paper, the 1980s were also a period during which managers and white collarsstarted criticising trade unions’ excessively egalitarian stands.
6The two-way fixed effects model has been estimated on Italian data in different contexts (e.g. Iranzo,Schivardi, and Tosetti [2008] and Flabbi, Macis, Moro, and Schivardi [2014]). However, none of thesestudies has focused on wage inequality and on its evolution over time.
5

the main results. Finally, Section 6 contains the concluding remarks.
2. Institutional Context and Existing Studies on Italian Wage Dispersion
During the years considered in this study, and largely still today, Italy has been char-
acterized by a wage setting mechanism fairly centralized at the sector-wide national level.
Collective contracts are de-facto binding for all employers and all workers, irrespective of
union membership. Such agreements are signed (typically every two years) by the major
trade unions and employers’ associations at the industry-wide level. Each contract regu-
lates specific job titles (livelli di inquadramento) and the contractual minimum wages that
is to apply for each of them. There are no opting-out clauses. That is to say, firms cannot
decide to resort to firm-level contractual agreements derogating to the wage standards
settled at the sectoral level.7 Regional- or firm-level agreements can only distribute top-up
wage components, typically related to indicators of profitability or productivity.
Up until 1993, a cost-of-living allowance, called Scala Mobile, was also added quarterly
to the bargained contractual minimum wages. This institution induced a greater propor-
tional wage growth at the bottom of the distribution, a growth which was particularly
strong before that a major reform of this system was approved through a referendum
in 1985. Those who were more disadvantaged by this indexation rule were highly qual-
ified white-collars and skilled workers. From 1987 on, in order to further mitigate the
egalitarian tendencies induced by the wage-adjustment mechanisms, the majority of the
nation-wide contracts pursued a re-appraisal of the skill requirements embedded in each
livello di inquadramento, widening the gaps in the contractual wages stipulated for each
of these levels.8
In 1993 a major reform of collective bargaining was approved, in order to achieve the
following main objectives:9 (i) impose moderation on wage growth, by coordinating wage
7Only in 2011, well beyond the time period studied in this paper, an agreement signed by trade unionsand employers’ organizations has attempted to widen the scope for derogation of firm-level contracts withrespect to sectoral bargaining. Nevertheless, reforms in the wage setting institutions remain an activelydebated policy topic in the Italian context.
8This general tendency is often highlighted by industrial relations reports of the time (e.g., CESOS[1989]).
9Casadio [2003] provides a detailed review of the content of this reform. Moreover, a detailed institu-tional background on the pre-1993 context is given by Erickson and Ichino [1995].
6

increments across sectors and by setting low inflation targets; (ii) increase regional dif-
ferences in wages, in order to better adapt them to the heterogeneous cost of living and
labour market conditions observed in different parts of the country; (iii) allow firms to dis-
tribute premiums related to performance on top of the sectoral minimum, and to further
negotiate some parts of the collective agreements, but not those related to compensation,
at the establishment level. This reform resulted in an increase of geographical differences
in top-up components of negotiated wages. However, as documented by Devicienti, Maida,
and Pacelli [2008] on a sample covering around 60% of national private-sector contracts,
the amount of flexibility in bargaining agreements introduced by the 1993 reform was quite
limited, given that the average share of all top-up components over total wages increased
from around 18% during the mid-80s, to only 22% by the end of the 1990s.
To give a flavour of the general economic context characterizing the period under study,
Figure A.4 of the Appendix shows the evolution of GDP in Italy and in the statistical area
where Veneto is located. At least three phases can be identified. From the early 1980s
until 1991 the economy grows, except for a short period of stagnation, which lasts until
1984. The years from 1991 to 1993 are characterized by an economic recession, which is
followed by a recovery phase. From 1993 onwards, North-Eastern Italy outperforms the
national economic growth level.
In Figure A.5 we compare the evolution of male and female absolute levels of employment
in the Veneto private sector. To construct this figure, we have calculated the number
of individuals working for at least 16 weeks in a private-sector establishment located in
Veneto, and we have taken 1982 as the reference year. Women’s employment level has
risen more sharply than men’s one. Moreover, the employment response to the 1991-1993
crisis is more pronounced for women. Considering the entire period under study, the pop-
ulation of workers grew by slightly less than 20% for men and by almost 50% for women.
As we discuss later, this gender difference in participation is one of the main reasons that
led us to study the men’s and women’s sample separately.
In Figure A.6, we provide an overview of the long-run evolution of real gross weekly wages,
computed separately by gender from the social security records of private sector workers in
7

Veneto. The average pay, which is reported in the two top panels of the figure, increased
up until the early 1990s, when a phase of economic crisis begun and wage growth became
persistently flat, and even declining in the case of women. Looking at the two bottom
panels of the figure, we can see that inequalities, as measured by the standard deviation
of log weekly wages, declined sharply until around 1983 for both gender groups. Previous
research has attributed this remarkable trend to the strong compressing effects of the Scala
Mobile (see, in particular, the analysis in Manacorda [2004], based on household survey
data).10
As can be noticed from the bottom panels of Figure A.6, the period 1982-2001, the one on
which we focus our analysis, is instead characterized by a very persistent growth in pay
inequality. Other papers have studied the Italian wage inequality from the early 1980s
onward, documenting a growth in pay dispersion. The main data sources that have been
used are the Bank of Italy Survey on Income and Wealth (see Brandolini, Cipollone, and
Sestito [2002], Manacorda [2004] and Naticchioni and Ricci [2009] among others) and the
Worker History Italian Panel (WHIP), or similar administrative data containing samples
of the private sector of the entire Italian territory (see, for example, Devicienti and Bor-
garello [2001], Cappellari [2004] and Cappellari and Leonardi [2016]).
Manacorda [2004] shows that a rise in wage dispersion occurred in Italy between 1984
and 1993. However, his analysis is limited in scope, since it focuses mainly on the ef-
fects of the Scala Mobile prior to 1984, and the evidence provided is based on repeated
cross sectional household surveys, which do not allow to match workers and firms. Using
the same data on a larger period of time, these results are confirmed also by Brandolini,
Cipollone, and Sestito [2002]. Devicienti and Borgarello [2001] analyse a panel of admin-
istrative data covering the period 1985-1996, documenting an increase in several measures
of wage inequality. However, their analysis is limited to a disaggregation of the observed
trend across gender and homogeneous geographical and job-qualification groups. Cappel-
lari [2004] studies a sample of social security records over the period 1975-1995, focusing
10Leonardi, Pellizzari, and Tabasso [2015] further investigate this issue, documenting the presence ofsubstantial wage penalties for high skilled workers employed in firms more affected by the Scala Mobileduring the 1976-1982 period.
8

on the longitudinal persistence of men’s earnings inequality. By decomposing the earnings
autocovariance structure into its long-term and transitory parts, he documents an increase
in the dispersion of the long-term earning component, particularly strong since the early
1990s among older cohorts of workers.11
Finally, only a few papers have specifically looked at the role played by collective bargain-
ing institutions in the evolution of wage inequality. Such studies usually employ samples
covering only a few sectors and smaller geographical areas. In particular, Dell’Aringa
and Lucifora [1994] and Erickson and Ichino [1995], using a sample of metal-mechanical
workers in the metropolitan area of Milan, argue that the centralized system of industrial
relations plays a pivotal role in determining the Italian wage structure. Beyond their
narrower coverage, the data employed in these studies have typically other limitations,
which impede the estimation of a two-way fixed effect model, and of the related wage
variance decomposition (e.g., an insufficient coverage of each firms’ entire workforce or a
limited panel dimension). Differently from the rest of the papers reviewed above, in the
present analysis we will directly look at the contributions of firm wage policies, worker
heterogeneity and assortative matching to the evolution of wage inequality.
3. Data and Preliminary Evidences on Inequality
3.1. Database and Descriptive Statistics
The Veneto Working Histories (VWH) database, which is studied here, contains earn-
ings data from social security records for dependent workers of the private sector in the
Veneto region. The information on pay includes maternity and sick leaves and all cash
benefits, but it excludes all in-kind benefits. The database contains the population of
private sector firms whose headquarters are located in Veneto, and the population of their
employees. Workers of these firms are followed if they continue working in a private-sector
establishment outside the Veneto region.12
11Cappellari and Leonardi [2016] focus on the relation between tenure and earning instability. They findthat the introduction of temporary contracts, which occurred by the end of the 1990s, has increased theamount of earning fluctuations, particularly among younger cohorts.
12Workers are not followed if they move to the public-sector, since all public-sector workers are excludedfrom these archives. Moreover, for firms outside Veneto information on the entire workforce is not available.
9

One advantage of using social security records is given by the fact that the information
contained is highly accurate. Indeed, employers are obliged to report correct information
on their workforce by the law. However, there are also some drawbacks, as for example the
lack of important information, most notably the employees’ level of education.13 Another
limitation, dictated by the current data availability, is clearly the possibility to look at
the evolution of wage inequality in only one region of the country.14 Nevertheless, there
are several circumstances that make Veneto a particularly informative case-study. First,
this region has a well-developed manufacturing sector and is fairly large, given that its
population amounted to 4.5 millions in 2001 and its economy represented around 11% of
the national GDP in the same year. A second, and more subtle reason why separately
analysing a single region of Italy is interesting, particularly in the context of this paper,
is the approval of the 1993 industrial relations reform. Indeed, this agreement intro-
duced more flexibility at the regional level, in order to better link wages to local market
conditions and inflation levels.15 Therefore, when considering the whole country, wage
inequality could be over-estimated by ignoring the fact that part of its trend could be
driven by a genuine adjustment of wages to the local price levels.16
The VWH database contains information on wages from 1975 until 2001, but we consider
only the last two decades of the data. In particular, in the rest of the paper we study
the period between 1982 and 2001, and we choose log gross daily wages, adjusted to the
2003 level, as the unit of measurement for earnings. Our choices are motivated on several
grounds. The main objective of the paper is to shed light on the determinants of the
13However, under the assumption of constant individual education levels across time, the effect of thisvariable can be captured by the unobserved individual heterogeneity term in a panel framework.
14There are no currently available country-level longitudinal matched employer-employee data suitablefor our aims. For instance, the Italian Worker History Italian Panel is a 1:90 sample of dependent workers,entailing that for many firms only a handful of workers (often just one) are observed. The only otheremployer-employee data source that has been analysed in the literature (i.e. the one studied by Iranzo,Schivardi, and Tosetti [2008]) allows to observe the entire workforce of each firm, but the firm sample isdrawn considering only relatively large establishments.
15On this topic, Devicienti, Maida, and Pacelli [2008] document a tenuous resurrection of the Italianwage curve after 1993, mostly driven by greater regional differences in wages. This form of flexibilityhas been one of the main targets of the 1993 agreement, since the Italian economy has always been quiteheterogeneous in terms of employment levels and costs of living, with substantial differences betweenNorthern and Southern regions.
16Correcting for the latter is no simple task, particularly given the lack of official data on spatial priceindexes.
10

most recent growth in pay dispersion, which takes place during the last two decades of
the available data. Moreover, information on days worked is reported only starting from
1982. Daily wages are a more precise measure of earnings than other available alterna-
tives (weekly or monthly wages), since, by the law, employers have to report all weeks and
months during which the employee has worked at least one day.
In order to analyse a sample of workers more homogeneous and consistent across time, we
have separately considered men and women.17 Moreover, throughout the paper we mainly
focus on the results of the male sample, although references to those obtained among
women are often included for comparison purposes. We have also taken a number of steps
that are relatively standard in the literature using similar data. First, for each employee
with multiple jobs during the same year, we have selected the most representative spell
in terms of months, weeks and days worked, resorting to total earnings to break the few
remaining ties. Second, we have excluded from the sample all spells shorter than approx-
imately four months (16 weeks) and, finally, we have trimmed wages at the 1st and 99th
percentiles (calculated over a six-year period).
We have divided the 1982-2001 years of data into five, partially overlapping, six-years
panels. In each period, we have separately estimated the two-way fixed effect model of
Abowd, Kramarz, and Margolis [1999] over the respective largest connected set.18 Finally,
all results are computed over firms of Veneto only, but we have included also employment
spells outside this region in the estimation sample of the two-way fixed effect model. The
rationale of these choices is discussed in the section providing the details of our economet-
ric method.
Tables 1 and 2 contain descriptive statistics for each of the five panels that we have con-
structed, computed separately by gender.19 As can be noticed, the (non-weighted) average
17As shown by Figure A.5, the observed employment dynamics are indeed quite different among menand women.
18This is a set of workers and firms connected by employees’ mobility. This restriction implies the loss ofan extremely small proportion of observations, and is usually applied to simplify estimations. See Abowd,Creecy, and Kramarz [2002] for a discussion.
19In reading these figures, notice that the secondary sector is over-represented, given that public sectorworkers are excluded from the social security archives. This pattern is reflected in the occupationalcomposition of the sample, where the majority of individuals are blue-collars.
11

firms’ size, as measured by the number of employees continuously working for at least six
months in a year, tends to be quite small and it is decreasing over time. This tendency,
considered together with rising employment levels and secondary sector jobs, shows that
the overall economic growth experienced by Veneto during the years under study has been
closely linked to a growth in the number of small-sized manufacturing oriented establish-
ments. The distribution of firm size is highly dispersed and positively skewed, since also
very small companies are included in our database. This last feature is worth noticing,
given that small firms are often not observed in traditional samples (see footnote 14),
despite being an important component of the Italian economy.20
Among other tendencies emerging from the tables, notice that the average age increases
for women in later years of the sample, despite being quite stable across men. This out-
come can in part be attributed to the higher education levels reached by younger cohorts
of women, a tendency determining a later entrance in the labour market. Moreover, the
average growth in women’s age is also linked to the greater labour market attachment
experienced by younger cohorts of female workers at later stages of their careers. There
are other substantial gender differences in the sample composition. In particular, females
are under-represented in managerial occupations and they are much more likely to work
par-time. Part-time contracts have been introduced in the Italian legislation only since
1985, and this explains why they tend to be quite rare in the earlier years of the data.
The over-representation of women in this category of workers poses challenges on the com-
parability of results obtained for men and women, and it is another important reason for
keeping our analysis of pay dispersion separated by gender.
Finally, notice that real wages are quite flat during the overall period considered, while
their dispersion, as measured by the standard deviation, steadily increases both among
women and men. In the next paragraph, we are going to present a more accurate descrip-
tion of this trend.
20According to the figures of the Italian Statistical Office (ISTAT - ASIA 2011) plants with less than 10workers represent around 95% of the firms’ population at the national level, and they employ around 46%of the private-sector workforce.
12

Table 1: Male Sample Summary Statistics (Mean and St. Dev.)
Period 1982-1987 1984-1989 1988-1993 1992-1997 1996-2001
Log daily wages 4.782 4.801 4.855 4.866 4.874St. Dev. 0.287 0.303 0.337 0.350 0.362
Age 36.76 36.37 35.94 35.83 35.81St. Dev. 11.07 11.04 10.91 10.40 9.85
Firms’ workers 7.884 7.392 7.031 7.500 7.419St. Dev. 55.30 48.77 39.05 52.09 49.023
Tenure 5.072 5.552 6.013 6.451 6.479St. Dev. 3.631 4.325 5.494 6.252 6.823Proportion
Part Time 0.002 0.004 0.007 0.011 0.016Proportion
Apprentice 0.016 0.020 0.025 0.025 0.035Proportion
Blue Collar 0.730 0.729 0.723 0.723 0.708Proportion
White Collar 0.247 0.243 0.242 0.244 0.250Proportion
Manager 0.007 0.007 0.008 0.007 0.007Proportion
Primary Sect. 0.043 0.045 0.045 0.044 0.042Proportion
Secondary Sect. 0.626 0.631 0.648 0.651 0.663Proportion
Tertiary Sect. 0.331 0.324 0.307 0.305 0.295
Total Workers 698,378 724,448 753,753 777,019 845,984
Total Firms 64,972 72,605 80,159 80,572 85,104
The sample is composed of firms located in Veneto belonging to the largest connected set.
Part-time contracts have been introduced only since 1985. Tenure is censored at 1975.
13

Table 2: Female Sample Summary Statistics (Mean and St. Dev.)
Period 1982-1986 1984-1989 1988-1993 1992-1997 1996-2001
Log daily wages 4.547 4.555 4.585 4.574 4.549St. Dev. 0.277 0.276 0.317 0.345 0.372
Age 31.47 31.25 31.31 32.37 33.45St. Dev. 9.86 9.68 9.36 9.26 9.30
Firms’ Workers 9.427 8.275 7.556 7.991 7.375St. Dev. 50.56 43.99 44.78 52.64 43.09
Tenure 4.497 4.837 5.082 5.603 5.749St. Dev. 3.414 4.003 4.925 5.642 6.284Proportion
Part Time 0.022 0.046 0.097 0.138 0.195Proportion
Apprentice 0.024 0.033 0.036 0.032 0.052Proportion
Blue Collar 0.621 0.616 0.582 0.593 0.546Proportion
White Collar 0.349 0.346 0.360 0.373 0.399Proportion
Manager 0.001 0.000 0.000 0.000 0.000Proportion
Primary Sect. 0.043 0.045 0.047 0.048 0.050Proportion
Secondary Sect. 0.511 0.517 0.514 0.499 0.492Proportion
Tertiary Sect. 0.446 0.437 0.439 0.453 0.458
Total Workers 406,988 442,871 493,208 518,292 603,106
Total Firms 42,600 52,804 67,263 67,476 78,797
The sample is composed of firms located in Veneto belonging to the largest connected set.
Part-time contracts have been introduced only since 1985. Tenure is censored at 1975.
14

3.2. Preliminary Evidences on Inequality
Figure 1 describes the evolution of log daily wages at the 10th, 50th and 90th percentiles
of the gender- and year-specific earning distribution. It can be easily noticed that the
90th-10th, 50th-10th and 90th-50th wage percentile ratios have all increased. Another
striking evidence is the very slow, and even negative growth of wages. In particular, men’s
earnings at the bottom of the distribution have remained stable over the whole period,
median wages have risen by less than 2% and the 90th percentile of the pay distribution
has risen by almost 6% in real terms, but it has been stagnating during most of the 1990s.
Instead, women’s percentiles ratio have started to widen later than men’s ones. Notice
that, from the beginning of the 1990s female wages at the bottom of the distribution have
declined by around 4%, while they have risen by almost the same amount at the 90th
percentile, following a similar pattern to men’s top earnings. The declining dynamic of
female wages at the bottom of the distribution is partly explained by the introduction of
part-time contracts, which have played an important role in increasing female participation
to the labour market.
In the left panels of Figures 2 and 3 we test the predictive performance of a series of
log-linear conditional wage models. To construct these figures, we have run year-by-year
OLS regressions on the workers of firms located in Veneto, using different sets of controls.
In each figure, the highest line of the left-panel graph represents the unconditional log
wage variance. The other lines represent the root mean squared error (RMSE) of year-
specific regression models. In each model, we have used the same set of base-line covariates,
namely: a quadratic in age, occupation dummies, tenure dummies, log of firm size (number
of employees), around thirty sector fixed effects, national industry-wide collective contract
fixed effects, a set of interactions (age with occupation and age with tenure). In addition to
these covariates, each regression model is fully saturated for one of the following categories:
(1) job titles (livelli di inquadramento), (2) firms or (3) both.21
21Notice that national industry-wide collective contract fixed effects are not collinear with job title fixedeffects, since the latter are specific occupations (usually between five and ten) defined by the former.Instead, firm fixed effects are collinear with sector fixed effects and, typically at least, also with industry-wide contracts fixed effects. The procedure adopted in constructing job title and collective contract fixedeffects will be discussed in more detail in Section 5.3.
15

The RMSE provides a measure of the performance of each model in explaining total wage
variation. In general, the trend in residual wage variance is fairly flat, while the total pay
variance, both in the case of men and women, shows a clear increasing pattern. This is
a preliminary evidence that workforce composition and returns to its characteristics do a
good job in explaining the rise in wage dispersion over time, and are becoming increasingly
relevant over time. Obviously, none of the estimated models reported here does control for
constant unobserved individual characteristics. Nevertheless we can see that a fairly small
proportion of the unconditional wage variation remains unexplained, especially when we
estimate a model fully saturated for job titles and firms. Firm fixed effect explain a greater
proportion of wage variation than job title fixed effects. However, when focusing on the
evolution of the RMSE across time, this same pattern does not hold.
In order to better compare the evolution in the relative performance of each of the three
regression models, in the right panels of Figures 2 and 3 we normalize each year-specific
RMSE to the 1982 level of the corresponding model.22 A clear pattern emerges both
in the male and female samples. Over time, the explanatory power of fixed effects for
job titles gains importance with respect to the models where firm effects are controlled
for. Since inquadramento levels are defined by sector-wide collective agreement, and a
particular minimum wage is set for each of these occupational positions, we interpret the
right panels of Figures 2 and 3 as a preliminary evidence of the importance of collective
bargaining in shaping the evolution of the pay distribution. In Section 5.3, employing a
more informative regression framework, we analyse this point in more detail.
22In interpreting the graph, notice that the absolute predictive performance of a model has to be evaluatedwith respect to the unconditional wage variance. The left panel of Figures 2 and 3 is useful in order tocompare the relative predictive performance of a model with respect to the others, but not the absoluteone, which indeed tends to grow over time.
16

Figure 1: Evolution of Log Daily Wages at Various Percentiles
100
102
104
106
1980 1985 1990 1995 2000Year
Evolution of Median Log Wages 10th Percentile Evolution90th Percentile Evolution
Base Year 1982=100, Male SampleEvolution of Log Daily Wages
9698
100
102
104
1980 1985 1990 1995 2000Year
Evolution of Median Log Wages 10th Percentile Evolution90th Percentile Evolution
Base Year 1982=100, Female SampleEvolution of Log Daily Wages
Figure 2: Wage St. Dev. and RMSE from Alternative Wage ModelsMale Sample, Year-by-Year Regressions
.15
.2.2
5.3
.35
St. D
ev.,
RM
SE
1980 1985 1990 1995 2000Year
Log daily wages st. dev. Mincer model (1) RMSEMincer model (2) RMSE Mincer model (3) RMSE
Pred
ictiv
e Pe
rform
ance
H
ighe
r
Low
er
1980 1985 1990 1995 2000Year
Mincer model (2) RMSE Mincer model (3) RMSEMincer model (4) RMSE
Reference Year = 1982, Various ModelsRMSE Evolution, Male Sample
Baseline controls: age (quadratic), tenure dummies, four qualification dummies, log of employees num-ber, sector fixed effects, national industry-wide collective contract fixed effects.
Model (1): job title (livello di inquadramento) fixed effects.
Model (2): firm fixed effects.
Model (3): fully saturated fixed effects for job titles and firms.
Note: national collective contracts vary within and across sectors, and might be not homogeneous acrossyears. Inquadramento levels are occupational positions determined by each national collective contract,and are not homogeneous across years.
17

Figure 3: Wage St. Dev. and RMSE from Alternative Wage ModelsFemale Sample, Year-by-Year Regressions
.15
.2.2
5.3
.35
.4
St. D
ev.,
RM
SE
1980 1985 1990 1995 2000Year
Log daily wages st. dev. Mincer model (1) RMSEMincer model (2) RMSE Mincer model (3) RMSE
Pred
ictiv
e Pe
rform
ance
H
ighe
r
Low
er
1980 1985 1990 1995 2000Year
Mincer model (2) RMSE Mincer model (3) RMSEMincer model (4) RMSE
Reference Year = 1982, Various ModelsRMSE Evolution, Female Sample
Baseline controls: age (quadratic), tenure dummies, four qualification dummies, log of employees num-ber, sector fixed effects, national industry-wide collective contract fixed effects.
Model (1): job title (livello di inquadramento) fixed effects.
Model (2): firm fixed effects.
Model (3): fully saturated fixed effects for job titles and firms.
Note: national collective contracts vary within and across sectors, and might be not homogeneous acrossyears. Inquadramento levels are occupational positions determined by each national collective contract,and are not homogeneous across years.
18
4. Econometric Methodology
The contributions of firm-specific, time-constant and time-varying components of wages
to raising inequality are identified relying on the higher-dimensional linear panel model of
Abowd, Kramarz, and Margolis [1999] (we will alternatively refer to this method as two-
way fixed effects model and AKM regression). Moreover, in order to make inter-temporal
comparisons, we adopt the same strategy of Card, Heining, and Kline [2013], dividing the
years under study into different sub-periods. In this section, we briefly review the chosen
econometric methodology, we explain the required assumptions, and we discuss the inter-
pretation of the model.
Let i index a specific worker, t the time period, and j = ι(i, t) the firm in which i is
working at t. Moreover, let yi represent a T × 1 vector of log wages, xi a T × P matrix of
time- and firm-varying individual characteristics. Then, the two-way fixed effects model
can be specified as follows
yit = xitβ + φj + ηi + eit
where yit and xit are elements of yi and xi, β is a P × 1 vector of parameters, while φj
and ηi are respectively firm-constant and time-constant components of individual wages,
which are allowed to be arbitrarily correlated with any of the characteristics in xi, and
which could be not perfectly observable. Notice that we will often refer to ηi with the
term unobserved individual heterogeneity, and to φj with firm wage premium or firm wage
policy.
Instead, eit is the error term, which we assume to have an expected value equal to zero in
all periods. Moreover, it is an idiosyncratic shock, which is not allowed to be correlated
with any of the elements in xi, φj and ηi. This assumption, which we define as strict
exogeneity, can be stated formally as
E[eit|xis, φj=ι(i,s), ηi
]= 0 ∀ s, t
Notice that the above assumption rules out any pattern of endogenous mobility of workers
between firms. Any realization of ι(i, s) = j should be uncorrelated with ei,t, so that,
for example, negative idiosyncratic shocks in wages should not lead to mobility towards
19
a certain type of firms. However, any correlation between ι(.) and ηi or φj is possible,
so that workers of a given type can move toward firms with certain wage policies and
vice-versa. If strict exogeneity holds, the model can be consistently estimated by OLS,
via inclusion of dummies for individuals’ and firms’ effects.
The hypothesis of exogenous worker mobility across firms, conditional on individual ob-
servable and time-constant unobservable characteristics, has been criticised, e.g. by Eeck-
hout and Kircher [2011] who point out that many search and matching models of the
labour market are inconsistent with the additive linearity of the AKM approach. Card,
Heining, and Kline [2013] develop several tests to support the validity of the strict exo-
geneity assumption. These tests have been conducted on German data (Card, Heining,
and Kline [2013]) and on Portuguese data (Card, Cardoso, and Kline [2016]), both papers
concluding that the AKM model provides an accurate approximation to wage determi-
nation in these countries. Flabbi, Macis, Moro, and Schivardi [2014] apply similar tests
on Italian Social Security earnings data, covering a sample of firms above 50 employees
over a period similar to the one analysed here, and do not report any evidence of AKM
misspecification.
Table 3 reports, for each of the AKM model estimation samples, the proportion of individ-
uals changing employer (the so-called movers) over the total number of individuals ever
working at the firm.23 All of the statistics computed for this variable are weighted by the
number of distinct firm’s employees included in the sample. Over the two decades anal-
ysed, workers’ mobility tends to grow.24 Despite this trend, mobility of workers is fairly
strong also during the 1980s. Indeed, during the period 1982-1987, on average 45% of the
workforce at a given firm was hired also by at least one of the other employers included in
the estimation sample. The same percentage was of almost 60% during the latest period
analysed (1996-2001). Even among employers with the most stable workforce, those at the
23Table 3 is computed on male workers only. Results obtained on the female sample are reported inTable A.1.
24This outcome can be interpreted as evidence of greater job instability in the most recent years. Thistendency has been triggered by several reforms, such as more flexible employment protection legislationsand the liberalization of the hiring process. Moreover, also market forces, such increased volatility, inter-national competitiveness and outsourcing, may have played an important role.
20
10th percentile of the mobility proportion distribution, the percentage of job-movers was
11% during 1982-1987. The (weighted) median number of movers per firm ranges between
20 in 1982-1987 and 26 during the period 1996-2001. Overall, the amount of mobility
observable in the data, despite not being uniform across periods, seems to be large enough
to provide a good estimate of the firm wage policies.
Our baseline control variables included in the AKM model are a quadratic for age, a
dummy for part-time workers,25 three dummies for occupation, the log of the number of
employees, six dummies for the first five years of tenure,26 and a full set of time fixed
effects. Moreover, we add interactions between age and occupation dummies, age and
tenure dummies, and firm size and time dummies. As a robustness check, we have ex-
cluded part-timers and apprentices from the computations, finding qualitatively similar
results. Moreover, we have estimated the model by including sector-specific time effects,
but again we did not find major differences in the results.
The estimated individual fixed effects measure the individual earning capacity that is con-
stant over time, and largely portable as the individual moves to other firms during his/her
labour market career. Education, skills, professional networks and other personal factors,
which are constant or change slowly over time, all contribute to this component, to the
extent that they are rewarded equally across employers. Instead, the estimated firm fixed
effect measure how much differences in wages paid by observationally similar employers
matter, keeping constant employee quality and other observable characteristics. Unlike a
simple average of the workers’ wages in the firm, φj can be interpreted as a firm-specific
wage policy because the AKM model controls for worker observed and unobserved hetero-
geneity, and hence accounts for the potential non-random sorting of workers to firms.27
25Part-time contracts have been introduced in the Italian legislation only in 1985. Prior to that date,part-time was informal, and mostly horizontal in nature.
26This discrete specification for the variable tenure is motivated by the fact that the information ontenure is censored up to 1975.
27Apart from the above mentioned restriction on the endogenous mobility of workers, one limitationof this model is given by the fact that firms wage premiums cannot be interpreted as indexes of firmsproductivity or efficiency. Indeed, as shown by Eeckhout and Kircher [2011], using wage data alone thecontribution to productivity of a skilled worker cannot be disentangled from the contribution of the firmtechnology, since the two are simultaneously determined, and, most importantly, not monotonically related.Nevertheless, since the focus of this analysis is on the determinants of wage dispersion rather than workers’productivity, the estimated firms wage policies remain an interesting parameter.
21

Notice that, as the AKM dependent variable is log wages, φj represent a proportional
firm-specific wage premium paid by firm j to all its employees.
There are several reasons why similar firms may adopt differentiated wage policies. As
highlighted by a vast stream of literature, firms might offer wages higher than the equi-
librium level as part of an exchange of gifts with their employees (as in the efficiency
wage theory set forth by Akerlof [1982]). Moreover, similar firms might adopt a so-called
wage posting behaviour, offering higher wages in order to reduce the cost of vacancies (e.g.
Burdett and Mortensen [1998]). Finally, firms might differ in the degree of rent-sharing, a
phenomenon which has been found to be small, but significant in magnitude, in the labour
market analysed here. Indeed, using the years from 1995 to 2001 of the database studied
here, Card, Devicienti, and Maida [2014] find an elasticity of wages with respect to profits
of around 5%.
Roughly speaking, firms’ effects in the AKM regression are identified as the average wage
shock experienced at a given establishment by employees who changed employer during
the period considered. Each firm effect is computed with respect to an arbitrary reference
category and, as shown by Abowd, Creecy, and Kramarz [2002], it is identified only by
workers who changed at least one employer within a given mobility group.28 Therefore, in
our analysis we have considered only the largest connected set of establishments, which
usually contains, depending on the years considered, more than 95% of the sample obser-
vations. Moreover, since the estimates of firms wage premiums could be biased whenever
the number of mobility episodes is low and the entire workforce is not observable, we will
compute and report the main results only for firms located in Veneto.29
Given the linearity of our panel model, and under the assumption of strict exogeneity, the
28By mobility group, or connected set, we intend the group containing all workers who ever worked forany of the firms in the group, and all the firms at which any of the workers in the group were ever employed.
29Firms excluded from the decomposition are nevertheless included in the regression, since otherwise wewould have a loss in efficiency. The choice of not reporting results for firms outside Veneto is motivated bythe fact that for such establishments we do not have information on the entire workforce. See Andrews,Gill, Schank, and Upward [2008] for a discussion of the effects of limited mobility bias in the estimates offirms-wage premiums.
22

total variance of log wages can be decomposed as follows
Var(yit) = Var(φj=ι(i,t)) + Var(ηi) + Var(xitβ) + Var(εit)+
+ 2Cov(φj=ι(i,t), ηi) + 2Cov(φj=ι(i,t), xitβ) + 2Cov(ηi, xitβ) (1)
Each component in the right-hand side of the above equation can be recovered from the
estimated parameters of our regression model. It follows that we can measure which are,
among firm-specific, time-constant and time-varying factors, the main drivers of wage
dispersion, and which forces lessen their magnitude over time. Notice that, with the ex-
ception of the error term, the effect of each component on the total variance is mediated
by the covariance terms. Of particular interest are the covariances associated to firms’ pay
premiums, since they measure positive or negative sorting of individuals with given charac-
teristics into types of firms adopting specific wage policies. Instead, the term Cov(ηi, xitβ)
measures whether workers with higher wage components related to their time-varying
characteristics also tend to exhibit higher (positive covariance) or lower (negative covari-
ance) components related to their time constant unobserved heterogeneity.
In practice it is often difficult to understand which human capital factors are absorbed
by unobserved heterogeneity, and what drives the sorting between time-varying and time-
constant characteristics of workers. To some extent Cov(ηi, xitβ) is determined by how
well given workers’ skills are measured by the time-varying characteristics included in the
regression.30 Given these difficulties, in presenting our results we will most often rely on
the following, more parsimonious decomposition
Var(yit) = Var(φj=ι(i,t)) + Var(ηi + xitβ) + Var(εit)+
+ 2[Cov(φj=ι(i,t), ηi) + Cov(φj=ι(i,t), xitβ)
](2)
30For example, ηi could capture the effect of professional networks’ quality. However, by including inxit a control for tenure interacted with age and occupation, we might provide a good proxy of networks’quality for experienced, highly qualified workers, and a bad proxy for inexperienced, less qualified workers.Then, we could have a situation in which ηi is lower for individuals with the best networks, simply becausefor these workers the quality of networks is captured by a time-varying characteristic. This will of coursedepend on how the wage-networks relation operates, and on how networks’ quality is distributed in thepopulation.
23

This decomposition is equivalent to the previous one, with the only exception that in
equation (2) the term Var(ηi + xitβ) captures the joint effect of workers’ time-constant
and time-varying characteristics. We will often refer to (ηi + xitβ) with the term workers’
wage premiums, in order to distinguish this source of wage variability, which is individual-
specific, from firms’ pay premiums. Given the already mentioned difficulties in interpreting
differences between returns to time-constant and time-varying workers’ characteristics, we
believe that Var(ηi + xitβ) can be considered a more comprehensive and more precise
measure of dispersion in employees’ overall earning abilities.
24

Table 3: Proportion of Job Mobility Episodes per Firm, Male Sample
Period Mean10th
Percentile50th
Percentile90th
Percentile
1982-1987 0.450 0.110 0.400 0.8891984-1989 0.496 0.137 0.474 0.9091988-1993 0.571 0.214 0.556 0.9521992-1997 0.581 0.234 0.562 0.9511996-2001 0.595 0.254 0.588 0.942The statistics refer to the proportion of individuals experiencing job-to-job transitions over the
total number of individuals ever working at the firm during the 6-year period. Each statistic is
weighted for the number of individuals ever employed by the firm. Only firms of Veneto belonging
to the largest connected set are considered.
25
5. Main Results
This section discusses the main results of the paper. They are based on the AKM
regression model described in the previous section, and on the associated variance decom-
position technique. We have estimated the two-way fixed effect model focusing on the
evolution of its parameters over time, and the results of this analysis are presented in the
next paragraph. Section 5.2 discusses some institutional features that have most likely in-
fluenced the evolution of the wage structure in the Italian case, and compares the results
of the AKM regressions with those obtained on German data by Card, Heining, and Kline
[2013]. Finally, in Section 5.3 we propose an empirical strategy in order to assess whether
the variability and evolution of unconditional wages and worker’s pay premiums, as de-
fined by equation (2), have been influenced by the growth of between-job titles minimum
wages differences.
5.1. Variance Decomposition from the AKM Regressions
As already mentioned, we have calculated the variance decomposition of equation (1)
on five, partially overlapping, six-years gender-specific panels. Here, we discuss the results
obtained in the male sample, as all of the analysis that follows this section is conducted
considering male workers only.31 Results for female workers are reported in Section A.2.
In each panel, we have computed two-way fixed effects regressions controlling for human
capital and aggregate shocks in wages. The coefficients associated to the regressors in-
cluded in xit were all significant and had the expected sign.32 For each period, Table 4
reports the results from the wage variance decomposition based on equation (1).
During the overall period considered, the total wage variance, as computed on each six-
years panels, has increased from 0.83 to 0.131, growing by almost 45%.33 When looking at
31Even if some similarities in the observed patterns emerge, substantial gender differences in participationrates and in the use of part-time contracts makes the results obtained for women seldom comparable tothe ones obtained in the male sample. Thus, a more careful assessment of the evolution of the female wagedistribution is out of the scope of the present analysis.
32In particular, in all periods returns to age are positive and slightly marginally decreasing. Moreover,there are wage losses during the first years of tenure and wage gains for white-collars. See Section 3.1 for acomplete list of the regressors. Notice that the MSE for each estimation of this model is reported in Table4. The overall R squared ranges between 0.69 and 0.77 in the male sample.
33To put our results in perspective, notice that Card, Heining, and Kline [2013] find that the totalvariance of male wages had risen in West Germany from 0.136 during 1985-1991, to 0.187 during 1996-
26

the behaviour of the various components of pay, a few noticeable features emerge. First,
in each period, the largest contribution to the total variance derives from the joint effect of
worker heterogeneity, both observed and unobserved. In general, the variance of ηi dom-
inates the variance of xitβ. However, as mentioned in the previous section, disentangling
the relative contributions of the two worker components is tricky from an empirical point
of view. Indeed, the covariance of the two components shows quite an erratic behaviour,
with high negative values in the sub-periods where the variance of xitβ is relatively larger.
This is the main reason why, in the rest of the paper, we will focus on the more parsimo-
nious decomposition of equation (2).
A second feature of the results is that the component related to firms’ wage premiums
provides a smaller contribution to overall wage dispersion than worker heterogeneity, and
this is true even if we compare it solely to worker’s unobserved heterogeneity. Importantly,
firm wage premiums are more relevant in the first period of the sample (1982-1987), but
lose importance thereafter. Finally, the estimated correlation between the firm wage ef-
fect and the worker’s heterogeneity, considering jointly both the observed and unobserved
components, tends to be negative in the earliest years, but it is clearly increasing over
time and positive during the last years considered. Hence, there is a significant tendency
towards positive sorting of firms’ wage premiums with workers’ overall human capital.
To show these trends more clearly, in Table 5 we have reported the decomposition of equa-
tion (2), computed in the first and in the last panel only. This less detailed decomposition
has a straightforward interpretation. The wage component related to the workers’ time-
varying observable characteristics and the component deriving from their time-constant
unobservable skills are here jointly considered. Firms’ pay premiums, and the way in
which they are sorted with workers attributes, form the other two main components of
total wage dispersion. When separately considering the period 1982-1987 and the period
1996-2001, the most important determinant of total wage dispersion is the variance of the
2002, which translates into a 31.5% increase. Instead, in our data we find that the male wage variance hasincreased from 0.092 during 1984-1989 to 0.131 during 1996-2001, which translates into a 35% increase.Finally, notice that Iranzo, Schivardi, and Tosetti [2008], analysing a sample of large Italian firms duringthe entire period 1981-1997, find the total male wage variance in the largest connected set to be 0.11.
27

term (ηi + xitβ). Indeed, this component constitutes between two thirds and three fourth
of the total pay variance in the male sample.
In the lower part of Table 5 we analyse the evolution of earning dispersion from the earli-
est to the latest panel. For each component of the total variance, we have computed the
difference across samples, the percentage change, and the contribution of this change as
a percentage of the change in total wage variance. Between these two periods, total wage
variance has risen by almost 45% among men. More than 52% of this growth is driven by
higher dispersion in our comprehensive measure of workers’ skills. Increasing assortative
matching between highly paid workers and better paying firms is another contributing
factor to the overall growth in wage dispersion. Despite the correlation between the in-
dividual component of wages and φj is relatively small in all periods, it switches from
negative to positive between the initial and final sub-periods of our data, contributing to
another 64% of the total change. Finally, the dispersion in firms’ wage premiums declines
between the first and the last panel, providing a negative contribution of about 15% to
the overall growth in wage dispersion.
The results presented so far can be summarized as follows. More than two thirds of the
variation of Italian wages is determined by the combined effect of workers’ time-varying
and time-constant individual characteristics.34 Earning dispersion has increased during
the overall period considered, and the worker-specific component of wages has been an im-
portant factor driving this trend. Instead, we find that the importance of the dispersion in
firm-specific wage policies has declined over time. In the rest of the paper we interpret the
emergence of these results in light of the specific features of the Italian system of Industrial
relations.
According to our estimates, a rising (positive) assortative matching between firms’ pay
premiums and the human capital of their workforce has also represented a significant con-
tributing factor to the overall growth in wage inequality. In particular, while firms paying
34Iranzo, Schivardi, and Tosetti [2008] apply AKM regression models over similar data (albeit theirsample covers only firms with 50+ employees) but with a focus on the entire period 1981-1997 (i.e.,without focusing on the temporal evolution of wage inequality, and its components), and also find thatroughly two thirds of the total wage variance is explained by worker-specific pay premiums.
28

lower wage premiums were the ones hiring on average more skilled workers up until the
mid-80s, this negative sorting has reversed since then. The reasons for this phenomenon
are likely to be complex, and cannot be fully explained within the scope of the present pa-
per. It is, however, tempting to relate growing assortativeness to some evolutions occurred
in the Italian labour market and in its legislation. In common with other EU countries,
Italy has indeed experienced a general trend of labour market liberalization that may
have gradually reduced search and matching frictions, and eventually improved allocative
efficiency. For instance, in the 1980s, hiring typically involved only open-end contracts,
while hirings under temporary contracts were gradually liberalized only starting from the
second half of the 1990s. Moreover, during the first years considered here, manual workers
were selected almost exclusively from the unemployment workers’ lists held by the public
employment service, and not via direct selection mechanisms. Indeed, the hiring process
was fully liberalized only in the early 1990s. Finally, other labour market tendencies have
probably contributed to the growth in sorting between firm wage policies and worker skills.
In particular, changes in the overall composition and characteristics of firms across time
represent another potentially important channel determining this trend.35
In the next section we discuss how changes in the industrial relation system might have
had a more direct bearing on the other two main findings of the paper, the declining dis-
persion in firm wage policies and the rising contribution of the worker-specific component
of wages to the overall inequality trends. In doing so, it is useful to assess the experience
of the second largest manufacturing economy in Europe in light of what has already been
documented for its manufacturing leader.
35On this respect, Table 3.1 shows that the composition of employment across industries tends to be quitestable over time, although the proportion of workers in the secondary sector is slightly higher toward theend of the overall period under study. Instead, there is a persistent growth in the incidence of small-sizedfirms.
29

Table 4: Variance Decomposition of Log Daily Wages, Men
Period Var(φj) Var(ηi) Var(xitβ) Var(εit)
1982-1987 0.031 0.050 0.006 0.0081984-1989 0.027 0.100 0.089 0.0081988-1993 0.026 0.101 0.094 0.0081992-1997 0.028 0.076 0.007 0.0071996-2001 0.024 0.130 0.153 0.007
Period 2Cov(φj , ηi) 2Cov(φj , xitβ) 2Cov(ηi, xitβ) TOTAL VAR.
1982-1987 -0.020 0.001 0.007 0.0831984-1989 -0.019 0.008 -0.121 0.0921988-1993 -0.014 0.015 -0.116 0.1131992-1997 -0.002 0.002 0.006 0.1231996-2001 -0.006 0.018 -0.195 0.131The estimation sample is composed of all workers in the largest connected set, provided they where employed
for at least four months. Results are computed only for firms located in Veneto.
Table 5: Decomposition of the Total Wage Variance Evolution, Male Sample
Period Var(φj) Var(ηi + xitβ) Var(eit)2Cov(φj , ηi +
xitβ)TOTALVAR.
1982-1987 0.031 0.063 0.008 -0.019 0.083% of Total 37.3 75.9 9.6 -22.9 100
1996-2001 0.024 0.088 0.007 0.012 0.131% of Total 18.3 67.2 5.3 9.2 100
Difference -0.007 0.025 -0.001 0.031 0.048
% ∆ -25.5 33.1 -13.3 200.0 44.9
% ∆/∆TOT -14.6 52.1 -2.1 64.6 100.0
Percentage changes for a given quantity z from t− 1 to t are computed using a reference value zr defined
as zr =|zt|+|zt−1|
2
30

5.2. Wage Inequality and Institutions: A Comparative Perspective
Since we have used a sampling strategy and a method similar to the one that has been
applied by Card, Heining, and Kline [2013] on German data, it is particularly interesting
to compare their evidence with that provided in our study. Table 6 reports the decom-
position of equation (2) applied on the results of Card, Heining, and Kline [2013], and
the results obtained by applying the same decomposition on our sample, considering a
comparable period of time.
Male earning dispersion has increased in Italy at a similar pace than in West Germany.36
However, the determinants of this trend are different in the two countries. Card, Heining,
and Kline [2013] show that, considering differences between the period 1996-2002 and the
period 1985-1991, only 34% of the total growth in wage variance can be attributed to
greater individual heterogeneity dispersion, while the same amount is more than 51% in
the case of Veneto. Between the same periods firms’ pay premiums dispersion rose by 26%
in Germany, while it has reduced by almost 8% in our sample. They also find that the
sorting between firm-specific and employee-specific pay premiums contributed for another
36% to the overall growth in the German earnings inequality.37
Card, Heining, and Kline [2013] interpret their findings, and in particular the growth
in firms’ wage policies dispersion, as being driven by the major changes in the German
industrial relation system that occurred in the early 1990s. As discussed by Dustmann,
Ludsteck, and Schnberg [2009], rather than in legislation reforms, such changes were laid
out in contract and mutual agreements between the three main actors of the system:
employer associations, trade unions and works councils. In response to the challenges
of the post-reunification period (e.g., increasing threats of firms’ off-shoring and mas-
sive migration flows), these actors allowed for an unprecedented decentralization of the
36In absolute terms, the variance of wages is higher in West Germany. However, beside differences in thedefinition of wages across samples, we should consider that our analysis is based on a database coveringthe Veneto region only. Thus, our sample is likely to be more homogeneous than the one employed byCard, Heining, and Kline [2013].
37The sorting contribution in Card, Heining, and Kline [2013] is somewhat weaker contribution than whatwe have found in our paper, though this might reflect the relative imprecision of the estimated correlationsbetween between worker and firm fixed effect, as often documented by the literature estimating AKM-typemodels.
31

German wage-setting process since the early 1990s. Deviations from industry-wide agree-
ments through “opting-out”, “opening” or “hardship” clauses were all increasingly used,
even though the dominating system of industry-wide bargaining basically remained un-
changed.38 Indeed, Card, Heining, and Kline [2013] observe that firms’ pay premiums, as
computed on the 1996-2002 sample, are disproportionally lower among establishments that
had opted out from national collective agreements, enlarging the dispersion in the firms’
wage policies. With the increase in the share of German workers not covered by any kind
of union agreement, and the rise in the number of firm-level deviations from industry-wide
union agreements, so did the variance of the firm-specific wage policies, Var(φj).
Italy’s system of industrial relations shares many features of the German one, and in
particular the centrality of the industry-wide collective bargaining. However, in many
respects the Italian system has not shown the flexibility demonstrated by the German
system, nor have the reforms it has experienced during the mid 1990s significantly altered
the system’s influence on wage setting. To begin with, Italian firms have never been able
to opt-out the industry-wide wage settlements and adjust wage downwardly, whenever the
local or firm-specific economic conditions and competitive pressures so required (see Sec-
tion 2). This may explain why, unlike the German case, the variance in the Italian firms’
wage policies has not widened over time, despite the fact that also Italy has been exposed
to the long-run challenges posed by the introduction of new technologies and increased
international competition.39
Notice that, according to our estimates, the variance of firm wage policies actually de-
creased from the mid 1980s to the early 2000s. Unable to deviate from the industry-set
minimum wages, Italian firms could still resort to incremental firm-level wage bargaining
as a source to differentiate their firm wage policies. Our data do not allow us to observe
which firms or workers were covered by firm-level agreements. Nevertheless, the avail-
38Dustmann, Ludsteck, and Schnberg [2009] provide an in-depth discussion of these and related changesin the German system of industrial relations, and provide the relevant institutional background.
39Facilitated by the close to border location, and partly in response to competitive pressures, manyVeneto firms moved their production abroad during the period considered. For example, the Romanianprovince of Timisoara is often called the “newest” Venetian Province, due to the large number of Venetoestablishment that have opened there.
32

able evidence suggests that the incidence of firm-level agreements declined over time (e.g.,
Sestito and Rossi [2000]), partly as a consequence of a reduction in unionisation rates,
as shown for Veneto by Vaona [2006]. The resulting standardization of compensation
schemes across employers is consistent with our finding of a decreasing dispersion in firms’
pay policies.40
The gradual dismantling of several egalitarian institutions and practices, which took place
during the 1980s, could be an additional channel explaining the higher variability in firm
wage policies in the first years of our sample period, and its subsequent decline. During the
1970s, the excessive wage compression operated by the indexation mechanism of the Scala
Mobile was distorting the wage structure defined by sectoral collective agreements. Firms
which wanted to provide a more adequate remuneration to the skills of their workers, most
often at the team or group level, had to adopt their own firm-specific wage policy. On
this respect, the 1980s were indeed characterized by strong political pressures of white col-
lars and intermediate managers against the excessively egalitarian policies followed by the
unions.41 As a result, starting from 1987, the renewals of sectoral collective agreements
gradually broadened the gaps in the pay scale of the various livelli di inquadramento.42
Since this evolution has probably improved the signal about appropriate wage adjustments
provided by the nation-wide contract, it could have also contributed to reduce the adop-
tion of differentiated firm wage policies.
In the previous section, we noticed how the dispersion of observed and unobserved indi-
vidual heterogeneity has emerged from our estimates as a major contributing factor to
the overall increase in earnings inequality. While in principle these trends may reflect the
underlying labour market forces, e.g. demand and supply of skills, in the following sec-
tion we will argue that these market forces have been largely “channelled” into the tracks
40Another potential reason for the decline in firm-level bargaining, and hence in Var(φj), is given by adocumented rising incidence of small and very small firms in the Italian economy, typically those wherethere is no firm-level bargaining.
41One of the first and most important moments in the history of this opposition movement was the so-called march of the forty-thousands in Turin, in May 1980. This protest marked a division in trade unions,which since then were forced to take into greater consideration the interests of more qualified workers (onthis topic, see Manacorda [2004] among others).
42See CESOS [1989].
33

set by the Italian system of industrial relations, in particular through the sectoral-level
bargaining process. We will do so by showing that the growth in individual heterogeneity
dispersion has been almost entirely driven by the broadened differences in pay between
job title categories, as settled in the industry-wide contract renewals.
34

Table 6: Wage Variance Evolution in Germany and Italy
Veneto Working Histories Data, Male Sample
Period Var(φj) Var(ηi + xitβ) Var(eit)2Cov(φj , ηi +
xitβ)TOTALVAR.
1984-1989 0.027 0.068 0.008 -0.011 0.092% of Total 29.3% 73.9% 8.7% -12.0% 100.0%
1996-2001 0.024 0.088 0.007 0.012 0.131% of Total 18.3% 67.2% 5.3% 9.2% 100.0%
% ∆ -11.8% 25.6% -13.3% 200.0% 35.0%
% ∆/∆TOT -7.7% 51.3% -2.6% 59.0% 100.0%
German IAB Data, Male Sample (from Card, Heining, and Kline [2013])
Period Var(φj) Var(ηi + xitβ) Var(eit)2Cov(φj , ηi +
xitβ)TOTALVAR.
1985-1991 0.025 0.095 0.014 0.005 0.139% of Total 18.1% 67.9% 10.2% 3.8% 100.0%
1996-2002 0.038 0.112 0.017 0.023 0.190% of Total 19.9%% 59.0% 8.9% 12.3% 100.0%
% ∆ 39.3% 16.6% 17.6% 125.5% 30.5%
% ∆/∆TOT 24.6% 34.2% 5.5% 35.7% 100.0%Percentage changes for a given quantity z from t− 1 to t are computed using a reference value zr defined
as zr =|zt|+|zt−1|
2
35
5.3. An Empirical Assessment of the Impact of Collective Bargaining on Wage and HumanCapital Dispersion
In this section we show that overall pay dispersion is mostly determined by between
job titles earning variability.43 We apply a simple variance decomposition methodology
that allows to divide total variation of a given quantity, which is partitioned into groups
(for example job titles), into an ecological component (differences between groups) and an
individual component (differences between members of the same group). Keeping fixed
a given period t, let yij represent wages (or another quantity of interest) of worker i in
group j, let n be the total number of workers, let J be the number of groups, and let nj be
the set of employees in group j. Moreover, define yj as the average level of wages within
group j, and define the within group variance as
Vj = (‖nj‖ − 1)−1∑i∈nj
(yit − yj)2
where we indicate by ‖nj‖ the cardinality of the set nj (i.e. the number of employees
in group j). Using the above notation, we can decompose the total wage variance into a
within group component, and a between group component as follows
Var(y) =1
n− 1
J∑j=1
(‖nj‖ − 1)Vj︸ ︷︷ ︸within component
+J∑j=1
‖nj‖ (yj − y)2︸ ︷︷ ︸between component
(3)
Notice that the variance decomposition defined above can be easily applied not only on job
titles but also on any other group partitioning the workers’ population, such as firms.44 In
this section, by relying on the AKM regression results, we implement the decomposition
of equation (3) on the individual-specific component of the wage, albeit for comparison we
apply the same decomposition also on the raw wage. As mentioned, the term (ηi + xitβ)
appearing in the AKM wage equation (which we sometimes call worker wage premium),
43In Section A.1 we also show that the segregation of high wage earners into given firms is not animportant phenomenon in the Italian case. Thus, job titles are relevant in determining pay dispersion, andthis is not a consequence of the fact that workers in given occupations are more likely to be hired by givengroups of firms. The low level of skill segregation across firms is also documented by Iranzo, Schivardi, andTosetti [2008].
44See Section A.1.
36
represents a good measure of individual-specific productive abilities.
In applying the decomposition of equation (3), we have used job titles (livelli di inquadra-
mento) to partition the population. The initial allocation of workers to a given job title
is typically related to its schooling level and other time-invariant personal characteristics,
captured by the worker fixed effect embedded in our estimated worker premium. The ef-
fect of promotion to higher ladders of the scale, as well as the (fairly automatic) seniority
wage premiums stipulated at each ladder by the relevant collective contract, are reflected
in the time-varying component of the estimated worker premium.
Notice that market forces can affect pay differentials between job titles only for what con-
cerns the component of the wage above the minimum, which is set at the industry-wide
level. Moreover, by the law, employers are not allowed to downgrade workers into less
remunerative job titles, an element which provides further rigidity in firms’ wage adjust-
ment decisions.45 Given this institutional context, the between job title variance can be
considered an informative parameter, which, to a given extent, allows to quantify the im-
pact of collective bargaining on wages.
A different measure of the effect of job title membership on wages is proposed by Torres,
Portugal, Addison, and Guimaraes [2013], who include job title fixed effects as regressors
in an AKM model. However, in the Italian context, the chosen method is more suitable
for studying the influence of collective bargaining on wage dynamics. Indeed, the proposed
variance decomposition can be computed on a yearly basis. Moreover, as mentioned above,
in Italy there are detailed rules, set by the relevant collective contract, for assigning each
worker to a job title. Such strict criteria, which tend to be based on seniority, education
and several other dimensions, change quite frequently over time.46 On this respect, a nice
feature of the between job titles variance is that, when compared from year to year, it fully
captures the effects of such institutionally-driven shifts in the segregation of workers with
45Nevertheless, employers can obviously affect the overall composition of job titles through their hiringpolicies, or by moving upward their current employees. We will propose a test for assessing the importanceof these tendencies in Section A.1.
46For example, several managerial occupations have started to be regulated by autonomous industry-wide collective contracts since the end of the 1980s. The resulting shift in the segregation of workers’characteristics across the occupational categories defined by collective contracts is a source of challengeson how to compare and interpret the variance of job title fixed effects across time.
37

given characteristics across various minimum wage levels. Thus, the chosen decomposi-
tion method provides a broad and easily interpretable measure of the impact of collective
bargaining on the evolution of wage inequality.
Before presenting the decomposition results, we provide further information on how job
titles (livelli di inquadramento), which are specific to a given industry-wide collective con-
tract, have been identified in the data. Several economic activities, despite being similar
in their nature, can be regulated by more than one collective contract,47 and the number
of such industry-wide contracts, as well as the number of job titles defined by them, can
change over time. Therefore, we have not constructed a homogeneous classification of job
titles across years. We have instead chosen a year-specific definition of the so-called livelli
di inquadramento, which is based on their classification code. As an inclusion rule, we
have adopted the criteria of considering as a legitimate job title only those for which at
least 150 observations were present, in a given year, in the largest connected set of Veneto
firms.48 The total number of inquadramento levels included in our decompositions ranges
between 432 (in 2001) and 520 (in 1984). Moreover, the percentage of the observations
belonging to the largest connected set of Veneto firms, which we have been able to include
in our decompositions, ranges between 83% of the total in 2001 and 70% in 1986.
Figure 4 reports the results of the variance decomposition into a between- and a within-job
titles components, applied year-by-year on the male sample. The reference population is
composed of workers in the largest connected set of Veneto firms, provided that they be-
long to a sufficiently representative job title category.49 The graphs show that practically
all of the growth in the dispersion of wages and of workers’ pay premiums is accounted
for by increased variability between occupations. Indeed, both in the case of unconditional
47To give an example, there are almost 40 distinct contracts covering workers in the sea transportindustry, while there are only five contracts for workers in the metal-manufacturing sector.
48This inclusion rule has been chosen to mitigate measurement error issues which are embedded in jobtitles’ classification codes. When computing the variance decomposition using different thresholds, wedid not find great sensitivity in the results. Measurement error problems are driven by the fact that jobtitle classification codes can change from year to year, since they are set by the respective industry-widecontracts. However, this problem seems to be particularly worrying only in the year 1989, when also theindustry-wide contracts’ classification system was reformed.
49Given that we have divided the 1982-2001 period into overlapping panels, in some years we can havetwo distinct mobility groups. Since there are no major differences when adopting different rules, we alwayschoose to consider only the connected set of the latest panel.
38

wages and of individual heterogeneity, the between component of the total variance shows
a growing trend, with the partial exception of the second half of the 1990s, while the within
component is persistently flat.50 As a consequence, in relative terms this latter source of
variation looses importance as a determinant of overall inequality. Figure 5 reports the
evolution of between- and within-job titles workers’ wage premiums dispersion by sector
(secondary and tertiary) and by occupation (white and blue collars), computed by nor-
malizing the 1982 levels of dispersion to 100.51 A trend similar to the one implied by the
right panel of Figure 4 is observed for all categories of workers. However the growth of
between job titles dispersion in human capital is stronger among production workers and
in the manufacturing sector.
A potential explanation for the trend toward higher between-job titles differences in wages
could be that firms have increasingly assigned employees to higher inquadramento levels,
as a way to raise the base wage of highly-skilled and performing workers. In Section A.1
we show that the role of this re-assignment has been relatively limited, as it can explain
only a modest proportion of the between job-title variance displayed in Figure 4.52
The results presented in this section, together with the supplementary analysis of Sec-
tion A.1, show that almost all of the inequality growth has arisen from differences in pay
between job categories which are defined and protected by the industry-wide collective
agreements. It remains unclear whether institutions have simply reacted to market forces,
and the extent to which they have represented a distortion to the wage structure. Nev-
ertheless, we can conclude that the growth in Italian wage inequality has been allowed
by the opening of the pay gaps between the various livelli di inquadramento stipulated
at each contract renewal, combined with the gradual dismantling of the egalitarian wage
indexation system since the mid 1980s.
50An exception to this general trend is the year 1989, during which there is a drop in the withincomponent of the total variance. However, this outcome is probably due to the measurement error inducedby the mentioned change in the contracts classification code, which occurred that year.
51By secondary sector, we define manufacturing and constructions sector. The primary sector (agricul-ture, forestry, fishing and mining) is excluded from these computations. The service sector is defined asthe residual category.
52Notice that, as mentioned, this re-assignment can only be operated upwardly, i.e. it is not possible todowngrade a worker to a lower livello di inquadramento.
39

Figure 4: Decomposition of Unconditional Wage Variance and Workers’ WagePremiums Variance Within- and Between Job Titles Defined by Sector-Wide
Contracts
.04
.06
.08
.1.1
2
Log
Wag
e Va
rianc
e
1980 1985 1990 1995 2000Year
Total wage variancewithin job titles defined by sector-wide contractsTotal wage variancebetween job titles defined by sector-wide contracts
Male Sample, Latest Mobility GroupUnconditional Wage Variance
.02
.04
.06
.08
Log
Wag
e Va
rianc
e
1980 1985 1990 1995 2000Year
Workers' wage component variancewithin job titles defined by sector-wide contractsWorkers' wage component variancebetween job titles defined by sector-wide contracts
Male Sample, Latest Panel EstimatesVariance of the Worker-Specific Wage Component
Job titles (inquadramento levels) are occupational categories defined within each sector-wide collectivecontract. Their definition might change at every round of negotiation. For each job title, there are arelated minimum wage and a related seniority premium that are bargained at the sector-wide level. Ineach year, we have selected only job titles represented by at least 150 workers in the largest connected setof Veneto firms. Depending on the year, the number of distinct job titles considered ranges between 432(in 2001) and 520 (in 1984).
Figure 5: Evolution of Workers’ Wage Premiums Variance Within- andBetween Job Titles by Sector and Occupation
100
150
200
250
1980 2000 1980 2000
Tertiary Sector Secondary Sector
Workers' wage component variancewithin job titles defined by sector-wide contractsWorkers' wage component variancebetween job titles defined by sector-wide contracts
Year
1982 = 100Evolution of Workers' Wage Component Variance by Sector
5010
015
020
0
1980 2000 1980 2000
White Collars Blue Collars
Workers' wage component variancewithin job titles defined by sector-wide contractsWorkers' wage component variancebetween job titles defined by sector-wide contracts
Year
1982 = 100Evolution of Workers' Wage Component Variance by Occupation
40

6. Conclusions
In this paper we have analysed the evolution of Italian wage inequality over a two
decade period. We have documented a substantial growth in several measures of pay dis-
persion. To interpret this trend, we have decomposed the overall wage dispersion in the
components capturing heterogeneity in firm pay policies, heterogeneity in workers’ time-
varying and time-constant characteristics, as well as the sorting patterns between the
firms’ and workers’ specific components of wages. To do so, we have estimated two-way
fixed effect wage models over subsequent time intervals, and have used matched employer-
employee data covering the population of private sector firms and workers in the Veneto
region of Italy. We have found that earnings dispersion has been mostly driven by differ-
ences in the worker-specific components of wages. Instead, in Italy employer-specific pay
premiums have lost relevance over time.
Our results are different from evidences documented for other countries, and Germany in
particular. In this respect, we have provided an indirect support to the claims of Card,
Heining, and Kline [2013]. These authors report evidence of a rise in the dispersion of
firms’ pay premiums. They attribute this finding to a growth in firm-level deviations
from the dispositions of industry-wide collective agreements (e.g., the opting-out clauses),
which were allowed by the German system and became increasingly used since the mid
1990s. We have documented the lack of such a flexible adaptation process in a similar
manufacturing-oriented economy, which has undergone qualitatively different reforms in
its system of industrial relations. Italian firms have been unable to apply heterogeneous
pay policies, and to circumvent the constraints to wage dynamics imposed by the sectoral
level of bargaining.
To shed further light on the role played by collective bargaining in the observed inequality
trend, we have analysed the evolution of pay differentials across so-called livelli di in-
quadramento. These are job titles defined by nation-wide sectoral collective agreements,
for which a set of minimum wages holds and applies regardless of a worker’s union mem-
bership. A simple variance-decomposition exercise allowed us to show that the growth in
both, wage and human capital dispersion, has almost entirely occurred between such job
41

titles.
Overall, our results show that market forces have been largely “channelled” into the tight
tracks set by the rules governing the country’s fairly centralized system of industrial re-
lations. Moreover, during the overall period considered, firms have been granted very
limited margins of wage flexibility. The extent to which the bargaining system may have
been able to provide the adequate signals about the appropriate wage adjustments, i.e.
the adjustment required by underlying market forces, remains an open question.
References
Abowd, J., F. Kramarz, and D. Margolis (1999): “High Wage Workers and High
Wage Firms,” Econometrica, 67(2), 251–333.
Abowd, J. M., R. H. Creecy, and F. Kramarz (2002): “Computing Person and Firm
Effects Using Linked Longitudinal Employer-Employee Data,” Longitudinal Employer-
Household Dynamics Technical Papers 2002-06, Center for Economic Studies, U.S. Cen-
sus Bureau.
Acemoglu, D., and D. Autor (2011): Skills, Tasks and Technologies: Implications
for Employment and Earningsvol. 4 of Handbook of Labor Economics, chap. 12, pp.
1043–1171. Elsevier.
Akerlof, G. A. (1982): “Labor Contracts as Partial Gift Exchange,” The Quarterly
Journal of Economics, 97(4), 543–69.
Andrews, M. J., L. Gill, T. Schank, and R. Upward (2008): “High Wage Work-
ers and Low Wage Firms: Negative Assortative Matching or Limited Mobility Bias?,”
Journal of the Royal Statistical Society Series A, 171(3), 673–697.
Autor, D. H., L. F. Katz, and M. S. Kearney (2008): “Trends in U.S. Wage In-
equality: Revising the Revisionists,” The Review of Economics and Statistics, 90(2),
300–323.
Brandolini, A., P. Cipollone, and P. Sestito (2002): “Earnings Dispersion, Low
42

Pay and Household Poverty in Italy, 1977-1998,” in The Economics of Rising Inequali-
ties. Oxford University Press.
Burdett, K., and D. T. Mortensen (1998): “Wage Differentials, Employer Size, and
Unemployment,” International Economic Review, 39(2), 257–73.
Cappellari, L. (2004): “The Dynamics and Inequality of Italian Men’s Earnings: Long-
term Changes or Transitory Fluctuations?,” Journal of Human Resources, 39(2), 475–
499.
Cappellari, L., and M. Leonardi (2016): “Earnings Instability and Tenure,” The
Scandinavian Journal of Economics, 118(2), 202–234.
Card, D., A. R. Cardoso, and P. Kline (2016): “Bargaining, Sorting, and the Gender
Wage Gap: Quantifying the Impact of Firms on the Relative Pay of Women,” The
Quarterly Journal of Economics, 131(2), 633–686.
Card, D., F. Devicienti, and A. Maida (2014): “Rent-sharing, Holdup, and Wages:
Evidence from Matched Panel Data,” Review of Economic Studies, 81(1), 84–111.
Card, D., J. Heining, and P. Kline (2013): “Workplace Heterogeneity and the Rise
of West German Wage Inequality,” The Quarterly Journal of Economics, 128(3), 967–
1015.
Casadio, P. (2003): “Wage Formation in the Italian Private Sector after the 1992-93
Income Policy Agreements,” in Institutions and Wage Formation in the New Europe.
Edward Elgar.
CESOS (1989): “Le relazioni sindacali in Italia, Rapporto 1987-1988,” Edizioni lavoro,
CESOS.
Dell’Aringa, C., and C. Lucifora (1994): “Collective Bargaining and Relative Earn-
ings in Italy,” European Journal of Political Economy, 10(4), 727–747.
Dell’Aringa, C., C. Lucifora, and N. Orlando (2005): “Collective Bargaining
43

and Within-Establishment Pay Inequality in Italy,” Rivista Internazionale di Scienze
Sociali, 113(2), 241–265.
Devicienti, F., and A. Borgarello (2001): “Trends in the Italian Earnings Distribu-
tion, 1985-1996,” LABORatorio R. Revelli Working Papers Series 2, LABORatorio R.
Revelli, Centre for Employment Studies.
Devicienti, F., A. Maida, and L. Pacelli (2008): “The Resurrection of the Italian
Wage Curve,” Economics Letters, 98(3), 335–341.
Di Nardo, J., N. Fortin, and T. Lemieux (1996): “Labor Market Institutions and the
Distribution of Wages, 1973-1992: A Semiparametric Approach,” Econometrica, 64(5),
1001–1044.
Dunne, T., L. Foster, J. Haltiwanger, and K. R. Troske (2004): “Wage and
Productivity Dispersion in United States Manufacturing: The Role of Computer In-
vestment,” Journal of Labor Economics, 22(2), 397–430.
Dustmann, C., B. Fitzenberger, U. Schonberg, and A. Spitz-Oener (2014):
“From Sick Man of Europe to Economic Superstar: Germany’s Resurgent Economy,”
Journal of Economic Perspectives, 28(1), 167–88.
Dustmann, C., J. Ludsteck, and U. Schnberg (2009): “Revisiting the German Wage
Structure,” The Quarterly Journal of Economics, 124(2), 843–881.
Eeckhout, J., and P. Kircher (2011): “Identifying Sorting–In Theory,” Review of
Economic Studies, 78(3), 872–906.
Erickson, C., and A. Ichino (1995): “Wage Differentials in Italy: Market Forces,
Institutions, and Inflation,” in Differences and Changes in Wage Structures, NBER
Chapters, pp. 265–306. National Bureau of Economic Research, Inc.
Faggio, G., K. G. Salvanes, and J. V. Reenen (2010): “The Evolution of Inequality
in Productivity and Wages: Panel Data Evidence,” Industrial and Corporate Change,
19(6), 1919–1951.
44
Flabbi, L., M. Macis, A. Moro, and F. Schivardi (2014): “Do Female Executives
Make a Difference? The Impact of Female Leadership on Gender Gaps and Firm Per-
formance,” IZA Discussion Papers 8602, Institute for the Study of Labor (IZA).
Fox, J. T. (2009): “Firm-Size Wage Gaps, Job Responsibility, and Hierarchical Match-
ing,” Journal of Labor Economics, 27(1), 83–126.
Iranzo, S., F. Schivardi, and E. Tosetti (2008): “Skill Dispersion and Firm Produc-
tivity: An Analysis with Employer-Employee Matched Data,” Journal of Labor Eco-
nomics, 26(2), 247–285.
Katz, L. F., and K. M. Murphy (1992): “Changes in Relative Wages, 1963-1987:
Supply and Demand Factors,” The Quarterly Journal of Economics, 107(1), 35–78.
Leonardi, M., M. Pellizzari, and D. Tabasso (2015): “Wage Compression within
the Firm,” IZA Discussion Papers 9254, Institute for the Study of Labor (IZA).
Manacorda, M. (2004): “Can the Scala Mobile Explain the Fall and Rise of Earnings In-
equality in Italy? A Semiparametric Analysis, 1977-1993,” Journal of Labor Economics,
22(3), 585–614.
Naticchioni, P., and A. Ricci (2009): “Falling Educational Wage Premia in Italy,”
QA - Rivista dell’Associazione Rossi-Doria, 4.
Piketty, T., and E. Saez (2003): “Income Inequality In The United States, 1913-1998,”
The Quarterly Journal of Economics, 118(1), 1–39.
(2006): “The Evolution of Top Incomes: A Historical and International Perspec-
tive,” American Economic Review, 96(2), 200–205.
Scoppa, V. (2014): “Firm Size and Wages in Italy: Evidence from Exogenous Job Dis-
placements,” Manchester School, 82(6), 677–700.
Sestito, P., and F. Rossi (2000): “Contrattazione aziendale, struttura negoziale e
determinazione decentrata del salario,” Lavoro e Relazioni Industriali, 2, 129–183.
45

Skans, O. N., P.-A. Edin, and B. Holmlund (2009): “Wage Dispersion Between
and Within Plants: Sweden 1985-2000,” in The Structure of Wages: An International
Comparison, NBER Chapters, pp. 217–260. National Bureau of Economic Research,
Inc.
Torres, S., P. Portugal, J. T. Addison, and P. Guimaraes (2013): “The Sources
of Wage Variation: A Three-Way High-Dimensional Fixed Effects Regression Model,”
IZA Discussion Papers 7276, Institute for the Study of Labor (IZA).
Vaona, A. (2006): “L’evoluzione recente dei tassi di sindacalizzazione in Veneto,”
Quaderni di Rassegna Sindacale, 3.
46
A. Appendix
A.1. Related Evidence on Between Job Titles Pay Dispersion
In this section we provide further evidences related to the evolution of wage inequalities
between the so-called livelli di inquadramento. In particular, we test whether this type of
dispersion has been driven by a trend in the composition of the labour force, which could
have become more likely to be employed at relatively low-paid (or high paid) occupations.
Moreover, we test whether differences in wages and human capital arise mostly within or
between firms. The analysis of this section shows that there have not been major shifts in
the labour force composition, with the only exception of a small but persistent growth of
low-paid occupations in the service sector. Moreover, we show that the wage and human
capital dispersion has been growing more rapidly within firms.
Figure A.1 shows the proportion of workers within each quartile of the job titles’ average
pay distribution. In constructing the graph, we have computed year-by-year the average
wage within each job title, separately considering workers in the secondary and tertiary
sectors. For each of these two sectors, we have classified each job title according to the
quartile of the job titles’ average pay distribution to which it belongs.53 Then, we have
computed year-by-year the proportion of workers within each quartile group of job titles.
Figure A.1 shows that the proportion of workers within each quartile of the job title dis-
tribution has been fairly constant during the overall period considered. There are some
exception to this general trend. In particular, in the years 1982 and 1983 the proportion
of workers in the two lowest quartiles of the job title distribution was substantially higher
than in subsequent years. Moreover, during the years between 1984 and the beginning of
the 1990s, both in the secondary and tertiary sectors there is a growth in the proportion
of workers in the highest quartile of job titles. However, at least in the secondary sector,
this tendency is only cyclical, given that, from the early 1990s onwards, this same pro-
portion decreases to levels similar to the ones in place during the early 1980s. Finally, in
the service sector only, there is a relatively persistent growth of the proportion of workers
53The job titles’ average pay distribution is not weighted by the number of observations within each jobtitle category. Thus a given percentile of the job titles’ average pay distribution can be quite different fromthe same percentile of the wage distribution.
47

belonging to the lowest quartile of the job title distribution. However, this growth is quite
small in magnitude. Other discrepancies in the proportions reported in the figure tend to
be year-specific, and are most likely attributable to differences in the job title classification
codes from one year to the other.
In Figure A.2 we replicate the analysis described above, this time considering the worker-
specific component of the wage, as estimated by the AKM regression model. In particular,
we have computed the average level of skills (i.e. observed and unobserved individual het-
erogeneity) within each job title. We have used this information to rank job titles into
quartiles, and we have computed the proportion of workers within each quartile group.
Figure A.2 shows tendencies similar to the ones described in Figure A.1. However, in this
case the growth in the proportion of workers belonging to the first quartile of job titles in
the service sector is even stronger. Moreover, the years 1982 and 1983 are quite peculiar.
Indeed, during these two years the proportion of secondary sector workers belonging to
the upper quartiles of the job title distribution is quite low. This tendency is probably
induced by the wage adjustment mechanisms in place up until 1984, which were shifting
upward wages at the bottom of the pay scale. Other trends seem to be either year specific,
or relatively small in magnitude.
Overall, by analysing the composition of job title categories across time, we can conclude
that the growth in wage inequality described throughout the paper is not driven by a qual-
itative shift in the labour demand, from evenly remunerated occupations to professional
positions characterized by a more differentiated pay structure. Instead, the channel driv-
ing the greater wage dispersion is more linked to differences in how the same occupations
are rewarded across time. Thus, with the partial exception of the service sector, where
employers have become more likely to hire workers belonging to less remunerative job title
categories, there is no evidence of a process of polarization of the workforce.
The growth of pay differentials between job titles, which we have documented in Section
5.3, could also derive from a process of segregation of the more qualified workers into
given enclaves of firms. Such market-driven process would then probably be reflected in
collective bargaining dynamics, given that the more skill-intensive firms could be able to
48

grant better economic conditions to selected groups of job titles. On the other hand, if
pay differentials between firms are low, despite a general growth in job title heterogeneity,
we may think that firms are constrained by the sectoral bargaining standards, given that
most of the inequality growth occurs within establishments, instead of across them. We
now turn to this problem of determining whether, over the years, the best paid occupa-
tions have become more segregated across given groups of employers. In order to test this
hypothesis, we have computed year-by-year the decompositions of equation (3), this time
using firms as the partitioning group of the population.
Figure A.3 reports the within- and between-firms variance decomposition, applied on wages
and on the estimated individual heterogeneity of the workforce. The reference population
is composed of male workers in Veneto firms belonging to the largest connected set. The
left panel of the figure shows that wage variation was almost equally split into a within-
and a between-firms component during the early 1980s. Since then, the importance of
earnings variance among co-workers rises sharply with respect to differences in average
wages between plants. Nevertheless, the years under study are characterized also by a
small growth in the unconditional wage variance between firms. This latter process can be
mostly ascribed to increased sorting of workers’ wage premiums with firms’ pay premiums,
a result which emerged from the AKM variance decomposition.
In the right panel of Figure A.3 we compute the same variance decomposition using work-
ers’ wage premiums alone, instead of total wages.54 When considering this component of
the pay, we find that between-firms dispersion in human capital has even declined over
the entire period. Therefore, we find no evidence of greater segregation of workers’ skills
across employers.
The low level of between-firms pay dispersion documented here is coherent with previous
studies on Italy (such as Iranzo, Schivardi, and Tosetti [2008]), but it is a quite peculiar
result when compared with evidences available for other European countries and the US.55
54Notice that despite the fact that observed and unobserved individual heterogeneity is a component ofthe total wage, its variance can be higher than the variance of unconditional wages, since the former doesnot take into account the potential negative sorting of workers’ wage premiums with firms’ pay premiums.
55Among studies focusing on between-plant wage inequality in other countries, see for example Dunne,Foster, Haltiwanger, and Troske [2004] on the US, Faggio, Salvanes, and Reenen [2010] on UK, and
49

Moreover, our finding is particularly robust, given that the sample includes also very small
firms and the private service sector, which are two categories whose exclusion could drive
the estimates of between-plants pay differentials down.56
Overall Italy is not characterized by strong pay differences between firms, which could have
been relevant if, for example, greater dispersion in productive performance across employ-
ers, often considered an outcome of technological changes and international competition,
had induced greater heterogeneity in wages between plants. Instead, the relevance of pay
dispersion between job titles, which is documented by Figure 4, suggests that, in the Ital-
ian case, the growth of inequality has entirely occurred within the collective bargaining
framework. Based on our results, we can conclude that over the years such institution has
granted more heterogeneous conditions for selected categories of workers (i.e. job titles),
while it has provided limited margins of flexibility for the firms.
Skans, Edin, and Holmlund [2009] on Sweden. All of these studies document increasing between-plantwage inequality, but they do not control for non-random assignment of workers to firms. As previouslydiscussed, Card, Heining, and Kline [2013] show that in Germany also firms pay premiums dispersion,which is a measure of between-plant wage variability net of employees’ sorting, has risen over time.
56On this topic, it has been documented for several countries that there is a firm-size wage premium(e.g. Fox [2009] for US and Sweden and Scoppa [2014] for Italy), so that excluding firms below a giventhreshold could lead to an underestimation of between plants wage differentials. Moreover, Dell’Aringa,Lucifora, and Orlando [2005], studying a sample of Italian firms in 1995, show that within establishmentspay dispersion is increasing with firm size. Finally, Faggio, Salvanes, and Reenen [2010] show that UKbetween plants wage dispersion is more relevant in the private service sector than in the manufacturingsector.
50

Figure A.1: Evolution of the Proportion of Workers Within Quartiles of theJob Titles’ Average Skills Distribution
010
2030
4050
6070
8090
100
010
2030
4050
6070
8090
100
1980 1985 1990 1995 2000 1980 1985 1990 1995 2000
Tertiary Sector Secondary sector
4th quartile of the job titles'average wage distribution
3d quartile of the job titles'average wage distribution
2d quartile of the job titles'average wage distribution
1st quartile of the job titles'average wage distribution
Prop
ortio
n of
the
popu
latio
n
Year
The 1st quartile refers to the bottom 25th percentiles of the job titles’ average pay distribution. Similarly,the 4th quartile refers to job titles characterized by an average wage higher than the 75th percentile of thejob titles’ average pay distribution.
51

Figure A.2: Evolution of the Proportion of Workers Within Quartiles of theJob Titles’ Average Pay Distribution
010
2030
4050
6070
8090
100
010
2030
4050
6070
8090
100
1980 1985 1990 1995 2000 1980 1985 1990 1995 2000
Tertiary Sector Secondary sector
4th quartile of the job titles'average skills distribution
3d quartile of the job titles'average skills distribution
2d quartile of the job titles'average skills distribution
1st quartile of the job titles'average skills distribution
Prop
ortio
n of
the
popu
latio
n
Year
The 1st quartile refers to the bottom 25th percentiles of the job titles’ average skill distribution. Similarly,the 4th quartile refers to job titles characterized by an average level of the worker specific wage componenthigher than the 75th percentile of the job titles’ average skill distribution.
Figure A.3: Within- and Between-Firms Decomposition of UnconditionalWage Variance and Workers’ Wage Premiums Variance
.03
.04
.05
.06
.07
Log
Wag
e Va
rianc
e
1980 1985 1990 1995 2000Year
Whithin firms total wage varianceBetween firms total wage variance
Male Sample, Latest Mobility GroupUnconditional Wage Variance
.03
.04
.05
.06
.07
Log
Wag
e Pr
emia
Var
ianc
e
1980 1985 1990 1995 2000Year
Whithin firms workers' wage premia varianceBetween firms workers' wage premia variance
Male Sample, Latest Panel EstimatesVariance of Worker-Specific Wage Premia
Worker’s wage premiums variance is defined as Var(ηi + xitβ). Since each panel that we have constructedis partially overlapping, for each year we report only estimates of Var(ηi + xitβ) from the latest availableperiod. For each year, the unconditional wage variance is computed on the largest connected set in thelatest panel. Only firms located in Veneto are considered.
52

A.2. AKM Variance Decomposition on the Female Sample
In this section, we provide a brief overview of the results obtained by applying the vari-
ance decomposition model of equations (1) and (2) on the female sample. As mentioned,
we find substantial gender differences in the wage structure. Moreover, several reasons
make it difficult to compare results obtained in the female and male samples. First of
all, the Italian labour market is characterized by a much lower female participation with
respect to males, especially in earliest years considered here.57 The low female partici-
pation leads to a selection bias of both, female workers and firms with higher levels of
female employment. Moreover, since we do not observe the number of working hours, the
influence of part-time contracts on the female wage structure tends to be quite strong, as
can be inferred from the negative growth of women’s wages at the 10th percentile of the
pay distribution (see Figure 1). Also in this case, it is likely that firms offering part time
contracts tend to be a selected category, thus making it more difficult to interpret results
obtained in a regression that controls for firms wage policies.
Table A.1 reports the weighted proportion of job-to-job mobility episodes over the total
number of female employees ever working at each firm. This statistic is slightly lower than
in the case of males, and it tends to grow over time. Results of the AKM regression based
variance decomposition, when applied on female workers, are reported in Tables A.2 and
A.3. Women experienced a growth in total wage variance much higher than men, with an
increase of almost 57% from the earliest to the most recent panel. In this case, dispersion
of firms’ pay premiums tends to be more relevant than in the male sample, but its im-
portance clearly declines over time, and is also mitigated by the negative covariance with
employees’ unobserved heterogeneity. Indeed, there is a considerable amount of negative
sorting between workers and firms, but, as was the case for men, this component of wage
variation tends to increase over time. Over time, the female wage distribution becomes
more similar to the male one. However, several differences are quite persistent. In par-
ticular, firms’ wage policies are always negatively correlated with individual observable
57Indeed, total female employment has grown by almost 50% during the overall period analysed here,while it has grown much less in the male sample (see Figure A.5)
53

and unobservable heterogeneity. This outcome can be interpreted as evidence of a limited
mobility bias in the case of women, but it also may be a consequence of the fact that
those firms offering part-time contracts, which tend to attract more women, are a selected
category in terms of rent-sharing behaviour. Finally, notice that the importance of the
idiosyncratic error term, which can be interpreted as the unexplained component of wage
variation, is greater in the case of women.58
Overall, even if the order of magnitude of each element of the regression model is quite
different between the male and female samples, when looking at the evolution of such
components over time, a qualitatively similar pattern emerges. In both cases, the growth
of wage inequality is driven, at least in part, by a more positive covariance between firms’
pay policy and individual heterogeneity. Moreover, this growth is accompanied by a re-
duction in the dispersion of firms’ fixed effects. However, in the case of women, there
are no evidences of a growth in the dispersion of individual observed and unobserved
heterogeneity.
58The overall R squared ranges between 0.69 and 0.77 in the male sample, and between 0.62 and 0.69in the female sample.
54

Table A.1: Proportion of Job Mobility Episodes per Firm, Female Sample
Period Mean10th
Percentile50th
Percentile90th
Percentile
1982-1987 0.433 0.101 0.364 0.8611984-1989 0.474 0.138 0.429 0.9001988-1993 0.546 0.190 0.506 0.9441992-1997 0.591 0.222 0.574 0.9541996-2001 0.581 0.235 0.571 0.950The statistics refer to the proportion of individuals experiencing job-to-job transitions over the
total number of individuals ever working at the firm during the 6-year period. Each statistic is
weighted for the number of individuals ever employed by the firm. Only firms of Veneto belonging
to the largest connected set are considered.
Table A.2: Variance Decomposition of Log Daily Wages, Women
Period Var(φj) Var(ηi) Var(xitβ) Var(εit)
1982-1987 0.080 0.095 0.002 0.0121984-1989 0.049 0.097 0.047 0.0111988-1993 0.032 0.058 0.029 0.0111992-1997 0.035 0.059 0.025 0.0111996-2001 0.044 0.096 0.062 0.014
Period 2Cov(φj , ηi) 2Cov(φj , xitβ) 2Cov(ηi, xitβ) TOTAL VAR.
1982-1987 -0.114 0.001 0.001 0.0771984-1989 -0.054 0.002 -0.076 0.0761988-1993 -0.014 0.009 -0.025 0.1001992-1997 -0.007 0.006 -0.010 0.1191996-2001 -0.030 0.014 -0.062 0.138The estimation sample is composed of all workers in the largest connected set, provided they where employed
for at least four months. Results are computed only for firms located in Veneto.
55
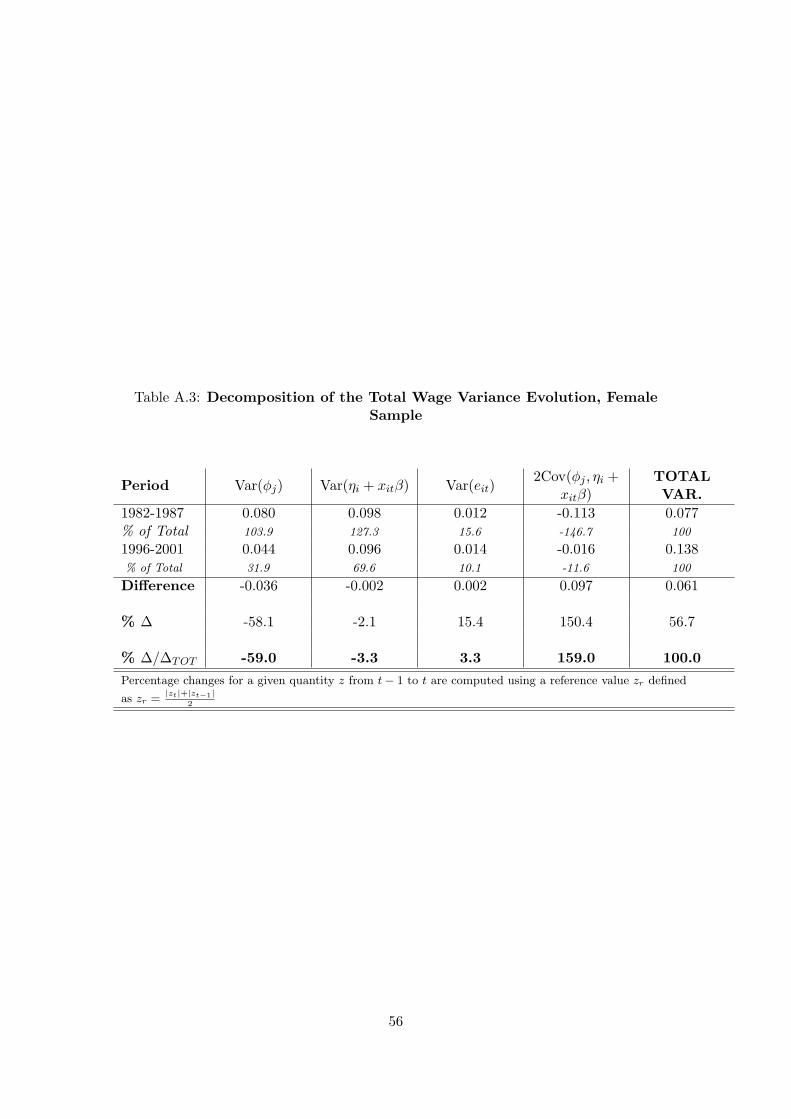
Table A.3: Decomposition of the Total Wage Variance Evolution, FemaleSample
Period Var(φj) Var(ηi + xitβ) Var(eit)2Cov(φj , ηi +
xitβ)TOTALVAR.
1982-1987 0.080 0.098 0.012 -0.113 0.077% of Total 103.9 127.3 15.6 -146.7 100
1996-2001 0.044 0.096 0.014 -0.016 0.138% of Total 31.9 69.6 10.1 -11.6 100
Difference -0.036 -0.002 0.002 0.097 0.061
% ∆ -58.1 -2.1 15.4 150.4 56.7
% ∆/∆TOT -59.0 -3.3 3.3 159.0 100.0
Percentage changes for a given quantity z from t− 1 to t are computed using a reference value zr defined
as zr =|zt|+|zt−1|
2
56
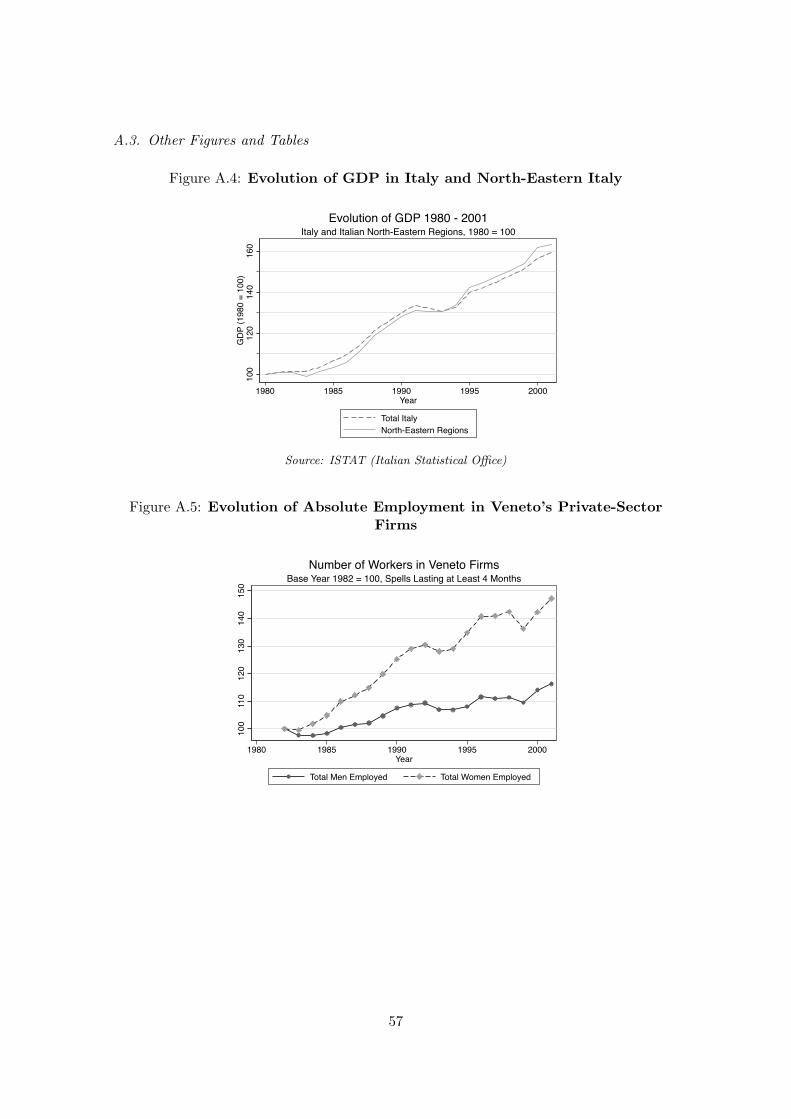
A.3. Other Figures and Tables
Figure A.4: Evolution of GDP in Italy and North-Eastern Italy
100
120
140
160
GD
P (1
980
= 10
0)
1980 1985 1990 1995 2000Year
Total ItalyNorth-Eastern Regions
Italy and Italian North-Eastern Regions, 1980 = 100Evolution of GDP 1980 - 2001
Source: ISTAT (Italian Statistical Office)
Figure A.5: Evolution of Absolute Employment in Veneto’s Private-SectorFirms
100
110
120
130
140
150
1980 1985 1990 1995 2000Year
Total Men Employed Total Women Employed
Base Year 1982 = 100, Spells Lasting at Least 4 MonthsNumber of Workers in Veneto Firms
57

Figure A.6: Long-Run Evolution of Gross Weekly WagesReal-Level Average and St. Dev. of Log Wages
500
600
700
800
1975 1980 1985 1990 1995 2000Year
Average level of weekly wages
Male Sample and Veneto Firms OnlyEvolution of Gross Mean Weekly Wages
400
450
500
550
600
1975 1980 1985 1990 1995 2000Year
Average level of weekly wages
Female Sample and Veneto Firms OnlyEvolution of Gross Mean Weekly Wages
.3.3
2.3
4.3
6.3
8
1975 1980 1985 1990 1995 2000Year
St. deviation of log weekly wages
Male Sample and Veneto Firms OnlyEvolution of Wage St. Deviation
.32
.34
.36
.38
.4.4
2
1975 1980 1985 1990 1995 2000Year
St. deviation of log weekly wages
Female Sample and Veneto Firms OnlyEvolution of Wage St. Deviation
58
Related Documents