Collecting online: How Statistics Netherlands moved its business Surveys onto the internet Ger Snijkers thanks to Deirdre Giesen, Hank Hermans, Myra Wieling

Collecting online: How Statistics Netherlands moved its business Surveys onto the internet Ger Snijkers thanks to Deirdre Giesen, Hank Hermans, Myra Wieling.
Dec 30, 2015
Welcome message from author
This document is posted to help you gain knowledge. Please leave a comment to let me know what you think about it! Share it to your friends and learn new things together.
Transcript
Collecting online: How Statistics Netherlands moved its
business Surveys onto the internet
Ger Snijkers thanks to Deirdre Giesen, Hank Hermans, Myra Wieling
15 October 2013 2OSS Seminar, Statistics New Zealand, Wellington
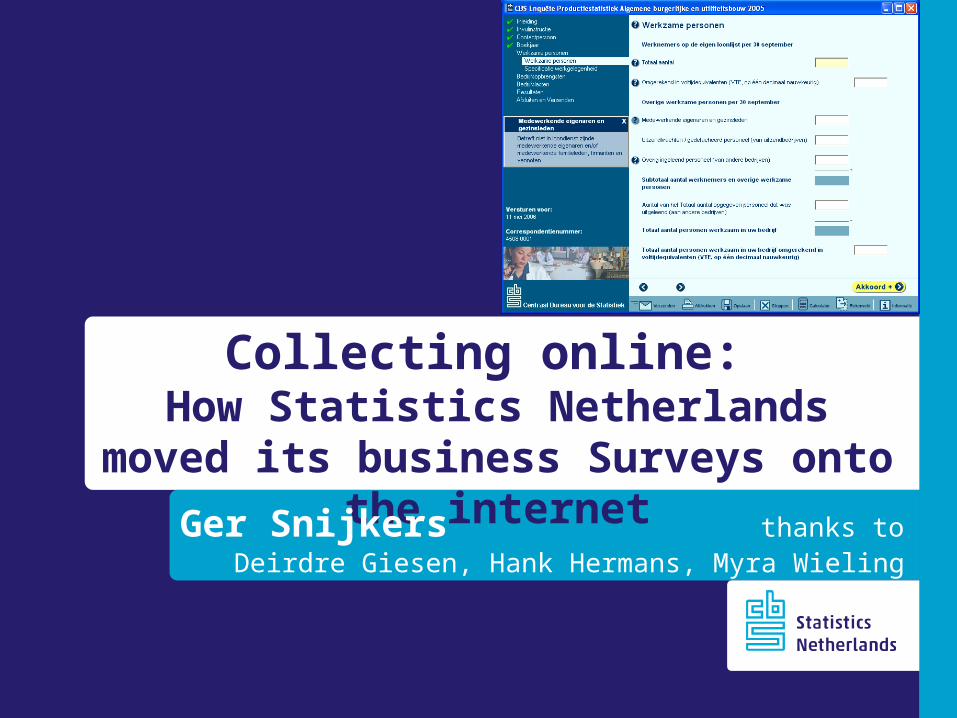
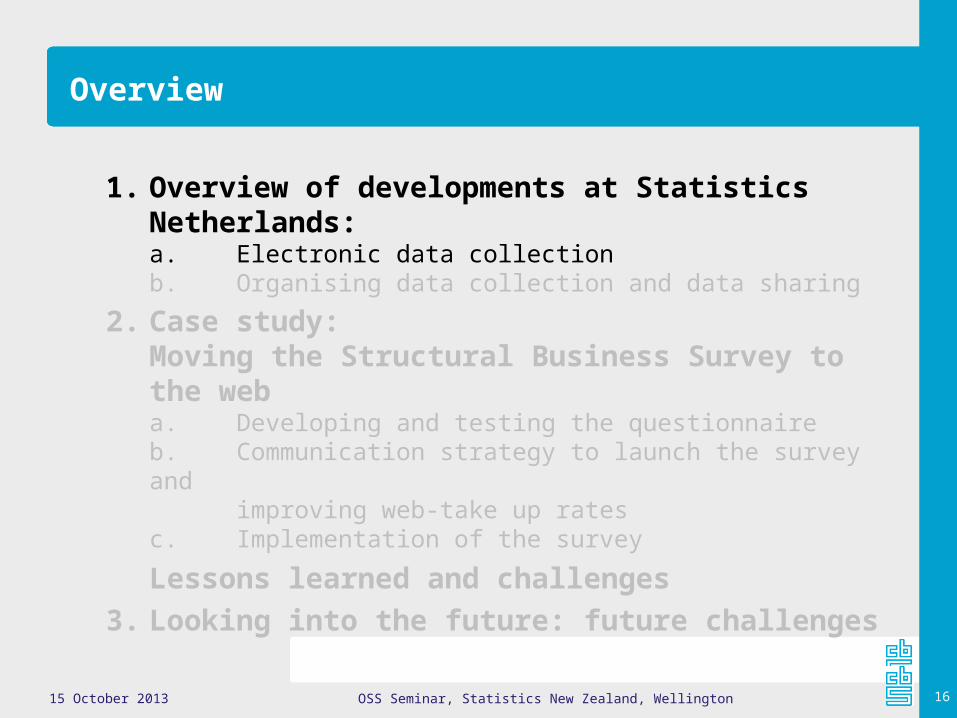
Overview
1. Overview of developments at Statistics Netherlands:a. Electronic data collectionb. Organising data collection and data sharing
2. Case study: Moving the Structural Business Survey to the weba. Developing and testing the questionnaireb. Communication strategy to launch the survey and improving web-take up ratesc. Implementation of the survey
Lessons learned and challenges3. Looking into the future: future challenges
15 October 2013 3OSS Seminar, Statistics New Zealand, Wellington
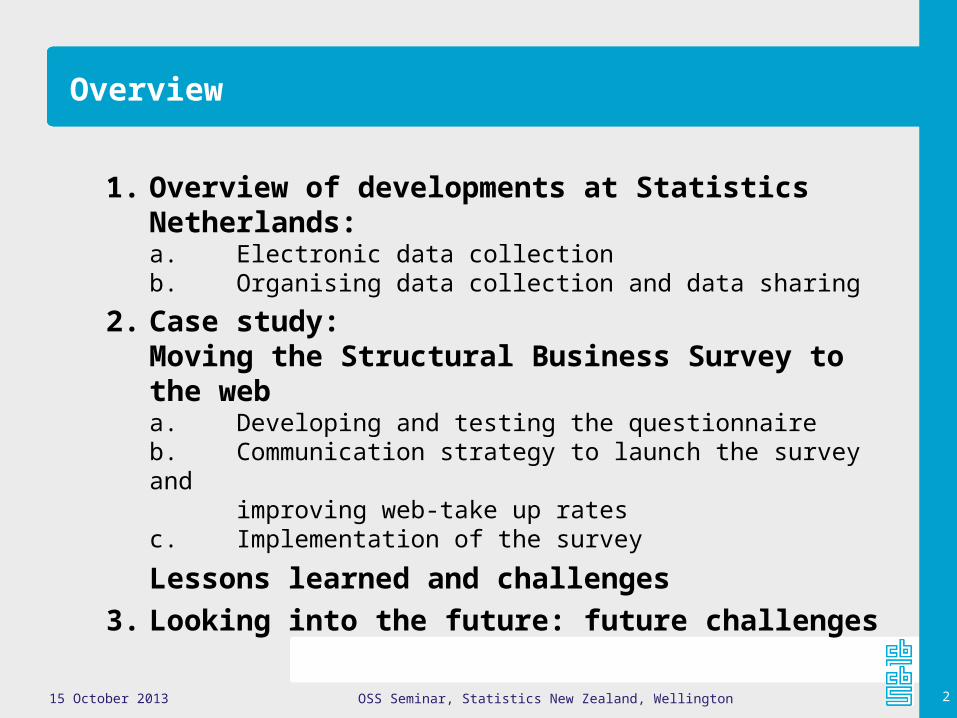
Brief history of electronic data collection at SN
Before 2000:• 1984 First PCs• Mid 1980s Blaise 1.0• 1993 E-reporting for International Trade: IRIS
- disk-by-mail (floppy disks, CDs), - now offline using downloadable software
• Mid 1990s Electronic Data Interchange: EDIsent
- software installed on business’ systems
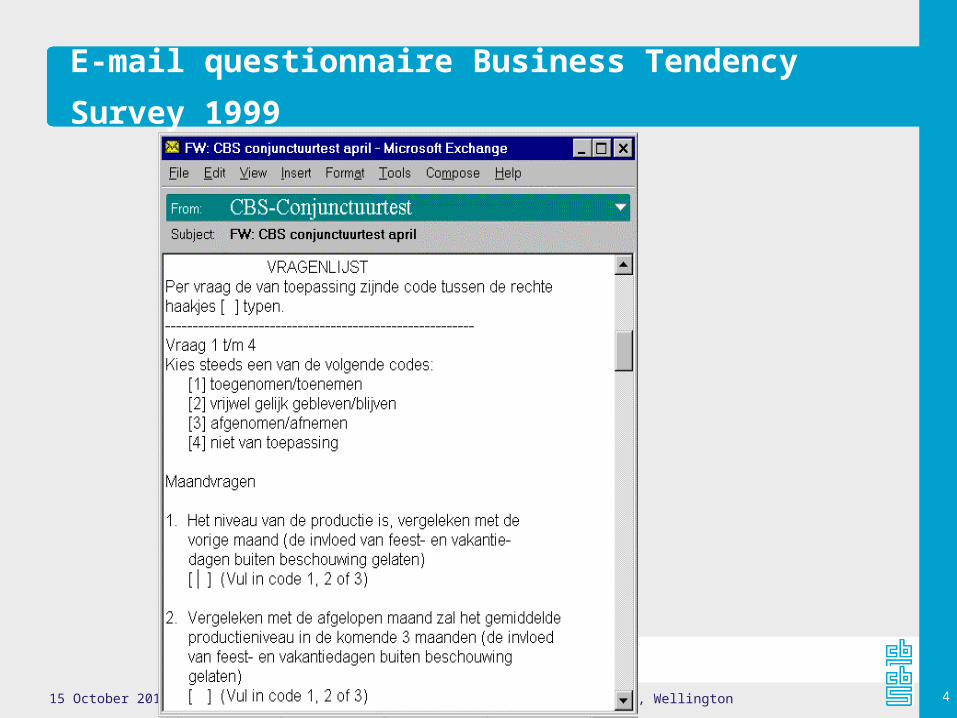
• 1998 Simple establishment surveys - e-mail
15 October 2013 4OSS Seminar, Statistics New Zealand, Wellington
E-mail questionnaire Business Tendency Survey 1999
15 October 2013 5OSS Seminar, Statistics New Zealand, Wellington
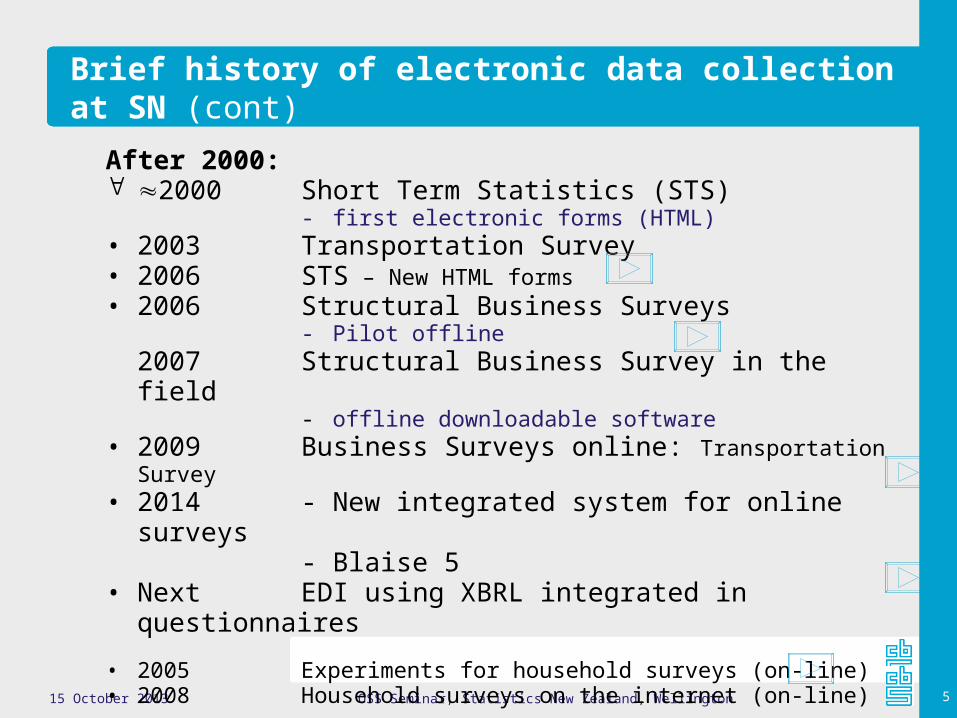
Brief history of electronic data collection at SN (cont)
After 2000: 2000 Short Term Statistics (STS)
- first electronic forms (HTML)• 2003 Transportation Survey• 2006 STS – New HTML forms• 2006 Structural Business Surveys
- Pilot offline 2007 Structural Business Survey in the field
- offline downloadable software• 2009 Business Surveys online: Transportation
Survey• 2014 - New integrated system for online
surveys - Blaise 5
• Next EDI using XBRL integrated in questionnaires
• 2005 Experiments for household surveys (on-line)• 2008 Household surveys on the internet (on-line)
15 October 2013 6OSS Seminar, Statistics New Zealand, Wellington
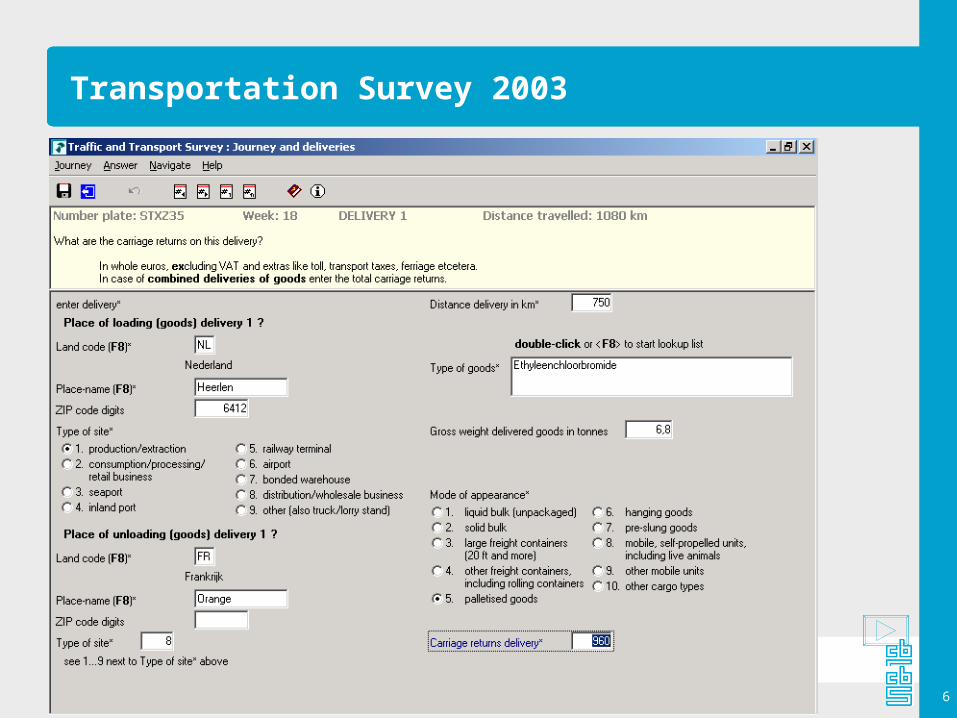
Transportation Survey 2003

15 October 2013 7OSS Seminar, Statistics New Zealand, Wellington
Offline SBS Survey 2007 more to come
15 October 2013 8OSS Seminar, Statistics New Zealand, Wellington
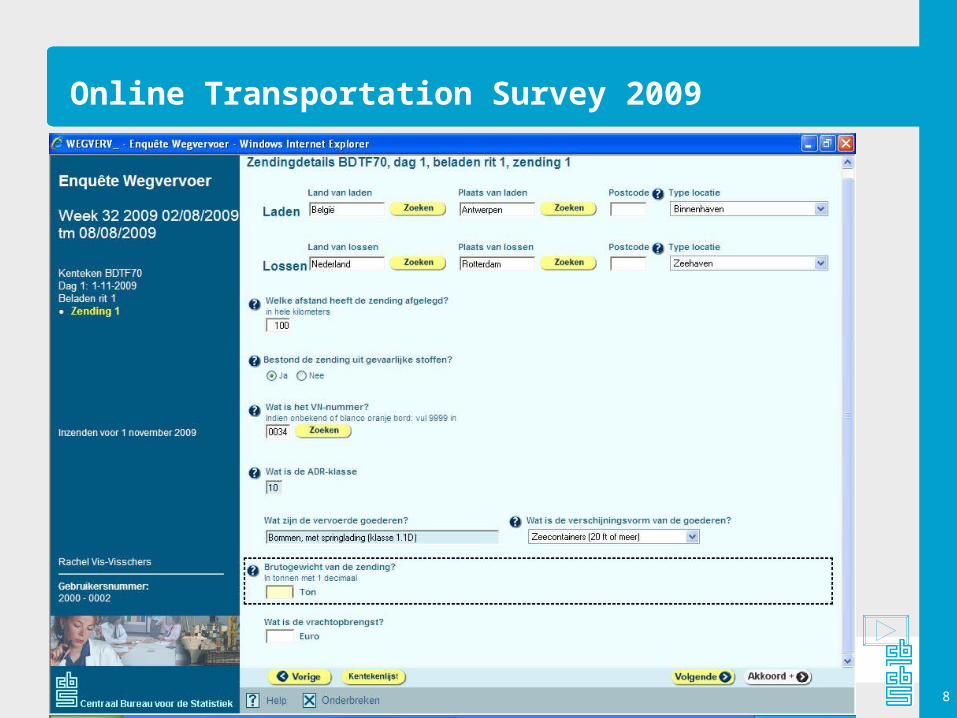
Online Transportation Survey 2009

15 October 2013 9OSS Seminar, Statistics New Zealand, Wellington
XBRL-based system (future)
15 October 2013 10OSS Seminar, Statistics New Zealand, Wellington
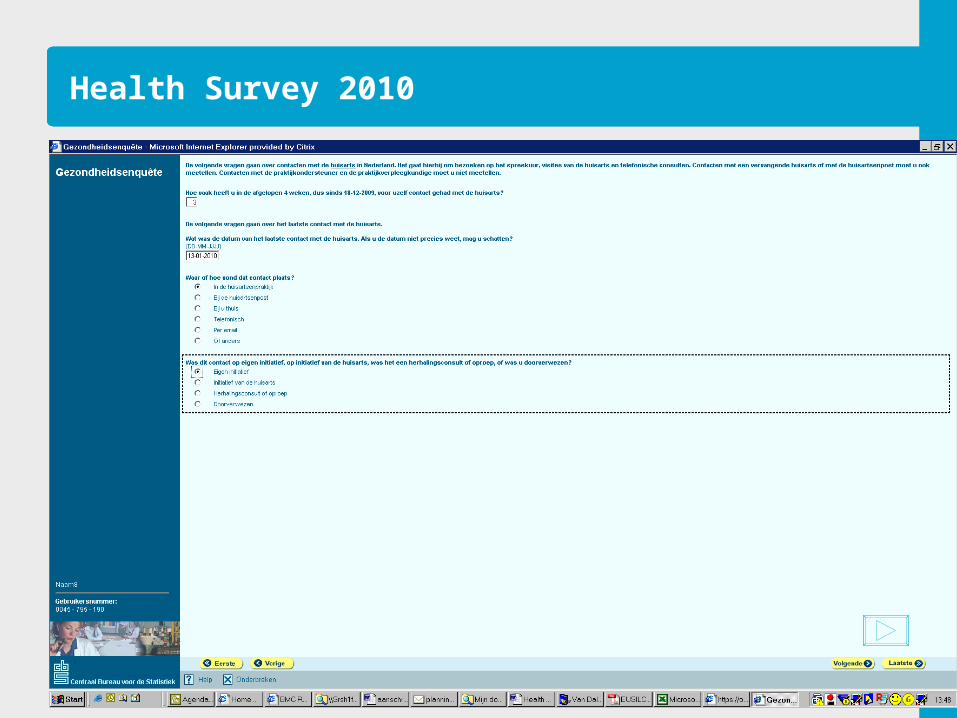
Health Survey 2010
15 October 2013 11OSS Seminar, Statistics New Zealand, Wellington
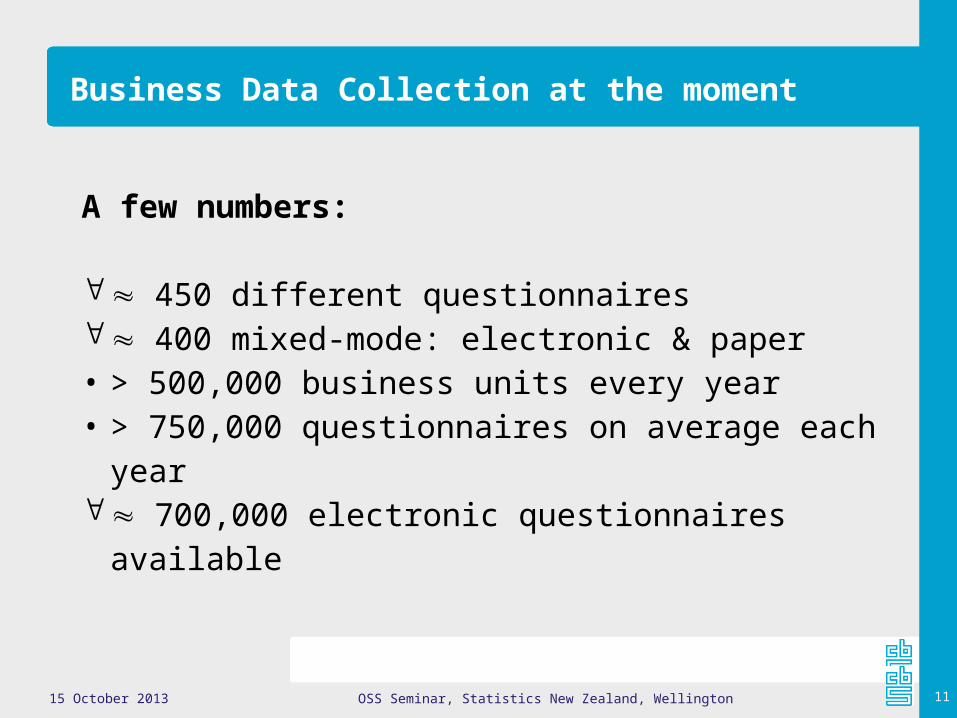
Business Data Collection at the moment
A few numbers:
450 different questionnaires 400 mixed-mode: electronic & paper• > 500,000 business units every year• > 750,000 questionnaires on average each year 700,000 electronic questionnaires available
15 October 2013 12OSS Seminar, Statistics New Zealand, Wellington
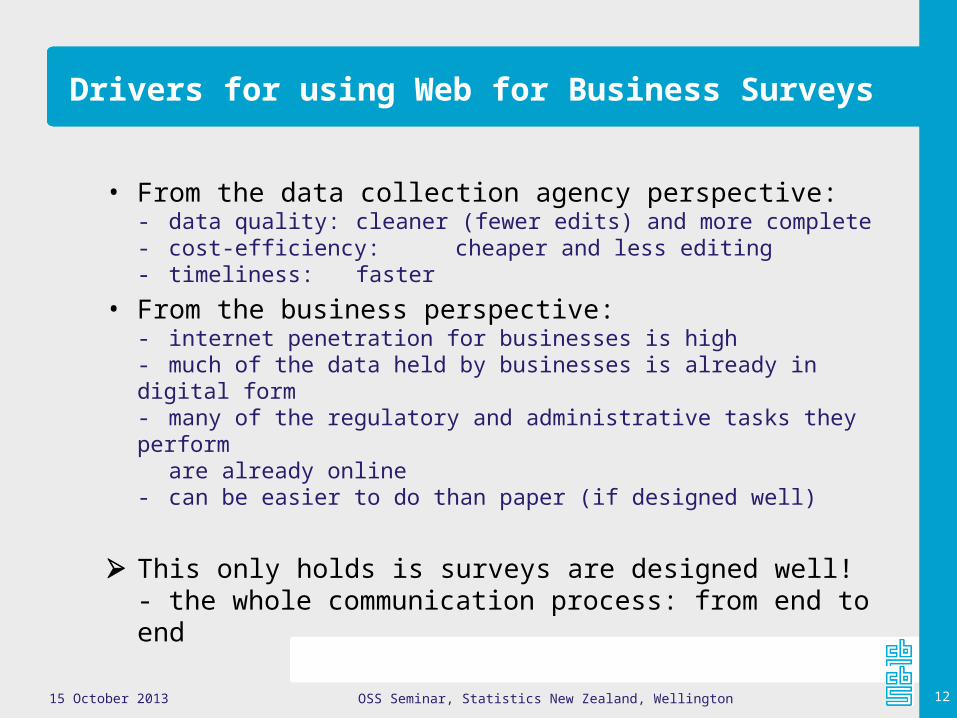
Drivers for using Web for Business Surveys
• From the data collection agency perspective:- data quality: cleaner (fewer edits) and more complete- cost-efficiency: cheaper and less editing- timeliness: faster
• From the business perspective:- internet penetration for businesses is high- much of the data held by businesses is already in digital form- many of the regulatory and administrative tasks they perform are already online- can be easier to do than paper (if designed well)
This only holds is surveys are designed well!- the whole communication process: from end to end
15 October 2013 13OSS Seminar, Statistics New Zealand, Wellington
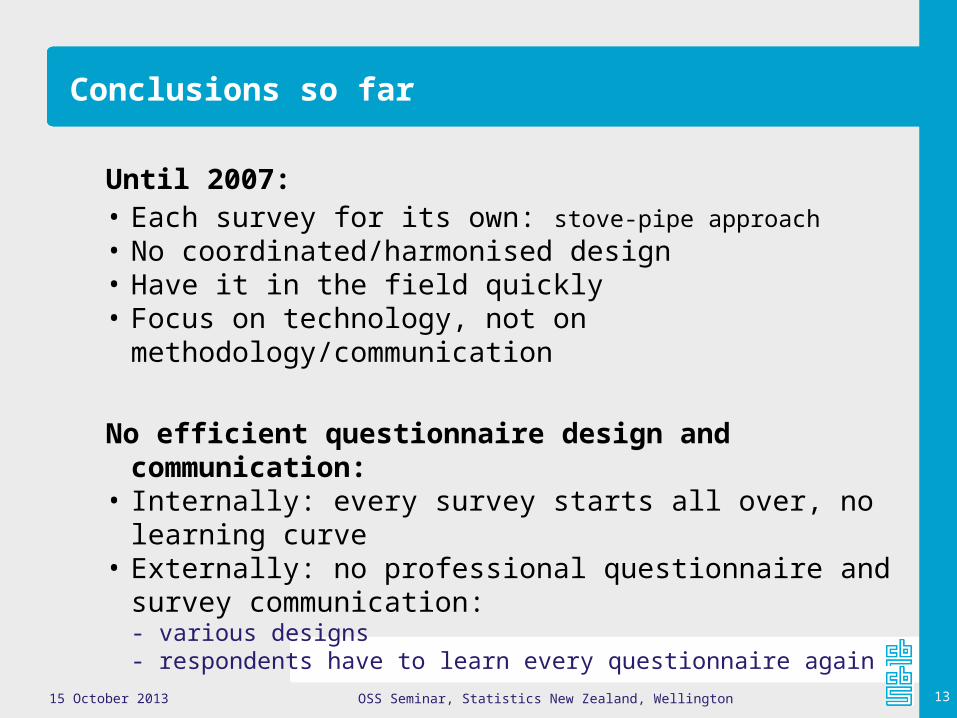
Conclusions so far
Until 2007: • Each survey for its own: stove-pipe approach• No coordinated/harmonised design• Have it in the field quickly• Focus on technology, not on
methodology/communication
No efficient questionnaire design and communication:
• Internally: every survey starts all over, no learning curve
• Externally: no professional questionnaire and survey communication:- various designs - respondents have to learn every questionnaire again
15 October 2013 14OSS Seminar, Statistics New Zealand, Wellington
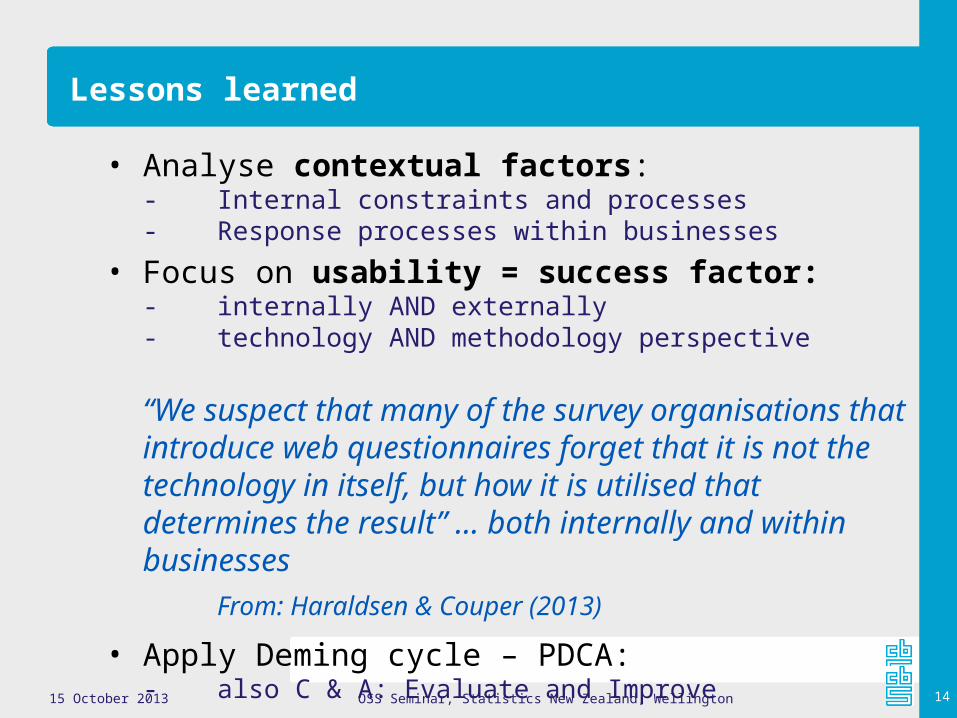
Lessons learned
• Analyse contextual factors:- Internal constraints and processes- Response processes within businesses
• Focus on usability = success factor:- internally AND externally - technology AND methodology perspective
“We suspect that many of the survey organisations that introduce web questionnaires forget that it is not the technology in itself, but how it is utilised that determines the result” ... both internally and within businesses
From: Haraldsen & Couper (2013)
• Apply Deming cycle – PDCA:- also C & A: Evaluate and Improve
15 October 2013 15OSS Seminar, Statistics New Zealand, Wellington
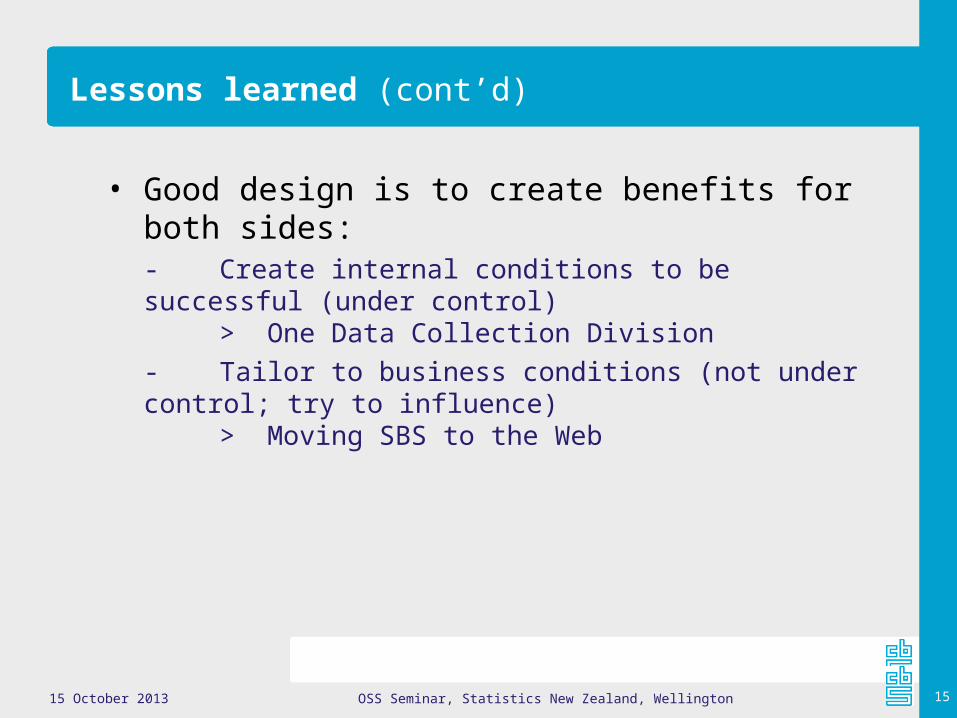
Lessons learned (cont’d)
• Good design is to create benefits for both sides:
- Create internal conditions to be successful (under control)
> One Data Collection Division - Tailor to business conditions (not under control; try
to influence) > Moving SBS to the Web
15 October 2013 16OSS Seminar, Statistics New Zealand, Wellington
Overview
1. Overview of developments at Statistics Netherlands:
a. Electronic data collection b. Organising data collection and data sharing
2. Case study:Moving the Structural Business Survey to the weba. Developing and testing the questionnaireb. Communication strategy to launch the survey and improving web-take up ratesc. Implementation of the survey
Lessons learned and challenges3. Looking into the future: future challenges

15 October 2013 17OSS Seminar, Statistics New Zealand, Wellington
Data Collection over the years
Stove pipes Data Collection 2000
Partial Centralisation Data Collection Now
< 1994 1994 - 2000
2000 - 2007
Present
15 October 2013 18OSS Seminar, Statistics New Zealand, Wellington
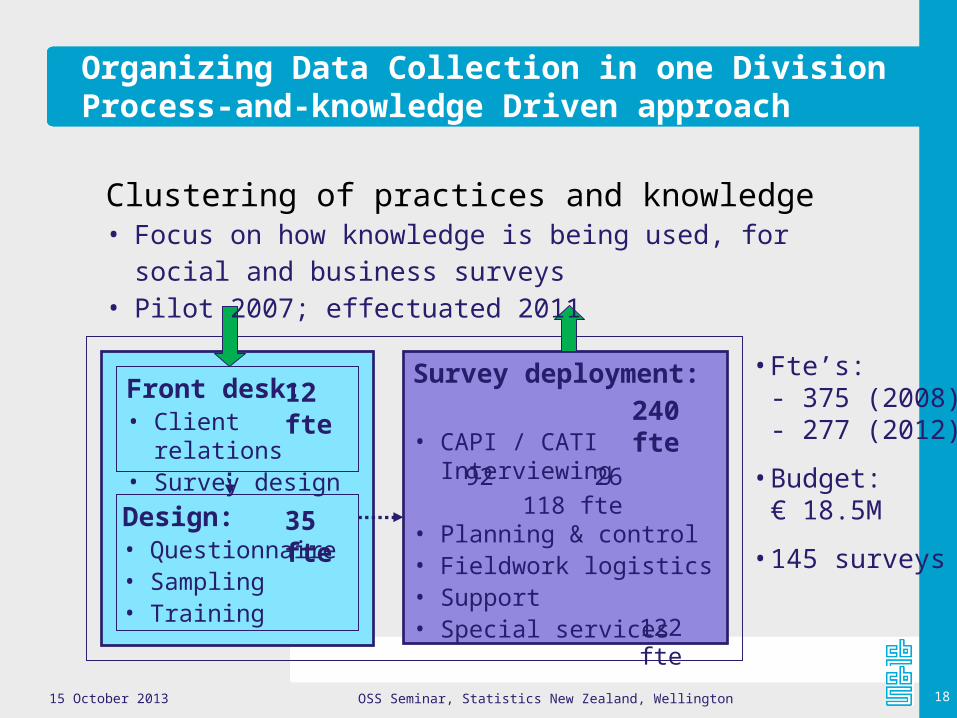
Organizing Data Collection in one DivisionProcess-and-knowledge Driven approach
Front desk:• Client relations• Survey design
Design:• Questionnaire• Sampling• Training
Survey deployment:
• CAPI / CATI Interviewing
• Planning & control• Fieldwork logistics• Support• Special services
Clustering of practices and knowledge• Focus on how knowledge is being used, for social and
business surveys• Pilot 2007; effectuated 2011
12 fte
35 fte
240 fte
• Fte’s:- 375 (2008)- 277 (2012)
• Budget:€ 18.5M
• 145 surveys
92 26 118 fte
122 fte
15 October 2013 19OSS Seminar, Statistics New Zealand, Wellington
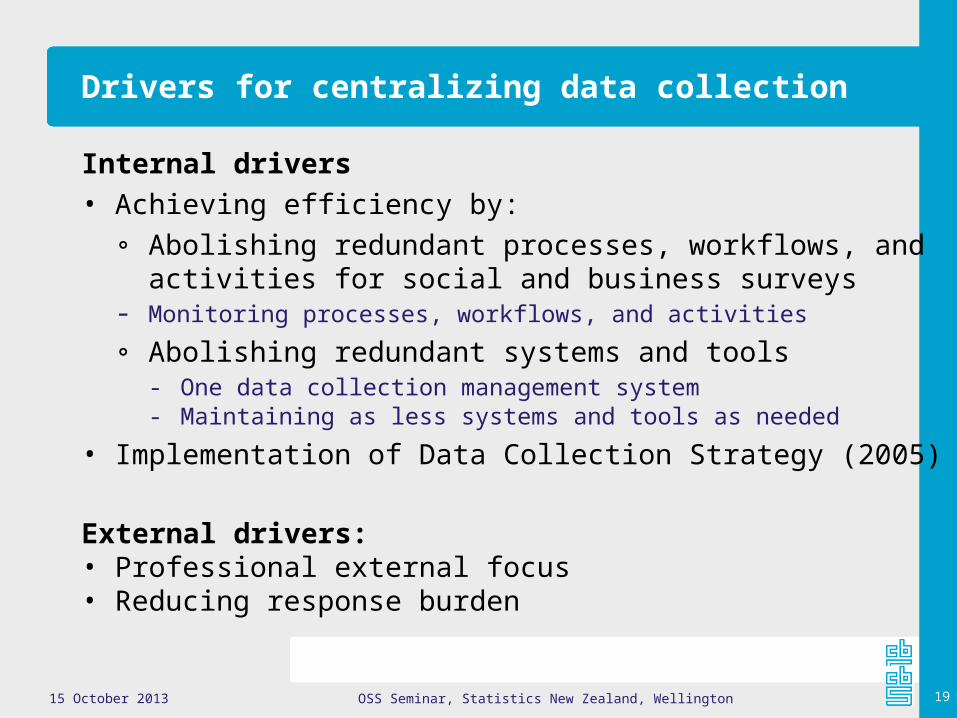
Drivers for centralizing data collection
Internal drivers• Achieving efficiency by: ∘ Abolishing redundant processes, workflows, and
activities for social and business surveys- Monitoring processes, workflows, and activities
∘ Abolishing redundant systems and tools - One data collection management system - Maintaining as less systems and tools as needed
• Implementation of Data Collection Strategy (2005)
External drivers:• Professional external focus• Reducing response burden

15 October 2013 20OSS Seminar, Statistics New Zealand, Wellington
The 2011 Data Collection Strategy:Retrieving and returning (first version in 2005)
3 steps:1. Re-use of available data
- Data sharing & data warehousing
2. Use of new registers and other secondary sources - Traditional government-based registers - Big/organic data
- Data on the internet (web-crawlers)
3. Primary data collection:1. EDI technologies, like XBRL
2. Web surveys 3. traditional modes: paper, CATI, CAPI
• Using new technologies • Reciprocity: report back to respondents
Multi-source designs
Mixed-mode designs

15 October 2013 21OSS Seminar, Statistics New Zealand, Wellington
Data collection: Developments over the yearsSummary and conclusions
• From stove-pipes to a coordinated system of data collection
• From uni-mode surveys to multi-source/mixed-mode data collection designs
• From single-survey managers to managers of integrated sets of statistics
• From local decision making to corporate decision making • From instrumental data collection to a communication
perspective
We are still in the middle of this process! A cultural shift needs years to change!But … are we moving too slow?

15 October 2013 22OSS Seminar, Statistics New Zealand, Wellington
Overview
1. Overview of developments at Statistics Netherlands:a. Electronic data collectionb. Organising data collection and data sharing
2. Case study: Moving the Structural Business Survey to the weba. Developing and testing the questionnaireb. Communication strategy to launch the survey and improving web-take up ratesc. Implementation of the survey
Lessons learned and challenges3. Looking into the future: future challenges

15 October 2013 23OSS Seminar, Statistics New Zealand, Wellington
Moving to the Web: two basic approaches
• Copy all paper questionnaires to the web in a short period of time, in one or various ways:- PDF, offline electronic questionnaire, online questionnaire
Quick results, but how is the questionnaire utilised? High risks of: - web Qs not being used
- negative effects on public image Pushing problems and costs downstream Evaluate and improve, if you still get the chance ...• Develop one approach and apply to all surveys:
- investing in the organisation, technology, and methodology- investing in the ‘respondent experience’: survey communication - investing in PR: harmonised approach
Takes time and costs money Higher chances of good results: web Qs actually used
15 October 2013 24OSS Seminar, Statistics New Zealand, Wellington
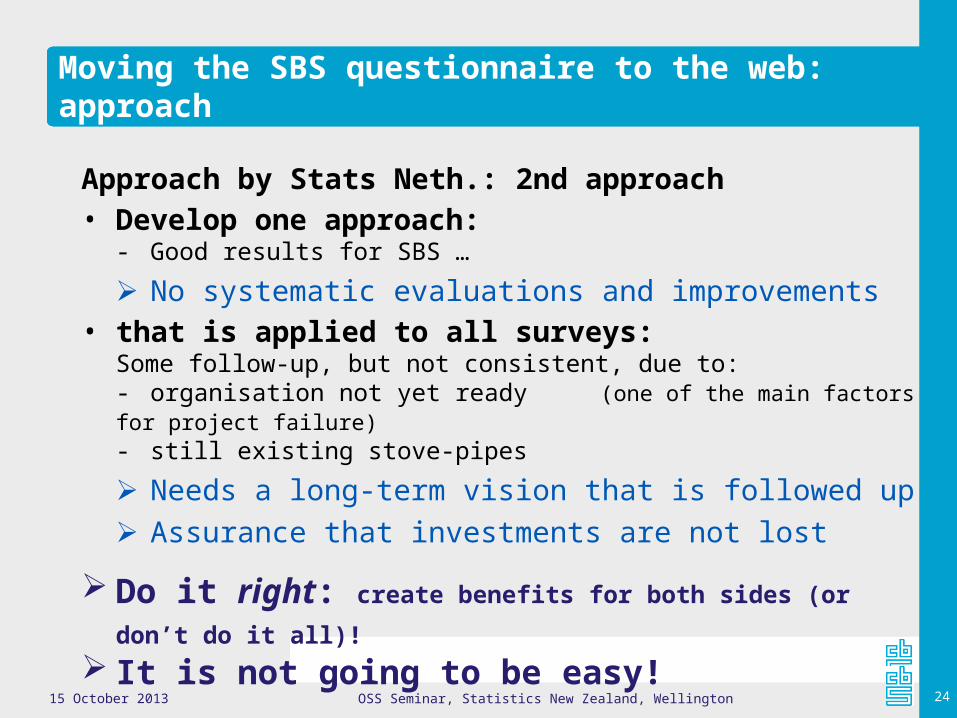
Moving the SBS questionnaire to the web: approach
Approach by Stats Neth.: 2nd approach• Develop one approach:
- Good results for SBS …
No systematic evaluations and improvements• that is applied to all surveys:
Some follow-up, but not consistent, due to:- organisation not yet ready (one of the main factors for project failure) - still existing stove-pipes
Needs a long-term vision that is followed up Assurance that investments are not lost
Do it right: create benefits for both sides (or
don’t do it all)! It is not going to be easy!

15 October 2013 25OSS Seminar, Statistics New Zealand, Wellington
Moving the SBS questionnaire to the web: Project
Project goals and constraints:• Develop a web questionnaire
- same contents- mixed-mode design: coherent paper and web- support completion process- motivate respondents to use this mode- into the field: March 2006
• Start of project: June 2004- we had one year, until Sept. 2005
15 October 2013 26OSS Seminar, Statistics New Zealand, Wellington
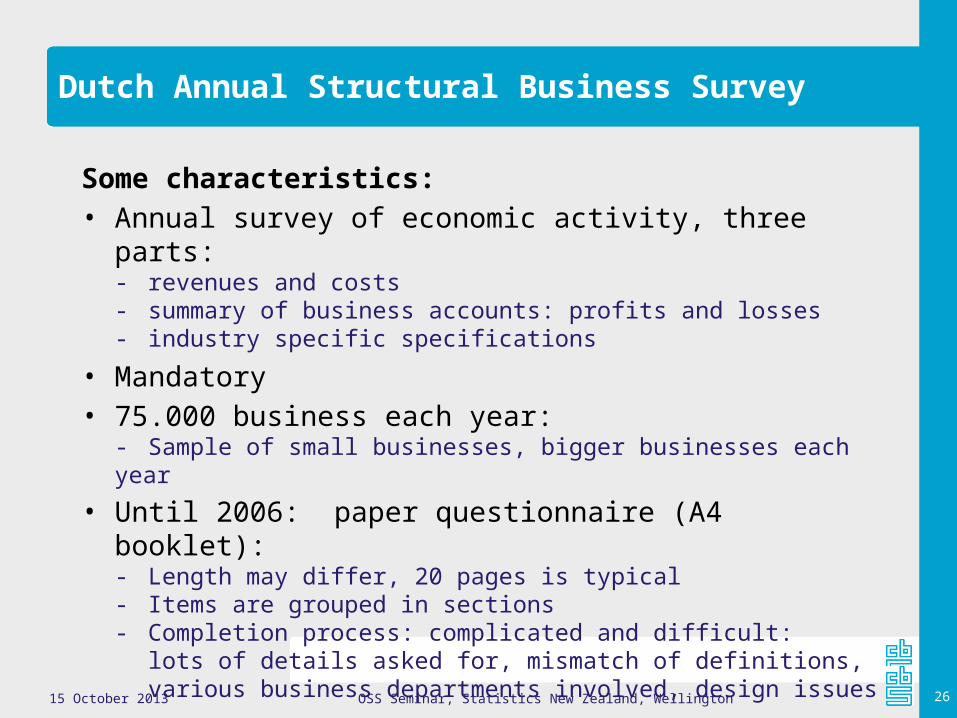
Dutch Annual Structural Business Survey
Some characteristics:• Annual survey of economic activity, three parts:
- revenues and costs- summary of business accounts: profits and losses- industry specific specifications
• Mandatory• 75.000 business each year:
- Sample of small businesses, bigger businesses each year
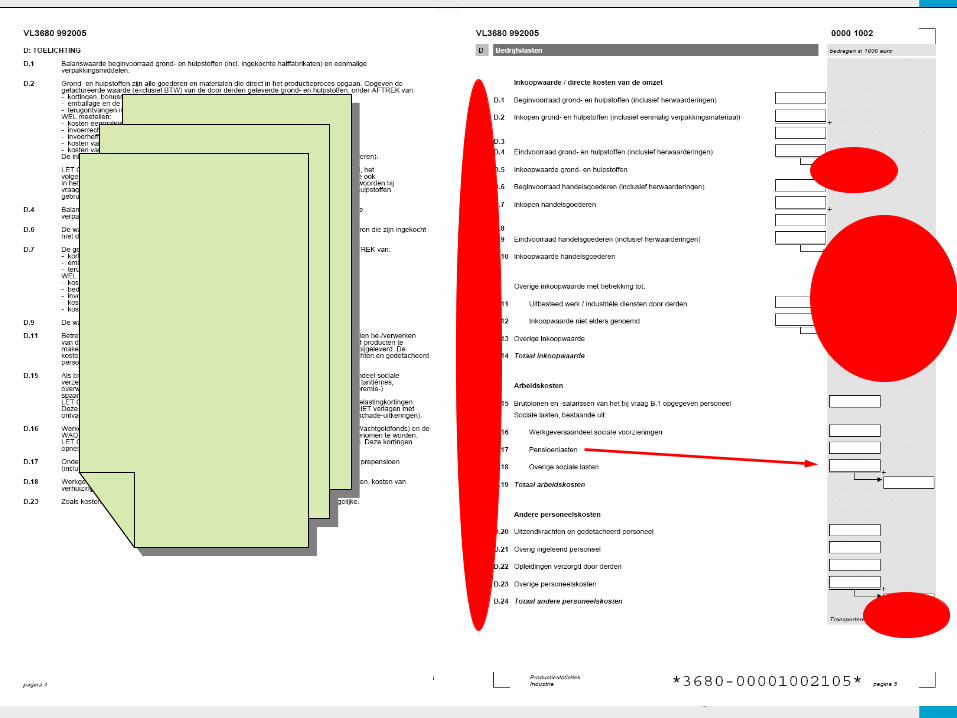
• Until 2006: paper questionnaire (A4 booklet):- Length may differ, 20 pages is typical- Items are grouped in sections- Completion process: complicated and difficult:
lots of details asked for, mismatch of definitions, various business departments involved, design issues

15 October 2013 27OSS Seminar, Statistics New Zealand, Wellington
Vernieuwde huisstijl:2. Onderzoek naar de PS
–Q oud
15 October 2013 28OSS Seminar, Statistics New Zealand, Wellington
Vernieuwde huisstijl:2. Onderzoek naar de PS
–Q oud

15 October 2013 29OSS Seminar, Statistics New Zealand, Wellington
3. 4 projects3. Improving paper questionnaire
–Q nieuw
15 October 2013 30OSS Seminar, Statistics New Zealand, Wellington
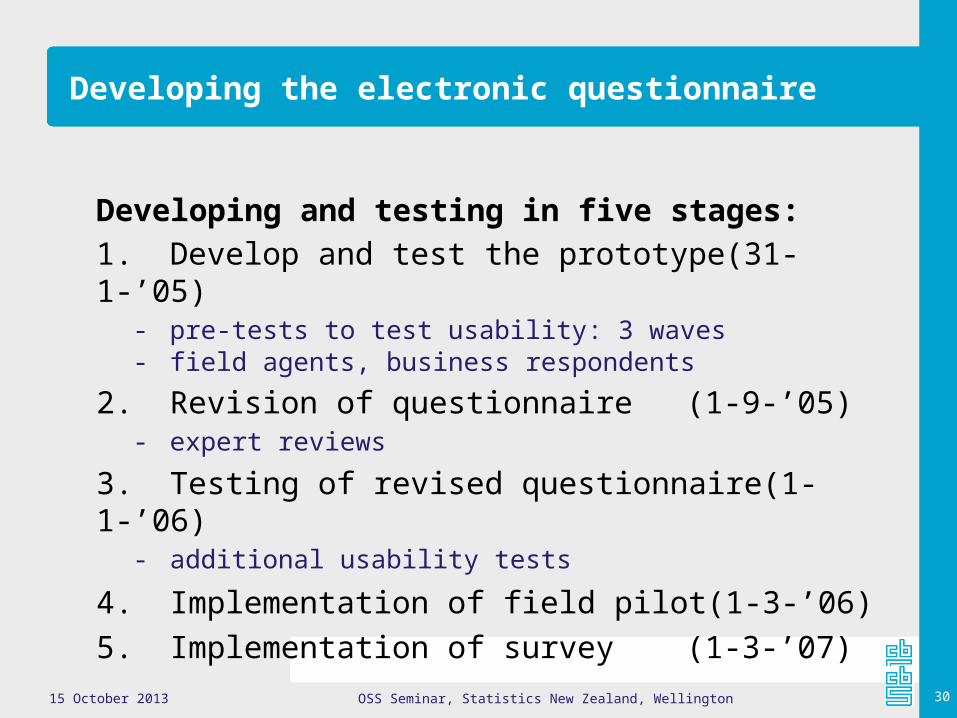
Developing the electronic questionnaire
Developing and testing in five stages:1. Develop and test the prototype (31-1-’05)
- pre-tests to test usability: 3 waves - field agents, business respondents
2. Revision of questionnaire (1-9-’05)- expert reviews
3. Testing of revised questionnaire (1-1-’06)- additional usability tests
4. Implementation of field pilot (1-3-’06)5. Implementation of survey (1-3-’07)

15 October 2013 31OSS Seminar, Statistics New Zealand, Wellington
The electronic questionnaire: the prototype
Developing paper Q and testing this prototype helped in thinking about a good design for an eQ

15 October 2013 32OSS Seminar, Statistics New Zealand, Wellington
Testing the prototype
Research issues:1. How does the e-Q work in practice?
- Completing the questionnaire- Question-and-answer process- Usability
2. What features should be included to make it easy to use?- Respondent friendly: ‘Computer-assisted’ tools- User demands
3. How should the eQ be designed in relation to the paper Q?- The same or a different design- ‘look-and-feel’ of paper and e-form
15 October 2013 33OSS Seminar, Statistics New Zealand, Wellington
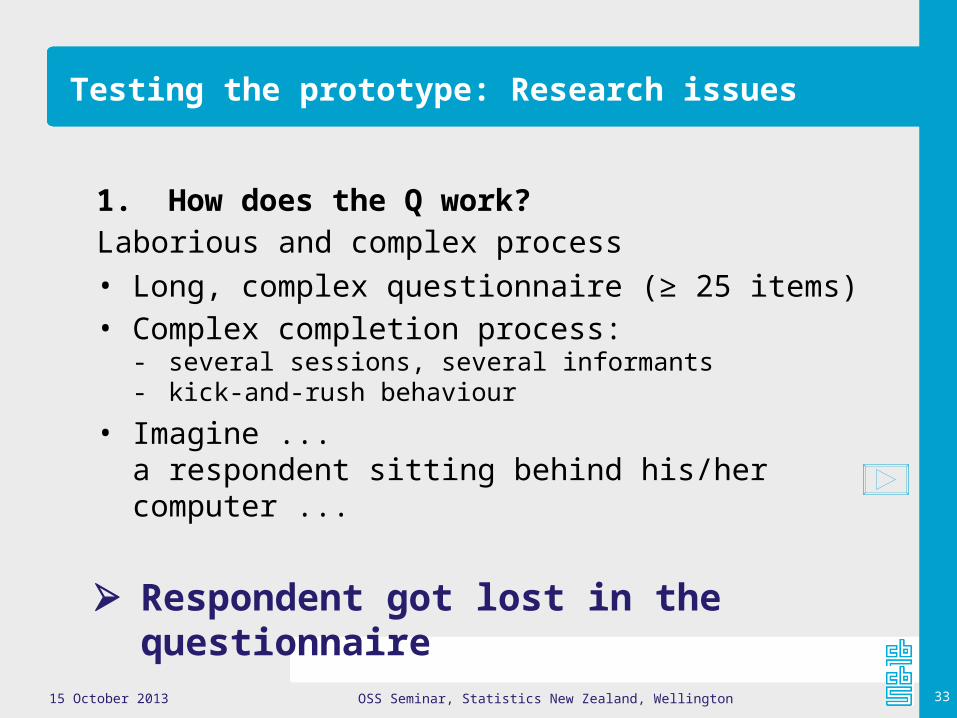
Testing the prototype: Research issues
1.How does the Q work?Laborious and complex process• Long, complex questionnaire (≥ 25 items)• Complex completion process:
- several sessions, several informants- kick-and-rush behaviour
• Imagine ... a respondent sitting behind his/her computer ...
Respondent got lost in the questionnaire

15 October 2013 34OSS Seminar, Statistics New Zealand, Wellington
Illustration of usability
“Medieval tech support”
A new systemis introduced:The ‘book’ (“beek”), in stead ofrolls of paper.
The monk Ansgard has called the helpdesk and is waiting for someone to come …

15 October 2013 35OSS Seminar, Statistics New Zealand, Wellington
Illustration of usability
“Medieval tech support”
It illustrates what we found in the pre-tests for the electronic questionnaire …

15 October 2013 36OSS Seminar, Statistics New Zealand, Wellington
2. Features to make it easy to use?• What am I supposed to do (next)?
- Easy to download, install, complete, send data back- It is one process: going to the internet – submitting data, - Clear instructions and explanations (but not read)
• How is the questionnaire built up? - Show how the questionnaire is structured: overview- Help to find the way in the questionnaire- No hidden rules, no unexpected functionalities
• Where am I? What did I do so far?- Provide overview of the completion process- Clear navigation, no scrolling- Printing function
Usability, navigation and overview: design of Tax forms
Choose a design people know: don’t be original!
Testing the prototype: Research issues
15 October 2013 37OSS Seminar, Statistics New Zealand, Wellington
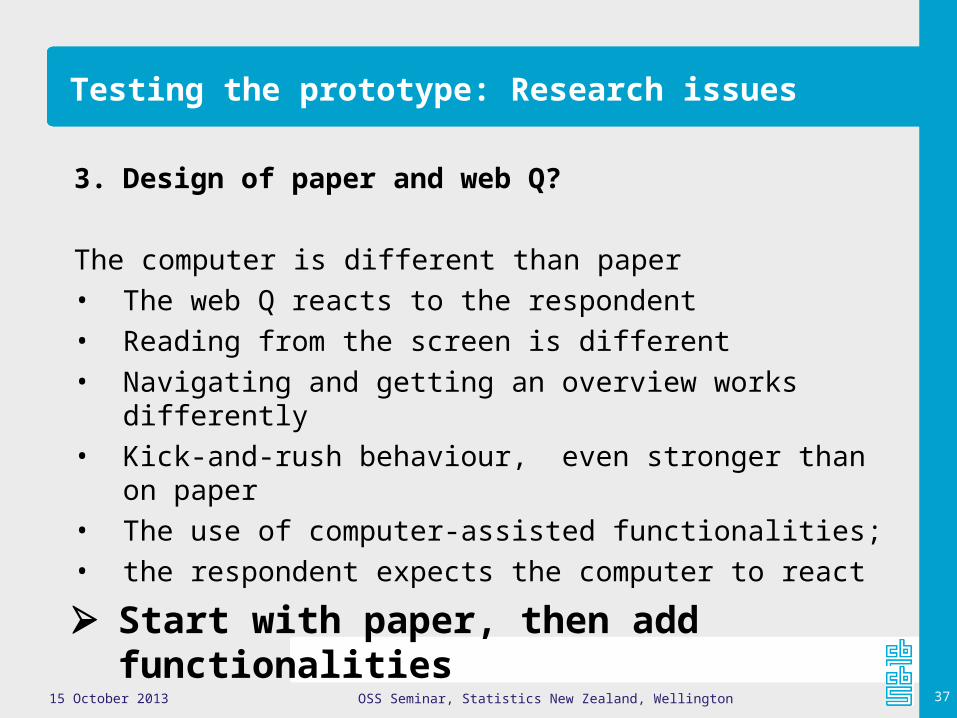
3. Design of paper and web Q?
The computer is different than paper• The web Q reacts to the respondent• Reading from the screen is different• Navigating and getting an overview works
differently• Kick-and-rush behaviour, even stronger than on
paper• The use of computer-assisted functionalities;• the respondent expects the computer to react
Testing the prototype: Research issues
Start with paper, then add functionalities

15 October 2013 38OSS Seminar, Statistics New Zealand, Wellington
Testing the prototype: Conclusions of pre-test waves
• Visual design Clear and logical: “Don’t make me think!” Simple, transparent, consistent No hidden and unexpected functionalities
• Support the completion process, end to end Other mode, other features, other visual design Use computer functionalities: automatic calculations Use layout and usability principles that are known to R (country specific)
• Tailor to kick-and-rush behaviour Split Q into small sections, small tasks Short and clear explanations

15 October 2013 39OSS Seminar, Statistics New Zealand, Wellington
Web questionnaire design is communication design
Questionnaire designer=
Communication designer
Questionnaire communication design
Lessons learned: Web Design Guidelines

15 October 2013 40OSS Seminar, Statistics New Zealand, Wellington
The revised questionnaire
Based on:• Pre-test results• Expert reviews
Iterative process with- Professional designer- Questionnaire designers- Methodologists
• A user-friendly design was put first, not the IT tool
• New prototypes designed in Power Point

15 October 2013 41OSS Seminar, Statistics New Zealand, Wellington
15 October 2013 42OSS Seminar, Statistics New Zealand, Wellington
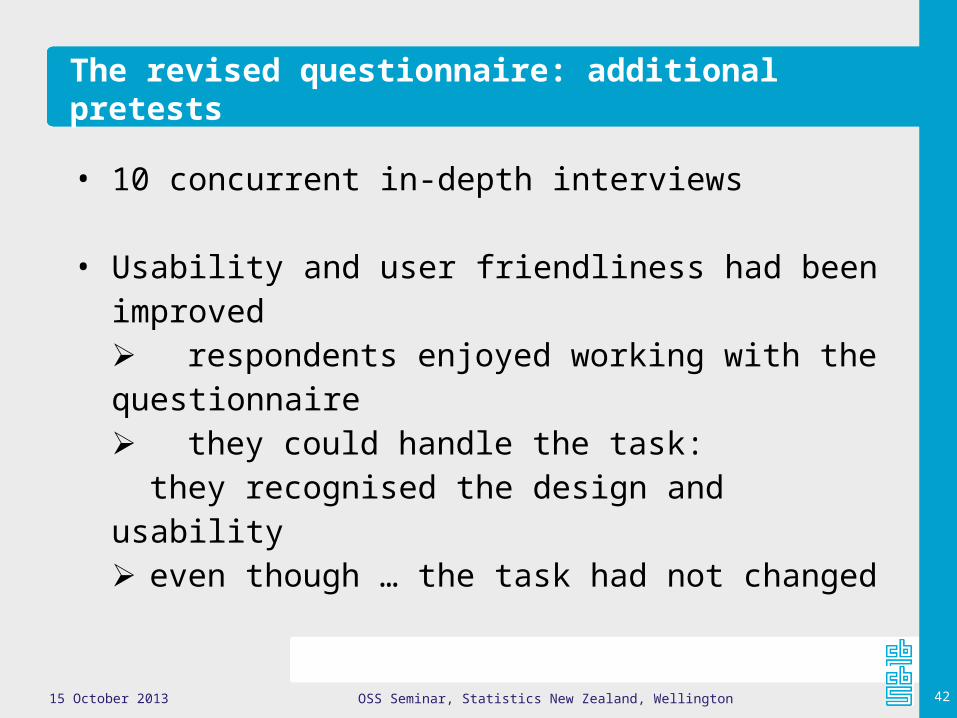
The revised questionnaire: additional pretests
• 10 concurrent in-depth interviews
• Usability and user friendliness had been improved respondents enjoyed working with the questionnaire they could handle the task: they recognised the design and usability even though … the task had not changed
15 October 2013 43OSS Seminar, Statistics New Zealand, Wellington
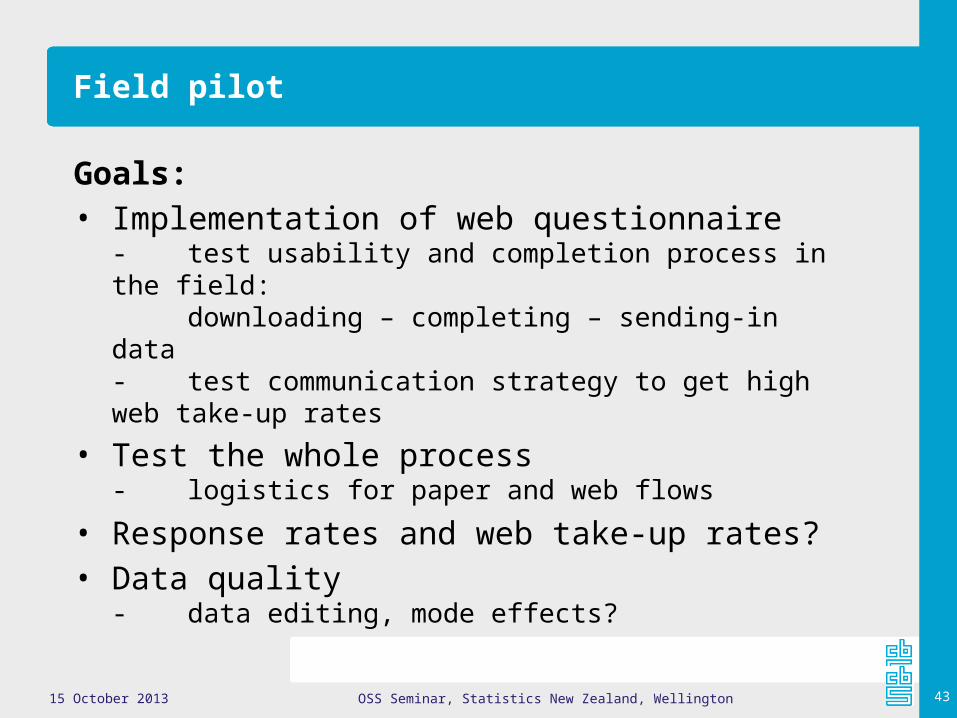
Field pilot
Goals:• Implementation of web questionnaire
- test usability and completion process in the field:
downloading – completing – sending-in data- test communication strategy to get high web take-up rates
• Test the whole process- logistics for paper and web flows
• Response rates and web take-up rates?• Data quality
- data editing, mode effects?

15 October 2013 44OSS Seminar, Statistics New Zealand, Wellington
Field pilot
Set-up:• March-July 2006• 7200 businesses, 5 industries• Communication strategy:
- internet portal: www.cbs.nl/productiestatistiek- advance letter with user name and password- leaflet to introduce web questionnaire
and explain why the survey is conducted- paper questionnaire not mentioned- only 2e or 3e reminding letters include paper questionnaireIn the Netherlands businesses have to report electronically to the Tax Office.
15 October 2013 45OSS Seminar, Statistics New Zealand, Wellington
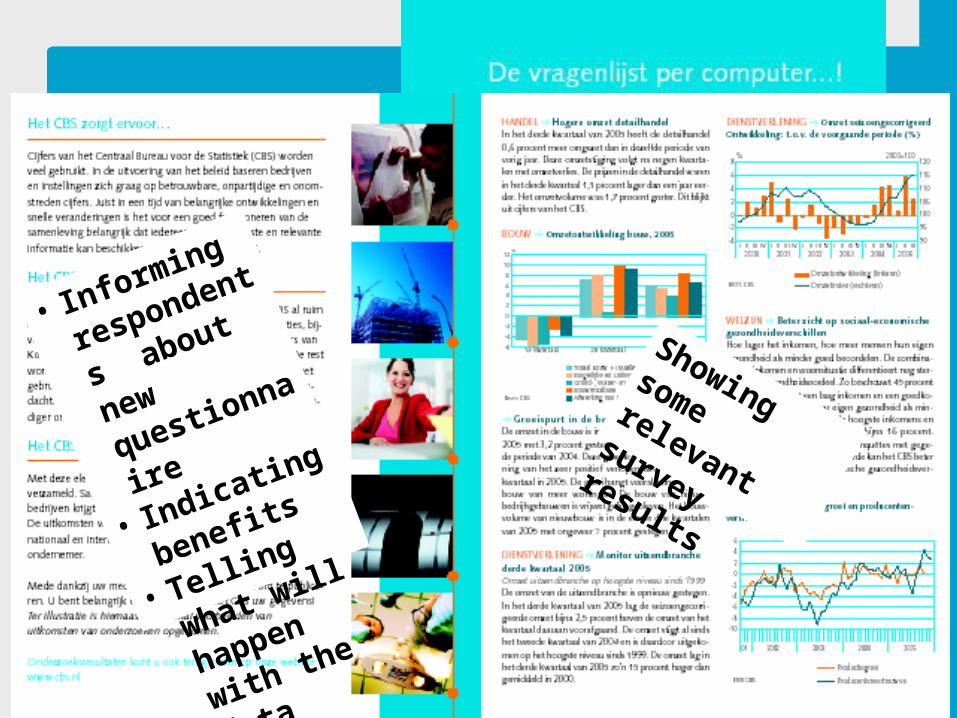
Leaflet
• Informing
responden
ts about
new
questionn
aire
• Indicating
benefits
• Telling
what will
happen
with the
data
Showing some relevant
survey results
15 October 2013 46OSS Seminar, Statistics New Zealand, Wellington
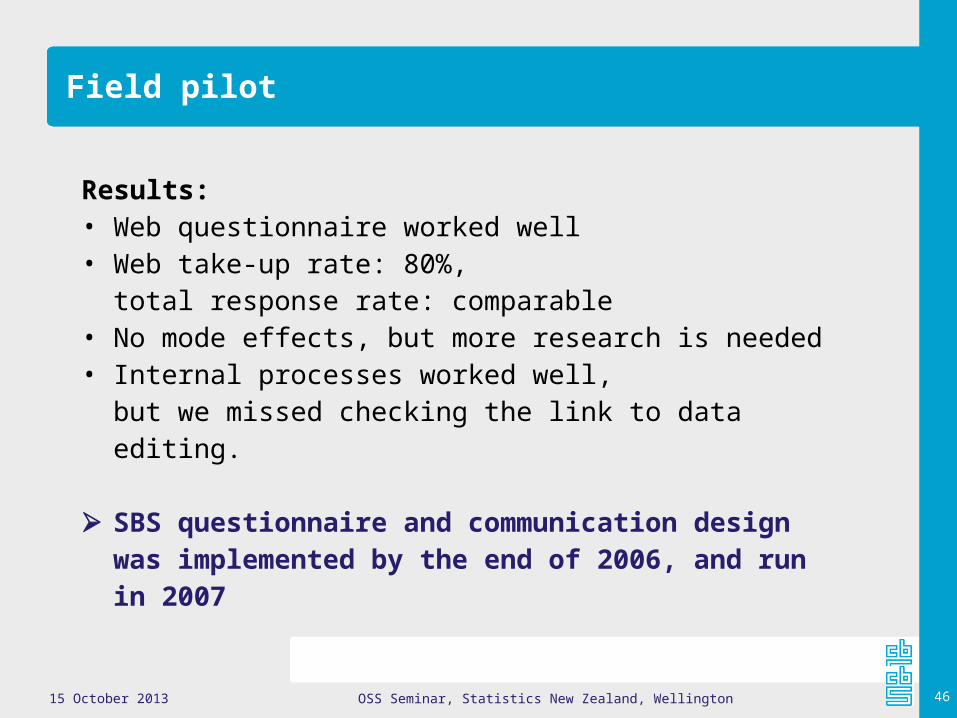
Field pilot
Results:• Web questionnaire worked well• Web take-up rate: 80%,
total response rate: comparable• No mode effects, but more research is needed• Internal processes worked well,
but we missed checking the link to data editing.
SBS questionnaire and communication design was implemented by the end of 2006, and run in 2007
15 October 2013 47OSS Seminar, Statistics New Zealand, Wellington
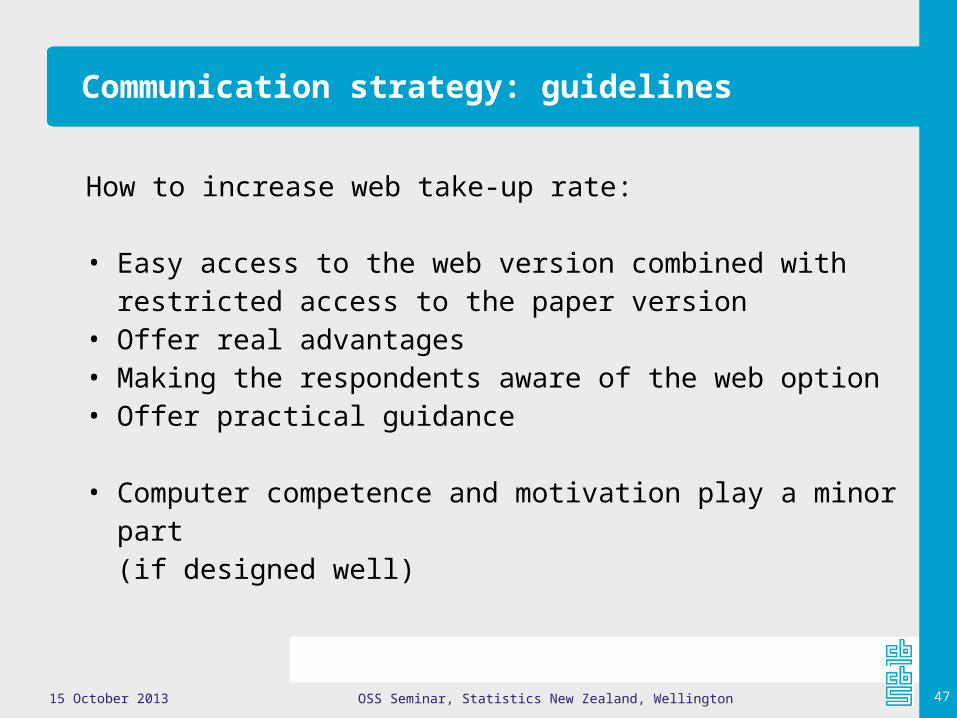
Communication strategy: guidelines
How to increase web take-up rate:
• Easy access to the web version combined with restricted access to the paper version
• Offer real advantages• Making the respondents aware of the web option• Offer practical guidance
• Computer competence and motivation play a minor part(if designed well)
15 October 2013 48OSS Seminar, Statistics New Zealand, Wellington
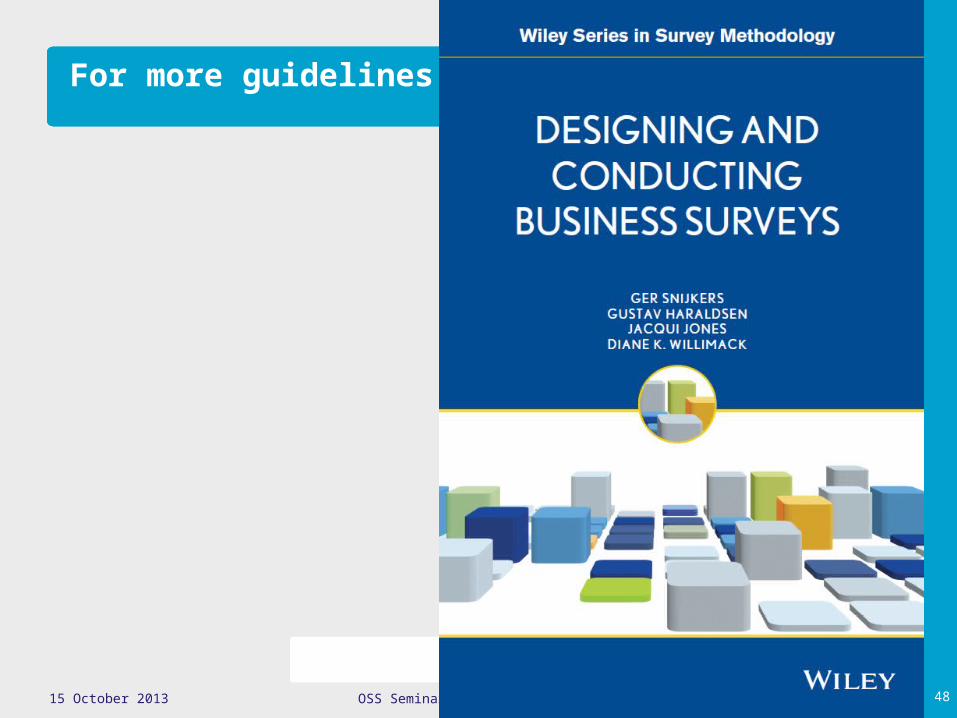
For more guidelines …

15 October 2013 49OSS Seminar, Statistics New Zealand, Wellington
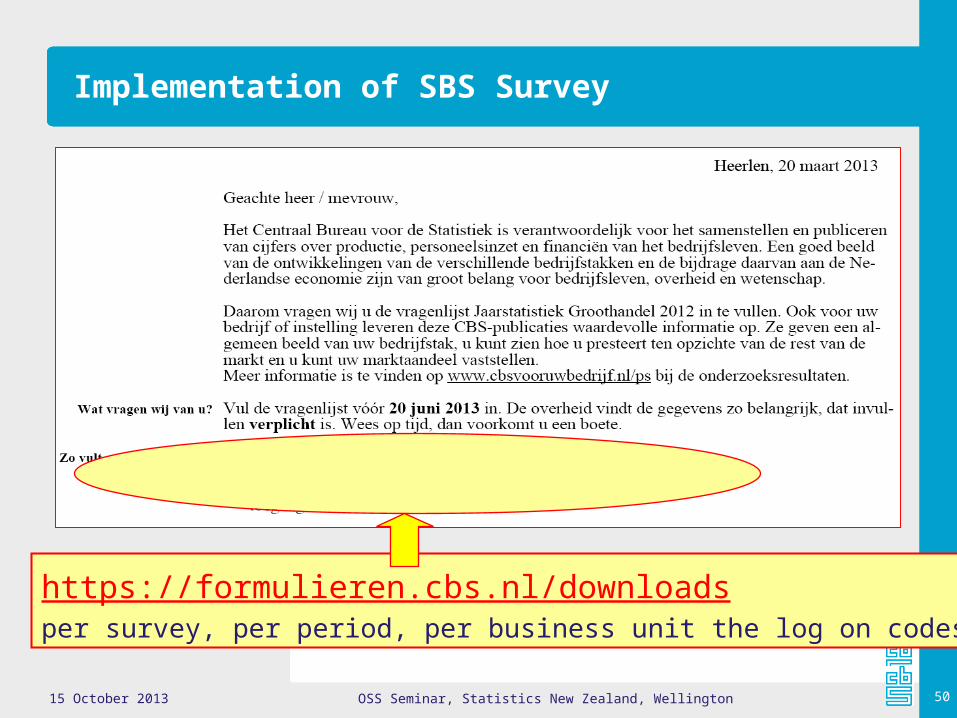
Implementation of SBS Survey
• Running from 2007 onward
• About 75.000 business receive this questionnaire every year
Web take-up rates:• Dutch Annual SBS, 2007: 84 %
Total response rate did not change (80%)• Dutch average 2008: 51% 3 largest Dutch business surveys (2008): 77
%(STS: 63%, SBS: 80%, Intrastat: 100%)
15 October 2013 50OSS Seminar, Statistics New Zealand, Wellington
https://formulieren.cbs.nl/downloadsper survey, per period, per business unit the log on codes
Implementation of SBS Survey

15 October 2013 51OSS Seminar, Statistics New Zealand, Wellington
The portal http://formulieren.cbs.nl
15 October 2013 52OSS Seminar, Statistics New Zealand, Wellington
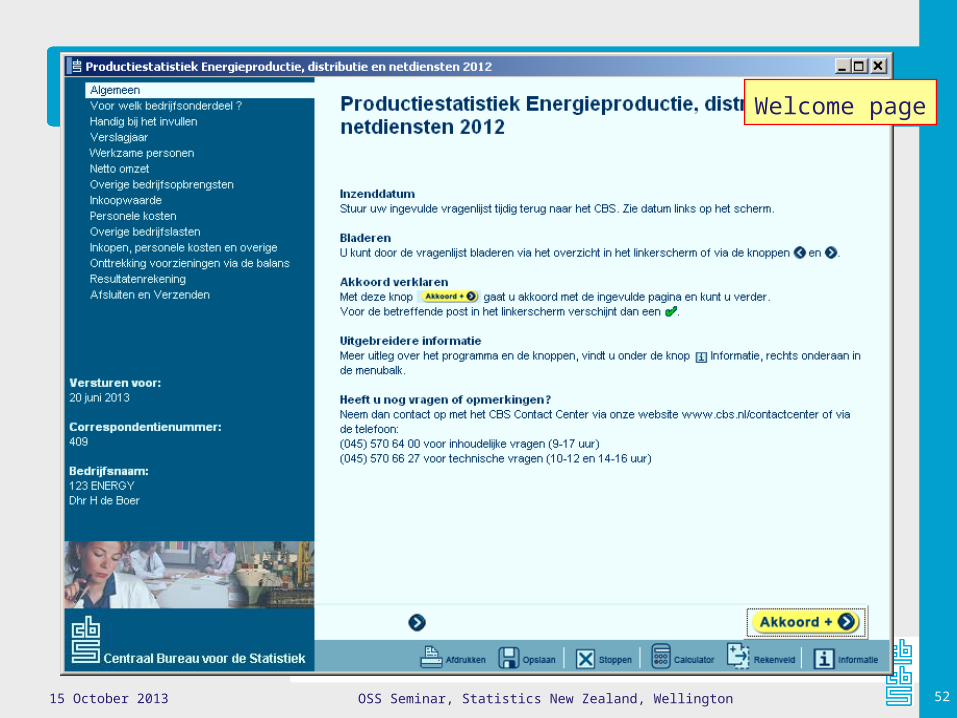
Welcome page
15 October 2013 53OSS Seminar, Statistics New Zealand, Wellington
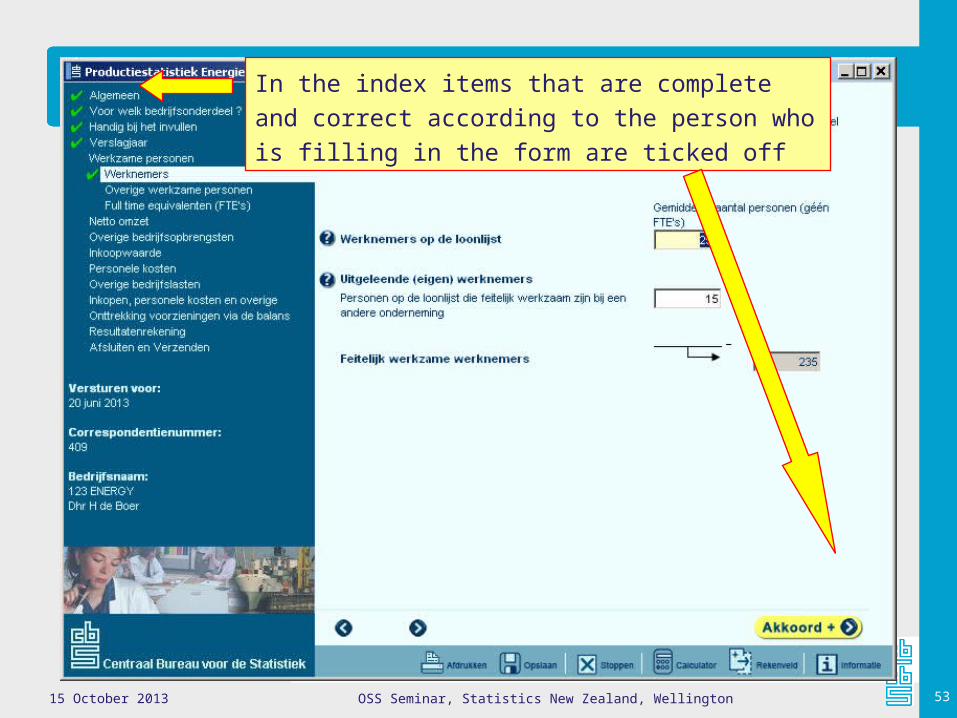
In the index items that are complete and correct
according to the person who is filling in the form are
ticked off
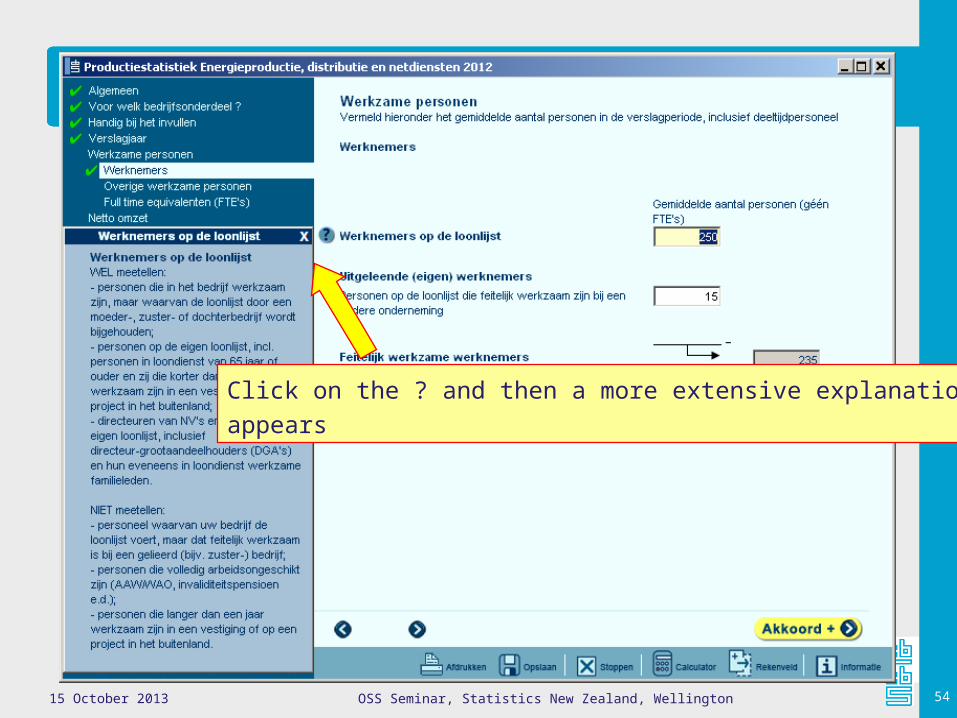
15 October 2013 54OSS Seminar, Statistics New Zealand, Wellington
Click on the ? and then a more extensive explanation
appears

15 October 2013 55OSS Seminar, Statistics New Zealand, Wellington
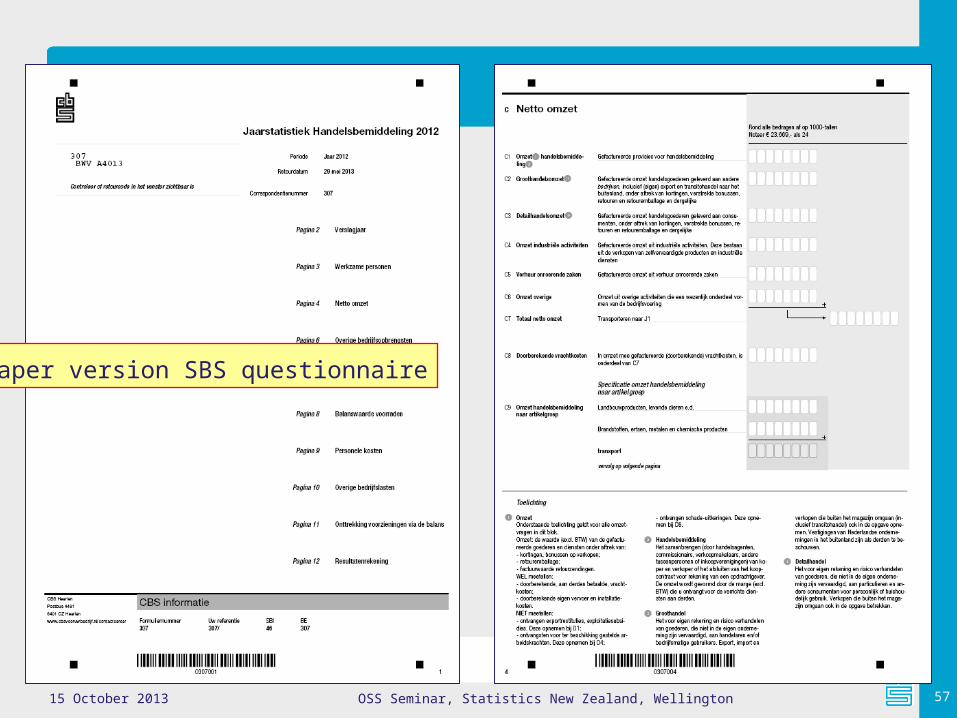
Print of the SBS questionnaire

15 October 2013 56OSS Seminar, Statistics New Zealand, Wellington
The confirmation of receipt
15 October 2013 57OSS Seminar, Statistics New Zealand, Wellington
Paper version SBS questionnaire
15 October 2013 58OSS Seminar, Statistics New Zealand, Wellington
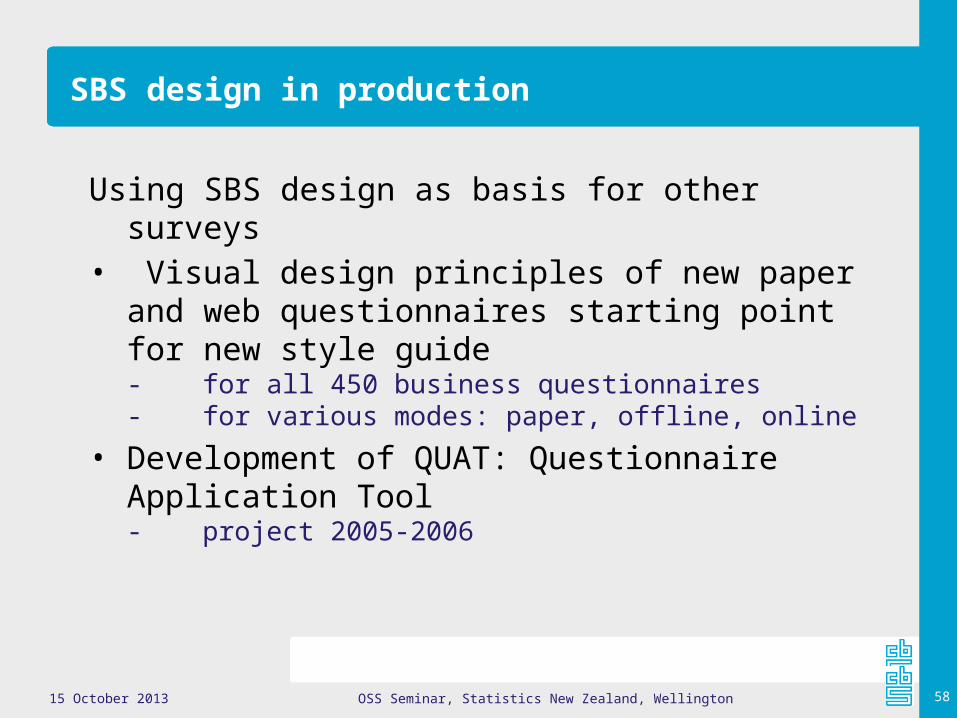
SBS design in production
Using SBS design as basis for other surveys• Visual design principles of new paper and
web questionnaires starting point for new style guide- for all 450 business questionnaires- for various modes: paper, offline, online
• Development of QUAT: Questionnaire Application Tool- project 2005-2006

15 October 2013 59OSS Seminar, Statistics New Zealand, Wellington
SBS design in production
Questionnaire Application Tool (QUAT): • Generic Tool for generating questionnaires:
- Editing of questionnaires, letters, and attachments - Uses data bases of populations and variables - Allows for tailored questionnaires, per stratum - Allows for generating questionnaires in mixed-mode
design: paper, online, offline
- Based on one set of visual design principles for each mode
• Uniform corporate identity concerning questionnaires and letters (one look-and-feel)
• Input coordination with regard to variables and classifications
• QUAT planner: for planning the dispatching of Qs

15 October 2013 61OSS Seminar, Statistics New Zealand, Wellington
SBS design in production
• SBS design still in production• But, offline system is out of date:
- runs only on Windows PC – lot of complaints from Apple users- Software to be downloaded – no open source software
• QUAT is still running• New system to be developed, on the same
principles

15 October 2013 62OSS Seminar, Statistics New Zealand, Wellington
Overview
1. Overview of developments at Statistics Netherlands:a. Electronic data collectionb. Organising data collection and data sharing
2. Case study: Moving the Structural Business Survey to the weba. Developing and testing the questionnaireb. Communication strategy to launch the survey and improving web-take up ratesc. Implementation of the survey
Lessons learned and challenges3. Looking into the future: future challenges
15 October 2013 63OSS Seminar, Statistics New Zealand, Wellington
Future challenges for statistics
Global developments:
• Emergence of the information society• Globalization• Shift in the balance of power between NSIs and
businesses
• Erikson, Haraldsen & Snijkers, 2012, UNECE Seminar, Geneva
• Snijkers & Haraldsen, 2013, BLUE-ETS final Conference, Brussels

15 October 2013 64OSS Seminar, Statistics New Zealand, Wellington
Challenges in modernising statistics
Based on global developments and data coll. strategy:
• Expanding usage of registers- data sharing and data warehousing- assessing quality of register-based statistics
• Blending designed and organic data - data integration theories
• Modernising current business survey designs- tailoring design to the business context, including
collecting data from globalised establishments- using paradata - adopting a communication perspective:
“Improving the Respondent Experience”
• Producing statistics in a globalized world- developing new statistical indicators- market position of an NSI?
15 October 2013 65OSS Seminar, Statistics New Zealand, Wellington
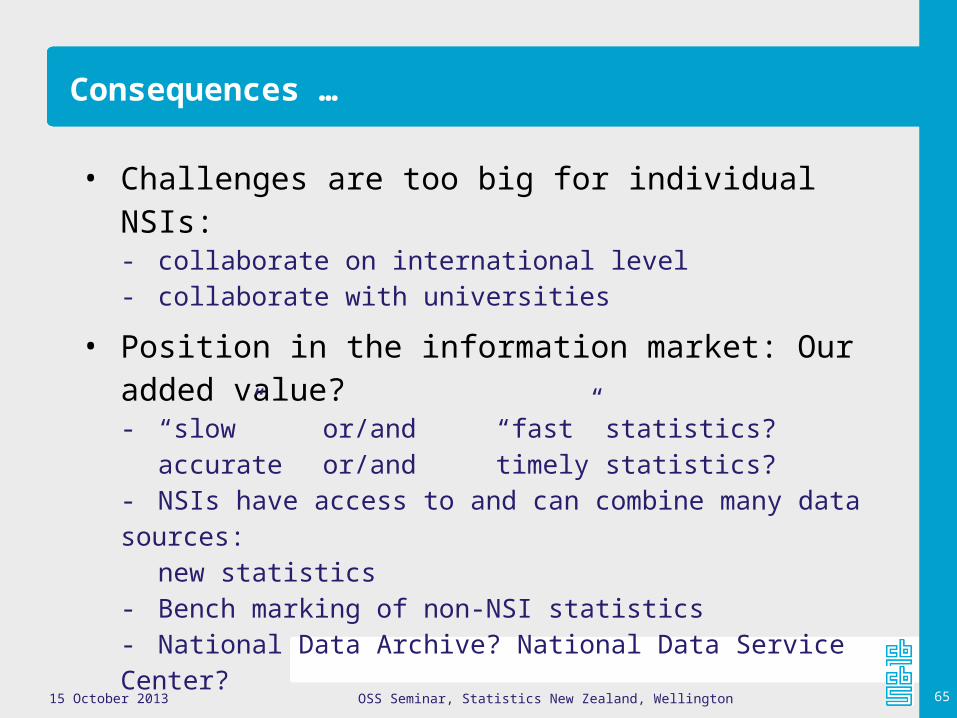
Consequences …
• Challenges are too big for individual NSIs:- collaborate on international level- collaborate with universities
• Position in the information market: Our added value? - “slow” or/and “fast” statistics?
accurate or/and timely statistics?- NSIs have access to and can combine many data sources: new statistics- Bench marking of non-NSI statistics- National Data Archive? National Data Service Center?

15 October 2013 66OSS Seminar, Statistics New Zealand, Wellington
Future challenges for statistics
Two final statements:
We are at the beginning of a new era in statistics production:
The era of data integration
Are we moving too slow?
The future is already here!
15 October 2013 67OSS Seminar, Statistics New Zealand, Wellington
References
• Beukenhorst, D.J., and D. Giesen, 2010, Internet Surveys at Statistics Netherlands. Paper presented at the 2nd International Workshop on Internet Survey Methods, Statistics Korea, 8-9 september 2010, Deajon, South korea.
• Haraldsen, G., and M. Couper, 2013, How to Design Effective Business Web Surveys, Course at the Nordic Meeting, 14 August 2013.
• Haraldsen. G., and G. Snijkers, 2013, Modernisation and Quality of Business Statistics: The NSI Perspective. Paper presented at the 3rd European Establishment Statistics Workshop, 9-11 September 2013, Nuremberg, Germany.
• Groves, R.M. (2011), Three Eras of Survey Research. Public Opinion Quarterly, Vol. 75, pp. 861-871.
• Erikson, J., G. Haraldsen, and G. Snijkers, 2012, The Future of Statistical Data Collection? Challenges and Opportunities. Paper presented at the UNECE Seminar on New Frontiers for Statistical Data Collection, 31 October-2 November 2012, Geneva, Switzerland.

15 October 2013 68OSS Seminar, Statistics New Zealand, Wellington
References
• Snijkers, G., H. Haraldsen, J. Jones, and D. Willimack, 2013, Designing and Conducting Business Surveys. Wiley, Hoboken.
• Snijkers, G., H. Hermans, and R. Göttgens, 2011, Data Collection and Sharing at Statistics Netherlands, Paper presented at the CES meeting, 14-16 June 2011, UNECE Geneva, Switzerland.
• Snijkers, G., E. Onat, E., and r. Vis-Visschers, 2007, The annual structural business survey: Developing and testing an electronic form, Proceedings of the 3rd International Conference on Establishment Surveys (ICES-III), Montreal, June 18–21, American Statistical Association, Alexandria, VA, pp. 456–463.
• Wieling, M., 2013, Electronic business questionnaires at Statistics Netherlands, Presentation at Statistics Netherlands for guests from Statistics Canada, 7 June 2013, Heerlen, Netherlands
Related Documents