RESEARCH ARTICLE Collapse ofa Planktothrix agardhii perennial bloom and microcystin dynamics in response to reduced phosphate concentrations in a temperate lake Arnaud Catherine 1 , Catherine Quiblier 1,2 , Claude Y ´ epr ´ emian 1 , Patrice Got 3 , Alexis Groleau 4 , Brigitte Vinc ¸on-Leite 5 ,C´ ecile Bernard 1 & Marc Troussellier 3 1 USM 505/EA 4105 ‘E ´ cosyste ` mes et interactions toxiques’, Mus ´ eum National d’Histoire Naturelle, Paris, France; 2 Universit ´ e Paris 7, Paris, France; 3 UMR- CNRS 5119 ‘Laboratoire E ´ cosyste ` mes Lagunaires’, Universit ´ e Montpellier II, Montpellier, France; 4 UMR-CNRS 7154 IPGP, Universit´ e Paris 7 and IPGP, Paris, France; and 5 Centre d’Enseignement et de Recherche sur l’Eau, la Ville et l’Environnement (CEREVE), Ecole Nationale des Ponts et Chauss ´ ees, Marne-la-Vall ´ ee, France Correspondence: C´ ecile Bernard, USM 505/ EA 4105 E ´ cosyste ` mes et interactions toxiques, Mus ´ eum National d’Histoire Naturelle, 57, rue Cuvier, Case 39, 75231 Paris, Cedex 05, France. Tel.: 133 1 40 79 31 83; fax: 133 1 40 79 35 94; e-mail: [email protected] Received 20 July 2007; revised 6 March 2008; accepted 15 March 2008. First published online 6 May 2008. DOI:10.1111/j.1574-6941.2008.00494.x Editor: Riks Laanbroek Keywords Planktothrix agardhii ; pico- and nanophytoplankton; shallow lake; statistical modeling; microcystin. Abstract Planktothrix agardhii dynamics, microcystin concentration and limnological variables were monitored every 2 weeks for 2 years (2004–2006) in a shallow hypereutrophic artificial lake (BNV, Viry-Cha ˆtillon, France). Time-series analysis identified two components in the P. agardhii biomass dynamics: (1) a significant decreasing trend in P. agardhii biomass (65% of the overall variance) and (2) a residual component without significant seasonal periodicity. A path-analysis model was built to determine the main factors controlling the P. agardhii dynamics over the period studied. The model explained 66% of P. agardhii biomass changes. The decreasing trend in P. agardhii biomass was significantly related to a decrease in the PO 4 3 concentration resulting from an improved treatment of the incoming watershed surface water. The residual component was related to zooplankton dynamics (cyclopoid abundances), supporting the hypothesis of a top-down control of P. agardhii, but only when the biomass was low. Forty-nine percent of the variability in the microcystin (MC) concentration (min: o 0.1 mg equiva- lent MC-LR L 1 ; max: 7.4 mg equivalent MC-LR L 1 ) could be explained by changes in the P. agardhii biomass. The highest toxin content was observed when P. agardhii biomass was the lowest, which suggests changes in the proportion of microcystin-producing and -nonproducing subpopulations and/or the physiolo- gical status of cells. Introduction Cyanobacterial blooms cause health and environmental concerns (Chorus, 2005). Planktothrix agardhii appears to be one of the most potentially toxic cyanobacterial species in European waters (No ˜ges & Ott, 2003; Willame et al., 2005). A recent study of health risks linked to the presence of cyanobacteria in French surface waters (Levi et al., 2006) showed that P. agardhii was one of the most frequently encountered genera (46% of 1699 samples). Planktothrix agardhii blooms were often associated with the detection of large amounts of microcystin (MC) and toxicity in various biological models (for a review, see Wiegand & Pflugmacher, 2005). The effects of P. agardhii toxic blooms on human health were shown by Codd et al. (1999). The increase of the occurrence, dominance and bloom of potentially toxic cyanobacteria in the continental waters has been recognized as a direct consequence of the eutrophica- tion of these ecosystems. Over the past 10 years, it has been shown that efforts to reduce eutrophication (oligotrophica- tion) of continental aquatic ecosystems could be successful in reducing noxious cyanobacterial populations, such as P. agardhii (Keto & Tallberg, 2000; Kangro et al., 2005; K¨ ohler et al., 2005). The multifactorial control of P. agardhii dynamics and toxicity has been evidenced by various in vitro studies on P. agardhii strains. They mainly focused on the effects of FEMS Microbiol Ecol 65 (2008) 61–73 c 2008 Federation of European Microbiological Societies Published by Blackwell Publishing Ltd. All rights reserved

Welcome message from author
This document is posted to help you gain knowledge. Please leave a comment to let me know what you think about it! Share it to your friends and learn new things together.
Transcript
R E S E A R C H A R T I C L E
CollapseofaPlanktothrixagardhii perennial bloomandmicrocystindynamics in response to reduced phosphate concentrations inatemperate lakeArnaud Catherine1, Catherine Quiblier1,2, Claude Yepremian1, Patrice Got3, Alexis Groleau4,Brigitte Vincon-Leite5, Cecile Bernard1 & Marc Troussellier3
1USM 505/EA 4105 ‘Ecosystemes et interactions toxiques’, Museum National d’Histoire Naturelle, Paris, France; 2Universite Paris 7, Paris, France; 3UMR-
CNRS 5119 ‘Laboratoire Ecosystemes Lagunaires’, Universite Montpellier II, Montpellier, France; 4UMR-CNRS 7154 IPGP, Universite Paris 7 and IPGP,
Paris, France; and 5Centre d’Enseignement et de Recherche sur l’Eau, la Ville et l’Environnement (CEREVE), Ecole Nationale des Ponts et Chaussees,
Marne-la-Vallee, France
Correspondence: Cecile Bernard, USM 505/
EA 4105 Ecosystemes et interactions
toxiques, Museum National d’Histoire
Naturelle, 57, rue Cuvier, Case 39, 75231
Paris, Cedex 05, France. Tel.: 133 1 40 79 31
83; fax: 133 1 40 79 35 94; e-mail:
Received 20 July 2007; revised 6 March 2008;
accepted 15 March 2008.
First published online 6 May 2008.
DOI:10.1111/j.1574-6941.2008.00494.x
Editor: Riks Laanbroek
Keywords
Planktothrix agardhii ; pico- and
nanophytoplankton; shallow lake; statistical
modeling; microcystin.
Abstract
Planktothrix agardhii dynamics, microcystin concentration and limnological
variables were monitored every 2 weeks for 2 years (2004–2006) in a shallow
hypereutrophic artificial lake (BNV, Viry-Chatillon, France). Time-series analysis
identified two components in the P. agardhii biomass dynamics: (1) a significant
decreasing trend in P. agardhii biomass (65% of the overall variance) and (2) a
residual component without significant seasonal periodicity. A path-analysis
model was built to determine the main factors controlling the P. agardhii dynamics
over the period studied. The model explained 66% of P. agardhii biomass changes.
The decreasing trend in P. agardhii biomass was significantly related to a decrease
in the PO43� concentration resulting from an improved treatment of the incoming
watershed surface water. The residual component was related to zooplankton
dynamics (cyclopoid abundances), supporting the hypothesis of a top-down
control of P. agardhii, but only when the biomass was low. Forty-nine percent of
the variability in the microcystin (MC) concentration (min:o 0.1 mg equiva-
lent MC-LR L�1; max: 7.4mg equivalent MC-LR L�1) could be explained by changes
in the P. agardhii biomass. The highest toxin content was observed when
P. agardhii biomass was the lowest, which suggests changes in the proportion of
microcystin-producing and -nonproducing subpopulations and/or the physiolo-
gical status of cells.
Introduction
Cyanobacterial blooms cause health and environmental
concerns (Chorus, 2005). Planktothrix agardhii appears to
be one of the most potentially toxic cyanobacterial species
in European waters (Noges & Ott, 2003; Willame et al.,
2005). A recent study of health risks linked to the presence
of cyanobacteria in French surface waters (Levi et al.,
2006) showed that P. agardhii was one of the most
frequently encountered genera (46% of 1699 samples).
Planktothrix agardhii blooms were often associated with
the detection of large amounts of microcystin (MC) and
toxicity in various biological models (for a review, see
Wiegand & Pflugmacher, 2005). The effects of P. agardhii
toxic blooms on human health were shown by Codd
et al. (1999).
The increase of the occurrence, dominance and bloom of
potentially toxic cyanobacteria in the continental waters has
been recognized as a direct consequence of the eutrophica-
tion of these ecosystems. Over the past 10 years, it has been
shown that efforts to reduce eutrophication (oligotrophica-
tion) of continental aquatic ecosystems could be successful
in reducing noxious cyanobacterial populations, such as
P. agardhii (Keto & Tallberg, 2000; Kangro et al., 2005;
Kohler et al., 2005).
The multifactorial control of P. agardhii dynamics and
toxicity has been evidenced by various in vitro studies on
P. agardhii strains. They mainly focused on the effects of
FEMS Microbiol Ecol 65 (2008) 61–73 c� 2008 Federation of European Microbiological SocietiesPublished by Blackwell Publishing Ltd. All rights reserved
nutrients (e.g. Ahlgren, 1977; Sivonen, 1990; Znachor et al.,
2006), temperature (Robarts & Zohary, 1987; Sivonen,
1990), light (Sivonen, 1990) and zooplankton (e.g. Davido-
wicz et al., 1988; Weithoff & Walz, 1995). While in vitro
studies may help to determine the ecophysiological or
ecotoxicological characteristics of the strains studied and
allow comparing them with other species, only in situ
approaches can show the relative effects of multifactorial
control on natural populations. However, although a large
number of field surveys of P. agardhii have been carried out
and limnological characteristics of different lakes have been
determined, very few studies used numerical analysis, such
as statistical or dynamic models, to detect and quantify the
relationships between P. agardhii and environmental vari-
ables. The dynamic simulation model of Oscillatoria agard-
hii in Lake Vechten proposed by Montealegre et al. (1995)
appears to be the only example of modeling P. agardhii
dynamics in situ. Statistical models were recently shown to
be very useful for linking both Microcystis and Anabaena
biomass dynamics, and microcystin concentrations to en-
vironmental changes in Quebec lakes (Rolland et al., 2005).
As P. agardhii can produce microcystins and thus cause
health concerns, numerical analyses are needed to improve
the understanding of the in situ controlling factors of
P. agardhii dynamics in different lakes. It is still unclear
whether the same factors regulate the biomass of P. agardhii
or whether the factors are rather site specific. Finding out
more about these factors and their relative importance is
a first step in drawing up numerical models able to simulate
P. agardhii dynamics and proposing management strategies
to reduce the spread of blooms.
The artificial lake at Viry-Chatillon (BNV) located South
of Paris is used for leisure activities and was shown to be
interesting to further explore both the P. agardhii dynamics
and its links with limnological characteristics and micro-
cystin concentrations (Briand et al., 2002; Yepremian et al.,
2007). These studies showed (1) the strong dominance
of the phytoplankton community by P. agardhii, (2) the
associated in situ microcystin concentrations, and (3) the
diversity of microcystin variants produced by strains iso-
lated from this ecosystem. A survey was carried out every 2
weeks between 2004 and 2006 to analyze and model the
dynamics of P. agardhii in this ecosystem. Conventional
time-series analysis and path analysis were used. These
statistical analyses are an intermediate approach between
dynamics and multiple regression modeling (Legendre &
Legendre, 1998). Simultaneous related changes in other
phytoplanktonic groups (pico- and nanophytoplankton)
were also studied. Finally, P. agardhii dynamics, microcystin
concentrations and cellular microcystin content were com-
pared to estimate the usefulness of the P. agardhii biomass
as a predictor of microcystin concentration in the BNV
ecosystem.
Materials and methods
Study site and sampling procedure
This study was carried out in the ‘Base Nautique de Viry-
Chatillon’ (BNV), a water sports center located
(2123004.200E, 48140003.300N) in the south suburban area of
Paris (France). It is a shallow artificial lake (mean depth:
2.8 m; 98 ha) that receives both diffuse and point source
inputs from an 810 ha watershed. The main point source
input is a rainfall collector, located on the south shore of the
lake collecting untreated surface water from a 430 ha sub-
basin. In 2003, an in-line treatment plant was added to the
rainfall collector to improve the quality of the outflow water
released into the BNV. This comprised filtration (3 mm),
flotation and decantation to limit the discharge of sus-
pended solids.
The sampling campaign was carried out every 2 weeks
between March 23, 2004 and March 21, 2006. Three
replicate samples were taken 0.5 m below the water surface
at a distance of c. 3 m.
Meteorological variables
Data were obtained for total solar radiation (average
between two sampling date) and wind speed at 10-m height
(averaged over the 72 h before sampling) from the Orly
airport meteorological station (Meteo-France), 6 km far
from the study site.
Physical and chemical variables
Water temperature, dissolved oxygen andconductivity
Water temperature was measured every 10 min using an in
situ thermistor chain (four SEAMON-MINI electronic tem-
perature recorders, accuracy 0.05 1C, Hugrun Inc., Reykja-
vik, Iceland). The average surface temperature over the
period between two sampling dates was then calculated.
Dissolved oxygen and conductivity were measured at
each sampling date using a multiparameter Sea-Bird SBE
19 Seacat Profiler (Sea-Bird Electronics Inc., WA).
Chemical analysis
The samples used to quantify dissolved nutrients were
immediately filtered using a cellulose acetate 0.22-mm syr-
inge filter (Nalgene, Rochester, NY). Ammonium (NH41)
and orthophosphate (PO43�) analyses were carried out on the
day of sampling using a spectrophotometric method as
described previously (Greenberg et al., 1999). The detection
limits were 1 mM for NH41 and 0.1 mM for PO4
3�. The nitrate
(NO3�) concentration was measured using a DX600 ion
FEMS Microbiol Ecol 65 (2008) 61–73c� 2008 Federation of European Microbiological SocietiesPublished by Blackwell Publishing Ltd. All rights reserved
62 A. Catherine et al.
chromatograph (Dionex Corp., Westmont, IL) equipped
with an AS14 IonPack analytical column (Dionex Corp.).
The detection limit was 0.85 mM.
Raw water was also collected in acid-washed polyethylene
containers for total phosphorus (TP) analysis using a
spectrophotometric method following acid digestion as
described previously (AFNOR, 1982), allowing a detection
limit of 0.4mM.
Biological variables
Chlorophyll a (Chl a ) concentration
The Chl a concentration was measured by filtering 300 mL
of water (Whatman GF-C filters), followed by methanol
extraction (Talling & Driver, 1963) and analysis with a Cary
50 Scan spectrophotometer (Varian Inc., Palo Alto).
Phytoplankton communities
The microphytoplankton species (420 mm) were deter-
mined using samples fixed in buffered formaldehyde (5%
v/v for high biomass species) or Lugol (for low biomass
species) as described previously (Yepremian et al., 2007).
The microphytoplankton units were counted using a Malas-
sez counting chamber with a Nikon Optiphot 2 microscope
(� 400, Nikon, Melville) or a Utermohl chamber (Lund,
1951) with an Olympus CK2 inverted microscope (� 400,
Olympus Optical Co., Tokyo, Japan) for low phytoplankton
biomass. At least 400 phytoplankton units (cells, trichomes,
colonies) were counted to reduce the estimation error to
o 10%. The biovolumes of each species were estimated as
described by Sun & Liu (2003). The wet weight biomass was
calculated from biovolume estimates, assuming that the
phytoplankton cells had a density of 1 g cm�3.
Nano- (2–20 mm) and picophytoplankton (� 2 mm) cells
were detected and counted by flow cytometry as described
previously (Troussellier et al., 1993; Campbell et al., 1994;
Crosbie et al., 2003). Analyses were performed using a
FACSCalibur flow cytometer (Becton Dickinson, San Jose,
CA) with an air-cooled argon laser (488 nm, 15 mW).
Subsamples were fixed with buffered formalin (2.5% v/v)
and stored immediately in liquid nitrogen until analysis.
Cells excited at 488 nm were detected and counted using
their right-angle light scattering (RALS) properties and their
orange (585/42 nm filter) and red (4650 nm filter) fluores-
cence from phycoerythrin and chlorophyll pigments, respec-
tively. For each analysis, fluorescent beads (1, 2, 6, 10, 20mm,
Polysciences Inc., Warrington, PA) were systematically
added to each sample to standardize the flow cytometer
settings. Cell abundances were estimated by adding a known
volume of fluorescent beads (True-Counts, Becton Dickin-
son) with known concentration.
Zooplankton communities
Zooplankton was collected by filtering 1.5 L of water
through a 60mm mesh and then preserved in a 70%
ethanol solution (Cottenie et al., 2003). Abundances (in-
dividuals L�1) were estimated using an inverted microscope
(Olympus CK2, Olympus Optical Co.) after sample sedi-
mentation. Five major taxonomic groups were distinguished:
rotifers, copepod nauplii (NAC), cyclopoid copepods (CYC),
calanoids copepods and cladocerans (CLA).
Toxicity assays
The cellular microcystin concentrations of the field samples
were estimated using the protein phosphatase 2A inhibition
assay (PP2A) as described previously (Briand et al., 2002).
The results are expressed in micrograms equivalent of MC-
LR L�1. The detection limit was 0.1 mg equivalent MC-
LR L�1 of raw water.
Data analyses
The following successive steps were followed: (1) character-
ization of the components of P. agardhii biomass dynamics
(time-series analyses), (2) identification of the P. agardhii
biomass-controlling factors among the different hypothe-
sized ones (path-analysis modeling) and (3) identification of
the dynamics components-specific controlling factors (cor-
relation analysis between the identified controlling factors
and the components of P. agardhii dynamics).
Time-series analyses were carried out on the 2004–2006
series to identify (1) trends and (2) periodicity, using a linear
regression model and contingency periodogram analysis
(Legendre et al., 1981), respectively.
To identify the P. agardhii biomass-controlling factors, a
path-analysis model (Wright, 1921) was built on the basis of
current knowledge about factors controlling phytoplankton
in lakes, including bottom-up, top-down and physical
forcing variables (Fig. 1a). The model underlying the path
diagram of Fig. 1a was obtained by refining our initial
guesses about the potential interrelations between P. agard-
hii biomass and the other measured variables. For instance,
both NH41 and NO3
� have first been introduced as potential
N sources controlling P. agardhii biomasses; only NH41 was
significantly related to P. agardhii, and thus retained in the
model. Then, in this study, we chose to use PO43� and not TP
as an explanatory variable in the path-analysis model. In our
case, TP can be considered to be a proxy of phytoplankton
biomass as shown by the high correlation coefficient
(r = 0.91, Po 10�4) that can be computed from the dataset.
In addition to this, the expected lack of independency
between these two variables does not allow including TP as
an explanatory variable in a statistical model such as the one
used in this study.
FEMS Microbiol Ecol 65 (2008) 61–73 c� 2008 Federation of European Microbiological SocietiesPublished by Blackwell Publishing Ltd. All rights reserved
63P. agardhii bloom collapse and microcystin dynamics
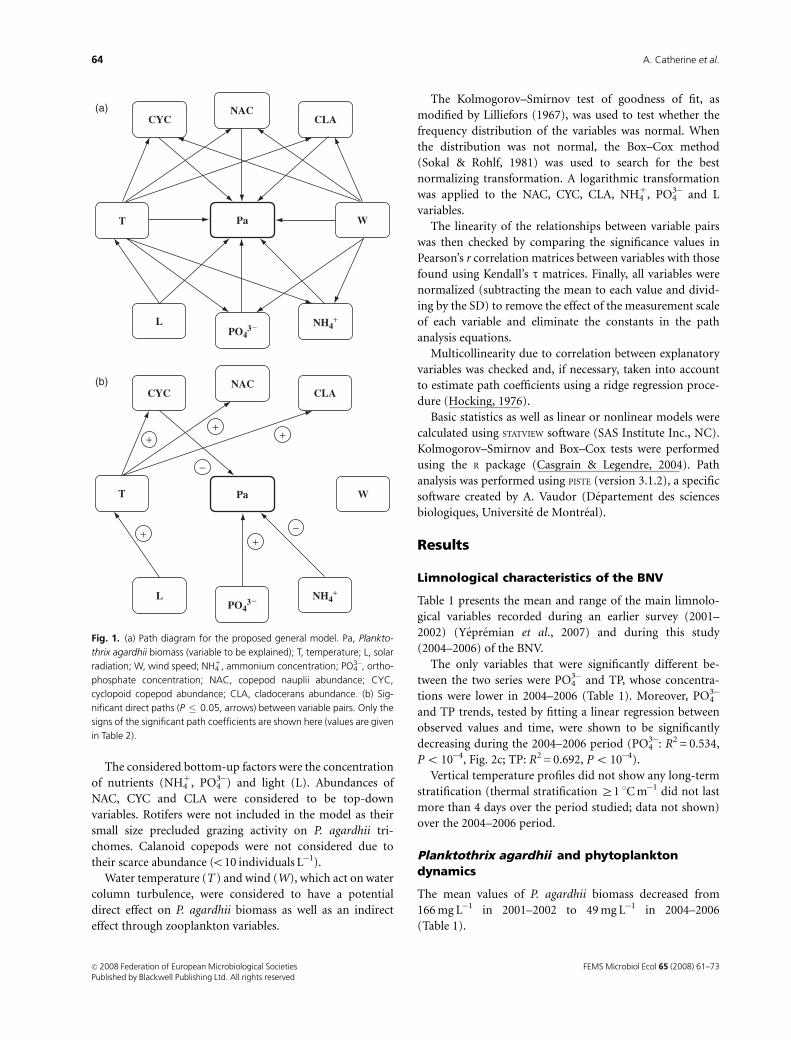
The considered bottom-up factors were the concentration
of nutrients (NH41, PO4
3�) and light (L). Abundances of
NAC, CYC and CLA were considered to be top-down
variables. Rotifers were not included in the model as their
small size precluded grazing activity on P. agardhii tri-
chomes. Calanoid copepods were not considered due to
their scarce abundance (o10 individuals L�1).
Water temperature (T ) and wind (W), which act on water
column turbulence, were considered to have a potential
direct effect on P. agardhii biomass as well as an indirect
effect through zooplankton variables.
The Kolmogorov–Smirnov test of goodness of fit, as
modified by Lilliefors (1967), was used to test whether the
frequency distribution of the variables was normal. When
the distribution was not normal, the Box–Cox method
(Sokal & Rohlf, 1981) was used to search for the best
normalizing transformation. A logarithmic transformation
was applied to the NAC, CYC, CLA, NH41, PO4
3� and L
variables.
The linearity of the relationships between variable pairs
was then checked by comparing the significance values in
Pearson’s r correlation matrices between variables with those
found using Kendall’s t matrices. Finally, all variables were
normalized (subtracting the mean to each value and divid-
ing by the SD) to remove the effect of the measurement scale
of each variable and eliminate the constants in the path
analysis equations.
Multicollinearity due to correlation between explanatory
variables was checked and, if necessary, taken into account
to estimate path coefficients using a ridge regression proce-
dure (Hocking, 1976).
Basic statistics as well as linear or nonlinear models were
calculated using STATVIEW software (SAS Institute Inc., NC).
Kolmogorov–Smirnov and Box–Cox tests were performed
using the R package (Casgrain & Legendre, 2004). Path
analysis was performed using PISTE (version 3.1.2), a specific
software created by A. Vaudor (Departement des sciences
biologiques, Universite de Montreal).
Results
Limnological characteristics of the BNV
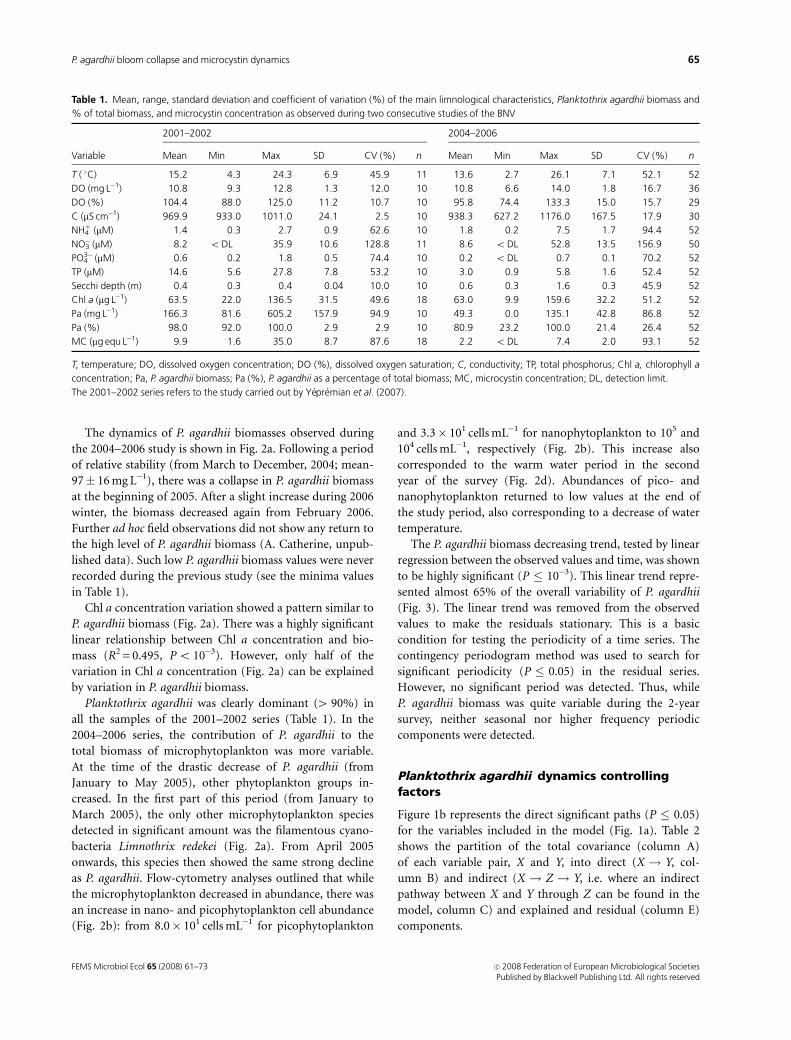
Table 1 presents the mean and range of the main limnolo-
gical variables recorded during an earlier survey (2001–
2002) (Yepremian et al., 2007) and during this study
(2004–2006) of the BNV.
The only variables that were significantly different be-
tween the two series were PO43� and TP, whose concentra-
tions were lower in 2004–2006 (Table 1). Moreover, PO43�
and TP trends, tested by fitting a linear regression between
observed values and time, were shown to be significantly
decreasing during the 2004–2006 period (PO43�: R2 = 0.534,
Po 10�4, Fig. 2c; TP: R2 = 0.692, Po 10�4).
Vertical temperature profiles did not show any long-term
stratification (thermal stratification Z1 1C m�1 did not last
more than 4 days over the period studied; data not shown)
over the 2004–2006 period.
Planktothrix agardhii and phytoplanktondynamics
The mean values of P. agardhii biomass decreased from
166 mg L�1 in 2001–2002 to 49 mg L�1 in 2004–2006
(Table 1).
CYC
CYC
++
+
−
−+
+
CLANAC
Pa WT
L
NAC
Pa
NH4+
PO43−
NH4+
PO43−
T
L
W
CLA
(b)
(a)
Fig. 1. (a) Path diagram for the proposed general model. Pa, Plankto-
thrix agardhii biomass (variable to be explained); T, temperature; L, solar
radiation; W, wind speed; NH41, ammonium concentration; PO4
3�, ortho-
phosphate concentration; NAC, copepod nauplii abundance; CYC,
cyclopoid copepod abundance; CLA, cladocerans abundance. (b) Sig-
nificant direct paths (P � 0.05, arrows) between variable pairs. Only the
signs of the significant path coefficients are shown here (values are given
in Table 2).
FEMS Microbiol Ecol 65 (2008) 61–73c� 2008 Federation of European Microbiological SocietiesPublished by Blackwell Publishing Ltd. All rights reserved
64 A. Catherine et al.
The dynamics of P. agardhii biomasses observed during
the 2004–2006 study is shown in Fig. 2a. Following a period
of relative stability (from March to December, 2004; mean-
97� 16 mg L�1), there was a collapse in P. agardhii biomass
at the beginning of 2005. After a slight increase during 2006
winter, the biomass decreased again from February 2006.
Further ad hoc field observations did not show any return to
the high level of P. agardhii biomass (A. Catherine, unpub-
lished data). Such low P. agardhii biomass values were never
recorded during the previous study (see the minima values
in Table 1).
Chl a concentration variation showed a pattern similar to
P. agardhii biomass (Fig. 2a). There was a highly significant
linear relationship between Chl a concentration and bio-
mass (R2 = 0.495, Po 10�3). However, only half of the
variation in Chl a concentration (Fig. 2a) can be explained
by variation in P. agardhii biomass.
Planktothrix agardhii was clearly dominant (4 90%) in
all the samples of the 2001–2002 series (Table 1). In the
2004–2006 series, the contribution of P. agardhii to the
total biomass of microphytoplankton was more variable.
At the time of the drastic decrease of P. agardhii (from
January to May 2005), other phytoplankton groups in-
creased. In the first part of this period (from January to
March 2005), the only other microphytoplankton species
detected in significant amount was the filamentous cyano-
bacteria Limnothrix redekei (Fig. 2a). From April 2005
onwards, this species then showed the same strong decline
as P. agardhii. Flow-cytometry analyses outlined that while
the microphytoplankton decreased in abundance, there was
an increase in nano- and picophytoplankton cell abundance
(Fig. 2b): from 8.0� 101 cells mL�1 for picophytoplankton
and 3.3� 101 cells mL�1 for nanophytoplankton to 105 and
104 cells mL�1, respectively (Fig. 2b). This increase also
corresponded to the warm water period in the second
year of the survey (Fig. 2d). Abundances of pico- and
nanophytoplankton returned to low values at the end of
the study period, also corresponding to a decrease of water
temperature.
The P. agardhii biomass decreasing trend, tested by linear
regression between the observed values and time, was shown
to be highly significant (P � 10�3). This linear trend repre-
sented almost 65% of the overall variability of P. agardhii
(Fig. 3). The linear trend was removed from the observed
values to make the residuals stationary. This is a basic
condition for testing the periodicity of a time series. The
contingency periodogram method was used to search for
significant periodicity (P � 0.05) in the residual series.
However, no significant period was detected. Thus, while
P. agardhii biomass was quite variable during the 2-year
survey, neither seasonal nor higher frequency periodic
components were detected.
Planktothrix agardhii dynamics controllingfactors
Figure 1b represents the direct significant paths (P � 0.05)
for the variables included in the model (Fig. 1a). Table 2
shows the partition of the total covariance (column A)
of each variable pair, X and Y, into direct (X ! Y, col-
umn B) and indirect (X ! Z ! Y, i.e. where an indirect
pathway between X and Y through Z can be found in the
model, column C) and explained and residual (column E)
components.
Table 1. Mean, range, standard deviation and coefficient of variation (%) of the main limnological characteristics, Planktothrix agardhii biomass and
% of total biomass, and microcystin concentration as observed during two consecutive studies of the BNV
Variable
2001–2002 2004–2006
Mean Min Max SD CV (%) n Mean Min Max SD CV (%) n
T ( 1C) 15.2 4.3 24.3 6.9 45.9 11 13.6 2.7 26.1 7.1 52.1 52
DO (mg L�1) 10.8 9.3 12.8 1.3 12.0 10 10.8 6.6 14.0 1.8 16.7 36
DO (%) 104.4 88.0 125.0 11.2 10.7 10 95.8 74.4 133.3 15.0 15.7 29
C (mS cm�1) 969.9 933.0 1011.0 24.1 2.5 10 938.3 627.2 1176.0 167.5 17.9 30
NH41 (mM) 1.4 0.3 2.7 0.9 62.6 10 1.8 0.2 7.5 1.7 94.4 52
NO3� (mM) 8.2 oDL 35.9 10.6 128.8 11 8.6 oDL 52.8 13.5 156.9 50
PO43� (mM) 0.6 0.2 1.8 0.5 74.4 10 0.2 oDL 0.7 0.1 70.2 52
TP (mM) 14.6 5.6 27.8 7.8 53.2 10 3.0 0.9 5.8 1.6 52.4 52
Secchi depth (m) 0.4 0.3 0.4 0.04 10.0 10 0.6 0.3 1.6 0.3 45.9 52
Chl a (mg L�1) 63.5 22.0 136.5 31.5 49.6 18 63.0 9.9 159.6 32.2 51.2 52
Pa (mg L�1) 166.3 81.6 605.2 157.9 94.9 10 49.3 0.0 135.1 42.8 86.8 52
Pa (%) 98.0 92.0 100.0 2.9 2.9 10 80.9 23.2 100.0 21.4 26.4 52
MC (mg equ L�1) 9.9 1.6 35.0 8.7 87.6 18 2.2 oDL 7.4 2.0 93.1 52
T, temperature; DO, dissolved oxygen concentration; DO (%), dissolved oxygen saturation; C, conductivity; TP, total phosphorus; Chl a, chlorophyll a
concentration; Pa, P. agardhii biomass; Pa (%), P. agardhii as a percentage of total biomass; MC, microcystin concentration; DL, detection limit.
The 2001–2002 series refers to the study carried out by Yepremian et al. (2007).
FEMS Microbiol Ecol 65 (2008) 61–73 c� 2008 Federation of European Microbiological SocietiesPublished by Blackwell Publishing Ltd. All rights reserved
65P. agardhii bloom collapse and microcystin dynamics
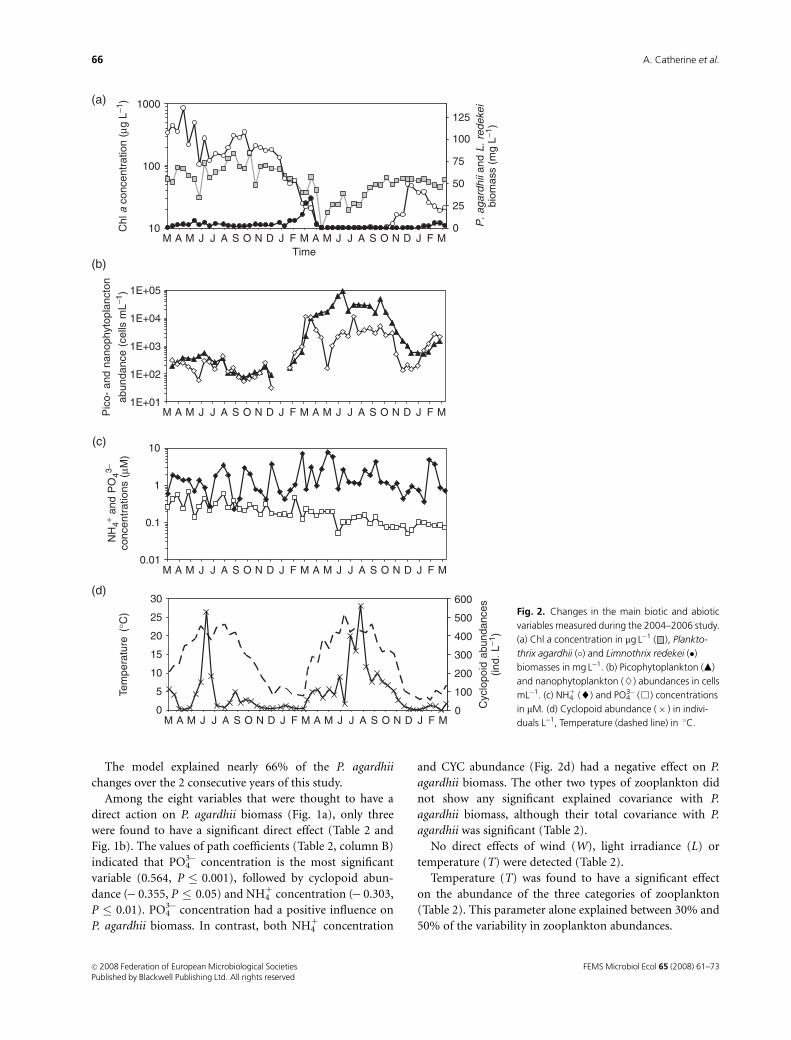
The model explained nearly 66% of the P. agardhii
changes over the 2 consecutive years of this study.
Among the eight variables that were thought to have a
direct action on P. agardhii biomass (Fig. 1a), only three
were found to have a significant direct effect (Table 2 and
Fig. 1b). The values of path coefficients (Table 2, column B)
indicated that PO43� concentration is the most significant
variable (0.564, P � 0.001), followed by cyclopoid abun-
dance (� 0.355, P � 0.05) and NH41 concentration (� 0.303,
P � 0.01). PO43� concentration had a positive influence on
P. agardhii biomass. In contrast, both NH41 concentration
and CYC abundance (Fig. 2d) had a negative effect on P.
agardhii biomass. The other two types of zooplankton did
not show any significant explained covariance with P.
agardhii biomass, although their total covariance with P.
agardhii was significant (Table 2).
No direct effects of wind (W), light irradiance (L) or
temperature (T) were detected (Table 2).
Temperature (T) was found to have a significant effect
on the abundance of the three categories of zooplankton
(Table 2). This parameter alone explained between 30% and
50% of the variability in zooplankton abundances.
(a)
10
100
1000
M A M J S O N D J F M A M J J S O N D J MTime
0
25
50
75
100
125
FAJ A
(b)
1E+01
1E+02
1E+03
1E+04
1E+05
M A M J S O N D J F M A M J J S O N D J MFAJ A
(c)
0.01
0.1
1
10
M A M J S O N D J F M A M J J S O N D J MFAJ A
(d)
0
5
10
15
20
25
30
Tem
pera
ture
(°C
)
0
100
200
300
400
500
600
M A M J S O N D J F M A M J J S O N D J MFAJ A
Fig. 2. Changes in the main biotic and abiotic
variables measured during the 2004–2006 study.
(a) Chl a concentration in mg L�1 ( ), Plankto-
thrix agardhii (�) and Limnothrix redekei (�)biomasses in mg L�1. (b) Picophytoplankton (m)
and nanophytoplankton (}) abundances in cells
mL�1. (c) NH41 (~) and PO4
3� (&) concentrations
in mM. (d) Cyclopoid abundance (� ) in indivi-
duals L�1, Temperature (dashed line) in 1C.
FEMS Microbiol Ecol 65 (2008) 61–73c� 2008 Federation of European Microbiological SocietiesPublished by Blackwell Publishing Ltd. All rights reserved
66 A. Catherine et al.
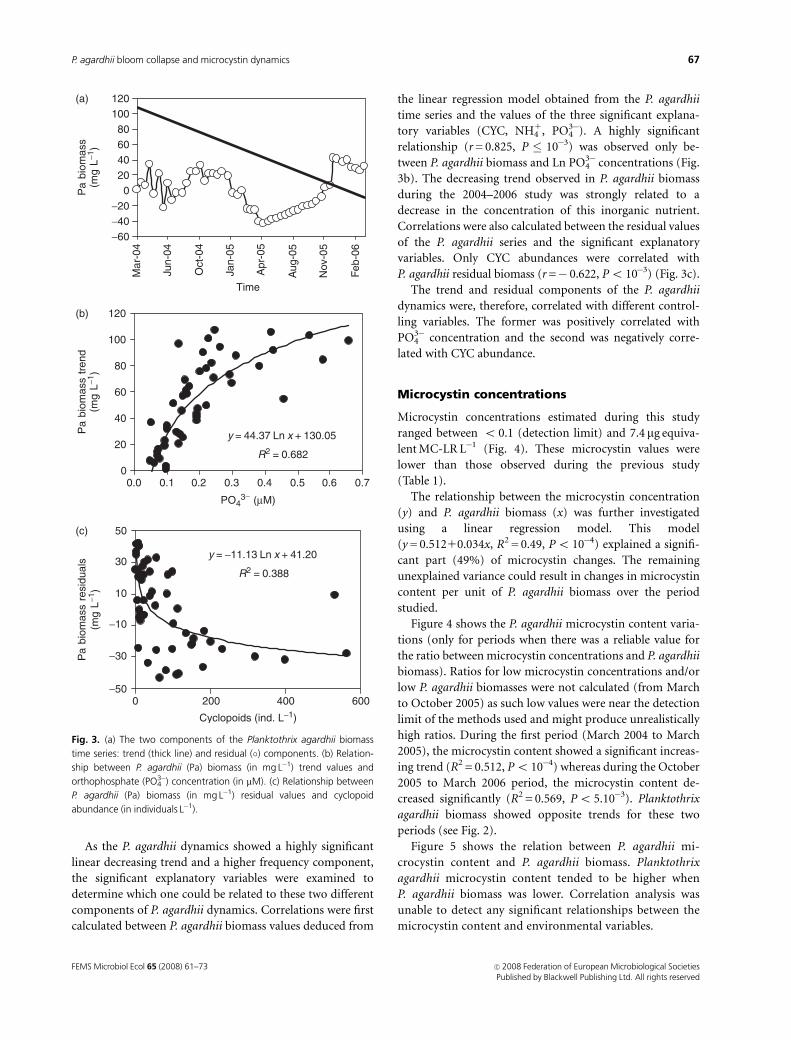
As the P. agardhii dynamics showed a highly significant
linear decreasing trend and a higher frequency component,
the significant explanatory variables were examined to
determine which one could be related to these two different
components of P. agardhii dynamics. Correlations were first
calculated between P. agardhii biomass values deduced from
the linear regression model obtained from the P. agardhii
time series and the values of the three significant explana-
tory variables (CYC, NH41, PO4
3�). A highly significant
relationship (r = 0.825, P � 10�3) was observed only be-
tween P. agardhii biomass and Ln PO43� concentrations (Fig.
3b). The decreasing trend observed in P. agardhii biomass
during the 2004–2006 study was strongly related to a
decrease in the concentration of this inorganic nutrient.
Correlations were also calculated between the residual values
of the P. agardhii series and the significant explanatory
variables. Only CYC abundances were correlated with
P. agardhii residual biomass (r =� 0.622, Po 10�3) (Fig. 3c).
The trend and residual components of the P. agardhii
dynamics were, therefore, correlated with different control-
ling variables. The former was positively correlated with
PO43� concentration and the second was negatively corre-
lated with CYC abundance.
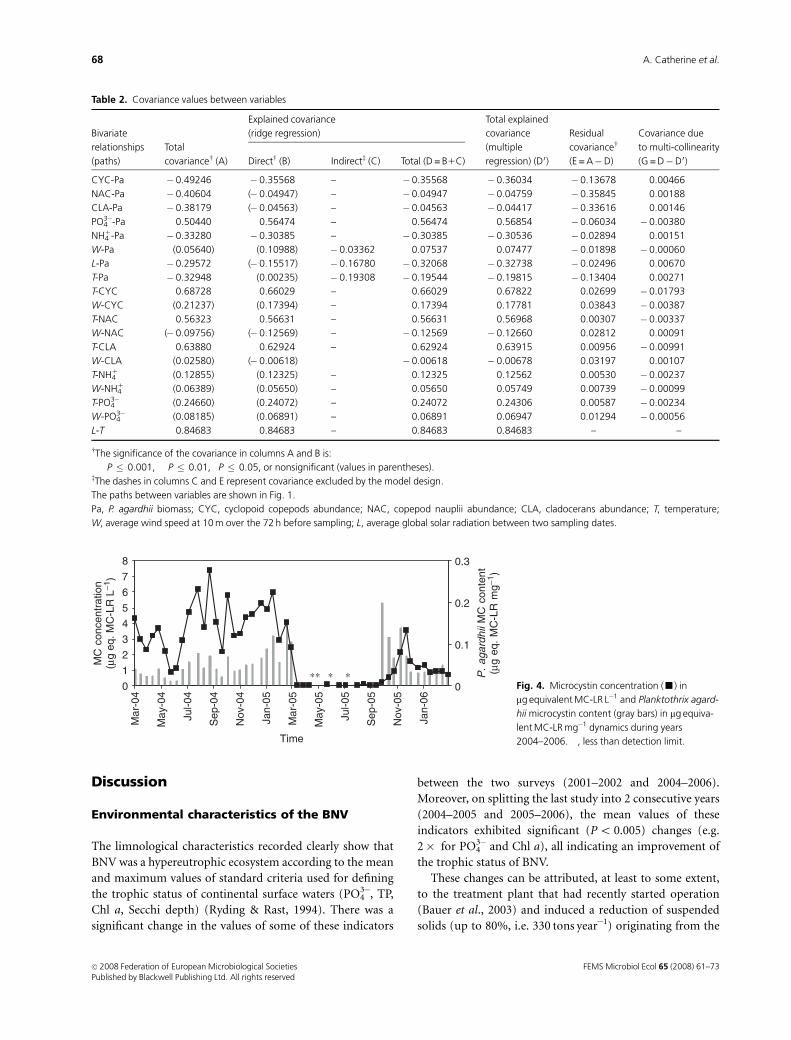
Microcystin concentrations
Microcystin concentrations estimated during this study
ranged between o 0.1 (detection limit) and 7.4 mg equiva-
lent MC-LR L�1 (Fig. 4). These microcystin values were
lower than those observed during the previous study
(Table 1).
The relationship between the microcystin concentration
(y) and P. agardhii biomass (x) was further investigated
using a linear regression model. This model
(y = 0.51210.034x, R2 = 0.49, Po 10�4) explained a signifi-
cant part (49%) of microcystin changes. The remaining
unexplained variance could result in changes in microcystin
content per unit of P. agardhii biomass over the period
studied.
Figure 4 shows the P. agardhii microcystin content varia-
tions (only for periods when there was a reliable value for
the ratio between microcystin concentrations and P. agardhii
biomass). Ratios for low microcystin concentrations and/or
low P. agardhii biomasses were not calculated (from March
to October 2005) as such low values were near the detection
limit of the methods used and might produce unrealistically
high ratios. During the first period (March 2004 to March
2005), the microcystin content showed a significant increas-
ing trend (R2 = 0.512, Po 10�4) whereas during the October
2005 to March 2006 period, the microcystin content de-
creased significantly (R2 = 0.569, Po 5.10�3). Planktothrix
agardhii biomass showed opposite trends for these two
periods (see Fig. 2).
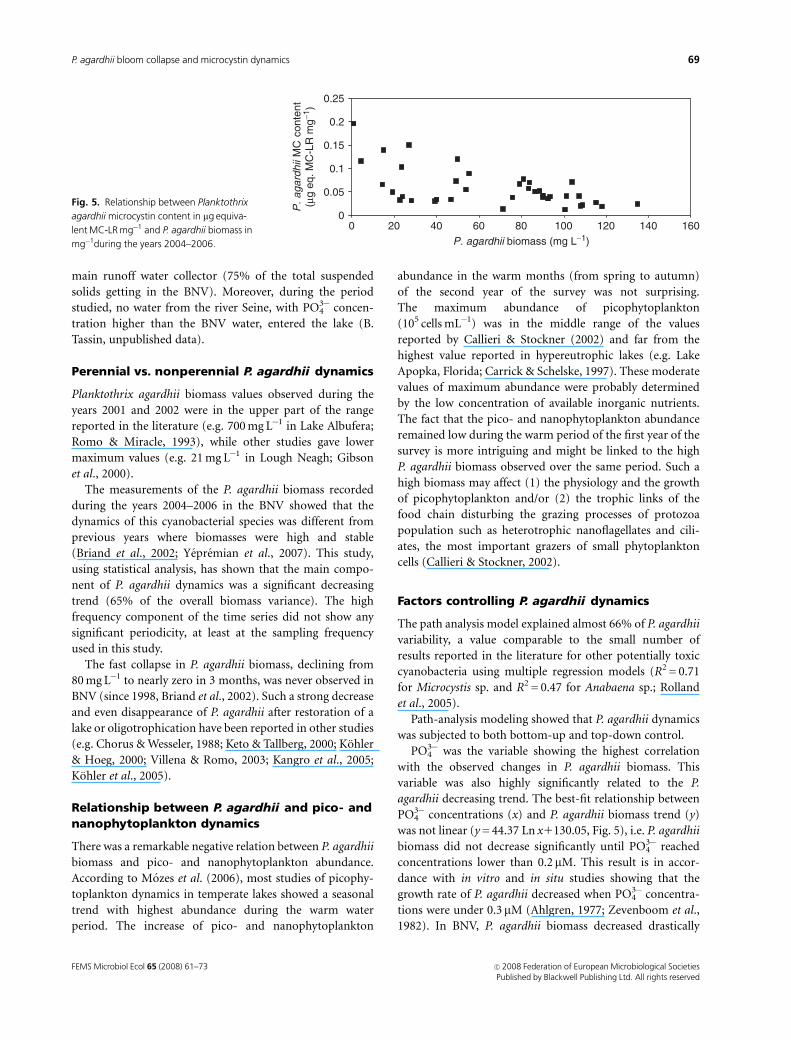
Figure 5 shows the relation between P. agardhii mi-
crocystin content and P. agardhii biomass. Planktothrix
agardhii microcystin content tended to be higher when
P. agardhii biomass was lower. Correlation analysis was
unable to detect any significant relationships between the
microcystin content and environmental variables.
(a)
020406080
100120
Mar
-04
Jun-
04
Oct
-04
Jan-
05
Apr
-05
Aug
-05
Nov
-05
Feb
-06
Time
(b)
y = 44.37 Ln x + 130.05
R2 = 0.682
0
20
40
60
80
100
120
0.0 0.1 0.2 0.3 0.4 0.5 0.6 0.7
R2 = 0.388
(c)
10
30
50
0 200 400 600
Fig. 3. (a) The two components of the Planktothrix agardhii biomass
time series: trend (thick line) and residual (�) components. (b) Relation-
ship between P. agardhii (Pa) biomass (in mg L�1) trend values and
orthophosphate (PO43�) concentration (in mM). (c) Relationship between
P. agardhii (Pa) biomass (in mg L�1) residual values and cyclopoid
abundance (in individuals L�1).
FEMS Microbiol Ecol 65 (2008) 61–73 c� 2008 Federation of European Microbiological SocietiesPublished by Blackwell Publishing Ltd. All rights reserved
67P. agardhii bloom collapse and microcystin dynamics
Discussion
Environmental characteristics of the BNV
The limnological characteristics recorded clearly show that
BNV was a hypereutrophic ecosystem according to the mean
and maximum values of standard criteria used for defining
the trophic status of continental surface waters (PO43�, TP,
Chl a, Secchi depth) (Ryding & Rast, 1994). There was a
significant change in the values of some of these indicators
between the two surveys (2001–2002 and 2004–2006).
Moreover, on splitting the last study into 2 consecutive years
(2004–2005 and 2005–2006), the mean values of these
indicators exhibited significant (Po 0.005) changes (e.g.
2� for PO43� and Chl a), all indicating an improvement of
the trophic status of BNV.
These changes can be attributed, at least to some extent,
to the treatment plant that had recently started operation
(Bauer et al., 2003) and induced a reduction of suspended
solids (up to 80%, i.e. 330 tons year�1) originating from the
Table 2. Covariance values between variables
Bivariate
relationships
(paths)
Total
covariancew (A)
Explained covariance
(ridge regression)
Total explained
covariance
(multiple
regression) (D0)
Residual
covariancew
(E = A�D)
Covariance due
to multi-collinearity
(G = D�D0)Directw (B) Indirectz (C) Total (D = B1C)
CYC-Pa � 0.49246��� � 0.35568� – �0.35568 � 0.36034 � 0.13678 0.00466
NAC-Pa � 0.40604�� (� 0.04947) – �0.04947 � 0.04759 � 0.35845 0.00188
CLA-Pa � 0.38179�� (� 0.04563) – �0.04563 � 0.04417 � 0.33616 0.00146
PO43�-Pa 0.50440��� 0.56474��� – 0.56474 0.56854 � 0.06034 �0.00380
NH41-Pa � 0.33280� � 0.30385�� – �0.30385 � 0.30536 � 0.02894 0.00151
W-Pa (0.05640) (0.10988) � 0.03362 0.07537 0.07477 � 0.01898 �0.00060
L-Pa � 0.29572� (� 0.15517) � 0.16780 �0.32068 � 0.32738 � 0.02496 0.00670
T-Pa � 0.32948� (0.00235) � 0.19308 �0.19544 � 0.19815 � 0.13404 0.00271
T-CYC 0.68728��� 0.66029��� – 0.66029 0.67822 0.02699 �0.01793
W-CYC (0.21237) (0.17394) – 0.17394 0.17781 0.03843 �0.00387
T-NAC 0.56323��� 0.56631��� – 0.56631 0.56968 0.00307 �0.00337
W-NAC (� 0.09756) (� 0.12569) – �0.12569 � 0.12660 0.02812 0.00091
T-CLA 0.63880��� 0.62924��� – 0.62924 0.63915 0.00956 �0.00991
W-CLA (0.02580) (� 0.00618) �0.00618 � 0.00678 0.03197 0.00107
T-NH41 (0.12855) (0.12325) – 0.12325 0.12562 0.00530 �0.00237
W-NH41 (0.06389) (0.05650) – 0.05650 0.05749 0.00739 �0.00099
T-PO43� (0.24660) (0.24072) – 0.24072 0.24306 0.00587 �0.00234
W-PO43� (0.08185) (0.06891) – 0.06891 0.06947 0.01294 �0.00056
L-T 0.84683��� 0.84683��� – 0.84683 0.84683 – –
wThe significance of the covariance in columns A and B is:���P � 0.001, ��P � 0.01, �P � 0.05, or nonsignificant (values in parentheses).zThe dashes in columns C and E represent covariance excluded by the model design.
The paths between variables are shown in Fig. 1.
Pa, P. agardhii biomass; CYC, cyclopoid copepods abundance; NAC, copepod nauplii abundance; CLA, cladocerans abundance; T, temperature;
W, average wind speed at 10 m over the 72 h before sampling; L, average global solar radiation between two sampling dates.
0
1
2
3
4
5
6
7
8
Mar
-04
May
-04
Jul-0
4
Sep
-04
Nov
-04
Jan-
05
Mar
-05
May
-05
Jul-0
5
Sep
-05
Nov
-05
Jan-
06
MC
con
cent
ratio
n(µ
g eq
. MC
-LR
L−1
)
Time
0
0.1
0.2
0.3
P.
agar
dhii
MC
con
tent
(µg
eq.
MC
-LR
mg−1
)
∗∗ ∗ ∗Fig. 4. Microcystin concentration (’) in
mg equivalent MC-LR L�1 and Planktothrix agard-
hii microcystin content (gray bars) in mg equiva-
lent MC-LR mg�1 dynamics during years
2004–2006. �, less than detection limit.
FEMS Microbiol Ecol 65 (2008) 61–73c� 2008 Federation of European Microbiological SocietiesPublished by Blackwell Publishing Ltd. All rights reserved
68 A. Catherine et al.
main runoff water collector (75% of the total suspended
solids getting in the BNV). Moreover, during the period
studied, no water from the river Seine, with PO43� concen-
tration higher than the BNV water, entered the lake (B.
Tassin, unpublished data).
Perennial vs. nonperennial P. agardhii dynamics
Planktothrix agardhii biomass values observed during the
years 2001 and 2002 were in the upper part of the range
reported in the literature (e.g. 700 mg L�1 in Lake Albufera;
Romo & Miracle, 1993), while other studies gave lower
maximum values (e.g. 21 mg L�1 in Lough Neagh; Gibson
et al., 2000).
The measurements of the P. agardhii biomass recorded
during the years 2004–2006 in the BNV showed that the
dynamics of this cyanobacterial species was different from
previous years where biomasses were high and stable
(Briand et al., 2002; Yepremian et al., 2007). This study,
using statistical analysis, has shown that the main compo-
nent of P. agardhii dynamics was a significant decreasing
trend (65% of the overall biomass variance). The high
frequency component of the time series did not show any
significant periodicity, at least at the sampling frequency
used in this study.
The fast collapse in P. agardhii biomass, declining from
80 mg L�1 to nearly zero in 3 months, was never observed in
BNV (since 1998, Briand et al., 2002). Such a strong decrease
and even disappearance of P. agardhii after restoration of a
lake or oligotrophication have been reported in other studies
(e.g. Chorus & Wesseler, 1988; Keto & Tallberg, 2000; Kohler
& Hoeg, 2000; Villena & Romo, 2003; Kangro et al., 2005;
Kohler et al., 2005).
Relationship between P. agardhii and pico- andnanophytoplankton dynamics
There was a remarkable negative relation between P. agardhii
biomass and pico- and nanophytoplankton abundance.
According to Mozes et al. (2006), most studies of picophy-
toplankton dynamics in temperate lakes showed a seasonal
trend with highest abundance during the warm water
period. The increase of pico- and nanophytoplankton
abundance in the warm months (from spring to autumn)
of the second year of the survey was not surprising.
The maximum abundance of picophytoplankton
(105 cells mL�1) was in the middle range of the values
reported by Callieri & Stockner (2002) and far from the
highest value reported in hypereutrophic lakes (e.g. Lake
Apopka, Florida; Carrick & Schelske, 1997). These moderate
values of maximum abundance were probably determined
by the low concentration of available inorganic nutrients.
The fact that the pico- and nanophytoplankton abundance
remained low during the warm period of the first year of the
survey is more intriguing and might be linked to the high
P. agardhii biomass observed over the same period. Such a
high biomass may affect (1) the physiology and the growth
of picophytoplankton and/or (2) the trophic links of the
food chain disturbing the grazing processes of protozoa
population such as heterotrophic nanoflagellates and cili-
ates, the most important grazers of small phytoplankton
cells (Callieri & Stockner, 2002).
Factors controlling P. agardhii dynamics
The path analysis model explained almost 66% of P. agardhii
variability, a value comparable to the small number of
results reported in the literature for other potentially toxic
cyanobacteria using multiple regression models (R2 = 0.71
for Microcystis sp. and R2 = 0.47 for Anabaena sp.; Rolland
et al., 2005).
Path-analysis modeling showed that P. agardhii dynamics
was subjected to both bottom-up and top-down control.
PO43� was the variable showing the highest correlation
with the observed changes in P. agardhii biomass. This
variable was also highly significantly related to the P.
agardhii decreasing trend. The best-fit relationship between
PO43� concentrations (x) and P. agardhii biomass trend (y)
was not linear (y = 44.37 Ln x1130.05, Fig. 5), i.e. P. agardhii
biomass did not decrease significantly until PO43� reached
concentrations lower than 0.2mM. This result is in accor-
dance with in vitro and in situ studies showing that the
growth rate of P. agardhii decreased when PO43� concentra-
tions were under 0.3mM (Ahlgren, 1977; Zevenboom et al.,
1982). In BNV, P. agardhii biomass decreased drastically
0
0.05
0.1
0.15
0.2
0.25
0 20 40 60 80 100 120 140 160P. agardhii biomass (mg L−1)
P.
agar
dhii
MC
con
tent
(µg
eq. M
C-L
R m
g−1)
Fig. 5. Relationship between Planktothrix
agardhii microcystin content in mg equiva-
lent MC-LR mg�1 and P. agardhii biomass in
mg�1during the years 2004–2006.
FEMS Microbiol Ecol 65 (2008) 61–73 c� 2008 Federation of European Microbiological SocietiesPublished by Blackwell Publishing Ltd. All rights reserved
69P. agardhii bloom collapse and microcystin dynamics
only when PO43� concentrations were below this threshold
for at least 3 months (August–December 2004), indicating
that the biomass was phosphorus limited. This is consistent
with TP concentration (means, minima and maxima re-
ported in Table 1) changes between the 2001–2002 and
2004–2006 periods. As indicated by these values, in
2001–2002, the carrying capacity of this ecosystem did not
seem to be limited by phosphorus. The system may, for
example, have rather been light limited, whereas in
2004–2006 there will have been a number of occasions for
phosphorus limitation. The increase of L. redekei biomass
after the decrease of P. agardhii (January–May 2005) may
also be linked to the lower phosphorus level as shown by
several authors (Rucker et al., 1997; Wiedner et al., 2002;
Noges & Ott, 2003).
That NH41 concentrations were negatively correlated with
changes in P. agardhii is probably not due to a direct causal
effect. Clearly, the maximum NH41 values observed cannot
be considered to inhibit phytoplankton growth, i.e. to be
toxic (Von Ruckert & Giani, 2004). This negative correlation
could be interpreted as the result of a fast uptake of NH41 by
P. agardhii and/or the result of P. agardhii lysis, leading to
NH41 production by heterotrophic microorganisms through
mineralization of decaying algae. A higher NH41 concentra-
tion associated with a lower PO43� concentration may favor
the growth of small phytoplankton, which can outcompete,
under such circumstances, microphytoplanktonic species
such as P. agardhii. Indeed, it is well known that as a source
of nitrogen, NH41 may favor the growth of small phyto-
plankton species, which are also better adapted to low
nutrient concentration due to their larger surface/volume
ratio (Koike et al., 1986; Harrison & Wood, 1988; Cochlan &
Harrison, 1991).
The negative relation between cyclopoids and P. agardhii
biomass was shown to be associated with the residual
variability component of P. agardhii dynamics. The hypoth-
esis of the negative effects of microcystins on zooplankton
can be ruled out. The microcystin concentrations (max:
7.4mg L�1) measured during this study were far below the
LD50 reported for various zooplankton organisms (e.g. LD50
expressed in mg MC-LR mL�1: Daphnia sp. = 9.6–21.4, De
Mott, 1991; Diaptomus bergei = 0.45–1, De Mott, 1991;
Thamnocephalus platyurus = 0.1, Torokne, 1999). It is more
probable that the negative correlation can be considered as
the result of a top-down control of P. agardhii by cyclopoid
grazing. Although adult CYC are generally considered to be
primarily omnivorous or carnivorous, it has already been
demonstrated that adult females were able to survive and
could reproduce on a diet of algae (Hopp et al., 1997). It has
been found that P. agardhii is an edible prey for various
zooplankton species belonging to cladocerans (Davidowicz
et al., 1988; Gliwicz & Lampert 1990; Degans & De Meester,
2002) and rotifers (Weithoff & Walz, 1995). Even though, it
has been shown that grazing is relatively inefficient when
filamentous cyanobacteria reach large biomass (Davidowicz
et al., 1988), the significant decrease in P. agardhii biomass
may have allowed zooplankton grazing activity to become
more efficient. During the spring and summer of the second
year, the large abundance of zooplankton may have helped
to maintain P. agardhii biomass at a low level.
The control exerted by the zooplankton on P. agardhii
may have been amplified by the decrease in PO43� concentra-
tion, limiting the ability of P. agardhii to compensate the loss
of biomass due to different processes (e.g. grazing).
Among the environmental variables tested as explanatory
variables in the path model, several, especially the tempera-
ture, had no significant correlation with P. agardhii biomass.
This lack of correlation highlighted that Oscillatoriales such as
P. agardhii are able to grow under a wide range of tempera-
tures, even below 10 1C (Post et al., 1985; Noges & Ott 2003).
One can expect to improve such a path-analysis model by
replacing some of the variables used by other ones more
related to biological processes such as grazing, lysis (e.g. viral
lysis) and growth rates. However, these variables are more
difficult to measure in field studies. The results of the path
model can be used to build a predictive equation of P.
agardhii biomass using the path coefficients in Table 2, as
one can do using multiple regression models (Rolland et al.,
2005). Such predictive equations need to be tested on
independent datasets to be validated.
Microcystin concentrations and P. agardhiibiomass dynamics
About 49% of changes in microcystin concentration could
be explained by P. agardhii biomass. This percentage con-
trasts with the nonsignificant or low correlation coefficients
reported by previous studies in the same ecosystem (Briand
et al., 2002; Yepremian et al., 2007) when P. agardhii
biomass was more stable. The collapse in P. agardhii biomass
during the year 2006 is probably the main explanation for
the stronger relationship observed between microcystin
concentration and cyanobacterial biomass. Such a collapse
extended the range of biomass and microcystin concentra-
tion values, giving a better data context to fit a statistical
model. Significant relationships between toxin producer
biomasses and toxin concentrations have also been reported
for studies where a large range of values of these variables
has been recorded (e.g. Rolland et al., 2005; Znachor et al.,
2006; Kardinaal et al., 2007b).
We also showed that the microcystin content per
P. agardhii biomass unit was quite variable and that opposite
trends existed between this ratio and biomass. The same
relationship has been shown recently in several studies of
Microcystis-dominated lakes (Kardinaal & Visser, 2005;
Kardinaal et al., 2007a, b; Welker et al., 2007). Moreover,
FEMS Microbiol Ecol 65 (2008) 61–73c� 2008 Federation of European Microbiological SocietiesPublished by Blackwell Publishing Ltd. All rights reserved
70 A. Catherine et al.
using molecular techniques, these studies reported changes
in the proportion of either microcystin-producing and
-nonproducing genotypes or chemotypes of Microcystis,
which could explain the observed changes in microcystin
concentration. Such P. agardhii microcystin-producing and
-nonproducing subpopulations have already been evidenced
in the BNV Lake (Yepremian et al., 2007) as well as in other
Planktothrix-dominated lakes (Kurmayer et al., 2004; Welker
et al., 2004).
The increase in microcystin amount per unit of P.
agardhii biomass when P. agardhii biomass was low could
be the result of an increase of the proportion of microcystin-
producing subpopulations in response to variations of
environmental parameters. These subpopulations may have
specific ecophysiological properties, allowing their better
persistence than microcystin-nonproducing subpopulations
under adverse conditions. Such differences have been de-
monstrated for Microcystis under light limitation, showing
that microcystin-nonproducing genotypes are stronger
competitors than microcystin-producing ones (Kardinaal
et al., 2007a). Thus, it seems that in dense Microcystis
blooms where shading plays an important role, microcys-
tin-nonproducing genotypes are superior competitors, lead-
ing to seasonal succession. The proportion of these two
genotypes in the 2004–2006 P. agardhii series is being
estimated using molecular methods, and a study of the
ecophysiological properties of several isolated P. agardhii
genotypes is being carried out in the BNV Lake (E. Briand,
unpublished data).
The microcystin cellular content of the microcystin-
producing subpopulations can also be affected by their
physiological status. A positive and significant correlation
between growth and microcystin-production rates has al-
ready been shown for P. agardhii isolated from the BNV
Lake (Yepremian et al., 2007), P. rubescens (Briand et al.,
2005) and Microcystis (Downing et al., 2005).
The improvement of predictive models of microcystin
concentration in lakes, such as the BNV, requires further
investigation of the causes of changes in the microcystin
content of toxin producer biomasses. Depending on the type
of processes involved (physiological status of the cells and/or
subpopulation dynamics), it may be necessary to develop
mechanistic models instead of statistical ones.
Acknowledgements
We are grateful to Aurelie Ledreux for PP2A inhibition
assays. The comments of the two anonymous reviewers are
greatly appreciated. This work was funded by the ECODYN
(INSU no. 04CV131) research program.
References
AFNOR (1982) Eaux, Methodes d’essais: Dosage des
orthophosphates, des polyphosphates et du phosphore total
(methode spectrometrique). AFNOR Ed., Paris.
Ahlgren G (1977) Growth of Oscillatoria agardhii in chemostat
culture 1: nitrogen and phosphorus requirements. Oı kos
29: 209–224.
Bauer T, Prat B & Sauvestre H (2003) Depollution des eaux
pluviales du Collecteur ZOH a Grigny en Essonne. Eau Ind
Nuis 266: 96–101.
Briand J-F, Robillot C, Quiblier-Lloberas C & Bernard C (2002) A
perennial bloom of Planktothrix agardhii (Cyanobacteria) in a
shallow eutrophic French lake: limnological and microcystin
production studies. Arch Hydrobiol 153: 605–622.
Briand J-F, Jacquet S, Flinois C, Avois-Jacquet C, Maisonnette C,
Leberre B & Humbert J-F (2005) Variations in the microcystin
production of Planktothrix rubescens (Cyanobacteria) assessed
from a four-year survey of Lac du Bourget (France) and from
laboratory experiments. Microbiol Ecol 50: 418–428.
Callieri C & Stockner JG (2002) Freshwater autotrophic
picoplankton: a review. J Limnol 61: 1–14.
Campbell L, Nolla HA & Vaulot D (1994) The importance of
Prochlorococcus to community structure in the Central North
Pacific Ocean. Limnol Oceanogr 39: 954–961.
Carrick HJ & Schelske CL (1997) Have we overlooked the
importance of small phytoplankton in productive waters?
Limnol Oceanogr 42: 1613–1621.
Casgrain P & Legendre P (2004) The R package for multivariate
and spatial analysis, Version 4.0 d9 – User’s Manual.
Departement des sciences biologiques, Universite de Montreal,
Canada. http://www.bio.umontreal.ca/Casgrain/en/
Chorus I (2005) Current Approaches to Cyanotoxin Risk
Assessment, Risk Management and Regulations in Different
Countries. Federal Environmental Agency, Dessau.
Chorus I & Wesseler E (1988) Plankton response to lake
restoration in Lake Schlachtensee (Berlin-West). Verh Int
Verein Limnol 23: 719–728.
Cochlan WP & Harrison PJ (1991) Kinetics of nitrogen (nitrate,
ammonium and urea) uptake by the picoflagellate Micromonas
pusilla (Prasinophyceae). J Exp Mar Biol Ecol 153: 129–141.
Codd GA, Bell SG, Kaya K, Ward CJ, Beattie KA & Metcalf JS
(1999) Cyanobacterial toxins, exposure routes and human
health. Eur J Phycol 34: 405–415.
Cottenie K, Michels E, Nuytten N & De Meester L (2003)
Zooplankton metacommunity structure: regional vs. local
processes in highly connected ponds. Ecology 84: 991–1000.
Crosbie ND, Teubner K & Weisse T (2003) Flow-cytometric
mapping provides novel insights into the seasonal and vertical
distributions of freshwater autotrophic picoplankton. Aquat
Microb Ecol 33: 53–66.
Davidowicz P, Gliwicz ZM & Gulati R (1988) Can Daphnia
prevent a blue-green algal bloom in hypertrophic lakes? A
laboratory test. Limnologica 19: 21–26.
Degans H & De Meester L (2002) Top-down control of natural
phyto- and bacterioplankton prey communities by Daphnia
FEMS Microbiol Ecol 65 (2008) 61–73 c� 2008 Federation of European Microbiological SocietiesPublished by Blackwell Publishing Ltd. All rights reserved
71P. agardhii bloom collapse and microcystin dynamics
magna and by the natural zooplankton community of the
eutrophic Lake Blankaart. Hydrobiologia 479: 39–49.
De Mott W (1991) Effects of toxic cyanobacteria and purified
toxins on the survival and feeding of a copepod and three
species of Daphnia. Limnol Oceanogr 36: 1346–1357.
Downing TG, Meyer C, Gehringer MM & Van de Venter M
(2005) Microcystin content of Microcystis aeruginosa is
modulated by nitrogen uptake rate relative to specific growth
rate or carbon fixation rate. Environ Toxicol 20: 257–262.
Gibson CE, Foy RH & Lennox SD (2000) The rise and rise of
Planktothrix agardhii in Lough Neagh 1969–1997. Verh Int
Verein Limnol 27: 2913–2916.
Gliwicz ZM & Lampert W (1990) Food thresholds in Daphnia
species in the absence and presence of blue-green filaments.
Ecology 71: 691–702.
Greenberg A, Clesceri L & Eaton A (1999) Standard Methods for
the Examination of Water and Wastewater, 20th edn. American
Public Health Association, Washington, DC.
Harrison WG & Wood LJE (1988) Inorganic nitrogen uptake by
marine picoplankton: evidence for size partitioning. Limnol
Oceanogr 33: 468–475.
Hocking RR (1976) The analysis and selection of variables in
linear regression. Biometrics 32: 1–49.
Hopp U, Maier G & Bleher R (1997) Reproduction and adult
longevity of five species of planktonic cyclopoid copepods
reared on different diets: a comparative study. Freshwater Biol
38: 289–300.
Kangro K, Laugaste R, Noges P & Ott I (2005) Long-term changes
and seasonal development of phytoplankton in a strongly
stratified hypertrophic lake. Hydrobiologia 547: 91–103.
Kardinaal WEA & Visser PM (2005) Dynamics of cyanobacterial
toxins: sources of variability in microcystin concentrations.
Harmful Cyanobacteria (Huisman J, Matthijs HCP & Visser
PM, eds), pp. 41–63. Springer, Dordrecht.
Kardinaal WEA, Tonk L, Janse I, Hol S, Slot P, Huisman J & Visser
PM (2007a) Competition for light between toxic and non-
toxic strains of the harmful cyanobacterium Microcystis. Appl
Environ Microbiol 73: 2939–2946.
Kardinaal WEA, Janse I, Kamst-van Agterveld M, Meima M,
Snoek J, Mur LR, Huisman J, Zwart G & Visser PM (2007b)
Microcystis genotype succession in relation to microcystin
concentrations in freshwater lakes. Aquat Microb Ecol 48: 1–12.
Keto J & Tallberg P (2000) The recovery of Vesijarvi, a lake in
Southern Finland: water quality and phytoplankton
interpretations. Bor Environ Res 5: 15–26.
Kohler J & Hoeg S (2000) Phytoplankton selection in a river-lake
system during two decades of changing nutrient supply.
Hydrobiologia 424: 13–24.
Kohler J, Hilt S, Adrian R, Nicklisch A, Kozerski HP & Walz N
(2005) Long-term response of a shallow, moderately flushed
lake to reduced external phosphorus and nitrogen loading.
Freshw Biol 50: 1639–1650.
Koike I, Holm-Hansen O & Biggs C (1986) Inorganic nitrogen
metabolism by Antarctic phytoplankton with special reference
to ammonium cycling. Mar Ecol Prog Ser 30: 105–116.
Kurmayer R, Christiansen G, Fastner J & Borner T (2004)
Abundance of active and inactive microcystin genotypes in
populations of the toxic cyanobacterium Planktothrix spp.
Environ Microbiol 6: 831–841.
Legendre L, Frechette M & Legendre P (1981) The contingency
periodogram: a method of identifying rhythms in series of
non-metric ecological data. J Ecol 69: 965–979.
Legendre P & Legendre L (1998) Numerical Ecology, 2nd edn.
Elsevier, Amsterdam.
Levi Y, Harvey M & Cervantes P (2006) Risques sanitaires lies a la
presence de cyanobacteries dans l’eau. Affset Ed., Paris.
Lilliefors HW (1967) The Kolmogorov-Smirnov test for
normality with mean and variance unknown. J Am Stat Ass 62:
399–402.
Lund JWG (1951) A sedimentation technique for counting algae
and other organisms. Hydrobiologia 3: 390–394.
Montealegre RJ, Verreth J, Steenbergen K, Moed J & Machiels M
(1995) A dynamic simulation model for the blooming of
Oscillatoria agardhii in a monomictic lake. Ecol Model 78:
17–24.
Mozes A, Presing M & Voros L (2006) Seasonal dynamics of
picocyanobacteria and picoeukaryotes in a large shallow lake
(Lake Ballaton, Hungary). Int Rev Hydrobiol 91: 38–50.
Noges P & Ott I (2003) Occurrence, coexistence and competition
of Limnothrix redekei and Planktothrix agardhii: analysis of
Danish-Estonian lake database. Arch Hydrobiol Suppl Algol
Stud 109: 429–441.
Post AF, de Wit R & Mur LR (1985) Interactions between
temperature and light intensity on growth and photosynthesis
of the cyanobacterium Oscillatoria agardhii. J Plankton Res 7:
487–495.
Robarts RD & Zohary T (1987) Temperature effects on
photosynthetic capacity, respiration and growth rates of
bloom-forming Cyanobacteria. N Z J Mar Freshw Res 21:
391–399.
Rolland A, Bird DF & Giani A (2005) Seasonal changes in
composition of the cyanobacterial community and the
occurrence of hepatotoxic blooms in the eastern townships,
Quebec, Canada. J Plankt Res 27: 683–694.
Romo S & Miracle M-R (1993) Long-term periodicity of
Plankthothrix agardhii, Pseudanabaena galeata and
Geitlerinema sp. in a shallow hypertrophic lagoon, the
Albufera of Valencia (Spain). Arch Hydrobiol 126: 469–486.
Rucker J, Widener C & Zippel P (1997) Factors controlling the
dominance of Planktothrix agardhii and Limnothrix redekei in
eutrophic shallow lakes. Hydrobiologia 342: 107–115.
Ryding S-O & Rast W (1994) Le controle de l’eutrophisation des
lacs et des reservoirs. Masson Ed, Paris.
Sivonen K (1990) Effects of light, temperature, nitrate,
orthophosphate, and bacteria on growth and hepatotoxin
production by Oscillatoria agardhii strains. App Env Microbiol
56: 2658–2666.
Sokal RR & Rohlf FJ (1981) Biometry: the Principles and Practice
of Statistics in Biological Research, 2nd edn. WH Freeman and
Co., San Francisco, CA.
FEMS Microbiol Ecol 65 (2008) 61–73c� 2008 Federation of European Microbiological SocietiesPublished by Blackwell Publishing Ltd. All rights reserved
72 A. Catherine et al.
Sun J & Liu D (2003) Geometric models for calculating cell
biovolume and area for phytoplankton. J Plankton Res 25:
1331–1346.
Talling JF & Driver D (1963) Some problems in the estimation
of chlorophyll a in phytoplankton. UAEC TID-7633 (ed).
Conference on Primary Production Measurement Marine and
Freshwater, Hawaı, pp. 142–146 .
Torokne AK (1999) A new culture-free microbiotest for routine
detection of cyanobacterial toxins. Environ Toxicol 14:
466–472.
Troussellier M, Courties C & Vaquer A (1993) Recent
applications of flow cytometry in aquatic microbial ecology.
Biol Cell 78: 111–121.
Villena MJ & Romo S (2003) Phytoplankton changes in a shallow
Mediterranean lake (Albufera of Valencia, Spain) after sewage
diversion. Hydrobiologia 506: 281–287.
Von Ruckert G & Giani A (2004) Effect of nitrate and ammonium
on the growth and protein concentration of Microcystis viridis
Lemmermann (Cyanobacteria). Rev Bras Bot 27: 325–331.
Weithoff G & Walz N (1995) Influence of the filamentous
cyanobacterium Planktothrix agardhii on population growth
and reproductive pattern of the rotifer Brachionus calyciflorus.
Hydrobiologia 313: 381–386.
Welker M, Christiansen G & von Dohren H (2004) Diversity of
coexisting Planktothrix (Cyanobacteria) chemotypes deduced
by mass spectral analysis of microcystins and other
oligopeptides. Arch Microbiol 182: 288–298.
Welker M, Sejnohova L, Nemethova D, von Dohren H, Jarkovsky
J & Marsalek B (2007) Seasonal shifts in chemotype
composition of Microcystis sp. communities in the pelagial and
the sediment of a shallow reservoir. Limnol Oceanogr 52:
609–619.
Wiedner C, Nixdorf B, Heinz R, Wirsing B, Neumann U &
Weckesser J (2002) Regulation of cyanobacteria and
microcystin dynamics in polymictic shallow lakes. Arch
Hydrobiol 155: 383–400.
Wiegand C & Pflugmacher S (2005) Ecotoxicological effects of
selected cyanobacterial secondary metabolites: a short review.
Toxicol Appl Pharmacol 203: 201–218.
Willame R, Jurczak T, Iffly J-F, Kull T, Meriluoto J & Hoffmann L
(2005) Distribution of hepatotoxic cyanobacterial blooms in
Belgium and Luxembourg. Hydrobiologia 551: 99–117.
Wright S (1921) Path coefficients and path regressions:
alternative or complementary concepts? Biometrics 16:
189–202.
Yepremian C, Gugger MF, Briand E, Catherine A, Berger C,
Quiblier C & Bernard C (2007) Microcystins ecotypes in a
perennial Planktothrix agardhii bloom. Water Res 41:
4446–4456.
Zevenboom W, Bij de Vaate A & Mur LR (1982) Assessment of
factors limiting growth rate of Oscillatoria agardhii in
hypertrophic Lake Wolderwijd, 1978, by use of physiological
indicators. Limnol Oceanogr 27: 39–52.
Znachor P, Jurczak T, Komarkova J, Jezberova J, Mankiewicz J,
Katovska K & Zapomlova E (2006) Summer changes in
cyanobacterial bloom composition and microcystin
concentration in eutrophic Czech reservoirs. Environ Toxicol
21: 236–243.
FEMS Microbiol Ecol 65 (2008) 61–73 c� 2008 Federation of European Microbiological SocietiesPublished by Blackwell Publishing Ltd. All rights reserved
73P. agardhii bloom collapse and microcystin dynamics
Related Documents