RESEARCH ARTICLE Open Access Collagen density regulates the activity of tumor-infiltrating T cells Dorota E. Kuczek 1 , Anne Mette H. Larsen 1,3 , Marie-Louise Thorseth 1 , Marco Carretta 1 , Adrija Kalvisa 4 , Majken S. Siersbæk 4 , Ana Micaela C. Simões 1 , Anne Roslind 5 , Lars H. Engelholm 2 , Elfriede Noessner 6 , Marco Donia 1 , Inge Marie Svane 1 , Per thor Straten 1,7 , Lars Grøntved 4 and Daniel H. Madsen 1,8* Abstract Background: Tumor progression is accompanied by dramatic remodeling of the surrounding extracellular matrix leading to the formation of a tumor-specific ECM, which is often more collagen-rich and of increased stiffness. The altered ECM of the tumor supports cancer growth and metastasis, but it is unknown if this effect involves modulation of T cell activity. To investigate if a high-density tumor-specific ECM could influence the ability of T cells to kill cancer cells, we here studied how T cells respond to 3D culture in different collagen densities. Methods: T cells cultured in 3D conditions surrounded by a high or low collagen density were imaged using confocal fluorescent microscopy. The effects of the different collagen densities on T cell proliferation, survival, and differentiation were examined using flow cytometry. Cancer cell proliferation in similar 3D conditions was also measured. Triple-negative breast cancer specimens were analyzed for the number of infiltrating CD8+ T cells and for the collagen density. Whole-transcriptome analyses were applied to investigate in detail the effects of collagen density on T cells. Computational analyses were used to identify transcription factors involved in the collagen density-induced gene regulation. Observed changes were confirmed by qRT-PCR analysis. Results: T cell proliferation was significantly reduced in a high-density matrix compared to a low-density matrix and prolonged culture in a high-density matrix led to a higher ratio of CD4+ to CD8+ T cells. The proliferation of cancer cells was unaffected by the surrounding collagen-density. Consistently, we observed a reduction in the number of infiltrating CD8+ T-cells in mammary tumors with high collagen-density indicating that collagen-density has a role in regulating T cell abundance in human breast cancer. Whole-transcriptome analysis of 3D-cultured T cells revealed that a high-density matrix induces downregulation of cytotoxic activity markers and upregulation of regulatory T cell markers. These transcriptional changes were predicted to involve autocrine TGF-β signaling and they were accompanied by an impaired ability of tumor- infiltrating T cells to kill autologous cancer cells. Conclusions: Our study identifies a new immune modulatory mechanism, which could be essential for suppression of T cell activity in the tumor microenvironment. Keywords: Tumor microenvironment, T cell activity, Extracellular matrix, Immune modulation, 3D culture © The Author(s). 2019 Open Access This article is distributed under the terms of the Creative Commons Attribution 4.0 International License (http://creativecommons.org/licenses/by/4.0/), which permits unrestricted use, distribution, and reproduction in any medium, provided you give appropriate credit to the original author(s) and the source, provide a link to the Creative Commons license, and indicate if changes were made. The Creative Commons Public Domain Dedication waiver (http://creativecommons.org/publicdomain/zero/1.0/) applies to the data made available in this article, unless otherwise stated. * Correspondence: [email protected] 1 Center for Cancer Immune Therapy, Department of Hematology, Copenhagen University Hospital Herlev, Herlev, Denmark 8 Department of Oncology, Copenhagen University Hospital Herlev, Herlev, Denmark Full list of author information is available at the end of the article Kuczek et al. Journal for ImmunoTherapy of Cancer (2019) 7:68 https://doi.org/10.1186/s40425-019-0556-6

Welcome message from author
This document is posted to help you gain knowledge. Please leave a comment to let me know what you think about it! Share it to your friends and learn new things together.
Transcript
RESEARCH ARTICLE Open Access
Collagen density regulates the activity oftumor-infiltrating T cellsDorota E. Kuczek1, Anne Mette H. Larsen1,3, Marie-Louise Thorseth1, Marco Carretta1, Adrija Kalvisa4,Majken S. Siersbæk4, Ana Micaela C. Simões1, Anne Roslind5, Lars H. Engelholm2, Elfriede Noessner6, Marco Donia1,Inge Marie Svane1, Per thor Straten1,7, Lars Grøntved4 and Daniel H. Madsen1,8*
Abstract
Background: Tumor progression is accompanied by dramatic remodeling of the surrounding extracellular matrixleading to the formation of a tumor-specific ECM, which is often more collagen-rich and of increased stiffness.The altered ECM of the tumor supports cancer growth and metastasis, but it is unknown if this effect involvesmodulation of T cell activity. To investigate if a high-density tumor-specific ECM could influence the ability of T cellsto kill cancer cells, we here studied how T cells respond to 3D culture in different collagen densities.
Methods: T cells cultured in 3D conditions surrounded by a high or low collagen density were imaged usingconfocal fluorescent microscopy. The effects of the different collagen densities on T cell proliferation, survival, anddifferentiation were examined using flow cytometry. Cancer cell proliferation in similar 3D conditions was alsomeasured. Triple-negative breast cancer specimens were analyzed for the number of infiltrating CD8+ T cells andfor the collagen density. Whole-transcriptome analyses were applied to investigate in detail the effects of collagendensity on T cells. Computational analyses were used to identify transcription factors involved in the collagendensity-induced gene regulation. Observed changes were confirmed by qRT-PCR analysis.
Results: T cell proliferation was significantly reduced in a high-density matrix compared to a low-density matrixand prolonged culture in a high-density matrix led to a higher ratio of CD4+ to CD8+ T cells. The proliferation ofcancer cells was unaffected by the surrounding collagen-density. Consistently, we observed a reduction in thenumber of infiltrating CD8+ T-cells in mammary tumors with high collagen-density indicating that collagen-densityhas a role in regulating T cell abundance in human breast cancer.Whole-transcriptome analysis of 3D-cultured T cells revealed that a high-density matrix induces downregulation ofcytotoxic activity markers and upregulation of regulatory T cell markers. These transcriptional changes werepredicted to involve autocrine TGF-β signaling and they were accompanied by an impaired ability of tumor-infiltrating T cells to kill autologous cancer cells.
Conclusions: Our study identifies a new immune modulatory mechanism, which could be essential for suppressionof T cell activity in the tumor microenvironment.
Keywords: Tumor microenvironment, T cell activity, Extracellular matrix, Immune modulation, 3D culture
© The Author(s). 2019 Open Access This article is distributed under the terms of the Creative Commons Attribution 4.0International License (http://creativecommons.org/licenses/by/4.0/), which permits unrestricted use, distribution, andreproduction in any medium, provided you give appropriate credit to the original author(s) and the source, provide a link tothe Creative Commons license, and indicate if changes were made. The Creative Commons Public Domain Dedication waiver(http://creativecommons.org/publicdomain/zero/1.0/) applies to the data made available in this article, unless otherwise stated.
* Correspondence: [email protected] for Cancer Immune Therapy, Department of Hematology,Copenhagen University Hospital Herlev, Herlev, Denmark8Department of Oncology, Copenhagen University Hospital Herlev, Herlev,DenmarkFull list of author information is available at the end of the article
Kuczek et al. Journal for ImmunoTherapy of Cancer (2019) 7:68 https://doi.org/10.1186/s40425-019-0556-6

BackgroundSolid tumors consist of cancer cells interacting with thetumor microenvironment, which includes stromal cells,immune cells, and the extracellular matrix. Infiltrationof tumors by lymphocytes, and in particular CD8+ cyto-toxic T cells, is known to predict good prognosis inmany types of cancer [1]. T cell infiltration into solidtumors is also associated with increased clinical efficacyof immunotherapies [2]. The beneficial effect of a highabundance of tumor-infiltrating T cells reflects the abil-ity of the immune cells to mount a response againstcancer cells [3]. As an important way for the cancer cellsto evade immune destruction, tumors can develop astrongly immunosuppressive tumor microenvironment[4–6]. This includes the accumulation of cell types withimmunosuppressive activity, such as tumor-associatedmacrophages (TAMs), myeloid-derived suppressor cells(MDSCs), and regulatory T cells (Tregs) [4]. Upregula-tion of PD-L1 by cells in the tumor microenvironmentconstitutes an important and well-studied immune es-cape mechanism in which the interaction with its recep-tor PD-1 on T cells lead to inactivation of the T cells [7].Antibody-mediated blockade of the PD1-PD-L1 inter-action has demonstrated remarkable clinical efficacy formany cancer patients and stimulated the research aimingat identifying additional targetable immunosuppressivemechanisms in the tumor microenvironment [7].In addition to non-malignant stromal cells and im-
mune cells, the tumor microenvironment consists of theextracellular matrix (ECM). Degradation of the ECMsurrounding a tumor is an essential part of invasivecancer growth and a main reason for the destruction ofthe normal tissue [8–10]. Of central importance, thedegradation of the ECM is accompanied by the depos-ition of a different tumor-specific ECM [11]. This newECM is often of increased density and stiffness, andcontains components that are not typically present inthe original ECM [12, 13]. Within the last decade, anumber of important discoveries have emphasized howthe ECM can affect cancer biology [14, 15]. A strongcorrelation between the density of collagen type I, whichis the most abundant component of the tumor ECM,and poor prognosis of breast cancer, gastric cancer andoral cancer has been demonstrated [16–18], and in vitrostudies have shown that a high-density and stiff ECMcan induce a process in epithelial cells resembling malig-nant transformation [19–21]. Other cell types such asfibroblasts and mesenchymal stem cells have also beendemonstrated to respond to the mechanical propertiesof the surrounding ECM by a process termed cellularmechanosensing [22, 23]. Through the effects on cancercells and stromal cells, the ECM can augment many ofthe hallmarks of cancer, such as the induction of angio-genesis [24] and the activation of invasion and metastasis
[15, 25]. It remains quite speculative if the ECM can alsomodulate the immunosuppressive tumor microenviron-ment and thereby support the cancer’s evasion of immunedestruction [15, 26]. It should, however, be noted that thepresentation of antigens linked to a stiff surface has beendemonstrated to impair TCR-mediated T cell activation,suggesting that T cells possess mechanosensing abilities[27] and others have confirmed that the TCR is affectedby mechanical force [28]. Furthermore, tumor-associatedremodeling of the ECM, can lead to the deposition ofECM components such as osteopontin, SPARC, versican,and tenascin C, which have been suggested to possessimmunosuppressive properties [29–31].Although cell culture in 3D environments is widely
used in the field of cancer biology [32], 3D culture of Tcells is less common and has mainly been used for thestudy of cell migration [33, 34]. The interaction betweencollagen and tumor-infiltrating T cells was, however,studied by Salmon et al. through the use of elegant exvivo culture of lung tumor slices combined withreal-time imaging [35]. Here, collagen fibers were sug-gested to prevent the migration of T cells from the stro-mal compartment into the tumor islets. Collagen-densitymediated inhibition of directional T cell migration hasalso been suggested as the reason for intratumoral T cellexclusion in pancreatic cancers [36]. It was not ad-dressed in these studies if the collagen also influencesthe activity of the T cells. In this study, we employed 3Dculture assays to investigate if the collagen-density candirectly impact the activity of T cells.
Materials and methodsT cell isolation and cultureHuman peripheral blood mononuclear cells (PBMCs)were isolated from healthy donors by gradient centrifu-gation using Lymphoprep (Alere AS) separation andfrozen in fetal calf serum (Sigma Aldrich) with 10%DMSO (Sigma Aldrich). For RNAseq experiments, thePBMCs were enriched for T cells by allowing the cells toadhere overnight and collecting only the non-adherentand loosely adherent cells. For confocal microscopy, Tcells were isolated from healthy donors at the CombinedTechnical Research Core facilities at the National Insti-tute of Dental and Craniofacial Research (NIDCR), NIHusing elutriation. For all other experiments, T cells wereisolated from PBMCs using magnetic anti-CD3 microbe-ads (Miltenyi Biotec) according to the manufacturer’sinstruction. Cells were cultured at 37 °C in a humidified5% CO2 environment in X-vivo media (Sartorius) with5% human serum (Sigma Aldrich).
3D culture in collagen gelsType I collagen gels were prepared using a modifiedprotocol from Artym and Matsumoto [37]. Briefly, cells
Kuczek et al. Journal for ImmunoTherapy of Cancer (2019) 7:68 Page 2 of 15

were resuspended in a mix of rat tail collagen type I(Corning), 0.02 N acetic acid, 10x DMEM with PhenolRed (Sigma Aldrich) and 10x reconstitution buffer(0 .2M Hepes (Gibco) and 0.2 62M NaHCO3). Toneutralize the pH, 2 N NaOH was added to the reconsti-tution buffer before use. For all cell lines, low density(LD) and high density (HD) gels contained 1 mg/ml and4mg/ml collagen type I respectively. First, 300 to 400 μlof the collagen solution was plated per well of anon-tissue culture treated 24-wells plate (Corning) andallowed to polymerize at 37 °C for at least 30 min. After-wards a second layer of collagen solution containing thecells was seeded on top of the first gel and allowed topolymerize for 1–2 h at 37 °C, after which 600 μl ofculture media was added. For culturing cells in 2Dconditions, the same number of cells were seeded in thewells of a tissue culture treated 24-well plate.
T cell proliferation assayT cells from healthy donors were transiently stimulatedwith 10 nM PMA (Sigma Aldrich) and 175 nM ionomy-cin (Sigma Aldrich) and labelled with CellTrace Violetdye (Thermo Fisher Scientific). 8 × 10⁵ T cells wereseeded in each well within LD or HD collagen gels or ontissue culture plastic. After 5 days of culture in 3D colla-gen gels or on plastic (2D), cells were treated with 3 mg/ml collagenase (Worthington) solution for 45–60min at37 °C to extract the cells from the gels, washed oncewith media and once with DPBS and resuspended inFACS buffer containing the following: Live/Dead FixableNear-IR Dead cell stain (Thermo Fisher Scientific),anti-CD3-APC (cl. SK7), anti-CD4-PE (cl. SK3), andanti-CD8-FITC (cl. HIT8a) (all BD Biosciences). Cellswere incubated with the antibodies in the dark at 4 °Cfor 30 min, washed twice with FACS buffer, resuspendedin FACS buffer and acquired using a BD FACSCanto IIflow cytometer (BD Biosciences). Analysis was per-formed with FlowJo V10 software. Experiments wererepeated three times using T cells isolated from differentdonors.T cell proliferation was also measured using the APC
BrdU Flow Kit (BD Biosciences) according to the manu-facturer’s instructions. Briefly, 8 × 10⁵ T cells wereseeded in each well within LD or HD collagen gels or ontissue culture plastic for 3 days. For labelling, BrdU wasadded to the medium of each well (final concentration10 μM) and cells were incubated for 90 min at 37 °C in5% CO2. Afterwards, media of the wells with collagen gelswas aspirated and replaced with 3mg/ml collagenasesolution (Worthington). Collagenase was also added tothe media of 2D cultured cells in concentration similar towhich cells in 3D gels were exposed. After completedigestion of the collagen gels, cells were collected andwashed once with DPBS (Lonza) and stained with Live/
Dead Fixable Near-IR Dead cell stain (Thermo FisherScientific), anti-CD3-FITC (cl- UCHT1), anti-CD4-PE (cl.SK3), and anti-CD8-BV421 (cl. RPA-T8) (all BD Biosci-ences). Next, cells were fixed, permeabilized, and stainedwith APC anti-BrdU antibody according to the manufac-turer’s instructions. Cells were resuspended in FACSbuffer and acquired using a BD FACSCanto II or LSR IIflow cytometer (BD Biosciences). Analysis was performedwith FlowJo V10 software.
Cancer cell proliferation assayCell proliferation was determined using the APC BrdUFlow Kit (BD Biosciences). 50.000 cells were cultured inthe different 3D or 2D culture conditions for 5 days. Forlabelling, BrdU was added to the medium of each well(final concentration 10 μM) and cells were incubated for45 min at 37 °C in 5% CO2. After digestion of collagengels and washing, cells were stained with Zombie AquaFixable Viability Dye (BioLegend) to determine cellviability and analyzed for the fraction of BrdU positivecells as described above.
RNA extraction, cDNA synthesis and quantitative real-time-PCRFor RNA isolation, 8 × 10⁵ PBMCs enriched for T cells,purified T cells (isolated with anti-CD3 microbeads,Miltenyi Biotec), or purified CD8 positive cells (isolatedwith CD8 MicroBeads, Miltenyi Biotec) were transientlystimulated with PMA and ionomycin and seeded withinLD or HD collagen gels or on tissue culture plastic.After 2 days, total RNA from cell cultures was purifiedusing RNeasy kit (Qiagen) according to the manufac-turer’s instructions. Quality of samples was measuredusing an Agilent 2100 BioAnalyzer (Agilent Genomics).Afterwards 500 ng – 1 μg RNA per sample was reversetranscribed using iScript cDNA Synthesis Kit (Bio-Rad).The synthesized cDNA was used as template in areal-time quantitative PCR reaction using Brilliant IIIUltra-Fast SYBR Green (Agilent Technologies) accordingto the manufacturer’s standard protocol. Equal amountsof cDNA were applied in each reaction mixture. As acontrol for the specificity of the quantitative real-timePCR, a sample without template was included. Thereal-time cycler conditions were as follows: initial activa-tion step at 95 °C for 3 min, 40 cycles of denaturing at95 °C for 5 s, and annealing/extension at 60 °C for 20 s,followed by a melting curve analysis of 65–95 °C with0 .5°C increment, 5 s per step.All measurements were based on triplicates or quadru-
plicates of each cell culture condition measured induplicates and normalized to the internal control gene,ACTB. Four independent experiments were performed.The comparative cycle threshold (ΔΔCT) method wasused to calculate the relative fold changes.
Kuczek et al. Journal for ImmunoTherapy of Cancer (2019) 7:68 Page 3 of 15

Primers were designed using the Primer-BLAST tool(NCBI, NIH). All primers spanned exon-exon junction,and maximum product length was 250 bp. Primerefficiencies were measured for all primer sets and foundto be between 85 and 103%. Primers are listed inAdditional file 1: Table S2.T cell cultures from three different healthy donors
were established and transduced with high affinityMAGE-A3a3a, MAGE-A3a3c, or MART-1 TCR, respect-ively, as previously described [38]. For MART-1 TCRtransduction, the TCRα and β sequences of theHLA-A2-restricted MART-1-specific (MART_27–36:ELAGIGILTV) A42 T cell clone were used [39].1 × 106 TCR transduced T cells were embedded in
collagen of high (4 mg/ml) or low (1 mg/ml) densitytogether with 1 × 10⁵ FM82 melanoma cells [38] andcultured for 2 days, after which total RNA was purified.Extensive T cell-mediated melanoma cytotoxicity duringthe co-culture period resulted in the presence of evenfewer melanoma cells as compared to the starting point.
RNAseqThe quantity and purity of isolated RNA were assessedusing an Agilent 2100 BioAnalyzer (Agilent Genomics).Total RNA (500 ng) was prepared for sequencing usingpolydT-mediated cDNA synthesis in accordance withthe manufacturer’s (Illumina) instructions. Libraries weremade with a NEBNext RNA Library Preparation Kit forIllumina. Library quality was assessed using FragmentAnalyzer (AATI), followed by library quantification(Illumina Library Quantification Kit). Sequencing wasdone on a HiSeq1500 platform (Illumina) with a readlength of 50 bp. Sequenced reads were aligned to the hu-man genome assembly hg19 using STAR [40]. Uniquelyaligned reads were quantified at exons of annotatedgenes and normalized to sequence depth and genelength using HOMER [41]. Sequencing depth andalignment information is in Additional file 1: Table S3.The number of reads per kilobase per million mapped(RPKM) for all RefSeq annotated genes can be found inAdditional file 2: Table S1. The analysis of differentialexpression was performed using DESeq2 package in R[42]. Principal component analysis was performed usingR (prcomp package). Heatmaps were generated fromz-score normalized RPKM values using R (pheatmappackage) on selected sets of genes. MA and Volcanoplots were generated using R.
Cytotoxicity assayA 51Cr-release assay for T cell-mediated cytotoxicity wasused to assess the cytotoxicity of tumor infiltrating Tcells after 3D culture in collagen matrices of high or lowdensity. Autologous melanoma cells MM33 were used astarget cells [43]. Effector cells (T cells) were pre-cultured
on plastic or in 3D collagen cultures for 3 days, afterwhich cells were treated with 3 mg/ml collagenasesolution for 45–60min to extract them from the gels,and washed twice with media. Typically, 5 × 10⁵ targetcells in 150 μl RPMI were labelled with 20 μl 51Cr (Per-kin Elmer) in a 15ml falcon tube at 37 °C for 1 h. Afterwashing, 5 × 10³ target cells per well were plated out ina 96-well plate (Corning) and T cells were added atvarious effector to target cell (E:T) ratios. Cells wereincubated at 37 °C for 4 h. Next, the level of 51Cr in thesupernatant was measured using a Wallac Wizard 1470automatic γ counter (Perkin Elmer). The maximum 51Crrelease was determined by addition of 100 μl 10% TritonX-100, and minimum release was determined byaddition of 100 μl of RPMI to target cells. Specific lysiswas calculated using the following formula: ((cpm sample
– cpm minimum release)/(cpm maximum release – cpm minimum
release)) × 100%.
Statistical analysisAll individual experiments were performed at least threetimes with at least three replicates per condition andresults are presented as mean ± standard error of themean (SEM) unless otherwise specified. For two-groupcomparisons between cells from the same donors, pairedtwo-tailed Student’s t-tests were performed. Formulti-group comparisons, one-way analysis of variance(ANOVA) was used followed by paired two-tailedStudent’s t-tests. All statistical analyses were performedusing GraphPad Prism. A p-value < 0.05 was consideredstatistically significant. Correlation between PSR-positivearea and CD8+ cell abundance was analyzed by Pearsoncorrelation.
Correlation of expression levels of collagen and T cellactivation markers in oral cancerTo study the correlation between collagen type I(COL1A1) levels and the expression level of 7 markers ofT cell activation, we used an already publishedsingle-cell RNA sequencing dataset available in theGene Expression Omnibus (GSE103322). In the studyby Puram et al. [44], head and neck tumors from 18patients and 5 matching lymph nodes were disaggregated,sorted into single cells and profiled using Smart-seq2.Here, we used the already processed data discardinglymph node samples (https://www.ncbi.nlm.nih.gov/geo/query/acc.cgi?acc=GSE103322), which contain expressionlevels of 23,686 genes in 4541 single-cells (including fibro-blasts, B cells, T cells, dendritic cells, endothelial cells,macrophages, mast cells, myocytes, and cancer andnon-cancer cells). To investigate correlation between col-lagen and T cell activation markers, we first calculatedaverage expression levels of COL1A1 across all cell typesand expression of each T cell marker across T cells for
Kuczek et al. Journal for ImmunoTherapy of Cancer (2019) 7:68 Page 4 of 15

each patient. Then, we calculated pairwise Pearson correl-ation between average expression levels of COL1A1 andeach T cell activation marker. All data processing and cor-relation analysis were performed using Pythons SciPy andPandas [45].
Additional materials and methodsDetailed information about cancer cell culture, confocalmicroscopy, flow cytometry analysis of T cell subsets, hist-ology, and ELISA can be found in the Additional file 3.
Results3D culture of T cells in different collagen densitiesimpairs proliferation without compromising viabilityTo investigate if 3D culture in collagen matrices ofdifferent collagen concentrations affected the viability ofT cells, we isolated T cells from healthy donors and tran-siently stimulated the cells with PMA and ionomycin.This type of stimulation bypasses T cell receptor activa-tion but acts on several of the same downstream signal-ing pathways including Protein Kinase C [46]. The Tcells were embedded in collagen matrices of high (4 mg/ml) or low (1 mg/ml) collagen concentration, or seededon regular tissue culture plastic (2D culture) and cul-tured for 5 days. The selected collagen concentration of1 mg/ml is representative of healthy normal tissue suchas lung or mammary gland whereas 4 mg/ml collagengels mimic the tissue stiffening occurring in solid tumors[19, 47]. To completely avoid cellular contact with theplastic surface of the wells, the 3D culture wasestablished on top of a pre-generated collagen matrixwithout cells (Fig. 1a). To evaluate if viability of the Tcells was affected by the different culture conditions,cells were extracted from the collagen matrices by a briefcollagenase-treatment, stained with a live/dead cellmarker and analyzed by flow cytometry (Fig. 1b). A highviability of more than 95% was observed in both 2D cul-ture and in 3D culture in different collagen densities. Tovisualize the 3D culture of T cells in collagen matrices ofdifferent collagen concentrations, purified T cells wereembedded in collagen matrices and imaged by confocalfluorescent microscopy (Fig. 1c-e). As expected, 3Dcultured T cells were completely surrounded by collagen(Fig. 1c). The structure and density of collagen fiberswere clearly different in the matrices of different colla-gen concentrations but no apparent morphologicalchanges were observed between T cells in 3D culture ofhigh or low collagen density (Fig. 1d-e). To examine if Tcell proliferation was affected by collagen density, T cellswere transiently PMA/ionomycin stimulated, CellTraceViolet (CTV) labeled, and embedded in a high- orlow-density collagen matrix or cultured on regular tissueculture plastic. Flow cytometry-based analysis of CTVdilution in CD3+ cells showed a clear reduction in
proliferation when cells were cultured in 3D comparedto 2D. Interestingly, we also observed a smaller but stillsignificant reduction in proliferation when T cellswere cultured in a high-density collagen matrix com-pared to a low-density collagen matrix (Fig. 1f-g).This result was confirmed using a BrdU-based prolif-eration assay (Fig. 1h). In consistence with other re-ports [21, 48] we did not observe that proliferation ofcancer cell lines was similarly impaired in a high-densitycollagen matrix (Fig. 1i).The effects were similar for CD4+ and CD8+ T cells
(Additional file 1: Figure S1) and consistently the differ-ent culture conditions did not change the ratio of CD4+cells to CD8+ cells after 2 days in culture (Fig. 1j). How-ever, after prolonged 3D culture of T cells for 5 days, theratio of CD4+ cells to CD8+ cells was higher in ahigh-density matrix compared to a low-density matrix(Fig. 1k), indicating that proliferation and/or survival isslightly more impaired for CD8+ cells than for CD4+cells in a high-density collagen matrix. Analysis of thedistribution of the different T cell differentiation subsetsafter 5 days of 3D culture in a high- or low-densitycollagen matrix or regular 2D culture (Additional file 1:Figure S2) suggested an increase in effector memory Tcells and a decrease in central memory T cells after 3Dculture in a high-density collagen matrix compared to alow-density collagen matrix.To study if the reduced T cell proliferation in a
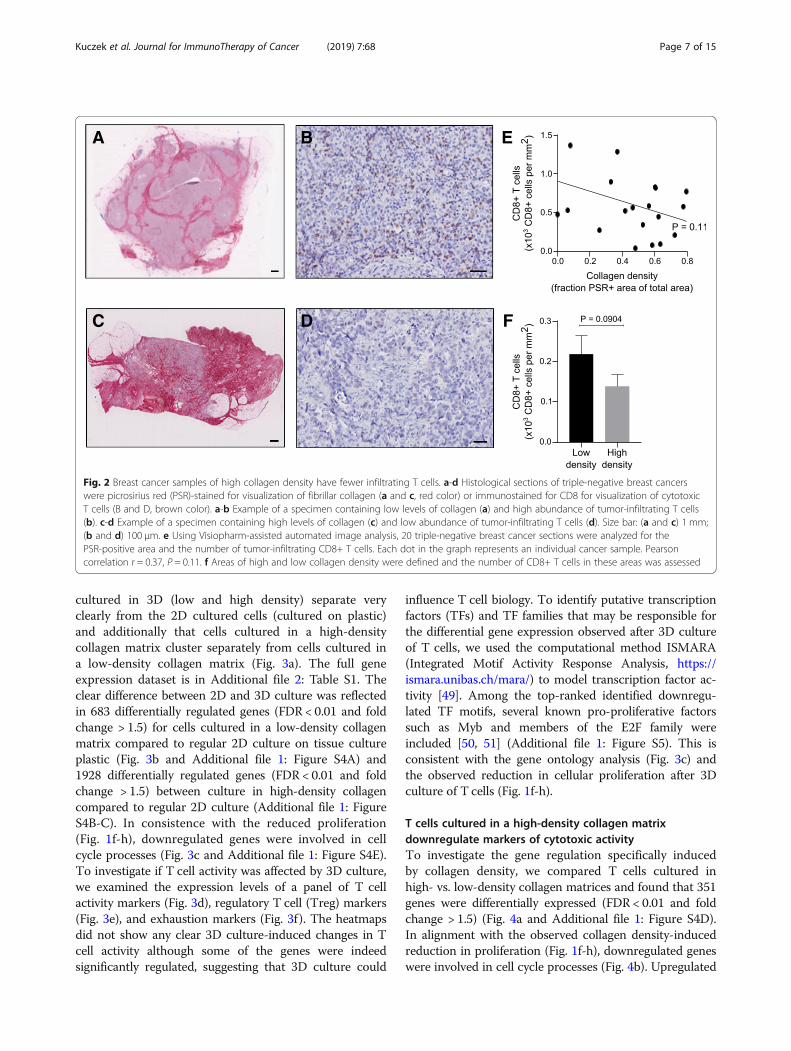
high-density collagen matrix could be reflected in thedifferential abundance of tumor-infiltrating T cells inbreast tumors, we examined 20 samples of resectedtriple-negative breast cancers, which were all of histo-logical grade 3 and had a diameter between 10 and 20mm. The samples were immunostained for CD8 andpicrosirius red-stained for fibrillar collagen (Fig. 2a-d).Consistent with our 3D culture data, samples thatcontained a high collagen density often had fewer infil-trating CD8+ T cells, although this negative correlationfailed to reach statistically significance with this lim-ited material (Fig. 2e). Analysis of the number of CD8+ cells located in intratumoral regions of either highor low collagen density within each tumor sample(Additional file 1: Figure S3) also revealed a tendencyof fewer CD8+ T cells in regions of high collagendensity (Fig. 2f ).
The gene expression profile of T cells is regulated bysurrounding extracellular matrixTo further elucidate the response of T cells to 3Dculture in different collagen densities, T cells were 3Dcultured for 2 days in low- or high-density collagenmatrices or cultured on regular tissue culture plastic andsubjected to RNA sequencing. A principal componentanalysis shows that the gene expression profile of cells
Kuczek et al. Journal for ImmunoTherapy of Cancer (2019) 7:68 Page 5 of 15

A
F
I J K
G H
B C
D E
Fig. 1 3D culture in high collagen density impairs T cell proliferation. a Schematic model of the 3D culture system. b T cells were cultured for 5days in the indicated conditions, and subsequently viability was analyzed by flow cytometry. Each dot in the graph represents an individualdonor. Error bars indicate standard error of the mean (SEM). c-e T cells cultured in a collagen matrix of low density (1 mg/ml, c-d) or high density(4 mg/ml, E) including fluorescently labeled collagen were imaged by confocal microscopy. c 3D projection of collagen matrix with embeddedT cells. d-e Representative images of individual T cells within a low- density collagen matrix (d) or high-density collagen matrix (e). Size bars:(c-e) 10 μm. f-g T cell proliferation after 5 days in culture was measured by flow cytometry-based analysis of CellTrace Violet (CTV) dilution.f Representative histogram showing CTV dilution in T cells cultured in 2D or in 3D in a low-density collagen matrix or high-density collagenmatrix. g Quantification of T cell proliferation based on CTV dilution. Three individual donors were analyzed. Connecting lines indicatemeasurements of the same donor. h T cells were cultured in collagen gels of high and low density and their proliferation was measured usinga BrdU-based flow cytometry assay. The percentage of CD3-positive BrdU-positive cells is shown. i The breast cancer cell lines EO771.LMB,MDA-MB-231, and 4 T1 were cultured in collagen matrices of low or high density for 5 days and analyzed using a BrdU-based flow cytometryassay. The percentage of BrdU-positive cells is depicted. j-k The ratio of CD4+ to CD8+ cells was analyzed by flow cytometry after culture for 2days (i) or 5 days (j). g-k Error bars indicate standard deviations of technical replicates
Kuczek et al. Journal for ImmunoTherapy of Cancer (2019) 7:68 Page 6 of 15
cultured in 3D (low and high density) separate veryclearly from the 2D cultured cells (cultured on plastic)and additionally that cells cultured in a high-densitycollagen matrix cluster separately from cells cultured ina low-density collagen matrix (Fig. 3a). The full geneexpression dataset is in Additional file 2: Table S1. Theclear difference between 2D and 3D culture was reflectedin 683 differentially regulated genes (FDR < 0.01 and foldchange > 1.5) for cells cultured in a low-density collagenmatrix compared to regular 2D culture on tissue cultureplastic (Fig. 3b and Additional file 1: Figure S4A) and1928 differentially regulated genes (FDR < 0.01 and foldchange > 1.5) between culture in high-density collagencompared to regular 2D culture (Additional file 1: FigureS4B-C). In consistence with the reduced proliferation(Fig. 1f-h), downregulated genes were involved in cellcycle processes (Fig. 3c and Additional file 1: Figure S4E).To investigate if T cell activity was affected by 3D culture,we examined the expression levels of a panel of T cellactivity markers (Fig. 3d), regulatory T cell (Treg) markers(Fig. 3e), and exhaustion markers (Fig. 3f). The heatmapsdid not show any clear 3D culture-induced changes in Tcell activity although some of the genes were indeedsignificantly regulated, suggesting that 3D culture could
influence T cell biology. To identify putative transcriptionfactors (TFs) and TF families that may be responsible forthe differential gene expression observed after 3D cultureof T cells, we used the computational method ISMARA(Integrated Motif Activity Response Analysis, https://ismara.unibas.ch/mara/) to model transcription factor ac-tivity [49]. Among the top-ranked identified downregu-lated TF motifs, several known pro-proliferative factorssuch as Myb and members of the E2F family wereincluded [50, 51] (Additional file 1: Figure S5). This isconsistent with the gene ontology analysis (Fig. 3c) andthe observed reduction in cellular proliferation after 3Dculture of T cells (Fig. 1f-h).
T cells cultured in a high-density collagen matrixdownregulate markers of cytotoxic activityTo investigate the gene regulation specifically inducedby collagen density, we compared T cells cultured inhigh- vs. low-density collagen matrices and found that 351genes were differentially expressed (FDR < 0.01 and foldchange > 1.5) (Fig. 4a and Additional file 1: Figure S4D).In alignment with the observed collagen density-inducedreduction in proliferation (Fig. 1f-h), downregulated geneswere involved in cell cycle processes (Fig. 4b). Upregulated
A B E
C D F
Fig. 2 Breast cancer samples of high collagen density have fewer infiltrating T cells. a-d Histological sections of triple-negative breast cancerswere picrosirius red (PSR)-stained for visualization of fibrillar collagen (a and c, red color) or immunostained for CD8 for visualization of cytotoxicT cells (B and D, brown color). a-b Example of a specimen containing low levels of collagen (a) and high abundance of tumor-infiltrating T cells(b). c-d Example of a specimen containing high levels of collagen (c) and low abundance of tumor-infiltrating T cells (d). Size bar: (a and c) 1 mm;(b and d) 100 μm. e Using Visiopharm-assisted automated image analysis, 20 triple-negative breast cancer sections were analyzed for thePSR-positive area and the number of tumor-infiltrating CD8+ T cells. Each dot in the graph represents an individual cancer sample. Pearsoncorrelation r = 0.37, P = 0.11. f Areas of high and low collagen density were defined and the number of CD8+ T cells in these areas was assessed
Kuczek et al. Journal for ImmunoTherapy of Cancer (2019) 7:68 Page 7 of 15

genes were involved in processes such as chemotaxis andcell migration (Fig. 4b). Of the 10 most significantly up-and down-regulated genes (Table 1), several have beensuggested to impact T cell activity. CD101, which is upreg-ulated in a high-density matrix, has been suggested to beinvolved in the negative regulation of T cell activity [52]and the expression levels on Tregs correlate with theirimmunosuppressive potency [53]. CIP2A, which is down-regulated in a high-density matrix, has been suggested topromote T cell activation [54].
To investigate the potential regulation of T cell activityby collagen density, we visualized the regulation of apanel of cytotoxic activity markers, exhaustion markers,and markers of Tregs (Fig. 4c-e). Transcripts encodingsix out of seven T cell activity markers were significantlydownregulated by culture in high-density collagencompared to low-density collagen (Fig. 4c). Only TNFdid not follow the same trend and was instead signifi-cantly upregulated. At the same time Treg markers wereslightly upregulated (Fig. 4d). The markers of T cell
A
C D
E
F
B
Fig. 3 Distinct transcriptomic signatures in 2D culture and in 3D culture in different collagen densities. a Principal component analysis of eachRNAseq replicate of T cells cultured on plastic (2D) or in 1 mg/ml (low density) or 4 mg/ml (high density) collagen matrices for 2 days. b MA plotillustrating the differentially regulated genes (FDR < 0.01 and fold change > +/− 1.5) between cells cultured in a low-density collagen matrix or inregular 2D culture. Genes that are upregulated in low-density collagen compared to 2D are shown in red and downregulated genes are shownin blue. c Gene ontology analysis illustrates biological processes most significantly enriched within genes that are upregulated (left panel, redbars) or downregulated (right panel, blue bars) in low density collagen compared to 2D. d-f Heatmaps of normalized (Z-score) RNAseq readcounts of genes encoding markers of T cell activity (d), Tregs (e), or T cell exhaustion (f). d-f Asterisks indicate significantly regulated genes
Kuczek et al. Journal for ImmunoTherapy of Cancer (2019) 7:68 Page 8 of 15
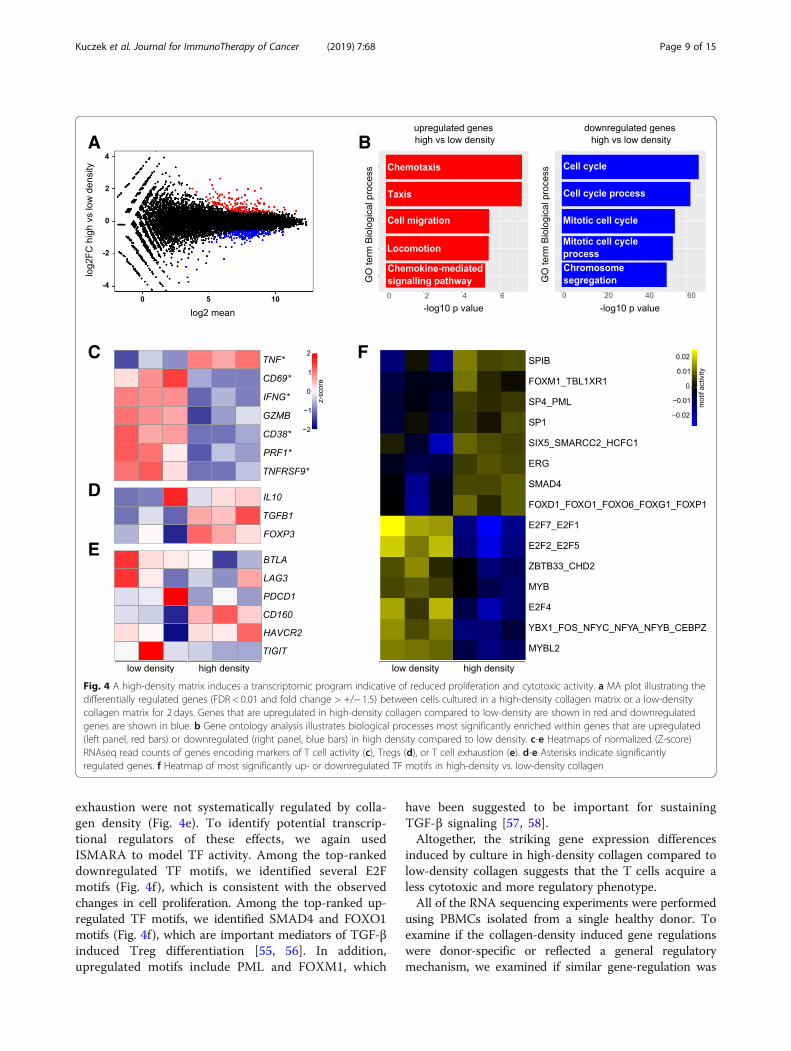
exhaustion were not systematically regulated by colla-gen density (Fig. 4e). To identify potential transcrip-tional regulators of these effects, we again usedISMARA to model TF activity. Among the top-rankeddownregulated TF motifs, we identified several E2Fmotifs (Fig. 4f ), which is consistent with the observedchanges in cell proliferation. Among the top-ranked up-regulated TF motifs, we identified SMAD4 and FOXO1motifs (Fig. 4f), which are important mediators of TGF-βinduced Treg differentiation [55, 56]. In addition,upregulated motifs include PML and FOXM1, which
have been suggested to be important for sustainingTGF-β signaling [57, 58].Altogether, the striking gene expression differences
induced by culture in high-density collagen compared tolow-density collagen suggests that the T cells acquire aless cytotoxic and more regulatory phenotype.All of the RNA sequencing experiments were performed
using PBMCs isolated from a single healthy donor. Toexamine if the collagen-density induced gene regulationswere donor-specific or reflected a general regulatorymechanism, we examined if similar gene-regulation was
A
C F
D
E
B
Fig. 4 A high-density matrix induces a transcriptomic program indicative of reduced proliferation and cytotoxic activity. a MA plot illustrating thedifferentially regulated genes (FDR < 0.01 and fold change > +/− 1.5) between cells cultured in a high-density collagen matrix or a low-densitycollagen matrix for 2 days. Genes that are upregulated in high-density collagen compared to low-density are shown in red and downregulatedgenes are shown in blue. b Gene ontology analysis illustrates biological processes most significantly enriched within genes that are upregulated(left panel, red bars) or downregulated (right panel, blue bars) in high density compared to low density. c-e Heatmaps of normalized (Z-score)RNAseq read counts of genes encoding markers of T cell activity (c), Tregs (d), or T cell exhaustion (e). d-e Asterisks indicate significantlyregulated genes. f Heatmap of most significantly up- or downregulated TF motifs in high-density vs. low-density collagen
Kuczek et al. Journal for ImmunoTherapy of Cancer (2019) 7:68 Page 9 of 15

observed in cells isolated from four additional healthydonors. A panel of six transcripts, which were significantlyregulated by collagen-density in the RNA sequencing ex-periments (two upregulated and four downregulated),were analyzed by qRT-PCR and compared to the RNAsequencing data (Fig. 5a-b). The gene-regulations followedthe same pattern as observed in the RNA sequencingexperiments, with four of the six genes showing a statisti-cally significant regulation. This experiment as well as theRNA sequencing was performed with PBMCs enrichedfor T cells by excluding the strongly adherent fraction ofthe PBMCs, and consequently approximately 70% of thecells were T cells (data not shown). To investigate if theremaining 30% cells, which include myeloid cells, could becritical for mediating this effect of collagen-density wepurified T cells from PBMCs from four healthy donorsusing magnetic anti-CD3 microbeads, resulting in a T cellpurity of more than 96% (data not shown). The purified Tcells were again transiently PMA/ionomycin-stimulatedand cultured in high-density collagen or low-densitycollagen. Analysis by qRT-PCR of the six-gene panelshowed a similar pattern of gene-regulations, indicatingthat T cells are directly affected by the surrounding colla-gen density (Fig. 5c). The only gene that did not follow the
same pattern in the purified T cell was TNFRSF9, poten-tially indicating the myeloid cells were involved in mediat-ing the previously observed upregulation of TNFRSF9.Analysis of purified CD8+ T cells after culture in collagenof high or low density showed that cytotoxic CD8-positiveT cells responded to the surrounding collagen matrix in acomparable manner as observed for total CD3+ T cells(Fig. 5d). To investigate if TCR-stimulated T cellsresponded similarly to the surrounding collagen density,we co-cultured MAGE-A3 or MART-1 TCR-transducedT cells together with the melanoma cell line FM82 [38]within collagen matrices (Fig. 5e). Analysis of thesame six-gene panel showed a similar response as ob-served for the purified T cells stimulated with PMA/ionomycin (Fig. 5c-d).
Collagen density modulates the tumoricidal activity oftumor-infiltrating T cellsTo investigate if the collagen density-induced transcrip-tional regulation of T cells was also reflected in an alteredcytotoxic activity, we used a matched set of cultured Tcells and melanoma cells isolated from the same tumorfragment. The T cell culture from this patient (MM33) haspreviously been shown to contain tumor-reactive T cellsand to have the ability to lyze autologous melanoma cells[43]. The MM33 T cells were transiently PMA/ionomy-cin-stimulated and 3D cultured for 2 days in a low-densitycollagen matrix or a high-density collagen matrix or onregular tissue culture plastic. Subsequently, the cells wereextracted from the matrices and assayed for their ability tolyze melanoma cells in a standard four-hour Cr-51 releaseassay (Fig. 6a). The incubation of melanoma cells with in-creasing numbers of T cells led to increased cell lysis, butthe cytotoxic activity of the T cells was impaired after 3Dculture compared to 2D culture. Strikingly, cytotoxicitywas particularly low for T cells cultured in high-densitycollagen matrix (Fig. 6a-b). The collagen density-inducedregulation of T cell cytotoxicity was also reflected in areduced level of secreted IFN-γ for the MM33 T cellscultured in a high-density collagen matrix (Fig. 6c). Inthese experiments, stimulation with PMA/ionomycin ledto noticeable cell death for a large fraction of the cells,which is probably due to the preceding expansion of thecells in high-dose IL-2 containing media. Therefore, wealso 3D cultured the T cell for 2 days without any stimula-tion followed by extraction of cells for cytotoxicitymeasurements (Fig. 6d). In this situation we also observeda reduced cytotoxic activity of the T cells cultured in ahigh-density collagen matrix compared to the T cellscultured in a low-density collagen matrix (Fig. 6d-e). Thereduced cytotoxicity was again accompanied by reducedsecretion of IFN-γ, although it should be noted that IFN-γlevels were much lower than for the PMA/ionomycintreated T cells (Fig. 6f).
Table 1 Top up- or downregulated genes in high-density vs.low-density collagen
Gene name Fold change FDR
Upregulated genes
PMEPA1 4.07834 1.41531E-61
COL6A3 3.68014 3.12178E-51
CD101 3.95483 1.25389E-41
SPON1 2.62745 8.14423E-38
BMF 1.79401 2.27592E-33
LDLRAD4 1.84521 4.21774E-25
KLF7 2.22110 6.98652E-25
DIXDC1 3.00926 5.88243E-24
SRGAP3 3.09677 1.52178E-23
IL2RB 1.55381 4.34924E-23
Downregulated genes
ESPL1 −2.23355 2.11961E-28
TOP2A −1.77958 1.68833E-20
KIF11 −1.85991 2.13272E-18
CSF2 −5.01719 5.95403E-18
KNL1 −2.36757 3.00598E-17
CENPE −2.49309 3.37425E-17
IL2RA −1.72578 7.80826E-17
CIP2A −2.08149 2.08037E-15
IL12RB2 −1.68486 2.31599E-15
NCAPG −1.97323 3.16306E-15
Kuczek et al. Journal for ImmunoTherapy of Cancer (2019) 7:68 Page 10 of 15

A B
C D
E F
Fig. 5 (See legend on next page.)
Kuczek et al. Journal for ImmunoTherapy of Cancer (2019) 7:68 Page 11 of 15

Taken together, our study reveals a novel immunosup-pressive mechanism, which could be important for can-cer progression and for cancer immunotherapy efficacy.
DiscussionCollagen density within tumors and their T cell infiltra-tion comprise strong prognostic indicators of poor andgood prognosis, respectively. It has, however, not beeninvestigated if these two parameters are independent orif they are interrelated. In this study, we used 3D cultureto address whether T cells respond to the surrounding
collagen matrix and if the collagen-density alters theiractivity.A first important observation made was that T cells in-
deed respond to their extracellular matrix environment.This was reflected in a dramatically altered transcrip-tional profile and reduced proliferation for 3D culturedcells compared to regular 2D culture on tissue cultureplastic. Gene ontology analysis to identify biologicalprocess categories that were statistically enriched con-firmed that cell proliferation was significantly affected in3D. This suggests that 3D culture models, which more
(See figure on previous page.)Fig. 5 T cells from different donors respond similarly to the surrounding collagen density. a Bar graph of normalized (Z-score) RNAseq readcounts of a selected panel of differentially regulated genes. b-e Bar graphs of qRT-PCR analyses of the same panel of genes as in (a) in 3–4different donors. Cultured cells were either PBMCs enriched for T cells (b), purified T cells (c), purified CD8+ cells (d) or TCR transduced T cells(e) cultured for 2 days in a high-density collagen matrix or a low-density collagen matrix. f Table of correlation analyses between COL1A1 geneand the same panel of genes as in (a) from a single-cell RNA sequencing dataset available in the Gene Expression Omnibus (GSE103322)(a-f) Asterisks indicate significantly regulated genes
A B C
D E F
Fig. 6 Tumor-infiltrating T cells display reduced cytotoxicity after culture in a high-density collagen matrix. Tumor-infiltrating T cells frommelanoma MM33 were cultured for 3 days on plastic (2D) or in collagen matrices of high- or low density, after which the cells were assayed fortheir ability to lyze autologous MM3 melanoma cells using a 51Cr-release assay. T cells were transiently PMA/ionomycin stimulated before theculture period (a-c) or cultured without any stimulus (d-f). (a and d) Representative example of MM33 melanoma cell lysis after 4 h incubationwith different numbers of T cells, which had been transiently PMA/ionomycin stimulated (a) or directly embedded in collagen (d) and pre-cultured as indicated. b Percentage of melanoma cell lysis at the highest T cell: melanoma cell ratio in 3 different experiments. The T cells hadbeen transiently PMA/ionomycin stimulated and cultured for 3 days in a low-density or high-density collagen matrix before extraction andincubation with 51Cr-labeled MM33 melanoma cells. c and f IFNγ levels in conditioned media of MM33 T cells, which had been transientlyPMA/ionomycin stimulated (c) or directly embedded in collagen (f) and cultured for 3 days in a low-density or high-density collagen matrix.e Percentage of melanoma cell lysis at the highest T cell: melanoma cell ratio in 5 different experiments. The T cells had been cultured for 3 daysin a low-density or high-density collagen matrix before extraction and incubation with 51Cr-labeled MM33 melanoma cells
Kuczek et al. Journal for ImmunoTherapy of Cancer (2019) 7:68 Page 12 of 15
accurately mimic tissue environments, could be highlyrelevant for studies of T cell biology. Although 3Dculture of T cells, compared to regular 2D culture, led toa substantial change in the transcriptional profile, in-spection of genes encoding markers of activation, Tregs,or exhaustion did not reveal any obvious pattern in theeffects on T cell activity.Another important observation in this study was that
T cells clearly respond to the density of the surroundingcollagen matrix. Culture of T cells within collagen-matri-ces of either high or low density resulted in fewer differ-entially regulated genes compared to the culture of Tcells in 2D vs. 3D but nevertheless resulted in strikingfunctional differences. A high collagen-density reducedT cell proliferation and 5 days of culture in this matrixfavored CD4+ T cells over CD8+ T cells. A similarreduction in cell proliferation was not observed for threedifferent breast cancer cell lines, suggesting that within atumor of high collagen density, T cell proliferation (espe-cially CD8+ T cell proliferation) is impaired whereascancer cells are unaffected. In line with these observa-tions, we observed in a limited number of triple-negativebreast cancer samples, that collagen density seemed tonegatively impact CD8+ T cell abundance. The effect ofcollagen density on T cell proliferation could constitutea new immunosuppressive mechanism within the tumormicroenvironment and provide an explanation for thecorrelation between collagen density in tumors andcancer patient prognosis.In alignment with the effect of the surrounding
collagen density on T cell proliferation, inspection ofdifferentially regulated genes confirmed that cell cycleprocesses were affected. In addition, markers of cyto-toxic T cell activity were clearly downregulated by ahigh-density collagen matrix compared to a low-densitymatrix whereas markers of Tregs were upregulated. Thisstriking observation suggests that collagen density, inaddition to reducing T cell proliferation, impairs cyto-toxic activity. Analysis of putative transcription factormotifs, which could mediate the observed transcriptionalchanges, identify decreased activity of E2F motifs and in-creased activity of transcription factor motifs down-stream of TGF-β signaling. These findings suggest thatE2F transcription factors could be involved in the colla-gen density-induced inhibition of T cell proliferation andthat autocrine TGF-β signaling could be centrallyengaged in the modulation of T cell activity.Using a unique T cell culture and melanoma cell
culture established from the same resected melanoma,we could also demonstrate that the tumor-infiltrating Tcells were indeed less efficient at killing the melanomacells after culture in a high-density collagen matrixcompared to a low-density collagen matrix. This obser-vation suggests that the collagen-density of the tumor
microenvironment can support the cancer cells’ escapefrom immune destruction by reducing T cell prolifera-tion and by modulating the cytotoxic activity oftumor-infiltrating T cells. This identified immunosup-pressive mechanism could be of relevance during tumorprogression but also have importance for the efficacy ofcancer immunotherapy.Although this is the first study to directly assess the
response of T cells to the surrounding collagen density,the potential of collagen to modulate immune activity issupported by a study of tissue regeneration, in whichcollagen implantation in wounded muscles of mice wasshown to induce an immunosuppressive microenviron-ment [59]. This effect involved M2-polarization ofmacrophages, which led to Th2-polarization of T cells.In our study we focused on the ability of the surround-ing collagen to directly regulate T cell activity, but it ispossible that collagen-induced M2-polarization of mac-rophages could further augment this modulation of Tcells.In addition to the effects of collagen-density on T cell
activity observed in this study, others have suggestedthat stromal collagen could limit the migration of T cellsinto the tumor islets and thereby impede their contactwith cancer cells [35, 36]. The impaired T cell migrationinto tumor islets was suggested to be caused by reducedmotility in collagen-dense region combined with in-appropriate guidance of T cells by the collagen fibersaligned in parallel to tumor islets. These studies furtherunderscore that collagen within the tumor microenvir-onment could be an important regulator of anti-cancerimmunity.
ConclusionBy using 3D culture of T cells, we have identified col-lagen density as a novel regulator of anti-cancer Tcell activity. This immunosuppressive mechanismcould be of central importance for the cancer cells’evasion of immune-destruction and could constitute anovel therapeutic target for enhancing immunother-apy efficacy.
Additional files
Additional file 1: Figure S1. Proliferation of CDLA and CD8A T cells.Figure S2. Fraction of T cell subsets after HD culture or %D culture indifferent collagen densities. Figure S3. Analysis of CD8+ T cell abundancein areas of high and low collagen density in 20 triple negative breast cancersamples. Figure S4. RNAseq data. Figure S5. Regulated transcription factorsafter 2D culture or 3D culture in low density collagen. Table S2. Sequencesof primers used for RT-qPCR. All primers were designed using the NCBI genedatabase and the primer-BLAST tool. Table S3. RNA sequencing depth andalignment info. (PDF 1041 kb)
Additional file 2: The number of reads per kilobase per million mapped(RPKM) for all RefSeq annotated genes. (XLSX 5563 kb)
Kuczek et al. Journal for ImmunoTherapy of Cancer (2019) 7:68 Page 13 of 15

Additional file 3: Supplementary materials and methods. (PDF 91 kb)
AbbreviationsCTV: Cell trace violet; ECM: Extracellular matrix; MDSCs: Myeloid-derivedsuppressor cells; PBMCs: Peripheral blood mononuclear cells; PD-1: Programmed cell death protein 1; PD-L1: Programmed death-ligand 1;PMA: Phorbol 12-myristate 13-acetate; TAMs: Tumor-associated macrophages;TCR: T cell receptor; TGF-β: Transforming growth factor β; Tregs: Regulatory Tcells
AcknowledgmentsWe thank Drs. Thomas H. Bugge and Marie Kveiborg for critically reviewingthis manuscript. We thank Dr. Alberto Santos for his help with bioinformaticsanalyses. We would like to acknowledge Dr. Andrew Gerry and Dr. BentJakobsen of Adaptimmune Ltd. (Oxfordshire, UK) for supplying us withlentiviral vectors for high affinity MAGE-A3 TCR transduction.
FundingThis study was supported by the Danish Cancer Society (D.H.M.), KnækCancer (D.H.M.), Novo Nordisk Foundation (D.H.M.), Dagmar MarshallsFoundation (D.E.K., D.H.M.), Dansk Kræftforskningsfond (D.E.K.), EinarWillumsen Foundation (D.E.K.), and Immutrain Project, EU’s H2020 underMarie-Sklodowska-Curie grant agreement 641549 (A.M.C.S.).
Availability of data and materialsThe datasets obtained in the current study are available from thecorresponding author or available from the indicated sources.
Authors’ contributionsConceptualization, DHM and DEK; Methodology, DHM, DEK, LHE, EN, MD,IMS, PtS and LG; Investigation, DHM, DEK, AMHL, MLT, MC, AK, MSS, AMCS,AR, LG; Writing – Original Draft, DHM and DEK; Writing – Review & Editing,DHM, DEK, AMHL, MLT, MC, AK, MSS, AMCS, AR, LHE, EN, MD, IMS, PtS, LG. Allauthors read and approved the final manuscript.
Ethics approval and consent to participateHealthy donor PBLs were obtained from buffy coats available from thecentral blood bank of the capital region of Copenhagen and informedconsent was obtained from all donors. Breast cancer samples wereanonymized and used upon approval by the Scientific Ethics Committee forThe Capital Region of Denmark.
Consent for publicationNot applicable.
Competing interestsThe authors declare that they have no competing interests.
Publisher’s NoteSpringer Nature remains neutral with regard to jurisdictional claims inpublished maps and institutional affiliations.
Author details1Center for Cancer Immune Therapy, Department of Hematology,Copenhagen University Hospital Herlev, Herlev, Denmark. 2Finsen Laboratory,Biotech Research and Innovation Centre, University of Copenhagen,Copenhagen, Denmark. 3Roskilde University Center, Roskilde, Denmark.4Department of Biochemistry and Molecular Biology, University of SouthernDenmark, Odense, Denmark. 5Department of Pathology, CopenhagenUniversity Hospital Herlev, Herlev, Denmark. 6Immunoanalytics: Tissue controlof Immunocytes, German Research Center for Environmental Health,Helmholtz Zentrum München, Munich, Germany. 7Institute for Immunologyand Microbiology, University of Copenhagen, Copenhagen, Denmark.8Department of Oncology, Copenhagen University Hospital Herlev, Herlev,Denmark.
Received: 1 November 2018 Accepted: 4 March 2019
References1. Fridman WH, Zitvogel L, Sautès–Fridman C, Kroemer G. The immune
contexture in cancer prognosis and treatment. Nat Rev Clin Oncol.2017;14:717–34.
2. Tumeh PC, Harview CL, Yearley JH, Shintaku IP, Taylor EJM, Robert L, et al.PD-1 blockade induces responses by inhibiting adaptive immune resistance.Nature. 2014;515:568–71.
3. Dunn GP, Bruce AT, Ikeda H, Old LJ, Schreiber RD. Cancer immunoediting:from immuno-surveillance to tumor escape. Nat Immunol. 2002;3:991–8.
4. Munn DH, Bronte V. Immune suppressive mechanisms in the tumormicroenvironment. Curr Opin Immunol. 2016;39:1–6.
5. Joyce JA, Fearon DT. T cell exclusion, immune privilege, and the tumormicroenvironment. Science. 2015;348:74–80.
6. Kumar V, Patel S, Tcyganov E, Gabrilovich DI. The nature of myeloid-derivedsuppressor cells in the tumor microenvironment. Trends Immunol. 2016;37:208–20.
7. Sharma P, Allison JP. The future of immune checkpoint therapy. Science.2015;348:56–61.
8. Madsen DH, Bugge TH. The source of matrix-degrading enzymes in humancancer: problems of research reproducibility and possible solutions. J CellBiol. 2015;209:195–8.
9. Madsen DH, Jürgensen HJ, Siersbæk MS, Kuczek DE, Grey Cloud L, Liu S, et al.Tumor-associated macrophages derived from circulating inflammatorymonocytes degrade collagen through cellular uptake. Cell Rep. 2017;21:3662–71.
10. Kessenbrock K, Plaks V, Werb Z. Matrix metalloproteinases: regulators of thetumor microenvironment. Cell. 2010;141:52–67.
11. Schedin P, Keely PJ. Mammary gland ECM remodeling, stiffness, andmechanosignaling in normal development and tumor progression. ColdSpring Harb Perspect Biol. 2011;3:a003228.
12. Cox TR, Erler JT. Molecular pathways: connecting fibrosis and solid tumormetastasis. Clin Cancer Res. 2014;20:3637–43.
13. Naba A, Clauser KR, Lamar JM, Carr SA, Hynes RO. Extracellular matrixsignatures of human mammary carcinoma identify novel metastasispromoters. Elife. 2014;3:e01308.
14. Cox TR, Bird D, Baker A-M, Barker HE, Ho MW-Y, Lang G, et al. LOX-mediatedcollagen crosslinking is responsible for fibrosis-enhanced metastasis. CancerRes. 2013;73:1721–32.
15. Pickup MW, Mouw JK, Weaver VM. The extracellular matrix modulates thehallmarks of cancer. EMBO Rep. 2014;15:1243–53.
16. Conklin MW, Eickhoff JC, Riching KM, Pehlke CA, Eliceiri KW, Provenzano PP,et al. Aligned collagen is a prognostic signature for survival in human breastcarcinoma. Am J Pathol. 2011;178:1221–32.
17. Ohno S, Tachibana M, Fujii T, Ueda S, Kubota H, Nagasue N. Role of stromalcollagen in immunomodulation and prognosis of advanced gastriccarcinoma. Int J Cancer. 2002;97:770–4.
18. Li H-X, Zheng J-H, Fan H-X, Li H-P, Gao Z-X, Chen D. Expression of αvβ6integrin and collagen fibre in oral squamous cell carcinoma: associationwith clinical outcomes and prognostic implications. J Oral Pathol Med.2013;42:547–56.
19. Paszek MJ, Zahir N, Johnson KR, Lakins JN, Rozenberg GI, Gefen A, et al. Tensionalhomeostasis and the malignant phenotype. Cancer Cell. 2005;8:241–54.
20. Levental KR, Yu H, Kass L, Lakins JN, Egeblad M, Erler JT, et al. Matrixcrosslinking forces tumor progression by enhancing integrin signaling. Cell.2009;139:891–906.
21. Provenzano PP, Inman DR, Eliceiri KW, Knittel JG, Yan L, Rueden CT, et al.Collagen density promotes mammary tumor initiation and progression.BMC Med. 2008;6:11.
22. Puig M, Lugo R, Gabasa M, Giménez A, Velásquez A, Galgoczy R, et al. Matrixstiffening and β1 integrin drive subtype-specific fibroblast accumulation inlung cancer. Mol Cancer Res. 2015;13:161–73.
23. Engler AJ, Sen S, Sweeney HL, Discher DE. Matrix elasticity directs stem celllineage specification. Cell. 2006;126:677–89.
24. Mammoto A, Connor KM, Mammoto T, Yung CW, Huh D, Aderman CM, etal. A mechanosensitive transcriptional mechanism that controlsangiogenesis. Nature. 2009;457:1103–8.
25. Leight JL, Wozniak MA, Chen S, Lynch ML, Chen CS. Matrix rigidity regulatesa switch between TGF-β1-induced apoptosis and epithelial-mesenchymaltransition. Mol Biol Cell. 2012;23:781–91.
Kuczek et al. Journal for ImmunoTherapy of Cancer (2019) 7:68 Page 14 of 15

26. Mushtaq MU, Papadas A, Pagenkopf A, Flietner E, Morrow Z, Chaudhary SG,et al. Tumor matrix remodeling and novel immunotherapies: the promise ofmatrix-derived immune biomarkers. J Immunother Cancer. 2018;6:65.
27. O’Connor RS, Hao X, Shen K, Bashour K, Akimova T, Hancock WW, et al.Substrate rigidity regulates human T cell activation and proliferation. JImmunol. 2012;189:1330–9.
28. Feng Y, Reinherz EL, Lang MJ. αβ T cell receptor Mechanosensing forces outserial engagement. Trends Immunol. 2018;39:596–609.
29. McMahon M, Ye S, Izzard L, Dlugolenski D, Tripp RA, Bean AGD, et al.ADAMTS5 is a critical regulator of virus-specific T cell immunity. PLoS Biol.2016;14:e1002580.
30. Jachetti E, Caputo S, Mazzoleni S, Brambillasca CS, Parigi SM, Grioni M, et al.Tenascin-C protects cancer stem-like cells from immune surveillance byarresting T-cell activation. Cancer Res. 2015;75:2095–108.
31. Sangaletti S, Chiodoni C, Tripodo C, Colombo MP. Common extracellularmatrix regulation of myeloid cell activity in the bone marrow and tumormicroenvironments. Cancer Immunol Immunother. 2017;66:1059–67.
32. Yamada KM, Cukierman E. Modeling tissue morphogenesis and cancer in3D. Cell. 2007;130:601–10.
33. Klemke M, Kramer E, Konstandin MH, Wabnitz GH, Samstag Y. An MEK-cofilin signalling module controls migration of human T cells in 3D but not2D environments. EMBO J. 2010;29:2915–29.
34. Wolf K, te Lindert M, Krause M, Alexander S, te Riet J, Willis AL, et al. Physicallimits of cell migration: control by ECM space and nuclear deformation andtuning by proteolysis and traction force. J Cell Biol. 2013;201:1069–84.
35. Salmon H, Franciszkiewicz K, Damotte D, Dieu-Nosjean M-C, Validire P,Trautmann A, et al. Matrix architecture defines the preferential localizationand migration of T cells into the stroma of human lung tumors. J ClinInvest. 2012;122:899–910.
36. Hartmann N, Giese NA, Giese T, Poschke I, Offringa R, Werner J, et al.Prevailing role of contact guidance in intrastromal T-cell trapping in humanpancreatic cancer. Clin Cancer Res. 2014;20:3422–33.
37. Artym VV, Matsumoto K. Imaging cells in three-dimensional collagen matrix.Curr Protoc Cell Biol. 2010;48:10.18.1–10.18.20.
38. Idorn M, Olsen M, Halldórsdóttir HR, Skadborg SK, Pedersen M, Høgdall C, etal. Improved migration of tumor ascites lymphocytes to ovarian cancermicroenvironment by CXCR2 transduction. Oncoimmunology. 2018;7:e1412029.
39. Cole DJ, Weil DP, Shamamian P, Rivoltini L, Kawakami Y, Topalian S, et al.Identification of MART-1-specific T-cell receptors: T cells utilizing distinctT-cell receptor variable and joining regions recognize the same tumorepitope. Cancer Res. 1994;54:5265–8.
40. Dobin A, Davis CA, Schlesinger F, Drenkow J, Zaleski C, Jha S, et al. STAR:ultrafast universal RNA-seq aligner. Bioinformatics. 2013;29:15–21.
41. Heinz S, Benner C, Spann N, Bertolino E, Lin YC, Laslo P, et al. Simplecombinations of lineage-determining transcription factors prime cis-regulatory elements required for macrophage and B cell identities.Mol Cell. 2010;38:576–89.
42. Love MI, Huber W, Anders S. Moderated estimation of fold change anddispersion for RNA-seq data with DESeq2. Genome Biol. 2014;15:550.
43. Jespersen H, Lindberg MF, Donia M, Söderberg EMV, Andersen R, Keller U,et al. Clinical responses to adoptive T-cell transfer can be modeled in anautologous immune-humanized mouse model. Nat Commun. 2017;8:707.
44. Puram SV, Tirosh I, Parikh AS, Patel AP, Yizhak K, Gillespie S, et al. Single-celltranscriptomic analysis of primary and metastatic tumor ecosystems in headand neck Cancer. Cell. 2017;171:1611–1624.e24.
45. Oliphant TE. Python for scientific computing. Comput Sci Eng. 2007;9:10–20.46. Isakov N, Altman A. Protein kinase Cθ in t cell activation. Annu Rev
Immunol. 2002;20:761–94.47. Wullkopf L, West A-KV, Leijnse N, Cox TR, Madsen CD, Oddershede LB, et al.
Cancer cell ability to mechanically adjust to extracellular matrix stiffnesscorrelates with their invasive potential. Mol Biol Cell. 2018;29(20):2378–85mbc. E18-05-0319.
48. Provenzano PP, Inman DR, Eliceiri KW, Keely PJ. Matrix density-inducedmechanoregulation of breast cell phenotype, signaling and gene expressionthrough a FAK–ERK linkage. Oncogene. 2009;28:4326–43.
49. Balwierz PJ, Pachkov M, Arnold P, Gruber AJ, Zavolan M, van Nimwegen E.ISMARA: automated modeling of genomic signals as a democracy ofregulatory motifs. Genome Res. 2014;24:869–84.
50. Oh I-H, Reddy EP. The myb gene family in cell growth, differentiation andapoptosis. Oncogene. 1999;18:3017–33.
51. Bertoli C, Skotheim JM, de Bruin RAM. Control of cell cycle transcriptionduring G1 and S phases. Nat Rev Mol Cell Biol. 2013;14:518–28.
52. Rivas A, Ruegg CL, Zeitung J, Laus R, Warnke R, Benike C, et al. V7, a novelleukocyte surface protein that participates in T cell activation. I. Tissuedistribution and functional studies. J Immunol. 1995;154:4423–33.
53. Fernandez I, Zeiser R, Karsunky H, Kambham N, Beilhack A, Soderstrom K, etal. CD101 surface expression discriminates potency among murineFoxP3+ regulatory T cells. J Immunol. 2007;179:2808–14.
54. Côme C, Cvrljevic A, Khan MM, Treise I, Adler T, Aguilar-Pimentel JA, et al.CIP2A promotes T-cell activation and immune response to listeriamonocytogenes infection. PLoS One. 2016;11:e0152996.
55. Shi Y, Massagué J. Mechanisms of TGF-beta signaling from cell membraneto the nucleus. Cell. 2003;113:685–700.
56. Ouyang W, Beckett O, Ma Q, Paik J, DePinho RA, Li MO. Foxo proteinscooperatively control the differentiation of Foxp3+ regulatory T cells. NatImmunol. 2010;11:618–27.
57. Lin H-K, Bergmann S, Pandolfi PP. Cytoplasmic PML function in TGF-βsignalling. Nature. 2004;431:205–11.
58. Xue J, Lin X, Chiu W-T, Chen Y-H, Yu G, Liu M, et al. Sustained activation ofSMAD3/SMAD4 by FOXM1 promotes TGF-β–dependent cancer metastasis.J Clin Invest. 2014;124:564–79.
59. Sadtler K, Estrellas K, Allen BW, Wolf MT, Fan H, Tam AJ, et al. Developing apro-regenerative biomaterial scaffold microenvironment requires T helper 2cells. Science (80- ). 2016;352:366–70.
Kuczek et al. Journal for ImmunoTherapy of Cancer (2019) 7:68 Page 15 of 15
Related Documents


