P romotion Optimization Institute • Fall Summit 2014 • Dallas, TX TPM-TPO- Collaborative Marketing is BI GGER in Dallas! Collaborative Promotion Optimization & Continuous Improvement Summit Latest Break Through in Insight-led Category Optimization Online consumer intelligence is changing both brand health monitoring and innovation. As a result, Microtesting can uncover new mass promotions with 20% to 50% better performance. Learn how Big data and Advanced Analytics can maximize category performance and assortment optimization in regions/store/cluster.

Welcome message from author
This document is posted to help you gain knowledge. Please leave a comment to let me know what you think about it! Share it to your friends and learn new things together.
Transcript

Promotion Optimization Institute • Fall Summit 2014 • Dallas, TX
TPM-TPO-
Collaborat ive
Market ing
is BIGGER
in Dallas!
Collaborat ive Promot ion Opt imizat ion & Cont inuous Improvement Summit
Latest Break Through in Insight-led
Category Optimization
Online consumer intelligence is changing both brand health monitoring and
innovation. As a result, Microtesting can uncover new mass promotions with 20% to
50% better performance. Learn how Big data and Advanced Analytics can maximize
category performance and assortment optimization in regions/store/cluster.
1 Promotion Optimization Institute • Fall Summit 2014 • Dallas, TX
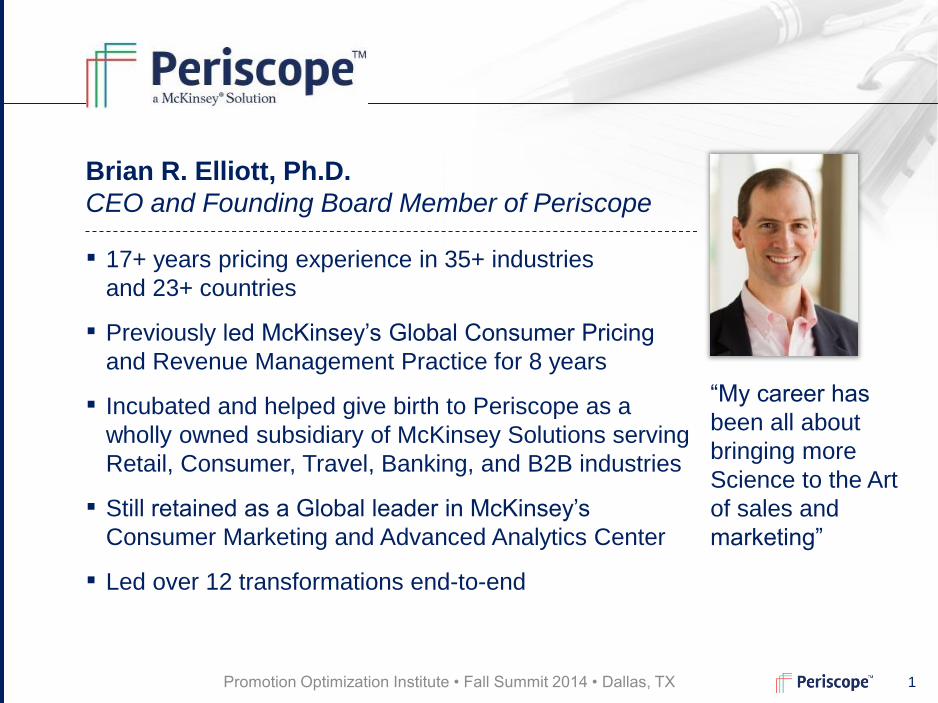
Brian R. Elliott, Ph.D.
CEO and Founding Board Member of Periscope
▪ 17+ years pricing experience in 35+ industries
and 23+ countries
▪ Previously led McKinsey’s Global Consumer Pricing
and Revenue Management Practice for 8 years
▪ Incubated and helped give birth to Periscope as a
wholly owned subsidiary of McKinsey Solutions serving
Retail, Consumer, Travel, Banking, and B2B industries
▪ Still retained as a Global leader in McKinsey’s
Consumer Marketing and Advanced Analytics Center
▪ Led over 12 transformations end-to-end
“My career has
been all about
bringing more
Science to the Art
of sales and
marketing”

2 Promotion Optimization Institute • Fall Summit 2014 • Dallas, TX
Hig
h
Low High
Low
Lift from quality merchandising
(indexed to category)1,2
Lif
t p
er
po
int
of
pri
ce
re
du
cti
on
(in
de
xe
d t
o c
ate
go
ry)1
Price-promo
and merch.
winners
~33% of CPGs
Trade investment winners capture more incremental
revenue from price reductions and quality merchandising
than others
-6.9 Others
Winners 24.8
-7.3
26.6
Relative lift from
quality merch.1,2
Percent (relative to
median)
Relative lift per pt.
of price reduction1
Percent (relative to
median)
1 Lift from promotion is calculated as difference in sales dollars given the specific promotion compared to baseline sales dollars;
relative lift indexed to category compares company lift by categories against average category lift figures
2 Quality merchandising implies Any Feature or Display on a product
3 Companies cannot exceed category lift by more than 50%
SOURCE: 2014 McKinsey CCM Finance Survey; Nielsen POS data, 52 weeks ending December 2012 /
(FDM, Walmart, Dollar, Convenience, Club)
3 Promotion Optimization Institute • Fall Summit 2014 • Dallas, TX
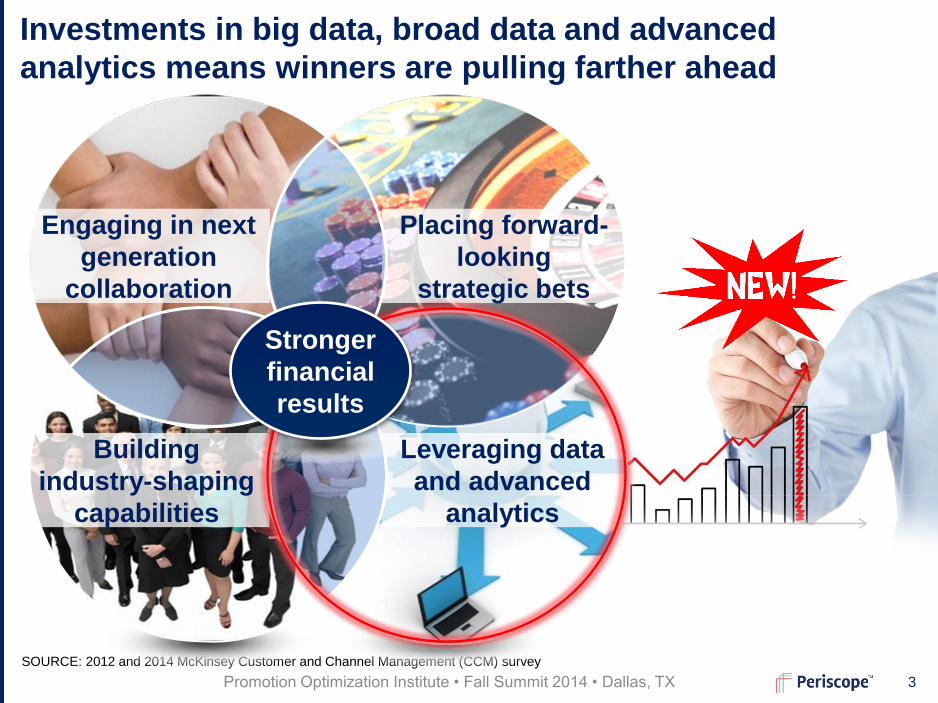
Investments in big data, broad data and advanced
analytics means winners are pulling farther ahead
SOURCE: 2012 and 2014 McKinsey Customer and Channel Management (CCM) survey
Engaging in next
generation
collaboration
Placing forward-
looking
strategic bets
Leveraging data
and advanced
analytics
Building
industry-shaping
capabilities
Stronger
financial
results

4 Promotion Optimization Institute • Fall Summit 2014 • Dallas, TX
Big and Broad data is creating new opportunities to pull
ahead with advanced analytics
Get the data
warehouse
right
Big Data
▪ CPG data
▪ Retailer data
+ Broad Data
▪ Syndicated data
▪ Government data
▪ Demographic data
▪ Commodities
▪ Supply-Demand curves
▪ Weather
+ New Data
▪ Social
▪ Online intelligence
– Competitor
▫ Price / promotion
▫ Terms/conditions
▫ Supply availability
– Product reviews
– Customer reviews
▪ Real time A/B testing
▪ Dynamic supply-demand
▪ …
5 Promotion Optimization Institute • Fall Summit 2014 • Dallas, TX
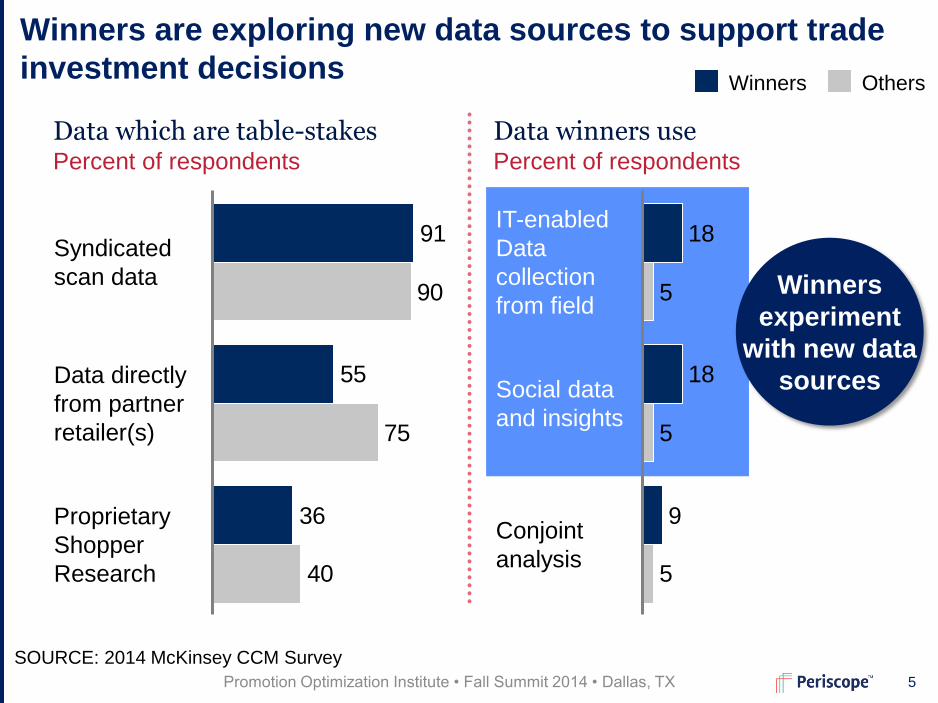
SOURCE: 2014 McKinsey CCM Survey
Data which are table-stakes Percent of respondents
Data winners use Percent of respondents
9
18
18
5
5
5
Conjoint
analysis
Social data
and insights
IT-enabled
Data
collection
from field
Others Winners
36
55
91
90
40
75
Proprietary
Shopper
Research
Data directly
from partner
retailer(s)
Syndicated
scan data Winners
experiment
with new data
sources
Winners are exploring new data sources to support trade
investment decisions

6 Promotion Optimization Institute • Fall Summit 2014 • Dallas, TX
Priorities in assessing trade investment Percent of respondents selecting in Top 3
Looking ahead, winners want a more granular
understanding of what really delivers their strategies
55
64
73
40
35
65
Identifying which
Promotions support
brand strategies
Determining promotions
that win with key
segments
Understanding
incrementality
Others Winners
SOURCE: 2014 McKinsey CCM Survey
7 Promotion Optimization Institute • Fall Summit 2014 • Dallas, TX
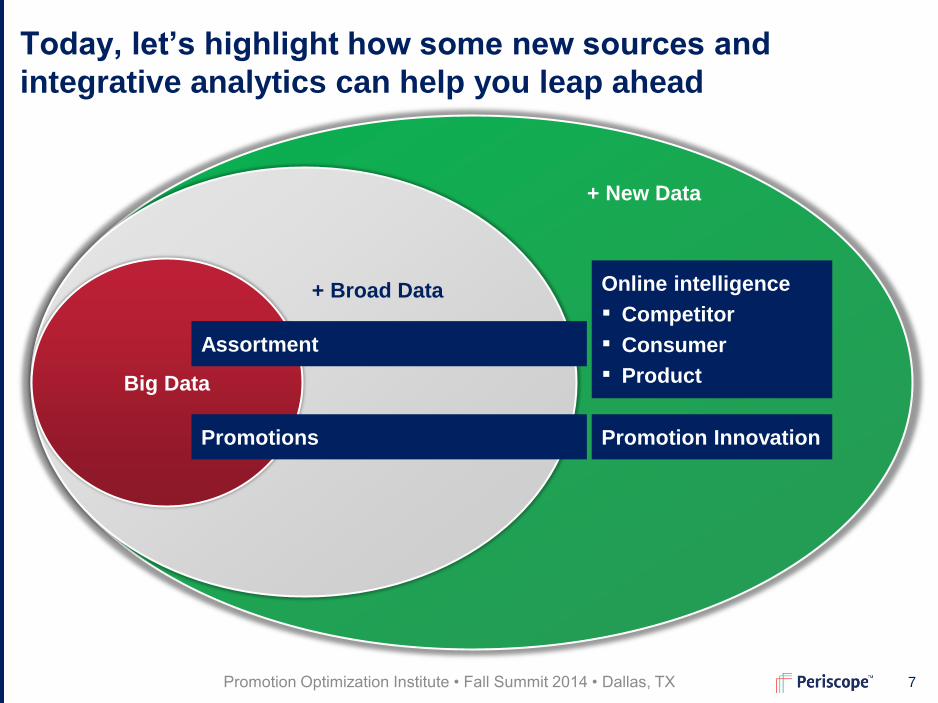
Today, let’s highlight how some new sources and
integrative analytics can help you leap ahead
Get the data
warehouse
right
Big Data
+ Broad Data
+ New Data
Online intelligence
▪ Competitor
▪ Consumer
▪ Product
Promotion Innovation
Assortment
Promotions

8 Promotion Optimization Institute • Fall Summit 2014 • Dallas, TX
NEW ! - Online and POS Consumer Insights
Paradigm shift
Field
consumer
intercepts
Mine existing
intercepts
Real and unprompted
consumer comments,
ratings and purchasing
behaviors
Hundreds of thousands
observations vs. few
hundred
Pennies on the dollar
vs. traditional fielding
costs
Easy to update and
expand in scope

9 Promotion Optimization Institute • Fall Summit 2014 • Dallas, TX 9 Promotion Optimization Institute • Fall Summit 2014 • Dallas, TX
Contents
Active prompting - Promotion Innovation
Passive Listening - Online competitor,
consumer and product intelligence
Integrative use of many sources – Assortment

10 Promotion Optimization Institute • Fall Summit 2014 • Dallas, TX
Consumer Goods and Retailers are facing the greatest
challenge to improve trade promotion effectiveness
11 Promotion Optimization Institute • Fall Summit 2014 • Dallas, TX
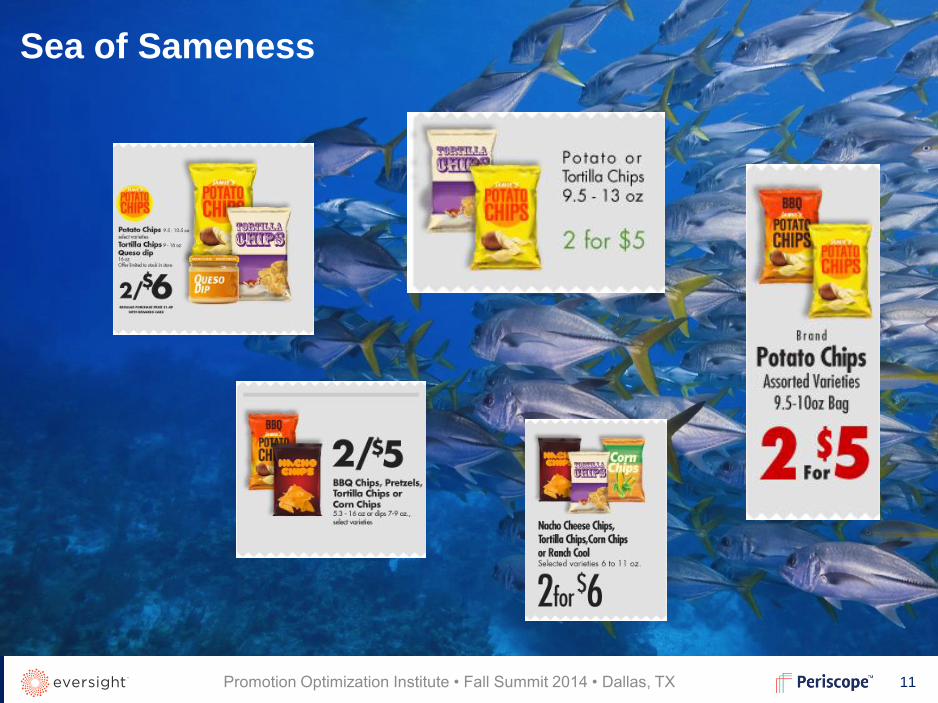
Sea of Sameness

12 Promotion Optimization Institute • Fall Summit 2014 • Dallas, TX
What if you knew precisely which
promotions would work
best before running them?
What if you could be right every time?

13 Promotion Optimization Institute • Fall Summit 2014 • Dallas, TX
Introducing Trade Promotion Innovation (TPI)
Introducing
OFFER
INNOVATION

14 Promotion Optimization Institute • Fall Summit 2014 • Dallas, TX
Find the best
promotions Plan with insight Manage execution
Post Event Evaluation
(TPE/TPO)
Determine the best past
promotions after they
are run
Promotion Planning
(TPP)
Build calendars, simplify
planning for account
managers, forecast
impact, compare
scenarios, and manage
workflow approvals
Build the Ad / Flyer
Managing workflow and
updating forecast
performance for final
execution (e.g.
front/middle/back page,
big/small ad)
How does Promotion Offer Innovation fit in the ecosystem?
Direct Marketing
Use loyalty card to
segment and track
shopper purchasing
behavior and build-up
one-to-one promotion
activities
Promotional "Offer
Innovation"
Test new ideas and
identify the ones that will
perform best, allowing
trade dollars to be spent
more efficiently
Trade Promotion
Management (TPM)
Track trade spend and
ensure proper
accounting, accruals,
and invoicing
15 Promotion Optimization Institute • Fall Summit 2014 • Dallas, TX
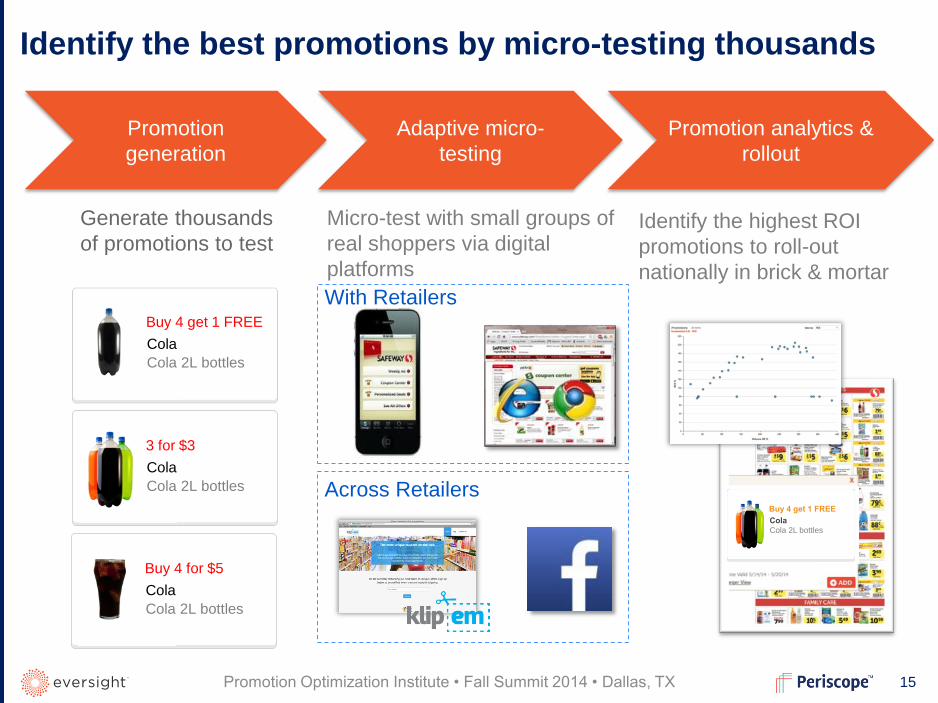
Identify the best promotions by micro-testing thousands
Promotion
generation
Generate thousands
of promotions to test
Buy 4 get 1 FREE
Cola
Cola 2L bottles
Buy 4 for $5
Cola
Cola 2L bottles
3 for $3
Cola
Cola 2L bottles
Promotion analytics &
rollout
Identify the highest ROI
promotions to roll-out
nationally in brick & mortar
Buy 4 get 1 FREE
Cola
Cola 2L bottles
Adaptive micro-
testing
Micro-test with small groups of
real shoppers via digital
platforms
With Retailers
Across Retailers
16 Promotion Optimization Institute • Fall Summit 2014 • Dallas, TX
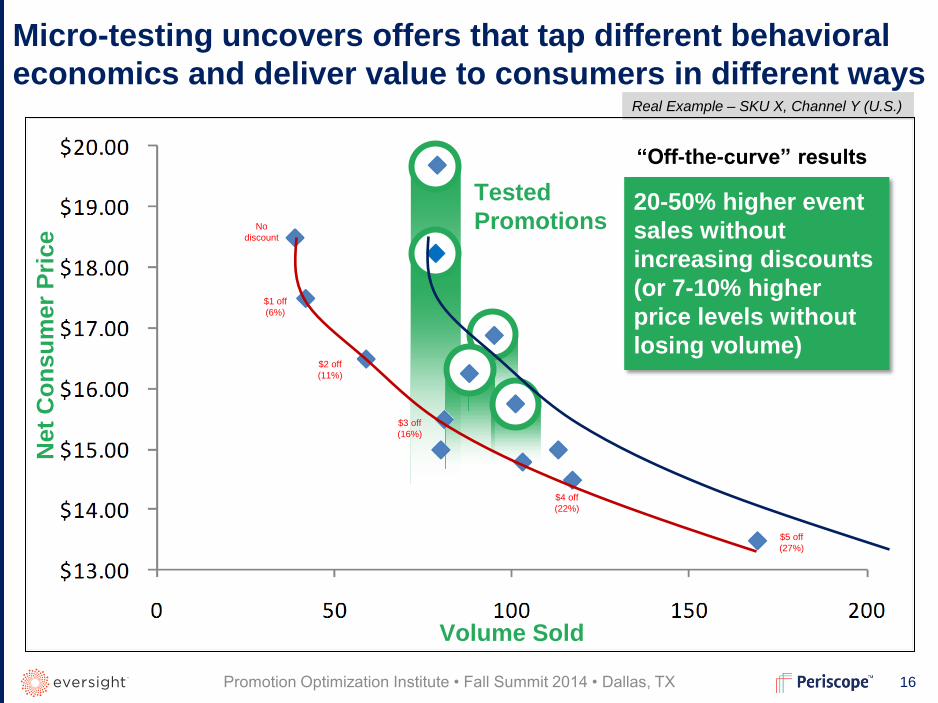
Real Example – SKU X, Channel Y (U.S.)
Micro-testing uncovers offers that tap different behavioral
economics and deliver value to consumers in different ways Real Example – SKU X, Channel Y (U.S.)
Net
Co
ns
um
er
Pri
ce
Volume Sold
No
discount
$5 off
(27%)
$1 off
(6%)
$2 off
(11%)
$3 off
(16%)
$4 off
(22%)
20-50% higher event
sales without
increasing discounts
(or 7-10% higher
price levels without
losing volume)
Tested
Promotions
“Off-the-curve” results

17 Promotion Optimization Institute • Fall Summit 2014 • Dallas, TX
Integrative example on Mass promotions:
Mass promotions can then be used to extract executional
effects, verify impact at scale and plan with full insight Units
-
100,000
200,000
300,000
400,000
500,000
600,000
700,000
800,000
900,000
$2.25 $2.50 $2.75 $3.00 $3.25 $3.50 $3.75 $4.00 $4.25
CHALLENGE: build the intelligence to determine what is truly driving the difference
Customer X , Market Y, Product Z, 2007-10
Understanding other perfor-
mance drivers in a
structured way and how they
can be influenced at a
retailer- level is a key value
creator in TPO
Combining Big and Broad
data we can now account for
up to 10 factors
Today
Price
REAL EXAMPLE

18 Promotion Optimization Institute • Fall Summit 2014 • Dallas, TX
What happened in the over-performing week in the example?
Great week, good package combo, excellent execution Units
Event week
REAL EXAMPLE
Execution
Customer X , Market Y, Product Z, 2007-10
-
100,000
200,000
300,000
400,000
500,000
600,000
700,000
800,000
900,000
$2.25 $2.50 $2.75 $3.00 $3.25 $3.50 $3.75 $4.00 $4.25
“DNA of an Event” Over-performance driven by:
Price
Reference price gap
Pantry loading
Cross-Retail
Competition
Weather
+ 50k from execution (50% more cases on display)
Seasonality
impact of the
week
Intra-portfolio
+ 100k from intra-portfolio (very shallow discount on Product Y)
We can do this on purpose with
insight-driven planning
+ 130k from value of the week (July 4)
19 Promotion Optimization Institute • Fall Summit 2014 • Dallas, TX
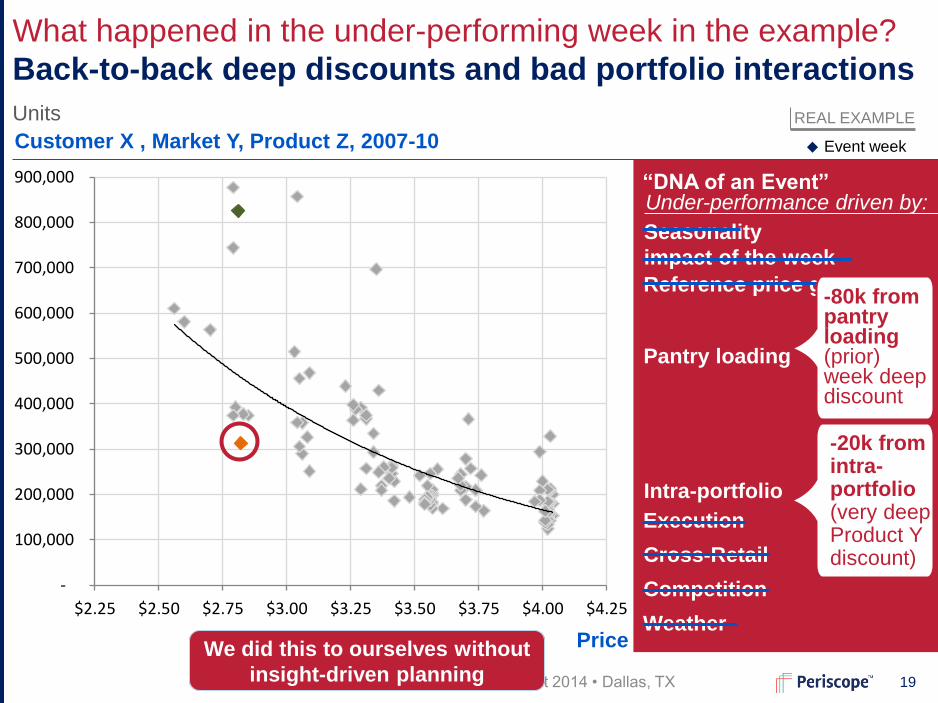
What happened in the under-performing week in the example?
Back-to-back deep discounts and bad portfolio interactions
-
100,000
200,000
300,000
400,000
500,000
600,000
700,000
800,000
900,000
$2.25 $2.50 $2.75 $3.00 $3.25 $3.50 $3.75 $4.00 $4.25
-20k from intra-portfolio (very deep Product Y discount)
Customer X , Market Y, Product Z, 2007-10
Execution
“DNA of an Event” Under-performance driven by:
Pantry loading
Intra-portfolio
Reference price gap
Cross-Retail
Competition
Weather
Seasonality
impact of the week
Units
We did this to ourselves without
insight-driven planning
Price
-80k from pantry loading (prior) week deep discount
Event week
REAL EXAMPLE
20 Promotion Optimization Institute • Fall Summit 2014 • Dallas, TX 20 Promotion Optimization Institute • Fall Summit 2014 • Dallas, TX
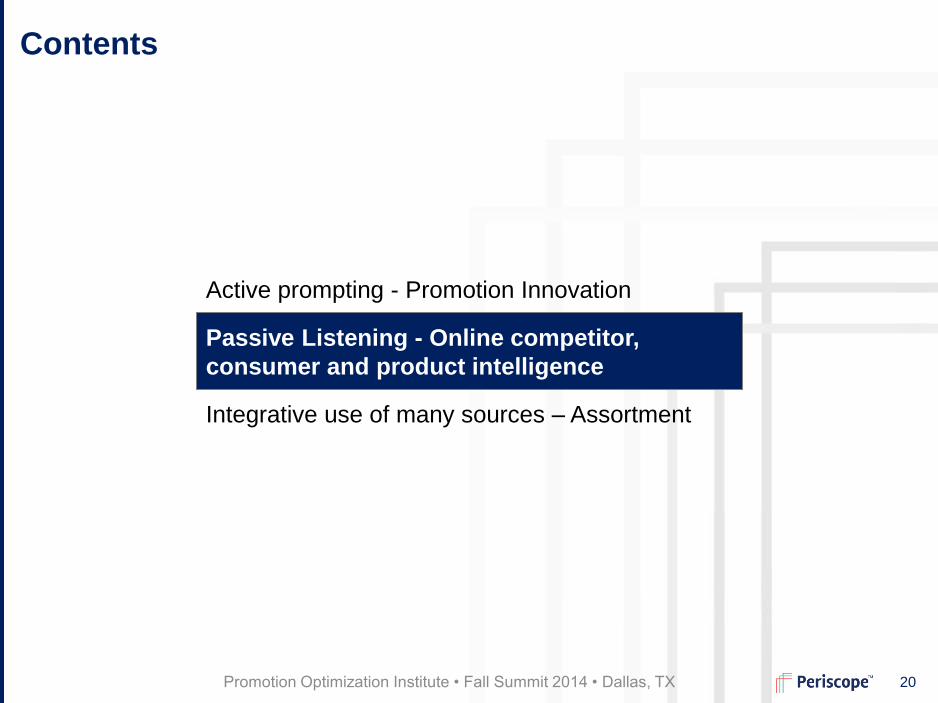
Contents
Active prompting - Promotion Innovation
Passive Listening - Online competitor,
consumer and product intelligence
Integrative use of many sources – Assortment
21 Promotion Optimization Institute • Fall Summit 2014 • Dallas, TX
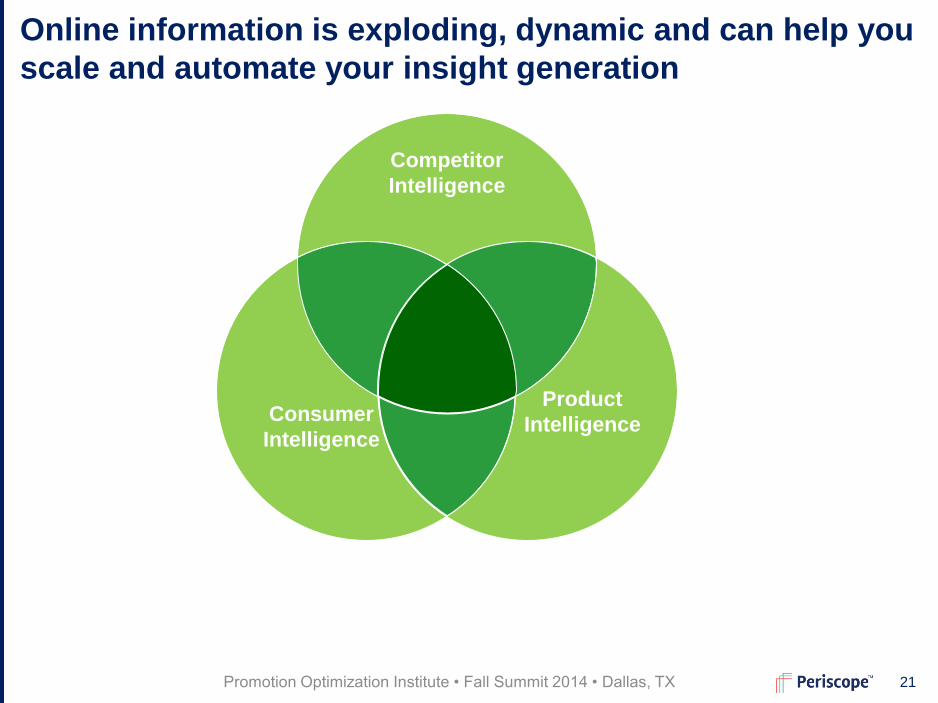
Online information is exploding, dynamic and can help you
scale and automate your insight generation
Competitor
Intelligence
Consumer
Intelligence
Product
Intelligence
Competitor
Intelligence
Consumer
Intelligence
Product
Intelligence

22 Promotion Optimization Institute • Fall Summit 2014 • Dallas, TX
Advanced competitive intelligence
Best practices
Example: Advanced Automated Product Matching
to adjust complexity and uncover more information
Get ‘Right’ data from
multiple sources
Ability to translate
insights into business
decisions and actions
Real-time, granular
online competitive
pricing, promotion, and
assortment visibility
using artificial intelligence
robots
Mine online consumer
and product ratings,
interactions and
information for consumer
and shopper insights
Exact item match
Slight variations,
to the same offer
Inter-changeable items
across tiers, substitutes
Deg
ree o
f sim
ilari
ty
High
Low

23 Promotion Optimization Institute • Fall Summit 2014 • Dallas, TX
Periscope Market Vision insights have moved beyond just Price
Exact &
Similar
items
Range comparison
Price Architecture (Value Map, Brand
ladder & pack curve)
Next best alternative pricing & features
Terms and conditions
Supply status
Competitive
Intelligence
Competitive pricing
Dynamic pricing
Minimum Advertised Price
(MAP) Enforcement
Competitor response time
Market share estimates
Promotions Cross-retailer effects
Competitive product
effects
Localized promotions
Consumer Insights Market segments &
Competitive interactions
Online decision trees (CDT)
Curated assortment by market
segment
Online shopping hierarchy
Average daily price changes per
repriced item
Camera & Photo 1.5
1.4 Industrial & Scientific
Kitchen & Dining 1.6
Video Games 1.6
Home Improvement 1.7
Toys & Games 1.7
Arts, Crafts & Sewing 1.7
Watches 1.9
Beauty 2.2
Appliances 2.2
Product Product attribute &
description maintenance
Star rating comparison
Innovation scan
Product design to value

24 Promotion Optimization Institute • Fall Summit 2014 • Dallas, TX
800
600
Jul 2013 May 2013 Mar 2013 Jan 2013 Nov 2012
2,200
2,000
1,600
1,400
1,200
1,000
3,000
2,800
1,800
2,600
2,400
Reference SKU
Lenovo S30(754GE)
Lenovo S30(734GE)
HP Z420(445ET)
HP Z420(434EA)
Lenovo S30(735GE)
HP Z420(448ET)
Lenovo S30(416GE)
HP Z420(454EA)
Pricing history of competing configurations for Reference SKU
$, net price (average across sellers)
Quadro
An item’s peer group is set through product features
and their value to the shopper …
Graphic
card
Key features (Simplified)
High tier
Mid-tier
Low tier
Quadro
Quadro
Quadro
Internal
16 GB
4 GB
8 GB
RAM
4 GB
4 GB
4 GB
4 GB 4 GB 4 GB
Open query
finds complete
competitor sets
Distinguish
features
affecting price
across product
category
Get dynamic
alerts on
competitive set:
▪ Price
▪ Features
▪ T&Cs
Internal
Internal Internal Internal
300 GB
2 TB
Hard
Drive
1 TB
1 TB
1 TB
1 TB
1 TB 1 TB 1 TB
1
2
3

25 Promotion Optimization Institute • Fall Summit 2014 • Dallas, TX
Capture longitudinal
data to understand
competitor
behavior:
▪ Frequency/policies
▪ Response time
▪ Follow / lead
1,600
1,500
1,400
1,300
1,200
1,100
1,000
900
May 2013 Apr 2013 Mar 2013 Feb 2013 Jan 2013
... which allows for competitor price monitoring
across identical and similar items over time
0
15
30
Number of competitive offers found
Exact item
Similar
item
Pricing history of competing offers for Reference SKU EUR, Net price, selected peer group SKUs
HP Z420
Reference SKU
Max
Avg.
Min
Range
of offers
“Lazy”
pricers
Or
testing
higher
prices?
Monitor competitive
offerings of exact
match and similar
featured items
▪ Number of offerings
▪ Price ranges
▪ Regional
segmentation
3 weeks lag
to adjust
reference
SKU price
26 Promotion Optimization Institute • Fall Summit 2014 • Dallas, TX SOURCE: Periscope Market Vision
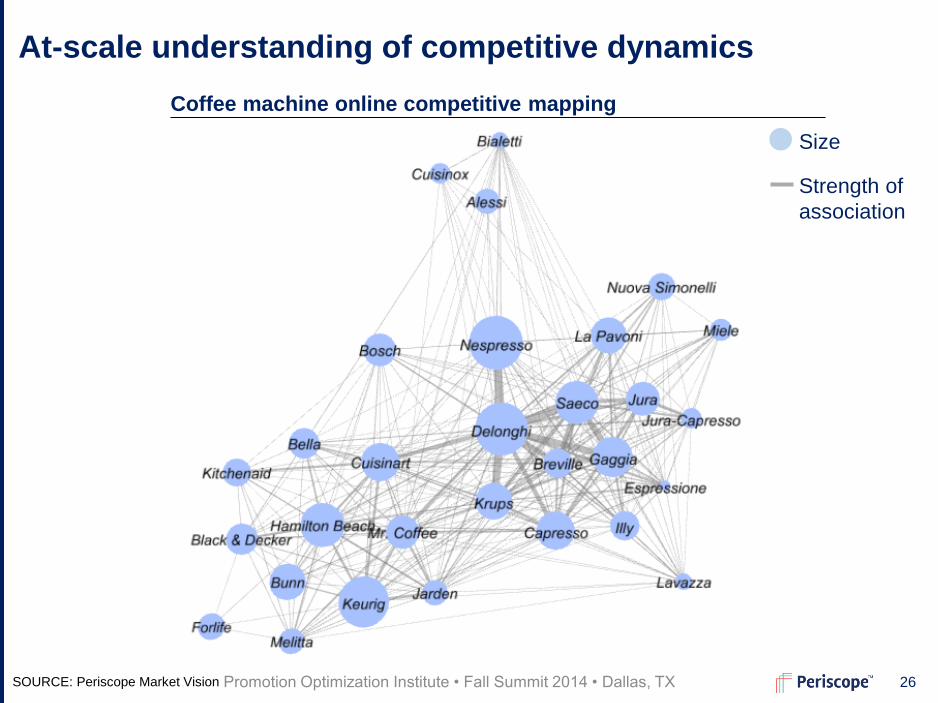
At-scale understanding of competitive dynamics
Coffee machine online competitive mapping
Size
Strength of
association
27 Promotion Optimization Institute • Fall Summit 2014 • Dallas, TX SOURCE: Periscope Market Vision
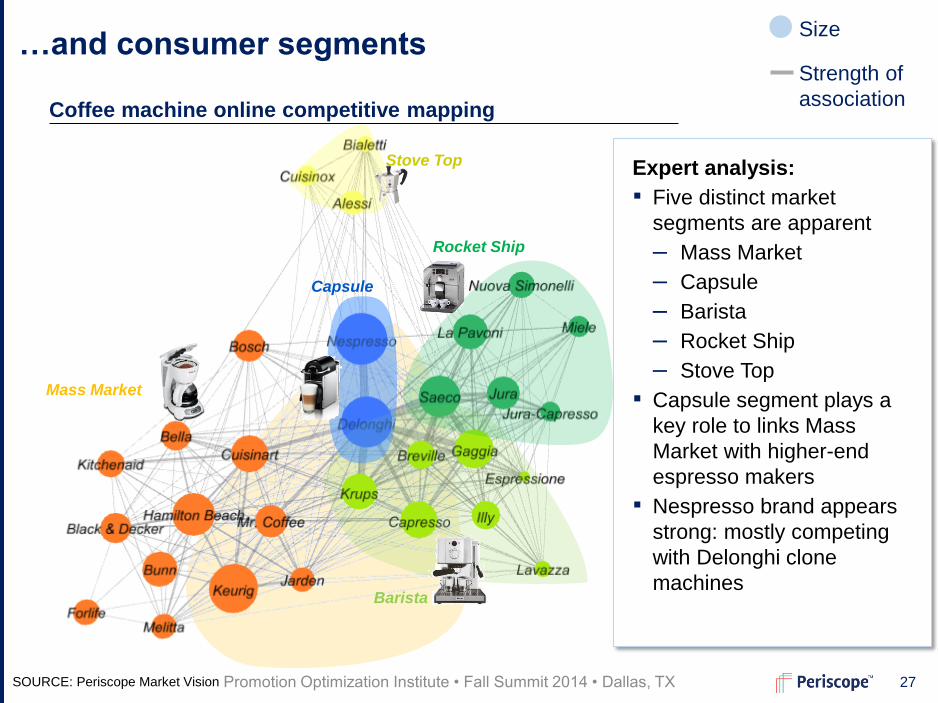
…and consumer segments
Stove Top
Barista
Capsule
Mass Market
Rocket Ship
Coffee machine online competitive mapping
Expert analysis:
▪ Five distinct market
segments are apparent
– Mass Market
– Capsule
– Barista
– Rocket Ship
– Stove Top
▪ Capsule segment plays a
key role to links Mass
Market with higher-end
espresso makers
▪ Nespresso brand appears
strong: mostly competing
with Delonghi clone
machines
Size
Strength of
association

28 Promotion Optimization Institute • Fall Summit 2014 • Dallas, TX
Working Gloves (206 SKUs / 20 Brands)
Sm.Brands (10%)
Brand die-hards (30% of SKUs)
Mechanix (57%)
Wells
Lamont (43%)
Big Brands (60% of SKUs)
Women
Garden (12%)
Carpenter (13%)
Cold/ Snow (12%)
General use (42%)
Contractor (21%)
Men Hvy -
Duty (44%)
Men Cut/
Abrasion (32%)
Women (24%)
Leather (38%)
Synthetic (62%)
… as well as price ranges per segment
$40-45
$35-40
$30-35
$25-30
$20-25
$15-20
$10-15
$5-10
$0-5
Price
range
% offers
3%
3% 5% 7% 16%
8% 10% 40%
43% 27% 20% 5%
8% 4% 18% 10% 13% 19% 5%
30% 32% 18% 8% 30% 50% 44% 27% 33% 32%
5% 32% 32% 19% 83% 30% 38% 25% 21%
32% 25% 8% 10% 13% 33% 16%
56% 10% 40% 5%
Range
Average
$11-42 $6-24
$25 $13
$11-37
$21
$1-12
$5
$10-15
$13
$3-30
$16
$11-24
$16
$7-23
$16
$2-18
$8
$16-36
$27
$1-38
$18
29 Promotion Optimization Institute • Fall Summit 2014 • Dallas, TX
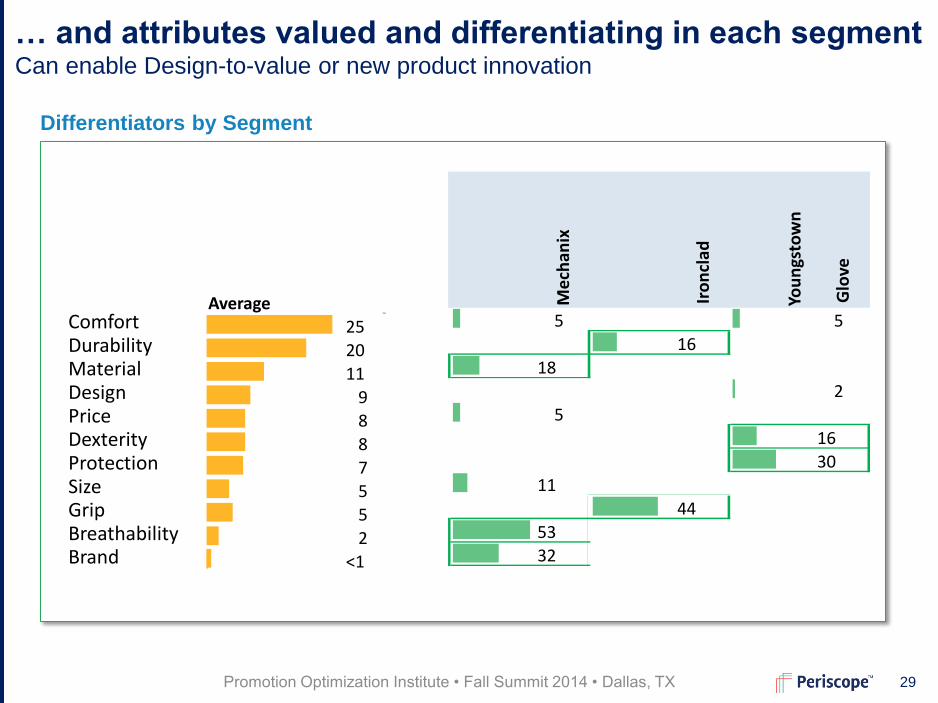
… and attributes valued and differentiating in each segment Can enable Design-to-value or new product innovation
Comfort Durability Material Design Price Dexterity Protection Size Grip Breathability Brand
Differentiators by Segment
Me
chan
ix
Iro
ncl
ad
You
ngs
tow
n
Glo
ve
5 5
16
18
2
5
16
30
11
44
53
32
Average
25
20
11
9
8
8
7
5
5
2
<1

30 Promotion Optimization Institute • Fall Summit 2014 • Dallas, TX
At-Scale insight requires automation
Online Market
Canvasing and
Monitoring
Advanced Data
Cleaning & Matching
Insight extraction
Source: Periscope Market Vision
– but also enables insight-
driven retailing at scale
across categories
Complements existing
research for CPG and
scales across markets…
31 Promotion Optimization Institute • Fall Summit 2014 • Dallas, TX 31 Promotion Optimization Institute • Fall Summit 2014 • Dallas, TX
Contents
Active prompting - Promotion Innovation
Passive Listening - Online competitor, consumer
and product intelligence
Integrative use of many sources – Assortment
32 Promotion Optimization Institute • Fall Summit 2014 • Dallas, TX
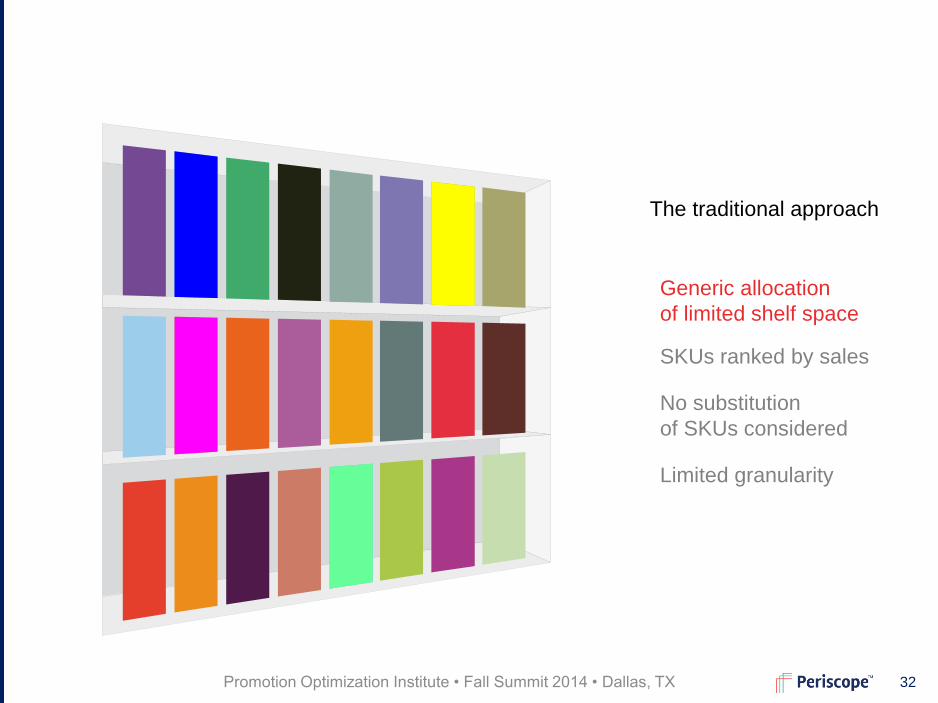
No substitution
of SKUs considered
Limited granularity
Generic allocation
of limited shelf space
SKUs ranked by sales
The traditional approach

33 Promotion Optimization Institute • Fall Summit 2014 • Dallas, TX
Sometimes they are quite indifferent –
even between two ‘mega skus’
… And sometimes there is just one
SKU that fits there bill – even if it’s a
relatively lower volume one
When shoppers come into a category they have different
degrees of ‘loyalty’ to different SKUs
34 Promotion Optimization Institute • Fall Summit 2014 • Dallas, TX
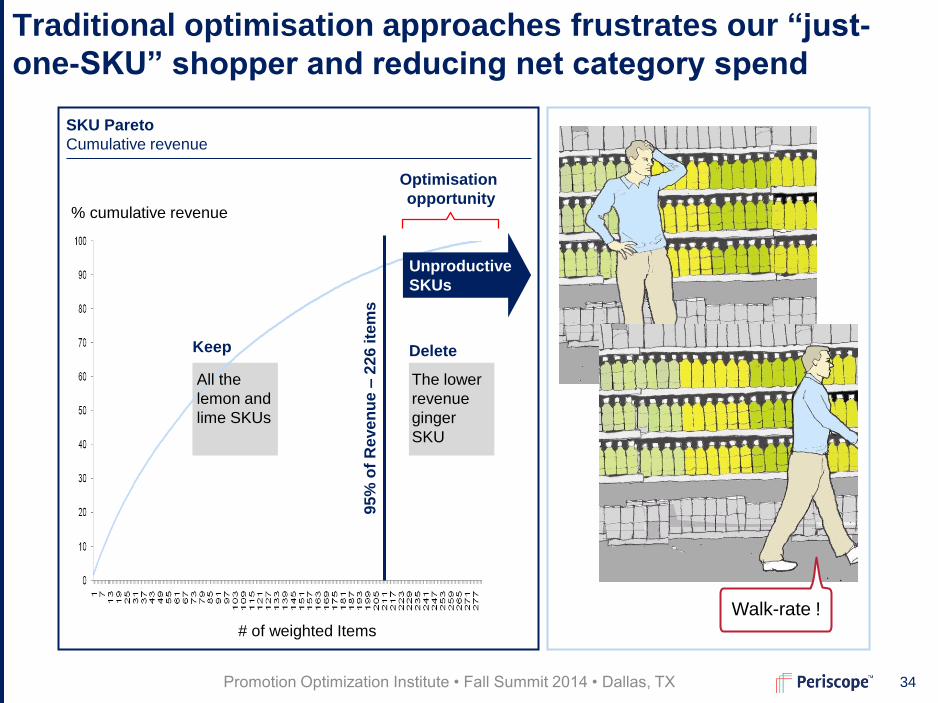
Traditional optimisation approaches frustrates our “just-
one-SKU” shopper and reducing net category spend
SKU Pareto
Cumulative revenue
95
% o
f R
eve
nu
e –
22
6 ite
ms
# of weighted Items
% cumulative revenue
Optimisation
opportunity
The lower
revenue
ginger
SKU
All the
lemon and
lime SKUs
Unproductive
SKUs
Keep Delete
Walk-rate !
35 Promotion Optimization Institute • Fall Summit 2014 • Dallas, TX
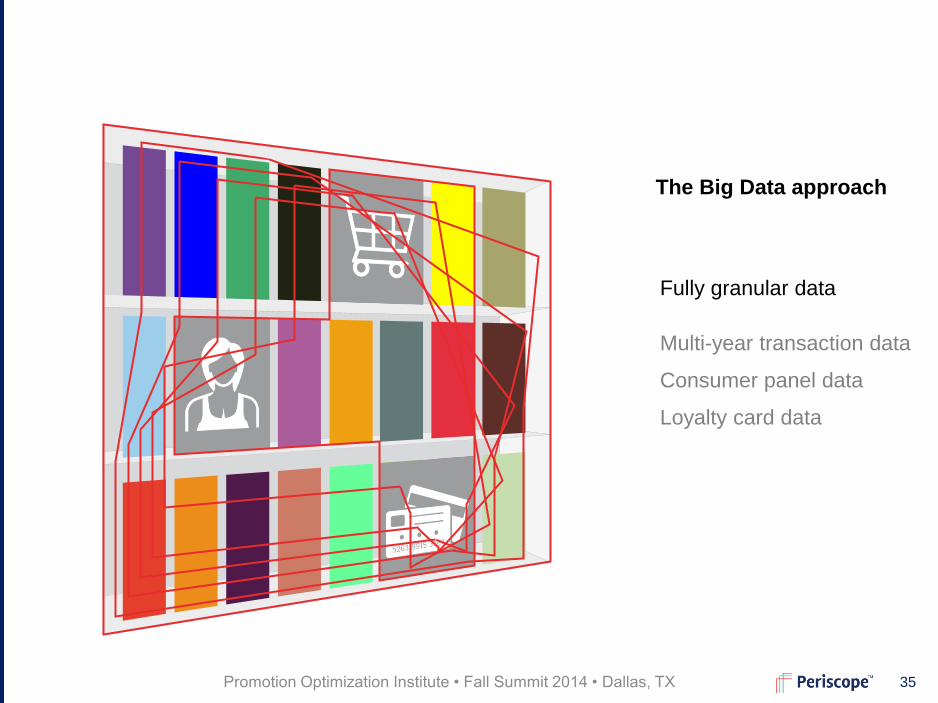
Multi-year transaction data
Loyalty card data
Consumer panel data
Fully granular data
The Big Data approach
36 Promotion Optimization Institute • Fall Summit 2014 • Dallas, TX
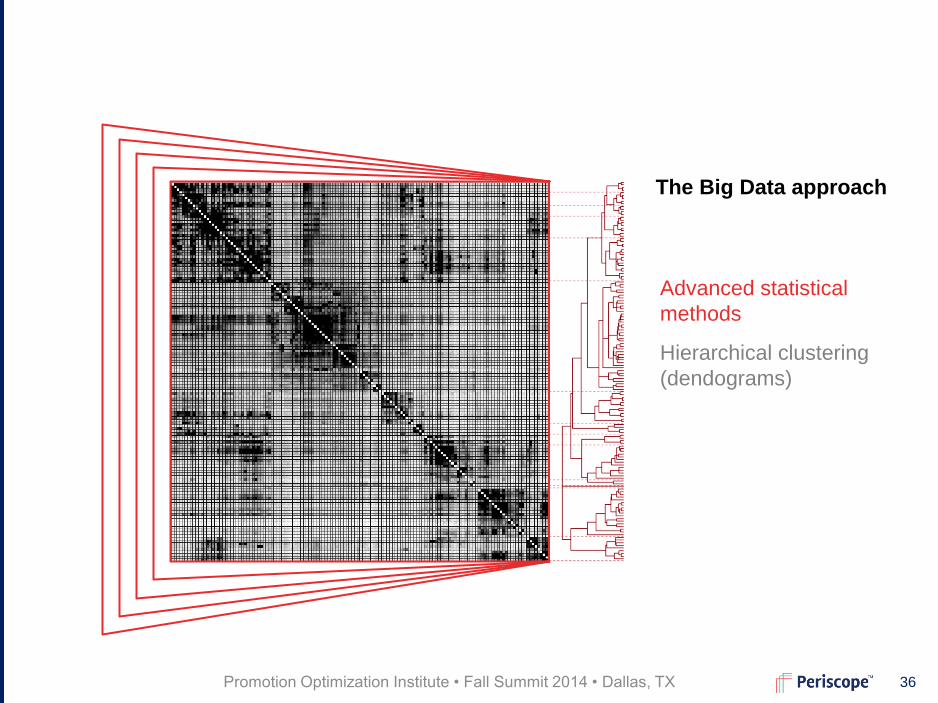
Hierarchical clustering
(dendograms)
Advanced statistical
methods
The Big Data approach
37 Promotion Optimization Institute • Fall Summit 2014 • Dallas, TX
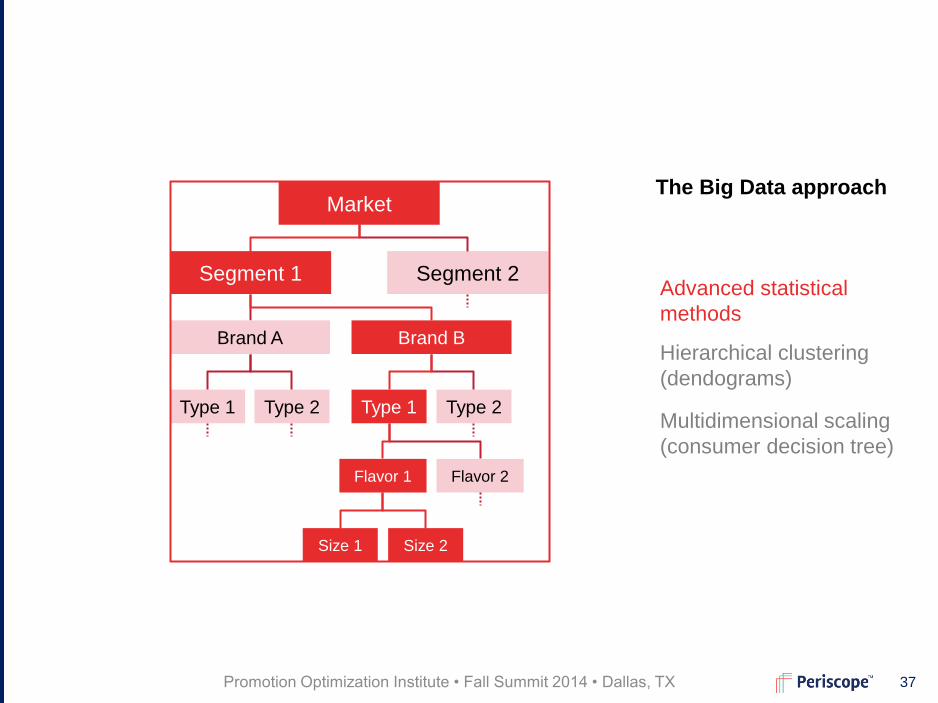
Hierarchical clustering
(dendograms)
Multidimensional scaling
(consumer decision tree)
Advanced statistical
methods
Market
Segment 1 Segment 2
Brand A Brand B
Type 1 Type 2 Type 1 Type 2
Flavor 1 Flavor 2
Size 1 Size 2
The Big Data approach
38 Promotion Optimization Institute • Fall Summit 2014 • Dallas, TX
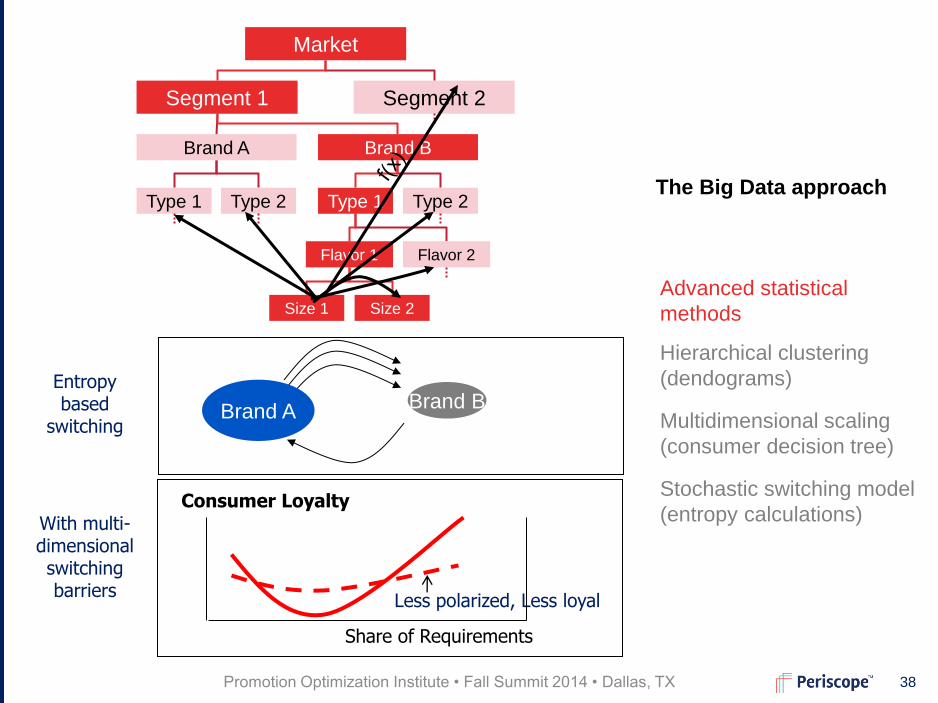
Advanced statistical
methods
Market
Segment 1 Segment 2
Brand A Brand B
Type 1 Type 2 Type 1 Type 2
Flavor 1 Flavor 2
Size 1 Size 2
Entropy based
switching
Brand B Brand A
Consumer Loyalty
Less polarized, Less loyal
Share of Requirements
With multi-dimensional switching barriers
Hierarchical clustering
(dendograms)
Multidimensional scaling
(consumer decision tree)
Stochastic switching model
(entropy calculations)
The Big Data approach

39 Promotion Optimization Institute • Fall Summit 2014 • Dallas, TX
Actual behaviour
(switching, walk rates)
Statistically relevant
Optimal SKU selection
per store
Predictive sales forecast
Advanced statistical
methods
Market
Segment 1 Segment 2
Brand A Brand B
Type 1 Type 2 Type 1 Type 2
Flavor 1 Flavor 2
Size 1 Size 2
Entropy based
switching
Brand B Brand A
Consumer Loyalty
Less polarized, Less loyal
Share of Requirements
With multi-dimensional switching barriers
The Big Data approach
40 Promotion Optimization Institute • Fall Summit 2014 • Dallas, TX
Revenue growth
more than double
the category growth
in the market
AND
Saves 40% of Category
management time
Impact
41 Promotion Optimization Institute • Fall Summit 2014 • Dallas, TX
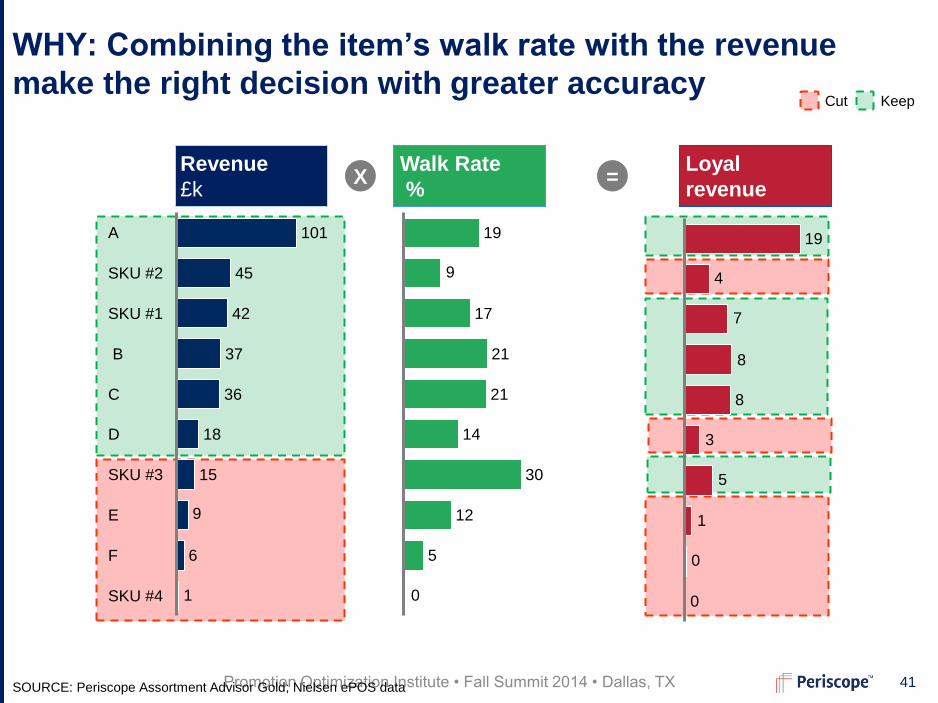
WHY: Combining the item’s walk rate with the revenue
make the right decision with greater accuracy
SOURCE: Periscope Assortment Advisor Gold; Nielsen ePOS data
Cut Keep
X = Loyal
revenue
Walk Rate
%
Revenue
£k
8
0
0
1
5
3
8
7
4
19
0
5
9
12
30
14
21
21
17
19
1
6
9E
SKU #3 15
D
42
SKU #2 45
A 101
SKU #4
F
18
C 36
B 37
SKU #1
42 Promotion Optimization Institute • Fall Summit 2014 • Dallas, TX
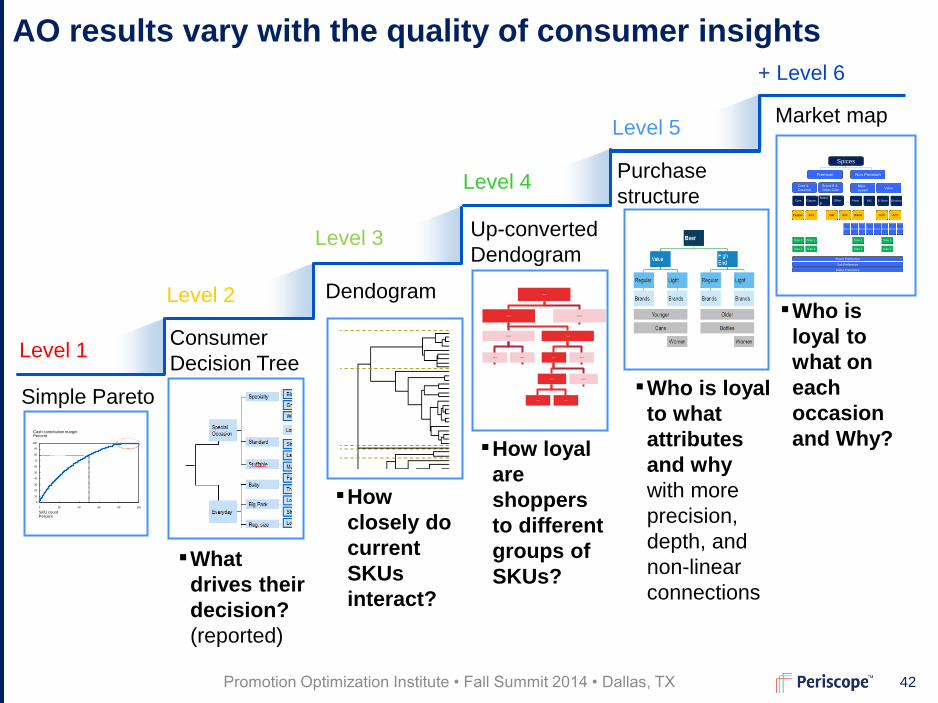
AO results vary with the quality of consumer insights
Simple Pareto
Dendogram
Purchase
structure
Consumer
Decision Tree Level 1
Level 2
Level 4
Level 5
Level 3
0
10
20
30
40
50
60
70
80
90
100
0 20 40 60 80 100
Cash contribution margin Percent
SKU count Percent
Market map
Spices
Premium Non Premium
Core &
Gourmet
Brand B &
Other CoreMain-
streamValue
Core Gourm.Brand
BOther Prem. MS $ Store Grocery
Pepper A/O A/O BlendSalt Grill A/O
Brand Brand Brand BrandBrand Brand Brand Brand
Size 1
Size 2
Size 1
Size 2
Size 1
Size 2
Size 1
Size 2
Flavor Preference
Salt Preference
Brand Preference
+ Level 6
▪What
drives their
decision?
(reported)
▪How
closely do
current
SKUs
interact?
▪Who is loyal
to what
attributes
and why
with more
precision,
depth, and
non-linear
connections
▪Who is
loyal to
what on
each
occasion
and Why?
Up-converted
Dendogram
▪How loyal
are
shoppers
to different
groups of
SKUs?
Market
Segment 1 Segment 2
Brand A Brand B
Type 1 Type 2 Type 1 Type 2
Flavor 1 Flavor 2
Size 1 Size 2
43 Promotion Optimization Institute • Fall Summit 2014 • Dallas, TX
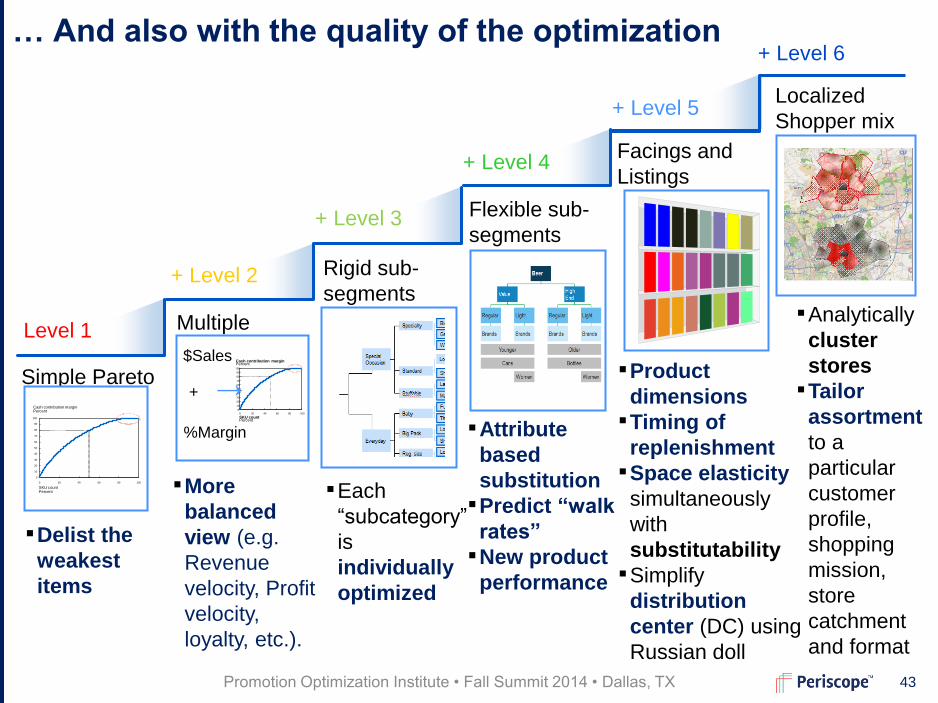
Simple Pareto
Multiple
Criteria
Flexible sub-
segments
Facings and
Listings
Rigid sub-
segments
Level 1
+ Level 2
+ Level 4
+ Level 5
+ Level 3
0
10
20
30
40
50
60
70
80
90
100
0 20 40 60 80 100
Cash contribution margin Percent
SKU count Percent
Localized
Shopper mix
0
10
20
30
40
50
60
70
80
90
100
0 20 40 60 80 100
Cash contribution margin Percent
SKU count Percent
$Sales
%Margin
+ →
+ Level 6 … And also with the quality of the optimization
▪Analytically
cluster
stores
▪Tailor
assortment
to a
particular
customer
profile,
shopping
mission,
store
catchment
and format
▪Product
dimensions
▪Timing of
replenishment
▪Space elasticity
simultaneously
with
substitutability
▪Simplify
distribution
center (DC) using
Russian doll
▪Attribute
based
substitution
▪Predict “walk
rates”
▪New product
performance
▪Each
“subcategory”
is
individually
optimized
▪More
balanced
view (e.g.
Revenue
velocity, Profit
velocity,
loyalty, etc.).
▪Delist the
weakest
items

44 Promotion Optimization Institute • Fall Summit 2014 • Dallas, TX
Are you ready to take the leap? All sustainable sources of competitive advantage are hard to copy

45 Promotion Optimization Institute • Fall Summit 2014 • Dallas, TX
Any questions or comments?
45
Related Documents