1 Fostering Distributed Business Logic in Open 1 Collaborative Networks: an integrated approach 2 based on semantic and swarm coordination 3 Francesco P. Appio 1 , Mario G. C. A. Cimino 2,* , Alessandro Lazzeri 2 , Antonella Martini 3 , Gigliola 4 Vaglini 2 5 1 Pôle Universitaire Léonard de Vinci, Research Center (Business Group) 6 12 av. Léonard de Vinci, 92916 Paris La Défense Cedex, France 7 e-mail: [email protected] 8 9 2 Department of Information Engineering 10 University of Pisa 11 Largo Lucio Lazzarino 1 - 56122 Pisa, Italy 12 e-mail: [email protected]; [email protected]; [email protected] 13 14 3 Department of Energy, System, Territory and Construction Engineering 15 University of Pisa 16 Largo Lucio Lazzarino 1 - 56122 Pisa, Italy 17 e-mail: [email protected] 18 19 * Corresponding author 20 Mario G. C. A. Cimino 21 E-mail: [email protected] 22 Phone: +39 050 2217 455 23 Fax: +39 050 2217 600 24 Abstract 25 Given the great opportunities provided by Open Collaborative Networks (OCNs), their success 26 depends on the effective integration of composite business logic at all stages. However, a dilemma 27 between cooperation and competition is often found in environments where the access to business 28 knowledge can provide absolute advantages over the competition. Indeed, although it is apparent 29 that business logic should be automated for an effective integration, chain participants at all 30 segments are often highly protective of their own knowledge. In this paper, we propose a solution 31 to this problem by outlining a novel approach with a supporting architectural view. In our 32 approach, business rules are modeled via semantic web and their execution is coordinated by a 33 workflow model. Each company’s rule can be kept as private, and the business rules can be 34 combined together to achieve goals with defined interdependencies and responsibilities in the 35 workflow. The use of a workflow model allows assembling business facts together while 36 protecting data source. We propose a privacy-preserving perturbation technique which is based on 37

Welcome message from author
This document is posted to help you gain knowledge. Please leave a comment to let me know what you think about it! Share it to your friends and learn new things together.
Transcript
1
Fostering Distributed Business Logic in Open 1
Collaborative Networks: an integrated approach 2
based on semantic and swarm coordination 3
Francesco P. Appio1, Mario G. C. A. Cimino2,*, Alessandro Lazzeri2, Antonella Martini3, Gigliola 4
Vaglini2 5
1 Pôle Universitaire Léonard de Vinci, Research Center (Business Group) 6
12 av. Léonard de Vinci, 92916 Paris La Défense Cedex, France 7
e-mail: [email protected] 8
9 2Department of Information Engineering 10
University of Pisa 11
Largo Lucio Lazzarino 1 - 56122 Pisa, Italy 12
e-mail: [email protected]; [email protected]; [email protected] 13
14 3Department of Energy, System, Territory and Construction Engineering 15
University of Pisa 16
Largo Lucio Lazzarino 1 - 56122 Pisa, Italy 17
e-mail: [email protected] 18 19
* Corresponding author 20
Mario G. C. A. Cimino 21
E-mail: [email protected] 22
Phone: +39 050 2217 455 23
Fax: +39 050 2217 600 24
Abstract 25
Given the great opportunities provided by Open Collaborative Networks (OCNs), their success 26
depends on the effective integration of composite business logic at all stages. However, a dilemma 27
between cooperation and competition is often found in environments where the access to business 28
knowledge can provide absolute advantages over the competition. Indeed, although it is apparent 29
that business logic should be automated for an effective integration, chain participants at all 30
segments are often highly protective of their own knowledge. In this paper, we propose a solution 31
to this problem by outlining a novel approach with a supporting architectural view. In our 32
approach, business rules are modeled via semantic web and their execution is coordinated by a 33
workflow model. Each company’s rule can be kept as private, and the business rules can be 34
combined together to achieve goals with defined interdependencies and responsibilities in the 35
workflow. The use of a workflow model allows assembling business facts together while 36
protecting data source. We propose a privacy-preserving perturbation technique which is based on 37
2
digital stigmergy. Stigmergy is a processing schema based on the principle of self-aggregation of 38
marks produced by data. Stigmergy allows protecting data privacy, because only marks are 39
involved in aggregation, in place of actual data values, without explicit data modeling. This paper 40
discusses the proposed approach and examines its characteristics through actual scenarios. 41
Keywords: open collaborative network; workflow; business rule; web ontology; data 42
perturbation; stigmergy. 43
44
1. Introduction and Motivation 45
1.1 Moving towards Open Collaborative Networks 46
A progressive opening of the boundaries of the companies is increasingly taking place. 47
Companies started applying this philosophy since the 1990s, by looking at the enormous potential 48
outside their walls, even those of their supply chains. In such a context, borders are constantly 49
blurring, formal and informal networks interplay, companies have multiple memberships to 50
dynamic and evolving structures. 51
From an historical perspective, three decades have shaped the environmental conditions for 52
enabling inter-enterprise collaboration (e.g., Camarinha-Matos, 2013; Curley and Salmelin, 2013, 53
Gastaldi et al., 2015). The 1990s were characterized by a competitive landscape leveraging 54
inward-looking systems, concentrated on making enterprise more efficient in isolation, where 55
collaboration activities were mainly focused on signing agreements with supply chain partners. In 56
such context, where the Internet was still in infancy, the debate about the role of information 57
technology in future manufacturing systems was still ongoing, and organizations were trying to 58
structure policies and mechanisms to become more specialized and inter-connected (Browne et al., 59
1995). Some firms began to employ the early concepts of Extended Enterprise (EE), i.e., the 60
principle that a dominant enterprise extends its boundaries to all or some of its suppliers. More 61
simply, the early concept of EE meant placing the manufacturing systems in the context of the 62
value chain (Porter, 1985). Such extended configurations lead to Computer Integrated 63
Manufacturing (CIM) systems. Indeed, from one side the challenge of CIM was to realize 64
integration within the factory, from the other side the challenge to manufacturing was shifting to 65
facilitate inter-enterprise networking across the value chain. In the late 90s, concepts such as 66
Virtual Enterprises (VEs) and Virtual Organizations (VOs) started diffusing, although still at the 67
level of single – and rather isolated – networks. More precisely, VEs represent dynamic and often 68
short-term alliances of enterprises that come together to share skills or core competencies and 69
resources, in order to better respond to business opportunities, and whose cooperation is supported 70
by computer networks (Li et al., 2014). An EE can be seen as a particular case of a VE. VOs 71
generalize the concept of VEs, because it is not limited to an alliance for profit, but to achieve 72
missions/goals (Camarinha-Matos and Afsarmanesh, 2007). 73
The 2000s were characterized by ICT advancements enabling new collaborative partnerships 74
modes and the concept of Collaborative Networked Organization (CNO), which further 75
generalizes VO. A CNO is an organization whose activities, roles, governance rules, are 76
3
manifested by a network consisting of a variety of entities (e.g., organizations and people). Such 77
entities are largely autonomous, geographically distributed, and heterogeneous in terms of their 78
operating environment, culture, social capital and goals. But they collaborate to better achieve 79
common or compatible goals, thus jointly generating value, and whose interactions are supported 80
by computer network. Since not all forms of collaborative partnership imply a kind of organization 81
of activities, roles, and governance rules, the concept of Collaborative Network (CN) further 82
generalize the collaborative partnership (Camarinha-Matos and Afsarmanesh, 2007; Camarinha-83
Matos et al., 2009; Romero and Molina, 2010). In the meanwhile, a progressive opening of the 84
companies boundaries enabled what has been defined the Open Innovation paradigm 85
(Chesbrough, 2003, Appio et al., 2016), in which externally focused, collaborative innovation 86
practices were adopted. 87
A deep mutation has been occurring in the last decade, the 2010s, in which the competitive 88
landscape morphed with the introduction of the Ecosystems perspective (Baldwin and Von Hippel, 89
2011; Curley and Samlelin, 2013). A new paradigm has been opening up, stressing the salient 90
characteristics of the variety of CNs discussed by Camarinha-Matos et al. (2009). We label it as 91
Open CNs (OCNs). OCNs are based on principles of integrated collaboration, co-created shared 92
value, cultivated innovation ecosystems, unleashed exponential technologies, and extraordinarily 93
rapid adoption (Curley and Salmelin, 2013). They also capture the elemental characteristics of the 94
constant transformation of networks ecosystems: continual realignment of synergistic relationships 95
of people, knowledge and resources for both incremental and transformational value co-creation 96
(Ramaswamy and Gouillart, 2010). Through relationships, value co-creation networks evolve from 97
mutually beneficial relationships between people, companies and investment organizations. A 98
continual realignment of synergistic relationships of people, knowledge and resources is required 99
for vitality of the ecosystem. Requirements for responsiveness to changing internal and external 100
forces make co-creation an essential force in a dynamic innovation ecosystem (Russell et al., 101
2011). In the third era, borders are further blurring, formal and informal networks interplay, 102
companies have multiple memberships to dynamic and evolving structures. In OCNs contexts 103
where ubiquity is for the first time allowed, the probability of break-away improvements increases 104
as a function of diverse multidisciplinary experimentation, a controlled process, addressing 105
systematically a set of steps, supported by different mechanisms and approaches to characterize 106
the management functionalities of a CN during its entire lifecycle. 107
In the next section we introduce the distinctive characteristics of the OCNs, trying to 108
disentangle the needs along with the challenges. 109
1.2 Characterizing Open Collaborative Networks (OCNs) 110
Camarinha-Matos and Afsarmanesh (2005, 2009) provide a comprehensive characterization of 111
the CN, defining it as a network consisting of a variety of entities (e.g. organizations and people) 112
that are largely autonomous, geographically distributed, and heterogeneous in terms of their 113
operating environment, culture, social capital and goals, but that collaborate to better achieve 114
common or compatible goals, thus jointly generating value, and whose interactions are supported 115
by computer network. Moving from this definition, we want to characterize a type of CN in which 116
4
more unstructured and self-organizing behaviors can be considered (e.g., Panchal 2010; Levine 117
and Prietula, 2013; Baldwin and Von Hippel, 2011; Bonabeau et al., 1997; Holland et al., 1999). 118
For this purpose, this section aims at characterizing the OCN according to the key dimensions. 119
An OCN can be thought of as entailing all the characteristics of a CN but is different under the 120
following respects: 121
1. it allows agents to take advantage of signals echoing the three layers (Moore, 1996) 122
namely, business ecosystem (trade associations, investors, government agencies and other 123
regulatory bodies, competing organizations that have shared product & service attributes, 124
business processes and organizational arrangements, other stakeholders, labor unions), 125
extended enterprise (i.e. direct customers, customers of my customers, standard bodies, 126
suppliers of complementary products, suppliers of my suppliers), and core business (core 127
contributors, distribution channels, direct suppliers); 128
2. it is inspired by ecosystem perspective, and then deals with a variety of structures ranging 129
from communities, to very loosely coupled agents coexisting and influencing each other. 130
The ecosystem, in its structural and functional openness, is the fertile ground for more 131
complex networks to grow and interact (Iansiti and Levien, 2004); 132
3. it subsumes that agents self-organize into more or less structured networks maximizing 133
the returns on the inside-out/outside-in practices (or knowledge inflows and outflows); 134
the ecosystem perspective potentially allows for a simultaneous reduction of both error 135
types by decreasing the risk of information overload, improving the ability to handle 136
complexity and minimizing interpretation biases (Velu et al., 2010). About the two errors, 137
a type I interpretation error (false positive) consists in detecting a specific market trend 138
when there is actually none. Noise is just wrongly interpreted as a valuable signal of an 139
important development in customer needs, competitor behavior or technological progress. 140
Conversely, a type II interpretation error (false negative) consists in failing to observe an 141
important market trend, when in truth there is one. Meaningful market signals are thus 142
overlooked or wrongly interpreted as meaningless. Firms operating in (closed) CNs have 143
to trade-off those type I and type II errors, both of which can be extremely costly; 144
4. it is less hierarchical and more oriented towards self-organization (Steiner et al., 2014; 145
Panchal, 2010; Jelasity et al., 2006). Self-organization is the process in which pattern at 146
the global level of a system emerges solely from numerous interactions among the lower-147
level components of the system. Moreover the rules specifying the interactions among the 148
system’s component are executed using only local information, without reference to the 149
global pattern. Self-organization relies on four ingredients: a) positive feedback, b) 150
negative feedback, c) amplification of fluctuations, and d) multiple interactions. The 151
behavior of entities may be attributed to physical behavior in the case of physical entities 152
and decisions in the case of human participants. The behaviors of entities are based on 153
local information available to them, which changes as the entities interact with each other. 154
These changes in local information may result in positive or negative feedback; a balance 155
between these two types of feedback results in self-organizing behavior; 156
5
5. it tolerates (and balances) two different types information exchange: direct and indirect. 157
Direct interactions involve direct information exchange between different individuals, 158
which changes their local information, and hence, their decisions. In the case of indirect 159
interactions, the individual actions affect the environment and modify it. Such indirect 160
interaction of entities with the environment plays an important role in achieving 161
coordination through self-organization mechanisms (Kiemen, 2011). 162
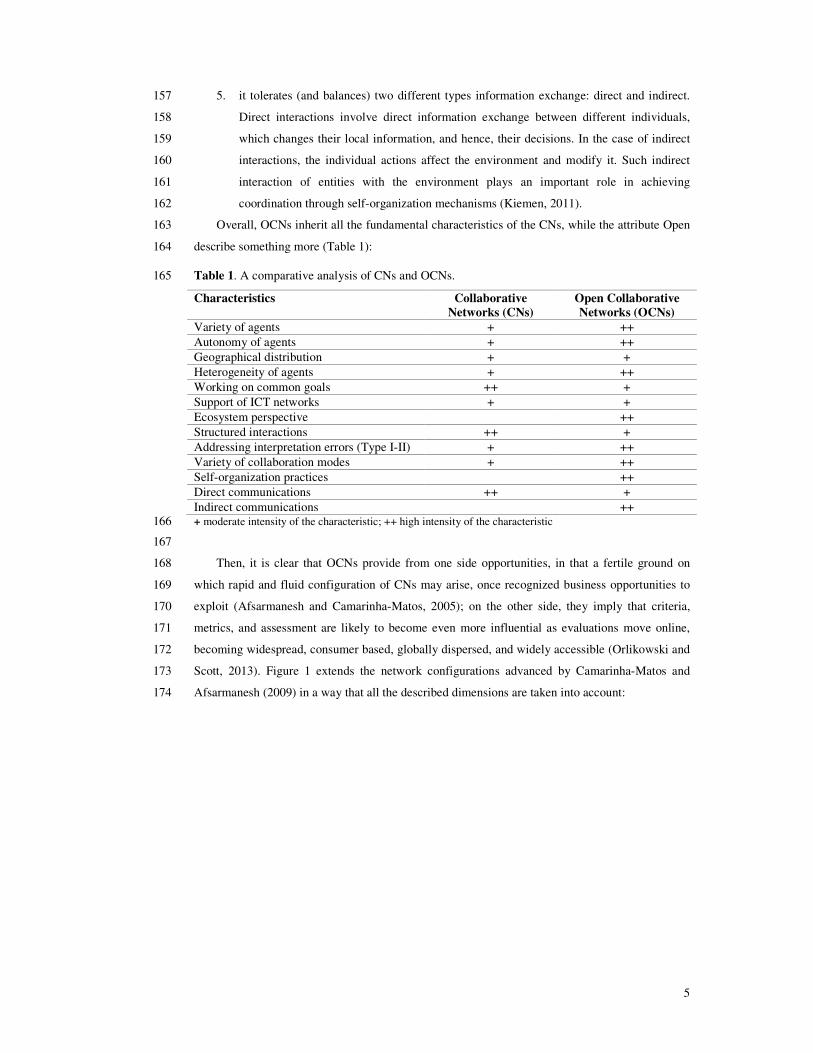
Overall, OCNs inherit all the fundamental characteristics of the CNs, while the attribute Open 163
describe something more (Table 1): 164
Table 1. A comparative analysis of CNs and OCNs. 165
Characteristics Collaborative Networks (CNs)
Open Collaborative Networks (OCNs)
Variety of agents + ++ Autonomy of agents + ++ Geographical distribution + + Heterogeneity of agents + ++ Working on common goals ++ + Support of ICT networks + + Ecosystem perspective ++ Structured interactions ++ + Addressing interpretation errors (Type I-II) + ++ Variety of collaboration modes + ++ Self-organization practices ++ Direct communications ++ + Indirect communications ++ + moderate intensity of the characteristic; ++ high intensity of the characteristic 166
167
Then, it is clear that OCNs provide from one side opportunities, in that a fertile ground on 168
which rapid and fluid configuration of CNs may arise, once recognized business opportunities to 169
exploit (Afsarmanesh and Camarinha-Matos, 2005); on the other side, they imply that criteria, 170
metrics, and assessment are likely to become even more influential as evaluations move online, 171
becoming widespread, consumer based, globally dispersed, and widely accessible (Orlikowski and 172
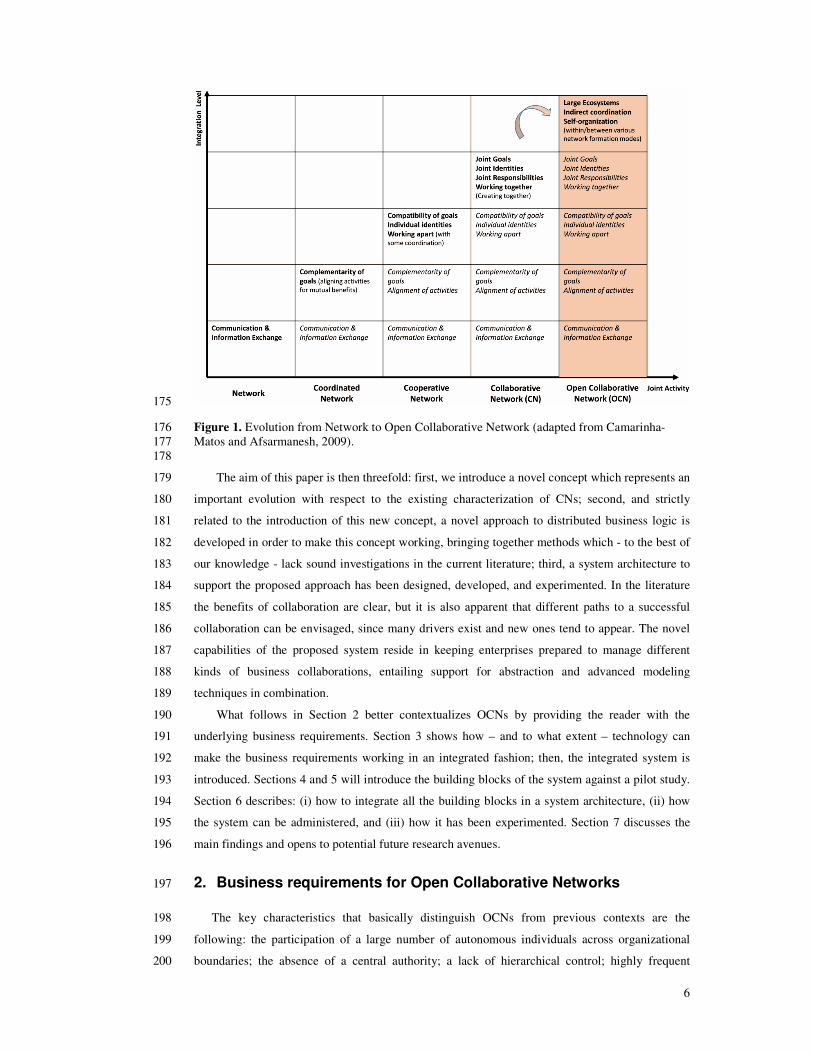
Scott, 2013). Figure 1 extends the network configurations advanced by Camarinha-Matos and 173
Afsarmanesh (2009) in a way that all the described dimensions are taken into account: 174
6
175
Figure 1. Evolution from Network to Open Collaborative Network (adapted from Camarinha-176 Matos and Afsarmanesh, 2009). 177 178
The aim of this paper is then threefold: first, we introduce a novel concept which represents an 179
important evolution with respect to the existing characterization of CNs; second, and strictly 180
related to the introduction of this new concept, a novel approach to distributed business logic is 181
developed in order to make this concept working, bringing together methods which - to the best of 182
our knowledge - lack sound investigations in the current literature; third, a system architecture to 183
support the proposed approach has been designed, developed, and experimented. In the literature 184
the benefits of collaboration are clear, but it is also apparent that different paths to a successful 185
collaboration can be envisaged, since many drivers exist and new ones tend to appear. The novel 186
capabilities of the proposed system reside in keeping enterprises prepared to manage different 187
kinds of business collaborations, entailing support for abstraction and advanced modeling 188
techniques in combination. 189
What follows in Section 2 better contextualizes OCNs by providing the reader with the 190
underlying business requirements. Section 3 shows how – and to what extent – technology can 191
make the business requirements working in an integrated fashion; then, the integrated system is 192
introduced. Sections 4 and 5 will introduce the building blocks of the system against a pilot study. 193
Section 6 describes: (i) how to integrate all the building blocks in a system architecture, (ii) how 194
the system can be administered, and (iii) how it has been experimented. Section 7 discusses the 195
main findings and opens to potential future research avenues. 196
2. Business requirements for Open Collaborative Networks 197
The key characteristics that basically distinguish OCNs from previous contexts are the 198
following: the participation of a large number of autonomous individuals across organizational 199
boundaries; the absence of a central authority; a lack of hierarchical control; highly frequent 200
7
interactions and complex exchange dynamics (e.g., Panchal 2010; Levine and Prietula, 2013; 201
Baldwin and Von Hippel, 2011). These characteristics result in self-organization of participants, 202
activities, and organizational (community) structures, as opposed to hierarchical structures in 203
traditional product development (Bonabeau et al., 1997; Holland et al., 1999). Self-organization 204
means that a functional structure appears and maintains spontaneously. The control needed to 205
achieve this must be distributed over all participating components. Overall, OCNs can be thought 206
of as distributed systems which are different from centralized and decentralized ones (Dhakal, 207
2009; Andrés and Poler, 2013; Andrés and Poler, 2014). Indeed, in distributed systems all agents 208
are networked on the basis of equality, independence, and cooperation. The greatest advantage of 209
distribution is that the resilience of the system increases with the increase in the number of 210
participants. Nowadays, distributed systems can be made possible thanks to the advancements in 211
the ICT infrastructures. Distributed systems are also known as layer-less system or hierarchy-less 212
system in that they use lateral (horizontal) protocols based on equality of relationship as opposed 213
to a decentralized system (also known as layered system or hierarchical system), which uses 214
hierarchical protocols where a higher agent must always control the lower ones. Both centralized 215
and decentralized systems thrive on the use of authority, something which is really smoothed in 216
the cases of OCNs. In the literature, Andrés and Poler (2013) identify and analyze strategic, 217
tactical, and operational issues arising in collaborative networks, proposing a classification matrix 218
for the most relevant ones. In a more recent study, they also identify relevant collaborative 219
processes that non-hierarchical manufacturing networks perform (Andrés and Poler, 2014). A 220
novel approach supporting unstructured networked organization is presented in (Loss and Crave, 221
2011). Here, the authors explore the concept of agile business models for CNs, describing a 222
theoretical framework. Ollus et al. (2011) presented a study aimed to support the management of 223
projects in networked and distributed environments. Collaborative management includes shared 224
project management, which means delegation of management responsibility and some extent of 225
self-organization. The management may in many cases be non-hierarchical and participative with 226
result-based assessment of progress. 227
The general objectives of a OCNs (e.g., Brambilla et al., 2011a, 2011b; Msanjila and 228
Afsarmanesh, 2006; Msanjila and Afsarmanesh, 2011; Romero et al., 2009; Romero and Molina, 229
2011) can be then articulated into different requirements: (i) transparency: to make the execution 230
of shared procedures more visible to the affected stakeholders; (ii) trust: to deploy measurable 231
elements that can establish a judgment about a given trust requirement; (iii) participation: to 232
engage a broader community to raise the awareness about, or the acceptance of, the process 233
outcome; (iv) activity distribution: to assign an activity to a broader set of performers or to find 234
appropriate contributors for its execution; (v) decision distribution: to separate and distribute 235
decision rules that contribute to the taking a decision; (vi) social feedback: to acquire feedback 236
from stakeholders along the work-flow, for process improvement; (vii) knowledge and information 237
sharing: to disseminate knowledge and information in order to improve task execution without 238
market disruption; (viii) collaboration readiness: to grasp partners’ preparedness, promptness, 239
aptitude and willingness; (ix) enabling ICT: to support collaborative activities in OCNs. Overall, 240
an extended perspective on characterizing the collaborative capability (Ulbrich et al., 2011) and 241
8
how to make it work through appropriate governance mechanisms are needed (Clauss and Spiety, 242
2015; Heindenreich et al., 2014). 243
It follows a more detailed explanation of how – and to what extent – it is possible to identify 244
patterns and technologies supporting OCNs business requirements. In Section 3, business 245
requirements will be better focused on a technological view. 246
247
2.1 Managing knowledge via workflow technology 248
In OCNs contexts if, on one side, firms must develop the ability to recognize the value of new 249
external knowledge, on the other side, they have to assimilate and utilize it for commercial ends 250
and they have to integrate it with knowledge that has been generated internally. They must develop 251
absorptive capacity (Fabrizio, 2009) depending on their knowledge integration and generation 252
mechanisms, many of which embedded in its products, processes and people (Escribano et al., 253
2009). This process of acquiring and internally using external knowledge has been labelled 254
“inbound open innovation” (Chesbrough, 2003). Empirical studies have consistently found that 255
firms perform more inbound than outbound activities (e.g., Chesbrough and Crowther, 2006), this 256
openness usually taking the form of a heightened demand for external knowledge and other 257
external inputs in the innovation process (Fagerberg, 2005); however, firms still fail to capture its 258
potential benefits (Van de Vrande et al. 2009). Indeed, past studies (e.g., Deeds and Hill, 1996; 259
Katila and Ahuja, 2002; Rothaermel and Deeds, 2006) have found that the process of external 260
search can be ineffective over a certain effort due to firm’s bounded rationality and limited 261
information processing. Since the late 1980s, workflow technology (i.e. workflow modeling and 262
workflow execution (Leymann and Roller, 2000)) has been used to compose higher-level business 263
functionality out of individual (composed or non-composed) functions. Such technologies have 264
today the potential to provide solutions for the effective management of knowledge inflows. 265
Workflow-based coordination as a system for tasks routing and allocation, can be thought of as the 266
first place where knowledge is created, shared and used (Reijers et al. 2009). 267
2.2 Adopting and using metrics and indicators 268
With the explosion of diverse types of information in OCNs in general, and in OCNs in 269
particular, analytics technologies that mine structured and unstructured data to derive insights are 270
now receiving unprecedented attention (Davenport and Harris, 2007; Prahalad and Krishnan, 271
2008). Today’s analytics must be operated firms wide, deep, and at a strategic level (Davenport et 272
al., 2010). A wide range of unstructured data from firms’ internal as well as external sources is 273
available (Chen et al., 2011), enabling a broader set of industry partners to participate. In OCNs, 274
under this model, all entities collaborate and co-develop high value analytics solutions. Well 275
(2009) properly frames them under the label “collaborative analytics” namely, a set of analytic 276
processes where the agents work jointly and cooperatively to achieve shared or intersecting goals. 277
They include data sharing, collective analysis and coordinated decisions and actions. Collaborative 278
analytics, while encompass the goals of their conventional counterparts, seek also to increase 279
9
visibility of important business facts and to improve alignment of decisions and actions across the 280
entire business (Well, 2009; Chen et al., 2012). 281
2.3 Ontologies and decision rules 282
Fundamental to collaborative efforts in OCNs is what Jung (2011) defines as “contextual 283
synchronization”, facilitating the mutual understanding among the members (Afsarmanesh and 284
Ermilova, 2007; Plisson, 2007; Romero et al., 2007, 2008), agents should at least define which 285
ontologies rule collaborative efforts. While Jung (2011) considers online communities of 286
individual users, we are trying to adopt an organizational point of view in that the OCN is 287
populated with organizational agents. Common and flexible ontology establishment goes through a 288
set of management activities and supporting tools for OCNs ontology adaptation into a specific 289
OCN domain sector, for OCN ontology evolution during the OCN lifecycle, as well as for OCN 290
ontology learning process (Ermilova and Afsarmanesh, 2006; Plisson, 2007; Chen, 2008). The 291
evolutionary trait of ontologies should be considered due to the high speed in which collaboration 292
in OCNs may expire; to this end, e.g. an Ontology Library Systems (OLS) in more than necessary 293
(Simões et al., 2007). 294
Overall, in OCNs, ontologies may help under several respects (Zelewski, 2001; Bullinger, 295
2008): (i) to overcome language barriers among participating members: different language and 296
knowledge cultures rules can be captured and ‘translated’ by an ontology; (ii) to allow the internal 297
integration of information systems which are today both technically driven and governed by 298
managerial or customer oriented understanding; (iii) to enable semantic access to the knowledge in 299
OCNs; (iv) to coordinate collaborative actors with different knowledge backgrounds. This can 300
lead to a number of potential applications, e.g. the integration of information and of systems for 301
computer-supported cooperative work (CSCW) between companies of the same or of different 302
domains. 303
2.4 Information sharing policies 304
Information reduces uncertainty in OCNs (Fiala, 2005) and aids in integrating flows and 305
functions across working groups such as partners (e.g., Barut et al., 2002; Krovi et al., 2003; 306
Patnayakuni et al., 2006). This reduction of uncertainty is useful as it saves organizational time 307
and cost by minimizing alternate decisions that arise due to uncertainty (Durugbo, 2015). 308
Furthermore, the flow of information is important for managing interactions and negotiations 309
during collaboration activities and for combining the work of individual agents. Agents 310
exchanging information in OCNs should confront with two characteristic: 1) trails, in order to 311
identify new business opportunities and organizations to partner with; trails vanish over time 312
realizing temporal evolution dynamics of OCNs; 2) information perturbation, as enabler of 313
collaboration as privacy and unveiling sensitive information of highly competitive value; our 314
context may be assimilated to the partial-information problem formulated by Palley and Kremer 315
(2014), in which the agent only learns the rank of the current option relative to the options that 316
have already been observed. It is clear that information is something which is capable of having a 317
value attached to it and can be considered to be an economic good (Bates, 1989). In order to 318
10
protect the economic value of information, it can be provided by using a privacy-preserving 319
mechanism. 320
2.5 Governance requirements 321
2.6 A number of approaches about OCNs governance may be adopted and adapted; however, 322
almost all the existing ones are devoted to classical networks which are static in nature 323
(Rabelo et al., 2014).. Some of them underlie the importance of at least three types of 324
governance: transactional governance, relational governance, institutionalized governance 325
(Clauss and Spieth, 2015). Transactional governance studies have focused on the deployment 326
of rules and contracts to safeguard transactions from opportunistic behavior (Puranam and 327
Vanneste, 2009). These are specified in order to formalize processes, activities and roles, 328
define responsibilities and justify consequences in case of disputes. On the other hand, studies 329
concerned with relational governance emphasizing inherent and moral control, governing 330
exchanges through consistent goals and cooperative atmospheres. Trust has been emphasized 331
as a fundamental element of relational governance (Das and Teng, 1998). It has an even 332
greater effect if relational norms between partners establish consistent role behaviours that are 333
in line with partners’ joint interests (Tangpong et al., 2010). Institutionalized governance 334
covers a separate functional unit responsible for an active network management (Heidenreich 335
et al., 2014). OCN orchestration mentions activities that enable and facilitate the coordination 336
of the network and the realization of the innovation outputs (Ritala et al., 2009). The 337
orchestrator is responsible for discretely influencing other firms and to support the appropriate 338
conditions for knowledge exchange and innovation. However, being the OCN potentially a 339
highly un-structured CN, the aforementioned forms of governance may be thought of as 340
emergent (Wang et al., 2011). 341
342
3. Establishing Open Collaborative Network: a technological view 343
In the last two decades the design of information systems for distributed organizations has 344
undergone a paradigm shift, from data/message-orientation to process-orientation, giving to 345
organizational context an important role. Modern Business Process Management Systems (BPMS) 346
aim to support operational processes, referred to as workflows. BPMS can be efficiently realized 347
using a Service-oriented Architecture (SOA), where the information system can be seen as a set of 348
dynamically connectable services with the processes as the “glue” (Sun et al., 2016, Liu et al., 349
2009). The fit between BPMS and SOA has been formalized by the Business Process Model and 350
Notation (BPMN) standard (OMG 2011, van der Aalst 2009). 351
In classical Business Process Management (BPM), processes are orchestrated centrally by the 352
organization, and deployed for execution by predefined subjects internal to the organization. This 353
closed-world approach is not suitable for OCN, where the open and collaborative nature of the 354
global processes is essential. Other requirements may be incorporated, such as transparency 355
control, easy participation, activity distribution, and decision distribution (Brambilla, 2011a). 356
Thus, a certain level of control in knowledge flow is essential. Unfortunately, structural 357
11
approaches for knowledge modeling are usually domain dependent and do not control the process. 358
Furthermore, business requirements change frequently, not only for different enterprises but also 359
for different period of time in the same enterprise, as markets and business practices change 360
(Wang 2005, Sarnikar 2007). To add adaptation capabilities to the network-based social 361
collaboration, some interesting works have been done on the formal modeling of collaboration 362
processes as a negotiation, such as those based on Social BPM (Brambilla, 2011a), and Social 363
Protocols (Picard, 2006). However, much work still has to be done before such approaches can be 364
used on a regular basis. 365
BPMN is increasingly adopted in research projects as a language to specify guidelines for 366
virtual organizations. For example in the ECOLEAD project (Romero and Molina, 2009; 367
Peñaranda Verdeza et al. 2009) the BPM centric approach has been used to define a set of general 368
and replicable business processes models for future instantiations into specific virtual 369
organizations, providing rationale of activities that should be carried out by a set of actors in order 370
to achieve the expected business process results. The ECOLEAD architecture presented in (Rabelo 371
et al., 2006; Rabelo et al., 2008) is made of different services: (i) horizontal services, such as 372
mailing, chat, task list, file storage, notification, calendar, wiki, forum, etc. (ii) basic services, such 373
as security, billing, service composition, reporting, discovery; (iii) platform-specific services; (iv) 374
legacy systems. The design approach is bottom-up, and it has been based on the web-services 375
technology. From the technological point of view, such architecture is important as it contains 376
elements that are incorporated into the current generation of CN, which can be implemented in a 377
diversity of platforms, equipment and devices. 378
In this paper we adopt a top-down design approach, focused on technological enablers of 379
business logic. An enabler is a factor addressing a critical aspect, which is not already incorporated 380
in existing approaches. More precisely, we propose a comprehensive approach for creating 381
business logic integration solutions in OCN. A system architecture has been also implemented and 382
demonstrated experimentally. The approach is based on three core technological enablers, 383
providing a conceptual structure to design an OCN. 384
The first technological enabler is the workflow design, which provides coordination and 385
flexibility in process. The workflow represents the sequence of steps, decisions, and the flow of 386
work between the process participants (Ray and Lewis, 2009). We assume that the process model 387
is encoded in BPMN, an open and standard language which in turn can be deployed and executed 388
by a BPMS to directly control the workflow engines (Sharp 2012, Fraternali, 2011, Picard 2010). 389
The second technological enabler is the business rule design, which regulates how knowledge 390
or information in one form may be transformed into another form through derivation rules. A 391
derivation can either be a computation rule (e.g. a formula for calculating a value) or an inference 392
rule (e.g. if some fact is true, then another inference fact must also be true) (Erikson 2000). 393
Business rules are designed in terms of modular tasks and encapsulated into BPMN business rules 394
tasks. To represent inference business rules, we used the de-facto standard for semantic rules on 395
the web, Semantic Web Rule Language (SWRL)(W3C 2004). SWRL rules can be connected to 396
facts expressed in Resource Description Framework (RDF) (W3C 2014) and to classes expressed 397
in Web Ontology Language (OWL) (W3C 2012), to allow facts and rules to be split or combined 398
12
into flexible logical sets (Wang 2005, Meech 2010). Business rules modeling and execution is an 399
important application of the Semantic Web in collaborative environments (Meech 2010). 400
The third technological enabler is the privacy-preserving collaborative analytics. With regards 401
to it, a workflow model is also used to assemble data flow together while preserving each 402
individual flow. To maximize the usability of data flow without violating its market value, a 403
suitable data perturbation technique is proposed, enabling collaborative analytics. Indeed relevant 404
marketing concerns largely prevent data flow in collaborative networks. More specifically, 405
business data is perturbed via digital stigmergy, i.e., a processing schema based on the principle of 406
self-aggregation of marks produced by data. Stigmergy allows protecting data privacy, because 407
only marks are involved in aggregation, in place of actual data values. There are two basic features 408
which allow stigmergy to protect data flows in OCN. The first is the decentralization of control in 409
decision making: each member has a partial view of the process which is insufficient to make the 410
decision. Second, members are not statically organized but can dynamically move between 411
different virtual enterprises. 412
In terms of supporting information technology, the combination of the first two enablers can 413
support life cycle maintenance when managing process improvement and dynamic process 414
changes. In the literature these aspects are usually referred to as dynamic BPs (Grefen et al., 415
2009), context-aware BPs and self-adaptation of BPs (Cimino and Marcelloni, 2011). More 416
specifically: (ii) the BPMN 2 specification includes a number of constructs and design patterns to 417
model decentralized business-collaborations (Bechini et al., 2008); (i) the service-oriented 418
computing, which is at the core of the BPMN 2 conception, is purposely designed to provide 419
flexible, dynamic, component-oriented interoperability, for the dynamic composition of business 420
application functionality using the web as a medium (Cimino and Marcelloni, 2011). However, the 421
web services framework offers a low level of semantics for the specification of rich business 422
processes, which is important for interoperability (Grefen et al., 2009). In the literature, 423
considerable work employs Semantic Web as a prominent technique for semantic annotation of 424
Web Services (Zeshan and Mohamad, 2011). With the help of well-defined semantics, machines 425
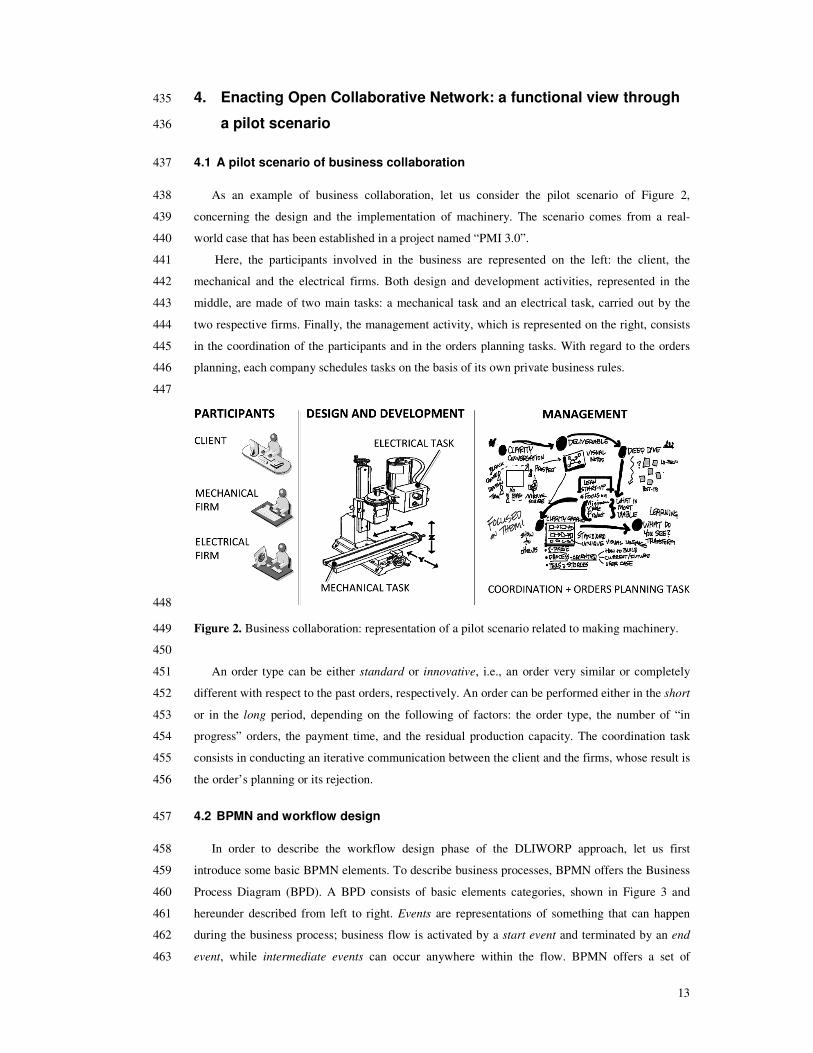
can understand the information and process it on behalf of humans, as software agents (Cimino 426
and Marcelloni, 2011). Furthermore, Semantic Web is at the core of context-awareness based 427
modeling, where two levels can be distinguished to improve reusability ad adaptability: the service 428
level and the external environment or context level (Furno and Zimeo 2014). 429
Given the above enablers, both the proposed approach and the prototype are referred to as 430
DLIWORP: Distributed Business Logic Integration via Workflow, Rules and Privacy-preserving 431
analytics. To better characterize the DLIWORP approach from a functional standpoint, the next 432
section illustrates a pilot scenario, which will be employed to explain all the functional modules of 433
the system. 434
13
4. Enacting Open Collaborative Network: a functional view through 435
a pilot scenario 436
4.1 A pilot scenario of business collaboration 437
As an example of business collaboration, let us consider the pilot scenario of Figure 2, 438
concerning the design and the implementation of machinery. The scenario comes from a real-439
world case that has been established in a project named “PMI 3.0”. 440
Here, the participants involved in the business are represented on the left: the client, the 441
mechanical and the electrical firms. Both design and development activities, represented in the 442
middle, are made of two main tasks: a mechanical task and an electrical task, carried out by the 443
two respective firms. Finally, the management activity, which is represented on the right, consists 444
in the coordination of the participants and in the orders planning tasks. With regard to the orders 445
planning, each company schedules tasks on the basis of its own private business rules. 446
447
448
Figure 2. Business collaboration: representation of a pilot scenario related to making machinery. 449
450
An order type can be either standard or innovative, i.e., an order very similar or completely 451
different with respect to the past orders, respectively. An order can be performed either in the short 452
or in the long period, depending on the following of factors: the order type, the number of “in 453
progress” orders, the payment time, and the residual production capacity. The coordination task 454
consists in conducting an iterative communication between the client and the firms, whose result is 455
the order’s planning or its rejection. 456
4.2 BPMN and workflow design 457
In order to describe the workflow design phase of the DLIWORP approach, let us first 458
introduce some basic BPMN elements. To describe business processes, BPMN offers the Business 459
Process Diagram (BPD). A BPD consists of basic elements categories, shown in Figure 3 and 460
hereunder described from left to right. Events are representations of something that can happen 461
during the business process; business flow is activated by a start event and terminated by an end 462
event, while intermediate events can occur anywhere within the flow. BPMN offers a set of 463
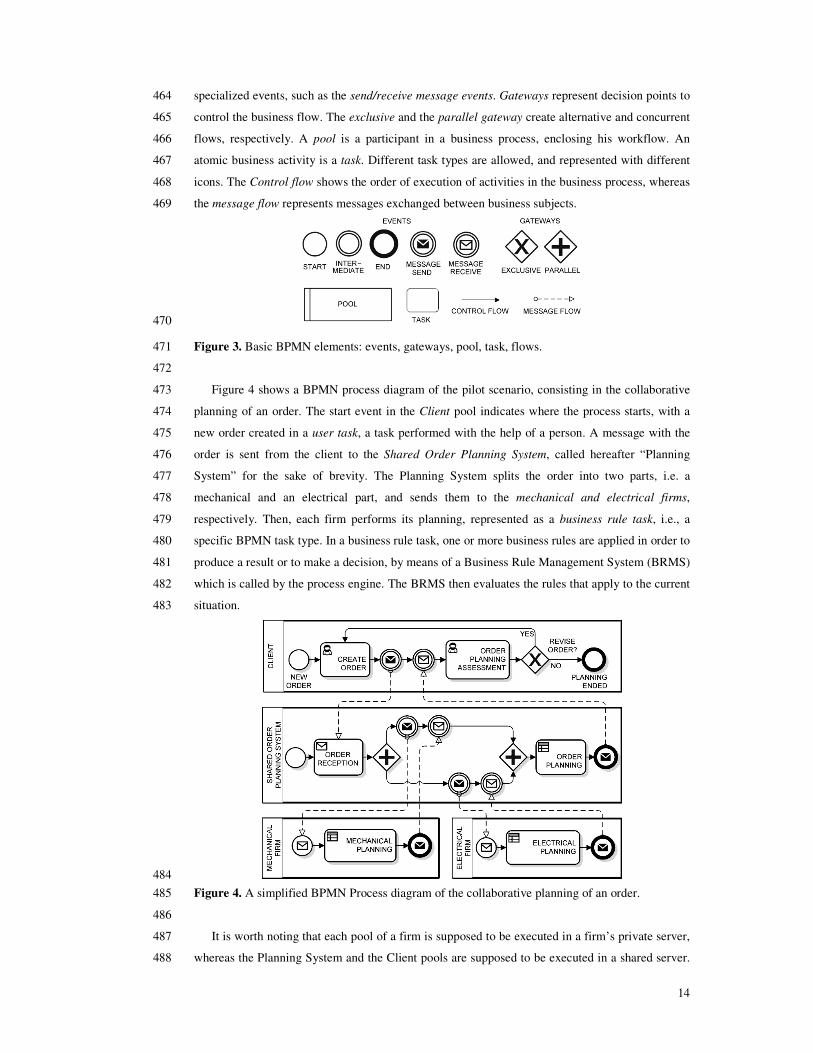
14
specialized events, such as the send/receive message events. Gateways represent decision points to 464
control the business flow. The exclusive and the parallel gateway create alternative and concurrent 465
flows, respectively. A pool is a participant in a business process, enclosing his workflow. An 466
atomic business activity is a task. Different task types are allowed, and represented with different 467
icons. The Control flow shows the order of execution of activities in the business process, whereas 468
the message flow represents messages exchanged between business subjects. 469
470
Figure 3. Basic BPMN elements: events, gateways, pool, task, flows. 471
472
Figure 4 shows a BPMN process diagram of the pilot scenario, consisting in the collaborative 473
planning of an order. The start event in the Client pool indicates where the process starts, with a 474
new order created in a user task, a task performed with the help of a person. A message with the 475
order is sent from the client to the Shared Order Planning System, called hereafter “Planning 476
System” for the sake of brevity. The Planning System splits the order into two parts, i.e. a 477
mechanical and an electrical part, and sends them to the mechanical and electrical firms, 478
respectively. Then, each firm performs its planning, represented as a business rule task, i.e., a 479
specific BPMN task type. In a business rule task, one or more business rules are applied in order to 480
produce a result or to make a decision, by means of a Business Rule Management System (BRMS) 481
which is called by the process engine. The BRMS then evaluates the rules that apply to the current 482
situation. 483
484
Figure 4. A simplified BPMN Process diagram of the collaborative planning of an order. 485
486
It is worth noting that each pool of a firm is supposed to be executed in a firm’s private server, 487
whereas the Planning System and the Client pools are supposed to be executed in a shared server. 488
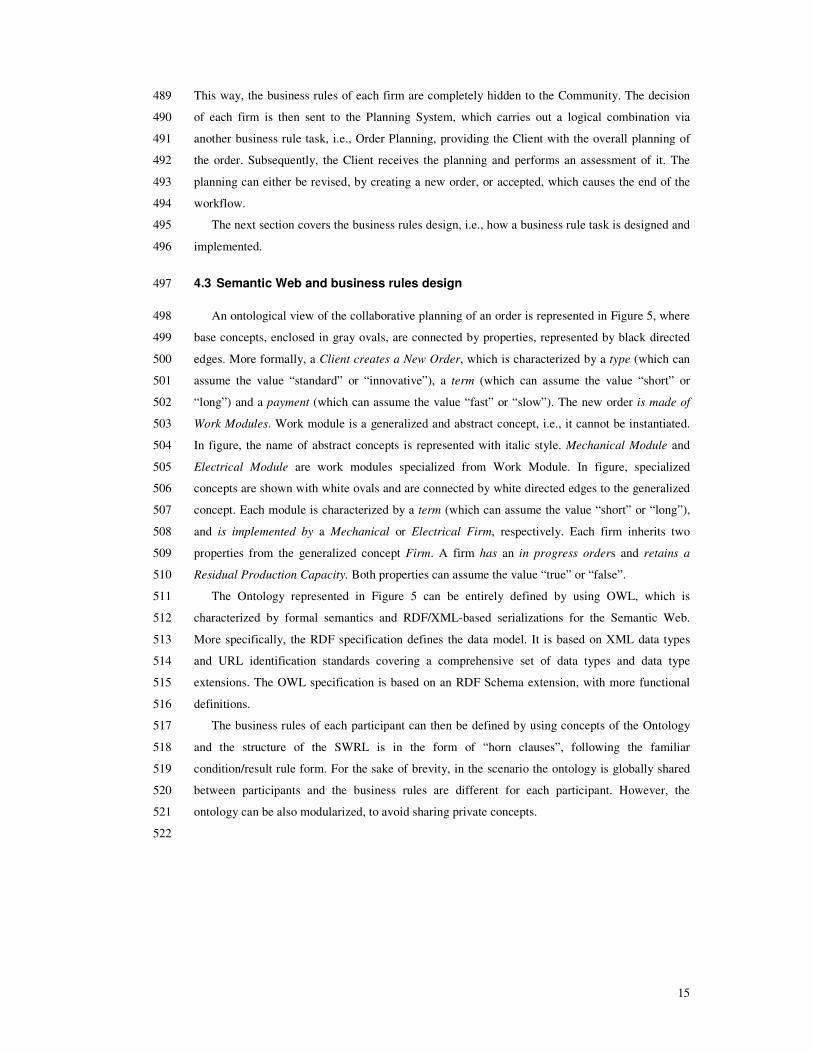
15
This way, the business rules of each firm are completely hidden to the Community. The decision 489
of each firm is then sent to the Planning System, which carries out a logical combination via 490
another business rule task, i.e., Order Planning, providing the Client with the overall planning of 491
the order. Subsequently, the Client receives the planning and performs an assessment of it. The 492
planning can either be revised, by creating a new order, or accepted, which causes the end of the 493
workflow. 494
The next section covers the business rules design, i.e., how a business rule task is designed and 495
implemented. 496
4.3 Semantic Web and business rules design 497
An ontological view of the collaborative planning of an order is represented in Figure 5, where 498
base concepts, enclosed in gray ovals, are connected by properties, represented by black directed 499
edges. More formally, a Client creates a New Order, which is characterized by a type (which can 500
assume the value “standard” or “innovative”), a term (which can assume the value “short” or 501
“long”) and a payment (which can assume the value “fast” or “slow”). The new order is made of 502
Work Modules. Work module is a generalized and abstract concept, i.e., it cannot be instantiated. 503
In figure, the name of abstract concepts is represented with italic style. Mechanical Module and 504
Electrical Module are work modules specialized from Work Module. In figure, specialized 505
concepts are shown with white ovals and are connected by white directed edges to the generalized 506
concept. Each module is characterized by a term (which can assume the value “short” or “long”), 507
and is implemented by a Mechanical or Electrical Firm, respectively. Each firm inherits two 508
properties from the generalized concept Firm. A firm has an in progress orders and retains a 509
Residual Production Capacity. Both properties can assume the value “true” or “false”. 510
The Ontology represented in Figure 5 can be entirely defined by using OWL, which is 511
characterized by formal semantics and RDF/XML-based serializations for the Semantic Web. 512
More specifically, the RDF specification defines the data model. It is based on XML data types 513
and URL identification standards covering a comprehensive set of data types and data type 514
extensions. The OWL specification is based on an RDF Schema extension, with more functional 515
definitions. 516
The business rules of each participant can then be defined by using concepts of the Ontology 517
and the structure of the SWRL is in the form of “horn clauses”, following the familiar 518
condition/result rule form. For the sake of brevity, in the scenario the ontology is globally shared 519
between participants and the business rules are different for each participant. However, the 520
ontology can be also modularized, to avoid sharing private concepts. 521
522
16
523
Figure 5. An ontological view of the collaborative planning of an order. 524
525
More specifically, the business rules can be informally expressed as follows: 526
(i) a mechanical firm places a new order in the short term if its type is standard and there are 527
no in-progress orders; otherwise the order is placed in the long term; 528
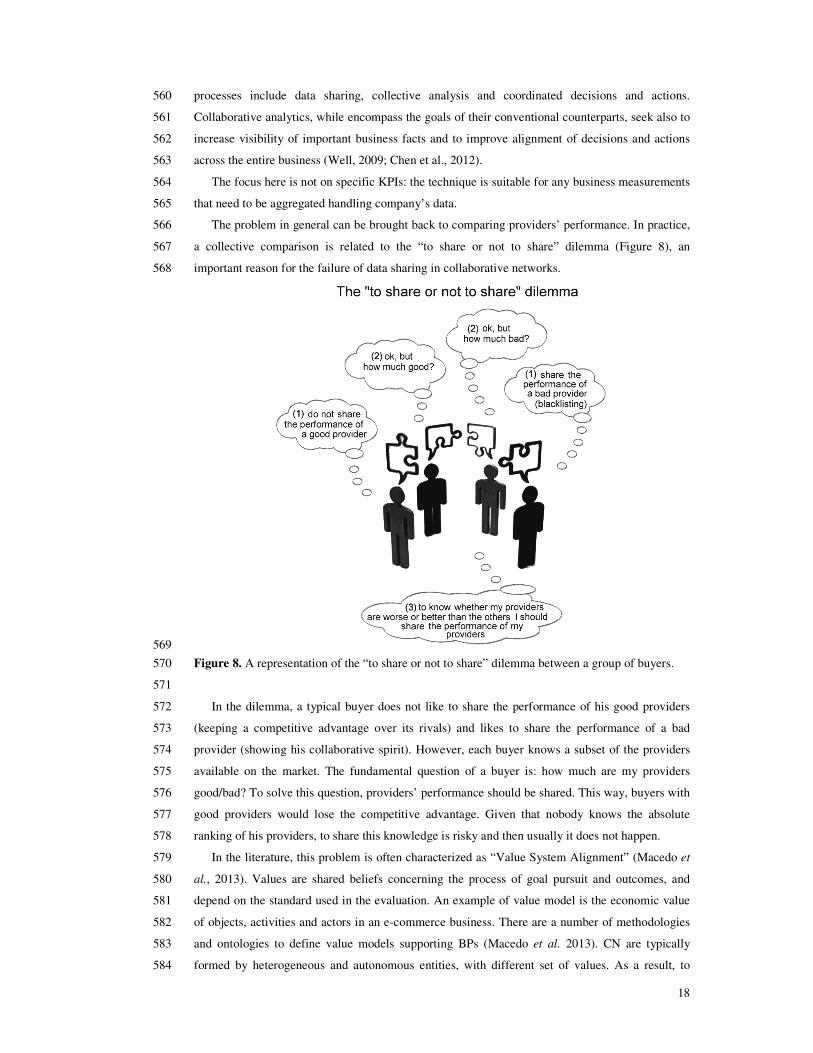
(ii) an electrical firm places a new order in the short time if there is a residual production 529
capacity and the payment is fast or if the payment is slow and its type is standard; 530
(iii) the planning system places a new order in the short term only if both modules have been 531
placed in the short term. 532
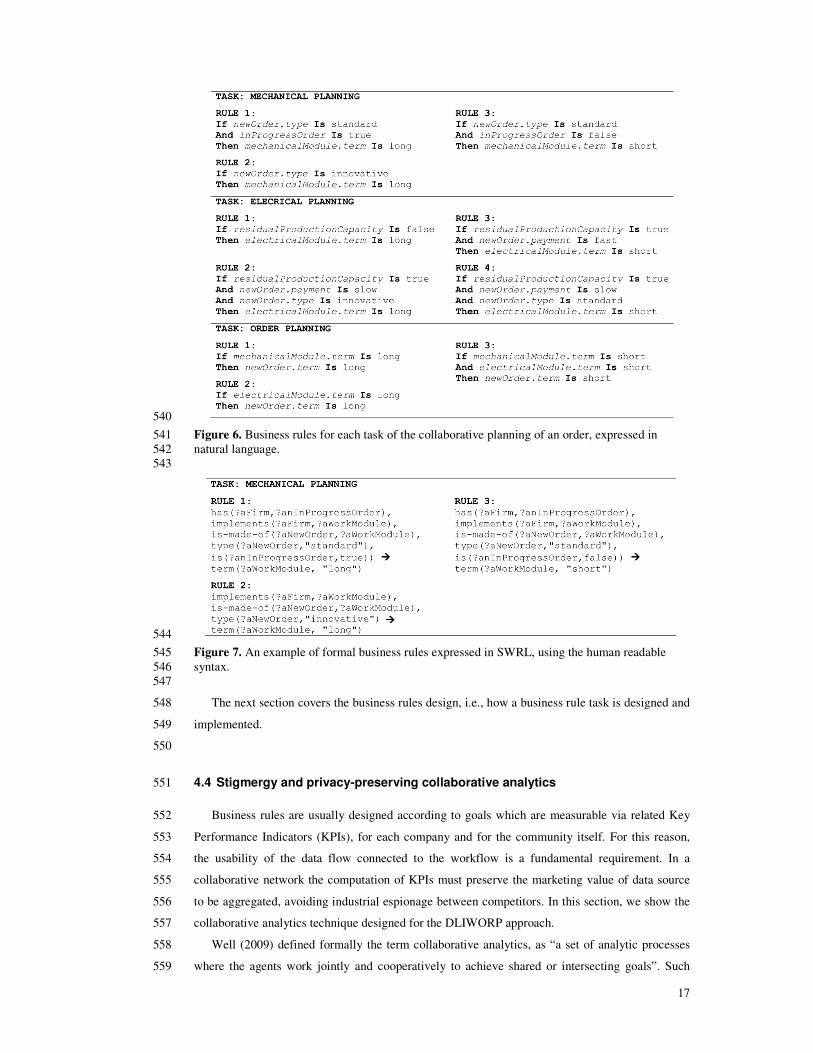
Figure 6 shows the above knowledge in a natural language, via if-then rules. 533
An example of formal business rules expressed in SWRL is shown in Figure 7, in the human 534
readable syntax, which is commonly used in the literature with SWRL rules and in rule editor 535
GUI. In this syntax: the arrow and the comma represent the then and the and constructs, 536
respectively; a variable is indicated prefixing a question mark; ontological properties are written in 537
functional notation. In the example of in Figure 7, each property can be found in the ontology of 538
Figure 5. 539
17
540
Figure 6. Business rules for each task of the collaborative planning of an order, expressed in 541 natural language. 542 543
544
Figure 7. An example of formal business rules expressed in SWRL, using the human readable 545 syntax. 546 547
The next section covers the business rules design, i.e., how a business rule task is designed and 548
implemented. 549
550
4.4 Stigmergy and privacy-preserving collaborative analytics 551
Business rules are usually designed according to goals which are measurable via related Key 552
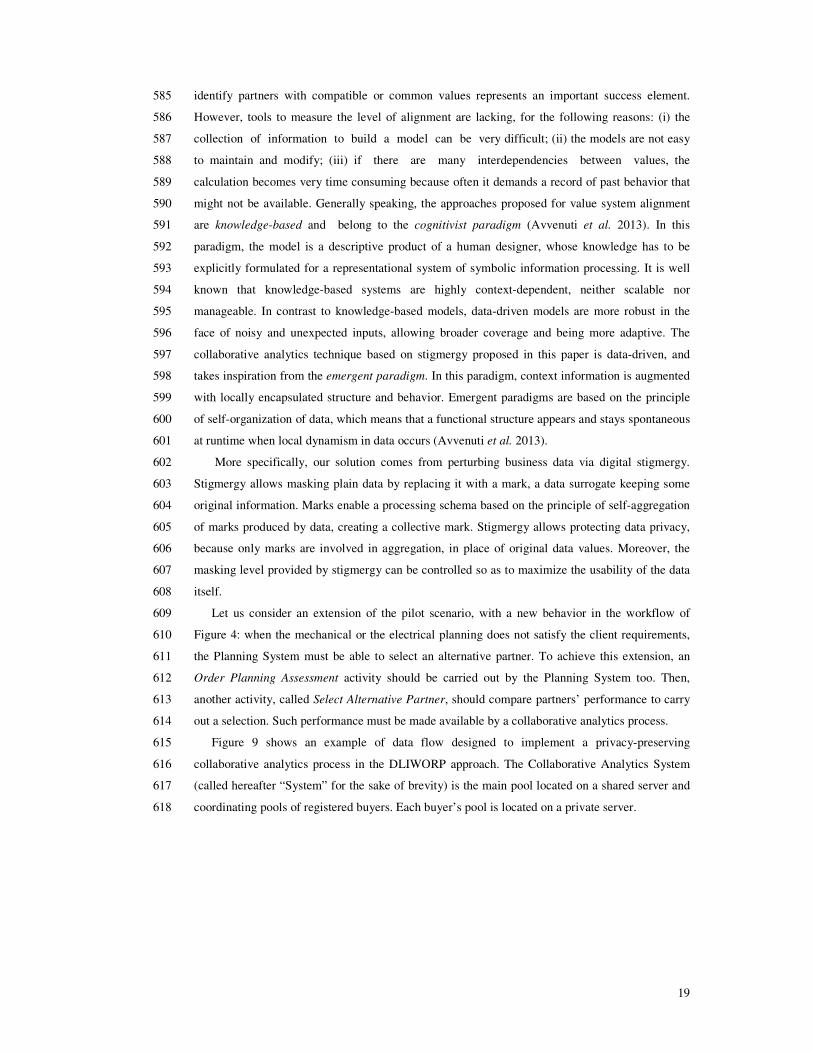
Performance Indicators (KPIs), for each company and for the community itself. For this reason, 553
the usability of the data flow connected to the workflow is a fundamental requirement. In a 554
collaborative network the computation of KPIs must preserve the marketing value of data source 555
to be aggregated, avoiding industrial espionage between competitors. In this section, we show the 556
collaborative analytics technique designed for the DLIWORP approach. 557
Well (2009) defined formally the term collaborative analytics, as “a set of analytic processes 558
where the agents work jointly and cooperatively to achieve shared or intersecting goals”. Such 559
18
processes include data sharing, collective analysis and coordinated decisions and actions. 560
Collaborative analytics, while encompass the goals of their conventional counterparts, seek also to 561
increase visibility of important business facts and to improve alignment of decisions and actions 562
across the entire business (Well, 2009; Chen et al., 2012). 563
The focus here is not on specific KPIs: the technique is suitable for any business measurements 564
that need to be aggregated handling company’s data. 565
The problem in general can be brought back to comparing providers’ performance. In practice, 566
a collective comparison is related to the “to share or not to share” dilemma (Figure 8), an 567
important reason for the failure of data sharing in collaborative networks. 568
569
Figure 8. A representation of the “to share or not to share” dilemma between a group of buyers. 570
571
In the dilemma, a typical buyer does not like to share the performance of his good providers 572
(keeping a competitive advantage over its rivals) and likes to share the performance of a bad 573
provider (showing his collaborative spirit). However, each buyer knows a subset of the providers 574
available on the market. The fundamental question of a buyer is: how much are my providers 575
good/bad? To solve this question, providers’ performance should be shared. This way, buyers with 576
good providers would lose the competitive advantage. Given that nobody knows the absolute 577
ranking of his providers, to share this knowledge is risky and then usually it does not happen. 578
In the literature, this problem is often characterized as “Value System Alignment” (Macedo et 579
al., 2013). Values are shared beliefs concerning the process of goal pursuit and outcomes, and 580
depend on the standard used in the evaluation. An example of value model is the economic value 581
of objects, activities and actors in an e-commerce business. There are a number of methodologies 582
and ontologies to define value models supporting BPs (Macedo et al. 2013). CN are typically 583
formed by heterogeneous and autonomous entities, with different set of values. As a result, to 584
19
identify partners with compatible or common values represents an important success element. 585
However, tools to measure the level of alignment are lacking, for the following reasons: (i) the 586
collection of information to build a model can be very difficult; (ii) the models are not easy 587
to maintain and modify; (iii) if there are many interdependencies between values, the 588
calculation becomes very time consuming because often it demands a record of past behavior that 589
might not be available. Generally speaking, the approaches proposed for value system alignment 590
are knowledge-based and belong to the cognitivist paradigm (Avvenuti et al. 2013). In this 591
paradigm, the model is a descriptive product of a human designer, whose knowledge has to be 592
explicitly formulated for a representational system of symbolic information processing. It is well 593
known that knowledge-based systems are highly context-dependent, neither scalable nor 594
manageable. In contrast to knowledge-based models, data-driven models are more robust in the 595
face of noisy and unexpected inputs, allowing broader coverage and being more adaptive. The 596
collaborative analytics technique based on stigmergy proposed in this paper is data-driven, and 597
takes inspiration from the emergent paradigm. In this paradigm, context information is augmented 598
with locally encapsulated structure and behavior. Emergent paradigms are based on the principle 599
of self-organization of data, which means that a functional structure appears and stays spontaneous 600
at runtime when local dynamism in data occurs (Avvenuti et al. 2013). 601
More specifically, our solution comes from perturbing business data via digital stigmergy. 602
Stigmergy allows masking plain data by replacing it with a mark, a data surrogate keeping some 603
original information. Marks enable a processing schema based on the principle of self-aggregation 604
of marks produced by data, creating a collective mark. Stigmergy allows protecting data privacy, 605
because only marks are involved in aggregation, in place of original data values. Moreover, the 606
masking level provided by stigmergy can be controlled so as to maximize the usability of the data 607
itself. 608
Let us consider an extension of the pilot scenario, with a new behavior in the workflow of 609
Figure 4: when the mechanical or the electrical planning does not satisfy the client requirements, 610
the Planning System must be able to select an alternative partner. To achieve this extension, an 611
Order Planning Assessment activity should be carried out by the Planning System too. Then, 612
another activity, called Select Alternative Partner, should compare partners’ performance to carry 613
out a selection. Such performance must be made available by a collaborative analytics process. 614
Figure 9 shows an example of data flow designed to implement a privacy-preserving 615
collaborative analytics process in the DLIWORP approach. The Collaborative Analytics System 616
(called hereafter “System” for the sake of brevity) is the main pool located on a shared server and 617
coordinating pools of registered buyers. Each buyer’s pool is located on a private server. 618
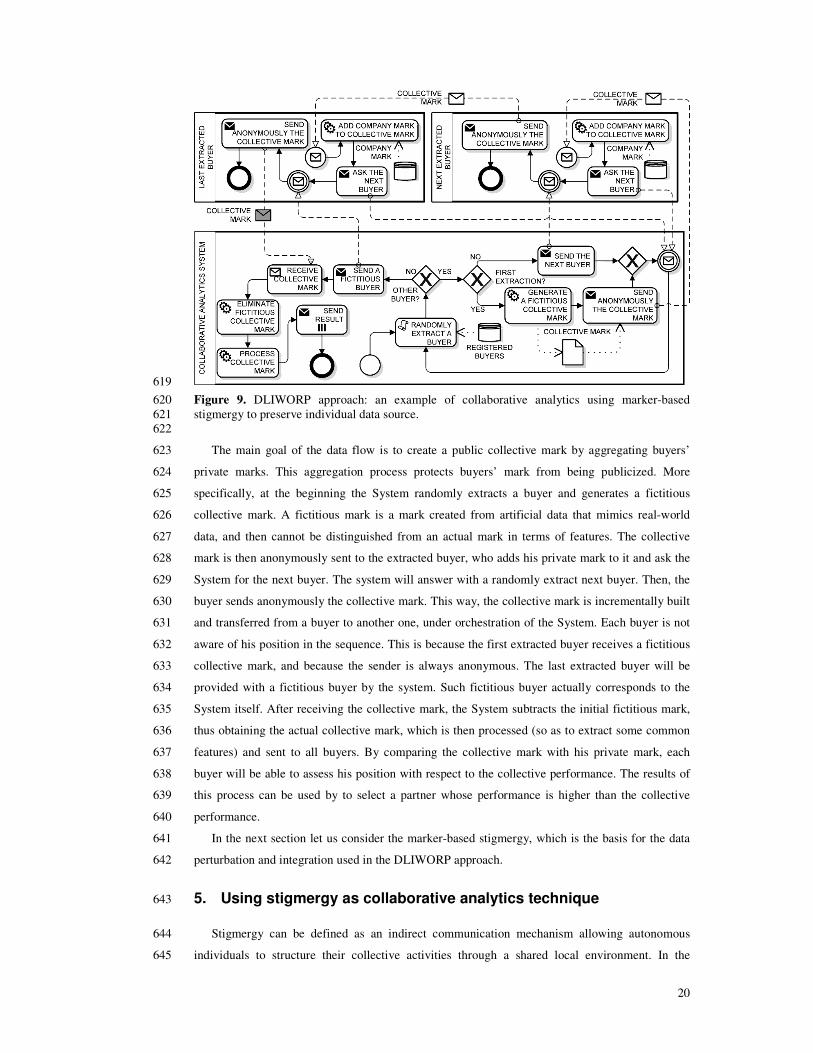
20
619
Figure 9. DLIWORP approach: an example of collaborative analytics using marker-based 620 stigmergy to preserve individual data source. 621 622
The main goal of the data flow is to create a public collective mark by aggregating buyers’ 623
private marks. This aggregation process protects buyers’ mark from being publicized. More 624
specifically, at the beginning the System randomly extracts a buyer and generates a fictitious 625
collective mark. A fictitious mark is a mark created from artificial data that mimics real-world 626
data, and then cannot be distinguished from an actual mark in terms of features. The collective 627
mark is then anonymously sent to the extracted buyer, who adds his private mark to it and ask the 628
System for the next buyer. The system will answer with a randomly extract next buyer. Then, the 629
buyer sends anonymously the collective mark. This way, the collective mark is incrementally built 630
and transferred from a buyer to another one, under orchestration of the System. Each buyer is not 631
aware of his position in the sequence. This is because the first extracted buyer receives a fictitious 632
collective mark, and because the sender is always anonymous. The last extracted buyer will be 633
provided with a fictitious buyer by the system. Such fictitious buyer actually corresponds to the 634
System itself. After receiving the collective mark, the System subtracts the initial fictitious mark, 635
thus obtaining the actual collective mark, which is then processed (so as to extract some common 636
features) and sent to all buyers. By comparing the collective mark with his private mark, each 637
buyer will be able to assess his position with respect to the collective performance. The results of 638
this process can be used by to select a partner whose performance is higher than the collective 639
performance. 640
In the next section let us consider the marker-based stigmergy, which is the basis for the data 641
perturbation and integration used in the DLIWORP approach. 642
5. Using stigmergy as collaborative analytics technique 643
Stigmergy can be defined as an indirect communication mechanism allowing autonomous 644
individuals to structure their collective activities through a shared local environment. In the 645
21
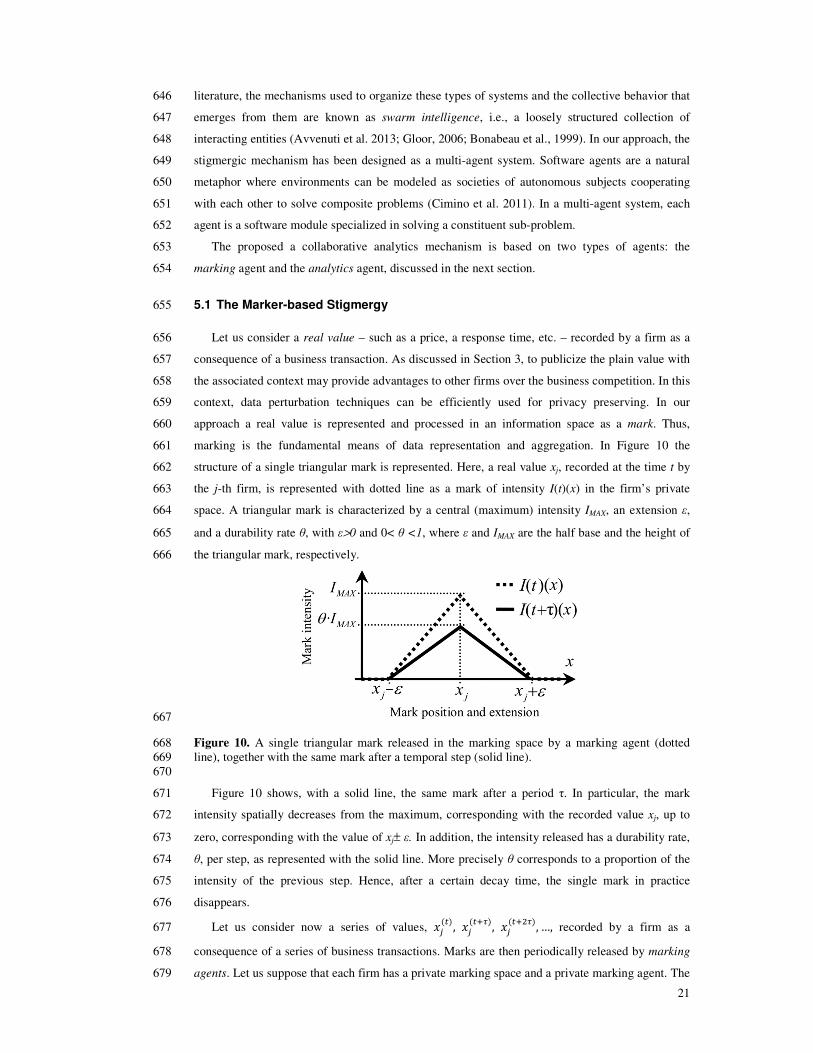
literature, the mechanisms used to organize these types of systems and the collective behavior that 646
emerges from them are known as swarm intelligence, i.e., a loosely structured collection of 647
interacting entities (Avvenuti et al. 2013; Gloor, 2006; Bonabeau et al., 1999). In our approach, the 648
stigmergic mechanism has been designed as a multi-agent system. Software agents are a natural 649
metaphor where environments can be modeled as societies of autonomous subjects cooperating 650
with each other to solve composite problems (Cimino et al. 2011). In a multi-agent system, each 651
agent is a software module specialized in solving a constituent sub-problem. 652
The proposed a collaborative analytics mechanism is based on two types of agents: the 653
marking agent and the analytics agent, discussed in the next section. 654
5.1 The Marker-based Stigmergy 655
Let us consider a real value – such as a price, a response time, etc. – recorded by a firm as a 656
consequence of a business transaction. As discussed in Section 3, to publicize the plain value with 657
the associated context may provide advantages to other firms over the business competition. In this 658
context, data perturbation techniques can be efficiently used for privacy preserving. In our 659
approach a real value is represented and processed in an information space as a mark. Thus, 660
marking is the fundamental means of data representation and aggregation. In Figure 10 the 661
structure of a single triangular mark is represented. Here, a real value xj, recorded at the time t by 662
the j-th firm, is represented with dotted line as a mark of intensity I(t)(x) in the firm’s private 663
space. A triangular mark is characterized by a central (maximum) intensity IMAX, an extension ε, 664
and a durability rate θ, with ε>0 and 0< θ <1, where ε and IMAX are the half base and the height of 665
the triangular mark, respectively. 666
667
Figure 10. A single triangular mark released in the marking space by a marking agent (dotted 668 line), together with the same mark after a temporal step (solid line). 669 670
Figure 10 shows, with a solid line, the same mark after a period τ. In particular, the mark 671
intensity spatially decreases from the maximum, corresponding with the recorded value xj, up to 672
zero, corresponding with the value of xj± ε. In addition, the intensity released has a durability rate, 673
θ, per step, as represented with the solid line. More precisely θ corresponds to a proportion of the 674
intensity of the previous step. Hence, after a certain decay time, the single mark in practice 675
disappears. 676
Let us consider now a series of values, �����, ��
�����, ��
�����, …, recorded by a firm as a 677
consequence of a series of business transactions. Marks are then periodically released by marking 678
agents. Let us suppose that each firm has a private marking space and a private marking agent. The 679
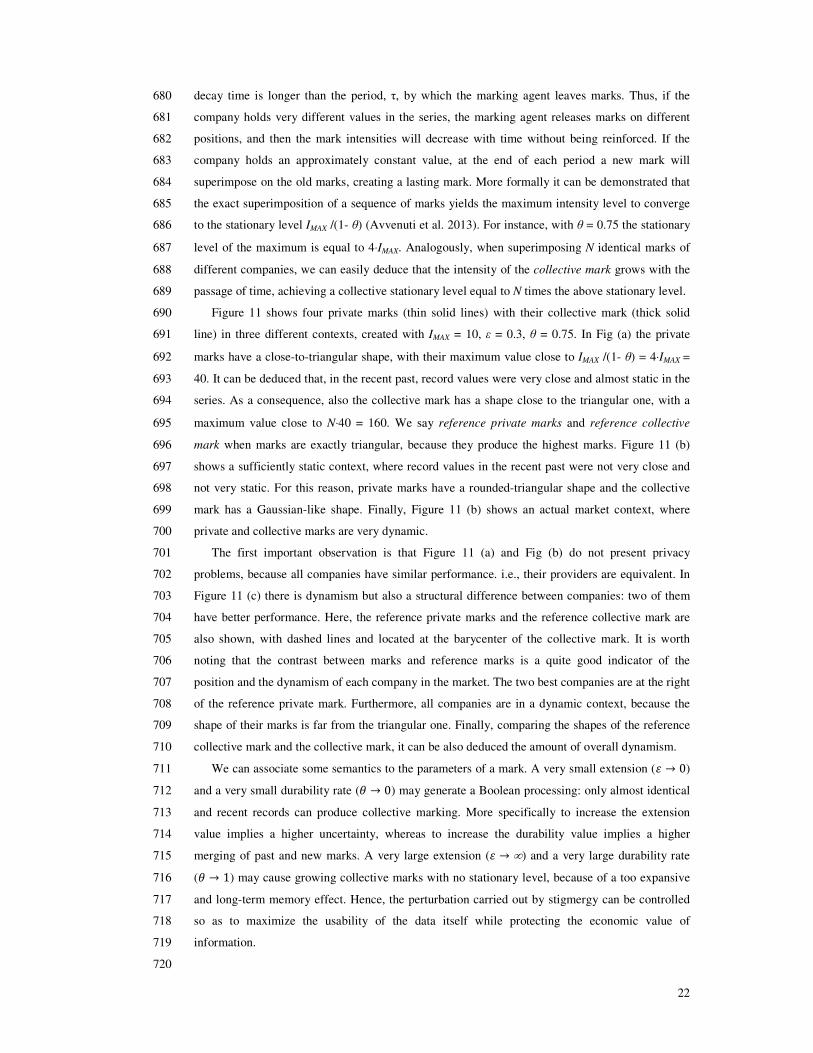
22
decay time is longer than the period, τ, by which the marking agent leaves marks. Thus, if the 680
company holds very different values in the series, the marking agent releases marks on different 681
positions, and then the mark intensities will decrease with time without being reinforced. If the 682
company holds an approximately constant value, at the end of each period a new mark will 683
superimpose on the old marks, creating a lasting mark. More formally it can be demonstrated that 684
the exact superimposition of a sequence of marks yields the maximum intensity level to converge 685
to the stationary level IMAX /(1- θ) (Avvenuti et al. 2013). For instance, with θ = 0.75 the stationary 686
level of the maximum is equal to 4⋅IMAX. Analogously, when superimposing N identical marks of 687
different companies, we can easily deduce that the intensity of the collective mark grows with the 688
passage of time, achieving a collective stationary level equal to N times the above stationary level. 689
Figure 11 shows four private marks (thin solid lines) with their collective mark (thick solid 690
line) in three different contexts, created with IMAX = 10, ε = 0.3, θ = 0.75. In Fig (a) the private 691
marks have a close-to-triangular shape, with their maximum value close to IMAX /(1- θ) = 4⋅IMAX = 692
40. It can be deduced that, in the recent past, record values were very close and almost static in the 693
series. As a consequence, also the collective mark has a shape close to the triangular one, with a 694
maximum value close to N⋅40 = 160. We say reference private marks and reference collective 695
mark when marks are exactly triangular, because they produce the highest marks. Figure 11 (b) 696
shows a sufficiently static context, where record values in the recent past were not very close and 697
not very static. For this reason, private marks have a rounded-triangular shape and the collective 698
mark has a Gaussian-like shape. Finally, Figure 11 (b) shows an actual market context, where 699
private and collective marks are very dynamic. 700
The first important observation is that Figure 11 (a) and Fig (b) do not present privacy 701
problems, because all companies have similar performance. i.e., their providers are equivalent. In 702
Figure 11 (c) there is dynamism but also a structural difference between companies: two of them 703
have better performance. Here, the reference private marks and the reference collective mark are 704
also shown, with dashed lines and located at the barycenter of the collective mark. It is worth 705
noting that the contrast between marks and reference marks is a quite good indicator of the 706
position and the dynamism of each company in the market. The two best companies are at the right 707
of the reference private mark. Furthermore, all companies are in a dynamic context, because the 708
shape of their marks is far from the triangular one. Finally, comparing the shapes of the reference 709
collective mark and the collective mark, it can be also deduced the amount of overall dynamism. 710
We can associate some semantics to the parameters of a mark. A very small extension (� → 0) 711
and a very small durability rate (� → 0) may generate a Boolean processing: only almost identical 712
and recent records can produce collective marking. More specifically to increase the extension 713
value implies a higher uncertainty, whereas to increase the durability value implies a higher 714
merging of past and new marks. A very large extension (� → ∞) and a very large durability rate 715
(� → 1) may cause growing collective marks with no stationary level, because of a too expansive 716
and long-term memory effect. Hence, the perturbation carried out by stigmergy can be controlled 717
so as to maximize the usability of the data itself while protecting the economic value of 718
information. 719
720
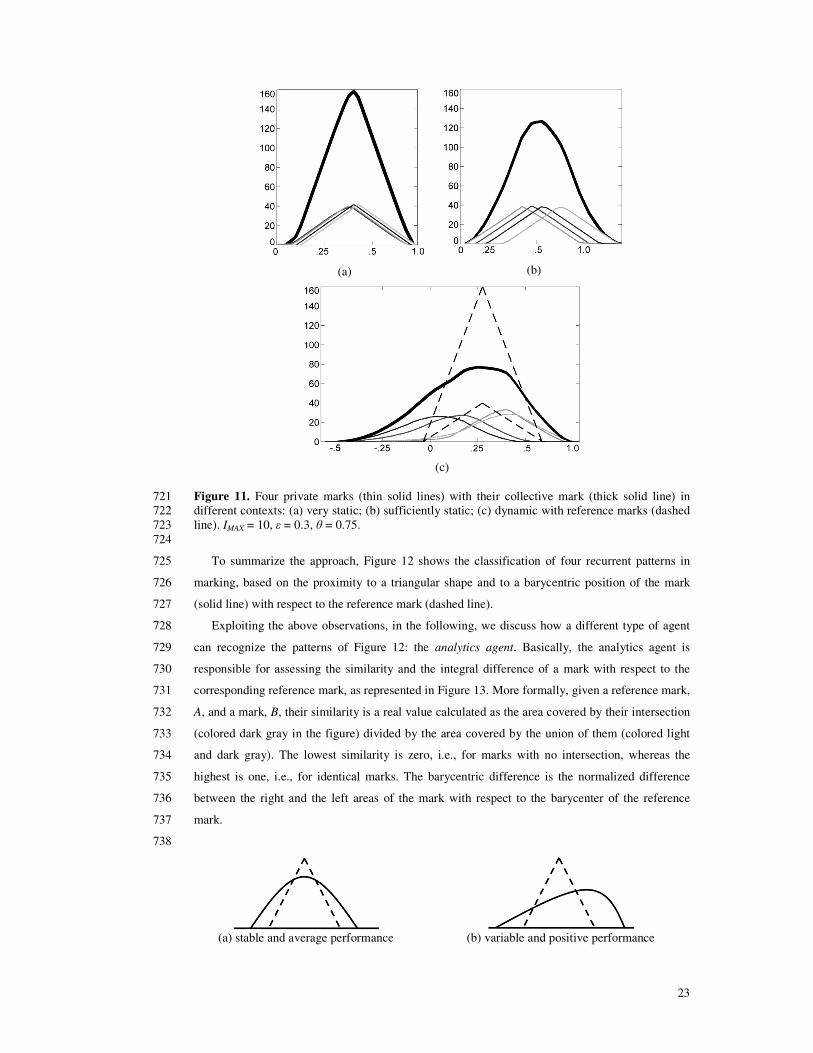
23
(a)
(b)
(c)
Figure 11. Four private marks (thin solid lines) with their collective mark (thick solid line) in 721 different contexts: (a) very static; (b) sufficiently static; (c) dynamic with reference marks (dashed 722 line). IMAX = 10, ε = 0.3, θ = 0.75. 723
724
To summarize the approach, Figure 12 shows the classification of four recurrent patterns in 725
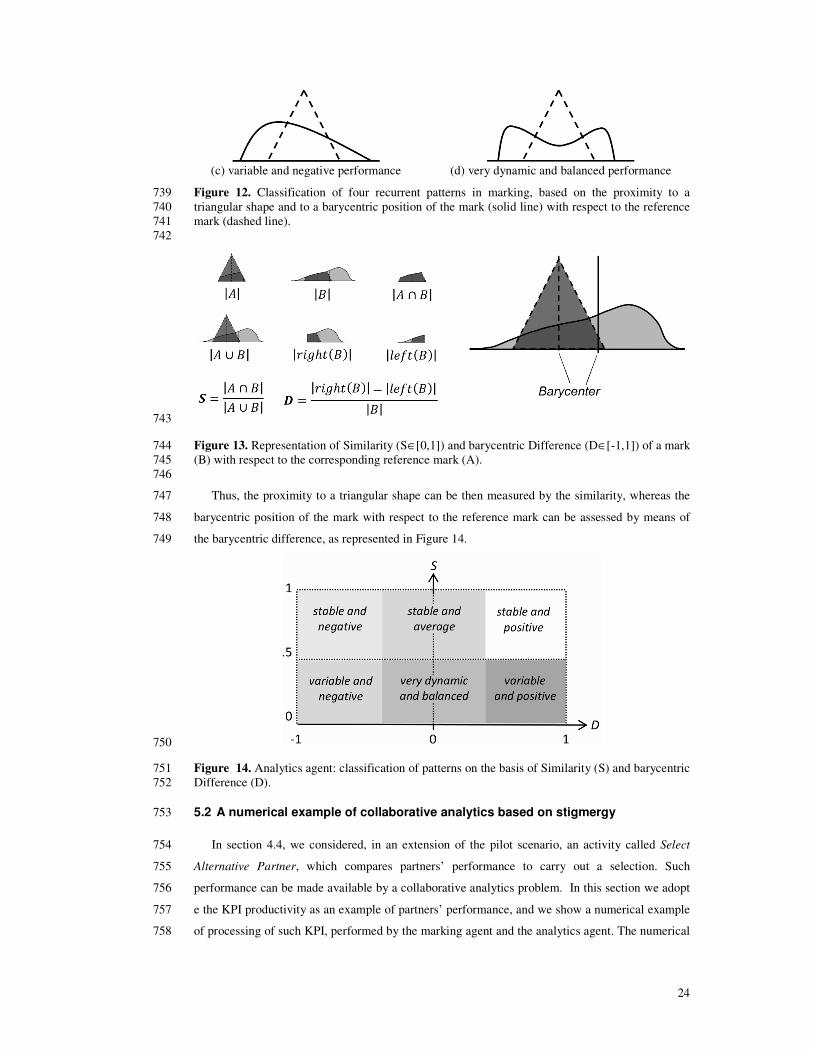
marking, based on the proximity to a triangular shape and to a barycentric position of the mark 726
(solid line) with respect to the reference mark (dashed line). 727
Exploiting the above observations, in the following, we discuss how a different type of agent 728
can recognize the patterns of Figure 12: the analytics agent. Basically, the analytics agent is 729
responsible for assessing the similarity and the integral difference of a mark with respect to the 730
corresponding reference mark, as represented in Figure 13. More formally, given a reference mark, 731
A, and a mark, B, their similarity is a real value calculated as the area covered by their intersection 732
(colored dark gray in the figure) divided by the area covered by the union of them (colored light 733
and dark gray). The lowest similarity is zero, i.e., for marks with no intersection, whereas the 734
highest is one, i.e., for identical marks. The barycentric difference is the normalized difference 735
between the right and the left areas of the mark with respect to the barycenter of the reference 736
mark. 737
738
(a) stable and average performance
(b) variable and positive performance
24
(c) variable and negative performance
(d) very dynamic and balanced performance
Figure 12. Classification of four recurrent patterns in marking, based on the proximity to a 739 triangular shape and to a barycentric position of the mark (solid line) with respect to the reference 740 mark (dashed line). 741
742
743
Figure 13. Representation of Similarity (S∈[0,1]) and barycentric Difference (D∈[-1,1]) of a mark 744 (B) with respect to the corresponding reference mark (A). 745
746
Thus, the proximity to a triangular shape can be then measured by the similarity, whereas the 747
barycentric position of the mark with respect to the reference mark can be assessed by means of 748
the barycentric difference, as represented in Figure 14. 749
750
Figure 14. Analytics agent: classification of patterns on the basis of Similarity (S) and barycentric 751 Difference (D). 752
5.2 A numerical example of collaborative analytics based on stigmergy 753
In section 4.4, we considered, in an extension of the pilot scenario, an activity called Select 754
Alternative Partner, which compares partners’ performance to carry out a selection. Such 755
performance can be made available by a collaborative analytics problem. In this section we adopt 756
e the KPI productivity as an example of partners’ performance, and we show a numerical example 757
of processing of such KPI, performed by the marking agent and the analytics agent. The numerical 758
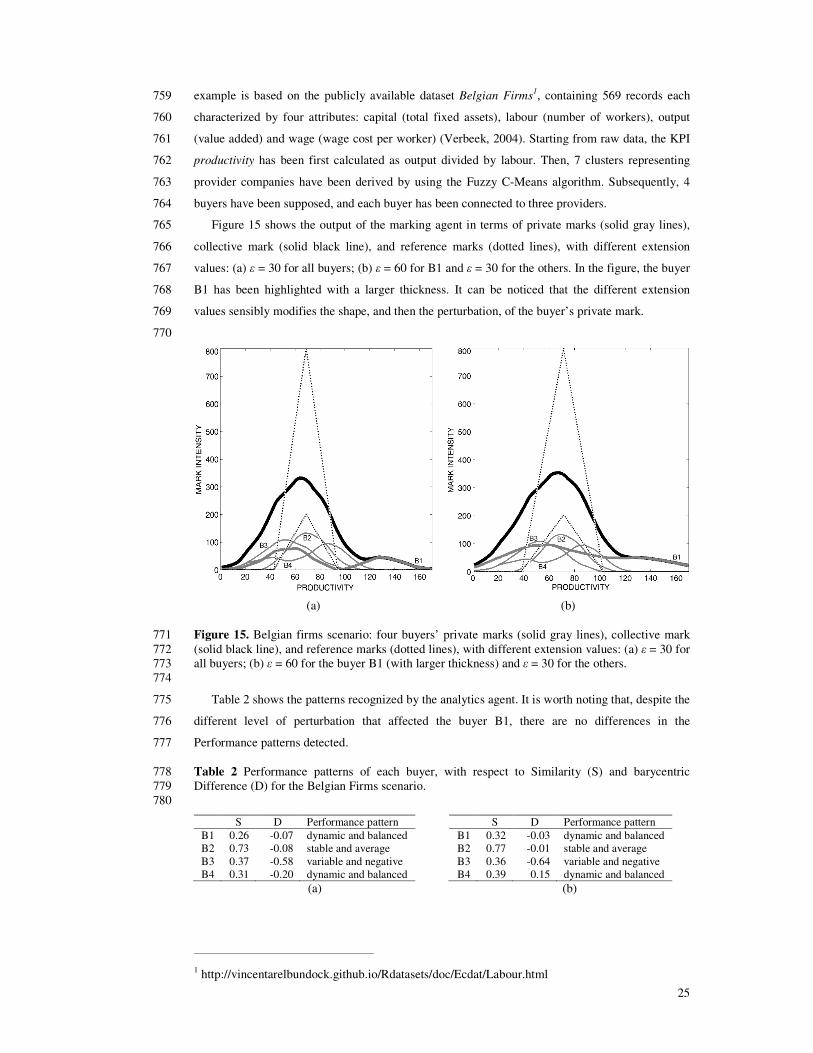
25
example is based on the publicly available dataset Belgian Firms1, containing 569 records each 759
characterized by four attributes: capital (total fixed assets), labour (number of workers), output 760
(value added) and wage (wage cost per worker) (Verbeek, 2004). Starting from raw data, the KPI 761
productivity has been first calculated as output divided by labour. Then, 7 clusters representing 762
provider companies have been derived by using the Fuzzy C-Means algorithm. Subsequently, 4 763
buyers have been supposed, and each buyer has been connected to three providers. 764
Figure 15 shows the output of the marking agent in terms of private marks (solid gray lines), 765
collective mark (solid black line), and reference marks (dotted lines), with different extension 766
values: (a) ε = 30 for all buyers; (b) ε = 60 for B1 and ε = 30 for the others. In the figure, the buyer 767
B1 has been highlighted with a larger thickness. It can be noticed that the different extension 768
values sensibly modifies the shape, and then the perturbation, of the buyer’s private mark. 769
770
(a)
(b)
Figure 15. Belgian firms scenario: four buyers’ private marks (solid gray lines), collective mark 771 (solid black line), and reference marks (dotted lines), with different extension values: (a) ε = 30 for 772 all buyers; (b) ε = 60 for the buyer B1 (with larger thickness) and ε = 30 for the others. 773
774
Table 2 shows the patterns recognized by the analytics agent. It is worth noting that, despite the 775
different level of perturbation that affected the buyer B1, there are no differences in the 776
Performance patterns detected. 777
Table 2 Performance patterns of each buyer, with respect to Similarity (S) and barycentric 778 Difference (D) for the Belgian Firms scenario. 779 780
S D Performance pattern B1 0.26 -0.07 dynamic and balanced B2 0.73 -0.08 stable and average B3 0.37 -0.58 variable and negative B4 0.31 -0.20 dynamic and balanced
(a)
S D Performance pattern B1 0.32 -0.03 dynamic and balanced B2 0.77 -0.01 stable and average B3 0.36 -0.64 variable and negative B4 0.39 0.15 dynamic and balanced
(b)
1 http://vincentarelbundock.github.io/Rdatasets/doc/Ecdat/Labour.html
26
6. Architecture, administration and experimentation of the 781
supporting system 782
This section focuses on the OCN as a system in its life-cycle. A prototypical system 783
architecture for the DLIWORP approach has been developed and experimented under a research 784
and innovation program supporting the growth of small-medium enterprises. 785
So far we have identified three technological enablers on the basis of initial requirements, and 786
then we have defined standard specifications and technological solutions, addressing each of the 787
factors. As a foundation of our approach, we require decomposition of modeling into workflow, 788
business rules, and privacy-preserving collaborative analytics. An especially important point is 789
that, if just one factor is not supported, then the other two factors cannot adequately foster the 790
distributed business logic inherent in the OCN. 791
We have described our approach through a demonstrative scenario, to shows how information 792
technology oriented solutions can be integrated towards the business perspective. The pilot 793
scenario is representative of some other scenarios which have been developed and tested in the 794
context of the regional research and innovation project. However, the scenario cannot be 795
considered a reference case. Our main purpose is to show the ability of the approach to express 796
aspects of interest that have been encountered in a real-world OCN. In the literature, the benefits 797
of collaboration are clear, but it is also apparent that different paths to a successful collaboration 798
can be envisaged, since many drivers exist and new ones tend to appear (Camarinha-Matos, 2014). 799
Indeed, emergent behavior resides in keeping enterprises prepared to manage different kinds of 800
business processes. This entails support for abstraction and modeling techniques in combination. 801
Here, the notion of business process model provides a number of advantages to capture the 802
different ways in which each case (i.e., process instance) in an OCN can be handled: (i) the use of 803
explicit process models provides a means for knowledge sharing between community members; 804
(ii) systems driven by models rather than code have less problems when dealing with change; (iii) 805
it better allows an automated enactment; (iv) it better support redesign; (v) it enables management 806
at the control level. 807
The remainder of this section is organized into three subsections, covering the system 808
architecture, the system administration, and its experimentation, respectively. 809
810
6.1 System architecture 811
Figure 16 shows an UML (Unified Modeling Language) architectural view of an OCN 812
supporting the DLIWORP approach. Here, device, execution environment and component are 813
represented as dark gray cuboids, light gray cuboids, and white rectangles, respectively. Links 814
between execution environments represent bidirectional communication channels, whereas usage 815
relationships between components are specified by their provided and required interfaces, 816
represented by the “lollypop” and “socket” icons, respectively. Finally, user roles are represented 817
by the “stick man” icon. There are three device categories: Business Community Server, which is 818
the computer(s) hosting data and services shared by the collaborative network; Company Server, 819
which is a computer hosting data and services that must be kept private by each company; Client, 820
27
which is a personal or office computer hosting client applications for users. There are two users 821
(roles): Business Worker, who is a participant to a workflow of the collaborative network; a 822
business worker uses the Web Browser as main execution environment; Business Logic Manager 823
is responsible for designing and deploying the business logic, via the DLIWORP approach; he 824
uses different client applications: a Stigmergic Modeler for designing data perturbation, a Semantic 825
Modeler for designing ontology and semantic rules, a Workflow Modeler for designing an 826
executable business collaboration, and a Business Analytics environment to access the 827
collaborative analytics. There can be many business workers and business logic managers for each 828
company. Both the Business Community Server and the Company Server have the following 829
execution environments: a Workflow Management System, where workflows are deployed (in the 830
Business Process Model knowledge base), executed (by the Workflow Engine), and recorded (by 831
the Event Repository database); a Semantic Web Service, hosting the Ontology and Rules 832
knowledge base and the Semantic Engine for executing business rule tasks; a Multiagent System 833
Manager, hosting the Marking Agent and the Analytics Agent, as well as their Marks Repository. 834
Specific point-to-point connections of the above execution environments in a network of 835
independent nodes should be avoided, because it hampers maintenance (Bechini et al. 2008). Thus, 836
the execution environments should be connected to an Enterprise Service Bus (ESB), a service-837
oriented middleware for structural integration. For this purpose, the Content Based Routing 838
component provides a routing service that can intelligently consider the content of the information 839
being passed from one application to another, whereas the Transformation Services transform data 840
to and from any format across heterogeneous structure and data types. In addition, the latter 841
module can also enhance incomplete data, so as to allow execution environments of different 842
vendors to coexist. An ESB can also be connected to other ESBs, to allow an easy integration 843
between collaborative networks. 844
Moreover, the execution environment hosting the ESB hosts an Enterprise Service Portal 845
(ESP), a framework for integrating information, people and processes across organizational 846
boundaries. For this purpose, the Users Management, the Groups Management, and the Messages 847
Management components provide support for profiles, privileges, roles, workgroups, companies, 848
business messaging, etc. The Web Content Management component allows to create, deploy, 849
manage and store content on web pages, including formatted text documents, embedded graphics, 850
photos, video, audio, etc. The Records Management component allows managing what represents 851
proof of existence. Indeed, a record is either created or received by an organization in pursuance of 852
or compliance with legal obligations, in a business transaction. The Document Management 853
component is used to track and store documents, keeping track of the different versions modified 854
by different users (history tracking). Finally, the Content Repository component is the main store 855
of digital content shared by the above components. It allows managing, searching and accessing 856
sets of data associated with different services, thus allowing application-independent access to the 857
content. 858
859
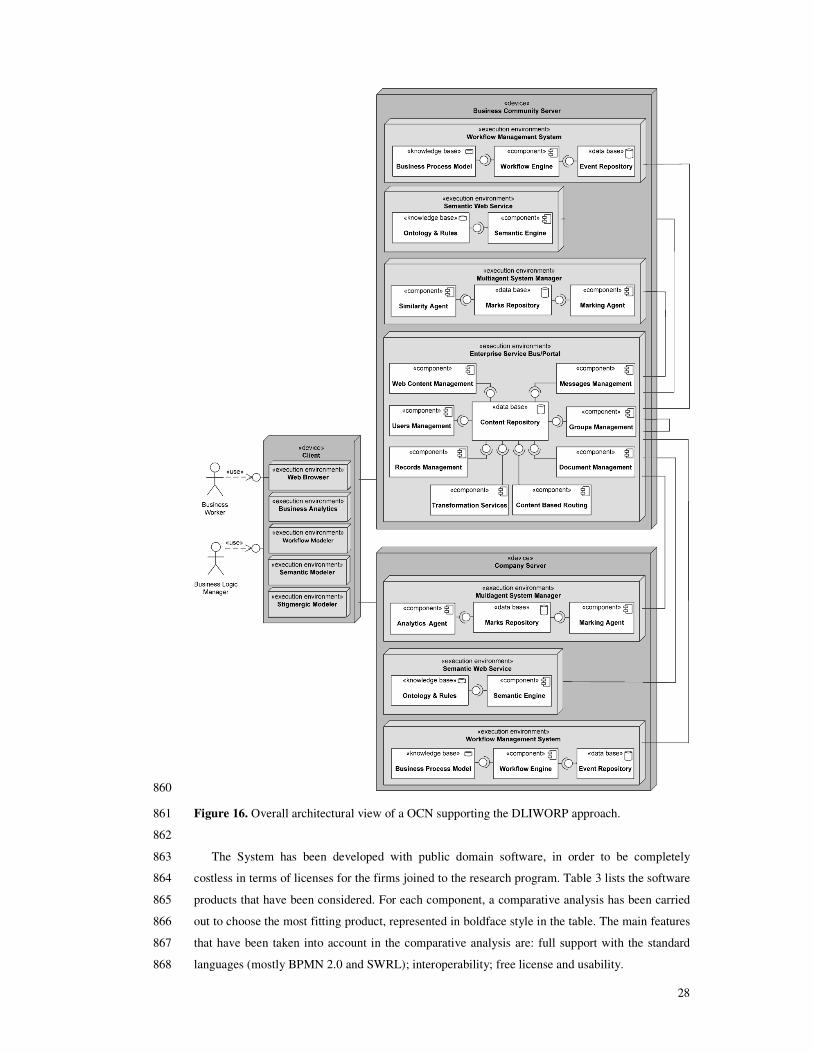
28
860
Figure 16. Overall architectural view of a OCN supporting the DLIWORP approach. 861
862
The System has been developed with public domain software, in order to be completely 863
costless in terms of licenses for the firms joined to the research program. Table 3 lists the software 864
products that have been considered. For each component, a comparative analysis has been carried 865
out to choose the most fitting product, represented in boldface style in the table. The main features 866
that have been taken into account in the comparative analysis are: full support with the standard 867
languages (mostly BPMN 2.0 and SWRL); interoperability; free license and usability. 868
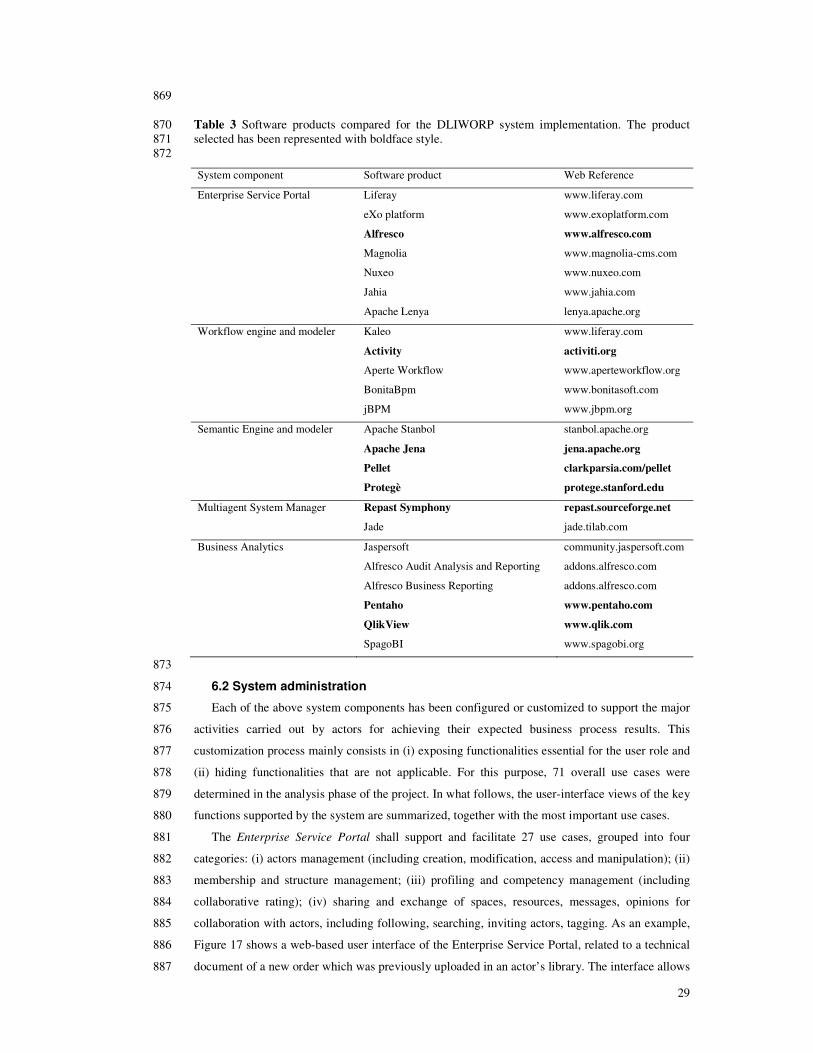
29
869
Table 3 Software products compared for the DLIWORP system implementation. The product 870 selected has been represented with boldface style. 871 872
System component Software product Web Reference
Enterprise Service Portal Liferay
eXo platform
Alfresco
Magnolia
Nuxeo
Jahia
Apache Lenya
www.liferay.com
www.exoplatform.com
www.alfresco.com
www.magnolia-cms.com
www.nuxeo.com
www.jahia.com
lenya.apache.org
Workflow engine and modeler Kaleo
Activity
Aperte Workflow
BonitaBpm
jBPM
www.liferay.com
activiti.org
www.aperteworkflow.org
www.bonitasoft.com
www.jbpm.org
Semantic Engine and modeler Apache Stanbol
Apache Jena
Pellet
Protegè
stanbol.apache.org
jena.apache.org
clarkparsia.com/pellet
protege.stanford.edu
Multiagent System Manager Repast Symphony
Jade
repast.sourceforge.net
jade.tilab.com
Business Analytics Jaspersoft
Alfresco Audit Analysis and Reporting
Alfresco Business Reporting
Pentaho
QlikView
SpagoBI
community.jaspersoft.com
addons.alfresco.com
addons.alfresco.com
www.pentaho.com
www.qlik.com
www.spagobi.org
873
6.2 System administration 874
Each of the above system components has been configured or customized to support the major 875
activities carried out by actors for achieving their expected business process results. This 876
customization process mainly consists in (i) exposing functionalities essential for the user role and 877
(ii) hiding functionalities that are not applicable. For this purpose, 71 overall use cases were 878
determined in the analysis phase of the project. In what follows, the user-interface views of the key 879
functions supported by the system are summarized, together with the most important use cases. 880
The Enterprise Service Portal shall support and facilitate 27 use cases, grouped into four 881
categories: (i) actors management (including creation, modification, access and manipulation); (ii) 882
membership and structure management; (iii) profiling and competency management (including 883
collaborative rating); (iv) sharing and exchange of spaces, resources, messages, opinions for 884
collaboration with actors, including following, searching, inviting actors, tagging. As an example, 885
Figure 17 shows a web-based user interface of the Enterprise Service Portal, related to a technical 886
document of a new order which was previously uploaded in an actor’s library. The interface allows 887
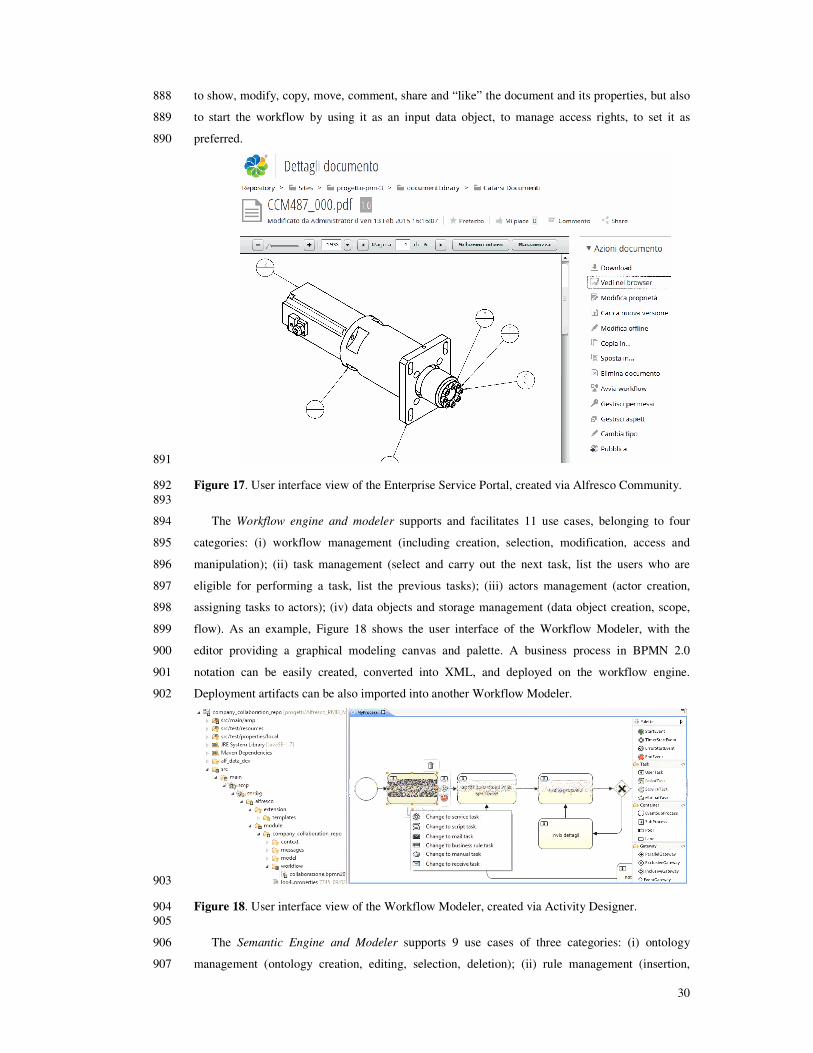
30
to show, modify, copy, move, comment, share and “like” the document and its properties, but also 888
to start the workflow by using it as an input data object, to manage access rights, to set it as 889
preferred. 890
891
Figure 17. User interface view of the Enterprise Service Portal, created via Alfresco Community. 892 893
The Workflow engine and modeler supports and facilitates 11 use cases, belonging to four 894
categories: (i) workflow management (including creation, selection, modification, access and 895
manipulation); (ii) task management (select and carry out the next task, list the users who are 896
eligible for performing a task, list the previous tasks); (iii) actors management (actor creation, 897
assigning tasks to actors); (iv) data objects and storage management (data object creation, scope, 898
flow). As an example, Figure 18 shows the user interface of the Workflow Modeler, with the 899
editor providing a graphical modeling canvas and palette. A business process in BPMN 2.0 900
notation can be easily created, converted into XML, and deployed on the workflow engine. 901
Deployment artifacts can be also imported into another Workflow Modeler. 902
903
Figure 18. User interface view of the Workflow Modeler, created via Activity Designer. 904 905
The Semantic Engine and Modeler supports 9 use cases of three categories: (i) ontology 906
management (ontology creation, editing, selection, deletion); (ii) rule management (insertion, 907
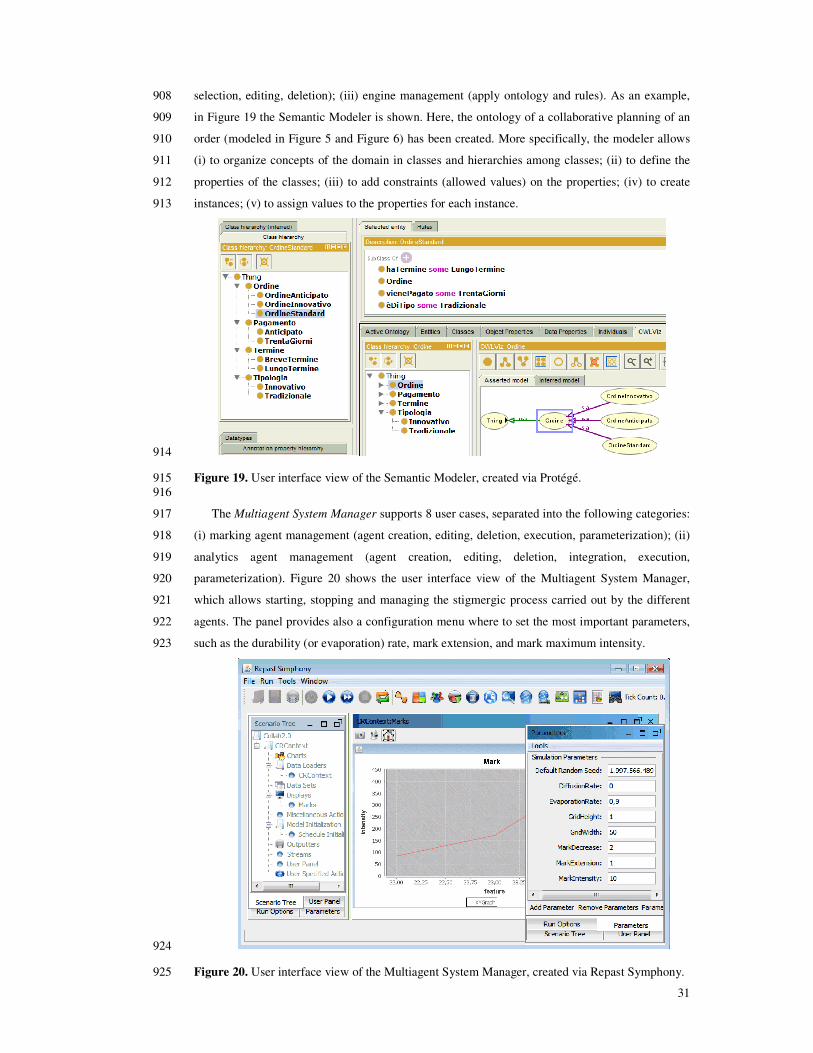
31
selection, editing, deletion); (iii) engine management (apply ontology and rules). As an example, 908
in Figure 19 the Semantic Modeler is shown. Here, the ontology of a collaborative planning of an 909
order (modeled in Figure 5 and Figure 6) has been created. More specifically, the modeler allows 910
(i) to organize concepts of the domain in classes and hierarchies among classes; (ii) to define the 911
properties of the classes; (iii) to add constraints (allowed values) on the properties; (iv) to create 912
instances; (v) to assign values to the properties for each instance. 913
914
Figure 19. User interface view of the Semantic Modeler, created via Protégé. 915 916
The Multiagent System Manager supports 8 user cases, separated into the following categories: 917
(i) marking agent management (agent creation, editing, deletion, execution, parameterization); (ii) 918
analytics agent management (agent creation, editing, deletion, integration, execution, 919
parameterization). Figure 20 shows the user interface view of the Multiagent System Manager, 920
which allows starting, stopping and managing the stigmergic process carried out by the different 921
agents. The panel provides also a configuration menu where to set the most important parameters, 922
such as the durability (or evaporation) rate, mark extension, and mark maximum intensity. 923
924
Figure 20. User interface view of the Multiagent System Manager, created via Repast Symphony. 925
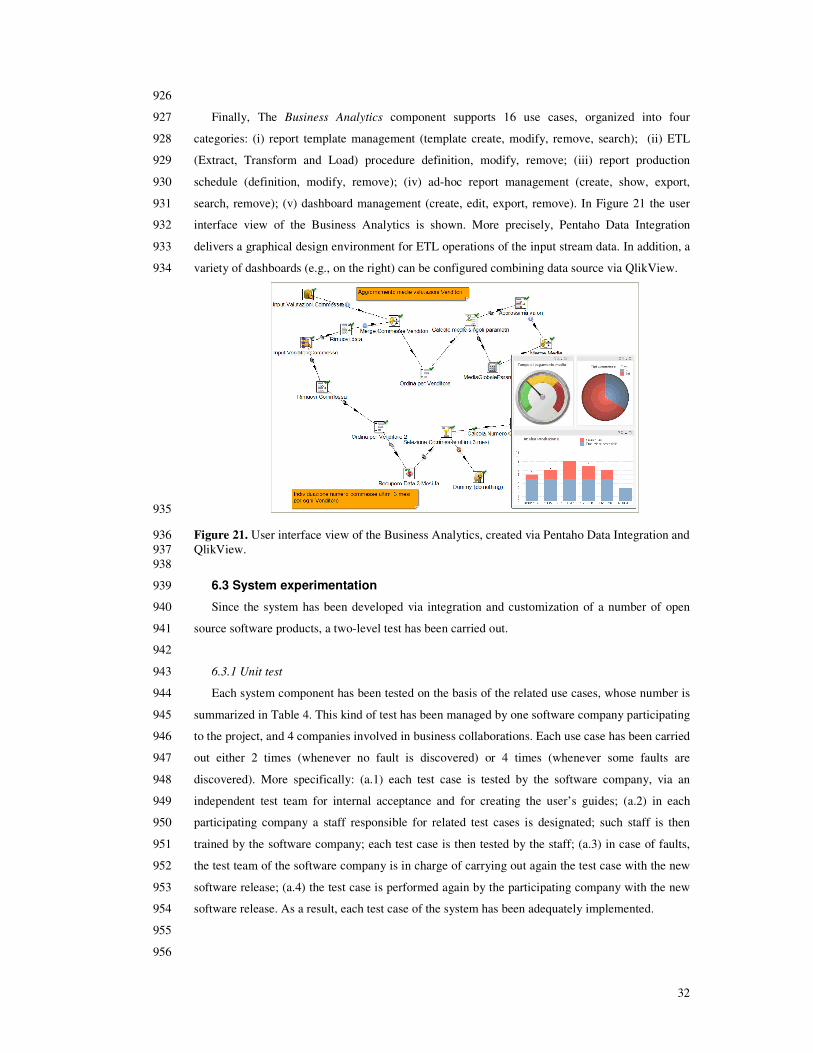
32
926
Finally, The Business Analytics component supports 16 use cases, organized into four 927
categories: (i) report template management (template create, modify, remove, search); (ii) ETL 928
(Extract, Transform and Load) procedure definition, modify, remove; (iii) report production 929
schedule (definition, modify, remove); (iv) ad-hoc report management (create, show, export, 930
search, remove); (v) dashboard management (create, edit, export, remove). In Figure 21 the user 931
interface view of the Business Analytics is shown. More precisely, Pentaho Data Integration 932
delivers a graphical design environment for ETL operations of the input stream data. In addition, a 933
variety of dashboards (e.g., on the right) can be configured combining data source via QlikView. 934
935
Figure 21. User interface view of the Business Analytics, created via Pentaho Data Integration and 936 QlikView. 937
938
6.3 System experimentation 939
Since the system has been developed via integration and customization of a number of open 940
source software products, a two-level test has been carried out. 941
942
6.3.1 Unit test 943
Each system component has been tested on the basis of the related use cases, whose number is 944
summarized in Table 4. This kind of test has been managed by one software company participating 945
to the project, and 4 companies involved in business collaborations. Each use case has been carried 946
out either 2 times (whenever no fault is discovered) or 4 times (whenever some faults are 947
discovered). More specifically: (a.1) each test case is tested by the software company, via an 948
independent test team for internal acceptance and for creating the user’s guides; (a.2) in each 949
participating company a staff responsible for related test cases is designated; such staff is then 950
trained by the software company; each test case is then tested by the staff; (a.3) in case of faults, 951
the test team of the software company is in charge of carrying out again the test case with the new 952
software release; (a.4) the test case is performed again by the participating company with the new 953
software release. As a result, each test case of the system has been adequately implemented. 954
955
956
33
Table 4 Unit test: number of test cases for each component. 957 958
Component No. of
test cases
Enterprise Service Portal 27
Workflow engine and modeler 11
Semantic engine and modeler 9
Multiagent System Manager 8
Business Analytics 16
959
6.3.2 System test 960
It comprises the execution of 5 real-world order planning instances, summarized in Table 5 as 961
end-to-end scenarios, to verify that the integrated system meets the business requirements. More 962
precisely, 9 companies have been directly involved in the integration test: 4 companies who are 963
partners of the project, and 5 client companies. Further companies have been indirectly involved as 964
sub-contractor or supplier companies. The partners roles are: mechanical firm, electrical firm, 965
assembling firm (who is also front-end responsible for the product sale), sub-contractor, and 966
supplier. 967
Table 5 System test: business scenarios and related features. 968 969
Business Scenario Description Features
a) Anti-vibration
component
A system used to attenuate vibration on
vehicles
Type of order: standard
Partners involved: 3
External subcontractors: yes
Business documents: 20
b) Painting machine A machine designed to support process
chains
Type of order: innovative
Partners involved: 3
External subcontractors: yes
Business documents: 11
c) Mors component A system for disc manufacturing via
compression.
Type of order: standard
Partners involved: 2
External subcontractors: no
Business documents: 9
d) Slab press A machine for leather ironing and
embossing
Type of order: innovative
Partners involved: 2
External subcontractors: yes
Business documents: 15
e) Wooden Drum A machine in Iroko wood for tanning Type of order: innovative
Partners involved: 2
External subcontractors: yes
Business documents: 11
970
In each order planning, the involved partners companies have been coordinated by the system 971
according to a business protocol modeled in BPMN. Figure 22 shows the major steps of the 972
34
protocol, with the following main phases: (i) the client specifies the product category and its 973
requirements; (ii) the system proposes a set of front-end companies; (iii) the client selects a front-974
end company and starts the agreement process on product requirements; (iv) if the order is not 975
accepted, the client selects another front-end company; (v) if the order is accepted, the front-end 976
company can require a set of partners for producing the components; (iv) once all partners have 977
been selected, the front-end company can send the budget to the client; (v) if the budget is 978
accepted the process ends; (vi) if the budget is not accepted the client can select another front-end 979
company. 980
981
Figure 22. The main phases of the protocol for the collaborative planning of orders in the pilot 982 scenario. 983
984
The collaboration protocol was modeled involving the partner companies, and using the 985
methodology of Sharp (2009). It comprises business rules and collaborative analytics, for 986
distributed decision support and data aggregation, respectively. More precisely, in Figure 22 the 987
business rule tasks “order planning” have been developed on the basis of the business logic 988
presented in Section 4.3. Table 6 lists some of the KPIs, with the related Critical Success Factors 989
(CSFs), based on the business rules. 990
Table 6 CSFs and KPIs based on the business rules of Figure 5 and Figure 6. 991 992
Company CSF KPI
Mechanical
firm
(i) to better exploit the production capacity
for the standpoint of innovation
(i) percentage of innovative orders
Electrical
firm
(ii) to improve the exploitation of the
production capacity in general
(ii) average exploitation and saturation of
the production capacity
35
(iii) to speed up payment time
(iii) average payment time
Overall
Community
(iv) to improve the capacity to follow the
client’s demand
(iv) percentage of orders revised by the
client
993
The service tasks “propose front-end companies” and “propose partner companies”, feed by 994
the data storage “KPIs”, have been developed with the technique presented in Sections 4.4 and 5, 995
and a seller/buyer rating. The rating is based on KPIs which are provided as a 1-to-5 relational 996
feedback at the end of the collaboration, and summarized in Table 7. 997
Table 7 KPIs related to the seller/buyer rating. 998 999
Company
Type
KPI name KPI description
Seller (i) Adequacy
(ii) Reliability
(iii) Customization
(iv) Expected delivery time
(v) Post-sale service
(vi) Communication
(i) the price is adequate to its yielded profit
(ii) the condition/level of the item/service matches its requirements
(iii) personalized requirements can be implemented
(iv) frequency and impact of delays
(v) availability to damage repair and protection
(vi) satisfied with the seller’s communication
Buyer (i) Payment
(ii) Changes
(iii) Communication
(i) payment deadlines observed
(ii) frequent running changes
(iii) availability to interaction and meeting
1000
As an example, Fig. 23 shows a radar chart with the KPIs values that have been really 1001
associated to four seller companies. The figure is intended as a basis for the viability of analyses 1002
on the different strategies undertaken within the OCN. More specifically, it shows that the strategy 1003
of the Electrical Firm (EX), is characterized by a focus on post-sale service and expected delivery, 1004
whereas a Mechanical Firm (MY) better focuses on customization and expected delivery. In 1005
contrast, the strategic objectives of the other two Mechanical Firms (MX and MZ) are oriented on 1006
adequacy and, in one case, also on post-sale service. 1007
As a result, the above business scenarios have made possible the initial roll-out of the system 1008
into production environments. Some other pilot projects will start, in order to demonstrate that the 1009
system can achieve a certain average throughput in terms of CSFs, by improving the innovative 1010
production, the exploitation of the production capacity, the payment time, and the overall capacity 1011
to follow the client’s demand. 1012
Currently, the project evaluation examines whether the program is successfully recruiting and 1013
retaining its intended participants, using training materials, maintaining its timelines, coordinating 1014
partners according to their collaborative processes. Once the success in functioning of the process 1015
is confirmed, subsequent program evaluation will examine the long-term impact of the program, 1016
by taking into account the quality of the outcomes. 1017
1018
1019
36
1020
Figure 23. The KPIs values associated to some seller companies. 1021 1022
7. Conclusions and future works 1023
To model distributed business logic in OCNs is a challenging problem mainly due both to the 1024
complex interactions companies may have and the uncertainty such a dynamic environment rises. 1025
Business requirements of OCNs reveal characteristics of self-organization, distribution, 1026
transparency, and marketing concerns on data flow. A focus on OCNs business logic, supported by 1027
technological tools, leads to the integration of three technological enablers: workflow design, 1028
business rules design, and privacy-preserving collaborative analytics. First, workflow-based 1029
coordination is based on the BPMN 2 standard, and provides a fundamental technology to 1030
integrate distributed activities and data flows. Moreover, the BPMN provides a notation readily 1031
understandable by all business stakeholders, supporting the representation of the most common 1032
control-flow patterns occurring for business collaborations. Second, business rules encapsulate 1033
knowledge related to logical tasks, typically decision and control tasks. Semantic Web based on 1034
the OWL/SWRL captures all the important features needed for business rules modeling: it is a 1035
mature and well-publicized standard, with available training materials, conformant technology 1036
implementations. Semantic Web documents are very flexible; they can be joined and shared, 1037
allowing many different arrangements of rule bases. Groups of rules and facts can be easily used 1038
with distributed strategies. Third, marker-based stigmergy allows protecting business privacy and 1039
enabling self-aggregation, thus supporting collaborative analytics when combined with workflows. 1040
The above enablers have been discussed and experimented with real-world data, through a pilot 1041
scenario of collaborative order planning. A suitable architectural model is also presented, together 1042
with specific software tools implementing the most important modules. 1043
We have designed and implemented the DLIWORP approach under the research and 1044
innovation project entitled “PMI 3.0”, which has been co-financed by the Tuscany Region (Italy) 1045
for the growth of the small-medium enterprises. The approach was first implemented on a 1046
37
technical proof of concept, which demonstrated the feasibility of the ideas, verifying that the 1047
presented concepts have the potential of being used, and establishing that the system satisfies the 1048
fundamental aspects of the purpose it was designed for, by touching all of the technologies in the 1049
solution. This first prototype was used as a demonstrator to prospective companies. Subsequently 1050
the prototype was engineered by a software company, who determined the solution to some 1051
technical problems (such as how the different companies’ systems might technically integrate) and 1052
demonstrated that a given configuration can achieve a certain throughput. Some pilot projects have 1053
already been started for an initial roll-out of the system into production environments. As a future 1054
work, the system will be cross-validated on different real-world scenarios, involving companies of 1055
different sizes and markets, in order to be consolidated as a design methodology. Thus, the 1056
validation of the proposed ideas has been so far partially achieved. Indeed, a concrete business 1057
infrastructure was successfully implemented, and it was possible to create given instances of the 1058
processes. However, the approach can be exhaustively tested with many scenarios and many real 1059
business situations. 1060
Acknowledgements 1061
This research has been partially supported in the research and innovation project entitled “PMI 1062
3.0”, which has been co-financed by the Tuscany Region (Italy) for the growth of the small-1063
medium enterprises. 1064
References 1065
Afsarmanesh, H., Camarinha-Matos, L. M., and Msanjila, S. S. (2010). Models, Methodologies, 1066
and Tools Supporting Establishment and Management of Second-Generation OCNs. IEEE 1067
Transactions on Systems, Man, and Cybernetcs – Part C, 41(5), 692-710. 1068
Andrés, B., and Poler, R. (2013). Relevant problems in collaborative processes of non-hierarchical 1069
manufacturing networks. Journal of Industrial Engineering and Management, 6(3): 723-731. 1070
Andrés, B., and Poler, R. (2014). Research on collaborative processes in non-hierarchical 1071
manufacturing networks. Technological Innovation for Collective Awareness Systems. IFIP 1072
Advances in Information and Communication Technology, 423: 21-28. 1073
Appio, F.P., Martini, A., and Gastaldi, L. (2016). Perspectives on inter-organizational and 1074
collaborative innovation. International Journal of Technology Management, forthcoming. 1075
Avvenuti, M., Cesarini, D., and Cimino, M.G.C.A. (2013). MARS, a multi-agent system for 1076
assessing rowers' coordination via motion-based stigmergy. Sensors, 13(9): 12218-12243. 1077
Baldwin, C., and Von Hippel, E. (2011). Modeling a Paradigm Shift: From Producer Innovation to 1078
User and Open Collaborative Innovation. Organization Science, 22(6): 1399-1417. 1079
Barut, M., Faisst, W., and Kanet, J.J. (2002). Measuring Supply Chain Coupling: An Information 1080
System Perspective. European Journal of Purchasing and Supply Management, 8(3): 161-171. 1081
Bates, B. J. (1989). Information as an economic good: A reevaluation of theoretical approaches. In 1082
B. D. Ruben and L. A. Lievrouw. Mediation, Information, and Communication. New 1083
Brunswick, NJ: Transaction Publishers. 1084
38
Bechini, A., Cimino, M.G.C.A., Marcelloni, F., Tomasi, A. (2008) Patterns and technologies for 1085
enabling supply chain traceability through collaborative e-business. Information and Software 1086
Technology, 50(4): 342-359. 1087
Bonabeau, E., Theraulaz, G., Deneubourg, J.-L., and Camazine, S. (1997). Self-organisation in 1088
social insects. Trends in Ecology and Evolution, 12(5), 188-193. 1089
Bonabeau, E., Dorigo, M., Theraulaz, G. (1999). Swarm intelligence: From natural to artificial 1090
systems. Oxford University Press, New York. 1091
Brambilla, M., Fraternali, P. and Vaca, C. (2011a). A Notation for Supporting Social Business 1092
Process Modeling. In Dijkman, R., Hofstetter, J., and Koheler, J. (eds.) Business Process 1093
Model and Notation, Lecture Notes in Business Information Processing 2011, 95: 88-102. 1094
Brambilla, M., Fraternali, P., and Vaca, C. (2011b). BPMN and Design Patterns for Engineering 1095
Social BPM Solutions. 4th Workshop on Business Process Management and Social Software 1096
(BPMS2’11), co-located with BPM 2011, August 2011, Clermont-Ferrand, France. 1097
Bullinger, A.C. (2008). Innovation and Ontologies: Structuring the Early Stages of Innovation 1098
Management. Dissertation Technische Universität München, Gabler. 1099
Camarinha-Matos, L.M. and Afsarmanesh, H. (2007). A framework for virtual organization 1100
creation in a breeding environment. Annual Reviews in Control, 31(1): 119-135. 1101
Camarinha-Matos, L.M., Afsarmanesh, H., Galeano, N., and Molina, A. (2009). Collaborative 1102
networked organizations – Concepts and practice in manufacturing enterprises. Computers & 1103
Industrial Engineering, 57(1): 46-60. 1104
Camarinha-Matos, L.M. (2013). Collaborative networks: A mechanism for enterprise agility and 1105
resilience. In: Enterprise Interoperability VI – Interoperability for Agility, Resilience, and 1106
Plasticity of Collaborations, K. Mertins et al. (eds.). Springer. 1107
Camarinha-Matos, Luis M., and Hamideh Afsarmanesh, eds (2014). Collaborative Systems for 1108
Smart Networked Environments: Proceedings of the 15th IFIP WG 5.5 Working Conference 1109
on Virtual Enterprises, PRO-VE 2014, Amsterdam, The Netherlands, October 6-8, 2014, Vol. 1110
434. Springer. 1111
Carbone, F., Contreras, J., Hernández, J.Z., and Gomez-Perez, J.M. (2012). Open Innovation in an 1112
Enterprise 3.0 framework: Three case studies. Expert Systems with Applications, 39(10): 8929-1113
8939. 1114
Chen, T.Y. (2008). Knowledge sharing in virtual enterprises via an ontology-based access control 1115
approach. Computers in Industry, 59(5): 502-519. 1116
Chen, Y., Kreulen, M., Campbell, C., and Abrams, C. (2011). Analytics ecosystem transformation: 1117
a force for business model innovation. Proceedings of the 2011 Annual SRII Global 1118
Conference, IEEE Computer Society, Washington, 11-20. 1119
Chen, H., Chiang, R. H., and Storey, V. C. (2012). Business Intelligence and Analytics: From Big 1120
Data to Big Impact. MIS Quarterly, 36(4): 1165-1188. 1121
Chesbrough, H.W. (2003). Open Innovation: The New Imperative for Creating and Profiting from 1122
Technology. Boston: Harvard Business School Press. 1123
Chesbrough, H.W., and Crowther, A.K. (2006). Beyond high tech: early adopters of open 1124
innovation in other industries. R&D Management, 36(3): 229-236.Chesbrough, H.W., and 1125
39
Schwartz, K. (2007). Innovating Business Models with Co-Development Partnerships. 1126
Research-Technology Management, 50(1): 55-59. 1127
Cimino, M.G.C.A., and Marcelloni, F. (2011). Autonomic tracing of production processes with 1128
mobile and agent-based computing. Information Sciences, 181(5): 935-953. 1129
Clauss, T., and Spieth, P. (2015). Governance of open innovation networks with national vs. 1130
international scope. Proceedings of the 25th
ISPIM Conference, Budapest, Hunagry. 1131
Curley, M., and Formica, P. (2013). The Experimental Nature of New Venture Creation, 1132
Capitalizing on Open Innovation 2.0. Springer. 1133
Curley, M., and Salmelin, B. (2013). Open Innovation 2.0: A New Paradigm. White Paper. 1134
Available online: http://ec.europa.eu/information_society/newsroom/cf/dae/document.cfm? 1135
doc_id=2182. 1136
Das, T.K., and Teng, B.S. (1998). Between trust and control: developing confidence in partner 1137
cooperation in alliances. Academy of Management Review, 23(3): 491-512. 1138
Davenport, T. H., and Harris, J. G. (2007). Competing on Analytics. New York (NY): Harvard 1139
Business School Press. 1140
Davenport, T. H., Harris, J. G., and Morrison, R. (2010). Analytics at Work: Smarter Decisions, 1141
Better Results. New York (NY): Harvard business Review Press. 1142
Deeds, D.L., and Hill, C.W.L. (1996). Strategic alliances and the rate of new product development: 1143
an empirical study of entrepreneurial biotechnology firms. Journal of Business Venturing, 1144
11(1): 41-55. 1145
Dhakal, P. (2009). The law of rule: centralized, decentralized and distributed systems. Report for 1146
CFFN, NRN-Canada, NRNA. 1147
Durugbo, C. (2015). Modelling information for collaborative networks. Forthcoming on 1148
Production Planning & Control. 1149
European Commission (2013). Open Innovation 2013. Available online: http://www.oi-1150
net.eu/attachments/article/73/OpenInnovationYearbook2013.pdf. 1151
Escribano, A., Fosfuri, A. and Tribò, J.A. (2009). Managing external knowledge flows: the 1152
moderating role of absorptive capacity. Research Policy, 38(1): 96-105. 1153
Eriksson, H. E., and Penker, M. (1999). Business modeling with UML: Business Patterns at Work. 1154
John Wiley & Sons. 1155
Ermilova, E., and Afsarmanesh, H. (2006). Competency and profiling management in virtual 1156
organization breeding environments. In L.M. Camarinha-Matos, H. Afsarmanesh and M. Ollus, 1157
eds. Network-centric collaboration and supporting frameworks. New York: Springer, 131–142. 1158
Fabrizio, K.R. (2009). Absorptive capacity and the search for innovation. Research Policy, 38(2): 1159
255-267. 1160
Fagerberg, J. (2005). Innovation: a guide to the literature. In Fagerberg, J.,Mowery, D., Nelson, R. 1161
(Eds.), The Oxford Handbook of Innovation. Oxford University Press, Oxford. 1162
Fiala, P. (2005). Information Sharing in Supply Chains. Omega, 33(5): 419-423. 1163
Fraternali, P., Brambilla, M., and Vaca, C. (2011). A model-driven approach to social BPM 1164
applications. Social BPM. Future Strategies Inc.(May 2011). 1165
40
Furno, A., Zimeo, E. (2014). Context-aware Composition of Semantic Web Services. Mobile 1166
Networks and Applications, 19:235–248. 1167
Gastaldi, L., Appio, F.P., Martini, A., and Corso, M. (2015). Academics as orchestrators of 1168
continuous innovation ecosystems: Towards a fourth generation CI initiatives. International 1169
Journal of Technology Management, 68(1/2): 1-20. 1170
Gloor, P. (2006). Swarm Creativity, Competitive Advantage Through Collaborative Innovation 1171
Networks. Oxford University Press. 1172
Grefen, P., Mehandjiev, N., Kouvas, G., Weichhart, G., Eshuis, R. (2009). Dynamic business 1173
network process management in instant virtual enterprises. Computers in Industry 60:86–103. 1174
Heidenreich, S., Landsperger, J., and Spieth, P. (2014). Are innovation networks in need of a 1175
conductor? Examining the contribution of network managers in low and high complexity 1176
settings. In press on Long Range Planning. 1177
Holland, O., and Melhuish, C. (1999). Stigmergy, self-organization, and sorting in collective 1178
robotics. Artificial Life, 5(2): 173-202. 1179
Iansiti, M., and Levien, R. (2004). Strategy as Ecology. Harvard Business Review, March. 1180
Jelasity, M., Babaoglu, O., and Laddaga, R. (2006). Guest Editors’ Introduction: Self-Management 1181
through Self-Organization. Intelligent Systems IEEE, 21(2): 8-9. 1182
Jung, J. J. (2011). Boosting social collaborations based on contextual synchronization: An 1183
empirical study. Expert Systems with Applications, 38(5), 4809-4815. 1184
Katila, R. and Ahuja, G. (2002). Something old, something new: a longitudinal study of search 1185
behavior and new product introduction. Academy of Management Journal, 45(6): 1183-1194. 1186
Kiemen, M. (2011). Self-organization in Open Source to support collaboration for innovation. 1187
Proceedings of the XXII ISPIM Conference held in 12-15 June 2011, Hamburg, Germany. 1188
Krovi, R., Chandra, A., and Rajagopalan, B. (2003). Information Flow Parameters for Managing 1189
Organizational Processes. Communications of the ACM, 46 (2): 77-82. 1190
Leymann, F., and Roller, D. (2000). Production Workflow: Concepts and Techniques. Prentice 1191
Hall. 1192
Levine, S.S., and Prietula, M. (2013). Open Collaboration for Innovation: Principles and 1193
Performance. Organization Science, 25(5): 1414-1433. 1194
Li, G. and Wei, M. (2014). Everything-as-a-service platform for on-demand virtual enterprises, 1195
Information Systems Frontiers, 16(3):435–452. 1196
Liu, C., Li, Q., and Zhao, X. (2009). Challenges and opportunities in collaborative business 1197
process management: Overview of recent advances and introduction to the special issue, 1198
Information Systems Frontiers, 11(3): 201–209. 1199
Loss L., and Crave S. (2011). Agile Business Models: an approach to support collaborative 1200
networks. Production Planning & Control, 22(5–6): 571-580. 1201
Macedo, P., and Camarinha-Matos, L.M. (2013). A qualitative approach to assess the alignment of 1202
Value Systems in collaborative enterprises networks. Computers & Industrial Engineering, 1203
64(1): 412-424. 1204
Macedo, P., Cardoso, T., Camarinha-Matos, L.M. (2013). Value Systems Alignment in Product 1205
Servicing Networks, Collaborative Systems for Reindustrialization, IFIP Series, 408:71-80. 1206
41
Msanjila, S.S., and Afsarmanesh, H. (2006). Assessment and creation of trust in OCNs. In 1207
Camarinha-Matos, L.M., Afsarmanesh, H., and Ollus, M. (eds.), Network-centric collaboration 1208
and supporting frameworks, Springer. 1209
Msanjijla, S.S., and Afsarmanesh, H. (2011). On modelling evolution of trust in organisations 1210
towards mediating collaboration. Production Planning & Control, 22(5-6): 518-537. 1211
Meech, A. (2010). Business Rules Using OWL and SWRL. Advanced in Semantic Computing, 2: 1212
23-31. 1213
Moore, J.F. (1996). Death of competition: leadership and strategy in the age of business 1214
ecosystems. John Wiley & Sons. 1215
Msanjila, S.S. and Afsarmanesh, H. (2011). On modelling evolution of trust in organizations 1216
towards mediating collaboration. Production Planning & Control, 22(5-6): 518-537. 1217
OMG (Object Management Group). (2011) Business Process Model and Notation (BPMN), 1218
Version 2.0, Official specification, January 2011. Available online: http://www.omg.org/spec/ 1219
BPMN/2.0. 1220
Ollus, M., Jansson, K., Karvonen, I., Uoti, M., and Riikonen, H. (2011). Supporting collaborative 1221
project management. Production Planning & Control, 22(5–6): 538-553. 1222
Palley, A.B., and Kremer, M. (2014). Sequential Search and Learning from Rank Feedback: 1223
Theory and Experimental Evidence. Management Science, 60(10): 2525-2542. 1224
Panchal, J.H. (2010). Coordination in collective product innovation. Proceedings of the ASME 1225
2010 International Mechanical Engineering Congress & Exposition IMECE 2010 November 1226
12 – 18, 2010, Vancouver, BC, Canada. 1227
Patnayakuni, R., Rai, A. and Seth, N. (2006). Relational Antecedents of Information Flow 1228
Integration for Supply Chain Coordination. Journal of Management Information Systems, 1229
23(1): 13-49. 1230
Peñaranda Verdeza, N., Galeano, N., Romero, D., Mejia, R., Molina, A. (2009). Collaborative 1231
Engineering Environments for Virtual Organisations. International Journal of Information 1232
Technology and Management, 8(3):298-320. 1233
Picard, W. (2006). Support for adaptive collaboration in Professional Virtual Communities based 1234
on negotiations of social protocols. International Journal of Information Technology and 1235
Management, 8(3):298-320. 1236
Picard, W., Paszkiewicz, Z., Gabryszak, P., Krysztofiak, K., and Cellary, W. (2010). Breeding 1237
virtual organizations in a service-oriented architecture environment. SOA Infrastructure Tools: 1238
Concepts and Methods, 375-396. 1239
Plisson, J., Ljubic, P., Mozetic, I., and Lavrac, N. (2007). An Ontology for Virtual Organization 1240
Breeding Environments. IEEE Transactions on Systems, Man, and Cybernetics, 37(6): 1327-1241
1341. 1242
Prahalad, C.K., and Krishnan, M.S. (2008). The new age of innovation: driving co-created value 1243
through global networks. New York: McGraw-Hill. Ramaswamy, V., and Gouillart, F. (2010). 1244
The Power of Co-Creation: Build It With Them to Boost Growth, Productivity, and Profits. 1245
Free Press. 1246
42
Puranam, P., and Vanneste, B.S. (2009). Trust and Governance: untangling a tangles web. 1247
Academy of Management Review, 34(1): 11-31. 1248
Ray, P., and Lewis, L. (2009). Managing cooperation in e-business systems, Information Systems 1249
Frontiers, 11(2): 181-188. 1250
Reijers, H.A., Song, M., and Jeong, B. (2009). Analysis of a collaborative workflow process with 1251
distributed actors, Information Systems Frontiers, 11(3): 307-322. 1252
Ritala, P., Armila, L., and Blomqvist, K. (2009). Innovation orchestration capability – Defining the 1253
organizational and individual level determinants. International Journal of Innovation 1254
Management, 13(4): 569-591. 1255
Rabelo, R. J., Gusmeroli, S., Arana, C., & Nagellen, T. (2006). The ECOLEAD ICT infrastructure 1256
for collaborative networked organizations. In L. M. Camarinha-Matos, H. Afsarmanesh & M. 1257
Ollus (Eds.), Network-centric collaboration and supporting frameworks, IFIP, 224:451-460. 1258
New York, Springer. 1259
Rabelo, R. J., & Gusmeroli, S. (2008). The ECOLEAD collaborative business infrastructure for 1260
networked organizations. In L. M. Camarinha-Matos & W. Picard (Eds.), Pervasive 1261
collaborative networks, IFIP, 283:451-462. New York, Springer. 1262
Rabelo, R. J., Costa, S., & Romero, D. (2014). A governance reference model for virtual 1263
enterprises, collaborative systems for smart networked environments. In L. M. Camarinha-1264
Matos & H. Afsarmanesh (Eds.), Collaborative Systems for Smart Networked Enterprises, 1265
IFIP, 434:60-70. Berlin Heidelberg, Springer. 1266
Romero, D., Galeano, N. and Molina, A. (2008). A virtual breeding environment reference model 1267
and its instantiation methodology. In IFIP International Federation for Information Processing, 1268
Volume 283; Pervasive Collaborative Networks; Luis M. Camarinha-Matos, Willy Picard; 1269
(Boston: Springer), pp. 15–24. 1270
Romero, D., Galeano, N., and Molina A. (2009). Mechanisms for assessing and enhancing 1271
organisations’ readiness for collaboration in collaborative networks. International Journal of 1272
Production Research, 47(17): 4691-4710. 1273
Romero, D., and Molina, A. (2009). VO breeding environments & virtual organizations integral 1274
business process management framework. Information Systems Frontiers , 11: 569-597. 1275
Romero, D., and Molina, A. (2010). Virtual organisation breeding environments toolkit: reference 1276
model, management framework and instantiation methodology. Production Planning & 1277
Control, 21(2): 181-217. 1278
Romero, D., and Molina, A. (2011). Collaborative networked organisations and customer 1279
communities: value co-creation and co-innovation in the networking era. Production Planning 1280
& Control, 22(5-6): 447-472. 1281
Rothaermel, F., and Deeds, D.L. (2006). Alliance type, alliance experience and alliance 1282
management capability in high technology ventures. Journal of Business Venturing, 21(4): 1283
429-460. 1284
Russell, M., Still, K., Huhtamaki, J., Yu, C., and Rubens, N. (2011). Transforming Innovation 1285
Ecosystems through Shared Vision and Network Orchestration. Triple Helix IX International 1286
Conference, Stanford University, Stanford, California. 1287
43
Sharp, A., and McDermott, P. (2009). Workflow Modeling, 2nd ed.. Artech House: Boston, MA, 1288
USA. 1289
Simões, D., Ferreira, H., and Soares, A.L. (2007). In IFIP International Federation for 1290
Information Processing, Vol. 243, Establishing the Foundation of Collaborative Networks; eds. 1291
Camarinha-Matos, L., Afsarmaresh, H., Novais, P., Analide, C. Springer. Boston, MA, USA, 1292
pp. 137-146. 1293
Sarnikar, S. (2007). Automating knowledge flows by extending conventional information retrieval 1294
and workflow technologies. Proceedings of the 2007 Winter Conference on Business 1295
Intelligence, David Eccles School of Business, February 22 -24, UT, USA. 1296
Steiner, A., Morel, L., and Camargo, M. (2014). Well-suited organization to open innovation: 1297
empirical evidence from an industrial deployment. Journal of Innovation Economics & 1298
Management, 1(13): 93-113. 1299
Sun, Y., Tan, W., Li, L., Shen, W., Bi, Z., Hu, X. (2016). A new method to identify collaborative 1300
partners in social service provider networks, Information Systems Frontiers, 18(3): 565-578. 1301
Tangpong, C., HHUng, K.T., and Ro, Y.K. (2010). The interaction effect of relational norms and 1302
agent cooperativeness on opportunism in buyer0supplier relationships. Journal of Operations 1303
Management, 28(5): 398-414. 1304
Ulbrick, S., Troitzsch, H., Van den Anker, F., Plüss, A., and Huber, C. (2011). How teams in 1305
netwoked organisations develope collaborative capability: processes, critical incidents and 1306
success factors. Production Planning & Control, 22(5-6): 488-500. 1307
Van de Vrande, V., de Jong, J.P.J., Vanhaverbeke, W., and de Rochemont, M. (2009). Open 1308
innovation in SMEs: trends, motives and management challenges. Technovation, 29(6-7): 423-1309
437. 1310
Van der Aalst, W. M. (2009). Process-aware information systems: Lessons to be learned from 1311
process mining. In Transactions on petri nets and other models of concurrency II (pp. 1-26). 1312
Springer Berlin Heidelberg. 1313
Velu, C., Barrett, M., Kholi, R., and Salge, T.O. (2013). Thriving in Open Innovation Ecosystems: 1314
toward a collaborative market orientation. Working Paper. 1315
Verbeek, M. (2008). A guide to modern econometrics. Chapter 4. John Wiley & Sons. 1316
Wang, Y., Wang, J., and Zhang, S. (2005). Collaborative knowledge management by integrating 1317
knowledge modeling and workflow modeling. In Information Reuse and Integration, Conf, 1318
2005. IRI-2005 IEEE International Conference on. (pp. 13-18). IEEE. 1319
Wang, H., Peng, X., and Gu, F. (2011). The emerging knowledge governance approach within 1320
Open Innovation: its antecedents factors and interior mechanisms. International Journal of 1321
Business and Management, 6(8): 94-104. 1322
Well, D. (2009). Collaborative Analytics – An Emerging Practice. Available Online 1323
http://www.b-eye-network.com/view/9406. 1324
W3C (2004). SWRL: A Semantic Web Rule Language Combining OWL and RuleML. W3C 1325
Member Submission, 21 May 2004. Available online http://www.w3.org/Submission/SWRL. 1326
W3C (2012). Web Ontology Language (OWL). November 2012. Available online 1327
http://www.w3.org/2001/sw/wiki/OWL. 1328
44
W3C (2014). Resource Description Framework (RDF). February 2014. Available online 1329
http://www.w3.org/RDF/. 1330
Zelewski, S. (2001). Ontologien - ein Ueberblick ueber betriebswirtschaftliche 1331
Anwendungsbereiche. Workshop "Forschung in schnellebiger Zeit", Appenzell. 1332
Zeshan, F., Mohamad, R. (2011). Semantic Web Service Composition Approaches: Overview and 1333
Limitations. International Journal on New Computer Architectures and Their Applications 1334
(IJNCAA) 1(3): 640-651. 1335
1336
Francesco P. Appio, PhD, is Associate Professor at the Research Center (Business Group) of the 1337
École de Management Léonard de Vinci in Paris. He is member of the Regional Entrepreneurship 1338
Acceleration Program, a global initiative at MIT. Over the past two years, he has been serving as 1339
Post-doc at the University of Pisa, School of Engineering. He completed his Ph.D. in 1340
“Management” at Scuola Superiore Sant’Anna in Pisa. His main research interests deal with the 1341
antecedents (novelty and originality) and consequences (impact) of radical innovations, intellectual 1342
property, co-creation practices, and decision making tools in the fuzzy front end of innovation. 1343
1344
Mario G.C.A. Cimino is with the Department of Information Engineering (University of Pisa) as 1345
a Senior Researcher in Information Systems. His research focus lies in the areas of Swarm 1346
Intelligence and Business/Social Process Analysis, with particular emphasis on Stigmergic 1347
Computing, Process Mining and Simulation. He is (co-)author of more than 40 publications. 1348
1349
Alessandro Lazzeri is currently a Ph.D. student in Information Engineering at the University of 1350
Pisa, Italy. He received his MSc in Business Informatics from the University of Pisa in 2013. His 1351
primary research interests include multi-agent systems and swarm intelligence. He is currently 1352
working on the application of stigmergy in temporal data analysis, as a visiting Ph.D. student at 1353
the Electrical and Computer Engineering Research Facility of the University of Alberta, Canada. 1354
1355
Antonella Martini, PhD, is Associate Professor at the University of Pisa where she teaches 1356
Managerial Engineering and Organization. Her main research interests involve continuous 1357
innovation and ambidexterity. She is board member of the Continuous Innovation Network 1358
(CINet) and president of CIMEA. She is author of many publications of which more than 90 at the 1359
international level. 1360
1361
Gigliola Vaglini is Full Professor at the University of Pisa. Her research interests include software 1362
engineering, algorithms and formal methods for concurrent and distributed system verification. 1363
She is the coordinator of the Bachelor and the two Masters in Computer Engineering of the 1364
University of Pisa, and is co-author of more than 50 articles on international journals. 1365
Related Documents