Fakultät für Medizin Institut für Pathologie Cold atmospheric plasma decontamination against nosocomial bacteria Tobias G. Klämpfl, Dipl.-Ing. (Univ.) Vollständiger Abdruck der von der Fakultät für Medizin der Technischen Universität München zur Erlangung des akademischen Grades eines Doctor of Philosophy (Ph.D.) genehmigten Dissertation. Vorsitzender: Univ.-Prof. Dr. Dr. Stefan Engelhardt Betreuer: Univ.-Prof. Dr. Jürgen Schlegel Prüfer der Dissertation: 1. apl. Prof. Dr. Dr. h.c. Gregor E. Morfill, Ludwig-Maximilians-Universität München 2. Univ.-Prof. Dr. Dirk Busch Die Dissertation wurde am 15.01.2014 bei der Fakultät für Medizin der Technischen Universität München eingereicht und durch die Fakultät für Medizin am 14.02.2014 angenommen.

Welcome message from author
This document is posted to help you gain knowledge. Please leave a comment to let me know what you think about it! Share it to your friends and learn new things together.
Transcript

Fakultät für Medizin
Institut für Pathologie
Cold atmospheric plasma decontamination against nosocomial bacteria
Tobias G. Klämpfl, Dipl.-Ing. (Univ.)
Vollständiger Abdruck der von der Fakultät für Medizin der Technischen Universität München zur Erlangung des akademischen Grades eines
Doctor of Philosophy (Ph.D.)
genehmigten Dissertation.
Vorsitzender: Univ.-Prof. Dr. Dr. Stefan Engelhardt
Betreuer: Univ.-Prof. Dr. Jürgen Schlegel
Prüfer der Dissertation:
1. apl. Prof. Dr. Dr. h.c. Gregor E. Morfill,
Ludwig-Maximilians-Universität München
2. Univ.-Prof. Dr. Dirk Busch
Die Dissertation wurde am 15.01.2014 bei der Fakultät für Medizin der Technischen Universität München eingereicht und durch die Fakultät für Medizin am 14.02.2014 angenommen.

ABSTRACT
Nosocomial pathogens are a considerable public threat, which cause high morbidity,
mortality and costs. In order to prohibit their spread, alternative and more efficient
decontamination strategies are demanded. Cold atmospheric plasma (CAP) gains
rising attention with its promising antimicrobial properties, appropriate also for the
treatment of heat-sensitive materials. CAP is physical plasma containing a cocktail of
chemically reactive species that is generated at ambient pressure.
My work addressed different important aspects of a CAP system based on the
Surface micro-discharge (SMD) technology. This involved its development,
characterization, decontaminating efficiency and factors influencing it. SMD air
plasma showed bactericidal and sporicidal potential at the kinetic studies, according
to European standard methods for sterilizing and disinfecting agents. Thereby, it was
highly effective in the inactivation of conventional biological indicators as well as of
endospores of Clostridium difficile due to the synergy between various plasma
species (such as ROS/RNS, electric field). Furthermore, electron microscopy
revealed that the microbicidal action was limited by the degree of contamination. For
these reasons and due to the high toxic ozone concentration, the use of pre-cleaned
instruments inside a closed volume is a prerequisite for adequate disinfection and
safety.
In conclusion, my work improves strongly the understanding about the
decontaminating action of SMD air plasma. It will serve as an alternative
decontaminating agent and contribute to the prevention of nosocomial infections in
the future. Important will be to validate an up-scaled device suitable for practical use,
to solve handling issues and gain measurable additional effect compared to common
methods.
ZUSAMMENFASSUNG
Nosokomiale Pathogene stellen eine ernsthafte öffentliche Bedrohung dar. Um ihre
Ausbreitung zu verhindern, sind alternative und effiziente Dekontaminierungs-
strategien notwendig. Kaltes atmosphärisches Plasma (CAP) erhält durch seine
vielversprechenden antimikrobiellen Eigenschaften und der zugleich geeigneten
Anwendung auf hitzeempfindlichen Materialen steigende Aufmerksamkeit. CAP ist
physikalisches Plasma, das aus einem Cocktail von chemisch reaktiven Spezies
besteht und bei Umgebungsdruck erzeugt wird.
Ich untersuchte unterschiedliche, wichtige Aspekte eines CAP Systems, basierend
auf der Technologie von Oberflächenmikroentladungen (SMD). Dies umfasste ihre
Entwicklung, Charakterisierung, dekontaminierende Effizienz und Faktoren, die diese
beeinflussen. SMD Luftplasma bewies in kinetischen Studien, gemäß europäischer
Standardmethoden, sein bakterizides und sporizides Potential. Dabei inaktivierte es
sehr effektiv Bioindikatoren als auch Clostridium difficile Endosporen wegen der
Synergie von verschiedenen Plasmaspezies (wie ROS/RNS, elektr. Feld). Zudem
zeigten elektronmikroskopische Aufnahmen, dass die mikrobizide Wirkung von dem
Grad der Kontaminierung abhängig war. Aus diesen Gründen und wegen der hohen
toxischen Ozonkonzentration ist das Behandeln von vorgereinigten medizinischen
Geräten in einem geschlossenen Raum für eine adäquate Desinfektion und
Sicherheitsgewährleistung erforderlich.
Zusammenfassend verbessert meine Arbeit stark das Verständnis über die
dekontaminierende Wirkung von SMD Luftplasma. Es könnte zukünftig alternativ
eingesetzt werden und die Vermeidung von nosokomialen Infektionen unterstützen.
Bedeutend werden dabei das Validieren eines für die Praxis geeigneten
Plasmageräts, das Lösen von Handhabungsproblemen und das Erlangen eines
messbaren zusätzlichen Nutzens gegenüber herkömmlichen Methoden sein.
TABLE OF CONTENTS
ABBREVIATIONS ____________________________________________________ I
SYMBOLS _________________________________________________________ II
1 INTRODUCTION ______________________________________________ 1
1.1 What is Physical Plasma? _______________________________________ 1
1.2 Cold Atmospheric Plasma (CAP) _________________________________ 2
1.2.1 Discharges at atmospheric pressure _______________________________ 3
1.2.2 Surface Micro-Discharge technology ______________________________ 4
1.2.2.1 Historical background __________________________________________ 5
1.2.2.2 Physical properties of barrier discharges ___________________________ 6
1.2.2.3 Entity of micro-discharge formation ________________________________ 9
1.2.2.4 Humid Air Plasma Chemistry ___________________________________ 13
1.3 Plasma Medicine _____________________________________________ 16
1.3.1 Nosocomial Infections _________________________________________ 18
1.3.2 CAP in microbial decontamination _______________________________ 21
1.4 Aim and research objectives of my doctoral work ____________________ 26
2 MATERIALS AND METHODS __________________________________ 27
2.1 SMD plasma device development - FlatPlaSter 2.0 __________________ 27
2.2 Plasma diagnostics ___________________________________________ 32
2.2.1 Optical emission spectroscopy __________________________________ 32
2.2.2 UV-C power emission _________________________________________ 33
2.2.3 Temperature profile ___________________________________________ 34
2.2.4 Dissipated plasma power via Lissajous figures ______________________ 35
2.2.5 Ozone concentration via absorption spectroscopy ___________________ 36
2.3 Quantitative Methods assessing plasma decontamination _____________ 39
2.3.1 Testing the bactericidal effect using agar plates _____________________ 39
2.3.2 Sterilization testing using dry inanimate carriers _____________________ 40
2.3.3 Disinfection testing ___________________________________________ 42
2.3.3.1 Treatment of bacteria on dry carriers (phase 2/step2) ________________ 42
2.3.3.2 The modified 4-field-test (phase2/step2) ___________________________ 47
2.3.4 Testing the influence of Tyvek cover on microbial inactivation __________ 50
2.4 Scanning Electron Microscopy of bacteria on carriers ________________ 53
3 RESULTS __________________________________________________ 55

3.1 Developing the electrode system ________________________________ 55
3.2 Plasma diagnostics ___________________________________________ 59
3.3 Bactericidal effect of SMD plasma using agar plates _________________ 66
3.4 SMD plasma sterilization using carriers ___________________________ 67
3.5 SMD plasma disinfection using carriers ___________________________ 69
3.6 SMD plasma surface disinfection (modified 4-field-test) _______________ 84
3.7 Influence of Tyvek cover on SMD plasma decontamination ____________ 87
4 DISCUSSION _______________________________________________ 92
4.1 Summary ___________________________________________________ 92
4.2 Considerations for developing a SMD device _______________________ 94
4.3 Ozone and other traits about SMD air plasma ______________________ 97
4.4 Bactericidal effect of SMD plasma _______________________________ 99
4.5 Plasma sterilization __________________________________________ 102
4.6 Plasma disinfection __________________________________________ 106
4.6.1 Using dry inanimate carriers ___________________________________ 106
4.6.2 Clinical surface disinfection ____________________________________ 112
4.7 Influence of Tyvek and other factors _____________________________ 117
4.8 CAP research and applications in decontamination _________________ 118
4.9 Fundamental issues related to nosocomial infections ________________ 120
4.10 Conclusion _________________________________________________ 123
4.11 Future perspectives __________________________________________ 124
5 ACKNOWLEDGMENTS ______________________________________ 126
6 REFERENCES _____________________________________________ 128
7 APPENDIX ________________________________________________ 149
7.1 List of figures _______________________________________________ 149
7.2 List of tables _______________________________________________ 152
8 PUBLICATIONS ____________________________________________ 153
„All Ding‘ sind Gift und nichts ohn‘ Gift;
allein die Dosis macht,
dass ein Ding kein Gift ist.“
(Paracelsus, ca. 1538)

Tobias G. Klämpfl Page I
ABBREVIATIONS
APPJ atmospheric pressure plasma jet BSA bovine serum albumin CAP cold atmospheric plasma CDC Center for Disease Control and Prevention cfu colony forming units DBD dielectric barrier discharge DC direct current DIN Deutsches Institut für Normierung DLR Deutsches Luft- und Raumfahrtzentrum DSMZ German Collection of Microorganisms and Cell Cultures D-value decimal reduction value ECDC European Center for Disease Control and Prevention EDX Energy-Dispersed X-Ray Spectroscopy EN European norm ESBL extended-spectrum β-lactamase FE-DBD floating-electrode DBD FP2.0 FlatPlaSter 2.0 IHPH Institute for Hygiene and Public Health IPP Max-Planck-Institute for Plasma Physics MPE Max-Planck-Institut for extraterrestrial Physics MRSA methicillin-resistant Staphylococcus aureus MO microorganism MW microwave OES Optical Emission Spectroscopy PBS phosphate buffered saline solution PE polyethylene PET polyethylene terephthalate PP polypropylene PVC polyvinylchloride RF radiofrequency SAL sterility assurance level SASP small acid-soluble protein SEM Scanning Electron Microscopy SMD surface micro-discharge SS physiological saline solution TBS tris buffered saline TSB tryptic soy broth TUM Technische Universität München VRE vancomycin-resistant Enterococcus WD working distance UV ultraviolet light
Tobias G. Klämpfl Page II
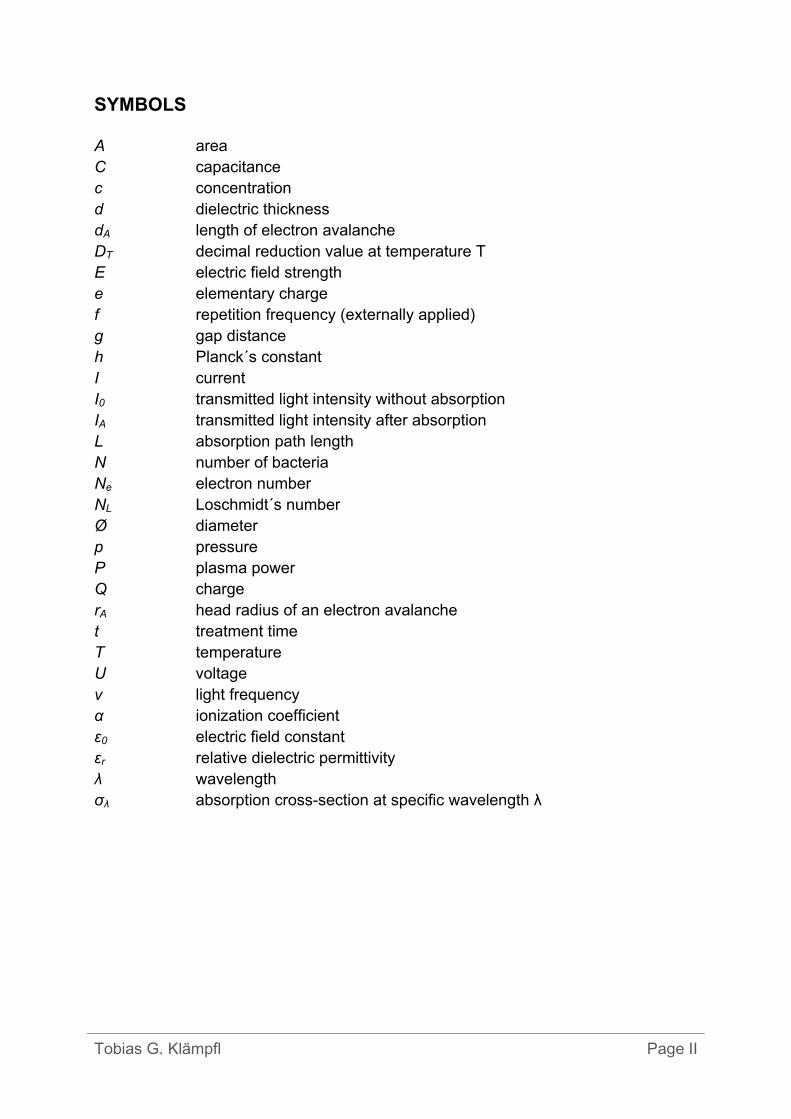
SYMBOLS
A area C capacitance c concentration d dielectric thickness dA length of electron avalanche DT decimal reduction value at temperature T E electric field strength e elementary charge f repetition frequency (externally applied) g gap distance h Planck´s constant I current I0 transmitted light intensity without absorption IA transmitted light intensity after absorption L absorption path length N number of bacteria Ne electron number NL Loschmidt´s number Ø diameter p pressure P plasma power Q charge rA head radius of an electron avalanche t treatment time T temperature U voltage v light frequency α ionization coefficient ε0 electric field constant εr relative dielectric permittivity λ wavelength σλ absorption cross-section at specific wavelength λ
INTRODUCTION
Tobias G. Klämpfl Page 1
1 INTRODUCTION
1.1 What is Physical Plasma?
The term “plasma” for an ionized gas was introduced in 1927, for the first time by
Irving Langmuir (1881-1957) [1]. The American chemist, who won the Nobel Prize for
his great achievements in surface chemistry in 1932, studied electric discharges and
their fluid characteristics at General Electric Research and Development Center. The
way these electrified fluids transported high-velocity electrons, molecules and ions of
gas impurities reminded him of the transport process of red and white corpuscles and
germs in blood plasma. Since that time plasma has also been used as a term in
physics, which induced incomprehension and resistance in the medical field, and
paved its determinant way through astrophysical science. It is assumed that 99% of
the universe contains of plasma such as solar corona, solar wind, nebula, earth´s
ionosphere and therefore, many physical processes require the understanding of
terrestrial and extraterrestrial plasmas. Natural plasma phenomena occur on earth as
lightning and the aurora borealis, a diffuse light displayed on the sky close to polar
circles, when high energetic charged particles originating from solar wind and the
magnetosphere collide with atoms in the atmosphere.
Conventionally, physical plasma is associated as the fourth state of matter. With
rising energy input to a system such as by heating, matter can pass through states
following higher degrees of freedom from the solid, through the liquid and to the
gaseous state. Higher energy levels (e.g. by electric power) can even lead to the
separation of gas molecule constituents in freely moving charged particles (electrons
and ions) forming a quasi-neutral, though electrically conductive plasma with same
densities of positive and negative charges (Figure 1.1). Accelerated electrons provide
the basis for further excitation, dissociation and reaction processes upon collision

INTRODUCTION
Tobias G. Klämpfl Page 2
with other bodies that leads to the multicomponent nature of plasma: electrons, ions,
excited molecules, neutrals like radicals and light. Further properties of plasma
include a gas temperature range from room to solar temperature, electron densities
from 106 - 1018 cm-3 and electron temperatures from 1 eV - 20 keV (1 eV ≈ 104 K) [2].
Figure 1.1: Schematic view of plasma with freely moving charges.
1.2 Cold Atmospheric Plasma (CAP)
There are two major categories of plasma systems: Thermal and non-thermal
ones [3]. In thermal plasma, the gas temperature and the electron temperature are
equal because of the complete ionization of a gas (Te = Tg). This kind of plasma
reaches very high temperatures and takes part for instance in natural thermonuclear
fusion reactions of hydrogen nuclei into helium within the sun, from which it derives
its energy. Arc discharges and microwave plasmas are derived from terrestrial
plasma systems usually associated as thermal plasmas [4], since Joule heating and
thermal ionization take place at high pressures [5]. In contrast, non-thermal plasma is
a weakly ionized gas far from thermodynamic equilibrium. While electron temperature
is 1-10 eV, electrons are not able to transfer their entire kinetic energy gained from
INTRODUCTION
Tobias G. Klämpfl Page 3
an externally applied electric field onto bigger particles and thus the gas remains non-
thermal (Te >> Tg; Tg ≈ 300 - 1000 K [4]). Non-thermal plasma can be generated in
different ways: by the use of low pressure, low applied power, a pulsed discharge
system and/or additional cooling of the gas. The term cold atmospheric plasma
describes a sub-group of non-thermal plasma solely at atmospheric pressure with
gas temperatures mainly below 425 K [6].
1.2.1 Discharges at atmospheric pressure
Atmospheric pressure plasmas can be classified into one of the three general
discharge types (Figure 1.2):
Corona discharges
Glow discharges
Arc discharges
Corona discharges (direct current (DC) or pulsed) are a typical source of non-thermal
plasma. They have a weakly luminous and non-uniform appearance at atmospheric
pressure preferably in the vicinity of sharp edges, points or thin wires that assure a
high enough electric field. Their applications involve among many others ozone
generation for water disinfection, removal of volatile organic compounds from waste
gases and the enhancement of surface adhesion of thin polymer films. In contrast,
glow discharges are luminous and characterized by a uniform and continuous glow.
At atmospheric pressure, glow discharges are realized most of the time in form of
plasma jets (DC to gigahertz), where electrodes are positioned inside a chamber,
flow of a noble gas is ionized and transported outside the chamber forming a jet.
Plasma-enhanced chemical vapour deposition of thin films is a particular process that
utilizes plasma jets. As mentioned before, arc discharges are a source of thermal

INTRODUCTION
Tobias G. Klämpfl Page 4
plasma. Their discharges are usually self-sustaining discharges (DC or microwave)
with low cathode fall voltage and an intensive thermionic field emission of electrons
which causes very high current fluxes. Arcs have a long history in metallurgy
(welding, cutting) and in illuminating devices.
Figure 1.2: Atmospheric pressure discharges: corona [7], glow [8] and arc [9] (from left to right).
All three discharge types have been subject of inventions and investigations in
regards of CAP devices aiming for biomedical applications for about fifteen years.
Even plasma species from thermal arc or also glow discharges can be cooled down
to such a degree that the remote treatment of thermo-sensitive organic matter like
tissue or single cells does not result in thermal destruction. Topics and devices in the
field of plasma medicine are introduced later (Section 1.3). In the following, the
plasma technology used in this study is described in detail first.
1.2.2 Surface Micro-Discharge technology
Surface micro-discharges (SMDs) were used as non-thermal non-equilibrium plasma
during this work. The generation of SMDs at ambient pressure is derived from the
dielectric-barrier discharge (DBD) technology which is related to the corona
discharge family and has been known for more than 150 years, notably much longer

INTRODUCTION
Tobias G. Klämpfl Page 5
than the term plasma itself. Many descriptions in this section are based on the review
of Kogelschatz [10].
1.2.2.1 Historical background
Historically, Siemens was the first investigator that conducted experiments with DBDs
in 1857 [11]. His goal was to produce ozone and he achieved it by implementing a
novel set-up of discharge apparatus, which included the arrangement of the
electrodes outside the plasma chamber and not in contact with the plasma. The
discharge originated from a flow of oxygen or air at atmospheric pressure and was
maintained in a narrow circular gap between two coaxial glass tubes by an
alternating voltage of sufficiently high amplitude. Since the glass walls limited the
electric current from passing as the dielectric barrier, this discharge type is commonly
referred as DBD. It is also frequently assigned as silent discharge due to the absence
of sparks, which are characterized by local overheating and the formation of local
shock waves and noise [12]. Silent discharges became an important research field
for the formation of ozone and nitrogen oxides for the next decades [13, 14]. Warburg
investigated the nature of silent discharges during that period [15, 16]. Buss proved
that numerous bright current filaments are characteristic for discharges, when
atmospheric-pressure air breaks down between planar parallel electrodes covered by
dielectric material [17]. He was also the first that recorded these micro-discharges
photographically (Lichtenberg figures) as well as the current and voltage with an
oscilloscope. Subsequently, many researchers devoted themselves to study the
properties of these filamentary structures [18-23]. In 1943, Manley suggested a
method for the determination of the power consumption in DBDs employing closed

INTRODUCTION
Tobias G. Klämpfl Page 6
voltage Lissajous figures and established an equation known as the power formula
for ozonizers [24].
Becker and Otto laid with their important contributions the basis for the industrial
application of DBDs as ozone generators in the first half of the 20th century [25-27],
which had been the major application used mainly in water treatment until the ‘90s
[10]. Nowadays, DBDs are utilized in a wide-ranged industrial scale. They combine
the advantages of non-equilibrium plasma properties with the ease of being up-
scaled under atmospheric pressure. At the same time power supplies become
increasingly efficient and cost-effective. In addition, better understanding of the
physical and chemical processes in ozonizers introduced beside improved ozone
generators new industrial applications including surface treatment, pollution control,
ultraviolet excimer lamps, excimer based mercury-free fluorescent lamps, high power
CO2 lasers and flat large-area plasma displays. More recently, research on
atmospheric DBDs has been directed into biomedical applications by Kelly-
Wintenberg et al. with the sterilization of matter [28], followed by initial and promising
investigations on cells and living tissue by Fridman et al. [29].
1.2.2.2 Physical properties of barrier discharges
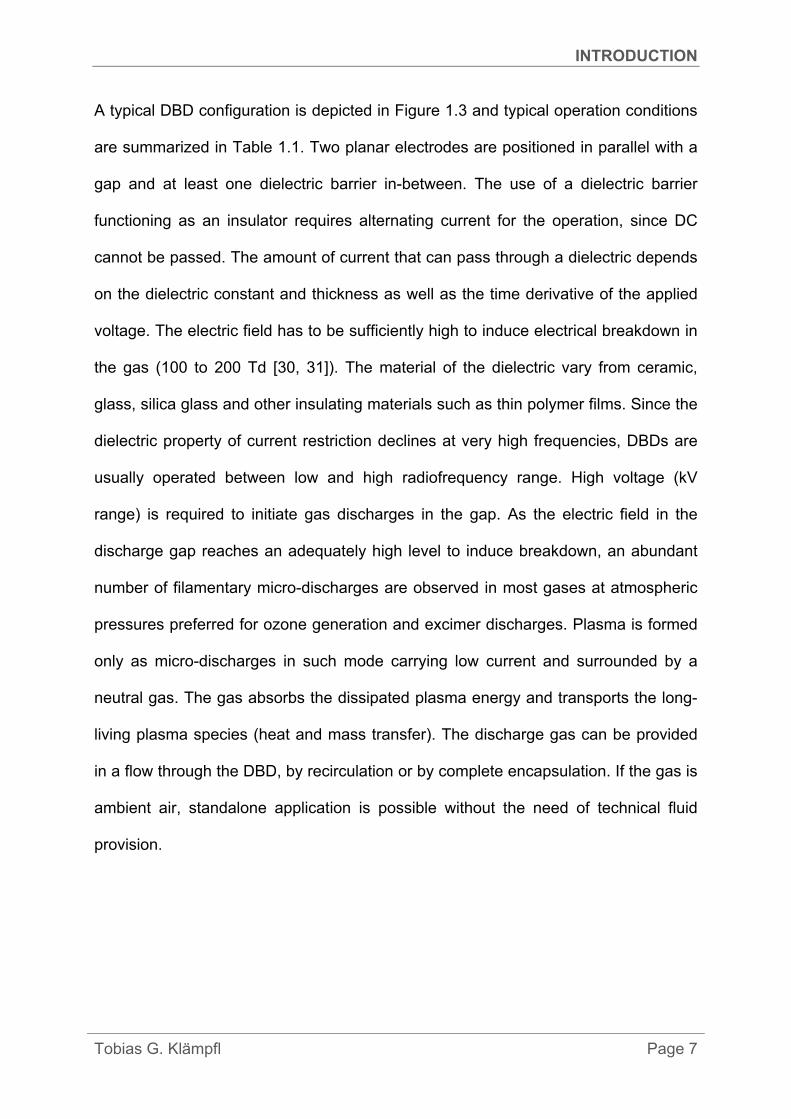
Figure 1.3: Typical basic configuration of a DBD system.
INTRODUCTION
Tobias G. Klämpfl Page 7
A typical DBD configuration is depicted in Figure 1.3 and typical operation conditions
are summarized in Table 1.1. Two planar electrodes are positioned in parallel with a
gap and at least one dielectric barrier in-between. The use of a dielectric barrier
functioning as an insulator requires alternating current for the operation, since DC
cannot be passed. The amount of current that can pass through a dielectric depends
on the dielectric constant and thickness as well as the time derivative of the applied
voltage. The electric field has to be sufficiently high to induce electrical breakdown in
the gas (100 to 200 Td [30, 31]). The material of the dielectric vary from ceramic,
glass, silica glass and other insulating materials such as thin polymer films. Since the
dielectric property of current restriction declines at very high frequencies, DBDs are
usually operated between low and high radiofrequency range. High voltage (kV
range) is required to initiate gas discharges in the gap. As the electric field in the
discharge gap reaches an adequately high level to induce breakdown, an abundant
number of filamentary micro-discharges are observed in most gases at atmospheric
pressures preferred for ozone generation and excimer discharges. Plasma is formed
only as micro-discharges in such mode carrying low current and surrounded by a
neutral gas. The gas absorbs the dissipated plasma energy and transports the long-
living plasma species (heat and mass transfer). The discharge gas can be provided
in a flow through the DBD, by recirculation or by complete encapsulation. If the gas is
ambient air, standalone application is possible without the need of technical fluid
provision.
INTRODUCTION
Tobias G. Klämpfl Page 8
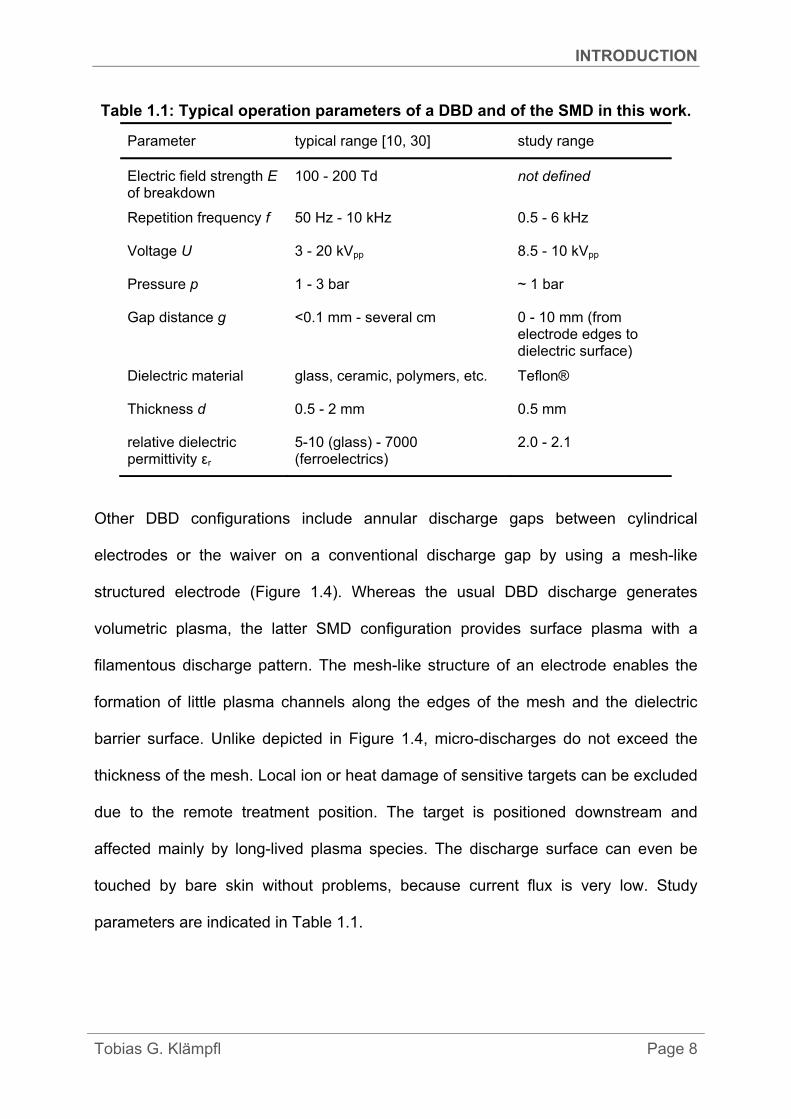
Table 1.1: Typical operation parameters of a DBD and of the SMD in this work.
Parameter typical range [10, 30] study range
Electric field strength E of breakdown
100 - 200 Td not defined
Repetition frequency f 50 Hz - 10 kHz 0.5 - 6 kHz
Voltage U 3 - 20 kVpp 8.5 - 10 kVpp
Pressure p 1 - 3 bar ~ 1 bar
Gap distance g <0.1 mm - several cm 0 - 10 mm (from electrode edges to dielectric surface)
Dielectric material glass, ceramic, polymers, etc. Teflon®
Thickness d 0.5 - 2 mm 0.5 mm
relative dielectric permittivity εr
5-10 (glass) - 7000 (ferroelectrics)
2.0 - 2.1
Other DBD configurations include annular discharge gaps between cylindrical
electrodes or the waiver on a conventional discharge gap by using a mesh-like
structured electrode (Figure 1.4). Whereas the usual DBD discharge generates
volumetric plasma, the latter SMD configuration provides surface plasma with a
filamentous discharge pattern. The mesh-like structure of an electrode enables the
formation of little plasma channels along the edges of the mesh and the dielectric
barrier surface. Unlike depicted in Figure 1.4, micro-discharges do not exceed the
thickness of the mesh. Local ion or heat damage of sensitive targets can be excluded
due to the remote treatment position. The target is positioned downstream and
affected mainly by long-lived plasma species. The discharge surface can even be
touched by bare skin without problems, because current flux is very low. Study
parameters are indicated in Table 1.1.

INTRODUCTION
Tobias G. Klämpfl Page 9
Figure 1.4: Schematic view of the SMD electrode system used in this study.
1.2.2.3 Entity of micro-discharge formation
The formation of filamentous micro-discharges is expected for gases that are forced
into electrical breakdown in DBD settings at atmospheric pressure. Beside the
filamentary mode though exists the mode of homogeneous diffuse glow discharges,
which occur under certain conditions [32, 33]. Diffusive glow discharges are typically
generated at lower pressures below 100 Pa (Figure 1.3) and have been applied in
various fields, especially the semiconductor and medical device industry for the
patterning by plasma etching or for the thin film formation by plasma deposition
processes. However, short-lived plasma filaments predominately occur at elevated
pressures and have distinct properties to vacuum plasma.
Each micro-discharge has a cylindrical-like plasma channel with about 100 µm
radius, which is extended and flattened on the dielectric surface (Figure 1.5). The
entity of a SMD can be described with a simple electric circuit (Figure 1.5). A high
enough electric field applied externally can initiate a micro-discharge that equals the

INTRODUCTION
Tobias G. Klämpfl Page 10
condition of a circuit, when a switch is closed and current has to flow through a time-
depended electric resistance.
Figure 1.5: Surface micro-discharge and an equivalent electric circuit.
The real mechanism of filament formation correlates with the streamer breakdown
theory [34-37], originally postulated for spark discharges. An initial free electron
accelerated by the electric field produces secondary electrons by direct ionization of
gas particles, leading to an electron avalanche and generation of its own electric field
. As a next step a streamer can develop, if the electric field of the space charge in
an avalanche equals the external field (following equations adapted from [38]):
4
(1.1)
with ionization coefficient elementary charge electric field constant avalanche length pressure head radius of an avalanche

INTRODUCTION
Tobias G. Klämpfl Page 11
The requirement for the avalanche amplification parameter can be derived on
the basis of the streamer development in the discharge gap under the assumption of
an avalanche head radius of 1⁄ :
ln4
20 (1.2)
This equation is known as the Raether-Meek criterion of streamer formation
20 . The total electron number must reach the order of 108 to 109 for space
charge effects to become relevant:
exp 10 to 10 (1.3)
The fulfillment of this criterion causes the transition of avalanche to self-propagating
ionized streamer at the anode. The streamer is reflected at the anode due to the high
space charge at the streamers head and propagates towards the cathode [30, 39,
40]. By bridging the gap in a few nanoseconds the streamer forms a conductive ion
channel (spatially-localized plasma filament) with maximum current flow. At this point,
the micro-discharge appears visible through the photon emission of associated de-
excitation processes. Charge accumulates at the dielectric surface observed as
lateral filament spreading and reduces the electric field to such a degree that it
collapses within nanoseconds. This principle mechanism is demonstrated for a DBD
configuration in Figure 1.6, being the same to the used SMD setting in this work. As
the current is terminated and the ionization process stops, the micro-discharge is
extinguished. Despite of that, surface charges and ionic charges are present in this
region after termination (cathode fall). The sustained charges allow the formation of a
new micro-discharge at the same location when the polarity of the applied voltage is
reverted [10]. This is the reason for the observation of single filaments with the naked
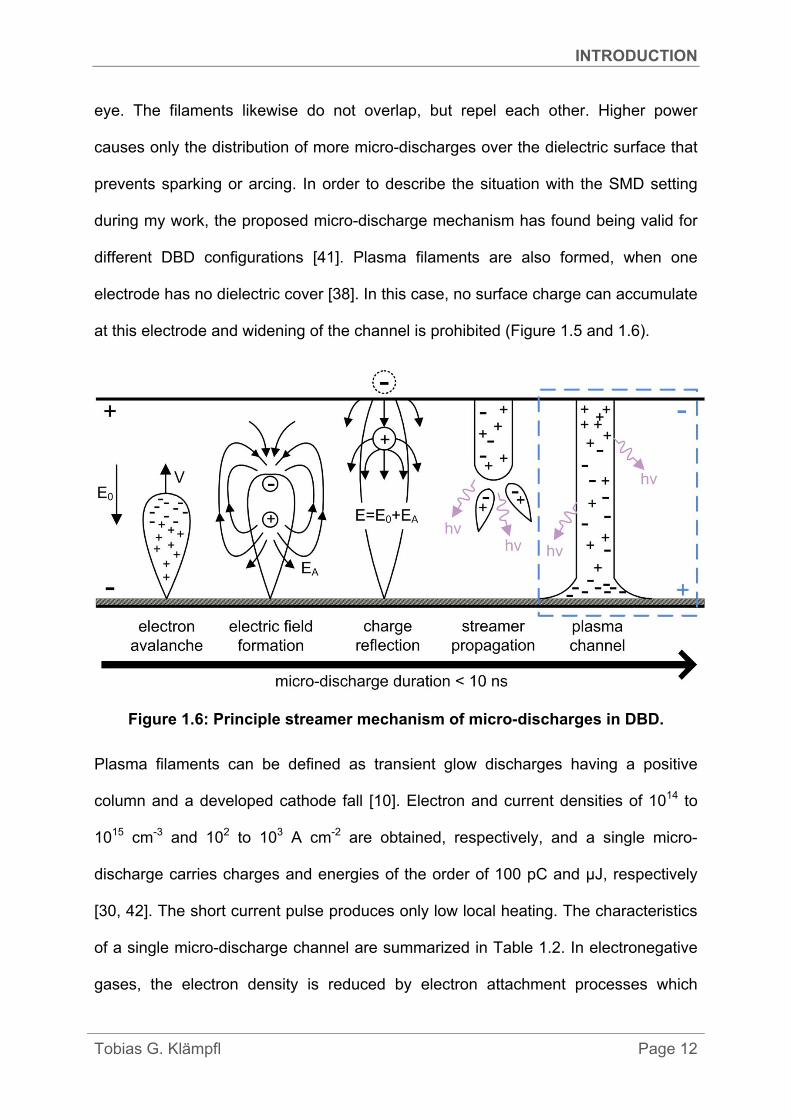
INTRODUCTION
Tobias G. Klämpfl Page 12
eye. The filaments likewise do not overlap, but repel each other. Higher power
causes only the distribution of more micro-discharges over the dielectric surface that
prevents sparking or arcing. In order to describe the situation with the SMD setting
during my work, the proposed micro-discharge mechanism has found being valid for
different DBD configurations [41]. Plasma filaments are also formed, when one
electrode has no dielectric cover [38]. In this case, no surface charge can accumulate
at this electrode and widening of the channel is prohibited (Figure 1.5 and 1.6).
Figure 1.6: Principle streamer mechanism of micro-discharges in DBD.
Plasma filaments can be defined as transient glow discharges having a positive
column and a developed cathode fall [10]. Electron and current densities of 1014 to
1015 cm-3 and 102 to 103 A cm-2 are obtained, respectively, and a single micro-
discharge carries charges and energies of the order of 100 pC and µJ, respectively
[30, 42]. The short current pulse produces only low local heating. The characteristics
of a single micro-discharge channel are summarized in Table 1.2. In electronegative
gases, the electron density is reduced by electron attachment processes which
INTRODUCTION
Tobias G. Klämpfl Page 13
create negative ions and cause filament radii being smaller than in other gases.
Subsequently, diffuse discharges are feasible more easily with gases like helium with
wide channels, where smoothening of the transverse field gradient can occur [10].
During my work, exclusively filamentous discharge occurred by using ambient air at
atmospheric pressure.
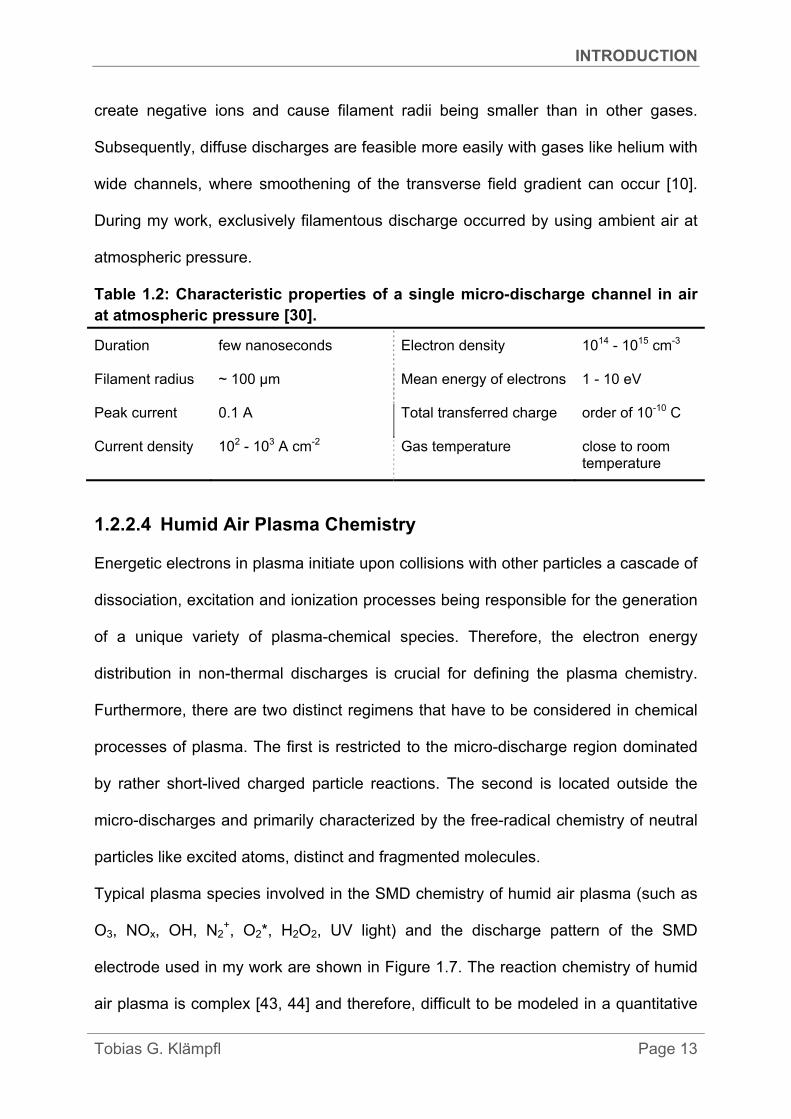
Table 1.2: Characteristic properties of a single micro-discharge channel in air at atmospheric pressure [30].
Duration few nanoseconds Electron density 1014 - 1015 cm-3
Filament radius ~ 100 µm Mean energy of electrons 1 - 10 eV
Peak current 0.1 A Total transferred charge order of 10-10 C
Current density 102 - 103 A cm-2 Gas temperature close to room temperature
1.2.2.4 Humid Air Plasma Chemistry
Energetic electrons in plasma initiate upon collisions with other particles a cascade of
dissociation, excitation and ionization processes being responsible for the generation
of a unique variety of plasma-chemical species. Therefore, the electron energy
distribution in non-thermal discharges is crucial for defining the plasma chemistry.
Furthermore, there are two distinct regimens that have to be considered in chemical
processes of plasma. The first is restricted to the micro-discharge region dominated
by rather short-lived charged particle reactions. The second is located outside the
micro-discharges and primarily characterized by the free-radical chemistry of neutral
particles like excited atoms, distinct and fragmented molecules.
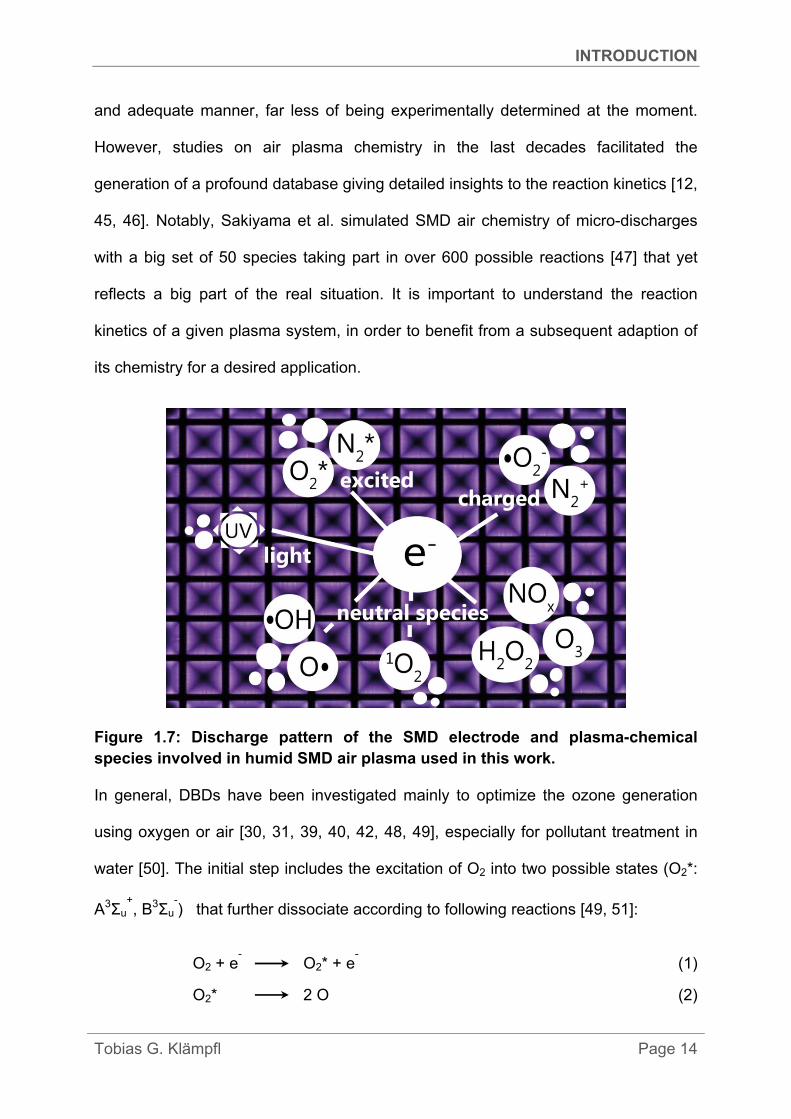
Typical plasma species involved in the SMD chemistry of humid air plasma (such as
O3, NOx, OH, N2+, O2*, H2O2, UV light) and the discharge pattern of the SMD
electrode used in my work are shown in Figure 1.7. The reaction chemistry of humid
air plasma is complex [43, 44] and therefore, difficult to be modeled in a quantitative
INTRODUCTION
Tobias G. Klämpfl Page 14
and adequate manner, far less of being experimentally determined at the moment.
However, studies on air plasma chemistry in the last decades facilitated the
generation of a profound database giving detailed insights to the reaction kinetics [12,
45, 46]. Notably, Sakiyama et al. simulated SMD air chemistry of micro-discharges
with a big set of 50 species taking part in over 600 possible reactions [47] that yet
reflects a big part of the real situation. It is important to understand the reaction
kinetics of a given plasma system, in order to benefit from a subsequent adaption of
its chemistry for a desired application.
Figure 1.7: Discharge pattern of the SMD electrode and plasma-chemical species involved in humid SMD air plasma used in this work.
In general, DBDs have been investigated mainly to optimize the ozone generation
using oxygen or air [30, 31, 39, 40, 42, 48, 49], especially for pollutant treatment in
water [50]. The initial step includes the excitation of O2 into two possible states (O2*:
A3Σu+, B3Σu
-) that further dissociate according to following reactions [49, 51]:
O2 + e- O2* + e
- (1)
O2* 2 O (2)

INTRODUCTION
Tobias G. Klämpfl Page 15
The resulting atomic O can be in the triplet state, O(3P), or in the singlet state, O(1D).
Only O(3P) is able to react readily with O2 (spin conservation rule) and a third
collision partner M (O2, O3, O or in air also N2) to form ozone:
O(3P) + O2 + M O3* + M O3 + M (3)
O3* is the transient excited state of ozone. Undesired side reactions compete with
ozone formation, since they also consume atomic O [10]:
O + O + M O2 + M (4)
O + O3 + M 2 O2 + M (5)
O + O3* + M 2 O2 + M (6)
Using air, a great variety of nitrogen species also interferes in the reaction pathways
of DBDs. In addition to ozone, many other oxidative species are generated [47, 52,
53]: NOx (x = 1-3), N2Oy (y = 1-5). In fact, nitrogen-based processes are responsible
for ca. 50% of total ozone produced due to the contribution of additional atomic O
[10]. However, NOx species can reach a certain concentration level, for instance due
to the application of excessive power, at which ozone formation is disfavored and
breaks down completely (discharge poisoning). In this situation, O atoms are
consumed more rapidly by NOx reactions instead of the ozone reaction (3). Whereas
NO, NO2 and N2O are accumulated, ozone is removed in an ozone destruction
process catalyzed by NO and NO2 [53]:
NO + O3 NO2* + O2 (7)
NO2* NO2 + hν (8)
2 NO + 3 O3 N2O5 + 3 O2 (9)
NO2 + O3 NO3 + O2 (10)
NO2* is an excited form of NO2.

INTRODUCTION
Tobias G. Klämpfl Page 16
In combination with water, which can be present in ambient air (relative humidity or
vapor) or as liquid, the complexity of the reaction system rises again. For instance,
water and the singlet O atom, O(1D), are converted to H2O2 which has a high
oxidative potential and is decomposed into reactive OH radicals [50]:
O(1D) + H2O H2O2* 2 OH (11)
In addition, OH radicals react with NOx to nitrous and nitric acids that are corrosive.
Reactions (1) to (11) present few examples, how reactive species are created and
interact with each other in humid air plasma.
Thus, it is likely that long-lasting SMD plasma species such as reactive oxygen
species (ROS: such as O3, OH, O, O2-) and nitrogen species (RNS: such as NO, N,
N2*, N2O) determine the effects on targets outside the micro-discharge region.
1.3 Plasma Medicine
The emerging field of plasma medicine has drawn a lot of attention to the research
society among physicists, biologist, engineers and physicians. Whereas thermal
atmospheric plasma sources have been utilized for cauterization and blood
coagulation for a long time, “cold” or tissue tolerable plasma has the advantage to
circumvent the risk of burns and serious tissue damage [29]. Previously, the use of
non-thermal plasma was restricted to vacuum applications with the sterilization of
medical devices and the surface modification of biomaterials involving etching,
cleaning, activation and thin film deposition. In 2002, Stoffels et al. have initiated the
new era of plasma with the investigation of CAP interacting with living cells and
tissues [54]. The development of non-thermal plasma sources at atmospheric
pressure has triggered the investigation of a whole new possible application range of
plasma in the medical field, which involves [55]:

INTRODUCTION
Tobias G. Klämpfl Page 17
Prevention and treatment of diseases:
Chronic wounds, skin and mucosal infectious diseases, localized tumors,
keloid formation, promotion of angiogenesis, tissue ablation, hemostasis
Inhibition of biofilm formation by active treatment and by material surface
treatment
Promotion of incorporation of implants into viable tissue by surface alterations
(biocompatibility, wetting, plasma steered application of antimicrobial active
layers with drug delivery function)
Improved diffusion of topically applied drugs with therapeutic outcome
(pharmacology)
Improvement of sanitation of medical devices by surface modification
The reasons for such wide range of applications are implicated beside the low heat
formation in the versatile technical realization and chemical properties of advancing
atmospheric pressure plasmas. Plasma provides a “chemical cocktail” that can be
tailored by alteration of the gas mixture, the power adjustments and the way of
treatment (direct with or indirect without ionic species) and accesses in a fast and
easy way confined spaces at the target site [56]. Hence, the mixture of reactive
species can act synergistically for instance to inactivate infectious microbial
pathogens and to promote cell/tissue healing processes at the same time. With CAP,
free radical species (O2-, H2O2, OH
-, NO, ONOO
-) can be produced that are also
employed by eukaryotic cells in the defense mechanism against invading bacteria
[57]. In addition, many biochemical processes in cells rely on ROS and RNS that are
part of CAP using air, which might enable the regulation of the respective cell
signaling by plasma [58]. Therefore, scientists try to design CAP according to

INTRODUCTION
Tobias G. Klämpfl Page 18
desirable cellular responses, in order to induce for instance sub-lethal effects like cell
detachment or apoptosis for healing, avoiding on the other hand lethal effects that
cause inevitable necrosis with unwanted scar formation [59].
One of the major tasks for researchers is to determine the “therapeutic window” of a
CAP source by tissue treatment. It is defined as the dosage range of plasma-derived
reactive species that already causes antimicrobial or in general therapeutic beneficial
effects but still is tolerated by healthy tissue without harming it. Such selectivity is
based on the distinct defense mechanisms of eukaryotic and prokaryotic cells, when
it comes to the interaction with reactive species. Eukaryotic cells possess greater
possibilities to defend reactive species and to repair oxidative damage to the DNA or
cell membrane than prokaryotic cells due to higher barriers (cytoskeleton, nucleus)
as well as extensive enzymatic catalysis and repair mechanisms. Similar selectivity
by CAP is proposed between healthy and cancer cells [60, 61]. Recently, SMD air
plasma sensitized chemo-resistant brain tumor cells in vitro for temezolomide
treatments [62] and induced senescence to melanoma cells [63]. Furthermore, CAP
has already demonstrated its promising properties especially in the field of
dermatology [64-66], by the first successful clinical trials in vivo on human chronic
wound disinfection with a MW driven argon plasma torch [67-69].
A more detailed overview of the present knowledge and research subjects in plasma
medicine is provided by recent publications [6, 70].
1.3.1 Nosocomial Infections
The European Center of Disease Control and Prevention (ECDC) reported that the
prevalence of patients with nosocomial infections in European acute care hospitals
reached 6% (3.2 million) in 2011-2012 [71] and solely 307,000 surgical site infections

INTRODUCTION
Tobias G. Klämpfl Page 19
were identified in European hospitals in 2008 [72]. In comparison, the American
counterpart, the Center for Disease Control and Prevention (CDC), reported
1.7 million nosocomial infections with 99,000 associated deaths in the USA back in
2002 [73, 74]. From an economic point of view, nosocomial infections are associated
with considerable costs for health care systems. They come along with an increased
duration of hospitalization [75], a possible need for isolation and increased use of
expensive alternative drugs for highly-resistant strains. It is estimated that infections
by antimicrobial drug-resistant microorganisms (MO) in general increase morbidity,
mortality and direct costs by approximately 30-100% [76, 77]. In the USA, the annual
costs for the medical treatment of nosocomial infections are estimated around $40
billion [78]. Prevention of such infections would substantially improve clinical care
quality for patients by decreasing morbidity, mortality and costs.
The concern about nosocomial infections is reflected by the substantial decline of the
antimicrobial susceptibility of pathogens. This includes methicillin-resistant
Staphylococcus aureus (MRSA), vancomycin-resistant Enterococcus (VRE),
Pseudomonas spp., Acinetobacter spp., Candida spp., as well as extended-spectrum
β-lactamase (ESBL) producing gram-negative bacteria such as invasive Escherichia
coli or Klebsiella spp. [71, 72].
Notably, Clostridium difficile has emerged as a leading nosocomial pathogen [79, 80],
which accounts for 48% of all healthcare-associated gastro-intestinal infections at the
moment, with increasing prevalence in Germany [71]. The symptoms range from mild
diarrhoea, fever to life-threatening pseudomembranous colitis. Use of antibiotics
destroys the patient´s intestinal flora and promotes overgrowth of naturally resistant
C. difficile, which used to be before a harmless concomitant inhabitant among many
other bacteria species in the intestine. In addition, the evolution of hyper toxic genetic

INTRODUCTION
Tobias G. Klämpfl Page 20
variants of C. difficile such as ribotype 027 that produce aggressive toxins [81, 82]
and a high recurrence rate of infections at about 20% worsen the situation [79]. C.
difficile bacteria are anaerobic. Depending on the surrounding condition, they are
able to change into a very endurable dormant form, called bacterial endospores. In
general, spores exist in a “sleeping mode”, their metabolism is down-regulated, they
are not motile and their structure is characterized by many dense physical barriers
with low water content in the inner core, where the DNA is protected by small acid-
soluble proteins (SASPs) [83]. In this fortress, spores are much more capable to
withstand environmental stress such as heat or oxidative stress than their vegetative
forms [84]. As soon as they reach conditions favorable for reproduction, spores
germinate again into their vegetative states. Therefore, particular clinical attention is
given to C. difficile. Its vegetative forms and spores are transmitted among patients
through the faecal-oral route, for example from contaminated surfaces or personnel
hands [85]. Many non-spore-forming nosocomial pathogens like VRE, MRSA or
Acinetobacter spp. persist on dry inanimate surfaces for several days or even months
[86]. Contamination by C. difficile endospores that are highly resistant against
standard surface disinfectants worsens the situation [83, 87]. Moreover, insufficient
sanitation per se or the use of inadequate cleaning agents is likely to lead to further
sporulation and spread of C. difficile [88].
Therefore, proper decontamination including disinfection of environmental surfaces
and hands of healthcare staff as well as sterilization of medical devices is important
to minimize the risk of the transmission of nosocomial pathogens [89-91]. At the
moment, no disinfection agent listed by the US Environmental Protection Agency is
specific for the environmental control of C. difficile spores [92]. Hypochlorite based
disinfectants are recommended [93], but their effectiveness and secure handling are

INTRODUCTION
Tobias G. Klämpfl Page 21
questionable [87]. In case of sterilizing agents, wet/dry heat, irradiation, chemical gas
and H2O2 gas plasma are the conventional methods for the sterilization of devices in
medicine or hygiene. However, all of these methods have several drawbacks that
limit their application. The material properties of sensitive devices including polymeric
biomaterials can be negatively altered such as in molecular weight, volume and
morphology [94-97]. These alterations may influence the physical and biological
performance of the medical device [96] and may be responsible for material failure
[97]. Some sterilization methods require 120 °C operating temperature that can lead
to the degradation of thermo-labile medical devices. Other limitations are the need of
vacuum chambers in common plasma sterilization methods [98] or the use of toxic
gases like formaldehyde or ethylene oxide [98-100]. As for any strong disinfectant
with alkylating or oxidizing behavior, regular handling is a big issue due to its
hazardous entity, unpleasant odor or material corrosive property. To circumvent this
problem, alternative decontaminants complementary to manual cleaning are
investigated [101].
1.3.2 CAP in microbial decontamination
CAP sources have originally been investigated due to their properties of variable
plasma chemistry and geometry, of enabling low temperature application and of their
great potential to inactivate bacteria and other resistant MO. In 1996, Laroussi
introduced for the first time a CAP device specific for sterilization purposes [102].
Since then, many studies followed to demonstrate germicidal properties of different
CAP sources, mainly corona discharges, DBDs, APPJs and more rarely thermal MW
plasmas [103]. Each technology has its advantages and drawbacks: Corona

INTRODUCTION
Tobias G. Klämpfl Page 22
discharges are well suited to induce plasma species into liquids, APPJs are applied
for the treatment of small localized areas and DBDs for treatments over a wide area.
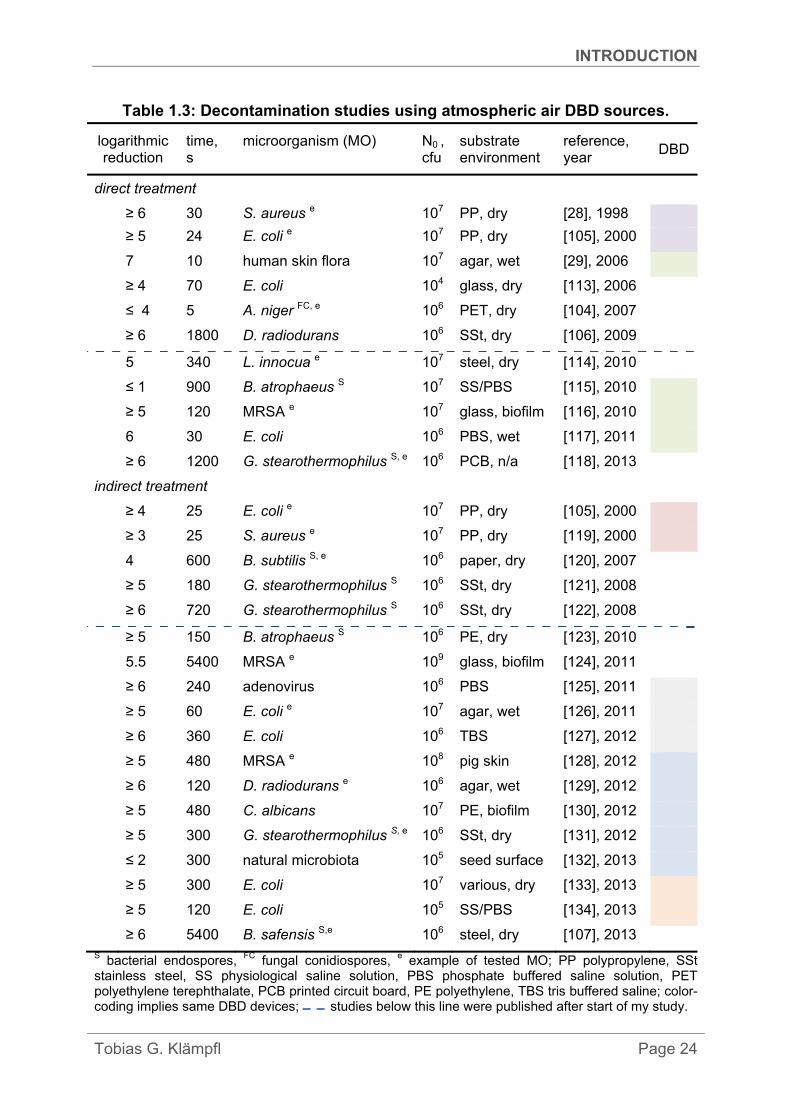
Table 1.3 summarizes the recent studies conducted only with DBD plasma devices
relevant for my work, using air at atmospheric pressure in direct treatment (with
discharge contact) or indirect treatment (remote) mode. Direct treatment may
damage sensitive materials due to the impact of charged particles, whereas it usually
results in faster inactivation compared to remote mode. Notably, the majority of these
studies were carried out after the conception and initiation of my project. Some
parameters differed depending on the study goal: type of MO (vegetative bacteria,
bacterial endospores, yeast, fungal spores, virus) and the treatment environment
(dry, wet, biofilm, liquid, living tissue). Muranyi et al. showed that their cascaded DBD
system could inactivate efficiently various MO with additional application of strong UV
light from an excimer lamp [104]. Gadri et al. provide the most extensive study on
both direct and indirect treatment with one atmosphere uniform glow discharge
plasma (OAUGDP) in terms of the range of different exposed MO [105]. They have
suggested the operation of such plasma devices not only in the medical/healthcare
field, but also for food processing, other general industrial and commercial use as
well as biological warfare defense. Moreover, equipment for space missions involves
sensitive electronics/materials and conventional sterilization with dry heat would
cause damages, therefore alternative DBD air decontamination became interesting
for the planetary protection against terrestrial microorganisms [106, 107]. Ambient air
is present everywhere, which makes it very attractive for plasma decontamination
purposes.
For a decontamination study, it is crucial to utilize the right terminology (Table 1.4), in
order to avoid misunderstanding. For instance, the term sterility describes a state of
INTRODUCTION
Tobias G. Klämpfl Page 23
being free of any viable MO, but is sometimes misused. Therefore, different tiers of
sterility assurance levels (SAL) have been suggested for the validation of plasma
sterilization [108]: pharmaceutical (SAL = 10-6), high-level (10-4) and low-level
sterilization (10-3). In addition, the decimal reduction value (D-value) is commonly
determined to indicate the antimicrobial efficiency for comparison reasons.
Furthermore, it is also important for a decontamination study to fulfill approved
standards for testing the decontaminating behavior of an agent. This involves the use
of appropriate biological indicators, often non-pathogenic bacterial endospores, which
serve as surrogates and have shown a level of resistance against a given sterilization
process (Table 1.5). However, validation standards for disinfection methods in human
medicine frequently prefer vegetative bacteria and other MO relevant in clinical
environments [91, 109]. Endospores of C. difficile have not been considered yet in
standard testing despite their rising significance. Therefore and due to the fact that
cultivation is sophisticated and long-lasting [110], C. difficile spores have been
subject in only one CAP (APPJ) study until now [111].
Unlike other gaseous or airborne decontaminants, DBD/SMD air plasma consists of a
mixture of reactive species such as O3, H2O2, UV light and many others [47], which
can act synergistically and be tailored for the possible prevention of infections [112].
Therefore, I investigated SMD air plasma as a promising candidate for the microbial
control in public health and hospital care.
INTRODUCTION
Tobias G. Klämpfl Page 24
Table 1.3: Decontamination studies using atmospheric air DBD sources.
logarithmic reduction
time, s
microorganism (MO) N0 ,
cfu substrate environment
reference, year
DBD
direct treatment
≥ 6 30 S. aureus e 107 PP, dry [28], 1998
≥ 5 24 E. coli e 107 PP, dry [105], 2000
7 10 human skin flora 107 agar, wet [29], 2006
≥ 4 70 E. coli 104 glass, dry [113], 2006
≤ 4 5 A. niger FC, e 106 PET, dry [104], 2007
≥ 6 1800 D. radiodurans 106 SSt, dry [106], 2009
5 340 L. innocua e 107 steel, dry [114], 2010
≤ 1 900 B. atrophaeus S 107 SS/PBS [115], 2010
≥ 5 120 MRSA e 107 glass, biofilm [116], 2010
6 30 E. coli 106 PBS, wet [117], 2011
≥ 6 1200 G. stearothermophilus S, e 106 PCB, n/a [118], 2013
indirect treatment
≥ 4 25 E. coli e 107 PP, dry [105], 2000
≥ 3 25 S. aureus e 107 PP, dry [119], 2000
4 600 B. subtilis S, e 106 paper, dry [120], 2007
≥ 5 180 G. stearothermophilus S 106 SSt, dry [121], 2008
≥ 6 720 G. stearothermophilus S 106 SSt, dry [122], 2008
≥ 5 150 B. atrophaeus S 106 PE, dry [123], 2010
5.5 5400 MRSA e 109 glass, biofilm [124], 2011
≥ 6 240 adenovirus 106 PBS [125], 2011
≥ 5 60 E. coli e 107 agar, wet [126], 2011
≥ 6 360 E. coli 106 TBS [127], 2012
≥ 5 480 MRSA e 108 pig skin [128], 2012
≥ 6 120 D. radiodurans e 106 agar, wet [129], 2012
≥ 5 480 C. albicans 107 PE, biofilm [130], 2012
≥ 5 300 G. stearothermophilus S, e 106 SSt, dry [131], 2012
≤ 2 300 natural microbiota 105 seed surface [132], 2013
≥ 5 300 E. coli 107 various, dry [133], 2013
≥ 5 120 E. coli 105 SS/PBS [134], 2013
≥ 6 5400 B. safensis S,e 106 steel, dry [107], 2013 S bacterial endospores, FC fungal conidiospores, e example of tested MO; PP polypropylene, SSt stainless steel, SS physiological saline solution, PBS phosphate buffered saline solution, PET polyethylene terephthalate, PCB printed circuit board, PE polyethylene, TBS tris buffered saline; color-coding implies same DBD devices; studies below this line were published after start of my study.

INTRODUCTION
Tobias G. Klämpfl Page 25
Table 1.4: Definitions of commonly used terms associated with microbial control processes (adapted from [103]).
Term Definition
microorganism any microbiological entity, cellular or non-cellular, capable of replication or of transferring genetic material
biological decontamination removal or neutralization of contaminating microbial substance antimicrobial tending to destroy microbes, prevent their development or
inhibit their pathogenic action
inactivation loss of ability of MO to grow and/or multiply
sterility state of being free from viable MO
asepsis activities that lead to a state of being free of living pathogenic MO
antisepsis destruction of pathogenic organisms on living tissue to prevent infection
sterilization validated process used to render a product free from viable MO
SAL probability of a single viable MO occurring on an item after sterilization (= ineffective sterilization)
D-value decimal reduction time required to reduce viable MO by 90%
disinfection process that eliminates many or all pathogenic MO except bacterial spores on inanimate objects
cleaning removal of contamination from an item to the extent necessary for further processing or for intended use
Table 1.5: Selection of microbial test indicators for sterilization (adapted from [103]).
agent specification MO form
heat dry G. stearothermophilus endospore
wet B. atrophaeus “
radiation UV B. pumilus “
γ B. pumilus “
D. radiodurans vegetative
gas C2H4Oa B. atrophaeus endospore
CH2Ob G. stearothermophilus “
H2O2 G. stearothermophilus “
a ethylene oxide b formaldehyde

INTRODUCTION
Tobias G. Klämpfl Page 26
1.4 Aim and research objectives of my doctoral work
The project during my PhD involved four parts: First, I focused on developing a CAP
device with an electrode system based on the SMD technology, which allowed
homogenous filamentary discharge in ambient air at atmospheric pressure. Second, I
aimed to characterize the discharge´s physical and chemical properties, using
appropriate plasma diagnostic tools. Third, I validated the sterilizing and disinfecting
action of the SMD air plasma according to European norm standard testing methods
[135, 136]. This included the use and indirect treatment of biological indicators
consisting of environmentally resistant vegetative bacteria (e.g. E. faecium) and
bacterial endospores (e.g. nosocomial relevant Clostridium difficile) immobilized
preferentially on dry inanimate carriers. Fourth, I assessed the surface conditions of
the carriers and the microbial surface morphology by scanning electron microscopy
(SEM) imaging, in order to identify factors influencing the efficiency of inactivation by
plasma and to observe putative plasma effects on treated bacteria, respectively.
Other influencing factors were subsequently identified and investigated.
The results give insights into the mechanism of bacterial inactivation by SMD air
plasma and demonstrate its general potency as a prospective air-based
decontaminant in clinical and other healthcare facilities compared to conventional
methods. The vision of this study was to improve patients´ care and prevent the
outbreak and spread of devastating nosocomial infections by a supportive CAP
decontamination system in the future.
MATERIALS and METHODS
Tobias G. Klämpfl Page 27
2 MATERIALS and METHODS
2.1 SMD plasma device development - FlatPlaSter 2.0
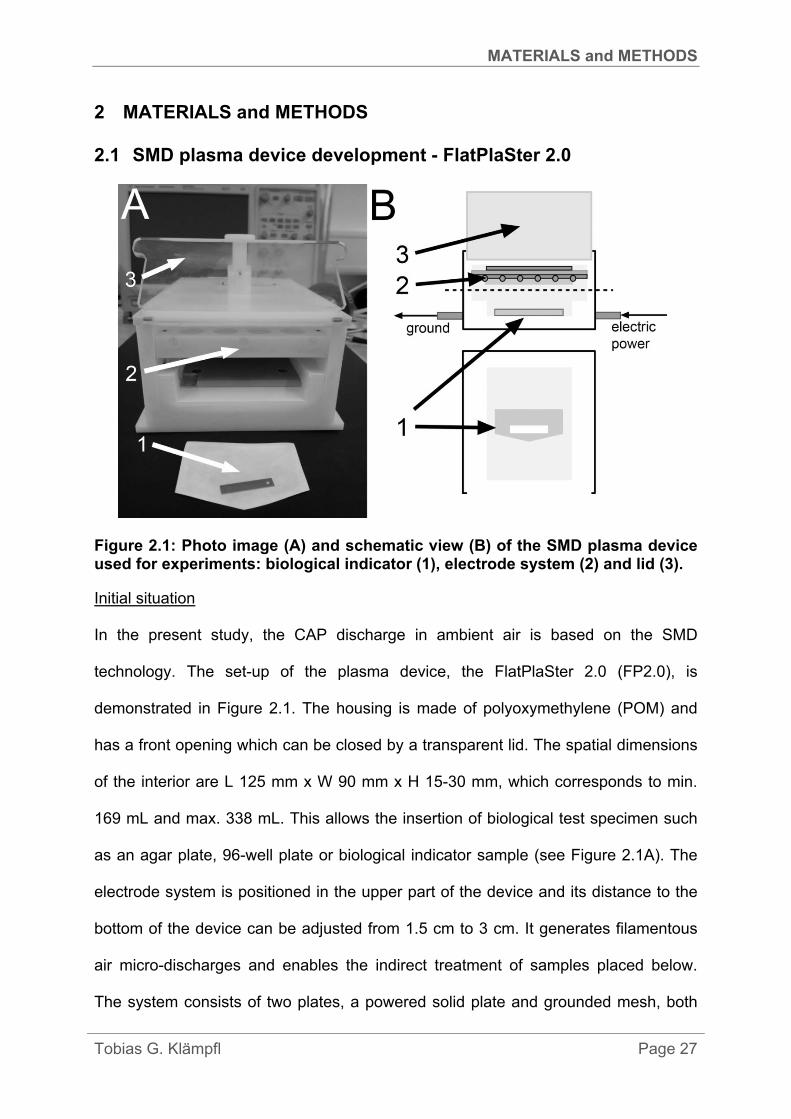
Figure 2.1: Photo image (A) and schematic view (B) of the SMD plasma device used for experiments: biological indicator (1), electrode system (2) and lid (3).
Initial situation
In the present study, the CAP discharge in ambient air is based on the SMD
technology. The set-up of the plasma device, the FlatPlaSter 2.0 (FP2.0), is
demonstrated in Figure 2.1. The housing is made of polyoxymethylene (POM) and
has a front opening which can be closed by a transparent lid. The spatial dimensions
of the interior are L 125 mm x W 90 mm x H 15-30 mm, which corresponds to min.
169 mL and max. 338 mL. This allows the insertion of biological test specimen such
as an agar plate, 96-well plate or biological indicator sample (see Figure 2.1A). The
electrode system is positioned in the upper part of the device and its distance to the
bottom of the device can be adjusted from 1.5 cm to 3 cm. It generates filamentous
air micro-discharges and enables the indirect treatment of samples placed below.
The system consists of two plates, a powered solid plate and grounded mesh, both

MATERIALS and METHODS
Tobias G. Klämpfl Page 28
separated by a dielectric layer. Application of electric power provided by an RF
function generator (HM8150, HAMEG Instruments, Germany or 8202, Voltcraft,
Germany) and an high voltage amplifier (PM 04015 or 10/10B-HS, TREK, USA) is
sufficient to create micro-discharges between the dielectric surface and the grounded
mesh. The general setting for plasma experiments is completed by an oscilloscope
for monitoring the voltage and the current flux, by a current probe and by a filter
pump system to remove extensive ozone (Figure 2.2). Sinusoidal wave frequency
was employed throughout the whole study. The typical voltage and current
measurement with an oscilloscope describes sinusoidal wave forms (Figure 2.3).
From a certain high voltage micro-discharge formation is observable by the
continuous creation and extinguishment cycle of a series of high current signals. The
voltage is measured in kVpp and the current in mA.
Figure 2.2: General setting for plasma experiments.
RF function generator (sinusoidal wave)
amplifier (high voltage)
oscilloscope
SMD device (FlatPlaSter 2.0)
pump with ozone filter
current probe

MATERIALS and METHODS
Tobias G. Klämpfl Page 29
Figure 2.3: Typical measurement of the applied voltage U(t) and current I(t) shape of the filamentary discharge in air.
SMD electrode development procedure
At first, the electrode system had to be developed. This involved the selection of an
appropriate grounded mesh electrode in regards of following criteria: assurance of
homogenous discharge pattern over the whole surface, high bactericidal effect and
robustness against corrosion. Initial tests with a flexible welding grid (stainless steel,
0.5 mm thick, 4.5 mm mesh size; from in-house workshop) demonstrated that its
structure was too unstable for the area size that had to be spanned (145 × 109 mm2),
since the grid was locally not in touch with the dielectric layer and subsequently
inhomogeneous discharge was obtained (Figure 2.4).
Figure 2.4: Inhomogeneous discharge pattern with welding grid.

MATERIALS and METHODS
Tobias G. Klämpfl Page 30
Therefore, the metal material (steel, stainless steel, alumina, alumina anodized),
mesh structure (square, round, hexagonal), mesh size and thickness were altered
and tested (examples in Figure 2.5). For this experiment, a solid copper plate was
chosen as the powered electrode with a smaller area size (L 126 mm x W 89 mm x T
3 mm) than the grounded electrode, in order to avoid sparking at the edges of the
electrode system. Notably, the discharge area is defined by the size of the powered
plate. It was placed in a frame (POM, 3 mm thick) to match with the dielectric (POM,
0.5 mm thick; from Goodfellow) and with the grounded electrode size. The frequency
(2 kHz, 6 kHz) and the voltage (7 kVpp, 9 kVpp at 2 kHz; varying voltages at 6 kHz)
were changed. The resulting discharge pattern was imaged with a Canon EOS 450D,
Macro lens EF-S 60 mm.
Figure 2.5: Examples of different mesh grids tested (purchased from Mevaco)

MATERIALS and METHODS
Tobias G. Klämpfl Page 31
In order to evaluate the bactericidal efficacy, colonies from an overnight secondary
culture of E. coli DSM 1116 (from German Collection of Microorganisms and Cell
Cultures (DSMZ)) were suspended in 5 mL PBS and adjusted to a McFarland density
of 0.5 (2 × 10⁸ CFU/mL) followed by a dilution series (undiluted suspension, 10-2,
10-4, 10-5) to determine negative controls. Müller-Hinton (MH) agar plates (Oxoid
Deutschland GmbH) were inoculated with 100 µL of the undiluted suspension or the
control dilutions (10-4, 10-5) and dried for 30 min at room temperature. Agar plate
samples were placed one by one centered into the plasma device, the lid was closed
and the sample was treated (t = 5 s, 10 s, 15 s or 30 s) at power settings mentioned
before. The distance from the micro-discharges to the agar surface was 0.8 mm.
After the treatment, the sample was removed and the device was evacuated from
ozone and other long-living species with the filter pump for 30s prior to the next
treatment, in order to create the same initial condition. The treated agar plates and
negative controls were incubated at 35 °C ± 2 °C overnight. The resulting growth of
E. coli colonies was imaged with the Canon camera and evaluated visually in a
qualitative way.
Furthermore, each material of the electrode system was viewed for changes such as
corrosive damage after treatments and documented with the Canon camera. The
dielectric stability was proven against breakdown. The available power setting range
was identified.

MATERIALS and METHODS
Tobias G. Klämpfl Page 32
2.2 Plasma diagnostics
2.2.1 Optical emission spectroscopy
Figure 2.6: Experimental set-up for OES measurements.
In order to identify SMD air plasma species and also the character of emitted UV
light, qualitative measurements were conducted by optical emission spectroscopy
(OES). For this purpose, the electrode system was dismounted from the FP2.0
device and aligned accordingly for the measurement setting (Figure 2.6). The
spectral emission lines were detected by a UV/VIS minispectrometer (C10082CA;
Hamamatsu, Japan). Therefore, a collimating lens (74-UV, 200 - 2000 nm, Ocean
Optics, USA) was placed orthogonally to the electrode surface in 2 cm distance. The
photons emitted by the plasma were transmitted through fiber optics (UV/SR-VIS
High OH content, 200 - 1100 nm, Ocean Optics, USA) to the spectrometer,
separated into spectral elements and the spectra was detected by a CCD camera
from 200 - 800 nm (Table 2.1). The measurement control was done with the software
SOLIS (Andor, UK) in the scope mode. The integration time was set to 10 s, in order
to achieve maximum 90 % of the maximum intensity scale at the highest electric
SMD electrode
collimating lens
optical fiber
OES detector
MATERIALS and METHODS
Tobias G. Klämpfl Page 33
power measured. The spectra were saved which did not change significantly after a
certain time (ca. 60 s). In addition, background spectra were measured without
plasma discharge for basic intensity adjustment. All measurements were conducted
in the dark. Resulting spectral resolution was 0.3 nm.
Spectra of SMD discharges were obtained varying the frequency (1 kHz, 6 kHz) and
the voltage (8.5 kVpp, 10 kVpp). Measured spectral lines were identified with the use
of a comprehensive library of molecular spectra [137].
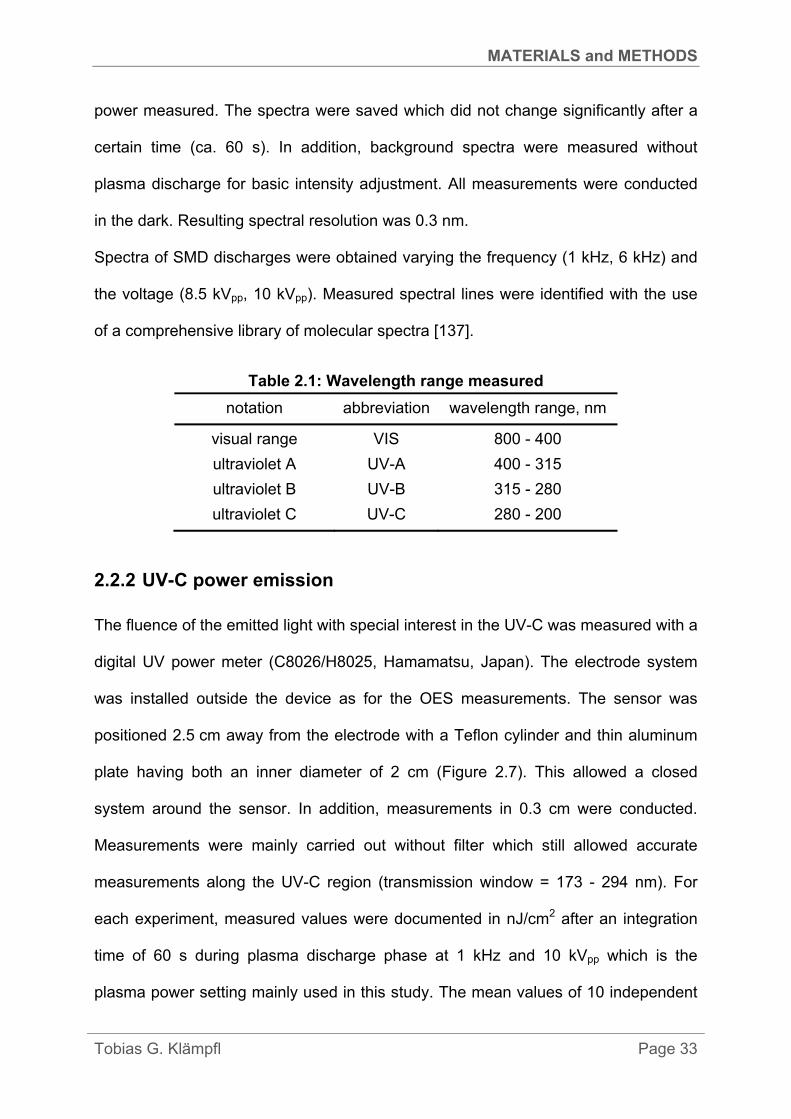
Table 2.1: Wavelength range measured
notation abbreviation wavelength range, nm
visual range VIS 800 - 400
ultraviolet A UV-A 400 - 315
ultraviolet B UV-B 315 - 280
ultraviolet C UV-C 280 - 200
2.2.2 UV-C power emission
The fluence of the emitted light with special interest in the UV-C was measured with a
digital UV power meter (C8026/H8025, Hamamatsu, Japan). The electrode system
was installed outside the device as for the OES measurements. The sensor was
positioned 2.5 cm away from the electrode with a Teflon cylinder and thin aluminum
plate having both an inner diameter of 2 cm (Figure 2.7). This allowed a closed
system around the sensor. In addition, measurements in 0.3 cm were conducted.
Measurements were mainly carried out without filter which still allowed accurate
measurements along the UV-C region (transmission window = 173 - 294 nm). For
each experiment, measured values were documented in nJ/cm2 after an integration
time of 60 s during plasma discharge phase at 1 kHz and 10 kVpp which is the
plasma power setting mainly used in this study. The mean values of 10 independent

MATERIALS and METHODS
Tobias G. Klämpfl Page 34
measurements was determined and reproduced. The results are expressed as power
density in nW/cm2.
Figure 2.7: UV power measurement set-up.
2.2.3 Temperature profile
The air temperature inside the closed FP2.0 was measured with a digital multimeter
(GTH 125, PeakTech, Germany). Therefore, one of the central holes at the sides of
the housing was used. All holes were normally sealed by lamella rubber plugs made
of ozone resistant rubber (ethylene propylene diene monomer, Smartplug,
Gummivogt, Germany). The temperature sensor was inserted through a little hole
drilled in one of the plugs that still assures a sealed condition. The temperature
profile was measured three times á 5 min at 0.5 kHz, 3 kHz and 6 kHz during plasma
discharge. At 1 kHz, 3 measurements were conducted á 10 min. The voltage was set
constant at 10 kVpp. The actual temperature value was documented with one decimal
accuracy every 15 s. The air in the chamber was evacuated with a pump after each
measurement, in order to return to the initial temperature (ca. 22 °C). The electrode
system was positioned 1.5 cm away from the bottom plate. Average values and the
standard error were calculated.
SMD electrode
sensor opening
2.5 cm
MATERIALS and METHODS
Tobias G. Klämpfl Page 35
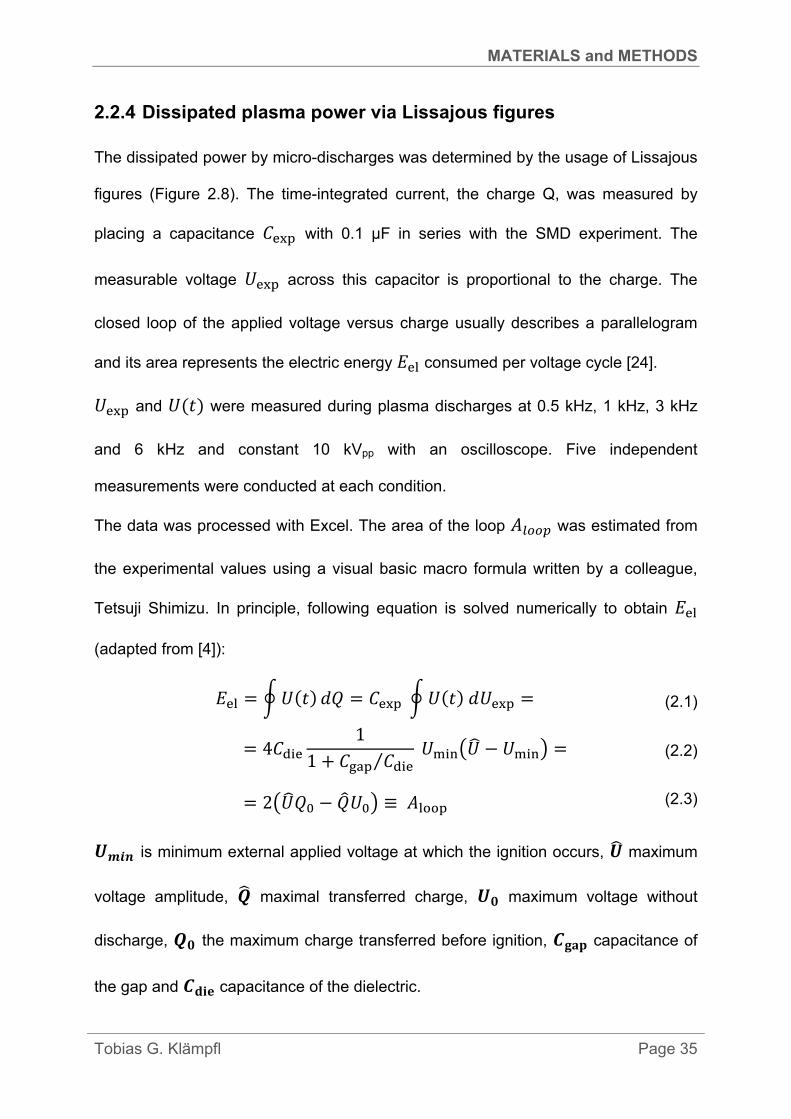
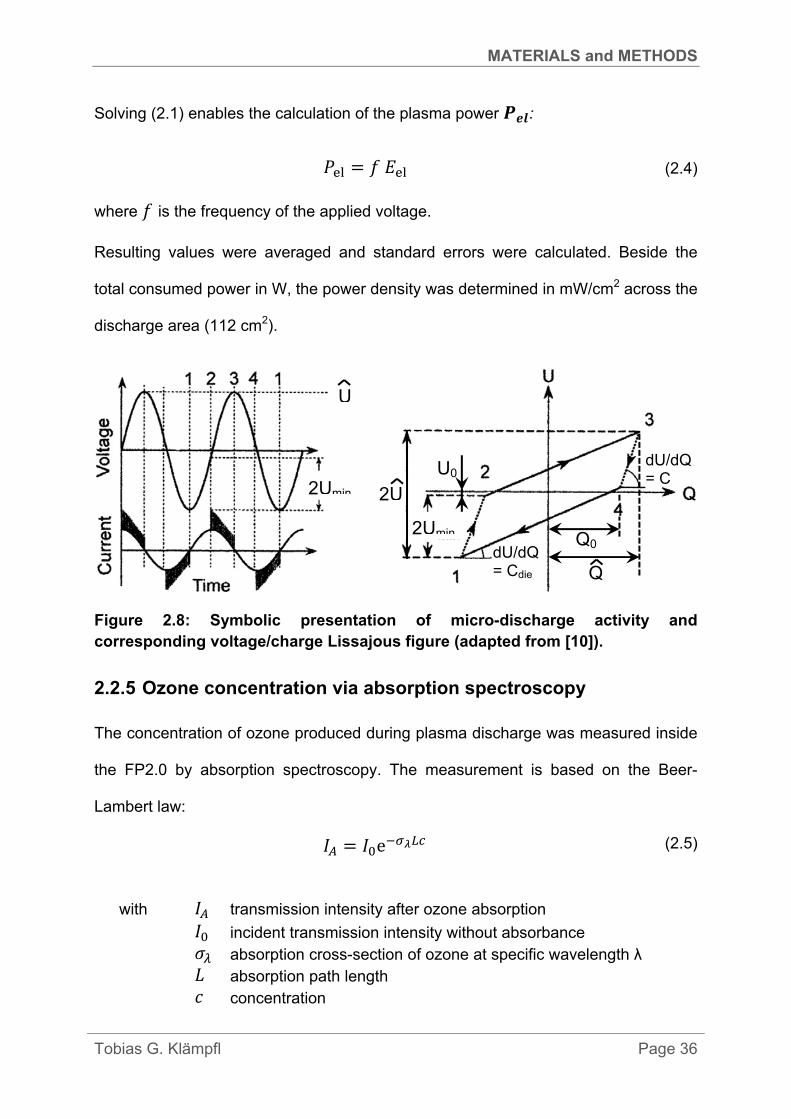
2.2.4 Dissipated plasma power via Lissajous figures
The dissipated power by micro-discharges was determined by the usage of Lissajous
figures (Figure 2.8). The time-integrated current, the charge Q, was measured by
placing a capacitance with 0.1 µF in series with the SMD experiment. The
measurable voltage across this capacitor is proportional to the charge. The
closed loop of the applied voltage versus charge usually describes a parallelogram
and its area represents the electric energy consumed per voltage cycle [24].
and were measured during plasma discharges at 0.5 kHz, 1 kHz, 3 kHz
and 6 kHz and constant 10 kVpp with an oscilloscope. Five independent
measurements were conducted at each condition.
The data was processed with Excel. The area of the loop was estimated from
the experimental values using a visual basic macro formula written by a colleague,
Tetsuji Shimizu. In principle, following equation is solved numerically to obtain
(adapted from [4]):
(2.1)
4
11 ⁄
(2.2)
2 ≡ (2.3)
is minimum external applied voltage at which the ignition occurs, maximum
voltage amplitude, maximal transferred charge, maximum voltage without
discharge, the maximum charge transferred before ignition, capacitance of
the gap and capacitance of the dielectric.
MATERIALS and METHODS
Tobias G. Klämpfl Page 36
Solving (2.1) enables the calculation of the plasma power :
(2.4)
where is the frequency of the applied voltage.
Resulting values were averaged and standard errors were calculated. Beside the
total consumed power in W, the power density was determined in mW/cm2 across the
discharge area (112 cm2).
Figure 2.8: Symbolic presentation of micro-discharge activity and corresponding voltage/charge Lissajous figure (adapted from [10]).
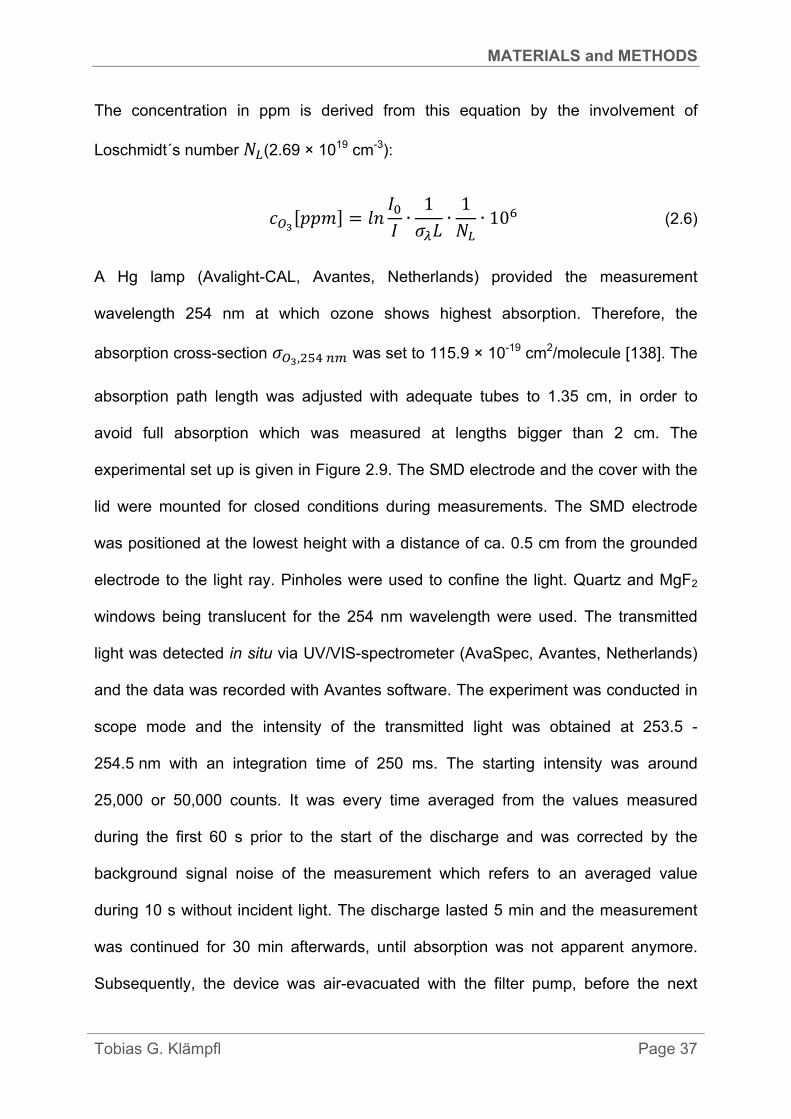
2.2.5 Ozone concentration via absorption spectroscopy
The concentration of ozone produced during plasma discharge was measured inside
the FP2.0 by absorption spectroscopy. The measurement is based on the Beer-
Lambert law:
e (2.5)
with transmission intensity after ozone absorption incident transmission intensity without absorbance absorption cross-section of ozone at specific wavelength λ absorption path length concentration
Q
U0
Q0
2U
U
2Umin
2Umin
dU/dQ = C
dU/dQ = Cdie
MATERIALS and METHODS
Tobias G. Klämpfl Page 37
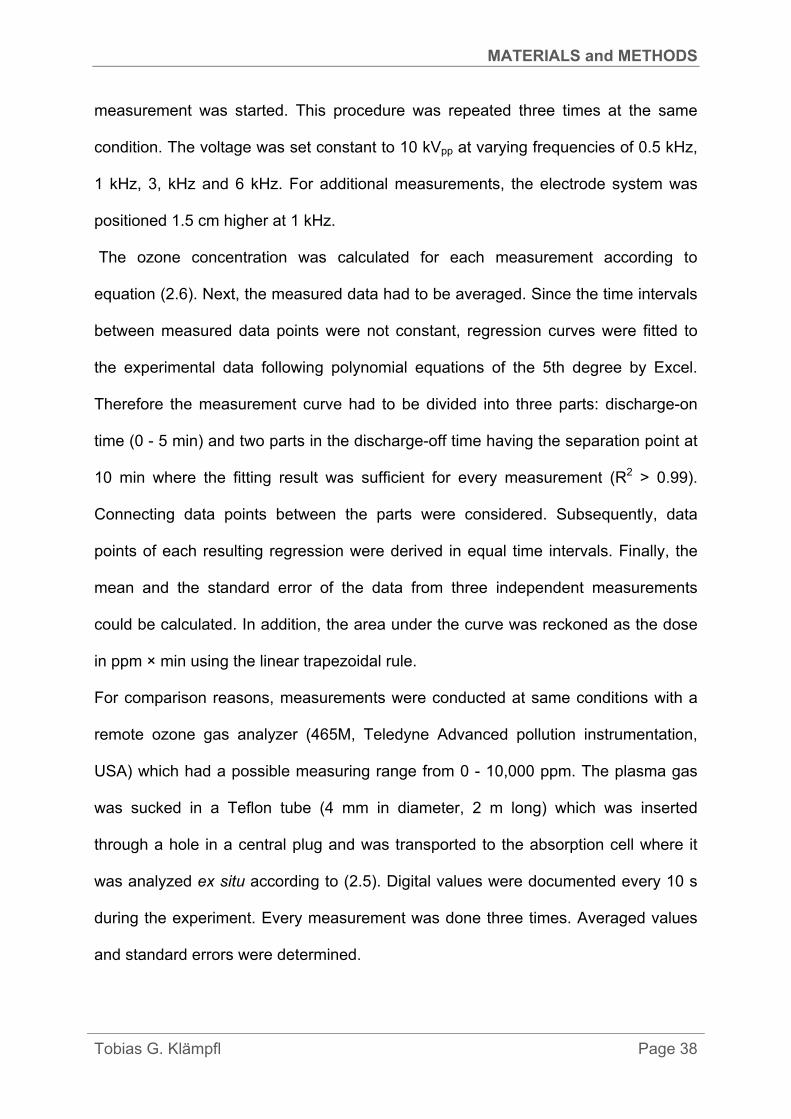
The concentration in ppm is derived from this equation by the involvement of
Loschmidt´s number (2.69 × 1019 cm-3):
∙1
∙1∙ 10 (2.6)
A Hg lamp (Avalight-CAL, Avantes, Netherlands) provided the measurement
wavelength 254 nm at which ozone shows highest absorption. Therefore, the
absorption cross-section , was set to 115.9 × 10⁻¹⁹ cm2/molecule [138]. The
absorption path length was adjusted with adequate tubes to 1.35 cm, in order to
avoid full absorption which was measured at lengths bigger than 2 cm. The
experimental set up is given in Figure 2.9. The SMD electrode and the cover with the
lid were mounted for closed conditions during measurements. The SMD electrode
was positioned at the lowest height with a distance of ca. 0.5 cm from the grounded
electrode to the light ray. Pinholes were used to confine the light. Quartz and MgF2
windows being translucent for the 254 nm wavelength were used. The transmitted
light was detected in situ via UV/VIS-spectrometer (AvaSpec, Avantes, Netherlands)
and the data was recorded with Avantes software. The experiment was conducted in
scope mode and the intensity of the transmitted light was obtained at 253.5 -
254.5 nm with an integration time of 250 ms. The starting intensity was around
25,000 or 50,000 counts. It was every time averaged from the values measured
during the first 60 s prior to the start of the discharge and was corrected by the
background signal noise of the measurement which refers to an averaged value
during 10 s without incident light. The discharge lasted 5 min and the measurement
was continued for 30 min afterwards, until absorption was not apparent anymore.
Subsequently, the device was air-evacuated with the filter pump, before the next
MATERIALS and METHODS
Tobias G. Klämpfl Page 38
measurement was started. This procedure was repeated three times at the same
condition. The voltage was set constant to 10 kVpp at varying frequencies of 0.5 kHz,
1 kHz, 3, kHz and 6 kHz. For additional measurements, the electrode system was
positioned 1.5 cm higher at 1 kHz.
The ozone concentration was calculated for each measurement according to
equation (2.6). Next, the measured data had to be averaged. Since the time intervals
between measured data points were not constant, regression curves were fitted to
the experimental data following polynomial equations of the 5th degree by Excel.
Therefore the measurement curve had to be divided into three parts: discharge-on
time (0 - 5 min) and two parts in the discharge-off time having the separation point at
10 min where the fitting result was sufficient for every measurement (R2 > 0.99).
Connecting data points between the parts were considered. Subsequently, data
points of each resulting regression were derived in equal time intervals. Finally, the
mean and the standard error of the data from three independent measurements
could be calculated. In addition, the area under the curve was reckoned as the dose
in ppm × min using the linear trapezoidal rule.
For comparison reasons, measurements were conducted at same conditions with a
remote ozone gas analyzer (465M, Teledyne Advanced pollution instrumentation,
USA) which had a possible measuring range from 0 - 10,000 ppm. The plasma gas
was sucked in a Teflon tube (4 mm in diameter, 2 m long) which was inserted
through a hole in a central plug and was transported to the absorption cell where it
was analyzed ex situ according to (2.5). Digital values were documented every 10 s
during the experiment. Every measurement was done three times. Averaged values
and standard errors were determined.

MATERIALS and METHODS
Tobias G. Klämpfl Page 39
Figure 2.9: Experimental set-up for the determination of the ozone concentration via absorption spectroscopy.
2.3 Quantitative Methods assessing plasma decontamination
2.3.1 Testing the bactericidal effect using agar plates
This SMD plasma experiments were conducted with the vegetative bacteria E. coli
ATCC 9637, Enterococcus mundtii ATCC 43186 and Pseudomonas aeruginosa
ATCC 9027 on agar plates. Preparation of the inoculated agar plates, the treatment
procedure and the incubation after plasma treatment follows the protocol described in
section 2.1. Agar plates were treated for 15 s up to 5 min. Every treatment was
performed three times at the same condition and the experiment was reproduced one
time.
After incubation, the colony forming units (cfu) of surviving bacteria were counted.
Results are shown as logarithmic cfu reduction curves in dependence of the
treatment time. Log corresponds to log10. The log reduction was calculated from:
Hg lamp λ = 254 nm
pinhole pinhole
UV spectrometer
L = 1.35 cm
I0 I
quartz window
MgF2 windows

MATERIALS and METHODS
Tobias G. Klämpfl Page 40
log log log (2.4)
NR is the number of reduced bacteria, N0 is the number of initial population and NS is
the number of surviving bacteria of a given strain in cfu after plasma treatment. If no
colony growth was found, complete inactivation was achieved. The values were
averaged and the standard errors were determined from both independent
experiments.
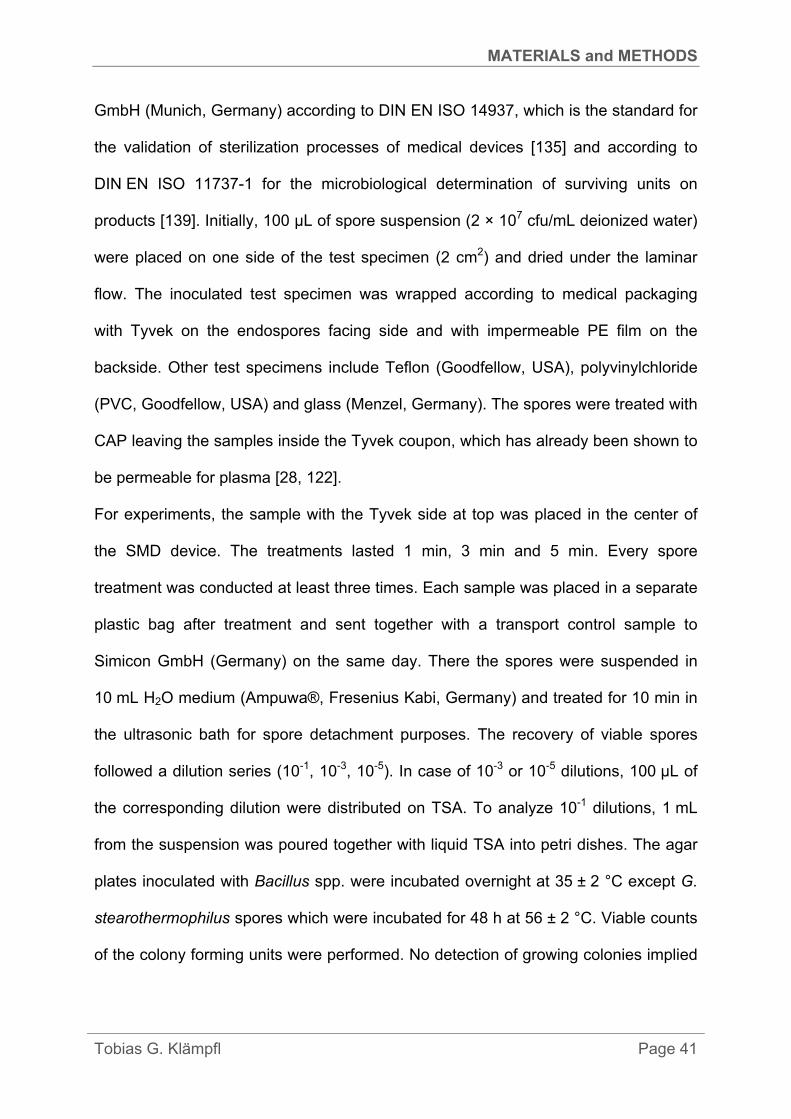
2.3.2 Sterilization testing using dry inanimate carriers
The efficacy of SMD plasma against bacterial endospores which are commonly used
as standard bioindicators for the validation of sterilization processes was investigated
with different inanimate carrier materials (metal, glass and polymeric surfaces).
Microbial carriers were wrapped in Tyvek® coupons (Figure 2.10). Tested bacterial
endospores include spores of G. stearothermophilus and Bacillus spp.
Figure 2.10: Biological indicator coupons: transparent impermeable PE cover on one side (left) and opaque gas permeable Tyvek® on the other side (right).
Experimental set-up
The bacterial endospores of G. stearothermophilus ATCC 7953, B. subtilis
DSM 13019, B. atrophaeus ATCC 9372 and B. pumilus ATCC 27142 were used as
biological indicators for the validation of atmospheric SMD air plasma as a sterilizing
agent. The indicator samples were provided and analyzed quantitatively by Simicon
0.6 cm
3.0 cm
MATERIALS and METHODS
Tobias G. Klämpfl Page 41
GmbH (Munich, Germany) according to DIN EN ISO 14937, which is the standard for
the validation of sterilization processes of medical devices [135] and according to
DIN EN ISO 11737-1 for the microbiological determination of surviving units on
products [139]. Initially, 100 µL of spore suspension (2 × 10⁷ cfu/mL deionized water)
were placed on one side of the test specimen (2 cm2) and dried under the laminar
flow. The inoculated test specimen was wrapped according to medical packaging
with Tyvek on the endospores facing side and with impermeable PE film on the
backside. Other test specimens include Teflon (Goodfellow, USA), polyvinylchloride
(PVC, Goodfellow, USA) and glass (Menzel, Germany). The spores were treated with
CAP leaving the samples inside the Tyvek coupon, which has already been shown to
be permeable for plasma [28, 122].
For experiments, the sample with the Tyvek side at top was placed in the center of
the SMD device. The treatments lasted 1 min, 3 min and 5 min. Every spore
treatment was conducted at least three times. Each sample was placed in a separate
plastic bag after treatment and sent together with a transport control sample to
Simicon GmbH (Germany) on the same day. There the spores were suspended in
10 mL H2O medium (Ampuwa®, Fresenius Kabi, Germany) and treated for 10 min in
the ultrasonic bath for spore detachment purposes. The recovery of viable spores
followed a dilution series (10-1, 10-3, 10-5). In case of 10-3 or 10-5 dilutions, 100 μL of
the corresponding dilution were distributed on TSA. To analyze 10-1 dilutions, 1 mL
from the suspension was poured together with liquid TSA into petri dishes. The agar
plates inoculated with Bacillus spp. were incubated overnight at 35 ± 2 °C except G.
stearothermophilus spores which were incubated for 48 h at 56 ± 2 °C. Viable counts
of the colony forming units were performed. No detection of growing colonies implied

MATERIALS and METHODS
Tobias G. Klämpfl Page 42
a minimum survival of ≤ 10 cfu. Results are shown as log reduction curves, D-values
and SAL; log corresponds to log10
D-value and SAL calculation of spore reduction
The characteristic decimal reduction time was determined from the data of plasma-
treated endospores by the equation:
∙ log (2.5)
t is the treatment time in minutes, DT is the D-value in minutes for a single decimal
reduction at the treatment temperature T. Here, T was room temperature (23 °C) at
ambient pressure. Data points were selected assuming 1st order kinetics. Average
values were used for calculation and interpolated except if detection limit was
reached. Treatment times were determined as specific SAL that are equivalent to
theoretical 6 and 12 log reduction [140]. An overkill with 12 log reduction means that
a bacterial spore survives the plasma treatment with a predicted probability of 10-6.
2.3.3 Disinfection testing
Two different standard approaches were chosen to investigate the disinfecting
behavior of SMD plasma: The first one is dealing with bacteria on carriers for the
disinfection of medical devices and the second one was modified from a proposed
standard for testing surface disinfectants on PVC flooring.
2.3.3.1 Treatment of bacteria on dry carriers (phase 2/step2)
In this study, the inactivation profile of SMD plasma was characterized against
bacterial endospores from C. difficile ribotype 027. Endospores from B. subtilis and
G. stearothermophilus served as surrogates. Gram-positive vegetative Enterococcus
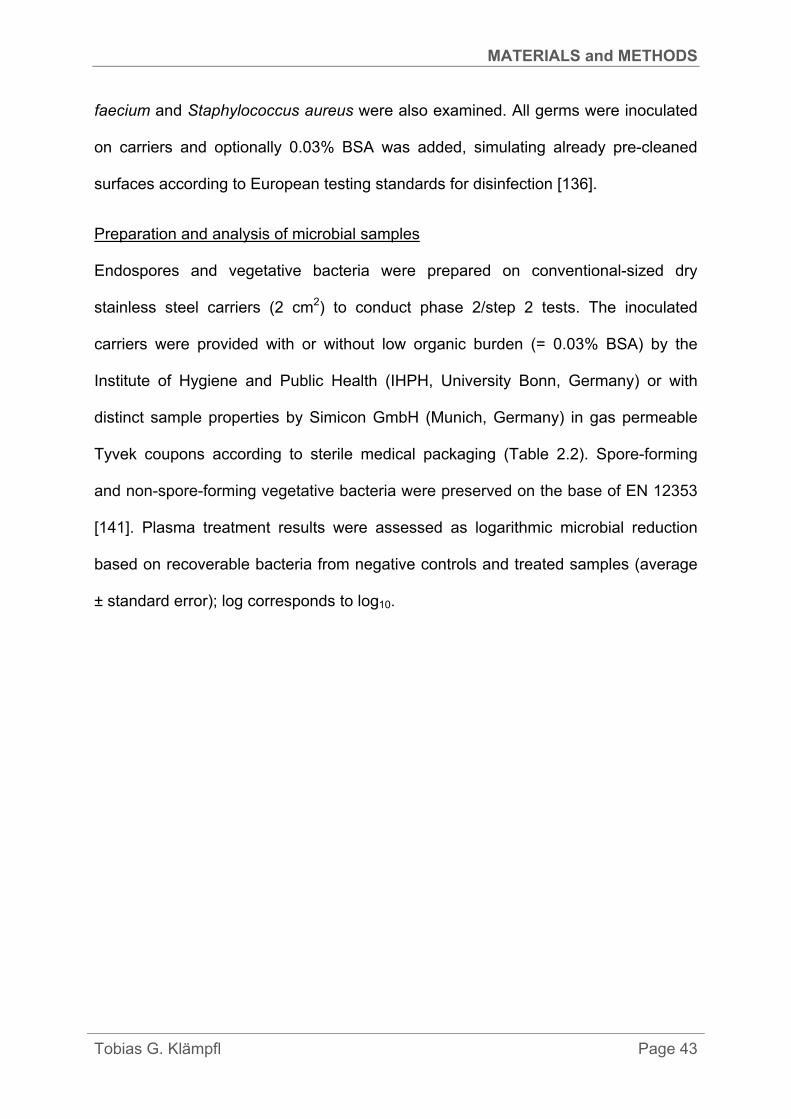
MATERIALS and METHODS
Tobias G. Klämpfl Page 43
faecium and Staphylococcus aureus were also examined. All germs were inoculated
on carriers and optionally 0.03% BSA was added, simulating already pre-cleaned
surfaces according to European testing standards for disinfection [136].
Preparation and analysis of microbial samples
Endospores and vegetative bacteria were prepared on conventional-sized dry
stainless steel carriers (2 cm2) to conduct phase 2/step 2 tests. The inoculated
carriers were provided with or without low organic burden (= 0.03% BSA) by the
Institute of Hygiene and Public Health (IHPH, University Bonn, Germany) or with
distinct sample properties by Simicon GmbH (Munich, Germany) in gas permeable
Tyvek coupons according to sterile medical packaging (Table 2.2). Spore-forming
and non-spore-forming vegetative bacteria were preserved on the base of EN 12353
[141]. Plasma treatment results were assessed as logarithmic microbial reduction
based on recoverable bacteria from negative controls and treated samples (average
± standard error); log corresponds to log10.
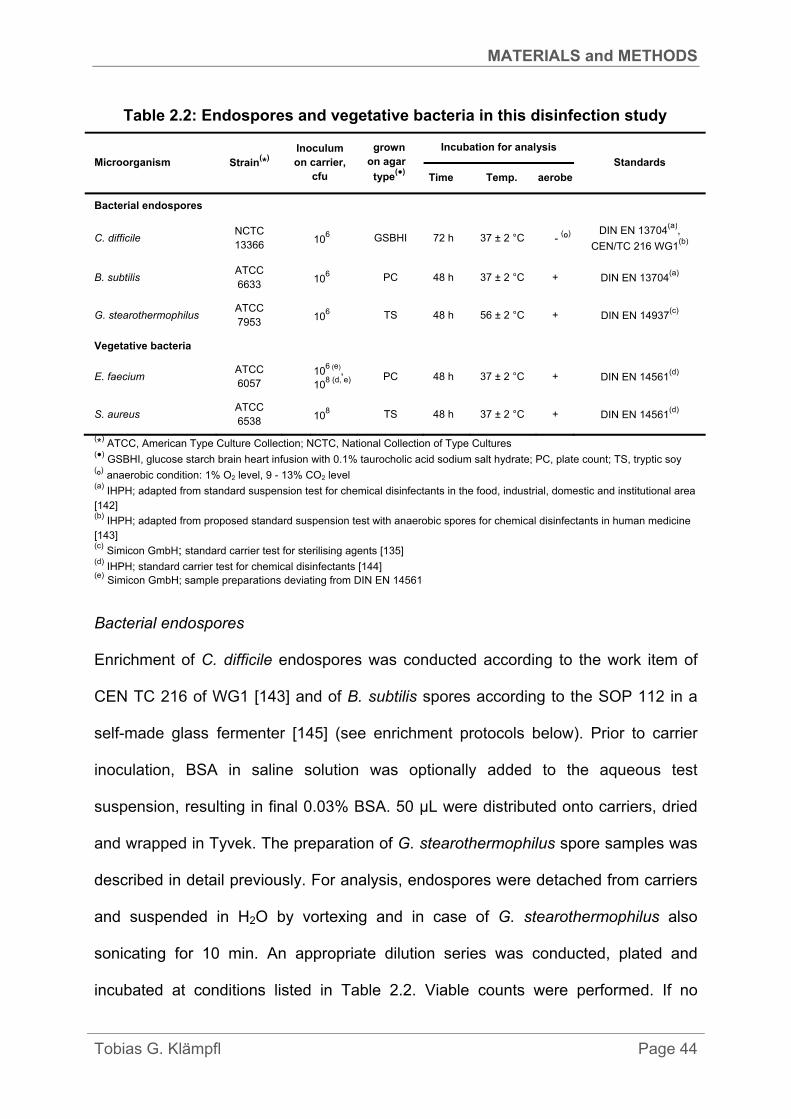
MATERIALS and METHODS
Tobias G. Klämpfl Page 44
Table 2.2: Endospores and vegetative bacteria in this disinfection study
Microorganism Strain(*)
Inoculum on carrier,
cfu
grown on agar
type(●)
Incubation for analysis
Standards
Time Temp. aerobe
Bacterial endospores
C. difficile NCTC 13366 10
6 GSBHI 72 h 37 ± 2 °C -
(º)
DIN EN 13704(a)
,
CEN/TC 216 WG1(b)
B. subtilis ATCC 6633 10
6 PC 48 h 37 ± 2 °C + DIN EN 13704
(a)
G. stearothermophilus ATCC 7953
106 TS 48 h 56 ± 2 °C + DIN EN 14937
(c)
Vegetative bacteria
E. faecium ATCC 6057
10
6 (e), 10
8 (d, e)
PC 48 h 37 ± 2 °C + DIN EN 14561(d)
S. aureus ATCC 6538
108 TS 48 h 37 ± 2 °C + DIN EN 14561
(d)
(*) ATCC, American Type Culture Collection; NCTC, National Collection of Type Cultures
(●) GSBHI, glucose starch brain heart infusion with 0.1% taurocholic acid sodium salt hydrate; PC, plate count; TS, tryptic soy
(º) anaerobic condition: 1% O2 level, 9 - 13% CO2 level
(a) IHPH; adapted from standard suspension test for chemical disinfectants in the food, industrial, domestic and institutional area
[142] (b)
IHPH; adapted from proposed standard suspension test with anaerobic spores for chemical disinfectants in human medicine [143] (c) Simicon GmbH; standard carrier test for sterilising agents [135] (d)
IHPH; standard carrier test for chemical disinfectants [144] (e) Simicon GmbH; sample preparations deviating from DIN EN 14561
Bacterial endospores
Enrichment of C. difficile endospores was conducted according to the work item of
CEN TC 216 of WG1 [143] and of B. subtilis spores according to the SOP 112 in a
self-made glass fermenter [145] (see enrichment protocols below). Prior to carrier
inoculation, BSA in saline solution was optionally added to the aqueous test
suspension, resulting in final 0.03% BSA. 50 µL were distributed onto carriers, dried
and wrapped in Tyvek. The preparation of G. stearothermophilus spore samples was
described in detail previously. For analysis, endospores were detached from carriers
and suspended in H2O by vortexing and in case of G. stearothermophilus also
sonicating for 10 min. An appropriate dilution series was conducted, plated and
incubated at conditions listed in Table 2.2. Viable counts were performed. If no
MATERIALS and METHODS
Tobias G. Klämpfl Page 45
survival was observed, further qualitative analysis via the turbidity method was
conducted with appropriate media and incubation for 7 days.
Vegetative bacteria
The preparation of working cultures, test suspensions and carrier inoculation was
performed according to EN 14561 [144]. The number of cells in the saline suspension
was adjusted to 2 - 5 × 10⁹ cfu/mL with 8.5% tryptone-NaCl using McFarland
standard. As for spores, BSA was optionally added to the saline test suspension and
50 µL were distributed onto carriers, dried and wrapped in Tyvek. Special E. faecium
samples deviating from the EN standard (Simicon GmbH) were prepared under
different conditions, in order to compare the bactericidal effect of plasma versus
regular samples (IHPH). Therefore, the inoculation area (2 or 8 cm2), microbial load
(106 or 108 cfu), organic burden (± 0.03% BSA, heparinized sheep blood) and test
suspension medium (saline solution or H2O Ampuwa®) were altered. For analysis,
each sample was vortexed in saline solution, diluted, plated and incubated at
conditions described in Table 2.2. Viable counts were performed. As for bacterial
endospores, the turbidity method was conducted, if no survival was observed via the
plate count method.
Enrichment protocols for bacterial endospores at IHPH
C. difficile
First, working cultures were incubated from one bead of frozen stock cultures on
columbia blood agar (CBA) under appropriate incubation conditions (Table 2.2). For
enriching C. difficile spores, a single colony was added to pre-reduced tubes with
meat medium covered with paraffin and incubated in an anaerobic chamber for at
least 18 h. Pre-reduced CBA plates were inoculated with 100 µl of the inoculated

MATERIALS and METHODS
Tobias G. Klämpfl Page 46
meat medium and incubated anaerobically for 7 days at 37 °C and subsequently for
14 days at room temperature in the absence of light. The spores were harvested by
washing down with 2-3 mL sterile H2O. The collected suspension was centrifuged
(3000 G; 10 °C; 10 min) and washed three times with 50 mL sterile H2O. The final
suspension was adjusted to a density of 2 × 10⁷ cfu/mL. To inactivate any vegetative
cells, the spore suspension was heated at 80 °C for 10 min. Its purity was proved by
phase contrast imaging and it was stored with sterile glass beads at 2 - 8 °C for six till
eight weeks until use.
B. subtilis
First, the sporulation medium consisting of 900 mL of solution 1 (magnesium sulfate
monohydrate, potassium chloride, nutrient broth, iron sulfate solution) and 100 mL of
solution 2 (calcium nitrate and manganese chloride tetrahydrate) was filled into the
2 L fermenter. The exact composition of both solutions is described elsewhere [110].
The sporulation medium was inoculated with 5 to 6 colonies of the first working
culture and incubated at 37 °C with magnetic stirring (120 rpm). After an incubation
time of 5 h, clouding of the sporulation media occurs and aeration by activating a
membrane pump was added. The incubation was continued with aeration for 72 h at
37 °C. Before harvesting the spores, a sonication step was carried out for 2 min at
10 °C. The spores were harvested by stepwise centrifugation (5000 G, 10 °C,
15 min) and washed three times with 25 mL sterile H2O. The final spore suspension
was adjusted to ~ 2 × 10⁹ cfu/mL. To inactivate any vegetative cells, the spore
suspension was heated at 80 °C for 10 min. The purity was proved by phase contrast
imaging. Final suspension was stored with sterile glass beads at 2 - 8 °C for at least
four weeks until use.

MATERIALS and METHODS
Tobias G. Klämpfl Page 47
SMD plasma experiments
The SMD plasma was generated with an electrode system at ambient air conditions
(23 °C). Individual microbial samples were treated within the Tyvek® coupon centred
and 5 mm below the electrode system inside the closed FP2.0 for up to 10 min.
Every treatment was carried out three times and experiments were reproduced with
the same conditions. Plasma-treated samples were analyzed together with two
negative controls, which were stored at the analyzing facilities, in order to determine
the recoverable microbial load of each batch at the time of analysis for log reduction
calculations; and with one neutral transport control, in order to detect possible
inactivation during transportation from the plasma lab to the analysing facility.
2.3.3.2 The modified 4-field-test (phase2/step2)
The 4-field-test is a proposed EN standard test for evaluating the potency of surface
disinfecting agents [146-148]. Briefly, it involves the mechanical distribution of a liquid
disinfectant by a wipe for microbial inactivation. The wipe is guided over four fields
with specific size (5 × 5 cm2) only the first being contaminated on PVC flooring (DLW
Vinyl Solid PUR, Armstrong, Germany) typically used in clinical facilities and the
microbial distribution as well as the inactivation are assessed (Figure 2.11). For my
study, this procedure was modified to the needs of gaseous plasma. Therefore, the
mechanical wipe part and also the dynamic guidance over the four fields were
omitted. Instead of inoculating only the first field, all fields were inoculated with the
same bacterial load. The first three fields were treated one after another with SMD air
plasma, the fourth field was used as control and microbial inactivation was assessed
(Figure 2.12).
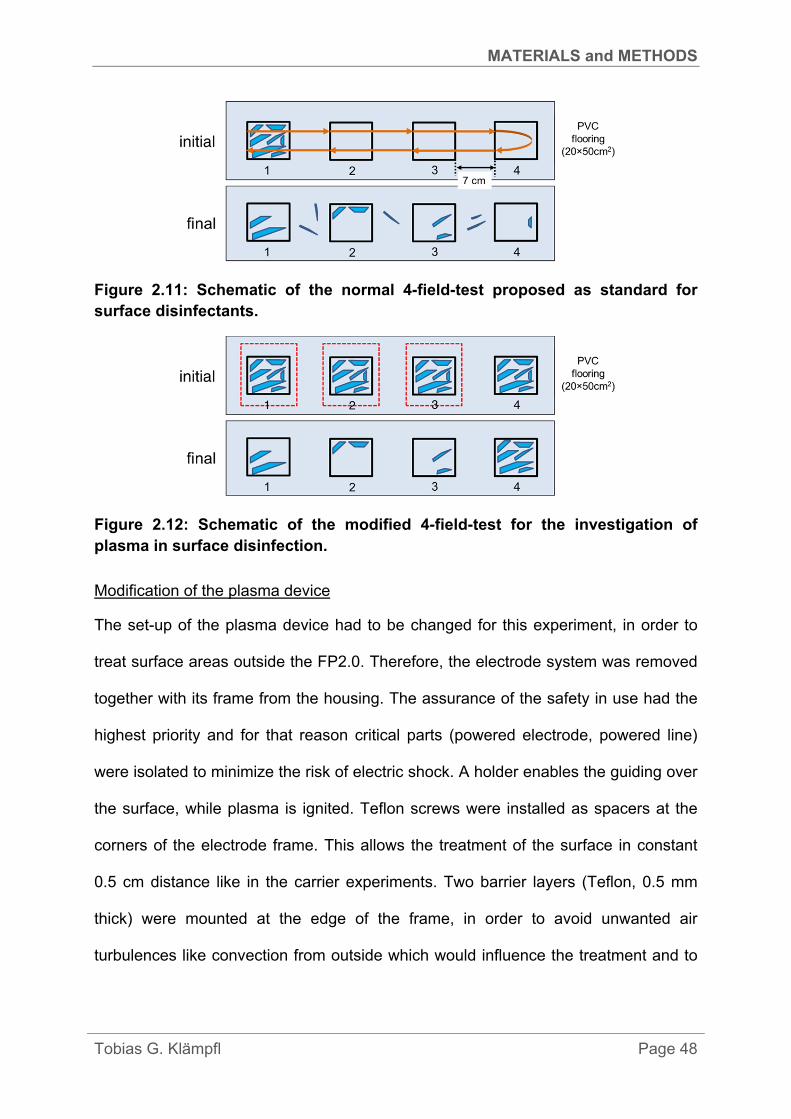
MATERIALS and METHODS
Tobias G. Klämpfl Page 48
Figure 2.11: Schematic of the normal 4-field-test proposed as standard for surface disinfectants.
Figure 2.12: Schematic of the modified 4-field-test for the investigation of plasma in surface disinfection.
Modification of the plasma device
The set-up of the plasma device had to be changed for this experiment, in order to
treat surface areas outside the FP2.0. Therefore, the electrode system was removed
together with its frame from the housing. The assurance of the safety in use had the
highest priority and for that reason critical parts (powered electrode, powered line)
were isolated to minimize the risk of electric shock. A holder enables the guiding over
the surface, while plasma is ignited. Teflon screws were installed as spacers at the
corners of the electrode frame. This allows the treatment of the surface in constant
0.5 cm distance like in the carrier experiments. Two barrier layers (Teflon, 0.5 mm
thick) were mounted at the edge of the frame, in order to avoid unwanted air
turbulences like convection from outside which would influence the treatment and to

MATERIALS and METHODS
Tobias G. Klämpfl Page 49
slow down diffusion of plasma species to the outside. The modified device is depicted
in Figure 2.13.
Figure 2.13: Set up of the modified SMD device.
Preparation, treatment and analysis of microbial samples at IHPH
Bacterial endospores of C. difficile and B. subtilis as well as vegetative bacteria E.
faecium and S. aureus were used together with 0.03% BSA simulating pre-cleaned
condition as previously described (Table 2.2). Instead of carriers, each field of the
PVC flooring was inoculated with 50 µL of bacterial suspension with a glass spatula.
Suspensions had a microbial density of around 107 cfu/mL for bacterial endospores
and 108 or 109 cfu/mL for vegetative bacteria. At the same time, another field
separated from the flooring with the four fields was also inoculated and served as the
drying control D. It determined the initial reference load for log reduction calculations.
After 30 min drying at ambient air, three of the four fields of the flooring were treated
one by one with plasma inside a fume hood at ambient room conditions (23 °C).
Therefore, the device was placed over the first field and treated for 1, 3, 5 or 10 min
at constant 1 kHz and 10 kVpp. Afterwards, the device was removed from the field
15.5 cm
holder power
ground
Teflon/Kapton surrounding
spacer
11 cm
Teflon barriers
MATERIALS and METHODS
Tobias G. Klämpfl Page 50
and the next treatment of an adjacent field was started after 2 min. Having finished
the treatment of three fields, all treated fields of the flooring and the untreated fourth
field, which served as control for side-diffusing plasma species, were analyzed via
the standard swab method [149]. Briefly, bacteria were collected from the surface
with two pre-wetted swabs per field, suspended in 5 mL medium and diluted
appropriately. 100 µL were distributed onto agar surface and incubated (Table 2.2).
Viable cell counts were performed. Log reduction and survival curves were
determined. The experiment was reproduced one time. Results are given as
averaged values and their standard errors from both experiments.
2.3.4 Testing the influence of Tyvek cover on microbial inactivation
The investigation of the real impact of the Tyvek cover on the microbial inactivation
by SMD plasma was conducted with a series of treatments and subsequent analyses
of G. stearothermophilus endospores on stainless steel substrates at MPE.
Preparation of samples
Biological indicator samples as used in previous experiments were purchased from
Simicon GmbH (SIMICON-OX). In this experiment, all samples were from the same
production batch no. 210413 having 2 × 10⁶ cfu spores on their surface. Different
sample configurations were prepared prior to treatments including either Tyvek cover
or not. Optionally, substrates were placed in glass (Øinner = 3.7 cm) or plastic vessels
(Øinner = 9 cm, PE petri dish) both with the same depth 0.7 cm but with different filling
volume (7.5 cm3 and 44.5 cm3, respectively). Many of these were put in Tyvek
coupon (Stericlin®, Simicon GmbH, Germany) and sealed by manual impulse hand
sealer (hpl ISZ 200, Hawo GmbH, Germany). Occasional substrates were sealed in
MATERIALS and METHODS
Tobias G. Klämpfl Page 51
impermeable PE coupons as controls for the exclusion of gaseous plasma species.
Other samples were placed without cover on anodized alumina or thin Teflon plate.
SMD experiment
Individual samples were inserted in central position into the FP2.0. The preferred
distance was 1.5 cm to the SMD electrode which was normally in the lowest position.
Most samples were treated at 1 kHz and 10 kVpp for 3 or 5 min at ambient conditions
(23 °C) and inside the closed device. Frequency, distance or the height of the
electrode system among others were altered in certain situations described in detail
in the results section. After the treatment, the sample was removed, the carrier
immediately placed into a tube with suspending medium, in order to avoid post-
plasma effects. The device was air-evacuated with the ozone filter pump for 1 min,
before the next treatment cycle could start. Six samples were treated at same
experimental conditions and in the great majority of cases, each set of experiment
was repeated one time.
Analysis of carriers
The quantitative analysis of G. stearothermophilus spores was carried out following
the protocol of a standard that Simicon GmbH applies (see sterilization experiments)
[139]. In detail, spores were suspended in 10 mL Ampuwa® water, vortexed for
1 min, placed for 15 min in the ultrasonic bath and vortexed again for 1 min.
Afterwards a dilution series was conducted (always 1 mL in 9 mL). TSA plates were
inoculated with 100 µL via the spread plate method and incubated at 56 ± 2 °C for
24 h. Counts of viable cells were performed with a manual colony count device
(schuett count, schuett-biotec GmbH, Germany). Since the pour plate method was
not applied as 10-1 dilution determinant (1 mL out of 10 mL of undiluted suspension

MATERIALS and METHODS
Tobias G. Klämpfl Page 52
poured together with liquid agar), the detection sensitivity was lower compared to
previous experiments with minimum 100 cfu or in other words, a maximum of 4.3 log
reduction could be detected.
At the beginning, samples were analyzed at MPE and at Simicon GmbH for the
validation of the analysis method.
Determination of the log reduction
In contrast to previous calculations, the median of the resulting cfu values from six
individual samples was determined. The absolute deviations of each of the six values
from the median were obtained and their own median, the so called median absolute
deviation (MAD) determined. The analysis results of two times six untreated samples
served as reference for the calculation of log reduction values. Results are expressed
as the mean from the log reduction of normally two median values acquired from two
independent series with six samples; log corresponds to log10
Determination of adherent spores to Tyvek cover
From an initial G. stearothermophilus suspension with 108 cfu/mL (SPW8206-8,
Simicon GmbH) a dilution with 104 cfu/mL was prepared. 10 µL were distributed from
this dilution over a piece of Tyvek cover (Stericlin®, Simicon GmbH) cut to the same
size as the one covering biological indicators. The samples were dried for 30 min at
ambient air. In order to detect the spore number that can be recovered from the
inoculated Tyvek covers, samples were pressed directly on TSA surface, removed
after short time and pressed again on another TSA plate. This was repeated until four
agar plates were inoculated from one sample. The idea was to detect spores which
were not detached from the Tyvek cover in the first press cycle. The backside of the
MATERIALS and METHODS
Tobias G. Klämpfl Page 53
cover without the spores served as negative control and was pressed on TSA as
well. Agar plates were incubated at adequate conditions. Cell count was performed.
Similarly, Tyvek covers from untreated biological indicator samples were pressed 20
times in series on different agar plates. Plates were incubated. If cell count was not
possible, the number of colonies was estimated. The mean value and the standard
error of three analyzed Tyvek covers were determined.
Tyvek covers from treated biological indicator samples were also analyzed. As for the
carrier test, two times six Tyvek covers exposed to plasma (1 kHz, 10 kVpp, 1.5 cm
distance) were used.
2.4 Scanning Electron Microscopy of bacteria on carriers
The impact of microbial distribution and burden on the plasma decontamination was
investigated by SEM imaging of carrier surfaces for the interpretation of inactivation
results.
SEM imaging and energy-dispersed x-ray (EDX) analysis
Samples of C. difficile and G. stearothermophilus endospores and of E. faecium that
were studied by SEM/EDX belonged to the same batch used in the SMD plasma
experiments. At least two untreated and one treated samples were imaged per
sample configuration. Four surface sites per selected sample were randomly imaged
by SEM. The treatment time for SEM samples equals the maximum treatment time
for samples used in the SMD plasma experiments (5 or 10 min).
Bacterial endospores
Scanning electron micrographs from samples of C. difficile or G. stearothermophilus
endospores were taken using a SEM system from FEI (HELIOS Nanolab 600;
Netherlands). Pre-coating of the sample was not required. The accelerating voltage

MATERIALS and METHODS
Tobias G. Klämpfl Page 54
of electron beam was set constant to 5 kV and the working distance to WD > 4 mm.
The system was operated in second electron detection mode at high vacuum (10-4
Pa). Vacuum drying and electron beam had no morphological effect on spores and
supplements (data not shown). EDX analysis identified chemical structures found in
SEM images by qualitative elemental mapping (Oxford Instruments, INCA PentaFET-
x3 Si detector).
Vegetative bacteria
E. faecium samples from Simicon GmbH were imaged using a high resolution SEM
from JEOL (JSM 7500F; Japan) with cold field emission electron source. The system
allows the imaging with low electron beam power (accelerating voltage = 1 kV, beam
current = 90 pA) and a long working distance (WD > 14 mm), in order to avoid
bacterial damage by the beam. Dehydration cycles with ethanol and pre-coating were
not necessary prior to the imaging process. The system was operated in second
electron detection mode at high vacuum (10-5 Pa).
RESULTS
Tobias G. Klämpfl Page 55
3 RESULTS
3.1 Developing the electrode system
To start with, I had to choose an appropriate electrode system for the following
decontamination studies with the available developed SMD air plasma device. The
housing of the FP2.0 as well as the frame for the SMD electrode was provided. I
addressed this task by establishing certain criteria, which should be fulfilled by the
prospective electrode system. This involved the supply of a homogenous discharge
pattern along the dielectric surface, a far-reaching maintenance of the stability of
electrode components used and an appropriate bactericidal effect of the generated
SMD plasma.
For all the above reasons, the performance of various grounded electrodes with
distinct materials and mesh structures was studied. The resulting discharge pattern
and bactericidal effects are depicted in Figure 3.1. Homogeneity was present to a
great extent for all grounded electrodes at 2 kHz, which was on the other hand more
difficult to obtain at a higher frequency of 6 kHz, emphasized by the red arrows in
discharge images. This phenomenon influenced clearly the bactericidal effect of the
plasma. At areas where no discharge was observed, E. coli was more likely to
survive the treatment and could grow to form dense layers (red arrows). This
underlines the importance of acquiring a homogenously distributed discharge. The
results from the 6 kHz treatments illustrate this adequately, although they cannot
further indicate, due to the use of different voltage amplitudes, which electrode
generated plasma with higher bactericidal effect. The limit of the power supply was
reached at this frequency and the available voltage ranges were narrow and different.
However, the bactericidal outcome is clarified at 2 kHz treatments, where plasma
from electrodes D, C, B and A showed in that order increasing microbial inactivation.
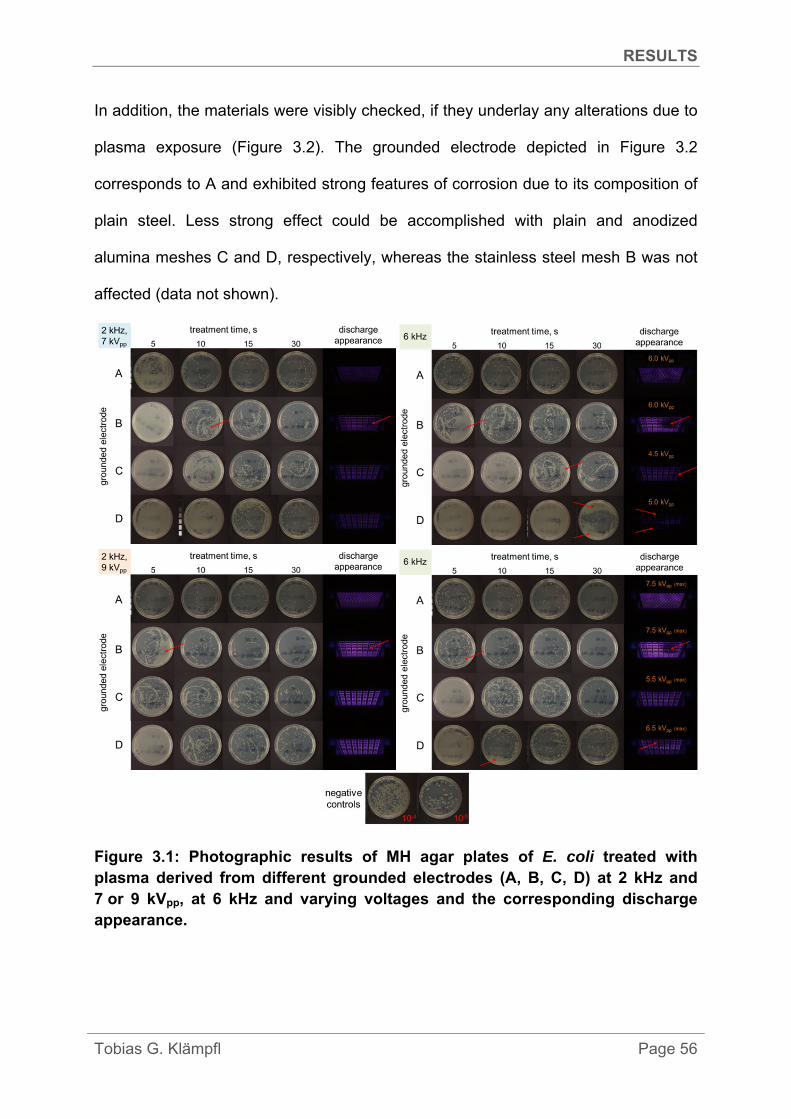
RESULTS
Tobias G. Klämpfl Page 56
In addition, the materials were visibly checked, if they underlay any alterations due to
plasma exposure (Figure 3.2). The grounded electrode depicted in Figure 3.2
corresponds to A and exhibited strong features of corrosion due to its composition of
plain steel. Less strong effect could be accomplished with plain and anodized
alumina meshes C and D, respectively, whereas the stainless steel mesh B was not
affected (data not shown).
Figure 3.1: Photographic results of MH agar plates of E. coli treated with plasma derived from different grounded electrodes (A, B, C, D) at 2 kHz and 7 or 9 kVpp, at 6 kHz and varying voltages and the corresponding discharge appearance.

RESULTS
Tobias G. Klämpfl Page 57
Overall, the grounded electrode B was identified as the most suitable among tested
objects and was installed permanently for further studies. The issue with the
homogeneity of the discharge pattern was addressed by adjusting the fixation.
Figure 3.2: Effect of plasma exposure on diverse device components.
In addition, other device components were also examined for their stability against
plasma Figure 3.2. Especially parts made of POM such as the dielectric and the
housing were altered by plasma. The dielectric material POM tended as well to break
down during treatments (lower minute range). Therefore, the dielectric material and
the electrode frame were exchanged by chemically inert and more stable Teflon®
film (0.5 mm thick, Goodfellow), however the POM housing was further used.
Moreover, corrosion occurred on the powered electrode plate made of copper in form
of tarnishing followed by patina formation at extensive use. For this reason, it was
substituted by the composite brass that helps resist tarnishing.

RESULTS
Tobias G. Klämpfl Page 58
The final configuration of the SMD electrode system consisted of a solid brass plate
and a mesh grid made of stainless steel, both spaced by a dielectric Teflon film and
its discharge appearance is demonstrated in Figure 3.3.
Figure 3.3: Final SMD electrode configuration.
Regarding to the development of the system, the dielectric material was found humid
at the side of the powered plate after long time use. This was probably caused by
discharge heating and subsequent water evaporation from the biological sample such
as an agar plate. The humidity was assumed to accelerate dielectric breakdown and
metal corrosion. In order to circumvent this issue, Kapton tape was wrapped around
the electrode system except from the grounded mesh “sealing” the openings at its
edges.

RESULTS
Tobias G. Klämpfl Page 59
3.2 Plasma diagnostics
Following the setting up of the equipment, the physical and chemical entity of the
SMD air plasma generated with the developed device was characterized, in order to
elucidate its inactivating effect against bacteria in subsequent studies.
OES spectral analysis
The emitted photons of the SMD in ambient air are strongly dominated by excited N2
molecules (Figure 3.4). The spectra exhibit almost no radiation in the most hazardous
UV-C region below 280 nm. However, less harmful UV-A and UV-B are present.
Moreover, higher external power due to higher frequency or voltage caused more
prominent spectral peaks. Especially in the UV-C and the near infrared region weak
spectral lines occur. These spectral lines refer mainly to excited N2, yet peaks in the
UV-C region could be related to photons from NO. A clear assignment to one of
these molecules is not possible due to overlapping peaks. The peak at 685 nm could
not be assigned to any molecule even with the aid of an extensive spectral library
[137]. Due to its absence in other measured spectra, it might be an impurity.
Indications of other chemical active molecules such as ozone or singlet oxygen are
missing or questionable due to overlapping spectra (Table 3.1). Besides, ozone is in
general hardly detectable by OES.
Table 3.1: Relevant plasma species and their wavelength appearance [137].
chemical species expected wavelength range, nm
N2 (2nd+) 280 - 497 N2 (1st+) 640 - 780 N2 (4th+) 220 - 280 NO (γ) ~ 247
OH 308 O3 328
singlet O2 762 atomic O 777
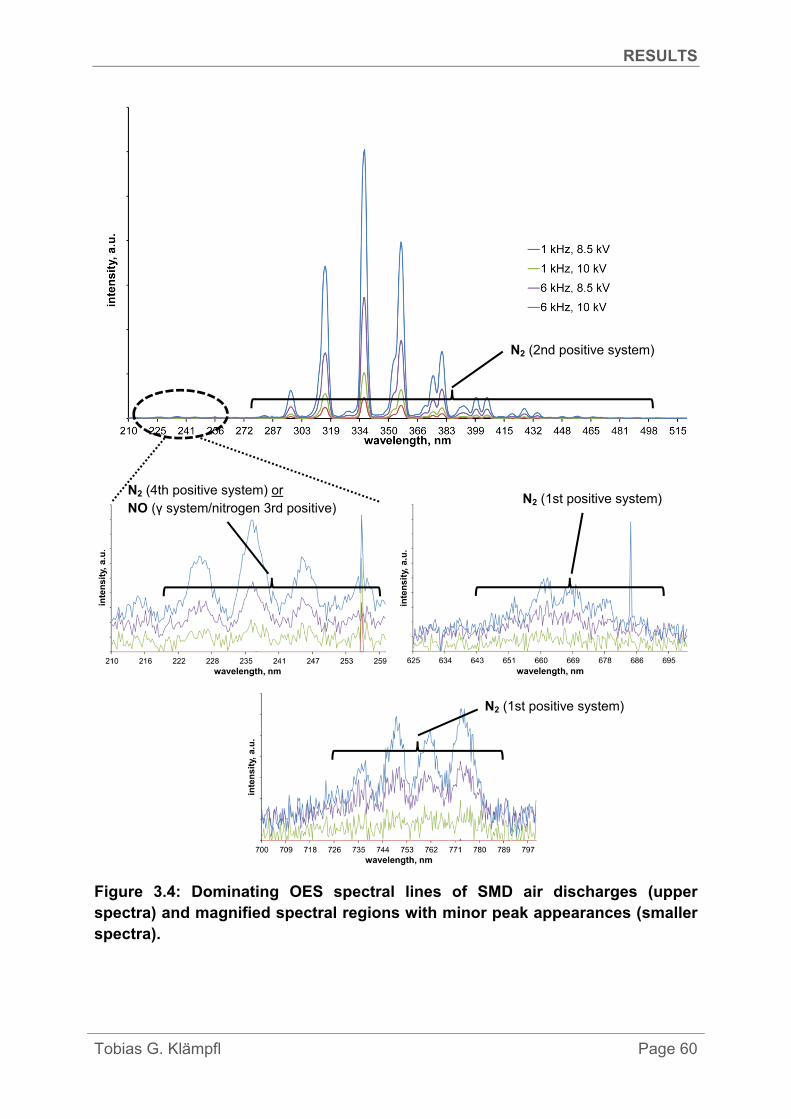
RESULTS
Tobias G. Klämpfl Page 60
Figure 3.4: Dominating OES spectral lines of SMD air discharges (upper spectra) and magnified spectral regions with minor peak appearances (smaller spectra).
N2 (2nd positive system)
N2 (1st positive system)
N2 (1st positive system) N2 (4th positive system) or NO (γ system/nitrogen 3rd positive)

RESULTS
Tobias G. Klämpfl Page 61
UV-C power density
The power density of the emitted UV-C photons was measured at 1 kHz, 10 kVpp in
the region below 280 nm which refers to the most harmful UV light at ambient air.
The UV-C power density was very low with less than 40 nW/cm2 detected in 2.5 cm
distance from the discharge surface without the use of optical filters (210 - 294 nm).
Measurements in 0.3 cm distance also did not exceed 110 nW/cm2. According to the
aforementioned OES results, it can be estimated that a six fold higher frequency
would increase the emission or the power density by a factor of less than six
(< 660 nW/cm2).
Temperature profile
The heat that was created by the plasma discharge at constant 10 kVpp elevated the
temperature inside the closed FP2.0 (Figure 3.5). However, the rate of the increase
was quite low with 0.1 °C, 0.3 °C, 1 °C and 3 °C per minute for 0.5 kHz, 1 kHz, 3 kHz
and 6 kHz, respectively. Therefore, 40 °C, as a lower threshold for protein
denaturation, would be reached in 180 min, 60 min, 18 min and 6 min of permanent
plasma discharge for 0.5 kHz, 1 kHz, 3 kHz and 6 kHz, respectively. Exceeding
70 °C, which affects thermoplastic polymers such as Teflon from the dielectric, is
theoretically reached earliest after 18 min at 6 kHz. However, the temperature of the
metal electrodes is higher than the air temperature, which was solely measured.
Since the metal electrodes are in direct contact with the dielectric, the critical 70 °C
for the polymer are obtained in shorter time. Thus, it is recommended to choose the
discharge duration up to maximum 10 min at 6 kHz and 10 kVpp, in order to avoid
damage of the electrode system.

RESULTS
Tobias G. Klämpfl Page 62
Figure 3.5: Temperature profile inside the closed FP2.0 at varying frequencies.
Dissipated plasma power
The actual power and the power density consumed by the plasma discharge at
10 kVpp were determined (Table 3.2). As expected the plasma power correlates quite
well with the applied frequency. For instance doubling of frequency resulted in nearly
doubled dissipated power. The only exception is demonstrated at 6 kHz which
showed a slightly lower power than the expected 24 W. A possible reason could be
that the outmost limitation of the power supply was reached with 6 kHz and 10 kVpp,
being barely obtainable. This hypothesis is supported by the tendency of altering
frequency shape from sinusoidal wave to irregular wave with pointy peaks at this
power setting.
Table 3.2: Dissipated SMD plasma power at varying frequency.
frequency,
kHz
plasma power,
W
power density,
mW/cm2
0.5 2.2 ± 0.0 20.0 ± 0.1
1 3.9 ± 0.1 34.9 ± 0.6
3 11.8 ± 0.2 105.1 ± 1.5
6 22.4 ± 0.6 200.0 ± 5.5
RESULTS
Tobias G. Klämpfl Page 63
Ozone concentration
As introduced, DBD plasma systems are known to generate ozone in ambient air.
Here, the ozone concentrations of SMD plasma were obtained by in situ and ex situ
measurements at 10 kVpp and varying frequency (Figure 3.6).
Very high concentrations were measured in situ during discharge. Although the initial
production rate of ozone increased with higher frequency, the concentration curves
developed differently as this starting correlation. The absolute concentration grew at
0.5 kHz and 1 kHz steadily, but flattened over time and reached its climax with
13,500 ppm at 1 kHz after 5 min. At higher frequency of 3 kHz, the ozone
concentration reached its maximum after 2 min with nearly 9,000 ppm and started to
decline from that moment. This tendency was pronounced in the case of 6 kHz with a
maximum of 7,900 ppm after 1.5 min and a higher descending rate which resulted in
only 2,500 ppm after 5 min. Enhancing the distance by 1.5 cm, resulting in doubling
the volume below the electrode system, led to a curve at 1 kHz driven plasma that
almost equals the curve at 0.5 kHz.
Ozone exhibited a long retention time of up to 25 min after plasma discharge. The
time was influenced by the original end concentration after 5 min discharge-on phase
and by the underlying volume. A higher volume resulted in a longer retention time.
In ex situ measurements, concentration curves are remarkably distinct in comparison
to in situ results. Whereas the initial production rate also increased with higher
frequency, the maximum concentration was already reached in each case within
1 min and was much lower with highest values of 2,500 ppm at 6 kHz. The
concentration level was hereby limited by the relatively high suction rate of the
remote analyzer which prohibited further accumulation of ozone inside the FP2.0. In
addition, the measured concentrations at 1 kHz for instance converge earlier than in

RESULTS
Tobias G. Klämpfl Page 64
in situ experiments. However, the principal drop of the concentration level at 6 kHz is
also recognizable.
Having extinguished the discharge, the suction rate was also responsible for the
rapid drop of the concentration to zero level within two or three minutes.
Figure 3.6: Ozone concentration profiles after in situ (top) and ex situ measurements (bottom) inside the closed FP2.0 during plasma discharge (left) and afterwards (right) at varying frequencies.
In regards of microbial inactivation, the ozone dose is an important measure and was
calculated for in situ measurements (Figure 3.7). Interestingly, about the same doses
with 36,000 ppm × min resulted from 1 kHz and 3 kHz operations after 5 min plasma
discharge duration. Less was obtained from 6 kHz (27,000 ppm × min) and more
from 1 kHz (47,000 ppm × min) operation. After plasma discharge was extinguished

RESULTS
Tobias G. Klämpfl Page 65
also very high doses were reached due to the long retention time of ozone, even
exceeding the doses derived during discharges at lower frequencies after 5 min.
Figure 3.7: Ozone doses derived from in situ measurements.
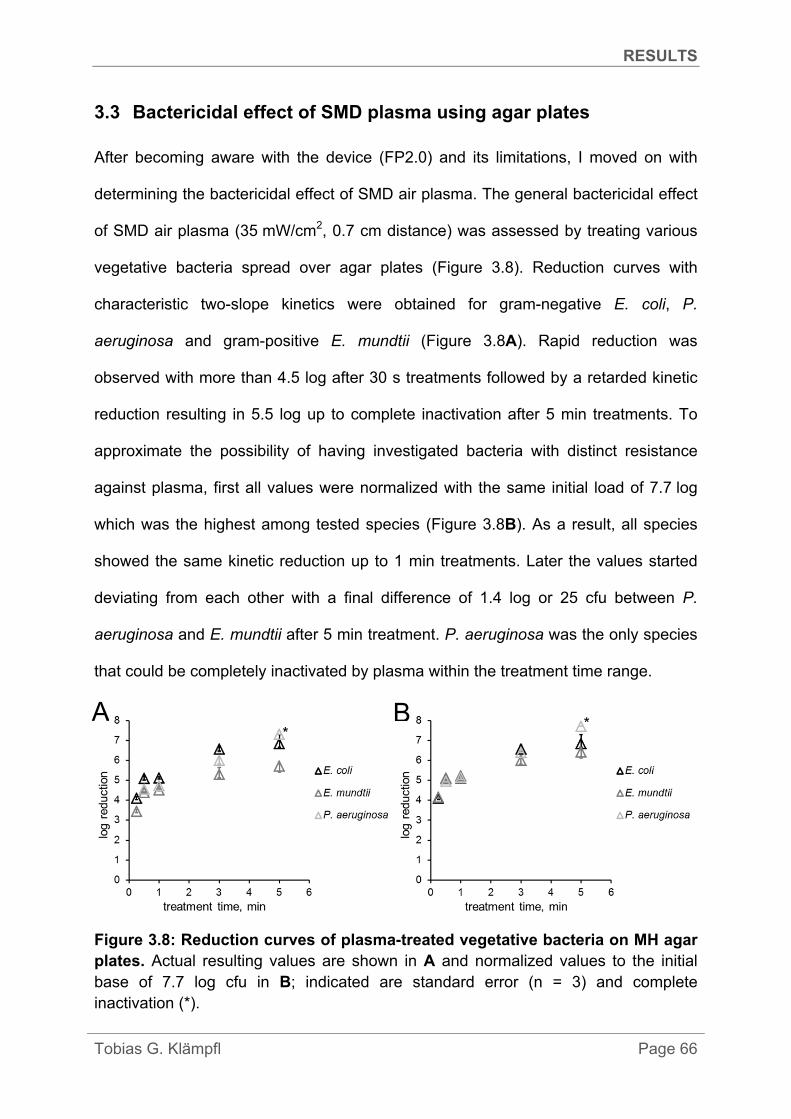
RESULTS
Tobias G. Klämpfl Page 66
3.3 Bactericidal effect of SMD plasma using agar plates
After becoming aware with the device (FP2.0) and its limitations, I moved on with
determining the bactericidal effect of SMD air plasma. The general bactericidal effect
of SMD air plasma (35 mW/cm2, 0.7 cm distance) was assessed by treating various
vegetative bacteria spread over agar plates (Figure 3.8). Reduction curves with
characteristic two-slope kinetics were obtained for gram-negative E. coli, P.
aeruginosa and gram-positive E. mundtii (Figure 3.8A). Rapid reduction was
observed with more than 4.5 log after 30 s treatments followed by a retarded kinetic
reduction resulting in 5.5 log up to complete inactivation after 5 min treatments. To
approximate the possibility of having investigated bacteria with distinct resistance
against plasma, first all values were normalized with the same initial load of 7.7 log
which was the highest among tested species (Figure 3.8B). As a result, all species
showed the same kinetic reduction up to 1 min treatments. Later the values started
deviating from each other with a final difference of 1.4 log or 25 cfu between P.
aeruginosa and E. mundtii after 5 min treatment. P. aeruginosa was the only species
that could be completely inactivated by plasma within the treatment time range.
Figure 3.8: Reduction curves of plasma-treated vegetative bacteria on MH agar plates. Actual resulting values are shown in A and normalized values to the initial base of 7.7 log cfu in B; indicated are standard error (n = 3) and complete inactivation (*).
* * A B
RESULTS
Tobias G. Klämpfl Page 67
3.4 SMD plasma sterilization using carriers
The antimicrobial effect of SMD plasma (35 mW/cm2, 1.5 cm distance) was further
investigated with some of the most environmentally robust MO, namely bacterial
endospores spread over dry carriers that are conventionally used as biological
indicators to validate sterilization methods.
As for vegetative bacteria, plasma also strongly affected the ability of spores to
survive (Figure 3.9). In contrast to previous agar experiments, the reduction curves
strongly differ from strain to strain (Figure 3.9A). This is most obvious at 1 min
treatments where B. subtilis spores were already reduced by nearly 4 log, whereas at
the same time only 1 log inactivation of G. stearothermophilus spores occurred. The
reduction values of B. atrophaeus and B. pumilus lie in between. Inactivation to the
detection limit of 5.3 log (≤ 10 cfu) was obtained after plasma treatment of 3 min for
Bacillus spp. spores except for G. stearothermophilus which required 5 min. Notably,
G. stearothermophilus spores were among the tested strains the most resistant
against plasma.
Therefore, further experiments were conducted with this spore type on model carriers
equally sized and with varying materials also used in medical devices, in order to
investigate their influence on the inactivation. In addition to stainless steel which is
conventionally used in sterilization testing, spores were distributed for that purpose
on glass, PVC and Teflon carriers (Figure 3.9B). Overall, the same reduction rate
was achieved with plasma independent of the underlying carrier material.

RESULTS
Tobias G. Klämpfl Page 68
Figure 3.9: Reduction curves of plasma-treated bacterial endospores validating sterilization. Bacillus spp. were treated on stainless steel carriers in A and G. stearothermophilus on varying carrier substrates in B; indicated are standard error (n ≥ 3) and detection limit (* ≤ 10 cfu).
The characteristic D-values related to plasma inactivation were calculated and
compared to reference values derived from conventional sterilization methods
(Table 3.3). For instance, B. subtilis spores had a D-value of only 0.3 min, while
endospores of G. stearothermophilus showed a D-value of 0.9 min, which is lower
than the minimum standard D-value of dry heat or H2O2 sterilization. Furthermore,
SAL values were determined for the plasma inactivation (Table 3.3).
Table 3.3: D-values and SAL of bacterial endospores treated by SMD air plasma and reference sterilization methods
a D-values of reference sterilization methods provided by Simicon GmbH; dash (-) indicates: data not available b D60°C of H2O2 (6.0 mg/L, saturated steam, 60°C); c D54°C of ethylene oxide (600 mg/L, 54°C) d D160°C of dry heat (160°C); e Devices used according to the standard regulations DIN EN ISO 18472 [150]
Bioindicator Strain D23°C-value,
min
SAL, min Reference method
D-valuea, min 6 log 12 log
G. stearothermophilus ATCC 7953
0.9 5.7 11.4 H2O2 4.2 b
B. pumilus ATCC 27142
0.5 3.2 6.5 γ-radiation -
B. atrophaeus ATCC 9372
0.6 3.4 6.8 ethylene oxide 3.0 c,e
B. subtilis DSM 13019
0.3 1.7 3.3 dry heat 2.8 d,e
A B* * *

RESULTS
Tobias G. Klämpfl Page 69
3.5 SMD plasma disinfection using carriers
Having studied the antimicrobial behavior against surrogate model organisms so far,
the decontaminating effect of SMD air plasma (35 mW/cm2, 0.5 cm distance) was
examined this time in more detail with nosocomial bacteria such as E. faecium and C.
difficile endospores. This involved the application of testing standards for disinfecting
agents with low organic burden (0.03% BSA) in addition to bacteria on dry carriers
which should aggravate the inactivation and simulate pre-cleaned conditions.
Table 3.4 exhibits all relevant control values that were measured in this study related
to the following log reduction curves. In the case of endospores, the load of B. subtilis
was distinct lower compared to others spore types. The inoculum of vegetative
bacteria was in general higher at Simicon samples due to a lower recovery rate.
Table 3.4: Control values of tested bacterial batches
Microorganism org.
burden preparation suspension
markerin
diagram
prep./ analysis institute
inoculum on carrier,
log
recovered from untreated
controls (*)
,
log
neutral transport controls,
log
Bacterial endospores
(ca. 106 cfu; Figure 3.10)
C. difficile - 0.03%
water water(+NaCl)
IHPH “
5.9 5.9
6.6 5.9
6.3 5.8
B. subtilis - 0.03%
water water(+NaCl)
“ “
5.3 5.3
5.1 5.3
5.0 5.1
G. stearothermophilus - water Simicon N/A 6.6 6.4
Vegetative bacteria
(ca. 108 cfu; Figure 3.11A)
E. faecium - - -
0.03%
water water NaCl NaCl
Simicon “
IHPH “
8.9 9.3 8.1 8.1
8.3 8.3 7.5 7.8
7.7 7.8 7.7 7.0
S. aureus 0.03% NaCl “ 8.2 7.9 8.0
Vegetative bacteria
(ca. 106 cfu; Figure 3.11B)
E. faecium - -
0.03% 0.03% blood
water water
water(+NaCl)NaCl NaCl
Simicon “ “ “ “
7.5 7.1 7.6 8.0 N/A
6.6 6.5 6.5 6.5 6.5
6.5 6.0 6.4 6.3 5.9
(*) basic value for log reduction calculations
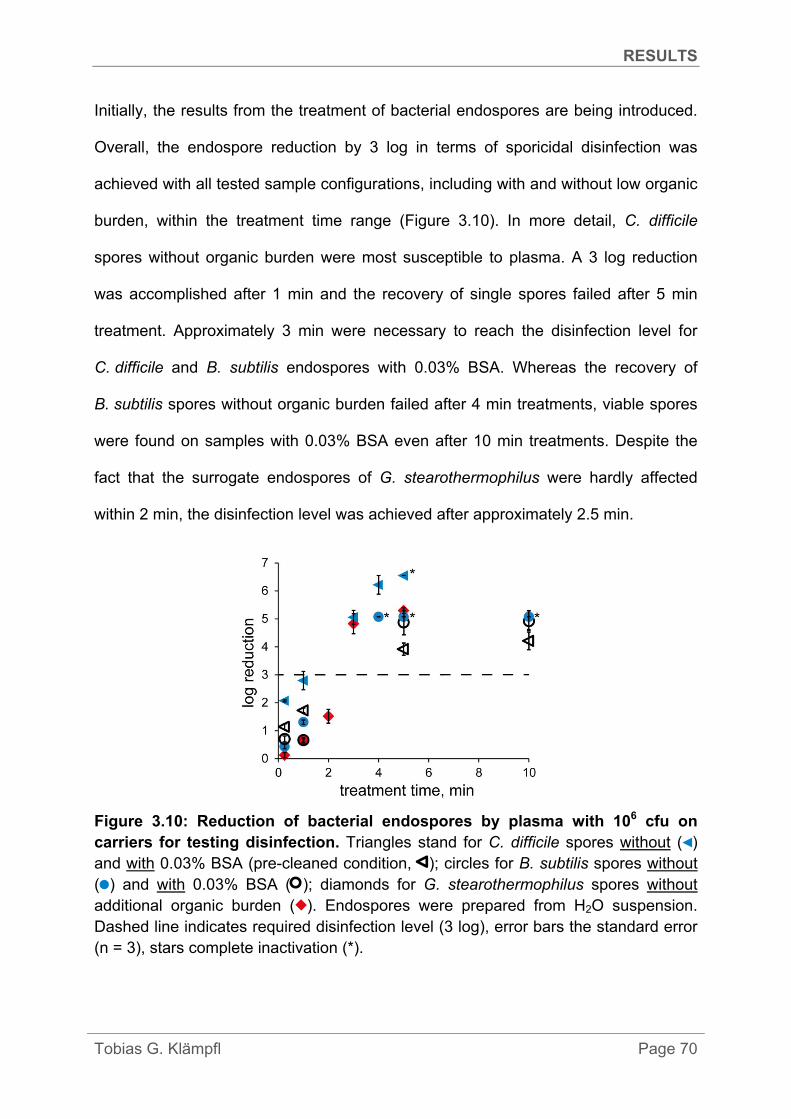
RESULTS
Tobias G. Klämpfl Page 70
Initially, the results from the treatment of bacterial endospores are being introduced.
Overall, the endospore reduction by 3 log in terms of sporicidal disinfection was
achieved with all tested sample configurations, including with and without low organic
burden, within the treatment time range (Figure 3.10). In more detail, C. difficile
spores without organic burden were most susceptible to plasma. A 3 log reduction
was accomplished after 1 min and the recovery of single spores failed after 5 min
treatment. Approximately 3 min were necessary to reach the disinfection level for
C. difficile and B. subtilis endospores with 0.03% BSA. Whereas the recovery of
B. subtilis spores without organic burden failed after 4 min treatments, viable spores
were found on samples with 0.03% BSA even after 10 min treatments. Despite the
fact that the surrogate endospores of G. stearothermophilus were hardly affected
within 2 min, the disinfection level was achieved after approximately 2.5 min.
Figure 3.10: Reduction of bacterial endospores by plasma with 106 cfu on carriers for testing disinfection. Triangles stand for C. difficile spores without ( ) and with 0.03% BSA (pre-cleaned condition, ); circles for B. subtilis spores without ( ) and with 0.03% BSA ( ); diamonds for G. stearothermophilus spores without additional organic burden ( ). Endospores were prepared from H2O suspension. Dashed line indicates required disinfection level (3 log), error bars the standard error (n = 3), stars complete inactivation (*).
RESULTS
Tobias G. Klämpfl Page 71
In contrast to the endospores, the disinfection of E. faecium or S. aureus (108 cfu) on
regular-sized carriers was insufficient (< 2 log in 10 min), but became sufficient, when
the bacteria were inoculated on four time larger carriers (E. faecium, required 5 log in
5 min) (Figure 3.11A). As a consequence, a lower bacterial load (106 cfu) was
applied on regular-sized carriers which indeed does not comply with the underlying
disinfection standards, but coincided with the initial load of bacterial endospores.
Under these conditions, it was possible to examine the influence of the load and
additional substances on disinfection. However, this measure led rather to successful
disinfection, perturbing gradually this effect with higher supplemental burden degree
(Figure 3.11B). In detail, very similar kinetic behaviour was observed for E. faecium
prepared in H2O with or without 0.03% BSA (5 log in 3 min), but the preparation in
saline solution with 0.03% BSA aggravated the reduction (4.3 log in 5 min). The
disinfection level was even reached with heavy burden in form of sheep blood (5 log
in 10 min). Notably, E. faecium was reduced most rapidly again using large carriers
(5 log in 15 s).

RESULTS
Tobias G. Klämpfl Page 72
Figure 3.11: Reduction of vegetative bacteria by plasma with 108 cfu (A) and 106 cfu (B) on carriers for testing disinfection. Triangles stand for E. faecium without 0.03% BSA prepared either from WS ( ) or from SS ( ) and on large carriers (8 cm2) from WS ( ); with 0.03% BSA from WS ( ) and from SS (pre-cleaned condition, ); with heparinized sheep blood ( ). Rings stand for S. aureus with 0.03% BSA from SS (pre-cleaned condition, ). Dashed line indicates required disinfection level (5 log), error bars the standard error (n = 3), stars (*) a possibly higher reduction (only analysed up to required 5 log reduction) in A or complete inactivation in B. WS = H2O suspension, SS = saline suspension.
Next, the microbial distribution on test carriers was examined by SEM imaging, in
order to interpret the different observed inactivation kinetics properly.
In the case of bacterial endospores (Figure 3.12), C. difficile without organic burden
were found distributed in successive patterns over the surface and were usually not
attached to each other, even in more dense regions (Figure 3.12A). In contrast with
organic burden, they formed cluster regions with BSA covering them (Figure 3.12B)
and were surrounded by NaCl crystals (Figure 3.13A). Remnants of vegetative
C. difficile forms were found at both sample configurations (Figure 3.12A/B).
G. stearothermophilus spores appeared on the surface in big agglomerations,
surrounded by organic cell debris left from sporulation process (Figure 3.12C).
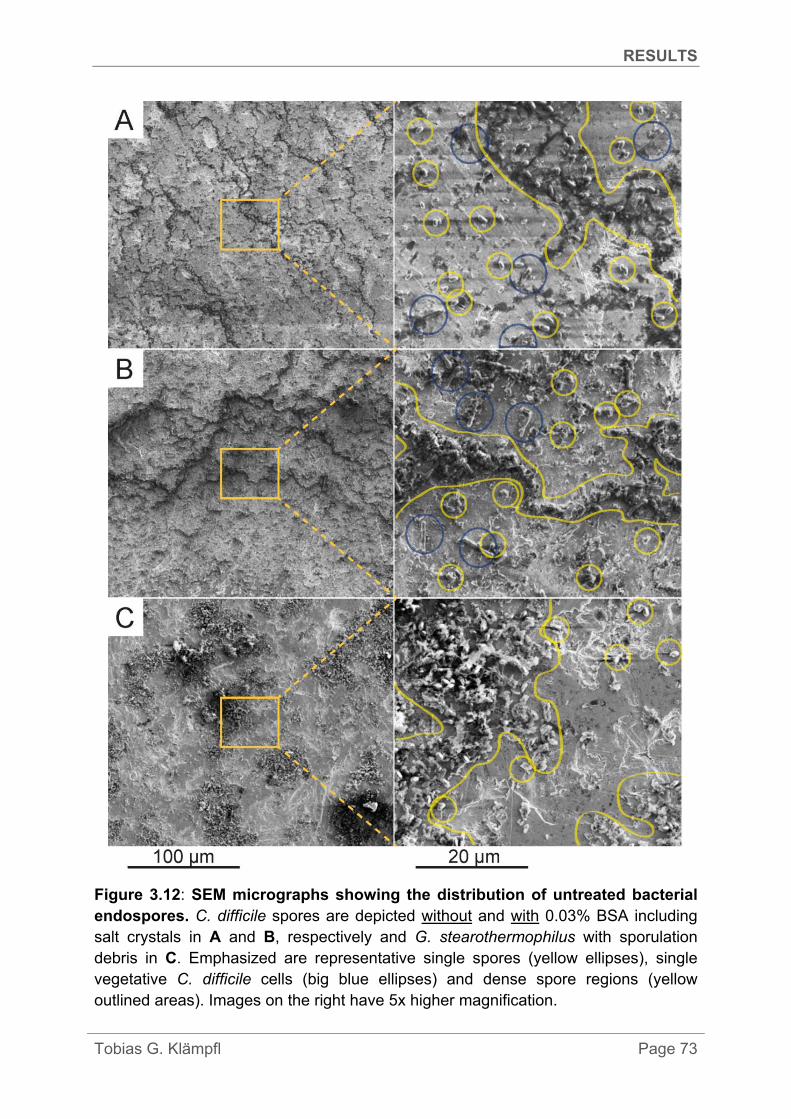
RESULTS
Tobias G. Klämpfl Page 73
Figure 3.12: SEM micrographs showing the distribution of untreated bacterial endospores. C. difficile spores are depicted without and with 0.03% BSA including salt crystals in A and B, respectively and G. stearothermophilus with sporulation debris in C. Emphasized are representative single spores (yellow ellipses), single vegetative C. difficile cells (big blue ellipses) and dense spore regions (yellow outlined areas). Images on the right have 5x higher magnification.

RESULTS
Tobias G. Klämpfl Page 74
Furthermore, the surface occupancy of E. faecium bacteria and varying burden was
assessed by SEM imaging in respect of different loads (Figure 3.14). The rationale
was based on the estimation of spore density in initial SEM images that multi-layering
could occur on carriers with vegetative bacteria which aggravated the plasma
inactivation. In detail, around 100 spores were counted on 50 × 50 µm2 on average.
This means that a load of 106 spores cover 100 µm2 on 2500 µm2 of the carrier, when
one spore occupies 1 µm2 and they are homogenously distributed. As a
consequence, it can be estimated under the assumption of similarity that 108 bacteria
would cover a 100 times larger area which exceeded the used carrier area by a factor
of four. Thus, bacteria would need to from 4 layers to fit into 2500 µm2 of the carrier.
Examining this experimentally, SEM image results reveal that 106 cfu E. faecium
were distributed mostly side-by-side in one layer (Figure 3.14A). Despite the fact that
bacterial cells were not clearly apparent with sheep blood, shapes at the edge of
blood matrix indicated their presence covered by matter (Figure 3.14B). On the
contrary, 108 cfu completely occupied the carrier surface (Figure 3.14C) forming
multi-layers of up to 10 layers (Figure 3.15). Morphological artefacts were present
only at the macrostructure of the bacterial film: Already existing cracks in the dense
film were widened slightly due to vacuum drying (Figure 3.16A1, A2).
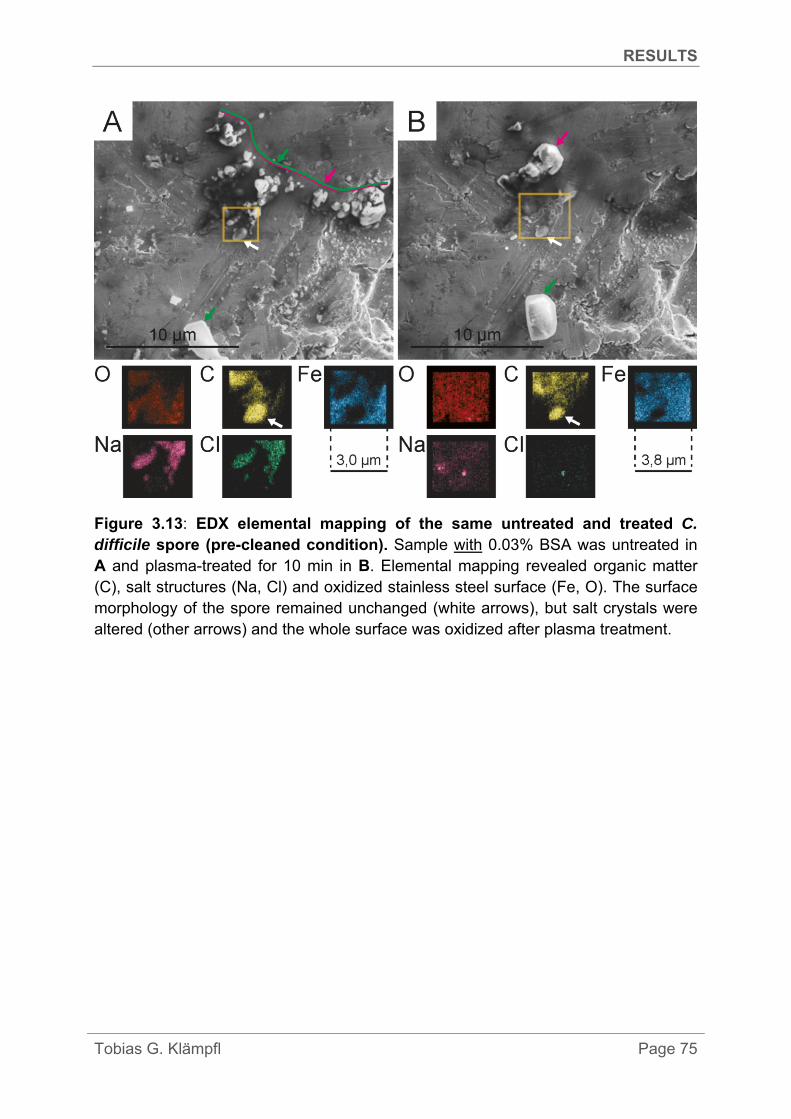
RESULTS
Tobias G. Klämpfl Page 75
Figure 3.13: EDX elemental mapping of the same untreated and treated C. difficile spore (pre-cleaned condition). Sample with 0.03% BSA was untreated in A and plasma-treated for 10 min in B. Elemental mapping revealed organic matter (C), salt structures (Na, Cl) and oxidized stainless steel surface (Fe, O). The surface morphology of the spore remained unchanged (white arrows), but salt crystals were altered (other arrows) and the whole surface was oxidized after plasma treatment.

RESULTS
Tobias G. Klämpfl Page 76
Figure 3.14: SEM micrographs demonstrating the distribution of untreated E. faecium bacteria. 106 cfu were prepared from H2O suspension without organic burden in A, from saline suspension with heparinised sheep blood in B and 108 cfu with 0.03% BSA (pre-cleaned condition) in C. Bacterial cells form a single layer in A, are embedded in the matrix (blue ellipses) of blood flakes (white arrows) in B and form a dense carpet covering the carrier surface, a random single hair (black arrows) and salt crystals (black ellipses) in C. Images on the right have 5x, 20x and 7x higher magnification in A, B and C, respectively.

RESULTS
Tobias G. Klämpfl Page 77
Figure 3.15: SEM micrographs depicting multi-layers of untreated E. faecium bacteria (pre-cleaned condition). 108 cfu with 0.03% BSA were prepared from saline suspension in A and from H2O suspension in B. Scratches in the bacterial carpet revealed metal surface (orange arrow), bacterial multi-layers with 4-5 layers in A and up to 10 layers in B. Emphasized are NaCl crystals (black ellipses), bottom and top of bacterial layers (blue arrows) and thickness of the bacterial layers (white dashed line). Centre and bottom image have 4x higher magnification.

RESULTS
Tobias G. Klämpfl Page 78
Figure 3.16: SEM micrographs demonstrating untreated and treated E. faecium bacteria (108 cfu; pre-cleaned condition). Samples were prepared with 0.03% BSA. The same untreated sample area (A1) was imaged again after 7 days storage at 2 - 8 °C (A2). Another sample was imaged after 10 min plasma treatment in B. Storage/vacuum drying caused an increase of already visible cracks and humidity change upon storage dissolved salt crystals at images on the left side in A. Missing salt structures can also be observed in B (holes). Plasma treatment itself did not affect the surface morphology of bacterial cells. Centered images have 10x and images on the right 40x higher magnification compared to images on the very left.
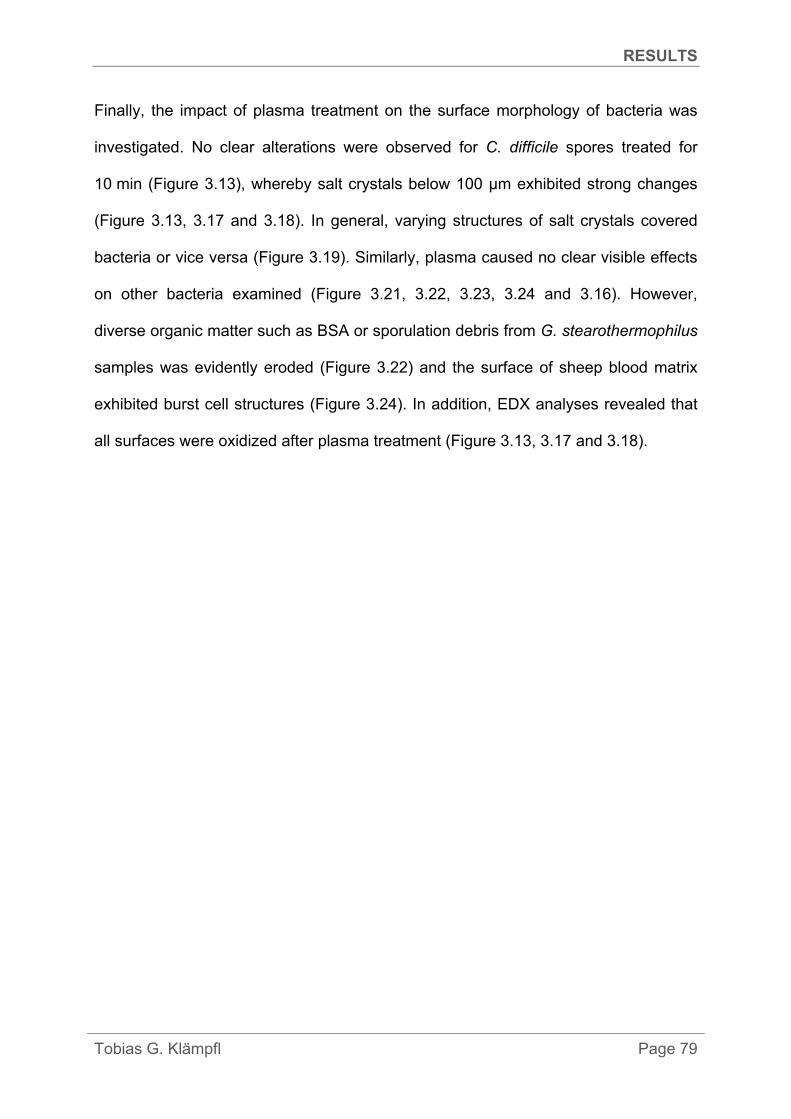
RESULTS
Tobias G. Klämpfl Page 79
Finally, the impact of plasma treatment on the surface morphology of bacteria was
investigated. No clear alterations were observed for C. difficile spores treated for
10 min (Figure 3.13), whereby salt crystals below 100 μm exhibited strong changes
(Figure 3.13, 3.17 and 3.18). In general, varying structures of salt crystals covered
bacteria or vice versa (Figure 3.19). Similarly, plasma caused no clear visible effects
on other bacteria examined (Figure 3.21, 3.22, 3.23, 3.24 and 3.16). However,
diverse organic matter such as BSA or sporulation debris from G. stearothermophilus
samples was evidently eroded (Figure 3.22) and the surface of sheep blood matrix
exhibited burst cell structures (Figure 3.24). In addition, EDX analyses revealed that
all surfaces were oxidized after plasma treatment (Figure 3.13, 3.17 and 3.18).

RESULTS
Tobias G. Klämpfl Page 80
Figure 3.17: SEM micrographs showing the same untreated and treated salt macrostructures from carriers with 0.03% BSA. Sample was untreated in A and plasma-treated for 10 min in B. NaCl macrostructures were mainly not affected, but their edges were smoothed. Elemental mapping by EDX revealed oxidation of whole surface after treatment.
Figure 3.18: SEM micrographs demonstrating the same untreated and treated salt microstructures from carriers with 0.03% BSA. Sample was untreated in A and plasma-treated for 10 min in B. NaCl microstructures below 100 μm were strongly affected by plasma. Their crystal shapes were reformed. Elemental mapping by EDX revealed oxidation of whole surface after treatment.

RESULTS
Tobias G. Klämpfl Page 81
Figure 3.19: SEM micrographs from different samples exposing various salt structures after BSA addition. Bulky dendrites were observed in A, smaller structures distributed together with C. difficile spores in B, cubic crystals on an E. faecium carpet in C and a thin dentritic layer covering E. faecium bacteria in D.
Figure 3.20: SEM micrographs depicting untreated and treated carriers with 0.03% BSA. The BSA film (dark spots) was disrupted by plasma and metal surface became apparent (bright spots). Images on the right have a 5x higher magnification.

RESULTS
Tobias G. Klämpfl Page 82
Figure 3.21: SEM micrographs showing untreated and treated C. difficile spores (pre-cleaned condition). Spores with 0.03% BSA were untreated in A and plasma-treated for 10 min in B. The morphology of C. difficile spores was not affected. Images on the right have a 4x higher magnification. Emphasized are single spores (yellow ellipses).
Figure 3.22: SEM micrographs demonstrating the same untreated and treated G. stearothermophilus spores. They were untreated in A and plasma-treated for 10 min in B. Cell debris was degraded and fused together after plasma treatment. Many spores vanished and present spores were covered by organic matter. Centered images have 5x and images on the right 100x higher magnification.
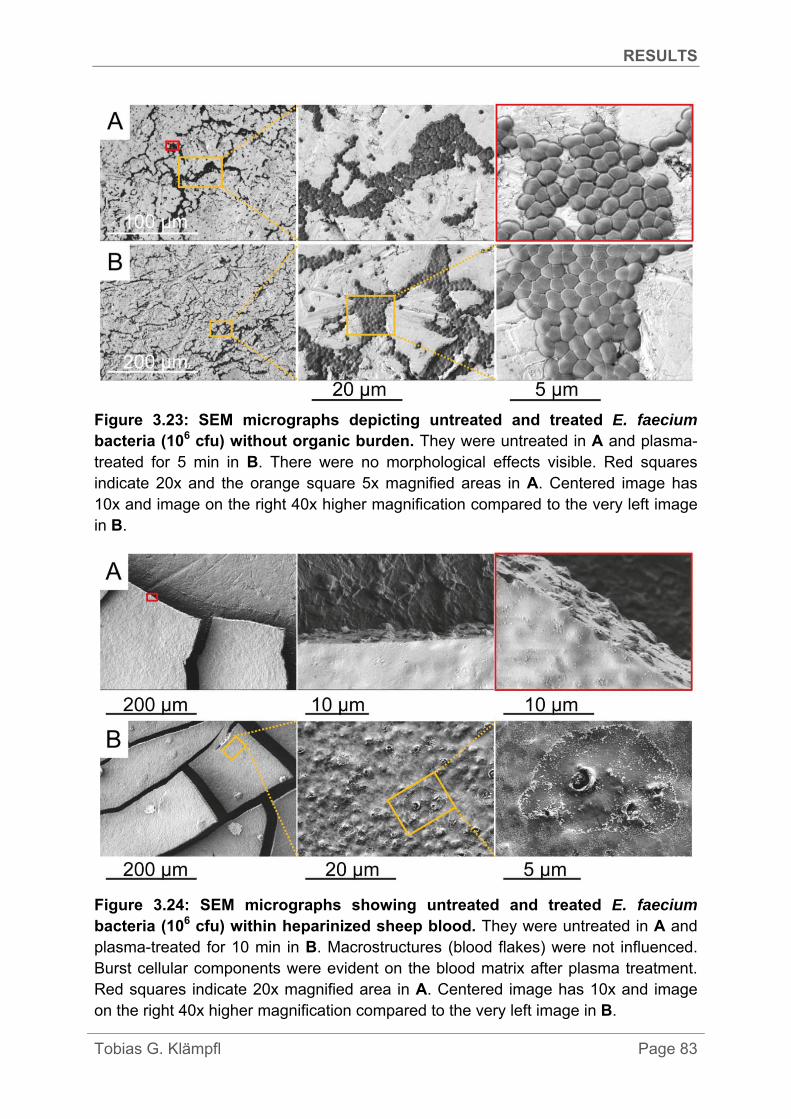
RESULTS
Tobias G. Klämpfl Page 83
Figure 3.23: SEM micrographs depicting untreated and treated E. faecium bacteria (106 cfu) without organic burden. They were untreated in A and plasma-treated for 5 min in B. There were no morphological effects visible. Red squares indicate 20x and the orange square 5x magnified areas in A. Centered image has 10x and image on the right 40x higher magnification compared to the very left image in B.
Figure 3.24: SEM micrographs showing untreated and treated E. faecium bacteria (106 cfu) within heparinized sheep blood. They were untreated in A and plasma-treated for 10 min in B. Macrostructures (blood flakes) were not influenced. Burst cellular components were evident on the blood matrix after plasma treatment. Red squares indicate 20x magnified area in A. Centered image has 10x and image on the right 40x higher magnification compared to the very left image in B.
RESULTS
Tobias G. Klämpfl Page 84
3.6 SMD plasma surface disinfection (modified 4-field-test)
SMD air plasma has shown strong bactericidal effects against nosocomial bacteria
on small model carriers inside the FP2.0 at closed conditions. The outcomes so far
indicated some limitations of plasma inactivation especially that the bacterial density
on carriers was a limiting factor. As a next step, the potential of plasma in disinfecting
large-area surfaces such as floors in healthcare settings was studied. In the so-called
modified 4-field-test, nosocomial bacteria were treated with plasma on 25 cm2 fields
marked on PVC flooring while simulating pre-cleaned conditions (with 0.03% BSA).
Therefore, the SMD system was modified, in order to apply plasma at open
conditions (35 mW/cm2, 0.5 cm distance).
At the beginning, it was essential to specify the recovery of bacteria from drying
control field D and from control field number 4, neighboring the plasma-treated fields,
in order to elucidate the influence of side-diffusing plasma species (Figure 3.25A, B).
The swab method allowed the recovery of ca. 50 % of initially loaded spores and ca.
15 % vegetative bacteria from the drying control. In the case of bacterial endospores,
adjacent treatments caused a 30% and 20% loss of viable C. difficile and B. subtilis
on the practically untreated field no. 4, independent from the treatment time,
respectively (Figure 3.25A). In contrast, vegetative bacteria E. faecium and S. aureus
did not show loss or a clear tendency towards loss through passive treatments
(Figure 3.25B).
However, the static but this time active plasma treatment of bacteria on fields number
1, 2 and 3 missed required disinfection levels by far (Figure 3.25C). A maximum of
2 log reduction was achieved over the course of 10 min treatments among all tested
bacteria. Bacterial endospores were more resistant with B. subtilis spores not
significantly inactivated in 5 min, whereas C. difficile spores showed at least 1 log
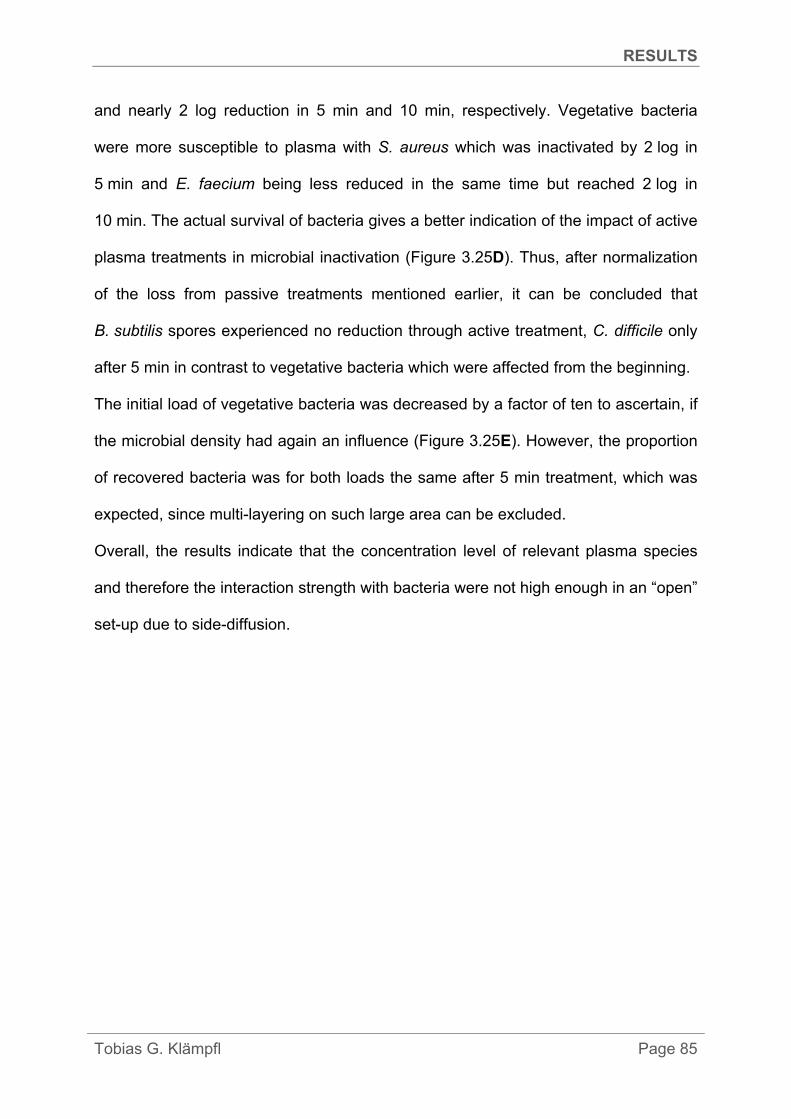
RESULTS
Tobias G. Klämpfl Page 85
and nearly 2 log reduction in 5 min and 10 min, respectively. Vegetative bacteria
were more susceptible to plasma with S. aureus which was inactivated by 2 log in
5 min and E. faecium being less reduced in the same time but reached 2 log in
10 min. The actual survival of bacteria gives a better indication of the impact of active
plasma treatments in microbial inactivation (Figure 3.25D). Thus, after normalization
of the loss from passive treatments mentioned earlier, it can be concluded that
B. subtilis spores experienced no reduction through active treatment, C. difficile only
after 5 min in contrast to vegetative bacteria which were affected from the beginning.
The initial load of vegetative bacteria was decreased by a factor of ten to ascertain, if
the microbial density had again an influence (Figure 3.25E). However, the proportion
of recovered bacteria was for both loads the same after 5 min treatment, which was
expected, since multi-layering on such large area can be excluded.
Overall, the results indicate that the concentration level of relevant plasma species
and therefore the interaction strength with bacteria were not high enough in an “open”
set-up due to side-diffusion.
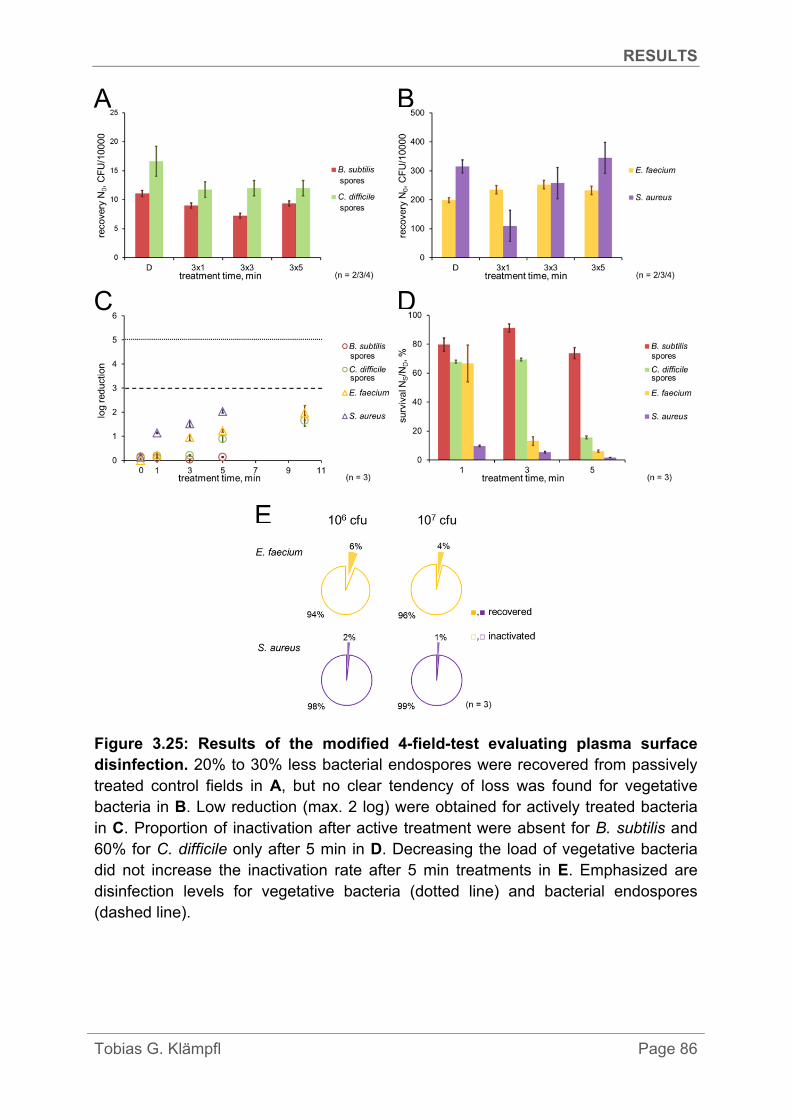
RESULTS
Tobias G. Klämpfl Page 86
Figure 3.25: Results of the modified 4-field-test evaluating plasma surface disinfection. 20% to 30% less bacterial endospores were recovered from passively treated control fields in A, but no clear tendency of loss was found for vegetative bacteria in B. Low reduction (max. 2 log) were obtained for actively treated bacteria in C. Proportion of inactivation after active treatment were absent for B. subtilis and 60% for C. difficile only after 5 min in D. Decreasing the load of vegetative bacteria did not increase the inactivation rate after 5 min treatments in E. Emphasized are disinfection levels for vegetative bacteria (dotted line) and bacterial endospores (dashed line).
A B
C D
E
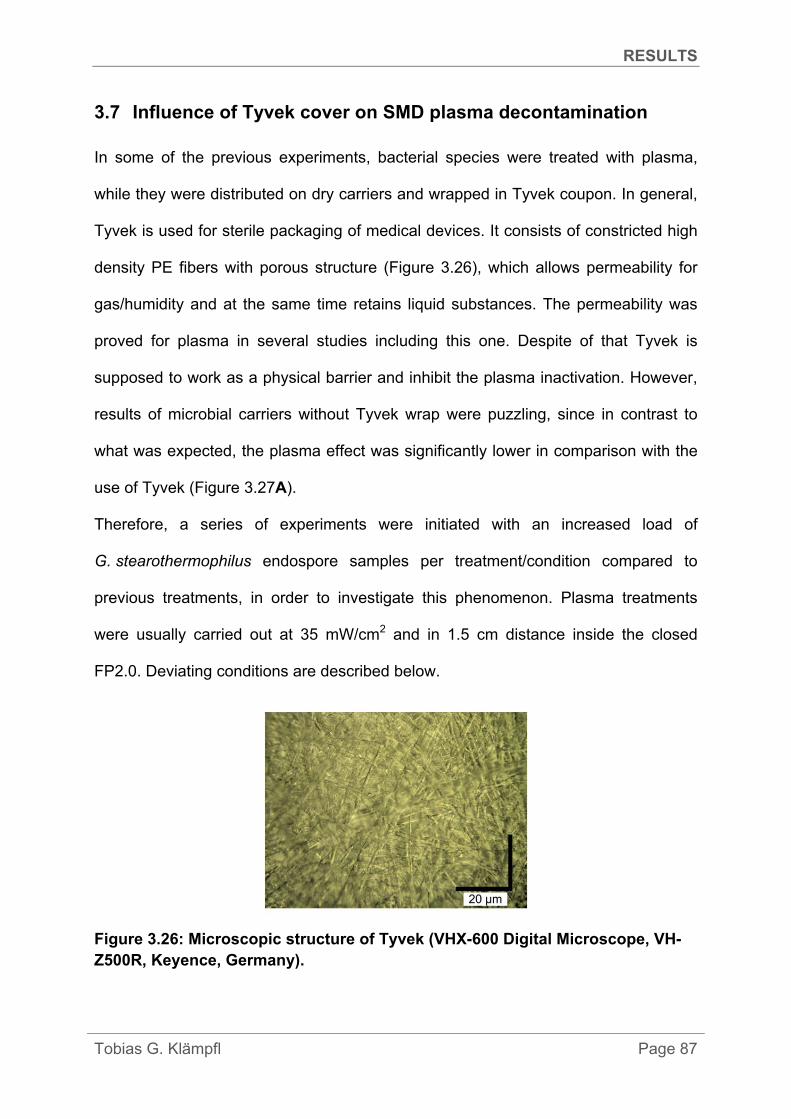
RESULTS
Tobias G. Klämpfl Page 87
3.7 Influence of Tyvek cover on SMD plasma decontamination
In some of the previous experiments, bacterial species were treated with plasma,
while they were distributed on dry carriers and wrapped in Tyvek coupon. In general,
Tyvek is used for sterile packaging of medical devices. It consists of constricted high
density PE fibers with porous structure (Figure 3.26), which allows permeability for
gas/humidity and at the same time retains liquid substances. The permeability was
proved for plasma in several studies including this one. Despite of that Tyvek is
supposed to work as a physical barrier and inhibit the plasma inactivation. However,
results of microbial carriers without Tyvek wrap were puzzling, since in contrast to
what was expected, the plasma effect was significantly lower in comparison with the
use of Tyvek (Figure 3.27A).
Therefore, a series of experiments were initiated with an increased load of
G. stearothermophilus endospore samples per treatment/condition compared to
previous treatments, in order to investigate this phenomenon. Plasma treatments
were usually carried out at 35 mW/cm2 and in 1.5 cm distance inside the closed
FP2.0. Deviating conditions are described below.
Figure 3.26: Microscopic structure of Tyvek (VHX-600 Digital Microscope, VH-Z500R, Keyence, Germany).

RESULTS
Tobias G. Klämpfl Page 88
To begin with, the analysis method was validated by simultaneous analysis of
microbial carriers at MPE and Simicon GmbH with subsequent comparison of the
results of recovered spores (Figure 3.27B, C). In relation to certified 2 × 10⁶ cfu by
Simicon GmbH, 80% or 90% were recovered from untreated samples and 1% or
0.5% from treated samples at MPE or the company, respectively. These results were
sufficient to move on with initial 1.6 × 10⁶ cfu recovered from untreated samples at
MPE which served as the basis for further determinations of log reduction after
plasma treatment. Thereby, the fact of the large discrepancy in the log reduction of
plasma-treated samples in or without Tyvek coupon was confirmed (Figure 3.27D).
Figure 3.27: Quantification results of untreated and plasma-treated endospores recovered from dry carriers. Discrepancy in microbial reductions was observed with or without Tyvek use in A. Validation of analysis method of untreated and plasma-treated samples in B and C, respectively. Difference in inactivation was confirmed in D. Emphasized are disinfection level (dotted line), detection limit (*, G. stearothermophilus, Simicon GmbH/MPE) or complete inactivation (*, C. difficile, IHPH).
A B
C D

RESULTS
Tobias G. Klämpfl Page 89
As a starting hypothesis, the Tyvek cover itself being in contact with the carrier
surface could decrease the recovery of spores, because plasma is able to enhance
adhesion to polymeric materials. Therefore, the recovery of untreated spores was
evaluated from artificially inoculated Tyvek and from Tyvek wrapped around
conventional biological indicator samples. The analysis of the first configuration
proved that 100% of inoculated G. stearothermophilus were generally recoverable
from Tyvek and analysis of the second configuration resulted in recovery of estimated
0.5 ± 0.1% from Tyvek surface being in contact with microbial carrier (certified 2 ×
106 cfu load). Therefore, analysis of Tyvek covers from plasma-treated biological
indicators is supposed to indicate clearly the degree of viable spores attached to
Tyvek. However, 5 min treatment caused in concordance with the carrier results zero
recovery which implied that all spores were inactivated independently from the
adhesive behavior. In addition, the arrangement of spacing between Tyvek and the
sample by placing the microbial carrier inside a vessel confirmed again that carrier
contact to Tyvek per se did not influence microbial reduction (Figure 3.28A).
Surprisingly and most importantly, control tests without the Tyvek wrap disproved the
described phenomenon and showed on the contrary same level of inactivation
compared to tests with wrapped samples (Figure 3.28A). It was concluded from this
finding that the Tyvek cover per se or related subjects such as the volume inside the
coupon (Figure 3.28C) were responsible for the phenomenon. The Tyvek cover in
fact hindered the inactivation as you would expect to happen (Figure 3.28C).
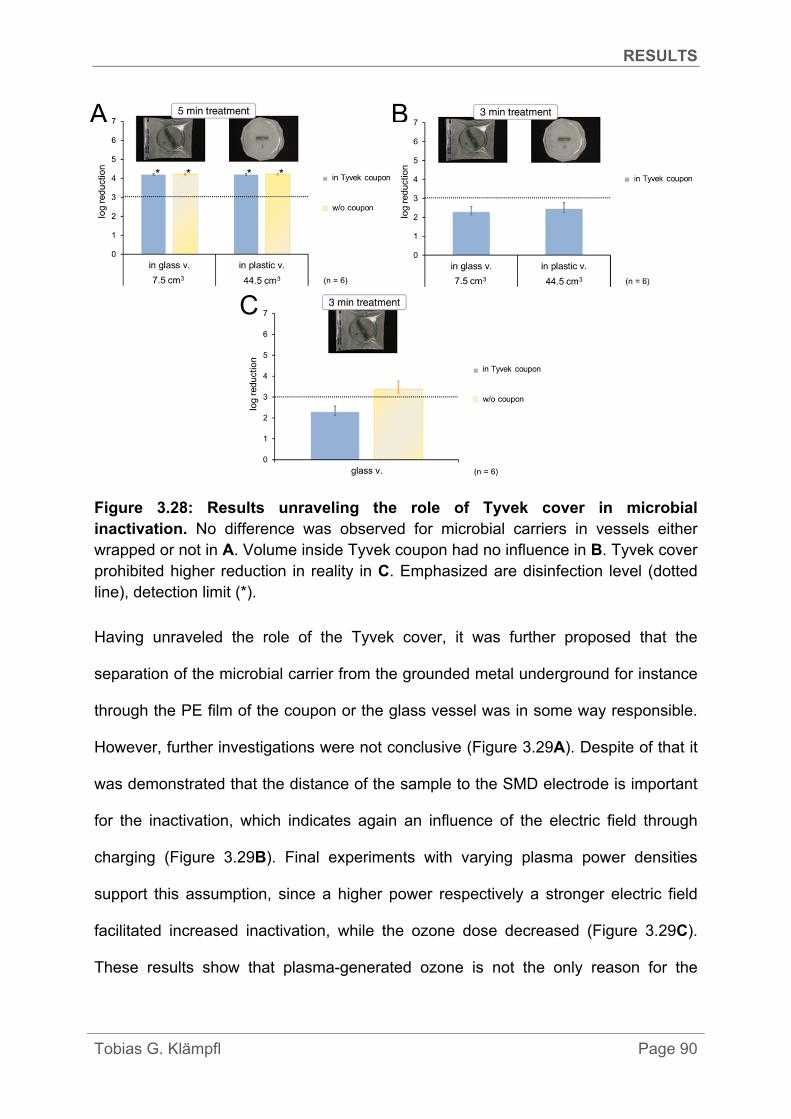
RESULTS
Tobias G. Klämpfl Page 90
Figure 3.28: Results unraveling the role of Tyvek cover in microbial inactivation. No difference was observed for microbial carriers in vessels either wrapped or not in A. Volume inside Tyvek coupon had no influence in B. Tyvek cover prohibited higher reduction in reality in C. Emphasized are disinfection level (dotted line), detection limit (*).
Having unraveled the role of the Tyvek cover, it was further proposed that the
separation of the microbial carrier from the grounded metal underground for instance
through the PE film of the coupon or the glass vessel was in some way responsible.
However, further investigations were not conclusive (Figure 3.29A). Despite of that it
was demonstrated that the distance of the sample to the SMD electrode is important
for the inactivation, which indicates again an influence of the electric field through
charging (Figure 3.29B). Final experiments with varying plasma power densities
support this assumption, since a higher power respectively a stronger electric field
facilitated increased inactivation, while the ozone dose decreased (Figure 3.29C).
These results show that plasma-generated ozone is not the only reason for the
C
A B

RESULTS
Tobias G. Klämpfl Page 91
inactivation of G. stearothermophilus spores. Further investigations on this topic are
warranted.
Figure 3.29: Experiments indicating influence of electric field on microbial inactivation. Emphasized are disinfection level (dotted line), detection limit (*).
A B
C
DISCUSSION
Tobias G. Klämpfl Page 92
4 DISCUSSION
4.1 Summary
During my doctoral work I developed a SMD electrode system, characterized the
plasma generated at ambient air conditions, investigated its decontaminating
behavior against bacterial species including nosocomial bacteria such as C. difficile
endospores and revealed factors influencing the decontamination.
Certain requirements had to be fulfilled by every component of the electrode system.
Essential was the chemical stability of used materials against oxidizing plasma
species followed by homogenous discharge pattern and bactericidal efficacy which
was assured by a stainless steel mesh grid as grounded electrode. A Teflon dielectric
film showed best performance in regards of chemical and electric stability and a
brass plate was favored as powered electrode. Finally, the electrode system was
installed inside a box which served from then on as SMD device (FlatPlaSter 2.0).
Furthermore, with the help of plasma diagnostic tools I demonstrated that mainly
excited N2 and perhaps NO molecules emitted photons, the emitted UV-C power was
below 660 nW/cm2, temperature rise ranged from 0.1 to 3 °C per minute and the
dissipated plasma power from 20 to 200 mW/cm2. The ozone concentration was
measured most appropriately in situ and reached maximum 13,500 ppm and higher
power resulted in a change in the concentration curve with declining rate. Notably,
the high ozone retention time led also to similar high doses, after the discharge was
stopped.
Afterwards, I demonstrated in initial quantification experiments that SMD air plasma
showed high bactericidal effects against different bacteria on agar plates with 5 log
reduction in 30 s independent from the bacterial type and with a potential complete
inactivation in 5 min.
DISCUSSION
Tobias G. Klämpfl Page 93
Next, I studied the sporicidal action of plasma treating microbial carriers used as
biological indicators according to standard sterilization testing. G. stearothermophilus
demonstrated indeed the highest resistance among tested endospores, yet was
inactivated to the detection limit within 5 min independent from the carrier material
which was still faster compared to reference sterilization methods.
In the following, I addressed the plasma decontamination of carriers loaded with
nosocomial bacteria using disinfection testing standards. The inactivation of
C. difficile endospores surpassed the disinfection level even with 0.03% BSA burden
within 5 min, which was not achieved with vegetative E. faecium or S. aureus at any
time. Disinfection was thereby facilitated by reducing the bacterial density of E.
faecium and thus avoiding multi-layering observed by SEM which prevented the
access of gaseous plasma species to bacteria in lower layers. Other supplemental
burden such as cell debris or salt crystals was identified by SEM that aggravated
plasma disinfection. Nevertheless, disinfection was achieved even with heavy burden
in form of sheep blood. Whereas surface morphologies of bacteria were not clearly
altered by plasma, EDX elemental mapping revealed that treated surfaces were
completely oxidized.
I adapted the SMD electrode in respect of secure handling for further antimicrobial
tests with the same nosocomial bacteria outside the device. The 4-field-test was
applied that was modified from a proposed standard test concerning the disinfection
of large clinical surfaces. However, the disinfection level was neither reached for
vegetative bacteria nor bacterial endospores on PVC flooring treated up to 10 min
which was attributed to the side-diffusion of plasma species.
Finally, I investigated the role of plasma-permeable Tyvek cover which was used in
carrier tests and had strongly facilitated the inactivation. This phenomenon was

DISCUSSION
Tobias G. Klämpfl Page 94
disproved by treating and analyzing G. stearothermophilus endospore samples,
where Tyvek rather functioned as a physical barrier and aggravated the plasma
effect, as expected. Additionally, further results propose an influence of charging by
the electric field applied during discharge. Finally, attributing the plasma effect solely
to the ozone dose was excluded.
4.2 Considerations for developing a SMD device
Since this is a study based on a technology, some important technical aspects in the
development of the SMD electrode system are briefly discussed. Overall, the
underlying criteria for choosing the proper grounded electrode were adequate for
material evaluation in my study. Inhomogeneous discharge patterns led to varying
and insufficient inactivation results in agar plate tests. This was circumvented by the
use of mechanical stable materials encompassing the electrode area and proper
fixation. The bactericidal effect of the plasma gained significance in following
experiments after the assurance that the given electrode material was chemically
stable against plasma. Therefore, the chosen stainless steel mesh electrode fulfilled
at best all criteria among tested electrodes.
However, there are aspects that have to be considered for future experiments. The
dissipated plasma power was not measured, which would have been a more
adequate parameter for comparing different electrode systems than the externally
applied frequency and voltage. In the case of the chosen mesh, the dielectric surface
was not optimally occupied by filaments. Hence, the density of generated micro-
discharges each of them working as its own chemical reactor could be increased for
a possible improved performance. This could be accomplished by a smaller mesh
size and a hexagonal mesh pattern to utilize more space for micro-discharges.
DISCUSSION
Tobias G. Klämpfl Page 95
However, processing to such shapes is complex in the case of stainless steel. In
general, sole dimensioning does not make sense, rather a balancing of the
geometrical and power parameters is required, as discharge filaments do not overlap
with each other and can create discharge-free areas [38]. In addition, higher heat
production and thus, a less stable dielectric might have to be considered.
The dielectric permittivity and thickness of a material define on the one hand the
interaction strength between the electrodes and on the other hand the resistance
against abrupt spark breakdown, which defines a disruptive discharge through
insulation accompanied by a large increase in current. Because facilitated interaction
allows rather a plasma discharge at lower electric power and at the same time has a
higher chance of undesired sparking, careful choice of materials has to be made at a
given power parameter range. In general, the dielectric material as any other
materials in the device set-up should be resistant against corrosives generated in air
plasma. Otherwise, frequent maintenance by exchanging parts have to take place or
as well undesired interfering effects on the actual target such as coating can occur.
Therefore, the substitution of the dielectric from POM to Teflon was correct, but also
the housing parts made of POM, the polycarbonate lid as well as the powered
electrode made of brass, which still exhibited strong features of tarnishing have to be
substituted with chemically inert materials in the future. Especially POM has
demonstrated bad performance: the device interior degraded or single parts even
broke (sample removing pole, SMD electrode holding frame).
However, the lifetime of the Teflon dielectric varied and its removal became
necessary every time accidental spark breakdown occurred. Notably, I experienced
that the exclusion of humidity, which preferably condensed between the powered
electrode and the dielectric, by sealing the free electrode parts enhanced the

DISCUSSION
Tobias G. Klämpfl Page 96
dielectric lifetime remarkably. Therefore, it is suggested to seal the combined parts of
the electrode system or to use one-piece systems, like printed circuit boards
(attention: non-resistant metals normally used) or like electrodes sticking together
with hardening ceramic dielectric as applied by Li et al. [151]. However, separate
electrode parts have the advantage that only the dielectric has to be exchanged upon
failure.
If the application of the SMD device is considered for the prospective treatment of
living tissue such as for hand sanitizing purposes [56, 64, 112, 131, 152], a great
safety issue has to be circumvented. Is it possible to avoid fatal spark breakdown
through dielectric failure at any time of use? Beside the concerns about acquiring the
proper hand disinfection results and about unknown long-term effects of plasma on
human skin, the avoidance of life-threatening sparking cannot be assured upon
frequent usage of the SMD electrode of my work. This disqualifies it for the treatment
of human tissue, even if it is possible to touch the actual micro-discharges. However,
the situation could be improved by the use of micro- or nanosecond pulses instead of
sinusoidal wave frequency as described for a floating-electrode DBD in direct contact
with tissue or sensitive materials [70, 153]. Pulses would allow a random spread of
micro-discharges over the dielectric surface and avoid the continuous filament
formation in the same spots. It would result in higher discharge uniformity and less
stress to the dielectric material, especially polymers, since local temperature rise.
Thus temperature can be elevated in filament channels and local electrostatic
charges can be limited. However, there are examples of DBD devices that seem to
be electrically safe [29, 154]. In addition, remote treatments with the hands far from
the DBD source would be quite safe.
DISCUSSION
Tobias G. Klämpfl Page 97
Finally, up-scaling the SMD device prototype (FP2.0), which might be required for
commercial use, is technically not a problem, as it has been demonstrated for other
industrial DBD reactors [10]. However, the prototype was not totally sealed.
Therefore, it might be appropriate to provide air-tight closures such as at the lid
opening, in order to prohibit putative diffusion of gaseous plasma species to the
outside first of all to protect the user and further to avoid losing potential species for
the decontamination goal.
4.3 Ozone and other traits about SMD air plasma
The characterization of the SMD air plasma revealed physical and chemical
specifications of the discharge. Ozone was measured in enormous concentrations,
whereas UV radiation and temperature are physical measures with minor importance,
while maximum 23 W are consumed by the discharge.
For the majority of the microbial experiments, the power was set low to 4 W, which
corresponds for instance to the power consumed by a modern current-saving LED
lamp for households. In addition to the measurement of the air temperature inside the
FP2.0, I recommend to monitor the material temperatures at the electrode system, in
order to control dielectric breakdown in a better way. The generated UV-C power is
far below the critical power density of 50 µW/cm2, which are known to start affecting
bacterial viability [155]. This is not surprising due to the production of considerable
quantities of ozone that absorb UV-C. However, OES analysis showed that UV-A and
UV-B radiation occur in higher quantities and thus, could participate as well in
photodissociation processes. OES spectral analysis was not able to identify in a clear
manner excited plasma molecules other than N2. Since NO emissions are assumed
to be present in the spectra and ozone was quenched at higher plasma power
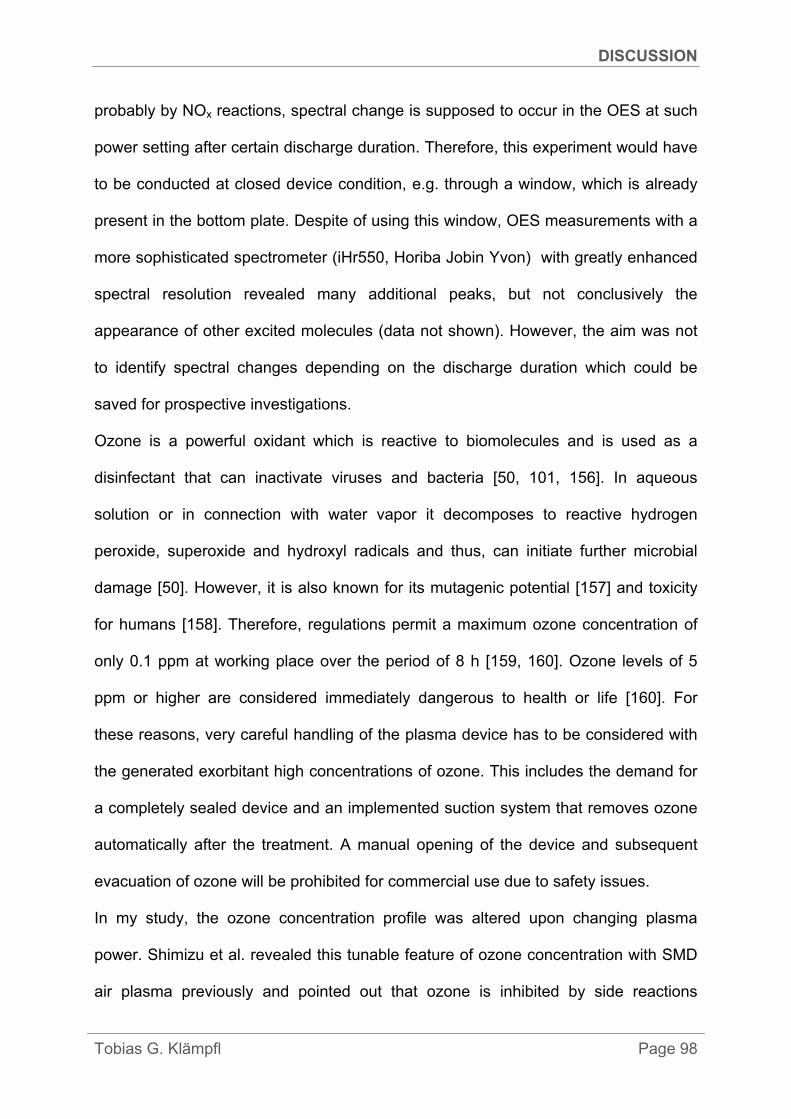
DISCUSSION
Tobias G. Klämpfl Page 98
probably by NOx reactions, spectral change is supposed to occur in the OES at such
power setting after certain discharge duration. Therefore, this experiment would have
to be conducted at closed device condition, e.g. through a window, which is already
present in the bottom plate. Despite of using this window, OES measurements with a
more sophisticated spectrometer (iHr550, Horiba Jobin Yvon) with greatly enhanced
spectral resolution revealed many additional peaks, but not conclusively the
appearance of other excited molecules (data not shown). However, the aim was not
to identify spectral changes depending on the discharge duration which could be
saved for prospective investigations.
Ozone is a powerful oxidant which is reactive to biomolecules and is used as a
disinfectant that can inactivate viruses and bacteria [50, 101, 156]. In aqueous
solution or in connection with water vapor it decomposes to reactive hydrogen
peroxide, superoxide and hydroxyl radicals and thus, can initiate further microbial
damage [50]. However, it is also known for its mutagenic potential [157] and toxicity
for humans [158]. Therefore, regulations permit a maximum ozone concentration of
only 0.1 ppm at working place over the period of 8 h [159, 160]. Ozone levels of 5
ppm or higher are considered immediately dangerous to health or life [160]. For
these reasons, very careful handling of the plasma device has to be considered with
the generated exorbitant high concentrations of ozone. This includes the demand for
a completely sealed device and an implemented suction system that removes ozone
automatically after the treatment. A manual opening of the device and subsequent
evacuation of ozone will be prohibited for commercial use due to safety issues.
In my study, the ozone concentration profile was altered upon changing plasma
power. Shimizu et al. revealed this tunable feature of ozone concentration with SMD
air plasma previously and pointed out that ozone is inhibited by side reactions
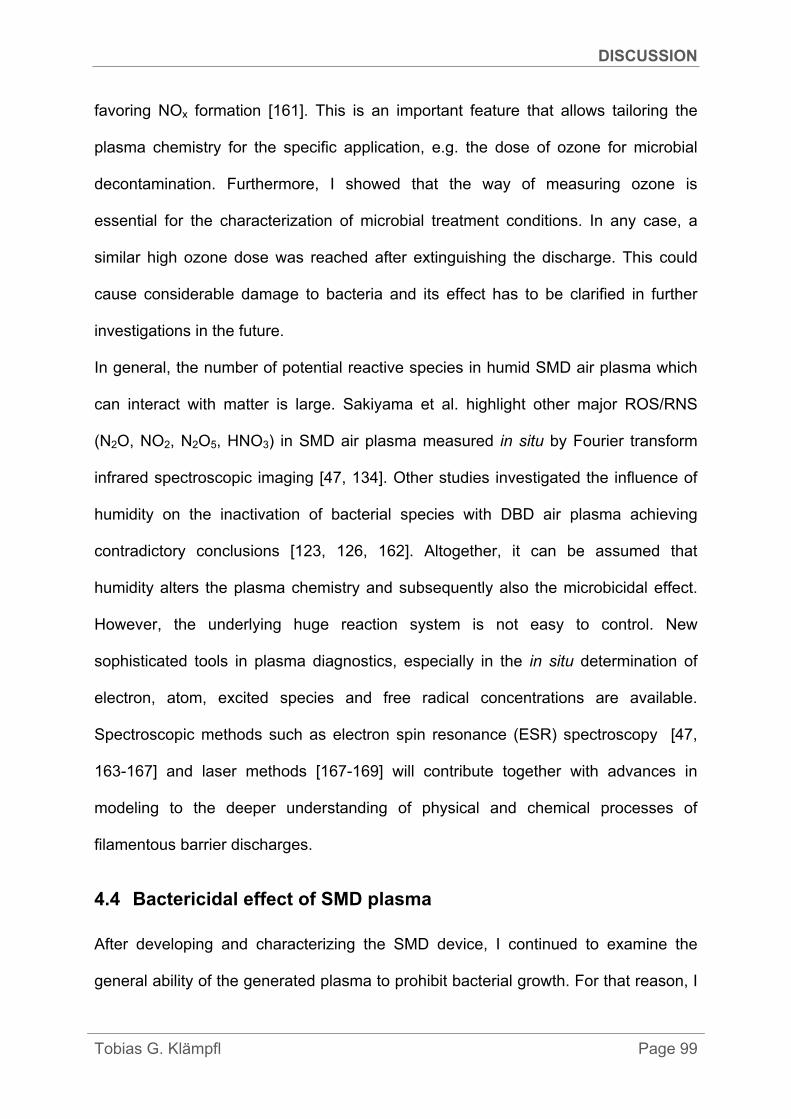
DISCUSSION
Tobias G. Klämpfl Page 99
favoring NOx formation [161]. This is an important feature that allows tailoring the
plasma chemistry for the specific application, e.g. the dose of ozone for microbial
decontamination. Furthermore, I showed that the way of measuring ozone is
essential for the characterization of microbial treatment conditions. In any case, a
similar high ozone dose was reached after extinguishing the discharge. This could
cause considerable damage to bacteria and its effect has to be clarified in further
investigations in the future.
In general, the number of potential reactive species in humid SMD air plasma which
can interact with matter is large. Sakiyama et al. highlight other major ROS/RNS
(N2O, NO2, N2O5, HNO3) in SMD air plasma measured in situ by Fourier transform
infrared spectroscopic imaging [47, 134]. Other studies investigated the influence of
humidity on the inactivation of bacterial species with DBD air plasma achieving
contradictory conclusions [123, 126, 162]. Altogether, it can be assumed that
humidity alters the plasma chemistry and subsequently also the microbicidal effect.
However, the underlying huge reaction system is not easy to control. New
sophisticated tools in plasma diagnostics, especially in the in situ determination of
electron, atom, excited species and free radical concentrations are available.
Spectroscopic methods such as electron spin resonance (ESR) spectroscopy [47,
163-167] and laser methods [167-169] will contribute together with advances in
modeling to the deeper understanding of physical and chemical processes of
filamentous barrier discharges.
4.4 Bactericidal effect of SMD plasma
After developing and characterizing the SMD device, I continued to examine the
general ability of the generated plasma to prohibit bacterial growth. For that reason, I

DISCUSSION
Tobias G. Klämpfl Page 100
treated indirectly with plasma various bacteria inoculated onto agar and assessed
quantitatively, how many bacteria were able to grow after treatment.
My kinetic study showed that 30 s treatments were sufficient to reduce the initial
bacterial load by 4 to 5 log. Longer treatments caused in all cases a progressive, but
retarded reduction curve with the potential of complete inactivation after 5 min
(> 7 log). My findings coincide with the observations made by Gadri et al., who
treated similarly with a remote air DBD system E. coli on agar plates, which resulted
also in a 7 log reduction after 5 min treatment [105]. In another study from my group,
we could demonstrate that 30 s plasma treatment inacivated 15 different bacterial
species, which were partially isolates from clinical patients (e.g. MRSA, VRE,
C. difficile) or nosocomial relevant type strains (e.g. Group A Streptococcus
pyogenes, Corynebacterium jeikeium), in the same log range as I achieved in my
work [131].
In our studies, no clear difference in the inactivation between gram-negative (here:
E. coli or P. aeruginosa) and gram-positive (here: E. mundtii) was observed. Results
of both studies herein suggest that there is no selectivity or protection to CAP based
on the bacterial cell wall structure. In my work, the spread of the reduction level
among different bacterial strains can be assigned to the deviation of initial loads,
which is normal in microbiological testing and was circumvented by normalizing. For
that reason, the spread cannot be referred to specific characteristics of a MO that
result in higher resistance against chemical stress (such as antibiotic agents in the
case of MRSA [131]) or physical environmental stress (such as desiccation, heat or
irradiation in the case of B. pumilus [131]). In addition, the effect of SMD air plasma
was not influenced by mechanisms of microbial resistance against antibiotics (innate
or acquired) [131, 170]. This is reasonable, since plasma consists of a mixture of
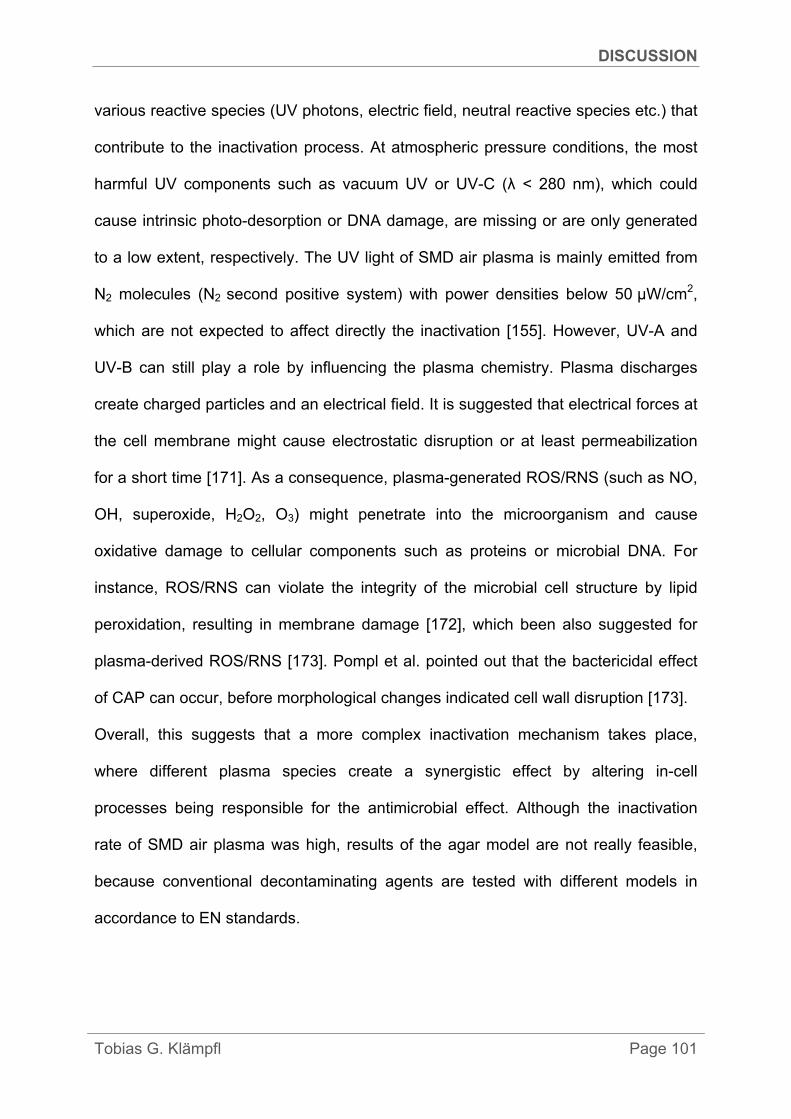
DISCUSSION
Tobias G. Klämpfl Page 101
various reactive species (UV photons, electric field, neutral reactive species etc.) that
contribute to the inactivation process. At atmospheric pressure conditions, the most
harmful UV components such as vacuum UV or UV-C (λ < 280 nm), which could
cause intrinsic photo-desorption or DNA damage, are missing or are only generated
to a low extent, respectively. The UV light of SMD air plasma is mainly emitted from
N2 molecules (N2 second positive system) with power densities below 50 μW/cm2,
which are not expected to affect directly the inactivation [155]. However, UV-A and
UV-B can still play a role by influencing the plasma chemistry. Plasma discharges
create charged particles and an electrical field. It is suggested that electrical forces at
the cell membrane might cause electrostatic disruption or at least permeabilization
for a short time [171]. As a consequence, plasma-generated ROS/RNS (such as NO,
OH, superoxide, H2O2, O3) might penetrate into the microorganism and cause
oxidative damage to cellular components such as proteins or microbial DNA. For
instance, ROS/RNS can violate the integrity of the microbial cell structure by lipid
peroxidation, resulting in membrane damage [172], which been also suggested for
plasma-derived ROS/RNS [173]. Pompl et al. pointed out that the bactericidal effect
of CAP can occur, before morphological changes indicated cell wall disruption [173].
Overall, this suggests that a more complex inactivation mechanism takes place,
where different plasma species create a synergistic effect by altering in-cell
processes being responsible for the antimicrobial effect. Although the inactivation
rate of SMD air plasma was high, results of the agar model are not really feasible,
because conventional decontaminating agents are tested with different models in
accordance to EN standards.

DISCUSSION
Tobias G. Klämpfl Page 102
4.5 Plasma sterilization
The application of the agar model indicated primary the inactivation of bacteria by
plasma, but it is not suitable for modelling the treatment of medical devices or dry
inanimate surfaces. Therefore, dry carriers were utilized as substrates for the
treatment of environmentally more resistant bacterial endospores according to
standard sterilization methods.
Bacterial endospores possess robust physical barriers and no metabolic activity,
which could be influenced by chemical reactive species. Endospores are highly
resistant to environmental stress including heat, UV- and γ-irradiation, desiccation,
mechanical disruption and toxic chemicals such as strong oxidizers or pH changing
agents [174, 175]. Their remarkable resistance has made them proper biological
indicators for the validation of disinfecting and sterilizing agents.
The results show that SMD air plasma inactivated spores less efficient than
vegetative bacteria on agar, but still quite rapidly by reaching the detection limit within
5 min treatment. In detail, Bacillus spp. were reduced in 3 min by 5 log. Kelly-
Wintenberg et al. reported that their DBD reduced B. subtilis spores with the same
sample configuration in less than 5 min treatments in direct mode [28]. In my study,
the D-values stayed below the values of standard reference methods. Furthermore,
my results suggest that maximum 6 min or 12 min are sufficient to reduce
theoretically the microbial load of all tested strains by 6 or 12 log, respectively.
Endospores of G. stearothermophilus, which are commonly used as biological
indicators for H2O2 sterilization, were more resistant against SMD air plasma than
spores of Bacillus spp. This coincides with the results of Kelly-Wintenberg et al., who
reduced G. stearothermophilus only by 3 log after 7 min treatment [28]. In my study,
the resulting D-value with D23°C = 0.9 min calculated for the reduction of

DISCUSSION
Tobias G. Klämpfl Page 103
G. stearothermophilus is four-fold lower than the standard D60°C = 4.2 min for H2O2
sterilization. Although this implies a strongly improved treatment efficacy, it is
advisable not to overrate these results due to the fact that a plasma prototype was
used. The validation has to be repeated with an up-scaled SMD device suitable for
the sterilization of medical instruments.
In addition, the influence of different non-metal test carriers on the inactivation of
G. stearothermophilus was investigated and the same inactivation rate was observed
with all tested materials. Mahfoudh et al. found that polymeric materials treated with
ozone, a major component in SMD air plasma, could affect indirectly spores of
B. atrophaeus [176, 177]. They exposed the polymeric materials to ozone
concentrations of 4000 ppm, which was lower than in my study. However, their actual
dose was much higher due to the treatment over hours and afterwards they spread
spores over the surfaces, which were sporicidal by the treatment except the
chemically inert Teflon [176]. The selection of the carrier material did not cause any
distinct plasma inactivation in my study. However, I used only carrier materials with
quite smooth surfaces that face the plasma generating electrode. A greater challenge
would be the involvement of surfaces with higher roughness or more complex
structures, which aggravate the access of plasma species such as plasma averted
surfaces, edge transitions or lumen. Screws were used in a recent low-pressure
plasma study regarding space component sterilization with B. pumilus and B. subtilis
spores [178] and thus, could be a more suitable model. In addition, a DBD study
showed similar inactivation of G. stearothermophilus spores on carriers either facing
or being averted from the plasma-permeable Tyvek cover [121]. This gives hope in
the activity of SMD air plasma with more complicated sample configurations.
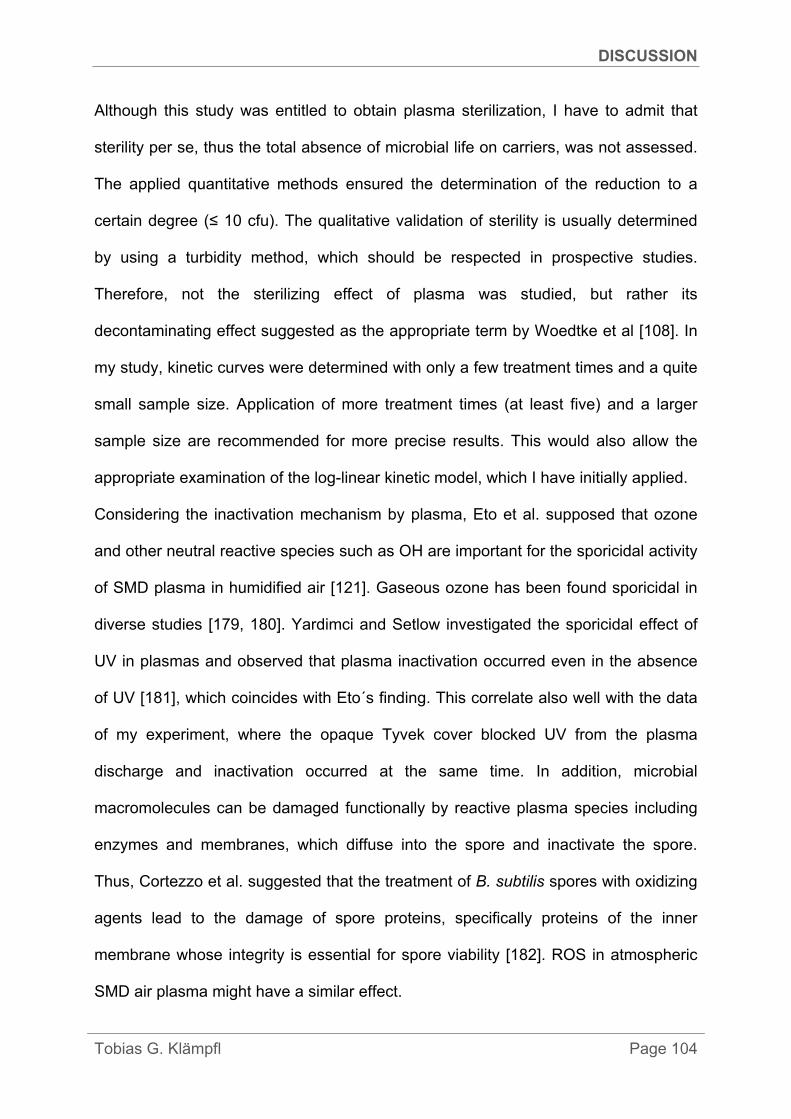
DISCUSSION
Tobias G. Klämpfl Page 104
Although this study was entitled to obtain plasma sterilization, I have to admit that
sterility per se, thus the total absence of microbial life on carriers, was not assessed.
The applied quantitative methods ensured the determination of the reduction to a
certain degree (≤ 10 cfu). The qualitative validation of sterility is usually determined
by using a turbidity method, which should be respected in prospective studies.
Therefore, not the sterilizing effect of plasma was studied, but rather its
decontaminating effect suggested as the appropriate term by Woedtke et al [108]. In
my study, kinetic curves were determined with only a few treatment times and a quite
small sample size. Application of more treatment times (at least five) and a larger
sample size are recommended for more precise results. This would also allow the
appropriate examination of the log-linear kinetic model, which I have initially applied.
Considering the inactivation mechanism by plasma, Eto et al. supposed that ozone
and other neutral reactive species such as OH are important for the sporicidal activity
of SMD plasma in humidified air [121]. Gaseous ozone has been found sporicidal in
diverse studies [179, 180]. Yardimci and Setlow investigated the sporicidal effect of
UV in plasmas and observed that plasma inactivation occurred even in the absence
of UV [181], which coincides with Eto´s finding. This correlate also well with the data
of my experiment, where the opaque Tyvek cover blocked UV from the plasma
discharge and inactivation occurred at the same time. In addition, microbial
macromolecules can be damaged functionally by reactive plasma species including
enzymes and membranes, which diffuse into the spore and inactivate the spore.
Thus, Cortezzo et al. suggested that the treatment of B. subtilis spores with oxidizing
agents lead to the damage of spore proteins, specifically proteins of the inner
membrane whose integrity is essential for spore viability [182]. ROS in atmospheric
SMD air plasma might have a similar effect.

DISCUSSION
Tobias G. Klämpfl Page 105
Overall, there is still a substantial lack of knowledge about the way plasma
inactivates bacterial endospores, because highly diverse plasma species are not
easy to measure appropriately. Despite of that, it is assumed that the synergy effect
of various SMD air plasma species is responsible for the inactivation of vegetative
planktonic bacteria, as well as for endospores. The development of tools, which can
identify and quantify relevant plasma species, is obligatory in combination with
biochemical studies for the investigation of the inactivation mechanism of MO evoked
by SMD air plasma. Therefore, physiological studies are supportive that combine
different methods for the provision of multimodal information e.g. on a single bacterial
spore in situ [183], as described for studying the dynamics of wet-heat sterilization
[184]. Especially studies on MO mutants, which lack of specific resistance-giving
proteins, can help to gain understanding.
It can be concluded that my SMD device operating in ambient air has demonstrated
its ability to remove microbial contamination from dry inanimate surfaces by efficient
reduction of viable bacterial endospores. Moreover, inactivation was achieved with
this SMD prototype more rapidly compared to reference sterilization methods. This
gives confidence in the possible contribution of SMD plasma in an improved hygienic
care in hospitals by efficient and safe sterilization of sensitive medical devices in
future. Prospective studies with devices tailored for clinical application and with more
complicated sample configurations will give better information on the suitability of the
SMD plasma technology in hygienic practice.
DISCUSSION
Tobias G. Klämpfl Page 106
4.6 Plasma disinfection
4.6.1 Using dry inanimate carriers
This is the first experimental study of kinetic inactivation by CAP treatment against
spore- and non-spore-forming nosocomial pathogens including C. difficile spores on
dry carriers and in fulfilment of disinfection standards which means the inclusion of
additional organic burden. Furthermore, the surface condition of used microbial
carriers was determined by SEM imaging and EDX analysis in detail.
Disinfection with bacterial endospores was successful within 10 min treatment, but
failed with vegetative bacteria due to the high bacterial density that caused the
formation of multi-layers on regular-sized carriers. However, the disinfection level
was achieved at lower bacterial density. Salt crystals or cell debris on the carrier
influenced the inactivation by SMD air plasma. Moreover, plasma oxidized all treated
surfaces, yet did not affect the surface morphology of endospores or vegetative
bacteria, but degraded BSA and cell debris.
Previously, inactivation of Bacilli and Clostridia endospores was demonstrated in H2O
suspension using CAP by Tseng et al. [111]. Furthermore, I utilized dry carriers and
treated Bacilli endospores on them using SMD air plasma in respect of sterilization
standards as described in my former experiment [131]. In contrast to both studies,
the crucial influence of organic burden on plasma inactivation was also examined
here. Overall, conditions observed on carrier surfaces were related to the inactivation
kinetics: rapid log-linear for C. difficile without organic burden, from slow to rapid after
the degradation of sporulation debris for G. stearothermophilus and slowed down for
C. difficile with 0.03% BSA, which restrained the access to highly covered spores.
Notably, endospores of C. difficile and B. subtilis without organic burden were
inactivated more rapidly than G. stearothermophilus spores. In contrast to C. difficile,

DISCUSSION
Tobias G. Klämpfl Page 107
G. stearothermophilus spores were mostly surrounded by sporulation debris forming
agglomerated regions that served as additional organic burden and hindered the
accessibility for gaseous CAP species. Furthermore, lower initial load of B. subtilis
was applied compared to other spore types. Thus, the general notion that C. difficile
spores are less robust against biocides than other endospores is questionable, when
the same sample conditions cannot be assured.
Notably, Mahfoud et al. demonstrated that dry gaseous ozone that inactivated
bacterial endospores did not affect the integrity of spore coat, which correlates with
my SEM imaging results [185]. However, they observed strong erosions of spore
structures, when humidity was present [185], and this is discrepant to my results,
since humidity was never excluded in my experiments and still clear morphological
effects were absent.
In comparison to other studies with liquid disinfectants, Block et al. reported that
Perasafe®, a product with 0.2 % peracetic acid, reduced C. difficile and
B. atrophaeus spores on stainless steel discs after 10 min exposure by about 6 log
[186]. They found that chlorine-releasing sodium dichloroisocyanurate (NaDCC),
which was commonly used at that time for environmental decontamination in Israeli
hospitals, was strongly inferior (< 2 log) [186]. However, they did not include any
additional organic burden such as BSA in their study. Barbut et al. compared an
innovative hydrogen peroxide dry-mist disinfection system with the common
disinfectant sodium hypochlorite (NaOCl) by treating hypervirulent C. difficile spores
on laminate and PVC carriers (2 cm2) [187]. They found that both methods reduced
spores equally more than 4 log after 10 min treatment or after one cycle in the case
of hydrogen peroxide in vitro, but could show with an in situ randomized field study
that the innovative system was superior in decontaminating C. difficile from surfaces
DISCUSSION
Tobias G. Klämpfl Page 108
in a single room [187]. Perez et al. demonstrated that acidified bleach was able to
achieve a 6 log reduction of C. difficile spores, which were distributed with high level
soiling on stainless steel discs, in only 3 min [188]. Maillard summarized studies
about the sporicidal activity of alkylating agents such as glutaraldehyde and oxidizing
agents such as peracetic acid, chlorine dioxide and chlorine-releasing agents
including surface tests and pointed out the possible failure of decontamination due to
several factors [189]: biocide concentration, contact time, level of soiling, type of
surface, temperature and relative humidity.
In the case of vegetative bacteria S. aureus and E. faecium, up to 99% of all bacteria
could be inactivated in my experiments, although standard compliant E. faecium
samples showed bacterial multi-layering, which blocked reactive plasma species.
Furthermore, larger carriers or lower microbial loads enabled inactivation up to the
disinfection level with increasingly significant additional burden. Disinfection was
achieved, even if E. faecium was embedded in blood matrix that prevented the
access of plasma. To my point of view the high electric field being necessary for
plasma generation contributes to the inactivation or that it is difficult to recover
bacteria from the blood bulk of plasma-treated samples. In favor for the latter,
atmospheric plasma can enhance the adhesion of organic surfaces by oxidation
[190]. This suggests that bacterial cells might be stuck together in organic clusters on
the carrier, unable to be separated by vortexing with subsequent false negative
viable counts.
Compared to the treatments on agar plates, SMD plasma was less effective in carrier
tests. This can be attributed to the higher bacterial density on carriers and to the wet
agar system per se. As demonstrated here, lowering the microbial density on carriers
caused similar inactivation kinetics. Furthermore, Boxhammer et al. have shown that

DISCUSSION
Tobias G. Klämpfl Page 109
the inactivation of E. coli in small quantities of liquid (20 µL) can be correlated to the
formation of H2O2 and NO, which in combination lead to nitrosative and oxidative
stress [127]. This could further explain an accelerated reduction on wet agar
compared to dry carriers.
In comparison to another SMD study, Pavlovich et al. treated E. coli (107 cfu) on
various surfaces with SMD air plasma in direct and indirect mode [133]. They
observed a similar kinetic reduction in both modes with 1 to 2 log after 60 s and 4 to
5 log after treating E. coli for 5 min on stainless steel discs, which is a slower effect
than in my study (see kinetics without BSA). I believe that the relation factor between
the total volume that microfilaments occupy (= reaction volume) and the chamber
volume was higher in my study and thus, could be one possible explanation of the
difference. However, a clear explanation is difficult, since distinct plasma power
densities were applied in both studies with a lower density here. Furthermore,
Pavlovich revealed similar inactivation for rubber and silicon carriers, but much lower
inactivation for pig skin as well as the inferiority of plasma to increasing
concentrations of chlorhexidine (2%) [133].
In comparison to liquid disinfectants, Block et al. showed in their study with
vegetative bacteria that chlorhexidine reduced S. aureus and E. faecalis on stainless
steel discs (108 cfu) by 4 and 6 log after 10 min exposures, respectively [191].
Povidone iodine was even more efficient with 6 log reductions after 2.5 min [191].
Therefore, liquid disinfectants seem to be much more efficient in the inactivation of
vegetative bacteria. Pottage et al. revealed that hydrogen peroxide vapour was able
to reduce G. stearothermophilus spores by 5 log after 30 min, yet achieved only
2.5 log for MRSA with the same initial load of 106 cfu and after the same treatment
time [192]. They assumed that the effect of catalase in MRSA detoxifies H2O2
DISCUSSION
Tobias G. Klämpfl Page 110
molecules. In my study, vegetative bacteria were not necessarily more resistant than
bacterial endospores. The similar kinetic behaviour can rather be explained by the
higher initial loading that was required in the case of vegetative bacteria, in order to
recover 106 cfu in the negative control samples. In addition, my results show that
catalase-negative E faecium was not more susceptible to plasma than catalase-
positive S. aureus on carriers with 108 cfu. For that reason, this suggests again that
synergy of active plasma species takes place.
SMD air plasma serves as a source of ROS/RNS and here, it degraded BSA protein
film and sporulation debris. Similarly, Finnegan et al. demonstrated that oxidizing
agents degrade proteins like BSA and other macromolecules present in microbial
cells [193]. However, spore coats provide physical barriers to large molecules and
detoxify ROS, before they can penetrate into the inner spore [83]. In my study, CAP
had no obvious effect on the surface morphology of endospores or E. faecium cells.
This implies again that oxidizing agents can damage key proteins in the inner
membrane of spores that leads to membrane integrity and viability loss upon further
stress [182]. In contrast, the outer spore coats were shown to get degraded by
oxidizing agents solved in aqueous solution, which exposes the essential
compartments in the core [194]. Despite of that, liquid-phase H2O2 is not as strong
oxidizer as vaporized H2O2 [193], a constituent in humidified air plasma. In addition,
the contribution of other plasma components (electric field, UV) to microbial cell
inactivation is probable and was discussed in the sterilization section.
My study and others indicate that the choice of suspending medium is important
[195, 196]. Standard compliant, bacterial endospores are prepared in H2O and
vegetative bacteria as well as BSA in saline medium. The latter medium causes salt
crystals on the surface upon drying, whose macrostructures cover bacteria and
DISCUSSION
Tobias G. Klämpfl Page 111
potentially shield biocides. Considering that salt is present on contaminated hospital
surfaces from body fluids, justifies its use in standard biocide testing. Moreover, tests
with nosocomial pathogens that model the real procedure of cleaning and disinfecting
surfaces such as the proposed “4-field-test” are still missing as standards, but are
close to be approved [147]. In general, a unique standard does not exist for testing
disinfectants with bacterial endospores not to mention C. difficile endospores or
specifically testing of gas-borne surface disinfectants in the human medicine area
due to anachronistic regulations [197]. Instead, valid standards are applied
considered for the food and domestic area [142], which cannot be considered reliable
methods in human medicine. Therefore, many products claim to be sporicidal against
C. difficile spores, but fail at more practical conditions with high burden and short
contact times [87].
Considering application, biofilm disruption and microbial density reduction by
mechanical cleaning are inevitable to enhance the disinfecting action of SMD air
plasma. Like other disinfecting agents, SMD air plasma has some disadvantages: O3
and other oxidative species are potentially harmful to living beings and corrosive to
materials; CAP devices are electrically driven and require maintenance; high voltage
demands careful handling; the target surface has to be close to the electrode
generating SMD plasma; side diffusion of gaseous plasma species must be avoided
for best performance results. However, the versatile nature of SMD air plasma
systems allow for instance the adjustment of O3 concentrations [161] and recent
studies have already proven that SMD devices do not harm human tissue cells while
being operated at bactericidal dosages [154, 198, 199].
In conclusion, the outcome of this study and the adaptable properties of CAP are
compelling evidence for a prospective contribution of SMD air plasma for the

DISCUSSION
Tobias G. Klämpfl Page 112
environmental control of C. difficile spores and other nosocomial pathogens,
especially in instrumental disinfection. Therefore, SMD plasma could serve as an
alternative to conventional liquid disinfectants among other promising air-borne
decontamination systems including gaseous hydrogen peroxide, chlorine dioxide,
ozone, air/filter decontamination technologies and UV disinfection [101]. However,
further investigations have to prove its antimicrobial action and safety in field studies.
A prerequisite is the use of well-defined microbial samples as well as reformations in
the regulation of decontaminant testing.
4.6.2 Clinical surface disinfection
In general, environmental surfaces are regarded as a reservoir for persistent
nosocomial pathogens available to be transmitted via personnel hands to susceptible
patients. Therefore, I assessed the applicability of SMD plasma at the disinfection of
clinical surfaces with an adjusted practical testing method, which is proposed to
become a European standard [146, 147, 200]. Results have shown that plasma was
not able to remove enough microbial contamination - neither bacterial endospores
nor vegetative bacteria - for fulfilling disinfection criteria within long 10 min
treatments.
In contrast to previous treatments with in part higher inactivation results in the same
time range, the treatments were carried out in an open volume and with microbes on
larger areas. Therefore, I regard the side diffusion of plasma species as the main
reason for the low reduction. To this end, provisionally fixed Teflon barriers were not
able to sustain a sufficient high plasma concentration under the electrode that would
stress more the bacteria. The side diffusion could also lead to passive inactivation in
the proximity of the actual treated surface, since surviving in control fields of the
DISCUSSION
Tobias G. Klämpfl Page 113
experiment was diminished in the case of bacterial endospores. However, a loss in
control fields was not observed with vegetative bacteria. Thus, to limit side diffusion,
adequate precautions like barriers that confine properly the treatment volume are of
great importance.
As mentioned, the test was modified in respect of plasma. The original test combines
practical cleaning and disinfection by mechanical distribution of liquid disinfectant and
microbes with a wipe over four fields. On the one hand, mechanical force on bacterial
contaminations such as with a brush would probably also enhance the plasma action,
since the bacterial density is decreased, agglomerations are disrupted and hence,
the available surface of single bacteria is potentially enlarged. Furthermore, only one
field is contaminated in the original approach with bacteria and then distributed to
other fields, in order to determine their spread, instead of loading all fields and
applying static one by one treatment. On the other hand, I demonstrated that
reduction of bacterial load did not lead to improved log reductions of vegetative
bacteria as it did in carrier tests. Therefore, the limitation of multi-layering or
agglomerating was missing. This observation pinpoints once again that side-diffusion
was the limiting factor. In addition, moving the device over the surface would
supposedly further decrease the local concentration and contact time of plasma
species with microbes. However, surface disinfection usually implies mobile
treatment, which should be also implemented for future plasma testing. This could be
achieved by installing small wheels and guidance could be ensured by the already
installed holder.
The chance for a successful surface disinfection with SMD plasma is low in this
study, because applying the treatment for minutes at the same position is not
practical and most of the times also not realistic in the everyday practice. However,
DISCUSSION
Tobias G. Klämpfl Page 114
conventional liquid disinfectants have the same problem. They are mainly validated
by standard suspension tests with treatment times of more than 10 min up to several
hours, recently including C. difficile endospores [87, 201, 202]. Buettgen et al. have
shown with this method that the same hypervirulent C. difficile spores were more
susceptible to disinfectants (e.g. chlorine releasing agents, glutaraldehyde) than B.
subtilis spores [201], which I also demonstrated with my 4-field-test results, but not
with my carrier tests. Their conclusion that the required disinfectant concentration
might be reduced for nosocomial relevant C. difficile is based on my results doubtful.
Moreover, the suspension test might make sense for instrumental disinfection, but
not for surface disinfection, since inactivation of microbial contamination on dry
surfaces is more difficult [191]. In surface disinfection, liquid disinfectants are applied
in quantities that are maybe sufficient for wetting the whole surface, but allow only
short exposure times due to early evaporation [203] which is addressed with the 4-
field-test. In combination with wipes that remove per se a lot of the contamination by
uptake, disinfectants which passed the suspension test have shown good reduction
performance in the 4-field test in only 2 s cleaning procedures and after certain
exposure times, but some disinfectants promoted also inadequate high spread of
microbes [204]. In a very similar approach including wiping, Ali et al. treated 25 cm2
big laminated surfaces with hypochlorite or NaDCC and assessed the spread and
inactivation of C. difficile spores [205]. They point out that most of the contamination
(3 log from initial 106 cfu) was already removed from the surface by the wiping
procedure and the disinfectant failed to prevent the spread of residual spores and to
inactivate them even after 60 min incubation time (disinfectant evaporated earlier)
[205]. This example highlights again the problematic situation of ineffective
DISCUSSION
Tobias G. Klämpfl Page 115
decontamination in hospitals as well as the demand of accurate standard validation
methods that reflect in-use practices [206].
In the previously mentioned study of Block et al. [186], they also exposed C. difficile
and B. atrophaeus spores to Perasafe® and NaDCC using PVC flooring substrates
(2 × 2 cm) without wiping and found that inactivation was aggravated with maximum
2.7 to 6 log compared to the set-up with stainless steel discs. This tendency appears
also in my study comparing carrier tests with PVC field tests, where in contrast to
Block et al. organic burden was additionally included.
Since this was the first test of this kind, there are no possible comparisons with other
plasma approaches. Despite of that, it is possible that a direct surface treatment such
as with a FE-DBD source would be more effective than the indirect treatment with a
SMD device, as charged species from the micro-discharges would improve the
inactivation effect and clinical surfaces are made of robust materials that proved to
withstand strong liquid disinfectants. Another approach would be to shorten the
distance with the given SMD device and/or to increase the plasma power. However,
movement along rough surfaces could be hindered and life-time of the electrode
would be reduced critically. Furthermore, you could think of using handheld SMD
devices which are under development [154] together with pre-moistured wipes, in
order to “activate” water by acidifying it for disinfection [115, 134]. Creating plasma
through the wipe tissue during cleaning process might also be worth considering,
since SMD plasma is active through various fabrics [121, 207]. However, all of these
suggestions are based on hypotheses and would need to be reasoned in detail.
Indeed, surface decontamination is nowadays a well-accepted task in the conflict
against nosocomial pathogens such as C. difficile, MRSA, VRE or norovirus [91, 208,
209], despite the lack of scientific evidence proofing the benefits a decade ago [210,
DISCUSSION
Tobias G. Klämpfl Page 116
211]. Beside the debatable effectiveness, the application of conventional hypochlorite
involves serious drawbacks: corrosion, low tolerance to organic matter, reduced
effectiveness in cleaning surfaces, and requiring two operational steps, which is time-
consuming [212]. Notably, conventional disinfectants such as quaternary ammonium
compounds, hypochlorites and phenolics render a risk to the safety of employees
and the environment by causing skin irritation and asthma; and benzalkonium
chloride is one of the leading allergens in healthcare personnel [213]. In addition,
commercial production of liquid disinfectants comes along with a lot of residual
waste, which has to be disposed and causes environmental pollution. For these
reasons, the investigation of alternative decontaminating agents is mandatory also in
respect of the toxic nature and processing of agents. For instance, SMD air plasma is
per se toxic, otherwise it would not possess any antimicrobial activity, but the
technology does not produce any waste. The plasma utilizes ambient air molecules,
consumes some electric energy and afterwards decomposes to air again which
makes this technology sustainable.
However and without doubt, my SMD air plasma prototype is not competitive in this
form for surface disinfection purposes and would need improvements as suggested
earlier. A prerequisite for considering SMD plasma application would be the
combination with cleaning processes among other aspects such as safe handling
and an objective evaluation of essential measures (e.g. in efficacy, maintenance,
handling, waste, toxicity, applicability, etc.) compared to conventional liquid
disinfectants and other uprising air-borne decontaminants. A comprehensive list of
advantages and disadvantages of common disinfecting and sterilizing agents is
provided by Rutala and Weber [214].

DISCUSSION
Tobias G. Klämpfl Page 117
4.7 Influence of Tyvek and other factors
Previously in my work, higher degrees of inactivation were obtained by the treatment
of endospore samples wrapped in Tyvek coupons compared to samples without the
wrap. Therefore, I investigated this phenomenon in detail and revealed that Tyvek
actually functions as a diffusion barrier and mitigates the plasma effect as expected.
Zimmermann et al. have demonstrated a similar barrier effect for treating bacteria on
agar through textiles and envelope materials [207]. However, it does not explain the
big difference in the reduction between treated samples without and with wrap.
Wintenberg et al. treated as well G. stearothermophilus samples within Tyvek
coupons and did not report any remarkable difference [28]. In contrast to spores, the
treatment of vegetative bacteria did not result in distinct reductions during my work
(data not shown). This could be attributed to a higher load (108 cfu) and density
which did not allow big log reductions anyway. I did not carry out though comparing
experiments with lower load. In line with my finding, Cotter et al. did not observe
variations of the CAP effect upon treating wrapped or unwrapped MRSA biofilms
[124].
In further experiments, I could exclude that the volume inside the Tyvek coupon or
the contact to Tyvek surface were responsible. However, results indicate that the way
of insulating the bare sample from the grounded bottom plate was important for the
resulting reduction. When insulated, plasma was effective. It was also effective, when
the sample was closer to the plasma electrode or with rising plasma power. These
findings suggest that the electric field of the SMD electrode and its charging potential
of surfaces could be the key. Moreover, the plasma effect cannot be assigned merely
to the ozone dose, since an enhanced plasma power resulted in a lower dose.

DISCUSSION
Tobias G. Klämpfl Page 118
Hence, other plasma components such as possibly the electric field support the
sporicidal action of plasma.
Further investigations need to be conducted for a conclusive assessment and
rationale of this phenomenon.
4.8 CAP research and applications in decontamination
My work addressed in depth the effect of CAP against bacterial species, vegetative
and dormant ones. Nevertheless, it is not enough to proof the decontaminating
behavior against such bacterial species. Other types of nosocomial pathogens,
namely mycobacteria, fungi and viruses have to be included in decontamination
studies, in order to cover the whole spectrum by testing mycobactericidal,
tuberculocidal, fungicidal, yeasticidal and virucidal activity [91].
The fungal yeast C. albicans is a major cause of invasive infection. In our recent
study, it was the hardest to inactivate by SMD air plasma in comparison with
vegetative bacteria on agar [131]. In contrast to bacteria, the fungal cell wall consists
of chitin/cellulose fibrils within a polysaccharide matrix. C. albicans can change its
shape depending on the environment and growth phase, for instance its cell wall is
thicker at lower than neutral pH. Furthermore, C. albicans produces dormant and
environmentally resistant chlamydospores. As an eukaryotic cell, C. albicans has a
nucleus containing a diploid genome and sheltered by the nuclear membrane as an
additional diffusion barrier, which contribute to higher resistance to DNA damage
[215]. These and other characteristics may enable C. albicans to be less sensitive to
biocides [215]. Besides planktonic cell inactivation, encouraging results of inactivated
C. albicans biofilms have been obtained recently with the same SMD device [130].
Planktonic and biofilm inactivation of C. albicans has also been demonstrated with
DISCUSSION
Tobias G. Klämpfl Page 119
other DBD and APPJ systems [216-218]. Muranyi et al. achieved a significant
reduction of the mold Aspergillus niger conidiospores by the direct treatment with a
DBD system [104].
Non-enveloped viruses such as adenovirus or norovirus are also a common threat.
Viruses cannot replicate by themselves and need the replication machinery of host
cells, which they deplete, before they move to invade other cells and further
attenuate the host. Zimmermann et al. demonstrated that SMD air plasma could
inactivate adenovirus in small quantities of liquid within 4 min [125]. Similarly, M2
bacteriophage, which was used as surrogate for norovirus, was successfully
inactivated with an APPJ [219] and bacteriophage Phi X 174 with another DBD
system [105]. However, studies on the virucidal activity of CAP are at the moment
rare.
Mycobacteria have a unique cell wall structure, which cannot be differentiated by
gram stain and makes them very robust against environmental stress.
M. tuberculosis and M. leprae are known for causing tuberculosis and leprosy,
respectively. Only few studies have been conducted using mycobacteria. Venezia et
al. inactivated M. fortitum by indirect treatment with a CAP source only described as
PlasmaSol [220]. Another study applied pulsed electric fields through water
containing M. paratuberculosis and showed an effect, which cannot convincingly be
related to CAP [221]. In my work, tests with M. terrae and M. avium as surrogates
provided by the IHPH were considered, but finally were not carried out due to the
insufficient log reduction results of treated vegetative bacteria on dry carriers.
Notably, tuberculocidity is technically approved after successful inactivation of
M. terrae and mycobactericidity after inactivation of M. terrae and M. avium.
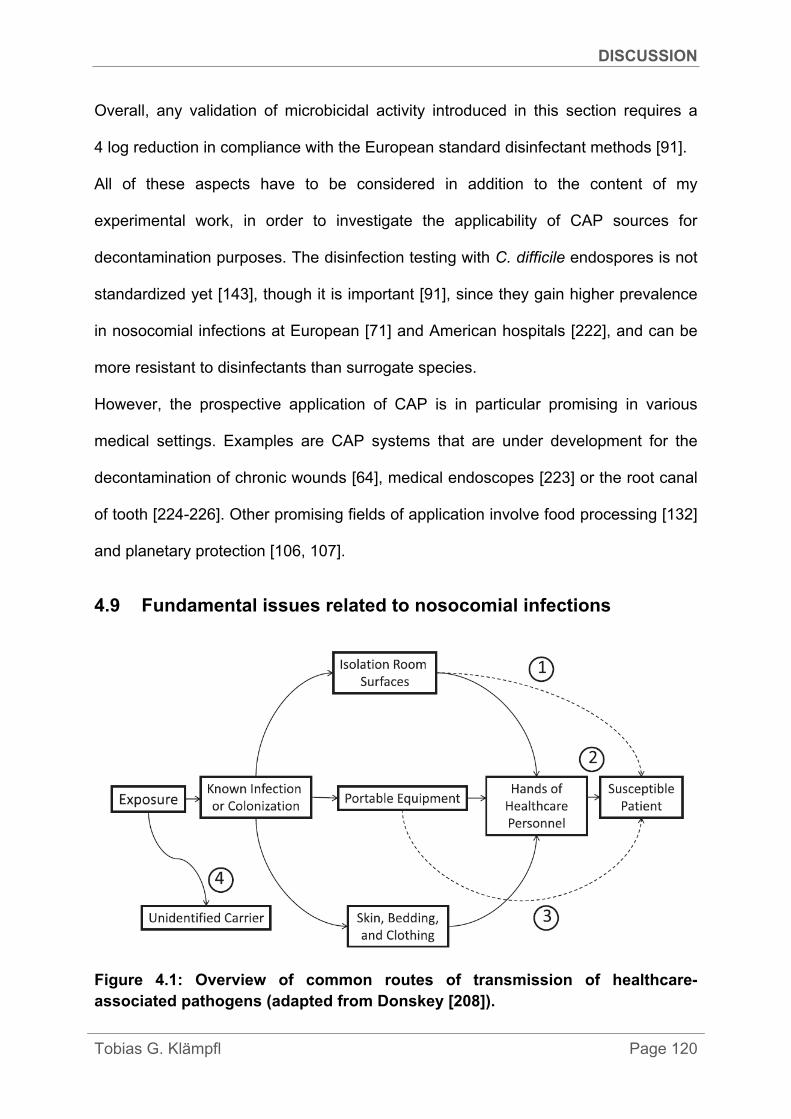
DISCUSSION
Tobias G. Klämpfl Page 120
Overall, any validation of microbicidal activity introduced in this section requires a
4 log reduction in compliance with the European standard disinfectant methods [91].
All of these aspects have to be considered in addition to the content of my
experimental work, in order to investigate the applicability of CAP sources for
decontamination purposes. The disinfection testing with C. difficile endospores is not
standardized yet [143], though it is important [91], since they gain higher prevalence
in nosocomial infections at European [71] and American hospitals [222], and can be
more resistant to disinfectants than surrogate species.
However, the prospective application of CAP is in particular promising in various
medical settings. Examples are CAP systems that are under development for the
decontamination of chronic wounds [64], medical endoscopes [223] or the root canal
of tooth [224-226]. Other promising fields of application involve food processing [132]
and planetary protection [106, 107].
4.9 Fundamental issues related to nosocomial infections
Figure 4.1: Overview of common routes of transmission of healthcare-associated pathogens (adapted from Donskey [208]).
DISCUSSION
Tobias G. Klämpfl Page 121
An adequate hygienic practice in healthcare facilities is without doubt essential for
the environmental control of nosocomial pathogens. However, there are many
possible routes pathogens can take to invade susceptible patients which have to be
blocked (Figure 4.1). Hence, some serious issues which are not directly linked to the
actual decontaminating agent are associated with this topic and need consideration.
One issue arises from the fact that you do not see the microbial threat and thus,
cannot really localize pathogens in the environment. For instance, healthcare
workers have no real ad hoc control measures, if their hands are really free of
considerable (harmful) microbial contamination after disinfection. Recommended
hand disinfection procedures follow a certain step-to-step protocol and require at
least 30 s [227]. Therefore, proper and continuous hygienic training is necessary for
the compliance of hand hygiene. This demands extra time that the nursing personnel
would have to invest for hand disinfection. As mentioned earlier, frequent disinfection
of hands can lead to skin diseases [213]. In Germany, the trend towards less
healthcare personnel, who are still responsible for the same number of patients,
increases their working load and intensifies this issue. Further economic reasons
force hospitals to shorten the duration of patients´ stay and to exploit their bed
capacities at any time by hospitalizing as many patients as possible.
Furthermore, Figure 4.1 depicts the possible route via isolation room surfaces. In
reality, many hospitals do not have the chance first of all to screen all patients that
they hospitalize and second to isolate infected patients from other patients simply
due to the lack of space. Many patients have to share a room and a bathroom, which
further simplifies the spread of microbial pathogens among patients. Therefore, an
insufficient clinical infrastructure can increase the risk for nosocomial infections. In
addition, many people are asymptomatic carriers of potential harmful pathogens such

DISCUSSION
Tobias G. Klämpfl Page 122
as C. difficile and contribute to the transmission [89, 228]. First reports about
newborns that are colonized by multidrug-resistant and highly invasive microbial
species such as hyper-producing ESBL Enterobacteriaceae are alarming [229-232].
In general, the concerns about antibiotic-resistant microbial pathogens are already
justified without listing the complications for the affected individual arising from the
actual infection at healthcare facilities. Once a nosocomial pathogen occurs, it is hard
to eradicate it from the clinical ward and requires complex interventions [89, 208].
The same is valid for infected patients, since for instance in the case of C. difficile
possible treatments are currently limited which are more or less effective in avoiding
permanent recurrence of the infection [89, 233, 234].
In conclusion, the prevention of nosocomial infections should have highest priority, in
order to maintain quality of medical services and reliability into medical facilities. This
goal can be approached by improving the conditions and processes in healthcare
facilities starting from the conscious use of antibiotics, modernization of clinical
infrastructure such as provision of isolating rooms, appropriate clinical management
and improvement of decontamination systems.

DISCUSSION
Tobias G. Klämpfl Page 123
4.10 Conclusion
My work addressed different aspects of a CAP system based on the SMD technology
and considered for the decontamination of medical devices and clinical surfaces.
SMD air plasma has demonstrated its bactericidal and sporicidal potential in tests,
according to European standard methods for sterilizing and disinfecting agents.
Thereby, it was effective in the inactivation of conventional biological indicators as
well as of endospores of C. difficile, a highly environmental resistant and fatal
nosocomial pathogen. The synergy between various plasma species (such as
ROS/RNS, electric field) is responsible for this effect. Furthermore, its microbicidal
action is limited by the degree of surface contamination. High bacterial density or
additional burden aggravate the access of gaseous plasma species and mitigate its
chemical reactivity. Application at open condition further mitigated the microbicidal
effect by side-diffusing species. For that reasons, SMD air plasma application is more
attractive for the disinfection of pre-cleaned instruments in a closed volume rather
than for surface disinfection. High ozone concentrations generated by plasma further
suggest the operation in a closed chamber due to safety reasons. In addition, the
oxidative nature of air plasma requires the use of inert device materials. This also
implicates that air plasma, even it enables the treatment of heat-sensitive materials,
can create complications, when chemical-sensitive surfaces are treated.
All in all, my work has improved the understanding about the decontaminating
behavior of SMD air plasma. SMD air plasma has the potential due to its versatile
properties to serve as an alternative to commonly used disinfecting or sterilizing
agents and may contribute to the prevention of nosocomial infections in the future.
Important will be to develop an up-scaled device, suitable for practical use, to solve
DISCUSSION
Tobias G. Klämpfl Page 124
handling issues, to gain measurable additional effect compared to common methods
and to validate its use in field studies.
4.11 Future perspectives
This work opens a new era in the research of SMD air plasma decontamination.
Many starting points for follow-up research are already pointed out in various
sections of the discussion.
One future objective will be to understand the radical chemistry step by step in a
better way, in order to control and adjust the plasma chemistry specifically for an
optimized decontaminating effect in the future. This includes the conduction of further
plasma diagnostics, e.g. the determination of OH or NO radicals via spin-trapping
followed by ESR spectroscopy, in combination with further kinetic studies, involving
the treatment of fungal, mycobacterial and viral species on surfaces according to
standards. Concerning the application, it is necessary to adjust the device set up to
the needs of intended practical use and to evaluate and improve its actual
applicability for the decontamination of more complex 3D objects. Furthermore, the
investigation of various plasma-treated materials, e.g. from medical devices, will
provide a better understanding, if and when undesired material alterations occur,
which could lead to failure of function.
In the end, I would like to investigate the interaction between MO and plasma in more
detail. Hence, I will continue to carry out confocal Raman imaging of plasma-treated
bacterial endospores. This includes also the imaging of artificial peptidoglycan layer,
a substantial cortex component in spores, and observing possible alterations in its
chemical composition after plasma treatment. In addition, the photometric
determination of the dipicolinic acid release from the spore core will clarify, if the
plasma treatment causes leakages in the membranes and coats. Imaging of treated

DISCUSSION
Tobias G. Klämpfl Page 125
spores by transmission electron microscopy will give some hints of morphological
alterations in the structure of inner spore layers such as ruptures. Moreover,
chromatographic investigations will reveal possible effects on DNA of treated spores.
Sophisticated will also be single cell investigations as proposed for wet heat [183]
that enables in situ measurements and treatments.
All the above future perspectives will further help to gain insight into the inactivation
mechanism by unraveling the molecular mechanism of plasma treatment and its
limitations, enabling its appropriate and alternative use in areas, where conventional
decontaminating agents are not applicable.
ACKNOWLEDGMENTS
Tobias G. Klämpfl Page 126
5 ACKNOWLEDGMENTS
First of all, I want to thank Professor Gregor Morfill who supported me thoroughly,
gave me freedom and his faith in my work at any time. Without his encouraging
visions and energy, research in plasma medicine in such a great network would not
have been possible. It was an honor to carry out my thesis in his group. I also would
like to thank in particular Dr. Hans-Ulrich Schmidt, a great person and microbiologist,
who has always been keen to discuss my project work, inspired me and motivated
me with his ideas to stick to my research direction.
I also want to acknowledge my supervisor at the TUM Prof. Jürgen Schlegel and my
mentor Prof. Claus Zimmer for their benevolent confidence in my work, Dr. Katrin
Offe as the supportive coordinator of the Ph.D. program at TUM, and in general the
TUM Graduate School.
I am also very grateful to the plasma medicine team at the MPE for their support
throughout the whole time: From the scientific part Dr. Tetsuji Shimizu, Dr. Yang-
Fang Li and Dr. Julia Zimmermann for their advices and for being available my
questions, Dr. Roberto Monetti, Dr. Wolfram Bunk and Dr. Thomas Aschenbrenner
for their efforts in SEM image data analysis of endospore morphologies, Dr. Mikhail
Pustylnik for his time in sophisticated OES measurements, Dr. Satoshi Shimizu and
Jin Jeon for good discussions, the student trainees Tanja Rosentreter and Andreas
Oberauer and all others who were involved but I do not particularly mention here;
from the non-scientific part the secretaries Angelika Langer and Birgit Boller, the
technicians Katinka Hartmann and Bernd Steffes, Kurt Dittrich for his support in the
use of the environmental chamber, the mechanical (Mr. Czempiel and coworkers),
metal (Walter Schunn and coworkers), electric (Mr. Tarantik and coworkers) and
polymer work shop (Franz Soller and coworkers), the drivers Toni Arturo and Erich
ACKNOWLEDGMENTS
Tobias G. Klämpfl Page 127
Rossa, and all administrative staff (Eva Kuhwald, Sylvia Goldbrunner, Wolfgang
Karing, Mirko Grasemann, Mrs. Mayr-Ihbe, Tobias Baumann and coworkers) who
were always a great support and who provided a great infrastructure for my project.
My research project was funded solely by MPE and the research grant MTTA. Ext.
0002. Many thanks for a great atmosphere at MPE X6 building to my colleagues
Pintu, Jayson, Philip, Jin, Guido, Thomas, Tanja, Arthur, Dong and Yang-Fang.
Furthermore, I want to thank Dr. Jürgen Gebel, Dr. Stefanie Gemein and Sylvia Koch
(IHPH) for their contributions to the Clostridium difficile project; Toni Seis and Dr.
Nicole Richter (Simicon GmbH) for their supportive communication regarding
sterilization/disinfection; Prof. David Graves and Dr. Yukinori Sakiyama (UC
Berkeley) for their kind help during my laboratory visit regarding the simulation of
plasma-chemical reactions; Dr. Alexander Gigler (LMU), Dr. Melanie Kaliwoda (LMU)
and Dr. Marek Janko (TU Darmstadt) for their support in confocal Raman microscopy
imaging of bacterial endospores; Dr. Petra Rettberg and Simon Barczyk (DLR Bonn)
for the microbiological insights into endospore culturing during my laboratory visit;
Katja Rodewald (TUM) for sharing her expertise in SEM imaging of E. faecium and
especially Dr. Martin Balden (IPP Garching) for his great expertise and support in
SEM imaging of bacterial endospores. Overall, I want to thank all of them for the
friendly cooperation. Moreover, I would like to express my great gratitude to Prof.
Molly Shoichet (University of Toronto, Canada) and Prof. Olaf Hinrichsen (TUM) for
their initial support in applying for the Ph.D. Program.
Last and most importantly, I would like to emphasize that all of this would not have
been possible without the great support, patience and love of my parents and my
whole family throughout my entire academic life; and in particular of my partner Maria

ACKNOWLEDGMENTS
Tobias G. Klämpfl Page 128
who shared with me every tough and good moment, always supported me the most
and has made my life colorful. Ευχαριστώ!

APPENDIX
Tobias G. Klämpfl Page 129
6 REFERENCES
1. Mott-Smith HM. History of "Plasmas". Nature 1971; 233(5316):219.
2. Fridman A. Introduction to Theoretical and Applied Plasma Chemistry. Plasma Chemistry. New York: Cambridge University Press; 2008. p. 1-10.
3. Fridman A, Kennedy LA. Plasma Physics and Engineering. 1st ed. New York: Taylor & Francis; 2004.
4. Wagner H-E, Brandenburg R, Kozlov KV, Sonnenfeld A, Michel P, Behnke JF. The barrier discharge: basic properties and applications to surface treatment. Vacuum 2003; 71:417-36.
5. Fridman A, Gutsol A, Cho YI. Non-Thermal Atmospheric Pressure Plasma. Elsevier Academic Press. 2007:
6. Laroussi M, Kong MG, Morfill G, Stolz W, editors. Plasma Medicine. New York: Cambridge University Press; 2012.
7. Research TT. Available from: http://www.teslatechnologyresearch.com/model1 .html.
8. Hoentsch M, von Woedtke T, Weltmann K-D, Nebe B. Time-dependent effects of low-temperature atmospheric-pressure argon plasma on epithelial cell attachment, viability and tight junction formation in vitro. Journal of Physics D: Applied Physics 2012; 45(2):025206.
9. Shimizu T, Steffes B, Pompl R, Jamitzky F, Bunk W, Ramrath K, Georgi M, Stolz W, Schmidt H-U, Urayama T, Fujii S, Morfill GE. Characterization of Microwave Plasma Torch for Decontamination. Plasma Processes and Polymers 2008; 5(6):577-82.
10. Kogelschatz U. Dielectric-barrier Discharges: Their History, Discharge Physics, and Industrial Applications. Plasma Chemistry and Plasma Processing 2003; 23(1):1-46.
11. Siemens W. Ueber die elektrostatische Induction und die Verzögerung des Stroms in Flaschendrähten. Poggendorff´s Ann Phys Chem; 102:66.
12. Fridman A. Plasma Chemistry. New York: Cambridge University Press; 2008.
13. Hautefeuille P, Chappuis J, editors. The search for gaseous compounds and the study of some ot their properties with the help of the spectroscope [De la recherche des composes gazeux et de !'etude de quelques-unes de leurs
APPENDIX
Tobias G. Klämpfl Page 130
proprietes a l'aide du spectroscope.] Translated from French. Proceedings of the Academy of Sciences; 1881; Paris.
14. Warburg E, Leithäuser G. About the analysis of nitrogen oxides by their absorption spectra in the ultrared [Über die Analyse der Stickoxyde durch ihre Absorptionsspektra im Ultrarot.] Translated from German. Annalen der Physik 1909; 28(4):313.
15. Warburg E. About the ozonation of oxygen by silent electric discharges [Über die Ozonisierung des Sauerstoffs durch stille elektrische Entladungen.] Translated from German. Annalen der Physik 1904; 318(3):464-76.
16. Warburg E. About the chemical effect of silent discharges. [Über die chemische Wirkung stiller Entladungen.] Translated from German. Zeitschrift für technische Physik 1925; 6(12):625-33.
17. Buss K. Electron-free discharge according to the measurement with the cathodic oscillograph [Die elektrodenlose Entladung nach Messung mit dem Kathodenoszillographen.] Tranlated from German. Archiv für Elektrotechnik 1932; 26(4):261-5.
18. Klemenc A, Hintenberger H, Höfer H. About the discharge process in an Siemens ozone apparatus [Über den Entladunsvorgang in einer Siemens-Ozonröhre.] Translated from German. Zeitschrift für Elektrochemie und angewandte physikalische Chemie 1937; 43(8):708-12.
19. Suzuki M. On the nature of chemical reaction in silent discharge. Proceedings of the Japan Academy 1950; 26(9):20-4.
20. Suzuki M, Naito Y. On the nature of the chemical reaction in silent electrical discharge. II. Proceedings of the Japan Academy 1952; 28(9):469-76.
21. Honda K, Naito Y. On the nature of silent electrical discharge. Journal of the Physical Society of Japan 1955; 10(11):1007-11.
22. Gobrecht H, Meinhardt O, Hein F. About the silent electrical discharge in ozonizers [Über die stille elektrische Entladung in Ozonisatoren.] Translated from German. Berichte der Bunsengesellschaft für physikalische Chemie 1964; 68(1):55-63.
23. Bagirov MA, Kurbanov MA, Shkilev AV. Study of Electrical Discharge in Air between Electrodes Covered by Dielectrics. Sov Phys Tech Phys [Zh Tekh Fiz] 1971; 16 [41](6):1011-21 [287-97].
24. Manley TC. The Electric Characteristics of the Ozonator Discharge Trans Electrochem Soc 1943; 84(1):83-96.
APPENDIX
Tobias G. Klämpfl Page 131
25. Becker H. About the extrapolation and calculation of the concentration and yield of ozone apparatus [Über die Extrapolation und Berechnung der Konzentration und Ausbeute von Ozonapparaten.] Translated from German. In: Harries CD, editor. Wissenschaftliche Veröffentlichungen aus dem Siemens-Konzern. Berlin: Springer-Verlag Berlin Heidelberg GmbH; 1922. p. 76-106.
26. Becker H. A simplified graphical presentation of the yield and concentration of ozone apparatus [Eine vereinfachte graphische Darstellung der Ausbeute und Konzentration bei Ozonapparaten.] Translated in German. In: Harries CD, editor. Wissenschaftliche Veröffentlichungen aus dem Siemens-Konzern. Berlin: Springer-Verlag Berlin Heidelberg GmbH; 1923. p. 243-7.
27. Otto M-P. The ozone and its applications [L'Ozone et ses applications.] Translated from French. Paris: Société française des électriciens; E. Chiron; 1929.
28. Kelly-Wintenberg K, Montie TC, Brickman C, Roth JR, Carr AK, Sorge K, Wadsworth LC, Tsai PPY. Room temperature sterilization of surfaces and fabrics with a One Atmosphere Uniform Glow Discharge Plasma. Journal of Industrial Microbiology & Biotechnology 1998; 20:69-74.
29. Fridman G, Peddinghaus M, Ayan H, Fridman A, Balasubramanian M, Gutsol A, Brooks A, Friedman G. Blood Coagulation and Living Tissue Sterilization by Floating-Electrode Dielectric Barrier Discharge in Air. Plasma Chemistry and Plasma Processing 2006; 26(4):425-42.
30. Eliasson B, Kogelschatz U. Modeling and applications of silent discharge plasmas IEEE Transactions on Plasma Science 1991; 19(2):309-23.
31. Eliasson B, Egli W, Kogelschatz U. Modeling Dielectric Barrier Discharge Chemistry. Pure and Applied Chemistry 1994; 66(6):1275-86.
32. Kogelschatz U. Filamentary, Patterned, and Diffuse Barrier Discharges. IEEE TRANSACTIONS ON PLASMA SCIENCE 2002; 30(4):1400-08.
33. Brandenburg R, Navratil Z, Jansky J, Stahel P, Trunec D, Wagner H-E. The transition between different modes of barrier discharges at atmospheric pressure Journal of Physics D: Applied Physics 2009; 42(8):085208.
34. Raether H. Development of the electron avalanche into the discharge channel [Die Entwicklung der Elektronenlawine in den Funkenkanal.] Translated from German. Zeitschrift für Physik 1939; 112(7-8):464-89.
35. Raether H. About the development of channel discharges [Zur Entwicklung von Kanalentladungen.] Translated from German. Archiv für Elektrotechnik 1940; 34(1):49-56.
APPENDIX
Tobias G. Klämpfl Page 132
36. Loeb LB, Meek JM. The Mechanism of Spark Discharge in Air at Atmospheric Pressure. Journal of Applied Physics 1940; 11:438-47.
37. Meek JM. A Theory of Spark Discharge. Physical Reviews 1940; 57(8):722-8.
38. Fridman A. Electric Discharges in Plasma Chemistry. Plasma Chemistry. New York: Cambridge University Press; 2008. p. 163.
39. Braun D, Küchler U, Pietsch G. Microdischarges in air-fed ozonizers. Journal of Physics D: Applied Physics 1991; 24(4):564-72.
40. Yoshida K, Tagashira H. Computer Simulation of Ozone Electrosynthesis in an N2/O2 Mixture-fed Ozonizer. Memoirs Kitami Institute of Technology 1986; 18(1):11-20.
41. Gibalov VI, Pietsch G. Dynamics of dielectric barrier discharges in different arrangements. Plasma Sources Sci Technol 2012; 21(2):1-35.
42. Eliasson B, Hirth M, Kogelschatz U. Ozone synthesis from oxygen in dielectric barrier discharges Journal of Physics D: Applied Physics 1987; 20:1421-37.
43. Herron JT, Green DS. Chemical Kinetics Database and Predictive Schemes for Nonthermal Humid Air Plasma Chemistry. Part II. Neutral Species Reactions. Plasma Chemistry and Plasma Processing 2001; 21(3):459-81.
44. Sieck LW, Herron JT, Green DS. Chemical Kinetics Database and Predictive Schemes for Humid Air Plasma Chemistry. Part I: Positive Ion–Molecule Reactions. Plasma Chemistry and Plasma Processing 2000; 20(2):235-57.
45. Capitelli M, Ferreira CM, Gordiets BF, Osipov AI. Plasma Kinetics in Atmospheric Gases. Heidelberg: Springer Verlag; 2000.
46. Becker KH, Kogelschatz U, Schoenbach KH, Barker RJ, editors. Non-Equilibrium Air Plasmas at Atmospheric Pressure. London: Insitute of Physics Publishing, Taylor & Travis, CRC Press; 2004.
47. Sakiyama Y, Graves DB, Chang HW, Shimizu T, Morfill GE. Plasma chemistry model of surface microdischarge in humid air and dynamics of reactive neutral species. J Phys D Appl Phys 2012; 45(42).
48. Samoilovich VG, Gibalov V, Kozlov KV, editors. Physical Chemistry of the Barrier Discharge. Düsseldorf: DVS-Verlag; 1997.
49. Kogelschatz U, Eliasson B, Hirth M. Ozone Generation from Oxygen and Air: Discharge Physics and Reaction Mechanisms. Ozone: Science & Engineering 1988; 10(4):367-78.
APPENDIX
Tobias G. Klämpfl Page 133
50. von Sonntag C, von Gunten U. Chemistry of Ozone in Water and Wastewater Treatment. London: IWA Publishing; 2012.
51. Eliasson B, Kogelschatz U. Electron impact dissociation in oxygen. Journal of Physics B: Atomic and Molecular Physics 1986; 19(8):1241-7.
52. Yagi S, Tanaka M. Mechanism of ozone generation in air-fed ozonisers. Journal of Physics D: Applied Physics 1979; 12(9):1509-20.
53. Kogelschatz U, Baessler P. Determination of Nitrous Oxide and Dinitrogen Pentoxide Concentrations in the Output of Air-Fed Ozone Generators of High Power Density. Ozone: Science & Engineering 1987; 9(3):195-206.
54. Stoffels E, Flikweert AJ, Stoffels WW, Kroesen GMW. Plasma needle: a non-destructive atmospheric plasma source for fine surface treatment of (bio)materials. Plasma Sources Sci Technol 2002; 11:383-8.
55. Kramer A, Hübner N-O, Assadian O, Below H, Bender C, Benkhai H, Bröker B, Ekkernkamp A, Eisenbeiß W, Hammann A, Hartmann B, Heidecke C-D, Hinz P, Koban I, Koch S, Kocher T, Lademann J, Lademann O, Lerch M, Maier S, Matthes R, Müller G, Partecke I, Rändler C, Weltmann K-D, Zygmunt M. Chances and perspectives of the plasma medicine by use of Tissue Tolerable Plasma (TTP). GMS Krankenhaushygiene Interdisziplinär 2009; 4(2):1-15.
56. Kong MG, Kroesen G, Morfill GE, Nosenko T, Shimizu T, van Dijk J, Zimmermann JL. Plasma medicine: an introductory review. New Journal of Physics 2009; 11:115012.
57. Demple B, Harrison L. Repair of oxidative damage to DNA: Enzymology and Biology. Annu Rev Biochem 1994; 63:915-48.
58. Graves DB. The emerging role of reactive oxygen and nitrogen species in redox biology and some implications for plasma applications to medicine and biology. Journal of Physics D: Applied Physics 2012; 45:263001 (42pp).
59. Stoffels E. ”Tissue Processing” with Atmospheric Plasmas. Contrib Plasma Phys 2007; 47(1-2):40-8.
60. Zhang XH, Li MJ, Zhou RL, Feng KC, Yang SZ. Ablation of liver cancer cells in vitro by a plasma needle. Applied Physical Letters 2008; 93:021502.
61. Keidar M, Walk R, Shashurin A, Srinivasan P, Sandler A, Dasgupta S, Ravi R, Guerrero-Preston R, Trink B. Cold plasma selectivity and the possibility of a paradigm shift in cancer therapy. Br J Cancer 2011; 105(9):1295-301.
APPENDIX
Tobias G. Klämpfl Page 134
62. Köritzer J, Boxhammer V, Schäfer A, Shimizu T, Klämpfl TG, Li YF, Welz C, Schwenk-Zieger S, Morfill GE, Zimmermann JL, Schlegel J. Restoration of sensitivity in chemo-resistant glioma cells by cold atmospheric plasma. PLoS One 2013; 8(5):e64498.
63. Arndt S, Wacker E, Li YF, Shimizu T, Thomas HM, Morfill GE, Karrer S, Zimmermann JL, Bosserhoff AK. Cold atmospheric plasma, a new strategy to induce senescence in melanoma cells. Exp Dermatol 2013; 22(4):284-9.
64. Heinlin J, Isbary G, Stolz W, Morfill G, Landthaler M, Shimizu T, Steffes B, Nosenko T, Zimmermann J, Karrer S. Plasma applications in medicine with a special focus on dermatology. Journal of the European Academy of Dermatology and Venereology : JEADV 2011; 25(1):1-11.
65. Lademann J, Kramer A, Richter H, Patzelt A, Meinke MC, Roewert-Huber J, Czaika V, Weltmann KD, Hartmann B, Koch S. Antisepsis of the follicular reservoir by treatment with tissue-tolerable plasma (TTP). Laser Phys Lett 2011; 8(4):313-7.
66. Kramer A, Hubner NO, Weltmann KD, Lademann J, Ekkernkamp A, Hinz P, Assadian O. Polypragmasia in the therapy of infected wounds - conclusions drawn from the perspectives of low temperature plasma technology for plasma wound therapy. GMS Krankenhaushygiene Interdisziplinär 2008; 3(1):Doc13.
67. Isbary G, Heinlin J, Shimizu T, Zimmermann JL, Morfill G, Schmidt HU, Monetti R, Steffes B, Bunk W, Li Y, Klämpfl T, Karrer S, Landthaler M, Stolz W. Successful and safe use of 2 min cold atmospheric argon plasma in chronic wounds: results of a randomized controlled trial. Brit J Dermatol 2012; 167(2):404-10.
68. Isbary G, Morfill GE, Schmidt HU, Georgi M, Ramrath K, Heinlin J, Karrer S, Landthaler M, Shimizu T, Steffes B, Bunk W, Monetti R, Zimmermann JL, Pompl R, Stolz W. A first prospective randomized controlled trial to decrease bacterial load using cold atmospheric argon plasma on chronic wounds in patients. The British journal of dermatology 2010; 163(1):78-82.
69. Isbary G, Stolz W, Shimizu T, Monetti R, Bunk W, Schmidt HU, Morfill GE, Klämpfl TG, Steffes B, Thomas HM, Heinlin J, Karrer S, Landthaler M, Zimmermann JL. Cold atmospheric argon plasma treatment may accelerate wound healing in chronic wounds: Results of an open retrospective randomized controlled study in vivo. Clinical Plasma Medicine 2013; In press - corrected proof.
70. Fridman A, Friedman G. Plasma Medicine. Philadelphia: John Wiley & Sons, Ltd.; 2013.

APPENDIX
Tobias G. Klämpfl Page 135
71. ECDC. Point prevalence survey of healthcare associated infections and antimicrobial use in European acute care hospitals. Stockholm: European Centre for Disease Prevention and Control 2013.
72. ECDC. Annual epidemiological report on communicable diseases in Europe. Stockholm: European Centre for Disease Prevention and Control (ECDC) 2010.
73. Pollack A. Rising Threat of Infections Unfazed by Antibiotics. New York Times. 2010.
74. CDC. Puplic Health Report. Centers for Disease Control and Prevention (CDC) 2007.
75. Coello R, Glenister H, Fereres J, Bartlett C, Leigh D, Sedgwick J, Cooke EM. The cost of infection in surgical patients: a case-control study. J Hosp Infect 1993; 25(4):239-50.
76. Cosgrove SE, Carmeli Y. The Impact of Antimicrobial Resistance on Health and Economic Outcome. Clinical Infectious Diseases 2003; 36(11):1433-7.
77. Leape LL, Brennan TA, Laird N, Lawthers AG, Localio AR, Barnes BA, Hebert L, Newhouse JP, Weiler PC, Hiatt H. The nature of adverse events in hospitalized patients. Results of the Harvard Medical Practice Study II. N Engl J Med 1991; 324(6):377-84.
78. Scott RD. The direct medical costs of healthcare-associated infections in U.S. hospitals and the benefits of prevention. Centers for Disease Control and Prevention 2009.
79. Bauer MP, Notermans DW, van Benthem BH, Brazier JS, Wilcox MH, Rupnik M, Monnet DL, van Dissel JT, Kuijper EJ. Clostridium difficile infection in Europe: a hospital-based survey. Lancet 2011; 377(9759):63-73.
80. Kuijper EJ, Coignard B, Tull P. Emergence of Clostridium difficile-associated disease in North America and Europe. Clin Microbiol Infect 2006; 12 Suppl 6:2-18.
81. Warny M, Pepin J, Fang A, Killgore G, Thompson A, Brazier J, Frost E, McDonald LC. Toxin production by an emerging strain of Clostridium difficile associated with outbreaks of severe disease in North America and Europe. Lancet 2005; 366(9491):1079-84.
82. McDonald LC, Killgore GE, Thompson A, Owens RC, Jr., Kazakova SV, Sambol SP, Johnson S, Gerding DN. An epidemic, toxin gene-variant strain of Clostridium difficile. N Engl J Med 2005; 353(23):2433-41.

APPENDIX
Tobias G. Klämpfl Page 136
83. Leggett MJ, McDonnell G, Denyer SP, Setlow P, Maillard JY. Bacterial spore structures and their protective role in biocide resistance. J Appl Microbiol 2012; 113(3):485-98.
84. Henriques AO, Moran CP, Jr. Structure, assembly, and function of the spore surface layers. Annu Rev Microbiol 2007; 61:555-88.
85. McFarland LV, Mulligan ME, Kwok RY, Stamm WE. Nosocomial acquisition of Clostridium difficile infection. N Engl J Med 1989; 320(4):204-10.
86. Kramer A, Schwebke I, Kampf G. How long do nosocomial pathogens persist on inanimate surfaces? A systematic review. BMC Infect Dis 2006; 6:130.
87. Speight S, Moy A, Macken S, Chitnis R, Hoffman PN, Davies A, Bennett A, Walker JT. Evaluation of the sporicidal activity of different chemical disinfectants used in hospitals against Clostridium difficile. J Hosp Infect 2011; 79(1):18-22.
88. Fawley WN, Underwood S, Freeman J, Baines SD, Saxton K, Stephenson K, Owens RC, Jr., Wilcox MH. Efficacy of hospital cleaning agents and germicides against epidemic Clostridium difficile strains. Infect Control Hosp Epidemiol 2007; 28(8):920-5.
89. Vonberg RP, Kuijper EJ, Wilcox MH, Barbut F, Tull P, Gastmeier P, van den Broek PJ, Colville A, Coignard B, Daha T, Debast S, Duerden BI, van den Hof S, van der Kooi T, Maarleveld HJ, Nagy E, Notermans DW, O'Driscoll J, Patel B, Stone S, Wiuff C. Infection control measures to limit the spread of Clostridium difficile. Clin Microbiol Infect 2008; 14 Suppl 5:2-20.
90. Hota B. Contamination, disinfection, and cross-colonization: are hospital surfaces reservoirs for nosocomial infection? Clin Infect Dis 2004; 39(8):1182-9.
91. Gebel J, Exner M, French GL, Chartier Y, Christiansen B, Gemein S, Goroncy-Bermes P, Hartemann P, Heudorf U, Kramer A, Maillard JY, Oltmanns P, Rotter M, Sonntag H-G. The role of surface disinfection in infection prevention. GMS Hygiene and Infection Control 2013; 8(1):Doc10.
92. Sehulster L, Chinn RY. Guidelines for environmental infection control in health-care facilities. Recommendations of CDC and the Healthcare Infection Control Practices Advisory Committee (HICPAC). MMWR Recomm Rep 2003; 52(RR-10):1-42.
93. Rutala WA, Weber DJ, HICPAC. Guideline for Disinfection and Sterilization in Healthcare Facilities. CDC. 2008:
APPENDIX
Tobias G. Klämpfl Page 137
94. Holy CE, Cheng C, Davies JE, Shoichet MS. Optimizing the sterilization of PLGA scaffolds for use in tissue engineering. Biomaterials 2001; 22(1):25-31.
95. Lerouge S, Tabrizian M, Wertheimer MR, Marchand R, Yahia L. Safety of plasma-based sterilization: surface modifications of polymeric medical devices induced by Sterrad and Plazlyte processes. Bio-medical materials and engineering 2002; 12(1):3-13.
96. Matthews IP, Gibson C, Samuel AH. Sterilisation of Implantable Devices. Clinical Materials 1994; 15(3):191-215.
97. Athanasiou KA, Niederauer GG, Agrawal CM. Sterilization, toxicity, biocompatibility and clinical applications of polylactic acid/polyglycolic acid copolymers. Biomaterials 1996; 17(2):93-102.
98. Feldman LA, Hui HK. Compatibility of Medical Devices and Materials with Low-Temperature Hydrogen Peroxide Gas Plasma. Medical Device & Diagnostic Industry. 1997:57-62.
99. EPA US. Health Effects Assessment Summary Tables (HEAST). Washington D.C.: U.S. Environmental Protection Agency 1997.
100. Angerer J, Bader M, Kramer A. Ambient and biochemical effect monitoring of workers exposed to ethylene oxide. International archives of occupational and environmental health 1998; 71(1):14-8.
101. Davies A, Pottage T, Bennett A, Walker J. Gaseous and air decontamination technologies for Clostridium difficile in the healthcare environment. J Hosp Infect 2011; 77(3):199-203.
102. Laroussi M. Sterilization of Contaminated Matter with an Atmospheric Pressure Plasma. IEEE Transactions on Plasma Science 1996; 24(3):1188-91.
103. Ehlbeck J, Schnabel U, Polak M, Winter J, von Wodtke T, Brandenburg R, von Hagen T, Weltmann K-D. Low temperature atmospheric pressure plasma sources for microbial decontamination. Journal of Physics D: Applied Physics 2011; 44:013002.
104. Muranyi P, Wunderlich J, Heise M. Sterilization efficiency of a cascaded dielectric barrier discharge. J Appl Microbiol 2007; 103:1535-44.
105. Gadri RB, Roth JR, Montie TC, Kelly-Wintenberg K, Tsai PP-Y, Helfritch DJ, Feldman P, Sherman DM, Karakaya F, Chen Z, Team UPS. Sterilization and plasma processing of room temperature surfaces with a one atmosphere

APPENDIX
Tobias G. Klämpfl Page 138
uniform glow discharge plasma (OAUGDP). Surface and Coatings Technology 2000; 131:528-42.
106. Cooper M, Fridman G, Staack D, Gutsol A, Vasilets VN, Anandan S, Cho YI, Fridman A, Tsapin A. Decontamination of Surfaces From Extremophile Organisms Using Nonthermal Atmospheric-Pressure Plasmas. IEEE Transactions on Plasma Science 2009; 37(6):866-71.
107. Shimizu S, Barczyk S, Rettberg P, Shimizu T, Klämpfl TG, Zimmermann JL, Hoeschen T, Linsmeier C, Weber P, Morfill GE, Thomas HM. Cold Atmospheric Plasma – a New Technology for Spacecraft Component Decontamination. Planetary and Space Science 2013; 90:60-71.
108. Von Woedtke T, Kramer A, Weltmann KD. Plasma Sterilization: What are the Conditions to Meet this Claim? Plasma Processes and Polymers 2008; 5:534-9.
109. Gebel J, Kirsch-Altena A, Exner M, Schwebke I. Prüfung der Wirksamkeit chemischer Desinfektionsmittel. In: Kramer A, Assadian O, editors. Wallhäusers Praxis der Sterilisation, Desinfektion, Antiseptik und Konservierung. 6 ed. Stuttgart, New York: Georg Thieme Verlag KG; 2008. p. 601-9.
110. Gemein S. Etablierung eines Testverfahrens zur Prüfung sporizider Flächendesinfektionsmittel mit dem Schwerpunkt Clostridium difficile Ribotyp 027. Bonn: University Bonn; 2011.
111. Tseng S, Abramzon N, Jackson JO, Lin WJ. Gas discharge plasmas are effective in inactivating Bacillus and Clostridium spores. Appl Microbiol Biotechnol 2012; 93(6):2563-70.
112. Morfill GE, Shimizu T, Steffes B, Schmidt H-U. Nosocomial infections - a new approach towards preventive medicine using plasmas. New Journal of Physics 2009; 11:115019.
113. Choi JH, Han I, Baik HK, Lee MH, Han D-W, Park J-C, Lee I-S, Song KM, Lim YS. Analysis of sterilization effect by pulsed dielectric barrier discharge. Journal of Electrostatics 2006; 64(1):17-22.
114. Leipold F, Kusano Y, Hansen F, Jacobsen T. Decontamination of a rotating cutting tool during operation by means of atmospheric pressure plasmas. Food Control 2010; 21(8):1194-98.
115. Oehmigen K, Hähnel M, Brandenburg R, Wilke C, Weltmann K-D, von Woedtke T. The Role of Acidification for Antimicrobial Activity of Atmospheric Pressure Plasma in Liquids. Plasma Processes and Polymers 2010; 7(3-4):250-7.

APPENDIX
Tobias G. Klämpfl Page 139
116. Joshi SG, Paff M, Friedman G, Fridman G, Firdman A, Brooks AD. Control of methicillin-resistant Staphylococcus aureus in planktonic form and biofilms: A biocidal efficacy study of nonthermal dielectric-barrier discharge plasma. Am J Infect Control 2010; 38(4):293-301.
117. Joshi SG, Cooper M, Yost A, Paff M, Ercan UK, Fridman G, Friedman G, Fridman A, Brooks AD. Nonthermal Dielectric-Barrier Discharge Plasma-Induced Inactivation Involves Oxidative DNA Damage and Membrane Lipid Peroxidation in Escherichia coli. Antimicrobial Agents and Chemotherapy 2011; 55(3):1053-62.
118. Mastanaiah N, Johnson JA, Roy S. Effect of Dielectric and Liquid on Plasma Sterilization Using Dielectric Barrier Discharge Plasma. PLoS One 2013; 8(8):e70840.
119. Montie TC, Kelly-Wintenberg K, Roth JR. An overview of research using the one atmosphere uniform glow discharge plasma (OAUGDP) for sterilization of surfaces and materials. IEEE Transactions on Plasma Science 2000; 28(1):41-50.
120. Schwabedissen A, Lacinski P, Chen X, Engemann J. PlasmaLabel – a New Method to Disinfect Goods Inside a Closed Package Using Dielectric Barrier Discharges. Contributions to Plasma Physics 2007; 47(7):551-8.
121. Eto H, Ono Y, Ogino A, Nagatsu M. Low-temperature sterilization of wrapped materials using flexible sheet-type dielectric barrier discharge. Applied Physical Letters 2008; 93:221502.
122. Eto H, Ono Y, Ogino A, Nagatsu M. Low-Temperature Internal Sterilization of Medical Plastic Tubes Using a Linear Dielectric Barrier Discharge. Plasma Processes and Polymers 2008; 5:269-74.
123. Hähnel M, Von Woedtke T, Weltmann KD. Influence of the Air Humidity on the Reduction of Bacillus Spores in a Defined Environment at Atmospheric Pressure Using a Dielectric Barrier Surface Discharge. Plasma Processes and Polymers 2010; 7(3-4):244-9.
124. Cotter JJ, Maguire P, Soberon F, Daniels S, O`Gara J, Casey E. Disinfection of meticillin-resistant Staphylococcus aureus and Staphylococcus epidermidis biofilms using a remote non-thermal gas plasma. Journal of Hospital Infection 2011; 78(3):204-7.
125. Zimmermann JL, Dumler K, Shimizu T, Morfill GE, Wolf A, Boxhammer V, Schlegel J, Gansbacher B, Anton M. Effects of cold atmospheric plasmas on adenoviruses in solution. J Phys D Appl Phys 2011; 44(50).
APPENDIX
Tobias G. Klämpfl Page 140
126. Shimizu T, Zimmermann JL, Morfill G. The bactericidal effect of surface micro-discharge plasma under different ambient conditions. New Journal of Physics 2011; 13:023026.
127. Boxhammer V, Morfill GE, Jokipii JR, Shimizu T, Klämpfl T, Li YF, Koritzer J, Schlegel J, Zimmermann JL. Bactericidal action of cold atmospheric plasma in solution. New Journal of Physics 2012; 14.
128. Maisch T, Shimizu T, Li Y-F, Heinlin J, Karrer S, Morfill GE, Zimmermann JL. Decolonisation of MRSA, S. aureus and E. coli by atmospheric plasma using a porcine skin model in vitro PLoS One 2012; 7(4):e34610.
129. Maisch T, Shimizu T, Mitra A, Heinlin J, Karrer S, Li Y-F, Morfill G, Zimmermann JL. Contact-free cold atmospheric plasma treatment of Deinococcus radiodurans. Journal of industrial microbiology & biotechnology 2012; 39(9):1367-75.
130. Maisch T, Shimizu T, Isbary G, Heinlin J, Karrer S, Klämpfl TG, Li Y-F, Morfill GE, Zimmermann JL. Contact-free inactivation of Candida albicans biofilm by Cold-Atmospheric Air Plasma. Journal of Applied and Environmental Microbiology 2012; 78(12):4242-7.
131. Klämpfl TG, Isbary G, Shimizu T, Li YF, Zimmermann JL, Stolz W, Schlegel J, Morfill GE, Schmidt HU. Cold atmospheric air plasma sterilization against spores and other microorganisms of clinical interest. Applied and Environmental Microbiology 2012; 78(15):5077-82.
132. Mitra A, Li Y-F, Klämpfl TG, Shimizu T, Jeon J, Morfill GE, Zimmermann JL. Inactivation of surface borne microorganisms and increased germination of seed specimen by Cold Atmospheric Plasma (CAP). Food and Bioprocess Technology 2013.
133. Pavlovich MJ, Chen Z, Sakiyama Y, Clark DS, Graves DB. Effect of Discharge Parameters and Surface Characteristics on Ambient-Gas Plasma Disinfection. Plasma Processes and Polymers 2013; 10:69 - 76.
134. Pavlovich MJ, Chang H-W, Sakiyama Y, Clark DS, Graves DB. Ozone correlates with antibacterial effects from indirect air dielectric barrier discharge treatment of water. Journal of Physics D: Applied Physics 2013; 46:145202 (10pp).
135. DIN EN ISO14937. Sterilization of health care products. General requirements for characterization of a sterilizing agent and the development, validation and routine control of a sterilization process for medical devices. German Version EN ISO 14937:2009.

APPENDIX
Tobias G. Klämpfl Page 141
136. DIN EN 14885. Chemical disinfectants and antiseptics - Application of European Standards for chemical disinfectants and antiseptics. German version EN 14885:2006.
137. Pearse RWB, Gaydon AG. The identification of molecular spectra. 4th ed. London: John Wiley & Sons, Inc. New York; 1976.
138. Molina LT, Molina MJ. Absolute absorption cross sections of ozone in the 185- to 350-nm wavelength range. Jorunal of Geophysical Research Atmospheres 1986; 91(D13):14501-08.
139. DIN EN ISO 11737-1. Sterilization of medical devices - Microbiological methods - Part 1: Determination of a population of microorganisms on products. German version EN ISO 11737-1:2006 + AC:2009.
140. Rutala WA. Principles of Disinfecting Patient-Care Items. Disinfection, Sterilization and Antiseptics in Health Care: Polyscience Publishers; 1998. p. 133-49.
141. DIN EN 12353. Chemical disinfectants and antiseptics - Preservation of test organisms used for the determination of bactericidal (including Legionella), mycobactericidal, sporicidal, fungicidal and virucidal (including bacteriophages) activity. German version EN 12353:2013.
142. DIN EN 13704. Chemical disinfectants - Quantitative suspension test for the evaluation of sporicidal activity of chemical desinfectants used in food, industrial, domestic and institutional areas - Test method and requirements (phase 2/step 1). German version EN 13704:2002.
143. CEN. N 783 WI Phase2-Step1 anaerobic spores. CEN TC 216. 2013: 1-52.
144. DIN EN 14561. Chemical disinfectants and antiseptics - Quantitative carrier test for the evaluation of bactericidal activity for instruments used in the medical area - Test method and requirements (phase 2, step 2). German version EN 14561:2006.
145. IHPH. SOP 112: Enrichment B. subtilis spores modified from Schaeffer - testing disinfecting agents. Institute for Hygiene and Public Health. 2004: 1-4.
146. Exner M, Vacata V, Hornei B, Dietlein E, Gebel J. Household cleaning and surface disinfection: new insights and strategies. J Hosp Infect 2004; 56 Suppl 2:S70-5.
147. DIN EN 16615:2013-06. Chemical disinfectants and antiseptics - Quantitative test method for the evaluation of bactericidal and yeasticidal activity on non-porous surfaces with mechanical action employing wipes in the medical area

APPENDIX
Tobias G. Klämpfl Page 142
(4-field test) - Test method and requirements (phase 2, step 2). German version prEN 16615:2013.
148. Gebel J, Exner M. Überprüfung der Wirksamkeit der Kombination von einem spezifizierten Wischtuch und einem Desinfektionsmittel im praxisnahen 4-Felder-Test. Hyg Med 2013; 38(6):252-6.
149. DIN 10113-1. Determination of surface colony count on fitment and utensils in foodareas - Part 1: Quantitative swab method. DIN 10113-1:1997-07.
150. DIN EN ISO 18472. Sterilization of health care products - Biological and chemical indicators - Test equipment. German version EN ISO 18472:2006.
151. Li Y-F, Shimizu T, Zimmermann JL, Morfill GE. Cold atmospheric plasma for surface disinfection. Plasma Processes and Polymers 2011; 8.
152. Morfill GE, Kong MG, Zimmermann JL. Focus on Plasma Medicine. New Journal of Physics 2009; 11:115011 (8pp).
153. Ayan H, Fridman G, Gutsol A, Vasilets VN, Fridman A, Friedman G. Nanosecond-Pulsed Uniform Dielectric-Barrier Discharge. IEEE Transactions on Plasma Science 2008; 36(2):504-8.
154. Isbary G, Köritzer J, Mitra A, Li Y-F, Shimizu T, Schroeder J, Schlegel J, Morfill GE, Stolz W, Zimmermann JL. Ex vivo human skin experiments for the evaluation of safety of new cold atmospheric plasma devices. Clinical Plasma Medicine 2013; 1(1):36-44.
155. Laroussi M, Leipold F. Evaluation of the roles of reactive species, heat, and UV radiation in the inactivation of bacterial cells by air plasmas at atmospheric pressure. International Journal of Mass Spectrometry 2004; 233:81-6.
156. Burleson GR, Murray TM, Pollard M. Inactivation of Viruses and Bacteria by Ozone, With and Without Sonication. Applied and Environmental Microbiology 1975; 29(3):340-4.
157. Victorin K. Review of the genotoxicity of ozone. Mutation Research/Reviews in Genetic Toxicology 1992; 277(3):221-38.
158. Menzel DB. Ozone: an overview of its toxicity in man and animals. J Toxicol Environ Health 1984; 13(2-3):183-204.
159. OSHA. Ozone. Occupational Safety & Health Organization; 2012; Available from: https://www.osha.gov/dts/chemicalsampling/data/CH_259300.html.
APPENDIX
Tobias G. Klämpfl Page 143
160. NIOSH. NIOSH Pocket Guide To Chemical Hazards. National Institute for Occupational Safety and Health. 2007:
161. Shimizu T, Sakiyama Y, Graves DB, Zimmermann JL, Morfill GE. The dynamics of ozone generation and mode transition in air surface micro-discharge plasma at atmospheric pressure. New Journal of Physics 2012; 14.
162. Muranyi P, Wunderlich J, Heise M. Influence of relative gas humidity on the inactivation efficiency of a low temperature gas plasma. J Appl Microbiol 2008; 104:1659-66.
163. Zhao G, Zhu A, Wu J, Liu Z, Xu Y. Mearurement of OH Radicals in Dielectric Barrier Discharge Plasmas by Cavity Ring-Down Spectroscopy. Plasma Science and Technology 2010; 12(2):166-71.
164. Kudrle V, Vasina P, Talsky A, Mrazkova M, Stec O, Janca J. Plasma diagnostics using electron paramagnetic resonance. Journal of Physics D: Applied Physics 2010; 43:13pp.
165. Kozlov KV, Wagner H-E, Brandenburg R, Michel P. Spatio-temporally resolved spectroscopic diagnostics of the barrier discharge in air at atmospheric pressure. Journal of Physics D: Applied Physics 2001; 34(21):3164.
166. Bruggeman P, Walsh JL, Schram DC, Leys C, Kong MG. Time dependent optical emission spectroscopy of sub-microsecond pulsed plasmas in air with water cathode. Plasma Sources Sci Technol 2009; 18(4):045023.
167. Stancu GD, Kaddouri F, Lacoste DA, Laux CO. Atmospheric pressure plasma diagnostics by OES, CRDS and TALIF. Journal of Physics D: Applied Physics 2010; 43:124002.
168. Lukas C, Spaan M, Schulz-von der Gathen V, Thomson M, Wegst R, Döbele HF, Neiger M. Dielectric Barrier Discharges with Steep Voltage Rise: Mapping of Atomic Nitrogen in Single Filaments Measured by Laser-Induced Fluorescence Spectroscopy. Plasma Sources Sci Technol 2001; 10:445-50.
169. Niemi K, Schulz-von der Gathen V, Döbele HF. Absolute Calibration of Atomic Density Measurements by Laser-Induced Fluorescence Spectroscopy with Two-Photon Excitation. Journal of Physics D: Applied Physics 2001; 34:2330-5.
170. Zimmermann JL, Shimizu T, Schmidt HU, Li Y-F, Morfill GE, Isbary G. Test for bacterial resistance build-up against plasma treatment New Journal of Physics 2012; 14:073037.
APPENDIX
Tobias G. Klämpfl Page 144
171. Leduc M, Guay D, Leask RL, Coulombe S. Cell permeabilization using a non-thermal plasma. New Journal of Physics 2009; 11:115021.
172. Bielski BHJ, Arudi RL, Sutherland MW. A study of the reactivity of perihydroxy radical/superoxide ion with unsaturated fatty acids. Journal of Biological Chemistry 1983; 258:4759-61.
173. Pompl R, Jamitzky F, Shimizu T, Steffes B, Bunk W, Schmidt H-U, Georgi M, Ramrath K, Stolz W, Stark RW, Urayama T, Fujii S, Morfill GE. The effect of low-temperature plasma on bacteria as observed by repeated AFM imaging. New Journal of Physics 2009; 11:115023.
174. Setlow P. Spores of Bacillus subtilis: their resistance to and killing by radiation, heat and chemicals. J Appl Microbiol 2006; 101:514-25.
175. Setlow P. I will survive: DNA protection in bacterial spores. TRENDS in Microbiology 2007; 15(4):172-80.
176. Mahfoudh A, Poncin-Épaillard F, Moisan M, Barbeau J. Effect of dry-ozone exposure on different polymer surfaces and their resulting biocidal action on sporulated bacteria. Surface Science 2010; 604:1487-93.
177. Mahfoudh A, Barbeau J, Moisan M, Leduc A, Segúin J. Biocidal action of ozone-treated polystyrene surfaces on vegetative and sporulated bacteria. Applied Surface Science 2009; 256:3063-72.
178. Stapelmann K, Fiebrandt M, Raguse M, Awakowicz P, Reitz G, Möller R. Utilization of Low-Pressure Plasma to Inactivate Bacterial Spores on Stainless Steel Screws. Astrobiology 2013; 13(7):597-606.
179. Ishizaki K, Shinriki N, Matsuyama H. Inactivation of Bacillus spores by gaseous ozone. J Appl Bacteriol 1986; 60(1):67-72.
180. Aydogan A, Gurol MD. Application of gaseous ozone for inactivation of Bacillus subtilis spores. J Air Waste Manag Assoc 2006; 56(2):179-85.
181. Yardimci O, Setlow P. Plasma Sterilization: Opportunities and Microbial Assessment Strategies in Medical Device Manufacturing. IEEE Transactions on Plasma Science 2010; 38(4):973-81.
182. Cortezzo DE, Koziol-Dube K, Setlow B, Setlow P. Treatment with oxidizing agents damages the inner membrane of spores of Bacillus subtilis and sensitizes spores to subsequent stress. J Appl Microbiol 2004; 97:838-52.
183. Kong L, Zhang P, Wang G, Yu J, Setlow P, Li Y-q. Characterization of bacterial spore germination using phase-contrast and fluorescence
APPENDIX
Tobias G. Klämpfl Page 145
microscopy, Raman spectroscopy and optical tweezers. NATURE PROTOCOLS 2011; 6(5):625-39.
184. Zhang P, Kong L, Wang G, Setlow P, Li Y-q. Monitoring the Wet-Heat Inactivation Dynamics of Single Spores of Bacillus Species by Using Raman tweezers, Differential Interference Contrast Microscopy, and Nucleic Acid Dye Fluorescence Microscopy. Journal of Applied and Environmental Microbiology 2011; 77(14):4754-69.
185. Mahfoudh A, Moisan M, Segúin J, Barbeau J, Kabouzi Y, Kéroack D. Inactivation of Vegetative and Sporulated Bacteria by Dry Gaseous Ozone. Ozone: Science & Engineering 2010; (32):180-98.
186. Block C. The effect of Perasafe and sodium dichloroisocyanurate (NaDCC) against spores of Clostridium difficile and Bacillus atrophaeus on stainless steel and polyvinyl chloride surfaces. J Hosp Infect 2004; 57(2):144-8.
187. Barbut F, Menuet D, Verachten M, Girou E. Comparison of the efficacy of a hydrogen peroxide dry-mist disinfection system and sodium hypochlorite solution for eradication of Clostridium difficile spores. Infect Control Hosp Epidemiol 2009; 30(6):507-14.
188. Perez J, Springthorpe VS, Sattar SA. Activity of selected oxidizing microbicides against the spores of Clostridium difficile: relevance to environmental control. Am J Infect Control 2005; 33(6):320-5.
189. Maillard JY. Innate resistance to sporicides and potential failure to decontaminate. J Hosp Infect 2011; 77(3):204-9.
190. Shenton MJ, Lovell-Hoare MC, Stevens GC. Adhesion enhancement of polymer surfaces by atmospheric plasma treatment Journal of Physics D: Applied Physics 2001; 34(18):2754.
191. Block C, Robenshtok E, Simhon A, Shapiro M. Evaluation of chlorhexidine and povidone iodine activity against methicillin-resistant Staphylococcus aureus and vancomycin-resistant Enterococcus faecalis using a surface test. Journal of Hospital Infection 2000; 46(2):147-52.
192. Pottage T, Macken S, Walker JT, Bennett A. Meticillin-resistant Staphylococcus aureus is more resistant to vaporized hydrogen peroxide than commercial Geobacillus stearothermophilus biological indicators. Journal of Hospital Infection 2012; 80(1):41-5.
193. Finnegan M, Linley E, Denyer SP, McDonnell G, Simons C, Maillard JY. Mode of action of hydrogen peroxide and other oxidizing agents: differences between liquid and gas forms. J Antimicrob Chemother 2010; 65(10):2108-15.
APPENDIX
Tobias G. Klämpfl Page 146
194. Khadre MA, Yousef AE. Sporicidal action of ozone and hydrogen peroxide: a comparative study. Int J Food Microbiol 2001; 71(2-3):131-8.
195. Otter JA, Yezli S, French GL. Impact of the suspending medium on susceptibility of meticillin-resistant Staphylococcus aureus to hydrogen peroxide vapour decontamination. J Hosp Infect 2012; 82(3):213-5.
196. Springthorpe VS, Sattar SA. Carrier tests to assess microbicidal activities of chemical disinfectants for use on medical devices and environmental surfaces. J AOAC Int 2005; 88(1):182-201.
197. Sattar SA. Promises and pitfalls of recent advances in chemical means of preventing the spread of nosocomial infections by environmental surfaces. Am J Infect Control 2010; 38(5 Suppl 1):S34-40.
198. Welz C, Becker S, Li Y-F, Shimizu T, Jeon J, Schwenk-Zieger S, Thomas HM, Isbary G, Morfill GE, Harréus U, Zimmermann JL. Effects of cold atmospheric plasma on mucosal tissue culture. Journal of Physics D: Applied Physics 2013; 46(4):045401.
199. Boxhammer V, Li YF, Koritzer J, Shimizu T, Maisch T, Thomas HM, Schlegel J, Morfill GE, Zimmermann JL. Investigation of the mutagenic potential of cold atmospheric plasma at bactericidal dosages. Mutat Res-Gen Tox En 2013; 753(1):23-8.
200. Meyer B, Exner M, Gebel J. Re: Spread and persistence of Clostridium difficile spores during and after cleaning with sporicidal disinfectants. J Hosp Infect 2012; 80(2):185; author reply 6.
201. Büttgen S, Gebel J, Hornei B, Engelhart S, Koch ONJ, Exner M. Comparison of chemo resistance of Clostridium difficile ribotype 027 spores and Bacillus subtilis spores against desinfectants. Hyg Med 2008; 33(12):513-7.
202. Horejsh D, Kampf G. Efficacy of three surface disinfectants against spores of Clostridium difficile ribotype 027. International Journal of Hygiene and Environmental Health 2011; 214(2):172-4.
203. Chatuev BA, Peterson JW. Analysis of the sporicidal activity of chlorine dioxide disinfectant against Bacillus anthracis (Sterne strain). Journal of Hospital Infection 2010; 74(2):178-83.
204. Büttgen S, Gebel J, von Rheinbaben F, Hornei B, Engelhart S, Exner M. Efficacy of surface and instrument disinfectants with sporicidal claims against spores of Clostridium difficile ribotype 027. Hyg Med 2008; 33(5):194-200.

APPENDIX
Tobias G. Klämpfl Page 147
205. Ali S, Moore G, Wilson AP. Spread and persistence of Clostridium difficile spores during and after cleaning with sporicidal disinfectants. J Hosp Infect 2011; 79(1):97-8.
206. Wilcox MH, Fraise AP, Bradley CR, Walker J, Finch RG. Sporicides for Clostridium difficile: the devil is in the detail. J Hosp Infect 2011; 77(3):187-8.
207. Zimmermann JL, Shimizu T, Boxhammer V, Morfill GE. Disinfection Through Different Textiles Using Low Temperature Atmospheric Pressure Plasma. Plasma Processes and Polymers 2012; 9(8):792-8.
208. Donskey CJ. Does improving surface cleaning and disinfection reduce health care-associated infections? Am J Infect Control 2013; 41(5):S12-S9.
209. Otter JA, Yezli S, Salkeld JA, French GL. Evidence that contaminated surfaces contribute to the transmission of hospital pathogens and an overview of strategies to address contaminated surfaces in hospital settings. Am J Infect Control 2013; 41(5 Suppl):S6-11.
210. Dettenkofer M, Wenzler S, Amthor S, Antes G, Motschall E, Daschner FD. Does disinfection of environmental surfaces influence nosocomial infection rates? A systematic review. Am J Infect Control 2004; 32(2):84-98.
211. Dettenkofer M, Spencer RC. Importance of environmental decontamination - a critical view. Jorunal of Hospital Infection 2007; 65(S2):55-7.
212. Dettenkofer M, Daschner FD. Detergent versus hypochlorite cleaning and Clostridium difficile infection. Journal of Hospital Infection 2004; 56(1):78-9.
213. Allerberger F, Ayliffe GAJ, Bassett M, Braveny I, Bucher A, Damani N, Daschner FD, Dettenkofer M, Ezpeleta C, Gastmeier P, Geffers C, Giamarellou H, Goldman D, Grzesiowski P, Gubina M, Haanen PEM, Haydouchka I, Hübner J, Kalenic S, Van Knippenberg-Gordebeke G, Kranenburg AMH, Krcmery V, Kropec A, Krüger W, Lemmen S, Mayhall CG, Meester M, Meetar S, Munzinger J, Muzlovic I, Ojajarvi J, Rüden H, Scott G, Shah P, Tambic-Andraszevic A, Unertl K, Voss A, Weist K. Routine surface disinfection in health care facilities: Should we do it? Am J Infect Control 2002; 30(5):318-9.
214. Rutala WA, Weber DJ. Disinfection and sterilization: an overview. Am J Infect Control 2013; 41(5 Suppl):S2-5.
215. McDonnell G, Russell AD. Antiseptics and disinfectants: activity, action, and resistance. Clin Microbiol Rev 1999; 12(1):147-79.
APPENDIX
Tobias G. Klämpfl Page 148
216. Rupf S, Lehmann A, Hannig M, Schäfer B, Schubert A, Feldmann U, Schindler A. Killing of adherent oral microbes by a non-thermal atmospheric plasma jet. J Med Microbiol 2010; 59:206-12.
217. Koban I, Matthes R, Hübner N-O, Welk A, Meisel P, Holtfreter B, Sietmann R, Kindel E, Weltmann KD, Kramer A, Kocher T. Treatment of Candida albicans biofilms with low-temperature plasma induced by dielectric barrier discharge and atmospheric pressure plasma jet. New Journal of Physics 2010; 12:073039.
218. Sun Y, Yu S, Sun P, Wu H, Zhu W, Liu W, Zhang J, Fang J, Li R. Inactivation of Candida Biofilms by Non-Thermal Plasma and Its Enhancement for Fungistatic Effect of Antifungal Drugs PLoS One 2012; 7(7):e40629.
219. Alshraiedeh NH, Alkawareek MY, Gorman SP, Graham WG, Gilmore BF. Atmospheric pressure, nonthermal plasma inactivation of MS2 bacteriophage: effect of oxygen concentration on virucidal activity. Jorunal of Applied Microbiology 2013; 115(6):1420-26.
220. Venezia RA, Orrico M, Houston E, Yin S-M, Naumova YY. Lethal Activity of Nonthermal Plasma Sterilization Against Microorganisms. Infect Control Hosp Epidemiol 2008; 29(5):430-6.
221. Rowan NJ, MacGregor SJ, Anderson JG, Cameron D, Farish O. Inactivation of Mycobacterium paratuberculosis by Pulsed Electric Fields. Applied and Environmental Microbiology 2001; 67(6):2833-36.
222. Lessa FC, Gould CV, McDonald LC. Current Status of Clostridium difficile Infection Epidemiology. Clinical infectious diseases 2012; 55(S2):S65-70.
223. Polak M, Winter J, Schnabel U, Ehlbeck J, Weltmann K-D. Innovative Plasma Generation in Flexible Biopsy Channels for Inner-Tube Decontamination and Medical Applications. Plasma Processes and Polymers 2012; 9(1):67-76.
224. Bussiahn R, Brandenburg R, Gerling T, Kindel E, Lange H, Lembke N, Weltmann K-D, Von Woedtke T, Kocher T. The hairline plasma: An intermittent negative dc-corona discharge at atmospheric pressure for plasma medical applications. Applied Physics Letters 2010; 96:143701.
225. Schaudinn C, Jaramillo D, Freire MO, Sedghizadeh PP, Ngyuen A, Webster P, Costerton JW, Jiang C. Evaluation of a nonthermal plasma needle to eliminate ex vivo biofilms in root canals of extracted human teeth. International Endodontic Journal 2013; 46(10):930-7.
226. Pan J, Sun K, Liang Y, Sun P, Yang X, Wang J, Zhang J, Zhu W, Fang J, Becker KH. Cold plasma therapy of a tooth root canal infected with
APPENDIX
Tobias G. Klämpfl Page 149
Enterococcus faecalis biofilms in vitro. Journal of Endodontics 2013; 39(1):105-10.
227. WHO. WHO Guidelines on Hand Hygiene in Health Care. World Health Organization. 2009:
228. Kachrimanidou M, Malisiovas N. Clostridium difficile infection: a comprehensive review. Crit Rev Microbiol 2011; 37(3):178-87.
229. Kothari C, Gaind R, Singh LC, Sinha A, Kumari V, Arya S, Chellani H, Saxena S, Deb M. Community acquisition of beta-lactamase producing Enterobacteriaceae in neonatal gut. BMC Microbiol 2013; 13:136.
230. Giuffre M, Cipolla D, Bonura C, Geraci DM, Aleo A, Di Noto S, Nociforo F, Corsello G, Mammina C. Outbreak of colonizations by extended-spectrum beta-lactamase-producing Escherichia coli sequence type 131 in a neonatal intensive care unit, Italy. Antimicrob Resist Infect Control 2013; 2(1):8.
231. Rettedal S, Lohr IH, Natas O, Giske CG, Sundsfjord A, Oymar K. First outbreak of extended-spectrum beta-lactamase-producing Klebsiella pneumoniae in a Norwegian neonatal intensive care unit; associated with contaminated breast milk and resolved by strict cohorting. Apmis 2012; 120(8):612-21.
232. Oteo J, Cercenado E, Vindel A, Bautista V, Fernandez-Romero S, Saez D, Padilla B, Zamora E, Campos J. Outbreak of multidrug-resistant CTX-M-15-producing Enterobacter cloacae in a neonatal intensive care unit. J Med Microbiol 2013; 62(Pt 4):571-5.
233. van Nood E, Vrieze A, Nieuwdorp M, Fuentes S, Zoetendal EG, de Vos WM, Visser CE, Kuijper EJ, Bartelsman JF, Tijssen JG, Speelman P, Dijkgraaf MG, Keller JJ. Duodenal infusion of donor feces for recurrent Clostridium difficile. N Engl J Med 2013; 368(5):407-15.
234. Kelly CP, LaMont JT. Clostridium difficile - more difficult than ever. N Engl J Med 2008; 359(18):1932-40.

APPENDIX
Tobias G. Klämpfl Page 150
7 APPENDIX
7.1 List of figures
Figure 1.1: Schematic view of plasma with freely moving charges. ............................ 2
Figure 1.2: Atmospheric pressure discharges: corona [7], glow [8] and arc [9] (from left to right). ................................................................................................................. 4
Figure 1.3: Typical basic configuration of a DBD system. .......................................... 6
Figure 1.4: Schematic view of the SMD electrode system used in this study. ............ 9
Figure 1.5: Surface micro-discharge and an equivalent electric circuit. .................... 10
Figure 1.6: Principle streamer mechanism of micro-discharges in DBD. .................. 12
Figure 1.7: Discharge pattern of the SMD electrode and plasma-chemical species involved in humid SMD air plasma used in this work. ............................................... 14
Figure 2.1: Photo image (A) and schematic view (B) of the SMD plasma device used for experiments: biological indicator (1), electrode system (2) and lid (3). ................ 27
Figure 2.2: General setting for plasma experiments. ................................................ 28
Figure 2.3: Typical measurement of the applied voltage U(t) and current I(t) shape of the filamentary discharge in air. ................................................................................ 29
Figure 2.4: Inhomogeneous discharge pattern with welding grid. ............................. 29
Figure 2.5: Examples of different mesh grids tested (purchased from Mevaco) ....... 30
Figure 2.6: Experimental set-up for OES measurements. ........................................ 32
Figure 2.7: UV power measurement set-up. ............................................................. 34
Figure 2.8: Symbolic presentation of micro-discharge activity and corresponding voltage/charge Lissajous figure (adapted from [10]). ................................................ 36
Figure 2.9: Experimental set-up for the determination of the ozone concentration via absorption spectroscopy. .......................................................................................... 39
Figure 2.10: Biological indicator coupons: transparent impermeable PE cover on one side (left) and opaque gas permeable Tyvek® on the other side (right). .................. 40
Figure 2.11: Schematic of the normal 4-field-test proposed as standard for surface disinfectants. ............................................................................................................. 48
Figure 2.12: Schematic of the modified 4-field-test for the investigation of plasma in surface disinfection. .................................................................................................. 48
APPENDIX
Tobias G. Klämpfl Page 151
Figure 2.13: Set up of the modified SMD device. ..................................................... 49
Figure 3.1: Photographic results of MH agar plates of E. coli treated with plasma derived from different grounded electrodes (A, B, C, D) at 2 kHz and 7 or 9 kVpp, at 6 kHz and varying voltages and the corresponding discharge appearance. ................ 56
Figure 3.2: Effect of plasma exposure on diverse device components. .................... 57
Figure 3.3: Final SMD electrode configuration. ......................................................... 58
Figure 3.4: Dominating OES spectral lines of SMD air discharges (upper spectra) and magnified spectral regions with minor peak appearances (smaller spectra). ............ 60
Figure 3.5: Temperature profile inside the closed FP2.0 at varying frequencies. ..... 62
Figure 3.6: Ozone concentration profiles after in situ (top) and ex situ measurements (bottom) inside the closed FP2.0 during plasma discharge (left) and afterwards (right) at varying frequencies. ............................................................................................. 64
Figure 3.7: Ozone doses derived from in situ measurements. .................................. 65
Figure 3.8: Reduction curves of plasma-treated vegetative bacteria on MH agar plates.. ...................................................................................................................... 66
Figure 3.9: Reduction curves of plasma-treated bacterial endospores validating sterilization. ............................................................................................................... 68
Figure 3.10: Reduction of bacterial endospores by plasma with 106 cfu on carriers for testing disinfection. ................................................................................................... 70
Figure 3.11: Reduction of vegetative bacteria by plasma with 108 cfu (A) and 106 cfu (B) on carriers for testing disinfection. ...................................................................... 71
Figure 3.12: SEM micrographs showing the distribution of untreated bacterial endospores. .............................................................................................................. 72
Figure 3.13: EDX elemental mapping of the same untreated and treated C. difficile spore (pre-cleaned condition). .................................................................................. 74
Figure 3.14: SEM micrographs demonstrating the distribution of untreated E. faecium bacteria. .................................................................................................................... 75
Figure 3.15: SEM micrographs depicting multi-layers of untreated E. faecium bacteria (pre-cleaned condition). ............................................................................................ 76
Figure 3.16: SEM micrographs demonstrating untreated and treated E. faecium bacteria (108 cfu; pre-cleaned condition). ................................................................. 77

APPENDIX
Tobias G. Klämpfl Page 152
Figure 3.17: SEM micrographs showing the same untreated and treated salt macrostructures from carriers with 0.03% BSA. ....................................................... 79
Figure 3.18: SEM micrographs demonstrating the same untreated and treated salt microstructures from carriers with 0.03% BSA. ........................................................ 79
Figure 3.19: SEM micrographs from different samples exposing various salt structures after BSA addition. ................................................................................... 80
Figure 3.20: SEM micrographs depicting untreated and treated carriers with 0.03% BSA. ......................................................................................................................... 80
Figure 3.21: SEM micrographs showing untreated and treated C. difficile spores (pre-cleaned condition). ................................................................................................... 81
Figure 3.22: SEM micrographs demonstrating the same untreated and treated G. stearothermophilus spores.. ..................................................................................... 81
Figure 3.23: SEM micrographs depicting untreated and treated E. faecium bacteria (106 cfu) without organic burden. .............................................................................. 82
Figure 3.24: SEM micrographs showing untreated and treated E. faecium bacteria (106 cfu) within heparinized sheep blood. ................................................................. 82
Figure 3.25: Results of the modified 4-field-test evaluating plasma surface disinfection. ............................................................................................................... 85
Figure 3.26: Microscopic structure of Tyvek (VHX-600 Digital Microscope, VH-Z500R, Keyence, Germany). ................................................................................................. 86
Figure 3.27: Quantification results of untreated and plasma-treated endospores recovered from dry carriers. ...................................................................................... 87
Figure 3.28: Results unraveling the role of Tyvek cover in microbial inactivation. .... 89
Figure 3.29: Experiments indicating influence of electric field on microbial inactivation. Emphasized are disinfection level (dotted line), detection limit (*). ....... 90
Figure 4.1: Overview of common routes of transmission of healthcare-associated pathogens (adapted from Donskey [208])............................................................... 119
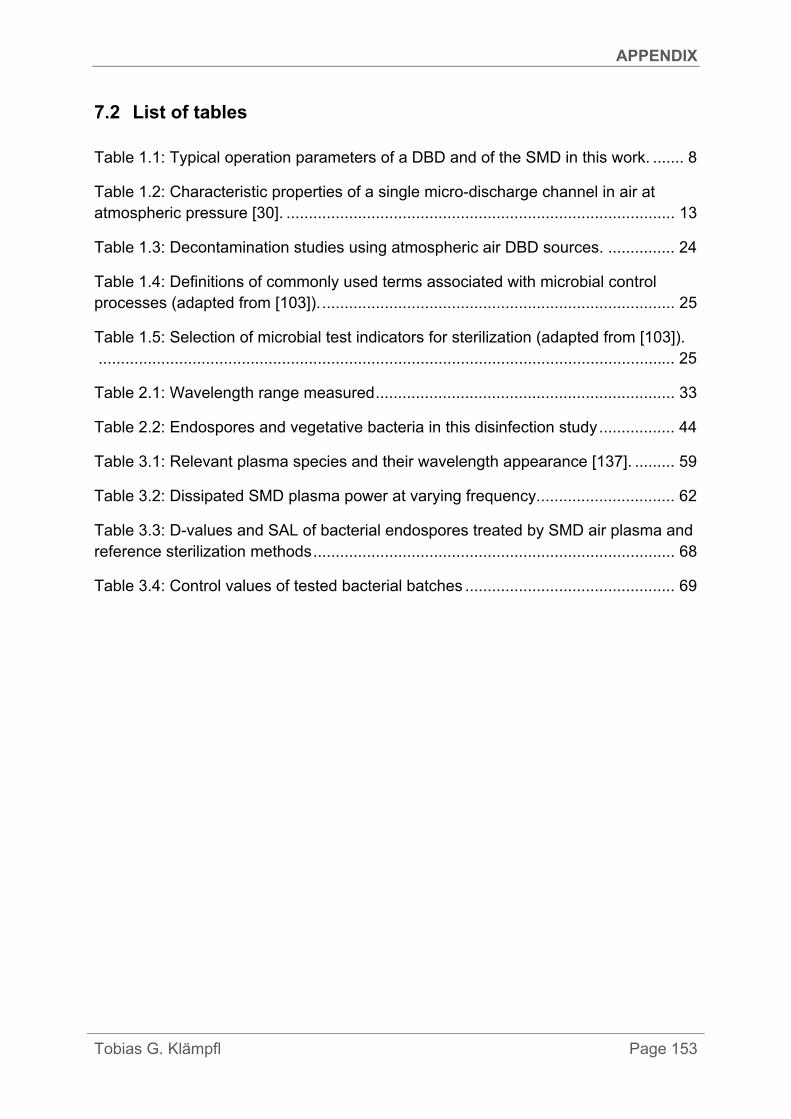
APPENDIX
Tobias G. Klämpfl Page 153
7.2 List of tables
Table 1.1: Typical operation parameters of a DBD and of the SMD in this work. ....... 8
Table 1.2: Characteristic properties of a single micro-discharge channel in air at atmospheric pressure [30]. ....................................................................................... 13
Table 1.3: Decontamination studies using atmospheric air DBD sources. ............... 24
Table 1.4: Definitions of commonly used terms associated with microbial control processes (adapted from [103]). ............................................................................... 25
Table 1.5: Selection of microbial test indicators for sterilization (adapted from [103]). ................................................................................................................................. 25
Table 2.1: Wavelength range measured ................................................................... 33
Table 2.2: Endospores and vegetative bacteria in this disinfection study ................. 44
Table 3.1: Relevant plasma species and their wavelength appearance [137]. ......... 59
Table 3.2: Dissipated SMD plasma power at varying frequency. .............................. 62
Table 3.3: D-values and SAL of bacterial endospores treated by SMD air plasma and reference sterilization methods ................................................................................. 68
Table 3.4: Control values of tested bacterial batches ............................................... 69
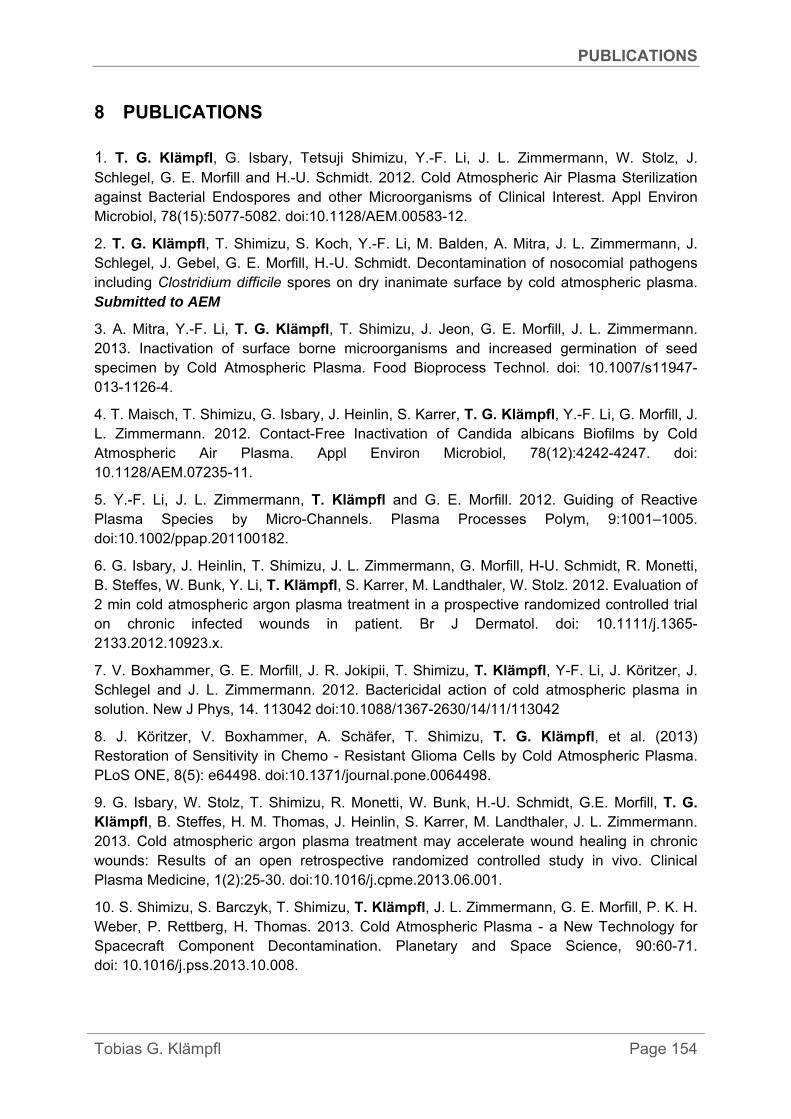
PUBLICATIONS
Tobias G. Klämpfl Page 154
8 PUBLICATIONS
1. T. G. Klämpfl, G. Isbary, Tetsuji Shimizu, Y.-F. Li, J. L. Zimmermann, W. Stolz, J. Schlegel, G. E. Morfill and H.-U. Schmidt. 2012. Cold Atmospheric Air Plasma Sterilization against Bacterial Endospores and other Microorganisms of Clinical Interest. Appl Environ Microbiol, 78(15):5077-5082. doi:10.1128/AEM.00583-12.
2. T. G. Klämpfl, T. Shimizu, S. Koch, Y.-F. Li, M. Balden, A. Mitra, J. L. Zimmermann, J. Schlegel, J. Gebel, G. E. Morfill, H.-U. Schmidt. Decontamination of nosocomial pathogens including Clostridium difficile spores on dry inanimate surface by cold atmospheric plasma. Submitted to AEM
3. A. Mitra, Y.-F. Li, T. G. Klämpfl, T. Shimizu, J. Jeon, G. E. Morfill, J. L. Zimmermann. 2013. Inactivation of surface borne microorganisms and increased germination of seed specimen by Cold Atmospheric Plasma. Food Bioprocess Technol. doi: 10.1007/s11947-013-1126-4.
4. T. Maisch, T. Shimizu, G. Isbary, J. Heinlin, S. Karrer, T. G. Klämpfl, Y.-F. Li, G. Morfill, J. L. Zimmermann. 2012. Contact-Free Inactivation of Candida albicans Biofilms by Cold Atmospheric Air Plasma. Appl Environ Microbiol, 78(12):4242-4247. doi: 10.1128/AEM.07235-11.
5. Y.-F. Li, J. L. Zimmermann, T. Klämpfl and G. E. Morfill. 2012. Guiding of Reactive Plasma Species by Micro-Channels. Plasma Processes Polym, 9:1001–1005. doi:10.1002/ppap.201100182.
6. G. Isbary, J. Heinlin, T. Shimizu, J. L. Zimmermann, G. Morfill, H-U. Schmidt, R. Monetti, B. Steffes, W. Bunk, Y. Li, T. Klämpfl, S. Karrer, M. Landthaler, W. Stolz. 2012. Evaluation of 2 min cold atmospheric argon plasma treatment in a prospective randomized controlled trial on chronic infected wounds in patient. Br J Dermatol. doi: 10.1111/j.1365-2133.2012.10923.x.
7. V. Boxhammer, G. E. Morfill, J. R. Jokipii, T. Shimizu, T. Klämpfl, Y-F. Li, J. Köritzer, J. Schlegel and J. L. Zimmermann. 2012. Bactericidal action of cold atmospheric plasma in solution. New J Phys, 14. 113042 doi:10.1088/1367-2630/14/11/113042
8. J. Köritzer, V. Boxhammer, A. Schäfer, T. Shimizu, T. G. Klämpfl, et al. (2013) Restoration of Sensitivity in Chemo - Resistant Glioma Cells by Cold Atmospheric Plasma. PLoS ONE, 8(5): e64498. doi:10.1371/journal.pone.0064498.
9. G. Isbary, W. Stolz, T. Shimizu, R. Monetti, W. Bunk, H.-U. Schmidt, G.E. Morfill, T. G. Klämpfl, B. Steffes, H. M. Thomas, J. Heinlin, S. Karrer, M. Landthaler, J. L. Zimmermann. 2013. Cold atmospheric argon plasma treatment may accelerate wound healing in chronic wounds: Results of an open retrospective randomized controlled study in vivo. Clinical Plasma Medicine, 1(2):25-30. doi:10.1016/j.cpme.2013.06.001.
10. S. Shimizu, S. Barczyk, T. Shimizu, T. Klämpfl, J. L. Zimmermann, G. E. Morfill, P. K. H. Weber, P. Rettberg, H. Thomas. 2013. Cold Atmospheric Plasma - a New Technology for Spacecraft Component Decontamination. Planetary and Space Science, 90:60-71. doi: 10.1016/j.pss.2013.10.008.
Related Documents


