4 c/) 4 z COLD-AIR PERFORMANCE EVALUATION OF SCALE MODEL OXIDIZER PUMP-DRIVE TURBINE FOR THE M-1 HYDROGEN-OXYGEN ROCKET ENGINE I1 - OVERALL TWO-STAGE PERFORMANCE

Welcome message from author
This document is posted to help you gain knowledge. Please leave a comment to let me know what you think about it! Share it to your friends and learn new things together.
Transcript

4 c/) 4 z
COLD-AIR PERFORMANCE EVALUATION OF SCALE MODEL OXIDIZER PUMP-DRIVE TURBINE FOR THE M-1 HYDROGEN-OXYGEN ROCKET ENGINE
I1 - OVERALL TWO-STAGE PERFORMANCE
TECH LIBRARY KAFB, NM
NASA T N D-3368
COLD-AIR PERFORMANCE EVALUATION OF SCALE MODEL
OXIDIZER PUMP-DRIVE TURBINE FOR THE M-1
HYDROGEN-OXYGEN ROCKET ENGINE
I1 - OVERALL TWO-STAGE PERFORMANCE
By Richard J . Roelke, Roy G. Stabe, and David G. Evans
Lewis Research Center Cleveland, Ohio
NATIONAL AERONAUTICS AND SPACE ADMINISTRATION
For sale by the Clearinghouse for Federal Scientific and Technical Information Springfield, Virginia 22151 - Price $0.50
COLD-AIR PERFORMANCE EVALUATION OF SCALE MODEL OXIDIZER PUMP-DRIVE
TURBINE FOR THE M-1 HYDROGEN-OXYGEN ROCKET ENGINE
I1 - OVERALL TWO-STAGE PERFORMANCE
by R i c h a r d J. Roelke, Roy G. Stabe, and Dav id G. Evans
Lewis Research Center
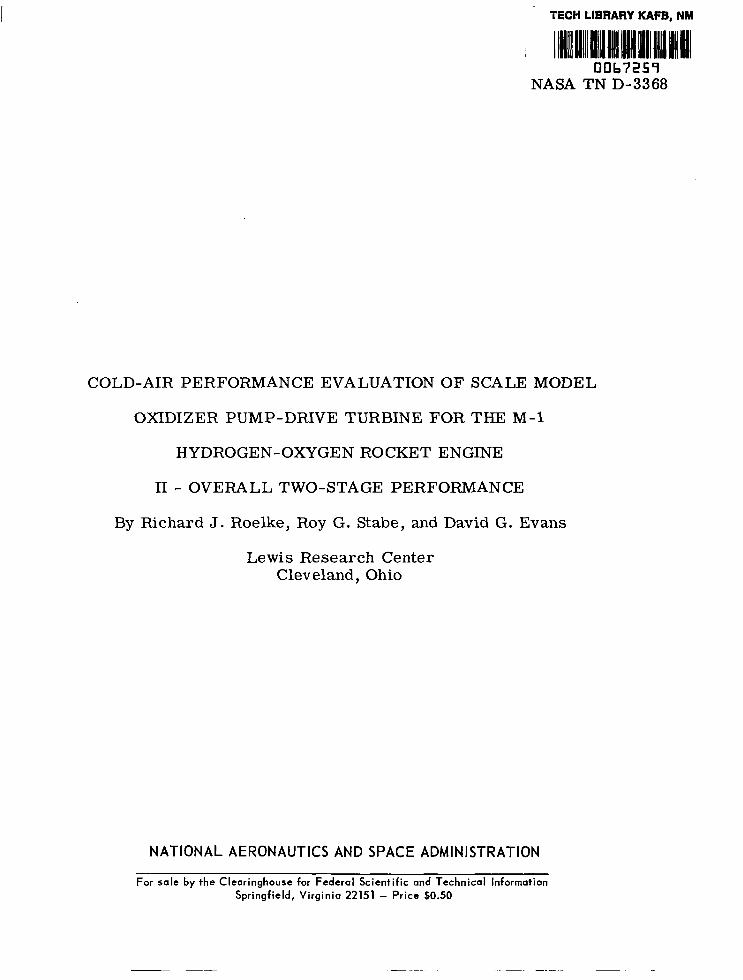
SUMMARY
The aerodynamic performance of a 0.45-scale model of the oxidizer pump-drive turbine and inlet manifold assembly for the M-1 rocket engine was experimentally evalu- ated with air at ambient inlet conditions. Speed was varied from 60 to 110 percent of equivalent design speed for equivalent pressure ratios ranging from 1.3 to 2.8.
At equivalent design speed and pressure ratio, the turbine static efficiency was 0. 524 and the equivalent specific work was 9.61 Btu per pound compared with the design values of 0. 536 and 9.832 Btu per pound, respectively. The turbine equivalent weight flow was 10. 8 percent less than design. Of this deficit, 3.7 percent was attributed to an undersize nozzle throat area of the test hardware, and the remaining part was charged to adverse flow conditions in the inlet manifold and nozzle channels. The result of these de- viations from design was a net loss of 12. 8 percent in turbine power at design speed and pressure ratio.
Radial surveys taken at the turbine exit at design equivalent speed and pressure ratio revealed circumferential and radial variations in total pressure similar in pattern but attenuated from those measured in prior inlet manifold surveys. Also observed was overturning of the flow and large circumferential variations in absolute flow angle, both of which occurred at all but the tip region of the blade passage. In the tip region, flow velocities lower than design existed, which lead to significant underturning of the flow.
Static-pressure measurements taken on each side of the rotor disks below the hub indicated shaft thrusts considerably higher than anticipated.
INTRO DU CTlON
The aerodynamic performance evaluation of the pump-drive turbines for the M-1

engine has been included as part of the turbine research and project support program. The M-1, a 1.5-million-pound-thrust hydrogen-oxygen rocket engine, utilizes separate fuel and oxidizer turbines in series with a single gas generator supplying the driving gas. The approach used in the design of the turbines was that of simplicity, light weight, and reasonable efficiency. These considerations led to the use of two-stage velocity- compounded cantilevered turbines for both pump drives.
The aerodynamic design of the oxidizer pump-drive turbine (oxidizer turbine, Model m) is reported in reference 1. The design of the turbine and the turbine blading was unusual in several aspects. The requirements imposed on the turbine by the turbo- pump system were those of low rotative speed and high propellant energy. These re- quirements resulted in a very low blade-jet speed ratio for a two-stage turbine of only 0. 128. Further, in order to simplify construction, identical blade profiles with blunt leading edges were incorporated for both rotors and the second-stage stator; however, the blade rows had different stagger angles.
The aerodynamic performance of a 0.45-scale feedpipe-manifold portion of the tur- bine with the nozzle in place was evaluated with air at approximately ambient inlet condi- tions and is reported in reference 2. The investigation indicated that as a result of mini- mizing flow areas in the feedpipes and manifold with attendant increases in flow Mach number, severe maldistribution of the flow existed which nearly doubled the predicted loss in feedpipe dynamic pressure and substantially reduced the flow capacity of the noz- zle from that used in the design.
The results of the cold-air experimental evaluation of the complete turbine are pre- sented herein. The performance of the 0.45-scale turbine was obtained for a range of total- to static-pressure ratios from 1 . 3 to 2.8 and speeds from 60 to 110 percent of equivalent design speed. In addition, zero speed torque for the same range of pressure ratios was also measured. Also included is a brief description of the M-1 turbopump system and oxidizer turbine as well as the scale test turbine, test facility, and proce- dures used in the evaluation.
SYMBOLS
A
C
C P g
h
Ah
2
aspect ratio, h/c
blade chord ( m a . x value, table V), in.
specific heat at constant pressure, Btu/(lb)(OR)
gravitational constant, 32. 17 ft/sec
blade height, in.
specific work, Btu/lb
2
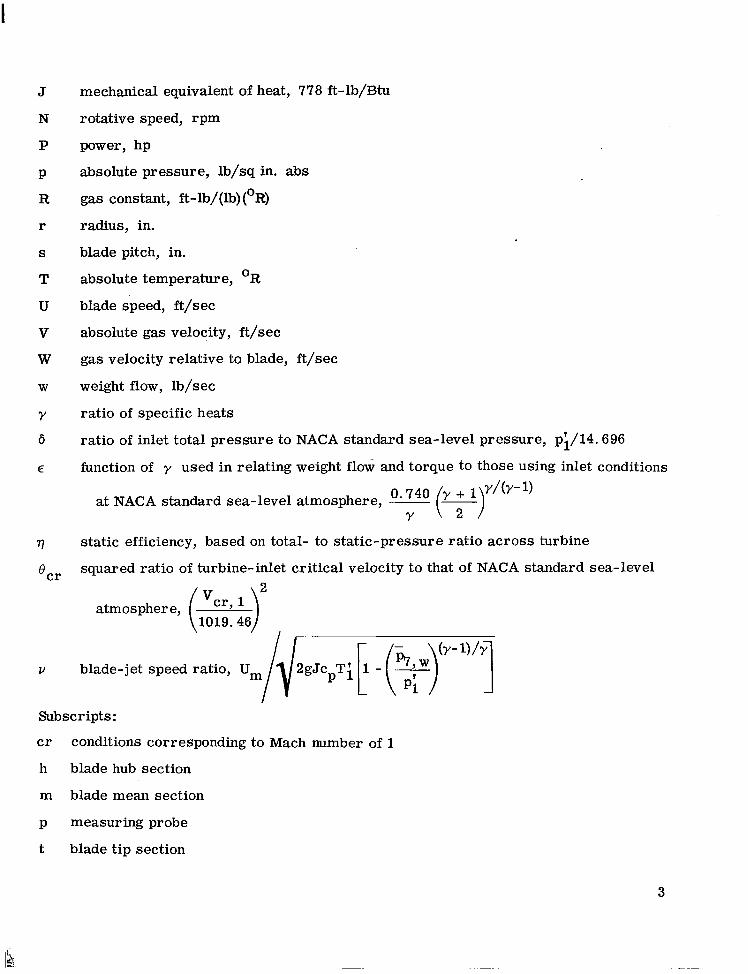
J
N
P
P
R
r
S
T
U
v W
W
Y
6
E
mechanical equivalent of heat, 778 ft-lb/Btu
rotative speed, rpm
power, hP
absolute pressure, lb/sq in. abs
gas constant, ft-lb/(lb) (OR)
radius, in.
blade pitch, in.
absolute temperature, OR
blade speed, ft/sec
absolute gas velocity, ft/sec
gas velocity relative to blade, ft/sec
weight flow, lb/sec
ratio of specific heats
ratio of inlet total pressure to NACA standard sea-level pressure, p;/14.696
function of y used in relating weight flow and torque to those using inlet conditions
0 740 (y ; lr/(y-l) at NACA standard sea-level atmosphere, 2 - Y
7 static efficiency, based on total- to static-pressure ratio across turbine
e,, squared ratio of turbine-inlet critical velocity to that of NACA standard sea-level
atmosphere, ( 1 2 :J v blade-jet speed ratio, Um
Subscripts:
c r conditions corresponding to Mach number of 1
h blade hub section
m blade mean section
p measuring probe
t blade tip section
3

W exhaust pipe wall
1,2,3,4, 5,6,7 measuring stations (see fig. 7)
a measured at center of feedpipe, station 1
Superscripts:
- average
? absolute total state
TURBOPUMP SYSTEM
A mockup of the M-1 engine turbopump feed system and a portion of the expansion nozzle is presented in figure 1. Figure l(a) shows the separate fuel and oxidizer turbo- pumps mounted on either side of the engine combustion chamber. A single gas generator supplies the turbines with the fuel-rich combustion products of liquid hydrogen and liquid oxygen. These combustion gases are discharged into the fuel turbine manifold, a r e ex- panded in the turbine, and are conveyed to the oxidizer turbine by two crossover ducts. The ends of the crossover ducts entering the oxidizer turbine manifold are referred to herein as the "feedpipes. ?' After passing through the oxidizer turbine manifold, the gases are expanded through the turbine into a hemispherically shaped exhaust housing (fig. l(b)), are passed through the nozzle skirt coolant passages, and are then expanded overboard through choked nozzles to supplement engine thrust. Figure 2 shows the inter- nal arrangement of the turbine components within the turbopump assembly, from which the compact, cantilevered design can be noted.
TURBINE DESCRIPTION
The following oxidizer turbine description is divided into three parts. The overall design requirements and velocity diagrams are presented first, followed by a general description of the turbine hardware and blading design characteristics. The remaining part includes a discussion of some of the similarity considerations made between the scale and the full-size machines and concludes with a brief description of the test unit.
Overa l l Requi rements
The turbine is a two-stage velocity-compounded machine with a nominally constant
4

TABLE I. - TURBINE DESIGN REQUlREMENTS TABLE II. - GAS PROPERTIES
Parameter F
Turbine power, hp Weight flow, lb/sec Rotative speed, rpm Specific work, Btu/lb Inlet total temperature,
Inlet total pressure, pi,
Pressure ratio, pi/* , W
Static efficiency, 11 Blade-jet speed ratio, u
T i , OR
lb/sq in. abs
:ombustion air equivalent lroducts of
NACA standard inlet
hydrogen Full size md oxygen
conc
a29 120 485.6 115 34.92
3635 852 a179. 0 9.,832
1190 518.7
208 .1 14.696
bl. 738
bo. 128 bo. 128
bl. 745 536 536
OllS
I. 45 Scale
98.33 7 .071
1893 9.832 518.7
14.696
bl. 745 536
bo. 128
Gas products of Combustion
and oxygen hydrogen
1. 98 ~
Specific heat, c P'
~ tu / (w (OR) Gas constant, R, 425.8
ft-lb/(lb) (OR) Ratio of specific heats, y 1.382
aComputed from velocity diagrams. bCorrected to rating stations other than those used in refs.
1 and 2; see DATA REDUCTION.
TABLE Dl. - DESIGN STATIC PRESSURE DISTRIBUTION
r-1 Blade row
t Nozzle First-stage rotor Second-stage stator Second-stage rotor
Pressure, lb/sq in. abs
Inlet 1 - Tip - 136 132.2 132.2 124 .4 -
NACA standarc
air
0 .241
53.35
1 .40
mean diameter of 33 inches. The turbine aerodynamic design specifications are listed in table I, and the gas properties of the hydrogen-oxygen combustion products corrected from those used in the design, along with NACA standard-air conditions, a r e listed in table II.
The design free-stream mean-diameter velocity diagrams needed to satisfy the pre- ceding requirements and a specified work split of 63 and 37 percent between the first and second stages, respectively, are shown in figure 3. All velocities in the turbine were subsonic. Also to be noted from the figure is the relatively high amount of exit whirl, 56. 5'. The design static pressure distribution through the turbine is given in table III.
Tu rbi ne Geometry
A cross-sectional view of the oxidizer turbine, Model III, is presented in figure 4(a).
5

TABLE IV. - BLADE DESIGN CHARACTERISTICS
Blade row
blades A r,.,/rt turning, of ( c / s ) ~ ratio, ratio, channel
Number Solidity, Aspect Radius Flow
den
Nozzle
94 1.57 3.21 .711 125.6 Second-stage rotor 97 1.62 2.78 .746 130.1 Second-stage stator 98 1.63 2.26 .789 134.7 First-stage rotor 43 1.57 0.85 0.823 70
The flight hardware was designed with a spherically shaped outer casing structure that includes the inlet manifold and exhaust section. The centerlines of the two feedpipes entering the manifold form an angle of 80'. In each of these feedpipes, there is a flow deflector plate to prevent the flow from impinging directly onto the nozzle tip wall that is in line with the feedpipe. -
All blades of the turbine were constant-section nontwisted designs with a curved .suc- tion surface downstream of the throat. Identical blade profiles with blunt leading edges were utilized for the rotors and the second-stage stator. The turbine flow areas of suc- cessive blade rows were increased by increasing the blade heights and changing the blade stagger angles. The general characteristics of the four blade rows a re given in table IV.
Scale Test U n i t
The oxidizer turbine test unit was built to 0 .45 of full scale to adapt it to an existing cold-air test facility. This change in scale and working fluid of the model turbine re- sulted in a turbine Reynolds number of only one-tenth of the design Reynolds number for the actual oxidizer turbine. The design Reynolds number of the full-size hot turbine was 7x10 , whereas the range of values for the model turbine operating with ambient air was between 6.2X10 and 8.3X10 for the range of pressure ratios covered. Even with this large change in Reynolds number, however, the Reynolds number of the model turbine was considerably above the value indicated in reference 3 at which any significant effect on performance would be expected.
6 5 5
A cross section of the test unit is shown in figure 4(b). Some deviations from exact similarity between the scale and the full-size turbines were permitted to simplify manu- facture. The hemispherically shaped exhaust section with the two exhaust ducts of the full-size turbine was not included in the evaluation but was replaced with a conically shaped single exhaust pipe. Also, the cross-sectional shapes of the inlet manifold of the two turbines differed slightly; however, the scaled manifold flow area was maintained in the test unit. A comparison of figures 4(a) and (b) illustrates these differences.
6

TABLE V. - TEST TURBINE BLADE COORDINATES
\
/
Turbine t 1 40.5' \ \\ \ /X
Nozzle 2 4 . 5 ' u
Nozzle coordinates
x, in. y,, in. yp, in.
blend
Second-stage stator
\- ' First-stage rotor \ Second-stage rotor
Stator and rotor coordinates
x, in. y,, in. I,, in.
0.000 0.177 0.177 .lo0 ,390 ,020
0.000 ,010 ,025 ,050 ,100 ,150 ,200 ,300 .400 .500 .600 ,700 . I78
0.135 ,210 ,250 ,285 .333 .363 ,380 ,383 ,347 ,278 ,190 . mo ,007 -
0.135 ,060 ,030 ,005 .022 ,055 .OB3 ,128 .150 ,143 ,107 ,055 .om -

The coordinates of the scale blade profiles are given in table V. A discrepancy of the scale blading from the specification resulted during the manufacture of the test unit. In general, the channel throat heights and widths were made less than the design dimensions; the following undersize throat areas resulted:
Blade row Amount that throat area was undersize from design
percent
Nozzle
5 . 2 Second-stage rotor 4 . 2 Second-stage stator 9 .0 First-stage rotor 3 .7
It was recognized that these deficiencies in the flow areas prevented exact simulation of the full-size turbine geometry and had probable effects on the turbine flow conditions. They were judged to be of insufficient magnitude, however, to affect the general level of overall performance appreciably.
Figure 5 shows partial assemblies of the scale hardware prior to testing. In figure 5(a) is the downstream end of the nozzle installed in the feedpipe-manifold assembly. The figure also shows the angle (807 formed by the two feedpipes. Figure 5(b) presents the second-stage rotor prior to installation of the tip shroud. The blade profile, which is representative for both rotors as well as for the second-stage stator, can be noted. Figure 5(c) illustrates the split casing designed for the scale test unit, with the second- stage stator installed. An assembly of the manifold, lower casing half, and shrouded rotors is shown in figure 5(d). The inlet header which supplies the air to the two feed- pipes and the scale turbine casing mounted on a support stand are presented in figure 5(e). The similarity in flow areas between the full-size and the scale turbine begins at the point at which the feedpipe diameter is reduced just prior to the entrance to the manifold and terminates at the trailing edge of the second-stage rotor.
APPARATUS AND INSTRUMENTATION
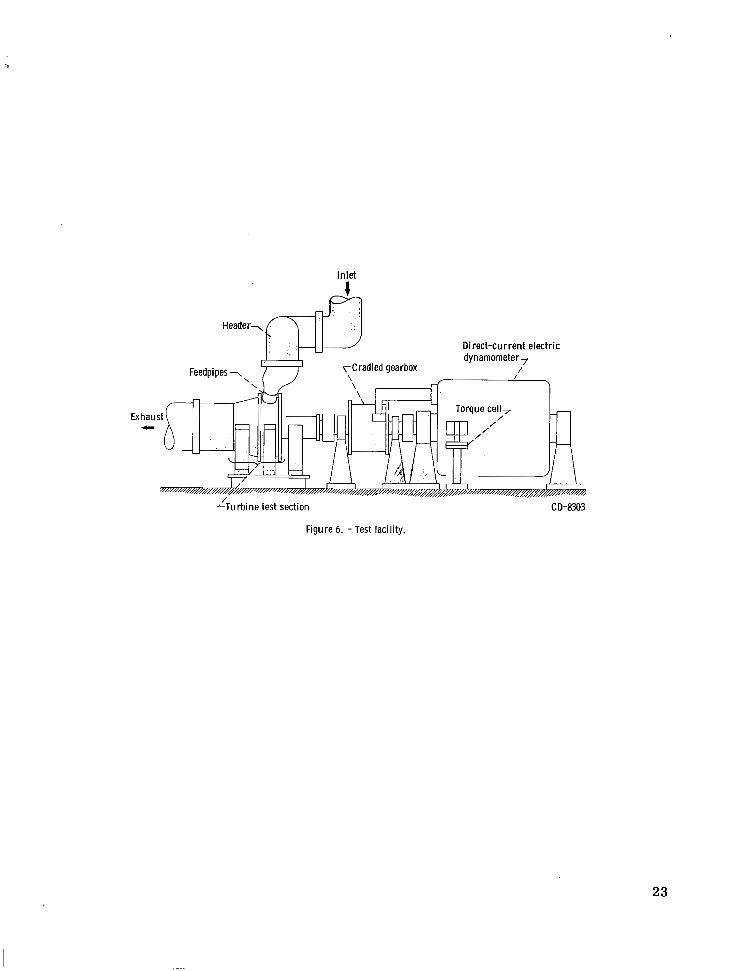
Test Facility
The test facility used in the experimental investigation was the same as that of refer- ence 2 . Figure 6 shows the arrangement of the equipment in the test cell. In operation, dry air from the laboratory high-pressure-air system flows through the inlet ducting, a calibrated orifice, and an automatic pressure control valve and into the test unit through an 8-inch-diameter header connecting the two feedpipes. After expanding through the
8

turbine, the air is discharged through the exhaust-pipe control valve to the laboratory altitude- exhaust system.
Turbine output power was transmitted through a cradled gear box and absorbed by a cradled direct-current electric dynamometer, which also served as a speed control. The total reaction torque of the'gear box and the dynamometer was measured with a single self-balancing pneumatic torque cell.
Instrumentation
The axial and circumferential locations of the instrumentation within the test turbine are shown in figure 7. Overall turbine performance was calculated from measurements taken at stations 1 and 7. The flow conditions in each feedpipe (station 1) were measured with four static pressure taps, one shielded total-pressure probe and two thermocouples. The instrumentation installed at station 7 consisted of four static-pressure taps on the casing wall, a Prandtl tube at the centerline and five thermocouples located at different radii corresponding to the area centers of five equal annular areas.
Additional fixed instrumentation consisted of eight static-pressure taps located around the periphery of the manifold (station 2) and hub and tip static-pressure taps at the trailing edge of three nozzle channels (station 3) and at the leading and trailing edges of two stator channels (stations 4 and 5). The channel static-pressure taps were posi- tioned 1/16 inch upstream of the blade trailing edge (stations 3 and 5) and 1/16 inch down- stream of the blade leading edge (station 4). These static taps were located in an esti- mated stream tube traced through the turbine. Five wall static-pressure taps and one fixed shielded total-pressure probe were located at station 6, one blade chord down- stream of the rotor. Static pressures were also measured below the hub upstream of each rotor at a radius of 5 inches (total of four pressure taps) and behind the second rotor at nominal radii of 0, 2, and 4 inches by three shielded static-pressure probes.
In addition to the fixed instrumentation, radial surveys of total pressure, total tem- perature, and absolute flow angle were made at station 6 with four combination probes mounted in self-alining actuators. In figure 8 are shown the instrumentation probes at stations 6 and 7 with a section of the exhaust pipe removed. The test hardware assem- bled in the test facility with all instrumentation in place is shown in figure 9.
Turbine shaft torque was determined from measurement of the dynamometer torque cell balance pressure (fig. 6), which was calibrated before and after each run. Turbine rotative speed was measured with a magnetic sensing element and a shaft-mounted 60- tooth gear and read on an electronic counter. A calibrated ASME thin-plate orifice was used for weight-flow measurement. The orifice inlet pressure was read on a precision Bourdon tube gage. All other pressures were recorded simultaneously by photographing
9

a bank of mercury manometers. Temperatures were read on a direct-reading potentiom- eter. Radial position and angle of the actuated probes at station 6 were read on a calibrated-probe-position instrument supplied as part of the actuator control equipment.
EXPERIMENTAL PROCEDURE
The turbine was operated at an inlet total pressure of approximately 30 inches of mercury absolute and an inlet temperature of 550' R at equivalent nominal inlet total- to exit static-pressure ratios of 1.3, 1. 55, 1.75, 1.9, 2.2, and 2 . 8 . At each pressure ratio up to 2.2, data were taken at 60, 80, 90, 100, and 110 percent of equivalent design speed. At the highest pressure ratio, data were taken only at 100 and 110 percent of equivalent design speed. Zero-speed torque data were taken oyer a pressure ratio range of 1.3 to 2.3.
At design equivalent speed and pressure ratio, survey data were taken at station 6 with the four actuated combination probes at each of nine radial positions between the hub and the tip. The actuated probes were positioned at the mean radius for all other turbine operating conditions. The turbine tare torque was measured by motoring the test unit, with the rotors removed, over the range of speeds investigated and was less than 1 per- cent of the turbine output.
DATA REDUCTION
The turbine specific work was calculated from weight-flow, speed, and torque mea- surements. The torque value used was the sum of the torque indicated by the pneumatic torque cell and the test unit tare torque.
The overall turbine performance was based on the ratio of calculated inlet total pres- sure at station 1 to the average value of measured wall static pressure at station 7
~ $ 7 , w - The inlet total pressure was calculated from the average of the eight static pressure readings in the feedpipes, the total feedpipe flow area, the average inlet total temperature, and the weight flow in the same manner as in reference 2. Calculated val- ues of total pressure averaged 0. 5 percent below the measured values at the center of the feedpipes (station 1).
The measuring stations used to rate the turbine did not coincide with the stations used in the design of the turbine; therefore, a new set of design point parameters was calculated. The design pressure ratio given in reference 1 was based on the conditions at the planes of the leading edge of the nozzle and the trailing edge of the second rotor, whereas the experimental investigation included the flow processes in the feedpipes and
10

the manifold and in a segment of the exhaust pipe. Station 1 was selected as the inlet rating station for the investigation reported herein because of the large variation of flow conditions within the manifold (ref. 2). Station 7 was used as the downstream rating sta- tion because it was the closest constant-section plenum to the turbine exit. The design total- to static-pressure ratio for the combustion products of hydrogen and oxygen corre- sponding to these new rating stations was calculated by use of the following equation:
- p; = (2)(&)(*)($) = (z) (1.667) (z) (1.039) = 1.738 p7, w P6,m p6, t p7,w 124.4
This value of 1.738 was then corrected to an equivalent pressure ratio value for standard air of 1.745 by the method of reference 2. The ratio - p6, /: 7, was measured during the testing; the remaining ratios in this equation a re design values given in reference 1. With this new value of design pressure ratio, the design static efficiency and blade-jet speed ratio inclusive of the inlet manifold were calculated to be 0. 536 and 0.128, re- spectively (table I, p. 5).
RESULTS AND DISCUSSION
This section contains three parts. The initial part presents the overall turbine per- formance calculated from weight flow, torque, speed, and pressure measurements. Fol- lowing this part is a description of the flow conditions in the feedpipes, inlet manifold, and turbine as determined from static-pressure measurements. The last part presents the results of the radial surveys made at the turbine exit of total pressure, absolute flow angle, and temperature.
Overa l l Per formance
The overall turbine performance as rated between measuring stations 1 and 7 is pre- sented in figures 10 to 14. The performance data were obtained by use of air at ambient inlet conditions and were reduced to equivalent parameters.
Specific work. - The variation of turbine equivalent specific work with total- to static-pressure ratio is shown in figure 10 for speeds from 60 to 110 percent of design speed. The design point in this figure, as in all subsequent performance figures, is indi- cated by a solid circle. The specific work increased with pressure ratio and speed over the ranges investigated.
At the equivalent design speed and pressure ratio (1.745), the turbine equivalent
11

specific work was 9.61 Btu per pound, which was 2.3 percent less than the design value of 9.832 Btu per pound. At equivalent design speed, the design value of specific work was obtained at a pressure ratio of 1.787.
Pressure ratios across the turbine great enough to achieve limiting loading were not obtainable. Limiting loading was being approached, however, as evidenced by the de- creasing slope of the curves, particularly for 100 and 110 percent of equivalent design speed, with increasing pressure ratio.
Overall static efficiency. - The variation of static efficiency with percent equivalent design speed and equivalent total- to static-pressure ratio is presented in figure 11. The static efficiency at any given speed decreased with increasing turbine pressure ratio. At the equivalent design speed and pressure ratio, the static efficiency was 0. 524, which was 2.2 percent lower than the design value of 0. 536.
The static efficiency variation with blade-jet speed ratio and rotative speed is shown in figure 12. The static efficiency increased with increasing blade-jet speed ratio with the peak efficiency indicated at a value of blade-jet speed ratio higher than the range in- vestigated. An examination of this figure reveals the presence of a family of curves with percent equivalent design speed as the parameter. At any given rotor speed and at the higher pressure ratios tested (lower blade-jet speed ratios), the efficiency curve becomes tangent to an envelope curve. At the lower pressure ratios tested, the efficiency falls below the envelope curve for each speed.
Weight flow. - The variation in equivalent weight flow with equivalent pressure ratio for the equivalent speeds investigated is shown in figure 13. In general, the equivalent weight flow increased with pressure ratio for all speeds investigated. Also, at all but the maximum pressure ratio investigated, the weight flow decreased with increasing speed. At equivalent design speed and pressure ratio, the measured equivalent weight flow was 6.31 pounds per second, which is 10. 8 percent below the design weight flow of 7.071 pounds per second. A weight-flow deficiency of 10.2 percent was measured during the manifold tests (ref. 2), where it was concluded that the undersize nozzle-throat area (3.7 percent) and unfavorable manifold flow conditions were responsible.
A nearly choked equivalent weight flow of 6. 57 pounds per second was approached at an equivalent total- to static-pressure ratio of about 2.8. This value of weight flow com- pares well with the maximum value (6. 55 lb/sec) measured in the prior manifold tests. The convergence of the speed lines at this pressure ratio indicates that the nozzle is ap- proaching a choked flow condition prior to any other blade row.
Torque. - The variation in equivalent torque with percent equivalent speed is shown in figure 14 for the range of equivalent pressure ratios investigated. The torque continu- ally decreased with speed for all pressure ratios covered. At any given speed, the torque increased with increasing pressure ratio. The measured equivalent torque at de- sign equivalent speed and pressure ratio was 238 foot-pounds, which was 12.8 percent
12
lower than the design value of 273 foot-pounds. This deficiency in torque, and there- fore power, at equivalent design speed and pressure ratio is the net result of the devia- tions of weight flow and specific work from their design values. At design pressure ra- tio, the ratio of starting torque to torque at design speed is approximately 1.3.
Static-Pressure Distribution
Static pressures measured in the feedpipes, inlet manifold, and stator channels are plotted in figures 15 to 17. These measurements were used to investigate the flow condi- tions in the turbine and are discussed in the succeeding paragraphs. In addition, rotor- hub static pressures are presented to assist in evaluating the shaft axial thrust character- istics.
" Inlet conditions. - The variation in feedpipe static- to total-pressure ratio with turbine-inlet total- to turbine-exit static-pressure ratio at equivalent design speed is shown in figure 15(a). The static pressure p1 is the average of the four wall taps in each feedpipe, and the total pressure p' is the measured value at the center of each feedpipe.
1, +
The flow characteristics of the two feedpipes a re quite different. The flow conditions in the left feedpipe do not change above turbine pressure ratios of approximately 1.8, whereas the flow conditions in the right feedpipe continue to change up to the highest pressure ratio investigated. This difference implies that above design pressure ratio the weight flow through the left feedpipe is constant and that any increase in flow must come from the right feedpipe. At the turbine design pressure ratio, the computed Mach numbers for the right and left feedpipes were 0 .25 and 0.32, respectively, which indi- cated that approximately 44. 5 percent of the total weight flow passed through the right feedpipe and 55. 5 percent through the left feedpipe. These differences in feedpipe flow conditions are attributed to the different flow and loss mechanisms on either side of the manifold. For example, nozzle incidence on the right side of the manifold is positive, whereas the incidence on the left side is negative. A larger effective blockage may thus be created on the right half of the manifold. The manifold tests (ref. 2) had indicated larger losses on the right half than on the left half of the manifold.
Figure 15(b) is a cross plot of data showing the manifold static pressure circumfer- ential variation for several values of turbine pressure ratio at equivalent design speed. The static-pressure variation shown is very similar to that measured in prior manifold tests (ref. 2), where sizable variations in flow velocities were concluded to exist around the manifold periphery. The highest velocities prevailed in the vicinity of the feedpipes, as expected from geometric considerations, and lower velocities existed between feed- pipes at the manifold top and bottom. As turbine pressure ratio was increased, the
13

static- to inlet total-pressure ratio decreased, as expected, inasmuch as the equivalent weight flow continuously increased (fig. 13). The relatively small change in static pres- sure as the turbine pressure ratio was increased from 2.1 to 2.8 indicates the near ap- proach to choking conditions, as mentioned previously. No change occurred in the region of the left feedpipe, where the flow was constant (fig. 15(a)), whereas in the region of the right feedpipe, small changes occurred as affected by the slight increase in flow through this feedpipe.
Flow path static pressures. - The axial static-pressure distribution at the hub and the tip of the blades measured at equivalent design speed and pressure ratio is shown in figure lS(a). The average of the static pressures measured at each station (maximum circumferential variation, k2.7 percent) is divided by the calculated inlet total pressure. The resulting values are connected with straight lines to define the hub and the tip read- ings. The design static-pressure distribution is shown by a dashed line. In general, the level of static pressures within the turbine shows reasonable agreement with the design values; the tip values are in better agreement than the hub values. A meaningful com- parison between the measured and the design static pressures, however, cannot be made because of the undersized and mismatched throat areas of the test hardware. The first- stage rotor, for example, was designed to have a constant static pressure at the mean section. Measurements indicated a small static-pressure decrease through this blade row, but this decrease may have been caused by the undersize throat areas.
One obvious feature noted in the data of figure 16(a) is the almost complete lack of a radial pressure gradient from hub to tip. This condition is quite different from both the design pressure distribution and the static pressures recorded at station 3 during the manifold tests (ref. 2), when the rotors and stator were removed. The latter pressure measurements taken at the design nozzle-mean-exit static- to inlet total-pressure ratio
~ 3 , m/ 1 p' a r e shown by triangular symbols. Also, the nozzle design pressure ratio
P3, m 1 /p' of 0.607 was not obtained at the overall design pressure ratio pi/&, of 1.745 of the turbine. This difference in nozzle pressure ratio between the manifold and the two-stage tests accounts for the small change in measured weight flow previously mentioned.
-
Shown in figures 16(b) and (c) are the results of cross plots of the circumferentially averaged axial static-pressure distribution at the tip and the hub, respectively, of the sta- tors at design speed for a range of turbine pressure ratios. This figure is useful in deter- mining the choking characteristics of the turbine hardware tested. As stated previously, the turbine weight flow measurements (fig. 13) indicated that the nozzle was operating very nearly choked at the maximum pressure ratio. This flow condition is also indicated in figures 16(b) and (c) by the almost constant value of static pressure at the nozzle exit (station 3) at the higher overall pressure ratios. A s the nozzle approaches choked condi- tions, the velocity diagrams (fig. 2) imply that the first-stage rotor also approaches choked
14

flow at the blade leading edge. The axial static-pressure data also indicate that the second- stage stator and rotor were not choked over the range of pressure ratios investigated.
Disk-face static pressures. - The static pressures measured on each side of the rotor disks are plotted in figure 17. Figure 17(a) shows the comparison between design and measured radial static-pressure gradient in the flow path and below the rotor hub at equivalent design speed and pressure ratio. The design static pressure distribution is shown by dashed lines. At measuring stations 3, 4, and 5 there is little radial variation in static pressure from the blade tip to pints below the hub, as mentioned previously. The pressures at and below the hub at station 3, however, are higher than the hub design
-
- static pressure, whereas the static pressures measured at station 6 below the hub are considerably below design. The net result of these static-pressure changes from design is a significantly larger shaft thrust than expected directed toward the turbine exit.
Figure 17(b) shows the measured variation of the static pressure acting on the faces of both rotor disks at five equivalent pressure ratios for each of five speeds. The cross- plotted pressure ratios p/pi at different measuring stations a re connected by straight lines to identify the readings taken at a given turbine pressure ratio pi/&, w. The local static- to inlet total-pressure ratios indicated for measuring station 6 (downstream of the second-stage rotor) a r e the average of the three radial stations shown in figure 17(a). The data presented in figure 17(b) can be used to evaluate the variation in shaft thrust at off-design operation. The static pressures measured at stations 3 and 6 indicate that the shaft thrust increases directly with overall pressure ratios and is always directed toward the turbine exit for all rotor speeds investigated. At any given pressure ratio, there are only minor changes in axial thrust with a change in rotative speed.
Tu rbine-Exit Su rveys
The results of the radial survey (station 6) of total pressure, absolute flow angle, and temperature taken at equivalent design speed and pressure ratio are shown in fig- ure 18. The design flow conditions taken from reference 1 are shown for comparison and are indicated by dashed lines.
Total-pressure survey. - Figure 18(a) presents the total-pressure measurements taken at the turbine exit, which show that the total pressure varied circumferentially as well as radially. The radial variation was virtually the inverse of the design variation. Losses lower than design (higher total pressures) occurred between the hub and the mean section, while losses larger than design occurred at the tip section.
The circumferential variation in total pressure is attributed to the flow conditions in the manifold. The highest nozzle-inlet total pressures were recorded (ref. 2) in line with the feedpipes, while the lowest pressures were recorded adjacent to the feedpipes,
15

with smaller pressure variations recorded around the remainder of the circumference. Position B (fig. 18(a)) was in line with the left feedpipe. Positions A and D were in the low-pressure areas on either side of the feedpipes, whereas position C was removed from either the high- or the low-pressure areas. The maximum circumferential total-pressure variation at the mean diameter of the turbine exit was only 2 . 1 percent, about one-fifth that measured at the nozzle inlet. The large variation in nozzle-inlet total pressure was apparently attenuated in passing through the turbine.
Angle survey. - The variation in absolute flow angle with location is shown in figure 18(b). The flow at the turbine exit is overturned for all but the tip region of the blade pas- sage and exhibits considerable variation circumferentially. The amount of overturning was as large as 10'; this amount occurred midway between the blade hub and mean sec- tions on the right side of the manifold (position D). At the blade tip, the flow is markedly underturned at all circumferential locations. Calculations made by use of .the total- and static-pressure values at the tip of the turbine exit indicated that the absolute Mach num- ber was lower than design. The Mach number varied from about 0.150 to 0.215, as com- pared with the design value of 0.274. These low velocities account for the underturning of the flow at the blade tip.
Temperature survey. - The results of the total-temperature survey at the turbine exit a re shown in figure 18(c). The survey indicated gas temperatures slightly lower than design; higher specific work was thus indicated than that calculated from the torque, weight-flow, and speed measurements. The difference between the two methods of calcu- lating the specific work, however, is of the order of only 2 percent and is probably caused by the inaccuracy inherent in the use of gas temperatures. The enthalpy drop across the turbine (indicated by 1 - (Ti/Ti)) varied by as much as 13 percent from hub to tip, with the flow in the vicinity of the hub and tip doing less work per pound than the remaining flow stream.
SUMMARY OF RESULTS
The aerodynamic performance of a 0.45-scale oxidizer pump-drive turbine including its inlet-manifold assembly for the M-1 rocket engine was determined with air at ambient inlet conditions. Speed was varied from 60 to 110 percent of equivalent design speed for equivalent pressure ratios ranging from 1.3 to 2.8. The results of the investigation a re summarized as follows:
1. At equivalent design speed and overall total- to static-pressure ratio, the static efficiency was 0. 524 and the equivalent specific work was 9.61 Btu per pound. The cor- responding design values were 0. 536 and 9.832 Btu per pound, respectively.
2. The equivalent weight flow measured at design speed and pressure ratio was 6.31
16

pounds per second, which is 10.8 percent below the design value of 7.071 pounds per sec- ond. Of this deficiency, 3.7 percent is attributed to the undersize nozzle-throat area of the test hardware, with the remaining part charged to adverse flow conditions in the inlet manifold and nozzle channels.
3. The result' of lower efficiency and weight flow than design was a net loss in turbine power of 12.8 percent at design equivalent speed and pressure ratio.
4. Static pressures measured at the blade tip and hub and below the hub showed that (a) Only small radial gradients existed at all axial stations through the turbine
except at the turbine exit. (b) The turbine shaft thrust was appreciably higher than predicted.
5 . A radial survey made at the turbine exit at four circumferential locations at de- sign equivalent speed and pressure ratio revealed that
(a) The pattern of circumferential and radial variations in nozzle-inlet total pres- sure measured in prior manifold tests persisted through the turbine but the magnitude of the variations was diminished.
(b) A considerable circumf&ential variation in flow angle existed. Overturning of the flow occurred at all but the tip region of the blade passage. At the blade tip, flow velocities were lower than design and the flow was significantly underturned.
(c) Total-temperature measurement indicated significant variations in the en- thalpy drop across the turbine from hub to tip.
Lewis Research Center, National Aeronautics and Space Administration,
Cleveland, Ohio, December 6, 1965.
REFERENCES
1. Beer, R. : Aerodynamic Design and Estimated Performance of a Two-Stage Curtis Turbine for the Liquid Oxygen Turbopump of the M-1 Engine. Rept. AGC-8800-12, Aerojet General Corp. (NASA CR-54764), 1965.
2. .&abe, Roy G. ; Evans, David G . ; and Fbelke, Richard J. : Cold-Air Performance Evaluation of Scale Model Oxidizer Pump-Drive Turbine for the M-1 Hydrogen- Oxygen Rocket Engine. I - Inlet Feedpipe-Manifold Assembly. NASA TN D-3294, 1966.
3. Holeski, D. E. ; and Stewart, W. L. : Study of NASA and NACA Single-Stage Axial Flow Turbine Performance as Related to Reynolds Number and Geometry. J. Eng. Power, vol. 86, no. 3, July 1964, pp. 296-298.
17

C-65-3706 ' ' ". ,, ,.;
, . . ,
(bl Oxidizer turbopump.
Figure 1. - Mockup of M-1 hydrogen-oxygen r x k e t e n g i n e Model ID turbomachinery mounted on combustion chamber.
18

CD-8282 Figure 2. - Oxidizer turbopump assembly.
19

123
0. 440
/ \ ($)6 = 0.332: '~(5)~ = 0.125
F igure 3. - Design free-stream velocity diagrams at mean diameter.
20

(a1 Flight model. CD-8301
t (b) 0.45-Scale test turbine. CD-8302
Figure 4. - Cross section of Model moxidizer turbine.
21

(a ) Nozzle installed in manifold-feedpipe assembly. (b) Second-stage rotor prior to installation of t ip shroud.
(c ) Split casing halves with second-stage stator installed.
(d) Rotors instal led on turbine shaft .
Figure 5. - Test turbine hardware.
(e ) Header, feedpipes, and turb ine suppor i srano.
22
7
In le t
Direct-current e lectr ic
LTurbine test section
Figure 6. - Test facility.
CD-8303
23

Static pressure rLeft feedpipe Q 0 Total pressure \
x Total temperature 0 Actuated probe
e-+- \
4 I
-@ Station 1 i Q. 3
4 5 6 CD-834 7
Figure 7. -Test turbine instrumentation.
24

I
25

I 2. 4
PerceA equivalent design speed
0 60 - A 80
0 0
90 100
n 110
2. 6 Equivalent-inlet total- to exit stat ic-pressure ratio, p'l/jT7,w
Figure 10. - Var ia t ion of equivalent specific work with percent equivalent design speed and pressure ratio.
F igure 11. - Var ia t ion of static efficiency with percent equivalent design speed and pressure ratio.
26

Figure 13.
110 .06 .IO .14 .18 .
I I E
--
srcent equiva- lent design
speed ..
60 80 90 -
100
Blade-jet speed ratio, u Figure 12. - Variat ion of static effi-
c iency wi th blade-jet speed rat io and percent equivalent design speed.
0 Design point
1.8 2.0 ivalen,t-inlet total- to exil
2. i t static-pl
f
0 "A
0 0
0
60 80 90
100 110 I
"
- I 'essure ratio, 2.4 p''/~~, ..E 2. 6 2.8
dariat ion of equivalent weight flw with percent eguivalent design speed and pressure rat io.
27

80 0 2
Percent equivalent design speed
Figure 14. - Variat ion of equivalent torque with percent equivalent design speed and pressure ratio.
28

._ c m I
0-
.9a-
.96 -
. 9 4
.92 I I [Design pressu,re ratio I I I
1.2 1.4 1.6 1. a 2.0 2. 2 2; 4 2. 6 2. a Equivalent- inlet total- top&static-pressure rat io, p1/P7,,,
c 0
Circumferential position, 'p, deg
(b) Circumferent ia l var iat ion in manifold outer-wall stat ic pressure with posit ion and turbine pressure ratio at equivalent design speed.
Figure 15. - Turbine-inlet pressure measurements.
29

P n “
.- I d (a) Comparison of design and experimental static-pressure E variat ion. 2 1.0
1/1 tatic-pressure ratio,
2 .a
3 VI
E n
s - - a, c - .- s A .6 B .- - - tu VI
v 0 -I . 4
. 2 (b) Var ia t ion of t ip s ta t ic pressure wi th turb ine pressure
ratio.
l - E . 4 .6 2
-1.5 I
3 4 5 2. 5 6
1. 0
. a
.6
. 4 2 3 4 5 6
Axial measuring station
(c! Variat ion of hub stat ic pressure wi th turbine pressure
F igure 16. - Flow passage static pressures at equivalent
ratio.
design speed.
30

Station
Static-pressure tap location 0.- Measured " - Design
il 4"-
I .. . .58 .62.66 .54 .58 .62- T M
(a) Comparison of design and measured radial variation across f l w path and disk faces at equivalent design speed and pressure ratio.
3 4 5 6 3 4 5 6 3 4 5 6 3 4 5 6 3 4 5 6 Axial measuring station
(b) Variation of static pressures below blade hub with percent equivalent design speed and pressure ratio.
Figure 17. - Disk-face static pressures.
31

I Total pressure ratio, pb/pi
(a) Radial and circumferential varia- t ion of total pressure.
M w W
W 0
Probe circumferential location v iwed f rom turbine exhaust
Absolute f l w angle, measured from axial, deg
(b) Radial and circumferential variation of absolute f l w angle.
Figure 18. - Turbine-exit survey data at equivalent design speed and pressure ratio.
I
' .91 .92 .93 .94 Total-temperature ratio, f 6 / f 1
(c) Radial and circumferen- tial variation of total tem- perature.

"The aeronazrtical atzd space activities of the United States shall be conducted so as to contribufe . . . to the expansion of hnman knowl- edge of phenomena in the atmosphere and space. The Administration shall provide for the widest practicable atzd appropriate dissemination of information concerning its activities and the results thereof."
" N A T l O N A L AERONAUTKS AND SPACE ACT OF 1958
NASA SCIENTIFIC AND TECHNICAL PUBLICATIONS
TECHNICAL REPORTS: Scientific and technical information considered important, complete, and a lasting contribution to existing knowledge.
TECHNICAL NOTES: Information less broad in scope but nevertheless of importance as a contribution to existing knowledge.
TECHNICAL MEMORANDUMS: Information receiving limited distri- bution because of preliminary data, security classification, or other reasons.
CONTRACTOR REPORTS: Technical information generated in con- nection with a NASA contract or grant and released under NASA auspices.
TECHNICAL TRANSLATIONS: Information published in a foreign language considered to merit NASA distribution in English.
TECHNICAL REPRINTS: Information derived from NASA activities and initially published in the form of journal articles.
SPECIAL PUBLICATIONS Information derived from or of value to NASA activities but not necessarily reporting the results .of individual NASA-programmed scientific efforts. Publications include conference proceedings, monographs, data compilations, handbooks, sourcebooks, and special bibliographies.
Details on the availability o f these publications may be obtained from:
SCIENTIFIC AND TECHNICAL INFORMATION DIVISION
NATIONAL AERONAUTICS AND SPACE ADMINISTRATION
Washington, D.C. PO546
Related Documents