UVA-F-1340 Version 4.1 This case was prepared by Jessica Chan under the supervision of Professor Robert F. Bruner. This case was written as a basis for class discussion rather than to illustrate effective or ineffective handling of an administrative situation. The financial support of the Batten Institute is gratefully acknowledged. Copyright 2001 by the University of Virginia Darden School Foundation, Charlottesville, VA. All rights reserved. To order copies, send an e-mail to [email protected]. No part of this publication may be reproduced, stored in a retrieval system, used in a spreadsheet, or transmitted in any form or by any means—electronic, mechanical, photocopying, recording, or otherwise—without the permission of the Darden School Foundation. Rev. 10/02. Graduate School of Business Administration University of Virginia Coke vs. Pepsi, 2001 On December 4, 2000, PepsiCo, Inc. and The Quaker Oats Company issued a joint press release announcing their merger. The terms of the merger stated that PepsiCo would acquire Quaker Oats in a stock-for-stock deal valuing Quaker at around $14 billion. Judging by the share price reactions to the announcement, observers viewed the deal as yet another setback for Coca-Cola. By acquiring Quaker Oats, PepsiCo would gain access to Gatorade and control 83.6 percent of the sports-drink market. PepsiCo already possessed extremely strong brands in the non- carbonated beverages segment such as Aquafina, Tropicana and Lipton. Now through Gatorade, PepsiCo would consolidate its lead even further. Analysts estimated that PepsiCo would control around 33 percent of the United States’ non-carbonated beverage market after the Gatorade acquisition, far ahead of Coca-Cola’s 21 percent. 1 A report by UBS Warburg stated, “Given PEP’s [PepsiCo’s] #1 rank in the faster growth segment and its improving competitive position in CSD’s [carbonated soft drinks], we believe PEP could, over the long term, threaten Coca-Cola’s lead in the domestic beverage category in all channels except fountain.” 2 Carolyn Keene, consumer analyst at the mutual fund firm Siegel, Parker and Lauck, (SPL) wondered how this latest announcement would affect the two companies’ prospects for value creation. Historically, Coca-Cola had trounced PepsiCo in terms of value created as measured by “EVA” TM or Economic Value-Added (see Exhibit 1). She wondered if the trend would be reversed given recent developments. To develop a view, she decided to perform an 1 “Deal Ensures Pepsi Outdistancing Coke on the Flat,” South China Morning Post, December 6, 2000 2 Caroline Levy, David Palmer and Elyse Sakowitz, “PepsiCo Inc.-Strong Buy”, UBS Warburg, December 5, 2000 Share Price Reactions to Merger Announcement 0.85 0.90 0.95 1.00 1.05 1.10 11/15/2000 11/22/2000 11/29/2000 12/6/2000 12/13/2000 12/20/2000 12/27/2000 KO PEP OAT Merger Announccement

Welcome message from author
This document is posted to help you gain knowledge. Please leave a comment to let me know what you think about it! Share it to your friends and learn new things together.
Transcript
UVA-F-1340 Version 4.1
This case was prepared by Jessica Chan under the supervision of Professor Robert F. Bruner. This case was written as a basis for class discussion rather than to illustrate effective or ineffective handling of an administrative situation. The financial support of the Batten Institute is gratefully acknowledged. Copyright 2001 by the University of Virginia Darden School Foundation, Charlottesville, VA. All rights reserved. To order copies, send an e-mail to [email protected]. No part of this publication may be reproduced, stored in a retrieval system, used in a spreadsheet, or transmitted in any form or by any means—electronic, mechanical, photocopying, recording, or otherwise—without the permission of the Darden School Foundation. Rev. 10/02.
Graduate School of Business AdministrationUniversity of Virginia
Coke vs. Pepsi, 2001
On December 4, 2000, PepsiCo, Inc. and The Quaker Oats Company issued a joint press release announcing their merger. The terms of the merger stated that PepsiCo would acquire Quaker Oats in a stock-for-stock deal valuing Quaker at around $14 billion.
Judging by the share price reactions to the announcement, observers viewed the deal as yet another setback for Coca-Cola. By acquiring Quaker Oats, PepsiCo would gain access to Gatorade and control 83.6 percent of the sports-drink market. PepsiCo already possessed extremely strong brands in the non-carbonated beverages segment such as Aquafina, Tropicana and Lipton. Now through Gatorade, PepsiCo would consolidate its lead even further. Analysts estimated that PepsiCo would control around 33 percent of the United States’ non-carbonated beverage market after the Gatorade acquisition, far ahead of Coca-Cola’s 21 percent.1 A report by UBS Warburg stated,
“Given PEP’s [PepsiCo’s] #1 rank in the faster growth segment and its improving competitive position in CSD’s [carbonated soft drinks], we believe PEP could, over the long term, threaten Coca-Cola’s lead in the domestic beverage category in all channels except fountain.”2
Carolyn Keene, consumer analyst at the mutual fund firm Siegel, Parker and Lauck, (SPL) wondered how this latest announcement would affect the two companies’ prospects for value creation. Historically, Coca-Cola had trounced PepsiCo in terms of value created as measured by “EVA”TM or Economic Value-Added (see Exhibit 1). She wondered if the trend would be reversed given recent developments. To develop a view, she decided to perform an
1 “Deal Ensures Pepsi Outdistancing Coke on the Flat,” South China Morning Post, December 6, 2000 2 Caroline Levy, David Palmer and Elyse Sakowitz, “PepsiCo Inc.-Strong Buy”, UBS Warburg, December
5, 2000
Share Price Reactions to Merger Announcement
0.85
0.90
0.95
1.00
1.05
1.10
11/1
5/20
00
11/2
2/20
00
11/2
9/20
00
12/6
/200
0
12/1
3/20
00
12/2
0/20
00
12/2
7/20
00
KOPEPOAT
Merger Announccement
UVA-1340
-2-
EVA analysis for Coca-Cola Co. and PepsiCo for 2001-2003. She hoped this would reveal which of the two companies would be the more attractive investment over the next few years.
Company Background: The Coca-Cola Company
In 2000, The Coca-Cola Company’s (ticker symbol: KO) annual sales were $20.5 billion, and its market value reached $110.1 billion. The company was the largest manufacturer, distributor and marketer of soft drink concentrates and syrups3 in the world, and also marketed and distributed a variety of non-carbonated beverage products, which included Minute Maid orange juice, Fruitopia, Dasani bottled water, and Nestea among others.
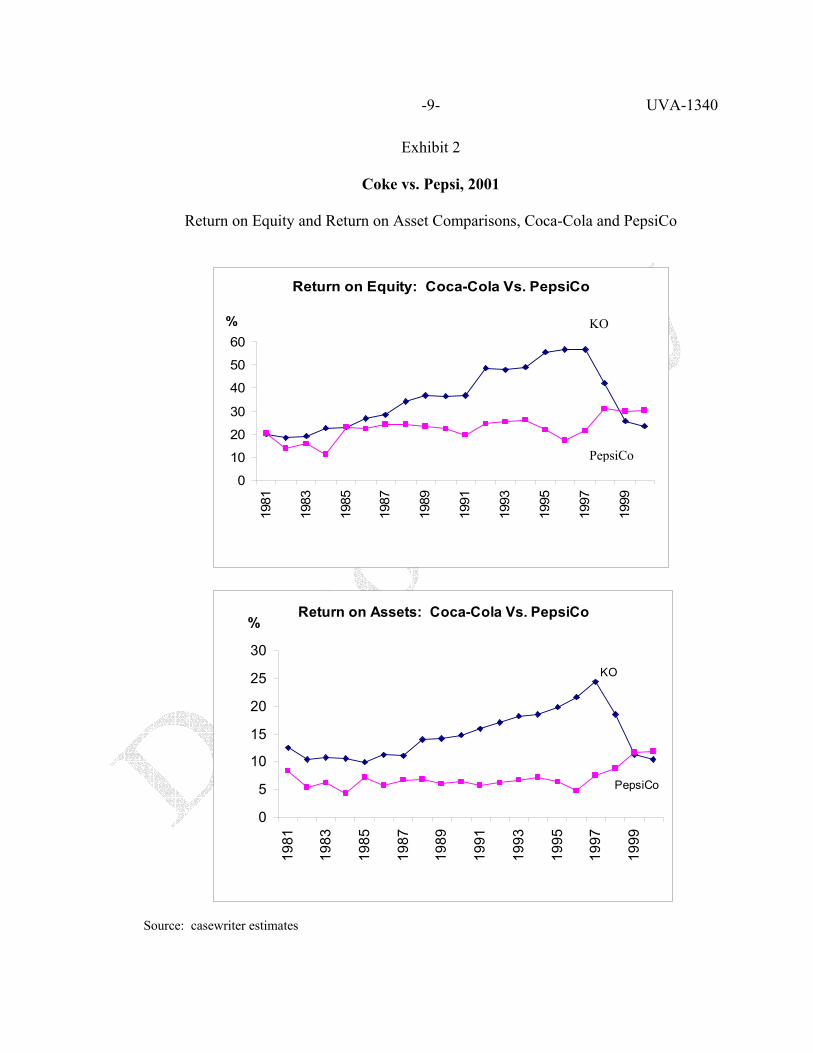
From 1993 to 1998, The Coca-Cola Company had consistently garnered the first or second spot in Fortune’s annual ranking of the top wealth creators. One of the main reasons for this was the company’s strategy of spinning off its bottling operations in order to avoid consolidation on its balance sheet. This move, implemented in 1985, contributed to a dramatic rise in returns on equity from 23 percent to as much as 57 percent over the last two decades (see Exhibit 2).
Recently however, the company had run into difficulties. The Asian financial crisis,
South America’s difficulties, and Russia’s devaluation of the ruble all hurt KO. But business mistakes by Doug Ivester, CEO from 1997 to 1999, aggravated the situation.
An example of one such mistake occurred in November 1999, when Ivester instituted a
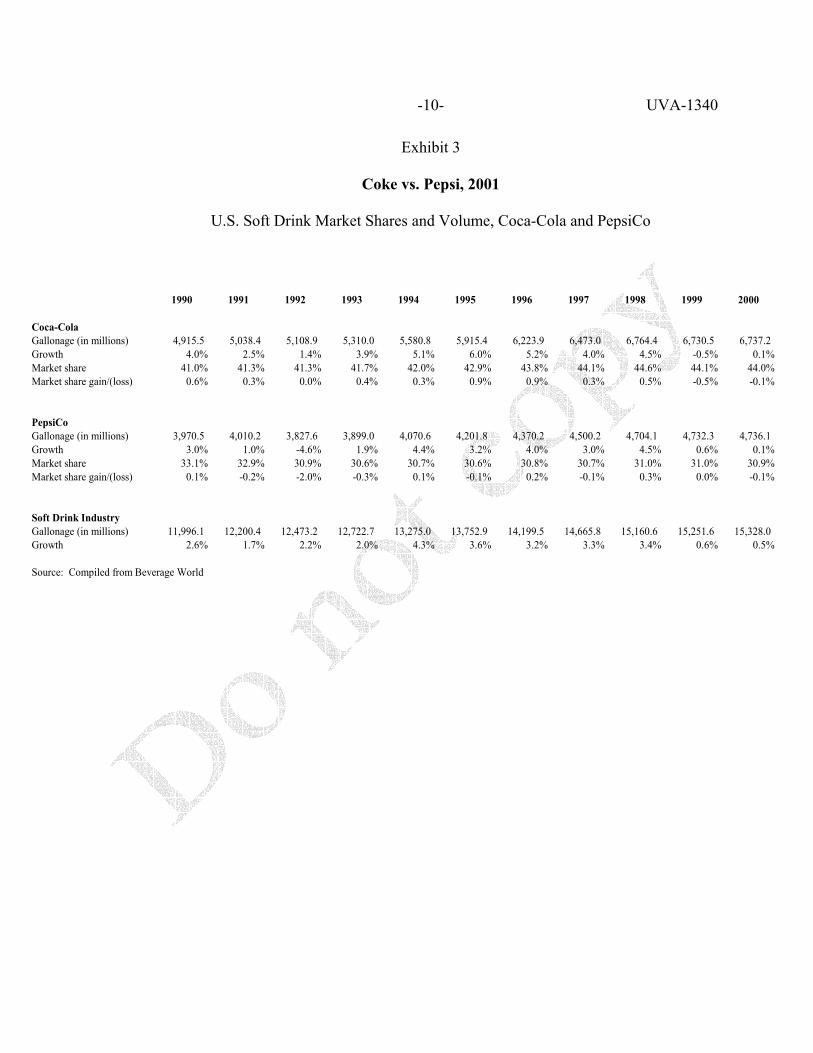
7.7 percent price hike on syrup, a rate that was double that of usual increases. The Coca-Cola Company’s bottlers were infuriated, and felt that Ivester was gouging them in order to increase KO’s profits. In response, the bottlers raised prices for the first time in years in order to improve profitability, resulting in a decrease in volume (see Exhibit 3). During Ivester’s approximately two-year term, net income fell by 41 percent. The company’s board of directors eased Ivester out in December 2000.
Douglas Daft, head of Coca-Cola’s Middle and Far East, and Africa groups, was chosen
to succeed Ivester. Upon taking over he immediately instituted major organizational changes such as cutting staff and reducing bureaucracy. But perhaps the most important change was his acknowledgment that KO needed to be a dominant player in the noncarbonated beverages market. In contrast to Ivester who had insisted on pushing the company’s core soft drink brands
3 The Coca Cola Company did not actually bottle and distribute its soft drink products. Rather, the
company manufactured concentrate and syrups that were then sold to authorized bottlers who were either majority or minority owned by KO, or completely independent. These bottlers then combined the syrup or concentrate with carbonated water and sweetener, packaged the finished drinks in authorized containers bearing the Coca-Cola trademark, and then sold these to retailers and wholesalers. Thus, KO’s main source of profit was from the syrup.
UVA-1340
-3-
– Coca-Cola, Fanta, Sprite and Diet Coke – Daft and his executives worked hard to come up with new noncarbonated products.
Some analysts were optimistic that the change in management would return The Coca-
Cola Company to its glory days. Perhaps through improved relations with bottlers and acquisitions of non-carbonated beverages, KO would return to the profit margins before 1998. Other analysts were less enthusiastic. One thing was certain, however: with PepsiCo’s invigorated management, KO would need to get back on its feet as quickly as it could.
Company Background: PepsiCo, Inc. In 2000, PepsiCo, Inc. was a $20 billion dollar company involved in the snack food, soft
drink and noncarbonated beverage businesses. The company sold and distributed salty and sweet snacks under the Frito-Lay trademark, and manufactured concentrates of Pepsi, Mountain Dew and other brands for sale to franchised bottlers. The company also produced and distributed juices and other noncarbonated beverages.4 Snack foods accounted for roughly two-thirds of PepsiCo’s sales and operating income, while beverages accounted for the remainder.
PepsiCo as a focused snack and beverage company in 2000 was due mostly to the efforts
of Roger Enrico, CEO from 1996 to 2000. During his tenure, Enrico instituted a massive overhaul at PepsiCo. In 1997, he sold off the fast food chains KFC, Taco Bell and Pizza Hut, ridding PepsiCo of a business that had long been a drag on returns. In 1999, he spun off Pepsi’s capital-intensive bottling operations into an independent public company. By spinning off the bottling operations PepsiCo would be left with just the higher-margin business of selling concentrate to bottlers.5 At the same time, independent PepsiCo bottlers would be able to raise capital on their own, freeing up cash flow within the parent company for other uses. Enrico also took aggressive steps to make PepsiCo a “total beverage company”. He brokered the acquisitions of Tropicana, the market leader in orange juice, and Quaker Oats, whose Gatorade brand dominated the energy drink market.
During Enrico’s term, PepsiCo’s return on equity almost doubled from 17 percent in
1996 to 30 percent in 2000. (See Exhibit 2 for historical returns and Exhibit 1 for a historical EVA analysis.) On Wall Street, analysts were upbeat about PepsiCo’s prospects.
4 Yahoo Finance. 5 In a price war “it’s the bottlers’ margins that get flattened, while the “parent” companies enjoy higher
sales volume because of the low prices. The concentrate business…can have gross margins of 80%, compared with between 35% and 40% for bottling.” --Nikhil Deogun, “PepsiCo’s Sale of Bottling-Business Stake Isn’t Being Greeted With “dot com” Hype”, The Wall Street Journal, March 26, 1999, p. C1.
UVA-1340
-4-
Industry Overview and Competitive Events In 2000, the beverage industry was undergoing a rapid transformation: the non-
carbonated drinks segment, although still representing only a small fraction of the beverage market, had grown by 62 percent in volume over the last five years, while soft drink volume growth had been sluggish.6 According to Beverage Digest, the share of the carbonated soft-drink industry fell from 71.3 percent in 1990 to 60.5 percent in 2000.
In soft drink volume, PepsiCo still lagged behind Coke, although it seemed to have caught up somewhat in recent years (see Exhibit 3). In the fall of 1999 for instance, PepsiCo, for the first time in its history, occupied two of the top three places for U.S. soft drink brands on store shelves as its Mountain Dew dislodged Diet Coke from third place. 7
Recent developments at both companies signaled an aggressive new round of competition. Below is a summary of recent competitive moves by both companies in several beverage categories:
Soft Drinks Over the last five years, Pepsi had launched aggressive and exciting marketing campaigns (e.g. “Generation Next”, “Joy of Pepsi”) that helped boost volumes and visibility. In addition, Pepsi launched the “Power of One” campaign – a strategy that entailed moving Pepsi drinks next to Frito-Lay on store shelves on the bet that doing so would entice shoppers to pick up a Pepsi when they bought chips. This strategy also helped boost both Frito Lay’s and Pepsi’s volumes. In response to the success of the Pepsi campaigns, Coca-Cola resorted to a number of tactics, such as veering away from its traditional feel-good ads and launching more trendy ones in the summer of 2000. Unfortunately, the new ads were highly unpopular and elicited negative reactions from customers and bottlers.8 Coca-Cola pulled out the ads and replaced them with the “Life tastes good” series, which returned to Coke’s traditional ‘feel-good’ themes while being trendier at the same time. Non Carbonated Beverages Coke and PepsiCo raced to position themselves in this important and fast-growing market segment:
• Orange Juice. PepsiCo acquired Tropicana in 1998 and claimed the clear market leader in orange juice. Tropicana held over 40 percent of the total chilled orange juice market, and 70 percent of the not-from-concentrate
6 McCarthy, “Buffeted: Coke’s Muddle over Quaker”, The Economist, November 25, 2000 7 Byrne, John A., “PepsiCo’s New Formula: How Roger Enrico Is Remaking the Company,” Business
Week, April 10, 2000 8 The ads were produced by the Cliff Freeman Ad Agency, famous for its controversial dot-com ad in
which gerbils are being shot out of a cannon. One example of a Coke commercial featured a grandmother in a wheelchair who throws a tantrum when she discovers there is no Coke at a family reunion.
UVA-1340
-5-
orange juice segment in the United States. On the other hand, Coke’s Minute Maid had less than a 20 percent share of the chilled orange juice market.
• Bottled Water. PepsiCo test-marketed Aquafina as early as 1994, while
Coke did not enter the bottled water market until 1999 with its Dasani brand. Aquafina was the number one brand in the US market for bottled water in 2000.
• Iced Tea. In iced-tea, PepsiCo’s Lipton boasted a 16-point share lead over
Coca-Cola’s Nestea.
• Sports Drinks. Pending the Federal Trade Commission’s approval of the PepsiCo-Quaker Oats deal, PepsiCo would own Gatorade, which held 83 percent of the US sports-drink market. Coca-Cola’s Powerade was a far second at 11 percent.
• Specialty Drinks. PepsiCo, in alliance with Starbucks, introduced the
highly popular Starbucks Frappuccino in 1996. It took Coca-Cola until 2000 to announce that it was going to test market a frozen coffee beverage. In October 2000, PepsiCo beat Coca-Cola in acquiring South Beach Beverage Co., maker of SoBe brand of teas and fruit juices.
Financial Comparison Analysts expected that the coming months would be among the most exciting in the
Coke-Pepsi saga. It would be interesting to see how the revived ‘cola wars’ would play out. In the meantime, a look at some performance measures might provide clues as to what the future held:
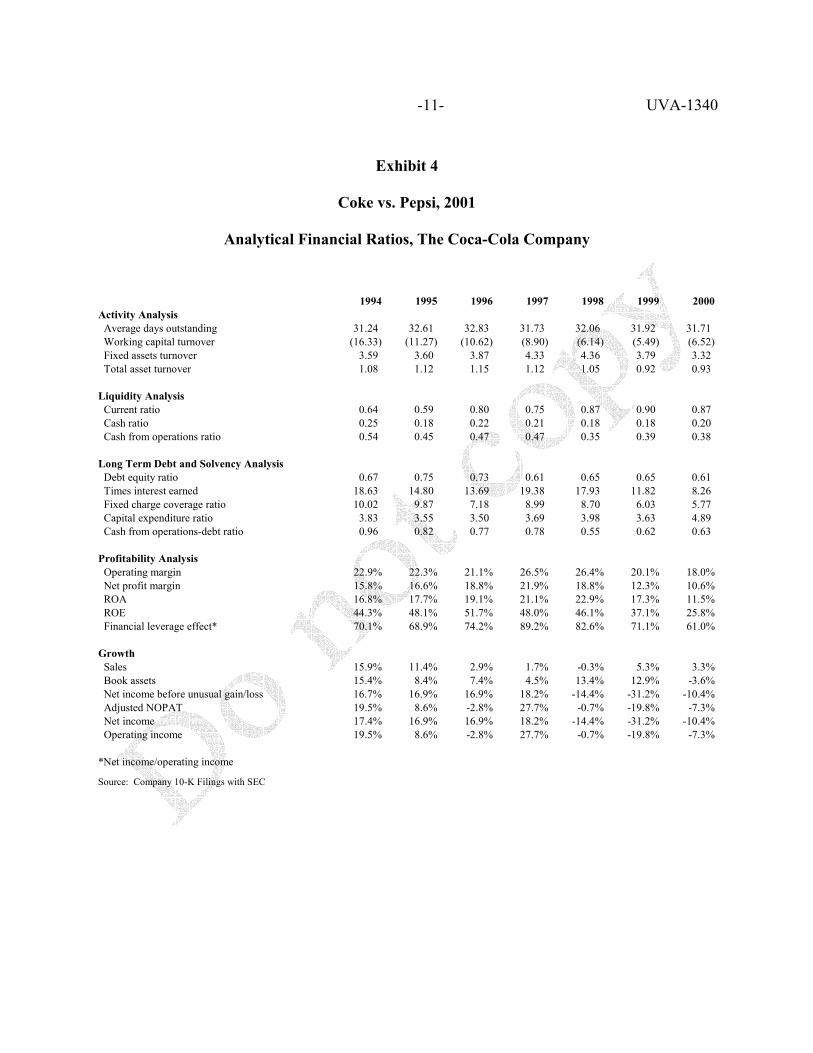
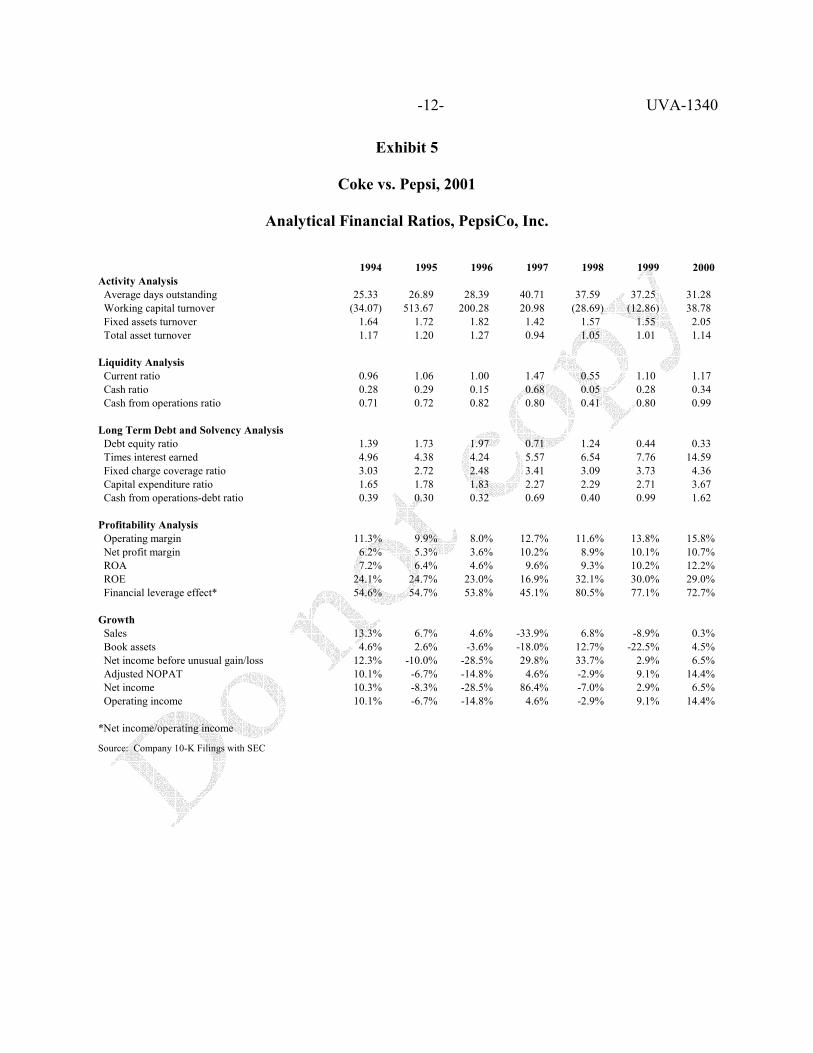
• Ratio analysis. Exhibits 4 and 5 present a variety of analytical ratios computed
from the financial statements of each firm. • Economic Profit Analysis. Also known as “Economic Value Added,” EVA
sought to estimate the value created or destroyed by comparing a firm’s cash operating profits or “Net Operating Profits After Tax” (NOPAT) against a capital charge:
EVA = NOPAT - (Weighted Average Cost of Capital x Invested Capital) Alternatively, the formula could be written as: EVA = (Return on Invested Capital, ROIC - WACC) x Invested Capital
UVA-1340
-6-
Return on Invested Capital, as the name suggested, could be calculated by dividing NOPAT by Invested Capital. The second formula highlights the idea that a “spread” earned beyond a company’s cost of capital resulted in value creation.
Conclusion Coke and Pepsi had created one of the strongest rivalries in business history. Carolyn
Keene now wanted to develop a view about the two companies’ future performances. She obtained projections pro-forma for the two firms from reports prepared by analysts at Credit Suisse First Boston9 (see Exhibits 6 and 7), and gathered information about current capital market conditions (Exhibit 8). She also took out her guidelines for estimating the components of EVA (Exhibit 9). It would be nice to finish her analysis before going off for Christmas break.
9 KO forecasts were obtained from report entitled “Third Quarter Review of 10Q: Flat Revenue and Varied
Operating Performance” by Andrew Conway, Chris O’ Donnell and Corey Horsch, Credit Suisse First Boston Equity Research, November 19, 2001. PepsiCo forecasts were obtained from report entitled “A Balanced Formula for Growth” by Andrew Conway, Chris O’ Donnell and Corey Horsch, Credit Suisse First Boston Equity Research, November 8, 2001.
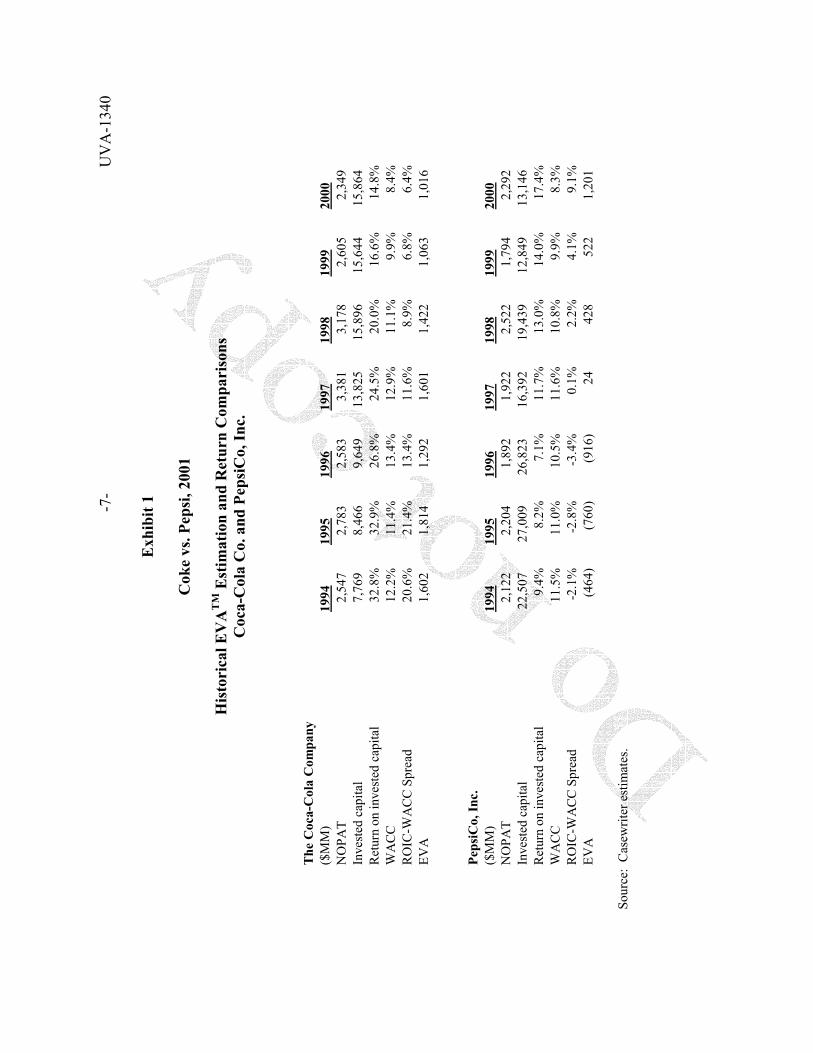
UV
A-1
340
-7-
Exh
ibit
1
Cok
e vs
. Pep
si, 2
001
H
isto
rica
l EV
AT
M E
stim
atio
n an
d R
etur
n C
ompa
riso
ns
Coc
a-C
ola
Co.
and
Pep
siC
o, In
c.
So
urce
: C
asew
riter
est
imat
es.
The
Coc
a-C
ola
Com
pany
($M
M)
1994
1995
1996
1997
1998
1999
2000
NO
PAT
2,54
7
2,78
3
2,58
3
3,38
1
3,17
8
2,60
5
2,34
9
Inve
sted
cap
ital
7,76
9
8,46
6
9,64
9
13,8
25
15
,896
15,6
44
15
,864
Ret
urn
on in
vest
ed c
apita
l32
.8%
32.9
%26
.8%
24.5
%20
.0%
16.6
%14
.8%
WA
CC
12.2
%11
.4%
13.4
%12
.9%
11.1
%9.
9%8.
4%R
OIC
-WA
CC
Spr
ead
20.6
%21
.4%
13.4
%11
.6%
8.9%
6.8%
6.4%
EVA
1,60
2
1,81
4
1,29
2
1,60
1
1,42
2
1,06
3
1,01
6
Peps
iCo,
Inc.
($M
M)
1994
1995
1996
1997
1998
1999
2000
NO
PAT
2,12
2
2,20
4
1,89
2
1,92
2
2,52
2
1,79
4
2,29
2
Inve
sted
cap
ital
22,5
07
27
,009
26,8
23
16
,392
19,4
39
12
,849
13,1
46
R
etur
n on
inve
sted
cap
ital
9.4%
8.2%
7.1%
11.7
%13
.0%
14.0
%17
.4%
WA
CC
11.5
%11
.0%
10.5
%11
.6%
10.8
%9.
9%8.
3%R
OIC
-WA
CC
Spr
ead
-2.1
%-2
.8%
-3.4
%0.
1%2.
2%4.
1%9.
1%EV
A(4
64)
(7
60)
(9
16)
24
42
8
52
2
1,
201

UVA-1340
-9-
Exhibit 2
Coke vs. Pepsi, 2001
Return on Equity and Return on Asset Comparisons, Coca-Cola and PepsiCo Source: casewriter estimates
Return on Equity: Coca-Cola Vs. PepsiCo
0
10
20
30
40
50
60
1981
1983
1985
1987
1989
1991
1993
1995
1997
1999
% KO
PepsiCo
Return on Assets: Coca-Cola Vs. PepsiCo
0
5
10
15
20
25
30
1981
1983
1985
1987
1989
1991
1993
1995
1997
1999
%
KO
PepsiCo
UVA-1340
-10-
Exhibit 3
Coke vs. Pepsi, 2001
U.S. Soft Drink Market Shares and Volume, Coca-Cola and PepsiCo
1990 1991 1992 1993 1994 1995 1996 1997 1998 1999 2000
Coca-ColaGallonage (in millions) 4,915.5 5,038.4 5,108.9 5,310.0 5,580.8 5,915.4 6,223.9 6,473.0 6,764.4 6,730.5 6,737.2 Growth 4.0% 2.5% 1.4% 3.9% 5.1% 6.0% 5.2% 4.0% 4.5% -0.5% 0.1%Market share 41.0% 41.3% 41.3% 41.7% 42.0% 42.9% 43.8% 44.1% 44.6% 44.1% 44.0%Market share gain/(loss) 0.6% 0.3% 0.0% 0.4% 0.3% 0.9% 0.9% 0.3% 0.5% -0.5% -0.1%
PepsiCoGallonage (in millions) 3,970.5 4,010.2 3,827.6 3,899.0 4,070.6 4,201.8 4,370.2 4,500.2 4,704.1 4,732.3 4,736.1 Growth 3.0% 1.0% -4.6% 1.9% 4.4% 3.2% 4.0% 3.0% 4.5% 0.6% 0.1%Market share 33.1% 32.9% 30.9% 30.6% 30.7% 30.6% 30.8% 30.7% 31.0% 31.0% 30.9%Market share gain/(loss) 0.1% -0.2% -2.0% -0.3% 0.1% -0.1% 0.2% -0.1% 0.3% 0.0% -0.1%
Soft Drink IndustryGallonage (in millions) 11,996.1 12,200.4 12,473.2 12,722.7 13,275.0 13,752.9 14,199.5 14,665.8 15,160.6 15,251.6 15,328.0 Growth 2.6% 1.7% 2.2% 2.0% 4.3% 3.6% 3.2% 3.3% 3.4% 0.6% 0.5%
Source: Compiled from Beverage World
UVA-1340
-11-
Exhibit 4
Coke vs. Pepsi, 2001
Analytical Financial Ratios, The Coca-Cola Company
1994 1995 1996 1997 1998 1999 2000Activity Analysis Average days outstanding 31.24 32.61 32.83 31.73 32.06 31.92 31.71 Working capital turnover (16.33) (11.27) (10.62) (8.90) (6.14) (5.49) (6.52) Fixed assets turnover 3.59 3.60 3.87 4.33 4.36 3.79 3.32 Total asset turnover 1.08 1.12 1.15 1.12 1.05 0.92 0.93
Liquidity Analysis Current ratio 0.64 0.59 0.80 0.75 0.87 0.90 0.87 Cash ratio 0.25 0.18 0.22 0.21 0.18 0.18 0.20 Cash from operations ratio 0.54 0.45 0.47 0.47 0.35 0.39 0.38
Long Term Debt and Solvency Analysis Debt equity ratio 0.67 0.75 0.73 0.61 0.65 0.65 0.61 Times interest earned 18.63 14.80 13.69 19.38 17.93 11.82 8.26 Fixed charge coverage ratio 10.02 9.87 7.18 8.99 8.70 6.03 5.77 Capital expenditure ratio 3.83 3.55 3.50 3.69 3.98 3.63 4.89 Cash from operations-debt ratio 0.96 0.82 0.77 0.78 0.55 0.62 0.63
Profitability Analysis Operating margin 22.9% 22.3% 21.1% 26.5% 26.4% 20.1% 18.0% Net profit margin 15.8% 16.6% 18.8% 21.9% 18.8% 12.3% 10.6% ROA 16.8% 17.7% 19.1% 21.1% 22.9% 17.3% 11.5% ROE 44.3% 48.1% 51.7% 48.0% 46.1% 37.1% 25.8% Financial leverage effect* 70.1% 68.9% 74.2% 89.2% 82.6% 71.1% 61.0%
Growth Sales 15.9% 11.4% 2.9% 1.7% -0.3% 5.3% 3.3% Book assets 15.4% 8.4% 7.4% 4.5% 13.4% 12.9% -3.6% Net income before unusual gain/loss 16.7% 16.9% 16.9% 18.2% -14.4% -31.2% -10.4% Adjusted NOPAT 19.5% 8.6% -2.8% 27.7% -0.7% -19.8% -7.3% Net income 17.4% 16.9% 16.9% 18.2% -14.4% -31.2% -10.4% Operating income 19.5% 8.6% -2.8% 27.7% -0.7% -19.8% -7.3%
*Net income/operating income
Source: Company 10-K Filings with SEC
UVA-1340
-12-
Exhibit 5
Coke vs. Pepsi, 2001
Analytical Financial Ratios, PepsiCo, Inc.
1994 1995 1996 1997 1998 1999 2000Activity Analysis Average days outstanding 25.33 26.89 28.39 40.71 37.59 37.25 31.28 Working capital turnover (34.07) 513.67 200.28 20.98 (28.69) (12.86) 38.78 Fixed assets turnover 1.64 1.72 1.82 1.42 1.57 1.55 2.05 Total asset turnover 1.17 1.20 1.27 0.94 1.05 1.01 1.14
Liquidity Analysis Current ratio 0.96 1.06 1.00 1.47 0.55 1.10 1.17 Cash ratio 0.28 0.29 0.15 0.68 0.05 0.28 0.34 Cash from operations ratio 0.71 0.72 0.82 0.80 0.41 0.80 0.99
Long Term Debt and Solvency Analysis Debt equity ratio 1.39 1.73 1.97 0.71 1.24 0.44 0.33 Times interest earned 4.96 4.38 4.24 5.57 6.54 7.76 14.59 Fixed charge coverage ratio 3.03 2.72 2.48 3.41 3.09 3.73 4.36 Capital expenditure ratio 1.65 1.78 1.83 2.27 2.29 2.71 3.67 Cash from operations-debt ratio 0.39 0.30 0.32 0.69 0.40 0.99 1.62
Profitability Analysis Operating margin 11.3% 9.9% 8.0% 12.7% 11.6% 13.8% 15.8% Net profit margin 6.2% 5.3% 3.6% 10.2% 8.9% 10.1% 10.7% ROA 7.2% 6.4% 4.6% 9.6% 9.3% 10.2% 12.2% ROE 24.1% 24.7% 23.0% 16.9% 32.1% 30.0% 29.0% Financial leverage effect* 54.6% 54.7% 53.8% 45.1% 80.5% 77.1% 72.7%
Growth Sales 13.3% 6.7% 4.6% -33.9% 6.8% -8.9% 0.3% Book assets 4.6% 2.6% -3.6% -18.0% 12.7% -22.5% 4.5% Net income before unusual gain/loss 12.3% -10.0% -28.5% 29.8% 33.7% 2.9% 6.5% Adjusted NOPAT 10.1% -6.7% -14.8% 4.6% -2.9% 9.1% 14.4% Net income 10.3% -8.3% -28.5% 86.4% -7.0% 2.9% 6.5% Operating income 10.1% -6.7% -14.8% 4.6% -2.9% 9.1% 14.4%
*Net income/operating income
Source: Company 10-K Filings with SEC
UV
A-1
340
-13-
Exh
ibit
6
Cok
e vs
. Pep
si, 2
001
In
com
e St
atem
ent a
nd B
alan
ce S
heet
For
ecas
ts, C
oca-
Col
a C
o.
In
com
e St
atem
ent
2001
E20
02E
2003
EB
alan
ce S
heet
2001
E20
02E
2003
EN
et o
pera
ting
reve
nue
20,2
23
21,2
34
22,5
08
Cas
h &
equ
ival
ents
2,23
8
2,40
6
2,43
2
Cos
t of g
oods
sold
6,09
2
6,28
5
6,61
7
A/R
, Net
1,83
8
1,93
0
2,04
6
Gro
ss p
rofit
14,1
31
14,9
49
15,8
91
Inve
ntor
ies
1,01
5
1,04
8
1,10
3
Prep
aid
expe
nses
& o
ther
1,83
4
1,86
8
1,96
4
Selli
ng e
xpen
se7,
508
7,
569
7,
985
T
otal
cur
rent
ass
ets
6,92
5
7,25
2
7,54
5
Gen
eral
& a
dmin
.1,
224
1,
248
1,
273
8,
732
8,
817
9,
258
In
vest
men
ts in
bot
tlers
5,96
2
6,18
9
6,44
9
Mar
keta
ble
secu
ritie
s2,
364
2,
364
2,
364
O
pera
ting
inco
me
5,39
9
6,13
2
6,63
3
PP&
E7,
334
8,
084
8,
834
Le
ss:
Acc
. dep
reci
atio
n(2
,935
)
(3
,476
)
(4
,073
)
In
tere
st in
com
e29
5
24
4
25
4
N
et P
P&E
4,39
9
4,60
8
4,76
1
Inte
rest
exp
ense
(310
)
(2
80)
(264
)
G
oodw
ill &
oth
er1,
783
1,
488
1,
193
Eq
uity
inco
me
197
227
261
Tot
al a
sset
s21
,434
21,9
01
22
,311
Oth
er in
com
e/(d
educ
tions
), ne
t24
(1
0)
(1
0)
A
/P &
acc
rued
liab
ilitie
s3,
796
3,
868
4,
066
Pr
etax
Inco
me
5,60
5
6,31
3
6,87
4
Loan
s and
not
es p
ayab
le3,
600
3,
500
3,
400
C
urre
nt p
ortio
n of
long
-term
deb
t15
4
15
3
2
In
com
e Ta
xes
1,68
2
1,89
4
2,06
2
Acc
rued
inco
me
taxe
s64
3
72
4
78
8
T
otal
cur
rent
liab
ilitie
s8,
193
8,
245
8,
256
N
et In
com
e3,
923
4,
419
4,
812
Lo
ng-te
rm d
ebt
681
528
526
Oth
er99
1
99
1
99
1
Su
pple
men
tal I
nfor
mat
ion:
Def
erre
d in
com
e ta
xes
302
239
170
Dep
reci
atio
n48
9
54
2
59
7
T
otal
liab
ilitie
s10
,167
10,0
03
9,
943
A
mor
tizat
ion
295
295
295
Cas
h ta
xes
1,73
8
1,95
7
2,13
1
Com
mon
stoc
k87
0
87
0
87
0
C
apita
l exp
endi
ture
s70
0
75
0
75
0
A
dditi
onal
pai
d-in
cap
ital
3,19
6
3,19
6
3,19
6
Ret
aine
d ea
rnin
gs23
,466
26,0
97
29
,067
Acc
umul
ated
goo
dwill
am
ortiz
atio
n at
the
end
of 2
000
was
exp
ecte
d to
be
$192
mill
ion.
Acc
umul
ated
oth
er c
ompr
ehen
sive
loss
es(2
,722
)
(2
,722
)
(2
,722
)
Tr
easu
ry st
ock
(13,
543)
(15,
543)
(18,
043)
The
read
er sh
ould
ass
ume
net i
ncom
e re
flect
s the
ded
uctio
n of
dep
reci
atio
n T
otal
equ
ity11
,267
11,8
98
12
,368
and
amor
tizat
ion.
Tot
al li
abili
ties a
nd e
quit y
21,4
34
21
,901
22,3
11
Sour
ce (e
xcep
t for
acc
um. g
oodw
ill a
mor
tizat
ion)
: “T
hird
Qua
rter R
evie
w o
f 10Q
: Fl
at R
even
ue a
nd V
arie
d O
pera
ting
Perf
orm
ance
” by
And
rew
Con
way
, C
hris
O’ D
onne
ll an
d C
ore y
Hor
sch,
Cre
dit S
uiss
e Fi
rst B
osto
n Eq
uity
Res
earc
h, N
ovem
ber 1
9, 2
001.
UV
A-1
340
-14-
Exh
ibit
7
Cok
e vs
. Pep
si, 2
001
In
com
e St
atem
ent a
nd B
alan
ce S
heet
For
ecas
ts, P
epsi
Co,
Inc.
In
com
e St
atem
ent
2001
E20
02E
2003
EB
alan
ce S
heet
2001
E20
02E
2003
ER
even
ues
C
ash
1,77
5
3,67
7
2,45
7
Bev
erag
es10
,553
11,3
07
12
,116
Inve
stm
ents
466
466
466
Frit
o-La
y14
,498
15,3
73
16
,273
Cas
h an
d eq
uiva
lent
s2,
241
4,
143
2,
923
Q
uake
r Foo
ds2,
042
2,
109
2,
179
27
,093
28,7
89
30
,568
A/R
, Net
2,29
2
2,43
5
2,58
5
Inve
ntor
ies
1,28
4
1,36
4
1,44
9
Ope
ratin
g Pr
ofit
Prep
aid
Exp.
& O
ther
886
942
1,00
0
Bev
erag
es1,
667
1,
818
1,
976
T
otal
non
-cas
h cu
rren
t ass
ets
4,46
2
4,74
1
5,03
4
Frit
o-La
y2,
675
2,
955
3,
239
Q
uake
r Foo
ds40
8
42
6
44
6
PP
&E
7,44
9
8,02
1
8,49
3
Syn
ergi
es-
60
90
Inta
ngib
les
4,55
6
4,55
6
4,55
6
Cor
pora
te e
xpen
se(3
65)
(3
74)
(3
82)
In
vest
men
ts in
unc
onso
l. af
filia
ted
3,09
5
3,23
5
3,41
4
4,38
5
4,88
5
5,36
9
Oth
er95
2
1,
019
1,
090
T
otal
ass
ets
22,7
57
25
,716
25,5
11
N
et in
tere
st e
xpen
se14
8
92
37
Eq
uity
inco
me
157
186
239
Shor
t-ter
m b
orro
win
gs20
2
-
-
C
urre
nt p
ortio
n of
long
term
deb
t28
1
44
4
64
Pr
etax
Inco
me
4,39
4
4,97
9
5,57
1
Acc
ts p
ayab
le &
oth
er c
urre
nt li
abs
5,01
7
5,28
4
5,57
3
Tot
al c
urre
nt li
abili
ties
5,50
0
5,72
8
5,63
7
Prov
isio
n fo
r tax
es1,
406
1,
593
1,
783
Lo
ng te
rm d
ebt
2,10
6
1,82
5
1,38
1
Net
inco
me
2,98
8
3,38
6
3,
788
O
ther
liab
ilitie
s4,
244
4,54
1
4,85
9
D
efer
red
inco
me
taxe
s1,
625
1,
974
2,
252
T
otal
liab
ilitie
s13
,475
14,0
68
14
,129
Supp
lem
enta
l inf
orm
atio
n:D
epre
ciat
ion
900
950
1,00
0
Pref
erre
d st
ock
Am
ortiz
atio
n23
6
29
5
29
5
C
omm
on st
ock
& a
dd'l
paid
-in c
apita
l69
0
69
0
69
0
C
ash
taxe
s1,
142
1,
245
1,
504
R
etai
ned
earn
ings
18,4
20
20
,786
23,5
20
C
apita
l exp
endi
ture
s1,
860
1,
583
1,
528
Tr
easu
ry st
ock
(8,4
34)
(8,4
34)
(11,
434)
Acc
umul
ated
com
preh
ensi
ve lo
ss(1
,394
)
(1
,394
)
(1
,394
)
A
ccum
ulat
ed g
oodw
ill a
mor
tizat
ion
at th
e en
d of
200
0 w
as e
xpec
ted
to b
e $7
51 m
illio
n. T
otal
equ
ity9,
282
11
,648
11,3
82
The
read
er sh
ould
ass
ume
net i
ncom
e re
flect
s the
ded
uctio
n of
dep
reci
atio
n T
otal
liab
ilitie
s and
equ
ity22
,757
25,7
16
25
,511
and
amor
tizat
ion.
Sour
ce (
exce
pt f
or d
epre
ciat
ion,
am
ortiz
atio
n, a
nd a
ccum
. goo
dwill
am
ortiz
atio
n):
“A B
alan
ced
Form
ula
for
Gro
wth
” by
And
rew
Con
way
, Chr
is O
’ D
onne
ll an
d C
orey
Hor
sch,
Cre
dit S
uiss
e Fi
rst B
osto
n Eq
uity
Res
earc
h, N
ovem
ber 8
, 200
1.

UVA-1340
-16-
Exhibit 8
Coke vs. Pepsi, 2001
Capital Market Information On December 4, 2000
Coca-Cola Co. and PepsiCo Inc. Share Price Performance Relative to S&P500: January 1993 to December 4, 2000
Current yields on U.S. Treasuries
3-month 6.15%6-month 6.11%1-year 6.00%5-year 5.52%10-year 5.73%20-year 5.82%
Historical Equity Risk Premiums (1926-1999)Geometric mean 5.90%Arithmetic mean 7.50%
Publicly Traded Debt*Coupon 5.75% paid semi-annually Coupon 5.75% paid semi-annuallyMaturity 4/30/2009 Maturity 1/15/2008 Current Price 91.54 Current Price 93.26 Rating A1 Rating A2
Historic Betas Historic Betas1994 0.88 1994 1.05 1995 0.83 1995 1.07 1996 1.19 1996 0.93 1997 1.11 1997 0.96 1998 0.97 1998 1.03 1999 0.71 1999 0.73 2000 0.44 2000 0.42
Average 0.88 Average 0.88
Dividend History and Forecasts Dividend History and ForecastsPaymt Dates 31-Mar 30-Jun 30-Sep 31-Dec Total Paymt Dates 31-Mar 30-Jun 30-Sep 31-Dec Total
1996 - 0.125 0.125 0.25 0.50 1996 0.20 0.115 0.115 - 0.43 1997 - 0.14 0.14 0.28 0.56 1997 0.23 0.125 0.125 - 0.48 1998 - 0.15 0.15 0.30 0.60 1998 0.25 0.13 0.13 - 0.51 1999 - 0.16 0.16 0.32 0.64 1999 0.26 0.135 0.135 - 0.53 2000 - 0.17 0.17 0.34 E 0.68 2000 0.27 0.14 0.14 0.55
E=estimate
Value Line Forecast of Dividend Growth from '97-99 to '03-'05: 7.50% Value Line Forecast of Dividend Growth from '97-99 to '03-'05: 7.50% Value Line EPS Estimate for FY 2001: 1.75$ Value Line EPS Estimate for FY 2001: 1.63$
Coke share price on December 4, 2000: 62.75$ PepsiCo share price on December 4, 2000: 43.81$
Outstanding shares (in millions): Outstanding shares (in millions): Basic 2,477 Basic 1,446 Diluted 2,487 Diluted 1,475
Sources of data: Bloomberg Financial Services, Ibbotson Associates Yearbook 1999, Value Line Investment Survey, IBES
The Coca-Cola Company PepsiCo, Inc
Relative Share Price Performance: Coca-Cola, PepsiCo and S&P 500
-
1.00
2.00
3.00
4.00
5.00
Jan-
93
Jul-9
3
Jan-
94
Jul-9
4
Jan-
95
Jul-9
5
Jan-
96
Jul-9
6
Jan-
97
Jul-9
7
Jan-
98
Jul-9
8
Jan-
99
Jul-9
9
Jan-
00
Jul-0
0
Coca-Cola
S&P 500
PepsiCo
UVA-1340
-17-
Exhibit 12
Coke vs. Pepsi, 2001
Some Guidelines for Estimating Components of EVA
• NOPAT. “Net operating profit after taxes” (NOPAT) is calculated with the aim of arriving at the actual cash generated by the concern. Adjustments might include adding back goodwill amortization and other non-cash expenses. Taxes must similarly be adjusted to reflect only actual cash taxes. Depreciation is not added back to NOPAT despite being a non-cash expense, because of the assumption that depreciation represents a true economic cost, i.e. it is the amount that must be reinvested to maintain operations at the existing level. For consistency, invested capital is measured net of depreciation.
• Invested Capital. Invested capital means simply, the amount of capital invested in the
business. It may be calculated either from the asset side, or from the liabilities + equity side of the balance sheet. The latter is the simpler method.
Invested capital includes debt, equity and other near-capital items that represent economic value employed on behalf of the firm such as the present value of operating leases, write-offs and cumulative losses, and accumulated goodwill amortization. The rationale for including losses and write-offs in continuing capital is that these represent unproductive assets, or failed investment. Were they excluded from the capital equation, the sum would only count successful efforts, and not accurately reflect the performance of the firm. Accumulated goodwill amortization likewise needs to be included in invested capital because it represents a true investment. Excess cash not needed for operations, such as marketable securities, may be deducted from the invested capital base.
• Cost of capital. The capital charge applied against NOPAT should be based on a blend of the costs of all the types of capital the firm employs, or the weighted average cost of capital.
WACC = Kd (1-t) * D/(D+E) + Ke * E/(D+E)
Where: Kd = Cost of debt T = Effective marginal tax rate Ke = Cost of equity D = Total debt E = Total equity
UVA-1340
-18-
The cost of debt (used for both debt and leases) is the annual rate consistent with each firm’s bond rating. The cost of equity may be estimated in a variety of ways10—a usual practice is to use the capital asset pricing model:
Ke = Rf + β (Rm – Rf)
where: Rf = Risk-free rate, typically the yield on 10-year US Treasury bonds β = Beta, a measure of the volatility of a company’s stock price with
respect to market movements Rm-Rf = Market risk premium, the additional return investors require over
the risk free rate to compensate them for investing in companies.11
10 Other ways of estimating the cost of equity include the dividend growth and earnings capitalization
models. 11 The two market premiums frequently used are 7.5 percent, which is an arithmetic average of annual
market returns over the Treasury-bill rate from 1926-1998, and 5.9 percent, which is a compound or geometric average of market returns over Treasury bonds from 1926-1998. (Source: Ibbotson Associates Yearbook, 1999)
Related Documents