JP RESEARCH INDIA PVT. LTD. 583/1, Sri Kumaran Salai, Civil Aerodrome Post, Avinashi Road, Coimbatore - 641 014, Tamil Nadu Submitted to: The Office of the Superintendent of Police- Coimbatore Rural District Coimbatore – 641 018, Tamil Nadu Coimbatore Rural Road Accident Study (October 2012- October 2014) Analysis of 568 accidents examined between October 2012 – October 2014 Submitted by:

Welcome message from author
This document is posted to help you gain knowledge. Please leave a comment to let me know what you think about it! Share it to your friends and learn new things together.
Transcript

JP RESEARCH INDIA PVT. LTD.
583/1, Sri Kumaran Salai, Civil Aerodrome Post, Avinashi Road, Coimbatore - 641 014, Tamil Nadu
Submitted to:
The Office of the Superintendent of Police- Coimbatore Rural District
Coimbatore – 641 018, Tamil Nadu
Coimbatore Rural Road Accident Study (October 2012- October 2014)
Analysis of 568 accidents examined between October 2012 – October 2014
Submitted by:

JP Research India Pvt. Ltd. | Coimbatore Rural Road Accident Study (2012 – 2014) 1
Coimbatore Rural Road Accident Study (October 2012- October 2014)
ACKNOWLEDGEMENTS .................................................................................................................................................. 2
1 INTRODUCTION .............................................................................................................................................. 3
HOW IS JPRI CONDUCTING THIS STUDY FOR FREE FOR THE GOVERNMENT? ............................................ 4
DOES THIS STUDY AFFECT MY PRIVACY? ......................................................................................................... 5
WHAT IS THE OBJECTIVE OF THIS REPORT? .................................................................................................... 5
ABOUT JP RESEARCH INDIA.................................................................................................................................... 6
ABOUT ROAD ACCIDENT SAMPLING SYSTEM – INDIA (RASSI) ....................................................................... 6
2 METHODOLOGY .............................................................................................................................................. 8
ACCIDENT DATA SAMPLE AND DATA ANALYSIS ................................................................................................. 8
HOW WERE THESE ACCIDENTS FOUND? .......................................................................................................... 8
REASONS FOR DROPPING CASES ........................................................................................................................ 9
WHY ARE “DROPPED” AND UNRECORDED ACCIDENTS IMPORTANT? .......................................................... 9
CONTRIBUTING FACTORS – A PRIMER ............................................................................................................... 10
THE JPRI APPROACH TO STUDYING AN ACCIDENT ......................................................................................... 10
3 DATA ANALYSIS ........................................................................................................................................... 13
DISTRIBUTION OF ACCIDENTS BY HIGHEST INJURY SEVERITY ...................................................................... 13
INJURY SEVERITY DEFINITIONS ..................................................................................................................... 13
DISTRIBUTION OF ACCIDENTS BY TIME OF OCCURRENCE .............................................................................. 14
DISTRIBUTION OF ACCIDENTS BY DAY OF WEEK ............................................................................................. 14
VEHICLES/ROAD USERS INVOLVED ................................................................................................................... 15
VEHICLES/ROAD USERS AFFECTED IN CRASHES WITH FATAL OR SERIOUS INJURY ................................. 15
COLLISION PARTNER ANALYSIS .......................................................................................................................... 16
ACCIDENT TYPES ................................................................................................................................................... 16
4 CONTRIBUTING FACTORS ANALYSIS ................................................................................................. 18
ANALYSING ACCIDENT AND INJURY CAUSATION .............................................................................................. 18
FACTORS CONTRIBUTING TO ACCIDENT CAUSATION (568 ACCIDENTS) .............................................. 18
FACTORS CONTRIBUTING TO INJURY CAUSATION (452 FATAL/SERIOUS INJURY ACCIDENTS) ....... 19
CONTRIBUTING FACTORS: ACCIDENTS .......................................................................................................... 20
HUMAN FACTORS CONTRIBUTING TO ACCIDENT CAUSATION ............................................................... 20
VEHICLE FACTORS CONTRIBUTING TO ACCIDENT CAUSATION ............................................................. 26
INFRASTRUCTURE FACTORS CONTRIBUTING TO ACCIDENT CAUSATION ......................................... 29
CONTRIBUTING FACTORS: INJURIES ................................................................................................................ 36
HUMAN FACTORS CONTRIBUTING TO INJURY CAUSATION ..................................................................... 36
VEHICLE FACTORS CONTRIBUTING TO INJURY CAUSATION ................................................................... 39
INFRASTRUCTURE FACTORS CONTRIBUTING TO INJURY CAUSATION .............................................. 44
5 CONCLUSIONS ............................................................................................................................................... 46
APPENDIX A: JP RESEARCH INDIA & RASSI CONTACT INFORMATION .......................................... 49
APPENDIX B: CASE SELECTION CRITERIA .................................................................................................. 50
MAIN CRITERIA ...................................................................................................................................................... 50
PROVISO .................................................................................................................................................................. 50
APPENDIX C: ACCIDENT TYPE DEFINITION .............................................................................................. 51
JP Research India Pvt. Ltd. | Coimbatore Rural Road Accident Study (2012 – 2014) 2
ACKNOWLEDGEMENTS
We express our sincere thanks to Principal Secretary to Government - Home, Prohibition and
Excise Department, Additional Director General of Police (State Traffic Planning Cell) -
TamilNadu, Transport Commissioner - Tamil Nadu and the Superintendent of Police –
Coimbatore Rural, for giving us the opportunity to conduct this study.
Our sincere appreciation and gratitude to all the officers of the Tamil Nadu State Highway Police
for their support and cooperation. We are also grateful to GVK EMRI 108 ambulance services
who notified us of road traffic accidents.
This study is conducted under the Road Accident Sampling System – India (RASSI) project,
which is an initiative financially and technically supported by the following consortium
members:
RASSI Consortium Members
We thank the RASSI consortium members not only for their financial support but for their belief
in safer road travel for India, which ultimately has made this project possible. Last, but not the
least, our deepest sense of gratitude to all the researchers and employees of JP Research India,
and JP Research, Inc., whose untiring efforts, dedication and passion have made this possible.
This report is dedicated to all the people
whose lives have been affected, directly or indirectly,
by road accidents on Coimbatore highways.
This project is part of a pioneering attempt in India to use local data to identify the most
effective implementation of road safety strategies that have proven to be highly effective in
mitigating fatalities, injuries and accidents around the world. We hope that the data collected
and analyzed as part of this study is useful to all the stake holders in helping make all of our
journeys safer.

JP Research India Pvt. Ltd. | Coimbatore Rural Road Accident Study (2012 – 2014) 3
1 INTRODUCTION An ongoing, standardized, in-depth accident investigation and data collection study was
established by JP Research India Pvt. Ltd. (JPRI) in 2011, subsequent to pilot studies conducted
in a few regions with the cooperation of state police authorities between 2008 and 2010. The
database effort, which is the first of its kind in India, is called the “Road Accident Sampling
System – India” (RASSI), and it is currently supported by a consortium of automobile and
component manufacturers.
In 2011, the RASSI study began investigating accidents on rural highways (mostly undivided,
with travel lanes approximately 3.5 meters wide) around Coimbatore, and this work has been
continued and expanded (Figure 1) from 2012 through 2014, the period covered by this report.
FIGURE 1: COIMBATORE RURAL HIGHWAYS INCLUDED IN STUDY (COURTESY: GOOGLE MAPS)
The study area delineated for the RASSI study in the Coimbatore district is over 250 km and
includes few district and village roads. The nine rural police stations that serve these highways
are: Annur, Koilpalayam, Karumathampatti, Sulur, Chettipalayam, Madukkarai, Kinathukkadavu,
Vadakkipalayam and Pollachi taluk.

JP Research India Pvt. Ltd. | Coimbatore Rural Road Accident Study (2012 – 2014) 4
How is JPRI conducting this study for free for the government ?
This study is being conducted at NO COST to the government. JPRI respects and is grateful for
the cooperation provided by the police and other government agencies for conducting this in-
depth crash investigation study. In return, JPRI provides reports that give scientific, detailed and
unbiased insights regarding road safety issues in India.
JPRI accident research teams spend a considerable amount of time examining road crashes on-
site (Figure 2). In-depth crash investigations are conducted in a scientific manner involving
detailed examination of the crash scene, crash vehicles and the injuries sustained by the victims
of the accident. Whenever possible, researchers also interview the accident victims to
understand the accident sequences better. The data collected are stored in a database in a
format which allows for detailed analysis of accidents. Numerous engineering measurements,
observations and notes are taken on accident data forms, which are used to build a scientific
database called RASSI. This database is shared with a consortium of automotive manufacturers
who use it for improving vehicle design and developing India-specific safety technologies. The
research consortium provides financial and technical support to JPRI under the RASSI initiative
for obtaining this scientific data. (More details on JPRI and RASSI are presented in following
subsections.)
FIGURE 2: JPRI ACCIDENT RESEARCHERS PERFORM ON-SCENE CRASH INVESTIGATIONS
JP Research India Pvt. Ltd. | Coimbatore Rural Road Accident Study (2012 – 2014) 5
Does this study affect my privacy?
This study is purely scientific, and personal information such as victim names, any contact
numbers, vehicle registration numbers, etc. are NOT stored in the scientific database.
JPRI crash investigation processes are designed keeping in mind that the entire purpose is not
to investigate accidents to find fault, but to make an unbiased scientific examination of each
accident to determine the various contributing factors in order to better understand what could
be done to prevent reoccurrences of such accidents and mitigate their severity. Since personal
information is not needed for analysis, JPRI researchers, after completing an accident
examination, de-identify all the details that go into the analytical database.
What is the objective of this report ?
Over the last two years of this study (October 2012 through October 2014), 1,088 accidents
were examined, and 568 of these were analyzed in detail. This report provides an in-depth
analysis of these 568 accidents and offers an analysis of the various factors influencing
accidents and injuries on the rural highways of Coimbatore.
The report not only identifies these “contributing factors” but also ranks them based on the
number of accidents these factors have influenced. This ranking is to help policy makers,
decision makers and road safety stakeholders in planning cost effective road safety investments
using data-driven road safety strategies.

JP Research India Pvt. Ltd. | Coimbatore Rural Road Accident Study (2012 – 2014) 6
About JP Research India JP Research India Pvt. Ltd. is a research firm dedicated to the business of automotive crash data
collection and analysis. The company, a fully owned subsidiary of JP Research, Inc., is a
forerunner in road safety research and has undertaken pioneering on-scene, in-depth accident
investigation, data collection and analysis projects with the goal of scientifically understanding
and mitigating road accident fatalities in India.
Accident research has proven to be the best way to understand the characteristics of real-world
road traffic accidents. Countries such as the USA, UK, Germany and Japan routinely use the
results of such research to significantly reduce the number of road traffic fatalities in their
countries. The fact that India has been losing approximately 1,50,000 lives on its roads every
year makes it imperative that we, too, conduct this kind of research to identify and then take
swift steps to address the key factors influencing the high traffic injury and mortality rate in our
country.
JP Research India is experienced in using accident research methodologies developed in other
nations and customizing these to suit India’s unique traffic conditions. After conducting
numerous studies and on-site crash research projects on Indian roads, JP Research India has
developed its own India-specific crash data collection forms, a methodology for conducting site
and vehicle crash investigations in the inimitable Indian traffic environment, and a searchable
database of in-depth accident data. In addition, the company’s experts offer training in all of
these areas, for those who would prefer to perform their own data collection and analysis. At JP
Research India, our overriding objective is to understand Indian roads, traffic and road users in
ways that can be used to save lives: ours and yours.
Contact information for JPRI is provided in Appendix A.
About Road Accident Sampling System – India (RASSI) India is currently ranked highest in the world for road traffic fatalities; thus, there is a critical
need to reduce the number of road traffic-related fatalities across the country. While the
economic and social benefits of implementing standardized accident reporting and crash data
collection systems to improve road and automotive safety and reduce fatalities have been
demonstrated in Europe and the USA for some time, there has been no comparable system in
India.
The absence of systematically collected, nationwide in-depth traffic crash data is seriously
impeding scientific research and analysis of road traffic accidents in India. To address root
causes of road crashes and injuries across India, it is necessary to fully understand the traffic
accidents taking place throughout the country. Only real world accident data, properly defined,
can reliably identify the key factors that contribute to traffic crashes, both in terms of their
frequency and severity. Further, since cultural and socio-economic conditions, as well as the
roads themselves, affect driving conditions and crash outcomes, the data must be specific to a
particular region. Over the past few years, an automotive accident data system—based on
US/European design, but modified for Indian conditions—has been successfully demonstrated
in the state of Tamil Nadu by a consortium of private companies. This system is called RASSI.
The genesis of the RASSI project began with a passenger car crash analysis study undertaken in
Chennai. This led to short-term accident studies on National Highways in the districts of
Kanchipuram and Coimbatore, with the cooperation of the Tamil Nadu state police. Based on the
JP Research India Pvt. Ltd. | Coimbatore Rural Road Accident Study (2012 – 2014) 7
experience from these initial studies, a robust methodology was developed to perform in-depth
accident data collection and research that applied generically to all Indian roads. A relational
database was also developed to record the scientific data obtained from each accident
investigated by the researchers. Based on the early success of RASSI, a number of Original
Equipment Manufacturers came forward to provide financial support for the continuation of the
study on a yearly basis. In 2011, in JPRI’s Coimbatore Data Centre, the RASSI Consortium
officially came into being, and members were granted interactive access to the database.
Crashes are continually being investigated in detail by JPRI teams in Coimbatore, Pune and
Ahmedabad, and the program logs a wide array of data, as well as vehicle and crash site
photographs. The teams collect and assess detailed evidence—such as skid marks, broken glass,
impacted objects, measurements of crash damage to the vehicle—and identify interior vehicle
locations contacted by occupants during the crash event. They then follow up on-site
investigations by linking medical record reviews to document the nature and severity of injury
from a crash.
The long-term goal of the RASSI Consortium is to extend RASSI to create an integrated network
of data centers across India with the support of other automotive and transportation-related
companies and of the government. This would result in a common set of automotive crash data
for research and analysis of root causes of India’s road traffic issues.
Contact information for RASSI is provided in Appendix A.
JP Research India Pvt. Ltd. | Coimbatore Rural Road Accident Study (2012 – 2014) 8
2 METHODOLOGY
Accident Data Sample and Data Analysis JPRI researchers examined a total of 1,088 accidents between 1st October 2012 and 31st October
2014. Of these 1,088 crashes, 475 accidents satisfied the case selection criteria for inclusion in
the RASSI database (Appendix B presents the case selection criteria methodology developed by
JP Research teams to identify cases for RASSI analysis) and were investigated in depth. For an
additional 93 accidents (of the 613 accidents dropped from inclusion in RASSI), JPRI was able to
identify enough partial information for inclusion in the analyses performed for this study. The
remaining 520 accidents were dropped because of late reporting of cases to JPRI, scene
evidence missing, and/or vehicle unavailable for investigation. In total, 568 accidents were
analyzed in detail for this study. These 568 accidents involved 1,108 road users (1,024 vehicles
and 84 pedestrians); 185 of the crashes resulted in fatalities and 267 involved serious injury.
Total number of occupants involved in these accidents were 1620 and number of victims who
sustained fatal and serious injuries were 733.
How were these accidents found?
JPRI researchers found these cases by making regular phone calls to police stations on a daily
basis, visiting police stations in person, receiving SMS (text) notifications from GVK EMRI 108
emergency response services and driving through the study areas to identify crashes. In some
cases, police were in fact notified about crashes by JPRI researchers when they came upon the
accidents on their own while travelling through the study areas. Because this method has
proved fruitful, JPRI teams frequently scout for crashes when out on the road; however, this
method is time-consuming and increases their on-road exposure.
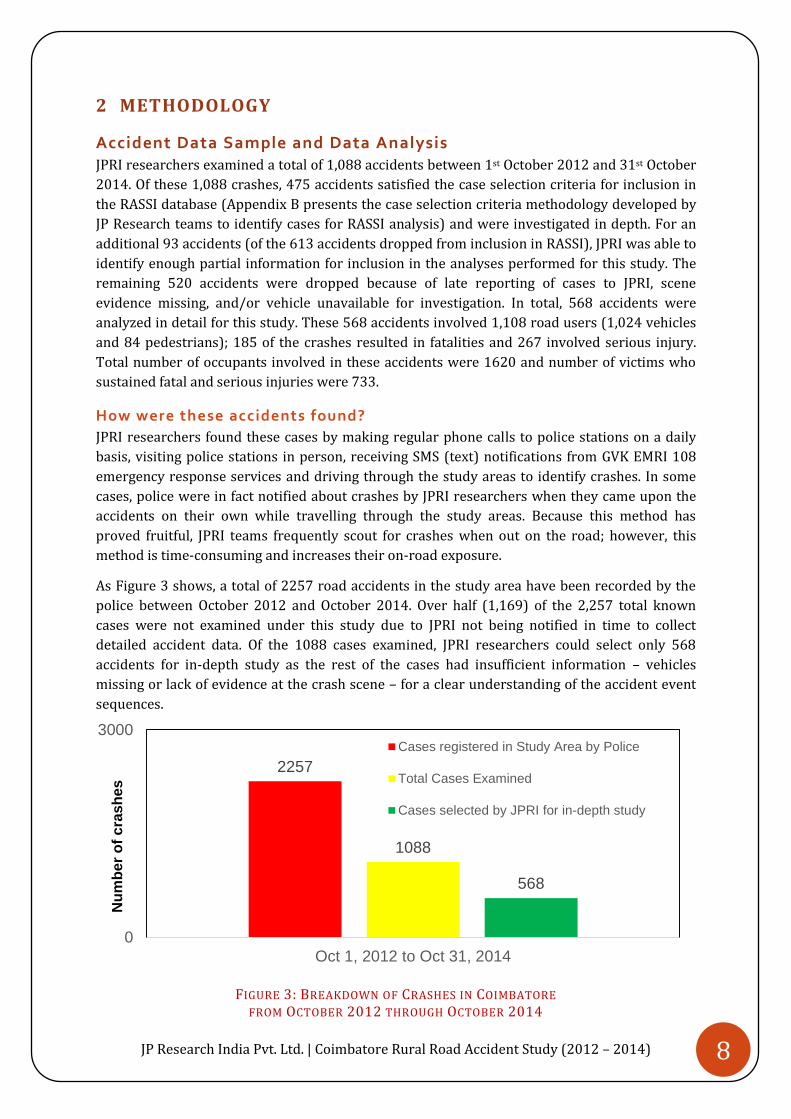
As Figure 3 shows, a total of 2257 road accidents in the study area have been recorded by the
police between October 2012 and October 2014. Over half (1,169) of the 2,257 total known
cases were not examined under this study due to JPRI not being notified in time to collect
detailed accident data. Of the 1088 cases examined, JPRI researchers could select only 568
accidents for in-depth study as the rest of the cases had insufficient information – vehicles
missing or lack of evidence at the crash scene – for a clear understanding of the accident event
sequences.
FIGURE 3: BREAKDOWN OF CRASHES IN COIMBATORE FROM OCTOBER 2012 THROUGH OCTOBER 2014
2257
1088
568
0
3000
Oct 1, 2012 to Oct 31, 2014
Nu
mb
er
of
cra
sh
es
Cases registered in Study Area by Police
Total Cases Examined
Cases selected by JPRI for in-depth study

JP Research India Pvt. Ltd. | Coimbatore Rural Road Accident Study (2012 – 2014) 9
Reasons for dropping cases
JPRI researchers currently examine more than twice as many crashes as can be used for in-
depth scientific analysis. Two major problems have arisen that are not experienced in the
Western world and that have resulted in cases having to be dropped from detailed analysis for
this study. These problems, unique to Indian crash data collection, are:
1. Lack of police notification of crashes immediately after they occur.
In many cases, it has been observed that the police are not informed immediately about
road accidents by the victims involved or by people who have noticed a crash. Due to
this, the police stations are themselves not aware of a crash that has taken place. It has
been noted that the difference between the time of accident and the time of reporting to
the police can be as high as 12 to 24 hours. Due to the late notifications, the police is also
unable to inform JPRI researchers about crashes as soon as they happen.
2. Lack of crash scene evidence and/or vehicles not available for inspection.
The above problem of late or no notifications also gives rise to the non-availability of the
involved vehicles for inspection or the lack of any identifiable scene evidence at the
crash scene. The crashes that are notified late to JPRI researchers have very little
information available while performing on-scene investigation and these crashes are not
considered for in-depth analysis by JPRI researchers as they have too many unknowns.
To improve crash notification, JPRI researchers are constantly engaging the local police and
ambulance services and encouraging them to call JPRI researchers as soon as they are aware of
a road accident. With faster crash notification from police and ambulance services, more
number of cases can be considered for in-depth analysis.
Why are “dropped” accidents important?
Having access to all accidents, including those that do not result in injury or serious damage, is
important because a full and accurate reporting of crash data:
1. Gives a more realistic indication of the number of accidents actually happening on rural
highways.
2. Gives an indication that not all accidents result in fatalities or serious injuries; even
minor or non-injury accidents should be addressed.
3. Allows analysts to determine which safety systems work well, and which do not work as
desired, in preventing an accident or mitigating injuries.

JP Research India Pvt. Ltd. | Coimbatore Rural Road Accident Study (2012 – 2014) 10
Contributing Factors – A Primer Road traffic accidents are primarily influenced by three main factors:
Human (drivers, riders, vehicle occupants, pedestrians and cyclists)
Vehicle (vehicle design/structure, mass, equipment such as seatbelts or tires, etc.)
Infrastructure/Environment (hereinafter called “infrastructure” and comprising road-
way, signage, conditions affecting visibility, etc.)
Typically, accidents are analyzed for each of the above factors, and the accident is finalized as a
result of a problem with only one of these factors. This type of analysis results in an
overrepresentation of human failures and tends to identify driver errors as the main
contributors to road traffic accidents. Thus, the commonly repeated wisdom – “Driver error is
the cause of over 90% of accidents”.
The problem with this type of analysis is the assumption that the driver initiated the accident
and hence all responsibility lies with him/her. Influencing factors that are vehicle-related and
infrastructure-related are often not accounted for, even though they are an inseparable part of
the whole accident.
The JPRI Approach to Studying an Accident When JPRI researchers examine an accident, they try to determine all the possible contributing
factors (human, vehicle and infrastructure) leading to that accident because each of these
factors can influence an accident independently or in combination (represented by the
overlapping areas in Figure 4). This kind of analysis gives a broader perspective and can help
identify vehicle and infrastructure related solutions that can prevent accidents and mitigate
injuries in spite of human errors.
The Conventional Approach
JPRI Approach
Venn Diagram Analysis
FIGURE 4: APPROACHES FOR ANALYZING ACCIDENT CAUSES
Of course, not all accidents result in serious or fatal injuries, and even for accidents occurring in
similar circumstances, the types and severities of injuries are often not the same. JPRI
researchers have found that two accidents with similar contributing factors leading to the crash
can have very different injury outcomes based on the contributing factors that influence
injuries. This necessitates that accident occurrence be understood separately from the
HUMAN ACCIDENT
HUMAN VEHICLE INFRASTRUCTURE
OR OR
INFRASTRUCTURE VEHICLE

JP Research India Pvt. Ltd. | Coimbatore Rural Road Accident Study (2012 – 2014) 11
resulting injuries. Although injuries are the outcome of an accident, the causal factors for an
accident need not be the same as those for the injuries sustained. Hence, just as an accident is
analyzed for human, vehicle and infrastructure factors that contributed to its occurrence, the
resulting injuries are similarly analyzed for human, vehicle and infrastructure factors that
influenced their occurrence and severity.
Figure 5 is a representation of the JPRI approach to analyzing the factors influencing the
occurrence of an accident as related to, but separate from, the factors influencing the occurrence
of an injury. In the case of this study, the focus was on serious/fatal injuries, but the same
approach is used even when injuries are slight to none.
FIGURE 5: A REPRESENTATION OF THE CONTRIBUTING FACTORS ANALYSIS SEPARATING
INFLUENCES ON ACCIDENTS AND INJURIES
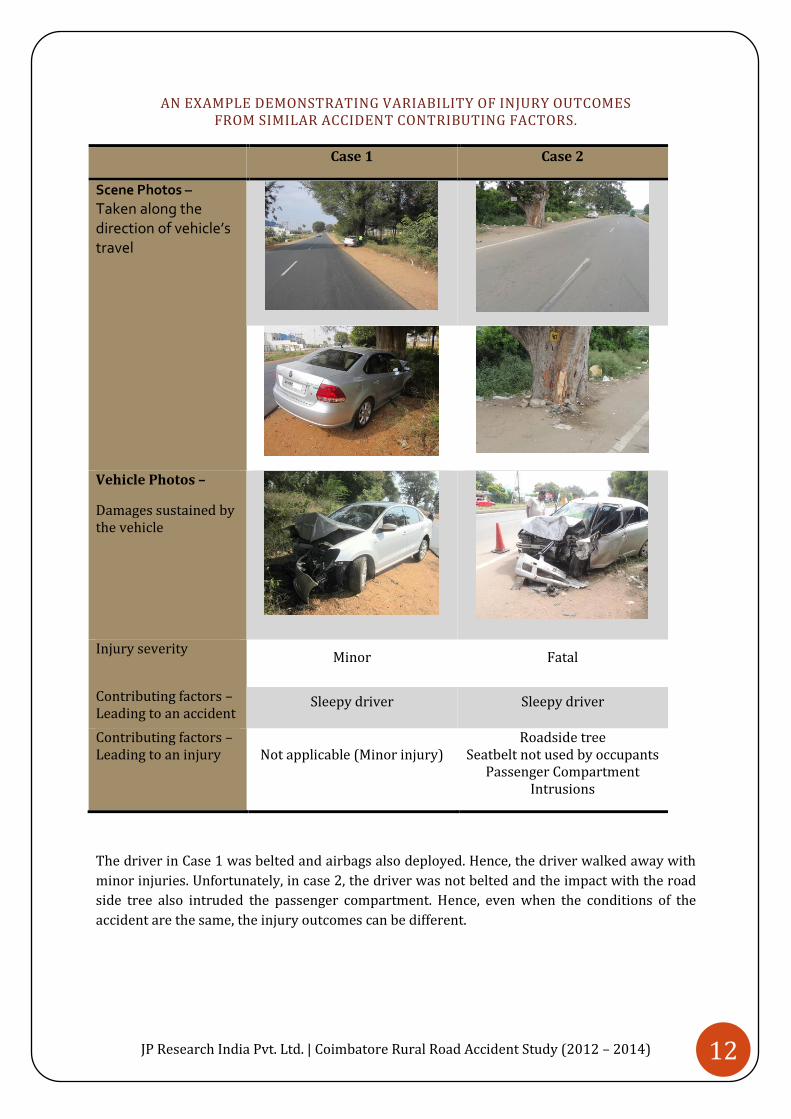
Below are two accident cases that demonstrate the above methodology.
Case 1: A sleepy car driver departs the roadway towards the right hand side of the road and
impacts a tree on the road side. The vehicle has visible damage and is not drivable, but the
driver sustained no injuries. The driver was wearing a seatbelt and the airbags deployed.
Case 2: A sleepy car driver departs the roadway towards the left hand side of the road and
impacts a tree. The vehicle is damaged and not drivable. The driver suffered fatal injuries. The
driver was not wearing a seatbelt.
In both cases, the circumstances leading to the accident are the same; sleeping and departing
the roadway but the injury outcomes are very different. One driver is able to walk away from
the accident, while in the other case, the driver dies.
Contributing Factors
•Factors influencing the accident
Accident
Contributing Factors
•Factors influencing fatal or serious injuries
Injury
JP Research India Pvt. Ltd. | Coimbatore Rural Road Accident Study (2012 – 2014) 12
AN EXAMPLE DEMONSTRATING VARIABILITY OF INJURY OUTCOMES FROM SIMILAR ACCIDENT CONTRIBUTING FACTORS.
Case 1 Case 2
Scene Photos –
Taken along the direction of vehicle’s travel
Vehicle Photos –
Damages sustained by the vehicle
Injury severity
Minor Fatal
Contributing factors – Leading to an accident
Sleepy driver Sleepy driver
Contributing factors –Leading to an injury Not applicable (Minor injury)
Roadside tree Seatbelt not used by occupants
Passenger Compartment Intrusions
The driver in Case 1 was belted and airbags also deployed. Hence, the driver walked away with
minor injuries. Unfortunately, in case 2, the driver was not belted and the impact with the road
side tree also intruded the passenger compartment. Hence, even when the conditions of the
accident are the same, the injury outcomes can be different.

JP Research India Pvt. Ltd. | Coimbatore Rural Road Accident Study (2012 – 2014) 13
3 DATA ANALYSIS The 568 accidents for which sufficient data were available were analyzed in depth by JPRI to
obtain a preliminary understanding of the characteristics of accidents seen on rural highways
around Coimbatore.
Distribution of Accidents by Highest Injury Severity The distribution of the 568 road accidents by injury severity (based on the most severe injury
sustained by any human involved in each accident) is shown in Figure 6. As can be seen, 80% of
accidents analyzed for the study (452 by count) resulted in fatal or serious injury to at least one
occupant or pedestrian.
FIGURE 6: PERCENTAGE DISTRIBUTION OF THE 568 ACCIDENTS BY HIGHEST INJURY SEVERITY
Injury Severity Definitions
The following are the definitions used to classify accidents based on injury.
Fatal Injury: An accident involving at least one fatality. Any victim who dies within 30 days of
the accident as a result of the injuries due to the accident is counted as a fatality.
Serious Injury: An accident with no fatalities, but with at least one or more victims hospitalized
for more than 24 hours.
Minor Injury: An accident in which victims suffer minor injuries which are treated on-scene
(first aid) or in a hospital as an outpatient.
No Injury: An accident in which no injuries are sustained by any of the involved persons.
Usually only vehicle damage occurs as a result of the accident.
Fatal 33%
Serious 47%
Minor 13%
No Injury 7%

JP Research India Pvt. Ltd. | Coimbatore Rural Road Accident Study (2012 – 2014) 14
Distribution of Accidents by Time of Occurrence The 568 accidents used for the contributing factors study were plotted against time durations of
3 hours (Figure 7) to identify times when accidents occur. The data shows highest percentage of
accidents (68%) occurred during the time period of 09:00 to 20:59 hours. The highest
percentage of accidents resulting in fatal/serious injury occurred during the afternoon-to-early-
evening commute time period of 15:00 to 17:59 hours (21%), followed closely by the forenoon
periods of 09:00 to 11:59 hours (19%) and the evening to night periods of 18:00 to 20:59 hours
(19%). As might be expected, the fewest accidents and injuries occurred during the low-traffic
volume hours between midnight and early morning, 00:00 to 05:59 hours.
FIGURE 7: PERCENTAGE DISTRIBUTION OF ACCIDENTS BY TIME OF OCCURRENCE
Please note that in the above figure and the next figure, “Fatal/Serious Accidents” refers to crash
counts and not the numbers of injury victims or vehicles involved.
Distribution of Accidents by Day of Week As shown in Figure 8, although accidents are well distributed over all days of the week, Fridays
and Saturdays show lower percentages, possibly due to reduction in traffic volume.
FIGURE 8: PERCENTAGE DISTRIBUTION OF ACCIDENTS BY DAY OF WEEK
Mondays and Wednesdays show the highest percentage of accidents in general and of
fatal/serious accidents, but overall the distribution stays fairly constant Sunday through
Thursday. If the highest percentage of fatal/serious crashes in any 3-hour period occurs
between 15:00 and 17:59 hours on Mondays, for example, but not on Wednesdays, the data may
suggest links besides commute traffic volume. Further study of the data might be warranted to
look for more informative patterns.
5 4
12 15 15
22 16
11
3 4
11
19 14
21 19
9
0
50
00:00 -02:59
03:00 -05:59
06:00 -08:59
09:00 -11:59
12:00 -14:59
15:00 -17:59
18:00 -20:59
21:00 -23:59
Pe
rce
nta
ge
(%
)
3hour time slots
All accidents Fatal/Serious accidents
17 16 17 16 11 9
14 17 15 17 15
10 10
16
0
50
Monday Tuesday Wednesday Thursday Friday Saturday Sunday
Pe
rce
nta
ge
(%
)
Day of week
All accidents Fatal/Serious accidents

JP Research India Pvt. Ltd. | Coimbatore Rural Road Accident Study (2012 – 2014) 15
Vehicles/Road Users Involved A total of 1,108 vehicles/road users (1,024 vehicles and 84 pedestrians) were involved in the
568 accidents analyzed. Figure 9 shows the percentage distribution of the types of
vehicles/road users involved in these accidents. Please note that the figure is based on a count
of the vehicles and pedestrians involved in all the 568 accidents and not the number of
occupants or accidents. In the case of pedestrians, each pedestrian is a single count. Findings
show that the type of vehicles/road users most often involved in accidents on the highways
were motorized two-wheelers, or “M2Ws” (32%), followed by cars (27%) and trucks (22%).
FIGURE 9: PERCENTAGE DISTRIBUTION OF VEHICLE/ROAD USER TYPE INVOLVED (N=1,108)
Vehicles/Road Users Affected in Crashes with Fatal or Serious Injury Figure 10 shows the percentage distribution of vehicles/road users directly associated with a
fatality or a serious injury due to the crash. Please note that percentages given for the road
users reflect a count of vehicles with at least one fatal victim or serious injury victim. Only in the
case of pedestrians does the percentage reflect the number of persons counted.
As can be seen, the vehicles with the highest share of fatalities or serious injuries to occupants
are M2Ws. M2Ws constitute 63% of vehicles which had at least one fatal occupant, and 52% of
vehicles which had at least one seriously injured occupant. Pedestrians account for only 8% of
the 1,108 road users involved in the 568 accidents analyzed for this study (see Figure 9);
however, Figure 10 shows that they account for 16% of road users in fatal and 13% of road
users in serious injury accidents.
FIGURE 10: PERCENTAGE DISTRIBUTION OF VEHICLE/ROAD USER TYPES IN CRASHES WITH AT LEAST ONE FATALITY OR SERIOUS INJURY VICTIM
(FATAL =186 ROAD USERS; SERIOUS = 314 ROAD USERS)
32 27
22
8 8 2 1
0
50
M2W Car Truck Bus Pedestrian M3W Bicycle
Pe
rce
nta
ge
(%
)
Vehicle / Road User Type
63
16 14 2.5 2.5 1 0 1
52
13 19
9.0 1 2.5 2.5 1
0
100
M2W Pedestrian Car Truck M3W Bus Bicyclist Other
Pe
rce
nta
ge
(%
)
Road user type
Fatal Serious
JP Research India Pvt. Ltd. | Coimbatore Rural Road Accident Study (2012 – 2014) 16
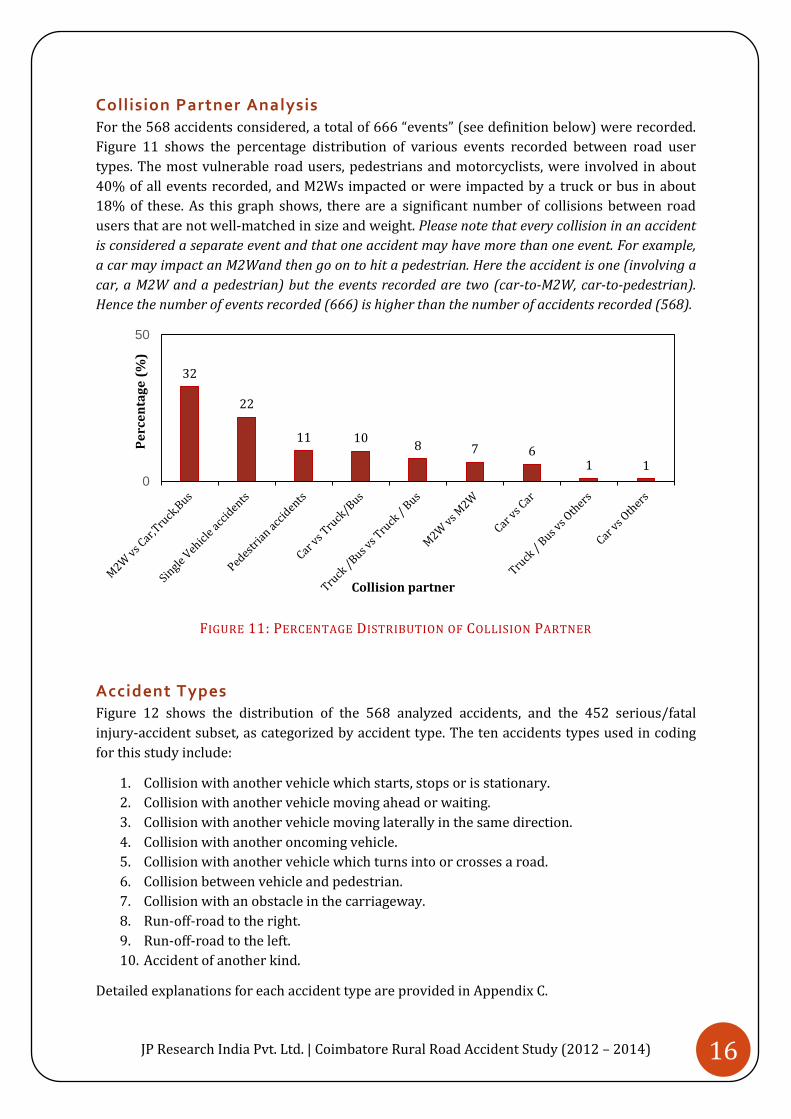
Collision Partner Analysis For the 568 accidents considered, a total of 666 “events” (see definition below) were recorded.
Figure 11 shows the percentage distribution of various events recorded between road user
types. The most vulnerable road users, pedestrians and motorcyclists, were involved in about
40% of all events recorded, and M2Ws impacted or were impacted by a truck or bus in about
18% of these. As this graph shows, there are a significant number of collisions between road
users that are not well-matched in size and weight. Please note that every collision in an accident
is considered a separate event and that one accident may have more than one event. For example,
a car may impact an M2Wand then go on to hit a pedestrian. Here the accident is one (involving a
car, a M2W and a pedestrian) but the events recorded are two (car-to-M2W, car-to-pedestrian).
Hence the number of events recorded (666) is higher than the number of accidents recorded (568).
FIGURE 11: PERCENTAGE DISTRIBUTION OF COLLISION PARTNER
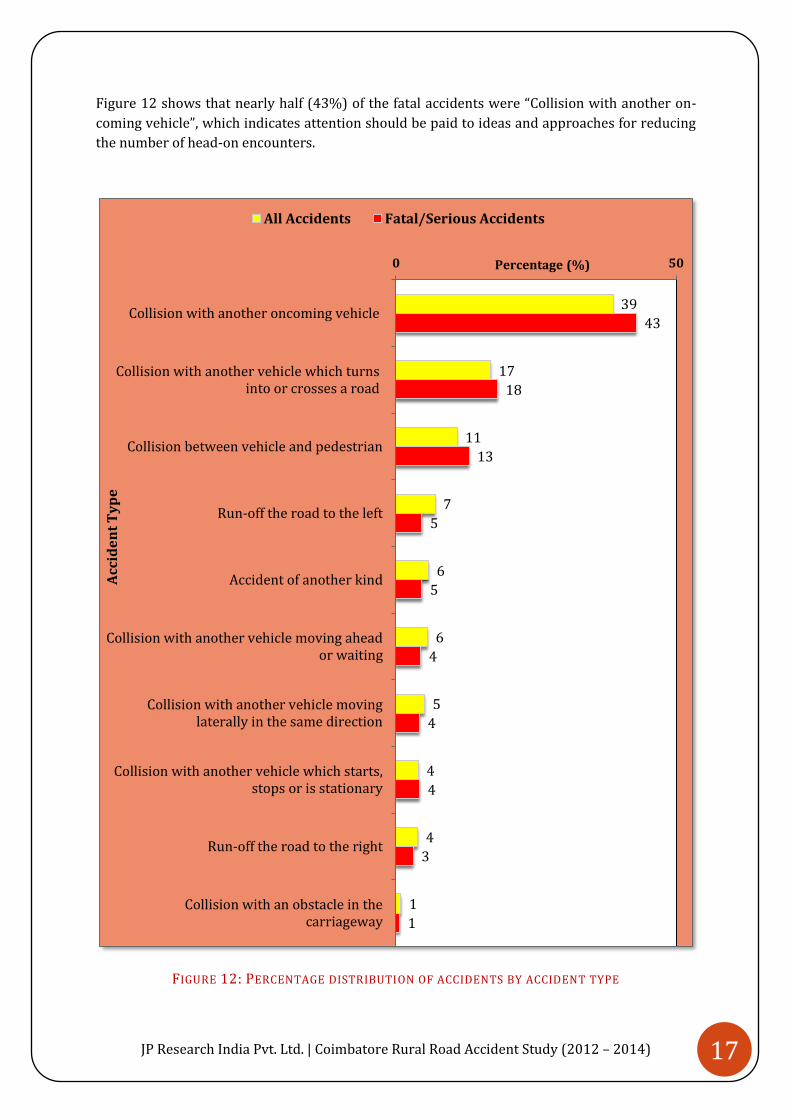
Accident Types Figure 12 shows the distribution of the 568 analyzed accidents, and the 452 serious/fatal
injury-accident subset, as categorized by accident type. The ten accidents types used in coding
for this study include:
1. Collision with another vehicle which starts, stops or is stationary.
2. Collision with another vehicle moving ahead or waiting.
3. Collision with another vehicle moving laterally in the same direction.
4. Collision with another oncoming vehicle.
5. Collision with another vehicle which turns into or crosses a road.
6. Collision between vehicle and pedestrian.
7. Collision with an obstacle in the carriageway.
8. Run-off-road to the right.
9. Run-off-road to the left.
10. Accident of another kind.
Detailed explanations for each accident type are provided in Appendix C.
32
22
11 10 8 7 6
1 1 0
50
Pe
rce
nta
ge
(%
)
Collision partner
JP Research India Pvt. Ltd. | Coimbatore Rural Road Accident Study (2012 – 2014) 17
Figure 12 shows that nearly half (43%) of the fatal accidents were “Collision with another on-
coming vehicle”, which indicates attention should be paid to ideas and approaches for reducing
the number of head-on encounters.
FIGURE 12: PERCENTAGE DISTRIBUTION OF ACCIDENTS BY ACCIDENT TYPE
39
17
11
7
6
6
5
4
4
1
43
18
13
5
5
4
4
4
3
1
0 50
Collision with another oncoming vehicle
Collision with another vehicle which turnsinto or crosses a road
Collision between vehicle and pedestrian
Run-off the road to the left
Accident of another kind
Collision with another vehicle moving aheador waiting
Collision with another vehicle movinglaterally in the same direction
Collision with another vehicle which starts,stops or is stationary
Run-off the road to the right
Collision with an obstacle in thecarriageway
Percentage (%)
Acc
ide
nt
Ty
pe
All Accidents Fatal/Serious Accidents

JP Research India Pvt. Ltd. | Coimbatore Rural Road Accident Study (2012 – 2014) 18
4 CONTRIBUTING FACTORS ANALYSIS As described in Section 2, every accident and injury is caused by one or more human, vehicle, or
infrastructure factors that contributed either singly or in combination to the crash itself and,
sometimes quite separately, to the injury outcome. To determine the contributing factors
influencing the occurrence of each accident, 568 accidents were analyzed in detail. In addition,
the contributing factors influencing the occurrence of serious or fatal injury in 452 of these
accidents were also analyzed in detail.
Analysing Accident and Injury Causation
Factors Contributing to Accident Causation (568 Accidents)
A distribution by contributing factors (human/vehicle/infrastructure) for the 568 accidents
analyzed over the study period of October 2012 - October 2014 is shown in Figure 13. This Venn
diagram of the study findings shows that human and infrastructure factors in combination
(66%) had the highest influence on the occurrence of accidents, followed by human factors
alone (23%).
FIGURE 13: DISTRIBUTION OF 568 ACCIDENTS BY CONTRIBUTING FACTORS INFLUENCING THE
OCCURRENCE OF THE ACCIDENT
The influences of each factor in the occurrence of accidents were found to be:
Contributing Factor All Combinations Alone
Human 97% 23%
Vehicle 8% Less than 1%
Infrastructure 75% 3%

JP Research India Pvt. Ltd. | Coimbatore Rural Road Accident Study (2012 – 2014) 19
Factors Contributing to Injury Causation (452 Fatal/Serious Injury Accidents)
Of the 568 accidents analyzed, 452 accidents involved at least one fatal/serious injury to an
occupant or pedestrian. The distribution by injury-contributing factors for those 452 accidents
is shown in Figure 14. This diagram shows that human and vehicle factors in combination (64%)
had the greatest influence on an injury outcome, followed by vehicle factors alone (19%) and
human factors alone (11%). Infrastructure factors alone showed the lowest contribution to
injury causation, both alone and in combination with other factors.
FIGURE 14: DISTRIBUTION OF 452 ACCIDENTS BY CONTRIBUTING FACTORS INFLUENCING THE
OCCURRENCE OF SERIOUS/FATAL INJURY
The influences of each factor in the occurrence of injury were found to be:
Contributing Factor All Combinations Alone
Human 80% 11%
Vehicle 85% 19%
Infrastructure 6% 1%

JP Research India Pvt. Ltd. | Coimbatore Rural Road Accident Study (2012 – 2014) 20
Contributing Factors: ACCIDENTS
HUMAN Factors Contributing to Accident Causation
For the 568 accidents analyzed, the following are the contributing human factors determined to
have influenced the occurrence of an accident. The table shows both the number and the
percentage of accidents influenced by each factor. Please note that more than one factor can
influence an accident; hence, the sum of percentage influence may not be equal to sum of human
factors influencing accidents (97%).
TABLE 1: CONTRIBUTING HUMAN FACTORS INFLUENCING THE OCCURRENCE OF 568 ACCIDENTS
Contributing Human Factors (Accident Occurrence)
Number of Accidents
% Influenced
Overtaking on undivided road
(58 Cars, 55 M2Ws, 21 Trucks, 11 Buses) 158 28%
Speeding - Excessive speed for conditions
(34 Cars, 19 M2Ws, 11 Trucks, 6 Buses, 4 Minitrucks) 77 14%
Speeding - Speed limit unknown
(28 Cars, 25 M2Ws, 10 Trucks, 4 Buses, 4 M3Ws) 75 13%
Turning suddenly or without indication
(32 M2Ws, 11 Cars, 10 Trucks, 4 Buses) 61 11%
Driving under the influence of alcohol
(25 M2Ws, 6 Cars, 6 Trucks, 1 M3W, 1 Bicycle) 40 7%
Following too closely
(17 M2Ws, 11 Cars, 7 Trucks, 4 Buses) 40 7%
Driver Sleep/Fatigue/Drowsiness 36 6%
Improper lane change/lane usage 28 5%
Pedestrian - Dangerous behaviour on roadway 26 5%
From Table 1 it can be seen that overtaking and excessive speed are the primary driver factors
influencing crash occurrence. These factors contributed to more than half (55%) of the
accidents analyzed for this study.
The human factors with the greatest influence, as identified in Table 1, are described in brief in
the following paragraphs, and information is provided on existing solutions to counter these
human errors.
Please note that the solutions identified here are merely suggestions. JPRI researchers are not
experts in road engineering, vehicle design, driving regulation or enforcement. But the company is
aware of solutions that have been implemented in other parts of the world and are already
available; these are outlined here. What might actually work best for any specific situation is a
decision to be made by government engineers and agencies based on the types of problems being
seen, existing program and design constraints and cost effectiveness.
JP Research India Pvt. Ltd. | Coimbatore Rural Road Accident Study (2012 – 2014) 21
1. Overtaking on Undivided Roads: 28% (58 Cars, 55 M2W s, 21 Trucks, 11 Buses)
Overtaking contributed to 28% of total accidents
analyzed (158 of 568 crashes). While, by strict
counts, car drivers and M2W riders were most
frequently involved in crashes due to misjudging
this maneuver, a relatively large number of
heavy vehicles (trucks and buses) were also
involved.
This problem is usually associated when the
speeds of all vehicles travelling on a road are not
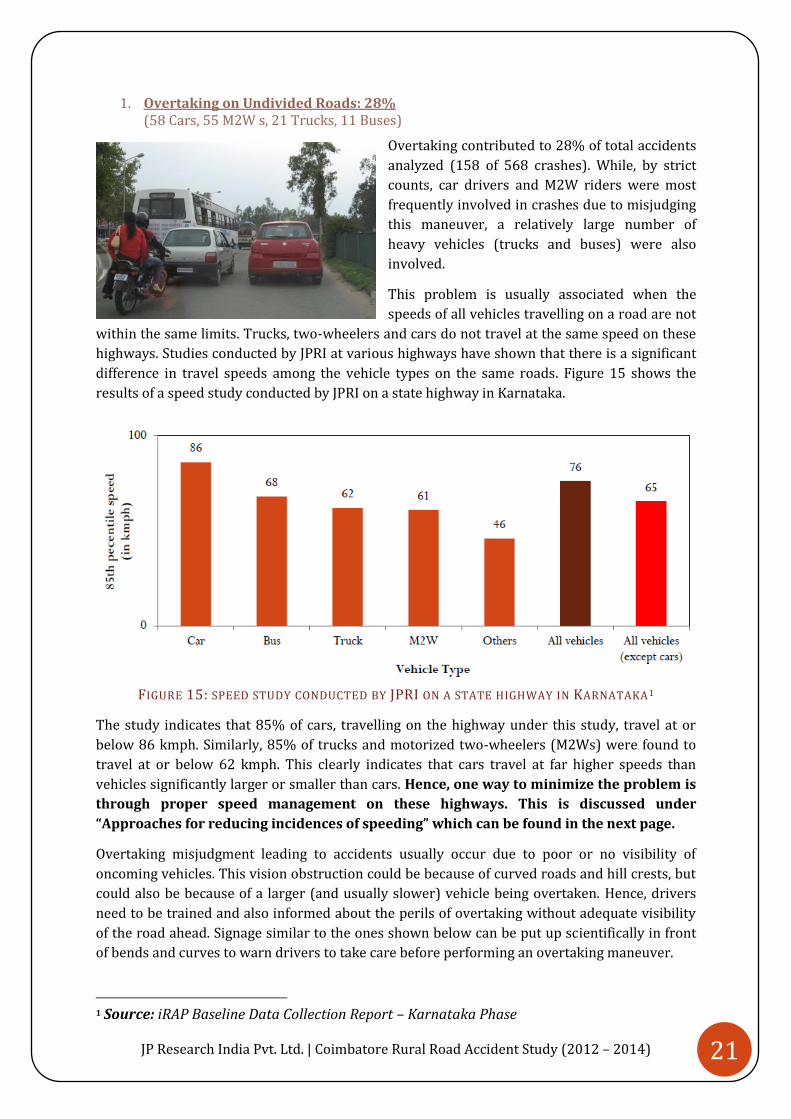
within the same limits. Trucks, two-wheelers and cars do not travel at the same speed on these
highways. Studies conducted by JPRI at various highways have shown that there is a significant
difference in travel speeds among the vehicle types on the same roads. Figure 15 shows the
results of a speed study conducted by JPRI on a state highway in Karnataka.
FIGURE 15: SPEED STUDY CONDUCTED BY JPRI ON A STATE HIGHWAY IN KARNATAKA1
The study indicates that 85% of cars, travelling on the highway under this study, travel at or
below 86 kmph. Similarly, 85% of trucks and motorized two-wheelers (M2Ws) were found to
travel at or below 62 kmph. This clearly indicates that cars travel at far higher speeds than
vehicles significantly larger or smaller than cars. Hence, one way to minimize the problem is
through proper speed management on these highways. This is discussed under
“Approaches for reducing incidences of speeding” which can be found in the next page.
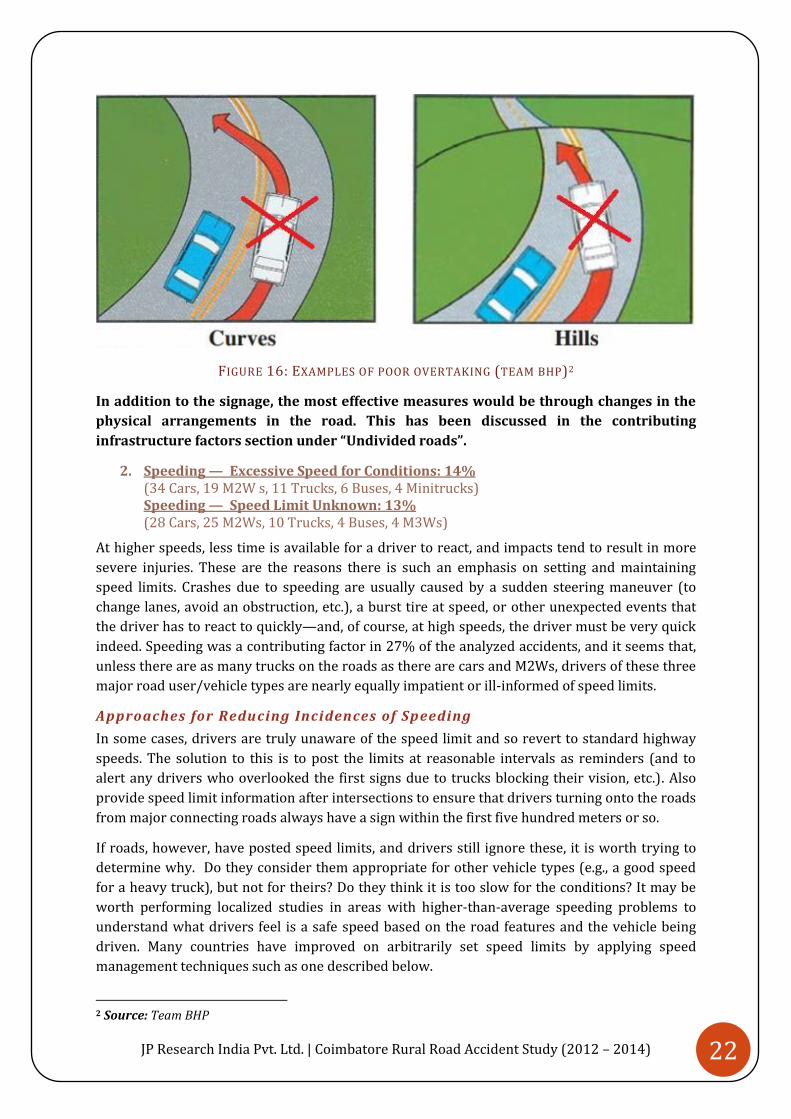
Overtaking misjudgment leading to accidents usually occur due to poor or no visibility of
oncoming vehicles. This vision obstruction could be because of curved roads and hill crests, but
could also be because of a larger (and usually slower) vehicle being overtaken. Hence, drivers
need to be trained and also informed about the perils of overtaking without adequate visibility
of the road ahead. Signage similar to the ones shown below can be put up scientifically in front
of bends and curves to warn drivers to take care before performing an overtaking maneuver.
1 Source: iRAP Baseline Data Collection Report – Karnataka Phase
JP Research India Pvt. Ltd. | Coimbatore Rural Road Accident Study (2012 – 2014) 22
FIGURE 16: EXAMPLES OF POOR OVERTAKING (TEAM BHP)2
In addition to the signage, the most effective measures would be through changes in the
physical arrangements in the road. This has been discussed in the contributing
infrastructure factors section under “Undivided roads”.
2. Speeding — Excessive Speed for Conditions: 14% (34 Cars, 19 M2W s, 11 Trucks, 6 Buses, 4 Minitrucks) Speeding — Speed Limit Unknown: 13% (28 Cars, 25 M2Ws, 10 Trucks, 4 Buses, 4 M3Ws)
At higher speeds, less time is available for a driver to react, and impacts tend to result in more
severe injuries. These are the reasons there is such an emphasis on setting and maintaining
speed limits. Crashes due to speeding are usually caused by a sudden steering maneuver (to
change lanes, avoid an obstruction, etc.), a burst tire at speed, or other unexpected events that
the driver has to react to quickly—and, of course, at high speeds, the driver must be very quick
indeed. Speeding was a contributing factor in 27% of the analyzed accidents, and it seems that,
unless there are as many trucks on the roads as there are cars and M2Ws, drivers of these three
major road user/vehicle types are nearly equally impatient or ill-informed of speed limits.
Approaches for Reducing Incidences of Speeding
In some cases, drivers are truly unaware of the speed limit and so revert to standard highway
speeds. The solution to this is to post the limits at reasonable intervals as reminders (and to
alert any drivers who overlooked the first signs due to trucks blocking their vision, etc.). Also
provide speed limit information after intersections to ensure that drivers turning onto the roads
from major connecting roads always have a sign within the first five hundred meters or so.
If roads, however, have posted speed limits, and drivers still ignore these, it is worth trying to
determine why. Do they consider them appropriate for other vehicle types (e.g., a good speed
for a heavy truck), but not for theirs? Do they think it is too slow for the conditions? It may be
worth performing localized studies in areas with higher-than-average speeding problems to
understand what drivers feel is a safe speed based on the road features and the vehicle being
driven. Many countries have improved on arbitrarily set speed limits by applying speed
management techniques such as one described below.
2 Source: Team BHP

JP Research India Pvt. Ltd. | Coimbatore Rural Road Accident Study (2012 – 2014) 23
Step 1: Collect Speed Data — Identify whether the posted speed limits are acceptable to the
traffic by conducting traffic speed studies. These identify speeds being driven by various vehicle
types (cars, trucks, buses, mini trucks, etc.) for a sample stretch and time period. Then
determine the 85th percentile speed (the speed below which 85% of the sample vehicle
population is travelling on a stretch of road).
Step 2: Set New Speed Limits — Using the speed data, road engineers can plan for reliable and
safe speed limits on various sections of the roadways in Coimbatore. The speeds can differ by
vehicle type (lower for trucks, etc.) or by the lane of travel.
Step 3: Inform Drivers of the New Speeds — Changes in speed limits need to be effectively
communicated to the habitual road users. Drivers need to be alerted to the new posted speed
limit by additional signs that warn of a change. Communication of changes can be enhanced
through road markings and traffic calming measures, if these are appropriate, so that the road
environment itself would influence the driver to follow a safe speed limit.
Step 4: Enforce — Good speed enforcement is the final alternative to control driver speeds.
3. Turning Suddenly without Indication: 11% (32 M2Ws, 11 Cars, 10 Trucks, 4 Buses) Improper Lane Change/Lane Usage: 5%
These related contributing factors describe the case of a driver either moving diagonally across
lanes (rather than moving through one after another in an orderly progression) or failing to
indicate intention to other drivers before changing lanes, catching other drivers by surprise.
What can be done to keep drivers in their proper lanes or convince them to use indicators?
Use of indicators to communicate to other drivers about the intention to turn or change lanes is
important and must be encouraged for safe driving. Proper lane discipline can be enforced
through educating drivers to use the left most (slow) lane in all possible conditions unless they
need to overtake. The right most lane (fast) lane should be used only as an overtaking lane.
Vehicle Engineering: Lane Departure Warning Systems
Because using indicators and observing lane
discipline is essential for the safety of all
vehicle occupants and other road users,
some of vehicles are equipped with driver
alert systems designed to warn a driver
when the vehicle begins to move out of its
lane without a proper turn signal. The
Mercedes Active Lane Keeping Assist, for
example, has a camera that “watches” the
markings on the pavement as you drive. If it senses that you're drifting out of your lane, it
vibrates the steering wheel and … can apply the brakes on one side of the vehicle, to help guide
you back into your own lane”.
Such systems have the added advantage of training drivers to use their indicators (to avoid the
constant warnings).

JP Research India Pvt. Ltd. | Coimbatore Rural Road Accident Study (2012 – 2014) 24
4. Driver Under Influence of Alcohol: 7% (25 M2Ws, 6 Cars, 6 Trucks, 1 M3W, 1 Bicycle)
In the study data for Coimbatore, drunk driving contributed to 7% of the accidents analyzed,
and significantly, all 27 riders (of M2Ws, an M3W, and a bicycle) suffered serious/fatal injuries.
Unfortunately, alcohol usage while driving was often not recorded properly by authorities, so
the figures could be even higher.
It is avoidable!
While in theory drunk driving accidents and resulting injuries are completely avoidable, in fact
it is very difficult to prevent people from driving while under the influence of drugs or alcohol.
Impaired driving is a problem that most countries struggle with. As Figure 17 shows, in
Coimbatore, there is no shortage of TASMAC3 liquor shops and bars on or near highways,
confirming that access to alcohol while driving is easy and suggesting that the solution to the
problem will not be.
FIGURE 17: COIMBATORE MAP SHOWING LIQUOR SHOPS (BLACK DOTS)
ON/NEAR HIGHWAYS (BROAD RED LINES). (COURTESY: GOOGLE MAPS)
One way of combating the problem is with education and public service messages that attempt
to change perceptions of what is socially acceptable, inform about how drinking affects reflexes
and judgment, and show the consequences in terms of destroyed lives. However, such
campaigns will reach only the receptive few and, unless well supported by public opinion, will
largely fail.
Another approach is strict enforcement, which often includes jail time and revoking licenses for
drunk driving convictions. That sounds impressive, but if not in jail, those with revoked licenses
can still physically drive—just not legally. Some jurisdictions set up “sobriety checkpoints” in
areas that typically see a lot of drunk driving accidents. If timed well, such sweeps can result in
3 “TASMAC” is Tamil Nadu State Marketing Corporation, a company owned and run by the government of Tamil Nadu to sell alcoholic beverages in the state.

JP Research India Pvt. Ltd. | Coimbatore Rural Road Accident Study (2012 – 2014) 25
taking a lot of drunk drivers off the road, at least for the night. And perhaps the fear of a repeat
arrest will keep some of those drivers off that particular stretch of road if they have been
drinking. However, unless there are random stops in random places nearly every day, the
problem will continue.
Vehicle Engineering: Ignition Interlock Systems
It will likely take the combined efforts of government and the
public to significantly reduce the number of fatalities due to this
factor. Technology does, however, often a solution of sorts.
Various breathalyzer-type systems can be attached to or built
into vehicles. The driver must be able to “pass” the breath test in
order for the car to be started, and thereafter the device can
prompt the driver to submit to further tests which, while they
would not stop the vehicle, would at least record the violations.
This solution is expensive, and still evolving.

JP Research India Pvt. Ltd. | Coimbatore Rural Road Accident Study (2012 – 2014) 26
VEHICLE Factors Contributing to Accident Causation
For the 568 accidents analyzed, the following are the contributing vehicle factors determined to
have influenced the occurrence of an accident. Table 2 shows both the number and the
percentage of accidents influenced by each factor. Please note that more than one factor can
influence an accident; hence, the sum of percentage influence may not be equal to sum of vehicle
factors influencing accidents (8%).
TABLE 2: CONTRIBUTING VEHICLE FACTORS INFLUENCING THE OCCURRENCE OF 568 ACCIDENTS
Contributing Vehicle Factors (Accident Occurrence) Number of Accidents
% Influenced
Tire Burst (6 Cars, 4 Trucks, 2 M2Ws,1 Minitruck)
13 2%
Absence of Reflectors (5 Trucks, 3 Buses)
8 1%
Overloaded – People (3 M2Ws, 2 Cars, 1 Truck, 1 Bus)
7 1%
Overloaded – Goods (5 Trucks)
5 1%
Goods not secured properly (3 Trucks)
3 1%
The vehicle factors with the greatest influence, as identified in Table 2, are described in brief in
the following paragraphs, and information is provided on existing solutions to counter these
factors. Please note that the solutions identified here are merely suggestions. JPRI researchers are
not experts in road engineering, vehicle design, driving regulation or enforcement. But the
company is aware of solutions that have been implemented in other parts of the world and are
already available; these are outlined here. What might actually work best for any specific situation
is a decision to be made by government vehicle engineers and agencies based on the types of
problems being seen, existing program and design constraints and cost effectiveness.
1. Tire Burst: 2%
(6 Cars, 4 Trucks, 2 M2Ws, 1 Minitruck)
Tire defects seen in the course of this study were associated with vehicles running at high
speeds or due to poor maintenance of tires. While definitive investigation of tire bursts and
defects requires detailed tire investigation, analysis and testing (which is outside of the scope of
this study), researchers were able to confidently identify 13 accidents where a tire burst was a
contributing factor.
While performing investigations for various accident studies, researchers have come across
numerous accidents where drivers have claimed that a tire burst caused the vehicle to lose
control and meet with an accident. JPRI researchers are trained to examine the scene and
differentiate tire bursts from tire damage caused by crash-involved impacts with objects such as
curb stones, barriers, gutters, etc. Thus, researchers were able to identify a number of accidents
in the current study where a tire burst had occurred, leading to an accident, and to separate
these cases from those where tire damage had occurred as a result of the accident.

JP Research India Pvt. Ltd. | Coimbatore Rural Road Accident Study (2012 – 2014) 27
Solution? Start with a good look at the tire.
A review of the general condition of the burst tire and remaining tires (e.g., tread depth very
low, incorrect inflation pressure) can often help identify specific problems that may have led to
tire failure. Generally, though, the problem is either one of failure by the vehicle’s owner to
follow good maintenance practices (e.g., protection from heat and direct sun, replacement when
old/cracked or worn) or the unlucky instance of a tire encountering something dangerous on
the road. In the former case, perhaps a policy of citations for unsafe equipment would focus
public attention and put financial pressure on commercial vehicles that operate unsafely.
2. Absence of Reflectors: 1% (5 Trucks, 3 Buses)
This problem is a basic visibility issue and would be an inexpensive fix for the truck owners and
drivers. As all of the examples we found were on commercial vehicles, perhaps this could be
something police inspected for during licensing, at random checkpoints, weigh stations (fixed or
moveable scales), bridges, and toll booths. Figures show the trucks without reflective stickers at
the rear and the truck with reflective stickers.
3. Overloaded – People: 1% (3 M2Ws, 2 Cars, 1 Truck, 1 Bus)
This problem leads to the same instability and vehicle strain issues (tires and suspensions) seen
in trucks overloaded with goods, but with the added problem of increasing driver distraction
and reducing the driver’s options for quick response in unexpected circumstances. Although
overloading was not seen as a specific contributing factor in the injury cases analyzed for this
study, it does also increase the chances for injury (in cars, there would not be enough seatbelts,
for instance, if there are more occupants than a vehicle was designed to carry, and on M2Ws, the
options for protecting oneself in any way in a crash scenario diminish).
Solutions to overloading vehicles with human cargo are not simple. Buses may be ticketed for
exceeding occupancy, and cars and M2Ws may be stopped and warned, but overall, this is
probably best addressed through public information campaigns, and change will come slowly.
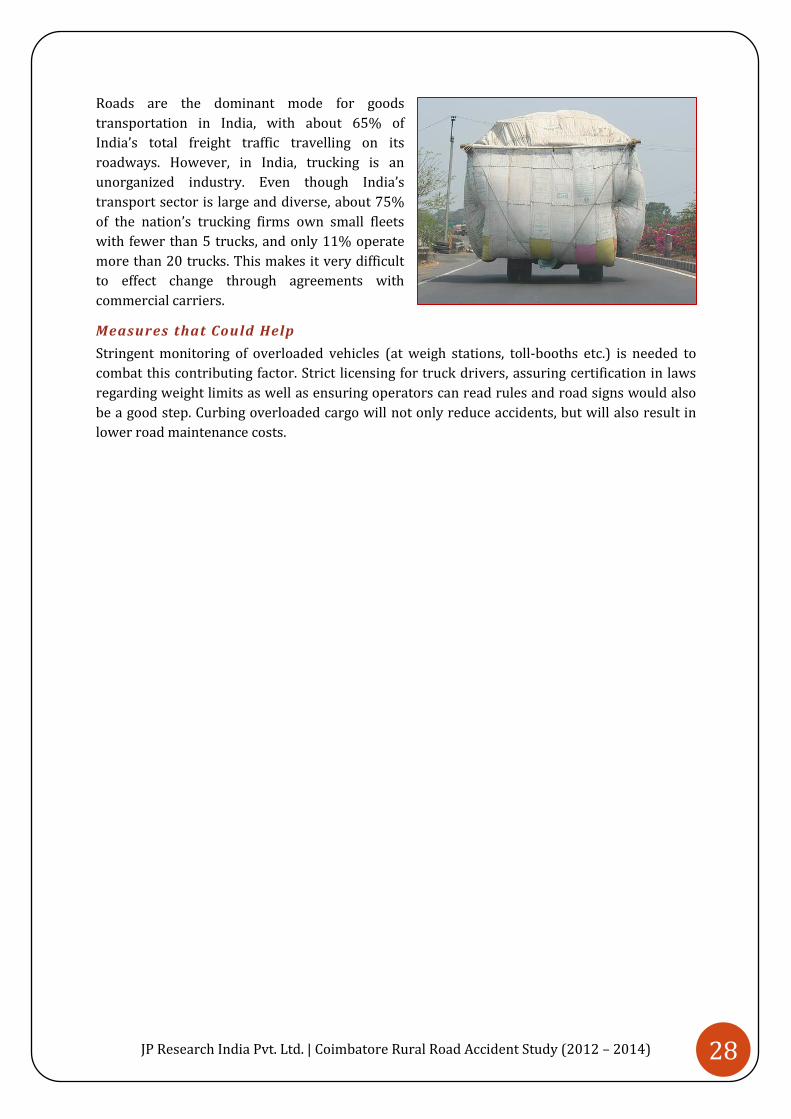
4. Overloaded – Goods: 1% (5 Trucks) Goods Not Secured Properly: 1% (3 Trucks)
Without reflectors With reflectors
JP Research India Pvt. Ltd. | Coimbatore Rural Road Accident Study (2012 – 2014) 28
Roads are the dominant mode for goods
transportation in India, with about 65% of
India’s total freight traffic travelling on its
roadways. However, in India, trucking is an
unorganized industry. Even though India’s
transport sector is large and diverse, about 75%
of the nation’s trucking firms own small fleets
with fewer than 5 trucks, and only 11% operate
more than 20 trucks. This makes it very difficult
to effect change through agreements with
commercial carriers.
Measures that Could Help
Stringent monitoring of overloaded vehicles (at weigh stations, toll-booths etc.) is needed to
combat this contributing factor. Strict licensing for truck drivers, assuring certification in laws
regarding weight limits as well as ensuring operators can read rules and road signs would also
be a good step. Curbing overloaded cargo will not only reduce accidents, but will also result in
lower road maintenance costs.

JP Research India Pvt. Ltd. | Coimbatore Rural Road Accident Study (2012 – 2014) 29
INFRASTRUCTURE Factors Contributing to Accident Causation
For the 568 accidents analyzed, the following are the contributing infrastructure factors
determined to have influenced the occurrence of an accident. Table 3 shows both the number
and the percentage of accidents influenced by each factor. Please note that more than one factor
can influence an accident; hence, the sum of percentage influence may not be equal to sum of
infrastructure factors influencing accidents (75%).
TABLE 3: CONTRIBUTING INFRASTRUCTURE FACTORS INFLUENCING THE OCCURRENCE OF 568 ACCIDENTS
Contributing Infrastructure Factors (Accident Occurrence)
Number of Accidents
% Influenced
Undivided road (58 Cars, 52 M2Ws, 41 Trucks, 20 Buses)
184 32%
Intersection (37 M2Ws, 11 Cars, 11 Buses,11 Trucks)
68 12%
Poor road marking/signage (13 Cars, 11 M2Ws, 4 Trucks, 1 Bus)
29 5%
Sharply curved road (10 Cars, 7 M2Ws, 4 Trucks, 4 Buses)
25 4%
Poor pedestrian infrastructure – Crossing 22 4%
Poor pedestrian infrastructure – Walking alongside 21 4%
Work zone 20 4%
Poor street lighting 19 3%
Defective road surface 12 2%
Others 20 4%
From Table 3 it can be seen that undivided roads and intersections are the primary
infrastructure factors influencing crashes. Just these two contributed to almost half (44%) of the
accidents analyzed for this study.
The infrastructure factors with the greatest influence, as identified in Table 3, are described in
brief in the following paragraphs, and information is provided on existing solutions to counter
these factors.
Please note that the solutions identified here are merely suggestions. JPRI researchers are not
experts in road engineering, vehicle design, driving regulation or enforcement. But the company is
aware of solutions that have been implemented in other parts of the world and are already
available; these are outlined here. What might actually work best for any specific situation is a
decision to be made by government engineers and agencies based on the types of problems being
seen, existing infrastructure design constraints and cost effectiveness.

JP Research India Pvt. Ltd. | Coimbatore Rural Road Accident Study (2012 – 2014) 30
1. Undivided Roads: 32%
(58 Cars, 52 M2Ws, 41 Trucks, 20 Buses)
Roads that are not separated by a median in between opposing lanes are called “undivided
roads”, and such roads contributed to 32% of total accidents analyzed for this study. Major
stretches of roads in Coimbatore, including highways (where travelling speed and frequency of
overtaking is higher), are undivided. These include the NH47 By-pass, NH209 and NH67.
Accidents involving overtaking, during which a vehicle enters the opposing traffic lane to
overtake the vehicle travelling/parked in-front of it, are common on undivided roads simply
because there is no barrier/division in place to prevent them. Such accidents often involve
head-on collision, at speed from both directions—a crash type that frequently results in serious
and fatal injuries.
Vehicle movement on an undivided road
(NH47 By-Pass) Vehicle movement on a median-separated road
(NH47)
In contrast, on divided roads, a median prevents or greatly discourages such crossover into oncoming traffic, so overtaking crashes tend to involve side impacts, fender clipping, and other generally smaller-impact crashes due to same-direction maneuvers.
The Obvious Solution: Medians
On busy highways, it is always preferable to have some sort of median in place for additional
safety. Various median designs are available as shown below:
Central hatching in rural areas can be used with rumble strips or pavement markers to
alert drivers when they are leaving their lane. Central hatching can be installed over a
continuous length of road or at specific points - for example, curves in the road.
Median barriers physically separate opposing traffic streams and help stop vehicles
travelling into opposing traffic lanes.
Lane width has an influence on safety, especially at certain key road locations. Vehicles
typically use more of the travel lane on bends than on straight road sections, and head-
Central Hatching Median barriers Passing lanes Dualling
JP Research India Pvt. Ltd. | Coimbatore Rural Road Accident Study (2012 – 2014) 31
on crashes can happen on bends when drivers accidentally (or intentionally) ‘cut the
corner'. Widening the lanes on a bend or an uphill gradient can reduce the risk of head-
on crashes by giving drivers more room to get around the bend without crossing into
the opposing lane. Similarly, widening turn lanes can improve safety, especially for
larger vehicles.
Road duplication or ‘dualling' involves changing a single carriageway road to a dual
carriageway road by building a second separate carriageway, usually alongside the first.
Road duplication provides a safety benefit through provision of a central median barrier
or strip of land (median or central reservation), thereby reducing the chances of head-
on crashes. This is costly and requires a large amount of space. Duplication is typically
only economically viable at higher traffic flow levels.
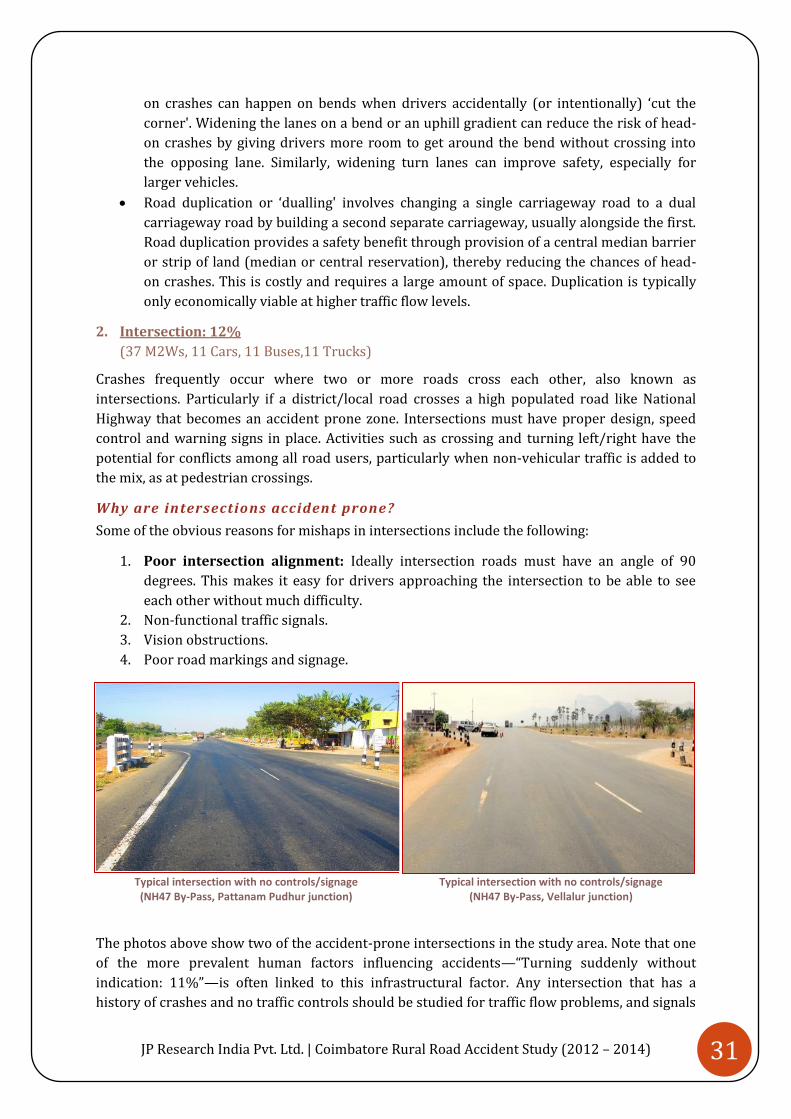
2. Intersection: 12%
(37 M2Ws, 11 Cars, 11 Buses,11 Trucks)
Crashes frequently occur where two or more roads cross each other, also known as
intersections. Particularly if a district/local road crosses a high populated road like National
Highway that becomes an accident prone zone. Intersections must have proper design, speed
control and warning signs in place. Activities such as crossing and turning left/right have the
potential for conflicts among all road users, particularly when non-vehicular traffic is added to
the mix, as at pedestrian crossings.
Why are intersections accident prone?
Some of the obvious reasons for mishaps in intersections include the following:
1. Poor intersection alignment: Ideally intersection roads must have an angle of 90
degrees. This makes it easy for drivers approaching the intersection to be able to see
each other without much difficulty.
2. Non-functional traffic signals.
3. Vision obstructions.
4. Poor road markings and signage.
Typical intersection with no controls/signage (NH47 By-Pass, Pattanam Pudhur junction)
Typical intersection with no controls/signage
(NH47 By-Pass, Vellalur junction)
The photos above show two of the accident-prone intersections in the study area. Note that one
of the more prevalent human factors influencing accidents—“Turning suddenly without
indication: 11%”—is often linked to this infrastructural factor. Any intersection that has a
history of crashes and no traffic controls should be studied for traffic flow problems, and signals
JP Research India Pvt. Ltd. | Coimbatore Rural Road Accident Study (2012 – 2014) 32
or clear signage indicating crossroads, turn lanes, the potential for stops/yields, etc. should be
considered.
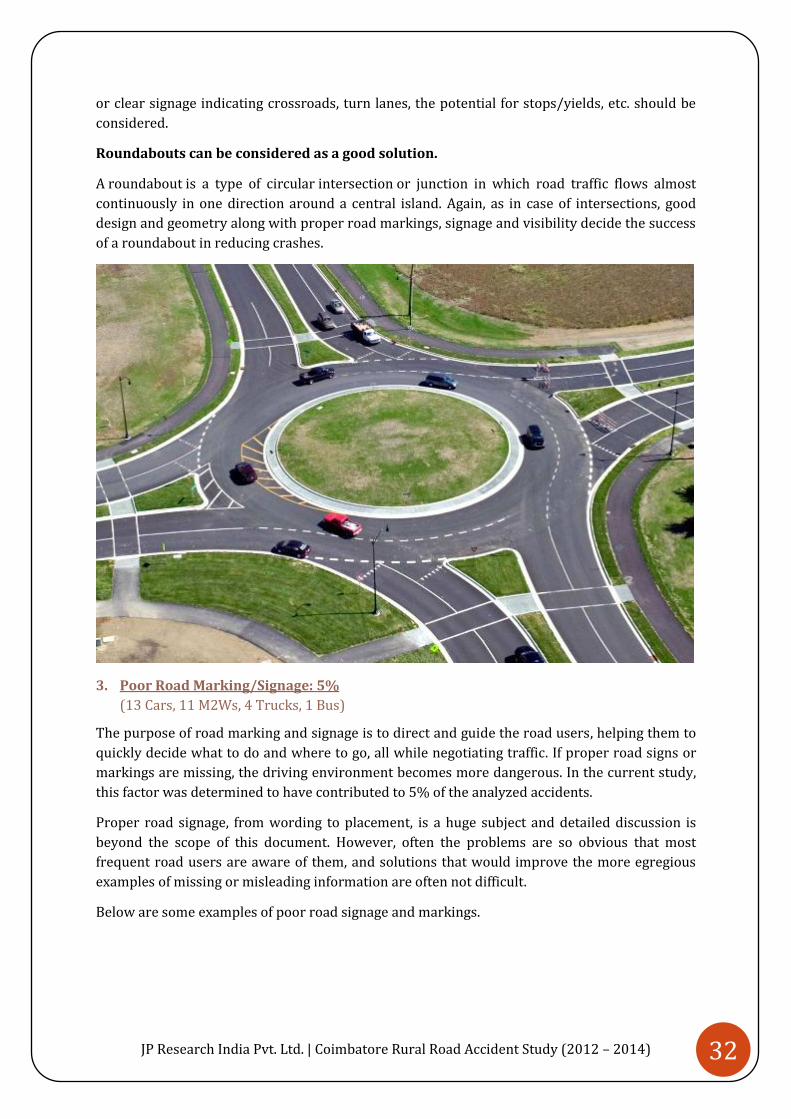
Roundabouts can be considered as a good solution.
A roundabout is a type of circular intersection or junction in which road traffic flows almost
continuously in one direction around a central island. Again, as in case of intersections, good
design and geometry along with proper road markings, signage and visibility decide the success
of a roundabout in reducing crashes.
3. Poor Road Marking/Signage: 5%
(13 Cars, 11 M2Ws, 4 Trucks, 1 Bus)
The purpose of road marking and signage is to direct and guide the road users, helping them to
quickly decide what to do and where to go, all while negotiating traffic. If proper road signs or
markings are missing, the driving environment becomes more dangerous. In the current study,
this factor was determined to have contributed to 5% of the analyzed accidents.
Proper road signage, from wording to placement, is a huge subject and detailed discussion is
beyond the scope of this document. However, often the problems are so obvious that most
frequent road users are aware of them, and solutions that would improve the more egregious
examples of missing or misleading information are often not difficult.
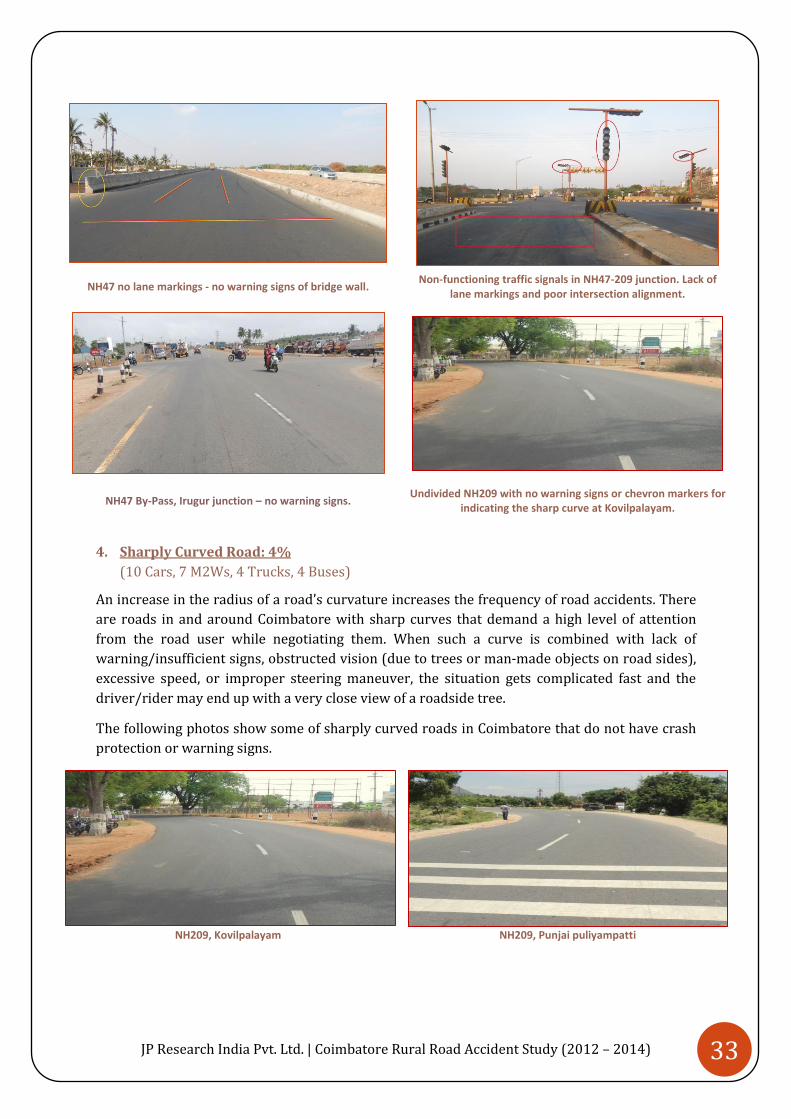
Below are some examples of poor road signage and markings.
JP Research India Pvt. Ltd. | Coimbatore Rural Road Accident Study (2012 – 2014) 33
NH47 no lane markings - no warning signs of bridge wall. Non-functioning traffic signals in NH47-209 junction. Lack of
lane markings and poor intersection alignment.
NH47 By-Pass, Irugur junction – no warning signs. Undivided NH209 with no warning signs or chevron markers for
indicating the sharp curve at Kovilpalayam.
4. Sharply Curved Road: 4%
(10 Cars, 7 M2Ws, 4 Trucks, 4 Buses)
An increase in the radius of a road’s curvature increases the frequency of road accidents. There
are roads in and around Coimbatore with sharp curves that demand a high level of attention
from the road user while negotiating them. When such a curve is combined with lack of
warning/insufficient signs, obstructed vision (due to trees or man-made objects on road sides),
excessive speed, or improper steering maneuver, the situation gets complicated fast and the
driver/rider may end up with a very close view of a roadside tree.
The following photos show some of sharply curved roads in Coimbatore that do not have crash
protection or warning signs.
NH209, Kovilpalayam NH209, Punjai puliyampatti
JP Research India Pvt. Ltd. | Coimbatore Rural Road Accident Study (2012 – 2014) 34
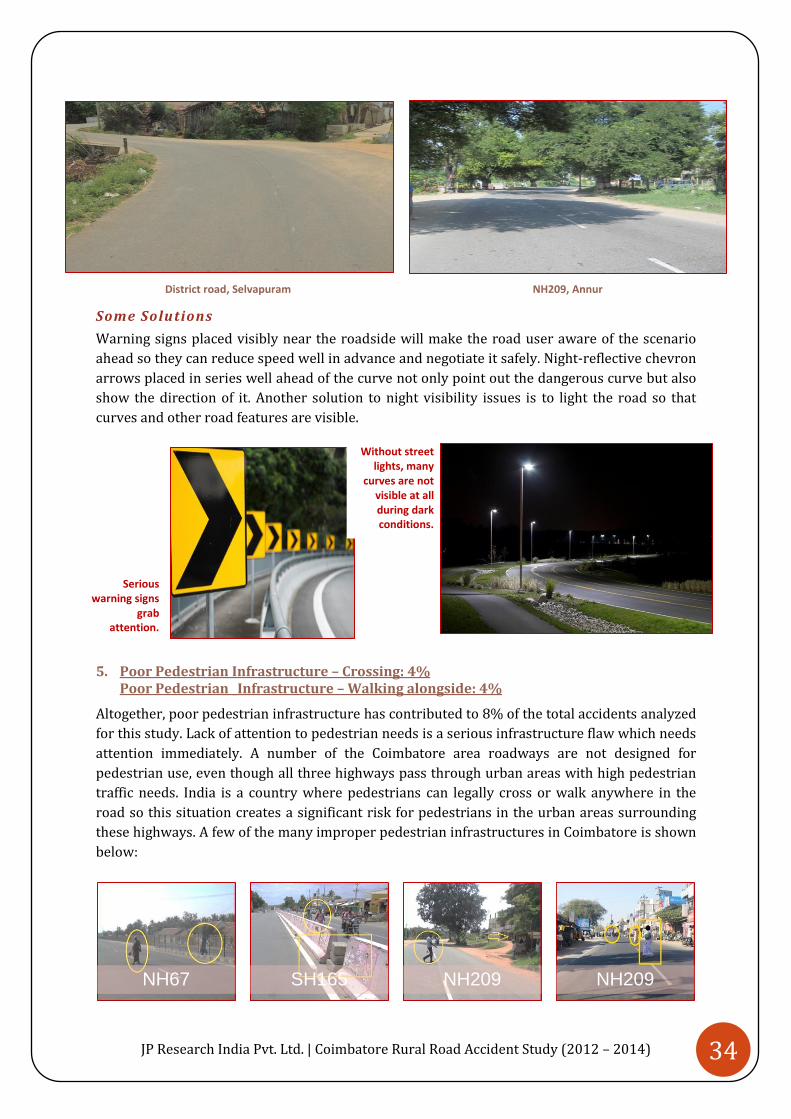
District road, Selvapuram NH209, Annur
Some Solutions
Warning signs placed visibly near the roadside will make the road user aware of the scenario
ahead so they can reduce speed well in advance and negotiate it safely. Night-reflective chevron
arrows placed in series well ahead of the curve not only point out the dangerous curve but also
show the direction of it. Another solution to night visibility issues is to light the road so that
curves and other road features are visible.
5. Poor Pedestrian Infrastructure – Crossing: 4% Poor Pedestrian _Infrastructure – Walking alongside: 4%
Altogether, poor pedestrian infrastructure has contributed to 8% of the total accidents analyzed
for this study. Lack of attention to pedestrian needs is a serious infrastructure flaw which needs
attention immediately. A number of the Coimbatore area roadways are not designed for
pedestrian use, even though all three highways pass through urban areas with high pedestrian
traffic needs. India is a country where pedestrians can legally cross or walk anywhere in the
road so this situation creates a significant risk for pedestrians in the urban areas surrounding
these highways. A few of the many improper pedestrian infrastructures in Coimbatore is shown
below:
NH67 SH165 NH209 NH209
Serious warning signs
grab attention.
Without street lights, many
curves are not visible at all during dark conditions.

JP Research India Pvt. Ltd. | Coimbatore Rural Road Accident Study (2012 – 2014) 35
Where pedestrian infrastructure is most needed?
Proper, pedestrian-friendly infrastructure is mandatory in the places where pedestrian
presence on the road is high. This includes areas at or near bus stops and bus stations, and in
selective places where National Highways cross or otherwise interact with and affect other
roadways in cities, but most especially at intersections. If proper facilities are not available in
required places, vehicle-pedestrian accidents are virtually assured.
6. Work Zones: 4%
Several of the accidents analyzed for this study occurred in work zones. Even though currently
most of the locations are now regular roads, it is important to discuss how accidents happened
in work zones.
A work zone is an area of a trafficway where highway construction, maintenance, or utility-
work activities are carried out for a limited period of time. A work zone is typically marked by
signs, channeling devices, barriers, pavement markings, and/or work vehicles. It extends from
the first warning sign or flashing lights on a vehicle to the "End of Road Work" sign or the last
traffic control device. A work zone may exist for short or long durations and may include
stationary or moving activities. Included in this category are long-term stationary highway
construction such as building a new bridge, adding travel lanes to the roadway and extending an
existing traffic way.
A crash in a work zone of NH47 A crash in a two way trafficked work zone (NH47)
How work zones contributed to accidents
Poor illumination of a work zone at night and poor notification of traffic changes were the main
problems contributing to accidents in work zones. On a divided highway, a work zone can shift
vehicles onto the oncoming traffic side (creating a temporary undivided road) or, if two lanes
are available in each direction, can funnel it into a single lane on its own side of the median.
Either option is likely to back up traffic, however, and confuse drivers, especially if they were
not warned of what to expect (e.g., “Right lane closed in 1 kilometer. Merge left.”).
A work zone on an undivided two-lane road
requires careful delineation and should have
proper safety and warning features, as shown.
Drivers must be warned well before the traffic
is diverted.

JP Research India Pvt. Ltd. | Coimbatore Rural Road Accident Study (2012 – 2014) 36
Contributing Factors: INJURIES
HUMAN Factors Contributing to Injury Causation
For the 568 accidents analyzed, 452 accidents resulted in fatal or serious injuries. The following
are the contributing human factors determined to have influenced the occurrence of injury.
Table 4 shows both the number and the percentage of fatal/serious injury accidents influenced
by each factor. Please note that more than one factor can influence injury; hence, the sum of the
percentage influence may not be equal to sum of human factors influencing injuries (80%).
TABLE 4: CONTRIBUTING HUMAN FACTORS INFLUENCING INJURY IN 452 SERIOUS/FATAL INJURY ACCIDENTS
Contributing Human Factors (Injury Causation)
Number of Accidents
% Influenced
Helmet not used (259 M2Ws, 1 Bicycle)
260 58%
Seat belt not used (91 Cars, 8 Trucks, 1 Bus, 1 Minitruck, 1 Pickup)
102 23%
Failure to use very basic, well-known, and easily available safety features influenced injury
occurrence in 80% of the serious/fatal crashes analyzed in this study.
The human factors with the greatest influence on injury occurrence in serious/fatal accidents,
as shown in Table 4, are described in brief in the following paragraphs, along with existing
solutions to counter these factors. Please note that the solutions identified here are, as in the
accident causation section, merely provided for informational purposes.
1. Helmet Not Used: 58% (259 M2Ws, 1 Bicycle)
India is the second largest M2W market in the world, with more than 10 million M2Ws sold here
every year, but India’s passion for M2Ws seems not to have extended to the one safety item that
should be considered a crucial part of the riding experience. The “human factors” for injuries to
M2W riders and pillion riders shrink to one major cause—helmet not used. A helmet is the
most basic and compulsory safety gear to be used while riding. It protects the head by absorbing
shocks in an event of a collision, and to not use one is to risk serious or fatal injury even in an
otherwise survivable accident.
In Law and in Practice
The statistics are bleak. Over 50% of crashes in the RASSI database involved at least one M2W,
and 51% of those riders suffered fatal injuries and 41% sustained serious injuries.
As per Section 129 of the Motor Vehicles Act, 1988, everyone other than a Sikh wearing a turban
should wear protective headgear (helmet) when riding on a motorcycle on a public road.
However, despite stringent safety regulations and laws, the RASSI data shows that
approximately 85% of M2W riders involved in crashes in India did not wear the single most
protective piece of equipment available to them—a helmet.
One approach to changing this statistic may be more awareness and safety campaigns, possibly
funded through a Public-Private partnership, to make people understand the importance of
helmets and the fragile (and irreplaceable) heads that they are designed to protect.
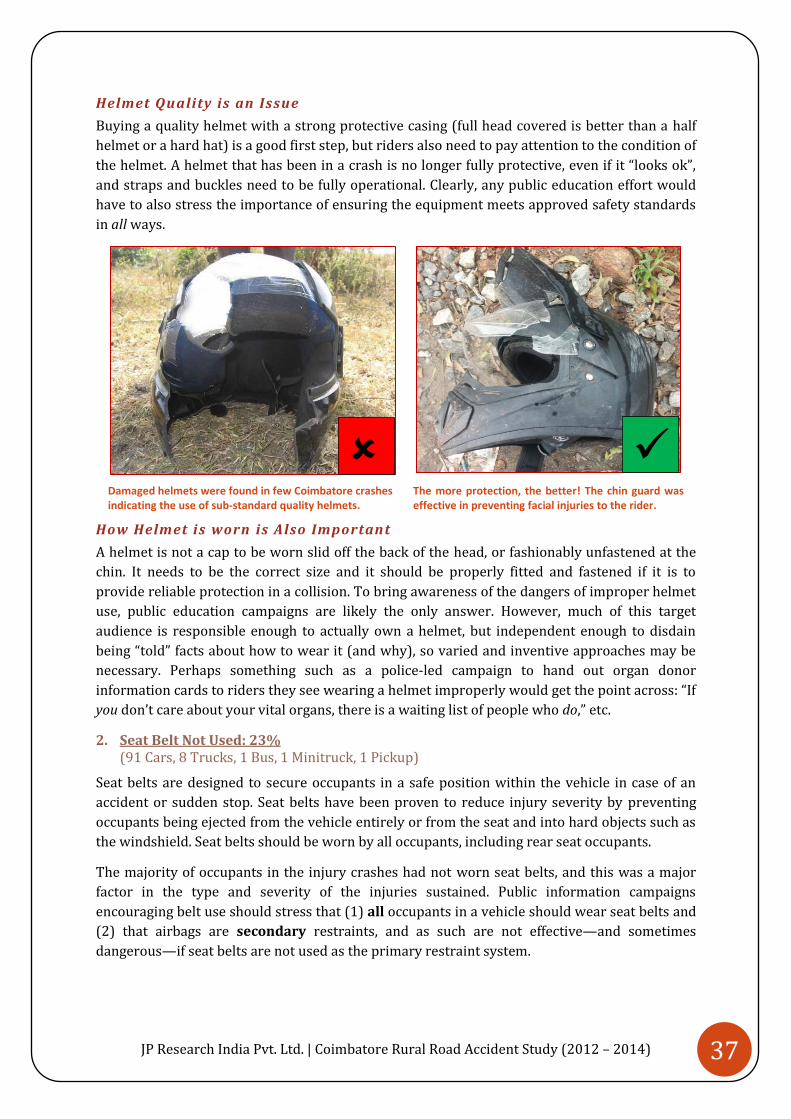
JP Research India Pvt. Ltd. | Coimbatore Rural Road Accident Study (2012 – 2014) 37
Helmet Quality is an Issue
Buying a quality helmet with a strong protective casing (full head covered is better than a half
helmet or a hard hat) is a good first step, but riders also need to pay attention to the condition of
the helmet. A helmet that has been in a crash is no longer fully protective, even if it “looks ok”,
and straps and buckles need to be fully operational. Clearly, any public education effort would
have to also stress the importance of ensuring the equipment meets approved safety standards
in all ways.
Damaged helmets were found in few Coimbatore crashes indicating the use of sub-standard quality helmets.
The more protection, the better! The chin guard was effective in preventing facial injuries to the rider.
How Helmet is worn is Also Important
A helmet is not a cap to be worn slid off the back of the head, or fashionably unfastened at the
chin. It needs to be the correct size and it should be properly fitted and fastened if it is to
provide reliable protection in a collision. To bring awareness of the dangers of improper helmet
use, public education campaigns are likely the only answer. However, much of this target
audience is responsible enough to actually own a helmet, but independent enough to disdain
being “told” facts about how to wear it (and why), so varied and inventive approaches may be
necessary. Perhaps something such as a police-led campaign to hand out organ donor
information cards to riders they see wearing a helmet improperly would get the point across: “If
you don’t care about your vital organs, there is a waiting list of people who do,” etc.
2. Seat Belt Not Used: 23% (91 Cars, 8 Trucks, 1 Bus, 1 Minitruck, 1 Pickup)
Seat belts are designed to secure occupants in a safe position within the vehicle in case of an
accident or sudden stop. Seat belts have been proven to reduce injury severity by preventing
occupants being ejected from the vehicle entirely or from the seat and into hard objects such as
the windshield. Seat belts should be worn by all occupants, including rear seat occupants.
The majority of occupants in the injury crashes had not worn seat belts, and this was a major
factor in the type and severity of the injuries sustained. Public information campaigns
encouraging belt use should stress that (1) all occupants in a vehicle should wear seat belts and
(2) that airbags are secondary restraints, and as such are not effective—and sometimes
dangerous—if seat belts are not used as the primary restraint system.

JP Research India Pvt. Ltd. | Coimbatore Rural Road Accident Study (2012 – 2014) 38
The figure below shows how belted and unbelted rear occupants move in an accident.
As can be seen in the above figure, the belted rear occupant is restrained to his seat position,
while the unbelted rear occupant moves forward and impacts the driver seat back. Hence, rear
occupants impacting the driver and other front seat occupants, can cause serious (and
avoidable) injury even if the vehicles are equipped with airbags.
Belted Rear Occupant Unbelted Rear Occupant

JP Research India Pvt. Ltd. | Coimbatore Rural Road Accident Study (2012 – 2014) 39
VEHICLE Factors Contributing to Injury Causation
For the 568 accidents analyzed, 452 accidents resulted in fatal or serious injuries. The following
are the contributing vehicle factors determined to have influenced the occurrence of injury.
Table 5 shows both the number and the percentage of fatal/serious injury accidents influenced
by each factor. Please note that more than one factor can influence injury; hence, the sum of the
percentage influence may not be equal to sum of vehicle factors influencing injuries (85%).
TABLE 5: CONTRIBUTING VEHICLE FACTORS INFLUENCING INJURIES IN 452 SERIOUS/FATAL INJURY ACCIDENTS
Contributing Vehicle Factors (Injury Causation)
Number of Accidents
% Influenced
Knock-down (Instability of centre of gravity due to collision) (225 M2Ws, 39 Pedestrians, 1 Bicycle)
265 59%
Passenger compartment intrusion – Other (26 Cars, 11 Trucks, 3 Buses)
42 9%
Seat belts not available/usable (7 Trucks, 8 Cars, 4 M3Ws,3 Buses)
25 6%
Runover (13 M2Ws, 9 Pedestrians, 1 Bicycle)
23 5%
Passenger compartment intrusion – Underride/Override (17 Cars, 1 Truck, 1 M3W, 1 Minitruck)
20 4%
Non-enclosed occupant cabin 12 3%
Entrapment 12 3%
Others 8 2%
Fall-down (instability of centre of gravity due to loss of control)
Two wheelers only 6 1%
Road user weight/mass/force incompatibilities influenced injury occurrence in well over half of
the serious/fatal crashes analyzed in this study.
The vehicle factors with the greatest influence on injury occurrence in serious/fatal accidents,
as shown in Table 5, are described in brief in the following paragraphs, along with existing
solutions to counter these factors. Please note that the solutions identified here are, as in the
accident causation section, merely provided for informational purposes.

JP Research India Pvt. Ltd. | Coimbatore Rural Road Accident Study (2012 – 2014) 40
1. Knock-down (Instability due to collision): 59% (225 M2Ws, 39 Pedestrians, 1 Bicycle)
During impact between a low mass road user (M2W/bicycle/pedestrian) and a higher mass
vehicle (car/truck/bus), the M2W/bicycle rider or pedestrian is usually knocked down to the
ground or thrown into the air to fall to the ground with force and speed. This loss of stability is
due to the sudden shift of centre of gravity of the road user due to which balance cannot be
maintained. Such an occurrence is coded as a knock-down.
As shown in Table 5 an unbalanced vehicle mass ratio contributed to 58% of total number of
serious and fatal injuries analysed in this study, and the most affected were the M2W riders and
pillion riders. Irrespective of helmet use, all of the motorcyclists suffered serious or fatal
injuries, primarily to the head, upper and lower extremities (arms and legs), and thorax, when
knocked down. Pedestrians did not fare well in this mismatched contest, either; 90% of
pedestrians suffered fatal injuries and all of them suffered serious injuries.
Reducing Severity of Injuries
To reduce the severity of injuries
sustained in such an unbalanced
collision, M2W riders must wear
proper safety gear. A quality, well-
fitted, and properly worn helmet can
greatly reduce injury severity through
protecting the head. Protective gear
for the body (such as leather or
abrasion-resistant riding wear) and
upper and lower extremities (gloves
and boots) are also effective in
reducing serious/fatal outcomes.
For pedestrians, the best solution is to
improve infrastructural factors to
reduce the opportunities for vehicle-
pedestrian accidents and their injury
outcomes. Other solutions involve
redesigning cars, trucks, and buses to
employ softer, pedestrian-friendly
bumpers and other systems. A number
of active and passive pedestrian
protection systems are already being
road-tested, although none are widely
available yet.
2. Passenger Compartment Intrusion - Other: 9% (26 Cars, 11 Trucks, 3 Buses) Passenger Compartment Intrusion due to Underride/Override: 4% (17 Cars, 1 Truck, 1 M3W, 1Minitruck)
This vehicle factor is another example of vehicle incompatibility effects in crashes. Passenger
vehicles are usually designed so that, during an impact, the passenger cabin (where the driver
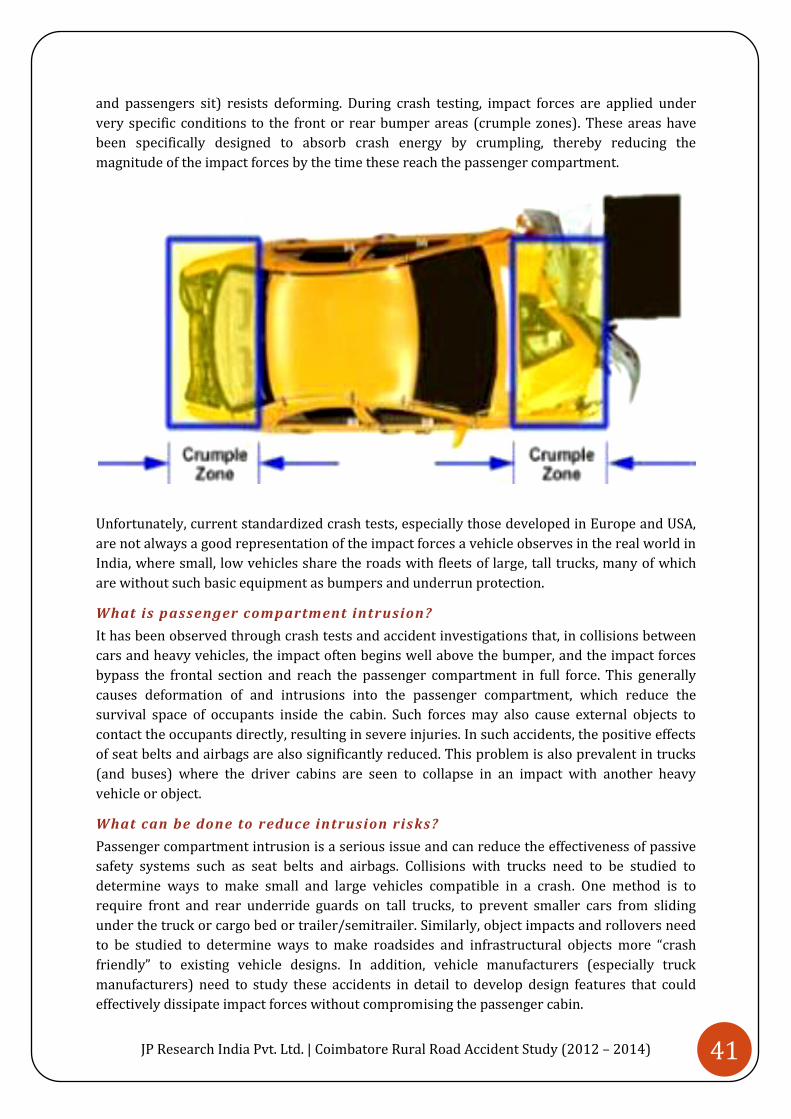
JP Research India Pvt. Ltd. | Coimbatore Rural Road Accident Study (2012 – 2014) 41
and passengers sit) resists deforming. During crash testing, impact forces are applied under
very specific conditions to the front or rear bumper areas (crumple zones). These areas have
been specifically designed to absorb crash energy by crumpling, thereby reducing the
magnitude of the impact forces by the time these reach the passenger compartment.
Unfortunately, current standardized crash tests, especially those developed in Europe and USA,
are not always a good representation of the impact forces a vehicle observes in the real world in
India, where small, low vehicles share the roads with fleets of large, tall trucks, many of which
are without such basic equipment as bumpers and underrun protection.
What is passenger compartment intrusion?
It has been observed through crash tests and accident investigations that, in collisions between
cars and heavy vehicles, the impact often begins well above the bumper, and the impact forces
bypass the frontal section and reach the passenger compartment in full force. This generally
causes deformation of and intrusions into the passenger compartment, which reduce the
survival space of occupants inside the cabin. Such forces may also cause external objects to
contact the occupants directly, resulting in severe injuries. In such accidents, the positive effects
of seat belts and airbags are also significantly reduced. This problem is also prevalent in trucks
(and buses) where the driver cabins are seen to collapse in an impact with another heavy
vehicle or object.
What can be done to reduce intrusion risks?
Passenger compartment intrusion is a serious issue and can reduce the effectiveness of passive
safety systems such as seat belts and airbags. Collisions with trucks need to be studied to
determine ways to make small and large vehicles compatible in a crash. One method is to
require front and rear underride guards on tall trucks, to prevent smaller cars from sliding
under the truck or cargo bed or trailer/semitrailer. Similarly, object impacts and rollovers need
to be studied to determine ways to make roadsides and infrastructural objects more “crash
friendly” to existing vehicle designs. In addition, vehicle manufacturers (especially truck
manufacturers) need to study these accidents in detail to develop design features that could
effectively dissipate impact forces without compromising the passenger cabin.

JP Research India Pvt. Ltd. | Coimbatore Rural Road Accident Study (2012 – 2014) 42
3. Seat Belts Not Available/Usable: 6% (8 Cars, 7 Trucks, 4 M3Ws, 3 Buses)
Although all cars are equipped with seat belts, it is common in Indian cars for the seat buckles to
be hidden (especially in rear seats) to increase seating comfort. This action makes the seat belts
unavailable and effectively unusable. The solution to this problem, of course, is for the rear seat
occupants to use the seat belts. While it is true that a seat belt buckle is not particularly
comfortable when located under a tail bone, if the belt is strapped across the body protectively,
as designed, this “problem” goes away entirely. And there is certainly nothing comfortable about
being thrown around a vehicle in the event of an accident.
Most trucks and buses in India do not have usable seatbelts. It has been proven worldwide that
seat belts are the cheapest and most effective safety systems in vehicles today. Hence, truck and
bus drivers should ensure that their vehicles are fitted with good quality seat belts.
Manufacturers, too, should ensure that all their vehicles come with these effective safety
systems as standard equipment.
Examples of crash vehicles with no seat belts available:
Although seat belts are present, people consider them a
hindrance—so they hide the buckles Again, hidden seat buckles made the seat belts unavailable.
Almost every Indian truck has this issue – no seat belts at all Few Indian cars have no seat belts at all
4. Runover: 5% (13 M2Ws, 9 Pedestrians, 1 Bicycle)
“Runover” is another collision condition where the human comes under the wheels of another
vehicle. A runover occurs when a heavy truck or other large vehicle straddles and runs over a
person. This event can occur on its own or as a following event after a knock-down or fall-over.
Even if not the first event, it is definitely the most bizarre and severe. All 23 of the crashes
where “runover” were fatal crashes, and as with the knock-down factor, motorcyclists,
pedestrians and bicycle riders are the victims.

JP Research India Pvt. Ltd. | Coimbatore Rural Road Accident Study (2012 – 2014) 43
Protection from Runover
Runover can be avoided in many cases if special bumpers/fenders are installed on the high-
ground clearance vehicles. In several countries, runover protection is mandatory on large
vehicles, particularly on construction and other industrial vehicles. In India, there are few rules
and no standards for installing runover protection on trucks/buses or other high mass vehicles.
While heavy vehicles are indeed supposed to offer front and rear under-run protection, the
materials, shapes, height, thickness, etc. are not clearly defined.
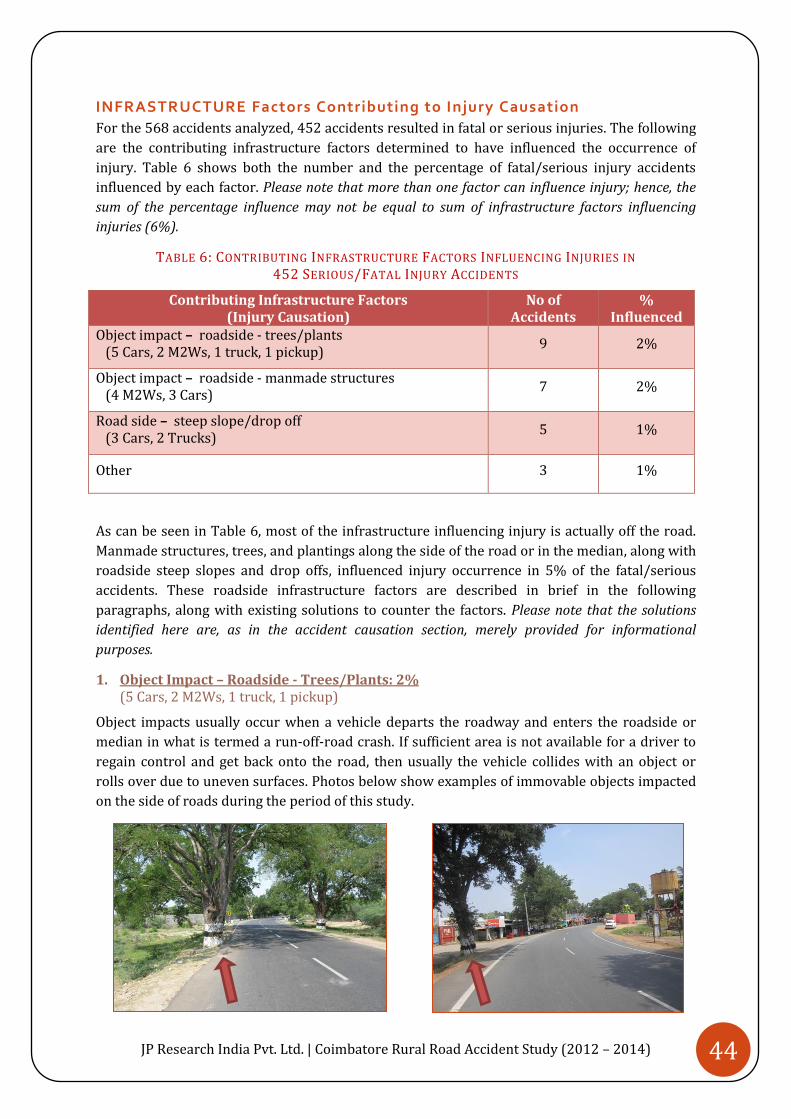
JP Research India Pvt. Ltd. | Coimbatore Rural Road Accident Study (2012 – 2014) 44
INFRASTRUCTURE Factors Contributing to Injury Causation
For the 568 accidents analyzed, 452 accidents resulted in fatal or serious injuries. The following
are the contributing infrastructure factors determined to have influenced the occurrence of
injury. Table 6 shows both the number and the percentage of fatal/serious injury accidents
influenced by each factor. Please note that more than one factor can influence injury; hence, the
sum of the percentage influence may not be equal to sum of infrastructure factors influencing
injuries (6%).
TABLE 6: CONTRIBUTING INFRASTRUCTURE FACTORS INFLUENCING INJURIES IN 452 SERIOUS/FATAL INJURY ACCIDENTS
Contributing Infrastructure Factors (Injury Causation)
No of Accidents
% Influenced
Object impact – roadside - trees/plants (5 Cars, 2 M2Ws, 1 truck, 1 pickup)
9 2%
Object impact – roadside - manmade structures (4 M2Ws, 3 Cars)
7 2%
Road side – steep slope/drop off (3 Cars, 2 Trucks)
5 1%
Other 3 1%
As can be seen in Table 6, most of the infrastructure influencing injury is actually off the road.
Manmade structures, trees, and plantings along the side of the road or in the median, along with
roadside steep slopes and drop offs, influenced injury occurrence in 5% of the fatal/serious
accidents. These roadside infrastructure factors are described in brief in the following
paragraphs, along with existing solutions to counter the factors. Please note that the solutions
identified here are, as in the accident causation section, merely provided for informational
purposes.
1. Object Impact – Roadside - Trees/Plants: 2% (5 Cars, 2 M2Ws, 1 truck, 1 pickup)
Object impacts usually occur when a vehicle departs the roadway and enters the roadside or
median in what is termed a run-off-road crash. If sufficient area is not available for a driver to
regain control and get back onto the road, then usually the vehicle collides with an object or
rolls over due to uneven surfaces. Photos below show examples of immovable objects impacted
on the side of roads during the period of this study.
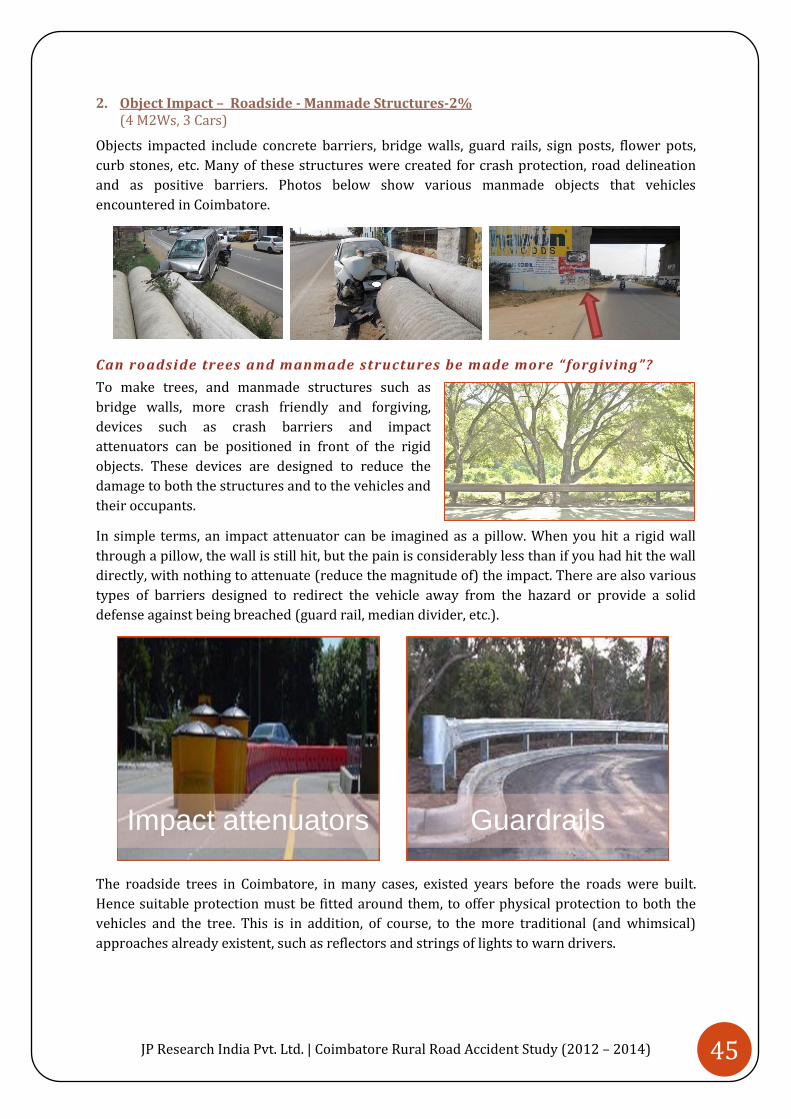
JP Research India Pvt. Ltd. | Coimbatore Rural Road Accident Study (2012 – 2014) 45
2. Object Impact – Roadside - Manmade Structures-2% (4 M2Ws, 3 Cars)
Objects impacted include concrete barriers, bridge walls, guard rails, sign posts, flower pots,
curb stones, etc. Many of these structures were created for crash protection, road delineation
and as positive barriers. Photos below show various manmade objects that vehicles
encountered in Coimbatore.
Can roadside trees and manmade structures be made more “forgiving”?
To make trees, and manmade structures such as
bridge walls, more crash friendly and forgiving,
devices such as crash barriers and impact
attenuators can be positioned in front of the rigid
objects. These devices are designed to reduce the
damage to both the structures and to the vehicles and
their occupants.
In simple terms, an impact attenuator can be imagined as a pillow. When you hit a rigid wall
through a pillow, the wall is still hit, but the pain is considerably less than if you had hit the wall
directly, with nothing to attenuate (reduce the magnitude of) the impact. There are also various
types of barriers designed to redirect the vehicle away from the hazard or provide a solid
defense against being breached (guard rail, median divider, etc.).
The roadside trees in Coimbatore, in many cases, existed years before the roads were built.
Hence suitable protection must be fitted around them, to offer physical protection to both the
vehicles and the tree. This is in addition, of course, to the more traditional (and whimsical)
approaches already existent, such as reflectors and strings of lights to warn drivers.
Impact attenuators Guardrails
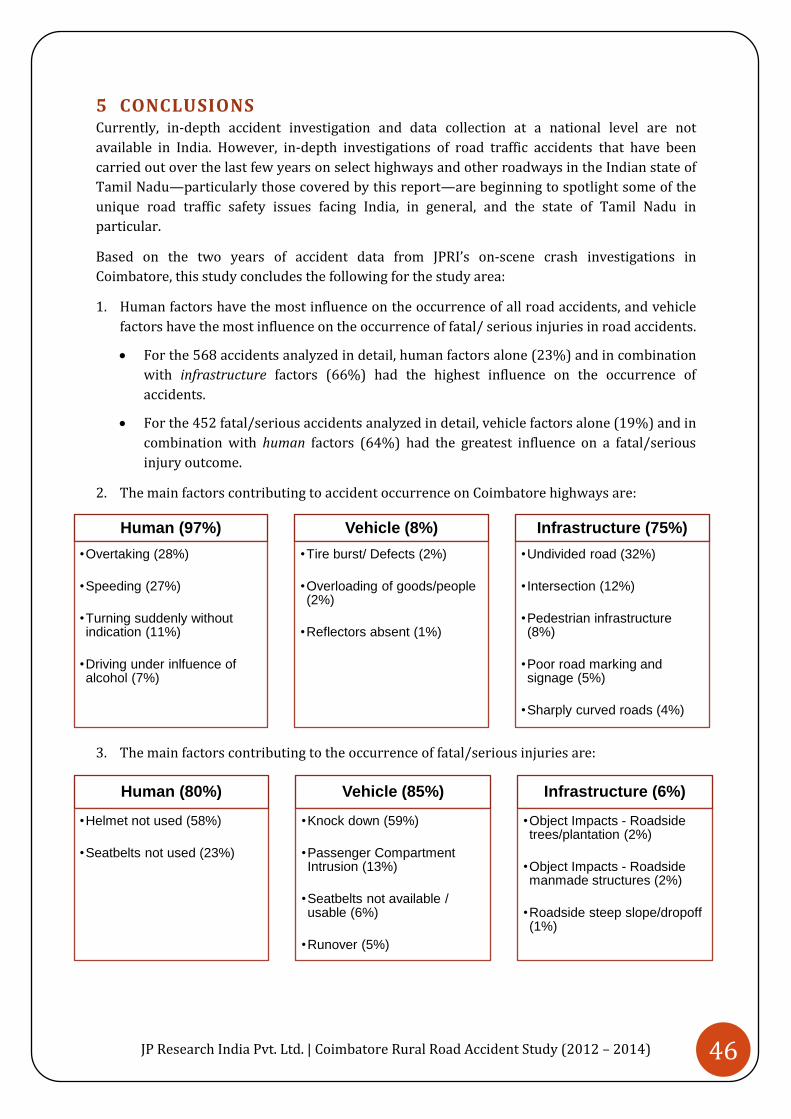
JP Research India Pvt. Ltd. | Coimbatore Rural Road Accident Study (2012 – 2014) 46
5 CONCLUSIONS Currently, in-depth accident investigation and data collection at a national level are not
available in India. However, in-depth investigations of road traffic accidents that have been
carried out over the last few years on select highways and other roadways in the Indian state of
Tamil Nadu—particularly those covered by this report—are beginning to spotlight some of the
unique road traffic safety issues facing India, in general, and the state of Tamil Nadu in
particular.
Based on the two years of accident data from JPRI’s on-scene crash investigations in
Coimbatore, this study concludes the following for the study area:
1. Human factors have the most influence on the occurrence of all road accidents, and vehicle
factors have the most influence on the occurrence of fatal/ serious injuries in road accidents.
For the 568 accidents analyzed in detail, human factors alone (23%) and in combination
with infrastructure factors (66%) had the highest influence on the occurrence of
accidents.
For the 452 fatal/serious accidents analyzed in detail, vehicle factors alone (19%) and in
combination with human factors (64%) had the greatest influence on a fatal/serious
injury outcome.
2. The main factors contributing to accident occurrence on Coimbatore highways are:
3. The main factors contributing to the occurrence of fatal/serious injuries are:
Human (97%)
•Overtaking (28%)
•Speeding (27%)
•Turning suddenly without indication (11%)
•Driving under inlfuence of alcohol (7%)
Vehicle (8%)
•Tire burst/ Defects (2%)
•Overloading of goods/people (2%)
•Reflectors absent (1%)
Infrastructure (75%)
•Undivided road (32%)
• Intersection (12%)
•Pedestrian infrastructure (8%)
•Poor road marking and signage (5%)
•Sharply curved roads (4%)
Human (80%)
•Helmet not used (58%)
•Seatbelts not used (23%)
Vehicle (85%)
•Knock down (59%)
•Passenger Compartment Intrusion (13%)
•Seatbelts not available / usable (6%)
•Runover (5%)
Infrastructure (6%)
•Object Impacts - Roadside trees/plantation (2%)
•Object Impacts - Roadside manmade structures (2%)
•Roadside steep slope/dropoff (1%)

JP Research India Pvt. Ltd. | Coimbatore Rural Road Accident Study (2012 – 2014) 47
4. The following actions are likely to reduce the number of accidents occurring on
Coimbatore’s highways:
Convert undivided road stretches on National Highways to divided roads. All three
National Highways in Coimbatore have undivided stretches: NH67, NH47 By-pass, and
NH209 (entire length). The largest individual factor contributing to accident causation
(32%) was the infrastructure factor “Undivided roads”. This was echoed by the largest
individual human factor influencing accident causation: overtaking on undivided roads
(28%). These crash contributors would largely disappear if many of the undivided road
stretches were converted to properly divided roads.
Implement a speed management program to control speeding (speeding was a factor in
27% of accidents). Match speeds to conditions, warn drivers of changes, and then
enforce posted limits.
Educate people to use indicators, and to respond to indications provided by other users,
while lane changing or accessing a turn. Together, turning suddenly without indication,
improper lane usage and/or lane changing contributed to 16% of accidents. This can be
approached through public education: concerning the dangers of texting while driving,
for example. A focused driver is more likely to indicate lane changes, pay attention to
other road users, and drive more safely in general.
Clearly mark traffic directions/instructions before and at intersections (confusion at
intersections was a contributing factor in 12% of accidents, and poor signage/road
marking was a factor in 5%). The design of every intersection should be clear, signals
and stop signs should be warned of in advance (to make drivers expectant), and
directional signage and road markings should be easily visible even in heavy traffic.
Clear markings before sharp curves would also help lower the number of accidents due
to losing control on curved roads (a contributing factor in 4% of accidents).
Improve pedestrian infrastructure, especially around bus stops and crossings on
highways. Poor pedestrian infrastructure resulting in pedestrians walking alongside or
crossing highways contributed to 8% of accidents.
Adopt stringent rules to help prevent drunk driving, which was a contributing factor in
7% of accidents.
Implement vehicle check programs to deal with truck and passenger overloading, lack of
reflectors, worn tires and other items (lights not operational, etc.) that are known to
contribute to accidents.
5. The following actions are likely to reduce the occurrence of fatality or serious injury in
accidents on Coimbatore’s highways:
Enforce proper helmet use and encourage use of helmets meeting approved standards.
Failure by M2W/bicycle users to wear a helmet at all was a contributing factor in 58% of
serious/fatal injury accidents, so changing helmet use patterns is a critical need. And
because proper head protection can make a life-saving difference, equal effort should go
towards making sure all helmets sold in India meet basic protective standards.

JP Research India Pvt. Ltd. | Coimbatore Rural Road Accident Study (2012 – 2014) 48
Take multiple approaches to reduce the severity of injuries due to “knock-down” (which
was a contributing factor in 59% of serious/fatal injury accidents).
o Educate about the value of protective gear. In addition to helmets, leather or
abrasion-resistant riding wear, gloves and boots are helpful in reducing
serious/fatal outcomes.
o Improve pedestrian infrastructure to more safely separate pedestrians from larger
road users (without infringing on pedestrian access to the roads).
o Require pedestrian-friendly bumpers and other features that are specially designed
to make large mass vehicles safer in pedestrian and cyclist collisions by absorbing
energy and deflecting at safer/softer impact points. Similar guards and additions
may also help protect against “runover”, which was a vehicle contributing factor in
5% of serious/fatal accidents.
Enforce seat belt use Failure to use seat belts resulted in 23% of fatal/serious injuries, seat belts were not available/ usable contributed in 6% of injuries sustained by the occupants.
Provide crash barriers to make rigid objects on roadside and median more crash-
friendly and forgiving when impacted. Object impacts were infrastructure contributing
factors in 4% of fatal/serious accidents.
It should be noted that the focus of this report is on solutions that could be implemented widely
and rapidly in order to have the greatest possible impact. Thus, implementation of even a few of
the measures suggested herein should result in a significant reduction in the number of
accidents and injuries on Coimbatore’s highways. Measures such as changes in vehicle designs
to reduce the impacts of size/weight incompatibilities could also make a significant difference in
injury outcome (passenger compartment intrusion, for example, was a vehicle contributing
factor in 13% of fatal/serious accidents); however, such changes would take many years to test
and implement, and even then would affect only new or retrofitted vehicles.
The 568 accidents analyzed for this study offer a preliminary understanding of the
characteristics of accidents seen on rural highways around Coimbatore. While more data and
analyses will improve these findings, the current study provides a solid starting point for police
and other government decision making authorities to take notice and make necessary
interventions.

JP Research India Pvt. Ltd. | Coimbatore Rural Road Accident Study (2012 – 2014) 49
APPENDIX A: JP RESEARCH INDIA & RASSI CONTACT INFORMATION
For more information on JPRI, RASSI or this report, check out our websites, call or come by one
of our offices, or drop us a line by email.
JP Research India
Contact
E-Mail: [email protected]
Website: www.jpresearchindia.com
Head Office
JP RESEARCH INDIA PVT LTD
583/1,1st Floor, Sri Kumaran Salai,
Civil Aerodrome Post, Avinashi Road,
Coimbatore 641 014
Tamil Nadu, India.
Phone: +91-422-44 00 100
Pune Branch Office
JP RESEARCH INDIA PVT LTD
No. 377, Sector 24, Third floor
Lokmanya Tilak Road, Nigdi Pradhiaran,
Pune 411 044
Maharashtra, India
Phone: +91-20-2765 4465
RASSI
Contact
RASSI Technical Committee Chairman:
Mr. Ravishankar Rajaraman ([email protected])
RASSI Business Committee Chairman:
Mr. Ajit Dandapani ([email protected])
Website: www.jpresearchindia.com/rassi.html

JP Research India Pvt. Ltd. | Coimbatore Rural Road Accident Study (2012 – 2014) 50
APPENDIX B: CASE SELECTION CRITERIA
Main Criteria The following are the basic criteria to be met for a crash to be investigated by the RASSI team:
1. Accident must involve at least one motorized vehicle.
2. Crash spot has to be on a public road in the study area.
Proviso While the basic criteria are straightforward, the following provisions also need to be met for a
case to be eligible for entry into the RASSI database:
1. The crash spot should be identifiable by:
a. knowing the final rest positions (based on evidence, photographs taken by police,
etc.), or
b. vehicle trajectories (skid marks, brake marks, etc.), or
c. any other evidence (debris, damaged fixed objects, eyewitness, etc.).
2. The crash spot should also yield measurements of the road, skid marks, and any other
evidence in most cases.
3. Vehicles should be examined to obtain data such as direct damage details, crush profile,
intrusions, contacts, and safety system use, wherever applicable.
4. Make and model of all the vehicles involved in the crash should be known.
5. In case of pedestrian, bicyclist, or motorized two wheeler (M2W) crashes, the other
vehicle should be available for inspection.
Ex. – If a car hits a bicyclist and causes injuries, then the crash will be considered
only if the car is available for inspection. (This is true even if the bicycle is
unavailable.)
6. The vehicles with highest injury severities have to be available for inspection in all other
crash types.
Ex. A – A car (Unit 1) collides with another car (Unit 2), and occupants in Unit 1
suffer minor injuries while occupants in Unit 2 sustain serious injuries. The crash
will be considered only if Unit 2 is available for inspection, and even if Unit 1 is
unavailable.
Ex. B – A car, a truck and a M2W collide with each other. M2W occupant sustains
fatal injuries, car occupant sustains grievous injuries and truck occupants sustain no
injury. This crash will be considered even if the car is not available for inspection
provided the other two vehicles are available.
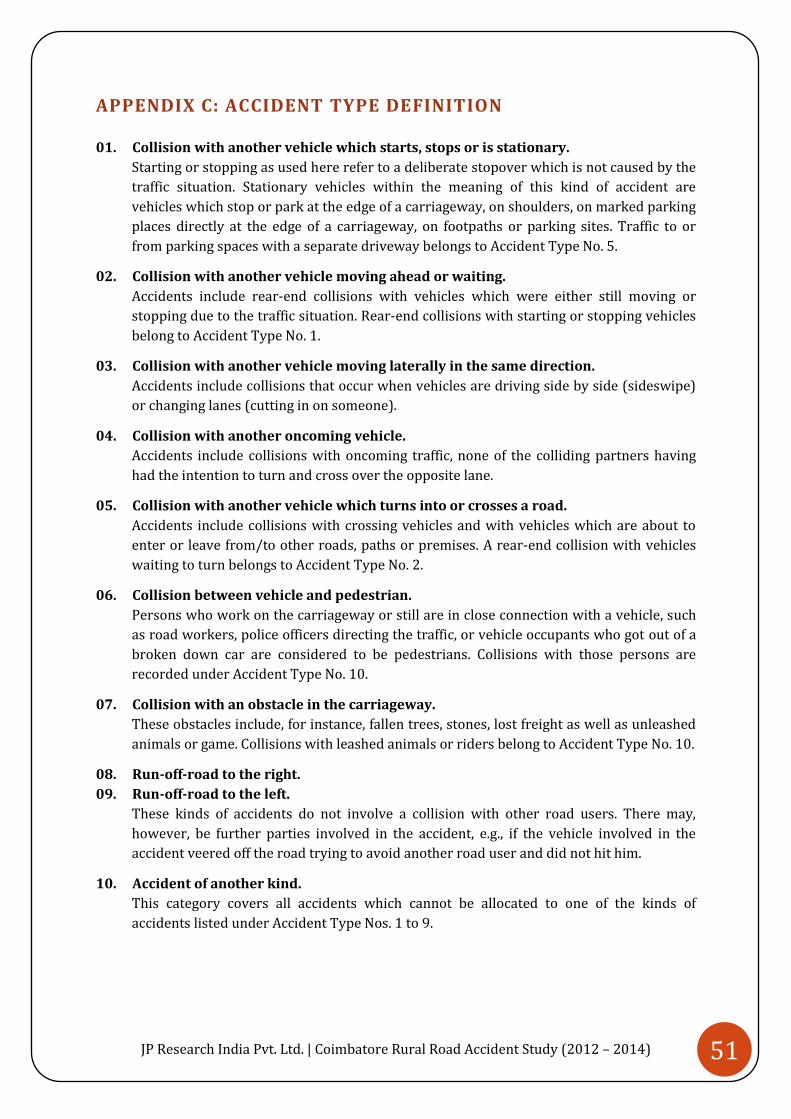
JP Research India Pvt. Ltd. | Coimbatore Rural Road Accident Study (2012 – 2014) 51
APPENDIX C: ACCIDENT TYPE DEFINITION
01. Collision with another vehicle which starts, stops or is stationary.
Starting or stopping as used here refer to a deliberate stopover which is not caused by the
traffic situation. Stationary vehicles within the meaning of this kind of accident are
vehicles which stop or park at the edge of a carriageway, on shoulders, on marked parking
places directly at the edge of a carriageway, on footpaths or parking sites. Traffic to or
from parking spaces with a separate driveway belongs to Accident Type No. 5.
02. Collision with another vehicle moving ahead or waiting.
Accidents include rear-end collisions with vehicles which were either still moving or
stopping due to the traffic situation. Rear-end collisions with starting or stopping vehicles
belong to Accident Type No. 1.
03. Collision with another vehicle moving laterally in the same direction.
Accidents include collisions that occur when vehicles are driving side by side (sideswipe)
or changing lanes (cutting in on someone).
04. Collision with another oncoming vehicle.
Accidents include collisions with oncoming traffic, none of the colliding partners having
had the intention to turn and cross over the opposite lane.
05. Collision with another vehicle which turns into or crosses a road.
Accidents include collisions with crossing vehicles and with vehicles which are about to
enter or leave from/to other roads, paths or premises. A rear-end collision with vehicles
waiting to turn belongs to Accident Type No. 2.
06. Collision between vehicle and pedestrian.
Persons who work on the carriageway or still are in close connection with a vehicle, such
as road workers, police officers directing the traffic, or vehicle occupants who got out of a
broken down car are considered to be pedestrians. Collisions with those persons are
recorded under Accident Type No. 10.
07. Collision with an obstacle in the carriageway.
These obstacles include, for instance, fallen trees, stones, lost freight as well as unleashed
animals or game. Collisions with leashed animals or riders belong to Accident Type No. 10.
08. Run-off-road to the right.
09. Run-off-road to the left.
These kinds of accidents do not involve a collision with other road users. There may,
however, be further parties involved in the accident, e.g., if the vehicle involved in the
accident veered off the road trying to avoid another road user and did not hit him.
10. Accident of another kind.
This category covers all accidents which cannot be allocated to one of the kinds of
accidents listed under Accident Type Nos. 1 to 9.
Related Documents