Cognitive processes in disorders of consciousness as revealed by EEG time–frequency analyses R. Fellinger a , W. Klimesch a , C. Schnakers b , F. Perrin c , R. Freunberger a,d , W. Gruber a , S. Laureys b , M. Schabus a,⇑ a Department of Psychology, Laboratory for Sleep and Consciousness Research and Division of Physiological Psychology, University of Salzburg, Hellbrunnerstraße 34, 5020 Salzburg, Austria b Cyclotron Research Center, University of Liège, Sart Tilman B30, 4000 Liege, Belgium c Neurosciences et Systèmes Sensoriels Unité Mixte de Recherche 5020, Université Claude Bernard Lyon 1 – CNRS, 69007 Lyon, France d Center for Lifespan Psychology Max Planck Institute for Human Development, Lentzeallee 94, 14195 Berlin, Germany article info Article history: Accepted 6 March 2011 Available online xxxx Keywords: Frontal theta Vegetative state Minimally conscious state Awareness highlights Oscillatory analyses are suggested for testing cognition in patients with disorders of consciousness. Time–frequency analysis examines cognitive processes reflected by different oscillations. Actively counting a name induces strong event-related synchronization of theta oscillations. abstract Objective: Although behavioral evaluation of awareness in disorders of consciousness is difficult it remains the clinical standard. We believe that the refinement of EEG and analyses techniques would improve our characterization of those patients. Methods: We focused on cognitive processing in a sample of 12 control subjects, eight vegetative-state patients, and 13 patients in the minimally consciousness state using EEG. We used an ‘active paradigm’ which asks subjects to follow instructions, specifically to actively count own or other names as compared to passively listening to them. EEG data was then analyzed using an advanced EEG analysis technique. Results: Results revealed that all groups exhibit a stronger theta-synchronization to their own names when forced to count them. We also observed a delay in theta power in response to targets relative to non-targets when participants were instructed to count their own name. Conclusion: Active paradigms are able to induce a different oscillatory activity compared to passive par- adigms. Differences between controls and the pathologic groups are prominent in the theta- and alpha- band. Significance: Time–frequency analyses allow to focus on distinct cognitive processes in patients with dis- orders of consciousness and thereby contribute to a refined understanding of severely brain-injured patients. Ó 2011 International Federation of Clinical Neurophysiology. Published by Elsevier Ireland Ltd. All rights reserved. 1. Introduction Progress of medicine in general and of intensive care in partic- ular has increased the number of patients who survive severe acute brain injury. Some of these patients recover from their coma with- in the first days after an insult others will take more time and go through different stages before fully or partially recovering aware- ness or before permanently losing all brain function (i.e., brain death). While coma is characterized by the absence of arousal and thus also of consciousness the vegetative state (VS) is characterized by ‘wakeful unawareness’. Patients in a vegetative state show sponta- neous eye opening, breathing and occasionally move their limbs in meaningless ways. Any evidence of communication, including a consistent response to command, or any purposeful movement indicates recovery of (minimally) consciousness. The minimally conscious state (MCS; Giacino et al., 2002) is used to describe patients who are unable to reliably follow instructions or communicate but who, nevertheless, demonstrate reproducible – 1388-2457/$36.00 Ó 2011 International Federation of Clinical Neurophysiology. Published by Elsevier Ireland Ltd. All rights reserved. doi:10.1016/j.clinph.2011.03.004 ⇑ Corresponding author. Tel.: +43 676 6306686. E-mail address: [email protected] (M. Schabus). Clinical Neurophysiology xxx (2011) xxx–xxx Contents lists available at ScienceDirect Clinical Neurophysiology journal homepage: www.elsevier.com/locate/clinph Please cite this article in press as: Fellinger R et al. Cognitive processes in disorders of consciousness as revealed by EEG time–frequency analyses. Clin Neurophysiol (2011), doi:10.1016/j.clinph.2011.03.004

Welcome message from author
This document is posted to help you gain knowledge. Please leave a comment to let me know what you think about it! Share it to your friends and learn new things together.
Transcript

Clinical Neurophysiology xxx (2011) xxx–xxx
Contents lists available at ScienceDirect
Clinical Neurophysiology
journal homepage: www.elsevier .com/locate /c l inph
Cognitive processes in disorders of consciousness as revealed by EEGtime–frequency analyses
R. Fellinger a, W. Klimesch a, C. Schnakers b, F. Perrin c, R. Freunberger a,d, W. Gruber a, S. Laureys b,M. Schabus a,⇑a Department of Psychology, Laboratory for Sleep and Consciousness Research and Division of Physiological Psychology, University of Salzburg, Hellbrunnerstraße 34, 5020Salzburg, Austriab Cyclotron Research Center, University of Liège, Sart Tilman B30, 4000 Liege, Belgiumc Neurosciences et Systèmes Sensoriels Unité Mixte de Recherche 5020, Université Claude Bernard Lyon 1 – CNRS, 69007 Lyon, Franced Center for Lifespan Psychology Max Planck Institute for Human Development, Lentzeallee 94, 14195 Berlin, Germany
a r t i c l e i n f o h i g h l i g h t s
Article history:Accepted 6 March 2011Available online xxxx
Keywords:Frontal thetaVegetative stateMinimally conscious stateAwareness
1388-2457/$36.00 � 2011 International Federation odoi:10.1016/j.clinph.2011.03.004
⇑ Corresponding author. Tel.: +43 676 6306686.E-mail address: [email protected] (M. Sch
Please cite this article in press as: Fellinger R eNeurophysiol (2011), doi:10.1016/j.clinph.2011
� Oscillatory analyses are suggested for testing cognition in patients with disorders of consciousness.� Time–frequency analysis examines cognitive processes reflected by different oscillations.� Actively counting a name induces strong event-related synchronization of theta oscillations.
a b s t r a c t
Objective: Although behavioral evaluation of awareness in disorders of consciousness is difficult itremains the clinical standard. We believe that the refinement of EEG and analyses techniques wouldimprove our characterization of those patients.Methods: We focused on cognitive processing in a sample of 12 control subjects, eight vegetative-statepatients, and 13 patients in the minimally consciousness state using EEG. We used an ‘active paradigm’which asks subjects to follow instructions, specifically to actively count own or other names as comparedto passively listening to them. EEG data was then analyzed using an advanced EEG analysis technique.Results: Results revealed that all groups exhibit a stronger theta-synchronization to their own nameswhen forced to count them. We also observed a delay in theta power in response to targets relative tonon-targets when participants were instructed to count their own name.Conclusion: Active paradigms are able to induce a different oscillatory activity compared to passive par-adigms. Differences between controls and the pathologic groups are prominent in the theta- and alpha-band.Significance: Time–frequency analyses allow to focus on distinct cognitive processes in patients with dis-orders of consciousness and thereby contribute to a refined understanding of severely brain-injuredpatients.� 2011 International Federation of Clinical Neurophysiology. Published by Elsevier Ireland Ltd. All rights
reserved.
1. Introduction
Progress of medicine in general and of intensive care in partic-ular has increased the number of patients who survive severe acutebrain injury. Some of these patients recover from their coma with-in the first days after an insult others will take more time and gothrough different stages before fully or partially recovering aware-
f Clinical Neurophysiology. Publish
abus).
t al. Cognitive processes in diso.03.004
ness or before permanently losing all brain function (i.e., braindeath).
While coma is characterized by the absence of arousal and thusalso of consciousness the vegetative state (VS) is characterized by‘wakeful unawareness’. Patients in a vegetative state show sponta-neous eye opening, breathing and occasionally move their limbs inmeaningless ways. Any evidence of communication, including aconsistent response to command, or any purposeful movementindicates recovery of (minimally) consciousness. The minimallyconscious state (MCS; Giacino et al., 2002) is used to describepatients who are unable to reliably follow instructions orcommunicate but who, nevertheless, demonstrate reproducible –
ed by Elsevier Ireland Ltd. All rights reserved.
rders of consciousness as revealed by EEG time–frequency analyses. Clin

2 R. Fellinger et al. / Clinical Neurophysiology xxx (2011) xxx–xxx
but fluctuating – behavioral evidence of awareness of self or theenvironment.
Unfortunately, evidence for MCS can easily be missed, espe-cially in patients whose senses and motor capacities are severelyimpaired and in whom a blink of an eye or the subtle movementof a finger may provide the only evidence of awareness (Laureyset al., 2005). Although behavioral assessment of disorders of con-sciousness (DOC) is susceptible to misdiagnosis mainly becauseof the use of inadequate scales or insufficient practical instruc-tion (Gill-Thwaites, 2006) it remains the only standard proce-dure in clinical daily routine. In order to improve thespecificity and sensitivity of diagnostic assessment, recently, anadditional application of neurophysiologic methods was sug-gested (Demertzi et al., 2008; Giacino et al., 2009). For the samereason and because bedside EEG is a simple way to measurebrain activity in response to external stimuli, several studiesduring the last years focused on preserved event-related poten-tials in DOC patients, in particular on the N100, MMN, P300and N400 (Kotchoubey et al., 2005; Vanhaudenhuyse et al.,2008). Progress in this line of research has lead to attempts touse ERPs as a potential tool for predicting the clinical outcome(Daltrozzo et al., 2007).
In the past it has been argued that ‘‘passive paradigms’’ (i.e.,without the need for wilful intervention by the patient) as adoptedin former event-related potential (ERP) and neuroimaging studiesmight merely identify neural activation which reflects automaticprocessing rather than demonstrating preserved awareness. Forexample, it could be demonstrated that with respect to auditorydesigns using stimuli with semantic content, speech processingmust not be strictly related to successful semantic comprehensionbut can simply reflect perception (Davis et al., 2007). Some morecritical evidence against standard procedures using passive stimu-lus presentation is that even in sleep reliable responses are obser-vable to salient stimuli, like the subject’s own name (Perrin et al.,1999).
In response to this, we modified our classical auditory ERP par-adigm (i.e., passive listening to own and other names; cf. (Perrinet al., 2006) and adopted an alternative ‘‘active’’ approach whichexplicitly asks subjects to follow instructions, specifically to ac-tively count own or other names as compared to passively listen-ing to them. Instruction following in ‘‘active paradigms’’ (Montiet al., 2009; Owen et al., 2006; Schnakers et al., 2008) allows toidentify awareness in the complete absence of motor behavior(including eye movements). Evidence that such ‘active’ ap-proaches can reveal some important insights in the actual condi-tion of a specific patient was brought by Schnakers et al. (2009).In this single-case study a 21 year old women suffering from totallocked-in syndrome was confronted with an active own name par-adigm. In fact, the patient showed an enhanced P300 to her ownnames when she was told to count compared to passive listeningto it; critically – 14 days later she showed reliable behavioral signsof consciousness.
In the following we want to present bedside EEG data using anactive paradigm and specifically an advanced EEG analysis tech-nique (event-related desynchronisation, ERD (Pfurtscheller andAranibar, 1977)) which might allow identifying otherwise hiddensigns of conscious awareness in DOC. Moreover, the applied meth-ods reveal the reactivity of ongoing oscillatory activity (i.e., theamplitude-size) in response to an event, which is not exactlytime-locked (like event-related potentials). The contribution ofongoing activity, especially in the lower frequency range (i.e., thetaand alpha) to cognitive processes related to memory and attentiondemands are well established (Klimesch, 1999). Therefore, task-related systematic changes in the oscillatory activity of DOCpatients could substantiate specific residual cognitive abilities orefforts in DOC patients.
Please cite this article in press as: Fellinger R et al. Cognitive processes in disoNeurophysiol (2011), doi:10.1016/j.clinph.2011.03.004
2. Methods
2.1. Subjects
A sample of 33 subjects, consisting of a control group andtwo types of disorders of consciousness (DOC) participated inthe present study. The control group comprised 12 subjects (8males, 4 females; mean age: 54 years). Furthermore, two DOCgroups were distinguished, one diagnosed as minimally con-sciousness conscious state (MCS; n = 13; 10 males, 3 females;mean age: 47 years) and another as vegetative state (VS; n = 8;6 males, 2 females; mean age: 47 years). Diagnosis was basedon internationally established criteria (cf., The Multi-Society TaskForce on PVS and (Giacino et al., 2002)). Only patients who didnot receive (i) centrally acting drugs, (ii) neuromuscular functionblockers and (iii) sedating drugs within 24 h preceding theexperiment were included. All patients had periods of eye open-ing, indicating preserved sleep–wake cycles. Table 1 providesindividual demographic data for all patients included in thesample.
2.2. Experimental procedure
The experiment comprised an auditory selective attentionparadigm (introduced by Schnakers et al. (2008)). The stimuliwere eight first names, the subject’s own name (SON) plus se-ven other unfamiliar names (UN’s). Stimuli were presentedacoustically in nine different sequences. Each sequence con-sisted of 120 stimuli, obtained by 15 random repetitions ofthe eight names. UN’s were common French names with noemotional background to the subjects (this was evaluated byan interview with the relatives). Names were recorded witha female voice (neutral intonation plus digitized) and pre-sented binaurally at a maximum of 90 dB. The ISI was1500 ms.
The experimental design consisted of three different condi-tions, one passive listening condition and two active countingtasks in which subjects had either to count their own name(‘count SON’condition) or a specific unfamiliar target name(‘count UN’condition). The experiment always started with thepassive listening condition, where subjects had only to listento the presented names without responding to them. The orderof the two active conditions was randomized between subjects.In the ‘count SON’-condition subjects were instructed to countthe appearance of the SON, whereas in the ‘count UN’-conditionsubjects were asked to count a specified UN. Thus, the two ac-tive conditions differed with respect to the target that had tobe counted. Before the presentation of each of the nine stimulussequences, the patients were briefly stimulated (e.g. by deeppressure stimulation which is a kind of intense ‘massage’ ofextremities) in order to ensure a sufficient arousal level. Betweeneach task condition there was a five minute break. All tasks wereperformed during states with open eyes.
2.3. Data acquisition
EEG was recorded bedside with a NuAmp EEG amplifier (Neu-roSoft, Sterling, VA). The sampling rate was set at 500 Hz. An ana-log bandpass filter from 0.1 to 200 Hz was used. The setupincluded three electrodes (Fz, Cz, Pz), a reference at the noseand a ground electrode near Fz. Additionally, EOG (two elec-trodes placed diagonally above and below the right eye) andEMG (two electrodes at the chin) were recorded. Impedanceswere kept below 5 kO and stimuli were presented binaurallyvia earphones.
rders of consciousness as revealed by EEG time–frequency analyses. Clin
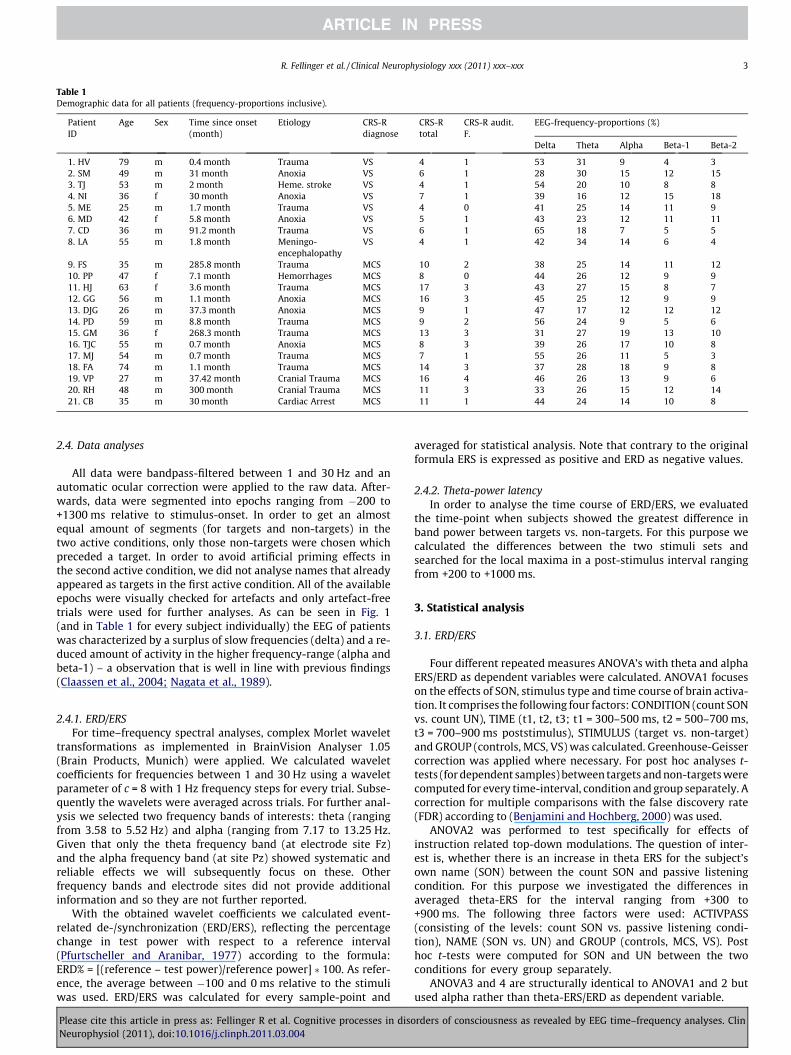
Table 1Demographic data for all patients (frequency-proportions inclusive).
PatientID
Age Sex Time since onset(month)
Etiology CRS-Rdiagnose
CRS-Rtotal
CRS-R audit.F.
EEG-frequency-proportions (%)
Delta Theta Alpha Beta-1 Beta-2
1. HV 79 m 0.4 month Trauma VS 4 1 53 31 9 4 32. SM 49 m 31 month Anoxia VS 6 1 28 30 15 12 153. TJ 53 m 2 month Heme. stroke VS 4 1 54 20 10 8 84. NI 36 f 30 month Anoxia VS 7 1 39 16 12 15 185. ME 25 m 1.7 month Trauma VS 4 0 41 25 14 11 96. MD 42 f 5.8 month Anoxia VS 5 1 43 23 12 11 117. CD 36 m 91.2 month Trauma VS 6 1 65 18 7 5 58. LA 55 m 1.8 month Meningo-
encephalopathyVS 4 1 42 34 14 6 4
9. FS 35 m 285.8 month Trauma MCS 10 2 38 25 14 11 1210. PP 47 f 7.1 month Hemorrhages MCS 8 0 44 26 12 9 911. HJ 63 f 3.6 month Trauma MCS 17 3 43 27 15 8 712. GG 56 m 1.1 month Anoxia MCS 16 3 45 25 12 9 913. DJG 26 m 37.3 month Anoxia MCS 9 1 47 17 12 12 1214. PD 59 m 8.8 month Trauma MCS 9 2 56 24 9 5 615. GM 36 f 268.3 month Trauma MCS 13 3 31 27 19 13 1016. TJC 55 m 0.7 month Anoxia MCS 8 3 39 26 17 10 817. MJ 54 m 0.7 month Trauma MCS 7 1 55 26 11 5 318. FA 74 m 1.1 month Trauma MCS 14 3 37 28 18 9 819. VP 27 m 37.42 month Cranial Trauma MCS 16 4 46 26 13 9 620. RH 48 m 300 month Cranial Trauma MCS 11 3 33 26 15 12 1421. CB 35 m 30 month Cardiac Arrest MCS 11 1 44 24 14 10 8
R. Fellinger et al. / Clinical Neurophysiology xxx (2011) xxx–xxx 3
2.4. Data analyses
All data were bandpass-filtered between 1 and 30 Hz and anautomatic ocular correction were applied to the raw data. After-wards, data were segmented into epochs ranging from �200 to+1300 ms relative to stimulus-onset. In order to get an almostequal amount of segments (for targets and non-targets) in thetwo active conditions, only those non-targets were chosen whichpreceded a target. In order to avoid artificial priming effects inthe second active condition, we did not analyse names that alreadyappeared as targets in the first active condition. All of the availableepochs were visually checked for artefacts and only artefact-freetrials were used for further analyses. As can be seen in Fig. 1(and in Table 1 for every subject individually) the EEG of patientswas characterized by a surplus of slow frequencies (delta) and a re-duced amount of activity in the higher frequency-range (alpha andbeta-1) – a observation that is well in line with previous findings(Claassen et al., 2004; Nagata et al., 1989).
2.4.1. ERD/ERSFor time–frequency spectral analyses, complex Morlet wavelet
transformations as implemented in BrainVision Analyser 1.05(Brain Products, Munich) were applied. We calculated waveletcoefficients for frequencies between 1 and 30 Hz using a waveletparameter of c = 8 with 1 Hz frequency steps for every trial. Subse-quently the wavelets were averaged across trials. For further anal-ysis we selected two frequency bands of interests: theta (rangingfrom 3.58 to 5.52 Hz) and alpha (ranging from 7.17 to 13.25 Hz.Given that only the theta frequency band (at electrode site Fz)and the alpha frequency band (at site Pz) showed systematic andreliable effects we will subsequently focus on these. Otherfrequency bands and electrode sites did not provide additionalinformation and so they are not further reported.
With the obtained wavelet coefficients we calculated event-related de-/synchronization (ERD/ERS), reflecting the percentagechange in test power with respect to a reference interval(Pfurtscheller and Aranibar, 1977) according to the formula:ERD% = [(reference – test power)/reference power] � 100. As refer-ence, the average between �100 and 0 ms relative to the stimuliwas used. ERD/ERS was calculated for every sample-point and
Please cite this article in press as: Fellinger R et al. Cognitive processes in disoNeurophysiol (2011), doi:10.1016/j.clinph.2011.03.004
averaged for statistical analysis. Note that contrary to the originalformula ERS is expressed as positive and ERD as negative values.
2.4.2. Theta-power latencyIn order to analyse the time course of ERD/ERS, we evaluated
the time-point when subjects showed the greatest difference inband power between targets vs. non-targets. For this purpose wecalculated the differences between the two stimuli sets andsearched for the local maxima in a post-stimulus interval rangingfrom +200 to +1000 ms.
3. Statistical analysis
3.1. ERD/ERS
Four different repeated measures ANOVA’s with theta and alphaERS/ERD as dependent variables were calculated. ANOVA1 focuseson the effects of SON, stimulus type and time course of brain activa-tion. It comprises the following four factors: CONDITION (count SONvs. count UN), TIME (t1, t2, t3; t1 = 300–500 ms, t2 = 500–700 ms,t3 = 700–900 ms poststimulus), STIMULUS (target vs. non-target)and GROUP (controls, MCS, VS) was calculated. Greenhouse-Geissercorrection was applied where necessary. For post hoc analyses t-tests (for dependent samples) between targets and non-targets werecomputed for every time-interval, condition and group separately. Acorrection for multiple comparisons with the false discovery rate(FDR) according to (Benjamini and Hochberg, 2000) was used.
ANOVA2 was performed to test specifically for effects ofinstruction related top-down modulations. The question of inter-est is, whether there is an increase in theta ERS for the subject’sown name (SON) between the count SON and passive listeningcondition. For this purpose we investigated the differences inaveraged theta-ERS for the interval ranging from +300 to+900 ms. The following three factors were used: ACTIVPASS(consisting of the levels: count SON vs. passive listening condi-tion), NAME (SON vs. UN) and GROUP (controls, MCS, VS). Posthoc t-tests were computed for SON and UN between the twoconditions for every group separately.
ANOVA3 and 4 are structurally identical to ANOVA1 and 2 butused alpha rather than theta-ERS/ERD as dependent variable.
rders of consciousness as revealed by EEG time–frequency analyses. Clin

4 R. Fellinger et al. / Clinical Neurophysiology xxx (2011) xxx–xxx
3.2. Theta-power latency
As variances were not homogeneous (according to Leven’s tests)the non-parametric Kruskal–Wallis test was used to compare thelatencies between groups and Mann–Whitney tests were per-formed for post hoc comparisons.
4. Results
4.1. ANOVA1, theta-ERS: effects of SON, stimulus type and time courseof brain activation
The respective findings, as summarized in Fig. 2a, show thattheta ERS is largest for targets under the SON condition. This obser-vation is reflected by the main effect for STIMULUS (F1/30 = 30.72,
Fig. 1. EEG frequency-proportions across groups. The bar-graphs depict therespective frequency-proportions for controls, MCS and VS patients averaged forall conditions (mean center-frequencies: delta = 2 Hz, theta = 5.5 Hz, alpha = 10 Hz,beta-1 = 16 Hz, beta-2 = 22.5 Hz). In general, a slowing of the EEG-signal can beobserved for patients (clear delta/theta dominance) together with a lack of higher-frequency oscillations (alpha and beta-1).
Fig. 2. Frontal theta ERS (Fz). (a) The graphic depicts the mean for targets and non-tarsubjects and three time-intervals post-stimulus. Post hoc analyses revealed that in the cowhereas in the count UN condition only healthy controls showed a target effect. The astecorrected for multiple comparison according to FDR (adjusted false discovery rate, seedelayed as compared to controls and even MC patients. (b) Frontal theta-ERS in the activetheta-ERS (from +300 to +900 ms) for their respective own names when they were toldcondition. The higher theta-ERS when actively counting SON in MCS patients could reflecfocus on the subjects own name. Alternatively, it has to noted that priming effects (i.e.fluctuations can account for the result.
Please cite this article in press as: Fellinger R et al. Cognitive processes in disoNeurophysiol (2011), doi:10.1016/j.clinph.2011.03.004
p < .001 and the interaction COND � STIMULUS (F1/30 = 13.13,p < .001). Furthermore, ERS is generally larger for control subjectsas compared to patients, and exhibits a differences in time as themain effects for GROUP (F2/30 = 24.58, p < .001), and TIME(F2/60 = 23.29, p < .001) indicate. Furthermore, these differencesare more pronounced for target-stimuli and also show a differenttime course between stimulus type and groups as the 3-way inter-action TIME � STIMULUS � GROUP, F4/60 = 12.06, p < .001), and thefollowing 2-way interactions, TIME � STIMULUS, (F2/60 = 5.52,p < .05) and TIME � GROUP (F4/60 = 13.25, p < .001) STIMU-LUS � GROUP (F2/30 = 10.97, p < .001) indicate.
Post-hoc t-tests, carried out to test for differences between tar-gets and non-targets revealed that in the SON condition, significanteffects were obtained in all of the three groups of subjects; con-trols: t1 (t11 = 6.11, p = .000), t2 (t11 = 5.99, p < .001), t3(t11 = 3.57, p < .01); MCS: t1 (t12 = 2.63, p < .05), t2 (t12 = 3.20,p < .01); VS: t2 (t7 = 2.68, p = .032), t3 (t7 = 2.88, p < .05). In sharpcontrast, in the UN condition (cf. the asterisks in Fig. 2a) no signif-icant differences were observed in the two groups of patients; con-trols: t1 (t11 = 3.37, p < .01), t2 (t11 = 3.10, p < .05).
4.2. ANOVA2, theta-ERS: instruction related top-down modulation
The differences between the two conditions, actively countingSON and passive listening are embedded in the 3-way interactionACTIVPASS � NAME � GROUP (F2/30 = 3.77, p < .05) which indicatesthat a higher extent of ERS to SON (as compared to UN) can beobserved in the active condition only and is largest for controlsubjects (cf. Fig. 2b). This pattern of results is also reflected bythe 2-way interactions. Additionally, the interactionsACTIVPASS � GROUP (F2/30 = 6.52, p < .01), and ACTIVPASS � NAME(F1/30 = 27.55, p < .001) as well as the main effects for NAME(F1/30 = 12.63, p < .001) and GROUP (F2/30 = 16.34, p < .001). Themain effect for ACTIVPASS closely missed the 5%-significance level(F1/30 = 3.99, p = .055). Post hoc tests for targets (i.e., SON) betweenthe active and passive condition revealed significant group effectsfor control subjects (p < .001) and the MCS group (p < .05). No post
gets for the two active conditions (count SON and count UN), the three groups ofunt SON condition every group shows higher frontal theta-ERS for the target name,
risks indicate the significance-level for post hoc t-tests (⁄⁄p < .01, ⁄p < .05), which areBenjamini & Hochberg, 2000). Also note that the theta ERS response in VS appears
(count SON) and passive listening condition. Controls and MCS show higher frontalto count them (‘count own name’-condition) compared to the ‘passive listening’-
t a top-down biased bottom-up driven response that is induced by the instruction to, passive conditions always precede active counting conditions) or simple baseline
rders of consciousness as revealed by EEG time–frequency analyses. Clin

Fig. 3. Theta-power latency. (a) Time–frequency difference-plots [targets (SON) –non-targets] for the ‘count own name’-condition at the frontal electrode Fz. Thedashed lines mark the presentation of the stimuli (names) and the rectangles thearea with the highest difference in the theta-range. Note the increasing processingdelay in theta power over groups. (b) To validate the prolonged latencies for thetheta-effect in DOC groups, this graph shows the mean time-points when subjectsexhibited the strongest difference between targets and non-targets in total power.In addition to prolonged theta peak latencies also the variance between groupsincrease with DOC severity probably reflecting less exact timing of stimulusprocessing (errorbars depict the standard deviations, asterisks indicate the respec-tive significance-level: �� < .01, � < .05).
R. Fellinger et al. / Clinical Neurophysiology xxx (2011) xxx–xxx 5
hoc tests between the two conditions were significant for non-tar-gets (i.e., UN). This finding rules out a simple block effect.
4.3. Theta-power latency
As the findings for ANOVA1 have shown, the time course of the-ta ERS is different between the patients and the control group.
Please cite this article in press as: Fellinger R et al. Cognitive processes in disoNeurophysiol (2011), doi:10.1016/j.clinph.2011.03.004
Visual exploration of the (wavelet) power plots (expressed as dif-ferences between targets and non-targets), as depicted in Fig. 3a,suggests that the time point of maximal theta power differencesis considerably later for patients as compared to controls. Statisti-cal analyses confirmed that the groups differed in the time-pointwhere they reached maximal difference in theta power (for targetsas compared to non-targets; v2 = 10.53, p = .005; see Fig. 3b). Post-hoc tests revealed that this is true for controls vs. VS(U(n1=12, n2=8) = 7.00, p < .01) and MCS vs. VS (U(n1=13, n2=8) = 23.50,p < .05) and that the variances increase for the DOC groups(Levene’s tests: controls vs. MCS, p < .01; controls vs. VS, p < .01)indicating an increasing time jitter in stimulus processing in DOC.
4.4. ANOVA3, alpha-ERD
The findings are summarized in Fig. 4a and show that alpha ERD islargest for control subjects and for SON. This result is reflected by themain effects for GROUP (F2/30 = 10.79, p < .001), and for STIMULUS(F1/30 = 15.23, p < .001), and the interaction STIMULUS � GROUP(F2/30 = 18.84, p < .001). These differences are interactively nestedwith TIME as the following interactions demonstrate: COND �TIME � GROUP (F4/60 = 3.64, p < .05), TIME � STIMULUS(F2/60 = 10.11, p < .001), TIME � GROUP (F4/60 = 4.96, p < .01), TIME �STIMULUS � GROUP (F4/60 = 15.61, p < .001), COND � TIME �STIMULUS (F2/60 = 6.17, p < .01). They show that the sharp increasein ERD over time (from t1 to t3) is more pronounced for (i) controlsubjects, (ii) SON and (iii) the count SON condition.
Post-hoc t-tests, carried out to test for differences between tar-gets and non-targets revealed that in the count SON condition, sig-nificant effects were obtained for control subjects and two timeintervals t2 and t3 only (t2: t11 = �5.78, p < .001; t3: t11 = �8.33,p < .001), as Fig. 4a shows. In the count UN condition significantdifferences were obtained for controls (t1: t11 = �3.49, p < .01; t2:t11 = �4.79, p < .001; t3: t11 = �4.31, p < .001), but most interest-ingly also for the MCS patient group (t: t12 = �3.25, p < .01; t2:t12 = �2.55, p < .05).
4.5. ANOVA4, alpha-ERD: count own name (active) vs. passivelistening
The effects between the two conditions, actively counting SONand passive listening are also embedded in the 3-way interactionACTIVPASS � STIMULUS � GROUP (F2/30 = 3.62, p < .05) whichmeans that a higher ERD to SON (as compared to UN) is evidentin the active condition for control subjects (cf. Fig. 4b). This lineof results is also reflected by the 2-way interaction ACTIV-PASS � GROUP (F2/30 = 4.38, p < .05 as well as the main effects forSTIMULUS (F1/30 = 9.76, p < .01) and GROUP (F2/30 = 6.47, p < .01).Post hoc tests for SON between the active and passive condition re-vealed a significant effect for control subjects only (p < .01).
5. Discussion
The findings of the present study indicate that both groups ofpatients (MCS and VS) are capable of responding neuronally withan increase in theta ERS to their own name (SON) when instructedto focus on and count their own name. No brain response to targetsin the theta frequency was observed for patients when they wereinstructed to focus on a specific unfamiliar name (i.e., UN targetvs. Other UN non-targets) or if they were passively listening totheir own name (cf. Fig. 2a and b). These findings suggest that pa-tients recovering from their disorder of consciousness were able torespond to the instruction (at least in essential parts) and try toestablish some kind of top-down processing stage. We also couldshow that the theta response in the count SON condition (mea-
rders of consciousness as revealed by EEG time–frequency analyses. Clin
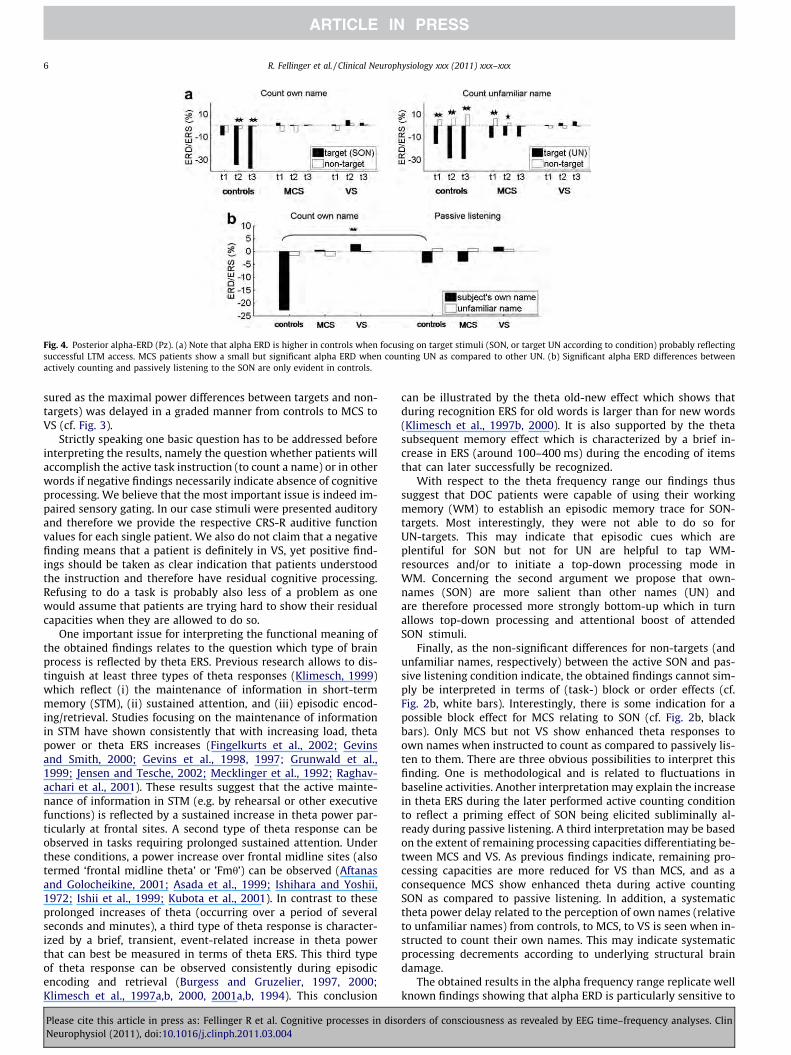
Fig. 4. Posterior alpha-ERD (Pz). (a) Note that alpha ERD is higher in controls when focusing on target stimuli (SON, or target UN according to condition) probably reflectingsuccessful LTM access. MCS patients show a small but significant alpha ERD when counting UN as compared to other UN. (b) Significant alpha ERD differences betweenactively counting and passively listening to the SON are only evident in controls.
6 R. Fellinger et al. / Clinical Neurophysiology xxx (2011) xxx–xxx
sured as the maximal power differences between targets and non-targets) was delayed in a graded manner from controls to MCS toVS (cf. Fig. 3).
Strictly speaking one basic question has to be addressed beforeinterpreting the results, namely the question whether patients willaccomplish the active task instruction (to count a name) or in otherwords if negative findings necessarily indicate absence of cognitiveprocessing. We believe that the most important issue is indeed im-paired sensory gating. In our case stimuli were presented auditoryand therefore we provide the respective CRS-R auditive functionvalues for each single patient. We also do not claim that a negativefinding means that a patient is definitely in VS, yet positive find-ings should be taken as clear indication that patients understoodthe instruction and therefore have residual cognitive processing.Refusing to do a task is probably also less of a problem as onewould assume that patients are trying hard to show their residualcapacities when they are allowed to do so.
One important issue for interpreting the functional meaning ofthe obtained findings relates to the question which type of brainprocess is reflected by theta ERS. Previous research allows to dis-tinguish at least three types of theta responses (Klimesch, 1999)which reflect (i) the maintenance of information in short-termmemory (STM), (ii) sustained attention, and (iii) episodic encod-ing/retrieval. Studies focusing on the maintenance of informationin STM have shown consistently that with increasing load, thetapower or theta ERS increases (Fingelkurts et al., 2002; Gevinsand Smith, 2000; Gevins et al., 1998, 1997; Grunwald et al.,1999; Jensen and Tesche, 2002; Mecklinger et al., 1992; Raghav-achari et al., 2001). These results suggest that the active mainte-nance of information in STM (e.g. by rehearsal or other executivefunctions) is reflected by a sustained increase in theta power par-ticularly at frontal sites. A second type of theta response can beobserved in tasks requiring prolonged sustained attention. Underthese conditions, a power increase over frontal midline sites (alsotermed ‘frontal midline theta’ or ’Fmh’) can be observed (Aftanasand Golocheikine, 2001; Asada et al., 1999; Ishihara and Yoshii,1972; Ishii et al., 1999; Kubota et al., 2001). In contrast to theseprolonged increases of theta (occurring over a period of severalseconds and minutes), a third type of theta response is character-ized by a brief, transient, event-related increase in theta powerthat can best be measured in terms of theta ERS. This third typeof theta response can be observed consistently during episodicencoding and retrieval (Burgess and Gruzelier, 1997, 2000;Klimesch et al., 1997a,b, 2000, 2001a,b, 1994). This conclusion
Please cite this article in press as: Fellinger R et al. Cognitive processes in disoNeurophysiol (2011), doi:10.1016/j.clinph.2011.03.004
can be illustrated by the theta old-new effect which shows thatduring recognition ERS for old words is larger than for new words(Klimesch et al., 1997b, 2000). It is also supported by the thetasubsequent memory effect which is characterized by a brief in-crease in ERS (around 100–400 ms) during the encoding of itemsthat can later successfully be recognized.
With respect to the theta frequency range our findings thussuggest that DOC patients were capable of using their workingmemory (WM) to establish an episodic memory trace for SON-targets. Most interestingly, they were not able to do so forUN-targets. This may indicate that episodic cues which areplentiful for SON but not for UN are helpful to tap WM-resources and/or to initiate a top-down processing mode inWM. Concerning the second argument we propose that own-names (SON) are more salient than other names (UN) andare therefore processed more strongly bottom-up which in turnallows top-down processing and attentional boost of attendedSON stimuli.
Finally, as the non-significant differences for non-targets (andunfamiliar names, respectively) between the active SON and pas-sive listening condition indicate, the obtained findings cannot sim-ply be interpreted in terms of (task-) block or order effects (cf.Fig. 2b, white bars). Interestingly, there is some indication for apossible block effect for MCS relating to SON (cf. Fig. 2b, blackbars). Only MCS but not VS show enhanced theta responses toown names when instructed to count as compared to passively lis-ten to them. There are three obvious possibilities to interpret thisfinding. One is methodological and is related to fluctuations inbaseline activities. Another interpretation may explain the increasein theta ERS during the later performed active counting conditionto reflect a priming effect of SON being elicited subliminally al-ready during passive listening. A third interpretation may be basedon the extent of remaining processing capacities differentiating be-tween MCS and VS. As previous findings indicate, remaining pro-cessing capacities are more reduced for VS than MCS, and as aconsequence MCS show enhanced theta during active countingSON as compared to passive listening. In addition, a systematictheta power delay related to the perception of own names (relativeto unfamiliar names) from controls, to MCS, to VS is seen when in-structed to count their own names. This may indicate systematicprocessing decrements according to underlying structural braindamage.
The obtained results in the alpha frequency range replicate wellknown findings showing that alpha ERD is particularly sensitive to
rders of consciousness as revealed by EEG time–frequency analyses. Clin
R. Fellinger et al. / Clinical Neurophysiology xxx (2011) xxx–xxx 7
retrieval of knowledge that is well integrated in long-term memory(LTM; Klimesch et al., 2007). The fact that control subjects exhibit asignificantly larger ERD to SON as compared to UN (under all activeconditions) underlines the validity of this interpretation. Mostinterestingly, no significant differences between SON and UN werefound for patients, suggesting that retrieval of knowledge storedalong with SON in LTM does not take place. The only significant ef-fect for patients was observed in the count UN condition for MCSsubjects. Here, patients exhibit a significantly larger ERD in re-sponse to the UN target as compared to non-targets. It can be spec-ulated that this may indicate either that MCS patients becameaware that the target was a name and/or that they were capableof establishing a LTM trace for the target item. A possible reasonwhy there were no findings present for the own-name conditioncould be due to the strong systematic theta-effects in this condi-tion that served as a confounding variable for systematic alpha-ef-fects in DOC patients. Nonetheless it should be mentioned that dueto the considerably reduced alpha-proportion in the EEG-spectrumof DOC patients those alpha effects have to be interpreted withcaution.
In clinical practice some EEG-parameter related to ongoingactivity have already been used, e.g. for the evolution of stroke.Some examples are the delta–alpha ratio (Claassen et al., 2004),the power Ratio Index (PRI, Nagata et al., 1989) and the meanBrain Symmetry Index (mBSI, van Putten, 2007). In general therelative ‘slowing’ of the power-spectrum is a stable phenomenonof many pathologic states (Kobylarz and Schiff, 2005). In contrastto the mentioned indices which solely rely on the task-unspecificactivity during a ‘resting’ period a clinical approach grounded onactive paradigms and concentrating on event-associated powerchanges would be able to reveal the reactivity of large, localneuronal assemblies entrained to a specific sub-band represent-ing the activity of a specific cognitive system.
Altogether the data indicate that time–frequency analyses al-low to focus on distinct cognitive processes and thereby contrib-ute to a refined understanding of residual cognitive processing inDOC. A limitation of the present study is that the results areconfined to the group-level. Nonetheless we believe that it iswarranted to identify valid paradigms and EEG signatures in or-der to apply these to a single-subject level in a next step. Futurestudies should therefore include longitudinal designs in order toinvestigate reliable oscillatory markers at an individual level. Webelieve that the increasing use and refinement of EEG and ad-vanced EEG analyses techniques has the potential to improveour clinical characterization of VS, and MCS patients, not onlyfor re(de)fining their diagnosis, but also to better differentiatepatients in terms of appropriate treatment (including adminis-tration of analgesics and access to neuro-rehabilitation pro-grams), outcome and end-of-life decisions. While EEG as anambulatory method carries the big advantage of being easilyintroduced to clinical DOC evaluation worldwide the presentedanalysis technique allows studying distinct cognitive processesby focusing on various brain oscillations which are simulta-neously present at all times. With this paper we hope to providea new perspective which might complement clinical diagnosis inthe future.
Funding
This research was funded by the Belgian Federal public health,Belgian Fund for Scientific Research (F.R.S.-FNRS), European Com-mission, James McDonnell Foundation, Mind Science Foundation,French Speaking Community Concerted Research Action (ARC-06/11-340), Fondation Médicale Reine Elisabeth, University of Liègeand the CNRS/FNRS-CGRI collaboration funds.
Please cite this article in press as: Fellinger R et al. Cognitive processes in disoNeurophysiol (2011), doi:10.1016/j.clinph.2011.03.004
References
Aftanas LI, Golocheikine SA. Human anterior and frontal midline theta and loweralpha reflect emotionally positive state and internalized attention: high-resolution EEG investigation of meditation. Neurosci Lett 2001;310:57–60.
Asada H, Fukuda Y, Tsunoda S, Yamaguchi M, Tonoike M. Frontal midline thetarhythms reflect alternative activation of prefrontal cortex and anteriorcingulate cortex in humans. Neurosci Lett 1999;274:29–32.
Benjamini Y, Hochberg Y. On the adaptive control of the false discovery rate inmultiple testing with independent statistics. J Educ Behav Stat 2000;25:60–83.
Burgess AP, Gruzelier JH. Short duration synchronization of human theta rhythmduring recognition memory. NeuroReport 1997;8:1039–42.
Burgess AP, Gruzelier JH. Short duration power changes in the EEG duringrecognition memory for words and faces. Psychophysiology 2000;37:596–606.
Claassen J, Hirsch LJ, Kreiter KT, Du EY, Sander Connolly E, Emerson RG, et al.Quantitative continuous EEG for detecting delayed cerebral ischemia in patientswith poor-grade subarachnoid hemorrhage. Clin Neurophysiol2004;115:2699–710.
Daltrozzo J, Wioland N, Mutschler V, Kotchoubey B. Predicting coma and other lowresponsive patients outcome using event-related brain potentials: a meta-analysis. Clin Neurophysiol 2007;118:606–14.
Davis MH, Coleman MR, Absalom AR, Rodd JM, Johnsrude IS, Matta BF, et al.Dissociating speech perception and comprehension at reduced levels ofawareness. Proc Natl Acad Sci USA 2007;104:16032–7.
Demertzi A, Vanhaudenhuyse A, Bruno MA, Schnakers C, Boly M, Boveroux P, et al. Isthere anybody in there? Detecting awareness in disorders of consciousness.Expert Rev Neurother 2008;8:1719–30.
Fingelkurts AA, Krause CM, Sams M. Probability interrelations between pre-/post-stimulus intervals and ERD/ERS during a memory task. Clin Neurophysiol2002;113:826–43.
Gevins A, Smith ME. Neurophysiological measures of working memory andindividual differences in cognitive ability and cognitive style. Cereb Cortex2000;10:829–39.
Gevins A, Smith ME, Leong H, McEvoy L, Whitfield S, Du R, et al. Monitoring workingmemory load during computer-based tasks with EEG pattern recognitionmethods. Hum Factors 1998;40:79–91.
Gevins A, Smith ME, McEvoy L, Yu D. High-resolution EEG mapping of corticalactivation related to working memory: effects of task difficulty, type ofprocessing, and practice. Cereb Cortex 1997;7:374–85.
Giacino JT, Ashwal S, Childs N, Cranford R, Jennett B, Katz DI, et al. The minimallyconscious state: definition and diagnostic criteria. Neurology 2002;58:349–53.
Giacino JT, Schnakers C, Rodriguez-Moreno D, Kalmar K, Schiff N, Hirsch J.Behavioral assessment in patients with disorders of consciousness: goldstandard or fool’s gold? Prog Brain Res 2009;177:33–48.
Gill-Thwaites H. Lotteries, loopholes and luck: misdiagnosis in the vegetative statepatient. Brain Inj 2006;20:1321–8.
Grunwald M, Weiss T, Krause W, Beyer L, Rost R, Gutberlet I, et al. Power of thetawaves in the EEG of human subjects increases during recall of hapticinformation. Neurosci Lett 1999;260:189–92.
Ishihara T, Yoshii N. Multivariate analytic study of EEG and mental activity inJuvenile delinquents. Electroencephalogr Clin Neurophysiol 1972;33:71–80.
Ishii R, Shinosaki K, Ukai S, Inouye T, Ishihara T, Yoshimine T, et al. Medial prefrontalcortex generates frontal midline theta rhythm. NeuroReport 1999;10:675–9.
Jensen O, Tesche CD. Frontal theta activity in humans increases with memory loadin a working memory task. Eur J Neurosci 2002;15:1395–9.
Klimesch W. EEG alpha and theta oscillations reflect cognitive and memoryperformance: a review and analysis. Brain Res Brain Res Rev 1999;29:169–95.
Klimesch W, Doppelmayr M, Pachinger T, Ripper B. Brain oscillations and humanmemory: EEG correlates in the upper alpha and theta band. Neurosci Lett1997a;238:9–12.
Klimesch W, Doppelmayr M, Schimke H, Ripper B. Theta synchronization and alphadesynchronization in a memory task. Psychophysiology 1997b;34:169–76.
Klimesch W, Doppelmayr M, Schwaiger J, Winkler T, Gruber W. Theta oscillationsand the ERP old/new effect: independent phenomena? Clin Neurophysiol2000;111:781–93.
Klimesch W, Doppelmayr M, Stadler W, Pöllhuber D, Sauseng P, Röhm D. Episodicretrieval is reflected by a process specific increase in humanelectroencephalographic theta activity. Neurosci Lett 2001a;302:49–52.
Klimesch W, Doppelmayr M, Yonelinas A, Kroll NEA, Lazzara M, Röhm D, et al. Thetasynchronization during episodic retrieval: neural correlates of consciousawareness. Brain Res Cogn Brain Res 2001b;12:33–8.
Klimesch W, Sauseng P, Hanslmayr S. EEG alpha oscillations: the inhibition-timinghypothesis. Brain Res Brain Res Rev 2007;53:63–88.
Klimesch W, Schimke H, Schwaiger J. Episodic and semantic memory: an analysis inthe EEG theta and alpha band. Electroencephalogr Clin Neurophysiol1994;91:428–41.
Kobylarz EJ, Schiff ND. Neurophysiological correlates of persistent vegetative andminimally conscious states. Neuropsychol Rehabil 2005;15:323–32.
Kotchoubey B, Lang S, Mezger G, Schmalohr D, Schneck M, Semmler A, et al.Information processing in severe disorders of consciousness: vegetative stateand minimally conscious state. Clin Neurophysiol 2005;116:2441–53.
Kubota Y, Sato W, Toichi M, Murai T, Okada T, Hayashi A, et al. Frontal midline thetarhythm is correlated with cardiac autonomic activities during the performanceof an attention demanding meditation procedure. Brain Res Cogn Brain Res2001;11:281–7.
rders of consciousness as revealed by EEG time–frequency analyses. Clin
8 R. Fellinger et al. / Clinical Neurophysiology xxx (2011) xxx–xxx
Laureys S, Piret S, Ledoux D. Quantifying consciousness. Lancet Neurol2005;4:789–90.
Mecklinger A, Kramer AF, Strayer DL. Event related potentials and EEG componentsin a semantic memory search task. Psychophysiology 1992;29:104–19.
Monti MM, Coleman MR, Owen AM. Executive functions in the absence of behavior:functional imaging of the minimally conscious state. Prog Brain Res2009;177:249–60.
Nagata K, Tagawa K, Hiroi S, Shishido F, Uemura K. Electroencephalographiccorrelates of blood flow and oxygen metabolism provided by positron emissiontomography in patients with cerebral infarction. Electroencephalogr ClinNeurophysiol 1989;72:16–30.
Owen AM, Coleman MR, Boly M, Davis MH, Laureys S, Pickard JD. Detectingawareness in the vegetative state. Science 2006;313:1402.
Perrin F, García-Larrea L, Mauguière F, Bastuji H. A differential brain response to thesubject’s own name persists during sleep. Clin Neurophysiol 1999;110:2153–64.
Perrin F, Schnakers C, Schabus M, Degueldre C, Goldman S, Brédart S, et al. Brainresponse to one’s own name in vegetative state, minimally conscious state, andlocked-in syndrome. Arch Neurol 2006;63:562–9.
Please cite this article in press as: Fellinger R et al. Cognitive processes in disoNeurophysiol (2011), doi:10.1016/j.clinph.2011.03.004
Pfurtscheller G, Aranibar A. Event related cortical desynchronization detected bypower measurements of scalp EEG. Electroencephalogr Clin Neurophysiol1977;42:817–26.
Raghavachari S, Kahana MJ, Rizzuto DS, Caplan JB, Kirschen MP, Bourgeois B, et al.Gating of human theta oscillations by a working memory task. J Neurosci2001;21:3175–83.
Schnakers C, Perrin F, Schabus M, Hustinx R, Majerus S, Moonen G, et al. Detectingconsciousness in a total locked-in syndrome: an active event-related paradigm.Neurocase 2009;15:271–7.
Schnakers C, Perrin F, Schabus M, Majerus S, Ledoux D, Damas P, et al.Voluntary brain processing in disorders of consciousness. Neurology 2008;71:1614–20.
van Putten MJAM. The revised brain symmetry index. Clin Neurophysiol2007;118:2362–7.
Vanhaudenhuyse A, Laureys S, Perrin F. Cognitive event-related potentials incomatose and post-comatose states. Neurocrit Care 2008;8:262–70.
rders of consciousness as revealed by EEG time–frequency analyses. Clin
Related Documents