Cognitive Effectiveness of Visual Instructional Design Languages Kathrin Figl (corresponding author) WU - Vienna University of Economics and Business, Institute for Information Systems & New Media UZAII, Augasse 2-6, A-1090 Vienna, Austria Tel +43 1 31336 4467, Fax +43 1 31336 90 4467 3 [email protected] Michael Derntl University of Vienna, Austria [email protected] Manuel Caeiro Rodriguez University of Vigo, Spain [email protected] Luca Botturi NewMinE Lab, Università della Svizzera italiana, Switzerland [email protected] Figl, K., Derntl, M., Rodriguez, M.C., Botturi, L. (2010). Cognitive Effectiveness of Visual Instructional Design Languages. Journal of Visual Languages and Computing, 21 (6), 359–373.

Welcome message from author
This document is posted to help you gain knowledge. Please leave a comment to let me know what you think about it! Share it to your friends and learn new things together.
Transcript
Cognitive Effectiveness of Visual
Instructional Design Languages
Kathrin Figl (corresponding author)
WU - Vienna University of Economics and Business, Institute for Information
Systems & New Media
UZAII, Augasse 2-6, A-1090 Vienna, Austria
Tel +43 1 31336 4467, Fax +43 1 31336 90 4467 3
Michael Derntl
University of Vienna, Austria
Manuel Caeiro Rodriguez
University of Vigo, Spain
Luca Botturi
NewMinE Lab, Università della Svizzera italiana, Switzerland
Figl, K., Derntl, M., Rodriguez, M.C., Botturi, L. (2010). Cognitive
Effectiveness of Visual Instructional Design Languages. Journal of Visual
Languages and Computing, 21 (6), 359–373.
KATHRIN
Schreibmaschinentext
Figl, K., Derntl, M., Rodriguez, M.C., Botturi, L. (2010). Cognitive Effectiveness of Visual Instructional Design Languages. Journal of Visual Languages and Computing, 21 (6), 359–373.
1
Cognitive Effectiveness of Visual
Instructional Design Languages
Abstract: The introduction of learning technologies into education is making the
design of courses and instructional materials an increasingly complex task.
Instructional design languages are identified as conceptual tools for achieving
more standardized and, at the same time, more creative design solutions, as
well as enhancing communication and transparency in the design process. In
this article we discuss differences in cognitive aspects of three visual
instructional design languages (E²ML, PoEML, coUML), based on user
evaluation. Cognitive aspects are of relevance for learning a design language,
creating models with it, and understanding models created using it. The findings
should enable language constructors to improve the usability of visual
instructional design languages in the future. The paper concludes with
directions with regard to how future research on visual instructional design
languages could strengthen their value and enhance their actual use by
educators and designers by synthesizing existing efforts into a unified modeling
approach for VIDLs.
Keywords: Visual Design Languages, Cognitive Effectiveness, Instructional
Design, Visual Notations, E²ML, PoEML, CoUML
2
1 Introduction
When an architect is in charge of designing a new house, s/he usually starts –
right after what an engineer would refer to as a requirements analysis – with
some sketch about the division and uses of the available space. The architect
would then refine this and translate the design solution into a visual
representation that the client could see, understand and discuss, and then into
some executive plans that s/he would hand out to the construction staff.
Architects exploit a number of such visual representations as part of the
process of analyzing design problems, thinking about solutions, and
communicating with stakeholders and other partners. Examples include
blueprints, structural drawings, electrical wiring schemas, and three-dimensional
displays of the house. The ability to use such representations, as part of their
design language, is very important for architects — as it is for industrial and
graphic designers, software architects and designers, musicians, and for all
those involved in a design activity with a long tradition.
For instructional designers — architects of learning environments — using a
visual instructional design language (VIDL) for modeling different aspects of
courses involving the use of new media, has similar advantages. The
contemporary rise of new, advanced learning technologies such as e-learning,
mobile learning, serious gaming, and simulations — often in combination with
the introduction of “new learning” models such as problem-based learning,
case-based learning, competency-based learning, etc. — has significantly
increased the complexity of teaching and learning processes (Jochems, van
Merrienboer et al. 2003). This requires more advanced design and development
3
processes in which communication is supported by the use of shared design
languages that are detailed and formal. In response, VIDLs for instructional
designers and developers are emerging as a new conceptual tool in order to
deal with this complexity. For example, two handbooks on instructional design
languages (Botturi and Stubbs 2008; Lockyer, Bennett et al. 2008) and a
chapter on the same topic in the AECT Research Handbook (Gibbons, Botturi
et al. 2008) have been published recently.
However, until now, there has been a discrepancy between the attention paid to
VIDLs in research and their actual usage by instructional designers. In practice,
instructional designers find it difficult to use VIDLs due to their unfamiliarity and
to the intrinsic complexity of the languages used (Boot, Nelson et al. 2007).
Therefore, conceptions about the usability and cognitive effectiveness of VIDLs
are of practical relevance in order to provide a solid basis for evaluating and
comparing existing VIDLs and guiding practitioners in choosing an appropriate
language. As previous research has demonstrated for a range of products,
design aesthetics positively influence perceived usability (Sonderegger and
Sauer 2010), and it is likely that the design of VIDLs influences user’s desire to
become familiar with a VIDL. Existing literature comparing VIDLs (Botturi 2005;
Botturi, Derntl et al. 2006; Figl and Derntl 2006) focuses mainly on formal
aspects of the languages; evaluations from the user point of view are rare up to
now. There are a few studies that assess the usability of specific VIDLs (e.g.
(Costagliola, Lucia et al. 2008)), but little research has been conducted on
comparative evaluation of VIDLs.
4
To fill this research gap, in this article we investigate different VIDLs according
to their cognitive effectiveness. We aim to bridge the gap between the
theoretical descriptions and the specifications of VIDLs, and the practical
application of those languages in design processes. Previous research on
constructing domain specific visual (modeling) languages has shown that it is
difficult to choose the appropriate concepts for visualization without
emphasizing too specific concepts or too general ones (Kelly and Pohjonen
2009), which may lead to low cognitive effectiveness resulting in low adoption
rates. To take this into account, we specifically focus on the way VIDLs deal
with the complexity of the educational domain (e.g. what perspectives or model
types they provide). In this article, the discussion and evaluation of three
selected VIDLs is theoretically grounded on a recently published framework on
the desirable properties of visual languages (Moody 2009).
The remainder of this paper is structured as follows. First, we begin with a
general introduction and overview of VIDLs and their purposes. Then, we
present a review of relevant theoretical perspectives on the cognitive
effectiveness and management of the design complexity of visual modeling
languages, with a specific focus on complexity management for the educational
domain. We then continue by discussing selected VIDLs based on
considerations of cognitive effectiveness and presenting the results of the user
evaluation. Finally, conclusions are drawn and directions for further research
are presented.
5
2 Visual Instructional Design Languages (VIDL)
A design language is defined as a set of concepts that support structuring
design (i.e. specification) or development (i.e. production) and help conceiving
innovative solutions (Gibbons and Brewer 2004). Although a design language is
a mental construct, it can be expressed, and thus turned into a means of
communication, through visual notation. A visual notation/language includes
“…a set of graphical symbols, a set of compositional rules for how to form valid
visual sentences, and definitions of their meanings” (Moody 2009).
Design languages are of interest to a broad audience in different disciplines
(e.g. (Winograd 1987; Rheinfrank and Evenson 1996)). In comparison to
general-purpose modeling languages like UML (Unified Modeling Language)
(Object Management Group 2009), VIDLs are domain-specific modeling
languages for the instructional domain. The aim of VIDLs is similar to
educational modeling languages, which have been proposed as providing a
“…semantic information model and binding, describing the content and process
within a ‘unit of learning’ from a pedagogical perspective in order to support
reuse and interoperability” (Rawlings, van Rosmalen et al. 2002). In contrast,
however, VIDLs do not necessarily provide a binding of the conceptual meta-
model underlying the language to a domain-specific or machine-readable
format (e.g. XML).
2.1 Purpose of VIDLs
For a discussion or evaluation of VIDLs, we need to clarify their intended
purpose (Botturi 2005). From a practical point of view, a language is
6
fundamental in order to allow a community to share their practices (Lave and
Wenger 1991). Using VIDLs is the first step in narrating such practices, and
therefore to engage in reflective thinking as presented, for example, in Schön’s
“reflection on action” (Schön 1983). Visual models may help by providing a
working space for problem solving in exploring, creating, refining and
redesigning design solutions. A common language means that a community
has a means to name and describe its environment and its inner dynamics, to
identify problems – design problems in this case –, analyze them, and describe
design solutions. A language is the medium for the creation of a common
ground (Clark and Brennan 1991), i.e. a shared understanding of a problem and
of its possible solutions, and eventually of a shared culture, in terms of the
collection and construction of solutions and principles over time. Therefore, the
language may improve communication, e.g. in design team meetings with fewer
misunderstanding between experts and stakeholders due to the existence of a
consistent terminology (Figl and Derntl 2006). Further purposes of VIDLs
include the documentation, sharing and reuse of final design solutions. VIDLs
may facilitate the investigation and diagnosing of different e-learning settings
according to their quality, and comparing them with respect to course design
principles, as for example the alignment of face-to-face and online activities. In
this way, instructional models expressed with a VIDL can support a more
profound understanding of e-learning scenarios.
The use of design languages further allows designers and developers to
generate and share design patterns. A design pattern captures the essential
bits and pieces of a design solution to be adapted and reused over and over
7
again for similar problems (Alexander, Ishikawa et al. 1977; Gamma, Helm et al.
1995). VIDLs can be used to complement the textual description of the design
solution using visual models and illustrations.
Last, but not least, by specifying educational requirements in specific e-learning
settings, VIDLs may help to bridge the gap between design and
implementation. The production of a detailed and unambiguous model of
instruction could then eventually be fed into an application (such as a learning
management system) in order to generate a digital learning environment,
although not all VIDLs support this aspect by offering a machine-readable
binding.
3 Cognitive Aspects of Visual Languages
A VIDL will only find acceptance when it supports educational designers and
teaching practitioners. From a cognitive point of view, the interaction with VIDLs
includes two main aspects, namely (a) the creation (authoring) of models and
(b) the understanding (reading) of models (Gemino and Wand 2004). Not all
VIDLs require the same effort (e.g. time, subjective ease-of-use) to learn the
language and to construct models. Additionally, models from different VIDLs are
likely to differ according to the effort required to interpret them and to develop
an understanding; VIDLs may also differ in the perceived difficulty of obtaining
information through their visual representation. These aspects show the
complex interplay between human cognitive models and visual instructional
design models. A higher degree of match between the designer’s mental image
and the visual model of a learning design “…can facilitate comprehension and
eliminate needless mental transformation” (Waters and Gibbons 2004). That is,
8
cognitive effectiveness is embodied in the ability of a VIDL to support
appropriate translations between cognitive and visual models. Up to now, a
variety of underlying cognitive theories have been adopted with regard to the
context of visual modeling, often in an attempt to explore potential benefits of
the visual representation. Examples include cognitive load theory (Sweller
1988), cognitive fit theory (Vessey 1991), cognitive dimensions framework for
notational systems (Green and Petre 1996) and the theory of multimedia
learning (Mayer 2001). The form of visual information representation can have a
significant impact on the efficiency of information search, the explicitness of
information, and problem solving (Larkin and Simon 1987). Moody (Moody
2009) proposed 9 principles for the cognitively effective design of visual
languages: semiotic clarity, graphic economy, perceptual discriminability, visual
expressiveness, dual coding, semantic transparency, cognitive fit, complexity
management and cognitive integration. These principles are described in more
detail in the following subsections.
3.1 Semiotic Clarity and Graphic Economy
Semiotic clarity refers to the importance of a one-to-one correspondence
between selected concepts and their visual representation by a symbol.
Anomalies such as symbol redundancy (more than one symbol representing the
same concept), overload (one symbol representing more than one concept),
symbol excess and deficit (when there are graphical symbols without a
correspondence to a semantic construct, or vice versa) should be avoided,
since they lead to ambiguity and additional unnecessary cognitive load for the
user (Moody 2009). Research on the creation of domain-specific modeling
9
languages reveals typical problems, e.g. that too many generic concepts for the
domain or too many semantically overlapping concepts are chosen for a
language; or that the language developer puts too much emphasis on specific
concepts while neglecting other equally important concepts (Kelly and Pohjonen
2009). A reasonable balance between the expressiveness of a language and
the number of the symbols is demanded by the principle of graphic economy.
3.2 Perceptual Discriminability, Visual Expressiveness and
Dual Coding
Perceptual discriminability is the “…ease and accuracy with which graphical
symbols can be differentiated from each other” (Moody 2009). Visual languages
which fully exploit the range of visual variables (e.g. spatial dimensions, shape,
size, color, brightness, orientation, and texture) for their symbols offer a greater
amount of visual expressiveness. If symbols differ according to several visual
variables (e.g. color and size), they can be easily distinguished, and if a symbol
has a unique value in the form of a visual variable, it is easily recognized. In
comparison to a textual representation, which is encoded verbally in the reading
direction, visual symbols are internally encoded in their spatial arrangement
(Santa 1977). Therefore, the use of spatial dimensions (e.g. swimlanes in UML
activity diagrams) can be especially recommended for visual languages. A wise
combination of text and graphical representation is referred to as dual coding,
and represents a further dimension for cognitively effective visual languages
(Moody 2009).
10
3.3 Semantic Transparency
Semantic transparency describes whether symbols and their corresponding
concepts are easily associated (Moody 2009). Icons, for example, are easily
associated with their referent real-world concepts. Concerning the modeling of
sequential learning activities, natural interpretations of the spatial relationships
of symbols can be taken advantage of, e.g. elements on the left or above other
elements are likely to imply some cause or one being a predecessor of the
other (Winn 1990). Additionally, a visual depiction of nodes and edges is likely
to be intuitively understandable because of its similarity to internal mental
representations of concepts and their relationships (Bajaj and Rockwell 2005).
3.4 Cognitive Fit
Cognitive fit refers to the fit between the problem representation and the
strategies required to perform a specific task (Vessey 1991). Therefore, the
cognitive effectiveness of a visual language might be different for experts and
for beginners, or for sketching on paper versus using a modeling software
application. A single VIDL could provide different visual dialects for each
relevant user group, or task, as a means of improving its cognitive fit (Moody
2009).
3.5 Complexity Management and Cognitive Integration
According to Moody (Moody 2009) complexity management “…refers to the
ability of a visual notation to represent information without overloading the
human mind”. Cognitive load is determined by the number of elements that
should be considered simultaneously (Kirschner 2002), and there is a natural
11
limit with regard to the capacity of the human short-term memory of
approximately 7 +/– 2 elements (Miller 1956). However, although the number of
elements is limited, their size and complexity is not. Chunking expands the
capacity of short-term memory, because information units belonging together
are chunked into one unit (Gobet, Lane et al. 2001). A language should provide
mechanisms to manage complexity in order to impose as low a cognitive load
on users as possible, so that individual models do not overwhelm users by
exposing them to too much complexity.
There are two main mechanisms that can be applied to manage complexity:
modularization and hierarchical structuring. Modularization works by dividing
complex domains into smaller parts (“chunks”). Languages may provide
different subsystems or level structures. A larger problem becomes more easily
manageable if it is broken down into separate parts. A lack of modularization
and too high coupling between interconnected diagrams, may cause difficulties
in maintaining models (Kelly and Pohjonen 2009). Hierarchical structuring
provides different levels of detail (abstraction/summarization vs.
decomposition/refinement), which makes complex concepts more easily
understandable for humans (Moody 2009).
Modularization, or the intent to provide different perspectives, leads to multiple
diagrams which belong together and represent a domain. The principle of
cognitive integration (Moody 2009) is important in terms of supporting the
understanding of relationships between different models. Important methods to
support cognitive integration are the provision of summary (overview) models
and the showing of the context of the whole system in each single model, each
12
of which represents only a smaller, specific part (Kim, Hahn et al. 2000).
Additionally, navigational maps depicting all models and their relationships, as
well as the clear labeling and numbering of levels, supports the viewers’
orientation (Moody 2009).
3.5.1 Complexity Management in Visual Instructional Design
Languages
In the following section, we present a framework for analyzing the complexity
management of VIDLs, partly building on the work in (Boot 2005), and partly
based upon the observation that different diagram types of VIDLs address
different ways of thinking, take different perspectives and focus on different
aspects of the domain. Previous research on the comparison and the evaluation
of VIDLs (Botturi 2005; Figl and Derntl 2006) provides a thorough basis for
selecting dimensions of complexity management. Existing efforts will be briefly
described and embedded in the context of the selected dimension.
Although complexity management in general is not specific to the instructional
design domain, how this domain is captured and conceptualized by VIDLs is of
specific interest. We identify three dimensions that reflect the characteristic
management of domain complexity in VIDLs: (1) stratification, (2) elaboration,
and (3) perspective. Stratification (organization) and elaboration (level of detail)
have already been identified by (Boot, Nelson et al. 2007) as important
variables for improving the organization of design documents using a layered
design architecture. The dimensions are explained in the following subsections.
13
3.5.2 Dimension 1: Elaboration (hierarchical structuring)
The “elaboration” dimension relates to ways how VIDLs enable us to represent
levels of abstraction, depending on the proximity of the modeled concepts to the
actual implementation. A language may support one or more degrees of
elaboration of design. Each particular diagram type of a VIDL is able to
represent and describe more or less detail of a particular design artifact. We
propose three levels of elaboration which were adapted from Fowler (Fowler
2003), and which are characterized as follows:
1. The conceptual level allows for a general, aggregate view of the design,
indicating its rationale and main elements. This degree of elaboration is
particularly suited for early design stages and idea generation.
2. The specification level provides means for a more comprehensive
description, including the design elements at more specific levels. This
degree of elaboration is suited for adding more detail to conceptual
representations in order to achieve a better understanding of higher-level
concepts. It can also be used to prepare the transition to the
development stage.
3. The implementation level represents the highest level of detail. This
degree of elaboration is typically required for the development of design
artifacts (e.g. learning objects).
3.5.3 Dimension 2: Stratification (Modularization)
Stratification refers to domain-specific complexity management through
modularization, by structuring the domain according to different design layers.
For instance, Gibbons (Gibbons 2003) proposes the following structure of seven
14
design layers for instructional design, in order to organize the discussion about
instructional design languages:
1. Content layer: analysis of the content and structure of the domain
2. Strategy layer: design of the instructional tasks and activities required to
achieve the instructional goals
3. Control layer: design of the learner interaction with the instructional
system (actions, control flow, etc.)
4. Message layer: design of the messages (information presented to the
learner) as indicated by the strategy layer
5. Representation layer: design of the media, tools, and methods that
represent (e.g. visualize) the design
6. Media logic layer: design of the logic of the instructional application
(software architecture, learning objects logic, etc.)
7. Management layer: design of the data management and administration
processes.
Some researchers have tried to classify VIDLs according to design layers,
because many languages do not cover all layers. For instance in (Fernández-
Manjón, Sánchez-Pérez et al. 2007; Martinez-Ortiz, Moreno-Ger et al. 2007),
the authors distinguish three different types of VIDLs which focus on different
layers: content structuring languages (focus on the content layer), activity
languages (focus on the strategy layer) and evaluation languages. Evaluation
languages cannot be directly mapped to the seven layers listed above.
However, evaluation seems to be another important layer, targeting issues of
problem-solving and question-answering in the learning process.
15
Any particular VIDL can be either single-layered (i.e. applicable to exactly one
of the seven layers) or multi-layered (i.e. applicable to more than one layer). A
multi-layered language offers a set of visual representations for describing
entities of different types, such as people and roles, activities, or learning
materials, at different layers of design. Each layer exposes a different set of
design goals, problems, structures, and terms that would need to be addressed
and supported by the design language. Consequently, while multi-layered
languages can be more expressive and detailed, they also require more effort
to support the cognitive integration of different model types. Single-layered
languages are easier and more straightforward to use, while limiting the number
of “views” on design solutions.
3.5.4 Dimension 3: Perspective
As outlined in (Moody 2009), visual languages often do not only provide
hierarchical structuring or modularization, but also provide heterogeneous
model types, e.g. for representing and visualizing different perspectives. A VIDL
can offer one single or multiple perspectives on the same concept or model.
Multiple-perspective languages offer different tools for representing more than
one view on the same set of entities. For example, one language can have
representations both for chronological relationships between learning activities
as well as for structural relationships between learning activities. Further
concrete instances of perspectives are, for example, the learners’ or teachers’
points of view.
Note that both perspectives could be at the same level of elaboration and could
be located on the same layer; that is, the perspective dimension is independent
16
of stratification and elaboration. While each additional perspective adds more
detail and facets to the entity under consideration, the cognitive integration of
perspectives becomes increasingly difficult. Depending on the use of the
language, an additional perspective can be used to clarify ambiguities about
particular concepts among different designers. An additional perspective might
also be some required artifact needed to satisfy computational or execution
constraints.
4 Evaluation of Cognitive Effectiveness of Selected VIDLs
(E²ML, PoEML, CoUML)
This section presents three VIDLs and discusses their diagram types according
to criteria for cognitive effectiveness as presented in the theoretical part of the
paper. First, we outline the method used to perform the user evaluation. Then,
we describe the selected VIDLs and discuss their main diagram types in terms
of salient positive and negative aspects raised during the user evaluation.
Therefore, not all nine criteria for cognitive effectiveness as defined by (Moody
2009) are discussed for each diagram type. Rather, the focus is particularly on
examples of good design as well as violations of cognitive effectiveness. The
section concludes with a presentation of results and the findings arising from
the user evaluation.
4.1 Method
The evaluation of the VIDLs was based on two aspects. In the first qualitative
part (“the creation of diagrams”), users were asked to acquaint themselves
with the languages and to actively create models of course designs. In the
17
second, more quantitatively-oriented part (“the evaluation of diagram types”),
the cognitive effectiveness and usefulness of a set of existing diagrams
modeled in different languages was rated by a different sample of users in a
web-based questionnaire. Thus, the evaluation involved the main cognitive
activities in terms of the creation and interpretation of diagrams. Additionally it
included a few users with knowledge of the languages for the qualitative
evaluation, as well as a larger sample of users for the quantitative evaluation.
The creation of diagrams: Five independent experts (3 graduate students with
backgrounds in information systems modeling and new media, and 2 course
instructors from an information systems department), who were familiar with the
cognitive effectiveness criteria, but unfamiliar with the languages, were asked to
become acquainted with the language descriptions. After learning the
languages, they modeled two courses using the provided diagram types in each
of the languages. Then they provided feedback on the languages. Since the
modeling process (in particular the tools provided) is supported quite differently
by different languages, these evaluations are not immediately comparable.
Nevertheless, the qualitative evaluations revealed several problems that
beginners might face when learning these languages. A variety of points for
improvements were identified and included in the discussion of the languages.
The evaluation of diagram types: For this evaluation, three different diagram
types were selected for each language, and a web-based questionnaire
instrument was created. Since there were no existing scales for the cognitive
effectiveness criteria, two-item scales were constructed for each criterion that
could be evaluated for each given diagram. In order to evaluate cognitive fit,
18
complexity management and cognitive integration, knowledge of more diagram
types and their relationships would be necessary. Therefore, these criteria were
not included in the questionnaire. Additionally a scale on the perceived
usefulness of diagram types as proposed by (Maes and Poels 2007) was
adapted for VIDLs and included in the questionnaire. We ran a pre-test with 3
participants for ensuring content validity and for ensuring the understandable
formulation of items before administering the questionnaire. Reliability analysis
revealed adequate internal consistency for all scales (Cronbach’s α > 0.8, with
the exception of visual expressiveness (Cronbach’s α = 0.6) and semiotic clarity
(Cronbach’s α = 0.2)), for which we then analyzed single item scores.
The final sample consisted of 20 participants (11 males, 9 females), aged 34
years on average. Most participants were course instructors (11), while some
were members of the e-learning support team of universities (3) or researchers
in the context of instructional design (6). The participants had already been
involved in the creation of 5 different instructional designs (e.g. courses) on
average.
4.2 E²ML – Educational Environment Modeling Language
E²ML (Botturi 2006; Botturi 2008) was developed mainly as a thinking tool for
instructional designers and for enhancing communication within large e-learning
projects. The result is a language with a very limited number of symbols, and
with a set of diagram types that cover two different layers of detail (overview
and action detail) and two perspectives (temporal and structural). Learning
goals, requirements and the design of teaching and learning activities can be
modeled. There is a more specific tool for goal classification that was developed
19
in conjunction with E²ML: the Quail model (Botturi), which is a visual model for
the definition and classification of high-level learning goals. E²ML modeling
starts with the definition and mapping of educational goals, then all available
resources (actors, resources, tools) are listed (in tabular form) and action
diagrams (learning and support activities) are modeled as the core of the design
solution. Action diagrams are presented in structured tables and not by the use
of visual symbols. They are the core part of E²ML and represent educational
activities. Relationships between actions, as for example inheritance and
aggregation, can also be expressed. Finally, overview diagrams are created
such as a timeline as a visualization of the “course calendar”, or a structural
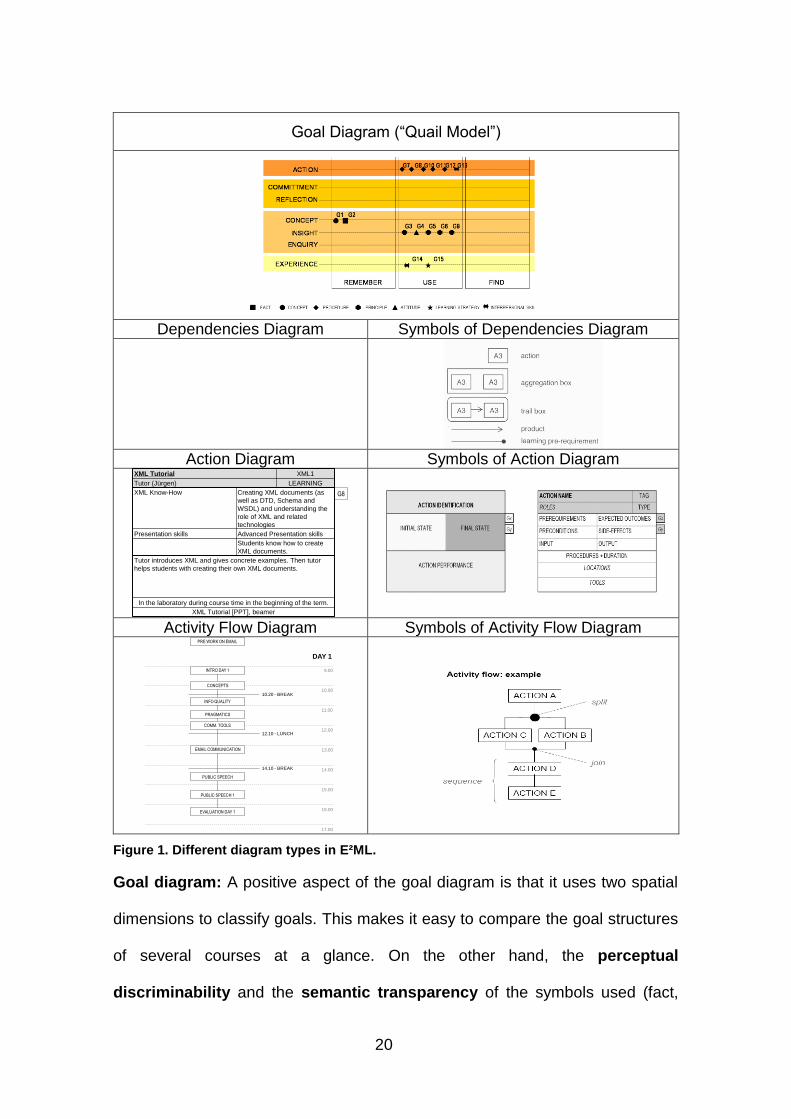
overview of the activities (dependencies diagram) (Botturi 2003). Thus, three
main diagram types can be identified: (1) goal definitions (2) action diagrams
and (3) overview diagrams (dependencies and activity flow diagram) (Botturi
and Belfer 2003) as depicted in Figure 1.
20
Goal Diagram (“Quail Model”)
Dependencies Diagram Symbols of Dependencies Diagram
Action Diagram Symbols of Action Diagram
G8Creating XML documents (as
well as DTD, Schema and
WSDL) and understanding the
role of XML and related
technologies
XML Know-How
Students know how to create
XML documents.
Advanced Presentation skills
XML Tutorial [PPT], beamer
In the laboratory during course time in the beginning of the term.
Tutor introduces XML and gives concrete examples. Then tutor
helps students with creating their own XML documents.
Presentation skills
LEARNINGTutor (Jürgen)
XML1XML Tutorial
Creating XML documents (as
well as DTD, Schema and
WSDL) and understanding the
role of XML and related
technologies
XML Know-How
Students know how to create
XML documents.
Advanced Presentation skills
XML Tutorial [PPT], beamer
In the laboratory during course time in the beginning of the term.
Tutor introduces XML and gives concrete examples. Then tutor
helps students with creating their own XML documents.
Presentation skills
LEARNINGTutor (Jürgen)
XML1XML Tutorial
Activity Flow Diagram Symbols of Activity Flow Diagram PRE WORK ON EMAIL
9.00
13.00
12.10 - LUNCH
10.20 - BREAK
14.10 - BREAK
17.00
10.00
11.00
12.00
14.00
15.00
16.00
COMM. TOOLS
PRAGMATICS
EMAIL COMMUNICATION
PUBLIC SPEECH
INFO QUALITY
PUBLIC SPEECH 1
EVALUATION DAY 1
CONCEPTS
INTRO DAY 1
DAY 1
Figure 1. Different diagram types in E²ML.
Goal diagram: A positive aspect of the goal diagram is that it uses two spatial
dimensions to classify goals. This makes it easy to compare the goal structures
of several courses at a glance. On the other hand, the perceptual
discriminability and the semantic transparency of the symbols used (fact,
21
concept, procedure, etc.) are quite low — they only vary according to their form
and no other visual variable such as size or color is used. Dual coding is
realized via a legend, but it demands cognitive effort to simultaneously switch
between symbols in the visual grid and descriptions of the symbols below.
Dependencies diagram: This diagram displays an overview of the
actions/activities in a course block on research paper writing. It shows different
kinds of dependencies among action elements (rectangles). For instance, the
“collect literature”, “content draft”, and “paper writing” actions have the “paper
writing workshop” as a prerequisite (indicated by an arrow with a dotted head).
Collecting the literature and drafting the paper content produces relevant
literature and a content draft as products, respectively, that are input to the
“paper writing” activity (indicated by simple arrows). Finally, the presentations
require the completed paper as a prerequisite. The visualization of the product
relationships seems to be more easily understandable than those of the pre-
requirement relationship due to the use of arrows. All the “group work” actions
are represented as an aggregation box around the relevant actions. The
aggregation boxes representing grouping exhibit semantic transparency, i.e.
they can be understood without explanation.
Action diagram: The action diagram is represented in the form of a table. This
provides a good overview, but designers have to remember the meaning of all
the cells as there are no hints provided once a table is filled out. It is possible to
decompose actions into sub-actions to model several levels of detail. Cognitive
integration between action diagrams and goal diagrams is realized via a
22
navigational cue: an identifier tag (a small rectangle attached to the action
diagram with an abbreviation of the corresponding goal).
Activity flow: The activity flow diagram describes the temporal and logical flow
of the educational activities during a course. As opposed to common practice in
process modeling, no start and end symbols and no arrows are used to
visualize the control flow. As long as textual information about dates and times
provide dual coded information, the flow direction should not be difficult to
interpret. When activity flow diagrams as well as dependencies diagrams are
used, the problem of symbol overload occurs: a small dot represents a join of
different activity flows as well as a pre-requirement relationship between
different actions, respectively.
4.3 PoEML – Perspective-oriented Educational Modeling
Language
The Perspective-oriented Educational Modeling Language (PoEML) (Caeiro-
Rodríguez 2007; Caeiro-Rodríguez 2008) stems from a study of the expressive
power of current instructional design languages, with a specific focus on
IMS Learning Design (IMS LD) (IMS Global 2003; IMS Global 2003) and
integrates many concepts from workflow modeling and groupware. It focuses on
the separation of 13 different perspectives on educational designs (e.g.,
structural, functional, participants, environment, data and data flow, tools, order
and control flow, etc.). In constructing these perspectives, overlaps between
perspectives were reduced to a minimum, so that perspectives can be modeled
independently of one another. This appears to be true for most perspectives;
23
though, for example the data perspective models are integrated with several
other diagram types. Consequently, hierarchical structuring is provided by
decomposition into several independent model types (Caeiro-Rodríguez,
Marcelino et al. 2007). Additionally, PoEML uses a second orthogonal kind of
cross-cutting concerns and distinguishes between four different aspects (modes
of control) describing how an educational unit is carried out during runtime
(constant-fixed, data-based/conditioned, event-based/signaled or decision-
based behaviour). The relationships between several diagram types are
described in the meta-model. PoEML provides an extremely rich and expressive
tool which can be used by designers to model educational scenarios on
different aggregation levels (e.g. single lessons or whole curricula). It also offers
a set of patterns for modeling in each of the perspectives. The output is coded
in XML. Similar to IMS LD, PoEML can hardly be used without a graphical user
interface application, of which a prototype is available (J-PoEML; (Caeiro-
Rodríguez 2008)).
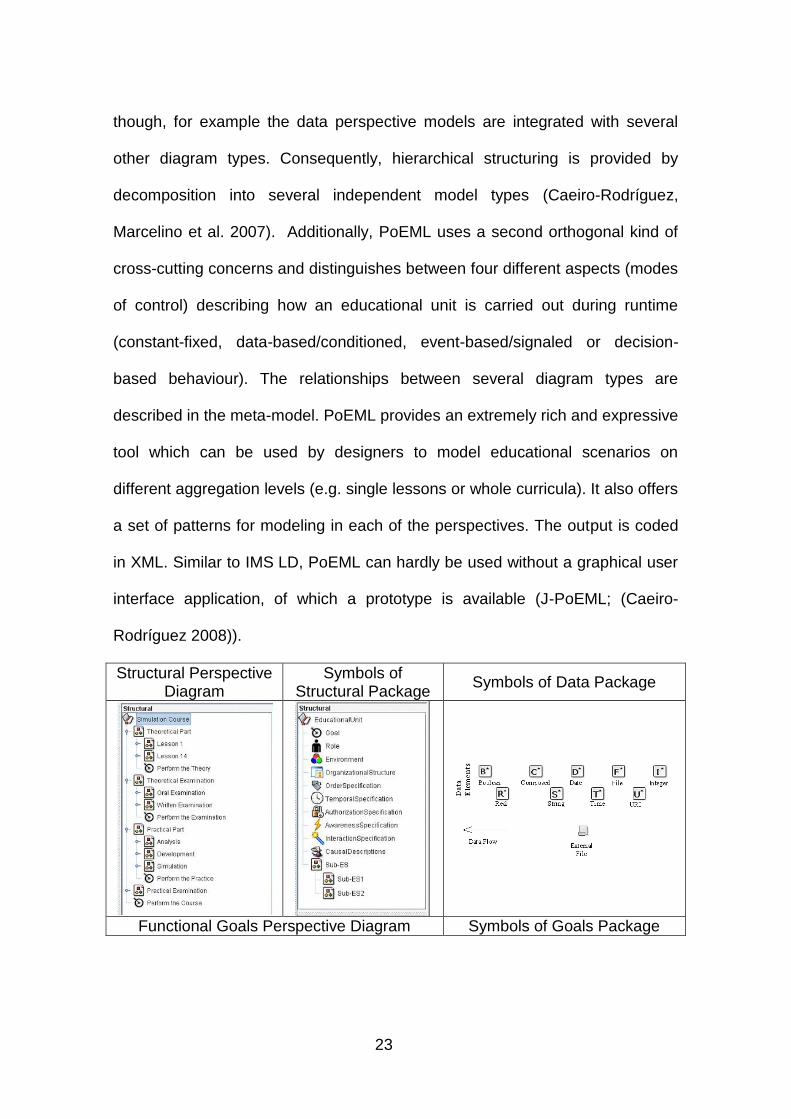
Structural Perspective Diagram
Symbols of Structural Package
Symbols of Data Package
Functional Goals Perspective Diagram Symbols of Goals Package
24
Participants’ Perspective Diagram Symbols of Participants
Package
Environments’ Perspective Diagram Symbols of Environments
Package
Order Perspective Diagram Symbols of Order Package
Temporal Perspective Diagram Symbols of Temporal Package
25
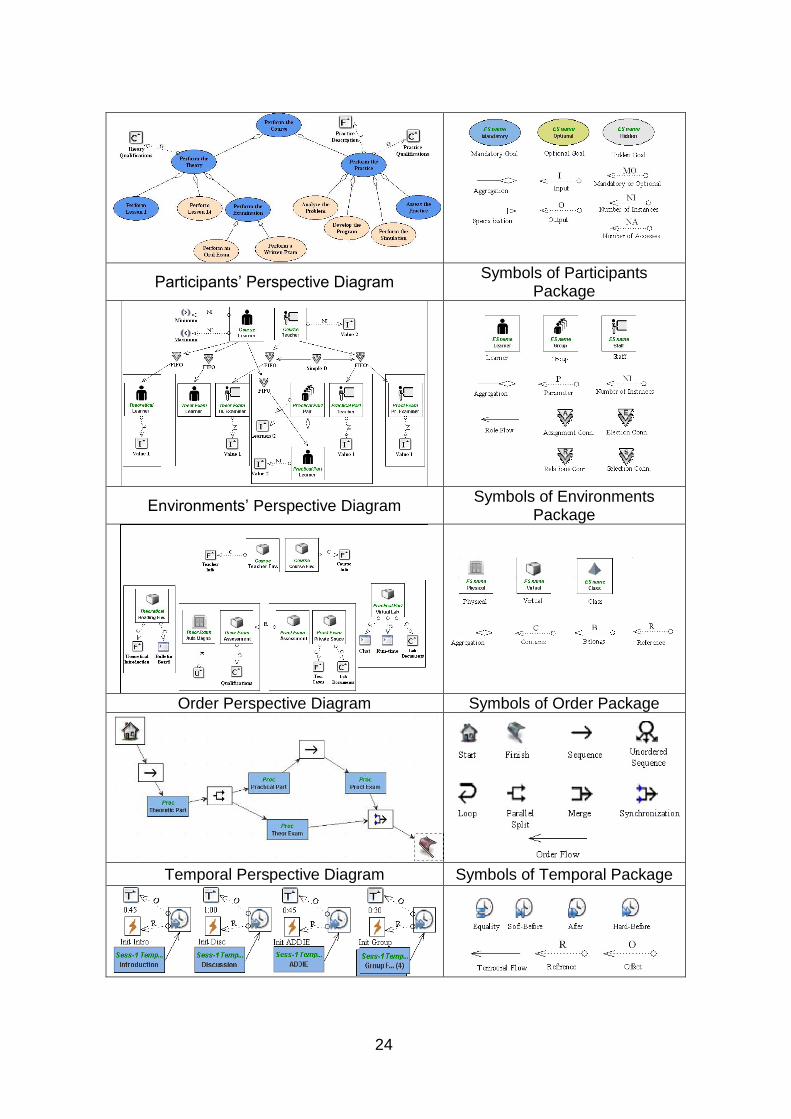
Figure 2. Different diagram types and symbol sets in PoEML (Caeiro-Rodríguez,
Marcelino et al. 2007; Caeiro-Rodríguez 2008).
Structural perspective diagram: The structural perspective provides an
overview of several elements of an educational scenario (e.g. a course). In
general, the symbols used as part of the structural package provide high
semantic transparency due to their iconic representation. However, not all of
them are similarly intuitive. For example, for “order specification” and “causal
descriptions”, it might be possible to find symbols with higher perceptual
immediacy.
The structural perspective allows for hierarchical aggregation and the
refinement of educational scenarios, visualized in the form of a hierarchical tree,
which should be easily understandable. Concerning semiotic clarity, users might
be irritated that, on the highest level of detail, a different symbol is used for an
educational unit/scenario than on lower levels.
Functional goal perspective diagram: Functional goals refer to the tasks that
participants have to perform, and not to knowledge, skills or abilities that could
be attained in an educational setting, as in the goal diagram of E²ML. This is
one of the few diagram types in which the visual variable color is explicitly used
to convey information (mandatory, optional or hidden goals).
Participants’ perspective diagram: In this diagram type, different roles are
modeled (e.g. learner, instructor). Here, it is also possible to model roles and
sub-roles hierarchically. The sample diagram demonstrates that a high level of
detailed information and specific rules can be visualized in PoEML. For
instance, the minimum and maximum number of learners and teachers is
defined by the attached data element symbols. Moreover, it is modeled that a
26
specific algorithm (first-in-first-out) is used to assign learners to exams or pairs
in the practical part. The use of data elements allows the refining of a design up
to a very detailed implementation level, as compared to the two other VIDLs
under investigation here. On the other hand, for beginners, the great variety of
symbols and connection types might be confusing.
Environments’ perspective diagram: This diagram visualizes whether
activities are performed in a virtual or a physical environment (e.g. a laboratory)
and which tools (e.g. a document) and artifacts (e.g. a text-editor) are used by
the participants.
Order perspective diagram and temporal perspective diagram: The order
diagram and the temporal diagram visualize in what logical order and under
what temporal constraints educational scenarios (comparable to activities and
actions in other languages) are performed, respectively. It is likely to be intuitive
due to the left-to-right layout of the sequence, and the use of arrows between
activities. Therefore, the meaning of the icons used to represent the start
(house) and the end (flag) also becomes obvious. On the other hand, the order
connectors (sequence, parallel split and synchronization) are dispensable.
Since the alignment of connecting arrows represents the same process flow,
users might even get irritated due to symbol redundancy.
4.4 CoUML – Cooperative UML
CoUML is an educational modeling language that can be used to model
technology-enhanced learning and cooperation environments (Derntl and
Motschnig-Pitrik 2008). CoUML stands for “Cooperative UML”, indicating that its
notation system is essentially an extension of the UML used to model
27
cooperative activities and environments. The notation has been revised and
improved over several years during its application in practice; it was used to
model blended learning courses for documentation purposes and for finding
patterns of recurring activities and structures in technology-enhanced
environments. Being based on UML, it exposes a formal notation system
allowing (a) the modeling of structural concepts like the documents, goals, and
roles involved; and (b) the modeling of activities performed by roles in the target
environment, incorporating relevant objects from the structural models (e.g.,
documents used in or produced by activities, or goals achieved by activities).
The structural models use generalization/specialization concepts, as well as
dependency relationships (e.g., include, derive, successor-of, or use) and the
overview diagram shows how the diagrams relate to each other. CoUML offers
the following diagram types as illustrated in Figure 3.
28
Course Activity Diagram Learning Goals Diagram Instructor StudentsTeams
Web Engineering
Block 3: Requirements engineering
Download resources
on requirements
engineering w
Lecture on requirements
engineering P
Requirements
specification
presentations P
Read requirements
specification
guidelines
Read downloaded
resources
Do requirements
analysis and
specification
Submit requirements
specifications w
Read
specifications
Provide general- and
team feedback w
Read
feedback w
Supervise forum and
provide feedbackw
Download requirements
specification guidelinesw
Use discussion
forum
(optional)
w
Requirements
specifications
Questions
Team
feedback
General
feedback
Monday
(w eek 2)
Friday, 2 PM
(w eek 2)
Sunday
(w eek 3)
Tuesday, 2 PM
(w eek 4)
Learning goals
All learning
goals have
same priority.
«goal»
Creating small-scale
web applications
1
«goal»
Conducting a
requirements
analysis
2«goal»
Creating a
conceptual
model
3
«goal»
Creating a data
model
4 «goal»
Creating a
navigation model
5
«goal»
Implement an
application concept
in teamwork
6«goal»
Understand data
storage and query
techniques
8
«goal»
Understand basic
web technology
7
«goal»
Understand web
script programming
9
Document Diagram Role Diagram Block 3: Requirements engineering
«document»
Lecture slides: Requirements
engineering
RE 1
«document»
Requirements engineering
case study paper
RE 2
«document»
Requirements specification
guidelines
RE 4
«document»
Requirements specifications
RE 5Instructor
Student
Team
«document»
Team feedbacks for
requirements specifications
RE 6
«document»
General feedback for
requirements specifications
RE 3
Roles
Instructor Tutor StudentGroup
4
Course Structure Diagram Course Package Diagram Course Structure Model (CSM)
Introduction to
Instructional Design
Session 1: Introduction
Session 2: Instructional
analysis
Session 3: Learning
goals
Session 4: Instructional
strategy
Session 5: Conclusion
Course: "Introduction to Instructional Design"
Course Activity Model (CAM)
Documents
Learning goals Roles
Course Structure Model (CSM)
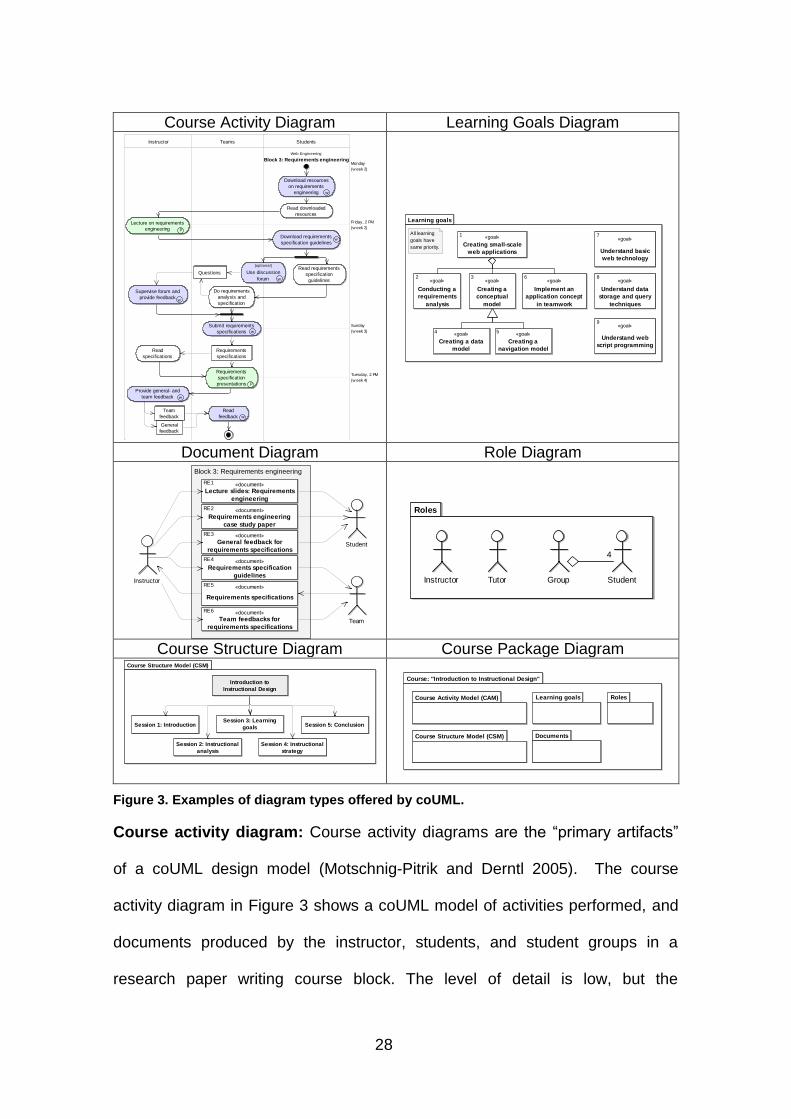
Figure 3. Examples of diagram types offered by coUML.
Course activity diagram: Course activity diagrams are the “primary artifacts”
of a coUML design model (Motschnig-Pitrik and Derntl 2005). The course
activity diagram in Figure 3 shows a coUML model of activities performed, and
documents produced by the instructor, students, and student groups in a
research paper writing course block. The level of detail is low, but the
29
perspective is different: here, the focus is on the temporal aspect. This diagram
shows how coUML is used to demonstrate different areas of responsibility
(those of instructor, student, and group), and how activities (rounded
rectangles) are arranged in chronological order (solid arrows), including the
documents (rectangular boxes) produced and consumed (dotted arrows) by
those activities. This model type is an extension of UML activity diagrams; the
most notable extensions include the visualization of points in time and the
different stereotypes for declaring activities as proceeding primarily face-to-face,
web-based, or in a blended mode (Motschnig-Pitrik and Derntl 2005). It is
worthwhile to mention that a positive cognitive aspect of this diagram is the use
of two spatial dimensions to depict information on roles (represented as so-
called “swimlanes” in UML) and the temporal aspect, leading to high visual
expressiveness. The diagram’s notation is based on UML activity diagrams,
which generally provide high perceptual discriminability of symbols (Figl,
Mendling et al. 2010).
Learning goals diagram: This diagram is used to model the intended learning
goals (rectangles carrying the keyword «goal») to be achieved by learners.
Specific goals can be generalized by higher-level goals using the UML
generalization relationship (a solid-line arrow with a hollow triangle pointing to
the more general goal). Aggregate goals can be decomposed into a set of sub-
goals by using UML aggregation relationships (solid connectors with a hollow
diamond at the aggregate end). Learning goal diagrams do not perform well on
the visual expressiveness dimension, since goals at all levels, and of any
30
type, have the same simple symbol. Other than that, these diagrams are
graphically economic.
Document diagram: Document diagrams are used to model structural
overviews of the documents that are provided and created during the runtime.
Documents are modeled as a rectangle carrying the name of the document and
the keyword «document». There are several types of relationships that can be
modeled between documents: aggregation (similar to goals, see above), and a
dependency between documents, which indicates that one document requires
another document. This diagram type also allows for modeling the providers
and consumers of documents by linking document symbols with role symbols
using dotted arrows (either unidirectional or bidirectional). This notation should
be easily understandable since it is semantically transparent and graphically
economic.
Role diagram: The role diagram is used to model the roles that participate in
and interact with each other during the instruction. It is a structural model that
represents roles (e.g. instructor or student) as stick-figures. Roles can be
associated with each other, either using a support dependency (a dashed arrow
carrying the keyword «support») or a UML aggregation relationship, indicating
that a role may be part of another role (e.g. in groupwork scenarios, students
are organized in groups, introducing the group role). Role diagrams are typically
simple, since most instructional designs will not involve more than a handful of
different actor roles.
Course structure diagram and course package diagram: Finally, the course
structure diagram acts as visual index to the course activity diagrams, and the
31
course package diagram shows, in an overview diagram, the components of the
whole design solution. Both diagram types exhibit only a small set of symbols,
i.e. package symbols and rectangles with arrow connectors.
4.5 Evaluation Results
This section presents the results of the user evaluation of the selected diagram
types of the three languages, E²ML, PoEML and coUML. Since the different
diagram types of the languages did vary to a great extent according to criteria
such as perceptual discriminability or semantic transparency, it is difficult to
offer a general evaluation for a language. The overall evaluation for a language
may also differ from the mean value of the scores for its diagram types; for
instance, semiotic clarity might be high for specific diagram types yet low for
the whole language if a symbol has different meanings in different diagram
types. Therefore, the evaluation results are presented separately for each
diagram type. Table 1 shows the descriptive results of the user evaluation.
32
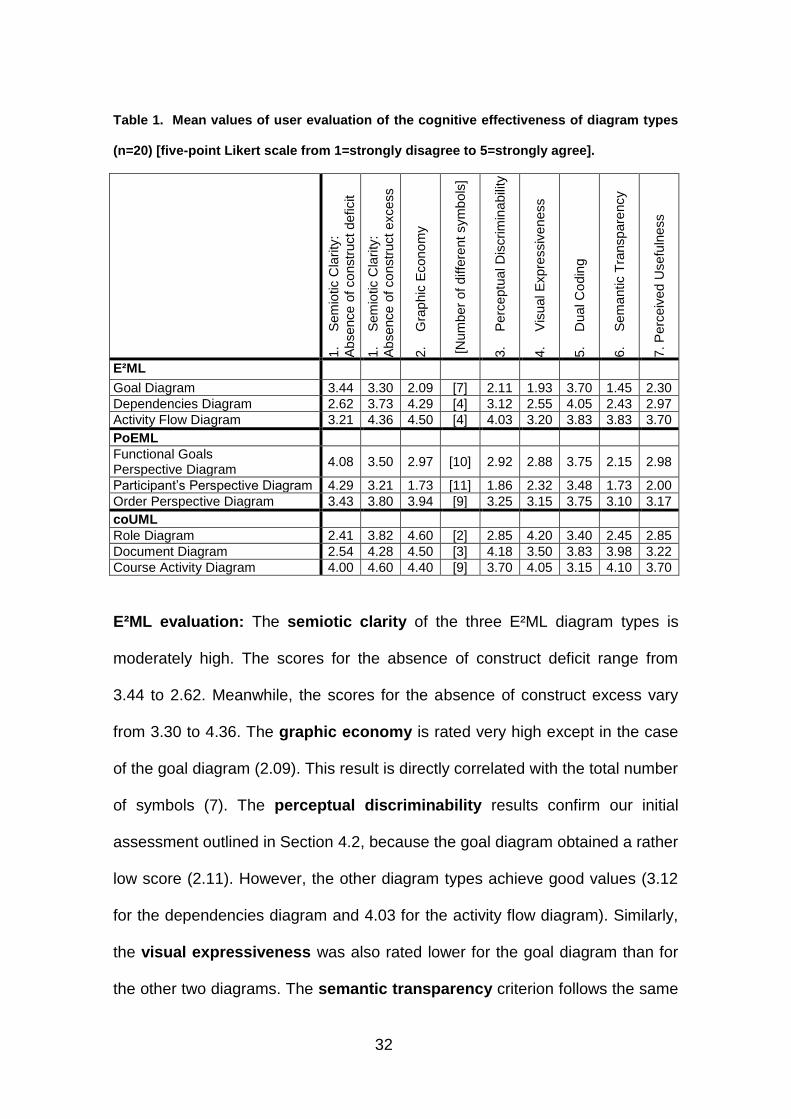
Table 1. Mean values of user evaluation of the cognitive effectiveness of diagram types
(n=20) [five-point Likert scale from 1=strongly disagree to 5=strongly agree].
1. S
em
iotic C
larity
:
Absence o
f co
nstr
uct deficit
1. S
em
iotic C
larity
:
Absence o
f co
nstr
uct excess
2. G
rap
hic
Econo
my
[N
um
ber
of
diffe
rent sym
bols
]
3. P
erc
eptu
al D
iscrim
inab
ility
4. V
isu
al E
xpre
ssiv
en
ess
5. D
ua
l C
odin
g
6. S
em
antic T
ranspare
ncy
7. P
erc
eiv
ed U
sefu
lness
E²ML
Goal Diagram 3.44 3.30 2.09 [7] 2.11 1.93 3.70 1.45 2.30
Dependencies Diagram 2.62 3.73 4.29 [4] 3.12 2.55 4.05 2.43 2.97
Activity Flow Diagram 3.21 4.36 4.50 [4] 4.03 3.20 3.83 3.83 3.70
PoEML
Functional Goals Perspective Diagram
4.08 3.50 2.97 [10] 2.92 2.88 3.75 2.15 2.98
Participant’s Perspective Diagram 4.29 3.21 1.73 [11] 1.86 2.32 3.48 1.73 2.00
Order Perspective Diagram 3.43 3.80 3.94 [9] 3.25 3.15 3.75 3.10 3.17
coUML
Role Diagram 2.41 3.82 4.60 [2] 2.85 4.20 3.40 2.45 2.85
Document Diagram 2.54 4.28 4.50 [3] 4.18 3.50 3.83 3.98 3.22
Course Activity Diagram 4.00 4.60 4.40 [9] 3.70 4.05 3.15 4.10 3.70
E²ML evaluation: The semiotic clarity of the three E²ML diagram types is
moderately high. The scores for the absence of construct deficit range from
3.44 to 2.62. Meanwhile, the scores for the absence of construct excess vary
from 3.30 to 4.36. The graphic economy is rated very high except in the case
of the goal diagram (2.09). This result is directly correlated with the total number
of symbols (7). The perceptual discriminability results confirm our initial
assessment outlined in Section 4.2, because the goal diagram obtained a rather
low score (2.11). However, the other diagram types achieve good values (3.12
for the dependencies diagram and 4.03 for the activity flow diagram). Similarly,
the visual expressiveness was also rated lower for the goal diagram than for
the other two diagrams. The semantic transparency criterion follows the same
33
pattern, with a very low score for the goal diagram (1.45), a medium score for
the dependencies diagram (2.43) and a good score for the activity flow (3.83).
The dual coding dimension received very high scores ranging from 3.70 to
4.50. This could be a consequence of the use of textual legends. Summarizing
the results for E²ML, the global perceived usefulness of the E²ML diagrams is
quite high, despite the goal diagram receiving a low 2.30 score.
PoEML evaluation: PoEML is notable for its extensive use of easily
understandable icons (e.g. stick-figures, clocks, houses). The semiotic clarity
of PoEML is very good, and the three evaluated diagram types achieved results
ranging between 3.21 and 4.29, both in relation to the absence of construct
deficit and excess. Nevertheless, since there are many diagram types and a
large number of symbols, the principle of graphic economy is not fulfilled so
well. This is particularly true for the participants’ perspective diagram, which
received a 1.73 score with 11 different symbols. The perceptual
discriminability was rated quite low, especially with regard to the participants’
perspective diagram (1.86). This may be due to the large number of similar
symbols, e.g. many rectangles are used for different concepts, which can only
be discriminated by colords and the icons inside. There is also a variety of
symbols in the other diagrams that can only be distinguished by their textual
annotation, e.g. a dotted arrow symbol is used to represent at least 9 different
types of relationships (labeled with I, O, MO, NI, NA, P, C, B, R). Similarly, the 9
different data elements are only distinguished with single letters. This may lead
to difficulties in distinguishing different relationships (dotted arrows) or data
types (small boxes) from one another. On the other hand, using a similar shape
34
for different symbols may account for recognizing them as belonging together,
due to the Gestalt law of similarity (Wertheimer 1938). This could be useful for
data symbols, but less useful for the relationship symbols, as they represent
quite different types of relationships. Probably as a result of this, the visual
expressiveness aspect received medium scores ranging from 2.88 to 3.15.
PoEML does reasonably well on the dual coding criterion, with scores ranging
from 3.48 to 3.75, perhaps because it allows the use of textual annotations
which are placed inside the symbols in most diagram types. Nevertheless, the
semantic transparency of the three diagram types was rated rather low (2.15,
1.73 and 3.10 respectively). These low scores suggest that the symbols need to
be complemented with icons whose appearance suggests their meaning more
intuitively. Finally, the perceived usefulness of PoEML is quite good, except in
the case of the participants’ perspective diagram, which received the worst
score of all the evaluated diagrams (2.00).
CoUML evaluation: The semiotic clarity of coUML is generally good, even
though it exhibits a certain degree of overload, since some symbols (e.g.
rectangles) are used to model different concepts. However those symbols are
tagged with a keyword, so it is possible to discriminate between them. In this
way, the user evaluation shows the maximum scores for the course activity
diagrams: 4.00 for the absence of construct deficit and 4.60 for the absence or
construct excess. CoUML’s graphic economy is excellent as it receives very
high scores for the three diagrams (4.40 to 4.60). The results indicate that the
language allows the visual expression of a versatile set of concepts in detail,
with a low number of visually easily discriminable symbols. The perceptual
35
discriminability and visual expressiveness also obtained very good scores,
with values greater than 3.50, except for role diagram (2.85). CoUML also does
reasonably well on the dual coding dimension, perhaps because both text and
symbols are used to represent concepts. The semantic transparency is also
very well rated for the document diagram (3.98) and the course activity diagram
(4.10), but not so well for the role diagram (2.45). Finally, the perceived
usefulness of the diagrams corresponds with the results of the other criteria as
the diagrams achieve very high scores (3.70 and higher), with the exception of
the role diagram (2.85).
Criteria that could not be evaluated by users based on single example diagrams
are not included in the table;
As already mentioned, some criteria could not be evaluated by users based on
single example diagrams, and were consequently not included in the table; they
are briefly discussed in the following. In general, the languages considered did
not differ to any great extent in terms of cognitive fit, complexity
management and cognitive integration. Concerning cognitive fit, for
instance, all languages provide only one visual representation of the diagram
types for all user groups and tasks. Nevertheless, the literature on E²ML shows,
for example, that the language can be used for sketching on whiteboards in a
very flexible manner (Botturi 2008). All languages put effort into complexity
management by providing several diagram types, including different
perspectives to some degree, and supporting cognitive integration by the
provision of overview diagrams and by enabling referencing between different
diagram types. Concerning differences in stratification, E²ML and coUML mainly
36
provide diagrams for modeling on the strategy layer (an exception is the coUML
document diagram which models aspects of the management layer). PoEML
does not provide different diagram types for the layers, but in many diagrams
concepts from several layers such as strategy, control, message, media logic
and management can be modeled. Different hierarchical levels are supported
by all three languages, and modeling on the conceptual as well as specification
layer is possible, although PoEML is the only language that enables the
modeling of implementation details.
4.6 Limitations
A basic limitation of the presented evaluation is that some of the cognitive
effectiveness criteria can only be evaluated after working intensively with the
language. Future research could profit from including user studies involving
actual designers in realistic, controlled design settings over a longer period of
time, for example as demonstrated in (Boot, Nelson et al. 2007). However, we
do believe that letting a larger sample of users evaluate example diagrams was
consistent with the goals of the study, and provided a reasonable first test of the
cognitive effectiveness and the perceived usefulness of the diagram types. The
difficulty of finding test users who have a profound knowledge of the languages
relates to problem of the generally low adoption of the investigated VIDLs.
Looking ahead, future research needs to examine causes for low adoption and
for ways of improving the achievement of higher user acceptance in the case of
the existing VIDLs. Future research could also take other VIDLs into account,
as there are many more available (see (Botturi and Stubbs 2008; Lockyer,
Bennett et al. 2008) for an overview). Such a complete evaluation might reveal
37
even more usable and creative solutions for visualizing specific aspects in
instructional design.
5 Conclusions
This paper presents the first study of the cognitive effectiveness of visual
instructional design languages (VIDLs). Our results suggest that an evaluation
from a user’s point of view is useful as a means of identifying various points for
improvement in terms of quality and the ease of use of VIDLs. Improvement
may, then, lead to higher acceptance and actual use of VIDLs by designers in
the long run.
Since there are many diagram types associated with the evaluated languages
which have similar purposes (e.g. goal or learning activity diagrams), we believe
that an integration of several diagram types into one single, unified modeling
approach would be beneficial as a means of better supporting the instructional
design community in the future. Other domains have successfully demonstrated
how powerful the establishment of an accepted visual modeling standard can
be, as for example the UML (Object Management Group 2009) for the software
domain or BPMN (Business Process Modeling Notation) (OMG 2009) for the
business process domain.
Additionally, many diagram types associated with different VIDLs focus on
different aspects and complement one another; their combination in a unified
modeling approach would allow the modeling of an extended number of domain
aspects. For instance, in early design stages, designers could use diagram
types as proposed on the conceptual level in the more sketchy language E²ML,
while in later designs and in the development stages, diagram types of a
38
language such as PoEML might be more appropriate to add more precision and
detail to the creative solutions of earlier stages (cf. (Derntl, Parrish et al. 2010)).
The provided discussion of the complexity of the domain allows an assessment
of the expressiveness of existing languages and their diagram types, and might
help to identify spots in the domain space that are not yet occupied. In
particular, when trying to find an optimal solution, competing proposals should
be compared as demonstrated by this paper, to identify strong and weak
aspects of the languages concerned. New combinations of existing diagram
types from different languages (Botturi and Stubbs 2008; Lockyer, Bennett et al.
2008) could be integrated to enhance usability and to lower the cognitive
demands placed on users.
In constructing a new unified modeling approach, besides combining several
diagram types, efforts to align diagram types and to support cognitive
integration between them seems important. Similar to the new proposal of
BPMN (OMG 2009), a lightweight version, including a smaller set of symbols,
could be created to lower the entry barriers for beginners. A modeling standard
for VIDLs could provide diagram types for a variety of specific design activities,
and would enable an internationally oriented development of instructional
design pattern repositories. Once in existence, such a standard could also
guide (novice) designers by providing some agreed-upon structure in order to
manage the complexity of the design domain.
Several possible directions for future research emerge from our user evaluation
of VIDLs. Future efforts need to address why VIDLs are rarely used. Besides a
lack of background in software engineering, or low interest in the more technical
39
aspects of design languages, VIDLs may demand considerable time and effort
in terms of learning, and the support of tools and documentation seems to be
insufficient at this point, since usable modeling tools are missing. For E²ML and
coUML, for instance, power-point templates are the only available modeling
tool; for PoEML there is only a Spanish modeling tool available. It is
recommended that the creators of VIDLs should put an effort into lowering this
threshold. For acceptance and adoption of VIDLs, the development and
enhancement of automated or semi-automated software tools supporting the
modeling process will be inevitable.
For researchers, the presented evaluation might also spawn similar studies on
other VIDLs and facilitate the understanding and coordination of research on
VIDLs.
References
Alexander, C., S. Ishikawa, et al. (1977). A Pattern Language - Towns, Buildings, Construction. New York, Oxford University Press.
Bajaj, A. and S. Rockwell (2005). COGEVAL: A Propositional Framework Based on Cognitive Theories To Evaluate Conceptual Models. Advanced Topics in Database Research. K. Siau, Idea Group Publishing: 255-282.
Boot, E. W. (2005). Building-block solutions for developing instructional software. Unpublished doctoral dissertation. The Netherlands, Open University.
Boot, E. W., J. Nelson, et al. (2007). "Stratification, Elaboration, and Formalization of Design Documents: Effects on the Production of Instructional Materials." British Journal of Educational Technology 38(5): 917-933.
Botturi, L. The Quail model for the classification of learning goals. Lugano, Università della Svizzera italiana.
Botturi, L. (2003). E2ML - Educational Environment Modeling Language. ED-MEDIA, Honolulu, Hawaii, USA, AACE Press.
Botturi, L. (2005). "Visual Languages for Instructional Design: an Evaluation of the Perception of E²ML." Journal of Interactive Learning Research 16(4): 329-351.
Botturi, L. (2006). "E²ML: A Visual Language for the Design of Instruction." Educational Technology Research and Development 54(3): 265-293.
40
Botturi, L. (2008). E²ML: A Tool for Sketching Instructional Designs. Handbook of Visual Languages for Instructional Design: Theories and Practices. L. Botturi and T. Stubbs. Hershey, PA, Information Science Reference: 112-132.
Botturi, L. and K. Belfer (2003). Pedagogical Patterns for Online Learning. E-Learn - World Conference on E-Learning in Corporate, Government, Healthcare, & Higher Education, Phoenix, Arizona, USA, AACE Press.
Botturi, L., M. Derntl, et al. (2006). A Classification Framework for Educational Modeling Languages in Instructional Design. IEEE International Conference on Advanced Learning Technologies (ICALT), Kerkrade, IEEE.
Botturi, L. and T. Stubbs (2008). Handbook of Visual Languages for Instructional Design. Hershey, PA, Information Science Reference.
Caeiro-Rodríguez, M. (2007). A Modeling Language for Collaborative Learning Educational Units - Supporting the Coordination of Collaborative Activities. ICEIS.
Caeiro-Rodríguez, M. (2008). PoEML: A separation-of-Concerns proposal to Instructional Design. Handbook of Visual Languages in Instructional Design: Theories and Practices. L. Botturi and T. Stubbs. Hershey, PA, Information Science Reference: 185-209.
Caeiro-Rodríguez, M., M. J. Marcelino, et al. (2007). "Supporting the Modeling of Flexible Educational Units PoEML: A Separation of Concerns Approach." Journal of Universal Computer Science 13(7).
Clark, H. H. and S. E. Brennan (1991). Grounding in Communication. Perspectives on Socially Shared Cognition. L. B. Resnick, J. M. Levine and S. D. Teasley. Hyattsville MD, American Psychological Association: 127-149.
Costagliola, G., A. D. Lucia, et al. (2008). "Assessing the usability of a visual tool for the definition of e-learning processes." Journal of Visual Languages and Computing 19(6): 721-737.
Derntl, M. and R. Motschnig-Pitrik (2008). coUML – A Visual Language for Modeling Cooperative Environments. Handbook of Visual Languages for Instructional Design: Theories and Practices. L. Botturi and T. Stubbs. Hershey, PA, Information Science Reference: 155-184.
Derntl, M., P. Parrish, et al. (2010). "Beauty and Precision: Weaving Complex Educational Technology Projects with Visual Instructional Design Languages." International Journal on E-Learning 9(2): 185-202.
Fernández-Manjón, B., J. M. Sánchez-Pérez, et al. (2007). Educational Modeling Languages. A Conceptual Introduction and a High-Level Classification. Computers and Education. E-Learning, From Theory to Practice, Springer Netherlands.
Figl, K. and M. Derntl (2006). A Comparison of Visual Instructional Design Languages for Blended Learning. ED-MEDIA, Orlando, Florida, AACE Press.
Figl, K., J. Mendling, et al. (2010). On the Cognitive Effectiveness of Routing Symbols in Process Modeling Languages. Business Information Systems (BIS), Berlin, Lecture Notes in Business Information Processing.
41
Fowler, M. (2003). UML distilled: A brief guide to the standard object modeling language. Boston, MA, Addison Wesley.
Gamma, E., R. Helm, et al. (1995). Design Patterns - Elements of Reusable Object-Oriented Software. Reading, MA, Addison-Wesley.
Gemino, A. and Y. Wand (2004). "A Framework for Empirical Evaluation of Conceptual Modeling Techniques." Requirements Engineering 9(4): 248-260.
Gibbons, A. (2003). "What and how do designers design? A theory of design structure." Tech Trends 47: 22-27.
Gibbons, A. S., L. Botturi, et al. (2008). Design Languages. Handbook of Research in Instructional Design. M. Spector, D. Merrill, J. v. Merriënboer and M. Driscoll, AECT: 633-645.
Gibbons, A. S. and E. Brewer (2004). Elementary Principles of Design Languages and Design Notation Systems for Instructional Design. Innovations to Instructional Technology: Essays in Honor of M. David Merrill. M. Spector and D. Wiley. New Jersey, Lawrence Erlbaum.
Gobet, F., P. C. R. Lane, et al. (2001). "Chunking mechanisms in human learning." Trends in Cognitive Sciences 5(6): 236-243.
Green, T. R. G. and M. Petre (1996). "Usability Analysis of Visual Programming Environments: A 'Cognitive Dimensions' Framework." Journal of Visual Languages and Computing 7(2).
IMS Global. (2003). "IMS Learning Design Best Practice and Implementation Guide." Retrieved Nov 21, 2003, from http://www.imsglobal.org/learningdesign/ldv1p0/imsld_bestv1p0.html.
IMS Global. (2003). "IMS Learning Design Information Model." Retrieved Aug 10, 2004, from http://www.imsglobal.org/learningdesign/ldv1p0/imsld_infov1p0.html.
Jochems, W. M. G., J. J. G. van Merrienboer, et al., Eds. (2003). Integrated E-Learning: Implications for Pedagogy, Technology and Organization. London, Routledge Farmer.
Kelly, S. and R. Pohjonen (2009). "Worst Practices for Domain-Specific Modeling." IEEE Software 26(4): 22-29.
Kim, J., J. Hahn, et al. (2000). "How Do We Understand a System with (So) Many Diagrams? Cognitive Integration Processes in Diagrammatic Reasoning." Information Systems Research 11(3): 284-303.
Kirschner, P. A. (2002). "Cognitive load theory: implications of cognitive load theory on the design of learning." Learning and Instruction 12(1): 1-10.
Larkin, J. H. and H. A. Simon (1987). "Why a Diagram is (Sometimes) Worth Ten Thousand Words." Cognitive Science 11(1): 65-100.
Lave, J. and E. Wenger (1991). Situated Learning: Legitimate Peripheral Participation. Cambridge, UK, Cambridge University Press.
Lockyer, L., S. Bennett, et al. (2008). Handbook of Research on Learning Design and Learning Objects: Issues, Applications and Technologies.
Maes, A. and G. Poels (2007). "Evaluating Quality of Conceptual Modelling Scripts Based on User Perceptions." Data & Knowledge Engineering 63(3): 701-724.
42
Martinez-Ortiz, I., P. Moreno-Ger, et al. (2007). Educational Modeling Languages. Computers and Education: E-learning, From Theory to Practice. B. Fernandez-Manjon, Springer: 27–40.
Mayer, R. E. (2001). Multimedia Learning, Cambridge University Press. Miller, G. A. (1956). "The magical number seven, plus or minus two: some limits
on our capacity for processing information." Psychological Review 63: 81-97.
Moody, D. L. (2009). "The “Physics” of Notations: Towards a Scientific Basis for Constructing Visual Notations in Software Engineering." IEEE Transactions on Software Engineering 35(5): 756-779.
Motschnig-Pitrik, R. and M. Derntl (2005). Learning Process Models as Mediators between Didactical Practice and Web Support. International Conference on Conceptual Modeling (ER 2005), Klagenfurt, Austria, Springer Verlag LNCS.
Object Management Group. (2009). "Unified Modeling Language™ (UML®) 2.2." from http://www.omg.org/spec/UML/2.2/.
OMG (2009). Business Process Modeling Notation (BPMN) Version 1.2. Rawlings, A., P. van Rosmalen, et al. (2002). Survey of Educational Modelling
Languages (EMLs). CEN/ISSS WS/LT Learning Technologies Workshop.
Rheinfrank, J. and S. Evenson (1996). Design languages. Bringing design to software. T. Winograd. Reading, MA, Addison-Wesley.
Santa, J. L. (1977). "Spatial transformations of words and pictures." Journal of Experimental Psychology: Human Learning and Memory 3: 418-427.
Schön, D. (1983). The Reflective Practitioner. How professionals think in action. London, UK, Temple Smith.
Sonderegger, A. and J. Sauer (2010). "The influence of design aesthetics in usability testing : Effects on user performance and perceived usability." Applied Ergonomics 41(3): 403-410.
Sweller, J. (1988). "Cognitive load during problem solving: Effects on learning." Cognitive Science: A Multidisciplinary Journal 12(2): 257-285.
Vessey, I. (1991). "Cognitive Fit: A Theory-Based Analysis of the Graphs Versus Tables Literature." Decision Sciences 22(2): 219-240.
Vessey, I. (1991). "Cognitive Fit: A Theory-Based Analysis of the Graphs Versus Tables Literature*." Decision Sciences 22(2): 219-240.
Waters, S. H. and A. S. Gibbons (2004). "Design languages, notation systems, and instructional technology: A case study." Educational Technology Research and Development 52(2): 57-69.
Wertheimer, M. (1938). Laws of organization in perceptual forms. A sourcebook of Gestalt psychology. W. D. Ellis. London, UK, Routledge and Kegan Paul.
Winn, W. (1990). "Encoding and retrieval of information in maps and diagrams." IEEE Transactions on Professional Communication 33(3): 103-107.
Winograd, T. (1987). "A Language/Action Perspective on the Design of Cooperative Work." Human-Computer Interaction 3(1): 3-30.

43
Related Documents