Desalination 134 (2001) 7–28 Presented at the International Conference on Seawater Desalination Technologies on the Threshold of the New Millennium, Kuwait, 4–7 November 2000. 0011-9164/01$– See front matter © 2001 Elsevier Science B.V. All rights reserved Cogeneration for power and desalination – state of the art review Ali M. El-Nashar Abu Dhabi Water and Electricity Authority, P.O. Box 41375, Abu Dhabi, UAE Tel. +971 (50) 6614430 (mobile); Fax +971 (2) 4434-906; e-mail: [email protected] Received 26 September 2000; accepted 10 October 2000 Abstract This paper reviews the state of the art of cogeneration for power and distillation. The performance of several cogeneration options are considered in association with the MSF process for seawater desalination. Both full load and part load characteristics of each major commercial cogeneration process is reviewed both from a technical and economic viewpoint. A methodology for selecting the optimum cogeneration option to satisfy a given demand of power and water is described and an example is given for a cogeneration plant having a power rating of 300 MW and 50 MIGD of potable water. The life cycle cost analysis is used to select the optimum cogeneration system and the exergy analysis method is used for allocating the costs between electricity and water. Keywords: Cogeneration; Desalination; Distillation; Dual-purpose plants for power and water; Economic analysis 1. Introduction Most of the potable water and electricity in the Arabian Gulf countries are produced by cogeneration plants associated with multi-stage flash (MSF) desalination units operating on seawater. Although other distillation process such as thermal vapor compression and MED are started to find their way in the market, the MSF process is still considered as the workhorse of desalination industry. In spite of its limitations, this process has proven its reliability and flexibility over almost 50 years of plant design and operation. For large desalination capacity, say beyond 30 MIGD, the MSF process can be considered as the only candidate that can be considered commercially. However, on the cogeneration plant side, the situation is different in that several alternatives are commercially available to provide the required electrical power and steam for desalination. Among these alternatives are: • Gas turbines associated with heat recovery steam generators (GT-HRSG),

Welcome message from author
This document is posted to help you gain knowledge. Please leave a comment to let me know what you think about it! Share it to your friends and learn new things together.
Transcript

Desalination 134 (2001) 7–28
Presented at the International Conference on Seawater Desalination Technologies on the Threshold of the NewMillennium, Kuwait, 4–7 November 2000.
0011-9164/01$– See front matter © 2001 Elsevier Science B.V. All rights reserved
Cogeneration for power and desalination –state of the art review
Ali M. El-NasharAbu Dhabi Water and Electricity Authority, P.O. Box 41375, Abu Dhabi, UAE
Tel. +971 (50) 6614430 (mobile); Fax +971 (2) 4434-906; e-mail: [email protected]
Received 26 September 2000; accepted 10 October 2000
Abstract
This paper reviews the state of the art of cogeneration for power and distillation. The performance of severalcogeneration options are considered in association with the MSF process for seawater desalination. Both full load andpart load characteristics of each major commercial cogeneration process is reviewed both from a technical andeconomic viewpoint. A methodology for selecting the optimum cogeneration option to satisfy a given demand ofpower and water is described and an example is given for a cogeneration plant having a power rating of 300 MW and50 MIGD of potable water. The life cycle cost analysis is used to select the optimum cogeneration system and theexergy analysis method is used for allocating the costs between electricity and water.
Keywords: Cogeneration; Desalination; Distillation; Dual-purpose plants for power and water; Economic analysis
1. Introduction
Most of the potable water and electricity inthe Arabian Gulf countries are produced bycogeneration plants associated with multi-stageflash (MSF) desalination units operating onseawater. Although other distillation processsuch as thermal vapor compression and MED arestarted to find their way in the market, the MSFprocess is still considered as the workhorse ofdesalination industry. In spite of its limitations,this process has proven its reliability and
flexibility over almost 50 years of plant designand operation. For large desalination capacity,say beyond 30 MIGD, the MSF process can beconsidered as the only candidate that can beconsidered commercially. However, on thecogeneration plant side, the situation is differentin that several alternatives are commerciallyavailable to provide the required electrical powerand steam for desalination. Among thesealternatives are:• Gas turbines associated with heat recovery
steam generators (GT-HRSG),

A.M. El-Nashar / Desalination 134 (2001) 7–288
• Back-pressure steam turbines (BP-ST) withthe discharge steam directed to desalination,
• Controlled extraction-condensing steamturbines (EC-ST) where the steam fordesalination is bled from a location on thesteam turbine which matches the steampressure required by desalination,
• Combined gas/steam turbine cycles where aheat recovery steam generator (HRSG) is usedto produce steam at medium or high pressurethat is supplied to a back-pressure steamturbine discharging into the MSF desalinationplant, this system is referred to as CC-BP,
• Combined gas/steam turbine cycles that aresimilar to the previous cycle except that acontrolled extraction-condensing steam turbineis used, CC-EC.
Each of the above cogeneration plants has itsown characteristics in terms of their part-loadperformance curves, fuel requirement and capitaland O&M cost needs. The matching of a cogene-ration plant with a given rated power capacity toan MSF plant designed to produce a given amountof desalted water require knowledge not only ofthe technical performance and economic data ofthe different technologies, but also data on theannual variation of electrical and water demandon the site on which the plant is to be constructed.
This paper reviews the technical and economiccharacteristics of the cogeneration plants currentlycommercially available as well as the costparameters for both cogeneration and desalinationplants. A methodology for selecting the optimalarrangement of cogeneration plant for a particularpower and desalination capacity is described andan example is given to demonstrate the use of themethod.
2. Performance indices of cogeneration plants
2.1. Power to water ratio
Typical power to water ratio for differentcogeneration plants are shown in Table 1 [1]. The
PWR does not only depend on the type primemover (type of cogeneration plant) but also on theperformance ratio, PR, of the desalination plant.The lower the PR of the desalination plant, thehigher will be the P/W ratio of the combinedcogeneration/desalination plant and the reverse istrue. The effect of the PR on the PWR of fourcogeneration systems (namely, BP-ST, EC-ST,GT-HRSG and CC-BP) is shown graphically inFig. 1. In this figure, three bands represent therange of change of PWR for the ST-BP, GT-HRSG and CC-BP configurations; the field ofchange for the EC-ST configuration is repre-sented by the total area above the ST-BP band.
Table 1Typical design power to water ratio for cogenerationplants
Prime mover Power to water ratio
Backpressure steam turbine –MSF (BP-ST)
4–7
Extraction/condensing steamturbine – MSF (EC-ST)
4–19
Gas turbine – unfired HRSG-MSF (GT-HRSG)
6–13
Combined gas turbine, HRSG,backpressure steam turbine (CC-BP)
9–18
2.2. Fuel energy savings ratio
Another performance criterion developed forcogeneration plants involves comparison betweenthe fuel required to meet the given loads ofelectricity and heat in the cogeneration plantwith that required in separate conventional plantdesigned to meet the loads, say in a conventionalboiler to meet the heat load for desalination and aconventional power station to meet the electricalload. For a cogeneration plant producing netelectrical power, P, and an amount of processheat, Qp, and consuming an amount of fuel

A.M. El-Nashar / Desalination 134 (2001) 7–28 9
Fpc
e
de
wMceevr
2
aprpco
both such conventional plants producing those
ig. 1. Power to water ratio for different cogenerationlants (note that the PWR range for the EC-ST plantsovers the whole area above the BP-ST band).
nergy (Qf)cog, the fuel energy saved, ∆Qf , is
( )cogf
cb
pf QPQ
Q −+=∆ηη
(1)
The fuel energy savings ratio (FESR) isefined as the ratio of the saving (∆Qf) to the fuelnergy required in the conventional plants.
( )[ ]bcco
cogc
cb
p
f
PQQ
FESRηηλ
ηη
ηη/1
/1
+−=
+
∆= (2)
here λcog = (Qp/P) is the heat to power ratio inWth/MWel, ηc is the thermal efficiency of the
onventional power plant, ηcog = [P/(Qf)cog] is thefficiency of the cogeneration plant, ηb is thefficiency of the conventional boiler. Typicalalues of these parameters for different cogene-ation plants are shown in Table 2.
.3. Net heat rate
A cogeneration facility producing electricitynd thermal energy for desalination (or otherurposes) will use more fuel than would beequired by a conventional electric power plantroducing only its electric output, or by aonventional boiler producing only its thermalutput, but less fuel than would be required by
outputs separately.It is customary to treat the cogeneration
system as if the energy required to producesteam is the same as if that steam had beenproduced in a conventional boiler supplyingsteam to a desalination plant. The incrementalcogeneration fuel energy, over and above theamount that would have been required toproduce the same amount of steam in a boiler, isconsidered to be used to produce electric power,and is referred to as the Net Heat Rate (NHR).This concept allocates all of the cogeneration fuelefficiency advantage to the electric generationportion of the cogeneration cycle. Thus, the NHRcan provide an effective means of determining theincremental performance due to the addition ofthe power generation (cogeneration) system to asystem producing only steam. This permitsassessment of potential economic benefits ofcompeting cogeneration technologies, providedthat the cogeneration technology uses the samefuel as that used to generate process steam in thenon-cogeneration case.
By definition, the net heat rate is defined asfollows:
P
NHR b
pf
−
=η
(3)
Typical NHR values for different cogene-ration plant types and the corresponding fuelsavings are shown in Table 3 which clearlyindicate that the potential fuel saving is largestfor the back pressure steam turbine cogenerationplant and the combined cycle with back pressuresteam turbine plant.
3. Commercially available cogeneration tech-nologies and their performance
In the following sections the performance atdifferent loads for each of the major cogeneration
A.M. El-Nashar / Desalination 134 (2001) 7–2810
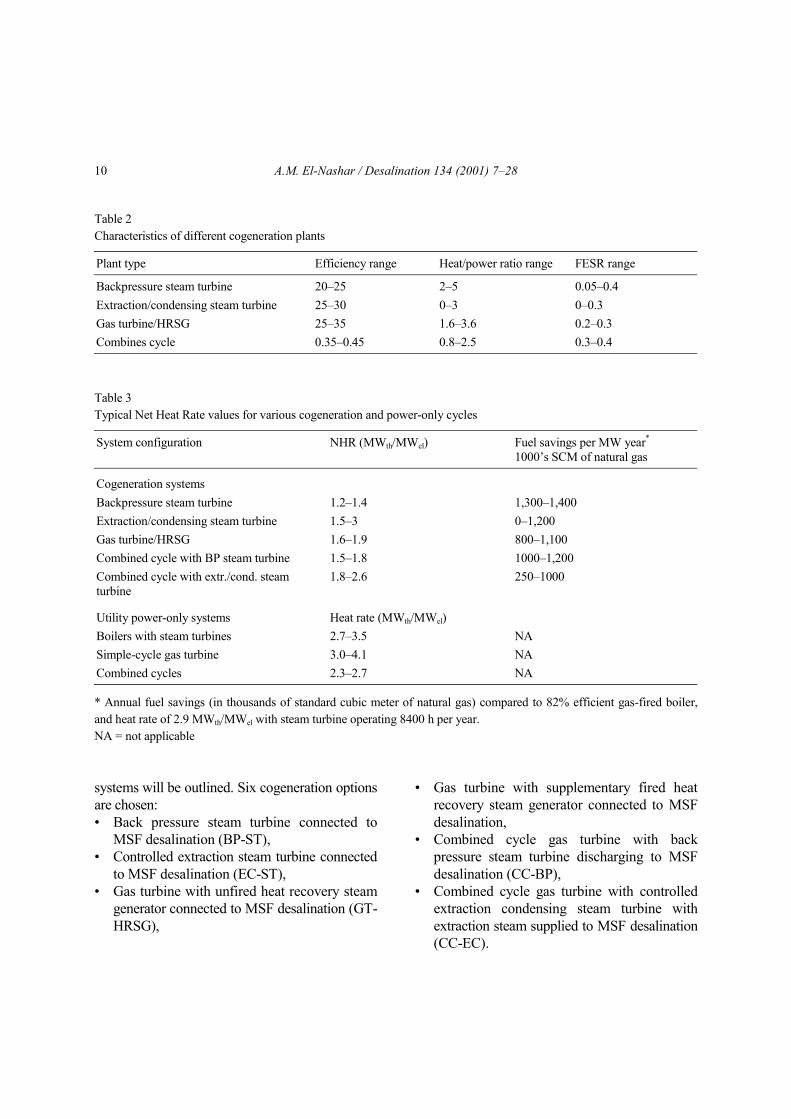
Table 2Characteristics of different cogeneration plants
Plant type Efficiency range Heat/power ratio range FESR range
Backpressure steam turbine 20–25 2–5 0.05–0.4Extraction/condensing steam turbine 25–30 0–3 0–0.3Gas turbine/HRSG 25–35 1.6–3.6 0.2–0.3Combines cycle 0.35–0.45 0.8–2.5 0.3–0.4
Table 3Typical Net Heat Rate values for various cogeneration and power-only cycles
System configuration NHR (MWth/MWel) Fuel savings per MW year*
1000’s SCM of natural gas
Cogeneration systemsBackpressure steam turbine 1.2–1.4 1,300–1,400Extraction/condensing steam turbine 1.5–3 0–1,200Gas turbine/HRSG 1.6–1.9 800–1,100Combined cycle with BP steam turbine 1.5–1.8 1000–1,200Combined cycle with extr./cond. steamturbine
1.8–2.6 250–1000
Utility power-only systems Heat rate (MWth/MWel)Boilers with steam turbines 2.7–3.5 NASimple-cycle gas turbine 3.0–4.1 NACombined cycles 2.3–2.7 NA
* Annual fuel savings (in thousands of standard cubic meter of natural gas) compared to 82% efficient gas-fired boiler,and heat rate of 2.9 MWth/MWel with steam turbine operating 8400 h per year.NA = not applicable
systems will be outlined. Six cogeneration optionsare chosen:• Back pressure steam turbine connected to
MSF desalination (BP-ST),• Controlled extraction steam turbine connected
to MSF desalination (EC-ST),• Gas turbine with unfired heat recovery steam
generator connected to MSF desalination (GT-HRSG),
• Gas turbine with supplementary fired heatrecovery steam generator connected to MSFdesalination,
• Combined cycle gas turbine with backpressure steam turbine discharging to MSFdesalination (CC-BP),
• Combined cycle gas turbine with controlledextraction condensing steam turbine withextraction steam supplied to MSF desalination(CC-EC).

A.M. El-Nashar / Desalination 134 (2001) 7–28 11
For each of these options, the part-loadperformance will be shown using data fromtypical plants using current technology. Thedesalination plant is assumed to operate at fullload irrespective of the electrical load variation.
3.1. Back-pressure steam turbine connected todesalination plant (BP-ST)
Natural gas can be burned in a fired boiler toproduce high-pressure superheated steam. Thissteam can be fed to a back-pressure steam turbineto produce power. The exhaust from the steamturbine will feed a desalination plant to producedesalinated water. Feed water heating utilizingextractions from the steam turbine are used toimprove overall plant efficiency.
Part load performance can be achieved bybypassing some of the steam around the steamturbine. To reduce steam turbine load, steamturbine throttle valves must start to close to reducethe amount of steam flowing through the turbine.This plant would require a dump condenser toallow maximum power production when adesalination unit is out of service. In a plantconsisting of a series of boiler/turbine/desalination
unit trains, a common header feeding the desali-nation units is normally installed, with a singledump condenser being required to handle theexcess steam supplied to the header in the eventof a desalination unit outage.
Performance information for a typical CC-STcogeneration plant is shown in Table 4. The planthas a rated power capacity of 98 MW and canproduce about 18 MIGD from MSF units havinga performance ratio, PR, of 8.0. The part-load heatrate ratio (defined as the heat load at any loaddivided by the design heat rate) for this plant isshown in Fig. 2, which shows the large drop inthe heat rate as the plant load increases.
The NHR and PWR for different electricalloads for the BP-ST cogeneration plant are shownin Figs. 3 and 4. It is assumed that while theelectrical load on the plant is allowed to vary, thethermal load, and hence the water production,remains constant at its rated value. The largeincrease in the NHR with decreasing the load isdue mainly to the use of part of the boiler steamfor desalination (after passing through a reducingvalve to reduce its pressure). The PWR, asexpected, increases linearly with the load butdepend on the performance ratio, PR, of thedesalination plant.
Table 4Part-load performance of back-pressure steam turbine cogeneration plant (BP-ST) connected to desalination unit having aperformance ratio PR = 8.0
ST gross output, kW 97,950 82,725 52,100 25,250 13,130Power auxiliary loads, kW 5,500 5,050 4,010 2,790 2,010Net power output, kW 92,450 77,675 48,090 22,460 11,120Load, % 100 84 52 24 12Fuel input, MMBtu/h HHV 1498.5 1437.9 1311.8 1202.5 1151.2Heat rate, Btu/kWh HHV 16,208 18,511 27,278 53,540 103,524Exhaust steam to desal, lb/h 973,000 834,000 558,000 291,000 162,000Bypass steam to desal, lb/h 0 139,000 415,000 682,000 811,000Total steam to desal, lb/h 973,000 973,000 973,000 973,000 973,000Desal. production, MIGD 17.92 17.92 17.92 17.92 17.92Desal. auxiliary load, kW 13,560 13,560 13,560 13,560 13,560

A.M. El-Nashar / Desalination 134 (2001) 7–2812
Fig. 2. Heat rate ratio of backpressure cogeneration plantsupplying constant steam flow to a desalination unit havinga performance ratio 8.0.
Fig. 3. Net heat rate for BP-ST cogeneration plant.
Fp
3.2. Extraction-condensing steam turbine con-nected to desalination plant
These units produce still more power byreplacing the backpressure turbine with anextraction/condensing steam turbine. A controlledextraction port on the steam turbine will maintainproper steam flow and pressure for the desali-nation units. Desalinated water production isreduced by about 40% from the backpressuresteam turbine case, since some steam flow isrequired to flow through the low-pressurecondensing section of the steam turbine, and sinceadditional feedwater heaters are used to furtherimprove cycle efficiency. As in the case of abackpressure steam turbine, substantial turndowncan be achieved by bypassing steam around thesteam turbine. Performance information for thistechnology is found in Table 5 for a plant with anet power output of 116 MW connected to anMSF plant having a capacity of 12.6 MIGD (thatis PWR = 9.2).
The heat rate ratio for different loads is shownin Fig. 5, which as for the BP-ST technologyexhibits a dramatic increase in the heat rate atpart load. The reason is the need for bypass steamto supplement the extraction steam, which forblade cooling reasons, has to be reduced at verysmall loads.
ig. 4. Power to water ratio for BP-ST cogenerationlant supplying constant steam to desalination.
Fc
ig. 5. Performance of EC-ST cogeneration plant withonstant steam to desalination. (Performance ratio PR = 8.0)

A.M. El-Nashar / Desalination 134 (2001) 7–28 13
Table 5Part-load performance of extraction/condensing steam turbine cogeneration plant (EC-ST) with constant steam supply todesalination. Performance ratio, PR = 8.0
Plant gross output, kW 125,000 93,200 72,700 54,350 –Power auxiliary loads, kW 8,730 7,920 7,490 7,720 4,000Net output, kW 116,270 85,280 65,210 46,630 4,000Load, % 100 73 56 40 3Total fuel input, MMBtu/h HHV 1593.7 1291.4 1111.2 1196.7 726.1Heat rate, Btu/kWh HHV 13,707 15,143 17,041 25,664 181,527Extr. steam to desal, lb/h 683,417 683,417 683,417 418,836 0Bypass steam to desal, lb/h 0 0 0 264,581 683,417Total steam to desal, lb/h 683,417 683,417 683,417 683,417 683,417Desal production, MIGD 12.59 12.59 12.59 12.59 12.59Desal auxiliary load, kW 9,520 9,520 9,520 9,520 9,520
The net heat rate and power-to-water ratio atpart-load for this technology is shown in Figs. 6and 7, respectively. It can be seen that the net heatrates are higher than the values for the BP-SToption. Also, as was shown before, higher PWRvalues can be obtained for the EC-ST plantcompared to the BP-ST one.
Note that this plant is designed for a power towater ratio (PWR ) of about 9 MW/MIGD, butlower PWR’s are possible. However, as PWRapproaches 5 MW/MIGD, they are reaching thePWR of backpressure steam turbine plants. Lowervalues of PWR can be achieved by reducing the
F
extraction steam flow and complementing it withbypass steam.
3.3. Gas turbine plus unfired heat recovery steamgenerator plus auxiliary boiler connected todesalination plant (GT-HRSG)
These units produce power in a virtuallyidentical manner to simple cycle gas turbines.However, the waste heat exhausting from the gasturbine is captured in an unfired HRSG, wheresteam is produced for export to a desalinationplant. The amount of steam produced by the
ig. 6. Net heat rate for a typical EC-ST cogeneration plant.
Ftd
ig. 7. Power to water ratio of extraction/condensing steamurbine cogeneration plant supplying constant steam toesalination.

A.M. El-Nashar / Desalination 134 (2001) 7–2814
HRSG is a function of the energy in the gasturbine exhaust. As gas turbine load is reduced tomatch reduced load demand, the correspondingHRSG steam production is reduced. Since desali-nated water production must remain constant,auxiliary boiler steam must be produced to main aconstant steam flow to the desalination unit.Performance information for this technology is
shown in Table 6 for a plant having a net poweroutput of 94 MW connected to an MSF planthaving a rated production of 10.8 MIGD.
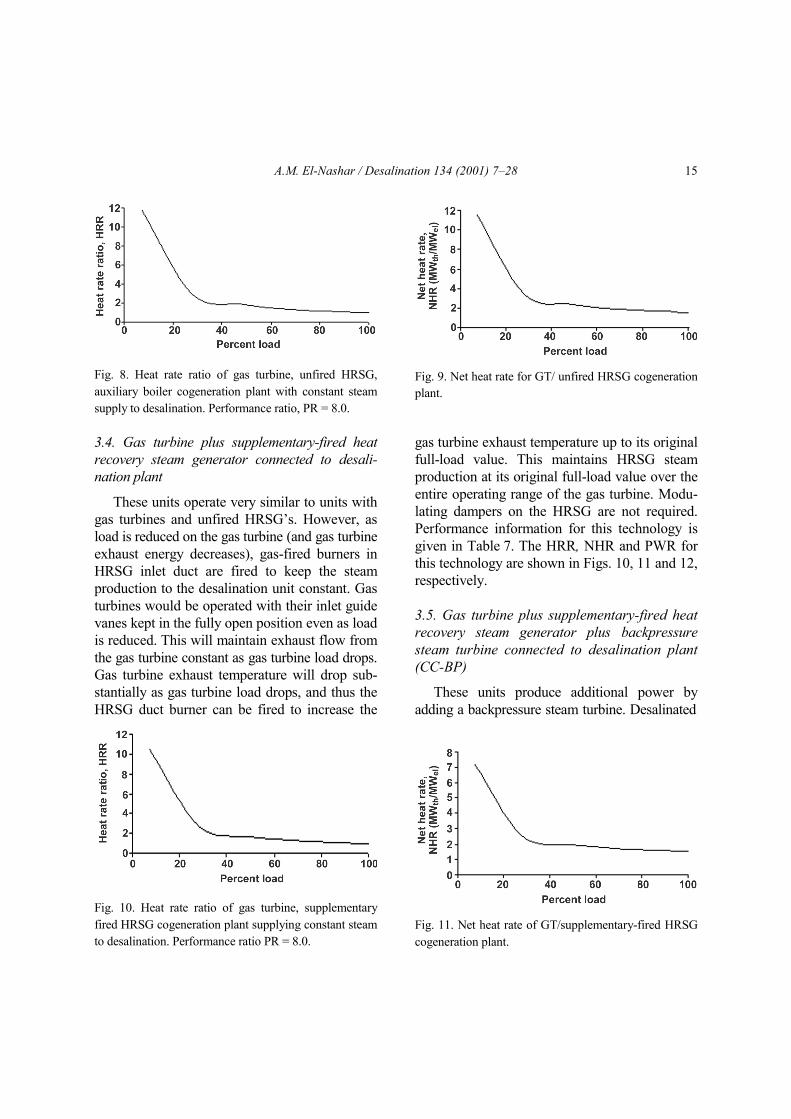
The heat rate ratio, HRR, for a typical GT-HRSG cogeneration plant is shown in Fig. 8which also shows a dramatic increase at partloads. The NHR is shown in Fig. 9.
Table 6Part-load performance of a gas turbine, unfired HRSG, auxiliary boiler (GT-HRSG) with constant steam to desalination.Performance ratio PR = 8.0
Ambient temperature, °C 50 50 50 50 50 50
GT gross output, kW 95,730 83,540 65,700 47,180 27,480 6,740Power auxiliary load, kW 1,910 1,780 1,580 1,340 1,020 510Net output, kW 93,820 81,760 64,120 45,840 26,460 6,230Load, % 100 87 68 49 28 7GT fuel input, MMBtu/h HHV 1154.7 1027.2 847.4 680.3 517.3 361.7Aux. boiler fuel input, MMBtu/h HHV 0 101.8 227.1 346.1 451.7 546.8Total fuel input, MMBtu/h HHV 1154.7 1129.0 1074.5 1026.4 969.2 908.5Heat rate, Btu/kWh HHV 12,308 13,809 16,758 22,390 36,628 145,828HRSG steam to desal., lb.h 586,300 500,000 386,400 278,000 179,000 93,000Aux. boiler steam to desal., lb/h 0 86,300 199,900 308,300 407,300 493,000Total steam to desal., lb/h 586,300 586,300 586,300 586,300 586,300 586,300Desal. production, MIGD 10.8 10.8 10.8 10.8 10.8 10.8Desal. aux. load, kW 8,170 8,170 8,170 8,170 8,170 8,170
Ambient temperature, °C 20 20 20 20 20 20
GT gross output, kW 113,000 102,410 82,900 62,270 40,580 17,290Power auxiliary load, kW 2,260 2,200 1,980 1,710 1,380 900Net output, kW 110,740 100,210 80,920 60,560 39,200 16,390Load, % 100 90 73 55 35 15GT fuel input, MMBtu/h HHV 1299.0 1186.8 986.4 797.6 616.6 441.7Aux. boiler fuel input, MMBtu/h HHV 0 85.5 230.6 364.7 481.2 587.9Total fuel input, MMBtu/h HHV 1299.0 1272.3 1217.0 1162.3 1097.8 1029.6Heat rate, Btu/kWh HHV 11,730 12,696 15,040 19,192 28,005 62,821HRSG steam to desal., lb.h 586,300 513,800 383,300 261,400 152,400 56,200Aux. boiler steam to desal., lb/h 0 75,500 203,900 324,900 433,900 530,100Total steam to desal., lb/h 586,300 586,300 586,300 586,300 586,300 586,300Desal. production, MIGD 10.8 10.8 10.8 10.8 10.8 10.8Desal. aux. load, kW 8,170 8,170 8,170 8,170 8,170 8,170
A.M. El-Nashar / Desalination 134 (2001) 7–28 15
Fas
3rn
gleHptvitGsH
Fft
ig. 8. Heat rate ratio of gas turbine, unfired HRSG,uxiliary boiler cogeneration plant with constant steamupply to desalination. Performance ratio, PR = 8.0.
Fp
.4. Gas turbine plus supplementary-fired heatecovery steam generator connected to desali-ation plant
These units operate very similar to units withas turbines and unfired HRSG’s. However, asoad is reduced on the gas turbine (and gas turbinexhaust energy decreases), gas-fired burners inRSG inlet duct are fired to keep the steamroduction to the desalination unit constant. Gasurbines would be operated with their inlet guideanes kept in the fully open position even as loads reduced. This will maintain exhaust flow fromhe gas turbine constant as gas turbine load drops.as turbine exhaust temperature will drop sub-
tantially as gas turbine load drops, and thus theRSG duct burner can be fired to increase the
gfpelPgtr
3rs(
a
ig. 10. Heat rate ratio of gas turbine, supplementaryired HRSG cogeneration plant supplying constant steamo desalination. Performance ratio PR = 8.0.
Fc
ig. 9. Net heat rate for GT/ unfired HRSG cogenerationlant.
as turbine exhaust temperature up to its originalull-load value. This maintains HRSG steamroduction at its original full-load value over thentire operating range of the gas turbine. Modu-ating dampers on the HRSG are not required.erformance information for this technology isiven in Table 7. The HRR, NHR and PWR forhis technology are shown in Figs. 10, 11 and 12,espectively.
.5. Gas turbine plus supplementary-fired heatecovery steam generator plus backpressureteam turbine connected to desalination plantCC-BP)
These units produce additional power bydding a backpressure steam turbine. Desalinated
ig. 11. Net heat rate of GT/supplementary-fired HRSGogeneration plant.

A.M. El-Nashar / Desalination 134 (2001) 7–2816
water production is reduced by about 30% sincehigher pressure steam is generated in the HRSGto allow sufficient steam turbine power produc-tion. Substantial power turndown can be achievedby reducing gas turbine load and increasingHRSG duct burner firing. Steam turbine loadremains essentially constant.
For a plant with a backpressure steam turbine,consideration needs to be given to a desalinationunit going out of service. If it were desired tomaintain maximum power production, a dumpcondenser would be required. In a plant con-sisting of a series of gas turbine/HRSG trains, a
common header feeding a single steam turbinewould be envisaged, with the steam turbineexhausting into a common header feeding thedesalination units. A single dump condenserwould be required to handle the excess steamsupplied to the header in the event of a desalina-tion unit outage. Performance information of thistechnology is given in Table 8. High power towater ratios of about 16 can be achieved withthis technology. The part-load heat rate and netheat rate for this technology is shown in Figs. 12and 13, respectively, and the power to water ratiois shown in Fig. 14.
Table 7Part-load performance of gas turbine, fired HRSG cogeneration plant with constant steam supply to desalination.Performance ratio PR = 8.0
Ambient temperature, °C 50 50 50 50 50 50
GT gross output, kW 95,730 83,540 65,700 47,180 27,480 6,740Power aux. load, kW 1,910 1,780 1,580 1,340 1,020 510Net output, kW 93,820 81,760 64,120 45,840 26,460 6,230% Load 100 87 68 49 28 7GT fuel input, MMBtu/h HHV 1154.7 1027.2 847.4 680.3 517.4 361.7Duct burner fuel input, MMBtu/h HHV 0 83.9 190.0 289.1 377.2 454.2Total fuel input, MMBtu/h HHV 1154.7 1111.2 1037.4 969.4 894.7 815.9Heat rate, Btu/kWh HHV 12,308 13,591 16,178 21,148 33,812 130,967Steam to desal., lb/h 586,300 586,300 586,300 586,300 586,300 586,300Desal. production, MIGD 10.8 10.8 10.8 10.8 10.8 10.8Desal. aux. load, kW 8,170 8,170 8,170 8,170 8,170 8,170
Ambient temperature, °C 20 20 20 20 20 20
GT gross output, kW 113,000 102,410 82,900 62,270 40,580 17,290Power aux. load, kW 2,260 2,200 1,980 1,710 1,380 900Net output, kW 110,740 100,210 80,920 60,560 39,200 16,390Load, % 100 90 73 55 35 15GT fuel input, MMBtu/h HHV 1299.0 1186.8 986.4 797.6 616.6 441.7Duct burner fuel input, MMBtu/h HHV 0.0 68.8 189.6 299.5 397.1 483.1Total fuel input, MMBtu/h HHV 1299.0 1255.6 1176.0 1097.1 1013.6 924.8Heat rate, Btu/kWh HHV 11,730 12,530 14,532 18,115 25,858 556,425Steam to desal., lb/h 586,300 586,300 586,300 586,300 586,300 586,300Desal. production, MIGD 10.8 10.8 10.8 10.8 10.8 10.8Desal. aux. load, kW 8,170 8,170 8,170 8,170 8,170 8,170

A.M. El-Nashar / Desalination 134 (2001) 7–28 17
Table 8Gas turbine, supplementary fired HRSG, backpressure steam turbine supplying constant steam flow to desalination.Performance ratio PR = 8.0
Ambient temperature, °C 50 50 50 50 50 50
GT gross output, kW 95,730 83,540 65,700 47,180 27,480 6,740ST gross output, kW 31,050 31,310 31,290 31,270 31,240 31,190Plant gross output, kW 126,780 114,850 96,990 78,450 58,720 37,930Power aux. load, kW 2,540 2,420 2,220 2,000 1,730 1,390Net output, kW 124,240 112,430 94,770 76,450 56,990 36,540Load, % 100 90 76 62 46 29GT fuel input, MMBtu/h HHV 1154.7 1027.2 847.4 680.3 517.4 361.7Duct burning fuel input, MMBtu/h HHV 0 86.7 192.7 290.9 379.1 455.1Total fuel input, MMBtu/h HHV 1154.7 1113.9 1040.1 971.2 896.5 816.9Heat rate, Btu/kWh HHV 9,294 9,908 10,975 12,704 15,731 22,355Steam to desal., lb/h 428,298 428,298 428,298 428,298 428,298 428,298Desal. production, MIGD 7.89 7.89 7.89 7.89 7.89 7.89Desal. aux. load, kW 5,970 6,000 6,000 5,990 5,990 5,980
Ambient temperature, °C 20 20 20 20 20 20
GT gross output, kW 113,000 102,410 82,900 62,270 40,580 17,290ST gross output, kW 30,700 30,690 30,770 30,770 30,780 30,790Plant gross output, kW 143,700 133,100 113,670 93,040 71,360 48,080Power aux. load, kW 2,870 2,830 2,610 2,360 2,070 1,700Net output, kW 140,830 130,270 111,060 90,680 69,290 46,380Load, % 100 93 79 64 49 33GT fuel input, MMBtu/h HHV 1299.0 1186.8 986.4 797.6 616.6 441.7Duct brning fuel input, MMBtu/h HHV 0 72.3 193.8 303.5 401.1 487.2Total fuel input, MMBtu/h HHV 1299.0 1259.1 1180.2 1101.1 1017.7 928.9Heat rate, Btu/kWh HHV 9,224 9665 10,627 12,143 14,687 20,027Steam to desal., lb/h 427,900 427,900 427,900 427,900 427,900 427,900Desal. production, MIGD 7.88 7.88 7.88 7.88 7.88 7.88Desal. aux. load, kW 5,960 5,950 5,960 5,960 5,960 5,960
3.6. Gas turbine plus supplementary- fired heatrecovery steam generator plus extraction/con-densing steam turbine connected to desalinationplant (CC-EC)
These units produce still more power byreplacing the backpressure turbine with an ex-traction/condensing steam turbine. A controlledextraction port on the steam turbine will
maintain proper steam flow and pressure for thedesalination unit. Desalinated water productionis reduced by about 15% from the backpressuresteam turbine case, since some steam flow isrequired to flow through the low-pressurecondensing section of the steam turbine. As inthe case of a backpressure steam turbine,substantial power turndown can be achieved by
A.M. El-Nashar / Desalination 134 (2001) 7–2818
Fwf
FHiP
Fp
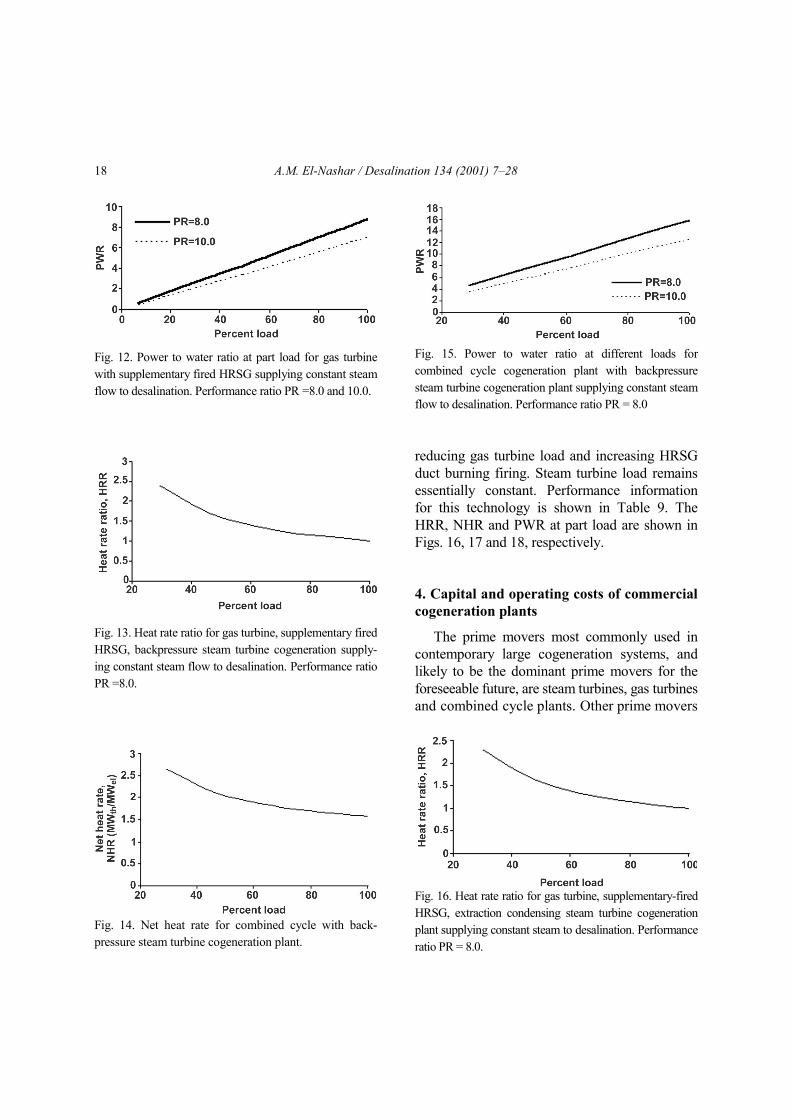
ig. 12. Power to water ratio at part load for gas turbineith supplementary fired HRSG supplying constant steam
low to desalination. Performance ratio PR =8.0 and 10.0.
ig. 13. Heat rate ratio for gas turbine, supplementary firedRSG, backpressure steam turbine cogeneration supply-
ng constant steam flow to desalination. Performance ratioR =8.0.
Fig. 15. Power to water ratio at different loads forcombined cycle cogeneration plant with backpressuresteam turbine cogeneration plant supplying constant steamflow to desalination. Performance ratio PR = 8.0
reducing gas turbine load and increasing HRSGduct burning firing. Steam turbine load remainsessentially constant. Performance informationfor this technology is shown in Table 9. TheHRR, NHR and PWR at part load are shown inFigs. 16, 17 and 18, respectively.
4. Capital and operating costs of commercialcogeneration plants
The prime movers most commonly used incontemporary large cogeneration systems, andlikely to be the dominant prime movers for theforeseeable future, are steam turbines, gas turbinesand combined cycle plants. Other prime movers
ig. 14. Net heat rate for combined cycle with back-ressure steam turbine cogeneration plant.
FHpr
ig. 16. Heat rate ratio for gas turbine, supplementary-firedRSG, extraction condensing steam turbine cogenerationlant supplying constant steam to desalination. Performanceatio PR = 8.0.

A.M. El-Nashar / Desalination 134 (2001) 7–28 19
Fp
TPp
ig. 17. Net heat rate for combined cycle cogenerationlant with extraction/condensing steam turbine.
able 9
Ffcd
art-load performance of gas turbine, supplementary fired HRSG, elant supplying constant steam flow to a desalination unit. Performan
Ambient temperature, °C 50 50GT gross output, kW 95,730 83,540ST gross output, kW 33,200 33,580Plant gross output, kW 128,930 117,120Power aux. load, kW 3,440 3,280Net output, kW 125,490 113,840Load, % 100 91GT fuel input, MMBtu/h HHV 1154.7 1027.2Duct burning fuel input, MMBtu/h HHV 0 86.7Total fuel input, MMBtu/h HHV 1154.7 1113.9Heat rate, Btu/kWh HHV 9,202 9,785Steam to desal., lb/h 360,000 360,000Desal. production, MIGD 6.63 6.63Desal.aux. load, kW 5,020 5,020Ambient temperature, °C 20 20GT gross output, kW 117,280 102,410ST gross output, kW 36,220 33,360Plant gross output, kW 153,500 135,770Power aux. load, kW 3,840 3,610Net output, kW 149,660 132,160Load, % 100 88GT fuel input, MMBtu/h HHV 1342.8 1186.8Duct burning fuel input, MMBtu/h HHV 0.0 72.3Total fuel input, MMBtu/h HHV 1342.8 1259.1Heat rate, Btu/kWh HHV 8,972 9,527Steam to desal., lb/h 360,000 360,000Desal. production, MIGD 6.63 6.63Desal.aux. load, kW 5,020 5,020
ig. 18. Power to water ratio for gas turbine, supplementaryired HRSG, extraction/condensing steam turbineogeneration plant supplying constant steam flow toesalination. Performance ratio PR = 8.0.
xtraction/condensing steam turbine (CC-EC) cogenerationce ratio PR = 8.0
50 50 50 5065,700 47,180 27,480 6,74033,545 33,520 33,465 3399,245 80,700 60,945 40,1353,020 2,730 2,370 1,92096,225 77,970 58,575 38,21577 62 47 30847.4 680.3 517.4 361.7192.7 290.9 379.1 455.11040.9 971.2 896.5 816.910,807 12,457 15,305 21,375360,000 360,000 360,000 360,0006.63 6.63 6.63 6.635,020 5,020 5,020 5,02020 20 20 2082,900 62,270 40,580 17,29033,480 33,485 33,495 33,500116,380 95,755 74,075 50,7903,340 3,030 2,670 2,210113,040 92,725 71,405 48,58076 62 48 32986.4 797.6 616.6 441.7193.8 303.5 401.1 487.21180.2 1101.1 1017.7 928.910,440 11,875 14,252 19,920360,000 360,000 360,000 360,0006.63 6.63 6.63 6.635,020 5,020 5,020 5,020
A.M. El-Nashar / Desalination 134 (2001) 7–2820
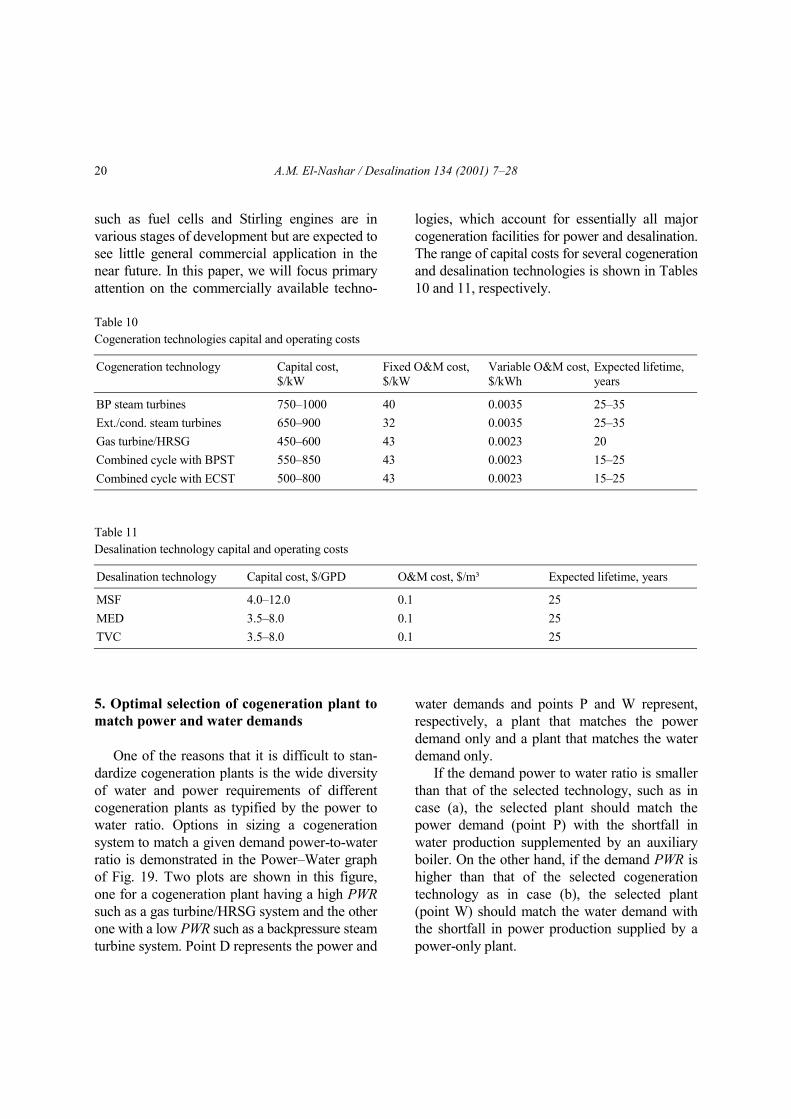
such as fuel cells and Stirling engines are invarious stages of development but are expected tosee little general commercial application in thenear future. In this paper, we will focus primaryattention on the commercially available techno-
logies, which account for essentially all majorcogeneration facilities for power and desalination.The range of capital costs for several cogenerationand desalination technologies is shown in Tables10 and 11, respectively.
Table 10Cogeneration technologies capital and operating costs
Cogeneration technology Capital cost,$/kW
Fixed O&M cost,$/kW
Variable O&M cost,$/kWh
Expected lifetime,years
BP steam turbines 750–1000 40 0.0035 25–35Ext./cond. steam turbines 650–900 32 0.0035 25–35Gas turbine/HRSG 450–600 43 0.0023 20Combined cycle with BPST 550–850 43 0.0023 15–25Combined cycle with ECST 500–800 43 0.0023 15–25
Table 11Desalination technology capital and operating costs
Desalination technology Capital cost, $/GPD O&M cost, $/m³ Expected lifetime, years
MSF 4.0–12.0 0.1 25MED 3.5–8.0 0.1 25TVC 3.5–8.0 0.1 25
5. Optimal selection of cogeneration plant tomatch power and water demands
One of the reasons that it is difficult to stan-dardize cogeneration plants is the wide diversityof water and power requirements of differentcogeneration plants as typified by the power towater ratio. Options in sizing a cogenerationsystem to match a given demand power-to-waterratio is demonstrated in the Power–Water graphof Fig. 19. Two plots are shown in this figure,one for a cogeneration plant having a high PWRsuch as a gas turbine/HRSG system and the otherone with a low PWR such as a backpressure steamturbine system. Point D represents the power and
water demands and points P and W represent,respectively, a plant that matches the powerdemand only and a plant that matches the waterdemand only.
If the demand power to water ratio is smallerthan that of the selected technology, such as incase (a), the selected plant should match thepower demand (point P) with the shortfall inwater production supplemented by an auxiliaryboiler. On the other hand, if the demand PWR ishigher than that of the selected cogenerationtechnology as in case (b), the selected plant(point W) should match the water demand withthe shortfall in power production supplied by apower-only plant.

A.M. El-Nashar / Desalination 134 (2001) 7–28 21
Fig. 19. Matching cogeneration system side to power and water demand.
The selection of the optimal cogenerationfacility from among a number of options isusually carried out using a computer model. It isassumed that the nominal capacity of the requiredcogeneration plant is known (both power andwater production rates) based on the estimateddemand for power and water at the site. Theperformance and cost parameters of a number ofpossible plant configurations are among the inputparameters that are required by the program. Onany one computer run, the program computes thelife cycle cost, LCC, of all discounted cash flowsfor a series of user-supplied unit sizes and theplant with the lowest LCC value is selected.
A computer model for selecting the optimumcogeneration plant with a given nominal powerand water rates is shown in Fig. 20. The model isdesigned to select the optimum cogenerationsystem size for a specific site where the electricaland water demands are specified throughout theyear. The selected system is specified by thefollowing three design parameters:• The cogeneration system size• The number of cogeneration units• The size of the auxiliary boiler if needed.
The selection is made from a user’s desiredspectrum of different sizes and different number
of units that are to be investigated. In addition tothe sizes and number of units, equipment datasuch as cost and performance of each piece ofequipment; economic data such as financingmethod, fuel cost, etc; plant load data such aselectrical and water load variation throughout theyear; and weather data such as ambient tempera-ture and pressure are also required as input to theprogram.
5.1. Economic considerations
The determination of the preferred cogenera-tion system to satisfy a certain power and waterdemand involves examining numerous alterna-tives each for a particular configuration; the finalsystem specification is the result of an extensivetrade-off economic analysis.
The economic value of a proposed cogenera-tion system typically is determined by predictinga series of future cash flows and then evaluatingthese cash flows according to an agreed-upon setof criteria or indicators. The LCC method is themost frequently utilized and widely acceptedinvestment analysis technique. It is based on adiscounted cash flow analysis without regard toeventual financing strategies. The LCC methodrecognizes that a capital investment by a utility is
P
W
W
P
D D
(a) High P/W ratio (b) Low P/W ratioPowerPower
Water Water
Aux. boilerheat
Power-onlyplant
D = demand pointP = match power demandW = match water demand

A.M. El-Nashar / Desalination 134 (2001) 7–2822
Fig. 20.
Optimization model for cogeneration plant.
A.M. El-Nashar / Desalination 134 (2001) 7–28 23
a cash outlay for the purpose of producing astream of future cash revenues (or expensesavings) sufficient to recover, or repay, theinvestment plus a return.
The economic analysis of a cogenerationfacility, as any industrial project, requires a set ofassumptions concerning general economic con-ditions and ground rules, current and future. Theprimary ground rules that must be established foran economic cash flow analysis are:• The economic life of the facility• The first year of operation• The number of years of construction• The general inflation rate• The inflation rate for fuel and O&M expenses
The economic life of cogeneration systems istypically 15 to 25 years and is ultimately limitedby the equipment life. This economic life is theperiod of time over which an investment isevaluated to determine its benefits and returns.The number of years of construction, the first yearof operation, the general inflation rate, and otherspecific rates and escalations are parameters usedto define the investment and operating costs of acogeneration facility.
The life cycle cost analysis method is used todetermine the most cost effective cogenerationoption by comparing the total present worth ofall costs incurred through out the lifetime of theplant. The life-cycle cost of a cogeneration plantproducing electricity and steam is the sum of theinitial cost plus the total present worth of annualcosts. The initial cost includes the cost of thepower generating equipment and the desalinationequipment, engineering, installation and projectmanagement. Thus the initial cost can be ex-pressed as
( ) cogcog TfedIC 1)( +++= (4)
where Tcog is the total hardware cost (powergeneration plus desalination equipment ), d , e,
and f are cost ratios for engineering, installationand project management, respectively.
The present worth of annual costs includeannual fuel costs and O&M costs. The presentworth of these costs can be expressed as [12]:
++
−
−+
=
+
+−
−+
=
Nom
om
omomom
Nf
f
fff
kg
gkg
CPW
kg
gkg
CPW
11
1 1
11
1 1
0
0
(5)
where PWf – present worth of fuel costs, $; PWom– present worth of O&M costs, $; Cf0 – fuel costin the first year, $; Com0 – O&M cost in the firstyear, $; gf – fuel escalation rate; gom – O&Mescalation rate; k – money interest rate; N –system life, years.
The life-cycle cost of the cogeneration plant,(LCC)cog, is obtained as the summation of theinitial plant cost and the present worth of allannual recurring costs:
( ) ( ) ( ) ( )cogomcogfcogcog PWPWICLCC ++= (6)
where (PWf)cog and (PWom)cog are given by
( ) ( )
( ) ( )
++−
−+=
+
+−
−+
=
Nom
om
omcogomcogom
Nf
f
ffcogf
kg
gkgCPW
kg
gkg
CPW
111 1
11
1 1
0
(7)
where (Cf)0 – fuel cost during the first year ofoperation, $; (Com)cog0 – O&M cost during thefirst year of operation, $; gf – fuel escalation rate;gom – escalation rate of O&M expenses; k –interest rate; N – equipment lifetime, years.
The life cycle cost of a desalination plant,consists only of capital amortization and O&Mcosts since the cost of steam and electricity usedby the desalination plant is born by the system as
A.M. El-Nashar / Desalination 134 (2001) 7–2824
a whole and does not involve the consumption ofadditional external resources:
( ) ( ) ( )desomdesdes PWICLCC +=
where (IC)des – initial capital of desalinationplant, $; (PWom)des – present worth of O&M costsof desalination plant, $.
The total life cycle cost of the combined co-generation and desalination plants is the summa-tion of (LCC)cog and (LCC)des
( ) ( ) ( )descogtot LCCLCCLCC += (8)
5.2. Cost allocation between electricity and water
The equality method of the exergy approach[13] is used for costing electricity and steamfrom a cogeneration plant. Based on these costs,the cost of water from the desalination plant canthen be estimated using the normal economicprocedure which take into consideration capital,O&M and energy costs. In the equality methodthe production by the cogeneration plant of thetwo products (electricity and steam) is consideredto have the same priority, so the capital, O&Mand energy costs are split between both productsaccording to the exergy content of each. Basedon this method the cost of electricity per unitexergy, ce
ε, is equal to the cost of steam per unitexergy, cs
ε:
εεes cc = (9)
The life cycle cost of a cogeneration plantwhich consists of capital amortization, O&Mcosts and energy costs can be split among theexergy content of the generated electricity andsteam as follows:
( ) εε ε sssecog cNHmNHPLCC ...... += (10)
where P – average power production, kW; H –plant availability, h/y; εs – exergy content per unitof steam, kWh/ton; CRF – capital recovery factor;ms – average steam production, ton/h.
This equation is used to estimate the unitexergy cost of electricity and steam. The unitcost of electricity ($/kWh) is identical to the unitexergy cost of electricity (also $/kWh) since theexergy content of electricity is identical to itsenergy content; i.e. ce
ε = ce. The unit cost of steamon the other hand is different from its unit exergycost since the exergy content of a mass of steamdepends on its pressure and temperature. The unitcost of steam ($/ton) can be related to its unitexergy cost ($/kWh) by
sss cc εε= (11)
Knowing the unit costs of electricity andsteam, it is now possible to calculate the unit costof water produced by the desalination plant from:
( )
NHm
pfNhPcLCCc
w
etot
w ..
.12
0
∆−
=∑
(12)
5.3. Example
To illustrate the procedure for selecting theoptimum cogeneration system from amongseveral options, let us consider an example whereit is required to install a cogeneration plant havinga rated power output of 300 MW and a rateddesalted water production of 50 MIGD. The plantspecification and economic parameters assumedare given in Table 12.
To make things simple, the desalinationsystem selected for this example is assumed to beMSF which seems to be appropriate for largecapacities such as the one in this example. Ingeneral, other distillation technologies such asMED or TVC could be included in the selectionprocess.

A.M. El-Nashar / Desalination 134 (2001) 7–28 25
Table 12Plant specification and economic parameters
Parameter Value
Rated power output, MW 300Rated water production, MIGD 50Performance ratio of MSF plant 7,8,9Fuel cost, $/GJ 1Plant factor 0.9Escalation rate for fuel 0.03Escalation rate for O&M expenses 0.03Interest rate 0.08Plant lifetime, year 25
The options for plant configurations are asfollows:• Backpressure steam turbine connected to MSF
(BP-ST)• Extraction-condensing steam turbine connect-
ed to MSF (EC-ST)• Gas turbine with heat recovery steam genera-
tor connected to MSF (GT-HRSG)• Combined cycle gas/backpressure steam tur-
bine connected to MSF (CC-BP)• Combined cycle gas/extraction-condensing
steam turbine connected to MSF (CC-EC)
The assumed specific capital cost and O&Mcost for each of the above cogeneration optionsas well as the MSF plant are shown in Table 13.
The electrical load on the cogeneration plantis assumed to vary throughout the year accordingto Fig. 21. This load variation is typical for othercogeneration plants operating in Abu Dhabi, UAE,and is also similar to the load patterns in otherGulf areas. The MSF desalination plant isassumed to operate at full load throughout theyear. The shortfall in steam production by thecogeneration plant is assumed to be supplied byan auxiliary boiler whose capacity depends onthe configuration of the plant as well as the loadvariation.
Table 13Specific capital and O&M costs of the cogeneration plants
Cost parameter Specificcapital cost,$/kW
FixedO&M cost,$/kWy
VariableO&M cost,$/kWh
BP-STEC-STGT-HRSGCC-BPCC-ECMSF, PR =7–9
10009507008008008–10 $/gpd
40324343430
0.00350.00350.00230.00230.00230.1 $/m³
Fe
wfasbrotcfrb
Ofig
ig. 21. Electrical monthly load ratios assumed for thexample problem.
The annual fuel consumption for each optionas estimated as the summation of the monthly
uel consumption by both the cogeneration plantnd the auxiliary boiler. The monthly fuel con-umption by the cogeneration plant was estimatedy multiplying the monthly-average plant heatate and monthly average load. The heat ratebviously depends on the plant load that varieshroughout the year. The monthly-average fuelonsumption by the auxiliary boiler is estimatedrom knowledge of the shortfall in the steamequired by the MSF plant that cannot be suppliedy the cogeneration plant.
The capital cost, present value of fuel and&M expenditures as well as the life cycle cost
or each option are shown in Table 14 whichndicates that the most economic alternative is theas turbine-heat recovery steam generator with a

A.M. El-Nashar / Desalination 134 (2001) 7–2826
life cycle cost of 1493 million $ to be followedwith a small margin by the combined cycle-backpressure option. The costs shown in this table areestimated assuming that the performance ratio,PR = 9.0.
The LCC for different values of PR is shownin Fig. 22 which indicates that the LCC is quitesensitive to the PR value for each plant configu-ration. The BP-ST configuration shows an in-creasing trend for LCC with increasing the PR.However, the other configurations displays theopposite trend, i.e. the LCC decreases withincreasing PR. As can be seen, the lowest LCCvalue is for the GT-HRSG option with PR = 9.0.The reason why the BP-ST exhibits this trend isthat when the PR of the desalination plant isabout 7, the annual amount of steam dischargedfrom the BP steam turbine is just enough tosupply the required amount of steam required bythe desalination plant. Thus the steam turbinewill match the MSF plant reasonably well. Onthe other hand, when the PR is larger than 7, thesteam turbine will produce more steam thanrequired by the MSF plant and hence some ofthis steam will have to be condensed in a dumpcondenser which constitutes a waste of energy.Thus increasing the PR beyond 7 for this optionbrings only increase in capital cost of the MSFplant and no extra benefit to the overall economyof the cogeneration plant.
The situation with the other cogenerationoptions is the opposite to that of the BP-ST onein that for these options, the amount of steamproduced is smaller that that required by theMSF plant which make it necessary to install anauxiliary boiler to supplement the shortfall insteam requirement. The additional capital, fueland O&M expenses associated with this boilercontributes to a high LCC value for the wholecogeneration plant. The increase in the perfor-mance ratio of the MSF plant can relieve thissituation by reducing the capacity of the auxiliaryboiler required as well its associated fuel andO&M expenses thus help to reduce the LCC.
Table 14Life cycle costs of the different cogeneration options(PR = 9)
Costparameter
Capitalcost, $106
PV fuel,$106
PV O&M,$106
Life cyclecost, $106
BP-STEC-STGT-HRSGCC-BPCC-EC
800803727772775
552465533439459
194266233292303
15471534149315031537
PV = present value
F
iciu
F(
ig. 22. Life cycle cost for different performance ratio.
The unit cost of electricity and water is shownn Figs. 23 and 24, respectively. The optimumogeneration option (GT-HRST at PR=9) resultsn a unit cost of electricity of 2.16 c/kWh and anit water cost of 1.13 $/m³.
ig. 23. Cost of electricity for each cogeneration optionPR = 9.0).

A.M. El-Nashar / Desalination 134 (2001) 7–28 27
F9
6
•
•
•
•
•
7
Cc
ceε — Cost of electricity per unit exergy,
ig. 24. Cost of water for each cogeneration plant (PR =.0).
. Conclusions
The wide variety of options available for com-bining cogeneration plants with desalinationplants and the influence of the technical andeconomic performance parameters of eachcombination makes the use of system model-ing using computer programming inevitable.
The optimum cogeneration option dependsstrongly on the load variation throughout theyear. Both monthly electrical and waterproduction loads should be input parametersto the computer model.
The power to water ratio of the differentcombinations of cogeneration plants scans therange from 4 to 18 MW per MIGD with thelowest ratio for the BP-ST option and thehighest ratio for the CC-EC option.
The power to water ratio has a strong influenceon the optimum selection of a cogenerationplant.
The selection of the most economicalcogeneration plant should be based on a lifecycle cost analysis which should take intoconsideration the escalation rates of fuel andO&M expenses in order to arrive at anestimate of the total expenses for each optionfor the whole lifetime of its operation.
. Symbols
e — Annual cost of electricity, $e — Unit cost of electricity, $/kWh
$/kWhCf — Annual fuel cost, $Cfo — Fuel cost during first year of operation, $Com — O&M cost during first year of opera-
tion, $CRF — Capital recovery factorCs — Annual steam cost, $cs — Unit cost of steam, $/toncs
ε — Cost of steam per unit exergy, $/kWhE — Exergy, kWFESR — Fuel energy savings ratiogf — Annual fuel escalation rategom — Annual O&M cost escalation rateH — Plant operation time, hours per yearHR — Heat rate, Btu/kWhHRR — Heat rate ratioIC — Initial capital cost, $IC — Initial capital, $k — Interest rateLCC — Life cycle cost, $Md — Rated capacity of desalination plant,
m³/dmw — Rated capacity of desalination plant,
m³/hN — Plant lifetime, yearsNHR — Net heat rate, MWth/MWelec
O&M — Annual O&M expenses, $pf — Plant availability, number of running
hours per year divided by 8760P — Net power output, kWP — Monthly average load, kWPR — Performance ratioPW — Present worth, $PWR — Power to water ratio, MW/MIGDT — Total hardware cost, $
Greek
∆h — Number of hours in a monthλcog — Process heat to power ratio, MWth/MWel
ηb — Boiler efficiencyηc — Thermal efficiency of a conventional
power plant

A.M. El-Nashar / Desalination 134 (2001) 7–2828
Subscripts
cog — Cogenerationdes — Desalinatione — Electricityf — Fuelfo — Fuel for first yearnet — Net powerom0 — O&M for first yearom — Operation and maintenances — Steamw — Water
Abbreviations
BP-ST — Back pressure steam turbine coge-neration
CC-BP — Combined cycle with back pressuresteam turbine cogeneration
CC-EC — Combined cycle with controlledextraction-condensing steam tur-bine cogeneration
EC-ST — Controlled extraction-condensingsteam turbine cogeneration
GT-HRSG — Gas turbine and heat recoverysteam generator cogeneration
IC — Initial costLCC — Life cycle costMED — Multiple effect distillationMSF — Multistage flashO&M — Operation and maintenanceTVC — Thermal vapor compression
References and bibliography
[1] L. Awerbuch, Power-desalination and the importanceof hybrid ideas, Proc., IDA World Congress onDesalination and Water Reuse, Madrid, Spain, 1997.
[2] J. Kovacik, R. Boericke and S. Jupp, Cogenerationprinciples, technologies and systems, in: Cogeneration— Why, When, and How to Assess and Implement aProject, R.H. McMahan, Jr., Ed., Marcel Dekker, Inc.,New York, 1987.
[3] I. Kamal, Thermo-economic modeling of dual-purpose power/desalination plants: steam cycles,Proc., IDA World Congress on Desalination andWater Reuse, Madrid, Spain, 1997.
[4] J.W. Baughn and N. Bagheri, The Effect of ThermalMatching on the Thermodynamic Performance ofGas Turbine and IC Engine Cogeneration Systems”,ASME 85-IGT-106, 1985.
[5] M. Haaland and K. Schüller, Brown Boverie Rev.,(1977) 9–77.
[6] P.N. Estey, S.J. Jabbour and T.J. Connoly, AModel for Sizing Cogeneration Systems. StanfordUniversity, Palo Alto, CA, 1980.
[7] A. Rohrer, Comparison of combined heat and powergeneration plants, ABB Rev, 3 (1996).
[8] A. Antonini, D. Micheli and P. Pinamonti, Perfor-mance parameters evaluation in industrial cogene-ration plants, ASME COGEN-TURBO, IGTI, 6(1991).
[9] B.J. Jody, E.J. Daniels and R.M. Bowman, Econo-mics of Industrial Cogeneration, Institute of GasTechnology, Chicago, IL.
[10] R.H. McMahan, Jr., Ed., Cogeneration — Why,When, and How to Assess and Implement a Project,Marcel Dekker, Inc., New York, 1987.
[11] F.W. Payne, Ed., Cogeneration Sourcebook, TheFairmont Press, Inc.
[12] P.P. Groumpos and G. Papageorgiou, Solar Energy,38(5) (1987) 341.
[13] T.J. Kotas, The Exergy Method of Thermal PlantAnalysis, Krieger Publishing Company, Malabar,FL, USA, 1995.
Related Documents