More Coffee (Más Café) Project Monitoring & Evaluation (M&E) Plan Submitted: October 15, 2014 This publication was produced for review by the United States Agency for International Development. It was prepared by TechnoServe.

Welcome message from author
This document is posted to help you gain knowledge. Please leave a comment to let me know what you think about it! Share it to your friends and learn new things together.
Transcript
More Coffee (Más Café) Project
Monitoring & Evaluation (M&E) Plan
Submitted: October 15, 2014
This publication was produced for review by the United States Agency for International Development. It
was prepared by TechnoServe.
More Coffee (Más Café)
Project Monitoring &
Evaluation (M&E) Plan
DISCLAIMER
The author´s views expressed in this publication do not necessarily reflect the views of the
United States Agency for International Development or the United States Government.
CONTENTS
I. Introduction ..................................................................................................................................................................... 5
II. The Project’s Theory of Change ............................................................................................................................... 5
III. A Multi-disciplinary M&E Approach ......................................................................................................................... 7
3.1 Project Inception .................................................................................................................................................... 7
3.2 Setting up the M&E System .................................................................................................................................. 7
3.3 Baseline Study.......................................................................................................................................................... 7
3.4 Implementation & Course Correction .............................................................................................................. 8
IV. Evaluations ..................................................................................................................................................................... 8
4.1 Mid-term Performance Evaluation ..................................................................................................................... 9
4.1 (a) Methodology ..................................................................................................................................................... 9
4.1 (b) Procedure and timeline of evaluation activities ...................................................................................... 10
4.1 (c) Audience and key stakeholders .................................................................................................................. 10
4.1 (d) Utilization of evaluation findings and recommendations ...................................................................... 10
4.2 Final Evaluation .................................................................................................................................................... 10
4.2 (a) Methodology ................................................................................................................................................... 11
4.2 (b) Procedure and timeline of evaluation activities ...................................................................................... 11
4.2 (c) Utilization of evaluation findings and recommendations ...................................................................... 12
V. Gender Integration into the M&E Approach ....................................................................................................... 12
VI. Data Collection, Quality Assurance & Reporting Procedures ....................................................................... 12
5.1 Program indicators and targets ......................................................................................................................... 12
5.2 M&E Team .............................................................................................................................................................. 13
5.3 Procedure for data collection and analysis .................................................................................................... 14
VII. Performance Indicator Reference Sheet PIRS ................................................................................................... 15
Value of incremental sales (collected at farm-level) attributed to FTF implementation (RiA) (4.5.2-23.
FTF Standard) ................................................................................................................................................................... 15
Percent change in coffee yields (Custom) ................................................................................................................. 17
Value of agriculture and rural loans (RiA) (WOG) (4.5.2-29 FTF Standard) .................................................... 19
Percent of farmers seeking loans who obtain them with project assistance (Custom) ................................. 21
Number of farmers and others who have applied improved technologies or management practices as a
result of USG assistance (RiA) (4.5.2-5 FTF Standard) ........................................................................................... 23
Number of Community Trainers (CT) who continues working to increase capacity in the coffee sector.
(Custom) ............................................................................................................................................................................ 26
Percent change of farmers with established coffee sales agreements (Custom) ............................................. 28
Number of private enterprises, producers organizations, water users associations, women’s groups,
trade and business associations and community-based organizations (CBOs) that applied improved
technologies or management practices as a result of USG assistance (RiA) (WOG) (4.5.2-42 FTF
Standard) ............................................................................................................................................................................ 30
Number of agreements with locally operating firms to facilitate financing for smallholder coffee farmers
(Custom) ............................................................................................................................................................................ 32
Number of public-private partnerships formed as a result of FTF assistance (4.5.2-12 FTF Standard) ..... 34
Number of Individuals who have received USG-supplied short term agricultural sector productivity or
food security training (4.5.2-7 FTF Standard) ........................................................................................................... 36
Number of local employers recruited to employ CTs in training provision in target areas (Custom) ...... 38
Number of food security private enterprises (for profit), producers organizations, water users
associations, women’s groups, trade and business associations, and community-based organizations
(CBOs) receiving USG assistance (RiA) (WOG) (4.5.2-11 FTF Standard)........................................................ 40
Percent of farmers scoring 75% or higher on a financial literacy aptitude test (Custom) ............................. 42
5
I. Introduction
The objectives of the Monitoring and Evaluation (M&E) Plan are to:
● Inform program management decision-making throughout the 4-year program to ensure
achievement of program goals
● Enable accurate and timely reporting to all stakeholders, including USAID, Smucker’s, oth-
er local stakeholders, and internal TechnoServe processes
● Evaluate program results and achievements and identify lessons learned for future initia-
tives
To achieve these objectives, the M&E Plan detailed below establishes the structure for a robust, trans-
parent, and practical M&E system. The plan lays out a coherent theory of change, a multi-disciplinary
M&E approach, clear data collection and reporting procedures, and a plan for integrating M&E data into
project decision-making.
II. The Project’s Theory of Change
TechnoServe uses a logical framework as the basis for monitoring and evaluation and data-based deci-
sion making. The project’s logical framework sets out a theory of change as to how the activities de-
scribed in the technical approach lead to outputs, outcomes, and expected goals. Our goal is to con-
tribute to sustainably reducing poverty and hunger by improving farm sales among more than 6,000 male
and female smallholder coffee farmers in El Salvador and Nicaragua. TechnoServe’s theory of change is
to improve farm sales by increasing farmers’ resilience and their inclusion in the coffee market system.
Resilient coffee farmers are better positioned to endure shocks brought on by extreme weather condi-
tions or price variations. Coffee farmers who are more included in the overall market system have
greater access to services and supports that the system provides. Two output components directly con-
tribute to achieving our intended outcome of increased resilience and inclusion. First, TechnoServe will
train smallholder farmers to improve their agronomic practices. Second, TechnoServe will facilitate ac-
cess to key inputs and financing. A third output component establishing the project’s monitoring and
evaluation system indirectly contributes to the project’s outcome by improving management’s ability to
successfully execute the other two output components.
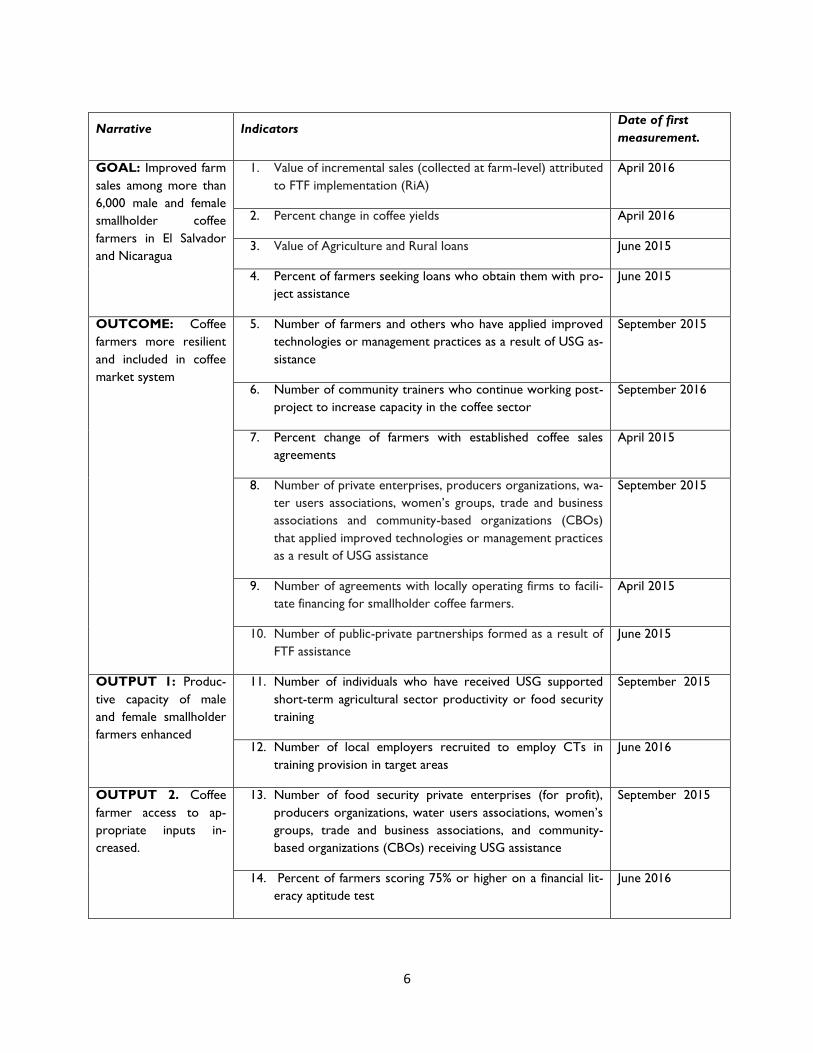
The project has selected indicators that will test the theory of change, as illustrated in the project’s logi-
cal framework, which is included in Annex I. If the theory is correct, progress against the projects’ out-
put indicators will stimulate behavior change among project beneficiaries, as measured by the outcome-
level indicators. As a result of the change in behavior among project beneficiaries, the project’s goal-level
indicators will begin to register change. The graphic below illustrates the output-outcome-goal level
results chain for this project and identifies timing estimates for when the project may expect to see
results at each level.
6
Narrative Indicators Date of first
measurement.
GOAL: Improved farm
sales among more than
6,000 male and female
smallholder coffee
farmers in El Salvador
and Nicaragua
1. Value of incremental sales (collected at farm-level) attributed
to FTF implementation (RiA)
April 2016
2. Percent change in coffee yields April 2016
3. Value of Agriculture and Rural loans June 2015
4. Percent of farmers seeking loans who obtain them with pro-
ject assistance
June 2015
OUTCOME: Coffee
farmers more resilient
and included in coffee
market system
5. Number of farmers and others who have applied improved
technologies or management practices as a result of USG as-
sistance
September 2015
6. Number of community trainers who continue working post-
project to increase capacity in the coffee sector
September 2016
7. Percent change of farmers with established coffee sales
agreements
April 2015
8. Number of private enterprises, producers organizations, wa-
ter users associations, women’s groups, trade and business
associations and community-based organizations (CBOs)
that applied improved technologies or management practices
as a result of USG assistance
September 2015
9. Number of agreements with locally operating firms to facili-
tate financing for smallholder coffee farmers.
April 2015
10. Number of public-private partnerships formed as a result of
FTF assistance
June 2015
OUTPUT 1: Produc-
tive capacity of male
and female smallholder
farmers enhanced
11. Number of individuals who have received USG supported
short-term agricultural sector productivity or food security
training
September 2015
12. Number of local employers recruited to employ CTs in
training provision in target areas
June 2016
OUTPUT 2. Coffee
farmer access to ap-
propriate inputs in-
creased.
13. Number of food security private enterprises (for profit),
producers organizations, water users associations, women’s
groups, trade and business associations, and community-
based organizations (CBOs) receiving USG assistance
September 2015
14. Percent of farmers scoring 75% or higher on a financial lit-
eracy aptitude test
June 2016
7
TechnoServe employs data generated from the monitoring and evaluation system to constantly test the
project’s theory of change. If, for example, the project is on target for achieving the identified outputs
but has not seen a concomitant change in project outcome targets, the management team will re-
evaluate the theory of change to identify bottlenecks or other barriers to achieving outcomes. Once
identified, the project will course correct, redefining its strategy at the activity and output level in order
to better ensure the achievement of project outcomes and goals.
III. A Multi-disciplinary M&E Approach
TechnoServe’s M&E approach facilitates a continual learning cycle by providing multiple data sources to
test hypotheses and, when indicated, make rapid course correction. The strategy is buttressed by the
project team’s use of Collaborative Learning and Adaptation (CLA) principles to ensure engagement of
project participants and to create ongoing feedback loops.
TechnoServe performs rigorous project evaluations that seek to establish project impact and provide
lessons learned for future development efforts. The project’s evaluation strategy will use quantitative
and qualitative methods to determine how the project contributed to improved welfare among benefi-
ciaries. Using this methodology, the project will collect data from a representative sample of the benefi-
ciary population and a comparable control population at project baseline and end line. In addition, the
project will evaluate progress towards outcome and goal-level targets at the mid-term review. A final
evaluation will consolidate data and provide recommendations for future efforts.
The approach incorporates M&E best practices during project inception, implementation and course
correction, and project closeout.
3.1 Project Inception
Primary activities during the inception phase include setting up the M&E data collection, analysis, and
reporting system and performing a baseline assessment of project indicators to inform implementation
strategy and targets.
3.2 Setting up the M&E System
The M&E team, with inputs from the project manager and field team, will perform an in-depth analysis of
data collection, quality assurance, and reporting requirements to ensure the project is prepared to re-
port on all indicators. M&E will then establish data collection protocols, design collection forms, and
train the relevant project team members in their use. The project will also develop an information flow
chart to illustrate how M&E data will be shared with project stakeholders in order to support evidence-
based decision-making.
A critical component of the inception phase is the development of a functioning database system that
will securely store, manage, and provide relevant reports on project data. The Project will be among the
first TechnoServe projects to adopt Taroworks, a technology developed by Grameen Foundation and
based on SalesForce database functionality. Taroworks will support the project’s data collection efforts
by integrating the potential of mobile data collection technology with state-of-the-art customer relation-
ship management software. By adopting Taroworks, the project will be at the forefront of
TechnoServe’s global effort to consolidate M&E management onto a single data platform facilitating pro-
ject-level analysis and organizational learning. It is expected that the project’s experience using
Taroworks will serve as a template for future TechnoServe projects.
3.3 Baseline Study
Baseline studies ensure that development projects have a point of comparison prior to the project’s
intervention from which to measure progress towards the outcome and goal-level indicators. Outcome
and goal-level data to be measured during the project’s baseline include:
8
● Level of farm revenues from coffee
● Level of coffee yields
● Use of good agricultural practices in coffee
● Percent of farmers with established coffee sales agreements
In addition to benchmarking current levels of key project indicators, the baseline will capture environ-
mental and economic characteristics of the beneficiary community in order to better inform the pro-
ject’s intervention strategy. Among the data to be collected include:
● Farm planting density
● Percent incidence of leaf rust and other agronomic problems
● Farm diversification strategies
● Average value of loans obtained for coffee farming
● Percent of farmers obtaining loans for coffee farming
TechnoServe will also carry out a gender analysis when obtains baselines data to better understand men
and women’s constraints and opportunities as coffee farmers, in order to create an intervention that
improves gender equality. The gender analysis will cover topics such as:
● Men and women’s access to productive resources (land, inputs, finance)
● Men and women’s roles in coffee production and commercialization
● Household decision-making over use of coffee income
The baseline study will be carried out after the project has consolidated participant lists for the project’s
first training cycle and before any effect on outcome and goal-level indicators is measurable. Given these
conditions, it is estimated that the project will complete the baseline study following the 2014/2015
coffee harvest in April – June of 2015.
The study will collect data from a representative sample of the project’s beneficiary population and a
sample of a comparable coffee-producing population that will provide counterfactual evidence of project
impact. The project will analyze the results from the baseline study in order to refine the implementa-
tion strategy and targets. Project management will propose any strategy or target changes to USAID
within three months of completing the baseline study.
3.4 Implementation & Course Correction
During implementation, the M&E team will collect, aggregate and analyze data to produce periodic re-
ports on project implementation and progress toward outputs. In addition to monitoring project imple-
mentation, the M&E team will oversee an annual survey to assess performance against outcome-level
indicators. Analysis of the reports and surveys will inform project decision-making and course correc-
tion, if necessary. TechnoServe will hire an external third party to perform a mid-term review in Q3 of
FY 2016 with a final evaluation performed in Q1 of FY 2018.
IV. Evaluations
TechnoServe will oversee a mid-term and final evaluation for the project. In addition, Más Café is under
the USAID/ E-CAM Regional Integrated Trade and Food Security Strategy which will have a mid-term
performance evaluation and a final performance evaluation. These evaluations will be more focused on
the strategy level than the Project level.
9
4.1 Mid-term Performance Evaluation
The purpose of the mid-term evaluation is to review and assess implementation progress, identify early
results from project activities, and help project management determine course corrections needed to
fully achieve project results in the remainder of the project.
The mid-term evaluation will concentrate on providing an analysis of the relevance, efficacy, and efficien-
cy of implementation activities carried out to date in order to assess the following:
● What advances toward impact has the project already achieved? Based on changes in beneficiary
behavior as a result of the program, what level of impact can already be estimated?
● Will the project’s implementation strategy for the remainder of the project’s lifetime ensure
achievement of project goals? If not, what changes to the implementation strategy would in-
crease the likelihood of project success?
The evaluation will cover the relevance of the project to the key problems facing male and female coffee
farmers in Nicaragua and El Salvador, quality of project design, efficiency of implementation, partners’
perception of change and potential sustainability, the extent to which the assumptions outlined in the
project results framework are valid, and identify external factors beyond the control of the project that
have affected it negatively or positively.
The lessons learned and results of the evaluation will feed into a set of recommended course correc-
tions to ensure that all targeted results are achieved by the end of the project and address any issues
that might prevent project activities from being sustainable upon the project’s completion.
4.1 (a) Methodology
The mid-term evaluation methodology will encompass the following components:
● A critical assessment of the project’s theory of change in order to evaluate the likelihood of
the project achieving its goals based on the current strategy.
● An implementation evaluation that reviews progress towards agreed upon project activities
to ensure that they are being implemented as expected. The implementation evaluation will in-
form project leadership and stakeholders as to which indicators are expected to demonstrate
impact, given the current progress in the project.
● A quantitative survey among a statistically representative random sample of the beneficiary
population to identify improvements in the application of best agricultural practices and other
project outcomes. The survey will employ a 95% confidence margin and a +/-5% margin of error
on the indicator of interest.
● A qualitative component encompassing in-depth stakeholder interviews, focus group among
project beneficiaries, and other strategies as identified by the Mid-term Evaluation Team that will
deepen the evaluation’s analysis of project reach and impact.
Taken together, these methods will provide inputs for conclusions as to whether or not the project's
efforts are on track to lead to impact-level targets by closeout. The report will include the current pro-
gress against relevant indicators. That is, the report will address progress against those indicators on
which donors and other stakeholders may expect the project to have achieved results. It will also ad-
dress indicators for which the project is not expected to have achieved a result and provide projections
on future impact based upon project progress and the theory of change. The indicator status report will
disaggregate where possible observed differences among the project’s geographic areas and client pro-
ducer organizations. This report will become the basis for more in-depth analysis, focused on shortfalls
in achieving performance expectations.
10
4.1 (b) Procedure and timeline of evaluation activities
The mid-term performance evaluation will be carried out by an external consultant, managed by a Mid-
term Review Team made up of the Regional M&E Manager, Project M&E Manager, the Project Director,
and TechnoServe’s Central America Program Manager. The Regional M&E Manager will provide general
oversight, backstopping and quality control of the evaluation results and methodology. TechnoServe will
share the Terms of Reference for the contracting of the external consultant with USAID to obtain feed-
back. Through a transparent, public tender, the Mid-term Review Team will announce and evaluate pro-
posals.
The selected external consultant will be responsible for developing a work plan and research instru-
ments based on the mid-term evaluation’s methodology. S/he will conduct producer surveys (with pos-
sible logistical assistance from TechnoServe in an effort to reduce costs), producer focus groups, and
producer organization surveys; analyze qualitative and quantitative data as well as project implementa-
tion data in the context of the project’s theory of change; and deliver a mid-term evaluation report with
recommendations to ensure the project may achieve its stated goals. In addition to providing infor-
mation on project progress in meeting targets and offering suggestions for improving effectiveness, the
evaluator will be asked to make recommendations for the final evaluation.
TechnoServe will initiate the process for procuring the mid-term evaluator by Q3 FY 2015 of project
implementation. Mid-term evaluation activities will be carried out during Q3 FY 2016, with a final report
submitted to USAID by September, 2016.
4.1 (c) Audience and key stakeholders
The mid-term evaluation will be primarily used by the Project as a management tool to assess the pro-
ject’s progress to date and identify needed course corrections, thereby guiding project management to
achieving project objectives and the most effective use of project funding. The extended audience for
this evaluation is USAID, Smucker´s and the Pacific Investment Management Company (PIMCO).
4.1 (d) Utilization of evaluation findings and recommendations
The evaluation findings will be discussed by project management and presented to USAID and relevant
stakeholders at a project stakeholder’s workshop. During this workshop the Mid-term Review Team,
supported by their external consultants, will present the relevant evaluation findings. They will present
the indicator status report, highlighting any potential areas for concern; present lessons learned and the
resulting set of recommendations – and Project management’s proposed response -- for the second half
of the implementation period. Based on feedback received the external evaluator will complete the mid-
term evaluation report and submit it to USAID. Pending recommendations and relevant approvals from
USAID, Project management will implement the changes and begin reporting against them in the follow-
ing semi-annual report.
4.2 Final Evaluation
At closeout, TechnoServe will oversee a final evaluation to establish the project’s impact. The final eval-
uation will be used internally to improve future project design and implementation strategy. In addition,
TechnoServe will seek out opportunities to share best practice identified within the final evaluation with
the larger development community.
11
The final evaluation - to be carried out by an external evaluator - will measure project success in effi-
ciently and sustainably achieving its goals. Specifically, the evaluation will measure the change in coffee
yields and revenues among farmer beneficiaries in comparison with the counterfactual population. It will
also determine the level to which project efforts can be attributed to having caused the change in yields
and revenues.
4.2 (a) Methodology
The final evaluation will employ qualitative and quantitative methods to gather evidence of project im-
pact. Critical components of the evaluation will include:
● A review of the project’s theory of change as implemented to assess the project’s coherence
and relevance for the Central American coffee-growing context.
● A review of project documents generated over during implementation, including market
studies, gender assessments, mid-term evaluation, and other annual surveys of project outcomes
performed.
● A quantitative survey among a statistically representative random sample of the beneficiary
population and the counterfactual population. The survey will measure changes to key indicators
identified in the baseline survey, including: o Level of farm revenues from coffee
o Level of coffee yields
o Use of good agricultural practices in coffee
o Percent of farmers with established coffee sales agreements
The survey will employ a 95% confidence margin and a +/-5% margin of error on the indicators
of interest.
● A qualitative component encompassing in-depth stakeholder interviews, focus group among
male and female project beneficiaries, and other strategies as identified by the Final Evaluation
Team that will deepen the evaluation’s analysis of project reach and impact.
The external evaluators will consolidate the evidence gathered and compare findings across quantitative
and qualitative research methods to construct an argument for project impact and the contributions of
each of the project’s output components to achieving that impact. In doing so, the final evaluation will
not only substantiate the degree to which the project achieved its goals but also identify the primary
drivers towards achieving those goals.
4.2 (b) Procedure and timeline of evaluation activities
The final evaluation will be carried out by an external consultant, managed by a Final Evaluation Team
made up of the Regional M&E Manager, Project M&E Manager, the Project Director, and TechnoServe’s
Central American Program Manager. The Regional M&E Manager will provide general oversight, back-
stopping and quality control of the evaluation results and methodology. TechnoServe will share the
Terms of Reference for the contracting of the external consultant with USAID to obtain feedback.
Through a transparent, public tender, the Mid-term Review Team will announce and evaluate proposals.
The selected external consultant will be responsible for developing a workplan and research instruments
based on the final evaluation’s methodology. S/he will conduct surveys among beneficiary and compari-
son group populations, producer focus groups, and producer organization surveys; analyze qualitative
and quantitative data as well as project implementation data in the context of the project’s theory of
change; and deliver a final evaluation report with observations how the success of the project in achiev-
ing its stated goals.
12
TechnoServe will initiate the process for procuring the final evaluator by Q3 FY 2017 of project imple-
mentation. Final evaluation activities will be carried out during Q4 FY 2017 and Q1 FY 2018, with a final
report submitted to USAID within three months of project closeout.
4.2 (c) Utilization of evaluation findings and recommendations
The final evaluation will be shared broadly with project partners, community stakeholders, USAID,
Smucker’s, PIMCO, other project partners, and the development community. TechnoServe will share
the synthesized reports of project progress, or appropriate excerpts, to key stakeholders such as pro-
ducer organizations, partner government agencies, and other donors and implementers with activities
near the project sites. In addition, TechnoServe will reflect internally on evaluation findings in order to
improve the design and implementation strategy of future agricultural value-chain projects.
V. Gender Integration into the M&E Approach
In addition to a multi-disciplinary approach to M&E, the project will ensure that gender is fully integrated
into project implementation, measurement and data analysis, and reporting. The M&E team, in consulta-
tion with TechnoServe’s LAC Regional Gender Advisor, will adapt elements of USAID-promoted tools
such as the Women’s Empowerment in Agriculture Index and the Gender Integration Framework ma-
trix to perform a gender assessment aimed at providing project management with key insights into Cen-
tral American women’s and men’s roles in coffee production and commercialization.
Following the gender assessment while we are performing the baseline, the project team including M&E
staff will revise project indicators and targets to ensure the project’s goals reflect the value of promoting
gender equity and women’s full participation in the project. This includes analyzing how the project will
promote women’s voice in the coffee value chain, their control over economic assets, and a reduction in
gender-based violence. Based on the context and needs identified in the gender assessment, the project
may create new indicators to ensure TechnoServe responds to these issues and/or update existing tar-
gets to ensure adequate gender representation.
On-going monitoring efforts will place a priority on measuring the project’s ability to reach both men
and women equitably. TechnoServe will also develop a strategy to monitor unintended gender-related
consequences. Mid-term and final evaluations will place a key focus on the extent to which the project
has successfully promoted gender equity throughout the intervention.
VI. Data Collection, Quality Assurance & Reporting Procedures
6.1 Program indicators and targets
TechnoServe has selected a total of 14 performance indicators to track progress toward each of the
above outputs, outcomes, and goals over the course of the project. These are shown in the Perfor-
mance Indicators Reference Sheets (PIRS). Seven out of the fourteen indicators are standard and are
part of the 2013 Feed the Future Indicator Handbook. The remaining seven indicators are custom and
designed especially for this project.
● Goal-level indicators track improvements to farm revenue and coffee productivity.
● Outcome-level indicators track farmers’ adoption of new techniques and the extent to which farmers
are better integrated in the coffee market system.
● Output-level indicators track the products and results of program activities.
13
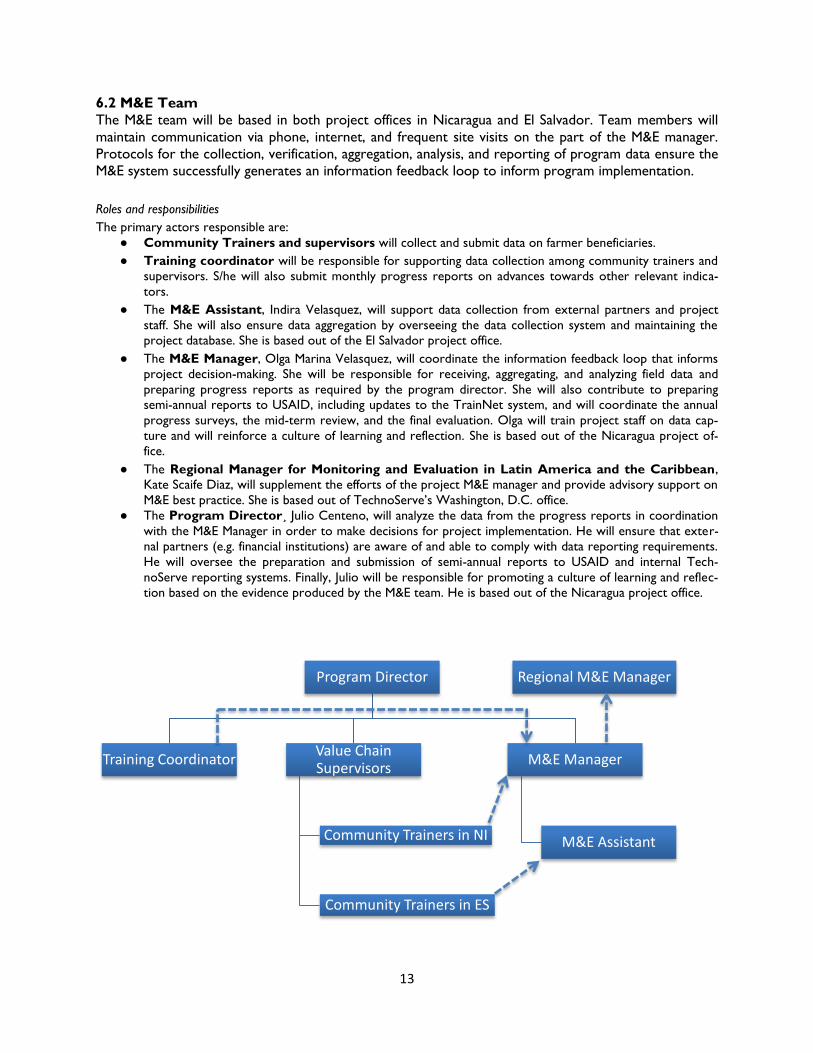
6.2 M&E Team
The M&E team will be based in both project offices in Nicaragua and El Salvador. Team members will
maintain communication via phone, internet, and frequent site visits on the part of the M&E manager.
Protocols for the collection, verification, aggregation, analysis, and reporting of program data ensure the
M&E system successfully generates an information feedback loop to inform program implementation.
Roles and responsibilities
The primary actors responsible are: ● Community Trainers and supervisors will collect and submit data on farmer beneficiaries.
● Training coordinator will be responsible for supporting data collection among community trainers and
supervisors. S/he will also submit monthly progress reports on advances towards other relevant indica-
tors.
● The M&E Assistant, Indira Velasquez, will support data collection from external partners and project
staff. She will also ensure data aggregation by overseeing the data collection system and maintaining the
project database. She is based out of the El Salvador project office.
● The M&E Manager, Olga Marina Velasquez, will coordinate the information feedback loop that informs
project decision-making. She will be responsible for receiving, aggregating, and analyzing field data and
preparing progress reports as required by the program director. She will also contribute to preparing
semi-annual reports to USAID, including updates to the TrainNet system, and will coordinate the annual
progress surveys, the mid-term review, and the final evaluation. Olga will train project staff on data cap-
ture and will reinforce a culture of learning and reflection. She is based out of the Nicaragua project of-
fice.
● The Regional Manager for Monitoring and Evaluation in Latin America and the Caribbean,
Kate Scaife Diaz, will supplement the efforts of the project M&E manager and provide advisory support on
M&E best practice. She is based out of TechnoServe’s Washington, D.C. office.
● The Program Director¸ Julio Centeno, will analyze the data from the progress reports in coordination
with the M&E Manager in order to make decisions for project implementation. He will ensure that exter-
nal partners (e.g. financial institutions) are aware of and able to comply with data reporting requirements.
He will oversee the preparation and submission of semi-annual reports to USAID and internal Tech-
noServe reporting systems. Finally, Julio will be responsible for promoting a culture of learning and reflec-
tion based on the evidence produced by the M&E team. He is based out of the Nicaragua project office.
Program Director
Training Coordinator Value Chain Supervisors
Community Trainers in NI
Community Trainers in ES
M&E Manager
M&E Assistant
Regional M&E Manager
14
6.3 Procedure for data collection and analysis Data will be captured, analyzed, and reported periodically, with output-level indicators reported internally on a
monthly basis and outcome and goal-level indicators reported on an annual basis. The data collection period and
strategy for each indicator is defined in the PIRS. TechnoServe will employ Taroworks, a mobile data-capture tool,
to capture and transmit field data. Data will be stored in a SalesForce database platform with backup to the cloud.
Results will be disaggregated by country for reporting purposes, and data analysis will compare results across use-
ful disaggregated categories to determine any emerging tendencies regarding program impact on varying target
populations and groups. All reports will contain qualitative information and, where useful, be presented in semi-
annual program reports.
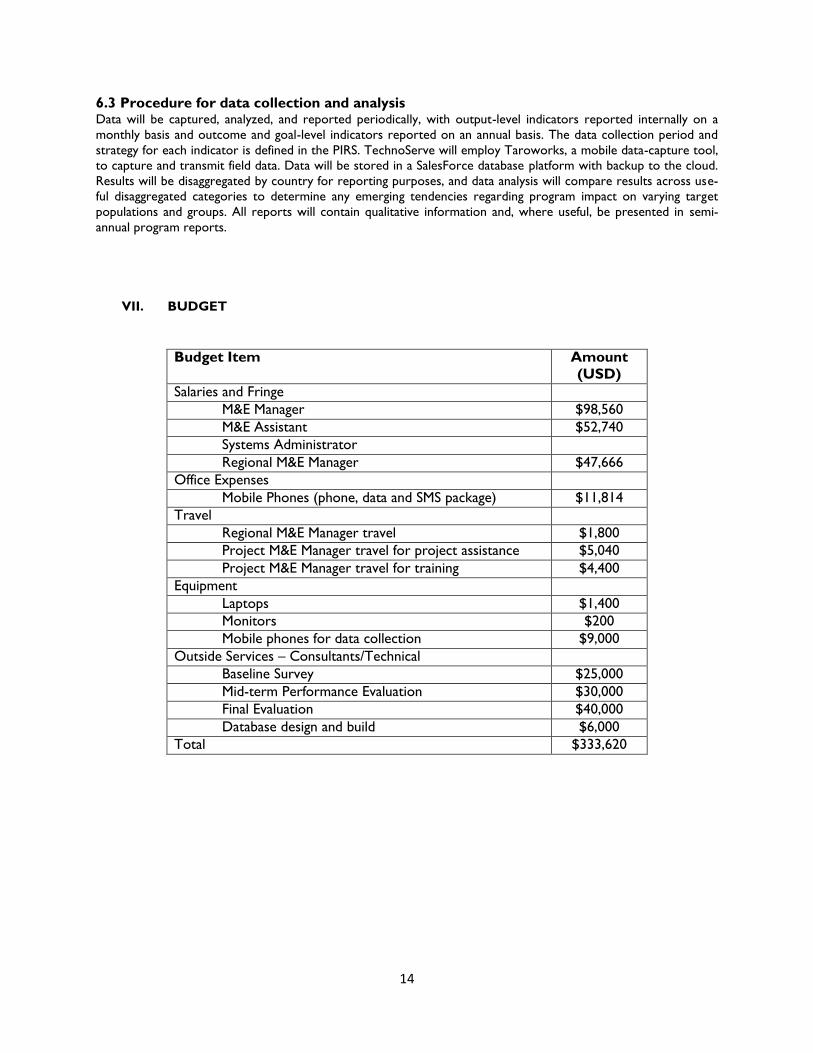
VII. BUDGET
Budget Item Amount
(USD)
Salaries and Fringe
M&E Manager $98,560
M&E Assistant $52,740
Systems Administrator
Regional M&E Manager $47,666
Office Expenses
Mobile Phones (phone, data and SMS package) $11,814
Travel
Regional M&E Manager travel $1,800
Project M&E Manager travel for project assistance $5,040
Project M&E Manager travel for training $4,400
Equipment
Laptops $1,400
Monitors $200
Mobile phones for data collection $9,000
Outside Services – Consultants/Technical
Baseline Survey $25,000
Mid-term Performance Evaluation $30,000
Final Evaluation $40,000
Database design and build $6,000
Total $333,620
15
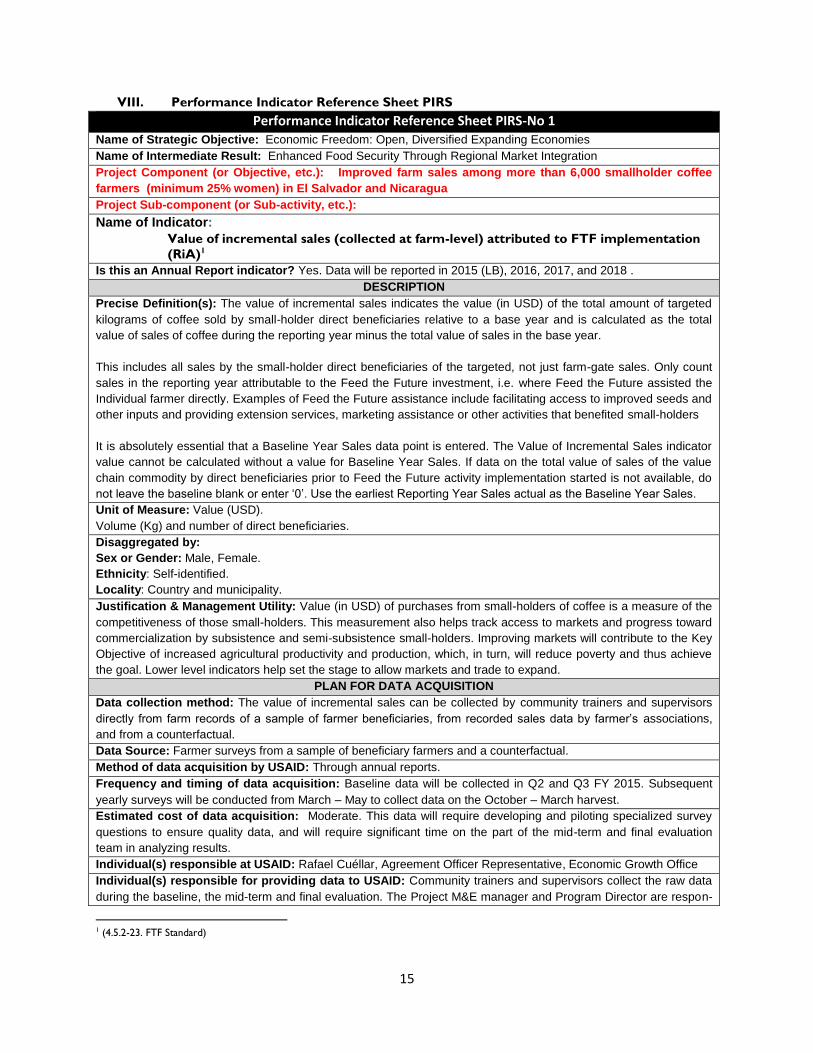
VIII. Performance Indicator Reference Sheet PIRS
Performance Indicator Reference Sheet PIRS-No 1 Name of Strategic Objective: Economic Freedom: Open, Diversified Expanding Economies
Name of Intermediate Result: Enhanced Food Security Through Regional Market Integration
Project Component (or Objective, etc.): Improved farm sales among more than 6,000 smallholder coffee
farmers (minimum 25% women) in El Salvador and Nicaragua
Project Sub-component (or Sub-activity, etc.):
Name of Indicator:
Value of incremental sales (collected at farm-level) attributed to FTF implementation
(RiA)1
Is this an Annual Report indicator? Yes. Data will be reported in 2015 (LB), 2016, 2017, and 2018 .
DESCRIPTION
Precise Definition(s): The value of incremental sales indicates the value (in USD) of the total amount of targeted
kilograms of coffee sold by small-holder direct beneficiaries relative to a base year and is calculated as the total
value of sales of coffee during the reporting year minus the total value of sales in the base year.
This includes all sales by the small-holder direct beneficiaries of the targeted, not just farm-gate sales. Only count
sales in the reporting year attributable to the Feed the Future investment, i.e. where Feed the Future assisted the
Individual farmer directly. Examples of Feed the Future assistance include facilitating access to improved seeds and
other inputs and providing extension services, marketing assistance or other activities that benefited small-holders
It is absolutely essential that a Baseline Year Sales data point is entered. The Value of Incremental Sales indicator
value cannot be calculated without a value for Baseline Year Sales. If data on the total value of sales of the value
chain commodity by direct beneficiaries prior to Feed the Future activity implementation started is not available, do
not leave the baseline blank or enter ‘0’. Use the earliest Reporting Year Sales actual as the Baseline Year Sales.
Unit of Measure: Value (USD).
Volume (Kg) and number of direct beneficiaries.
Disaggregated by:
Sex or Gender: Male, Female.
Ethnicity: Self-identified.
Locality: Country and municipality.
Justification & Management Utility: Value (in USD) of purchases from small-holders of coffee is a measure of the
competitiveness of those small-holders. This measurement also helps track access to markets and progress toward
commercialization by subsistence and semi-subsistence small-holders. Improving markets will contribute to the Key
Objective of increased agricultural productivity and production, which, in turn, will reduce poverty and thus achieve
the goal. Lower level indicators help set the stage to allow markets and trade to expand.
PLAN FOR DATA ACQUISITION
Data collection method: The value of incremental sales can be collected by community trainers and supervisors
directly from farm records of a sample of farmer beneficiaries, from recorded sales data by farmer’s associations,
and from a counterfactual.
Data Source: Farmer surveys from a sample of beneficiary farmers and a counterfactual.
Method of data acquisition by USAID: Through annual reports.
Frequency and timing of data acquisition: Baseline data will be collected in Q2 and Q3 FY 2015. Subsequent
yearly surveys will be conducted from March – May to collect data on the October – March harvest.
Estimated cost of data acquisition: Moderate. This data will require developing and piloting specialized survey
questions to ensure quality data, and will require significant time on the part of the mid-term and final evaluation
team in analyzing results.
Individual(s) responsible at USAID: Rafael Cuéllar, Agreement Officer Representative, Economic Growth Office
Individual(s) responsible for providing data to USAID: Community trainers and supervisors collect the raw data
during the baseline, the mid-term and final evaluation. The Project M&E manager and Program Director are respon-
1 (4.5.2-23. FTF Standard)
16
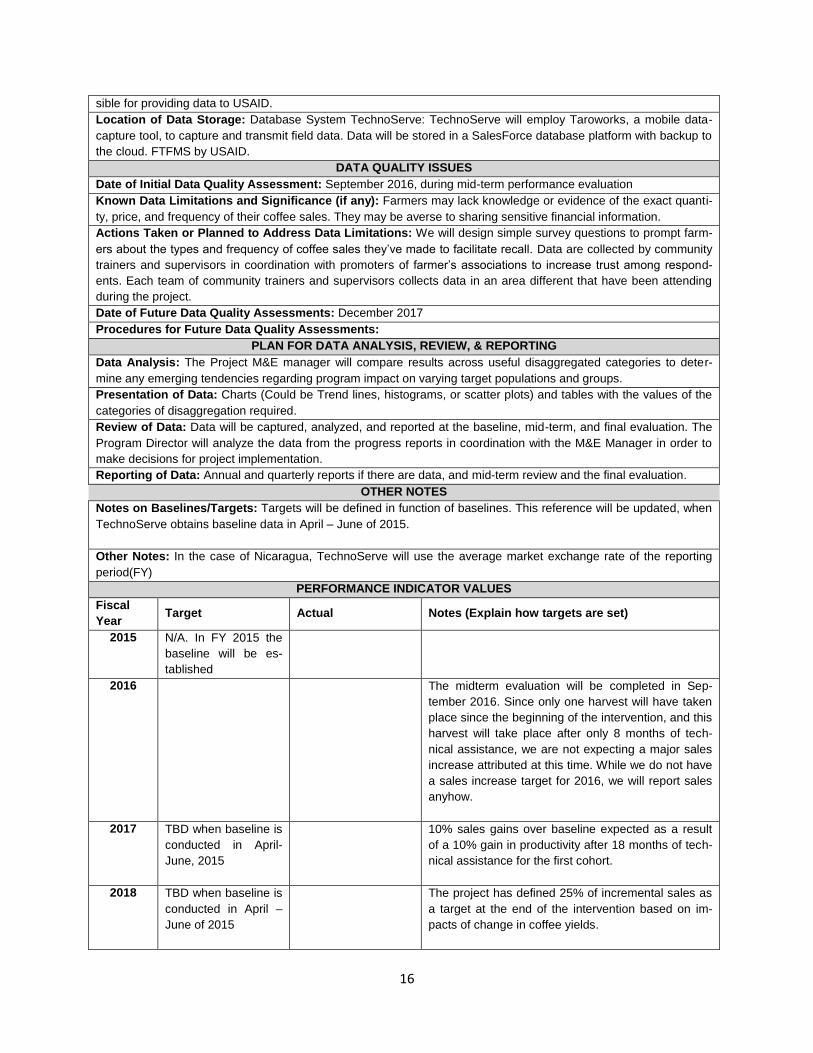
sible for providing data to USAID.
Location of Data Storage: Database System TechnoServe: TechnoServe will employ Taroworks, a mobile data-
capture tool, to capture and transmit field data. Data will be stored in a SalesForce database platform with backup to
the cloud. FTFMS by USAID.
DATA QUALITY ISSUES
Date of Initial Data Quality Assessment: September 2016, during mid-term performance evaluation
Known Data Limitations and Significance (if any): Farmers may lack knowledge or evidence of the exact quanti-
ty, price, and frequency of their coffee sales. They may be averse to sharing sensitive financial information.
Actions Taken or Planned to Address Data Limitations: We will design simple survey questions to prompt farm-
ers about the types and frequency of coffee sales they’ve made to facilitate recall. Data are collected by community
trainers and supervisors in coordination with promoters of farmer’s associations to increase trust among respond-
ents. Each team of community trainers and supervisors collects data in an area different that have been attending
during the project.
Date of Future Data Quality Assessments: December 2017
Procedures for Future Data Quality Assessments:
PLAN FOR DATA ANALYSIS, REVIEW, & REPORTING
Data Analysis: The Project M&E manager will compare results across useful disaggregated categories to deter-
mine any emerging tendencies regarding program impact on varying target populations and groups.
Presentation of Data: Charts (Could be Trend lines, histograms, or scatter plots) and tables with the values of the
categories of disaggregation required.
Review of Data: Data will be captured, analyzed, and reported at the baseline, mid-term, and final evaluation. The
Program Director will analyze the data from the progress reports in coordination with the M&E Manager in order to
make decisions for project implementation.
Reporting of Data: Annual and quarterly reports if there are data, and mid-term review and the final evaluation.
OTHER NOTES
Notes on Baselines/Targets: Targets will be defined in function of baselines. This reference will be updated, when
TechnoServe obtains baseline data in April – June of 2015.
Other Notes: In the case of Nicaragua, TechnoServe will use the average market exchange rate of the reporting
period(FY)
PERFORMANCE INDICATOR VALUES
Fiscal
Year Target Actual Notes (Explain how targets are set)
2015 N/A. In FY 2015 the
baseline will be es-
tablished
2016 The midterm evaluation will be completed in Sep-
tember 2016. Since only one harvest will have taken
place since the beginning of the intervention, and this
harvest will take place after only 8 months of tech-
nical assistance, we are not expecting a major sales
increase attributed at this time. While we do not have
a sales increase target for 2016, we will report sales
anyhow.
2017 TBD when baseline is
conducted in April-
June, 2015
10% sales gains over baseline expected as a result
of a 10% gain in productivity after 18 months of tech-
nical assistance for the first cohort.
2018 TBD when baseline is
conducted in April –
June of 2015
The project has defined 25% of incremental sales as
a target at the end of the intervention based on im-
pacts of change in coffee yields.
17
THIS SHEET LAST UPDATED ON: October 20, 2014
Performance Indicator Reference Sheet PIRS-No 2 Name of Strategic Objective: Economic Freedom: Open, Diversified Expanding Economies
Name of Intermediate Result: Enhanced Food Security Through Regional Market Integration
Project Component (or Objective, etc.): Improved farm sales among more than 6,000 smallholder coffee
farmers (minimum 25% women) in El Salvador and Nicaragua
Project Sub-component (or Sub-activity, etc.):
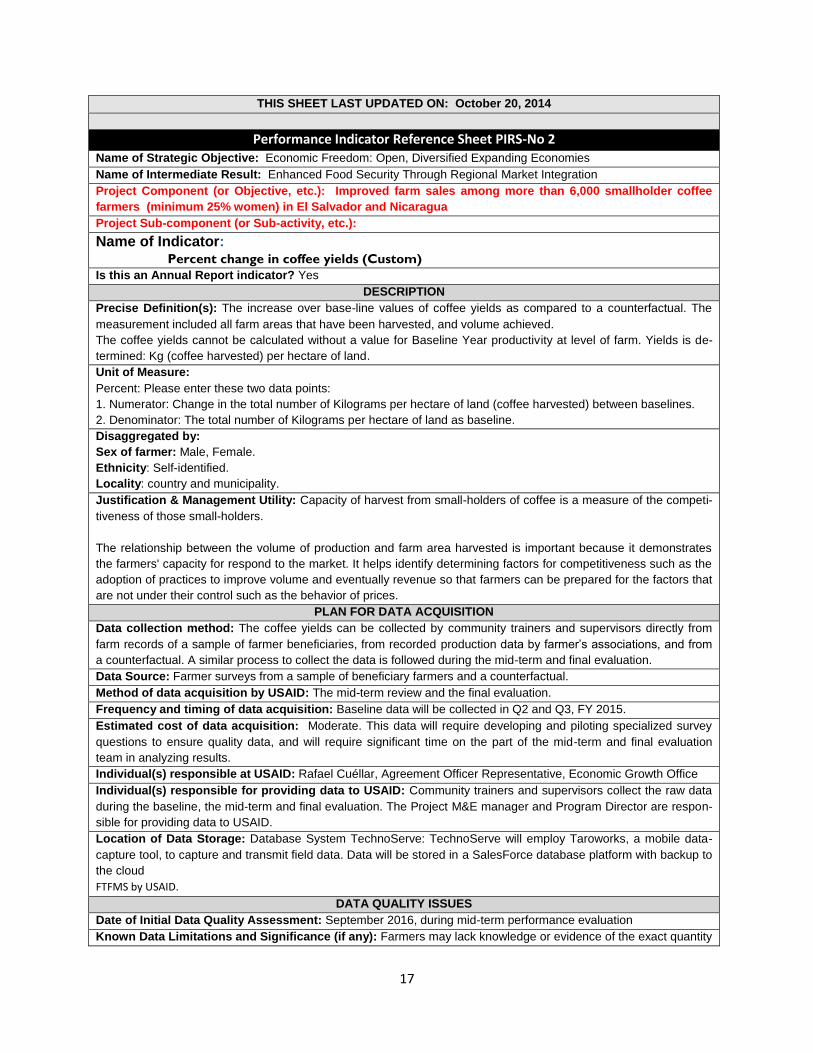
Name of Indicator: Percent change in coffee yields (Custom)
Is this an Annual Report indicator? Yes
DESCRIPTION
Precise Definition(s): The increase over base-line values of coffee yields as compared to a counterfactual. The
measurement included all farm areas that have been harvested, and volume achieved.
The coffee yields cannot be calculated without a value for Baseline Year productivity at level of farm. Yields is de-
termined: Kg (coffee harvested) per hectare of land.
Unit of Measure:
Percent: Please enter these two data points:
1. Numerator: Change in the total number of Kilograms per hectare of land (coffee harvested) between baselines.
2. Denominator: The total number of Kilograms per hectare of land as baseline.
Disaggregated by:
Sex of farmer: Male, Female.
Ethnicity: Self-identified.
Locality: country and municipality.
Justification & Management Utility: Capacity of harvest from small-holders of coffee is a measure of the competi-
tiveness of those small-holders.
The relationship between the volume of production and farm area harvested is important because it demonstrates
the farmers' capacity for respond to the market. It helps identify determining factors for competitiveness such as the
adoption of practices to improve volume and eventually revenue so that farmers can be prepared for the factors that
are not under their control such as the behavior of prices.
PLAN FOR DATA ACQUISITION
Data collection method: The coffee yields can be collected by community trainers and supervisors directly from
farm records of a sample of farmer beneficiaries, from recorded production data by farmer’s associations, and from
a counterfactual. A similar process to collect the data is followed during the mid-term and final evaluation.
Data Source: Farmer surveys from a sample of beneficiary farmers and a counterfactual.
Method of data acquisition by USAID: The mid-term review and the final evaluation.
Frequency and timing of data acquisition: Baseline data will be collected in Q2 and Q3, FY 2015.
Estimated cost of data acquisition: Moderate. This data will require developing and piloting specialized survey
questions to ensure quality data, and will require significant time on the part of the mid-term and final evaluation
team in analyzing results.
Individual(s) responsible at USAID: Rafael Cuéllar, Agreement Officer Representative, Economic Growth Office
Individual(s) responsible for providing data to USAID: Community trainers and supervisors collect the raw data
during the baseline, the mid-term and final evaluation. The Project M&E manager and Program Director are respon-
sible for providing data to USAID.
Location of Data Storage: Database System TechnoServe: TechnoServe will employ Taroworks, a mobile data-
capture tool, to capture and transmit field data. Data will be stored in a SalesForce database platform with backup to
the cloud
FTFMS by USAID.
DATA QUALITY ISSUES
Date of Initial Data Quality Assessment: September 2016, during mid-term performance evaluation
Known Data Limitations and Significance (if any): Farmers may lack knowledge or evidence of the exact quantity
18
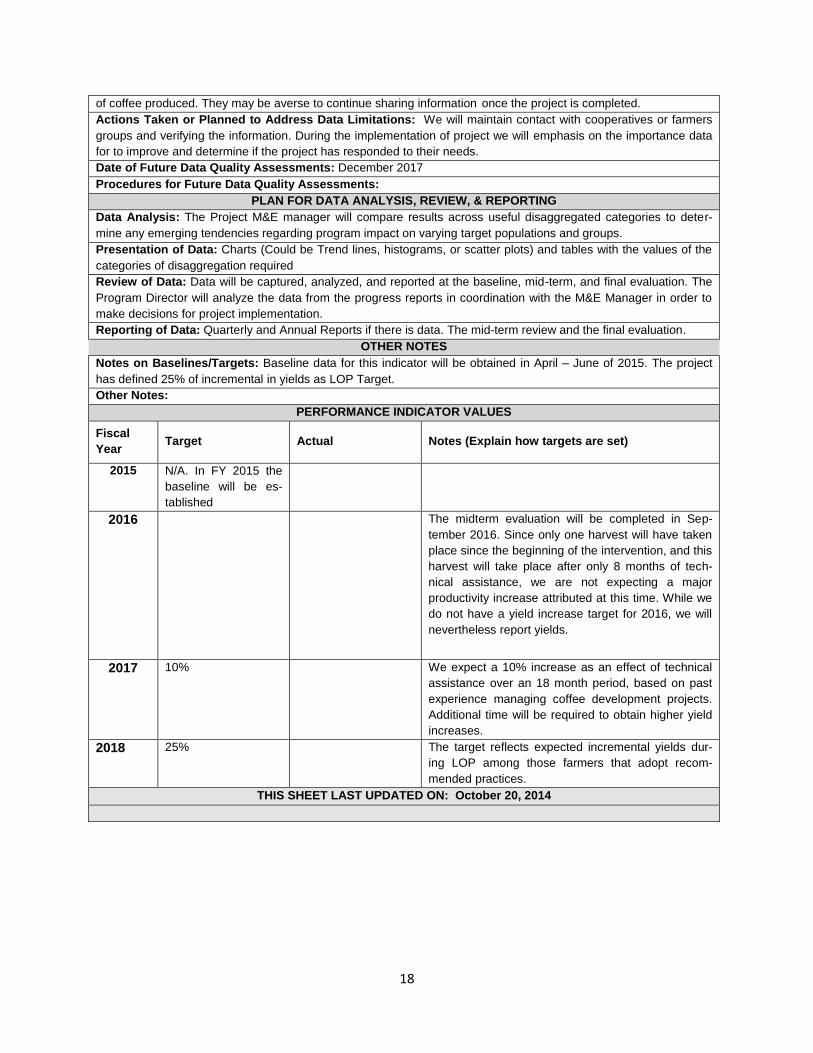
of coffee produced. They may be averse to continue sharing information once the project is completed.
Actions Taken or Planned to Address Data Limitations: We will maintain contact with cooperatives or farmers
groups and verifying the information. During the implementation of project we will emphasis on the importance data
for to improve and determine if the project has responded to their needs.
Date of Future Data Quality Assessments: December 2017
Procedures for Future Data Quality Assessments:
PLAN FOR DATA ANALYSIS, REVIEW, & REPORTING
Data Analysis: The Project M&E manager will compare results across useful disaggregated categories to deter-
mine any emerging tendencies regarding program impact on varying target populations and groups.
Presentation of Data: Charts (Could be Trend lines, histograms, or scatter plots) and tables with the values of the
categories of disaggregation required
Review of Data: Data will be captured, analyzed, and reported at the baseline, mid-term, and final evaluation. The
Program Director will analyze the data from the progress reports in coordination with the M&E Manager in order to
make decisions for project implementation.
Reporting of Data: Quarterly and Annual Reports if there is data. The mid-term review and the final evaluation.
OTHER NOTES
Notes on Baselines/Targets: Baseline data for this indicator will be obtained in April – June of 2015. The project
has defined 25% of incremental in yields as LOP Target.
Other Notes:
PERFORMANCE INDICATOR VALUES
Fiscal
Year Target Actual Notes (Explain how targets are set)
2015 N/A. In FY 2015 the
baseline will be es-
tablished
2016 The midterm evaluation will be completed in Sep-
tember 2016. Since only one harvest will have taken
place since the beginning of the intervention, and this
harvest will take place after only 8 months of tech-
nical assistance, we are not expecting a major
productivity increase attributed at this time. While we
do not have a yield increase target for 2016, we will
nevertheless report yields.
2017 10% We expect a 10% increase as an effect of technical
assistance over an 18 month period, based on past
experience managing coffee development projects.
Additional time will be required to obtain higher yield
increases.
2018 25% The target reflects expected incremental yields dur-
ing LOP among those farmers that adopt recom-
mended practices. THIS SHEET LAST UPDATED ON: October 20, 2014
19
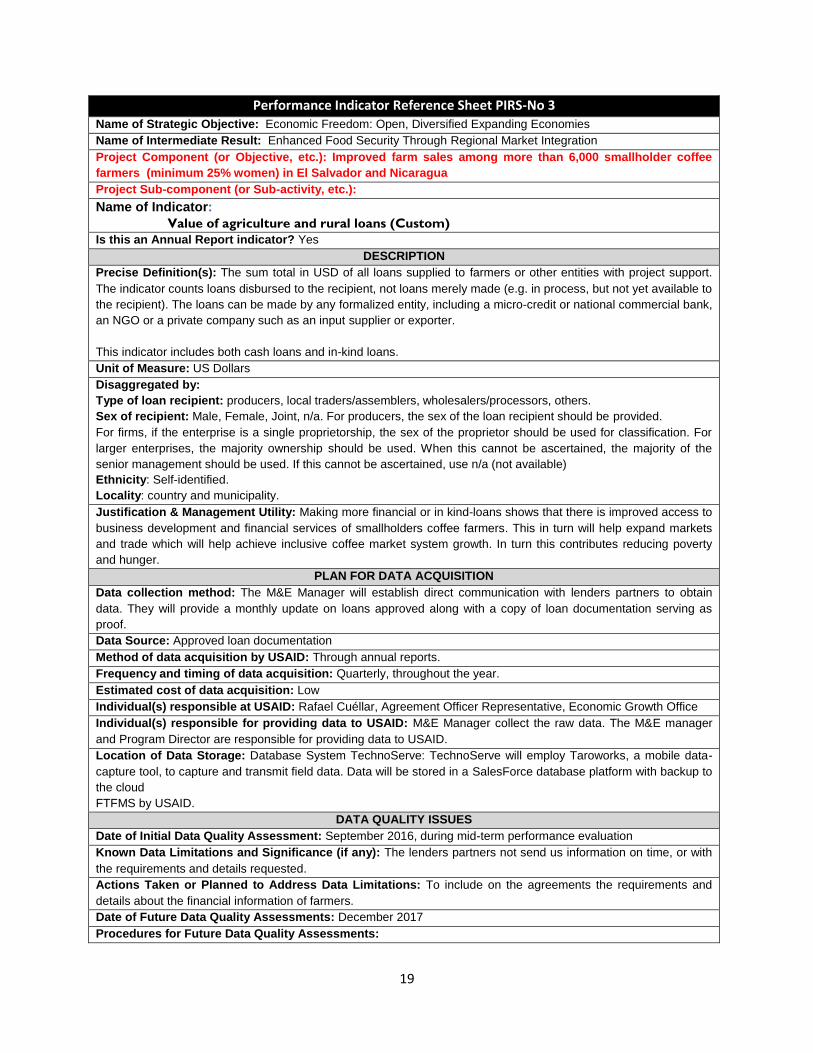
Performance Indicator Reference Sheet PIRS-No 3 Name of Strategic Objective: Economic Freedom: Open, Diversified Expanding Economies
Name of Intermediate Result: Enhanced Food Security Through Regional Market Integration
Project Component (or Objective, etc.): Improved farm sales among more than 6,000 smallholder coffee
farmers (minimum 25% women) in El Salvador and Nicaragua
Project Sub-component (or Sub-activity, etc.):
Name of Indicator:
Value of agriculture and rural loans (Custom)
Is this an Annual Report indicator? Yes
DESCRIPTION
Precise Definition(s): The sum total in USD of all loans supplied to farmers or other entities with project support. The indicator counts loans disbursed to the recipient, not loans merely made (e.g. in process, but not yet available to
the recipient). The loans can be made by any formalized entity, including a micro-credit or national commercial bank,
an NGO or a private company such as an input supplier or exporter.
This indicator includes both cash loans and in-kind loans.
Unit of Measure: US Dollars
Disaggregated by:
Type of loan recipient: producers, local traders/assemblers, wholesalers/processors, others.
Sex of recipient: Male, Female, Joint, n/a. For producers, the sex of the loan recipient should be provided.
For firms, if the enterprise is a single proprietorship, the sex of the proprietor should be used for classification. For
larger enterprises, the majority ownership should be used. When this cannot be ascertained, the majority of the
senior management should be used. If this cannot be ascertained, use n/a (not available)
Ethnicity: Self-identified.
Locality: country and municipality.
Justification & Management Utility: Making more financial or in kind-loans shows that there is improved access to
business development and financial services of smallholders coffee farmers. This in turn will help expand markets
and trade which will help achieve inclusive coffee market system growth. In turn this contributes reducing poverty
and hunger.
PLAN FOR DATA ACQUISITION
Data collection method: The M&E Manager will establish direct communication with lenders partners to obtain
data. They will provide a monthly update on loans approved along with a copy of loan documentation serving as
proof.
Data Source: Approved loan documentation
Method of data acquisition by USAID: Through annual reports.
Frequency and timing of data acquisition: Quarterly, throughout the year.
Estimated cost of data acquisition: Low
Individual(s) responsible at USAID: Rafael Cuéllar, Agreement Officer Representative, Economic Growth Office
Individual(s) responsible for providing data to USAID: M&E Manager collect the raw data. The M&E manager
and Program Director are responsible for providing data to USAID.
Location of Data Storage: Database System TechnoServe: TechnoServe will employ Taroworks, a mobile data-
capture tool, to capture and transmit field data. Data will be stored in a SalesForce database platform with backup to
the cloud
FTFMS by USAID.
DATA QUALITY ISSUES
Date of Initial Data Quality Assessment: September 2016, during mid-term performance evaluation
Known Data Limitations and Significance (if any): The lenders partners not send us information on time, or with
the requirements and details requested.
Actions Taken or Planned to Address Data Limitations: To include on the agreements the requirements and
details about the financial information of farmers.
Date of Future Data Quality Assessments: December 2017
Procedures for Future Data Quality Assessments:
20
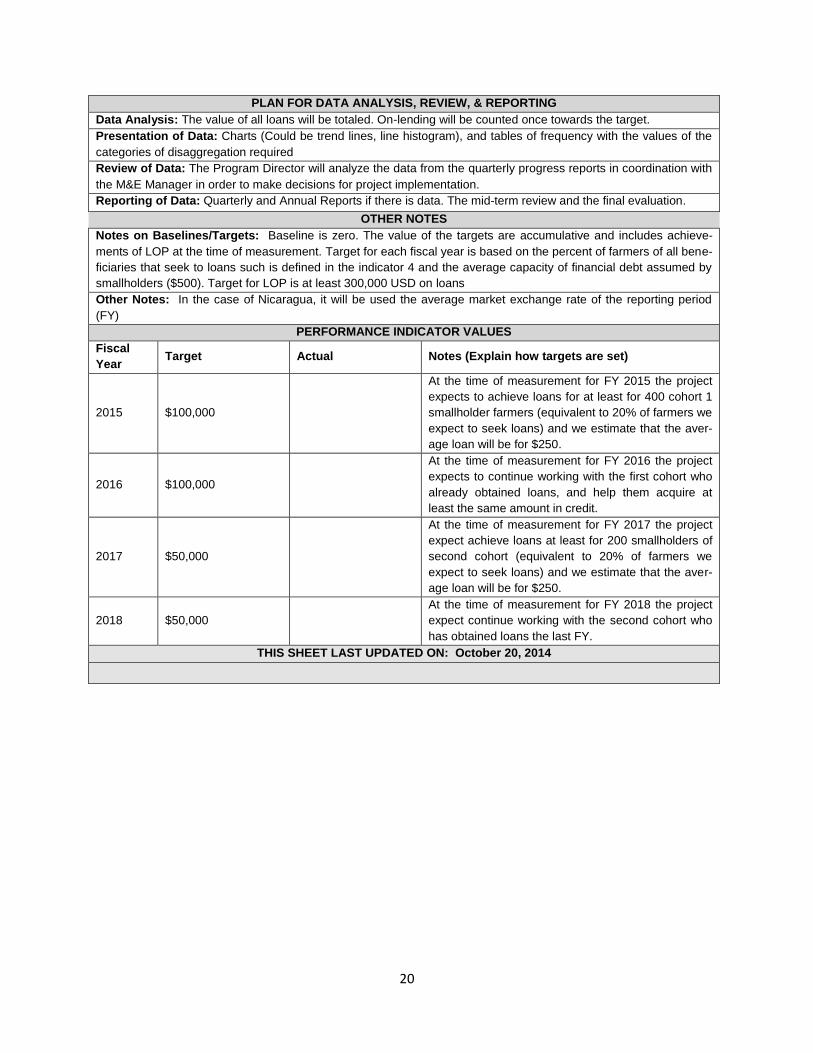
PLAN FOR DATA ANALYSIS, REVIEW, & REPORTING
Data Analysis: The value of all loans will be totaled. On-lending will be counted once towards the target.
Presentation of Data: Charts (Could be trend lines, line histogram), and tables of frequency with the values of the
categories of disaggregation required
Review of Data: The Program Director will analyze the data from the quarterly progress reports in coordination with
the M&E Manager in order to make decisions for project implementation.
Reporting of Data: Quarterly and Annual Reports if there is data. The mid-term review and the final evaluation.
OTHER NOTES
Notes on Baselines/Targets: Baseline is zero. The value of the targets are accumulative and includes achieve-
ments of LOP at the time of measurement. Target for each fiscal year is based on the percent of farmers of all bene-
ficiaries that seek to loans such is defined in the indicator 4 and the average capacity of financial debt assumed by
smallholders ($500). Target for LOP is at least 300,000 USD on loans
Other Notes: In the case of Nicaragua, it will be used the average market exchange rate of the reporting period
(FY)
PERFORMANCE INDICATOR VALUES
Fiscal
Year Target Actual Notes (Explain how targets are set)
2015 $100,000
At the time of measurement for FY 2015 the project
expects to achieve loans for at least for 400 cohort 1
smallholder farmers (equivalent to 20% of farmers we
expect to seek loans) and we estimate that the aver-
age loan will be for $250.
2016 $100,000
At the time of measurement for FY 2016 the project
expects to continue working with the first cohort who
already obtained loans, and help them acquire at
least the same amount in credit.
2017 $50,000
At the time of measurement for FY 2017 the project
expect achieve loans at least for 200 smallholders of
second cohort (equivalent to 20% of farmers we
expect to seek loans) and we estimate that the aver-
age loan will be for $250.
2018 $50,000 At the time of measurement for FY 2018 the project
expect continue working with the second cohort who
has obtained loans the last FY. THIS SHEET LAST UPDATED ON: October 20, 2014
21
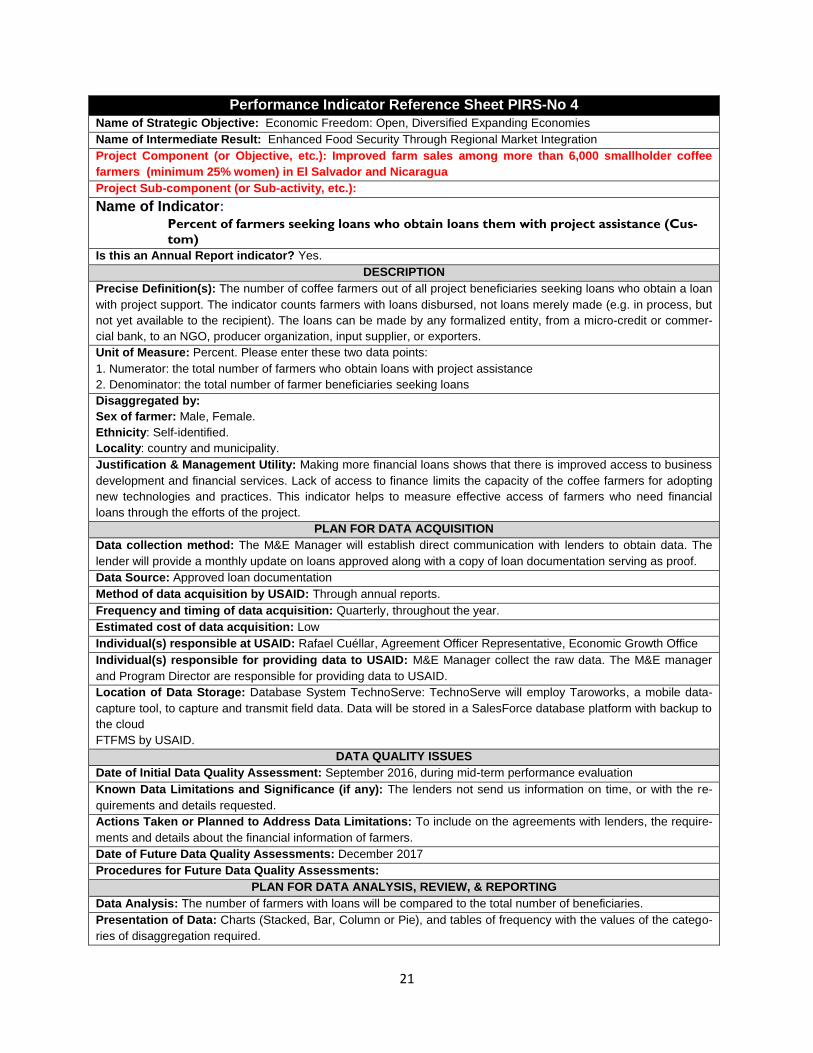
Performance Indicator Reference Sheet PIRS-No 4
Name of Strategic Objective: Economic Freedom: Open, Diversified Expanding Economies
Name of Intermediate Result: Enhanced Food Security Through Regional Market Integration
Project Component (or Objective, etc.): Improved farm sales among more than 6,000 smallholder coffee
farmers (minimum 25% women) in El Salvador and Nicaragua
Project Sub-component (or Sub-activity, etc.):
Name of Indicator: Percent of farmers seeking loans who obtain loans them with project assistance (Cus-
tom)
Is this an Annual Report indicator? Yes.
DESCRIPTION
Precise Definition(s): The number of coffee farmers out of all project beneficiaries seeking loans who obtain a loan
with project support. The indicator counts farmers with loans disbursed, not loans merely made (e.g. in process, but
not yet available to the recipient). The loans can be made by any formalized entity, from a micro-credit or commer-
cial bank, to an NGO, producer organization, input supplier, or exporters.
Unit of Measure: Percent. Please enter these two data points:
1. Numerator: the total number of farmers who obtain loans with project assistance
2. Denominator: the total number of farmer beneficiaries seeking loans
Disaggregated by:
Sex of farmer: Male, Female.
Ethnicity: Self-identified.
Locality: country and municipality.
Justification & Management Utility: Making more financial loans shows that there is improved access to business
development and financial services. Lack of access to finance limits the capacity of the coffee farmers for adopting
new technologies and practices. This indicator helps to measure effective access of farmers who need financial
loans through the efforts of the project.
PLAN FOR DATA ACQUISITION
Data collection method: The M&E Manager will establish direct communication with lenders to obtain data. The
lender will provide a monthly update on loans approved along with a copy of loan documentation serving as proof.
Data Source: Approved loan documentation
Method of data acquisition by USAID: Through annual reports.
Frequency and timing of data acquisition: Quarterly, throughout the year.
Estimated cost of data acquisition: Low
Individual(s) responsible at USAID: Rafael Cuéllar, Agreement Officer Representative, Economic Growth Office
Individual(s) responsible for providing data to USAID: M&E Manager collect the raw data. The M&E manager
and Program Director are responsible for providing data to USAID.
Location of Data Storage: Database System TechnoServe: TechnoServe will employ Taroworks, a mobile data-
capture tool, to capture and transmit field data. Data will be stored in a SalesForce database platform with backup to
the cloud
FTFMS by USAID.
DATA QUALITY ISSUES
Date of Initial Data Quality Assessment: September 2016, during mid-term performance evaluation
Known Data Limitations and Significance (if any): The lenders not send us information on time, or with the re-
quirements and details requested.
Actions Taken or Planned to Address Data Limitations: To include on the agreements with lenders, the require-
ments and details about the financial information of farmers.
Date of Future Data Quality Assessments: December 2017
Procedures for Future Data Quality Assessments:
PLAN FOR DATA ANALYSIS, REVIEW, & REPORTING
Data Analysis: The number of farmers with loans will be compared to the total number of beneficiaries.
Presentation of Data: Charts (Stacked, Bar, Column or Pie), and tables of frequency with the values of the catego-
ries of disaggregation required.
22
Review of Data: The Program Director will analyze the data from the quarterly progress reports in coordination with
the M&E Manager in order to make decisions for project implementation.
Reporting of Data: Quarterly and Annual Reports if there are data. The mid-term review and the final evaluation
OTHER NOTES
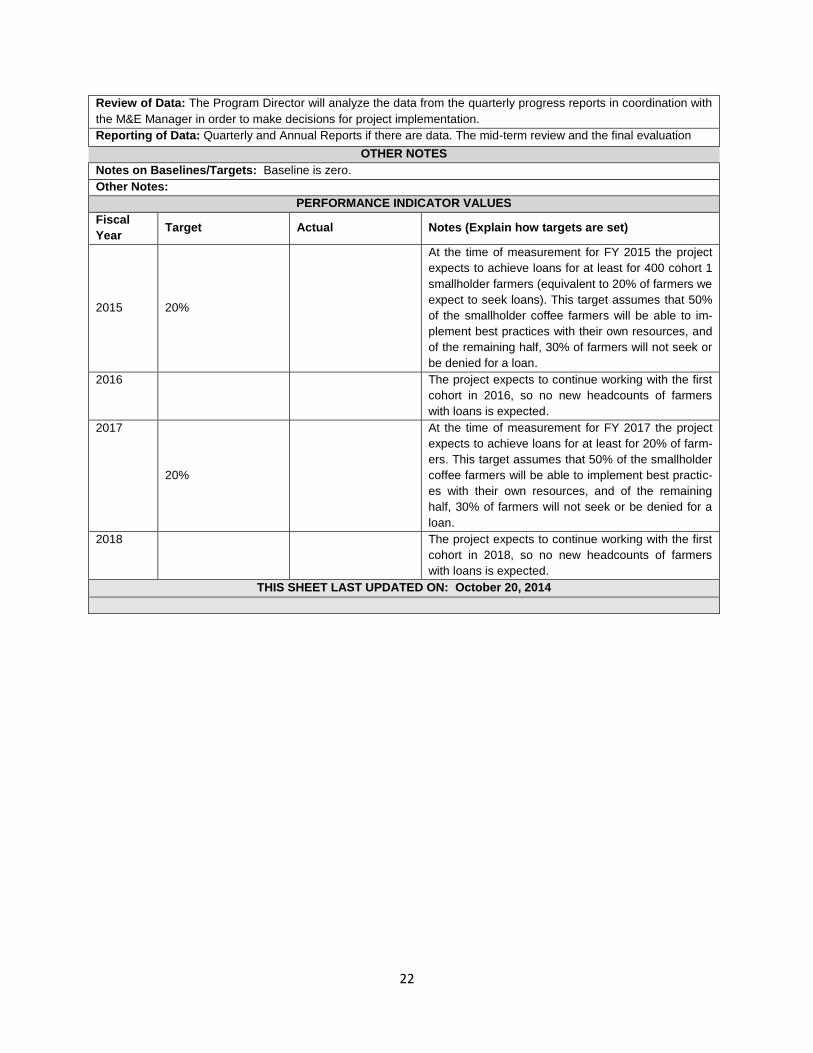
Notes on Baselines/Targets: Baseline is zero.
Other Notes:
PERFORMANCE INDICATOR VALUES
Fiscal
Year Target Actual Notes (Explain how targets are set)
2015 20%
At the time of measurement for FY 2015 the project
expects to achieve loans for at least for 400 cohort 1
smallholder farmers (equivalent to 20% of farmers we
expect to seek loans). This target assumes that 50%
of the smallholder coffee farmers will be able to im-
plement best practices with their own resources, and
of the remaining half, 30% of farmers will not seek or
be denied for a loan. 2016
The project expects to continue working with the first
cohort in 2016, so no new headcounts of farmers
with loans is expected. 2017
20%
At the time of measurement for FY 2017 the project
expects to achieve loans for at least for 20% of farm-
ers. This target assumes that 50% of the smallholder
coffee farmers will be able to implement best practic-
es with their own resources, and of the remaining
half, 30% of farmers will not seek or be denied for a
loan. 2018
The project expects to continue working with the first
cohort in 2018, so no new headcounts of farmers
with loans is expected. THIS SHEET LAST UPDATED ON: October 20, 2014
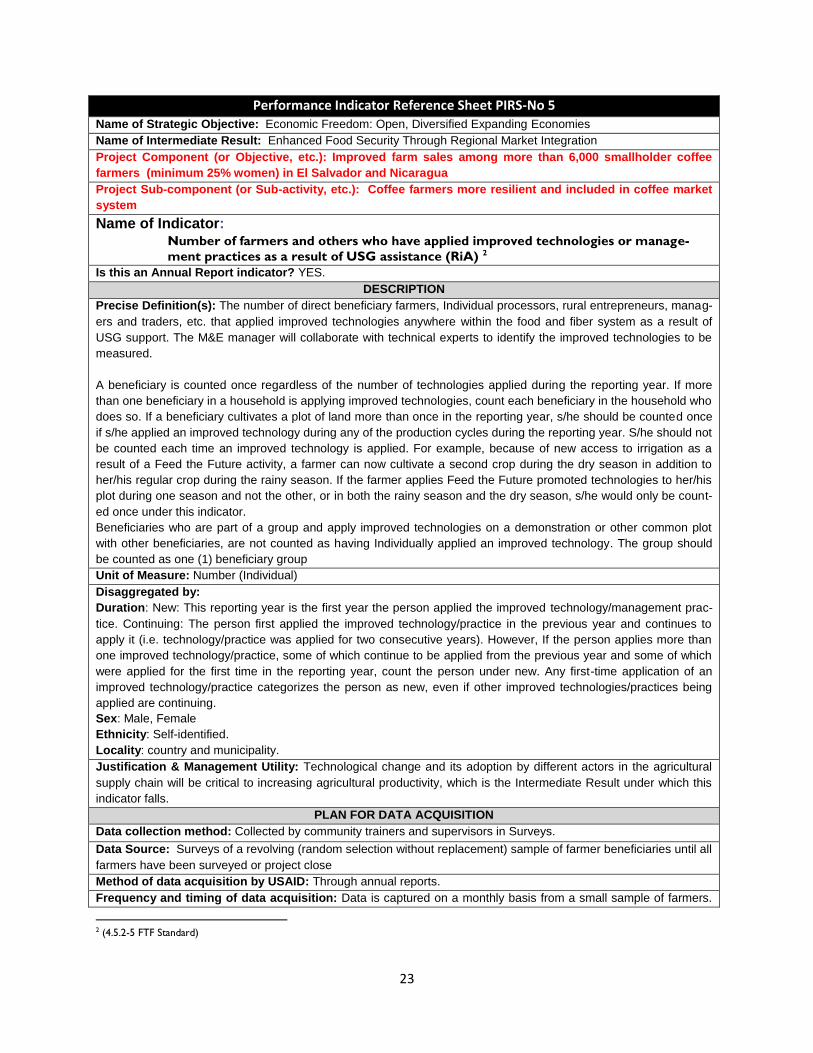
23
Performance Indicator Reference Sheet PIRS-No 5 Name of Strategic Objective: Economic Freedom: Open, Diversified Expanding Economies
Name of Intermediate Result: Enhanced Food Security Through Regional Market Integration
Project Component (or Objective, etc.): Improved farm sales among more than 6,000 smallholder coffee
farmers (minimum 25% women) in El Salvador and Nicaragua
Project Sub-component (or Sub-activity, etc.): Coffee farmers more resilient and included in coffee market
system
Name of Indicator: Number of farmers and others who have applied improved technologies or manage-
ment practices as a result of USG assistance (RiA) 2
Is this an Annual Report indicator? YES.
DESCRIPTION
Precise Definition(s): The number of direct beneficiary farmers, Individual processors, rural entrepreneurs, manag-
ers and traders, etc. that applied improved technologies anywhere within the food and fiber system as a result of
USG support. The M&E manager will collaborate with technical experts to identify the improved technologies to be
measured.
A beneficiary is counted once regardless of the number of technologies applied during the reporting year. If more
than one beneficiary in a household is applying improved technologies, count each beneficiary in the household who
does so. If a beneficiary cultivates a plot of land more than once in the reporting year, s/he should be counted once
if s/he applied an improved technology during any of the production cycles during the reporting year. S/he should not
be counted each time an improved technology is applied. For example, because of new access to irrigation as a
result of a Feed the Future activity, a farmer can now cultivate a second crop during the dry season in addition to
her/his regular crop during the rainy season. If the farmer applies Feed the Future promoted technologies to her/his
plot during one season and not the other, or in both the rainy season and the dry season, s/he would only be count-
ed once under this indicator.
Beneficiaries who are part of a group and apply improved technologies on a demonstration or other common plot
with other beneficiaries, are not counted as having Individually applied an improved technology. The group should
be counted as one (1) beneficiary group
Unit of Measure: Number (Individual)
Disaggregated by:
Duration: New: This reporting year is the first year the person applied the improved technology/management prac-
tice. Continuing: The person first applied the improved technology/practice in the previous year and continues to
apply it (i.e. technology/practice was applied for two consecutive years). However, If the person applies more than
one improved technology/practice, some of which continue to be applied from the previous year and some of which
were applied for the first time in the reporting year, count the person under new. Any first-time application of an
improved technology/practice categorizes the person as new, even if other improved technologies/practices being
applied are continuing.
Sex: Male, Female
Ethnicity: Self-identified.
Locality: country and municipality.
Justification & Management Utility: Technological change and its adoption by different actors in the agricultural
supply chain will be critical to increasing agricultural productivity, which is the Intermediate Result under which this
indicator falls.
PLAN FOR DATA ACQUISITION
Data collection method: Collected by community trainers and supervisors in Surveys.
Data Source: Surveys of a revolving (random selection without replacement) sample of farmer beneficiaries until all
farmers have been surveyed or project close
Method of data acquisition by USAID: Through annual reports.
Frequency and timing of data acquisition: Data is captured on a monthly basis from a small sample of farmers.
2 (4.5.2-5 FTF Standard)
24
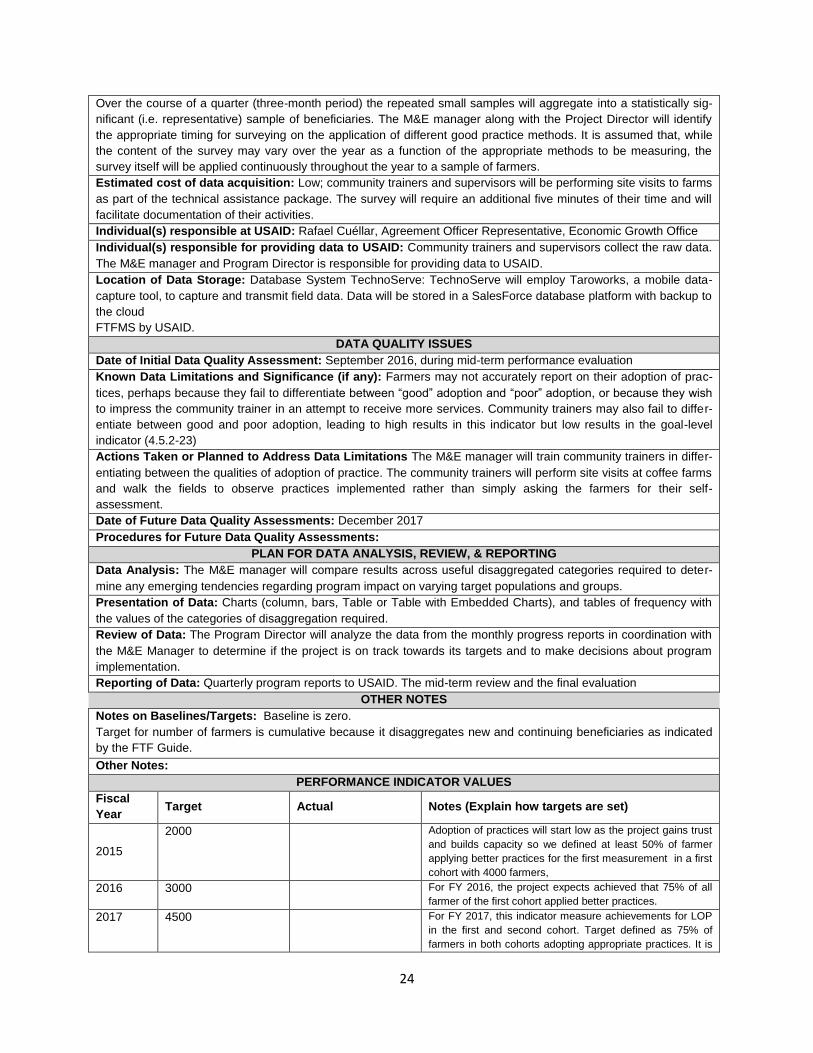
Over the course of a quarter (three-month period) the repeated small samples will aggregate into a statistically sig-
nificant (i.e. representative) sample of beneficiaries. The M&E manager along with the Project Director will identify
the appropriate timing for surveying on the application of different good practice methods. It is assumed that, while
the content of the survey may vary over the year as a function of the appropriate methods to be measuring, the
survey itself will be applied continuously throughout the year to a sample of farmers.
Estimated cost of data acquisition: Low; community trainers and supervisors will be performing site visits to farms
as part of the technical assistance package. The survey will require an additional five minutes of their time and will
facilitate documentation of their activities.
Individual(s) responsible at USAID: Rafael Cuéllar, Agreement Officer Representative, Economic Growth Office
Individual(s) responsible for providing data to USAID: Community trainers and supervisors collect the raw data.
The M&E manager and Program Director is responsible for providing data to USAID.
Location of Data Storage: Database System TechnoServe: TechnoServe will employ Taroworks, a mobile data-
capture tool, to capture and transmit field data. Data will be stored in a SalesForce database platform with backup to
the cloud
FTFMS by USAID.
DATA QUALITY ISSUES
Date of Initial Data Quality Assessment: September 2016, during mid-term performance evaluation
Known Data Limitations and Significance (if any): Farmers may not accurately report on their adoption of prac-
tices, perhaps because they fail to differentiate between “good” adoption and “poor” adoption, or because they wish
to impress the community trainer in an attempt to receive more services. Community trainers may also fail to differ-
entiate between good and poor adoption, leading to high results in this indicator but low results in the goal-level
indicator (4.5.2-23)
Actions Taken or Planned to Address Data Limitations The M&E manager will train community trainers in differ-
entiating between the qualities of adoption of practice. The community trainers will perform site visits at coffee farms
and walk the fields to observe practices implemented rather than simply asking the farmers for their self-
assessment.
Date of Future Data Quality Assessments: December 2017
Procedures for Future Data Quality Assessments:
PLAN FOR DATA ANALYSIS, REVIEW, & REPORTING
Data Analysis: The M&E manager will compare results across useful disaggregated categories required to deter-
mine any emerging tendencies regarding program impact on varying target populations and groups.
Presentation of Data: Charts (column, bars, Table or Table with Embedded Charts), and tables of frequency with
the values of the categories of disaggregation required.
Review of Data: The Program Director will analyze the data from the monthly progress reports in coordination with
the M&E Manager to determine if the project is on track towards its targets and to make decisions about program
implementation.
Reporting of Data: Quarterly program reports to USAID. The mid-term review and the final evaluation
OTHER NOTES
Notes on Baselines/Targets: Baseline is zero.
Target for number of farmers is cumulative because it disaggregates new and continuing beneficiaries as indicated
by the FTF Guide.
Other Notes:
PERFORMANCE INDICATOR VALUES
Fiscal
Year Target Actual Notes (Explain how targets are set)
2015
2000 Adoption of practices will start low as the project gains trust
and builds capacity so we defined at least 50% of farmer
applying better practices for the first measurement in a first
cohort with 4000 farmers,
2016 3000 For FY 2016, the project expects achieved that 75% of all
farmer of the first cohort applied better practices.
2017 4500 For FY 2017, this indicator measure achievements for LOP
in the first and second cohort. Target defined as 75% of
farmers in both cohorts adopting appropriate practices. It is
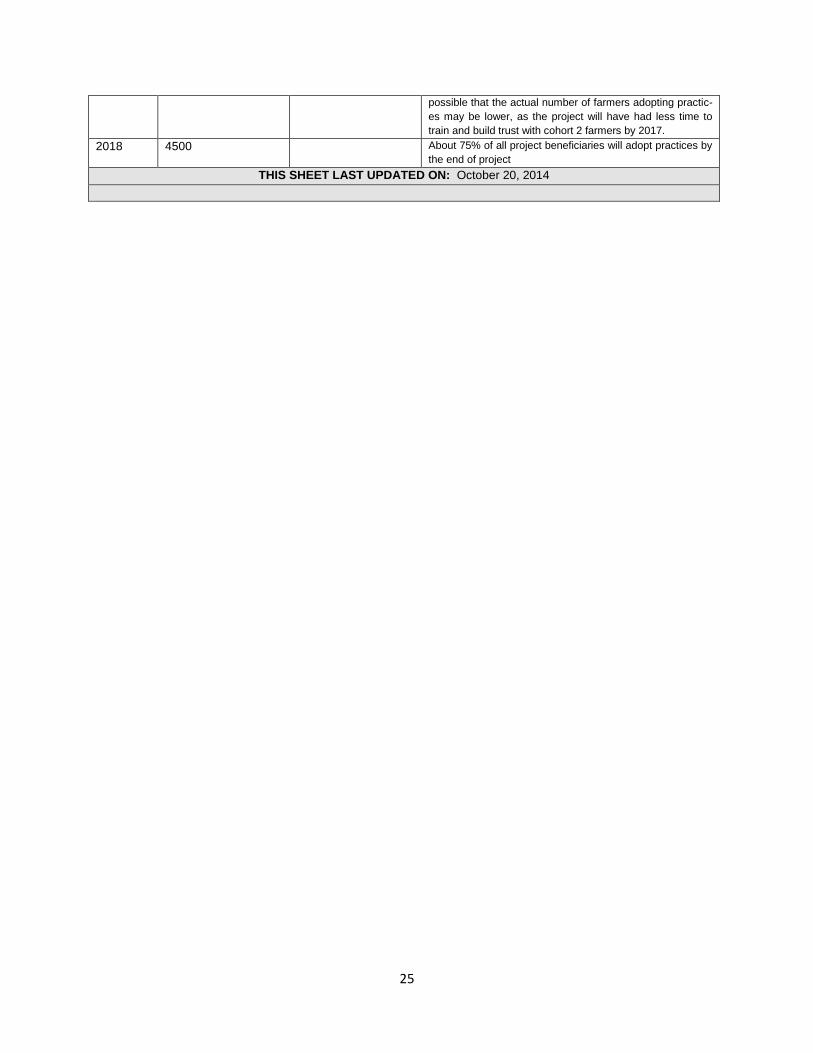
25
possible that the actual number of farmers adopting practic-
es may be lower, as the project will have had less time to
train and build trust with cohort 2 farmers by 2017.
2018 4500 About 75% of all project beneficiaries will adopt practices by
the end of project THIS SHEET LAST UPDATED ON: October 20, 2014
26
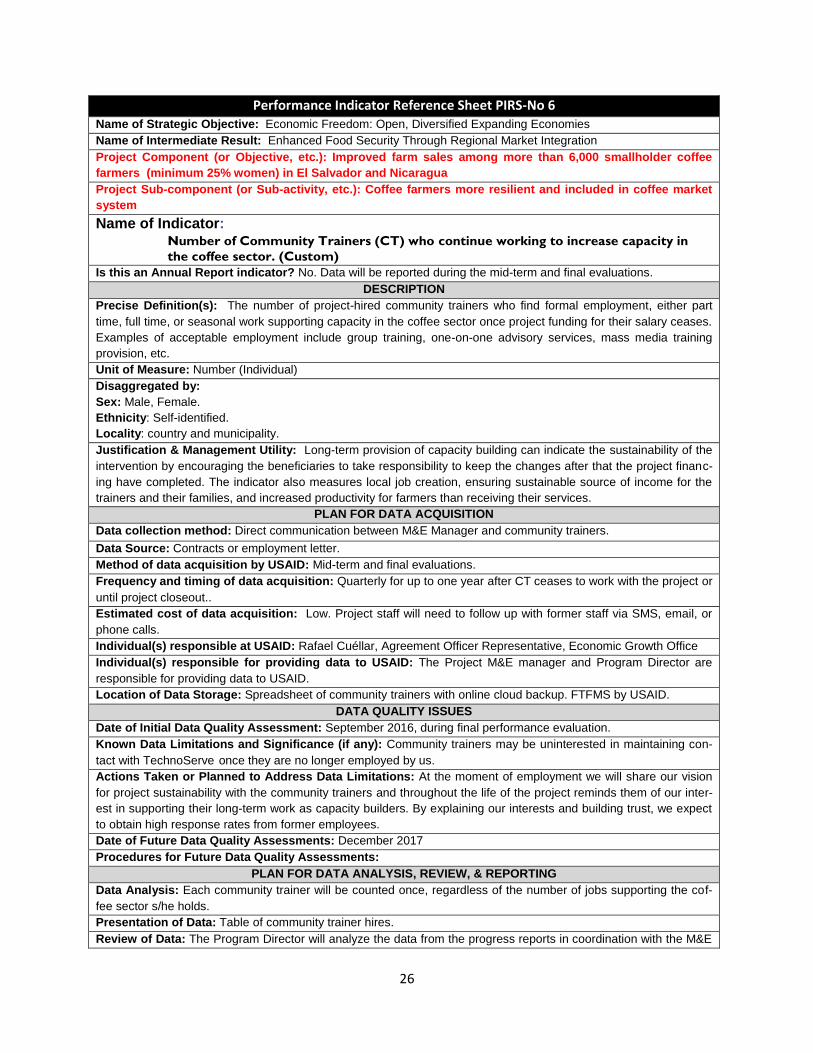
Performance Indicator Reference Sheet PIRS-No 6 Name of Strategic Objective: Economic Freedom: Open, Diversified Expanding Economies
Name of Intermediate Result: Enhanced Food Security Through Regional Market Integration
Project Component (or Objective, etc.): Improved farm sales among more than 6,000 smallholder coffee
farmers (minimum 25% women) in El Salvador and Nicaragua
Project Sub-component (or Sub-activity, etc.): Coffee farmers more resilient and included in coffee market
system
Name of Indicator: Number of Community Trainers (CT) who continue working to increase capacity in
the coffee sector. (Custom)
Is this an Annual Report indicator? No. Data will be reported during the mid-term and final evaluations.
DESCRIPTION
Precise Definition(s): The number of project-hired community trainers who find formal employment, either part
time, full time, or seasonal work supporting capacity in the coffee sector once project funding for their salary ceases.
Examples of acceptable employment include group training, one-on-one advisory services, mass media training
provision, etc.
Unit of Measure: Number (Individual)
Disaggregated by:
Sex: Male, Female.
Ethnicity: Self-identified.
Locality: country and municipality.
Justification & Management Utility: Long-term provision of capacity building can indicate the sustainability of the
intervention by encouraging the beneficiaries to take responsibility to keep the changes after that the project financ-
ing have completed. The indicator also measures local job creation, ensuring sustainable source of income for the
trainers and their families, and increased productivity for farmers than receiving their services.
PLAN FOR DATA ACQUISITION
Data collection method: Direct communication between M&E Manager and community trainers.
Data Source: Contracts or employment letter.
Method of data acquisition by USAID: Mid-term and final evaluations.
Frequency and timing of data acquisition: Quarterly for up to one year after CT ceases to work with the project or
until project closeout..
Estimated cost of data acquisition: Low. Project staff will need to follow up with former staff via SMS, email, or
phone calls.
Individual(s) responsible at USAID: Rafael Cuéllar, Agreement Officer Representative, Economic Growth Office
Individual(s) responsible for providing data to USAID: The Project M&E manager and Program Director are
responsible for providing data to USAID.
Location of Data Storage: Spreadsheet of community trainers with online cloud backup. FTFMS by USAID.
DATA QUALITY ISSUES
Date of Initial Data Quality Assessment: September 2016, during final performance evaluation.
Known Data Limitations and Significance (if any): Community trainers may be uninterested in maintaining con-
tact with TechnoServe once they are no longer employed by us.
Actions Taken or Planned to Address Data Limitations: At the moment of employment we will share our vision
for project sustainability with the community trainers and throughout the life of the project reminds them of our inter-
est in supporting their long-term work as capacity builders. By explaining our interests and building trust, we expect
to obtain high response rates from former employees.
Date of Future Data Quality Assessments: December 2017
Procedures for Future Data Quality Assessments:
PLAN FOR DATA ANALYSIS, REVIEW, & REPORTING
Data Analysis: Each community trainer will be counted once, regardless of the number of jobs supporting the cof-
fee sector s/he holds.
Presentation of Data: Table of community trainer hires.
Review of Data: The Program Director will analyze the data from the progress reports in coordination with the M&E
27
Manager in order to make decisions for project implementation.
Reporting of Data: Mid-term and final evaluation
OTHER NOTES
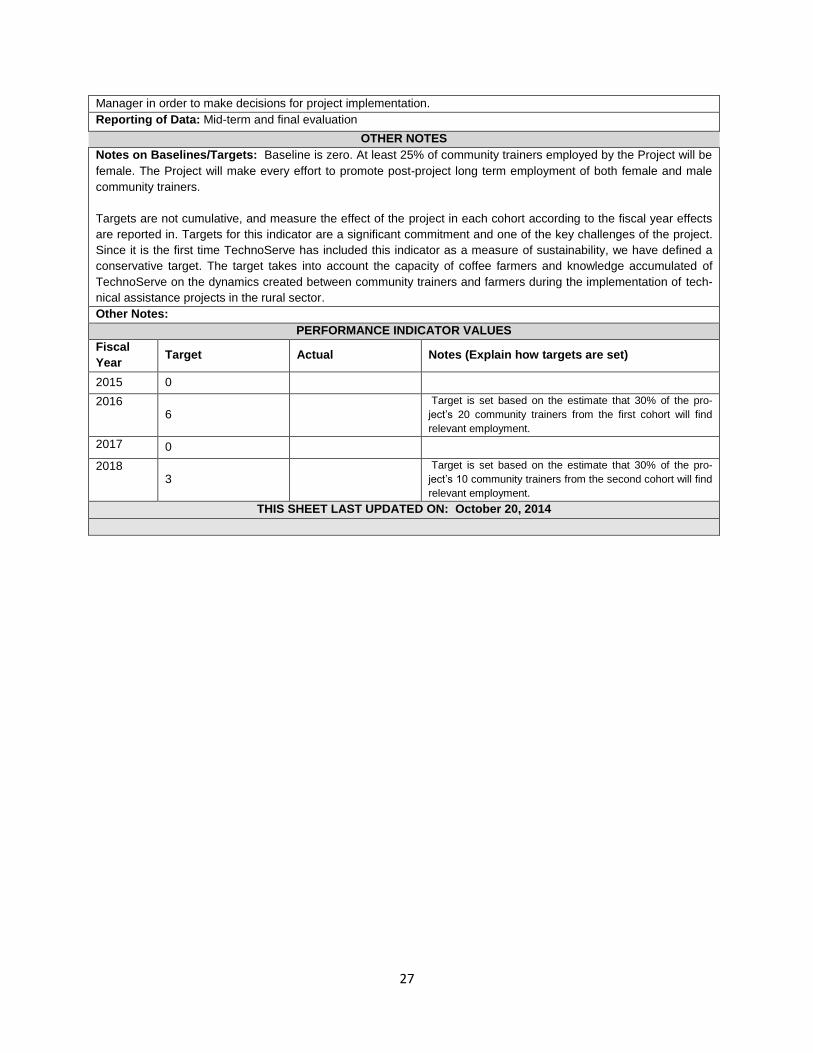
Notes on Baselines/Targets: Baseline is zero. At least 25% of community trainers employed by the Project will be
female. The Project will make every effort to promote post-project long term employment of both female and male
community trainers.
Targets are not cumulative, and measure the effect of the project in each cohort according to the fiscal year effects
are reported in. Targets for this indicator are a significant commitment and one of the key challenges of the project.
Since it is the first time TechnoServe has included this indicator as a measure of sustainability, we have defined a
conservative target. The target takes into account the capacity of coffee farmers and knowledge accumulated of
TechnoServe on the dynamics created between community trainers and farmers during the implementation of tech-
nical assistance projects in the rural sector.
Other Notes:
PERFORMANCE INDICATOR VALUES
Fiscal
Year Target Actual Notes (Explain how targets are set)
2015 0
2016 6
Target is set based on the estimate that 30% of the pro-
ject’s 20 community trainers from the first cohort will find
relevant employment.
2017 0
2018 3
Target is set based on the estimate that 30% of the pro-
ject’s 10 community trainers from the second cohort will find
relevant employment.
THIS SHEET LAST UPDATED ON: October 20, 2014
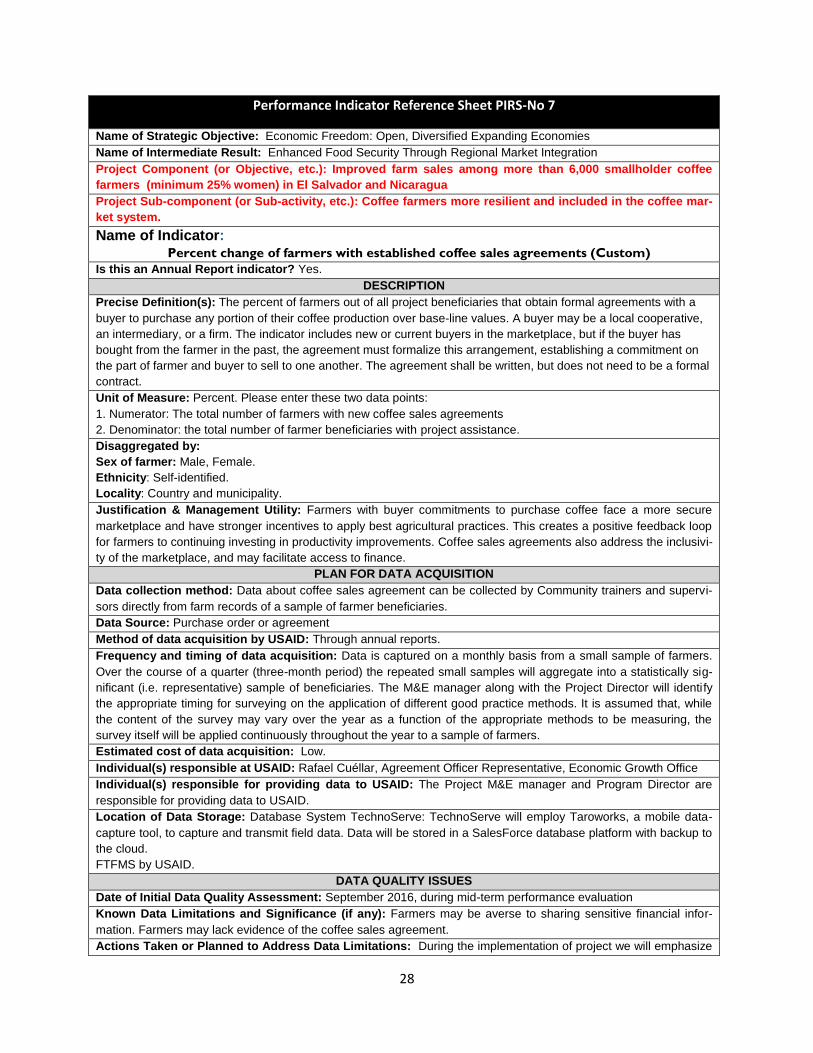
28
Performance Indicator Reference Sheet PIRS-No 7
Name of Strategic Objective: Economic Freedom: Open, Diversified Expanding Economies
Name of Intermediate Result: Enhanced Food Security Through Regional Market Integration
Project Component (or Objective, etc.): Improved farm sales among more than 6,000 smallholder coffee
farmers (minimum 25% women) in El Salvador and Nicaragua
Project Sub-component (or Sub-activity, etc.): Coffee farmers more resilient and included in the coffee mar-
ket system.
Name of Indicator: Percent change of farmers with established coffee sales agreements (Custom)
Is this an Annual Report indicator? Yes.
DESCRIPTION
Precise Definition(s): The percent of farmers out of all project beneficiaries that obtain formal agreements with a
buyer to purchase any portion of their coffee production over base-line values. A buyer may be a local cooperative,
an intermediary, or a firm. The indicator includes new or current buyers in the marketplace, but if the buyer has
bought from the farmer in the past, the agreement must formalize this arrangement, establishing a commitment on
the part of farmer and buyer to sell to one another. The agreement shall be written, but does not need to be a formal
contract.
Unit of Measure: Percent. Please enter these two data points:
1. Numerator: The total number of farmers with new coffee sales agreements
2. Denominator: the total number of farmer beneficiaries with project assistance.
Disaggregated by:
Sex of farmer: Male, Female.
Ethnicity: Self-identified.
Locality: Country and municipality.
Justification & Management Utility: Farmers with buyer commitments to purchase coffee face a more secure
marketplace and have stronger incentives to apply best agricultural practices. This creates a positive feedback loop
for farmers to continuing investing in productivity improvements. Coffee sales agreements also address the inclusivi-
ty of the marketplace, and may facilitate access to finance.
PLAN FOR DATA ACQUISITION
Data collection method: Data about coffee sales agreement can be collected by Community trainers and supervi-
sors directly from farm records of a sample of farmer beneficiaries.
Data Source: Purchase order or agreement
Method of data acquisition by USAID: Through annual reports. Frequency and timing of data acquisition: Data is captured on a monthly basis from a small sample of farmers.
Over the course of a quarter (three-month period) the repeated small samples will aggregate into a statistically sig-
nificant (i.e. representative) sample of beneficiaries. The M&E manager along with the Project Director will identify
the appropriate timing for surveying on the application of different good practice methods. It is assumed that, while
the content of the survey may vary over the year as a function of the appropriate methods to be measuring, the
survey itself will be applied continuously throughout the year to a sample of farmers.
Estimated cost of data acquisition: Low.
Individual(s) responsible at USAID: Rafael Cuéllar, Agreement Officer Representative, Economic Growth Office Individual(s) responsible for providing data to USAID: The Project M&E manager and Program Director are
responsible for providing data to USAID.
Location of Data Storage: Database System TechnoServe: TechnoServe will employ Taroworks, a mobile data-
capture tool, to capture and transmit field data. Data will be stored in a SalesForce database platform with backup to
the cloud.
FTFMS by USAID.
DATA QUALITY ISSUES
Date of Initial Data Quality Assessment: September 2016, during mid-term performance evaluation
Known Data Limitations and Significance (if any): Farmers may be averse to sharing sensitive financial infor-
mation. Farmers may lack evidence of the coffee sales agreement.
Actions Taken or Planned to Address Data Limitations: During the implementation of project we will emphasize
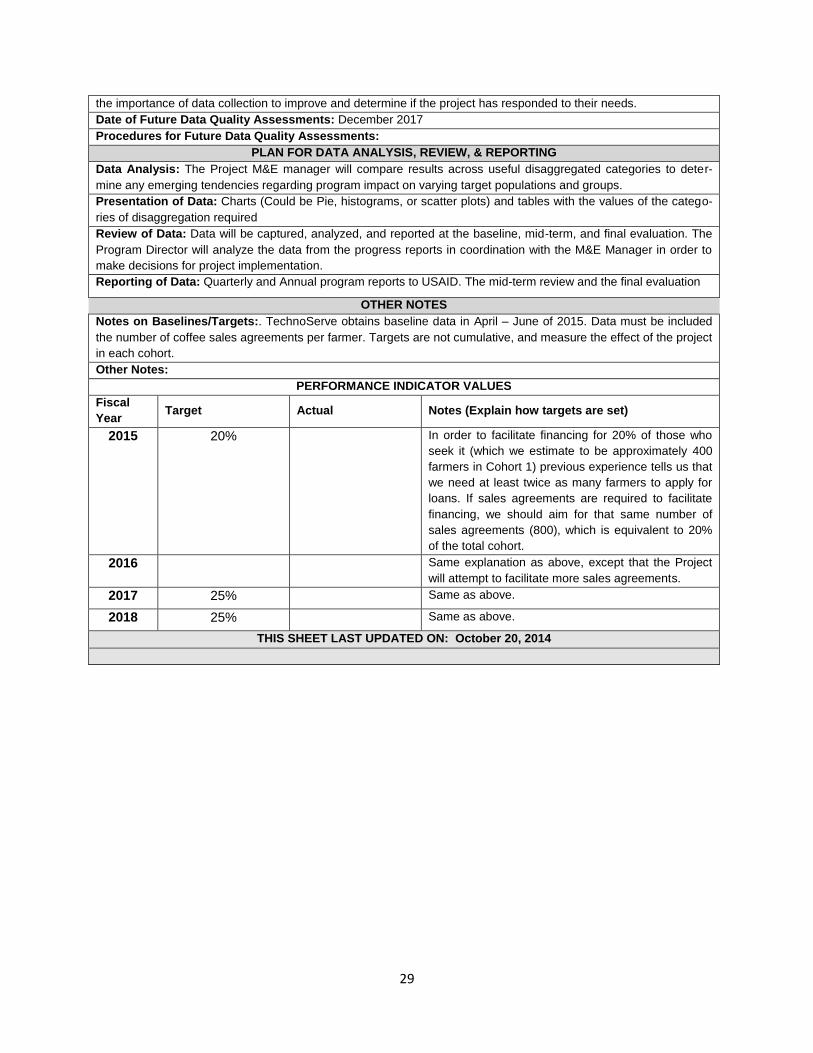
29
the importance of data collection to improve and determine if the project has responded to their needs.
Date of Future Data Quality Assessments: December 2017
Procedures for Future Data Quality Assessments:
PLAN FOR DATA ANALYSIS, REVIEW, & REPORTING
Data Analysis: The Project M&E manager will compare results across useful disaggregated categories to deter-
mine any emerging tendencies regarding program impact on varying target populations and groups.
Presentation of Data: Charts (Could be Pie, histograms, or scatter plots) and tables with the values of the catego-
ries of disaggregation required
Review of Data: Data will be captured, analyzed, and reported at the baseline, mid-term, and final evaluation. The
Program Director will analyze the data from the progress reports in coordination with the M&E Manager in order to
make decisions for project implementation.
Reporting of Data: Quarterly and Annual program reports to USAID. The mid-term review and the final evaluation
OTHER NOTES
Notes on Baselines/Targets:. TechnoServe obtains baseline data in April – June of 2015. Data must be included
the number of coffee sales agreements per farmer. Targets are not cumulative, and measure the effect of the project
in each cohort.
Other Notes:
PERFORMANCE INDICATOR VALUES
Fiscal
Year Target Actual Notes (Explain how targets are set)
2015 20% In order to facilitate financing for 20% of those who
seek it (which we estimate to be approximately 400
farmers in Cohort 1) previous experience tells us that
we need at least twice as many farmers to apply for
loans. If sales agreements are required to facilitate
financing, we should aim for that same number of
sales agreements (800), which is equivalent to 20%
of the total cohort.
2016 Same explanation as above, except that the Project
will attempt to facilitate more sales agreements.
2017 25% Same as above.
2018 25% Same as above.
THIS SHEET LAST UPDATED ON: October 20, 2014
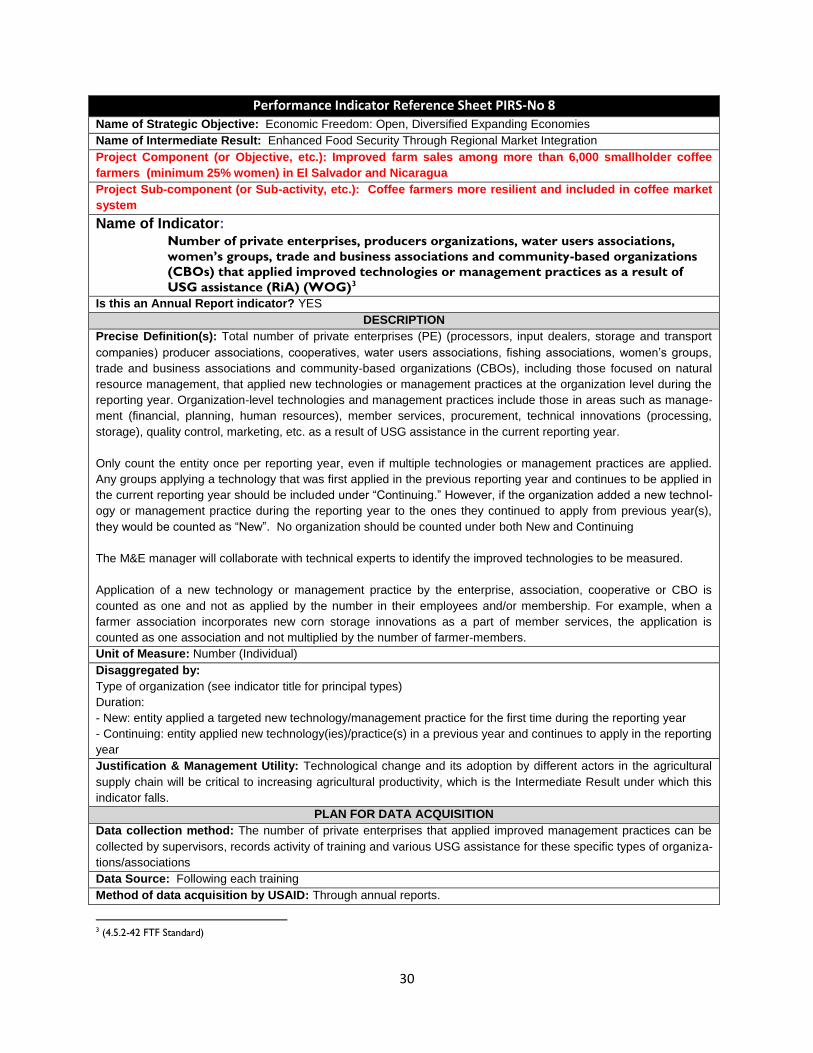
30
Performance Indicator Reference Sheet PIRS-No 8 Name of Strategic Objective: Economic Freedom: Open, Diversified Expanding Economies
Name of Intermediate Result: Enhanced Food Security Through Regional Market Integration
Project Component (or Objective, etc.): Improved farm sales among more than 6,000 smallholder coffee
farmers (minimum 25% women) in El Salvador and Nicaragua
Project Sub-component (or Sub-activity, etc.): Coffee farmers more resilient and included in coffee market
system
Name of Indicator: Number of private enterprises, producers organizations, water users associations,
women’s groups, trade and business associations and community-based organizations
(CBOs) that applied improved technologies or management practices as a result of
USG assistance (RiA) (WOG)3
Is this an Annual Report indicator? YES
DESCRIPTION
Precise Definition(s): Total number of private enterprises (PE) (processors, input dealers, storage and transport
companies) producer associations, cooperatives, water users associations, fishing associations, women’s groups,
trade and business associations and community-based organizations (CBOs), including those focused on natural
resource management, that applied new technologies or management practices at the organization level during the
reporting year. Organization-level technologies and management practices include those in areas such as manage-
ment (financial, planning, human resources), member services, procurement, technical innovations (processing,
storage), quality control, marketing, etc. as a result of USG assistance in the current reporting year.
Only count the entity once per reporting year, even if multiple technologies or management practices are applied.
Any groups applying a technology that was first applied in the previous reporting year and continues to be applied in
the current reporting year should be included under “Continuing.” However, if the organization added a new technol-
ogy or management practice during the reporting year to the ones they continued to apply from previous year(s),
they would be counted as “New”. No organization should be counted under both New and Continuing
The M&E manager will collaborate with technical experts to identify the improved technologies to be measured.
Application of a new technology or management practice by the enterprise, association, cooperative or CBO is
counted as one and not as applied by the number in their employees and/or membership. For example, when a
farmer association incorporates new corn storage innovations as a part of member services, the application is
counted as one association and not multiplied by the number of farmer-members.
Unit of Measure: Number (Individual)
Disaggregated by:
Type of organization (see indicator title for principal types)
Duration:
- New: entity applied a targeted new technology/management practice for the first time during the reporting year
- Continuing: entity applied new technology(ies)/practice(s) in a previous year and continues to apply in the reporting
year
Justification & Management Utility: Technological change and its adoption by different actors in the agricultural
supply chain will be critical to increasing agricultural productivity, which is the Intermediate Result under which this
indicator falls.
PLAN FOR DATA ACQUISITION
Data collection method: The number of private enterprises that applied improved management practices can be
collected by supervisors, records activity of training and various USG assistance for these specific types of organiza-
tions/associations
Data Source: Following each training
Method of data acquisition by USAID: Through annual reports.
3 (4.5.2-42 FTF Standard)
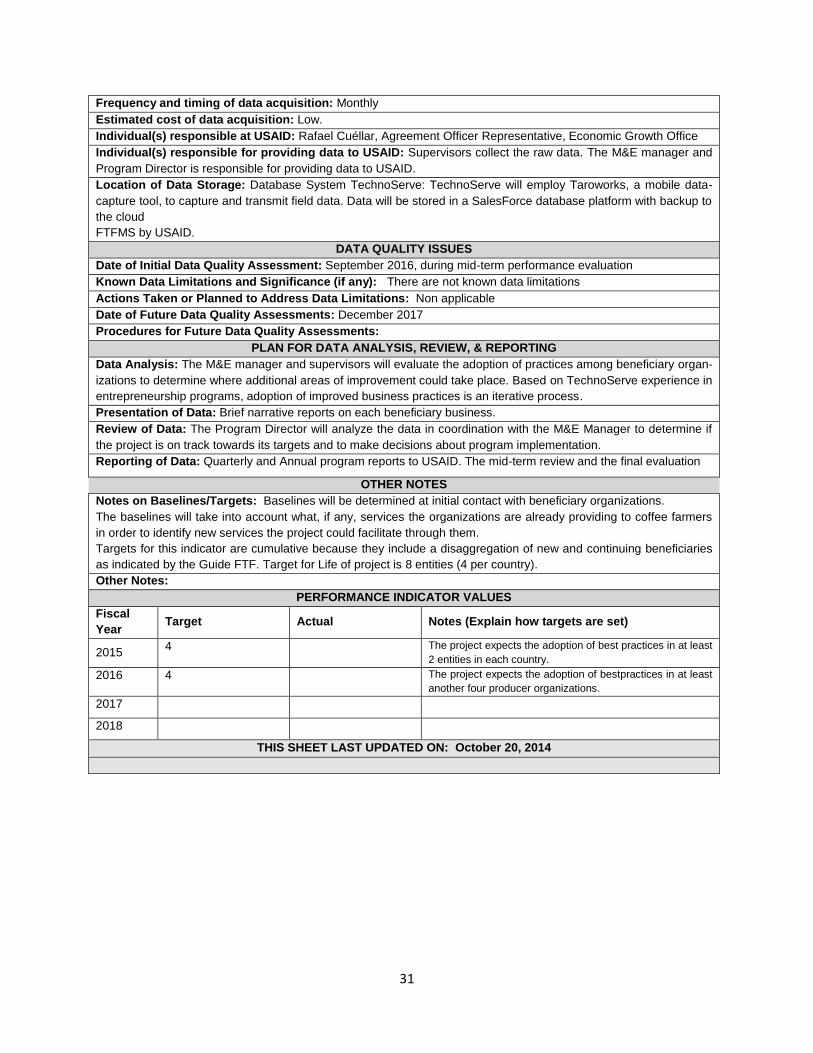
31
Frequency and timing of data acquisition: Monthly
Estimated cost of data acquisition: Low.
Individual(s) responsible at USAID: Rafael Cuéllar, Agreement Officer Representative, Economic Growth Office
Individual(s) responsible for providing data to USAID: Supervisors collect the raw data. The M&E manager and
Program Director is responsible for providing data to USAID.
Location of Data Storage: Database System TechnoServe: TechnoServe will employ Taroworks, a mobile data-
capture tool, to capture and transmit field data. Data will be stored in a SalesForce database platform with backup to
the cloud
FTFMS by USAID.
DATA QUALITY ISSUES
Date of Initial Data Quality Assessment: September 2016, during mid-term performance evaluation
Known Data Limitations and Significance (if any): There are not known data limitations
Actions Taken or Planned to Address Data Limitations: Non applicable
Date of Future Data Quality Assessments: December 2017
Procedures for Future Data Quality Assessments:
PLAN FOR DATA ANALYSIS, REVIEW, & REPORTING
Data Analysis: The M&E manager and supervisors will evaluate the adoption of practices among beneficiary organ-
izations to determine where additional areas of improvement could take place. Based on TechnoServe experience in
entrepreneurship programs, adoption of improved business practices is an iterative process.
Presentation of Data: Brief narrative reports on each beneficiary business.
Review of Data: The Program Director will analyze the data in coordination with the M&E Manager to determine if
the project is on track towards its targets and to make decisions about program implementation.
Reporting of Data: Quarterly and Annual program reports to USAID. The mid-term review and the final evaluation
OTHER NOTES
Notes on Baselines/Targets: Baselines will be determined at initial contact with beneficiary organizations.
The baselines will take into account what, if any, services the organizations are already providing to coffee farmers
in order to identify new services the project could facilitate through them.
Targets for this indicator are cumulative because they include a disaggregation of new and continuing beneficiaries
as indicated by the Guide FTF. Target for Life of project is 8 entities (4 per country).
Other Notes:
PERFORMANCE INDICATOR VALUES
Fiscal
Year Target Actual Notes (Explain how targets are set)
2015 4 The project expects the adoption of best practices in at least
2 entities in each country.
2016 4 The project expects the adoption of bestpractices in at least
another four producer organizations.
2017
2018 THIS SHEET LAST UPDATED ON: October 20, 2014
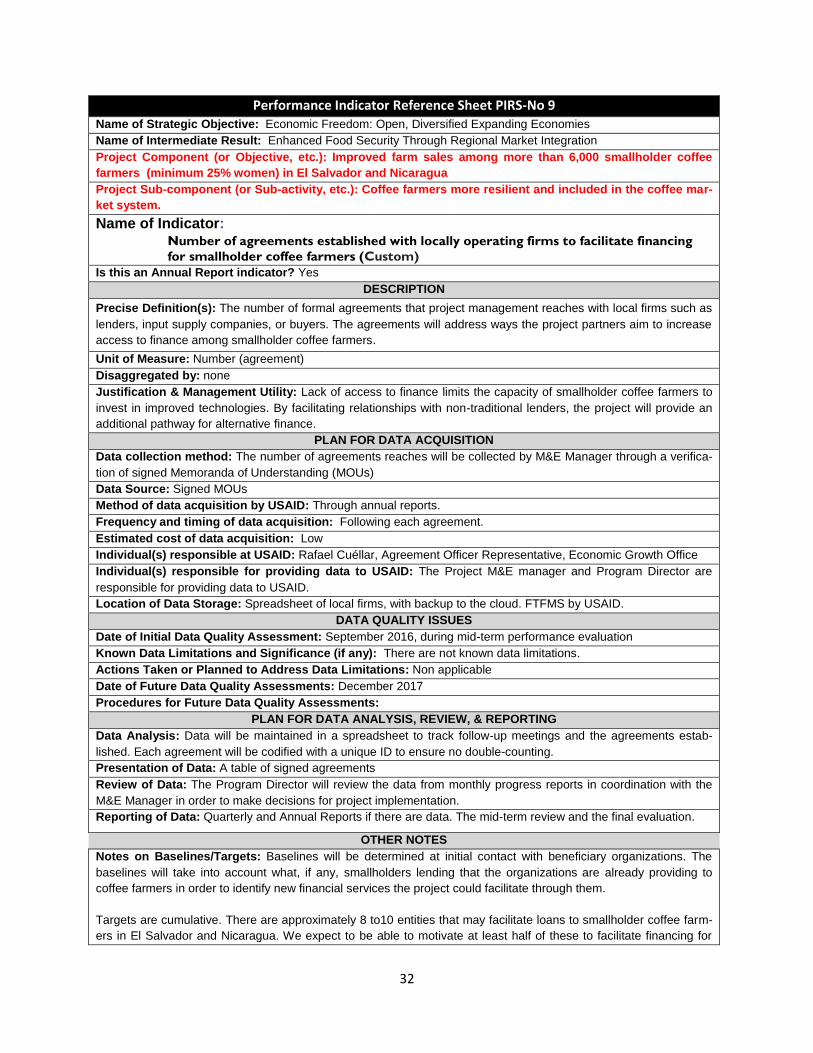
32
Performance Indicator Reference Sheet PIRS-No 9 Name of Strategic Objective: Economic Freedom: Open, Diversified Expanding Economies
Name of Intermediate Result: Enhanced Food Security Through Regional Market Integration
Project Component (or Objective, etc.): Improved farm sales among more than 6,000 smallholder coffee
farmers (minimum 25% women) in El Salvador and Nicaragua
Project Sub-component (or Sub-activity, etc.): Coffee farmers more resilient and included in the coffee mar-
ket system.
Name of Indicator: Number of agreements established with locally operating firms to facilitate financing
for smallholder coffee farmers (Custom)
Is this an Annual Report indicator? Yes
DESCRIPTION
Precise Definition(s): The number of formal agreements that project management reaches with local firms such as
lenders, input supply companies, or buyers. The agreements will address ways the project partners aim to increase
access to finance among smallholder coffee farmers.
Unit of Measure: Number (agreement)
Disaggregated by: none
Justification & Management Utility: Lack of access to finance limits the capacity of smallholder coffee farmers to
invest in improved technologies. By facilitating relationships with non-traditional lenders, the project will provide an
additional pathway for alternative finance.
PLAN FOR DATA ACQUISITION
Data collection method: The number of agreements reaches will be collected by M&E Manager through a verifica-
tion of signed Memoranda of Understanding (MOUs)
Data Source: Signed MOUs
Method of data acquisition by USAID: Through annual reports.
Frequency and timing of data acquisition: Following each agreement.
Estimated cost of data acquisition: Low
Individual(s) responsible at USAID: Rafael Cuéllar, Agreement Officer Representative, Economic Growth Office
Individual(s) responsible for providing data to USAID: The Project M&E manager and Program Director are
responsible for providing data to USAID.
Location of Data Storage: Spreadsheet of local firms, with backup to the cloud. FTFMS by USAID.
DATA QUALITY ISSUES
Date of Initial Data Quality Assessment: September 2016, during mid-term performance evaluation
Known Data Limitations and Significance (if any): There are not known data limitations.
Actions Taken or Planned to Address Data Limitations: Non applicable
Date of Future Data Quality Assessments: December 2017
Procedures for Future Data Quality Assessments:
PLAN FOR DATA ANALYSIS, REVIEW, & REPORTING
Data Analysis: Data will be maintained in a spreadsheet to track follow-up meetings and the agreements estab-
lished. Each agreement will be codified with a unique ID to ensure no double-counting.
Presentation of Data: A table of signed agreements
Review of Data: The Program Director will review the data from monthly progress reports in coordination with the
M&E Manager in order to make decisions for project implementation.
Reporting of Data: Quarterly and Annual Reports if there are data. The mid-term review and the final evaluation.
OTHER NOTES
Notes on Baselines/Targets: Baselines will be determined at initial contact with beneficiary organizations. The
baselines will take into account what, if any, smallholders lending that the organizations are already providing to
coffee farmers in order to identify new financial services the project could facilitate through them.
Targets are cumulative. There are approximately 8 to10 entities that may facilitate loans to smallholder coffee farm-
ers in El Salvador and Nicaragua. We expect to be able to motivate at least half of these to facilitate financing for
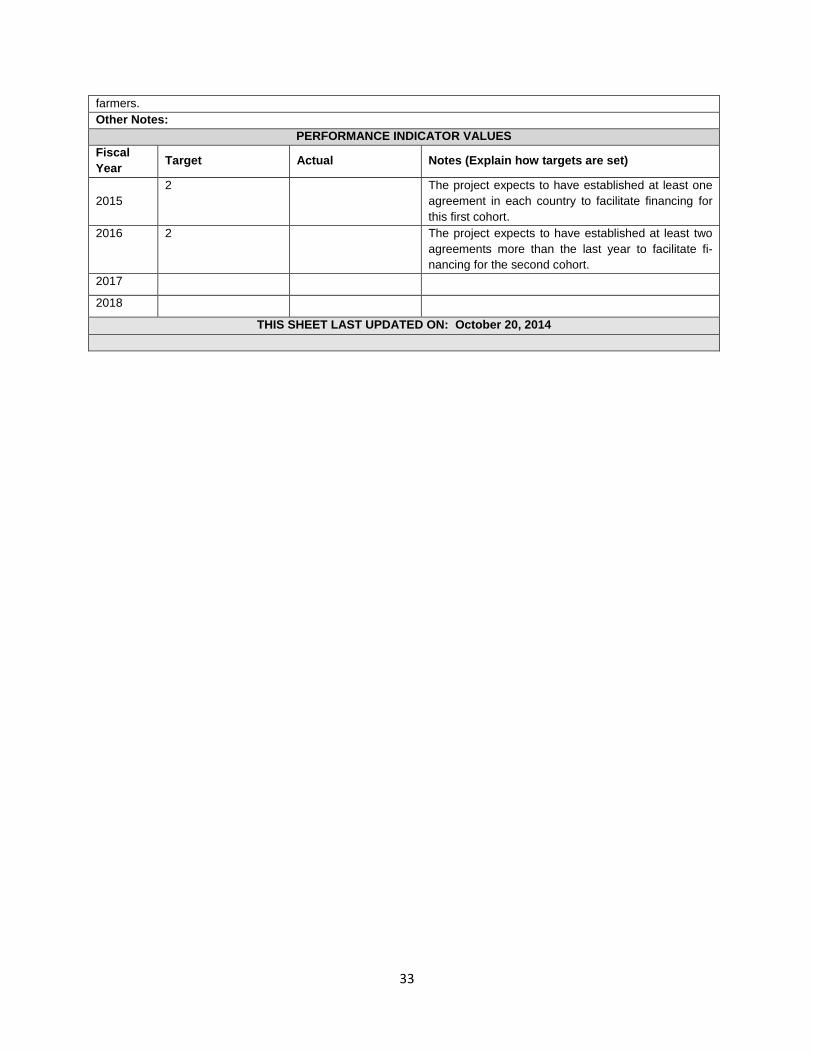
33
farmers.
Other Notes:
PERFORMANCE INDICATOR VALUES
Fiscal
Year Target Actual Notes (Explain how targets are set)
2015
2 The project expects to have established at least one
agreement in each country to facilitate financing for
this first cohort.
2016 2 The project expects to have established at least two
agreements more than the last year to facilitate fi-
nancing for the second cohort.
2017 2018
THIS SHEET LAST UPDATED ON: October 20, 2014
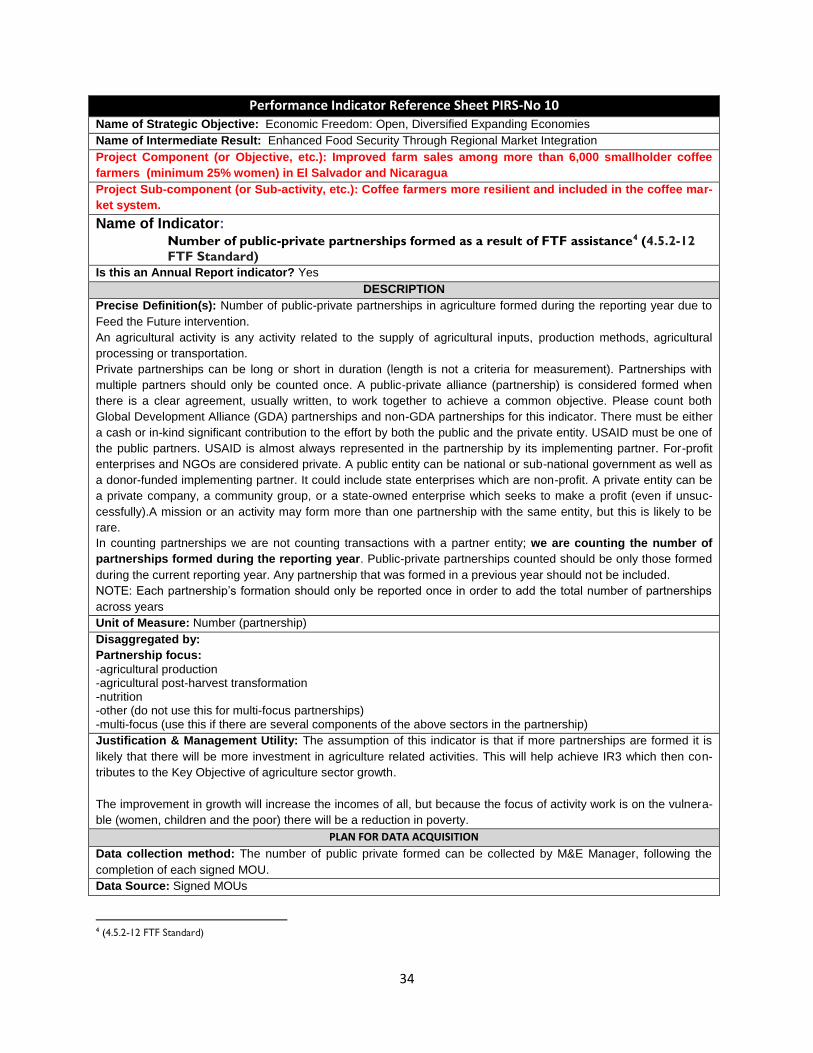
34
Performance Indicator Reference Sheet PIRS-No 10 Name of Strategic Objective: Economic Freedom: Open, Diversified Expanding Economies
Name of Intermediate Result: Enhanced Food Security Through Regional Market Integration
Project Component (or Objective, etc.): Improved farm sales among more than 6,000 smallholder coffee
farmers (minimum 25% women) in El Salvador and Nicaragua
Project Sub-component (or Sub-activity, etc.): Coffee farmers more resilient and included in the coffee mar-
ket system.
Name of Indicator: Number of public-private partnerships formed as a result of FTF assistance4 (4.5.2-12
FTF Standard)
Is this an Annual Report indicator? Yes
DESCRIPTION
Precise Definition(s): Number of public-private partnerships in agriculture formed during the reporting year due to
Feed the Future intervention.
An agricultural activity is any activity related to the supply of agricultural inputs, production methods, agricultural
processing or transportation.
Private partnerships can be long or short in duration (length is not a criteria for measurement). Partnerships with
multiple partners should only be counted once. A public-private alliance (partnership) is considered formed when
there is a clear agreement, usually written, to work together to achieve a common objective. Please count both
Global Development Alliance (GDA) partnerships and non-GDA partnerships for this indicator. There must be either
a cash or in-kind significant contribution to the effort by both the public and the private entity. USAID must be one of
the public partners. USAID is almost always represented in the partnership by its implementing partner. For-profit
enterprises and NGOs are considered private. A public entity can be national or sub-national government as well as
a donor-funded implementing partner. It could include state enterprises which are non-profit. A private entity can be
a private company, a community group, or a state-owned enterprise which seeks to make a profit (even if unsuc-
cessfully).A mission or an activity may form more than one partnership with the same entity, but this is likely to be
rare.
In counting partnerships we are not counting transactions with a partner entity; we are counting the number of
partnerships formed during the reporting year. Public-private partnerships counted should be only those formed
during the current reporting year. Any partnership that was formed in a previous year should not be included.
NOTE: Each partnership’s formation should only be reported once in order to add the total number of partnerships
across years
Unit of Measure: Number (partnership)
Disaggregated by:
Partnership focus:
-agricultural production -agricultural post-harvest transformation -nutrition -other (do not use this for multi-focus partnerships) -multi-focus (use this if there are several components of the above sectors in the partnership)
Justification & Management Utility: The assumption of this indicator is that if more partnerships are formed it is
likely that there will be more investment in agriculture related activities. This will help achieve IR3 which then con-
tributes to the Key Objective of agriculture sector growth.
The improvement in growth will increase the incomes of all, but because the focus of activity work is on the vulnera-
ble (women, children and the poor) there will be a reduction in poverty.
PLAN FOR DATA ACQUISITION
Data collection method: The number of public private formed can be collected by M&E Manager, following the
completion of each signed MOU.
Data Source: Signed MOUs
4 (4.5.2-12 FTF Standard)
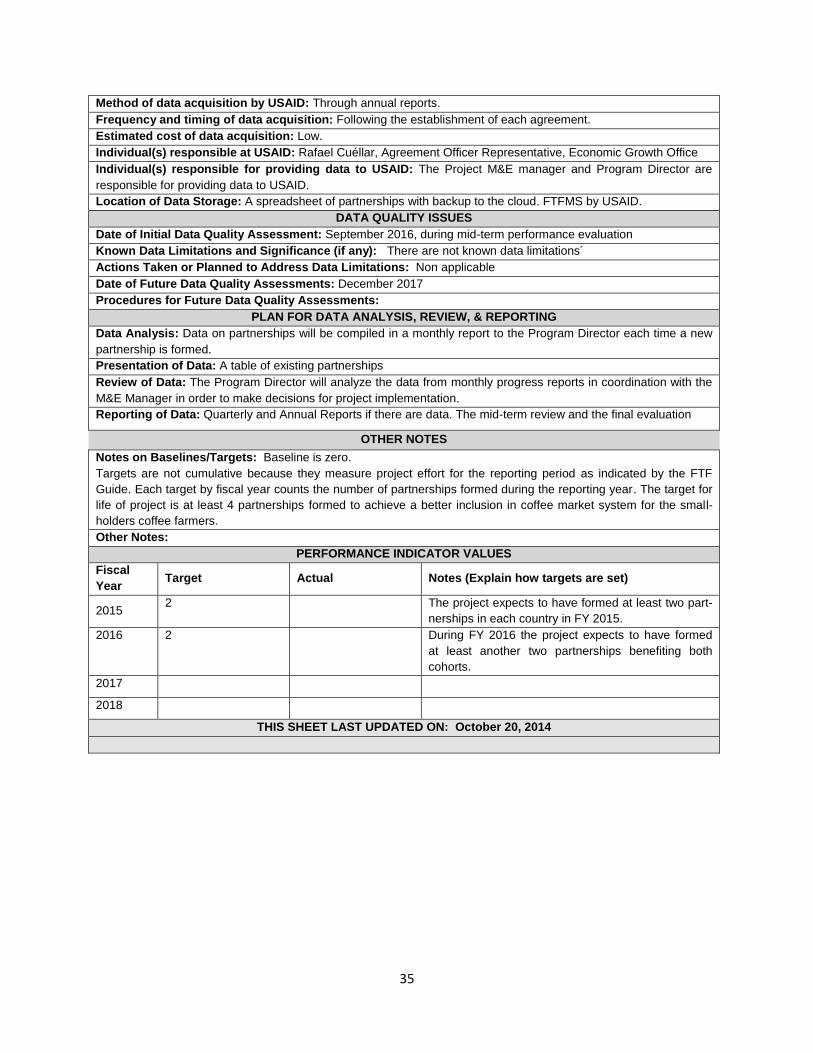
35
Method of data acquisition by USAID: Through annual reports.
Frequency and timing of data acquisition: Following the establishment of each agreement.
Estimated cost of data acquisition: Low.
Individual(s) responsible at USAID: Rafael Cuéllar, Agreement Officer Representative, Economic Growth Office
Individual(s) responsible for providing data to USAID: The Project M&E manager and Program Director are
responsible for providing data to USAID.
Location of Data Storage: A spreadsheet of partnerships with backup to the cloud. FTFMS by USAID.
DATA QUALITY ISSUES
Date of Initial Data Quality Assessment: September 2016, during mid-term performance evaluation
Known Data Limitations and Significance (if any): There are not known data limitations´
Actions Taken or Planned to Address Data Limitations: Non applicable
Date of Future Data Quality Assessments: December 2017
Procedures for Future Data Quality Assessments:
PLAN FOR DATA ANALYSIS, REVIEW, & REPORTING
Data Analysis: Data on partnerships will be compiled in a monthly report to the Program Director each time a new
partnership is formed.
Presentation of Data: A table of existing partnerships
Review of Data: The Program Director will analyze the data from monthly progress reports in coordination with the
M&E Manager in order to make decisions for project implementation.
Reporting of Data: Quarterly and Annual Reports if there are data. The mid-term review and the final evaluation
OTHER NOTES
Notes on Baselines/Targets: Baseline is zero.
Targets are not cumulative because they measure project effort for the reporting period as indicated by the FTF
Guide. Each target by fiscal year counts the number of partnerships formed during the reporting year. The target for
life of project is at least 4 partnerships formed to achieve a better inclusion in coffee market system for the small-
holders coffee farmers.
Other Notes:
PERFORMANCE INDICATOR VALUES
Fiscal
Year Target Actual Notes (Explain how targets are set)
2015 2 The project expects to have formed at least two part-
nerships in each country in FY 2015. 2016 2 During FY 2016 the project expects to have formed
at least another two partnerships benefiting both
cohorts. 2017 2018
THIS SHEET LAST UPDATED ON: October 20, 2014
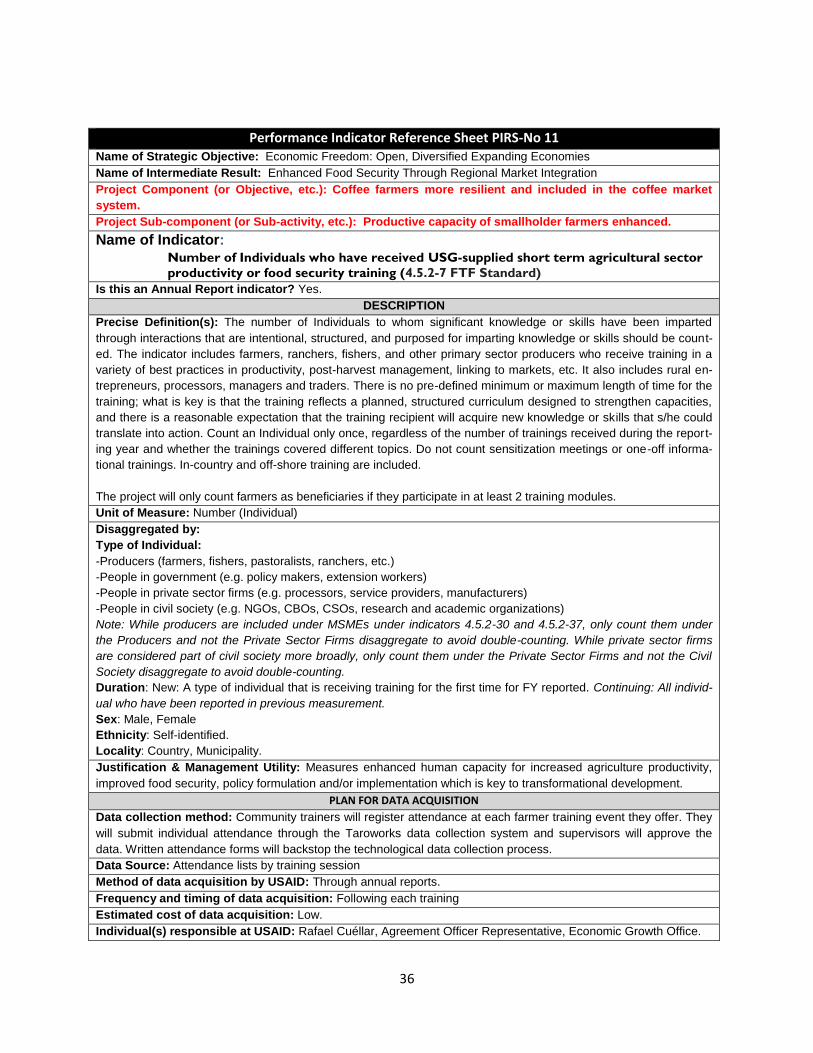
36
Performance Indicator Reference Sheet PIRS-No 11 Name of Strategic Objective: Economic Freedom: Open, Diversified Expanding Economies
Name of Intermediate Result: Enhanced Food Security Through Regional Market Integration
Project Component (or Objective, etc.): Coffee farmers more resilient and included in the coffee market
system.
Project Sub-component (or Sub-activity, etc.): Productive capacity of smallholder farmers enhanced.
Name of Indicator: Number of Individuals who have received USG-supplied short term agricultural sector
productivity or food security training (4.5.2-7 FTF Standard)
Is this an Annual Report indicator? Yes.
DESCRIPTION
Precise Definition(s): The number of Individuals to whom significant knowledge or skills have been imparted
through interactions that are intentional, structured, and purposed for imparting knowledge or skills should be count-
ed. The indicator includes farmers, ranchers, fishers, and other primary sector producers who receive training in a
variety of best practices in productivity, post-harvest management, linking to markets, etc. It also includes rural en-
trepreneurs, processors, managers and traders. There is no pre-defined minimum or maximum length of time for the
training; what is key is that the training reflects a planned, structured curriculum designed to strengthen capacities,
and there is a reasonable expectation that the training recipient will acquire new knowledge or skills that s/he could
translate into action. Count an Individual only once, regardless of the number of trainings received during the report-
ing year and whether the trainings covered different topics. Do not count sensitization meetings or one-off informa-
tional trainings. In-country and off-shore training are included.
The project will only count farmers as beneficiaries if they participate in at least 2 training modules.
Unit of Measure: Number (Individual)
Disaggregated by:
Type of Individual:
-Producers (farmers, fishers, pastoralists, ranchers, etc.)
-People in government (e.g. policy makers, extension workers)
-People in private sector firms (e.g. processors, service providers, manufacturers)
-People in civil society (e.g. NGOs, CBOs, CSOs, research and academic organizations)
Note: While producers are included under MSMEs under indicators 4.5.2-30 and 4.5.2-37, only count them under
the Producers and not the Private Sector Firms disaggregate to avoid double-counting. While private sector firms
are considered part of civil society more broadly, only count them under the Private Sector Firms and not the Civil
Society disaggregate to avoid double-counting.
Duration: New: A type of individual that is receiving training for the first time for FY reported. Continuing: All individ-
ual who have been reported in previous measurement.
Sex: Male, Female
Ethnicity: Self-identified.
Locality: Country, Municipality.
Justification & Management Utility: Measures enhanced human capacity for increased agriculture productivity,
improved food security, policy formulation and/or implementation which is key to transformational development.
PLAN FOR DATA ACQUISITION
Data collection method: Community trainers will register attendance at each farmer training event they offer. They
will submit individual attendance through the Taroworks data collection system and supervisors will approve the
data. Written attendance forms will backstop the technological data collection process.
Data Source: Attendance lists by training session
Method of data acquisition by USAID: Through annual reports.
Frequency and timing of data acquisition: Following each training
Estimated cost of data acquisition: Low.
Individual(s) responsible at USAID: Rafael Cuéllar, Agreement Officer Representative, Economic Growth Office.
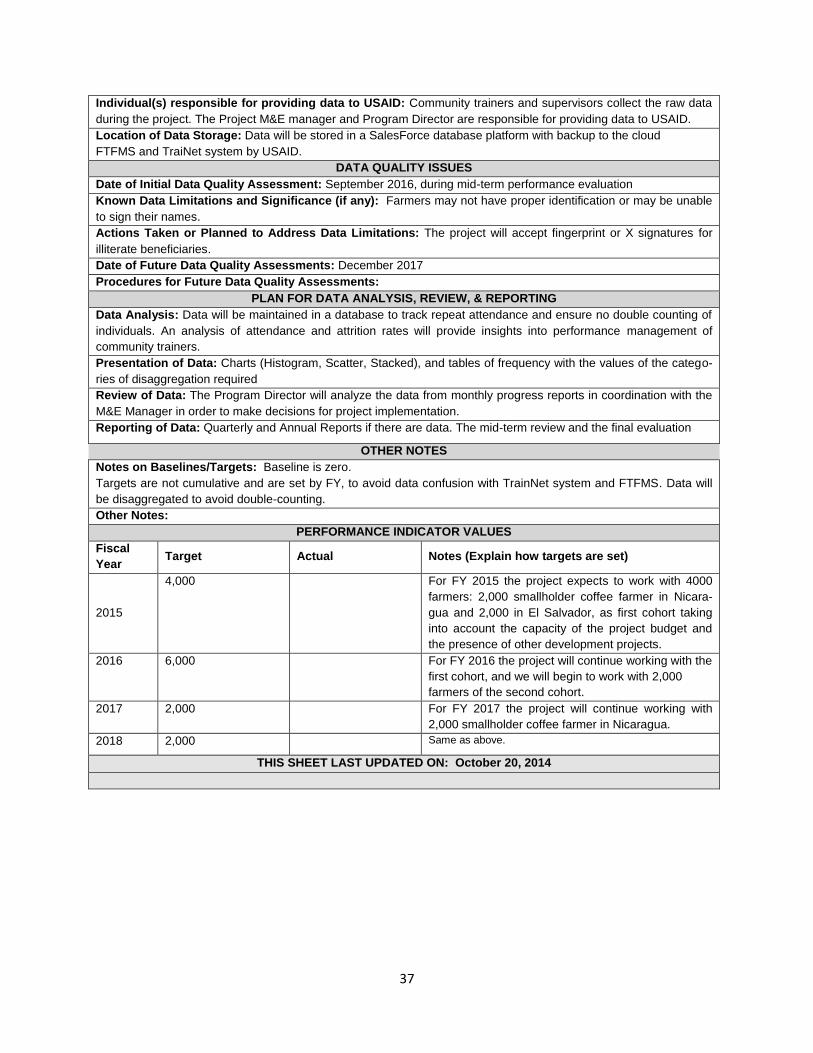
37
Individual(s) responsible for providing data to USAID: Community trainers and supervisors collect the raw data
during the project. The Project M&E manager and Program Director are responsible for providing data to USAID.
Location of Data Storage: Data will be stored in a SalesForce database platform with backup to the cloud
FTFMS and TraiNet system by USAID.
DATA QUALITY ISSUES
Date of Initial Data Quality Assessment: September 2016, during mid-term performance evaluation
Known Data Limitations and Significance (if any): Farmers may not have proper identification or may be unable
to sign their names.
Actions Taken or Planned to Address Data Limitations: The project will accept fingerprint or X signatures for
illiterate beneficiaries.
Date of Future Data Quality Assessments: December 2017
Procedures for Future Data Quality Assessments:
PLAN FOR DATA ANALYSIS, REVIEW, & REPORTING
Data Analysis: Data will be maintained in a database to track repeat attendance and ensure no double counting of
individuals. An analysis of attendance and attrition rates will provide insights into performance management of
community trainers.
Presentation of Data: Charts (Histogram, Scatter, Stacked), and tables of frequency with the values of the catego-
ries of disaggregation required
Review of Data: The Program Director will analyze the data from monthly progress reports in coordination with the
M&E Manager in order to make decisions for project implementation.
Reporting of Data: Quarterly and Annual Reports if there are data. The mid-term review and the final evaluation
OTHER NOTES
Notes on Baselines/Targets: Baseline is zero.
Targets are not cumulative and are set by FY, to avoid data confusion with TrainNet system and FTFMS. Data will
be disaggregated to avoid double-counting.
Other Notes:
PERFORMANCE INDICATOR VALUES
Fiscal
Year Target Actual Notes (Explain how targets are set)
2015
4,000 For FY 2015 the project expects to work with 4000
farmers: 2,000 smallholder coffee farmer in Nicara-
gua and 2,000 in El Salvador, as first cohort taking
into account the capacity of the project budget and
the presence of other development projects.
2016 6,000 For FY 2016 the project will continue working with the
first cohort, and we will begin to work with 2,000
farmers of the second cohort.
2017 2,000 For FY 2017 the project will continue working with
2,000 smallholder coffee farmer in Nicaragua.
2018 2,000 Same as above.
THIS SHEET LAST UPDATED ON: October 20, 2014
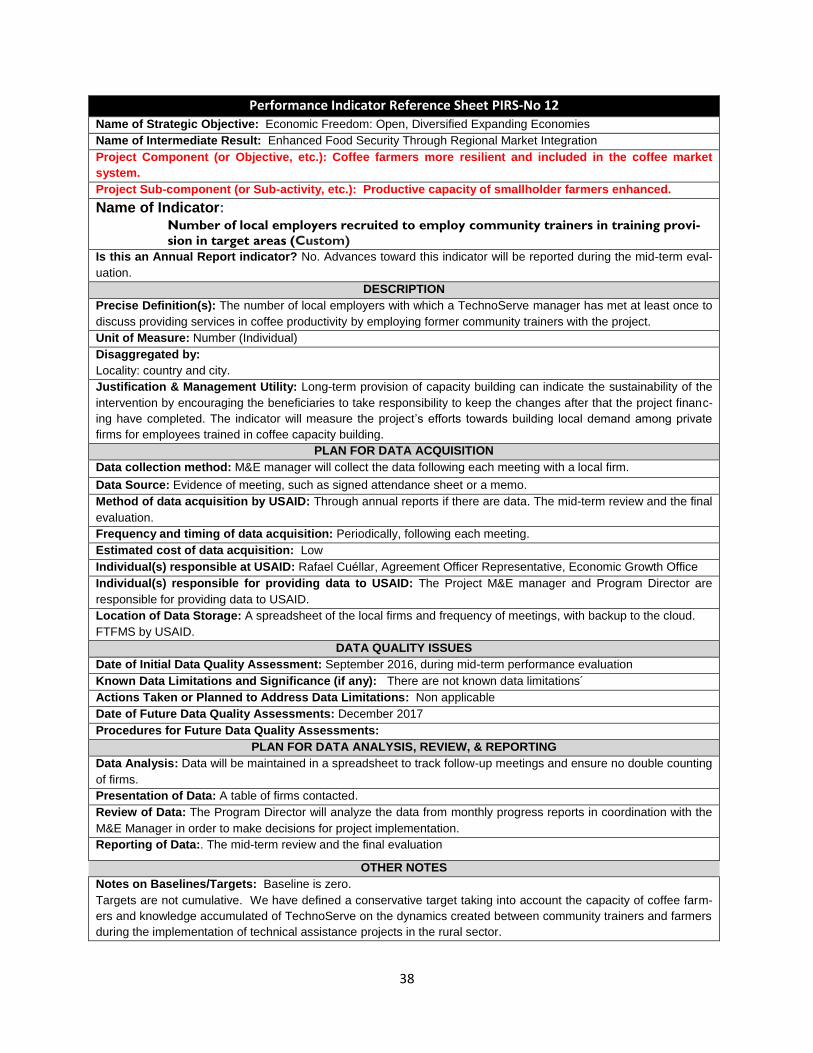
38
Performance Indicator Reference Sheet PIRS-No 12 Name of Strategic Objective: Economic Freedom: Open, Diversified Expanding Economies
Name of Intermediate Result: Enhanced Food Security Through Regional Market Integration
Project Component (or Objective, etc.): Coffee farmers more resilient and included in the coffee market
system.
Project Sub-component (or Sub-activity, etc.): Productive capacity of smallholder farmers enhanced.
Name of Indicator: Number of local employers recruited to employ community trainers in training provi-
sion in target areas (Custom)
Is this an Annual Report indicator? No. Advances toward this indicator will be reported during the mid-term eval-
uation.
DESCRIPTION
Precise Definition(s): The number of local employers with which a TechnoServe manager has met at least once to
discuss providing services in coffee productivity by employing former community trainers with the project.
Unit of Measure: Number (Individual)
Disaggregated by:
Locality: country and city.
Justification & Management Utility: Long-term provision of capacity building can indicate the sustainability of the
intervention by encouraging the beneficiaries to take responsibility to keep the changes after that the project financ-
ing have completed. The indicator will measure the project’s efforts towards building local demand among private
firms for employees trained in coffee capacity building.
PLAN FOR DATA ACQUISITION
Data collection method: M&E manager will collect the data following each meeting with a local firm.
Data Source: Evidence of meeting, such as signed attendance sheet or a memo.
Method of data acquisition by USAID: Through annual reports if there are data. The mid-term review and the final
evaluation.
Frequency and timing of data acquisition: Periodically, following each meeting.
Estimated cost of data acquisition: Low
Individual(s) responsible at USAID: Rafael Cuéllar, Agreement Officer Representative, Economic Growth Office
Individual(s) responsible for providing data to USAID: The Project M&E manager and Program Director are
responsible for providing data to USAID.
Location of Data Storage: A spreadsheet of the local firms and frequency of meetings, with backup to the cloud.
FTFMS by USAID.
DATA QUALITY ISSUES
Date of Initial Data Quality Assessment: September 2016, during mid-term performance evaluation
Known Data Limitations and Significance (if any): There are not known data limitations´
Actions Taken or Planned to Address Data Limitations: Non applicable
Date of Future Data Quality Assessments: December 2017
Procedures for Future Data Quality Assessments:
PLAN FOR DATA ANALYSIS, REVIEW, & REPORTING
Data Analysis: Data will be maintained in a spreadsheet to track follow-up meetings and ensure no double counting
of firms.
Presentation of Data: A table of firms contacted.
Review of Data: The Program Director will analyze the data from monthly progress reports in coordination with the
M&E Manager in order to make decisions for project implementation.
Reporting of Data:. The mid-term review and the final evaluation
OTHER NOTES
Notes on Baselines/Targets: Baseline is zero.
Targets are not cumulative. We have defined a conservative target taking into account the capacity of coffee farm-
ers and knowledge accumulated of TechnoServe on the dynamics created between community trainers and farmers
during the implementation of technical assistance projects in the rural sector.
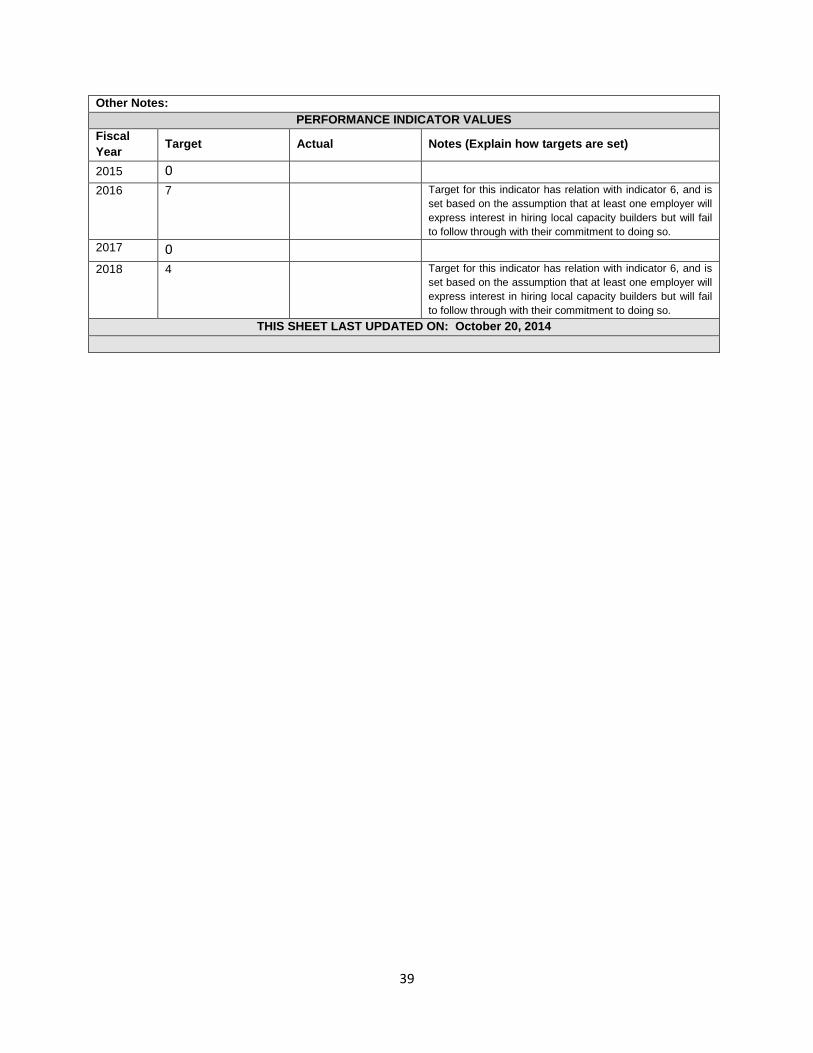
39
Other Notes:
PERFORMANCE INDICATOR VALUES
Fiscal
Year Target Actual Notes (Explain how targets are set)
2015 0
2016 7 Target for this indicator has relation with indicator 6, and is
set based on the assumption that at least one employer will
express interest in hiring local capacity builders but will fail
to follow through with their commitment to doing so.
2017 0
2018 4 Target for this indicator has relation with indicator 6, and is
set based on the assumption that at least one employer will
express interest in hiring local capacity builders but will fail
to follow through with their commitment to doing so.
THIS SHEET LAST UPDATED ON: October 20, 2014
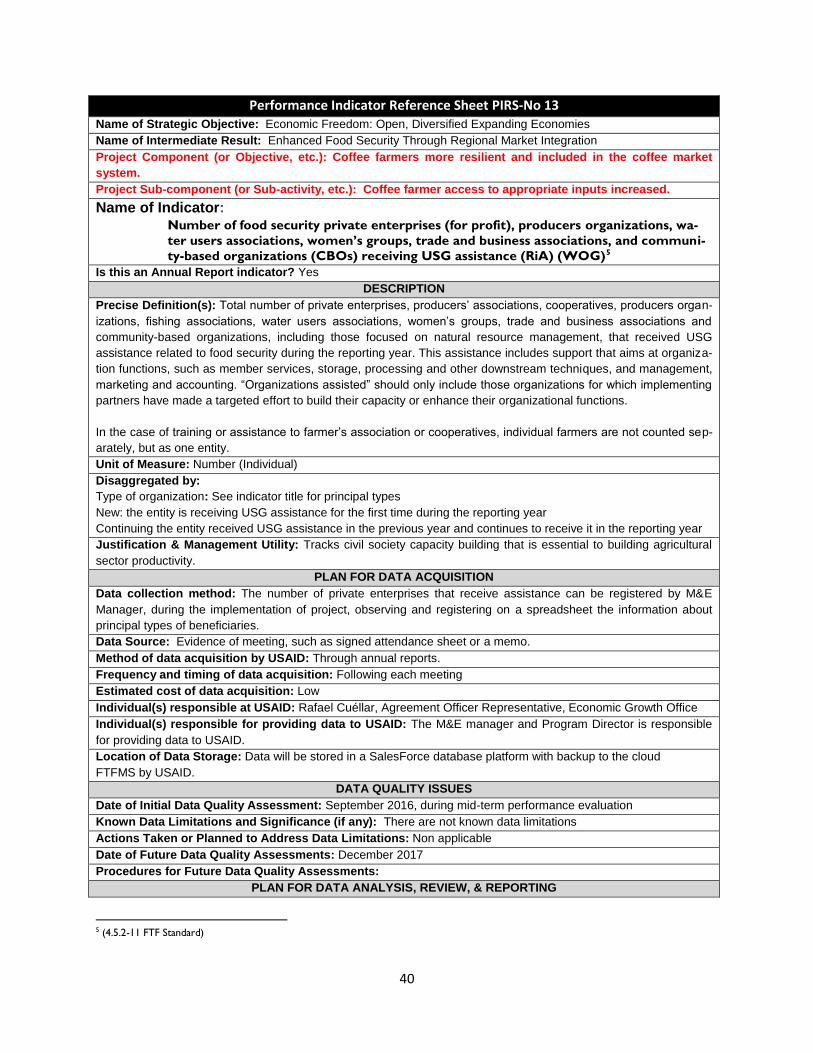
40
Performance Indicator Reference Sheet PIRS-No 13 Name of Strategic Objective: Economic Freedom: Open, Diversified Expanding Economies
Name of Intermediate Result: Enhanced Food Security Through Regional Market Integration
Project Component (or Objective, etc.): Coffee farmers more resilient and included in the coffee market
system.
Project Sub-component (or Sub-activity, etc.): Coffee farmer access to appropriate inputs increased.
Name of Indicator: Number of food security private enterprises (for profit), producers organizations, wa-
ter users associations, women’s groups, trade and business associations, and communi-
ty-based organizations (CBOs) receiving USG assistance (RiA) (WOG)5
Is this an Annual Report indicator? Yes
DESCRIPTION
Precise Definition(s): Total number of private enterprises, producers’ associations, cooperatives, producers organ-
izations, fishing associations, water users associations, women’s groups, trade and business associations and
community-based organizations, including those focused on natural resource management, that received USG
assistance related to food security during the reporting year. This assistance includes support that aims at organiza-
tion functions, such as member services, storage, processing and other downstream techniques, and management,
marketing and accounting. “Organizations assisted” should only include those organizations for which implementing
partners have made a targeted effort to build their capacity or enhance their organizational functions.
In the case of training or assistance to farmer’s association or cooperatives, individual farmers are not counted sep-
arately, but as one entity.
Unit of Measure: Number (Individual)
Disaggregated by:
Type of organization: See indicator title for principal types
New: the entity is receiving USG assistance for the first time during the reporting year
Continuing the entity received USG assistance in the previous year and continues to receive it in the reporting year
Justification & Management Utility: Tracks civil society capacity building that is essential to building agricultural
sector productivity.
PLAN FOR DATA ACQUISITION
Data collection method: The number of private enterprises that receive assistance can be registered by M&E
Manager, during the implementation of project, observing and registering on a spreadsheet the information about
principal types of beneficiaries.
Data Source: Evidence of meeting, such as signed attendance sheet or a memo.
Method of data acquisition by USAID: Through annual reports.
Frequency and timing of data acquisition: Following each meeting
Estimated cost of data acquisition: Low
Individual(s) responsible at USAID: Rafael Cuéllar, Agreement Officer Representative, Economic Growth Office
Individual(s) responsible for providing data to USAID: The M&E manager and Program Director is responsible
for providing data to USAID.
Location of Data Storage: Data will be stored in a SalesForce database platform with backup to the cloud
FTFMS by USAID.
DATA QUALITY ISSUES
Date of Initial Data Quality Assessment: September 2016, during mid-term performance evaluation
Known Data Limitations and Significance (if any): There are not known data limitations
Actions Taken or Planned to Address Data Limitations: Non applicable
Date of Future Data Quality Assessments: December 2017
Procedures for Future Data Quality Assessments:
PLAN FOR DATA ANALYSIS, REVIEW, & REPORTING
5 (4.5.2-11 FTF Standard)
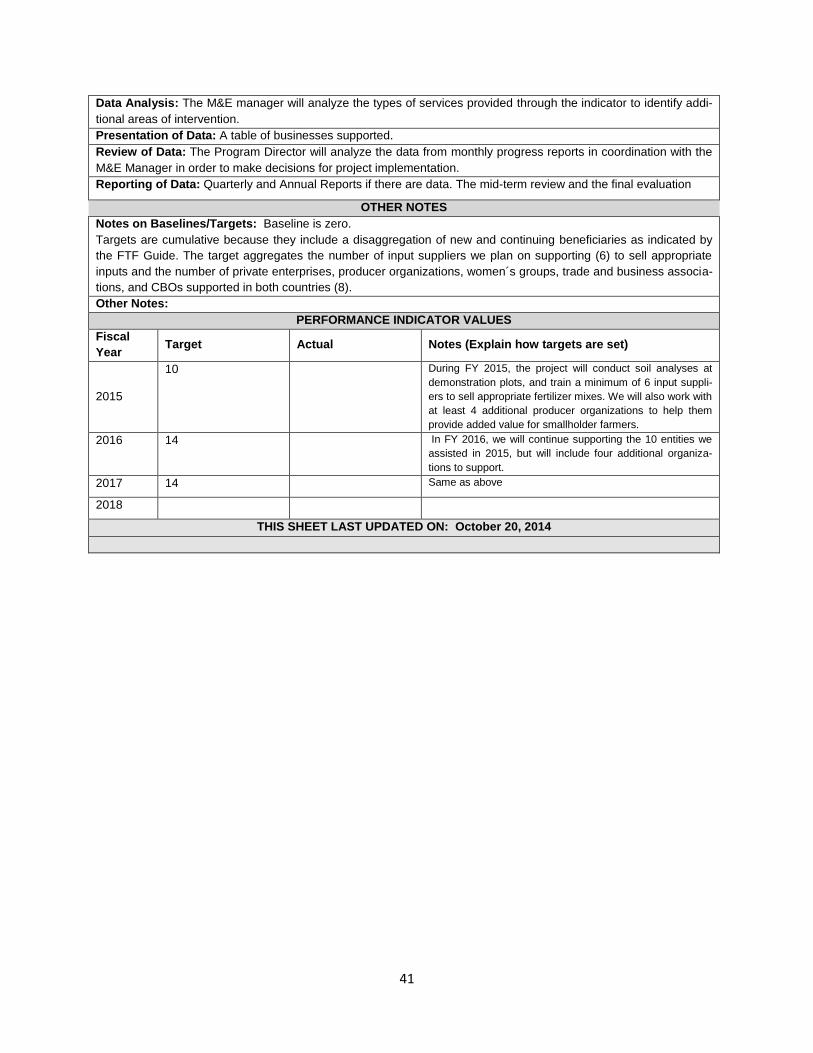
41
Data Analysis: The M&E manager will analyze the types of services provided through the indicator to identify addi-
tional areas of intervention.
Presentation of Data: A table of businesses supported.
Review of Data: The Program Director will analyze the data from monthly progress reports in coordination with the
M&E Manager in order to make decisions for project implementation.
Reporting of Data: Quarterly and Annual Reports if there are data. The mid-term review and the final evaluation
OTHER NOTES
Notes on Baselines/Targets: Baseline is zero.
Targets are cumulative because they include a disaggregation of new and continuing beneficiaries as indicated by
the FTF Guide. The target aggregates the number of input suppliers we plan on supporting (6) to sell appropriate
inputs and the number of private enterprises, producer organizations, women´s groups, trade and business associa-
tions, and CBOs supported in both countries (8).
Other Notes:
PERFORMANCE INDICATOR VALUES
Fiscal
Year Target Actual Notes (Explain how targets are set)
2015
10 During FY 2015, the project will conduct soil analyses at
demonstration plots, and train a minimum of 6 input suppli-
ers to sell appropriate fertilizer mixes. We will also work with
at least 4 additional producer organizations to help them
provide added value for smallholder farmers.
2016 14 In FY 2016, we will continue supporting the 10 entities we
assisted in 2015, but will include four additional organiza-
tions to support.
2017 14 Same as above
2018 THIS SHEET LAST UPDATED ON: October 20, 2014
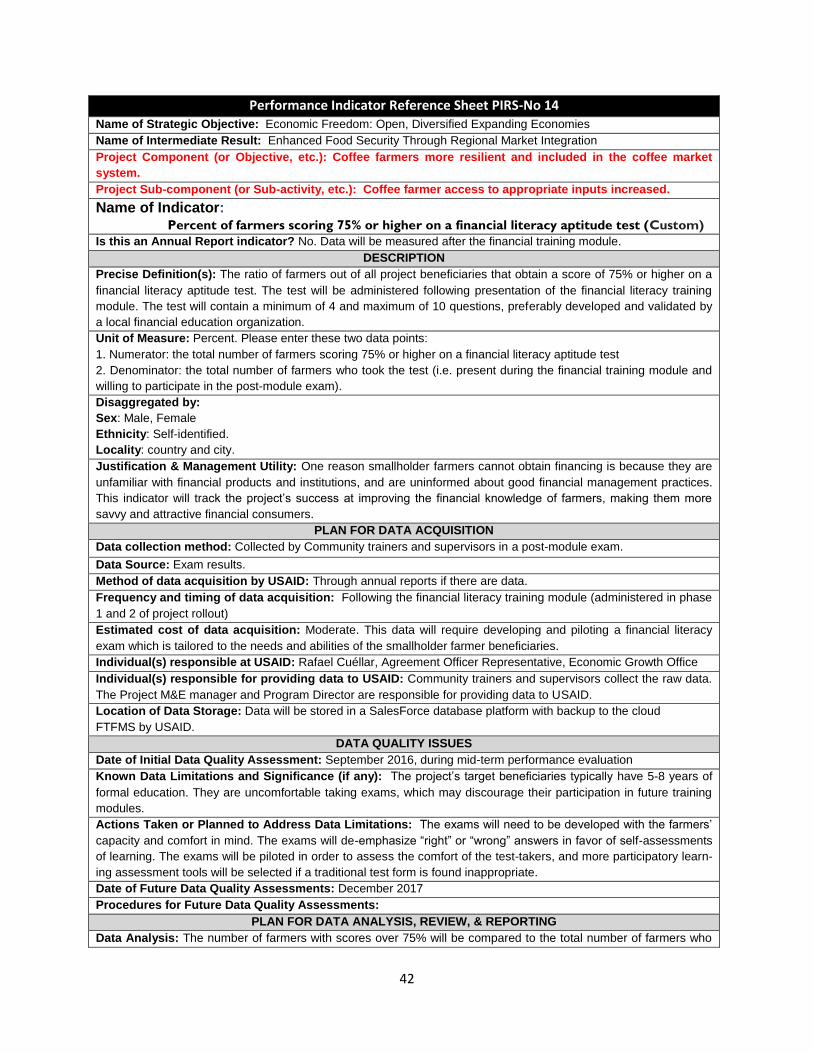
42
Performance Indicator Reference Sheet PIRS-No 14 Name of Strategic Objective: Economic Freedom: Open, Diversified Expanding Economies
Name of Intermediate Result: Enhanced Food Security Through Regional Market Integration
Project Component (or Objective, etc.): Coffee farmers more resilient and included in the coffee market
system.
Project Sub-component (or Sub-activity, etc.): Coffee farmer access to appropriate inputs increased.
Name of Indicator: Percent of farmers scoring 75% or higher on a financial literacy aptitude test (Custom)
Is this an Annual Report indicator? No. Data will be measured after the financial training module.
DESCRIPTION
Precise Definition(s): The ratio of farmers out of all project beneficiaries that obtain a score of 75% or higher on a
financial literacy aptitude test. The test will be administered following presentation of the financial literacy training
module. The test will contain a minimum of 4 and maximum of 10 questions, preferably developed and validated by
a local financial education organization.
Unit of Measure: Percent. Please enter these two data points:
1. Numerator: the total number of farmers scoring 75% or higher on a financial literacy aptitude test
2. Denominator: the total number of farmers who took the test (i.e. present during the financial training module and
willing to participate in the post-module exam).
Disaggregated by:
Sex: Male, Female
Ethnicity: Self-identified.
Locality: country and city.
Justification & Management Utility: One reason smallholder farmers cannot obtain financing is because they are
unfamiliar with financial products and institutions, and are uninformed about good financial management practices.
This indicator will track the project’s success at improving the financial knowledge of farmers, making them more
savvy and attractive financial consumers.
PLAN FOR DATA ACQUISITION
Data collection method: Collected by Community trainers and supervisors in a post-module exam.
Data Source: Exam results.
Method of data acquisition by USAID: Through annual reports if there are data.
Frequency and timing of data acquisition: Following the financial literacy training module (administered in phase
1 and 2 of project rollout)
Estimated cost of data acquisition: Moderate. This data will require developing and piloting a financial literacy
exam which is tailored to the needs and abilities of the smallholder farmer beneficiaries.
Individual(s) responsible at USAID: Rafael Cuéllar, Agreement Officer Representative, Economic Growth Office
Individual(s) responsible for providing data to USAID: Community trainers and supervisors collect the raw data.
The Project M&E manager and Program Director are responsible for providing data to USAID.
Location of Data Storage: Data will be stored in a SalesForce database platform with backup to the cloud
FTFMS by USAID.
DATA QUALITY ISSUES
Date of Initial Data Quality Assessment: September 2016, during mid-term performance evaluation
Known Data Limitations and Significance (if any): The project’s target beneficiaries typically have 5-8 years of
formal education. They are uncomfortable taking exams, which may discourage their participation in future training
modules.
Actions Taken or Planned to Address Data Limitations: The exams will need to be developed with the farmers’
capacity and comfort in mind. The exams will de-emphasize “right” or “wrong” answers in favor of self-assessments
of learning. The exams will be piloted in order to assess the comfort of the test-takers, and more participatory learn-
ing assessment tools will be selected if a traditional test form is found inappropriate.
Date of Future Data Quality Assessments: December 2017
Procedures for Future Data Quality Assessments:
PLAN FOR DATA ANALYSIS, REVIEW, & REPORTING
Data Analysis: The number of farmers with scores over 75% will be compared to the total number of farmers who
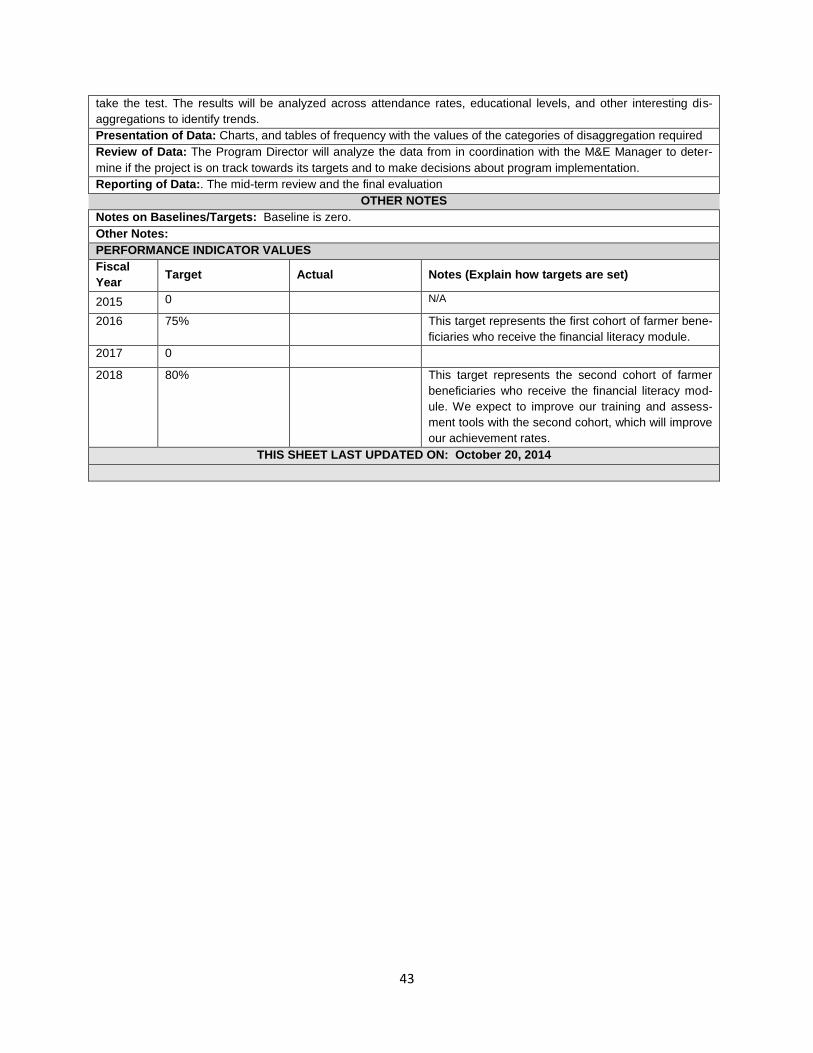
43
take the test. The results will be analyzed across attendance rates, educational levels, and other interesting dis-
aggregations to identify trends.
Presentation of Data: Charts, and tables of frequency with the values of the categories of disaggregation required
Review of Data: The Program Director will analyze the data from in coordination with the M&E Manager to deter-
mine if the project is on track towards its targets and to make decisions about program implementation.
Reporting of Data:. The mid-term review and the final evaluation
OTHER NOTES
Notes on Baselines/Targets: Baseline is zero.
Other Notes:
PERFORMANCE INDICATOR VALUES
Fiscal
Year Target Actual Notes (Explain how targets are set)
2015 0 N/A
2016 75% This target represents the first cohort of farmer bene-
ficiaries who receive the financial literacy module. 2017 0 2018 80% This target represents the second cohort of farmer
beneficiaries who receive the financial literacy mod-
ule. We expect to improve our training and assess-
ment tools with the second cohort, which will improve
our achievement rates.
THIS SHEET LAST UPDATED ON: October 20, 2014
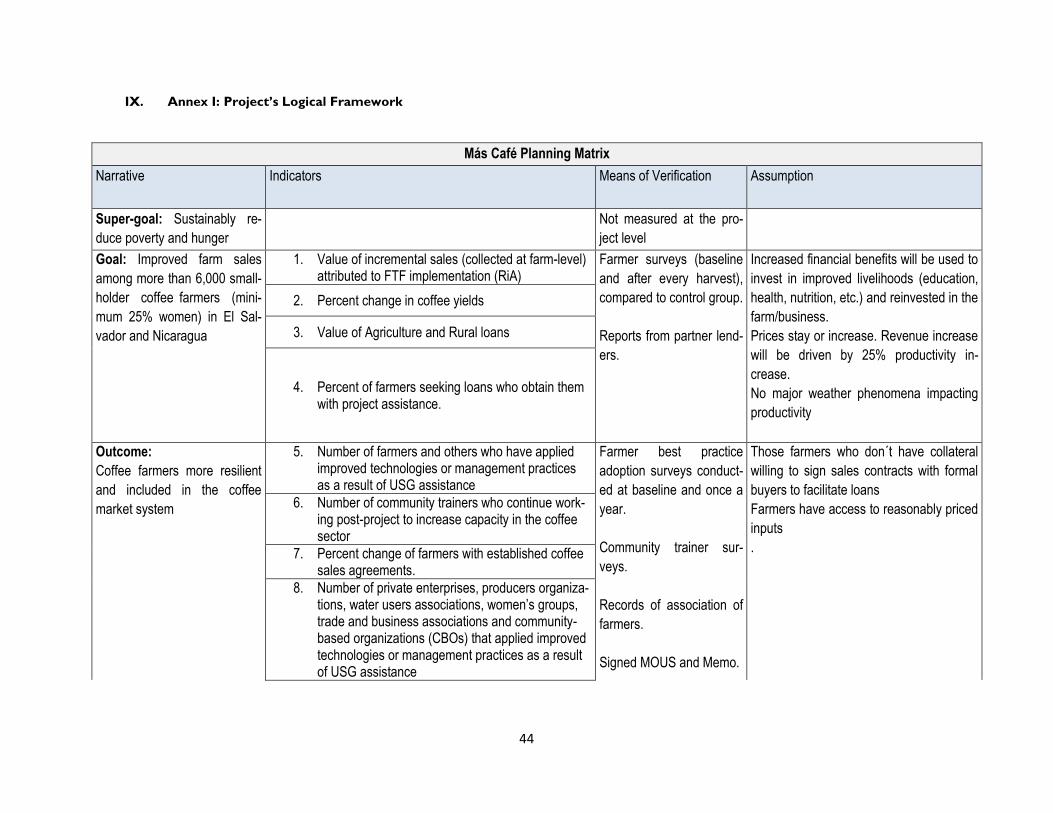
44
IX. Annex I: Project’s Logical Framework
Más Café Planning Matrix
Narrative Indicators Means of Verification Assumption
Super-goal: Sustainably re-
duce poverty and hunger
Not measured at the pro-
ject level
Goal: Improved farm sales
among more than 6,000 small-
holder coffee farmers (mini-
mum 25% women) in El Sal-
vador and Nicaragua
1. Value of incremental sales (collected at farm-level) attributed to FTF implementation (RiA)
Farmer surveys (baseline
and after every harvest),
compared to control group.
Reports from partner lend-
ers.
Increased financial benefits will be used to
invest in improved livelihoods (education,
health, nutrition, etc.) and reinvested in the
farm/business.
Prices stay or increase. Revenue increase
will be driven by 25% productivity in-
crease.
No major weather phenomena impacting
productivity
2. Percent change in coffee yields
3. Value of Agriculture and Rural loans
4. Percent of farmers seeking loans who obtain them with project assistance.
Outcome:
Coffee farmers more resilient
and included in the coffee
market system
5. Number of farmers and others who have applied improved technologies or management practices as a result of USG assistance
Farmer best practice
adoption surveys conduct-
ed at baseline and once a
year.
Community trainer sur-
veys.
Records of association of
farmers.
Signed MOUS and Memo.
Those farmers who don´t have collateral
willing to sign sales contracts with formal
buyers to facilitate loans
Farmers have access to reasonably priced
inputs
.
6. Number of community trainers who continue work-ing post-project to increase capacity in the coffee sector
7. Percent change of farmers with established coffee sales agreements.
8. Number of private enterprises, producers organiza-tions, water users associations, women’s groups, trade and business associations and community-based organizations (CBOs) that applied improved technologies or management practices as a result of USG assistance
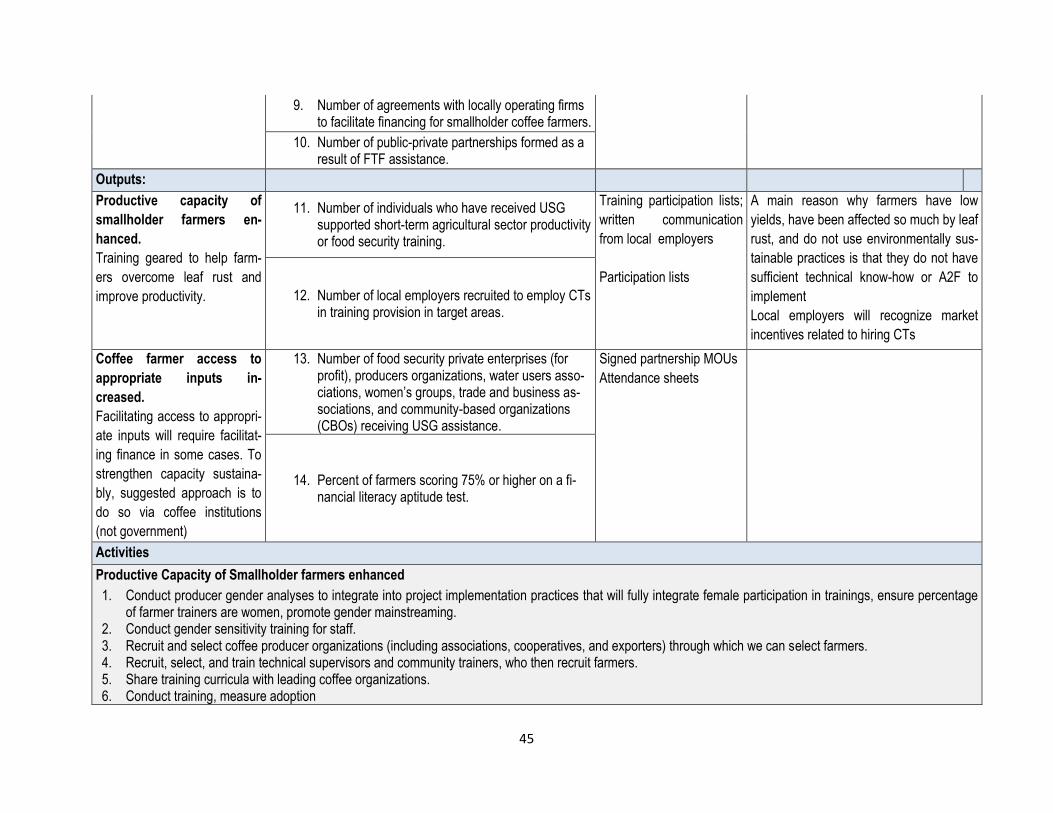
45
9. Number of agreements with locally operating firms to facilitate financing for smallholder coffee farmers.
10. Number of public-private partnerships formed as a result of FTF assistance.
Outputs:
Productive capacity of
smallholder farmers en-
hanced.
Training geared to help farm-
ers overcome leaf rust and
improve productivity.
11. Number of individuals who have received USG supported short-term agricultural sector productivity or food security training.
Training participation lists;
written communication
from local employers
Participation lists
A main reason why farmers have low
yields, have been affected so much by leaf
rust, and do not use environmentally sus-
tainable practices is that they do not have
sufficient technical know-how or A2F to
implement
Local employers will recognize market
incentives related to hiring CTs
12. Number of local employers recruited to employ CTs in training provision in target areas.
Coffee farmer access to
appropriate inputs in-
creased.
Facilitating access to appropri-
ate inputs will require facilitat-
ing finance in some cases. To
strengthen capacity sustaina-
bly, suggested approach is to
do so via coffee institutions
(not government)
13. Number of food security private enterprises (for profit), producers organizations, water users asso-ciations, women’s groups, trade and business as-sociations, and community-based organizations (CBOs) receiving USG assistance.
Signed partnership MOUs
Attendance sheets
14. Percent of farmers scoring 75% or higher on a fi-nancial literacy aptitude test.
Activities
Productive Capacity of Smallholder farmers enhanced
1. Conduct producer gender analyses to integrate into project implementation practices that will fully integrate female participation in trainings, ensure percentage of farmer trainers are women, promote gender mainstreaming.
2. Conduct gender sensitivity training for staff. 3. Recruit and select coffee producer organizations (including associations, cooperatives, and exporters) through which we can select farmers. 4. Recruit, select, and train technical supervisors and community trainers, who then recruit farmers. 5. Share training curricula with leading coffee organizations. 6. Conduct training, measure adoption
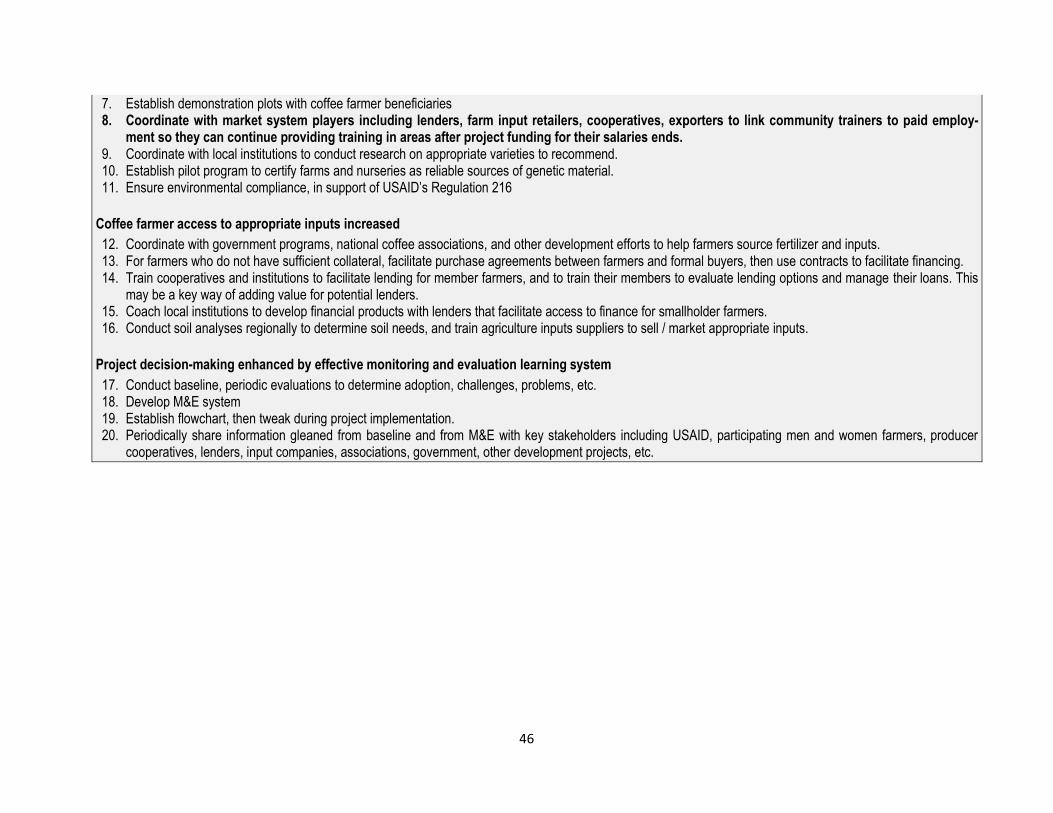
46
7. Establish demonstration plots with coffee farmer beneficiaries 8. Coordinate with market system players including lenders, farm input retailers, cooperatives, exporters to link community trainers to paid employ-
ment so they can continue providing training in areas after project funding for their salaries ends. 9. Coordinate with local institutions to conduct research on appropriate varieties to recommend. 10. Establish pilot program to certify farms and nurseries as reliable sources of genetic material. 11. Ensure environmental compliance, in support of USAID’s Regulation 216
Coffee farmer access to appropriate inputs increased
12. Coordinate with government programs, national coffee associations, and other development efforts to help farmers source fertilizer and inputs. 13. For farmers who do not have sufficient collateral, facilitate purchase agreements between farmers and formal buyers, then use contracts to facilitate financing. 14. Train cooperatives and institutions to facilitate lending for member farmers, and to train their members to evaluate lending options and manage their loans. This
may be a key way of adding value for potential lenders. 15. Coach local institutions to develop financial products with lenders that facilitate access to finance for smallholder farmers. 16. Conduct soil analyses regionally to determine soil needs, and train agriculture inputs suppliers to sell / market appropriate inputs.
Project decision-making enhanced by effective monitoring and evaluation learning system
17. Conduct baseline, periodic evaluations to determine adoption, challenges, problems, etc. 18. Develop M&E system 19. Establish flowchart, then tweak during project implementation. 20. Periodically share information gleaned from baseline and from M&E with key stakeholders including USAID, participating men and women farmers, producer
cooperatives, lenders, input companies, associations, government, other development projects, etc.
Related Documents