Research Article Coexpression within Integrated Mitochondrial Pathways Reveals Different Networks in Normal and Chemically Treated Transcriptomes Cong Chen, 1 Tae Kyung Hyun, 2 Xiao Han, 2 Zhihui Feng, 1 Yuan Li, 1 Xiaolong Liu, 3 and Jiankang Liu 1 1 Center for Mitochondrial Biology and Medicine, e Key Laboratory of Biomedical Information Engineering of Ministry of Education, School of Life Science and Technology and Frontier Institute of Science and Technology, Xi’an Jiaotong University, Xi’an 710049, China 2 Division of Applied Life Science (Brain Korea 21-World Class University Program), Plant Molecular Biology and Biotechnology Research Center, Gyeongsang National University, Jinju 660-701, Republic of Korea 3 e Liver Center of Fujian Province, Fujian Medical University, Fuzhou 350025, China Correspondence should be addressed to Jiankang Liu; jkliu [email protected] Received 22 February 2014; Revised 13 April 2014; Accepted 5 May 2014; Published 24 June 2014 Academic Editor: Graziano Pesole Copyright © 2014 Cong Chen et al. is is an open access article distributed under the Creative Commons Attribution License, which permits unrestricted use, distribution, and reproduction in any medium, provided the original work is properly cited. As energy producers, mitochondria play a pivotal role in multiple cellular processes. Although several lines of evidence suggest that differential expression of mitochondrial respiratory complexes (MRCs) has a significant impact on mitochondrial function, the role of integrated MRCs in the whole coexpression network has yet to be revealed. In this study, we construct coexpression networks based on microarray datasets from different tissues and chemical treatments to explore the role of integrated MRCs in the coexpression network and the effects of different chemicals on the mitochondrial network. By grouping MRCs as one seed target, the hypergeometric distribution allowed us to identify genes that are significantly coexpress with whole MRCs. Coexpression among 46 MRC genes (approximately 78% of MRC genes tested) was significant in the normal tissue transcriptome dataset. ese MRC genes are coexpressed with genes involved in the categories “muscle system process,” “metabolic process,” and “neurodegenerative disease pathways,” whereas, in the chemically treated tissues, coexpression of these genes mostly disappeared. ese results indicate that chemical stimuli alter the normal coexpression network of MRC genes. Taken together, the datasets obtained from the different coexpression networks are informative about mitochondrial biogenesis and should contribute to understanding the side effects of drugs on mitochondrial function. 1. Introduction Mitochondria are small membrane-enclosed organelles (from 0.5 to 1.0 M in diameter) found in most eukaryotic cells except mature red blood corpuscles [1]. Mitochondria are the powerhouses of eukaryotic cells and are involved in many cellular processes, including apoptosis; ion homeo- stasis; and the metabolism of glucose, lipids, and amino acids [2]. ATP, the energy currency of cell, is the final product of the respiratory chain/oxidative phosphorylation system, which consists of five protein complexes (complexes I–V) localized to the inner mitochondrial membrane [3]. Mitochondrial defects including mitochondrial DNA (mtDNA) mutations, altered expression and activity of respiratory chain subunits and glycolytic enzymes, and decreased oxidation of NADH- linked substrates have been suspected to play an important role in the development and progression of diseases, such as certain neurodegenerative diseases, diabetes, Leigh’s disease, and cancer [4–7]. ese clinical phenotypes are direct evidence reflecting the essential function of mitochondria. Mitochondrial genetic disorders are caused by defects in nuclear or mtDNA that affect the expression of the mtDNA-encoded mitochondrial respiratory complexes (MRCs) and the biosynthesis of the mtDNA-encoded polypeptides [8]. Mutations in genes required for mtDNA maintenance, expression, and replication regulate genetic Hindawi Publishing Corporation International Journal of Genomics Volume 2014, Article ID 452891, 10 pages http://dx.doi.org/10.1155/2014/452891

Welcome message from author
This document is posted to help you gain knowledge. Please leave a comment to let me know what you think about it! Share it to your friends and learn new things together.
Transcript

Research ArticleCoexpression within Integrated MitochondrialPathways Reveals Different Networks in Normal andChemically Treated Transcriptomes
Cong Chen,1 Tae Kyung Hyun,2 Xiao Han,2 Zhihui Feng,1 Yuan Li,1
Xiaolong Liu,3 and Jiankang Liu1
1 Center forMitochondrial Biology andMedicine,The Key Laboratory of Biomedical Information Engineering ofMinistry of Education,School of Life Science and Technology and Frontier Institute of Science and Technology, Xi’an Jiaotong University, Xi’an 710049, China
2Division of Applied Life Science (Brain Korea 21-World Class University Program), Plant Molecular Biology andBiotechnology Research Center, Gyeongsang National University, Jinju 660-701, Republic of Korea
3The Liver Center of Fujian Province, Fujian Medical University, Fuzhou 350025, China
Correspondence should be addressed to Jiankang Liu; jkliu [email protected]
Received 22 February 2014; Revised 13 April 2014; Accepted 5 May 2014; Published 24 June 2014
Academic Editor: Graziano Pesole
Copyright © 2014 Cong Chen et al. This is an open access article distributed under the Creative Commons Attribution License,which permits unrestricted use, distribution, and reproduction in any medium, provided the original work is properly cited.
As energy producers, mitochondria play a pivotal role in multiple cellular processes. Although several lines of evidence suggestthat differential expression of mitochondrial respiratory complexes (MRCs) has a significant impact on mitochondrial function,the role of integrated MRCs in the whole coexpression network has yet to be revealed. In this study, we construct coexpressionnetworks based on microarray datasets from different tissues and chemical treatments to explore the role of integrated MRCs inthe coexpression network and the effects of different chemicals on themitochondrial network. By groupingMRCs as one seed target,the hypergeometric distribution allowed us to identify genes that are significantly coexpresswithwholeMRCs. Coexpression among46 MRC genes (approximately 78% of MRC genes tested) was significant in the normal tissue transcriptome dataset. These MRCgenes are coexpressed with genes involved in the categories “muscle system process,” “metabolic process,” and “neurodegenerativedisease pathways,” whereas, in the chemically treated tissues, coexpression of these genes mostly disappeared.These results indicatethat chemical stimuli alter the normal coexpression network ofMRC genes. Taken together, the datasets obtained from the differentcoexpression networks are informative about mitochondrial biogenesis and should contribute to understanding the side effects ofdrugs on mitochondrial function.
1. Introduction
Mitochondria are small membrane-enclosed organelles(from 0.5 to 1.0 𝜇M in diameter) found in most eukaryoticcells except mature red blood corpuscles [1]. Mitochondriaare the powerhouses of eukaryotic cells and are involved inmany cellular processes, including apoptosis; ion homeo-stasis; and the metabolism of glucose, lipids, and amino acids[2]. ATP, the energy currency of cell, is the final product of therespiratory chain/oxidative phosphorylation system, whichconsists of five protein complexes (complexes I–V) localizedto the inner mitochondrial membrane [3]. Mitochondrialdefects including mitochondrial DNA (mtDNA) mutations,
altered expression and activity of respiratory chain subunitsand glycolytic enzymes, and decreased oxidation of NADH-linked substrates have been suspected to play an importantrole in the development and progression of diseases, such ascertain neurodegenerative diseases, diabetes, Leigh’s disease,and cancer [4–7]. These clinical phenotypes are directevidence reflecting the essential function of mitochondria.Mitochondrial genetic disorders are caused by defectsin nuclear or mtDNA that affect the expression of themtDNA-encoded mitochondrial respiratory complexes(MRCs) and the biosynthesis of the mtDNA-encodedpolypeptides [8]. Mutations in genes required for mtDNAmaintenance, expression, and replication regulate genetic
Hindawi Publishing CorporationInternational Journal of GenomicsVolume 2014, Article ID 452891, 10 pageshttp://dx.doi.org/10.1155/2014/452891

2 International Journal of Genomics
disorders, indicating that differential expression of MRCsand related genes has a significant impact on mitochondrialdysfunction [7, 9]. Therefore, systematic analysis of nuclearand mitochondrial gene expression in the context of well-defined disease models should provide insight into theinteraction of gene regulatory networks with MRCs, improv-ing our understating of mitochondrial disorders.
Coexpression analysis using transcriptome datasets gen-erated by high-throughput microarray transcript profilingproduces correlations that have often been considered toimply functional relationships [10, 11]. A strong correlationamong transcripts for MRC components has been found bythis type of coexpression analysis in plants. In the case ofplant MRC genes, it has been shown that genes belongingto MRCs are clustered into the same coexpression group[10]. Similarly, several mtDNA-encodedmitochondrial genesform a small cluster with a nuclear-encoded mitochondrialgene module and the glycolysis module [12]. Coexpressionanalysis has also implicated several unannotated genes incancer and mitochondrial complex I disease [13], indicatingthat coexpression analysis is a useful tool not only forunderstanding many diseases at the molecular level butalso for identification of novel candidate genes involved inmitochondria-related diseases. Although several studies havedemonstrated the power of coexpression analysis, few haveexploitedMRCs as an integrated component for analyzing thecoexpression network.
To further investigate the role of integrated MRCs inthe whole coexpression network, we determined the coex-pression networks of normal and chemically treated humantissues by analysis of Pearson correlation factors. In thecoexpression network under normal conditions, we foundthat the MRCs are almost fully self-connected. This self-connection indicates that whole MRCs might play a rolesimilar to that of single genes in the coexpression network.Using the hypergeometric distribution, we considered geneswith a𝑃 value less than 10−8 to be coexpression “friends” withMRCs. Candidate functions for these “friends” were deter-mined through enrichment analysis, using Gene Ontology(GO) terms and Kyoto Encyclopedia of Genes and Genomes(KEGG) pathways. We then explored the coexpression net-work between “friends” andMRCs in both normal and chem-ically treated tissues.The systematic coexpression network ofgenes interacting with wholeMRCs identifies candidates thatpotentially participate inmitochondrial biogenesis and couldserve as targets for future therapeutic interventions aimed atmodulating mitochondrial function.
2. Methods
2.1. Selection of Datasets and Construction of CoexpressionNetworks. To create coexpression “friends” with MRCs,we first constructed a genome-wide coexpression net-works using two different microarray datasets. Expres-sion datasets for 65 human tissues were downloaded fromthe COXPRESdb website (http://coxpresdb.jp/). Transcrip-tion profiles (E-MTAB-798) of human hepatocytes treatedwith 130 chemical compounds including drugs such as
acetaminophen, aspirin, rifampicin, metformin hydrochlo-ride, simvastatin, and tamoxifen citrate were obtained fromEMBL-EBI (http://www.ebi.ac.uk/arrayexpress/). Coexpres-sion networks were constructed as described in Azuaje [14].The Spearman coexpression coefficient, 𝜌, was calculated foreach pair of genes, and all gene pairs with 𝜌 ≥ 0.3 weredefined as gene-gene associations in the network. In thecoexpression network, the nodes represent genes and theedges represent the connection with coefficient ≥0.3.
2.2. Analysis of Coexpression Significance. TheMRC is desig-nated as NADH-Coenzyme Q reductase (complex I), succi-nate-CoQ reductase (complex II), ubiquinol-cytochrome creductase (complex III), cytochrome c oxidase (complex IV),and ATP synthase (complex V). Complexes I, II, III, and IVplay as the electron transfer complexes, whereas complex V isknown as an enzyme-conserving complex [3]. Since differentdatasets contain different probes mapping to different genesymbols, we used gene symbols that are present in geneplatform file containing 56MRC genes (33 genes for complexI, 4 genes for complex II, 8 genes for complex III, and 23 genesfor complex IV). To determine coexpression significance,56 MRC genes were selected as an integrated target seedfor further analysis. The hypergeometric distribution wasused to calculate the connection between the MRC genesand other genes in the whole coexpression network. Thisdiscrete probability distribution describes the probability of𝑘 successes in 𝑛 draws, without replacement, from a finitepopulation of size 𝑁 containing 𝐾 samples. For example,suppose that there are 𝐾 (56) MRC genes among𝑁 (20,000)genes in the genome. Gene X makes connections with 𝑘MRCs and 𝑛 connections with the genome. We define geneswith a𝑃 value less than 10−8 to be coexpression “friends” withMRCs.
2.3. Software Tools. The R platform (http://www.r-project.org/) was used for network generation and statistical cal-culations. Functional annotation of “friends” was carriedout using the web based tool PANTHER (http://www.pan-therdb.org/). GO enrichment and KEGG analysis were per-formed with DAVID (http://david.abcc.ncifcrf.gov/). DAVIDwas also used to analyze the functional annotations of thegene sets and modules. For pathway enrichment analysis ofthe MCR coexpressed genes, “GO BP,” “KEGG PATHWAY,”and “PANTHER PATHWAY” were selected. The 𝑃 valuesand a modified Fisher’s exact test were used to determine theenrichment of gene sets in ontology.
3. Results and Discussion
3.1. Coexpression of MRC Genes across Different Human Tis-sues. Two functional entities are involved in the generation ofATP by a process called oxidative phosphorylation located inthe mitochondrial inner membrane [3]. The first entity is theelectron transfer chain historically defined as four complexes(I, II, III, and IV), whereas the second entity is known asthe system that phosphorylates ADP to produce ATP [15].Among these complexes, complex I is the first and largest

International Journal of Genomics 3
Tissues-based networkCompounds based network
2323
Number of mitochondrialrespiratory genes coexpressed with MRCs
(a)
1308 114 124
Number of cellular genescoexpressed with MRCs
Tissues-based networkCompounds based network
(b)
Figure 1: Genes significantly coexpressed with MRCs in normal and chemically treated tissues. (a) Self-connections among mitochondrialrespiratory complexes. (b) Coexpressed cellular genes.
enzyme complex of the respiratory chain and is directlyinvolved in maintaining cellular reduction-oxidation (redox;NADH/NAD+) homeostasis [15]. The mammalian complexI is composed of at least 45 subunits and is the main sourceof reactive oxygen species, which are implicated in cell sig-naling, disease, and aging [16]. Its deficiency is the most fre-quently encountered in mitochondrial disorders [17], and thelarge number of genes coding for complex I subunits mightexplain why complex I deficiency is characterized by markedclinical and genetic heterogeneity [18]. Complex II is com-posed of four nuclear-encoded subunits, whereas complexIII is a complex of 11 subunits [19, 20]. Complex II receiveselectrons via FADH2 and transfers it to complex III thoughtCoenzyme Q 10. Then electrons are carried by cytochrome cto complex IV, which is composed of 19 subunits. This elec-tron transport is required for the generation of the transmem-brane proton gradient in inner mitochondrial membranewhich is utilized by complex V to convert ADP to ATP [21].Defect in any of MRCs leads to impaired ATP productionand results in a mitochondrial disease involving abnormalityof the central nervous system and eyes, renal, muscle, heat,and haematological system, as well as diverse age-relateddisorders including cancer and degenerative diseases [21–24].This indicates that these complexes have a significant impacton mitochondrial function. To investigate the connectivityof expression between MRCs and other genes, we gener-ated coexpression networks using expression datasets for 65human tissues. Prior genome-wide expression analyses havedemonstrated significant coexpression of MRC genes undervarious physiological conditions in several species [25]. Sim-ilarly, our large-scale analysis across different human tissuesreveals a coexpression cluster (46 out of 56 MRC genes) sig-nificantly enriched in genes belonging tomitochondrial com-plexes I to IV (Figure 1(a)). Of these, 37 genes belong to com-plex I, composed of 45 subunits [26]. Mitochondrial complex
I uses NADH as a cofactor for electron transfer and translo-cates protons across the innermitochondrial membrane [27].The genes NDUFB5 (𝑃 = 9.98𝐸 − 55) and NDUFA7 (𝑃 =1.14𝐸 − 54), two subunits of complex I, exhibited thelowest 𝑃 values (Supplementary Table S1 available online athttp://dx.doi.org/10.1155/2014/452891), indicating that thesegenes are significantly coexpressed with other MRCs. Inmany organisms, the complexes I, III, and IV can associateinto supercomplexes [28–30]. Among the various types ofassociation, the I + III
2
+ IV1−4
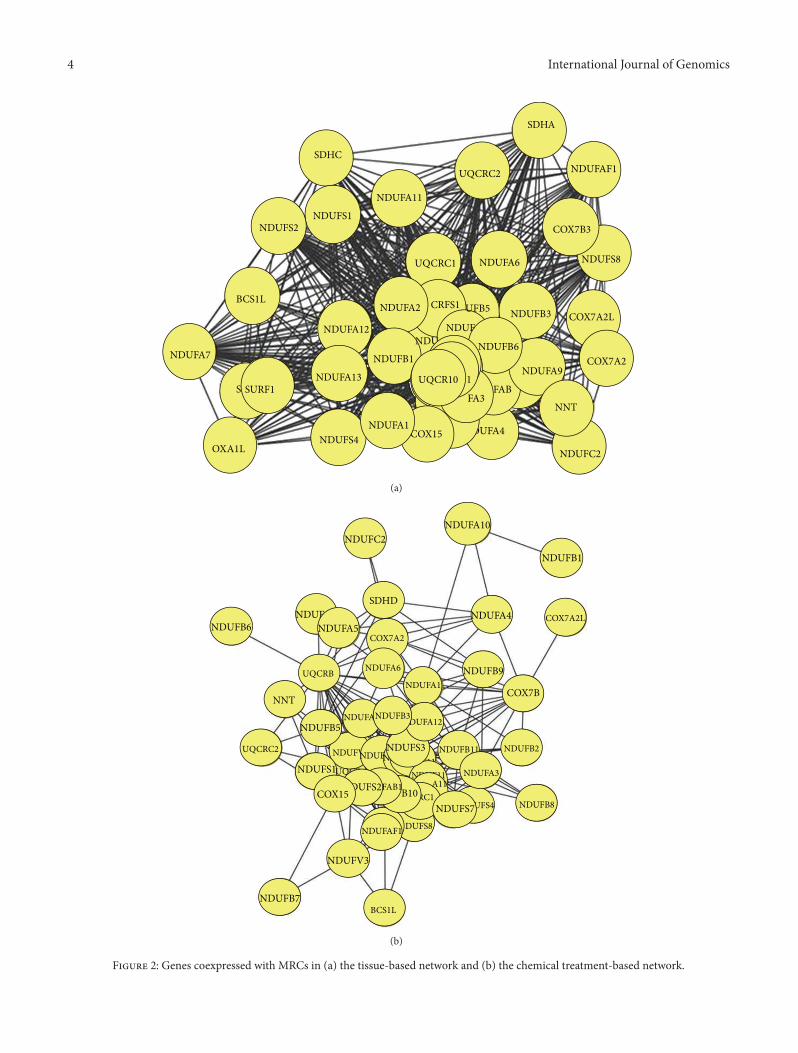
supercomplex or the respira-some is one of themost intriguing supercomplexes, because itconsidered theminimal unit to perform complete respirationfrom NADH to oxygen [29, 31]. This supercomplex has alsobeen detected by inhibitor titration in bovine mitochondria,suggesting that the two mitochondrial electron transfercomplexes specifically interact to form this supercomplex.In our coexpression network (Figure 2(a)), NDUFB5 iscoexpressed with SDHC of complex II and UQCRC2 ofcomplex III. In addition, UQCRC1 inmitochondrial complexIII is significantly coexpressed with the complex I subunitsNDUFA13, NDUFAF1, and NDUFS7. It has been shown thatthe absence in complex III results in a dramatic loss ofcomplex I in humans, and complex I is necessary for fullyassembled complex III [32–34], indicating that supercomplexformation is necessary for assembly and stability of individualcomponents [35]. Taken together, these results suggest thatcomplex I is tightly coexpressed with complex III comparedto other complexes and that this coexpression might berequired for maintaining the supercomplex.
3.2. Coexpression ofMRCGenes in Chemically Treated Tissues.Drug-induced liver injury is a common side effect of certainpharmaceutical therapies. Drugs can be metabolized intoelectrophilic chemicals or free radicals, which have direct
4 International Journal of Genomics
SDHA
SDHCNDUFAF1
NDUFS8NDUFA6
COX7B3
COX7A2L
COX7A2
NDUFC2
OUFA4
NDUFA9NDUFA13
NDUFA12
NDUFA2
NDUFS4
S SURF1
OXA1L
NDUFA7
BCS1L
NDUFS2NDUFS1
NDUFA11
UQCRC2
UQCRC1
NDUFB1
NDUFB3
NDUFB6
NDUF
UFB5
NDU
FABNNT
CRFS1
1UQCR10
FA3
COX15NDUFA1
(a)
NDUFB1
NDUFB2
NDUFB8
NDUFB7
NDUFB9
NDUFB6
NDUFV3
NDUFA10
NDUFA4
NDUFA1
NDUFA6
NDUFC2
COX7A2
BCS1L
UQCRC2
UQCRB
UQCR
COX7BNNT
SDHDNDUF
NDUFA5
NDUFAF1
NDUFB11
DUFS8
UFS4
NDUFS1
NDUFB5NDUFA
NDUFVNDUFND NDUF11
B10
COX7A2L
NDUFA3
NDUFS3
NDUF11
RC1FAB1 A11NDUFS2
COX15 B10
NDUFA12NDUFB3
NDUFS7
(b)
Figure 2: Genes coexpressed with MRCs in (a) the tissue-based network and (b) the chemical treatment-based network.

International Journal of Genomics 5
effects upon mitochondrial proteins. Damage to mitochon-drial proteins decreases their affinity for substrates, resultingin mitochondrial dysfunction [36, 37]. Therefore, under-standing drug-induced mitochondrial toxicity is critical forthe development of safe drugs. To investigate the effectof chemical toxicity on the coexpression network of MRCgenes in liver, transcription profiles of human hepatocytestreated with 130 chemical compounds were used as input.Stress-related stimuli induce the remodeling of coexpressionnetworks, resulting in the large-scale alteration of cellularfunction, involving a shift of resources from growth andmetabolism to protection and maintenance [38, 39]. Asshown in Figure 1(b), coexpression of MRC genes in treatedhuman hepatocytes was significantly lower than in non-treated human tissues. NDUFAF4, a subunit of complex I,exhibited significant coexpression with other MRCs undernormal conditions (𝑃 = 2.31𝐸−54; Supplementary Table S1).However, the 𝑃 value between NDUFAF4 and other MRCsincreased substantially (𝑃 = 0.209) after chemical treatment,indicating a major change in the coexpression network.UQCRC2, a complex III subunit, is also tightly connectedwith other MRCs in normal tissue (𝑃 = 1.16𝐸 − 52). Again,this connection disappeared under chemical treatment (𝑃 =0.001). A similar loss of coexpression was observed for23 MRC genes, although the remaining 23 genes (19 fromcomplex I, 2 from complex III, and 2 from complex IV)were still highly coexpressed (Figure 2(b)). NDUFA1 is coex-pressed with complex I subunit NDUFA4 and complex IIIsubunit UQCRB. One possible explanation for these changesin coexpression in response to chemical treatment is thatthese compounds directly or indirectly influence MRC geneexpression. Indeed, differential expression of mitochondrialgenes has been induced by manipulating the agonal-pH stateand through drug treatment [40, 41]. Furthermore, somecompounds might modulate cellular redox levels or dissipatethe mitochondrial membrane gradient by facilitating anionflux across the mitochondrial inner membrane, as suggestedby Toogood [42], resulting in remodeling of the coexpressionnetwork.
3.3. Coexpression of MRC and Cellular Genes. In normaltissue, 1,422 genes are coexpressed significantly with MRCgenes. Of these, coexpression of 1,308 genes was observedin normal tissue but not in chemically treated tissue. Theremaining 114 genes are coexpressed in both normal andtreated tissues. To identify the function of these 114 genes,we analyzed their associated GO terms using the onlinePANTHER tool (http://www.pantherdb.org/geneListAnal-ysis.do). A total of 51 (44.7%) genes were assigned to“metabolic process” (Figure 3(a)), indicating that this processis closely related tomitochondrial function. “Immune systemprocess” and “apoptosis” were represented by 4.26% and1.42% of these genes, respectively. The 1,308 genes thatare coexpressed only in normal tissues were also cate-gorized using PANTHER (Figure 3(b)). Of these, 26.56%were assigned to “metabolic processes” and 14.16% to “cel-lular processes.” “Immune system process” and “apoptosis”
were assigned to 4.84% and 2.50% of these genes, respec-tively. AIFM1 (apoptosis-inducing factor, mitochondrion-associated 1) ENDOG (endonuclease G) is involved inintrinsic (mitochondria-associated) pathway for cancer cellapoptosis, for example, tightly coexpressed with MRC genes(𝑃 = 9.09𝐸−29 and 1.71𝐸−39, resp.) in normal tissue, but thiscoexpression disappeared in treated tissues (SupplementaryTable S1). AIFM1 is known to be important for the assemblyand stability of complexes I and III [43]. In addition, themutation or inhibition of MRC is widespread in cancer andintimately connected to apoptosis resistance [44], indicatingthat the MRC plays as a modulator of apoptosis for thetreatment of cancer [45, 46]. Coexpression among MRCgenes and the mechanistic target of rapamycin (mTOR)gene also disappeared after chemical treatment (𝑃 = 0.99;Supplementary Table S1). Disruption of the mTOR complexby treatment with the mTOR inhibitor rapamycin reducesmitochondrial membrane potential, oxygen consumption,and ATP synthetic capacity, indicating that formation ofthe mTOR complex is required for overall mitochondrialactivity [47]. Taken together, these findings indicate thatcoexpression of MRC genes with cellular genes such asAIFM1 might be required to maintain the mitochondrialcomplexes. Furthermore, the disruption of this coexpressionby chemical treatment suggests that similar disruptionsmight be responsible for mitochondria-related side effects ofpharmaceuticals.
In contrast to the coexpression network in normal tissues,only 238 genes were significantly enriched in chemicallytreated tissues. Of these, 114 are coexpressed in normaltissues, whereas 124 are coexpressed only in treated tissues.This finding suggests that chemical treatment alters the coex-pression network between MRC genes and cellular genes.Of the genes coexpressed only in treated tissues, almost half(48.91%) were associated with the term “metabolic process”(Figure 3(c)). The gene for 2,4-dienoyl CoA reductase 2(DECR2), an auxiliary enzyme in the mitochondrial beta-oxidation of unsaturated fatty acids, is coexpressed witha 𝑃 value of 7.49𝐸 − 8 (Supplementary Table S1). Three acyl-CoA thioesterases (ACOTs), ACOT11 (𝑃 = 5.51𝐸 − 42),ACOT13 (𝑃 = 1.14𝐸 − 26), and ACOT2 (𝑃 = 1.83𝐸 − 14),involved in peroxisomal lipid metabolism [48], were highlycoexpressed with MRCs in normal tissue, whereas ACOT8(𝑃 = 1.75𝐸 − 08) is coexpressed with MRCs in treated tissues(Supplementary Table S1).
Coexpression network, which is the reconstruction ofbiological networks from high-throughput data, can be usedto identify higher-level features of gene-gene relationshipsbased on graph theoretic considerations such as clusteringcoefficient or node degree [49, 50]. However, large-scaleanalyses only provide clues that help in forming a hypothesis[51]. Although the differences among coexpression networks(Supplementary Table S1) should help identify and priori-tize candidate genes to determine the effects of drugs onmitochondria, further study is required to determine therelationship between the coexpressed genes and specificmitochondrial functions.

6 International Journal of Genomics
0.38%2.46%
3.50% 1.42% 0.66%2.46% 2.84%
2.08%6.72%
3.50%
16.19%
4.26%
44.70%
8.81%
(a)
0.11%
1.44%3.41%
6.97%1.86%
8.41%
26.56%
8.94%
8.46%
4.90%
4.42%
2.66%0.21%4.84%0.16%
2.50%
14.16%
(b)
Apoptosis (GO:0006915)Cell adhesion (GO:0007155)Cell communication (GO:0007154)Cell cycle (GO:0007049)Cellular component organization (GO:0016043)
Generation of precursor metabolites and energy (GO:0006091)Homeostatic process (GO:0042592)Immune system process (GO:0002376)Localization (GO:0051179)Metabolic process (GO:0008152)Regulation of biological process (GO:0050789)Reproduction (GO:0000003)Response to stimulus (GO:0050896)System process (GO:0003008)Transport (GO:0006810)
Cellular process (GO:0009987)
5.52%5.52%
7.11%2.34%
1.59% 6.27%3.93%
0.75%
0.75%3.18%
7.86%
6.27%
48.91% Developmental process (GO:0032502)
(c)
Figure 3: PANTHER analysis of the functional categories of genes coexpressed with MRCs. (a) Genes coexpressed in both normal tissuesand chemically treated tissues. (b) Genes coexpressed with MRCs only in the tissue-based network. (c) Genes coexpressed with MRCs onlyin the chemically treated tissue.
3.4. Functional Enrichment Analysis of MRC “Friends”. Toinvestigate the biological processes represented by genessignificantly coexpressed with MRC genes in normal tissuecompared to treated tissues, we performed GO term enrich-ment analyses using the functional annotation tool DAVID(http://david.abcc.ncifcrf.gov/). For normal tissue, annota-tions for 1,308 genes were enriched in 17 terms, including“muscle system process,” “cellular metabolic process,” and“carboxylic acid metabolic process” (Table 1). For chemicallytreated tissues, GO term enrichment of 124 genes coexpressedwith MRC genes found only ribosome biogenesis terms,such as “translational elongation and translation” (Table 2).A sufficient supply of ATP is required to maintain the con-tractile function of muscle [52], suggesting the importanceofmitochondria duringmuscle contraction.Myosin providesenergy and plays a vital role in muscle contraction. Myosingenes could be divided into several classifications [53], such as
myosin heavy chain 1 (MYH1), myosin light chain 3 (MYL3),and myosin binding protein C2 (MYBPC2). Mutations inmyosin genes lead to hypertrophic cardiomyopathy [54].These findings indicate that muscle system closely interactswith MRC genes for improving mitochondrial function.
For the GO term “fatty acid metabolic process,” 39 geneswere identified as “friends” of MRCs. Of these, carnitinepalmitoyltransferase 2 (CPT2) localizes to the inner leaflet ofthe inner mitochondrial membrane, where it oxidizes long-chain fatty acids to produce substrates for the mitochondrialfatty acid beta-oxidation pathway [55]. Most of the genesrequired for mitochondrial biogenesis are controlled byDNA-binding transcription factors and coregulators [56].Peroxisome proliferator-activated receptor gamma coactiva-tor 1-alpha (PPARGC1A) is a transcriptional coactivator thatregulates various metabolic processes including mitochon-drial biogenesis and respiration [57].Therefore, coexpression

International Journal of Genomics 7
Table 1: GO enrichment of genes coexpressed with MRCs only in normal tissue transcriptome.
Term Count Pop 𝑃 value Genes
Muscle system process 68 168 1.15𝐸 − 35
MYBPC2, TNNC2, MYBPC1, TNNC1, GNA11, MYBPC3,ANKRD2, PGAM2, KCNJ12, TTN, DES, DYSF, CHRNA1,MAP2K6, MB, ACTA1,MYH1, CRYAB, MYH2, TBCE, MYH4,MYLK2, ACTN2, PDE4D, MYH7, MYH6, CACNG1, MYH8,TNNT2, TRDN, TNNT3, TNNT1, PSEN2, RYR1, SMPX, RYR2,KBTBD10, STBD1, CASQ2, SGCA, CLCN1, ALDOA, MYL7,MYL4, TCAP, MYL3, MYL1, DAG1, MYOT, MYOM2, CKMT2,CAMK2D, MYOM1, SCN5A, HRC, ACTC1, MSTN, TRIM63,TNNI3, HOMER1, CACNA1S, TNNI2, SLC6A8, CHRNB4,GAMT, CHRNB1, SCN4A, SNTA1
Cellular ketone metabolicprocess 106 567 7.46𝐸 − 23
Carboxylic acid metabolicprocess 99 556 8.48𝐸 − 20
Oxoacid metabolic process 99 556 8.48𝐸 − 20
Glucose metabolic process 41 153 2.39𝐸 − 14
PRKAG3, ALDOA, LDHA, PHKA1, PRKAG2, PGAM2, OGDH,PDHB, ACN9, HIBADH, PPP1R3C, PPP1R1A, GYS1, ENO3,PDHA1, GAPDH, AGL, PDK2, WDTC1, CRYAB,PHKG1, PDK4, EPM2A, BAD, DLAT, PPP1R3A, PFKM,FBP2, PPARGC1A, PPP1CB, GPI, PPP1R2, GBE1, PYGM,PGM1, GPT, PGK1, DCXR, UGP2, MDH2, MDH1
Hexose metabolic process 43 192 3.64𝐸 − 12
Acetyl-CoA metabolicprocess 17 31 1.39𝐸 − 11
Fatty acid metabolicprocess 39 198 2.11𝐸 − 09
PRKAG3, ACOX1, PPARA, TYRP1, ACADSB, CYP2J2,PTGES2, ECH1, CPT2, PRKAG1, PRKAG2, ACOT2,NDUFAB1, ECHS1, HADHA, HADHB, PEX7, ACSL1,ACOT11, ETFDH, GNPAT, PRKAA2, HADH, CPT1B, LPL,PLA2G15, ACADM, ACADS, MCAT, PRKAB2, CRAT,PPARGC1A, C9ORF3, ACADVL, UCP3, ANKRD23, MLYCD,FABP3, MECR
Table 2: GO enrichment of genes coexpressed with MRCs only in chemically treated tissue.
Term Count Pop hits 𝑃 value Genes
Translational elongation 12 101 7.51𝐸 − 11RPS19, RPL32, RPL14, RPS29, RPL22, FAU,RPS10, RPL38, RPL12, RPS21, UBA52, RPL29
Translation 16 331 5.86𝐸 − 09
RPL14, MRPS21, RPL38, RPL29, MRPL11,RPS19, RPL32, RPS29, EIF3H, RPL22, FAU,RPS10, MRPL48, RPL12, RPS21, UBA52
Metabolic process 73 7647 1.98𝐸 − 05
Protein metabolic process 36 2812 1.18𝐸 − 04
Primary metabolic process 66 6923 1.60𝐸 − 04
Macromolecule metabolic process 56 5710 6.11𝐸 − 04
of MRC genes with functional genes such as CPT2 andPPARGC1A might be required for the function and mainte-nance of mitochondria.
3.5. Coexpression of MRC Genes in Neurodegenerative Dis-ease Pathways. Several molecular, cellular, biochemical, andanimal model studies have suggested that mitochondrialdysfunction closely relates to the progression of severalneurodegenerative diseases [58]. Using KEGG pathwayenrichment analysis, we found that 19 MRC genes (41%
of MRC genes in the coexpression network), belongingto complexes I to IV, are coregulated with Parkinson’s,Alzheimer’s, and Huntington’s disease pathways (Table 3),indicating the importance of MRCs in neurodegenerativedisease pathways. In Parkinson’s disease, PTEN-inducedputative kinase 1 (PINK1), a mitochondrial serine/threonine-protein kinase, was found to be a coexpression “friend” withMRC genes in normal tissue (𝑃 = 1.28𝐸 − 13) but notin treated tissues (𝑃 = 0.35) (Supplementary Table S1).PINK1 loss-of-function causes mitochondrial dysfunction

8 International Journal of Genomics
Table 3: KEGG enrichment analysis of genes coexpressed with MRCs.
Term Count Pop 𝑃 value Genes
Parkinson’s disease 40 128 9.27𝐸 − 15
UQCRC2, ATP5D, NDUFB4, NDUFB6, NDUFB7,UBE2G1, CYC1, NDUFAB1, PINK1, ATP5G2,UQCRFS1, COX5A, NDUFB1, NDUFB2, UQCR11,ATP5O, ATP5H, NDUFS1, ATP6, NDUFA5,NDUFA2, COX7A1, SLC25A4, NDUFA6, CYCS,NDUFC2, ATP5F1, COX4I1, NDUFC1, NDUFA10,VDAC2, VDAC3, VDAC1, SDHA, NDUFV3, PPID,NDUFV2, SDHD, COX6A2, ATP5A1
Hypertrophiccardiomyopathy(HCM)
32 85 2.33𝐸 − 14
PRKAG3, MYL2, TNNC1, MYL3, PRKAG1,MYBPC3, PRKAG2, CACNB1, DAG1, TPM2, TTN,TPM3, DES, DMD, ITGB6, PRKAA2, ACTC1,CACNG6, PRKAB2, MYH7, MYH6, CACNG1,TNNI3, CACNA1S, TNNT2, ATP2A2, SGCG, ITGA7,SGCD, RYR2, SGCA, SGCB
Alzheimer’s disease 41 163 1.03𝐸 − 11
UQCRC2, ATP5D, NDUFB4, NDUFB6, NDUFB7,CYC1, NDUFAB1, ATP5G2, UQCRFS1, COX5A,NDUFB1, NDUFB2, UQCR11, CALML6, ATP5O,ATP5H, GAPDH, NDUFS1, ATP6, NDUFA5, LPL,NDUFA2, COX7A1, NDUFA6, CYCS, NDUFC2,ATP5F1, COX4I1, BAD, NDUFC1, NDUFA10,CACNA1S, SDHA, NDUFV3, ATP2A2, ATP2A1,NDUFV2, SDHD, PSEN2, COX6A2, ATP5A1
Dilatedcardiomyopathy 30 92 1.15𝐸 − 11
MYL2, TNNC1, MYL3, MYBPC3, CACNB1, DAG1,TTN, TPM2, TPM3, DES, DMD, ITGB6, PRKACA,ACTC1, CACNG6, MYH7, MYH6, CACNG1, TNNI3,CACNA1S, TNNT2, ADCY9, ATP2A2, SGCG, PLN,ITGA7, SGCD, RYR2, SGCA, SGCB
Huntington’s disease 43 180 1.80𝐸 − 11
UQCRC2, ATP5D, NDUFB4, POLR2E, NDUFB6,CLTB, NDUFB7, POLR2LL, CYC1, NDUFAB1,ATP5G2, UQCRFS1, COX5A, NDUFB1, NDUFB2,UQCR11, ATP5O, ATP5H, NDUFS1, ATP6, NDUFA5,NDUFA2, COX7A1, SLC25A4, NDUFA6, CYCS,ATP5F1, NDUFC2, COX4I1, NDUFC1, NDUFA10,VDAC2, VDAC3, PPARGC1A, VDAC1, SDHA,NDUFV3, PPID, NDUFV2, SDHD, COX6A2,ATP5A1, CLTCL1
and Parkinsonism [59]. In addition, the 𝛼1 subunit ofdihydropyridine receptor (CACNA1S), calmodulin-like 6(CALML6), presenilin protein 2 (PSEN2), BCL2-associatedagonist of cell death (BAD), and lipoprotein lipase (LPL)in Alzheimer’s disease pathway are significantly coexpressedwith MRC genes (Table 3), whereas clathrin light chain B(CLTB), clathrin heavy polypeptide-like 1 (CLTCL1), DNA-directed RNA polymerase II subunits (POLR2E, POLR2L),and PPARGC1A were identified as coexpression “friends”with MRC genes in Huntington’s disease pathway. Thesefindings indicate that MRC genes are directly or indirectlylinked with neurodegenerative disease pathways. Mitochon-drial dysfunction causes not only neurodegenerative diseasesbut also hypertrophic and dilated cardiomyopathy [60].MRC “friend” genes were enriched in the hypertrophic anddilated cardiomyopathy pathways in normal tissue (Table 3),whereas coexpression again disappeared after treatment withchemicals. KEGG pathway enrichment analysis thus suggeststhat the coexpression network revealed by using MRC genes
as seed genes provides a possible link between mitochondriaand various disease pathways.
4. Conclusion
In this study, we have compared the networks of genescoexpressed with MRC genes in normal and chemicallytreated tissues. We find a differential distribution of coex-pression after chemical treatment.These differences might bemediated by chemical-related stimuli, suggesting that coex-pression network analysis can provide helpful informationfor understanding side effects of drugs on mitochondrialfunctions.
Conflict of Interests
The authors declare that there is no conflict of interestsregarding the publication of this paper.

International Journal of Genomics 9
Authors’ Contribution
Cong Chen and Tae Kyung Hyun contributed equally to thispaper.
Acknowledgments
This original study was partly supported by the NationalNatural Science Foundation of China (Key Program, no.31200620), China Postdoctoral Science Foundation (CPSF;no. 2013M540739), Shaanxi Postdoctoral Science Founda-tion, and Xi’an Jiaotong University (985 and 211 Projects).
References
[1] M. P. Yaffe, “The machinery of mitochondrial inheritance andbehavior,” Science, vol. 283, no. 5407, pp. 1493–1497, 1999.
[2] D.D.Newmeyer and S. Ferguson-Miller, “Mitochondria: releas-ing power for life and unleashing themachineries of death,”Cell,vol. 112, no. 4, pp. 481–490, 2003.
[3] B.Muster,W.Kohl, I.Wittig et al., “Respiratory chain complexesin dynamic mitochondria display a patchy distribution in lifecells,” PLoS ONE, vol. 5, no. 7, Article ID e11910, 2010.
[4] J. S. Carew and P. Huang, “Mitochondrial defects in cancer,”Molecular Cancer, vol. 1, article 9, 2002.
[5] H. Lu, V. Koshkin, E. M. Allister, A. V. Gyulkhandanyan,and M. B. Wheeler, “Molecular and metabolic evidence formitochondrial defects associated with 𝛽-cell dysfunction in amouse model of type 2 diabetes,” Diabetes, vol. 59, no. 2, pp.448–459, 2010.
[6] S. Ohsawa, Y. Sato, M. Enomoto, M. Nakamura, A. Betsumiya,and T. Igaki, “Mitochondrial defect drives non-autonomoustumour progression through Hippo signalling in Drosophila,”Nature, vol. 490, no. 7421, pp. 547–551, 2012.
[7] J. Labbadia and R. I. Morimoto, “Huntington’s disease: under-lyingmolecular mechanisms and emerging concepts,” Trends inBiochemical Sciences, vol. 38, no. 8, pp. 378–385, 2013.
[8] D. J. M. Fernandez-Ayala, S. Chen, E. Kemppainen, K. M. C.O’Dell, and H. T. Jacobs, “Gene expression in a Drosophilamodel ofmitochondrial disease,” PLoSONE, vol. 5, no. 1, ArticleID e8549, 2010.
[9] V. S. Dhillon and M. Fenech, “Mutations that affect mitochon-drial functions and their association with neurodegenerativediseases,”Mutation Research, vol. 759, pp. 1–13, 2014.
[10] S. Movahedi, M. van Bel, K. S. Heyndrickx, and K. Vandepoele,“Comparative co-expression analysis in plant biology,” Plant,Cell and Environment, vol. 35, no. 10, pp. 1787–1798, 2012.
[11] X. Han, C. Chen, T. K. Hyun, R. Kumar, and J. Y. Kim,“Metabolic module mining based on independent componentanalysis in Arabidopsis thaliana,” Molecules and Cells, vol. 34,no. 3, pp. 295–304, 2012.
[12] N. J. Hudson, A. Reverter, Y. H. Wang, P. L. Greenwood, and B.P. Dalrymple, “Inferring the transcriptional landscape of bovineskeletal muscle by integrating co-expression networks,” PLoSONE, vol. 4, no. 10, Article ID e7249, 2009.
[13] S. van Dam, R. Cordeiro, T. Craig, J. van Dam, S. H. Wood,and J. P. de Magalhaes, “GeneFriends: an online co-expressionanalysis tool to identify novel gene targets for aging andcomplex diseases,” BMC Genomics, vol. 13, no. 1, article 535,2012.
[14] F. Azuaje, L. Zhang, C. Jeanty, S. Puhl, S. Rodius, and D. R.Wagner, “Analysis of a gene co-expression network establishesrobust association between Col5a2 and ischemic heart disease,”BMCMedical Genomics, vol. 6, no. 1, article 13, 2013.
[15] A. Mourier and N. G. Larsson, “Tracing the trail of protonsthrough complex I of the mitochondrial respiratory chain,”PLoS Biology, vol. 9, no. 8, Article ID e1001129, 2011.
[16] M. P. Murphy, A. Holmgren, N. Larsson et al., “Unraveling thebiological roles of reactive oxygen species,”CellMetabolism, vol.13, no. 4, pp. 361–366, 2011.
[17] H. Pagniez-Mammeri, S. Loublier, A. Legrand, P. Benit, P.Rustin, and A. Slama, “Mitochondrial complex I deficiencyof nuclear origin. I. Structural genes,” Molecular Genetics andMetabolism, vol. 105, no. 2, pp. 163–172, 2012.
[18] E. Fassone and S. Rahman, “Complex I deficiency: clinical fea-tures, biochemistry and molecular genetics,” Journal of MedicalGenetics, vol. 49, no. 9, pp. 578–590, 2012.
[19] A. Benchoua, Y. Trioulier, D. Zala et al., “Involvement ofmitochondrial complex II defects in neuronal death producedby N-terminus fragment of mutated huntingtin,” MolecularBiology of the Cell, vol. 17, no. 4, pp. 1652–1663, 2006.
[20] P. Gaignard, M. Menezes, M. Schiff et al., “Mutations in CYC1,encoding cytochrome c1 subunit of respiratory chain complexIII, cause insulin-responsive hyperglycemia,” The AmericanJournal of Human Genetics, vol. 93, no. 2, pp. 384–389, 2013.
[21] S. Jain-Ghai, J. M. Cameron, A. Al Maawali et al., “Complex IIdeficiency—a case report and review of the literature,”AmericanJournal of Medical Genetics A, vol. 161, no. 2, pp. 285–294, 2013.
[22] D. C. Wallace, “Mitochondrial diseases in man and mouse,”Science, vol. 283, no. 5407, pp. 1482–1488, 1999.
[23] E. J. Lesnefsky and C. L. Hoppel, “Oxidative phosphorylationand aging,” Ageing Research Reviews, vol. 5, no. 4, pp. 402–433,2006.
[24] F. Scaglia, J. A. Towbin, W. J. Craigen et al., “Clinical spectrum,morbidity, and mortality in 113 pediatric patients with mito-chondrial disease,” Pediatrics, vol. 114, no. 4, pp. 925–931, 2004.
[25] H. K. Lee, A. K. Hsu, J. Sajdak, J. Qin, and P. Pavlidis,“Coexpresion analysis of human genes across many microarraydata sets,” Genome Research, vol. 14, no. 6, pp. 1085–1094, 2004.
[26] C. M. Sue and E. A. Schon, “Mitochondrial respiratory chaindiseases and mutations in nuclear DNA: a promising start?”Brain Pathology, vol. 10, no. 3, pp. 442–450, 2000.
[27] A. F. Santidrian, A.Matsuno-Yagi, M. Ritland et al., “Mitochon-drial complex I activity and NAD+/NADH balance regulatebreast cancer progression,”The Journal of Clinical Investigation,vol. 123, no. 3, pp. 1068–1081, 2013.
[28] R. Acın-Perez, P. Fernandez-Silva, M. L. Peleato, A. Perez-Martos, and J. A. Enriquez, “Respiratory active mitochondrialsupercomplexes,” Molecular Cell, vol. 32, no. 4, pp. 529–539,2008.
[29] E. Lapuente-Brun, R. Moreno-Loshuertos, R. Acin-Perez etal., “Supercomplex assembly determines electron flux in themitochondrial electron transport chain,” Science, vol. 340, no.6140, pp. 1567–1570, 2013.
[30] C. Blanchi, M. L. Genova, G. P. Castelli, and G. Lenaz, “Themitochondrial respiratory chain is partially organized in asupercomplex assembly: kinetic evidence using flux controlanalysis,” The Journal of Biological Chemistry, vol. 279, no. 35,pp. 36562–36569, 2004.
[31] N. V.Dudkina,M. Kudryashev,H. Stahlberg, and E. J. Boekema,“Interaction of complexes I, III, and IV within the bovine

10 International Journal of Genomics
respirasome by single particle cryoelectron tomography,” Pro-ceedings of the National Academy of Sciences of the United Statesof America, vol. 108, no. 37, pp. 15196–15200, 2011.
[32] R. Acın-Perez, M. P. Bayona-Bafaluy, P. Fernandez-Silva et al.,“Respiratory complex III is required to maintain complex I inmammalian mitochondria,” Molecular Cell, vol. 13, no. 6, pp.805–815, 2004.
[33] C. Ugalde, R. J. R. J. Janssen, L. P. van den Heuvel, J. A.M. Smeitink, and L. G. J. Nijtmans, “Differences in assemblyor stability of complex I and other mitochondrial OXPHOScomplexes in inherited complex I deficiency,”HumanMolecularGenetics, vol. 13, no. 6, pp. 659–667, 2004.
[34] E. L. Blakely, A. L. Mitchell, N. Fisher et al., “A mitochon-drial cytochrome b mutation causing severe respiratory chainenzyme deficiency in humans and yeast,” FEBS Journal, vol. 272,no. 14, pp. 3583–3592, 2005.
[35] N.V.Dudkina, R.Kouril, K. Peters,H. Braun, andE. J. Boekema,“Structure and function of mitochondrial supercomplexes,”Biochimica et Biophysica Acta, vol. 1797, no. 6-7, pp. 664–670,2010.
[36] J. Neustadt and S. R. Pieczenik, “Medication-induced mito-chondrial damage and disease,” Molecular Nutrition and FoodResearch, vol. 52, no. 7, pp. 780–788, 2008.
[37] M. V. Tsiper, J. Sturgis, L. V. Avramova et al., “Differentialmitochondrial toxicity screening and multi-parametric dataanalysis,” PLoS ONE, vol. 7, no. 10, Article ID e45226, 2012.
[38] P. V. Gopalacharyulu, V. R. Velagapudi, E. Lindfors, E. Halperin,and M. Oresic, “Dynamic network topology changes in func-tional modules predict responses to oxidative stress in yeast,”Molecular BioSystems, vol. 5, no. 3, pp. 276–287, 2009.
[39] S. Lehtinen, F. X. Marsellach, S. Codlin et al., “Stress inducesremodelling of yeast interaction and co-expression networks,”Molecular BioSystems, vol. 9, no. 7, pp. 1697–1707, 2013.
[40] M. P. Vawter, H. Tomita, F. Meng et al., “Mitochondrial-related gene expression changes are sensitive to agonal-pH state:implications for brain disorders,” Molecular Psychiatry, vol. 11,no. 7, pp. 663–679, 2006.
[41] T. Lee, M. G. Manjanatha, A. Aidoo et al., “Expression anal-ysis of hepatic mitochondria-related genes in mice exposedto acrylamide and glycidamide,” Journal of Toxicology andEnvironmental Health A, vol. 75, no. 6, pp. 324–339, 2012.
[42] P. L. Toogood, “Mitochondrial drugs,” Current Opinion inChemical Biology, vol. 12, no. 4, pp. 457–463, 2008.
[43] L. Delavallee, L. Cabon, P. Galan-Malo, H. K. Lorenzo, and S. A.Susin, “AIF-mediated caspase-independent necroptosis: a newchance for targeted therapeutics,” IUBMB Life, vol. 63, no. 4, pp.221–232, 2011.
[44] A. Lemarie and S. Grimm, “Mitochondrial respiratory chaincomplexes: apoptosis sensors mutated in cancer?” Oncogene,vol. 30, no. 38, pp. 3985–4003, 2011.
[45] J. Q. Kwong, M. S. Henning, A. A. Starkov, and G. Manfredi,“The mitochondrial respiratory chain is a modulator of apop-tosis,” The Journal of Cell Biology, vol. 179, no. 6, pp. 1163–1177,2007.
[46] S. Fulda, “Exploiting mitochondrial apoptosis for the treatmentof cancer,”Mitochondrion, vol. 10, no. 6, pp. 598–603, 2010.
[47] S. M. Schieke, D. Phillips, J. P. McCoy Jr. et al., “Themammaliantarget of rapamycin (mTOR) pathway regulates mitochondrialoxygen consumption and oxidative capacity,” The Journal ofBiological Chemistry, vol. 281, no. 37, pp. 27643–27652, 2006.
[48] M. C. Hunt, K. Solaas, B. Frode Kase, and S. E. H. Alexson,“Characterization of an acyl-CoA thioesterase that functions asa major regulator of peroxisomal lipid metabolism,” Journal ofBiological Chemistry, vol. 277, no. 2, pp. 1128–1138, 2002.
[49] M. Mistry, J. Gillis, and P. Pavlidis, “Meta-analysis of genecoexpression networks in the post-mortem prefrontal cortexof patients with schizophrenia and unaffected controls,” BMCNeuroscience, vol. 14, article 105, 2013.
[50] R. de Smet and K. Marchal, “Advantages and limitations of cur-rent network inference methods,”Nature Reviews Microbiology,vol. 8, no. 10, pp. 717–729, 2010.
[51] M. Y. Hirai, “A robust omics-based approach for the iden-tification of glucosinolate biosynthetic genes,” PhytochemistryReviews, vol. 8, no. 1, pp. 15–23, 2009.
[52] R. K.Dash, B.M. Bell,M. J. Kushmerick, and P.Vicini, “Estimat-ing in vitro mitochondrial oxygen consumption during musclecontraction and recovery: a novel approach that accounts fordiffusion,” Annals of Biomedical Engineering, vol. 33, no. 3, pp.343–355, 2005.
[53] J. R. Sellers, “Myosins: a diverse superfamily,” Biochimica etBiophysica Acta, vol. 1496, no. 1, pp. 3–22, 2000.
[54] E. M. McNally, J. R. Golbus, and M. J. Puckelwartz, “Geneticmutations andmechanisms in dilated cardiomyopathy,” Journalof Clinical Investigation, vol. 123, no. 1, pp. 19–26, 2013.
[55] S. Violante, L. IJlst, H. Te Brinke et al., “Carnitine palmi-toyltransferase 2 and carnitine/acylcarnitine translocase areinvolved in the mitochondrial synthesis and export of acylcar-nitines,” FASEB Journal, vol. 27, no. 5, pp. 2039–2044, 2013.
[56] C. A. Piantadosi and H. B. Suliman, “Transcriptional control ofmitochondrial biogenesis and its interface with inflammatoryprocesses,” Biochimica et Biophysica Acta, vol. 1820, no. 4, pp.532–541, 2012.
[57] J. St-Pierre, S. Drori, M. Uldry et al., “Suppression of reactiveoxygen species and neurodegeneration by the PGC-1 transcrip-tional coactivators,” Cell, vol. 127, no. 2, pp. 397–408, 2006.
[58] P. H. Reddy, “Role of mitochondria in neurodegenerativediseases: mitochondria as a therapeutic target in Alzheimer'sdisease,” CNS Spectrums, vol. 14, pp. 8–13, 16–18, 2009.
[59] D. P. Narendra, S. M. Jin, A. Tanaka et al., “PINK1 is selectivelystabilized on impaired mitochondria to activate Parkin,” PLoSBiology, vol. 8, no. 1, Article ID e1000298, 2010.
[60] D. E. Meyers, H. I. Basha, and M. K. Koenig, “Mitochon-drial cardiomyopathy: pathophysiology, diagnosis, and man-agement,” Texas Heart Institute Journal, vol. 40, pp. 385–394,2013.
Related Documents


![Integrating Coexpression Networks with GWAS to Prioritize ... · LARGE-SCALE BIOLOGY ARTICLE Integrating Coexpression Networks with GWAS to Prioritize Causal Genes in Maize[OPEN]](https://static.cupdf.com/doc/110x72/5f51aba08bfbac6bef7784c2/integrating-coexpression-networks-with-gwas-to-prioritize-large-scale-biology.jpg)