Co-evolution of resource trade-offs driving species interactions in a host-parasite network: An exploratory model C.F. M c Quaid a,* , N.F.Britton a a Department of Mathematical Sciences, University of Bath, Claverton Down, Bath, BA2 7AY, UK Abstract Patterns of nestedness and specialization asymmetry, where specialist species interact mainly with generalists while generalists interact with both generalists and specialists, are often observed in mutualistic and antagonistic bi-partite ecological networks. These have been explained in terms of the relative abundance of species, using a null model that assigns links in proportion to abundance, but doubts have been raised as to whether this offers a complete explanation. In particular, host-parasite networks offer a variety of examples in which the reverse patterns are observed. We propose that the link between specificity and species-richness may also be driven by the co-evolution of hosts and parasites, as hosts allocate resources to optimize defence against parasites, and parasites to optimize attack on hosts. In this hypothesis, species interactions are a result of resource allocations. This novel concept, linking together many different arguments for network structures, is introduced through the adaptive dynamics of a simple ecological toy system of two hosts and two parasites. We analyse the toy model and its functionality, demonstrating that co-evolution leads to specialization asymmetry in networks with closely related parasites or fast host mutation rates, but not in networks with more distantly related species. Having constructed the toy model and tested its applicability, our model can now be expanded to the full problem of a larger system. Keywords: co-evolution, nestedness, trade-off, parasite, food web 1. Introduction What drives the association between the host-specificity of parasites and the parasite species- richness of the hosts that they infect? Generalist parasites are often found in hosts with both high and low parasite species diversity, while specialist parasites are found mainly in hosts with a rich diversity of parasites (Poulin, 1997; V´ azquez et al., 2005). This association, between the specificity of parasites and the species-richness of the hosts that they infect, is known as specialization asymmetry (V´ azquez et al., 2005), or in a slightly stronger case as nestedness, when those species occurring in a species-poor assemblage form a non-random subset of those assemblages with a higher species richness (Poulin and Gu´ egan, 2000). These patterns can be * Corresponding author Tel.: +44 1225 38 5669 Email: [email protected] 1 arXiv:1211.1489v1 [q-bio.PE] 7 Nov 2012

Welcome message from author
This document is posted to help you gain knowledge. Please leave a comment to let me know what you think about it! Share it to your friends and learn new things together.
Transcript
Co-evolution of resource trade-offs driving species interactions in ahost-parasite network: An exploratory model
C.F. McQuaida,∗, N.F.Brittona
aDepartment of Mathematical Sciences, University of Bath, Claverton Down, Bath, BA2 7AY, UK
Abstract
Patterns of nestedness and specialization asymmetry, where specialist species interact mainlywith generalists while generalists interact with both generalists and specialists, are often observedin mutualistic and antagonistic bi-partite ecological networks. These have been explained interms of the relative abundance of species, using a null model that assigns links in proportionto abundance, but doubts have been raised as to whether this offers a complete explanation. Inparticular, host-parasite networks offer a variety of examples in which the reverse patterns areobserved.
We propose that the link between specificity and species-richness may also be driven bythe co-evolution of hosts and parasites, as hosts allocate resources to optimize defence againstparasites, and parasites to optimize attack on hosts. In this hypothesis, species interactions area result of resource allocations. This novel concept, linking together many different argumentsfor network structures, is introduced through the adaptive dynamics of a simple ecological toysystem of two hosts and two parasites.
We analyse the toy model and its functionality, demonstrating that co-evolution leads tospecialization asymmetry in networks with closely related parasites or fast host mutation rates,but not in networks with more distantly related species. Having constructed the toy model andtested its applicability, our model can now be expanded to the full problem of a larger system.
Keywords: co-evolution, nestedness, trade-off, parasite, food web
1. Introduction
What drives the association between the host-specificity of parasites and the parasite species-richness of the hosts that they infect? Generalist parasites are often found in hosts with bothhigh and low parasite species diversity, while specialist parasites are found mainly in hosts witha rich diversity of parasites (Poulin, 1997; Vazquez et al., 2005). This association, betweenthe specificity of parasites and the species-richness of the hosts that they infect, is known asspecialization asymmetry (Vazquez et al., 2005), or in a slightly stronger case as nestedness,when those species occurring in a species-poor assemblage form a non-random subset of thoseassemblages with a higher species richness (Poulin and Guegan, 2000). These patterns can be
∗Corresponding authorTel.: +44 1225 38 5669Email: [email protected]
1
arX
iv:1
211.
1489
v1 [
q-bi
o.PE
] 7
Nov
201
2
seen from parasites in fish species (Poulin, 1997) to fleas and their hosts (Vazquez et al., 2005),although there is some debate on the extent to which this is evident, and many counterexamplesexist (Poulin, 1997, 2007; Valtonen et al., 2001).
Nestedness is also evident in many other food webs (Ings et al., 2009), and there is mixedevidence for whether the addition of parasites to these webs should increase or decrease theirrelative nestedness (Hernandez and Sukhdeo, 2008; Lafferty et al., 2006). Nestedness is a featurewhich is particularly prevalent in mutualistic networks (Bascompte et al., 2003; Vazquez andAizen, 2003, 2004), an interesting fact given the complete reversal in interaction types involvedwhen compared to host-parasite networks. Nevertheless, in order to fit parasites into food webmodels, it is important to understand the forces behind such structural traits as nestedness,particularly as antagonistic networks are instead generally expected to be compartmentalized(Bascompte 2010; Thebault and Fontaine 2008; Thompson 2005, but see Flores et al. 2011 forthe effects of scale-dependence).
What is clear is that structural patterns of species interactions in ecological networks, suchas nestedness and anti-nestedness, are not random (Joppa et al., 2010). Vazquez et al. (2005)constructed a null model based on host abundance to account for such patterns, yet there maybe many more explanations for the link between the specificity of a parasite and the parasitespecies-richness of the hosts that it infects (Lewinsohn et al., 2006; Poulin, 2007). This doesnot, for example, explain the frequent occurrence of anti-nestedness. Further explanations fornestedness in networks include complementarity (Rezende et al., 2007), based on phenotypicmatching between species, and competitive load (Bastolla et al., 2009), based on a new speciesentering a network targeting a host with less competition provided by resident parasite species.
Another possible driving force behind the link between specificity and species richness isrelated to the levels of defence that a host exhibits. For example, avian fleas with different levelsof specificity target hosts with different levels of T-cell mediated immune response (Møller et al.,2005). Generalist parasites target hosts with weak levels of immune response, while parasiteswith fewer host species exploit those with both strong and weak immune responses. This alsohas an effect on the parasite species-richness of host species, with hosts with stronger immuneresponses being parasitized by a greater number of species. In this instance, then, the specificityof parasites and specialization asymmetry appears to be related to the host immune response(Møller et al., 2005). Here, this idea is turned around slightly, but the concept of a relationshipbetween host response and specificity is maintained.
It is becoming increasingly apparent that the co-evolution of species is an important drivingforce in host-parasite relationships (Best et al., 2009). It is also widely acknowledged that trade-offs in resource allocation are responsible for much evolutionary drive in parasites, such as thelink between virulence and transmission(May and Anderson, 1983). In our paper it is postulatedthat the link between specificity and richness may be driven by the co-evolution of both hostsand parasites when balancing the allocation of resources (see Poulin and Morand 2004). Theseresources are devoted in different degrees to interactions with one species versus another, eitherfor infection or for preventing infection.
As an example, the influenza virus binds to cell-surface oligosaccharides via a sialic acid recep-tor. The receptor type may have one of two conformations: Neu 5Acα(2,3)-Gal or Neu5Acα(2,6)-Gal. A host species may have one of the two or both (Cobey et al., 2010), but the virus mustadapt to one linkage type at the expense of the other. Other examples include phenotypic traitmatching, such as the shape of mouthparts of ectoparasites (Graham et al., 2009) or nectarholder size and shape in mutualistic pollinator networks (Vazquez et al., 2009). From the host
2
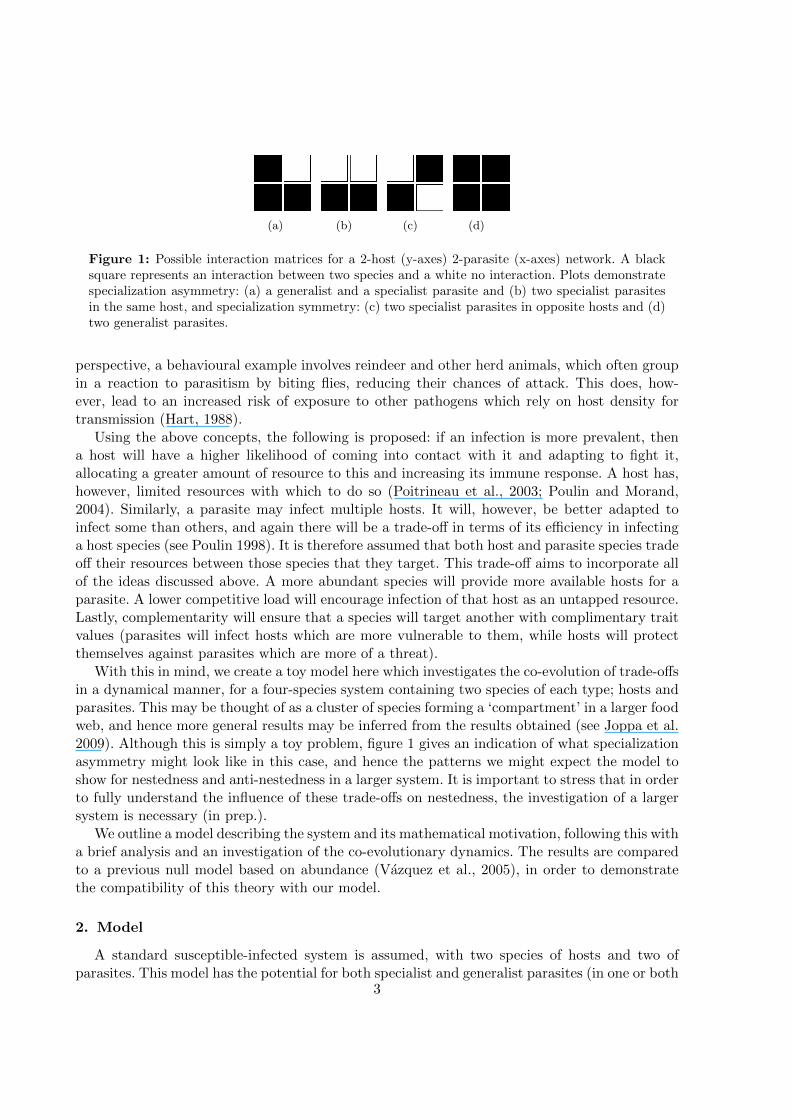
(a) (b) (c) (d)
Figure 1: Possible interaction matrices for a 2-host (y-axes) 2-parasite (x-axes) network. A blacksquare represents an interaction between two species and a white no interaction. Plots demonstratespecialization asymmetry: (a) a generalist and a specialist parasite and (b) two specialist parasitesin the same host, and specialization symmetry: (c) two specialist parasites in opposite hosts and (d)two generalist parasites.
perspective, a behavioural example involves reindeer and other herd animals, which often groupin a reaction to parasitism by biting flies, reducing their chances of attack. This does, how-ever, lead to an increased risk of exposure to other pathogens which rely on host density fortransmission (Hart, 1988).
Using the above concepts, the following is proposed: if an infection is more prevalent, thena host will have a higher likelihood of coming into contact with it and adapting to fight it,allocating a greater amount of resource to this and increasing its immune response. A host has,however, limited resources with which to do so (Poitrineau et al., 2003; Poulin and Morand,2004). Similarly, a parasite may infect multiple hosts. It will, however, be better adapted toinfect some than others, and again there will be a trade-off in terms of its efficiency in infectinga host species (see Poulin 1998). It is therefore assumed that both host and parasite species tradeoff their resources between those species that they target. This trade-off aims to incorporate allof the ideas discussed above. A more abundant species will provide more available hosts for aparasite. A lower competitive load will encourage infection of that host as an untapped resource.Lastly, complementarity will ensure that a species will target another with complimentary traitvalues (parasites will infect hosts which are more vulnerable to them, while hosts will protectthemselves against parasites which are more of a threat).
With this in mind, we create a toy model here which investigates the co-evolution of trade-offsin a dynamical manner, for a four-species system containing two species of each type; hosts andparasites. This may be thought of as a cluster of species forming a ‘compartment’ in a larger foodweb, and hence more general results may be inferred from the results obtained (see Joppa et al.2009). Although this is simply a toy problem, figure 1 gives an indication of what specializationasymmetry might look like in this case, and hence the patterns we might expect the model toshow for nestedness and anti-nestedness in a larger system. It is important to stress that in orderto fully understand the influence of these trade-offs on nestedness, the investigation of a largersystem is necessary (in prep.).
We outline a model describing the system and its mathematical motivation, following this witha brief analysis and an investigation of the co-evolutionary dynamics. The results are comparedto a previous null model based on abundance (Vazquez et al., 2005), in order to demonstratethe compatibility of this theory with our model.
2. Model
A standard susceptible-infected system is assumed, with two species of hosts and two ofparasites. This model has the potential for both specialist and generalist parasites (in one or both
3
hosts respectively) as well as species-poor and species-rich hosts (containing neither parasite,one only or both). Si refers to susceptibles of host type i, while Iij refers to infecteds of hosttype i with parasite type j, where in this instance i, j ∈ N2. We then have
dSidt
=αiNi −∑j∈N2
aijcijSiFij − ωiSiNi,
dIijdt
=aijcijSiFij − γijIij − ωiIijNi. (2.1)
The model contains birth (αi) and death (ωi) rates dependent on the host species i, as well asinfection-related death; death rate γij of host species i due to parasite species j. Ni = Si+Ii1+Ii2represents the total population size of host species i.
The maximum force of infection F ij of parasite species j on host species i is given by
F ij =∑k∈N2
βikj Ikj ,
where βikj is the pairwise potential infectious contact rate for the transfer of parasite j from host
k to host i. In our model, the actual force of infection Gij is assumed to be moderated by thestrategies adopted by the parasite j and the host i. It is given by
Gij = aijcijFij = aijcij(β
i1j I1j + βi2j I2j), (2.2)
with 0 ≤ aij ≤ 1, 0 ≤ cij ≤ 1. Here aij is a parasite-related trait defining the relative probabilityof success of parasite j’s attack on host i, and cij is a host-related trait defining the relativeprobability of failure of host i’s defence against parasite j. All else being equal, parasites benefitfrom values of aij that are as high as possible, while hosts benefit from values of cij that are aslow as possible.
We assume, however, that each parasite species j has a fixed amount of resource to allocate toinfection, and that there is therefore a trade-off between the strength a1j of its attack against host1 and the strength a2j of its attack against host 2. This trade-off is assumed to be a decreasingfunction, which is species specific and is not dependent upon the population or environment. Ahost species i, meanwhile, varies strategy cij in order to reduce transmission of parasite j, anda similar trade-off is presumed.
Transmission of infection to a susceptible host then depends on the actual force of infection, ameasure of both the propensity of the parasite to infect that host, as well as the host’s propensityto defend itself against the parasite.
In reality, it is difficult to determine the shapes such trade-offs take (Best et al., 2009). Ageneral trade-off shape therefore allows for a greater understanding of different possible evo-lutionary outcomes (Kisdi, 2006). Points at which an evolutionary stable strategy (ESS) mayexhibit evolutionary branching also often depend on the nature of the trade-off function pre-sumed; more specifically, whether it is concave or convex, and the extent of this (Kisdi, 2006).Levins’ fitness set approach (Rueffler et al., 2006) has previously influenced intuitive thoughtson the effects of these shapes under normal evolutionary conditions, with a generalist expectedif a trade-off is convex, or weak, and either specialist expected if a trade-off is concave, or strong.
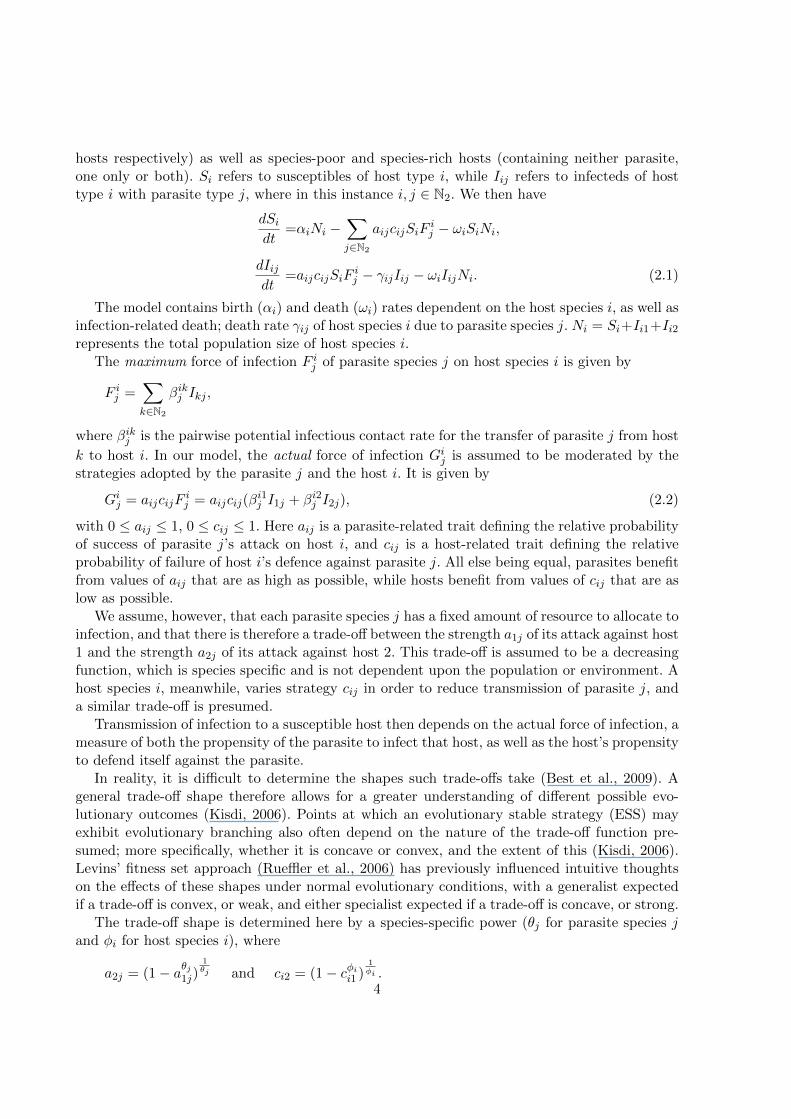
The trade-off shape is determined here by a species-specific power (θj for parasite species jand φi for host species i), where
a2j = (1− aθj1j)1θj and ci2 = (1− cφii1 )
1φi .4
0 0.2 0.4 0.6 0.8 10
0.2
0.4
0.6
0.8
1
a11
a21
StrongWeak
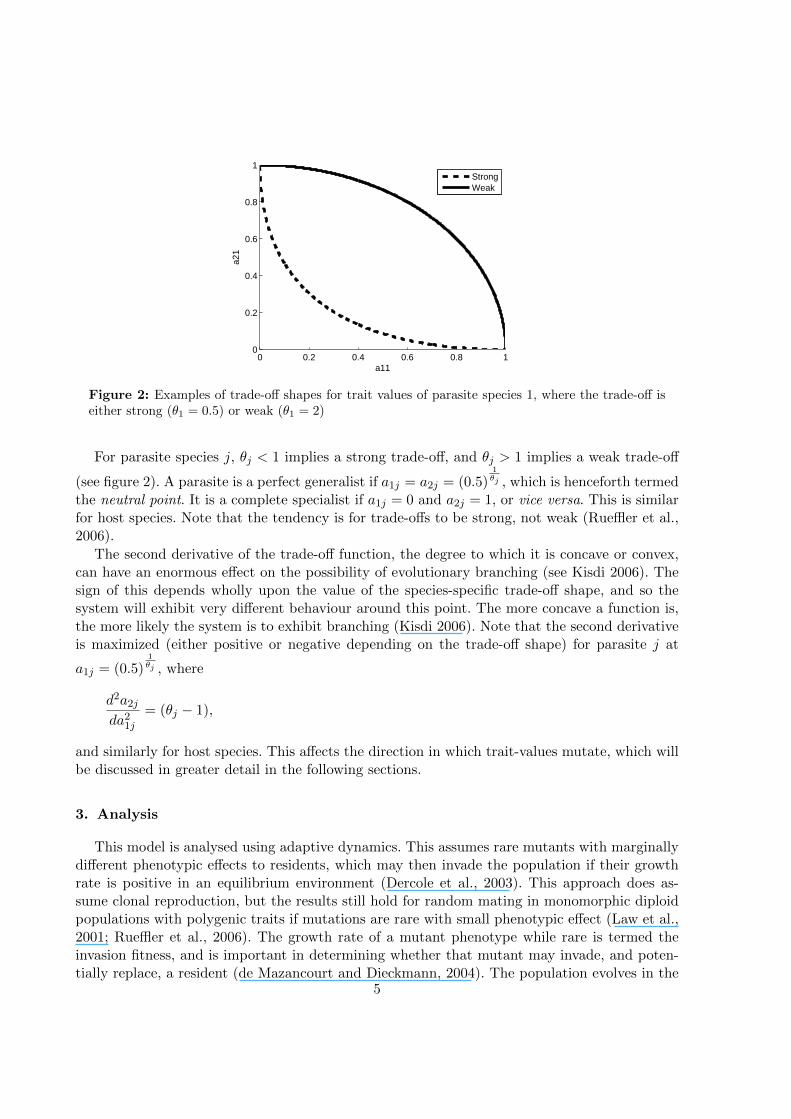
Figure 2: Examples of trade-off shapes for trait values of parasite species 1, where the trade-off iseither strong (θ1 = 0.5) or weak (θ1 = 2)
For parasite species j, θj < 1 implies a strong trade-off, and θj > 1 implies a weak trade-off
(see figure 2). A parasite is a perfect generalist if a1j = a2j = (0.5)1θj , which is henceforth termed
the neutral point. It is a complete specialist if a1j = 0 and a2j = 1, or vice versa. This is similarfor host species. Note that the tendency is for trade-offs to be strong, not weak (Rueffler et al.,2006).
The second derivative of the trade-off function, the degree to which it is concave or convex,can have an enormous effect on the possibility of evolutionary branching (see Kisdi 2006). Thesign of this depends wholly upon the value of the species-specific trade-off shape, and so thesystem will exhibit very different behaviour around this point. The more concave a function is,the more likely the system is to exhibit branching (Kisdi 2006). Note that the second derivativeis maximized (either positive or negative depending on the trade-off shape) for parasite j at
a1j = (0.5)1θj , where
d2a2jda21j
= (θj − 1),
and similarly for host species. This affects the direction in which trait-values mutate, which willbe discussed in greater detail in the following sections.
3. Analysis
This model is analysed using adaptive dynamics. This assumes rare mutants with marginallydifferent phenotypic effects to residents, which may then invade the population if their growthrate is positive in an equilibrium environment (Dercole et al., 2003). This approach does as-sume clonal reproduction, but the results still hold for random mating in monomorphic diploidpopulations with polygenic traits if mutations are rare with small phenotypic effect (Law et al.,2001; Rueffler et al., 2006). The growth rate of a mutant phenotype while rare is termed theinvasion fitness, and is important in determining whether that mutant may invade, and poten-tially replace, a resident (de Mazancourt and Dieckmann, 2004). The population evolves in the
5
direction of the fitness gradient (the change in the invasion fitness with respect to change inthe mutant trait value) as successive mutations occur and then spread through the population(de Mazancourt and Dieckmann, 2004). The invasion fitness can then be used to discover singu-larities, where the fitness gradient of any local mutant is zero, and to investigate the nature ofthese singularities (Geritz et al., 1998). An example of the derivation of the invasion conditionis given below for parasite 1 in a system without co-infection or recovery; the method is similarfor the second parasite species.
3.1. Parasite invasion conditions
In determining the invasion fitness of a mutant parasite in the population, here a mutantI ′i1 with strategy (a′11, a
′21) of parasite 1, with the resident population at a stable, non-trivial
equilibrium (Si = S∗i , Iij = I∗ij), the linearized dynamics of the mutant are expressed as follows:
dI ′11dt
= a′11c11S∗1F
1′1 − γ11I ′11 − ω1I
′11N
∗1 ,
dI ′21dt
= a′21c21S∗2F
2′1 − γ21I ′21 − ω2I
′21N
∗2 . (3.3)
In the full system of equations for the dynamics, including the resident dynamics, the residentis at a stable steady equilibrium. The Jacobian of the system can be therefore split into theoriginal dynamics and a separate submatrix determined by the mutant, given by A1.
Defining δ11 = a′11 − a11 and δ21 = a′21 − a21, both small, we get
A1 =
(A1(1, 1) A1(1, 2)A1(2, 1) A1(2, 2)
), (3.4)
where the equilibrium of the system is used to guarantee that
I∗i1(γi1 + ωiN∗i ) = ai1ci1S
∗i F
i∗1 ,
and hence
A1(n, n)I∗n1 = δn1cn1S∗nβ
nn1 I∗n1 − an1cn1S∗nβnn−11 I∗n−11,
A1(n, n− 1) = (δn1 + an1)cn1S∗nβ
nn−11 . (3.5)
The stability of A1 is then used to indicate the potential for invasion. As it is difficult tointerpret anything useful from the eigenvalues, a sign-equivalent proxy can be found for thegrowth rate of the mutant by investigating the trace and determinant of A1. The determinantis given by
I∗11I∗21 det(A1) = −c11c21S∗1S∗2u1(δ11, a11, δ21, a21),
where, to leading order of δ,
u1(δ11, a11, δ21, a21) =β121 β211 I∗11I∗21(δ11a21 + a11δ21)
+ β211 β111 (I∗11)
2δ11a21
+ β121 β221 (I∗21)
2a11δ21. (3.6)
When a′11 = a11, then tr(A1) < 0 and det(A1) = 0, as δn1 = 0. For the small perturbationsresulting from mutation we can therefore rely on the determinant condition for stability analysis,
6
as the trace will remain negative. The cases for I∗11 = 0 and I∗21 = 0 are discussed later. Thedeterminant will be negative, and hence the system is unstable and the mutant invades, if
u1(δ11, a11, δ21, a21) > 0 (3.7)
Interpreting this condition, invasion of a mutant parasite can be seen to be driven by thefollowing; the first term is due to inter-species transmission, and is minimized at the neutral pointa11 = a21, hence driving towards generalism. This is due to an increased invasion probabilitywhen a mutant is investing more equally than the resident, as (δ11a21 + a11δ21) is larger. Whena11 = a21 then this term is zero, and no possible mutant can invade due to this. When a11 <
(0.5)1θ1 , this implies that a21 > (0.5)
1θ1 . Hence we require a mutant with a larger value of a11 to
promote invasion, and vice versa for a11 > (0.5)1θ1 . So this term stabilizes at and attracts to the
neutral point, promoting generalism.The final two terms compare the use of the two available hosts. For example, if transmission
due to host 1 (β211 β111 (I∗11)
2) is high, then a mutant with larger a′11 will invade, ensuring host1 is utilized. These terms demonstrate an increased invasion potential if the mutant increasesinfection of the species with higher infection rates (β211 β
111 compared to β121 β
221 ) and on which
the resident relies more (whether I∗11 is greater or less than I∗21), as δ11 and δ21 have oppositesigns. This ensures that the mutant is spread as much as possible to susceptible hosts.
Note that the case where either I∗11 = 0 or I∗21 = 0 sees the parasite shy away from a completelyprotected host. These points are only obtainable, for a four species system where the maximumforce of infection is not zero, if the actual force of infection is zero, i.e. a11c11 = 0 or a21c21 = 0as appropriate. For the case where I∗11 = 0, the submatrix of the Jacobian is given by
A1 =
(−γ11 − ω11(S
∗1 + I∗12) 0
(δ21 + a21)c21S∗2β
211 δ21c21S
∗2β
221
). (3.8)
The mutant can thus invade only if δ21 > 0, i.e. if a′11 < a11. A similar situation arises forI∗21 = 0. If both I∗11 and I∗21 = 0 then the system is at a trivial equilibrium, in which case nomutant can invade.
3.2. Host invasion conditions
Similarly to the parasite case above, a mutant population (S′1, I′1j) with trait value c′1j of host
1 is introduced at low densities to the resident population at equilibrium (Si = S∗i , Iij = I∗ij).The dynamics of the subsystem are given by
dS′1dt
=α1N′1 − a11c′11S′1F 1∗
1 − a12c′12S′1F 1∗2 − ω1S
′1N∗1 ,
dI ′11dt
=a11c′11S′1F
1∗1 − γ11I ′11 − ω1I
′11N
∗1 ,
dI ′12dt
=a12c′12S′1F
1∗2 − γ12I ′12 − ω1I
′12N
∗1 . (3.9)
The equilibrium conditions are taken from equation 2.1, and we define ε11 = c′11 − c11 andε12 = c′12 − c12, both small. Again we investigate the submatrix of the Jacobian, given by
C1 =
C1(1, 1) α1 α1
a11(ε11 + c11)F1∗1 −a11c11S∗1F
1∗1
I∗110
a12(ε12 + c12)F1∗2 0 −a12c12S∗1F
1∗2
I∗12
, (3.10)
7
where
C1(1, 1) = α1
(1− N∗1
S∗1
)− a11ε11F 1∗
1 − a12ε12F 1∗2 .
Now, as the subsystem is three-dimensional, the eigenvalues are given as solutions to anequation of the form λ3 + b1λ
2 + b2λ+ b3, where
b1 =− tr(C1),
2b2 =tr2(C1)− tr(C21),
b3 =− det(C1).
For stability, it is required that b1, b2, b3 > 0 and b1b2 > b3. When c′11 = c11, both b1 and b2are positive and O(1), as ε = 0. On the other hand,
b3 = − 1
I∗11I∗12
a11a12S∗1F
1∗1 F 1∗
2 w1(ε11, c11, ε12, c12),
where
w1(ε11, c11, ε12, c12) =c12ε11α1I∗11 + c11ε12α1I
∗12
− c11c12a11S∗1F 1∗1 ε11
− c11c12a12S∗1F 1∗2 ε12. (3.11)
Now this is O(ε), and is zero when c′11 = c11, hence b1b2 > b3. The criteria for instability (andinvasion) when mutations are small can therefore be reduced to
w1(ε11, c11, ε12, c12) > 0. (3.12)
Interpreting this condition, it can be seen that mutant invasion depends on a balance ofterms. The first two terms from equation 3.11 push the host towards a generalized defence. Forexample, a particularly large value of c11 makes the second term likely to be larger, and hencea mutant with a smaller trait value c′11 will invade, to ensure that ε12 > 0.
The final two terms decrease in importance (c11c12 decreases), compared to the initial terms,as the host specializes. If the pressure from parasite 1 is higher (the actual force of infection ishigher) then the first of these terms will be larger. A host mutant with a smaller trait value willtherefore invade, in order to make ε11 negative and the sum of the final two terms positive. Inthis way the mutant host protects itself against parasite 1 to a greater extent. These terms thenaccount for the pressure that a parasite places on the host, and the host’s reaction to this.
The case where either I∗11 or I∗12 is zero, which again occurs if a11c11 = 0 or a12c12 = 0 asappropriate, shows that a host will not defend itself against a non-threatening parasite, and ifthe system is at a trivial equilibrium, then no mutant may invade. For example, if I∗11 = 0, thenequation 3.10 is given by
C1 =
C1(1, 1) α1 α1
0 −γ11 − ω1N∗1 0
a12c′12F
1∗2 0 −a12c12S∗1F
1∗2
I∗12
, (3.13)
8
where C1(1, 1) = α1
(1− N∗1
S∗1
)− a12ε12F 1∗
2 . In this case, a stronger than necessary condition is
that a mutant will always invade if a12ε12F1∗2 < 0, i.e. if c′11 > c11. A similar situation arises for
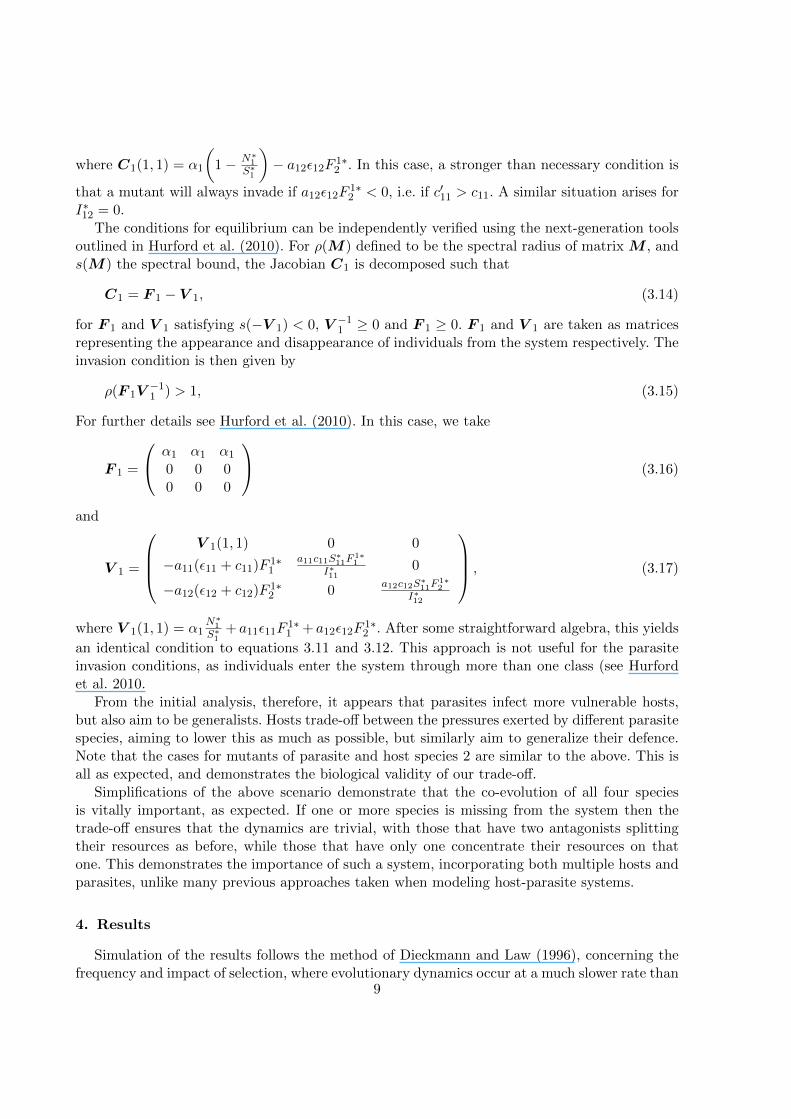
I∗12 = 0.The conditions for equilibrium can be independently verified using the next-generation tools
outlined in Hurford et al. (2010). For ρ(M) defined to be the spectral radius of matrix M , ands(M) the spectral bound, the Jacobian C1 is decomposed such that
C1 = F 1 − V 1, (3.14)
for F 1 and V 1 satisfying s(−V 1) < 0, V −11 ≥ 0 and F 1 ≥ 0. F 1 and V 1 are taken as matricesrepresenting the appearance and disappearance of individuals from the system respectively. Theinvasion condition is then given by
ρ(F 1V−11 ) > 1, (3.15)
For further details see Hurford et al. (2010). In this case, we take
F 1 =
α1 α1 α1
0 0 00 0 0
(3.16)
and
V 1 =
V 1(1, 1) 0 0
−a11(ε11 + c11)F1∗1
a11c11S∗11F1∗1
I∗110
−a12(ε12 + c12)F1∗2 0
a12c12S∗11F1∗2
I∗12
, (3.17)
where V 1(1, 1) = α1N∗1S∗1
+ a11ε11F1∗1 + a12ε12F
1∗2 . After some straightforward algebra, this yields
an identical condition to equations 3.11 and 3.12. This approach is not useful for the parasiteinvasion conditions, as individuals enter the system through more than one class (see Hurfordet al. 2010.
From the initial analysis, therefore, it appears that parasites infect more vulnerable hosts,but also aim to be generalists. Hosts trade-off between the pressures exerted by different parasitespecies, aiming to lower this as much as possible, but similarly aim to generalize their defence.Note that the cases for mutants of parasite and host species 2 are similar to the above. This isall as expected, and demonstrates the biological validity of our trade-off.
Simplifications of the above scenario demonstrate that the co-evolution of all four speciesis vitally important, as expected. If one or more species is missing from the system then thetrade-off ensures that the dynamics are trivial, with those that have two antagonists splittingtheir resources as before, while those that have only one concentrate their resources on thatone. This demonstrates the importance of such a system, incorporating both multiple hosts andparasites, unlike many previous approaches taken when modeling host-parasite systems.
4. Results
Simulation of the results follows the method of Dieckmann and Law (1996), concerning thefrequency and impact of selection, where evolutionary dynamics occur at a much slower rate than
9
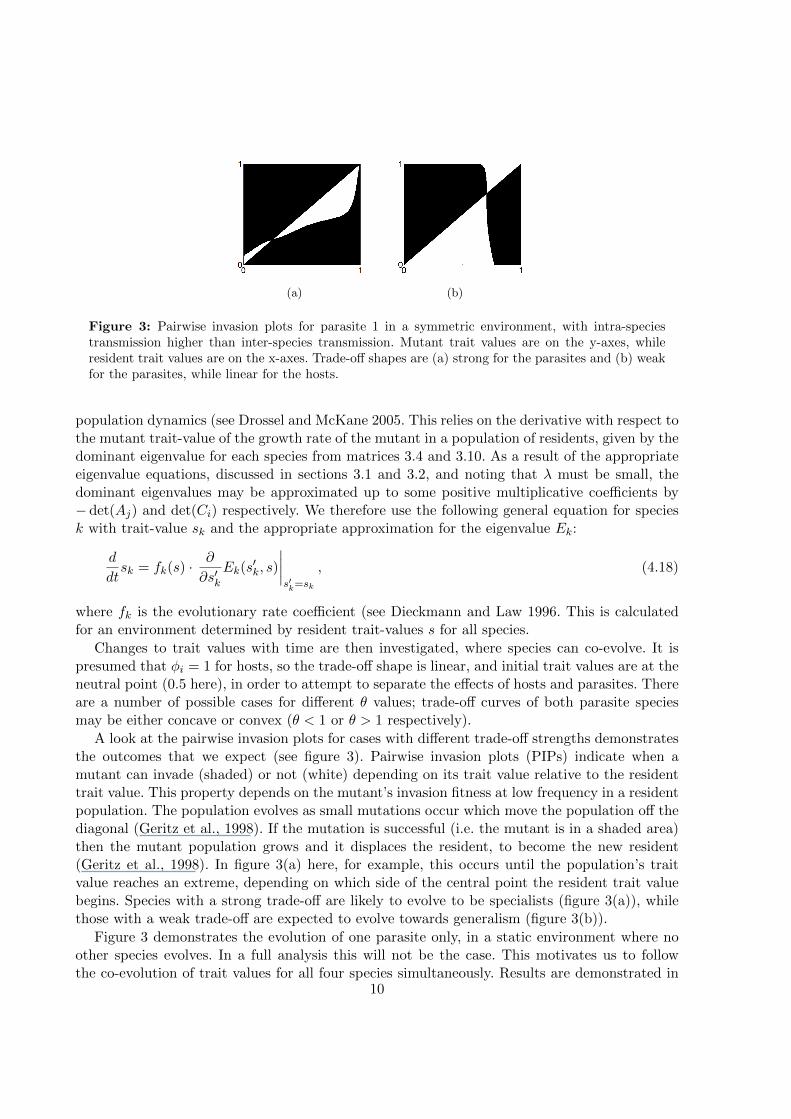
(a) (b)
Figure 3: Pairwise invasion plots for parasite 1 in a symmetric environment, with intra-speciestransmission higher than inter-species transmission. Mutant trait values are on the y-axes, whileresident trait values are on the x-axes. Trade-off shapes are (a) strong for the parasites and (b) weakfor the parasites, while linear for the hosts.
population dynamics (see Drossel and McKane 2005. This relies on the derivative with respect tothe mutant trait-value of the growth rate of the mutant in a population of residents, given by thedominant eigenvalue for each species from matrices 3.4 and 3.10. As a result of the appropriateeigenvalue equations, discussed in sections 3.1 and 3.2, and noting that λ must be small, thedominant eigenvalues may be approximated up to some positive multiplicative coefficients by−det(Aj) and det(Ci) respectively. We therefore use the following general equation for speciesk with trait-value sk and the appropriate approximation for the eigenvalue Ek:
d
dtsk = fk(s) ·
∂
∂s′kEk(s
′k, s)
∣∣∣∣s′k=sk
, (4.18)
where fk is the evolutionary rate coefficient (see Dieckmann and Law 1996. This is calculatedfor an environment determined by resident trait-values s for all species.
Changes to trait values with time are then investigated, where species can co-evolve. It ispresumed that φi = 1 for hosts, so the trade-off shape is linear, and initial trait values are at theneutral point (0.5 here), in order to attempt to separate the effects of hosts and parasites. Thereare a number of possible cases for different θ values; trade-off curves of both parasite speciesmay be either concave or convex (θ < 1 or θ > 1 respectively).
A look at the pairwise invasion plots for cases with different trade-off strengths demonstratesthe outcomes that we expect (see figure 3). Pairwise invasion plots (PIPs) indicate when amutant can invade (shaded) or not (white) depending on its trait value relative to the residenttrait value. This property depends on the mutant’s invasion fitness at low frequency in a residentpopulation. The population evolves as small mutations occur which move the population off thediagonal (Geritz et al., 1998). If the mutation is successful (i.e. the mutant is in a shaded area)then the mutant population grows and it displaces the resident, to become the new resident(Geritz et al., 1998). In figure 3(a) here, for example, this occurs until the population’s traitvalue reaches an extreme, depending on which side of the central point the resident trait valuebegins. Species with a strong trade-off are likely to evolve to be specialists (figure 3(a)), whilethose with a weak trade-off are expected to evolve towards generalism (figure 3(b)).
Figure 3 demonstrates the evolution of one parasite only, in a static environment where noother species evolves. In a full analysis this will not be the case. This motivates us to followthe co-evolution of trait values for all four species simultaneously. Results are demonstrated in
10
0.45
0.5
0.55
0.6
0.65
0.7
0.75
0.8
0.85
0.9
Evolutionary Time
Tra
it
a11a21a12a22
(a) Weak trade-off for parasites (θj = 2)
0
0.1
0.2
0.3
0.4
0.5
0.6
0.7
0.8
0.9
1
Evolutionary Time
Tra
it
close−up
a11a21a12a22
(b) Mixed trade-offs for parasites (θ1 = 2, θ2 = 0.5)
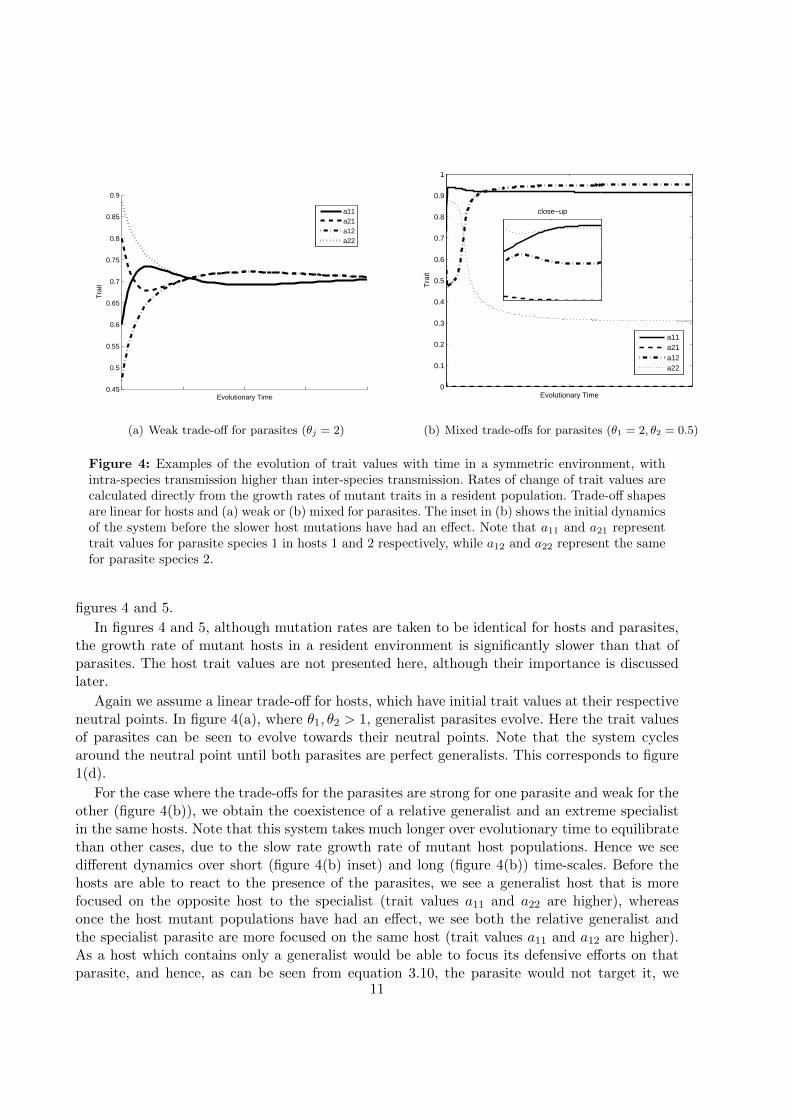
Figure 4: Examples of the evolution of trait values with time in a symmetric environment, withintra-species transmission higher than inter-species transmission. Rates of change of trait values arecalculated directly from the growth rates of mutant traits in a resident population. Trade-off shapesare linear for hosts and (a) weak or (b) mixed for parasites. The inset in (b) shows the initial dynamicsof the system before the slower host mutations have had an effect. Note that a11 and a21 representtrait values for parasite species 1 in hosts 1 and 2 respectively, while a12 and a22 represent the samefor parasite species 2.
figures 4 and 5.
In figures 4 and 5, although mutation rates are taken to be identical for hosts and parasites,the growth rate of mutant hosts in a resident environment is significantly slower than that ofparasites. The host trait values are not presented here, although their importance is discussedlater.
Again we assume a linear trade-off for hosts, which have initial trait values at their respectiveneutral points. In figure 4(a), where θ1, θ2 > 1, generalist parasites evolve. Here the trait valuesof parasites can be seen to evolve towards their neutral points. Note that the system cyclesaround the neutral point until both parasites are perfect generalists. This corresponds to figure1(d).
For the case where the trade-offs for the parasites are strong for one parasite and weak for theother (figure 4(b)), we obtain the coexistence of a relative generalist and an extreme specialistin the same hosts. Note that this system takes much longer over evolutionary time to equilibratethan other cases, due to the slow rate growth rate of mutant host populations. Hence we seedifferent dynamics over short (figure 4(b) inset) and long (figure 4(b)) time-scales. Before thehosts are able to react to the presence of the parasites, we see a generalist host that is morefocused on the opposite host to the specialist (trait values a11 and a22 are higher), whereasonce the host mutant populations have had an effect, we see both the relative generalist andthe specialist parasite are more focused on the same host (trait values a11 and a12 are higher).As a host which contains only a generalist would be able to focus its defensive efforts on thatparasite, and hence, as can be seen from equation 3.10, the parasite would not target it, we
11
0
0.1
0.2
0.3
0.4
0.5
0.6
0.7
0.8
0.9
1
Evolutionary Time
Tra
it
a11a21a12a22
(a) Parasites in the same host
0
0.1
0.2
0.3
0.4
0.5
0.6
0.7
0.8
0.9
1
Evolutionary Time
Tra
it
a11a21a12a22
(b) Parasites in opposite hosts
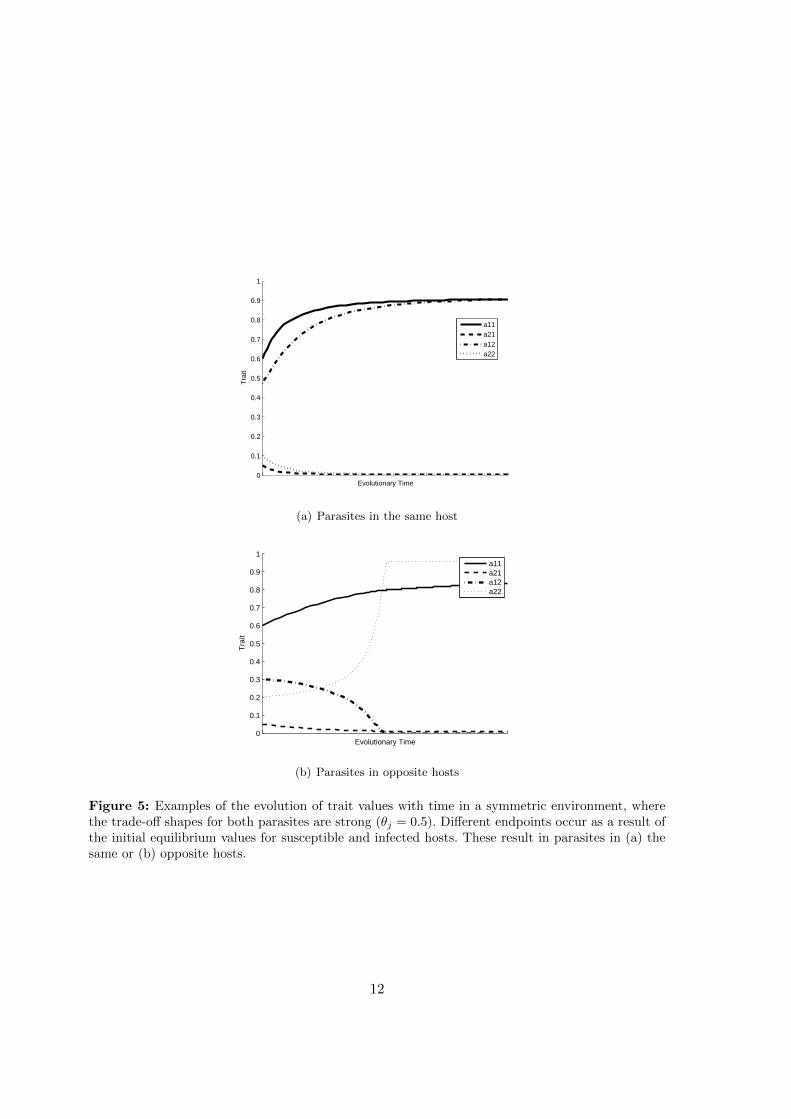
Figure 5: Examples of the evolution of trait values with time in a symmetric environment, wherethe trade-off shapes for both parasites are strong (θj = 0.5). Different endpoints occur as a result ofthe initial equilibrium values for susceptible and infected hosts. These result in parasites in (a) thesame or (b) opposite hosts.
12
see only comparative generalists here. This system demonstrates specialization asymmetry, andindeed nestedness (as far as that is plausible in such a small system) over longer evolutionarytime-scales, corresponding to figure 1(a).
For the case where both θj < 1 (figure 5), specialists always evolve. These can evolve to bein the same hosts (i.e. a11 and a12 evolve to the same extreme, figure 5(a)), or in the oppositehost (a11 and a12 at the opposite extremes, figure 5(b)). These scenarios bear resemblances tospecialization asymmetry (figure 1(b)) and compartmentalization (figure 1(c) where the networkis split into separate sub-networks that are not linked to one another) respectively.
4.1. Initial trait values
From the parasite conditions for invasion, it can be seen that the behaviour of the casesdepends heavily on the initial equilibrium conditions, which are a result of the initial traitvalues. The behaviour of each scenario pivots around which side of case-specific points theinitial trait values lie, similarly to which side of an evolutionary stable strategy an initial pointlies in a pairwise invasion plot (see figure 3). Each case has only a limited number of evolutionaryend points for trait values, and evolves to these. An analysis of the initial trait values showsinteresting results.
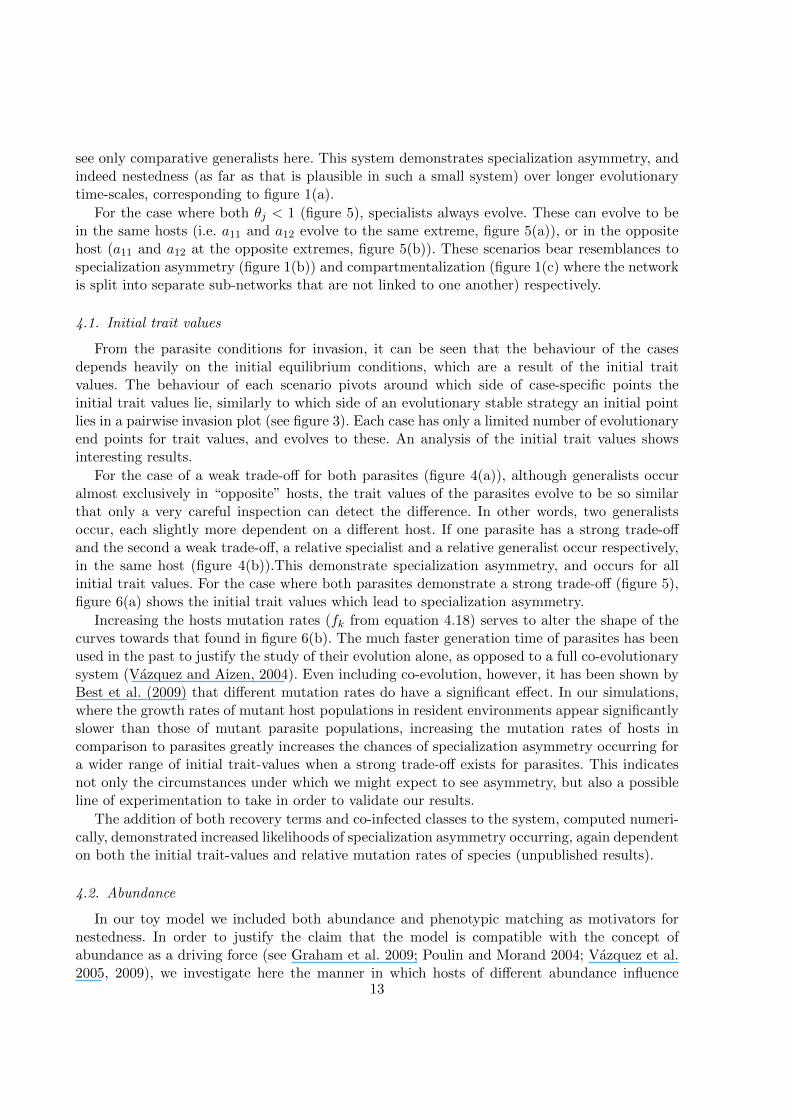
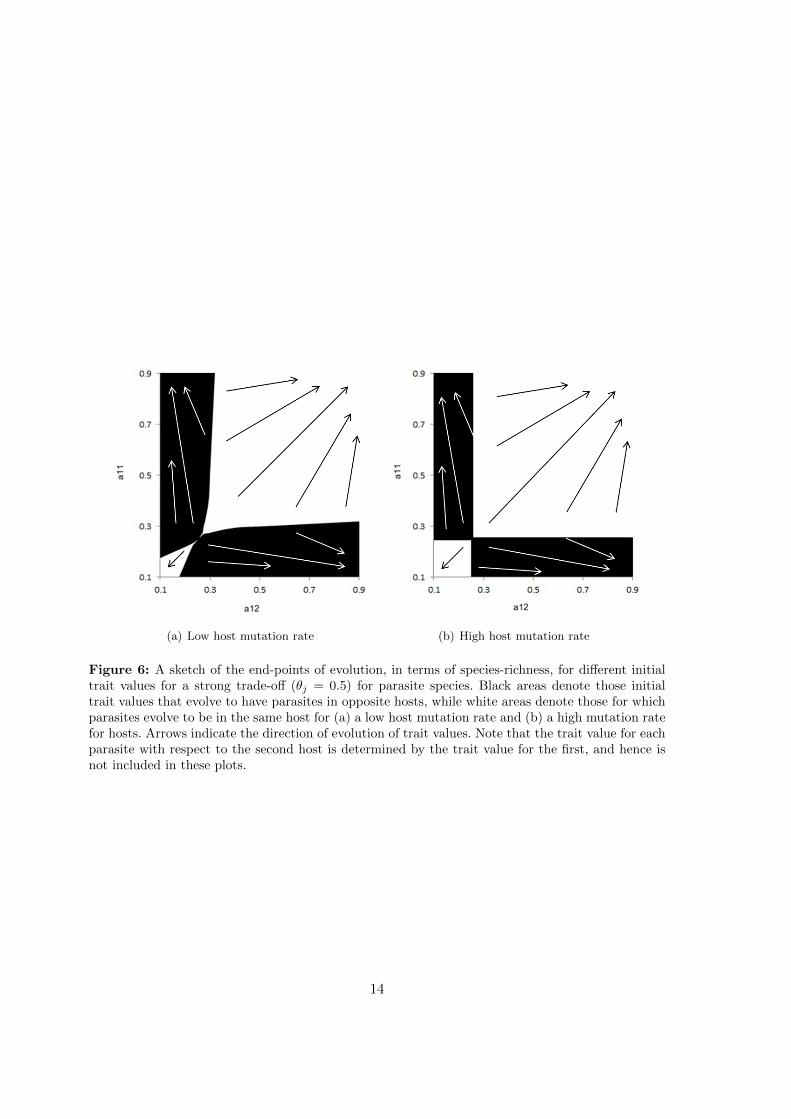
For the case of a weak trade-off for both parasites (figure 4(a)), although generalists occuralmost exclusively in “opposite” hosts, the trait values of the parasites evolve to be so similarthat only a very careful inspection can detect the difference. In other words, two generalistsoccur, each slightly more dependent on a different host. If one parasite has a strong trade-offand the second a weak trade-off, a relative specialist and a relative generalist occur respectively,in the same host (figure 4(b)).This demonstrate specialization asymmetry, and occurs for allinitial trait values. For the case where both parasites demonstrate a strong trade-off (figure 5),figure 6(a) shows the initial trait values which lead to specialization asymmetry.
Increasing the hosts mutation rates (fk from equation 4.18) serves to alter the shape of thecurves towards that found in figure 6(b). The much faster generation time of parasites has beenused in the past to justify the study of their evolution alone, as opposed to a full co-evolutionarysystem (Vazquez and Aizen, 2004). Even including co-evolution, however, it has been shown byBest et al. (2009) that different mutation rates do have a significant effect. In our simulations,where the growth rates of mutant host populations in resident environments appear significantlyslower than those of mutant parasite populations, increasing the mutation rates of hosts incomparison to parasites greatly increases the chances of specialization asymmetry occurring fora wider range of initial trait-values when a strong trade-off exists for parasites. This indicatesnot only the circumstances under which we might expect to see asymmetry, but also a possibleline of experimentation to take in order to validate our results.
The addition of both recovery terms and co-infected classes to the system, computed numeri-cally, demonstrated increased likelihoods of specialization asymmetry occurring, again dependenton both the initial trait-values and relative mutation rates of species (unpublished results).
4.2. Abundance
In our toy model we included both abundance and phenotypic matching as motivators fornestedness. In order to justify the claim that the model is compatible with the concept ofabundance as a driving force (see Graham et al. 2009; Poulin and Morand 2004; Vazquez et al.2005, 2009), we investigate here the manner in which hosts of different abundance influence
13
(a) Low host mutation rate (b) High host mutation rate
Figure 6: A sketch of the end-points of evolution, in terms of species-richness, for different initialtrait values for a strong trade-off (θj = 0.5) for parasite species. Black areas denote those initialtrait values that evolve to have parasites in opposite hosts, while white areas denote those for whichparasites evolve to be in the same host for (a) a low host mutation rate and (b) a high mutation ratefor hosts. Arrows indicate the direction of evolution of trait values. Note that the trait value for eachparasite with respect to the second host is determined by the trait value for the first, and hence isnot included in these plots.
14
the model outcomes. This is especially important over evolutionary, as opposed to ecological,timescales.
There are two aspects of abundance to be compared to the model presented here. Firstly,does increased abundance of a species indeed lead to a higher number of links occurring, andsecondly, does asymmetry in the assignment of links lead to nestedness? The first of these iscompared to the model, while the second is a question that remains independent of the model.
Firstly we note that, if nestedness is a result of abundance then we would expect it to occurin mutualistic and predator-prey webs, as the number of links of a species is associated solelywith its abundance and not with the nature of those links. This is indeed evident (see Montoyaet al. 2006), particularly in mutualistic networks, which display more nestedness than wouldbe expected from a random, bipartite network (Bascompte et al., 2003). However, if this is thecase then why would certain web-types display more nestedness than others (see Hernandez andSukhdeo 2008; Lafferty et al. 2006)? This promotes the thinking that abundance alone cannotexplain patterns of nestedness in ecological networks. A further question concerns whether ornot abundant species are more likely to have links simply as they are more likely to interactwith other species due to their abundance, or whether this is due to the inherent benefits ofinteracting with a more abundant species. Our model attempts to address this, proposing thatthere is an evolutionary advantage to interacting with a more abundant species.
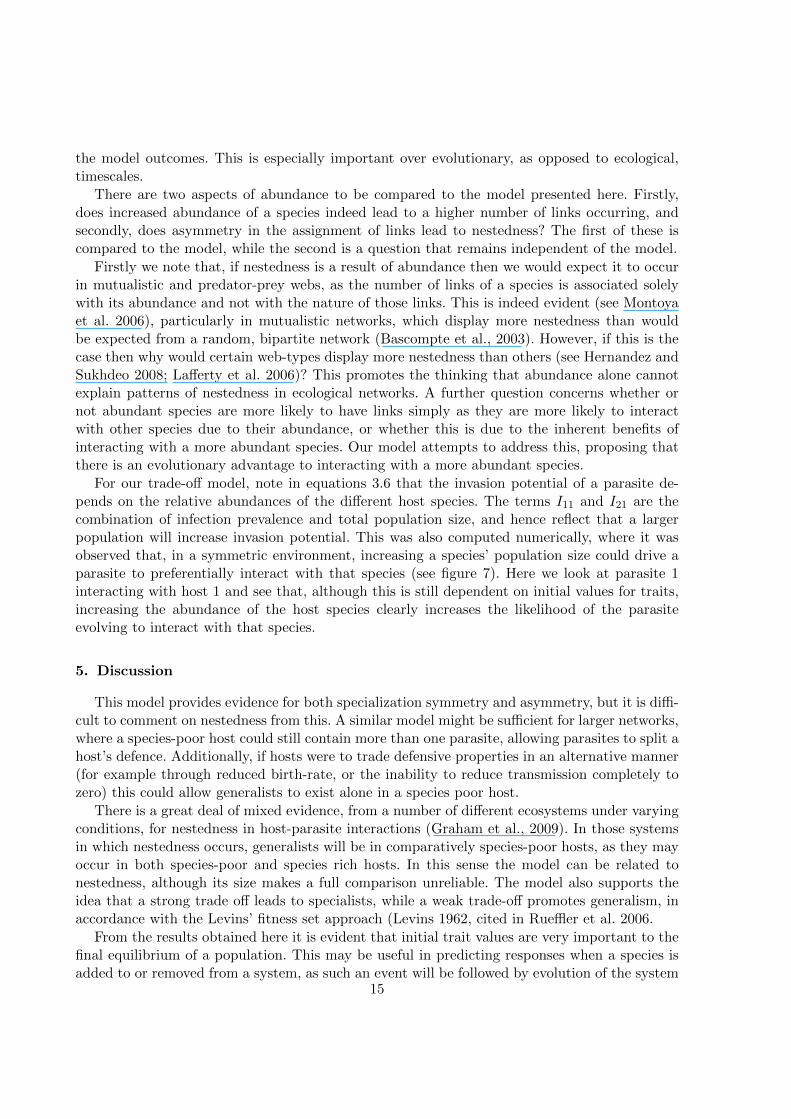
For our trade-off model, note in equations 3.6 that the invasion potential of a parasite de-pends on the relative abundances of the different host species. The terms I11 and I21 are thecombination of infection prevalence and total population size, and hence reflect that a largerpopulation will increase invasion potential. This was also computed numerically, where it wasobserved that, in a symmetric environment, increasing a species’ population size could drive aparasite to preferentially interact with that species (see figure 7). Here we look at parasite 1interacting with host 1 and see that, although this is still dependent on initial values for traits,increasing the abundance of the host species clearly increases the likelihood of the parasiteevolving to interact with that species.
5. Discussion
This model provides evidence for both specialization symmetry and asymmetry, but it is diffi-cult to comment on nestedness from this. A similar model might be sufficient for larger networks,where a species-poor host could still contain more than one parasite, allowing parasites to split ahost’s defence. Additionally, if hosts were to trade defensive properties in an alternative manner(for example through reduced birth-rate, or the inability to reduce transmission completely tozero) this could allow generalists to exist alone in a species poor host.
There is a great deal of mixed evidence, from a number of different ecosystems under varyingconditions, for nestedness in host-parasite interactions (Graham et al., 2009). In those systemsin which nestedness occurs, generalists will be in comparatively species-poor hosts, as they mayoccur in both species-poor and species rich hosts. In this sense the model can be related tonestedness, although its size makes a full comparison unreliable. The model also supports theidea that a strong trade off leads to specialists, while a weak trade-off promotes generalism, inaccordance with the Levins’ fitness set approach (Levins 1962, cited in Rueffler et al. 2006.
From the results obtained here it is evident that initial trait values are very important to thefinal equilibrium of a population. This may be useful in predicting responses when a species isadded to or removed from a system, as such an event will be followed by evolution of the system
15
Figure 7: Regions of initial trait values for both parasites which, under co-evolution with a strongtrade-off, lead to parasite 1 occuring in host 1. Filled areas denote regions of initial trait values whichsee parasite 1 evolving to be in host 1, and succesively lighter shades denoting the increase in size ofthe region as the relative abundance of host species 1 increases.
in a direction dictated, to a certain extent, by the equilibrium values of the system prior to thealteration.
One crucial factor concerning this model is that it is dynamical. A structural property canbe described and predicted by this dynamical model, explaining an aspect of static models thatcannot be explained through a simple trophic hierarchy. This helps in clarifying how parasiticassociations may be motivated, and, to a certain extent, investigates the effects which parasitein a host species have on one another. This toy model can now easily be expanded to include amore realistic system containing many more species (in prep.). Analysis of a larger system willthen enable questions on the nestedness of the system as a result of trade-offs to be answered.
5.1. Future
The primary purpose of this paper was to lay the foundation for a model which could explainpatterns of nestedness in ecological networks. In order to do so, this model needs to be repeatedat a larger scale for a host-parasite network. Given the evidence for nestedness in other systems(Bascompte et al., 2003; Vazquez and Aizen, 2003, 2004), the adaption of this model to thesesystems, particularly mutualistic networks, could also be used to corroborate any conclusionsreached (in prep.).
Many other factors are considered as possible motivators for the species-richness of parasitesin hosts (see Feliu et al. 1997; Marcogliese 2002; Montoya et al. 2006; Morand and Poulin1998; Nunn et al. 2003; Poulin and Leung 2011; Poulin and Morand 2004), which focus on thecharacteristics of the hosts. It is becoming increasingly clear that the interests of the parasites arealso important factors in this, and, in fact, both motivating factors are likely to be of importance.There have been very few models which investigate the co-evolution of a host-parasite systemusing adaptive dynamics (but see Best et al. 2009; Caval and Ferriere 2010), and these focusprimarily on the discovery of a co-evolutionary stable strategy. In that sense, every additionalapproach to or analysis of a co-evolutionary system adds to the field of co-evolutionary ecology.
16
With the aim of co-evolution in mind, it has been observed that, according to game the-ory, predators may be responsible for the presence of additional prey species through inducedbranching (McGill and Brown, 2007). Is it possible that parasites have such an effect? This couldpresumably only happen if parasites exerted similar levels of pressure to predators, which is un-likely (Poulin, 2010). Branching in our model could, however, potentially explain nestedness, asparasites would be found in similar hosts. This would lead to results similar to figure 5(a), anaspect which could be investigated further.
A further step from here is to investigate the effect that the position of a host in the networkas a whole has on its parasites, and how this fits in with the observations made here. Theposition of a host species in the network is considered a potential driving factor in determiningits parasitic composition (Chen et al., 2008; Vazquez et al., 2005). This has been looked at to agreater extent than parasite interactions with each other in the past (Cobey et al., 2010), butopen questions still remain, specifically with larger networks that include both multiple hostsand multiple parasites together.
6. Conclusion
The results of the model indicate that the hypothesis of resource trade-off driving a linkbetween specificity and species richness appears to be plausible. It can certainly be used tomodel interactions between hosts and parasites, which should yield interesting results whenused on a larger scale. This also highlights the importance of factors such as host mutation ratesin co-evolutionary systems, even when these rates are low.
Using such information as our results for the mutation rates and initial trait values, our modelhelps to predict the circumstances under which we might expect patterns such as specializationasymmetry to occur. We would predict the presence of specialist parasites in species-rich hoststo be more likely if the hosts had higher mutation rates, and in systems in which parasites aremore closely related, are more likely to originate in similar hosts or appear as generalists. Giventhe relationship between specialization asymmetry and nestedness, we would therefore expectnestedness under similar circumstances, and anti-nestedness the remainder of the time.
This model demonstrates that dynamic co-evolution of the network is vitally important inaccounting for parasites, as it demonstrates how the dynamics could influence structural proper-ties. In particular, it demonstrates the importance of the co-evolution of both hosts and parasitesin such a scenario. Parasites, therefore, are not a characteristic to simply be transposed ontoa system with no regard to their effects on one-another. Much like interactions in conventionalfood webs, the influences of different parasites can alter the entire structure of a host-parasitenetwork.
Acknowledgments
C.F. McQuaid is a Commonwealth Scholar, funded by the Department for InternationalDevelopment, UK.
References
Bascompte, J., 2010. Structure and dynamics of ecological networks. Science 329, 765–766.Bascompte, J., Jordano, P., Melian, C. J., Olesen, J. M., 2003. The nested assembly of plant-animal mutualistic
networks. PNAS 100, 9383–9387.
17
Bastolla, U., Fortuna, M. A., Pascual-Garcıa, A., Ferrera, A., Luque, B., Bascompte, J., 2009. The architectureof mutualistic networks minimizes competition and increases biodiversity. Nature 458, 1018–1021.
Best, A., White, A., Boots, M., 2009. The implications of coevolutionary dynamics to host-parasite interactions.The American Naturalist 173 (6), 779–791.
Caval, D., Ferriere, R., 2010. A unified model for the coevolution of resistance, tolerance, and virulence. Evolution64, 2988–3–9.
Chen, H.-W., Liu, W.-C., Davis, A. J., Jordan, F., Hwang, M.-J., Shao, K.-T., 2008. Network position of hosts infood webs and their parasite diversity. Oikos 117, 1847–1855.
Cobey, S., Pascual, M., Dieckmann, U., 2010. Ecological factors driving the long-term evolution of influenza’s hostrange. Proc. R. Soc. B 277, 2803–2810.
de Mazancourt, C., Dieckmann, U., 2004. Trade-off geometries and frequency-dependent selection. The AmericanNaturalist 164 (6), 765–778.
Dercole, F., Irisson, J.-O., Rinaldi, S., 2003. Bifurcation analysis of a predator-prey coevolution model. SIAM J.Appl. Math. 63, 1378–1391.
Dieckmann, U., Law, R., 1996. The dynamical theory of coevolution: a derivation from stochastic ecologicalprocesses. J. Math. Biol. 34, 579–612.
Drossel, B., McKane, A., 2005. Modelling food webs. In: Bornholdt, S., Schuster, H. (Eds.), Handbook of Graphsand Networks: From the Genome to the Internet. Wiley-VCH Verlag GmbH & Co. KGaA, Weinheim, FRG.
Feliu, C., Renaud, F., Catzeflis, F., Hugot, J.-P., Durand, P., Morand, S., 1997. A comparative analysis of parasitespecies richness of Iberian rodents. Parasitology 115, 453–466.
Flores, C. O., Meyer, J. R., Valverde, S., Farr, L., Weitz, J. S., 2011. Statistical structure of host-phage interactions.PNAS 108, E288–E297.
Geritz, S., Kisdi, E., Meszena, G., Metz, J., 1998. Evolutionary singular strategies and the adaptive growth andbranching of the evolutionary tree. Evolutionary Ecology 12, 35–57.
Graham, S. P., Hassan, H. K., Burkett-Cadena, N. D., Guyer, C., Unnasch, T. R., 2009. Nestedness ofeectoparasite-vertebrate host networks. PLoS ONE 4, 1–8.
Hart, B. L., 1988. Behavioral adaptations to pathogens and parasites: five strategies. Neuroscience and Biobehav-ioral Reviews 14, 273–294.
Hernandez, A. D., Sukhdeo, M. V., 2008. Parasites alter the topology of a stream food web across seasons.Oecologia 156, 613–624.
Hurford, A., Cownden, D., Day, T., 2010. Next-generation tools for evolutionary invasion analyses. J. R. Soc.Interface 7, 561–571.
Ings, T. C., Montoya, J. M., Bascompte, J., Bluthgen, N., Brown, L., Dormann, C. F., Edwards, F., Figueroa, D.,Jacob, U., Jones, J. I., Lauridsen, R. B., Ledger, M. E., Lewis, H. M., Olsesen, J. M., van Veen, F. F., Warren,P. H., Woodward, G., 2009. Ecological networks - beyond food webs. Journal of Animal Ecology 78, 253–269.
Joppa, L. N., Bascompte, J. M., Sole, R. V., Sanderson, J., Pimm, S. L., 2009. Reciprocal specialization inecological networks. Ecology Letters 12, 961–969.
Joppa, L. N., Montoya, J. M., Sole, R., Sanderson, J., Pimm, S. L., 2010. On nestedness in ecological networks.Evolutionary Ecology Research 12, 35–46.
Kisdi, E., 2006. Trade-off geometries and the adaptive dynamics of two co-evolving species. Evolutionary EcologyResearch 8, 959–973.
Lafferty, K. D., Dobson, A. P., Kuris, A. M., 2006. Parasites dominate food web links. PNAS 103 (30), 11211–11216.
Law, R., Bronstein, J. L., Ferriere, R., 2001. On mutualists and exploiters: plant-insect coevolution in pollinatingseed-parasite systems. J. Theor. Biol. 212, 373–389.
Lewinsohn, T. M., Prado, P. I., Jordano, P., Bascompte, J., Olesen, J. M., 2006. Structure in plant-animalinteraction assemblages. Oikos 113, 174–184.
Marcogliese, D., 2002. Food webs and the transmission of parasites to marine fish. Parasitology 124, S83–S99.May, R., Anderson, R., 1983. Epidemiology and genetics in the coevolution of parasites and hosts. Proc. R. Soc.
Lond. B 219, 281–313.McGill, B. J., Brown, J. S., 2007. Evolutionary game theory and adaptive dynamics of continuous traits. Annu.
Rev. Eco. Evol. Syst. 38, 403–435.Møller, A., Christe, P., Garamszegi, L., 2005. Coevolutionary arms races: increased host immune defense promotes
specialization by avian fleas. J. Evol. Biol. 18, 46–59.Montoya, J. M., Pimm, S. L., Sole, R. V., 2006. Ecological networks and their fragility. Nature 442, 259–264.Morand, S., Poulin, R., 1998. Density, body mass and parasite species richness of terrestrial mammals. Evolution-
18
ary Ecology 12, 717–727.Nunn, C. L., Altizer, S., Jones, K. E., Sechrest, W., 2003. Comparative tests of parasite species richness in
primates. The American Naturalist 162, 597–614.Poitrineau, K., Brown, S., Hochberg, M., 2003. Defence against multiple enemies. J. Evol. Biol. 16, 1319–1327.Poulin, R., 1997. Parasite faunas of freshwater fish: the relationship between richness and the specificity of para-
sites. International Journal for Parasitology 27 (9), 1091–1098.Poulin, R., 1998. Large-scale patterns of host use by parasites of freshwater fishes. Ecology Letters 1, 118–128.Poulin, R., 2007. Are there general laws in parasite ecology? Parasitology 134, 763–776.Poulin, R., 2010. Network analysis shining light on parasite ecology and diversity. Trends in Parasitology 26,
492–498.Poulin, R., Guegan, J.-F., 2000. Nestedness, anti-nestedness, and the relationship between prevalence and intensity
in ectoparasite assemblages of marine fish: a spatial model of species coexistence. International Journal forParasitology 30, 1147–1152.
Poulin, R., Leung, T., 2011. Body size, trophic level, and the use of fish as transmission routes by parasites.Oecologia 166, 731–738.
Poulin, R., Morand, S., 2004. Parasite Biodiversity, 1st Edition. Smithsonian Institution, pp. 43–52, 86–90, 153–157.
Rezende, E. L., Jordano, P., Bascompte, J., 2007. Effects of phenotypic complementarity and phylogeny on thenested structure of mutualistic networks. Oikos 116, 1919–1929.
Rueffler, C., Van Dooren, T. J., Metz, J. A., 2006. The evolution of resource specialization through frequency-dependent and frequency-independent mechanisms. The American Naturalist 167, 81–93.
Thebault, E., Fontaine, C., 2008. Does asymmetric specialization differ between mutualistic and trophic networks?Oikos 117, 555–563.
Thompson, J. N., 2005. The Geographic Mosaic of Coevolution, 1st Edition. The University of Chicago Press, pp.93–95, 246–259.
Valtonen, E., Pulkkinen, K., Poulin, R., Julkunen, M., 2001. The structure of parasitic component communitiesin brackish water fishes of the northeastern baltic sea. Parasitology 122, 471–481.
Vazquez, D. P., Aizen, M. A., 2003. Null model analyses of specialization in plant-pollinator interactions. Ecology84, 2493–2501.
Vazquez, D. P., Aizen, M. A., 2004. Asymmetric specialization: a pervasive feature of plant-pollinator interactions.Ecology 85 (5), 1251–1257.
Vazquez, D. P., Bluthgen, N., Cagnolo, L., Chacoff, N. P., 2009. Uniting pattern and process in plant-animalmutualistic networks: a review. Annals of Botany 103, 1445–1457.
Vazquez, D. P., Poulin, R., Krasnov, B. R., Shenbrot, G. I., 2005. Species abundance and the distribution ofspecialization in host-parasite interaction networks. Journal of Animal Ecology 74, 946–955.
19
Related Documents