AN EXTENSION OF COCHRAN'S TEST ~ri FOR HO0MOGENEITY OF VARIANCES BY H. SOLOMON and M. A. STEPHENS TECHNICAL REPORT NO. 419 ~\UGUST 8, 1989 Prepared Under Contract N00014-89-i.-1627 (NR-042-267) For the Office of Naval Research Herbert Solomon, Project Director Reproduct ,n in Whole or in Part is Permitted for any purpose of the United States Government Approved [or public release; distribution unlimited. 'EPART>. 'NT OF STATISTICS L)TIC STANFORD UNIVERSITY ELECTE 17 STANFORD, CALIFORNIA AUG 08 3989

Welcome message from author
This document is posted to help you gain knowledge. Please leave a comment to let me know what you think about it! Share it to your friends and learn new things together.
Transcript

AN EXTENSION OF COCHRAN'S TEST
~ri FOR HO0MOGENEITY OF VARIANCES
BY
H. SOLOMON and M. A. STEPHENS
TECHNICAL REPORT NO. 419
~\UGUST 8, 1989
Prepared Under Contract
N00014-89-i.-1627 (NR-042-267)
For the Office of Naval Research
Herbert Solomon, Project Director
Reproduct ,n in Whole or in Part is Permittedfor any purpose of the United States Government
Approved [or public release; distribution unlimited.
'EPART>. 'NT OF STATISTICS L)TICSTANFORD UNIVERSITY ELECTE 17STANFORD, CALIFORNIA AUG 08 3989

1. Introduction
Cochran's (1941) well-known test for equality of k normal population variances pro-
ceeds as follows. Let o, i = 1,..., k, be the population variances, and the null hypothesis
is
H0 = 2 = = = , say. (1)
Suppose k sample variances, one from each population. are given, each based on n degrees
of freedom; let the values be s .. k. Let these be ranked, so that, labelled in
ascending order, the values are sf1 ) < 2... < S 2)" To test H 0 , Cochran suggested the
statistic
(2Z = Sh /Y (2)
where Y = E= 1S., Thus the statistic compares the largest sample variance with the
sum of all variances, and is clearly appropriate to test H0 against the alternative that one
population variance is larger than the rest. Solomon and Stephens (1989) have recently
given very complete tables of the distribution of Z and have described, in particular, the
usefulness of the test in process control; for example, to see if the largest variance in a
sample of one week's daily output is excessively large. Solomon and Stephens (1989) also
give references to earlier literature and to other applications, particularly for n = 2, to
testing for white noise in time series analysis.
The question has been raised what to do if it is suspected that more than one vari-
ance is particularly large compared to the others, perhaps, say, in examining 30 daily vari-
ances from one month's output. One might propose to apply Cochran's test successively:
when one variance has been found too high, remove it and repeat the test on k - 1 vari-
ances; continue this procedure, rejecting the largest of the current set of variances, till no
further significance is found for Z. However, for such a technique, it is virtually impossi-
ble to evaluate the overall significance level, that is, to find the probability of rejecting m
variances, if this is what happens, when H0 is true.
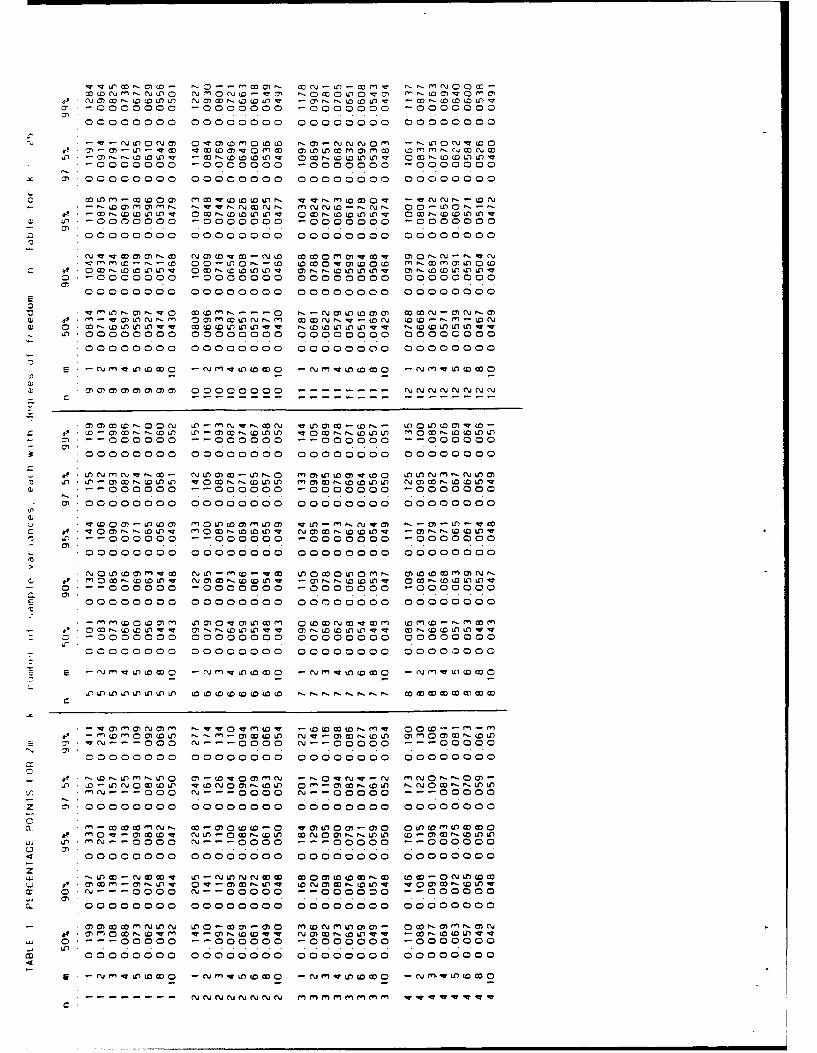
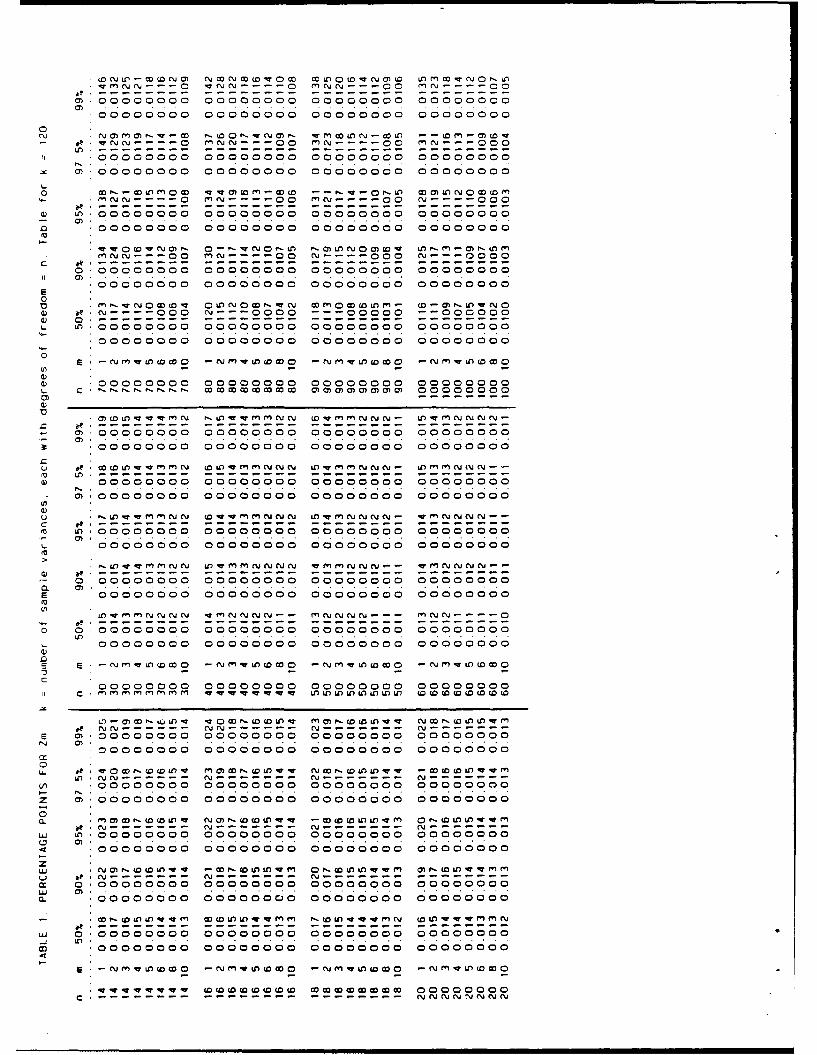
In this article extensive tables are given to test the hypothesis of k equal variances,
each with n degrees of freedom, where rejection would indicate that the m-th largest sample
variance is an outlier. This is based on the ratio of the m-th largest sample variance toin.. .i .. Au/or
2 Dist J Special

the sum Y. Thus the test statistic is
s2ZM = S(k+l-).y (3)
Y
Cochran's statistic Z, defined in (2) is identical to Z 1 . The rationale behind this test is as
follows. When the s? are ranked, we can imagine them plotted against the expected values
of k ordered chi-square variables, with degrees of freedom n. If Ho is true, the plot should
appear like a straight line. A commonly occurring alternative to the straight line plot, oc-
curring in data analysis, is a plot in which the smallest s? values are close to a straight
line, but, say, the top m values are all too large to be on the line. Suppose, then, the m-th
largest s?, that is s .. is significantly large. The other larger s?, namely s 2Iag s I
i ,.kl - ) (+2-m),
S2 k+3_,) , etc., will probably be large also, even if not themselves significantly large. be-
cause they must be in order of increasing size. Such an event (s2 significantly large)((k+lm) sgiiatylre
will suggest that m population variances are larger than all the others. When, as usually
happens, the value of a 2 in H0 is not known, it is necessary to divide by Y in order to
obtain a scale-free statistic, and this leads to the statistic Zm. The statistic is not formally
developed as, say, a likelihood-ratio statistic, but will be useful in analyzing real data on
variances, such as arise in quality assurance; in the example quoted above, several vari-
ances during the course of a month may have appeared to be too large, and the test can
be used to examine this possibility.
The test procedure is set out below, and the t',Ory of the test, together with some
comments, is given in Section 3.
2. Test Procedure
The steps in making the test are:
(a) Rank the k given sample variances (which must be independent and each based
on n degrees of freedom): s0,) <(2) k)< )"
(b) Calculate Zm from (3), where Y = s2 + + + 2
(c) Refer to Table 1 for the appropriate values of k, degrees of freedom n and n..
(d) If Zm is larger than the value given for significance level a. reject H0 at level a.
3
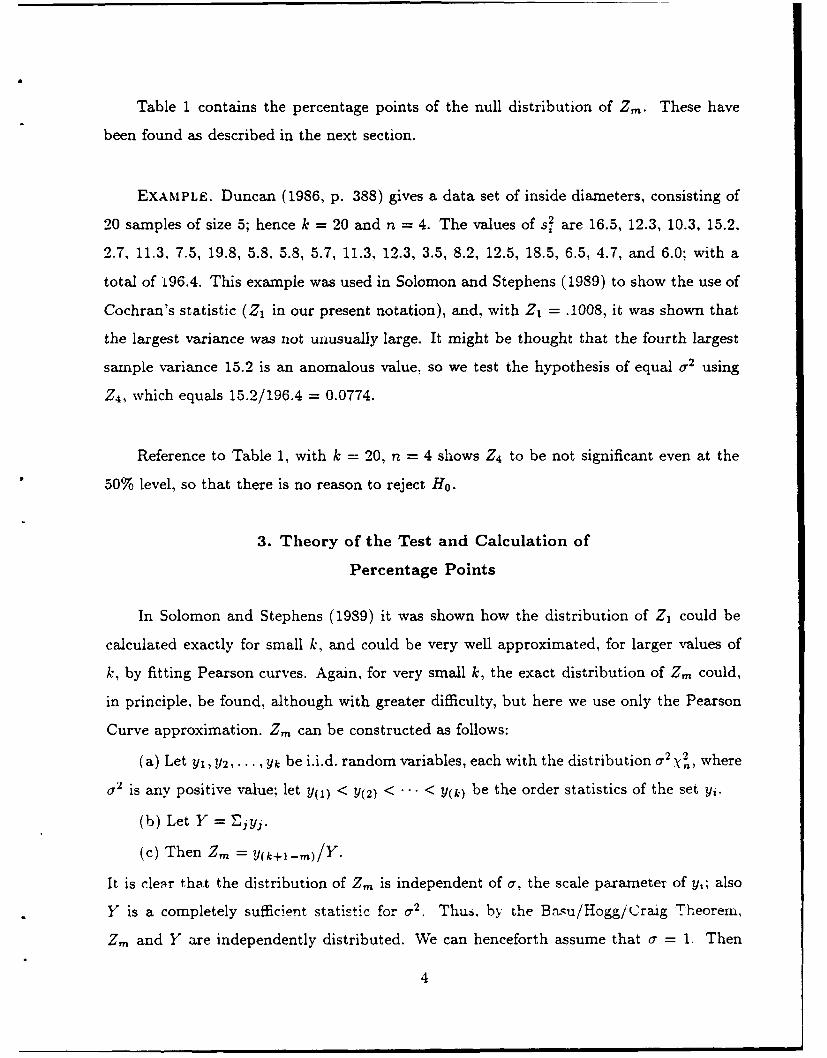
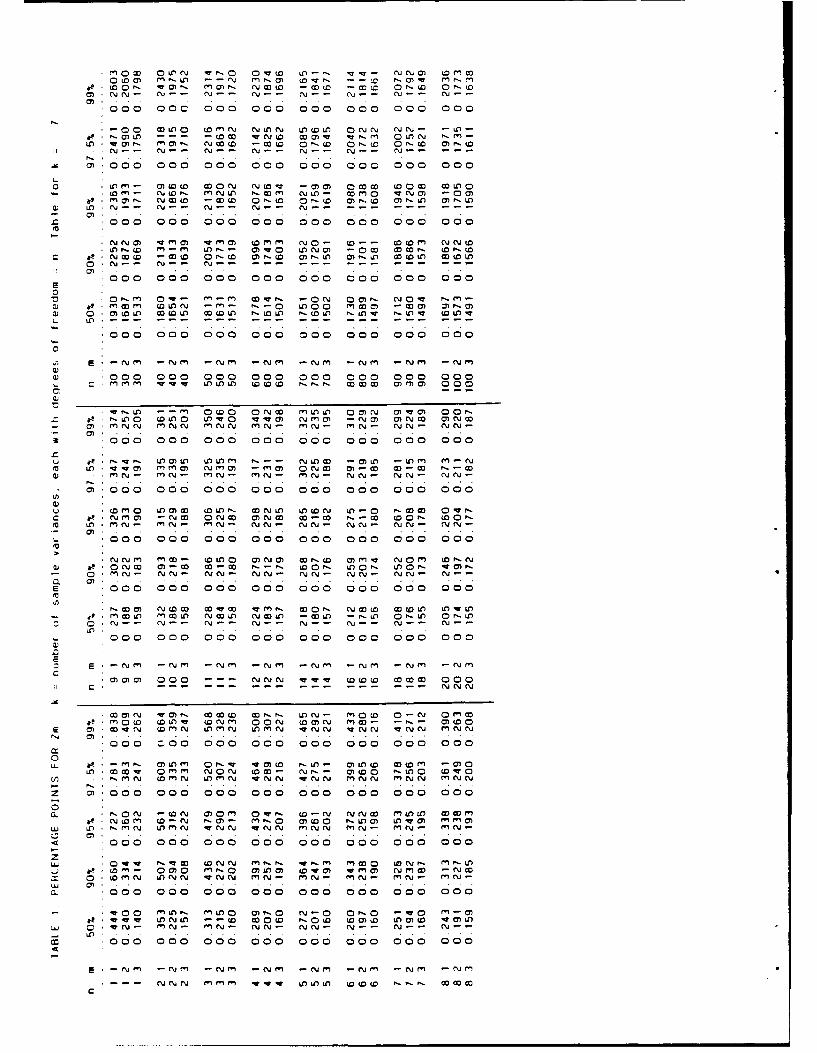
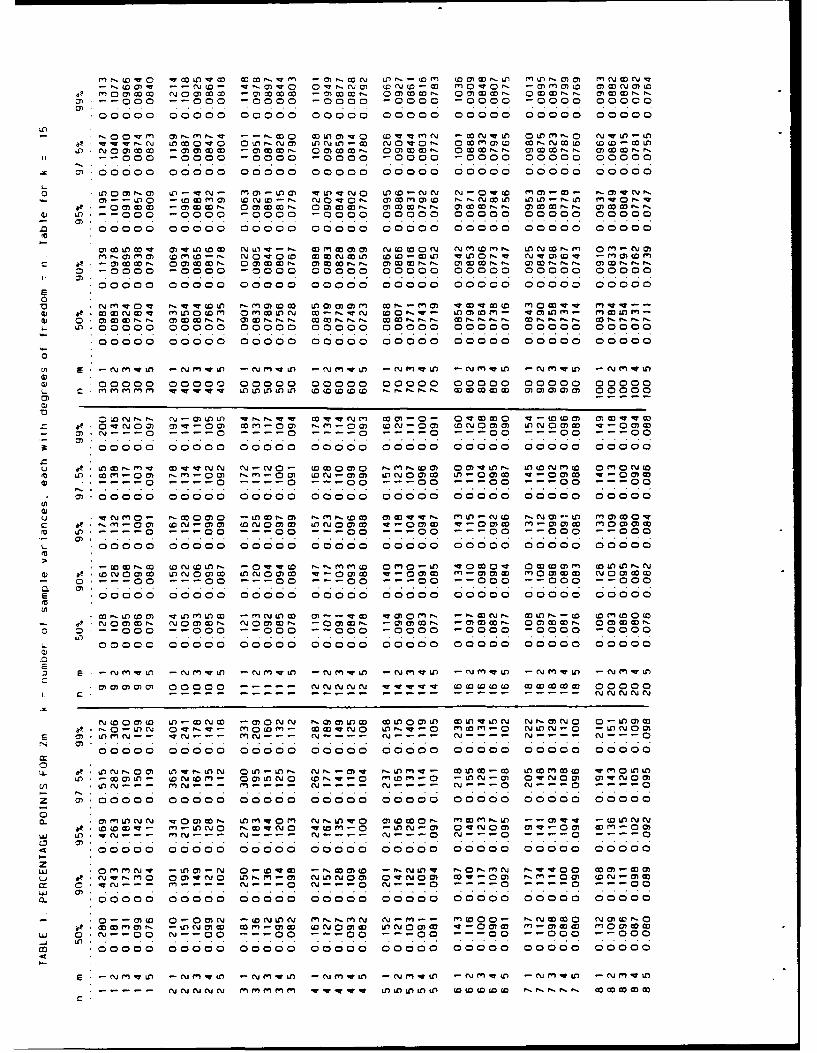
Table 1 contains the percentage points of the null distribution of Z,,. These have
been found as described in the next section.
EXAMPLE. Duncan (1986, p. 388) gives a data set of inside diameters, consisting of
20 samples of size 5; hence k = 20 and n = 4. The values of s? are 16.5, 12.3, 10.3, 15.2,
2.7, 11.3, 7.5, 19.8, 5.8. 5.8, 5.7, 11.3, 12.3, 3.5, 8.2, 12.5, 18.5, 6.5, 4.7, and 6.0; with a
total of i96.4. This example was used in Solomon and Stephens (1989) to show the use of
Cochran's statistic (Z 1 in our present notation), and, with Z1 = .1008, it was shown that
the largest variance was not unusually large. It might be thought that the fourth largest
sample variance 15.2 is an anomalous value, so we test the hypothesis of equal Or2 using
Z 4 , which equals 15.2/196.4 = 0.0774.
Reference to Table 1, with k = 20, n = 4 shows Z4 to be not significant even at the
50% level, so that there is no reason to reject H0 .
3. Theory of the Test and Calculation of
Percentage Points
In Solomon and Stephens (1989) it was shown how the distribution of Z1 could be
calculated exactly for small k, and could be very well approximated., for larger values of
k, by fitting Pearson curves. Again, for very small k, the exact distribution of Z,,, could,
in principle, be found, although with greater difficulty, but here we use only the Pearson
Curve approximation. Z, can be constructed as follows:
(a) Let Y1, Y2,... Yk be i.i.d. random variables, each with the distribution a2,yn, where
a2 is any positive value; let Y(1) < Y(2) < ... < Y(k) be the order statistics of the set yi.
(b) Let Y = Ejyj.
(c) Then Z,, = Y(k+1-,,m)/Y.
It is clear that the distribution of Z.. is independent of a, the scale parameter of y,; also
Y is a completely sufficient statistic for a 2. Thus, by the Ba.u/Hogg/Craig Theorem,
Z, and Y are independently distributed. We can henceforth assume that a = 1. Then
4

ZmIY - Y(k+1-m), and we have
E (Yrk+l-m)) (4)E(M, E(y- ) ,(4
where E(.) denotes expectation. The denominator of (4) is easy to find, since Y is a X2 -
variable with kn degrees of freedom: then
EI r ) = 2r{(kn + 2r)/2}E(Y) r(kn/2) (5)
For the distribution of Y(k+l-m), let G(t) be the distribution, and g(t) the density, of y2;
then E(yr)), for any i (1 < i < k) is
. ,.)) n! 00 trG'-l(t)[1- G(t)]n-ig(t)dt.
(i (n - i)!(i - 1)! (6)
The moments of Y(k+l--m) can be calculated from (6), and hence, using (4) and (5), the
moments of Zm can be found. The first 4 moments have been used to fit Pearson curves to
the distribution of Zm, as described by Solomon and Stephens (1978), and hence to obtain
percentage points of Zm. These can be expected to be very accurate, especially in the long
upper tail which will be used, in general, in the present application.
COMMENTS ON TABLE 1. (1) The case n = 2. For this case, the ' distribution is
essentially the exponential distribution, and the special properties of this distribution can
be used to give an exact answer to the probability (Zm > z). This was done by Fisher
(1929) in connection with testing for white noise in time series, and by Stevens (1939),
in connection with a problem in geometric probability. Fisher (1940) discussed the two
problems, and gave a small table of upper 5% points of Zm, for m = 1 and 2. (Z 1 and Z2
are there called gi and g2). A comparison of our points with Fisher's is given in the small
table following: P.C. refers to the Pearson curve points, F to the exact points as given by
Fisher.
5

k: 5 10 20 30
m = 1 F .6838* .4449 .2704 .1978
m = 1 P.C. .6838* .4437 .2700 .1977
m = 2 F .3670* .2651 .1755 .1336
m = 2 P.C. .3653 .2641 .1753 .1335
*These are exact results, see comment (2) below.
It is clear that the Pearson curve fits give excellent results; calculations show that the
errors in a given by using the P.C. points at the 5% level will be less than 0.25%.
(2) For m = 1 an exact formila is available for P(Zm > z) when z > 0.5. This was
used in Solomon and Stephens (1989) and is again used in the present Table 1, which
repeats results for m = 1 for the sake of completeness.
(3) As a check, we calculated the moments of Y(k+l-m) using several available algo-
rithms for the incomplete Gamma distribution. Table 1 as given uses the most recent,
by Shea (1988). Other algorithms gave essentially the same values in the upper tail, but
slightly different values in the lower tail, especially for small k and n. The lower tail is, of
course, much less likely to be used in applications, and, to make the Table of manageable
size, we give only the upper tail points. A much more extensive table including the lower
tail, is available from the second author.
This work was partially supported by the Natural Sciences and Engineering Research
Council of Canada, and by the U. S. Office of Naval Research, and the authors express
thanks to both of these agencies.
References
Cochran, W. G. (1941). The distribution of the largest of a set of estimated variances as
a fraction of their total, Annals of Eugenics 11, 47-52.
Duncan, A. J. (1986). Quality Control and Industrial Statistics. Irwin: Holmwood. Illinois.
Fisher, R. A. (1929). Tests of significance in harmonic analysis. Proceedings of the Royal
Society, A 125, 54-9.
Fisher, R. A. (1940). On the similarity of the distributions found for the test of significance
6

in harmonic analysis, and in Stevens's problem in geometric probability, Annals of
Eugenics 10, 14-17.
Shea, B. L. (1988). Chi-squared and Incomplete Gamma Integral. Algorithm AS 239,
Applied Statistics 37, 466-473.
Solomon, H. and Stephens, M. A. (1978). Approximations to density functions using
Pearson curves, Journal of the American Statistical Association 73, 153-160.
Solomon, H. and Stephens, M. A. (1989). Percentage points for Cochran's test for equality
of variances, Journal of Quality Technology, to appear.
Stevens, W. L. (1939). Solution to a geometrical problem in probability, Annals of Eugenics
9, 315-20.
7

4 ) " "0) )- -r f)U Wqf cv m -a U') N-a ro . Y - N(0O N -Wt' CN 0 m -WN l C -MO N0~ 0~-M
a,. mN C NN r~ CjC N M N mNCjN NNN N N N NjciC\J N N
000O 000 000 000 000 000 000 c00
U-)
o m W ~j- U-0'- mNO CO') w N.O a)w- r -m- W0-u'
r n ~ mNN mNCjN NN cuN N NN NNNC~ r N j N NNCj NcuJ
.0 00 000 000 000 000 000 000 000
c~ 0 - it CY m N a) - nm Wcj CON to O r) 0 00mNN 0N -aN WN wN NNo MN W nz C nN
000CO 000 000 C00 000 000 000 000
E0
.Dr- .N Nj COa) - Ltn M -t 00M L -0 w M - f._cc N
0 U) N 'N7, U-c -a 0) -a -aCM rn -a, rn -a,) r- a, r- a,u') NN Ci- N Cj-N N - N N N- N N- e'UN N C C
0 00 0 00 0 00 0 00 0 00 0 00 0 00 000
0
cLn E -N M - Nj ~ - Cj M -NMM - Nj - Nmr - n~ -N M
~00 0 0 00 0 00 000 0 00 0 00 000 000*f mrn M rw- uU,)U) 0(D( ID cr- W co 0)00 000)co
e Z0 MZW UD:: o (0( cNLfl ~0 c a 0 (Lo0) c U)fLC)-o a L'Ncf W - Lfl -W V 0 vt~ N0 0a,)qT C7 o~~ rn WWM
cT a.re \J w mn j-anCU Wm CmN win ~m ~NN m N M ~NIt 000 000 000 000 000 000 000 000
u 0 -Lo -- ) LoN W X N. Wr, Lrr- v-rN NN f rnm m ,. m~jenVcv LC) U - morn N 0, M -(3)M a com W co N m (f, m
(U- * MCj - l CinN -Wn cNN \A m C MnI inN i mN rnN ~NCF co00 000 000 000 000 000 000 000
u V M M - 0 N - LO - N N 0 OC V, NCJ- n WC C DO LLc - ~ N0) m -~r W ~ (" ~ r 0 W-.Mr-0M C~j \j r.- to U-~O cv WC\
m U) -NN WNN qewC M -TCj j N CNN in NOj (n NN rn c (V (n ANcu
COO00 0 000 000 000 000 000 000
0*,0w~ MnOV VMMi COON mtn- MM -Va, '-(0rn - ~ a,~N Cr .C\ Cj '-N~ CN-N f r U CN mCN mu'- Ci (nJ fl
CI .0, . . .. .E . 000 000 000 000 000 000 000 000
: M - - M 0C\ 0 17N V MM ,--W -a 0 WM C \J Nr 0c
0inN- MnN - NN Ci- NNCJ- NN. M- N CN- N N- NNjM
CO 000 ) 000 000 00 000 000 000 000
: S - Nmr - Cirn - N M m - jm -N im -r -NjM - Nm
0,0,0, c 000 - -- N NN w- a U ( (0 co 000co
coN cc 00 Y Nj t OU') . rn m ,-r ? v 0 m m ( QLC (O W' - .C~'Nw- 0r- C oQ into W c Ll Ll Uw -cU-)' je N U( 0 Cv
0) -a 0 N - - CjN (mN cojM NMC LC fn j U'm N uin n Cj V f u N
~00 0 0 00 0 00 0 00 0 00 0 00 000 00 0
$ -0 0 -W o 0) -aM o L,- I ', N L ( NL !-a M.-
UlNm Nw N N W N u' mNe &'nN 0fnN Wm N v enN
z C3)0o0 000 000 000 000 000 000 000
LJ u'.r m COM j W nN LC) nN( U'mNc Ln N - nMN -w MN -aNN c
< 000 000 000 000 000 000 000 000
L. \) w .N.wN. ~ N N C7) 0- N (DO 0 l 0-,mN N WN 0 coNcr 0N N Cviru (D NC U-) rN v MN T MNCj - iCl - l q'N qNN ~N
'000Oo 000 000 000 000 000 000 000
m-- nL)L )L r- NW f mmN V-aa WC~ um c -e- CC) N C -M
cc 0 00 0 00 0 00 0 00 000 0 00 000 0 00
SNm - N - rN - Nm - N -Nm - Nm -NcuM
N NN mM n -W T fuu -WOC X)-N U)V DW oWc

(3 C O CM0 -- MC 0)C W L ( v o MC v~a MON coz
~C00C~ C N -0 A0 Nfl -0~ ~jC ~jC;- O~jC0j- N ~
CI Dc 00 0 W cY u'-0 LC n a)~ 0 v Cj N
Hu . C\J Nr C~j N ~ C.J C\J - cOj NC\ C~j
C-3 0~.00 00 0 0 0000 o 0 0 0 00c .0 0 00 000a
0 oo rj U'C) 0-'- MqLO cu - .7 C)0)M - ~ru -U'-
d.J N' C\JC' N C\Cj (C\j ru C\1 %J N -- C'j' C\j -
M:000 000 000 000 000 000 0o0 000
'-.J C0 N0M MON w 0 0 0 0 '-MM ~(V M0 c C\ U -~ C' N o - ~jso - C~ CUOj - i~ -j-- Cl'- -o\ '-
c000 000 000 000 000 000 000 000E0V 0wcDOu MVO NNW~~ oom OMO MMM q.-(0 MN.U
d) a .0C'J Mv MOto -w0 Q- -M Z M N0 -- 0 LC) 00Lr) 0 l N (\Jj -- -~ -w. -~ - -- -O~ -
000 000 000 000 000 000 000 000
0 00 0o0 0 00 0 00 000 000 0 00 000M n w 7 LrOLo 0 Q (D(( ED r. M M o a) ) 000co
C~j U'Ur) CC ~0 r LC(10fl U'O m -Mo r~j.m C'J n N- w0-~ M rJ 0 M J a) - 2, to (0C U'Lr)0- - ~Lfl - M
0) 'r n~j(. N J( -a CirJirnN M NCj C" mcu e~J mrn j M N N M cl N
000 000) 000 000 000 000 000 000
o O cM-'- moo(U (0CM am,- M(NJO ~-(0 ONOJU MW(MU' M-Z - 0 00 00l-f vLn0 mr o n 0 N -MO0
r re mcljc mcrcn N C\C\\&li rc M~C~j M Cj cu J (N M C\j N NC(v
*7 o0 00 000 000 000 00a0 000 000 00 0
wo Wo00 c0'( M 0(0f V'NM Fn GO- a~O -a0) U -c tooID- 0nn 0 U'L1)0 M -w0 CU-e0 -MO 0mCo OMMM
0 M' . V NCh M N Ns M NJC N MNN(' M C. M N N M C\J- (\j.-
00 00 0 0 000 000 0 000o 00 0
CU0 Vo Q P,~O -M V WmO OWO r, (0O M CO-n 0' C~jC MnC\j Nj M J MCSJ MCN- NC\J - CN M -~j\ (C\.Cj~
co '000 00 00 0 000 000 000 000
(D - : W (O 0 ( - oc0 0 U0 - ~0 r -~0 MQr a) n Co \jC ~ C\J~ - V N- C\j N- t\jRJ- Cj rJ- C ~ C\u-
-.(\j M .- U N (Nti M r ~ n ~ -CJ
M Lo 0) ~ ~ Y oq 00 CtcJ\ -W 0a) o -W (0( 0 00Y jG
MLLO C\JNO (D c 0co0 'ul c M -' u " CK 00) CD 01- OI)'JN-M (r\( C\LOU VIUU CDMU M\(j' C(0OnCj nCi Loc wM N wC~j -MO)tN
'.- .~ ..C000 000 000 000 000 000 000 000
M - N IM rJ OjMN %j -w(~ ~M ('j qCtJCCj wC\j CU -0c\J('
2 C0'000 000c000a000 000 00a0 00 0 0 00
COP MM Mn- Cj J G)cu -wco- M, 0- (c o
< 000 000 000 000 000 000 000 000
z~IL _ ( 0 . 0 W - en - 0v-.0 co W 0 bcOLnO U") 0
000oc 000 000 000 000 000 000 000
0 co U(M 0-0 (mm N CIIO U-(t N~~' M~ - " Wf Lo (%JM$(Oq V ~ L C)V ) w 0 N Nj~ 0 C\J~ C~ (0O
"i -w\J Ml n v- MnN - M N M N.- C~ (N- NN C- NN Cj-
M0 Oo 000 000 000 000 000 000 000
N N-N -N F"N -NVI -N M0 DNWW - MMD-
NN M '' 'fbf 000c(((
M mo- C~ Oif' r-0 0~ Nf~ (\ - ruO N~
'000 000 000 000 000) 000 000 000
*-00 Co U) 0 C"rN N L)CN V U(D LS ONN NN rf 'i- -L.
U-) 'wCM 0 C~jG ( NLo 0 cc 0 0 0 a).. D
HI 'Nj N~j N'- N N .-- N- Cj -
-' O00 000 000D 000 000 000 000 000
0 ofm- OWCDO WON NOV~ -a , M ) 000M c CO CO X)0(D cM- Ci N Lo PmNLA O m N~j ' - co Na -00cm
0 ma, N - Oa r-w Or-.o m Pl. (D ,-g a0r-
z 0 0000 000 00 0 00.00 000 0 0 0 0 0 0
*NCN J, ~m M ~ma M WMm NO 0- (0-- =CM NNWDLr rn-rn U .- av0 OtNO -am W W Dl P,
a 0 NCajW - Go 0--f.0 cmr- ( ()cO') 0 a -) ~C LC) M OU')0 ry N- N --------------
0 00 0 00 000 0 00 0 00 000 00C0 000E0
Or-M Ov- rn-M W - -ON 0 0) C- N0' v .m
Ln ---- ---mcOO - -n- '-- - --- --- - -- , ---
*000 000 000) 000 000 000 000 000
~' E N M -CNuM -NC'M - N m - Nm -NCiM -N M - MJm
*000 000 000 000 000 000) 000 000
*~O -- mn OcO 0NM MoLo DO)N MVMa or*--) C'LO 0 u)0 Lova vvma NiaM -No M NN aCW
0)a~N rn CuCj MN Cuj Ml ~Cu~ M N- inNJ- MN N N- CN N
00 00 0 0 )0 000 000C 000 000C 000
uq F.Q- IfLnMCC Lo CM C-- NL o~ -a0 Lo - m mn- Nm * -'a C? ima) Ninma, -mma, N 0CW W- *- W
M M in- in N- inNCJ- MiN- inNC)- Cuj- N N NN-\
(-mOo 000 000 c 0 00 000 0 00 000 000U)
u mmai omm W U) CK)r- ~N Lf LCo c Lf - 0 DC 0 -c Nina,0 -N W 0CuM ONO W- !'.- W 0 0 - Co0om ,- inM - inN- f iN - Cuu C uj- CuN Cu- NNj NN V ~
CY co o 000 00 00 0 0 0 00c .0 0 00 000
0uu ma c 3. - C - CO Q01 C aPa 0PC v~m Cui c r-- 0r \j - NN Cj- N N- N N NN-V CuN- NC u Cu
00 000 000 000 000 000 000 000
coM ,jQMa, wcO Mq' rp- w0o Nwco 0 ~C Lo U") w U0 - o - Cc m LC)O N LL Cui o L - WLP - Lo 0 P-L) 0 L
ONmi- - N - Cu- Cu-- N- N~ N ~000 000 000 000 000 000 000 000
'Z E -Nm f - Nmr -NCjm '- c n m - Nirn - Nm -NC.)Mc
M~~a 000c o - N NN lwI (0 Q(0 00Wc 000
W~, CY) i cuO -W m inNG CO L)M- m 0co 0-CuJ 0 MW0 m 0 ( ( OLA -a~ i W OO m 00N W 0),N (n- ~- M'OO
'000 zoo Dooo 000 000 000 000 000
m a -' moum 0 ' -W vmo c o m- M~~c Lr)W 0 -aM CLr 0 Oq mm NO0N toCO - eur*- - M co ~LC0 (D 1w0
U ~ (Oinm MN mLnm N -W N i-aCo mN icu N m)N N m NN
0) coo0 000 000) 000 000 000 000 000
~N D M c-N '-a,'- m f,0 aMbO P, 0m L Moa ima, Iuj LO m finCJ )MN -WCNjN It N mN m MN- r ~N- iN -L: a,, .
000 000 000 000c 000 000 000 000
0 V qwb W WN N mn Wm rno 0 N F- m P. 0
- 0cMN LON N -W 'NN MnN - mnN M N - ~ iN
a.a 00 000 0 00 000 0 00 0 00 0 00 000
84 a w0 -a min N -- W0 N 0 or-)o -qo rn-a, LSD -0N - inN - MnN - CYN N N -N-- N
Lo. .. .
'000 000 000 000 000 000 000 000
E - -Nmf - C\mf -Ncm -Ncifn -NClm - N in - -N m
rlN N mmm -a ) V innn IDcwcc CO-' W ccc

0000 0000 0000 1 0 000 0000 - 0 U ( D0 0000 0 00 00000- N -.
00000 00000 00000 00000 00000 00000 00000 00000
*g;; 0 0 zm 0u V Lo ;omo mo ( v u-w o o~ - N m (OLOOC z M M N a n ) Y
C n M~ ocu J 0oo m Nm c 0 M~ M nq wm cu ~ nm 0 (D Lr) WU 0 - rn LC) 0)0- 00 - - - - - - - - --
00000OO 00000 00000 00000 00000 00000 00000 00000
00000CO 00000 00000 00000 00000 00000 00000 00000
C) 00000 00000 00000 00000 00000 00000 00000 00000E ~ 'o ~ ~ ~ 'a 0 00
T NMCO leCJ~L en ~ Ll. N D r S Cm 0 - L L) r "-0 L ( 0-w ~ N -W MNm- o o m \--- -- --- -~--- -- ~--- -- C%-- -\CJ~ -- JC--- r----
COC 0000 000 00000 00000 00000 00000 00000 00000
LlNM aw m-jN-m m %- 0 (\NMV C-jMj-- -e -- N m- N V mv0 -Nm
oc* aco0000 00000 00000 00000 000 0 0 00 00000 00000
VM 0 MV M nm;;m-NL~m~-~~ ionm MOO!Mom -CJCOww -N N mwc WmM LCu M\C\- CjC~i C\J J N -- - N N- --
00 0 0000 0 00 0 0 0000oen0 nm ( o U 000 0000 00000Ta -
Q) MN .2 m N t2l :2 -N ' 0N C m N O-- C N --0C\ --- J- -mo. Nf0 . - - -
0 . . . .
E n 000 0 0000 ( 00000 D 0 0 000 00 0 00 00 0 00 0 0 000 00 00 0'V
- - N'-.~j 0('C\J 0 - C Oj ~ u- 04 - - - - - - - OC O'j - -- -rC'-J- - - CU - -
fl. . . . . . . . .. . .*00 0 00 0 00000 00000 0 0 000 C 0 0 0 0000 0coc 00000 00000
C j--- C j - - -- C~ - -- N- -- --~J ~ C N - -- Nr'w~ -J f -jm- -
E)~0 00000o COO 0OLDO(OL 000 00 00 0 00000
(o 0 o vC o c -0- - N jco z w m l
* ~~m~C'J C', -lO- N-oun j - ~ ~ --c ~ ' Cr0ocJ o~c.- o
00000 00000 00000 00000 00000 00000 00000 00000OZ0
E - NCm'i L-- ~ jmv mL mo'u-N m~- -a Lo N M--a L0- i~J. m W i NM O i m v --
z ~ 000 00 0 0000 0000 00 0 0 0 0 0 0 00000
-a m OrN 0(0LC o U) N.0O NLn zv Ni~ . O0~U N~C' ~i0 M - 0N
CV fn N - enNc- qN u- C\ -n - jCj- -~ en N V- - - -CJ iN -- -
4 0 000 00000 00000 00000 00000 00000 00000 00000
LL 00ri 0 mN- MN - in -- iN -- inN. t -' inc-jm - CJ~ -W-
C. 0000 0000 0000M T NO M m o m DW0 00 0 0000 00 0 00 0 00000n
m -iN o LI) -o Mo '~ N--qr oitoj VL0OU C\ Vu Md\ -- rn.CO r \J(j
000 0000 00000ccc OOC 00000 00000 00000 00000 00000
0
(D MrJn~l N -Ni) nqinj-- -WNC - r j r -NiMqLN -( -q~ -N~ f M-\iqC -C%J - - - -ri-q-L-
< COO NONCNO 00000ni qq'qqq OC~COLf (O(OOCO0 000 C
z

I n m 0j otrn v mNco c\ mrv(N - N~ mcoVa -a ~ cJ~ r-n N c-'N WMt r~~ CCm\J -eJ - ---- - - -L0M -- -- - 0 W\ L~MC - LfmmjJ fl0N
M:CO.0O 00000 00000 00000 00000 00000 00000 00000
Mo00c 0 D( a)~~O EDlU- -McJ U)-0) CDL~fJ v~L~ ;N O~ CU; mP weN1U-C O Z(
00000C 0 0 00 00 0 00 00000 00000 00000 00000 00000
0 N M0 -* 0ft % (0P1~ t.-C L LD - c LP -rnCO COCO- -- Lo r qV N W CJ N n Nmco
0* 0 - .m -aW mN m w m o V w LMv( ) mL )-
00 0 00 00 0 00 00000 00 C00 0 00 00 00 0 00 00000 C0 000
0v D M ru C "M n0 400( ~N f0 W~t) 0 00 r 0it 0 mCCOq V 0 m ) VN V
0) 0 LfM N cIqI~J .12N qN!j 2NU :J - T M z=zN,.. . . . . . . ...
-00 0 00 0 00000 00000 0 0 00 0 00000 C00000 0C0 00 0
*P -N ( vLO Vr ) -NMvrn LO - eA cjrwLO -NMW Og - m m w - N m WU - N m IV
00000 00000 00000 00000 00000 00000 00000 00000c mr" n W V - v LO LAntinLn ( o (DID(D o o cc a 0) 0) M (m 0 000 0
.c I 0 -L c)M 010o~ ~0 D W N0 ( vm (D0 CYO(DvN L) 00 N A~ vc -coWWcu m COV)m NM o N - -- C-- - C~ NN -- C~ ~ N - -- Cj---- Cj---- r
0 0 000 0 0 000 00 0 00 00000 00000 00000 00000 00000
W W q'WF w m 0 L M N. LUIM N .- 0 m Lp tA 00 000A oL N.CNCD 0 m0 0 -aOVLA* 0OWN N. 0- CDWN LOawCOm LOMCWC\J VW MN mmLmmN NPnLMc Ntomm
0) r J- -- r V-- N---- N---- N---- N-- - N --
M* CC 000000 0000 000 00000 00000 00000 00000 00000
u (D cL tu0~ V (7)M W 0P P, M N qc f--M wmCwm N'-W0 VN OOM0MN 0 P, 0Nc ( - (D v ~N (l) L n ri WC aLf1n c VQDLlC) M mgI Om N N LflMN rMN NC~to LX) *' - z -:: ~
C7 . . . . . . . . . ... . . .L- .00000 00000 00000 00000 00000 00000 00000 00000
%n 0UILAO NMV0 NMNV0 C L Om O) z? N N 0 0 mvm0 w~0 ~N mw01 ~ ~ ~ ~ ~ ' a- -~AM LAM -)M -NL M -r~ -c q OCC - O,
. .~ .* . . . . .
00000000 00000 00000 00000 00000 00000 00000
0 0 C CIAM C 000 00C 0L~- 0 00 00 0 .M0 0 0C 0 0 00 a0 C 0 0 0
00000~~~~~~~~ 00 0 00 0 0 0 0 0 00 0 00 0 0 0 0 0a)0 m ,)) 0
0) -NM -M L -N~ L -N~ L -tI U -NM~L cm~L - WNLm
V LA-W. P,0 O m n M M -. PcOM V LO0 rM a dOLM LM .- 0 MN~A N W mUME) 0) NM ru L M - 'VNN- IWci- C m-- NJ-- - N-C\ M - -- M N - - 1n ---
C) .0 ' . . . . . . . ..00000 00000 00000 00000 00000 00000 00000 00000
(I ( MN u )nN W --- M - M C --- n ' N- - - N-- NNJu-- -
M-000000 OLI-100 00000 00000 00000 00000 00000 00000
0a.C *0) MN.LO . 3 V c\ NN 0 NU c) C ~LANO1 r(D M M to FLIU ( CM - LO t OCP-M W t C0V - V
LUP' Lr. -- f" . r -N - -N-- m Nr -- - m N- NN - -- CJC
4 .00000 IDOOnc 00000 0000c) 00000 00000 00000 00000
t.. $ 0 V.000 M tC - (0 M F V- NNPC F-.w.- 0 -to -aN QD0 UDM N Q M 1Om N L M lA m NLc 0 N LCM - Wrq - M NY- - - MlN -- - M NCJ- -- NN cj- - - \---- ----
U 01. .a. '000 J0~000 00000 00000 00000 00000 00000 00000
-m m mo : NM M PI0, NP-LAN 0 wm r . LANW LAn M01 (D MncoM m 0 0(D M V4l N00 MO0W-t ID -0 QMWZM V -01 N'V-O- -L0M-0 00M-0 OCOMZ0
-j UL A. . . ... I . . . . . . . . . . .
00000 00000 00000 00000 00000 00000 00000 00000
0-NMWLA -NMVLA -NMVLA -NMWLA NCIMVL -NMVLA - N VLo -NMWLA
N N YNN mM M r"M W v v LALALinALA LDOpCL 0 W 0 ( 0 N. '

a'. V M 0 0~ V-mN ZO Oq'C (C00 -- flm \j -m \- Lr N- MN -LqN--0l r o C )a
00
0 P, h0~ w 00uo m - LOl1- 0 MP nri( m CN0 a)1 a ~ lt -W L.(O U'U 0 L'41 UU0 LC)0 01 -CO -~ 0 to -W(D0 -WM ~C~j1, 0 0 0v (D o 0) M m~~r 1- '.N1P-
..V o000000 00 600 00 a00 00000 00000 0 0000 0 00060 0 0000c
: 0 -W M 0 o0 r0 0 CO- Mr~ CN~j ~N - cJ-0 IMN.-0a) ) -L222 Lz z == 7 2 T':
fl 00000 00000 00000 00000 00000 00000 00000 00000
N N M~N LL( 0- w 0 (M N C0 mN0- (D mP_0 MCJ00
0-. . . . . . . . ... . . .
' 00000 00000 0000 00 0 00 0C)00 00 00 00C0 0 00 00 00000
0V . -vm N V~om mw-mm - ID M Ci Mfl Ln l'q0r11, N Oif 0LNOC~ CN W CD l
Q)fl C2~ 0 0 0%fl -aOU)OU~L. Lfl' T2 1
'00000 00000 00000 00000 00000 00000 00000 00000
U) l 5. m-W Nt t m -W LO - N m -W -NMlu N m vL0 -NMq'Lf - Nm VL0 -NMWU
Q) 00000 00000 00000 00000 00000 00000 00000 00000L C r" m . n -- Wq-W- 1.70 0 If Uflt 1.0 (0 0 CCDCDGoCDCDC)OY (7 l ~0) 00000
S!
M M0~ omoo -OMM m PM C NULl- CN 0 m- mmmmm 0O 0 mMO-~ ~~ ~ a"LfOVIm m-.I
C,-u N M'i N :: : r- " 0 ...................................................... . . ..... . . .. .......
* 00000 00000 00000 00000 00000 00000 00000 00000
u 0 Olt OVMVM NO0 m 0m vLC~ ~0CO0 m (D fnGo If- CO DCO - Y 0 LI LC4)a, u - - ~ - ---
*0:00000 00000 00000 00000 00000 00000 00000 00000
4)u v00- - 0O0om WNWIMW C\ N0) r L - 0 0U Mai l w w Pco.- m ITS U-MOMC V ! z M :!:2~m :~- m N N- N- N!2~N -CVN OCo(1 0-mN M nr(
L- 00000 00000 00000 00000o 00000 00000 00000 00000
t* Lo-ur- ONcOM MW;O N t-0 Cl -Co (DN -f~q- ;Mw z ONOO 0 mO~
E 00000O 00000 00000 00000 00000 00000 00000 00000
: 0( r.N 0 - " l 0 -W 0 (OMn-0 ( CmN- anm 0 - 1-o L m00
0 00000 0 ,0 00 0 0 000c0 00000 0000o0 00000 cc0 00 000cc0
E Cu -m V 0 - N M~ V NCJM V -NMVLr -M V 0 -NMVO~f -NMVOr -NmlL
~M0 0 0 cN 0 0l f) 0 anoM MMMOU 0MIZ M 0 LO 0U - ONL0 VOWcN0f'Da w(l~' mO.)m 0vo0omm mvWOL~ Ofm OCN MN,.N -- . N (m0(O CN
a) M - N- 0~N m qNUNj- -- - m% n- - - MN- - - mN - -- NN-CM
.0 '.
.. . .00000 00000 00000 00000 00000 00000 00000 00000
0LL &P (Do- D 0Lr - - MCo Lf - 0)N P- Cori Y o 0 t ~0 W M I l- - ("I LCO MO f )F Cj W
0 0 M cN W0UON 0 0 W 0 N Lr)~ mN, 111, V N 0COVN w 0 0mN -0 0in(D M N -~N N - vN - fn r)- - m N M N- -- jCJ- - --. - --
Z 0).00000 .z0000 00000 00000 00000 00000 00000 00000
0N. Nlf) 0(D - qO N0 - in N.0to - - 0 -N- Nt-L 0 0 N C0c0 (D-DV K -WcO q'u) mM C
w C\CD N- - - - i"N - -- en Cj. M iN- - - NV- --- NI.. .' .
co0000 00000 00000 00000 00000 00000 00000 00000
zW . 0- MOnf -lN ~ 0 NCOMOO 0 P~u- m 0 0~i- 10 0 U~ 0M
0 ) I v0W 0Vj mnq- j o MNN~n 00iM- : .OcZin cON IlM !0CW )N MN.VN.. . . . . . . . . I . . . . . . . .. . . . . . .
CL . 00000 00000 00000 00000 00000 00000 00000 00000
C-U- 0LN w -W C NM ev 0 m Ul 9N NWOLMID M l. w 0 r: 0-ONM M I-N 0
Z 2a.I O W: CO-0 NW t-- NW-- Nw- M ---- 0) m CJ-( c' -0C- a . . . . . . . ..* . . . . . . . . . . . . . . . . . . . . I
m 00000 00000 00000 00000 00000 00000 00000 000004
N. NMWL0 N fn-W -Nm lc 'N lWf -NMVO~ -NMwu) N mVU 0 NMVOt
---- - NNNN MMMMM wyw Wq LC) InLr (00(0(00 CO CI IDWC,

oa ~j0, )- a) r-.O w IM ~N N w no oo mmoon WOW- C~ - 1*0 Ln - -M'0-u mmOlCmm -0 N C mm 1- N w ON (D - 07 0 0U 0).70
0 0 000 00 00 00 00 0 00 0060 000 00 00 0 00 00000 0 000 0
CV c m0 I r (D cL.) - - MN lCDe ~ mI -Irvo Lf.02-Lfl M CO) O ("0 aOD(DU 0 a) ~.0 2( ~ -r mm o vtN0 -N ~N- rn-0 rn00 r-00 N0
-(71)00000 00000O 00000 00000 00000 00000 00000 00000O
o , INNt in 0) -aMr a)r'0~ rn 0 C) r ( oLr o~ M o n cc 1-a ,0UGo L MI
* ~rn-o ~-00~ N-0 r~~ 002 M-~~. Mn00 N- 0M N-0 2. .0 . .. . . .
:O00000 00000 00000O 00000 00000 00000 00000O 00000
SN m r- 0 0 OmoflN MMM-U ~0 2)m V L)c G M( 0 2C0 0 coCoLo0- - ;tC O qN 40 0 ID M 0V0 ;!eOO w-00 M N0VP00M2w; ~ ;1 N- 0 (-W01,
0-- -0 - -a - - o - - --- 0 - -0 - -0
00000 00000 00000 00000 00000 00000 00000 0000020
a) ) U) o - q CNw02 0 cm r co ITI.. CNit n 0 m to wm NLCoCom zw0)Cm---------------------0a j00 Y 0 0) -0) m0 0 a00 0)0 00 0 )00
.00000 00000000000000 000 000000
0N M -'W U) - NM -WL) - N MWU) - CNM V V - N M -WV) N M VU) - fu -WU) - NM -WU)Q)2) .00000 00000 00000 00000 00000 00000 00000 00000-) c-M M M a- r- -annrr 0 fl~L) L U) QIDQI too o - ccc DCDCD 0 mc 0) a 0a0 00
z 0D CO r-) -a020 CO-0U -w.,. en- V0I- m WCj- N ov tj 0M N rncu- orrn-~ ~~~~~~~~~ -~~U M -~M -~N rr N- cq - L - conrcu o-u.rcM
-l -02 '-- - - ~j- - - ~00 0 000 0 0 0 000 00 0 00 00C0 0000 00 0 0 0 0000 00 a00 0
u In t,~o~~ P -W M" o M 7P- - w y ~-W M- D c D- 0 r-W " M0m 0 0 - C w-a 1, ) - CIm n 0 r- : M r: \J O 0-~N 1)DMN o MN 02t)M z2fl~ 22)N N- -
a) CD 00 0 0 0 0 000000D 00 0 00 001000 0 0 000 00000 00 0 00
,a U CV CU- - --O M - -MN -~lN 01)-0 W.N ZW*~ 2~
E 00000 00000 00000 00000 00000 00000 00000 00000
*D _ _ m L m M- oOn- -Wm- omfM- ~ - 0 CY 'j- N0 0) -W J- a 0MN 0'--------- ----- 0------------ -0---------------------- ---- ---- ------
U- . . . . . .EOC 00000000000 00000 00000 00000 00000 00000O
0)n~o ornMo 0r-o mN-Y. C700 qN0002 crjo, M-
---------------- -------0w m- - - -0----------------------------------- -------- 0
- .00000 00000 00000 00000 00000 00000 00000 000002)
- a) -WC v- W.wf -Wr~ IM P 0 D ) M CD 0 -NrM u -Nm P, -NMo - Nrn U -- moof
S710202000 00000 -0 0 C'.0NN0 co o (D(0rflOO 0 00000
00LNmW D-WCC) wv - 0'-- 0 NM Ll 0 w w IN - v-M b-0-U702M- P i00-0 N N-0$ 002,2 r. -o w-ocD wLt2-w- OoMr.aN M. ooom' V2o)ON- M-.-WNZM
LL) M) MN - a(V - - - nN - -- nN - - - MN - MN-N----- Cj.02- . I . . . . . . .
'00000 00000 00000 00000 00000 00000 00000 00000z
-d (n 0)N. sMQ - 2rW M Min N-~ omvfmP..0-2 N0 Va -W.~ N.M0 - co 2LfN-N- n' oJ - r" Cy - - r-,q -00 - 0202mM V --- (002U)M Cj -fl - -
0 000 00 00 0 00 00000 00 0 00 0 00 00 0 0000C 00000 00 00 0
-a0 mi I (".. C o q 02 CD -o(rM - 02O U( W)-DN') jLc joa) O -a N 0 0 !-% J.F N ~m - 0 (
0 .) ,fM- N --- 0 MN--- MN - - -- 0 - - --- ' -- -.~ .02 . . . . . . . . . . .
4 00000 00000 00000 00000 00000 00000 00000 00000
* v -00W 0) - MI-W - -OCm - 02O2Uv v0 NMN to)0q W-w('J N M w Lo -COMVN IN.) IN - M -- N- - -M M -v w -c -r l )L) t D( 4 DI o()CDc
c~0

To o (DDO J-Oo c-oo ~Oc10 rn-oo (Dooo ooo N00O0cy (DccC\
-0 --- --- --- 00 -~--0 --- 00 --- 00
'0000 000 0 o c0 00 00000 c 00c0 00000 00000 00000
-- NMr-N MNM0a M-0O-- M-Ofr.N inwoo( ro - MLinr0m MNWMQM
----- 0 - --0 -- 0 --- 00 -- 00c --- 00 --- 00 -000o
m~ O00000 00000 00000 00000 00000 00000 00000 00000
N (D Q0r- LO co O ~oO -Ma) D-aDto( - coM 0 (D UDm m m OON Ln M OMUNWM -MVNOM(D 0N'.0 C t to -r- 0~ v oM-)-r om (D 0 Ni PM N CO N \ ) ' LOO~n a-U) - - r o--w Cu-oc,) t-o0 C 0 m -oo')oc V \- 0 0)CD ru 0 0 a C7 -oooma -0ommm -oCa 0 (M 0
i n-0--0 --- 00c --- 00 --- 00c --- 00 -- 000 -- 000
.0 'j00 00a-0 00000 0 0000 0 0 000 0 000cc10 0000 0 c0000 0 00D00a
m P Mr0 Lr) (D m (D L wm 00wf O~C n-in-- ---------------- OnN vmmom00) o 0 -I -M~ minwm ONcON -woon- wcomvw covw o -aM m ~ Nc o mM- 0 rn-oo(Mo)'~ --oo N0 P0) ~ N00 a) 0 -oomomo -ommmo -00o0o -oomow
0 - 0 --- 0 C)C ) --- 00)C: -000C - 00 000 --- 000C7 . . . . . .
'00000000 00000 00000 00000 00000 00000 00000E0
(U 0 0M O r O~ -Wf mr -- U -0O O 0O 2'O 0OOO v 00 0 w o L r m0 m ON rz m
0n'-000 -- 000 -- 000 -- 000 -0000 -0000 -0000 -0000
'00000 00000 00000 00000 00000 00000 00000 00000
0
W~ E CU M -W L NM 'Win - M 1 U) .CV M -qfL N ("InL - N M IU - N M W W - (JM - V
00000000 00000 00000 00000 00000 00000 00000
-m n n- Nu M m0 m D LOOOM ~u-W N inO 0Ln m (L~D NN V Nw.C vc'- m 0 vC~N- N 0 M m 0 -OMNo com- n 0ifCJ0~ CJ0~
- m C\ ----,- - - - -L !:2 2:!!:2
CM . . . . . . . . . .
00000 00000 00000 00000 00000 00000 00000 00000
u O Mwt-0w onUoom W NI~w -moCoi - N-~v mm Nmm cOMN0N -(Doo-m~ in NCMNO -OM-0 OiM.0 COiM-0 MVN~-o M'VN-0ZR0 ~M0
oV - - -- V -- .- -- -u~ n Nn~~ o- - - - - m- - - - a 'n ~0.......................... ... ..... .. ..
LM 0 0000 00 00 0 0 0D00 00000 0 0 000 0 00 00 00000 00 0 000
u O oM-m -~ ~CVOin- LOOWOO O0cuoM0 -NM- MN,1O0 cMninr MN Pc comN0 oom-0 MON-0 0) v ~N0-0 C co -C) CM-0Oj C nN0O (D I"m 0'---- Cj---- ----- ----- ----- ------------------------------------- 0--------------
Ql . . .
E :00000 00000 00000 00000 00000 00000 00000 00000m0U,
-W -0 0 OVOO0 omomao M-MMO coco 0 0 0 mnono -'no ON r" LS
Lr CD0'---- c oo 0 0.co---0 -- 0 . 1 -- 0. 1 - 00 --- c 0. .--- 00 --- 0000
00000 00 0 00 0 00000 00 0 0 0 0 0 00000
E ) ( V- aCj- -' NMrn N -N ~ i - N q~ - V- -n M~ -- - ~ i -N ~ i -N -
0o0o0 0 00co0 CD -o 0 0 0 0c 0N(J 0 ccc o 0 D0 00
0*Lm m m C LOO, r, 0 - IV ~Lr1J cu a-ocrow MMV0M N M 07 F ( o qn V0 V CY)0 C C
iO M - - nN C\ Cj ) o aN Lt)nNjP a- -aC o Y O( D0 -aOCM nOn vW N.N - MOVNOV) LC iM C aCU- N -~ Mn J- - M NC1- - - ---- ---- N ---- -
m 000000 0000 00 00000 00000 0a000 0 00000 00000
a. - IV-0C)D - 0r - ( ( NM f CONMn ' 01 -0 NMWC0 -a-Wfnm c 0 f-O0~ 0 N fl 0V O000- om u.-- N - 0m - CO a)LO CU co -WC.J - -W N0 m (Dm C~oC -'D "I
Li iniN N M nU- -- M NCJ- - - C --- - -~ - -c . . . . . . . .. .
4 .00000 00000 00000 00000 00000 00000O 00000 00000z.d W Wm 'O NM inIDMO C) Y 0OnICuN0 Dco vN 0 -w - 5 -wqN0 Cij (D m 0 u) n - 0 0 mM-m
cr 0 w. \ --- M N-----------------------------------------------------------------
a. 00000 00000O 00000 00000 00000 00000 00000 00000
0 NONo o -a mD (N coi -r~UO in 0M VN M q -- M - cof-NO M DC N- 0 (M o N 0 C
0 *00000 00000O 00000 00000 00000 00000 00000 00000
N N NM mnj N f n M wv v- -' M0f -NM in LO Ln -N0 i -N0i -N0Dm ow G
*--------- N N M M q q incn~n ccccc -~r-r-

0 0 0 00 0 00O 0 CY --OO N0 O - 00coto)~ -0 w co w-00'
0),----C --- C --- 0c -- 000 -- 0 -0 0 -- 0 -0 0
00000000 00000 00000 00000 00000 00000 00000
0 -oo o i NU -o c NooC a W 0 m)0 NW e -0 - - V-VOO -00mo -cWoWII -- 0-00 -- 000 -- 00 - - 000 -- 000 0 0 00 -0000
a) 00000 00 00C0 00000 00000 00000 0 C 0 00 00000 00000
0 0w cn (o 0 ca'0M-o 0 o r- Mo- to~o 00 r ~'~ c'i -m0mo -0rNrWc - 0 -
a) Lfl.00-O --- cc 000 000o -000 -0000 -0000 -0000
0 *000 000600 0 0000 00000 0000 0 0 000 006000 00000
* CO Na) 0 C0 CD0 I 3 C N.~Uqr ) Lt0 0- ? . P 0L L 0~Nr( CO - (-N J c~0 - tO
c O 00-O (DPocn'.JN. -CommC eu0m0LC -moo=r Ommmm~- Looo-w aLmomm0,---00 -000~ -- 000 -00c -0000 -0O00 0O000 -00a,0
a) 0 . . . . . . . . ..00000 00000 00000 00000 00000 00000 00000 00000
E0
0) C0CCY)WJ P-W0 in - ,-a0 m V N.O cc ~ rE -OMON- 0 m M ) M wm0 P,0, N. ?o~ -- M W cUD 0 De~ N M -WCYIErC\j 0MWW- M - r.w- v- 0 (om M 00 comO *( f0 fM0a~) 0 *-mmo m 0 m 0c)~ CI Go 0C ococ m m om0Wmm 0 o GoW CT MC 0 OC DC
O.IOO U*0000000 -0000 -0000 00000 00000 00000 00000
00000 00000 00000 00000 00000 00000 00000 00000
0
U) -N'MVMf C"JfmLf - N m IT - Nr"w n - N r" VLo -eufMVL - N Mw 0 - N " aLC
a) .00000 00000 00000 00000 00000 00000 00000 00000L C mmVm -W -Woc qr -W 0L ) C t 0C D DW c mC) 00000
z alp JN o n 0 - Lo M -0 0UM-0 OONC\-0 -T~J N MV-00 - M - 0 0 r" -0 cmM N \ N - - - - C - - - - - - 0 - - - -0
A * 00000 00000 00000 00000 00000 00000 00000 00000
(D cn OO~M-0 CO0 C'j- 0 a Tcu -o 0 W N 0 0 vM-'-o M .- 0 ) cr oG LN ~- 0 a--- -- -- - -- - - 0 -- -0 - - 0 -- 0
0 . . . . . . . . . . .
m 000000 00000 00000 00000 00000 00000 00000 00000
OOOOLI'J- 00('000 000\00 0-0000 co0~000 00cc00 0flC000 00t'J00
cv -- C --- -0 ---- 0 --- 0 ---- 0 ---- 0 -0 --- 0cl 0.................................... . .
L. *00000 00000 00000 00000 00000 00000 00000 00000cv
CJ0N.. U'o 0 mmmm -oWMNMOU m:O-O 0v~0;0 N~O M Oc00w-- mco) *)0 fn)J0 -,= 0a)CO Y Wf'10C) O) Go 'J0 N m c NCj000)0 i -00) c
00-0 ---- 00 -0--------------- --- 0 ---- 0 00co -- 000
& *.0000 00000 00000 00000 00000 00000 00000 00000
c
03 0 0) 0 00 00 uN W- W- t DU D ( -0 00 co00 000 -000
1- c -----Ll A~~c ----- ~U -----v~t ----- l r~m ---- c~f ----- 'UNNNN
0 M W - Da -(nU)n NA-- ~0 0 N -u0 ( m ~ - ) i M 0 WN - OLAMO N.momE M) * cMCJ N CN M N - -- M .j - -- (\ - -'
.. .0)' . . . . .
z-m00000 00000 00000 00000 00000 00000 00000 00000
CLN ' LC) owoom -- woo 0 0 P, vLA mL qo OMOcnOo oq C ,) r o-- N0-N -Wc~d 0C) WCOw 0 -, C( OOL U ACL.f c -0~i0 q M(0 -wU). (n ClJ C) NjW m 0 -MCM-0 -ON-0
(/) 0 .LMC---)\J- r CI ~- -- --- - N---- N---- N---- j----0 IY , . . . .
2 000000 00000 00000 00000 00000O 00000 00000 00000
0a.00N Nmu-c-c 0 0 (7) N.-mC n OO C 0C toN.N (MOOwL- C) CYA =M C7)-cj 0M m W c c
w 0Go ~l M WN 0 W-l OO 0J -W AJ0 Nli WM 0 0 rm- 0 a)-mfclm-0 a) c n N0UJj -AL CJ MC j- m j- - c --- N----
Cj 0 ') . . . ... . . . . . . . . . . . .
L .00000 00000 00000 00000 00000 00000 00000 00000
LU *OmwvJN.wM( MN0 P,~0ON 0 r (OmqUm OLAO- MJ0 0O D O)MN .. 0L 0 omOmc MO(NO VN O WV-OW cJM --q-0 ( C'\LM- -L-0 0) W U qaC,) W N0 C 4
O' N~A ---J 0 - - -0 - -c --- cc - -00 ---- 00C) . ... . . . . . . . .. . . . . . . .
m 00000 00000 00000 00000 00000 00000 00000 00000
EU -NMV0 CUM 0 AJN -W ---- 0 --- 00 --- 00 --- 0n0 --- ifn0
-0 00 00 0 0000 NNCj MMM "M w vv o00 0 0000 0000 0 0 0 00000 ocococc

a).O 00v( O V N u( 0 000U)- r -r00 -00 D00 -D00 N00 m -000-0 -0000
m- (MO~ C'OC)C7 O N0(nO O 0m oC ) )C .- )( OCC) 0 C C CCMX. 0~~O 0)f~ Go-. r.- C C
* M,--000 -- 000 -- 00o -0000 -0000 -0000 -0000 -0000
-~O.00000 00000 00000 00000 00000 00000 00000 00000
o N~v 0a0 Om. NNwU Y W nR N~ N LO~flf NMP.CIC C~~O l( I ,( ' (0M~ r.M r. 00Lt0 -C
If .,-co --000 000 o 0000000 -0000 -0000 -0000 -0000
M- 00000 00000 00000 00000 00000 00000 00000 00000
0 -m rm 00 0 Cuo~ mt~ M ccJO entC\O rnLL- CO-( ~ )( mL)- w w o mNr OCl(
0D -O-000 o000o -0000 -0000 -0000 -0000 00000 00000M1 . . . . . .. . . . . . . . . . . . . . . . . .
00000000 00000 00000 00000 00000 00000 00000
0-000 00000 00000 00000 00000 00000 00000 00000
'00000000 00000 00000 00000 00000 00000 00000
0LO O V' - ML) LC)f COI mN oW CON e -M U 00L)F, L YN0 m rU -Nm wc m NM U PN-w m0m ?I w
tn ' 0000 00000 00000 00000 00000 00000 00000 00000.00000MM 00 0 00000tL±Lf COL0(0CO 00000"r' 000 00000 a
0)
N M VLO- N0 -0 -W--C VMWL MM O -NMVL N W O
*00000000 00000 00000 00000 00000 00000 00000
MM C Oemm MNT-M mN0~.!' z~Lfc fv~~ M.MN OO O - m 0)OCN0
--~-- - -0 ---- 0 -- 00m --- 00. . . . . . . . . . . . . . . . . . . .
*: cocoa0 00000 00000 00000 00000 00000 00000 00000
r0 ---- - -0 ---- 0 - 0 -- 0 - 00 --- 00
m '00000 00000 00000 00000 00000 00000 00000 00000
C) a0 mm c en00 C N0 ) 0 0 ) wn -IN0 0 ON00) 0 u 0 4O m V-oO w - 00- *-------------0---0 0 --- 0 0 --- 00c --- 00c --- 00 --- 00c
M: '00000 00 0 00 00000 00000 00000 00000 00000 00000
(D )MO DON j N0 0) (D~~O~ C\ =)L)COiC)0 N~P 0 w wNM CCO m -0Cm G M -0 . Cz0--0 -00 -- 0 00 -- 0 00 -- 000c -- 000c -- 000c -00 00
CL ) . . * . . . . . . . . . . . . .
E 00 00000 00000 00000 00000 00000 00000 00000
- M - m O r -NU NM) f GoM 'U COLf .NM00COC Ci0 C O uCD ) -00C C -NM .) - N 0) DD OOO 00c -c o -000 - -NNC0 -- 0 CO OCO -- c 00000
S-: E N Nn Nm-O -NU.) -W N - Cu ml -W VA) -~N 0W Iflr- 0 CNOm -0L -NL.M.
2--' M -- W --- - N--- - -- - -- N--- - -- - N M
E M N MN N - -- MN(V- -- f---- - N ---- \ --- N- -
Cz 0)'000 0000 000 0 00 0 0 0000 0coo 00000 0 0 000 00000
*n vm o OD CM f) U 00m fl. w v N 0cO-W-0 mwm~-o t 0 N0) 0 ON-0Ln r U.'N - - --- MN-- M-- - - N- -- V-- N- -0
. . . . . . . . . ..'z 'M00000 00000 00000 00000 00000 00000 00000 00000
zoc.J . o.) qf (DOVuO MONVO 00-OM NV)-0". M P..O -0)IOM' NvtflM
- * w r D M.,.M -o -N CYDP-L ~ 0 L) -I 0 m Dm- MCO Ln lN0a) Cm00 ~ 0 ) rY)lM-uoOCF
<. '00 00000 00000 00000 00000 00000 00000 00000
-A 0) N'- ) U') tof"-W LOq? M Y)'. O -. NMNCLOmmC) r~~ LONIL), M ,M~ LL) W0 Ou.) m
m 0V -- 0- N- -- N - -00 - -- 0 - - -0 -- -0-0 -- -0-0 --- -0
LO .U . . . . . . . . . ... . . . . . . . . .
a) '00000 00000 00000 00000 00000 00000 00000 00000
E * -NM VO -NMY. NM VL - N m -W -NMmw. -N U. N ("v n -Cu v - N m LO
C.
0 m0 000 00N00(m00 0000 00000 0000 00 0 0000m MW - 0 00000 a C C
MI-000 0000o 0000 -0000 -0000 -0000 00000 00000
C)C C~000 0 0000a 00 00C0 0 0000 00cc00 00 0 00 00 00 0 00o00
.-- c000 0000 -0000 -0000 00000 00000 00000 00000
M-00000 00000 00000 00000 00000 00000 00000 00000
a) -- - LC 0 OM M a 0 - N r Y O~~-~ M 0) (. -- CjC O u n m-
0'L-000 -0000 -0000 00000 00000 00000 00000 00000.~ . .* . . . . . . . . . . . . .
'00000 00000 00000 00000 00000 00000 00000 00000
0
(1 c ) OG -j()O $ C\~ CO~O omCr' -we c r w P- C O , C t - COP P Dr ,v f, P,
*.00000 00000 00000 00000 00000 00000 00000 00000
0
0000 00000 00000 00000 00000 00000 00000 00000L. C rv v v v LO LO LO LnLO ( ( ( ( D 00 O COOC CI (M-r (m O 0) rO'O 00000
- : --- --- 00----------------------- --- o---0 00 - -00
3 00000 00000 00000 00000 00000 00000 00000 00000
-- -- 0 -- 0 - -0 00o -- 00 --- 00 00-o --- 00
*c00000 00000 00000 00000 00000 00000 00000 00000
Q wU Nm 0 - . 00 a C)0 - 0 wrOm r P,. 0 mw v m fI~U')-Cfl Ci). NO t) m O ~0 -m 60 - - -cc - -0- 00 --00 00 00 - 00 000o -- 000
00000 00000 00000 00000 00000 00000 00000 00000
- W 0 L0O 0 V0W0 MM0 0 0 00 00VMO MO M0 0 00
000 00000 00000 00000 00000 00000 00000 00000
-~ a m0~r N0 ,w N0O C) a- a)~r C) CO r- a) O CO 0o -a)0 Y O CO I,o -000 -- 000 -- 000 -- 000 -0000 -0000 -0000 -0000
L 0000 0 C00C)000 000 0 )CC0 00 0 0 000 0000 0 00000 0 0000a
E CS m NmWLA -NMVOL -N m VLO -'NMqu -rMMV0 -NJMVML - N m VLO - N m -W
a) ) M ( O) 0 0 0 0 -- - AN N NN -a-W- qqr W ( Dc C0COD COwC DC 00 00 011 C . - - - - - - - - - - - - - - - - - - N NN
N CO0 m (D u) AJ - CO CU CO 0 N O WA WOOO MUOVON AjPM-O O-IOdm~~-L s oqe0N 0 - 'w- MaOWM- WW N Pn- v - 0 Mt ma-o0 Nu )cNJ-o0 - LO i0 (zr= C) L M N- - -~ - - - - - - -- - - C ---- C -- - N - r
00000 00000 00000 00000 00000 00000 00000 00000
LA-WOOL- (0 CJ (D m 0 m U AAJ0 w D v 0 fM'OMt 0N0 0J0 0ovm00 0'qJOMU) ANj- -- M nNJ- - --- - - - - Nj- -- o -0\ 0 -- C
z M-'00000 00000 00000 00000 00000 00000 00000 00000
O cOwoww- n-LANO r-.ovcN0 WcOi-0 -LAN-0M 0'V('L00 a,'-0o, Min-0u. L. VN - MC c- -- --- -i----- - Nj- - -0C C e--- -o0 - -0
4 00000 00000 00000 00000 00000 00000 00000 00000
z0 * Nw~~mc 00)VN0 L P M- M NLAN00 0VN0C' m-00 M Qm EDn0 -0) CO-0C V --- --- N -0 N - N- -0 -- -a--- 0 -- 00
0. '00000 00000 00000 00000 00000 00000 00000 00000
CO 0) Cun~f ~)~0 CO M I WN0OW 0 LC00' w0 (M inOm momDww 0N 00o N 00o -- 00 -- 00 - 00 --- 000 -- 000- c
C 00000 00000 00000 00000 00000 00000 00000 00000
NNNNN ininnini ww-qw LOA) LA ULO OWOOO~c r. COC O DC

-00 00 0 00 000 0 -0000 000 000 00000ooaoc;
0000oa 00000 00000 00000 00000 00000 00000 00000
-(D C\j 0 C ~ N j-- N ~C\j ( - CY)m 0 U -OC a).- 0 ( m .a)0C .LO 0 M N~C M a c in) O r *I m,
Coco *-00 -0000 -0000 00000 00000 00000 00000 00000
fl) 00000 00000 00000 00000 00000 00000 00000 00000
.Y)CDCO C C C C C) D , C O f. 0r ( CO~ C r-0mmC C r - CO (
4) 0-0000c -0000 00000 00000 00000 00000 00000 00000
*00000 00000 00000 00000 00000 00000 00000 00000
- ML 0 W ~ - W 0 LD 0 0 N M M W V 0 r-Cm wowmc -r-L Nc~ W)COaCm
0-fl* 0000 00000 00000 00000 00000 00000 00000 00000
00000 00000 00000 c0000 00000 00000 00000 00000
0
* 00000 00000 00000 00000 00000 00000 00000 00000
00 0C 00---0----------------00 --- 00 --- 00 --- 00 --- 00 -- 000
0~
3 *00000 00000 00000 00000 00000 00000 00000 00000
m~L~rm-cma (CO -0 ()O rn-a 7) ( CCCi0O LfOCLON)0 0)0cc LO O' 0 mM W- O q M MCdi-- - --- 0 00 c - 00 -- 0 0 0- 0 000 000c-- o
cocoa0 000 00000 00000 00000 00000 00000 000o0
000L~00 00000 00 000 000 000 000coa oo
U) 0 u0 C U' ) U0C 0 W0O ) q- )CO l i mO3) m ~C)C C~0) D( 00 C N0C -)-0 D Cm 0n---00 --- 00c -- 000c -- 0 00 -- 000 -- 000 -- 000 -- 000
L 00 00000 00000 00000 00000 00000 00000 00000
0- I0N - - 0)0OOM- 7)M O Lr 0-L CU CO 00 0 '0)~ OCO n-mm) O (0 Cr D - 0 CO P,o 0 -- 000 -- 000 0000 0000o -0000 0000o -0000 -0000
E 00000 00000 00000 00000 00000 00000 00000 00000
0 -C'mi~-000~L -ej0wu0 -0000u -00e00u -00Jm00 -00jc00 -c0w0
Ca) 7) CYOCY 00000 - - - -- -W - (D (OODDC ( O00C o 0 000 0
11 C . --- - - - - - - - - - - - - - - - N N
M r U') D l ) ~ -C~j CIDu!l L u0 -W oY m -m o q L fl- svU') - u -LA?.p- 0t0C om 0 -it. flCOUN ca~m OU)N\O fWVN~o Ncm- CC%-O U-CNJ0C V-OM
E M.fCCJ 0C N n(j--- I - C J 0 CU- -0 0- -
*00 00 00000C0 0C 00000 00000 0000C0 0 00 0000 0 C,0 000C
0U. 0 Owt C c~r, - ) n C t-0C tr -to - - D0 )- C WfqC P- CNO" N N ( 0 -W- O -W- Q~ -Wq-
O0 O M~mv- w t n O O-aN0 V(D M 0 a N O u a 0 v NC, a)-W-0 0 O 00 M(A w U--- rnN--- CU---- N M~"~ ~- -- 0a -- - -0 - --- 0
z C,*00000 00000 00000 00000 00000 00000 00000 000000
0U- M C C"JLO U) CNJCDO0 0m0C,0c MONCO M iCM0 P. MC ~ 00o N01.00mUm- -OOfli crM-0 N(ON-Om 0oCJ0 O -0C, )MM-0C, 1-trO)
w O wr - C ~ -~~ CU - - --0 CU---a ---- 0 - -- 0 00-C,, *
49 00 0 00 0000 00000 0 000C)coa0C)0 00 0000 0 00C)00C0 00000
zCw n0 0 -W CO 0Y q OC V ~-CU' 00C)m Ul) C - 0, .- 0 WMrNja, a ~~ M oWP, M 0 qOM MO WVj Et M~om -v- a)mO -tON0OM n c M-0 COC wm~ cCj 0 o~ ) C 0 MCO
Cr 0,qCN--- N ~--- 0 N -- - -0 -- 00 -0- 0 -0-0LJ Ol .
C * 00000 00000 00000 00000 00000 00000 00000 00000
- , ' ~UC" Cm -OQW~(- N-=M- OfNMOO V tt,0) C 1( c- W D 0 0r r- c 0-WNm
wi 0e'--00 es--00 -- 0c --- 00 -- 000 -- 000 -- 000 -- 000ifl. . . . ..
03 00000 00000 00000 00000 00000 00000 00000 00000
EU N V JINMWO (%JfMLC - C\MVU CUm-wu -Nm~LC) -erJMWOL -N\m~wo
C.

(O D 0- ~ 0 -s '-i mN. a- OD I - N (D 0 - ' .Cuj 0 0.'-W -(X CO O en O
0) 0000 -0000 -0000 00000 00000 00000 00000 00000
00000 0000 0 00000c 0000 0 0 0000 0 )000,0 0000 0C)) )0 000
N C LO C I CN -0W O CO~lm U 0 N 0C VOMOCU a OCJ M 0 m a v0 v MF
0 m w . - 0 C C .- 0 O - O.NN C a).O Na.N.N. D 0P (D C rN.- .N(.L fN.- D (
11 0000 -0000 00000 00000 00000 00000 00000 00000AC M- 00000 00000 00000 00000 00000 00000 00000 c0000
O LC) CO mC\ W0mC en Cc --- - - U)0 N m - - N Cu C NIL wLOlfM C\j(D N. 0 0tno 0CuN m C)(00)Q V - -W 0 -0g-O MM O O C ) w0N ~Cu (M M L mU O) (D
a) LOl *0000 00000 00000 00000 00000 00000 00000 00000
.0 *M00 00 0 0 0 000 00Do00.0 00 0 0 0 00000 C00000oo 0000o .0 0C0 0 .0
.N.NLfl(W fMWCD(O 0o Doo 0W-N.-- OOCMUO N.0CCJO NOJNOOt MO 0* -rP00f- omlM0 -0U0O WW O O-CJOm MCONO NOU*-WO 0O0OCM
C 0 witC)CK f* 0. N N O)YN.N O ?, N.(D X O( Or P-N . CcNN WCCD r-(D to C FN.. ( (D~ CO .N.CQD0-00000 0 000C0 0C0000 0 )0 0 00 00000 00000 0C0 00 00 000C
00000a 00000 00000 00000 00000 00000 00000 00000
0CO ~Cu Ni m -.W - MN OY ' - a)U-) w fe- -0 M0OMOO 0 OCUON C 0 - P 0 -Wc.mm
OJvc (D N.O 0N OCJC 1 0 r 0NCjCOCO-a ( - CcUW0 CO (D qw L , nM q ) W ) Um(1 ) ci 0O NNN~ .- (D W N Pr-I, D D N. oCOU ( Cc D ( (.. D (0 N ~(D (D ( ?I-W (D(DL 0. *00000 00000 00000: 00000 00000 00000 00000 00000
00000 00000 00000 00000 00000 00000 00000 00000
0
00000 00000 00000 00000 00000 00000 00000 00000
0) o~--- 00 --- 00DC --- 00 --- 00 --- 00c -- 000 -- 000 -- 000
*1 .00000 00000 00000 00000, 00000 00000 00000 00000
.Co it )Lt')(00hw 0 - N - q Cm oU) 0 0m - f- 0 m qe.Jm 0 m Lt')JMM
.G)-O -- 00 - 00 C -- 00 -- 000 -- 00 000o 000o
M-')00000 00000 00000 00000 00000 00000 00000 00000cn
u * c00om(~jq 0c00N O aMcMi -- NWe fMiNWCw0 wm v MOOC\N. O)M-C0C it LONC OMM U)- 0 0t 0 n-mW D q -()C CO en M0~ N 0CO J a0) C I N M.Or 0)~d N O CD f
0: --- 0 00 00 o -000 000c 0-c 0 000o -0000
L. 00000 00000 00000 00000 00000 00000 00000 00000
U') V 0)C) 0-Na.N.0 0W O0') CNJCMOW 0 N - m P, 0 (M () CuCc (D?, , O m LO c Y) -
-0--000 -- 000 -- 000 -- 000 -- 000 -0000 -0000 -0000CL C'. ) . . . . . . . . . . . . . . . . . . . . . . . . . .
E .00000 00000 00000 00000 00000 00000 00000 00000
o0 -0000 0000 -0000 -0000 -0000 -0000 00000 00000. ... . .
I- . 00 00C0 0000 0000 C0 0 0 C.00o0 0 0000 C. 0000 0000 0 0 .. C 0 0C0 0
'C
Cm ) ) m ) 00000 - N N - wq a- ( o(1 (D( OGoC DC 00000
mm0mm 0 - " 01v'm O ')M) 0 Mr, )0- -a0 0)0 LO inm ,D in 0MC Mr r qT O .0 0
0) L'iC) CluM - M ~ J----------------------- C\i 0 Z!2 -- 0 N- 0 - -0
00000 00000D 00000 00000 00000 00000 00000 00000
LL P-. WNW) PN.)DN. CJ'0N. N \0 0N r VOMCOV N.NC\ MC)' M M vmm)').N
a Cu - -- M )J - - -------------- -a--------------------------00 - - -00
z 01'00000 00000 00000 00000 00000 00000 00000 00000
U., L q i't')J M - -------------------- 00 - -- 00C - -- 00c0 0'................................................................ . . .. .. ........ . . . .. ..
< 00000 00000 00000 00000 00000 00000 00000 00000
z*L N.N~I i0oU N (0 PM 0vm-o N~u~ V N M , M P M 0 (3) N - N -W N 0 Cu
Li CO ~I)Cu Cj 0 N. CO ' ) CUOfNOM' ov-00' MM-MM ( ')0 Y C r )0CJ00( inOO) C in - 0 ()m -o- - C\- - -- ao c- ao-----------------0 - -- 00 --- 00c - - -00
0. 00000 00000 00000 00000 00000 00000 00000 00000
CO a W O~ NOMWO IT0 cw 0 w F- m 0N N0 0 w 0 (DONjm U Vn N0~ - qw Cm ( C0 m
Lu 0 N)--00 00 - -00 - 000) 000 -000 -- 000 0000
'O00000 00000 00000 00000 00000 00000 00000 00000
- --- N N MU')i Me~mi -(J~fn -jnu -rwufvWW n Oin -ci (D~i ID Cc(D (Dwwww
C'

-~ j z2 No vo ( NAA0 O0~ N w NO O- m -'- m0LAn L) -~ OLA) Ln 00 L
00000 00000 00000 00000 00000 00000 00000 00000
0000 0000 00000 00000 00000 00000 00000 00000
It Cooco 00000 00000 00000 00000 00000 00000 00000
a) L00000 00000D 00000 00000 00000 00000 00000 00000
a) 00000o 00000 00000 00000 00000 00000 00000 00000
00000 0 0 000 0000 000000,0 0,0o0' 'QC*'000 00 '00 0, *0 '0 0 00000'
00000 00000 00000 00000 00000 00000 00000 00000
0
a) a,-. m LO0~ 0 - nC\j COLO r.) (D0 f-aC'j -W 7 0 M- M 00 l M- C F, VCUj- D -a C\j0a 0 La m u0a) 0 -C D Dca D( 0 -c(c0L0 ~rc cc r-cccc Qaac COc~OCc r.c(0cc M rD nQ Dc DW D0cD(D( C ( OD(
U00000 00000 00000 00000 00000 00000 00000 00000
0
V.' E NCr(L M wU) - ( MlwLL, - Cvm lwLO - N m v to - ~mm W 0 -N~MqA - N m V L - N m W
L Coc coo coco~ ALLDa co.coa coo coo 00000 00000
M -.--- 0oo --- 00 --- 00 -- 000 -- 000 -- 000 -- 000 -- 000
coco000 00000 00000 00000 00000 00000 00000o 00000
o 0 MOcu-M N (o 0)- (0 m P, O0 mC)( Dm -WDN-WO COc wc~Uj AJN0 f~ ( M0 O- A ) 0- 00-W
a) - O -- 00 000o 000o 000o 000o -0000 -0000
* 000000 00000 00000 00000 00000 00000 00000 00000U,
C a0 * w -VO~ ~0) C - ~0 U)CO - C "O , f CD~N N0) C 1, ru NO) CaF' - mCDPN. - fl C .. NISL.000o -000 -- 000 000o -- 000 -0000 -0000 -0000
L .00000 00000 00000 00000 00000 00000 00000 00000(D
CO ca) U)LO CO ( mfC a- 0 -C0( LO C7 -u' 0fP0~ v -e0 m m 0aC.J m ru.N ~~- O-
0-0000 00000 00000 00000 00000 00000 00000 00000
O m m c.oo . . . . . .~- A .o ~ r.r- . c . L ~ C J . L. . . . . . . .% - ~ . . .0 . .c .
E 0-0000 -0000 -0 000 0 0 00 0000c 00 00000 0 0000 0coo
L 00000 0 0000 00000 00000 00000 00000 00000 00000
E m v 0~t - rjm v 0 .- C\j m -Cr -(\JC(V - N m -Cfl (JMVA -NMV -C'NIm La
.00000Y)(MCY 00000 ----- N N N NN -WV- rW ( cUD (DCc (D G O OC 0 )0 00' C - - - - - - - - - - - - - - - - - - NCU(C.NN N
:000z Lm cD;0 r-LOmm C DC \j CO M q-W I-~- VNmO 00 0NCO CY LP U LA-Wm ~ -o0 VcaM-M o ja0) 0LANO O -00 om- (Mm O a O~
E M 0 Cj--- r j -- N - - -- -- -\,---0 -N -a0 - - 00--c - - -00Nl 0n. . . . . . . . . . . . .
00 00C0 00000 0000 0 C0C>000 0 0 000 0 00 0a)0 00000 00000
0LL. 0 mwm-v OOAJ'W W ON I )CO ( c0Ll u , V w ~QC 0 ~C m CC W CO ED0 c )t o -U') n
0 0 0 w - C\jOLA')C\j 0 MaN -m mmmom0 ov -o 0 M m-om -euomw U ~ 0 c'0ccV) aCJ .. j n- - - Cuj- -- (--- 0 -- -- 0-- -00 - - -00 00
z C 00 00 0 000 00000 o 0C'C C*0'0'0 0 00*0 060060 0 0 0 a o 00 *0
0 -VN~mo MWW-0 M'ONOM 0YNOM Mrn-MM r, N 0 Mw o ~ u0 a O ' L- 0 OCKuj -- ~j- - N --- 0 N- - - - 00 - -00 --- 00 - - 00
< 00000 00000 00000 00000 00000 00000 00000 00000
zwj Cl A-0aLO- muIU -W'nC -NN Ci m w0 -~q N w , m -N M -N N r- 0 0- v Nu r (
0 -. -N N 0 ID n -( 0C -L NO 0m -mm -Namw WNOM00 L-o ~- (MC .a-M o~ --- Nj---0a N --- 0 --- 00 00cc -- 00 --- 000-co
.O 0 . . . . . . . .
CL 00000 00000 00000 00000 00000 00000 00000 00000
CO ULA) .I L L0N ev CO m - NNUIWL -caNNV q'-MM WcaON vm '-
Luj O-N- 00 - 00 --- 00 -000o -- 000 -- 000 -0000 -0000
03 00000 00000 00000 00000 00000 00000 00000 00000
~ -MWL -N~ct -N~cf -N~LA -NnwL -NinqLA -NMWLA
NNNNN mmmmm Ywwvv 00000)L COCDCO(C

-a0 * )- f -7 '-I N ON'-OCM( C~~-jf .'((D O CU 0 '!-(c O We~~Lc m Y o6 D- n
0).-0000 00000 00000 00000 00000 00000 00000 00000- Y) 000000 0000 0 0 .0000 0c0 00 00000 .00 0 0 0 0 0 00 0 0 c000D
ovw-W m0) n0 a (DCJ~f Cf~O Cm u--7 W0 ( C-N D 0 'j r-0 - (O fCJ q \ w oW(D( ' 0r
.- oc CLO 00000 0000 0000 000 00000 00000 00000 00000
C7 '00000 00000 00000 00000 00000 00000 00000 00000
*D N OMLo ) ( a) NCar~ LO LO U C J ,,~v (n~ct NALCJ N cL a Wm 00M- toa nN0 -WCCm Watm w -(O 0 Co 0 -V- (D(0 o toflOC -(ODC (DCcD~( r-C O (DC(D ( '(D (D D U
0100000 00000 00000 00000 00000 00000 00000 00000
*0 00000 00000 00000 00000 00000 00000 00000 00000
-m m D m C~ mOL'- 0 -CO L)Co -- 'W ~-rMWM ur) C U')N 0 vflCON Cj D n N00CnQ) 0 m P Q-OCC -OCo l o Mto0 -CCO D f D ( cc o t tD~ o W n (O~DLLL D ( f(DlDLDL D (D (D u)
0,.00000 00000 00000 00000 00000 00000O 00000 00000
'00000 00000 00000 00000 00000 00000 00000 00000
0fJ0 OM N W~~t NCJmL -c (D (D - - m0 wm 0NIMN NN~'f vcJ~t 0 P- 0 r-
L_000000 00000 00000 00000 00000 00000 00000 00000.. . . . .tU L)L~f .D D OC c .- - ~ r . . 0 0 0 0 0 . . . . . . . . . . . . . .
3 00000 00000 00000 00000 00000 00000 00000 00000
L 'E--000 -- 000 -- 0 00 L NmV0 -- 00 -W0 -000 qr0 -0000-aL) l -000* .00000 00000 00000 00000 00000 00000 00000 00000o
.C Owarir- 0 0CoM 0-0 OM q 3)M r M 0CJL COU CO.C~ c~~ -a C~j()cc D~ Ol m '0-- co .- o -- coo 00-0 0 0000 0-c00 0000 -0000
39 00000 00000 00000 00000 00000 00000 00000 00000
m p L cj- M M W r'-o 0 D V0C"M1 Cn Co r- OCP..CD00%W qCuC 0)0 L~ M ~ O r_ -0wr-
-) 0'- o 000o 000o -000 0000o 00 0 0000 -0000 -0000: . . . . . . . . . . . . . . . . . . . . . . .
m * 0000 00000 00000 00000 00000 00000 00000 00000
o0'-000 -0000 00000 00000 00000 00000 00000 00000
L '00000000 00000 00000 00000 00000 00000 00000
0 *- 000l 'f~f -Uwit -0000Lt -000m0u -00mw0f -(0000U .CU00
E :00000 00000 000 000 cocoa~c 000 00000oco
.) 0) m o~ -C CD-r'. 0 LO) O V CC 0 D -a o~~~ - mL) 00 oq CD~Lc U\ , D D-0 0 M Cc P- 0 Mf lN v-.. MPP-0 CD c~oo (3)0O CDdP D )wr ( D C M- 1 D Mr ,( (D~o C J0O( (
0:o o -Coco- 00 0 00--00 ococo --- 00 --- 00 00ocLO . I . . . . . . . I00000 00000 00000 00000 00000 00000 00000 00000
(/~----N- -- J--- -'---- --- 00 ---- --- 00 -0 0N
. .. .. . .
Z .00000 00000 00000 00000 00000O 00000 00000 00000
0a. 0 M- O mP CJ)! NLL IL0U-0 0-m U') f~f M ~ ~ q-e v~0~ GoC m0c " r D fmm C D-a
O*VOcmO O'q-NO rVJ()CJ0O 0-'-OM ~m0O cmom0O Lf M O OMI-w q.w e'- -- N~-- c- -- o0 C\ c- -o- --- cc-0 00 --- 00 0 -00
.: . . . . . . .. . . . . . . . .
z C 00000 00000 00000 00000 00000 00000 00000 00000
zwLC wO 3Ll-0 m- a~ _cOow MCLO cOwO-N -000 ~ F.-CCO V ,M00 .F
$ UOMO MLCMoO Cj l 0Y 0~ (m 0q nG I 00 I N0 Co~ LflO ) ~- 0 O - M0 00LL 0)'qTN - - CJ -- 0 C ~ 0 0 --- 00 000 0 -00 - 000
. *00 00000 00000 00000 00000 00000 00000 00000
-L M 0 I( P,0P UrU 0N- M~\ M ( n w om m ooU)A PNsVr 0M0 LC) (D(D Co C m-W
LU O~mN -- -0 0~--0 00 - -0 --- 00 0--00 0000o 0000o 0000
'0000 000 00000 00000 00000 00000 00000 00000
0 D M t ,0 C C oG n W W N 0P 4 v m - v
V* . 00 *o Jt-U fn~WL 0I U fW~t OD - N0 Mr- (P Go _ C .CDJ~f ODr. D ()M 1, (
-u Ou-NDJ-r0 --- ~ oow -- o -- cooc~c -- c o 00 0 - 00 00_j 0 . . . . . I . . . . . . . . . . I ..,

a.-000000 -- 000000 -- 000000 -- 000000
00 000000 00000000 00000000 00000000
CN -W*DO-V NMOO 0U)V0 fl0 0U -U h- N
Ls lom Z m \JL 0U momCw0wo'L No (O
H 000000 -000000 -- 000000 -- 000000
-M-.)00000000 00000000 00000000 00000000
0-000000 -000000 -0000000 -0000000D *00000 00 0 0 00 00 000 o 00 0 00 000 00000000 c
0 0000-000 0000000O -0000000 -0000000O0 0000000 00000000 00000000 00000000
EC
0- 1) 0000000 0 0 0 0 0 0 0 0 0 0 0 0
'00000000 a)0 00 0000 0 000 0 00 0 00000000
LO r (D w)C 0 -Nm-wLCow0 - MJm W U-) w w0 -NJMVOWWO~
LM -
- C.)N O00000 000000 --- 00000 -00000N
It 00000000 00000000 00000000 00000000
)~ C.)'--00000 --- -- 00000 -- 000000. . . . . . . . . . . .
U. 00000000000000 00000000 00000000
C 'N - i)-0 zCLL W- 0w , (D mm w0 q wr m0. 0C(Qf m0~)C LO- --- 00000o -- 0 00000 -- 000000 -- 0000000
. . . . . . . . . . .E 0000000000000 00000000 00000000
r= 00000000 00000000 00000000 00000000
0 0000000 00000000 00000000 00000000
EE E. -r'JP)Ln(C. -NMVO~(DWO -. )jmvincco -rimWu~OOM
C C.
.~-cs J~L--r- ut-O0 WVMO.NNWW7 O)~- m L N L N0 -0C -UM L O- W , O OMMOOC
E .V~ -''-- coo MN --- 000 CJ-0000 C.J-0000. ., ..
*00000000 00000000 00000000 00000000
w r v 0CU N0 0 N0- -,-m000CL. m0-0 0 0 0
LU .MN---000 N - -0000 N'--- 0000 -'-- 00000S.)00000000 00000000 00000000 00000000
0
uCa C-mni--O000 N --- 0000 Nu-00000 -- 00000o
C 0000000000000 00000000 00000000
0 N0 r 0-~ W mMC-OCO -~ ooc - 0w P w v 0w qr)JtU qLL 0.Mtu-0000 --- 00000 C--00000 -- 00000
LO . . . . . . . . . . - .0. 00000000 00000000 00000000 00000000
- . NM-OCWJ -N.mN~t)o 0wo -N UVMOW -N VOWqLL.
w 0N -000 0 -~0000 000 00 0 000

- M 0 LO M mM LN\0 WLO LO OL'-fl'7 -c ru
(O 00 0 00 0 000 0 -( DwL o0 000000L -(D 0000000C o 00 0 00 00 00 oo oo oo 00 00 0
0)
OCOCO 00000 0000000 00000000 00000000
o-OowmoI-o -COOO-wcOLO Q00Wc LOOOC O- - noo0- L000o000q 0 0O00000O 00 00cJ 00000000O-r~
~ : 0000000000000 00000000 00000000
0O00000000 C0000000 00000000 00000000cy:00000000, 00000000 00000000 00000000
C-,00000000 00000000 00000000 00000000
E 00000000 00000000 00000000 0000
0, Comm ifON 0 0wr -a a w 00 v cOj0 -Co9~flom-
00000000000000 00000000 00000000
- 0'0000000 00000000 00000000 00000000
E 00 00 0 0 0 0 0 00000000 00000000w
Ur - -O L ,\- , O ( ~ m ~ 0 D' ~ O(~
00000000 00000000 00000000 0000
*C,00000000c 00000000 00000000 00000000
'C'~00000000 C0000000 00000000 000 00000
L 00000000 00000000 00000000 00000000
- 0-:00000000 00000000 00000000 00000000
00000 00000 . .OCC
I *00000000000000 00000000 00000000
w 0 0 m 00 0l N N0 N w .~~C0 0 OC DM0qw M v (Nw -1 -0f~lfL ' toC L~Llf to0w0 W 0 0 0 000L ' Dw LLLC)Lfl
0.00000000 00000000 00000000, 00000000
00000000O 00000000 00000000 00000000
M
00000000 00000000 00000000 00000000
I 0 000000 0000000O -0000000 -0000000
00000000000000 00000000 00000000
a . 0000000 -0000000 -0000000 -0000000
z CO C000000 00 000000 00000000 00000000
0
(A. '0000000 -0000000 -0000000 -0000000
4 0)00000000 00000000 00000000 00000000
0w * a, O0, MW oo o~rj qmv -- omW~wq mJUoc cJrWE
LU 0o 0000000 -0000000 -0000000 00000000cJ 0) .
0. 00000000 00000000 00000000 00000000
- 0L . -00~C r'~0CO O P- P,0000 0wP 0000 0w ( O
-~ 0000000 00000000 00000000 00000000
L 000000000 00000000 00000000 00000000
.000000000
CN VO W - cm o w
c *000 -0000000 -00000000000
00000000 00000000 00000000 00000000
-0000000 -0000000 0COC000000 -0000000
- 000000000000 00000000 00000000
M OM- m*m o oo M~c m C m-~ co 0 W 0- lN0'-- N
tPf.-0000000c -0000000 -0000000 -0000000m ~
* 00000000 00000000 00000000 00000000
~-m~r-,.L 000 00~ 0 000(0 0 O'0flO0O
000000000 0000000 00000000 00000000
0000000000000 00000000 00000000
.0000 000000000000 00000000
00000000 00000000 00000000 00000000N
m m - ~0 m m -jC Dn00 - w Lf(D 00 -cjm Cfcoo
000 000000000 -00c-000
00000 000C00 000l0) 00 0000000
- -0'0~ CP Lo Lfl m (M0w (D 0 LOa)000 000000 -000000 -000000
M00000000 00000000 00000000 00000000
c vom CO mo O l N o)ml-.ocfa-Of _M _00000 000000 -0000000 -0000000
* 000000000 00000000 00000000 00000000
0-*-000000 -- 000000 -0000000 -0000000
030000000 00000000 00000000 00000000
- - 00000000000 00000000 00000000
E v 0 C w 0 .NVM w - N * o( ~
00000 -- 000 0000--0000 00000000 000 00000
- 0 co00000 00000000 00000000 00000000
- 00000000 00000000 00000000 00000000
- M M- wen u' X -(" 00 WWa- ~0 VC \J0M - a 0 L WM MCm OflD 0
0 W MM 00C( -0M ( - c~ -0 M 0 0 0 0 w -(c 0- ~c\--0000 -~--o0o0o0 --- 000000
00000000 00000000 00000000 00000000
0 (m wM - m ~- 0 v OW-owe,~r MW 0 u m Jq-ruW mcmJ0.- CLOW.(I---0Coc N~'--00000 c*'-00000 --- 000000
Z 0 00000000 00000000 00000000 00000000
MMM.O 0 'C0M -O W6OUM00- Ow.Mm-M
0-a-Oco -~~00 \-000000 -000000 -. 0000000( ul*
4o 00000000 00000000 00000000 00000000
z~ fM M M- c~Ll J ' ~ ~ c~0~L~O

co Lt~q w ocl cV OmzN
00000 co00 C0 00a0 0000 00000000co 0 0 000 00 0
.OO0COO OO CD0 00 0r-Ll' 0~-~o~ 0c 00 0 OO OCOO
0000000 0 00000 0 00 000 0 0000 000 00000
- ~ ~ OCOO OCC0000 0000000000 00000000
o ONJOMN~gm 0 -W -0 w wv m m 0CDtL m f- UC'JmII.Cu w \J 0v
00000000 00000000 0 00 00 0 00 0 00 00 00 0
W N~ v .l0w N w o n v0m00Nmf
0.'00000000 0000 00000000
Q) 0M 0 (D- M - NLC C 0 0mD00VN - - r Q 0COaN
00000000000000 00000000 00000000. . . . . . . . . . . . . . . . . . . .
*0000000000000 00000000 00000000
Q)CC0~\~ 0~r~ooC NmCOOOOOf W000'J0-Lt
e) 0 0 0 Lo V IT to00 - a q W v'L *000000 00000000000000 00000000
9 0 0 0 00000 0 00 0 00 00 0 a0 00 00 00 00000000
0 0 0 0 0 0 0 0 OO tCOOO0000 0 OOOtOLC~OO. . . . . . . . . . . . . . . . .
M- 00000000 00000000 00000000 00000000
- c W oo v W oo w w 0 00000000w W Do~n W
ea U0,00000000 00000000 00000000 00000000
' 00000000 00000000 00000000 00000000
4) 00000000 00000000 00000000 00000000
*E ,0 00 0 0 000 00000000 0 00 0000 0 CD0CD0 00 0010
0 '00 000 00 00000000 00000000 00000000
c..cc000000 0000000 0000co0000 0 0000000
* W00w0L UC w'- 0 C9mwowwo 0dMV00wo
- ~ ~ OO O O 0O00000 00000 00000 00000000
2 *00 00000 00000000 00000000- 00000000
0 00000000O 00000000 00000000 00000000
00000000 00000000 00000000 00000000
00000 00000000 00000000 00000000
CLov Nwoq 'N 0rvv u 0~u C1oo ovOow
M 00- W~C~UU m0~wwooLLLCw w P.- w 0 0 0 w GDCooovv~
00000000 -0000000 00000000 00000000
4 00000000 00000000 00000000 00000000
0
00000000 00000000 00000000 00000000
0 '. . m. . . . . . . . .~,0 - J ~ l . . . . . .0 . . . . . .0000000C0cifln 00000000l~n ~C DO 00000000~finL~
4j 000000000 00000000 00000000 00000000
fL U , .C. . . . . . . . . . . . . .. . . . . . . . I
CD :00000000 00000000 00000000 00000000-
- ,.-NMcomCOM -NMVOWN0CD -NMV WO -0CmvoU)M
c ON.~t gLnq ount~q'' CO ON C0 O ONa

*~~~~~~~~ M000 0 -O OO o N0 0 0 0 0 0
0T 0000000 00000000 00000000 0000000000
-0000000 00000000 00000000 00000000
. -o~~0000000 00000000 00000000 00000000
S . 00000000 00000000 00000000 00000000- a)
00000000 00000000 00000000 00000000
o 0e Ln 0 vg q' ' v oV- c r- o oo0100000000 00000000 00000000 00000000
., .~ .*00000000 00000000 00000000 00000000
L 41:00000000 00000000 00000000 00000000
C00C0 0000C 0 0000 0000 00CCoCOCC0 00 C0(z000
E N m qwU)(DCl0 -\JMVOWWO~ - '~ m 0 w -NJmvUtcow
Q) M* M O M C a c o - - -( -CJl -d(- O - N MN 0UNN
M '-000000 -0000000 -0000000 -0000000
3t 00000000 0 C000C0 00 00000000 C0 0 00 000.co m * , C NL 0 CJ(DCO l-f- 0 MOVC Oc L N VM
LO m w0 e NMr WC(Ll CL 0 - f?--CtoDw 0 v 0o-c wLU vw'-0000000 -0000000 -0000000 -0000000(M-00000000o 00000000 00o00o0o 00000000
u 'MNWOMM-,Ll movo'C CDO) ON-nmomv OW NI-C -wl ooa ow-CDCDLD-e C W oo-00000-0000000 -0000000 -0000000
. . . . . . . I . .L .00000000 00000000 00000000 00000000
0.-0000000 -0000000 00000000 000000000. 0 ) . . . . . . . . . . ... . . . . . . . . IE .00000000 00000000 00000000 00000000
C0,00000000 00000000 00000000 00000000L 0 0000000 00000000 00000000 00000000
(D
'i C
00000000 00000000 00000000 00000000
0
.m-~000 ('J-000 0 -000000 -- 000000. . . . ... .
z M-.00000000 00000000 00000000 00000000
-- L.r0000 --- 00000 -000000 -0000004 .00000000 00000000 00000000 00000000z
-- 0''0000 --- 00000 -000000 -0000000
wj 0'--00000 -0000000 -0000000 00000000
M 00000000 00000000 00000000 00000000
MM M M M - v- W-

0C 00000000 00000000 00000000 00000000
00000000 00000000 00000000 00000000
0
I 00000000 00000000 00000000 00000000
M1 300000000 00000000 00000000 00000000
fLn-00000000 00000000 00000000 00000000
*00000000 00000000 00000000 00000000
OOMeNOOMW M W ~-oo0r-- (D oVOMoMo - M - 0 M wF-o
0'000000000000 00000000 0000000011 c '). . . .. . . .
*00000000 00000000 00000000 00000000e)0'a 0 oc ~ n E ot 0w)tim r ~~ m M 'r (Dm r. m 0 Dc wP oL q )( n1
Lfl.00000000 00000000 00000000 00000000
.00000000 00000000 00000000 00000000
UN VO W - N VO W - N V W O - M O W0r)
00000 . 00000000 00000000 00000000
CD - - - - - - - -
MMM0C'aOLLON - vor 0V ON wW c - r, (ow M.Now
0) 000 00 0 0 0 0 0 0 000 0 q W- W f oVn- 7M c Wwq WvM 0 000000 W W W- o,00000000 00000000 00000000 00000000
3: 00000000 00000000 00000000 00oo00oo
. '00000000 00 00 0 0000000 M-M0 00000000o o ov -m
M) Lo 0 nLo~M -Wv- W- = v qv M 0Lo- W- - W vqwM M-D 000000000 00000000 00000000 00000000
(7) 00000000O 00000000 00000000 00 0 00 00 0
M0100000000 00000000 00000000 00000000a ) . . . . . . . . . . . . . . . . . . . . .
L 0000 00000000 00000000 00000000
a) Lor~~n~ V - - q v 0Ln1wv - v-WM0 -cr'1~c~ -Wv vM 0v-W CDv T
0.00000000 00000000 00000000 00000000
.~00000000 00000000 00000000 00000000
. .0 . .. .000000000000000 00000000 0000
*00000000 00000000 00000000 00000000z aI~o00000 00000 0000000 0 0000000oow
LU -n00000000 00000000 00000000 00000000(* ) . . ... . . . . . . . . . . . . .
*00000000 00000000 00000000 00000000
U-. oe~ ON0WMMM 0p MnJLn) 0 o OD 0 VW D o qv O~v v
Lo 0.00000000 00000000 00000000 00000000.~. . . . . . . . . . . .
. '3)00000000 00000000 00000000 00000000
a. -cq~a -WoPsttWVo VNWNCr 0- -NW(Oqwj0
LU 0.00000000 00000000 00000000 000000000 . . . . . . . .
-d *00000000 00000000 00000000 00000000
*A 0 - JM~Ic~ P.-M P M- 0N 1 M0 OMVrWMWO MM ~.,
, ~ 00000000 OC00D0 00000000
MmoM O - W VN ?-

~~~Lfl'-(Dm OM0-W 00 NcOnW ~ C JOVMMMMNN\ OV MMMNNe~ ommmmNjcN
c, 0 0 0 0 00 0 0 0 0 0 00 0 0 0 0 0
LL,.mMMMeJc OV~MM Mmc ovmmmmcjN~ .7mmmmNMNje
i *00000000 00000000 00000000 00000000
.0 C.00000000 00000000 00000000 00000000
0 mm ow m Vo'CO Dh -m.oumw .CMMMNMWN
G~0000000 00000000 00000000 00000000- C . . .. . .
n 0000000000000 00000000 00000000
c O.Vvf~mmmmmNJ m VMMMMNNN VMMM NNCJJi VMMCJNN0.00000000 00000000 00000000 00000000
HCr).....~00000000 00000000 00000000 00000000oE0
v LL 0 00 0 -C 0 0000 0 00000000 0000000 L
L00000000 00000000 00000000 00000000
E: N c~M - W Wcoo 0 vMvL Dc - Nm a LO DCo.0 -NMVM QWnO0U)-
* Ommmm 00000000 ~C.CJ
- ~ 0000000O 00000000 00000000 00000000
00000000 00000000 00000000 00000000
00000000000000 00000000 00000000
* C,00000000 00000000 00000000 00000000
U.c ~ u c c J . . . . . . . . . . . . . . . . . . . . .
00000000000000 00000000 00000000IQ
-0:00000000 00000000 00000000 00000000
S 00000000 00000000 00000000 00000000
-W m. mt - mr J\ -. mmmmmc'ucv m m m ~c N N ~mmM NrNjN0 0 0000000 00000000(DO 00000000 00000000
0000000 000000 00000000 00000000
E :.WmtnmLom0 -rN'J W P N-WM 0LOM . M0 0 000mv;f(Or0
E C A--00000 -0000000 -0000000 00000000.*~ ., .
0000000000000 00000000O 00000000
0
m m% ,, 0 o- Wm w qv
(A C0000000 00000000 00000000 00000000
uJ M 0-000000 00000000 00000000 00000000
4 00000000 00000000 00000000 00000000
zLU ACOJf NNUM10OWN commor0?mo(-) wm ww m 0q .Owvfv rmmm(r 0--000000 -0000000 00000000 00000000wL .C , . . . . . . . . ... . . .C. 00000000 00000000 00000000 00000000
uJ 0 -0000000 00000000 00000000 00000000-j U , . . . . . . . . . . . . . . . . . .
*o 00000000 00000000 00000000 000000004N WD M m v w o - M M W
~~'JmNNNNNNNN MJfWfflCOM0 vJWvv~~ -~ wwt)C
- CJCJc~M ~ ~ q q

'v N r N NNM N ru~ru NNNN j N~c~ c rJc\j r~oOCO 00000 0000000 00000000OO 0000 00 00
00000000 00000000 00000000 00000000
0 - -am ~j c\, -0 wvmN--Oo cm N N - - 00 Lfm J--0 0 MLr ucj N NN NNNurN N NN N~u u u jeu
cocc000000 00000000 00000000 00000000
0~ c00 0 0 00 00000000 0 00 0 00 00 0 C0 000 00
oD -a ~ mU 0 0 ) c ) o N ~L 0 -aq aa D a ) tOvmN~rN-00 cOme~c--Oo M N--0Coo amm'--0OM
Lo-00000000 00000000 00000000 00000000
0 om cuuN-- r)0 :)m N - - 0 0 M a ~mu- -0a' qN--OOaCc a, N ru N N N N N N NNNNNNNcar- ruN NNNNN'- N m u m N cu- -
0.00000000 00000000 00000000 000000000n - . . .. . . I . . . . . . . . . . I .
* 00000000 00of-0000 00000000 00000000
0
oamrJ--0OOMM mN-000O0a C\J000CMO N-00O~OMMO) 0 NNNNmJC - NNJNNNC\J NNNruNJ-'- NN N -
- L.00000000 00000000 00000000 00000000
'00000000) 00000000 00000000 00000000
E -C'JNmvMnCo0 -NrmvLnow0 -rumvLnww -rum~Lloww
U)
- :00000000 00000000 00000000 00000000
00 vcDflm m 0q -- Lnvvm - o m ruo- mN
- oa00000000 00000000 00000000 00000000
Q) ,00000000 00000000 00000000 00000000
a) 00000000w 00000000 00000000 00000000
* C,'OOOOOOOo~ 00000000 00000000 00000000
m aP nnc utu N cNNN NN N Nj (jCjc~ ~ ~ NrJ~~ rCj NNNvNc~j cC- n 00000000 00000000 00000000 00000000
'000000 00000000000000 00000000
a) a,, C%~eJNuCN NNNNNNNNuCJ~ NNN N'.cJC JCUNN- 0-00000000 00000000 00000000 00000000
S 000000 00000000000000 00000000
.'00000000 00000000 00000000 00000000
- *-00000000 00000000 00000000 00000000
00000000 00000000 00000000 00000000
2 0000 00000000 00000000 0 0000 000
00000000OOO 00000000 00000000 000000300
< 0000 00000000 00000000 00000000
1 .mmmNNNN mmmNNNN mmmwNNNN mmNNNNNNM 0,00000000 00000000 00000000 00000000uj.... . ... . .. C. . ......
4 0000000000000 00000000 00000000
a-000000000 00000000 00000000 00000000LC) .C . . . . . . . . . ..'
0. .00000000 00000000 00000000 00000000
- m- Lo W cc 0 - N m - LC coccN -N .(O WWO - cluM 00
C. -------- ~ -------- 0~ -------- ~ .~N "NMNMN0~

ONOV 0 m ( mm 0ON i-* m f 0 0 LOmLw
-,Cc 00000000 0000000 0000
00000000 00000000 00000000 00000000
- m m - m w 0Lo) Ncu0 mi- 0 LC(m ( r-ULO 0 O-m C~wLSC No OVlu C) C"D N 01N; ; ; rNo oa) 00000000 00000000O 00000000 00000000
.x ~~~'.0 0 0 0 0 0 0m 0 0 0 0 0 0 0 00 00 0 0 0 0 0
rUN CUC\ w a - D 0 N W -0'Cm~w J 00 00 0 00 0 0 00 00 0 00000000(DLn-W vo ~ w o
- e 0 00' 0C
.0 00000000 00000000 00000000 00000000
0OM0OWONZN W=MNMNCDO w m O)C w m mLM Of-.NVOOM00CO C v Om-C0lwow o r- v m M 0CLU) qOrC~ w --"i NrN -u - -N --
0 00000000 00000000 00000000 00000000a ) . . . . . . . . I
00000000 00000000 00000000 00000000
0
a) 0 iC- ~ .. . ...00 00 0 0 0 0 00 0 0 0 00 0 0 0 0
00000000 00000000 00000000 00000000
0inV0 w - -~ww
MOMOM 00000000 v- NNN(Cu
tr .Mrn CuiCCu u N nm CUNN m- MC\INNMCJ In .UON 4- o,0000000 00000000OOOC 00000 0 a0 C000000
* 00000000 00000000 00000000 00000000
N MuuuCJN MNNNNN-.- MNNNN-- M N NC\J m~~00000000 0000000 00000000 00000000
* )0000000 00000000 00000000 00000000CD)u . Y (D -a 0m V N; ~t~ u0 N. ; 00 ~ 0) m00 (DCC m~ MN CujCuiC\uz Ci MuU NCm u M NNN CuNCujCu~u
0 A. 00000000 00000000 00000000 00000000
C- 00000000 0000000 00000 c00 00000000
E0.00000000 00000000 00000000 00000000
m. 0) .
S 000000 00000000 00000000 00000000
O0-00000000 00000000 00000000 00000000
-T U" 0 000 0 00000000 000000n ( w0 0 0 0 0
0 -C mL 00 00 0-N Q I cc~ (D CD m ho Co\JM oLf)C0w
i C.
S '-000000 00000000 00000000 00000000N 0' .
0)0000000 00000000 00000000 00000000
C7) , -0000000 00000000 00000000 00000000
zL 0)00000000 00000000 00000000 00000000
0 L00000 00 0a0 00 000 000 00 0 00 0 00 00 00 0
Cu 00 w om ) V O
01000000a00 00000000 00000000 00000000
OO0O000000 00000000 00000000 00000000
0. 000000000 00000000 00000000 00000000
w1 0.000000 00 00 0 00 00 0 00000000.. . .. ..
0000oo0000 00000000 0 00 0 00 00 400000000
N . LO (DACc 0 -CuN wLcO f - C - N m -a in 0 CML Co 0
C,
(D Ci L~z V 0 NoLono mooo OWNM OMWVNOJ0 -Ln
3)o:oo 000Ooo o ocooc 00000000cm . .. .0000000 0 00 000000 0000000
0
- A----------0 0 Coco 0 000 0 r -000
U)00000000 00000000 00000000 00000000
.00000000 00000000 00000000 00000000
0
00000000 00000000 00000000 00000000
- '.........................................I...... ........ ....... .
c,:00000000 00000000 00000000 00000000
, 0r0C 0 00 -00000000 0 0000 0 0 0000
000000000 00000000 00000000 00000000
II ...
E 00000000 00000000 00000000 00000000
C) .0*00000000 00000000 00000000
00000000 0000 0000 00000000
S 00000000 00000000 00000000 00000000
00000000 00000000 00000000 00000000
11 c 00 00 0 v W q - v 00 O 0 0 00 0 000000w
-wm W~ M000 0 m , w0 v N o0 000 0 0 v0 M
0 0
00
ArnuA(~ NcJN ----- N ------ N ------
E M:00000000 00000000 00000000 00000000
L C , 0 -c 00000000 0000000 00000000
0atV WP 0nv m0000000 rnrnc000 WO rnANeu( )V
- O)000000 000000 000000 00000000
Z (M00000000c 00000000 00000000 00000000
C)J . 00000000 00000000 00000000 00000000
- ,00000000 00000000 00000000 00000000
IV L 00000000 00000000 00000000 00000000
0 LD
0:.00000000 00000000 00000000 00000000
LO .a . . . . I . .. .E 00000000 00000000 00000000 00000000
M )WC I "VU CCO0 -CVM- nWW0 - M M W
In-m -IWV R! 0 2 2! 0 2 T 0 o o rD ,C~ NCI(

UNCLASS I FIEDSECURITY CLASSIFICATION Of THIS PAGE (When D"e Entered)
REPORT DOCUMENTATION PAGE BEFOREsCrPuN FORM
REPORT MUMmeR 3, GOVT ACCESSION NO. 3. RECIPIENT'S CATALOG NUMMER
419
4. TITLE (and Subtitle) S. TYPE OF REPORT a PERIOD COVEREO
An Extension Of Cochran's Test For TECHNICAL REPORTHomogeneity Of Variances G. PERFORMING 0RG. REPORT NUMUEX
7. AUTHOR(e) S. CONTRACT OR GRANT NUMIER(e)
H. Solomon and M. A. Stephens N00014-89-J-1627
S. PERFORMING ORGANIZATION NAME AND ADDRESS 10. PROGRAM ELEMENT. PROJECT, TASK
Department of Statistics ARIEA A WORK UNIT NUMCERS
Stanford University NR-042-267Stanford, CA 94305
i. CONTROLLING OFFICZ NAME ANO ADDRESS 13. REPORT DATE
Office of Naval Research August 8, 1989
Statistics & Probability Program Code 1111 13. NUMIEROF PAGES33
t4. MONITORING AGENCY NAME & AOORESS(I dif terent Ina Contrellng 0ffcs) Is. SECURITY CLASS. (o fh #a..)
UNCLASSIFIED
IS.. Oi CL.ASSIFIrICATI ON/OOWMNGRAOI NGSCM IOULI
r
It. O1STRIUUTIOM STATEMENT (of ld Reporf)
APPROVED FOR PUBLIC RELEASE: DISTRIBUTION UNLIMITED
17. DISRIUTION STATEMENT (01 the ebettect entered In lo, k0. II difnemrn fbom Reped,)
I4. SUPPLEMENTARY NOTES
It. KEY WORDS (Contlaue on reowea ide It necoeev and Idaemilt by ledia mmbr)
Control charts; process control; quality control, stability of variance.
20. ASSTRACT (Cenihme an revern alde IS nacoesery sind Identitby b. mumbo)
Cochran's test for equality of k normal population variances consists ofcomparing the largest of the set of k sample variances, all based on the samenumber of degrees of freedom n, with the sum of the sample variances. Moregenerally, it may sometimes be advantageous to compare the m-th largest samplevariance with the total. The distribution theory of the resulting statistic Zmis discussed, and a table is given of percentage points of Zm , for a widerange of k, n, and m, with which to make the test. The test is illustratedwith an example taken from Duncan (1986).
DD I P1OH 1473 EoITION OF I NOV 45 Is o,1SOLTELIELS/N 0102-014-601 1 UNCLASSIFID33 99CUIRITY CL.ASSIICATION OF
rT141S PAQ-9- (Wht Date anforew)
Related Documents