COBALT, NICKEL ANU SELENIUM IN TASMANIAN ORE MINERALS by G. D. LOFTUS-HILLS, B.Sc. (lions.) Submitted in partial fulfillment of the requirements for the degree of Doctor of Philosophy. UNIVERSITY OF TASMANIA HOBART 1968

Welcome message from author
This document is posted to help you gain knowledge. Please leave a comment to let me know what you think about it! Share it to your friends and learn new things together.
Transcript
COBALT, NICKEL ANU SELENIUM IN TASMANIAN ORE MINERALS
by
G. D. LOFTUS-HILLS, B.Sc. (lions.)
Submitted in partial fulfillment of the requirements
for the degree of Doctor of Philosophy.
UNIVERSITY OF TASMANIA
HOBART
1968
This thesis contains no material which has been accepted for
the award of any other degree or diploma in any University and, to
the best of my knowledge and belief, contains no copy or paraphrase
of material previously published or written by another person, except
where due reference is made in the text of the thesis.
G. D. LOFTUS-HILLS.
University of Tasmania, November, 1968,
ABSTRACT
Analyses of Co, Ni and Se in pyrites and other minerals from a
wide variety of Tasmanian ore deposits support a genetic relationship
between the Mt. Lyell (pyritic - Cu) and Rosebery (banded In-Pb-Cu)
deposits, and the Cambrian eugeosynclinal volcanic rocks in which they
occur.
The concentration trends for all the ores due to fundamental
availability contain smaller-scale components due to depositional
processes, which, except in one case, do not interfere with these
trends. The components include impoverishment of Co (and Ni) during
remobilization of sulphides, increase in Ni and decrease in Co away
from the centre of zoned deposits, impoverishment of Ni (and Co) in
replacement as compared with vein lodes, and regular and irregular
partitioning of respectively Co-Ni and Se between coexisting minerals.
The trends of Co-Ni in pyrite due to availability include the
following:
(a) The sedimentary-diagenetic pyrites generally contain
Co/Ni < 0.5, but show no correlation of Co-Ni values with rock type,
age, or degree of recrystallization.
(b) Pyrites in the Cambrian acid-intermediate igneous rocks
have Co/Ni ratios ranging 1-150, and contain up to 0.8% Co.
(c) Pyrites from Devonian hypogene replacement and vein
deposits show two main trends - 0-1500 ppm Ni, with Co/Ni < 1; and
0100 ppm Co, with Ni ranging 10-100 ppm.
The Se contents of sulphides associated with Cambrian and
Devonian acid-intermediate igneous activity are indistinguishable, but
the Savage River magnetite ore, the Cuni Cu-Ni ore, and particularly
the Mt. Lyell ore are all enriched in Se, whereas the Rosebery ore is
impoverished.
The Co-Ni values in the Mt. Lyell and Rosebery ores follow the
trend for pyrites in the Cambrian acid-intermediate igneous rocks.
The dispersion of Se at Mt. Lyell is consistent with the postulated
open-cast origin for the massive ores, and within the Rosebery lode,
the stratification of the Co-Ni values, and their gradation between .
lode and normal sedimentary types, strongly suggest a sedimentary origin.
These and other collated data suggest that ores associated with geo-
synclinal vulcanism may be characterized by (i) high to very high Co/Ni
ratios, and often marked impoverishment in Ni, (ii) greater Co and Ni
concentrations associated with Cu than with Pb-Zn ores, both within and
between deposits, and (iii) a tendency for Co to correlate with Cu
within deposits.
In Tasmania, Se and 5S 34 values are more closely controlled than
Co-Ni in their fundamental availability by other than genetic factors,
and within deposits they show less variation due to depositional
processes.
Selenium was analyzed by X-ray fluorescence spectrography, and Co
and Ni by atomic absorption spectrophotometry. In the latter technique,
because Fe caused both non-atomic absorption and chemical interferences
in the flame, it was extracted with di-isopropyl ether.
CONTENTS
Page
1. INTRODUCTION 1
SCOPE OF THESIS 1
ACKNOWLEDGEMENTS 2
2. THE STUDY OF TRACE ELEMENTS IN ORE MINERALS 4
DISPERSION OF TRACE ELEMENTS 4
APPLIED STUDIES 5
Metallogenic Provinces 5
Environments and Conditions of Deposition 7
PROBLEMS OF INVESTIGATION 10
THE STUDY OF TASMANIAN ORES 12
3. DISPERSION OF COBALT, NICKEL, SELENIUM AND CADMIUM 15
COBALT AND NICKEL 15
Crystal Chemistry 15
Primary Dispersion 18
- Availability 18
- Depositional processes 24
Secondary Dispersion 24
- Sedimentation 24
- Metamorphism 28
Discussion 29
SELENIUM • 31
Crystal Chemistry 31
Primary Dispersion 32
- Availability 32
- Depositional processes 33
Secondary Dispersion 34
- Sedimentation 34
- Metamorphism 35
Discussion 35
CADMIUM IN SPHALERITE 36
SUMMARY 38
4. SAMPLING AND ANALYSIS 40
SAMPLING 40
SAMPLE PREPARATION 41
ANALYSIS 42
Cobalt and Nickel 43
Selenium 59
Copper, Iron and Zinc 62
5. METALLOGENESIS OF TASMANIA 65
GEOLOGICAL HISTORY 65
METALLOGENIC HISTORY 69
6. COBALT, NICKEL, SELENIUM AND CADMIUM IN ORE MINERALS 80
COBALT AND NICKEL ANALYSES 84
Sedimentary-Diagenetic 84
Precambrian (?) Intramagmatic 91
Cambrian Intramagmatic 91
- Acid-intermediate Rocks 91
- Mafic-ultramafic Rocks 91
Devonian Intramagmatic and Hydrothermal 92
Mt. Lyell 93
Rosebery-Hercules District 93
Mt. Farrell group, Mt. Remus 94
Lake George Mine, Captain's Flat, N.S.W. 94
SELENIUM ANALYSES 95
ANALYSES OF CADMIUM IN SPHALERITE 96
DEPOSITIONAL AND POST-DEPOSITIONAL VARIATIONS 97
Distribution Functions 97
Variation within Single Minerals 98
Correlations with Mode of Emplacement 100
- Massive-disseminated 100
- Vein-replacement 100
- Vein-sedimentary 102
Remobilization 104
Partition between Minerals 107
Dilution 109
Zoning 110
Discussion 113
METALLOGENIC SUBPROVINCES 114
ORES OF UNCERTAIN ORIGIN 115
Savage River 115
Mt. Lyell 117
Rosebery-Hercules District 120
Mt. Farrell 123
Magnet 124
Mt. Remus 124
Lake George Mine, Captain's Flat, N.S.W. 124
Discussion 125
CONCLUSIONS 126
Processes 126
Mineralization of Known Origin 129
Mineralization of Uncertain Origin 130
Investigational Procedures 132
Generalizations 132
REFERENCES 134
APPENDIX 1 : CADMIUM AND IRON IN SPHALERITES - SAMPLE PREPARATION AND
ANALYSES.
APPENDIX 2 : ANALYSES OF CADMIUM AND IRON IN TASMANIAN SPHALERITES.
APPENDIX 3 : SPECTROPHOTOMETRIC DETERMINATION OF COBALT -
2-NITROS0-1-NAPHTHOL METHOD.
APPENDIX 4 : ATOMIC AbSORPTION SPECTROPHOTOMETRIC DETERMINATION OF
COBALT AND NICKEL.
APPENDIX b INDEPENDENT SELENIUM ANALYSES.
REFERENCES : APPENDICES.
APPENDED REPRINTS : (i) Loftus-Hills and Solomon (1967).
(ii) Loftus-Hills, Solomon and Hall (1967).
LIST OF FIGURES
Following page
3.1 Suggested partition of Co and Ni between ore minerals. 15
4.1 CompariSOn of Ni analyses by atomic absorption and )01F. 44
4.2 Comparison of Co analyses by atomic absorption and
spectrophotometry. 44
4.3 Interferences in the atomic absorption analysis of Co
and Ni in Fe-rich solutions. 48
4.4 Atomic absorption analysis: erratic dilution behaviour
of Fe-rich solutions of Zn and Co. 51
4.5 Comparison of Se analyses by three laboratories. 61
4.6 XRF analysis: standard graphs for CU, Fe and Zn. 64
5.1 GeOlogical map of Tasmania. 65
5.2 summary of geological history and mineralization of the
mineralized areas of Tasmania. 66
- 5.3 Locality map for the sets of samples other than from
the west coast of Tasmania. 66
5.4 Geological and locality map of the west coast of
Tasmania. 66
5.5 Geological and locality map of the Mt. Lyell area. 72
5.6 Distribution of S -isotope ratios from some ores and
sedimentary pyrites within the Mt. Read Volcanics. 73
5.7 Geology of the Rosebery and Hercules deposits. 74
5.8 Geological and locality map of the Tullah area. 76
6.1 Co and Ni in sedimentary -diagenetic pyrites ' with
definition of Trend I. 84
Following • page
6.2 Textures of some sedimentary pyrite nodules. 89
6.3 Co and Ni in pyrites and magnetites from Savage River. 91
6.4
Co and Ni in pyrites, magnetites, and Cu-Ni ore, from
mineralization in Cambrian igneous rocks, with
definition of Trend II. 91
6.5 Co and Ni in pyrites and pyrrhotites from Devonian
ores: west coast area. 92
6.6 Co and Ni in pyrites from Devonian ores: Moina and
north-east areas. Definition of Trends III, IV, and V. 92
6.7 Co and Ni in pyrites and chalcopyrites from the West
Lyell area. 93
6.8 Co and Ni in pyrites from Mt. Lyell lodes other than
in the West Lyell area. 93
6.9 Co and Ni in pyrite and pyritic ore from the main lode,
Rosebery Mine. 93
6.10 Co and Ni in pyrites and pyritic ore, Rosebery-Hercules
area. 93
6.11 Co and Ni in pyrite (and arsenopyrite) from the mines
in the Tullah area (Mt. Farrell group), and in pyrite
from Mt. Remus, and Captain's Flat. 94
6.12 Histogram of all Se analyses. 95
6.13 Histogram of all analyses of Cd in sphalerite. 96
6.14 Co and Ni distribution histograms. 97
6.15 Variation in Co and Ni concentrations in. one mineral
within single specimens. 98
Fig. Following page
6.16 Variation of Se concentration in one mineral within
single specimens. 99
6.17 Distribution of Se concentrations in the different
ore-types at Mt. Lyell. 99
6.18 Locality and geological maps of the Mt. Bischoff area. 100
6.19 North-south cross-section through Mt. Bischoff. 100
6.20 Cross-sections through the Renison Bell Mine. 100
6.21 Co and Ni in pyrite, pyrrhotite and arsenopyrite from
vein and replacement deposits at Mt. Bischoff and
Renison Bell. 101
6.22 Averaged Co and Ni concentrations for Mt. Bischoff and
Renison Bell, and within-specimen concentration
variations. 101
6.23 Co and Ni in pyrites and pyrrhotites from the Nairne
Deposit, South Australia. 103
6,24 The effect of remobilization on the Co and Ni contents
of pyrite and chalcopyrite, West Lyell. 105
6.25 Partition of Co and Ni between associated minerals -
individual specimens. 107
6,26 Averaged results of the partitioning of Co and Ni
between pyrite and other associated minerals. 107
6.27 Variation of parameters of possible thermometric
significance with spatial position at Mt. Bischoff. 110
Fig.
6.28 Spatial distribution of Co and Ni in pyrite,
Following page
pyrrhotite, and arsenopyrite at Mt. Bischoff. 110
6.29 Zoning of Co and Ni at Zeehan and Story's Creek. 111
6.30 Averaged Cd and Fe in Tasmanian sphalerites. 112
6.31 Co and Ni contents of py concentrates from three
drill holes through the Prince Lyell orebody. 118
6.32 Co, Ni, pyrite, chalcopyrite and sphalerite contents
of the Rosebery lode in two adjacent cross sections;
E lens, 14 level. 120
LIST OF PLATES
Plate
6.1, 6.2 Textures in a sedimentary pyrite nodule from the
hangingwall shale, Hercules Mine: zoned cores and
crystals, and rim zones.
6.3 Vein - replacement relationships in the Battery
Open Cut, Renison Bell.
6.4, 6.5 Textures in the metamorphosed and partly remobil-
ized sedimentary pyrite-pyrrhotite ores at Nairne,
South Australia.
Following page
89
101
106
LIST OF TABLES
Table Page
3.1 Abundances of Co and Ni in igneous rocks. 20
3.2 Some ores of possible volcanic origin analyzed for Co and Ni. 23
3.3 Abundances of Co and Ni in sedimentary rocks and pyrites. 26
4.1 Contamination in sample preparation. 41
4.2 Ni analysis by XRF : Operating conditions. 45
4.3 Co analysis by spectrophotometer : Operating conditions. 46
4.4 Comparative sample analyses for Co and Ni with and without
Fe-extraction. 53
4.5 Co and Ni analyses by atomic absorption : Operating
conditions. 56
4.6 Co and Ni analyses by atomic absorption : Reliability tests. 57
4.7 Se analysis by XRF : Operating conditions. 60
4.8 Cu, Fe, and Zn analyses by XRF : Operating conditions. 63
6.1 Analyses of Co, Ni and Se in ore minerals. 80
6.2 Textural data for sedimentary -diagenetic pyrites. 85
6.3 Analytical data for the Rosebery Mine hangingwall shale,
Que River siltstone, and Branch Creek shale. 87
6.4 Electron microprobe analysis of a pyrite nodule from the
Hercules Mine hangingwall shale. 90
6.5 Cross-correction procedure for Co and Ni in Mt. Lyell pyrites
and chalcopyrites. 105
Table Appendix
A2.1 Analyses of Cd and Fe in Tasmanian sphalerites. 2
A2.2 Average Cd and Fe values in Tasmanian sphalerites. 2
A5.1 Comparison of independent Se analyses. 5
1
I. INTRODUCTION
Tasmanian ore deposits are unusual in their variety and richness.
They have been subjected to scientific examination for over eighty years,
but the origin of some of them is still unclear. This thesis forms part
of the continuing investigation of the deposits by the group led by
Dr. M. Solomon at the University of Tasmania. In addition to using
standard field and laboratory research techniques, the group is special-
izing in mineral thermometry and barometry, isotope geology, and
geochemistry.
SCOPE OF THE THESIS
The initial aim of the investigation was to determine the extent
to which the trace Co, Ni and Se contents of ore minerals could be used
to elucidate the genesis of some Tasmanian ore deposits. In order to
define trace-element concentration trends which were empirically useful
as genetic discriminants, as many as possible of the potentially inter-
fering non-genetic trends, due to local effects at the deposition site
and post-depositional changes, had first to be accounted for. This has
yielded results of general geochemical significance, and has helped to
solve some specific geological problems.
Part of this work has been undertaken in collaboration with
Mr. D. I. Groves (Tasmanian Department of Mines). While most of the
Co and Ni work is mine, the study of Cd in sphalerite was mainly Groves',
2
and the Se analytical work was equally shared. The only analytical data
listed in the body of the thesis are those produced wholly or partly by
myself. The analyses of Cd and Fe in sphalerite are listed in
Appendix 2. The development of original analytical techniques is des-
cribed in Chapter 4, but the detailed procedures are described in
Appendices.
ACKNOWLEDGEMENTS
I wish to express my appreciation of the sustained inspiration,
guidance, and practical assistance of Dr. Michael Solomon during the
course of this study. Mr. David Groves' energetic cooperation in our
joint investigations is very much appreciated. Mk. Ramsay Ford has been
a source of expert advice on all matters geochemical. Discussion with
other Departmental Staff, and fellow graduate students, has been most
stimulating.
Thanks are due to the following for invaluable advice on atomic
absorption technique and theory: Dr. K.L. Williams and Dr. C.S. Rann
(A.N.U.), Mr. B.S. Rawling (Zinc Corporation, Broken Hill), Dr. D.J.
David (CSIRO, Canberra), and Prof. T.S. West (Imperial College, London).
Dr. J.F. Lovering (A.N.U.) kindly arranged for analyses of pyrite
specimens on the electron microprobe. Dr. P.W. Smith (University of
Tasmania), Prof. H.P. Schwarcz (McMaster) and Dr. J.B. Goodenough
(M.I.T.) gave helpful advice on crystal field theory, and Mr. B.D. Johnsop
and Dr. V.P. St. John generously devoted time to developing computer
programmes. Mr. A. Grassia (CSIRO, Hobart) and J.P.. McKibben helped in
elucidating some statistical problems.
3
For permission to sample, and for assistance in the field, I am
indebted to the Mt. Lyell Co. and Messrs. R. G. Elms and K. 0. Reid; the
Electrolytic Zinc Co. and Mr. R. B. Brathwaite; Renison Ltd. and
Mr. R. Shakesby; the Storey's Creek Tin Mining Co.* and MY. C. Kingsbury;
the Broken Hill Proprietary Co. and Mr. C. E. Gee; and Pickands Mather
& Co. and Mr. A. Munro. Samples were also collected by Dr. R. George,
and Messrs. M. R. Banks, A. Brown, C. E. Gee, A. B. Gulline,
J. P. McKibben, J. Jago, M. Rubenach, and D. Patterson. I wish to thank
Dr. M. Solomon, Mr. C. E. Gee and Mr. P. Gourley, for assistance in the
field. The assistance with some of the drafting of Mrs. Helen Quilty and
the Tasmanian Mines Department is gratefully acknowledged.
The research was supported by the Australian Research Grants
Committee (grant to Dr. M. Solomon) and by the University of Tasmania
research funds.
For laboratory and typing assistance, and for sustained encourage-
ment, I am greatly indebted to my wife.
* The spelling of the town, from which the mine takes its name, has been changed to "Story's Creek".
4
. THE STUDY OF TRACE ELEMENTS IN ORE MINERALS
DISPERSION OF TRACE ELEMENTS
All naturally crystallizing minerals incorporate, by various mechanisms,
traces of elements foreign to the mineral. The trace element content of an
ore mineral is controlled by a large number of variables, which may be divided
into those acting at the source of the transporting medium, during transport',
during deposition and after deposition (during metamorphism or diagenesis).
Rose (1967) has given an extensive list of possible variables in a magmatic-,
hydrothermal ore-depositing system. In such a system the individual
variables at source and during transport are not all accessible for systematic
investigation, and trace element concentration due to their combined effect
is referred to here as "availability". Even when the source and transport
mechanisms can be examined, as with some minerals formed by surface processek,
so many variables are acting that it is often still necessary to describe
their effect in terms of empirical availability.
Trace elements may be held in various structural sites in a mineral
e.g. in diadochic substitution, in interstitial sites, in lattice defects
(Goni and Guillemin, 1964), or in growth zones (Grigor'ev, 1961; Tauson,
1965). In addition, trace minerals may be captured during the growth of the
host mineral, or may exsolve during its cooling, and these may interfere in
those trace element studies which require single-mineral rather than whole-ore
analysis (Loftus-Hills and Solomon, 1967). It should be noted with respect
to the following discussions that some older single-mineral trace element
analyses do not record any monitoring of, in particular, trace mineral
contPmination.
5
APPLIED STUDIES
Trace element studies in sulphides have usually been directed towards
one or more of the following objectives : determination of metallogenic
provinces, of general environment of deposition, or of detailed conditions
of deposition (Loftus-Hills and Solomon, 1967). The studies as listed
require examination of successively shorter wavelengths in the concentrationr•
distance distribution pattern, but different combinations of trace elements
and minerals have different patterns. The elements most suitable for study
of availability are those that show little control by depositional and post-,
depositional variables, thus allowing the larger scale patterns to emerge.
Conversely, if an element is a good discriminant of the local variables, it
may thereby be a poor indicator of availability. The usefulness of various
trace elements in these studies will be examined in following sections.
Metallogenic Provinces
The dispersion of metals in space and time over large areas has been
studied on: many different scales and with varying emphases, but the
evident difficulties in defining criteria for classification of metallogenic
provinces and epochs (Turneaure, 1955) has somewhat inhibited quantitative
studies. On the scale of continental structures genetic relationships
cannot generally be demonstrated, and the investigations are mainly
empirical. Within tectonic units, however, it becomes possible to relate
the distribution of metals to magmatic, tectonic and sedimentary stages of
geosynclinal development (Bilibin, 1955; McCartney, 1965; Solomon, 1965a),
and genetic associations such as Cu-Ni sulphides in early geosynclinal
ultramafics, and Sn in later granites, are well known.
6
It has long been recognized (DeLaunay and Urbain, 1910) that trace
concentrations of metals can be used to supplement and expand classifi-
cation of metallogenic provinces and epochs based on mineral concentrations.
Stoiber (1940) and Schroll (1950, 1951) found that the trace element
composition of, respectively, sphalerite, and galena and sphalerite, was
distinctive for certain metallogenic provinces. Warren and Thompson (1945)
and Burnham (1959) have subdivided large, mineral-defined provinces on the
basis of trace elements in sphalerite, and sphalerite and chalcopyrite.
On a smaller scale, Rose (1967) used trace elements in sphalerite and chalco-
pyrite to classify in space and time the mineralization within the Central
district, New Mexico, and the Bingham district, Utah.. In each of these
studies it was shown, at least qualitatively, that the discriminating
elements had appropriate distribution patterns. Burnham (1959) demonstrated
this distribution quantitatively by calculating that the variance of tin in
chalcopyrite was greater between districts than within districts.
In Australia the only attempt to relate trace element distributions
to evolutionary stages in the development of a geosyncline has been by
Harris (1965), who studied galena, sphalerite and chalcopyrite in south-
eastern New South Wales, within the Tasman Geosyncline. His study -
suffered from inadequate sampling, and no firm conclusions can be drawn from
it.
7
Environments and conditions of deposition
The many attempts to relate trace element distribution in ore
minerals to the origin and depositional conditions of the ores can be
classified as follows:
(i) Single minerals have been analyzed in attempts to correlate
temperature of formation with the concentration of individual elements.
The concentrations of Cd, Mn , Ge, In, Ga and other elements in sphalerite
(e.g. Fryklund and Fletcher, 1956), Re in molybdenite (Fleischer, 1959;
Badalova et 21., 1962; Paganelli, 1963), and Ag, Sb and Bi in galena
(Fleischer, 1955; El Shazly et al., 1957), have been extensively tested
for such correlations. It has gradually been realized that there should be .
no direct temperature-control of concentrations, as the trace elements are
undersaturated with respect to the host mineral. Nevertheless, certain
types of ore appear to develop within certain temperature ranges, and thus
the trace and major element composition may indicate the approximate
temperature of deposition. It is clear, however, that the single element-
single mineral approach is applicable only over restricted areas.
More useful are sets of several trace elements, which can for example
"fingerprint", if only empirically, certain environments of deposition, in
the same way that sets can characterize metallogenic provinces (Taylor, 1965).
Fruth and Maucher (1966) have used the technique in a stratiform Pb-Zn
deposit in the Bergamo Alps, Italy, to correlate two distinctive trace
element sets with two sedimentary fades of the host rock, and they consider,
that this evidence supports a syngenetic origin for the ore.
(ii) Of greater significance for temperature determination is the
analysis of pairs of coexisting minerals for single elements.
8
The partition coefficient defining equilibrium concentrations of the
element in the two minerals is a quantitative function of temperature,
and can be determined experimentally (Frieampn, 1949; McIntire, 1963;
Barton and Skinner, 1967). Numerous attempts to show consistent
partition in natural ores (slimmpry in Fleischer, 1955; Fryklund and
Harner, 1955; Fryklund and Fletcher, 1956; Wilson and Anderson, 1959;
Doe, 1962; Rose, 1967) have indicated that apparently coexisting ore
minerals are rarely in trace element equilibrium.
This could be explained either by the minerals incorporating
the trace elements in non—equilibrium amounts, or by the minerals not
being deposited contemporaneously. More successful studies with
silicate pairs suggest that in order to produce equilibrium partition,
it may be necessary to anneal the ore for times comparable with those
involved in regional metamorphism. Some metamorphosed ores show more
consistent partition between minerals than unmetamorphosed ores
(Roscoe, 1965).
(iii) One mineral may be analyzed for a selected pair of
elements. This approach is used in petrological studies, where ratios
such as Rb/K, Ni/Co, Ni/Mg, Hf/Zr, Ba/Sr (Taylor, 1965) have proved
powerful tools for investigating the geochemistry of igneous rock
series. The pairs consist either of a trace and a major element which
are chemically similar, the former substituting for the latter; or two
trace or minor elements that are similar enough to enter the sane host
mineral, but show different sensitivities to environmental or
depositional variables.
9
In studies of ores, Troshin (1962) has used GaiIn ratios in
sphalerite to qualitatively define temperature ranges of ore deposition.
However the two most promising ratios - CoiNi and Se/S - have been
found most useful in defining environments of deposition (see
Chapter 3).
(iv) The spatial pattern of trace-element distribution within
a deposit can not only indicate gradients of temperature, etc. during
deposition; it can also reflect the environment of deposition of the ore.
One might expect, for example, a stratification of trace element values •
parallel to bedding in a sedimentary mineral deposit. However the
existence of such a relationship would be insufficient evidence for
assigning a sedimentary origin to a deposit.
As Cambel and Jarkovsky (1967) have stressed, it is pointless, if
only because of sampling requirements, to attempt determination of
environments of deposition by trace element studies without a thorough
knowledge of the geology and mineralogy of the sampled areas. The
better this knowledge, the greater is the possibility that the trace
element dispersion shown by each deposit, and the differences between
deposits, might be explained geochemically, rather than by empirical
availability. Especially within deposits, the dispersions are meaning-
less without being tested against predetermined parameters sucti as
spatial interval, mineralogical zoning, temperature gradients, time
There is no advantage in also analyzing S where single monometallic sulphides, rather than. mixedsulphides or concentrates, are being studied. Analyses for Se only would then be classified in group (i).
10
intervals (e.g. textural sequences), differences in wallrock, etc.
By systematic elimination of variables it may then be possible to
approach unique interpretations of data.
PRO6LEMS OF INVESTIGATION
Many trace element investigations of hypogene ore deposits have
been at least partly directed towards the interpretation of the data
in terms of temperature control. However, not only are temperature
gradients difficult to establish independently, due to the paucity of
ore thermometers, but interfering variables may be impossible to define,
much less account for quantitatively. This complexity is shown, for
example, by zoning of trace elements within single crystals ( .g.
Murayyeva et al., 1964). Rose (1967), after analyzing zones in a large
sphalerite crystal for Mn, Cd, Co, In, Ni and Fe, inferred that at
least four factors were necessary to explain the concentration varia-
tions across the crystal. Such studies suggest that the elucidation
of detailed processes of trace element dispersion should improve with
the number of elements analyzed. The use of multi-element sets has
been encouraged by the existence of techniques of multivariate analysis
such as factor analysis (e.g. Spencer, 1966).
It is not immediately apparent that Single-mineral analyses are
to be preferred to analyses of whole-ore in every type of investigation.
In the study of availability, for example, although the use of a single
mineral ensures a constant host matrix, any dilution effect due to
other trace-accommodating minerals in the deposit remains undefined.
Gavelin and Gabrielson (1947) and Burnham (1959) found that
11
characteristic values in one mineral were accompanied by similarly
high or low values in associated minerals. It cannot be assumed, how-
ever, that dilution is unlikely under all conditions of ore deposition,
and in this study, although the sample sets are biased towards a single
mineral, check-analyses have been performed on associated, where
possible coexisting, minerals.
In single-mineral studies the minimum size of specimens is
determined by the concentration of the mineral in the ore, combined with
the efficiency of the separation procedures, and the sensitivity of the
analytical technique. When the ore is locally about 100% single mineral
(allowing sampling from polished sections), or the trace element con-
centrations come within the range of an electron microprobe, it is
possible to keep sample-volumes very small in order to avoid trace
mineral contamination. This procedure may be disadvantageous in
practice, as more analyses will be required to delineate variation of a
given wavelength, and in general a compromise must be reached between
analyzing many small samples relatively easily, and analyzing fewer
large samples demanding lengthier preparation.
The problems of properly designing a sampling programme in single-
mineral trace element investigations are formidable. Not only is con-
stant sample size impossible to maintain, because of variable concen-
tration of the mineral in the ore, and discontinuity of mineralization;
but the sampling interval, which is usually already variable due to
difficulty of access and irregularity of distribution of the single
mineral, cannot be optimised without some prior knowledge of the dis-
tribution of the trace element in the ore. In particular, the type of
12
serial correlation (Agterberg, 1965) would have to be established for
each deposit, as the surface defining the limits of mutual dependence
of trace element concentrations in specimens close together may be
highly asymmetrical in three dimensions. Finally, if the intention is
to specify the trace element content of a whole ore deposit, and the
sampling technique cannot be systematized, then the existence of gross
concentration gradients, combined with the serial correlation effects,
can only be allowed for by quantity rather than quality of samples.
It may be noted that in many cases where the ideas on the origin of an
orebody have changed, the original sampling in older trace element
investigations, and therefore the data, may be inappropriate for test-
ing the new hypotheses.
THE STUDY OF TASMANIAN ORES
The ore deposits of Tasmania,and particularly of western
Tasmania, are highly suitable for trace element investigations, for
the following reasons:-
(i) The regional geology and tectonics is well known, and the
detailed geology of many of the mines is adequately documented.
(ii) Uncertain relationships between some igneous rocks and
nearby ores have been reduced by extensive radiometric dating of the
former.
(iii) The small size of the area should minimize gross variations
in deep-seated trace element availability for any metallogenic unit.
(iv) Pyrite occurs in every one of the major deposits, and most
of the small ones, allowing comparative studies within a constant matrix.
13
There are two main clases of ore deposit in Tasmania which are suitable
targets for trace-element investigation:
(a) The large deposits at Rosebery and Mt. Lyell have until
this decade been regarded as Devonian magmatic-hydrothermal replacement
deposits. However, both these deposits occur within Cambrian volcanic
rocks, and in common with many similar ore deposits throughout the
world, a genetic association of the ores with their host rocks is
becoming increasingly apparent. The empirical data of trace elements
in ore minerals could therefore provide further evidence for or against
such an association.
(b) There are several smaller vein deposits which, when examined
by standard geological techniques, do not clearly reveal their origin.
A trace element study could well do so.
The trace elements chosen for investigating the Tasmanian environ-
ments of deposition were Co, Ni and Se. These elements are present in
reasonably high concentrations, are less likely than some other
elements such as Pb, Zia, Cu, As, and Sn to contaminate as trace
minerals. and have previously been successful as environmental indica-
tors (see Chapter 3). Minerals other than pyrite were analyzed for
these elements where pyrite was absent, or where dilution or partition
effects required study. If mineral separation was impossible with
available equipment, whole-ore samples were used. The overall avail-
ability trend for each deposit was investigated for interfering
components due to within-deposit variables by testing the trace
element concentrations against all possible independent local para-
meters. The valid trends were then used for genetic discrimination.
14
Tasmanian metallogenesis may be divided into five units: one
probably Precambrian, two Cambrian (one mafic-ultramafic igneous, one
acid igneous), and two nevonian (one in the west, one in the north-
east). The procedure has been to establish the trace element distribu-
tion both within and between deposits of known origin in each of these
units; to determine the background sedimentary-diagenetic values in a
wide variety of sedimentary rocks; and then to compare these with the
distributions for the deposits of uncertain origin. The results of the
empirical correlations have then been compared with similar empirical
evidence from Cd in sphalerites (Appendix 2), and from S-isotope data.
15
3. DISPERSION OF CO8ALT, NICKEL, SELENIUM AND CADMIUM
COBALT AND NICKEL
Crystal Chemistry
To facilitate interpretation of the analytical data, an attempt
has been made to determine orders of preference for accommodation of
Co and Ni in the structures of minerals used in this study. The best
approach would have been to use quantitative crystal field stabili-
zation energy (CFSE) data for the elements and structures involved,
but such data does not yet exist for the transition metal sulphides.
It was therefore necessary to compile all available experimental and
empirical data in an attempt to give a qualitative order of accommo-
dation.
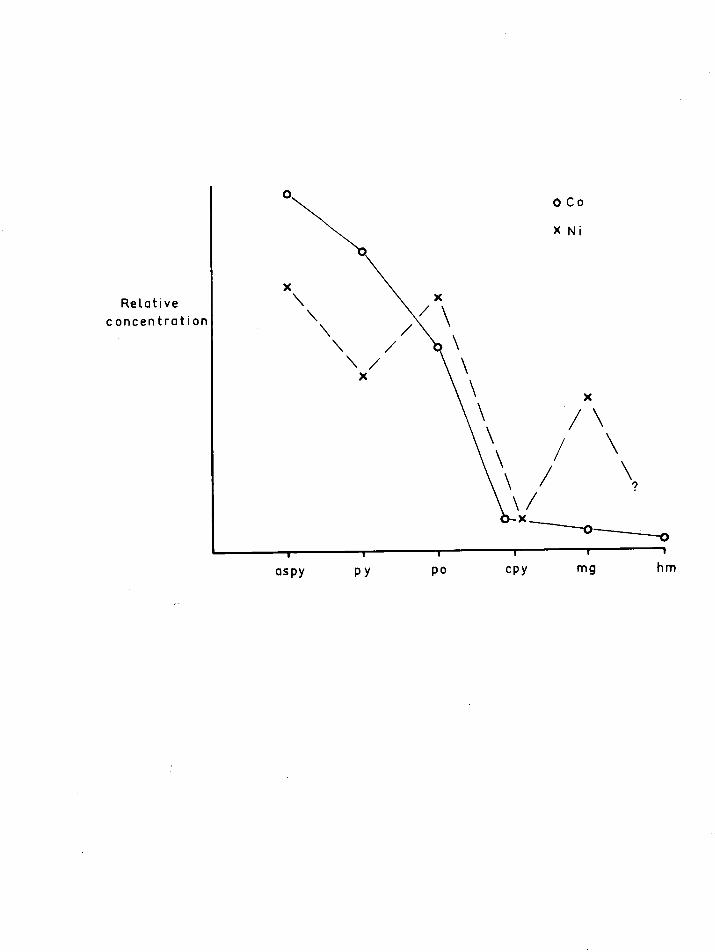
A reasonable interpretation from the data is given in Figure 3.1,
which suggests how Co and Ni should partition between arsenopyrite,
pyrite, pyrrhotite, chalcopyrite, magnetite and hematite, assuming
mutual equilibrium. This interpretation is based on evidence of
widely varying quality; in general the orders of accommodation in the
individual minerals are more firmly based than the differences in
accommodation between minerals. Several different types of explanation
are available for some of these relationships, but the most fundamental
reasoning applicable to each is as follows:-
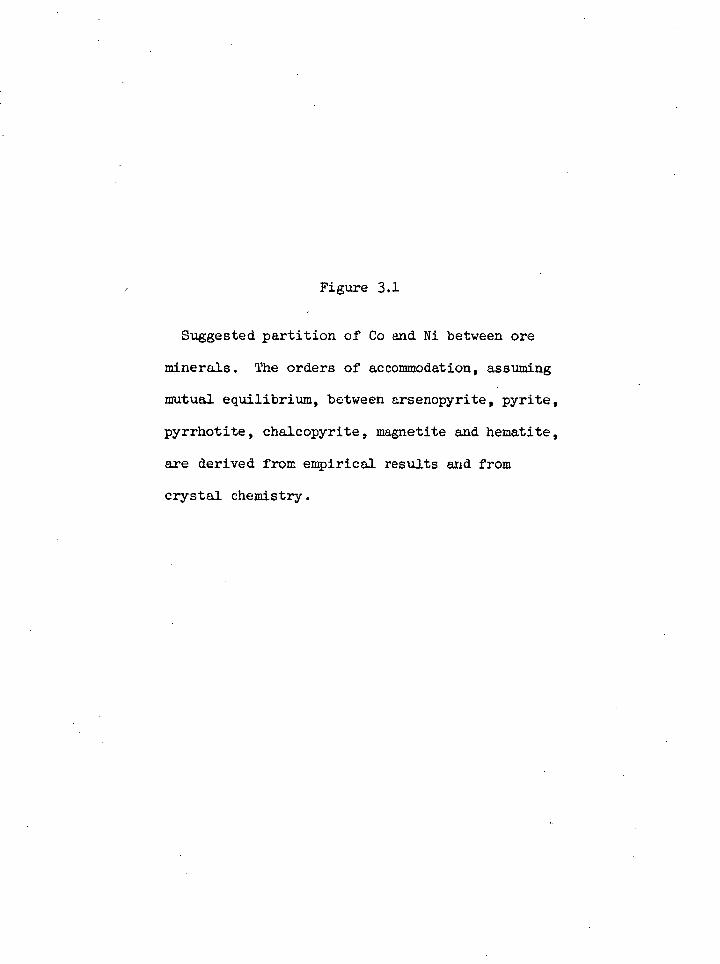
Figure 3.1
Suggested partition of Co and Ni between ore
minerals. The orders of accommodation, assuming
mutual equilibrium, between arsenopyrite, pyrite,
pyrrhotite, chalcopyrite, magnetite and hematite,
are derived from empirical results and from
crystal chemistry.
t hm
1 mg
1
aspy PY
Relative concentration
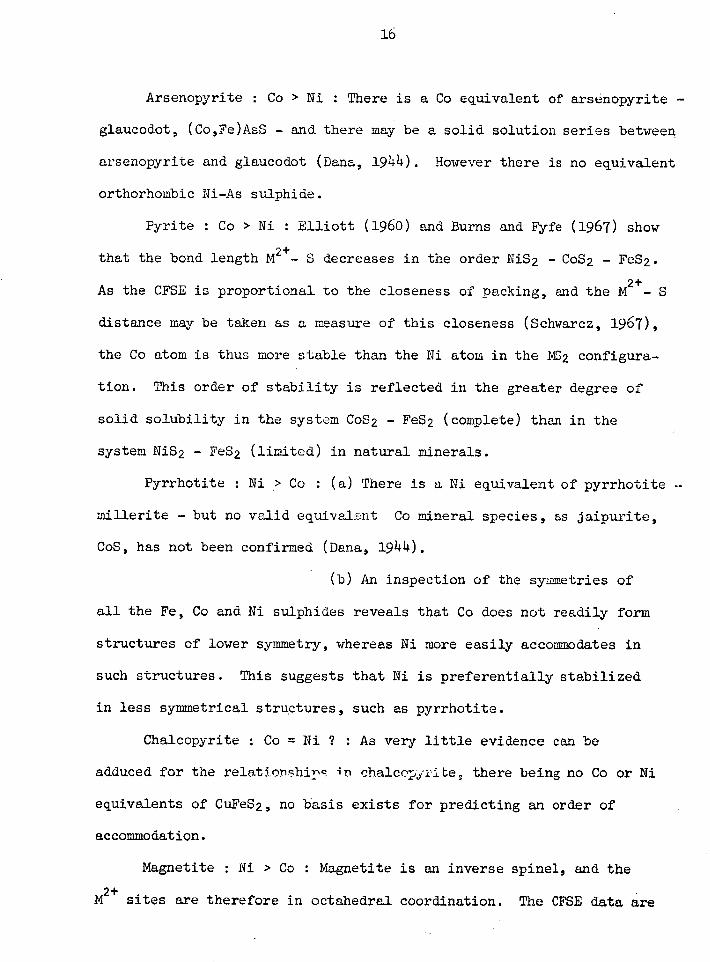
16
Arsenopyrite : Co > Ni : There is a Co equivalent of ars6nopyrite -
glaucodot, (Co,Fe)AsS - and there may be a solid solution series between
arsenopyrite and glaucodot (Dana, 1944). However there is no equivalent
orthorhombic Ni-As sulphide.
Pyrite : Co > Ni : Elliott (1960) and Burns and Fyfe (1967) show
that the bond length M. 24.- S decreases in the order N1S2 - CoS2 - FeS2.
As the CFSE is proportional to the closeness of Packing, and the M 2+- S
distance may be taken as a measure of this closeness (Schwarcz, 1967),
the Co atom is thus more stable than the Ni atom in the NE2 configura-
tion. This order of stability is reflected in the greater degree of
solid solubility in the system CoS2 - FeS2 (complete) than in the
system NiS2 - Fe32 (limited) in natural minerals.
Pyrrhotite : Ni > Co : (a) There is a Ni equivalent of pyrrhotite -
millerite - but no valid equivalent Co mineral species, as jaipurite,
CoS, has not been confirmed (Dana, 1944).
(b) An inspection of the symmetries of
all the Fe, Co and Ni sulphides reveals that Co does not readily form
structures of lower symmetry, whereas Ni more easily accommodates in
such structures. This suggests that Ni is preferentially stabilized
in less symmetrical structures, such as pyrrhotite.
Chalcopyrite : Co = Ni 2 : As very little evidence can be
adduced for the relatiorhiTI in chalcolvrite, there being no Co or Ni
equivalents of CuFeS2, no basis exists for predicting an order of
accommodation.
Magnetite : Ni > Co : Magnetite is an inverse spinel, and the
2+ . M sites are therefore in octahedral coordination. The CFSE data are
17
2+ known for the oxides, and reveal that Ni is more stabilized than
2+ . Co in octahedral sites (Schwarcz, 1967).
Hematite : Co only ? : The existence of Ni in the +3 oxidation
state has not been established, although higher oxidation states can
be produced (Sisler, Vanderwerf and Davidson, 1949). This suggests
that, small though the amount of Co entering the hematite lattice
appears to be, the Ni content should be even smaller, and where present,
probably not held in diadochic substitution.
The relative concentrations of Co and Ni between minerals must be
justified mainly on empirical grounds. The exceptions are: (a) Crystal
chemical considerations show that transition metals will be much more
readily accommodated in sulphides than in oxides because (i) they are
in the more stable low spin configuration in sulphides (Schwarcz, 1967),
and (ii) the stabilization of the metals in the sulphide sites is
strengthened by n-bond formation (Burns and Fyfe, 1967). (b) The
concentration of Co in hematite should be low because the available Co
species will probably be in the +2 oxidation state. (c) The concen-
tration of both Co and Ni in chalcopyrite will be lower than in the
other sulphides because.both the Cu and Fe atoms are in sites of
tetrahedral coordination, which are energetically less stable than
those octahedrally coordinated, as in arsenopyrite, pyrite and
pyrrhotite (J. B. Goodenough, pers. comm.).
The relationships between arsenopyrite, pyrite and pyrrhotite are
founded entirely on observational evidence. Much of the pioneering
work was based on mineral assemblages which were stated to be in para-
genetic sequences, no claim being made for textural equilibrium
18
(Rost, 1939; Hegemann, 1943; Gavelin and Gabrielson, 1947). Nevertheless
the early conclusions have not been substantially varied by later work,
although one of the latter (Neumann, 1950), despite the significance
given it by Deer, Howie and Zussman (1962, p.149), is based on inadequate
sampling. The major qualitative conclusion which may be drawn„particu-
larly from the data of Wager, Vincent and Smales (1957) and Hawley and
Nichol (1961), is that pyrite discriminates against Ni more strongly than
pyrrhotite discriminates against Co (Fig. 3.1). However some of the Ni :
and Co in pyrrhutite may be present in intergrown or exsolved pentlandite
(Deer, Howie and Zussman, 1962, p.150), and the possibility arises that
much of the Ni enrichment commonly found in pyrrhotite is due to trace
mineral contamination, which was certainly not allowed for in any of the
studies quoted above.
Primary Dispersion
Availability
The Co/Ni ratio is low in mafic and ultramafic rocks, but during
differentiation the ratio rises, until in late silicic fractions it can
be > 1 (Taylor, 1965). It is apparent that Ni is withdrawn from the
fluid into crystallizing minerals more rapidly than Co, which is there-
by enriched in residual fluids. This is explained by the preferential
CFSE of Ni in octahedral oxygen-coordinated sites in silicates and
oxides (Schwarcz, 1967). During early crystallization, Ni in particular
enters the structures of olivine, pyroxene, and iron oxides, in which it
probably substitutes for Fe2+ (Ringwood, 1956). Nickel is also en-
riched in the early fractions of minerals, which can be explained by
19
inversion of solid-solution trends in Mg -Fe -Ni -Na silicate systems
caused by the high octahedral site preference energy of Ni 2+ (Burns
and Fyfe, 1967), The Ni content of later Fe-rich olivines becomes
lower due to decreased availability (Wager and Mitchell, 1951). It is
not clear whether Co2+ substitutes for re2+
, or Mg2+
, or both, in the
ferromagnesian minerals.
If the basic magma contains sufficient S, an immiscible sulphide
phase may separate at an early stage, and Ni and Co will partition
strongly into this melt from the silicate phase, either before or after
silicate crystallization (Kullerud and Yoder, 1965). If the S content
is somewhat lower, as in the Skaergaard intrusion (Wager, Vincent and
Smales, 1957), the Ni and Co may be almost entirely taken up in sili-
cates before sulphides begin to form. The sulphides are then Ni-Co
deficient, and may be Cu-rich.
Granites have low Ni content, and even lower Co. The metals are
held in the structures of ferromagnesian minerals such as biotite,
which in the Cape Granite, South Africa, contains up to 105 ppm Ni and
57 ppm Co (Kolbe and Taylor, 1966a). There is a definite correlation
of Ni with Fe and of Co with Fe and Mg (Carr and Turekian, 1961; Kolbe
and Taylor, 1966a), although the concentrations of Ni-ana Co reduce to
undetectable amounts as granites become leucocratic. The overall
crustal abundances, and some detailed data, of Co and Ni are listed in
Table 3.1.
The concentrations of Co and Ni in sulphides generally acknow-
ledged to be derived from igneous rocks reflect to a certain extent
concentrations in the parent bodies. Wilson's (1953) suggestion that
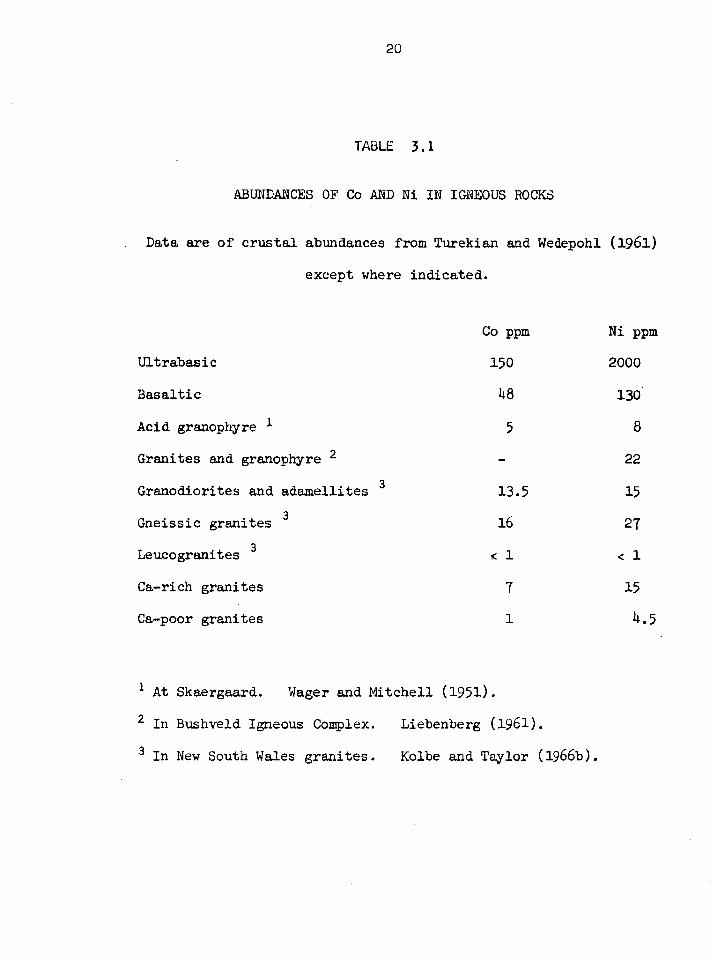
20
TABLE 3.1
ABUNDANCES OF Co AND Ni IN IGNEOUS ROCKS
Data are of crustal abundances from Turekian and Wedepohl (1961)
except where indicated.
Co ppm Ni ppm
Ultrabasic
Basaltic
Acid granophyre 1
Granites and granophyre 2
3 Granodiorites and adamellites
3 Gneissic granites
Leucogranites 3
Ca-rich granites
Ca-poor granites
150
48
5
-
13.5
16
lc 1
7
1
2000
130
8
22
15
27
< 1
15
4.5
1 At Skaergaard. Wager and Mitchell (1951).
2 In Bushveld Igneous Complex. Liebenberg (1961).
3 In New South Wales granites. Kolbe and Taylor (1966b).
21
pyrite derived from early magmatic melts should have a higher Ni and
Co content, and a lower Co/Ni ratio, than pyrite derived from late
fluids, was supported by the results of Hawley and Nichol (1961).
Noddack and Noddack (see Rankama and Sahama, 1950, p.679) suggested
that the average content of Co and Ni in magmatic sulphide ores is
0.21% and 3.14% respectively (Co/Ni = 0.07). Berg and Friedensburg
(1944) showed that hydrothermal sulphides have Co/Ni ratios ranging
from 0.1 up to, in pyrite, 830. Cambel and Jarkovsky (1967, Figs. 94,
97, 126) describe a range in the Co/Ni ratios of Czechoslovakian
hydrothermal pyrites, with twice as many individual deposits containing
Ni > Co as containing Co > Ni, the average Co and Ni contents being
about 600 ppm.
The Co and Ni concentrations in ore deposits which are interpreted
as being related to vulcanism are difficult to relate to the chemical
evolution of the postulated source rocks, as the geochemical cycles of
possible types of mineralizing solutions in the environment are. far
from understood. The solutions, and also their metal content, are
probably polygenetic, due to admixture of meteoric waters, most
obviously at the exhalative stage. For this reason much of the chemical
and isotopic investigations of this type of ore. deposit have. been ,
empirical, an approach made possible by the existence of modern
occurrences of mineralization similar to a few of the ore types .. In
one such occurrence in the Red Sea (Miller et al., 1966) an Fe,..euTZn
rich submarine discharge of thermal waters is depositing a sediment
containing 300 ppm Co and 50 ppm Ni.
22
Despite the paucity of direct evidence for trace-element abun-
dances in a volcanic environment of ore deposition, there are data for
Co-Ni in pyrites from several ores which are associated with volcanic
rocks, and can with greater or less certainty be related genetically
to the volcanic activity, whether subvolcanic, exhalative, or of
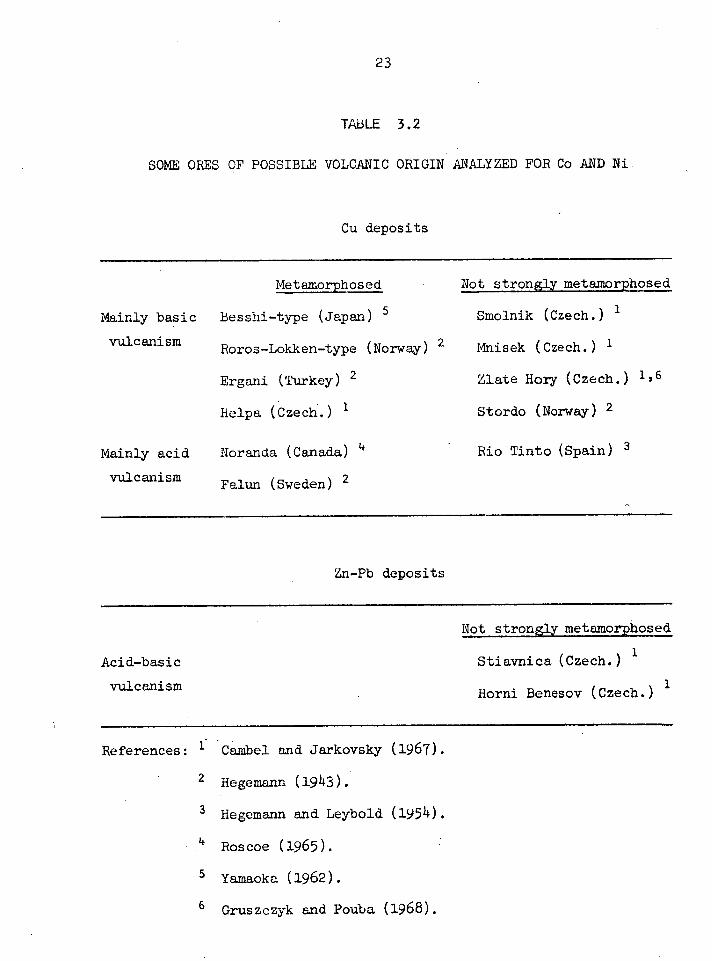
obscure environment. A representative sample of these ores is listed
in Table 3.2. These pyrites show three outstanding features:
(i) Those from the unmetamorphosed ores, and from some of the
metamorphosed ores, have extremely high Co/Ni ratios (up to 100), and
remarkably restricted Ni ranges (e.g. 0-10 ppm, 20-50 ppm, 0-100 ppm).
The exception is Stordo, which has Co/Ni = 0.1, but still shows
negligible variation from 100 ppm Ni. According to Schneiderhohn
(1962, p.315) and Routhier (1963, p.955), the Stordo deposit is sedi-
mentary.
(ii) There is a distinct tendency, noted by Cambel and
Jarkovsky (1967) both for their own results and those of Hegemann
(19)43), for Co (and to a much smaller extent Ni) to be more enriched
in Cu ores than in Pb-Zn ores, typical concentration ranges being
50-1000 ppm Co and 0-400 ppm Co respectively. A tendency for Co to
correlate with Cu is also shown by the Noranda ores (Roscoe, 1965),
pyrite in the Zn-rich ores containing less Co (and Ni).
(iii) Some of the metamorphosed pyrites (e.g. Helpa), although
having higher Co/Ni ratios, show just as restricted a range for Co as
for Ni, probably due to metamorphic homogenization.
2 3
TABLE 3.2
SOME ORES OF POSSIBLE VOLCANIC ORIGIN ANALYZED FOR Co AND Ni
Cu deposits
Metamorphosed Not strongly metamorphosed
Mainly basic Besshi-type (Japan) 5 Smolnik (Czech.) 1
vulcanism Roros-Lokken-type (Norway) 2 Mnisek (Czech.) 1
Ergani (Turkey) 2 Zlate Hory (Czech.) 1,5
helpa (Czech.) 1 Stordo (Norway) 2
Mainly acid
Noranda (Canada) 4
Rio Tinto (Spain) 3
vulcanism Falun (Sweden) 2
Zn-Pb deposits
Not strongly metamorphosed
Acid-basic Stiavnica (Czech.) 1
vulcanism , 1 Horni Benesov (Czech.)
References: 1 Cambel and Jarkovsky (1967).
2 Hegemann (1943).
3 Hegemann and Leybold (1954).
Roscoe (1965).
5 Yamaoka (1962).
6 Gruszczyk and Pouba (1968).
24
Depositional processes
Goldschmidt (1954, p.668) lists several European workers who
claimed a correlation between the Co content of pyrite and temperature
of deposition, and BjOrlykke and Jarp (1950) made a similar suggestion
for Norwegian pyrites. It was demonstrated by Rose (1967), however,
that in chalcopyrite and sphalerite "The general lack of similarity in
the behaviour of different elements", including Co, "even in parts of
the same crystal, indicates that the trace element content is not
dependent on any single environmental variable such as temperature ...
Consideration of several factors is necessary to explain the variations"
(p.582).
More empirically, several investigators have exsmined
spatial variation of the Co and Ni contents within ore (*posits.
Suggestions by Auger (1941) that Co and Ni in pyrrhotite vary system-
atically with depth in the Noranda ore were regarded by Fryklund and
1-lamer (1955) as inconclusive, and their own results on other ores
failed to find any systematic trend. Lateral zoning of Co contents of
sphalerite averaged over intervals of 2000 ft. has been found by Rose
(1967) in the Central District, Utah, the decrease of Co outward from
the granitic stocks paralleling a decrease in Zn/Pb ratio of the ores.
Secondary Dispersion
Sedimentation
The cycles of Co and Ni in normal sedimentary environments have
been svmmsrized by Loftus-Hills and Solomon (1967), who emphasized the
complexity of the variables controlling the ultimate trace element
25
content.:of- a sedimentary pyrite crystal. The availability of the trace
elements, particularly Ni, seems to be mainly a function of the history
of potential adsorbing materials in the transporting medium. These
adsorbents include detritus, particularly clays; scavenger Fe and Mn
hydrated oxide colloids; and both terrestrial and marine organic com-
pounds, which may form organometallic complexes. For example,
terrestrial clays and organic materials with an inherited sorbed trace
element component may adsorb further metals during transport, and the
final distribution of the trace elements would be closely related to
the history of transport and deposition of these carriers. The overall
effect is that Ni, and to a less extent Co, correlate significantly
with carbonaceous content of a sediment, and tend to be concentrated in
shales, although the relative significance of these correlations is not
constant (e.g. Krauskopf, 1956; Tourtelot, 1964; Vine, 1966).
The Co and Ni are rearranged during diagenesis, partitioning into
any sulphide phase present (particularly pyrite).
Cobalt should be concentrated preferentially to Ni in pyrite, and
this has been confirmed by Spencer (1966), who found the pyrite/shale
partition for Co to be three to four times that for Ni. The extent to
which partitioning of Co and Ni proceeds depends on the abundance and
form of the sulphide and of alternative host minerals (clays, carbon-
aceous material), and on the degree of recrystallization, and can vary
widely between rock units (Mohr, 1959; Le Riche, 1959; Nicholls and
Loring, 1962; Spencer, 1966).
Despite the many variables, the Co/Ni ratio in sedimentary
pyrites is generally < 1 (Table 3.3), and that in the whole-rock
26
TABLE 3.3
ABUNDANCES OF Co AND Ni IN SEDIMENTARY ROCKS AND PYRITES
A. Marine
Rock
Co ppm
Enrichment factor Rock
ELM
Pyrite Enrichment factor
Pyrite
Shale 19 13-240 6 68 100-1010 8
Sandstone 0.3 10 17 2.0 10-35 11
Limestone 0.1 10-35 220 2.0 250-950 300
Non-marine * *
Shale 11 20-1050 47 25 100-950 21
Sandstone 10 10-28
Limestone 45-200 560-1040
B. Undifferentiated
Shale 10-50 20-100
Sandstone 1-10 2-10
Limestone &
dolomite 0.2-2 3-10
A. "Rock" data from Turekian and Wedepohl (1961).
"Pyrite" data from Degens (1965).
"Enrichment factor" is the median of the range of concentrations in
pyrite divided by the average abundance in the rock.
Tourtelot (196)4).
B. Krauskopf (1955).
27
usually even lower. From the data on the average abundances, two
main points emerge:
(a)Marine sulphides are generally less enriched in Co and Ni
than non-marine sulphides. This is probably a dilution effect caused
by the greater weight of sulphides available in marine environments.
(b) The Co and Ni content of iron sulphides is in general
markedly dependent on the rock type. A low content of e.g. clay and
organic material in a sediment may result in low initial trace-element
abundances, but it also means that there are few suitable hosts for the
metals other than pyrite, which therefore becomes relatively enriched
during diagenesis. Hence the increase in the approximate enrichment
factors from shale to limestone in Table 3.3.
A well documented exception is the Silurian graptolitic shale
analyzed by Spencer (1966), in which the pyrite averaged 1900 ppm Co
and 400 ppm Ni, the Co-enrichment being tentatively explained in terms
of the ready transport by colloidal iron hydrated oxides of Co3+
,
supposedly formed at elevated pH and Eh in the absence of soluble
organic acids in the early Palaeozoic.
The dispersion of Co and Ni in abnormal sedimentary environments,
in which base-metal concentrations are unusually high, is significantly
different to that in normal environments. Whole-rock analyses of the
Marl Slate by Hirst and Dunham (1963), and of the Kupferschiefer by
Deans (1950), Wedepohl (1964, 1965), Wazny (1965) and Knitzschke (1966)
generally show Ni > Co, but with Co ranging 0-300 ppm, and Ni 30-500 ppm
or 300-1000 ppm. These ranges are greater than those for normal shales
quoted by Krauskopf (1955) (Table 3.3). However, as in many normal
28
shales, Co and Ni, and Ni and non-carbonate C, show good positive
correlations, and Co also correlates with Cu.
It might be expected that the greater the base-metal concentration
in a sediment, the more abnormal will be its trace element content.
If the Rammelsberg and Meggen ores are sedimentary, as postulated by
Ehrenberg et al. (1954), Kraume et al. (1955) and Anger et al. (1966),
this expectation is confirmed, but the Co-Ni distribution in pyrites
from the two deposits (Regemann, 1943) are completely different:
(i) The more cupriferous Rammelsberg Zn-Pb-Cu deposit has Co > Ni,
with Co ranging 10-1000 ppm, and Ni 5-400 ppm, giving a Co-Ni field
similar to, but somewhat broader than, those described for the ores of
volcanic association. The massive banded ore averages about 150 ppm Co
and 20 ppm Ni, and exhibits layering of the trace as well as the major
elements (Kraume, 1962).
(ii) The pyritic-Zn deposit of Meggen contains pyrite with
Co < Ni, Co ranging 10-50 ppm, and Ni showing a restricted range of
concentrations around 100 ppm - an overall distribution very like that
for Stordo. Although these fields lie within the range for normal sedi-
mentary pyrite, they show abnormally restricted values of Ni.
Metamorphism
The problem in investigating the effect of metamorphism is the
difficulty of sampling both unmetamorphosed and metamorphosed material
from the same site. For this reason studies of metamorphic resegregation
of trace elements will usually have an inherent error due to the un-
defined initial availability of the metals. With this proviso, the
study of Cambel and Jarkovsky (1965, 1967) reveals some remarkable
29
trends of Co and Ni concentrations with increasing metamorphism. These
authors divided a series of pyritic ores, formed in several different
environments during the syngenetic clastic and pyroclastic phase of
geosynclinal vulcanism in the Little Carpathians of Czechoslovakia,
into three groups based on metamorphic grade (epizone, mesozone, and
katazone metamorphism). The unmetamorphosed ores had an average Co/Ni =
0.04. There is a marked increase in Co at constant Ni (about 1000 ppm)
with increase of metamorphic grade; but within the highest grade, the Ni
content remains constant below a certain threshold value of Co, above
which the Ni values drop and become erratic, the Co/Ni ratio becoming
> 1. Cambel and Jarkovsky offer no explanation for these trends, but
the changes could represent an increased approach to equilibrium
partitioning of Co into, and Ni out of, the pyrite structure. However,
the possibility cannot be discounted of introduction of additional Co
into the recrystallizing sulphides by a fluid phase, which Robinson and
Strens (1968) have shown experimentally to be quite feasible.
Roscoe (1965) found a similar trend with increasing metamorphism
in the Noranda-Matagnmi area, the Co content increasing in pyrite, but
decreasing in pyrrhotite, and the overall abundances being less variable
in the more metamorphosed Matagani area than in the Noranda area.
Discussion
In areas where both magmatic-hydrothermal and normal sedimentary-
diagenetic pyrites have been studied, the latter show much lower Co/Ni
ratios (Rost, 1939; Carstens, 1943; Hegemann, 1943; Coleman and
30
Delevaux, 1957; Roscoe, 1965; Cambel and Jarkovsky, 1967). Several
authors IlaW therefore attempted to use the ratio in metallogenic
studies (Davidson, 1962; Prokhorov, 1965; Wright, 1965; Darnley, 1966;
Saager and Nihalik, 1967), but several of these studies are methodogi-
cally unsound.
(i) Davidson argued that, because the statistics he compiled
showed the only Co-rich ores of known origin to be hydrothermal, the
Co-rich Zambian Cu ores could therefore not be regarded as "sedimentary"
This reasoning begs the question by not allowing the possibility of, and
therefore not investigating, environments of sulphide deposition other
than magmatic hydrothermal or normal sedimentary-diagenetic (Loftus-
Hills and Solomon, 1967).
(ii)Wright used several criteria in attempting to prove the syn-
genesis of pyrite associated with a Canadian iron ore deposit. He cited;
for example, a low Co content and Co/Ni ratio, and low Se content, and
from broad generalizations from the literature on the general distribu-
tion of these elements, inferred a syngenetic origin. The fallacy of
this argument is an overdependence on empirical rules, with no testing of
the conclusions by analysis of other local pyrites of different genesis. .
(iii)One sample of each of two different types of pyrite, inti-
mately intergrown, from the Basal Reef of the Witwatersrand System, were•
analyzed by Saager and Mahalik. Because one analysis gave Co/Ni < 1, and
the other Co > 100 ppm, and the authors considered that these pointed to'
sedimentary and hydrothermal origins respectively, they concluded that
the Co-Ni values could not be used for genetic interpretation. Apart
from the inadequate use of the empirical Co-Ni data, it is quite
unacceptable to base such a conclusion on two samples.
31
It is clear, then, that as a technique of investigation, the Co-
Ni distribution in sulphides is still fundamentally empirical. Pre-
conceived ideas about dispersion patterns based on work in other areas
may therefore be misleading, and applied studies in every case demand
establishment of the basic local dispersion patterns, using a suffia.
ciently large number of samples to cover variations caused by processes
at the deposition site. Nevertheless, the dispersion patterns des-
cribed in this section show some remarkably consistent trends between
widely separated mineral deposits, and could provide very strong
corroborative evidence for discrimination of genetic types of deposits.
SELENIUM
Crystal Chemistry
There is no basis either for a quantitative or a qualitative
determination of the order of preference for accommodation of Se in ore
sulphides. Complete isomorphism has been demonstrated between galena
and clausthalite (Earley, 1950; Coleman, 1959), but although several
other sulphide-selenide pairs are known to be isostructural, and some
of them form limited solid solution series (Earley, 1949; Coleman and
Delevaux, 1957; Bethke and Barton, 1961; Sindeeva, 1964), there is
insufficient data for ranking the sulphides in their order of preference
for Se. Most investigators of Se in sulphides (e.g. Bergenfelt, 1953;
Edwards and Carlos, 1954; Zaryan, 1962; Faramazyan and Zaryan, 1964;
32
Sindeeva, 1964; Ismailov, 1965; Babcan, 1966) have ranked the sulphides
they studied in order of Se content, but the discrepancies between their
lists suggests that variation in availability of Se during deposition of
the mineralogical sequences, as found by Hawley and Nichol (1959) and
Zaryan (1962), outweighs effeots due to inherent accommodating capabil-
ities of the minerals. The only order which may be generally applicable',
and even then availability factors may dominate, is that Cu, Fe, and Mo
sulphides tend to be enriched in Se, and sphalerite depleted (Sindeeva,
1964), but exceptions are common (e.g. Ismailov, 1965).
Primary Dispersion
Availability
The Clarke Index for Se is 0.14 ppm, based on acid, mafic, and
ultramafic rocks (Sindeeva, 1964). The geochemical cycle of Se is
entirely controlled by its crystallochemical similarity to S. It
substitutes for S in sulphide structures whenever the latter are avail-
able, and only in the absence of abundant sulphides, or where the
concentration of Se is unusually high, does Se form independent min-
erals. Selenium is so strongly chalcophile that all classes of igneous
rocks contain at most a few ppt Se, and usually < 1 ppm (Turekian and
Wedepohl, 1961; Sindeeva, 1964).
It is recognized that certain areas are Se-enriched in both their
igneous and sedimentary rocks (e.g. South-western U.S.A.; Tuve.- U.S.S.R. 9
and Se can thus be an excellent meta1logenic province indicator.
33
Despite the uniform depletion of Se in igneous source rocks,
different genetic types of mineralization concentrate Se to varying
degrees. Volcanic processes in general tend to produce Se-rich gases,
sulphur and tuffs (Colemanand Delevaux, 1957; Davidson and Powers,
1959; Rosenfeld and Beath, 1964; Sindeeva, 1964), and pyritic ores
associated with volcanic rocks have high Se contents. Magmatic-
hydrothermal ores are very variable in Se, with Cu-Mo deposits being
enriched (Goldschmidt and Strock, 1935; Edwards and Carlos, 1954), Pb-Zn
deposits not so markedly enriched, and Au-quartz deposits showing
variable enrichment. In magmatic Ni-Cu ores the vein deposits tend to
be more enriched in Se than the disseminated deposits (Sindeeva, 1964).
Superimposed on the genetic variability are distinct correlations of Se
with Cu (Hawley and Nichol, 1959; Sindeeva, 1964), and with U (Sindeeva,
1964), which cut across the genetic types of deposits.
Depositional processes
Because of varying availability during deposition, and of the
imprecise criteria used, most attempts to correlate the concentration of
Se with temperature of formation are probably invalid. Goldschmidt and
Strock (1935) and Rankama and Sahama (1950, p.746) suggest that there
may in some cases be a direct proportionality between Se and temperature,
but their data are scanty. Bergenfelt (1953) and Sindeeva (1964) claim
a general correlation of Se with low-temperature stages of mineralization ?
although as Sindeeva notes, temperature may not be the direct control of '
concentration.
Attempts have been made in two investigations to directly measure
the temperature of formation of the host minerals. Pyrites for which the
34
formation temperature had been estimated by Smith- (1948) using his
thermoelectric potential method, were analyzed for Se by Hawley and
Nichol (1959). They found an inverse relationship between Se concen-
tration and temperature, but admitted the possible effect of other
variables. However, various workers have shown the thermoelectric
potential method to be invalid (Fischer and Hiller, 1956; Suzuki, 1963).
A direct measurement of temperatures of fumarolic S samples by Suzuoki,
(1964) showed the Se content to be directly proportional to temperature.
-Spatial variation of Se concentration with respect to intrusive
igneous rocks was tested by Hawley and Nichol (1959), who found only
three cases of systematic dispersion, two examples (dolerites at
Noranda and Geco) showing decreased abundance away from the intrusive,
and one (quartz porphyry at McIntyre) showing an increase followed by a
decrease.
The Cu ores of the Kafan deposit consist both of quartz veins and
disseminated ores in volcanics. Zaryan (1962) showed that Se in most
ore minerals was enriched in the veins, which could be a natural con-
centration effect due to different available proportions of sulphides.
Secondary Dispersion
Sedimentation
In the weathering-sedimentation cycle, Se separates from S, the
latter being largely bound in the sulphate ion, which is concentrated
in the hydrosphere. Selenium, however, is trapped by exogenetic
processes, and is largely retained by the products of mineral weathering.
35
The selenite normally produced in weathering is easily reduced to Se
metal and Byers et al. (1938) suggest that it is also absorbed by
colloidal Fe hydrated oxides. Some Se is transported to the oceans,
probably as selenites, on colloidal Fe hydrated oxides, and incorpor-
ated in: or adsorbed on carbonaceous material, but it is precipitated
on reaching the sea, as almost all modern seabottom samples contain Se,
whereas its concentration in seawater is < 0.001 ppm (Sindeeva, 1964).
Shales, especially where carbonaceous, have the highest Se contents of
normal sediments (Turekian and Wedepohl, 1961; Rosenfeld and Beath,
1964), but except in high-Se provinces, sedimentary-diagenetic sulphides,
in which the Se and S become reassociated, are reported to contain
< 30 ppm Se (Rankama and Sahama, 1950, p:754; Goldschmidt, 1954;
Edwards and Carlos, 1954; Sindeeva, 1964).
Metamorphism
Wampler and Kulp (1964) suggest that some enrichment in sedi-
mentary pyrite may occur during metamorphic recrystallization, but
studies of Se in metamorphosed ores (Edwards and Carlos, 1954; Cambel
and Jarkovsky, 1967) have not been sufficiently detailed to allow
testing of this hypothesis.
Discussion
The genetic implications of Se concentration have been variously
argued on the basis of the continually enlarging mass of empirical
evidence. Goldschmidt and Hefter (1933), Goldschmidt and Strock (1935)
and Carstens (1941) suggested that pyrite of sedimentary origin had a
36
s/Se ratio of 200,000 or more, whereas pyrite of hydrothermal origin
had a ratio of 10,000 to 20,000. The data from a wider range of ore
types constrained Edwards and Carlos (195)-) to modify this generaliza-
tion. They refused to consider a sedimentary origin for an ore which
contained pyrite with greater than about 10 ppm Be, and concluded, with
Williams and Byers (1934), that high Se is caused by hydrothermal or
magmatic processes, but that low Sc does not rule out a hydrothermal
origin. Since the latter work, the relationship of Se and volcanic
activity has been more clearly recognized, and the investigation of
Coleman and Delevaux (1957) proved that high Sc concentrations do not
rule out a sedimentary origin, particularly where volcanic material is
present and/or where the province is Se-rich. Discrimination between
Se-enrichment due to particular processes, and to a general provincial
enrichment, must be made in every study by determination of local back-
ground concentrations, as in Co-Ni investigations.
CADMIUM IN SPHALERITE
The crustal abundance of Cd has been estimated at 0.15 ppm
(Green, 1959) and 0.08 ppm (Brooks and Ahrens, 1961). Sandell and
Goldich (1943) and Vincent and Bilefield (1960) estimate a concentration
of 0.13 to 0.18 ppm Cd in basic magma. The latter authors, in a study
of fractional crystallization in the Skaergaard intrusion, have shown
that Cd remains largely in solution, and that there is only a four-fold
increase in concentration in the youngest siliceous differentiates.
Zinc has been shown to behave similarly (e.g. Lunderggrdh, 1948) and
37
there should be little difference in the Zn/Cd ratio in a hydrothermea
solution from that in the parent magma.
Numerous authors have attempted to relate empirically the Cd
content of sphalerite and the Fe content and/or temperature of formation
of the sphalerites (Craton and Harcourt, 1935; Stoiber, 1940; Warren
and Thompson, 1945; Edwards, 1955; Fryklund and Fletcher, 1956;
Kullerud, 1959). Their opinions are about equally divided between Cd
correlating directly and inversely with inferred temperature. Some of
the later authors, however, have noted that theoretically there can be
no temperature control of Cd content due to accommodation constraints
by the host ZnS structure, as the latter is not saturated with Cd.
Further, the criterion used by Edwards, Fryklund and Fletcher, and
Kullerud to determine temperatures - the Fe content of sphalerite
was based on experiments (Kullerud, 1953) which have since proved to be
inadequate (e.g. Boorman, 1967; Scott and Barnes, 1967).
Mookherjee (1962) investigated the "enrichment factor" for Cd in
sphalerite and found that the enrichment calculated from published data
was lower by about two orders of magnitude than the theoretical factor.
While the theoretical factor could be obtained experimentally by using
pure components, the addition of Cl - ions, which Mookherjee reasoned
from fluid inclusion data to be present in ore-forming fluids, depressed
the value to the range actually found in ores. Thus, while the experi-
mental data suggested that the Cd content of the sphalerites was
directly proportional to temperature, they showed.a much stronger
inverse correlation of the Cd content with the salinity. If, therefore,
a decrease in salinity happens to be accompanied by a decrease in
38
temperature, as found in several studies (Roedder, 1960; Groves and
Solomon, in press), the Cd content of the sphalerite could appear to
have a spurious inverse correlation with temperature. Therein, perhaps,
lies yet another explanation for the contradictory temperature correla-
tions obtained by previous workers.
As pointed out in most of the previous studies, however, the
variations in Cd content due to local depositional effects are much
smaller than variations between districts due to differing availability,
and Cd in sphalerites may therefore be used to delineate metallogenic
provinces. Ivanov (1964) indicated that Cd values from similar deposits
but different provinces may differ by a factor of up to 2.5. Fryklund
and Fletcher (1956) suggested a Cd province with Cd contents of
sphalerite from 0.40 to 0.45 per cent extending down the west coast of
North Amercia, and on a smaller scale Rose (1967) has demonstrated
differences in Cd content of sphalerites between districts in Utah.
SUMMARY
Cobalt and nickel together can in many cases be excellent discrim-
inators of sedimentary and volcanic processes, and in some cases
hydrothermal processes. Because their distribution between rock types
is reasonably constant, they have not found much use in delineation of
metallogenic provinces except in combination with other elements. How-
ever their distribution between mineral phases is well enough known for
them to be used as empirical discriminators on a local scale, and perhaps
as guides to post-depositional changes such as metamorphism.
39
The dispersion of Se is much less strictly controlled by
mineralogy. The dispersion patterns are therefore more empirically
based, and it has proved very difficult to distinguish between local
effects on concentrations due to variable availability, inherent
mineralogical preferences, temperature, etc. However the Se content
can broadly reflect mineralizing processes, and is therefore a
potential discriminant of genesis. Its enrichment in certain areas of
the earth's crust make it useful for delineating metallogenic provinces.
Despite attempts to relate the Cd content of sphalerites to
temperature of deposition, it appears from the data of dispersion of Cd
that it can most usefully be applied to determination of metallogenic
provinces.
40
4. SAMPLING AND ANALYSIS
SAMPLING
Eight minerals have been used in this study, but most analyses
have been performed on pyrite and pyrrhotite, because
(i) pyrite, with or without pyrrhotite, occurs in nearly all
the metallogenic environments of interest in Tasmania;
(ii) pyrite and pyrrhotite are by far the most abundant of the
Co-Ni-rich minerals in the deposits investigated;
(iii)Edwards and Carlos (1954) concluded that pyrite is the most
consistent index mineral for Se distribution.
As specimens could be of optimum use only if they were located
accurately with respect to geology, most were chip-samples taken from
in situ or from diamond-drill core. Because of difficulty of access,
it was not always possible to realize this ideal, and some dump and
museum specimens were used. Where conditions permitted, however,
sampling was designed to give a set of specimens which could be system-
atically tested for the scale of trace element variation at the
sampling site, from fractions of a millimeter to several meters. On a
larger scale, sampling sites were selected within lodes or mineral
fields to test spatial variations which might be genetically significant.
The number of specimens sampled from each locality (sampling site) is
evident from Table 6.1.
41
SAMPLE PREPARATION
Pure pyrite samples were ground in a porcelain mortar and pestle,
but most multimineralic samples required the use of a mechanical jaw
crusher, a rotating disc pulverizer, or a gyratory grinder (Cr-steel
head), and sieves. Contamination from these sources was tested using
large specimens of clear quartz, with the results listed in Table 4.1.
TABLE 4.1
CONTAMINATION IN SALE PREPARATION : TEST WITH PURE QUARTZ
Procedure AAS analysis
Co Ni
Crush (4 cycles), Sieve, Hand grind
0 ppm 1 ppm
Crush (4 cycles), Sieve, Gyratory grinder 0 PPI 5 PPm
Crush (4 cycles), Sieve, Disc pulverizer 1 ppm 13 ppm
Very little use was made of the disc pulverizer, and inspection of the
ore mineral analyses suggests that in practice the levels of contamina-
tion in the quartz test were not reached when comminuting sulphides
and oxides: the highest possible contamination (lowest analysis) from
the disc pulverizer, for example, was 5 ppm Ni,
Where grain size permitted, the samples were purified by various
combinations of micropanning, electromagnetic and hand-magnet
separations, differential acid leaching, simple flotation using a
detergent, heavy liquid separation, flash-roast magnetization of
42
chalcopyrite, and hand-picking. The procedure for every sample is
listed in the Table of Data (an expansion of Table 6.1) filed in the
Geology Department, University of Tasmania.
A few specimens were too fine-grained for purification, and were
analyzed whole, polished sections being made for identification of
• potentially interfering minerals, which, if too abundant, disqualified
the sample from analysis.
All purification procedures were continually monitored by
binocular microscope, and visual estimates of impurities were made using
a grain-count card. Most purification resulted in samples > 95% pure
(with respect to ore minerals), and the latter were > 99% pure except
where stated otherwise in Table 6.1. Seventy of the more difficult
separations were quality-controlled by microscopic examination of
polished grain-mounts. Where such examination revealed purifications
of < 99%, the grain-count estimate of composition (> 400 grains) is
listed in Table 6.1.
ANALYSIS
A considerable period was spent in establishing satisfactory
analytical procedures. The X-ray Spectrograph techniques were
developed in collaboration with Mr. R. J. Ford and Dr. M. Solomon of
this Department, and Mr. J. Hutton of Adelaide, and the atomic
absorption techniques were developed with the help of Dr. K.L. Williams,
Dr. C.S. Rann, and Dr. D.J. David at Canberra, and Mr. B.S. Rawling, of
Broken Hill.
The techniques used for the various analyses were:
Spectrophotometry Co in pyrite
X-ray Spectrography : Ni in pyrite
Se in sulphides
Cu, Fe, Zn in sulphides
Atomic Absorption Spectrophotometry : Co and Ni in all samples.
Cobalt and Nickel
X-ray fluorescence is not an ideal choice for analyzing sulphide
minerals, because of the strong mass absorption of the metalliferous
matrix. This absorption lowers sensitivity, an undesirable feature in
the determination of trace concentrations. In addition, the fluorescence
of the pyrite samples produced a very strong iron spectrum, the FeK t3
line of which seriously interfered with the CoK a line, thus precluding Co
analysis. Iron also absorbed Ni radiation, and the sensitivity of Ed
analyses decreased accordingly.
• Much work on the X-ray spectrograph (Philips PW 1540) was neverthe-
less directed towards determining Ni in powdered pyrite pressed pills
(Norrish and Chappell, 1967), both using Ge as an internal standard, and
using the scattered background technique of Andermann and Kemp (1958) as
modified by Kalman and Heller (1962). Unfortunately Ge was found to
enhance the Ni radiation, and the scattered background technique did not
work, as a constant ratio of analytical line to scattered background
intensity could not be obtained. The satisfactory value of 78 ppm for
W-1 (quoted range 75-82 ppm) derived by the latter method is regarded as
fortuitous.
44
A simple linear calibration technique was therefore used, but the
method was limited to samples of approximately constant mass-absorption,
i.e. to pure or nearly pure pyrite. The early pyrite-based standards
were somewhat unsatisfactory as they were mixed wet, but later standards
were mixed dry in a gyratory swing-mill. Operating conditions are
presented in Table 4.2. Background at the peak position was estimated
by finding the smallest response possible from a series of Analar,
supposedly Ni-free chemicals of varying mass absorption, and calculating
this response in terms of the mass absorption of pyrite. Figure 4.1
shows that comparable results were obtained for Ni analyses by X-ray
spectrography and atomic absorption spectrophotometry.
Spectrophotometry is an excellent technique for Co analysis as Co
forms highly coloured complexes susceptible to solvent extraction. The
method used was the 2-nitroso-l-naphthol extraction described by
Sandell (1959, Vol.3, p.409), and is summarized in Appendix 3. Measure-
ments were made on a Bausch and Lomb "Spectronic 20" spectrophotometer,
which gave excellent results, emphasising the sensitivity of the tech-
nique (Table .4.3). Analysis of samples determined by both spectro-
photometry and atomic absorption agree reasonably well (Fig. 4.2).
All such spectrophotometric techniques have the inherent dis-
advantage that a separate extraction is usually required for each
element, which involves excessive laboratory time. This can be avoided
in the technique of atomic absorption spectrophotometry (AAS), which in
its simplest form requires only that the sample be taken up into a
suitable solution. With the installation of a Techtron AA3 atomic
absorption spectrophotometer, the methods discussed previously were used
only for accuracy tests.
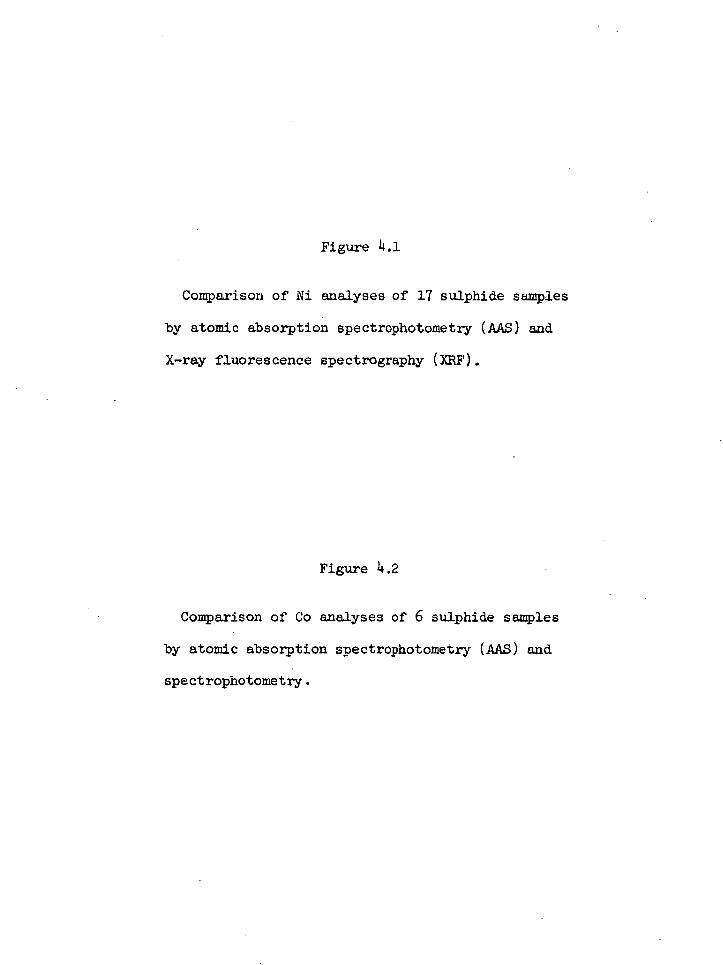
Figure 4.1
Comparison of Ni analyses of 17 sulphide samples
by atomic absorption spectrophotometry (AAS) and
X—ray fluorescence spectrography (XRF).
Figure 4.2
Comparison of Co analyses of 6 sulphide samples
by atomic absorption snectrophotometry (AAS) and
spectrophotometry.
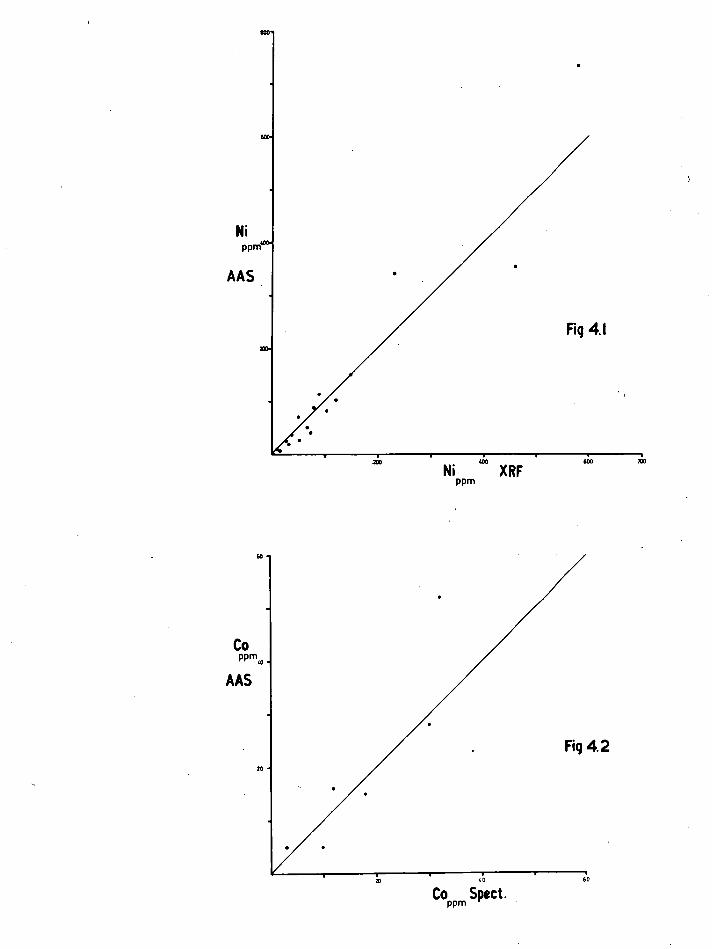
..
CO PPmth
AAS
Fig 42 20
... Co Spect.
PPm
20 60
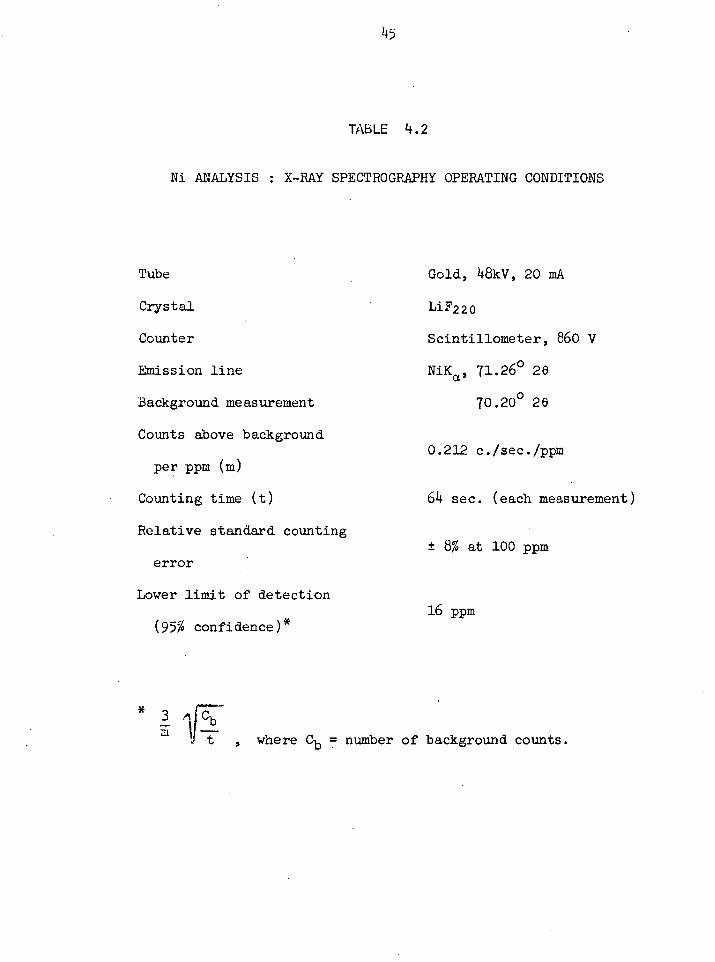
45
TAbLE 4.2
Ni ANALYSIS : X-RAY SPECTROGRAPHY OPERATING CONDITIONS
Tube Gold, It8kV, 20 mA
Crystal L1 F220
Counter Scintillometer, 860 V
Emission line NiKa, 71.26 ° 26
Background measurement 70.200 26
Counts above background 0.212 c./sec./ppm
per ppm (m)
Counting time (t) 64 sec. (each measurement)
Relative standard counting t 8% at 100 ppm
error
Lower limit of detection 16 ppm
(95% confidence) *
3 AfT7 t , where Cb = number of background counts.
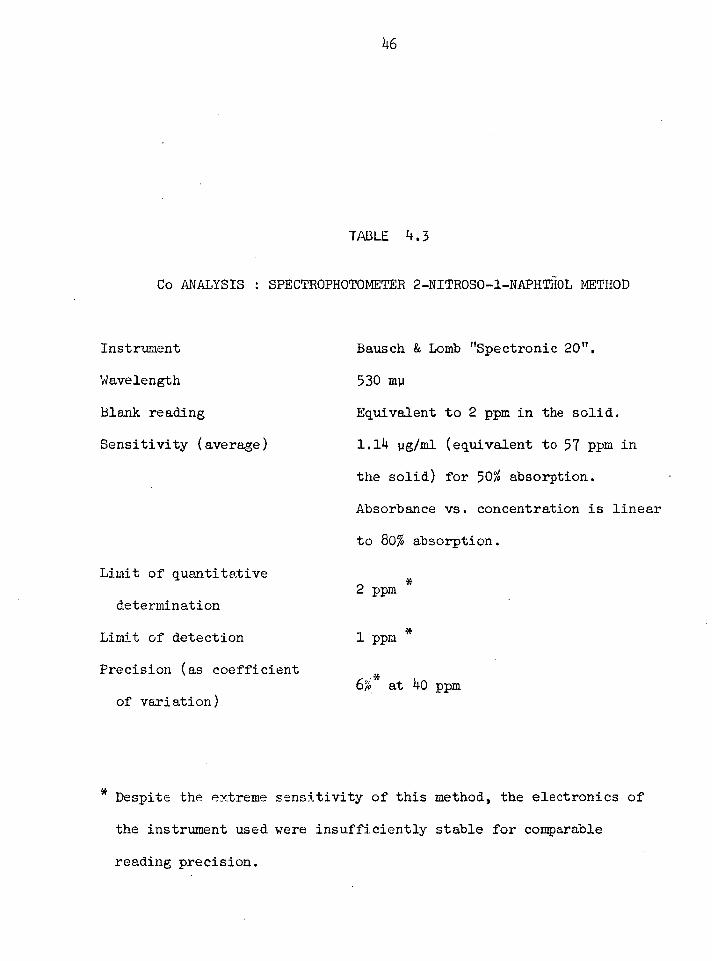
46
TABLE 4.3
Co ANALYSIS : SPECTROPHOTOMETER 2-NITROS0-1-NAPHTHOL METHOD
Instrument Bausch & Lomb "Spectronic 20".
Wavelength 530 'up
Blank reading Equivalent to 2 ppm in the solid.
Sensitivity (average) 1.14 pg/m1 (equivalent to 57 ppm in
the solid) for 50% absorption.
Absorbance vs. concentration is linear
to 80% absorption.
Limit of quantitative
determination
Limit of detection
Precision (as coefficient
of variation)
2 ppm
1 ppm *
6',1, * at 40 ppm
Despite the extreme sensitivity of this method, the electronics of
the instrument used were insufficiently stable for comparable
reading precision.
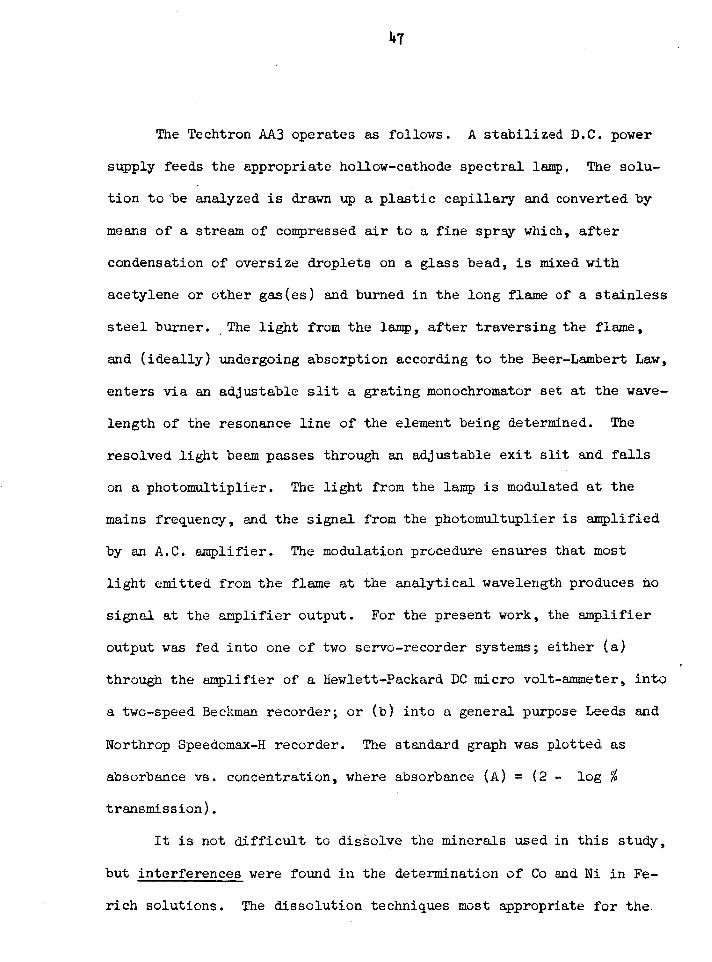
The Techtron AA3 operates as follows. A stabilized D.C. power
supply feeds the appropriate hollow-cathode spectral lamp. The solu-
tion to 'be analyzed is drawn up a plastic capillary and converted by
means of a stream of compressed air to a fine spray which, after
condensation of oversize droplets on a glass bead, is mixed with
acetylene or other gas(es) and burned in the long flame of a stainless
steel burner. . The light from the lamp, after traversing the flame,
and (ideally) undergoing absorption according to the Beer-Lambert Law,
enters via an adjustable slit a grating monochromator set at the wave-
length of the resonance line of the element being determined. The
resolved light beam passes through an adjustable exit slit and falls
on a photomultiplier. The light from the lamp is modulated at the
mains frequency, and the signal from the photomultuplier is amplified
by an A.C. amplifier. The modulation procedure ensures that most
light emitted from the flame at the analytical wavelength produces no
signal at the amplifier output. For the present work, the amplifier
output was fed into one of two servo-recorder systems; either (a)
through the amplifier of a Hewlett-Packard DC micro volt-ammeter, into
a two-speed Beckman recorder; or (b) into a general purpose Leeds and
Northrop Speedomax-H recorder. The standard graph was plotted as
absorbance vs. concentration, where absorbance (A) = (2 - log %
transmission).
It is not difficult to dissolve the minerals used in this study,
but interferences were found in the determination of Co and Ni in Fe-
rich solutions. The dissolution techniques most appropriate for the.
48
chemical preparation necessary to overcome these interferences will be
described after the following discussion of the interferences.
Although the AAS technique is relatively free of interferences
compared with flame photometry or X-ray fluorescence, physical,
chemical and spectral interferences can occur (e.g. Slavin, 196)4).
Contrary to the results obtained by Belcher and Kinson (196)4) and Beyer
(1965), who found no interferences from Fe in the analysis of Ni in
iron and steel, marked interferences were found when Co and Ni were
analyzed in very Fe-rich solutions using normal-intensity hollow-
cathode lamps.
Type I interference is a blank effect which is constant for
constant Fe concentration, and results in parallel calibration curves
for varying Fe concentrations (Fig. )4.3a). This interference is
commonly referred to as non-atomic absorption (NAA), and ascribed to
scattering of light, particularly at short wavelengths, by non-
atomized particles in the flame (Willis, 1963). There are, however,
two other possibilities, which were investigated by the writer and
C.S. Rann on the latter's experimental apparatus, using a narrow band
amplifier to minimise effects due to line broadening.
(i) True molecular absorption may occur, due to the presence of
undissociated molecules in the flame. Koirtyohann and Pickett (1966a,
1966b) have since emphasised the theoretical probability that this type
of absorption will predominate over scattering. However, tests using
a Xenon (band spectrum) lamp revealed no absorption at the analytical
wavelength.
(ii)The Fe atoms in the flame may absorb energy from the Co
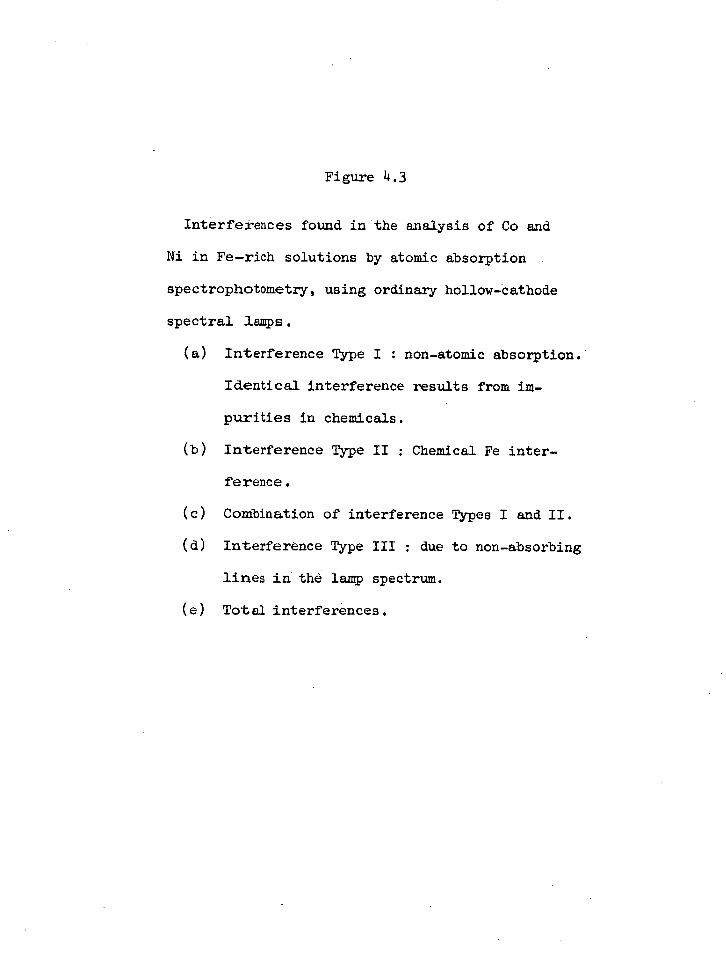
Figure 4.3
Interferences found in the analysis of Co and
Ni in Fe-rich solutions by atomic absorption
spectrophotometry, using ordinary hollow-cathode
spectral lamps.
(a) Interference Type I : non-atomic absorption.
Identical interference results from im-
purities in chemicals.
(b) Interference Type II : Chemical Fe inter-
ference.
(c) Combination of interference Types I and II.
(d) Interference Type III : due to non-absorbing
lines in the lamp spectrum.
(e) Total interferences.
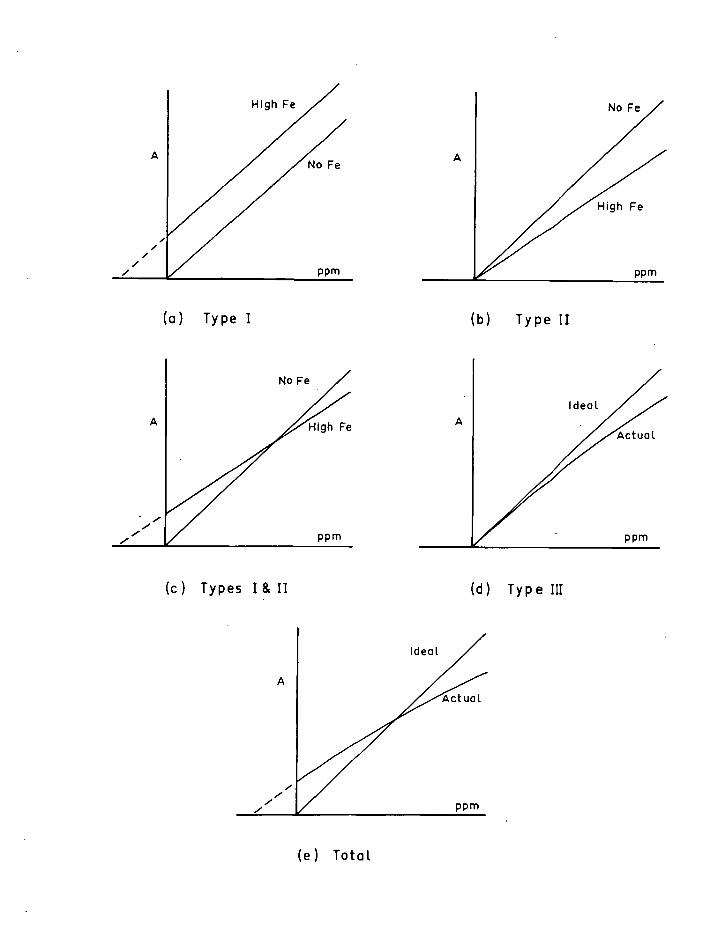
A
High Fe
No Fe
, /
/ /
/
PPm
(a) Type I
(b) Type II
(c ) Types I& II
(d) Type III
(e ) Total
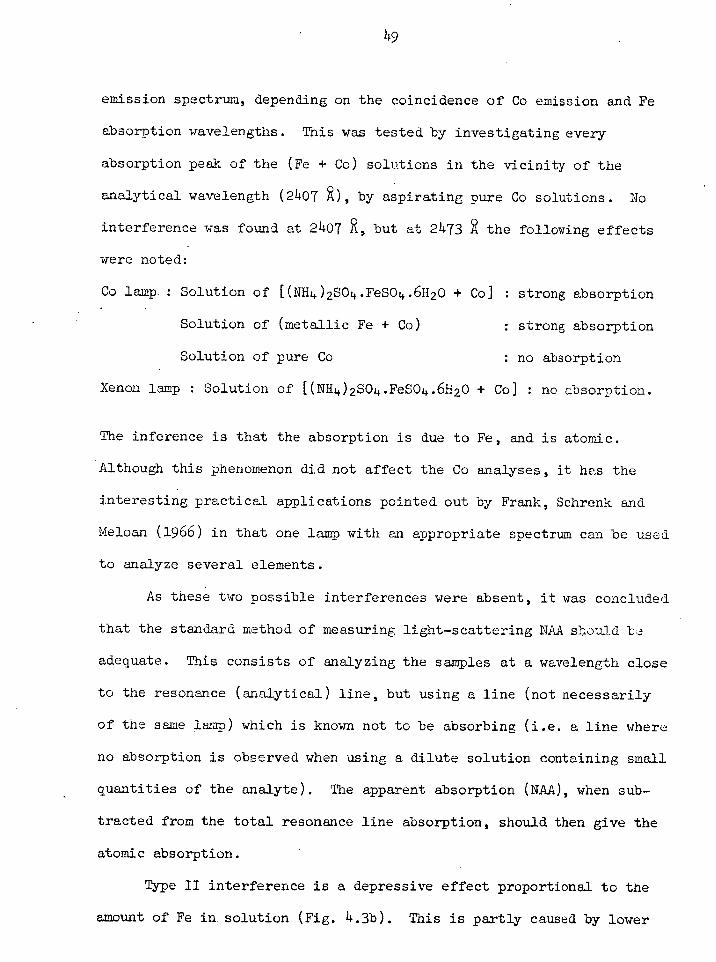
emission spectrum, depending on the coincidence of Co emission and Fe
absorption wavelengths. This was tested by investigating every
absorption peak of the (Fe + Co) solutions in the vicinity of the
analytical wavelength (2407 R), by aspirating pure Co solutions. No
interference was found at 2407 R, but at 2473 the following effects
were noted:
Co lamp. : Solution of [(N114)2SO4.FeSO4.6H20 + Co] : strong absorption
Solution of (metallic Fe + Co) : strong absorption
Solution of pure Co : no absorption
Xenon lamp : Solution of [(NH4)2SO4.FeSO4.6H20 + Co] : no absorption.
The inference is that the absorption is due to Fe, and is atomic.
Although this phenomenon did not affect the Co analyses, it has the
interesting practical applications pointed out by Frank, Schrenk and
Meloan (1966) in that one lamp with an appropriate spectrum can be used
to analyze several elements.
As these two possible interferences were absent, it was concluded
that the standard method of measuring light-scattering NAA should be
adequate. This consists of analyzing the samples at a wavelength close
to the resonance (analytical) line, but using a line (not necessarily
of the same lamp) which is known not to be absorbing (i.e. a line where
no absorption is observed when using a dilute solution containing small
quantities of the analyte). The apparent absorption (NAA), when sub-
tracted from the total resonance line absorption, should then give the
atomic absorption.
Type II interference is a depressive effect proportional to the
amount of Fe in solution (Fig. 4.3b). This is partly caused by lower
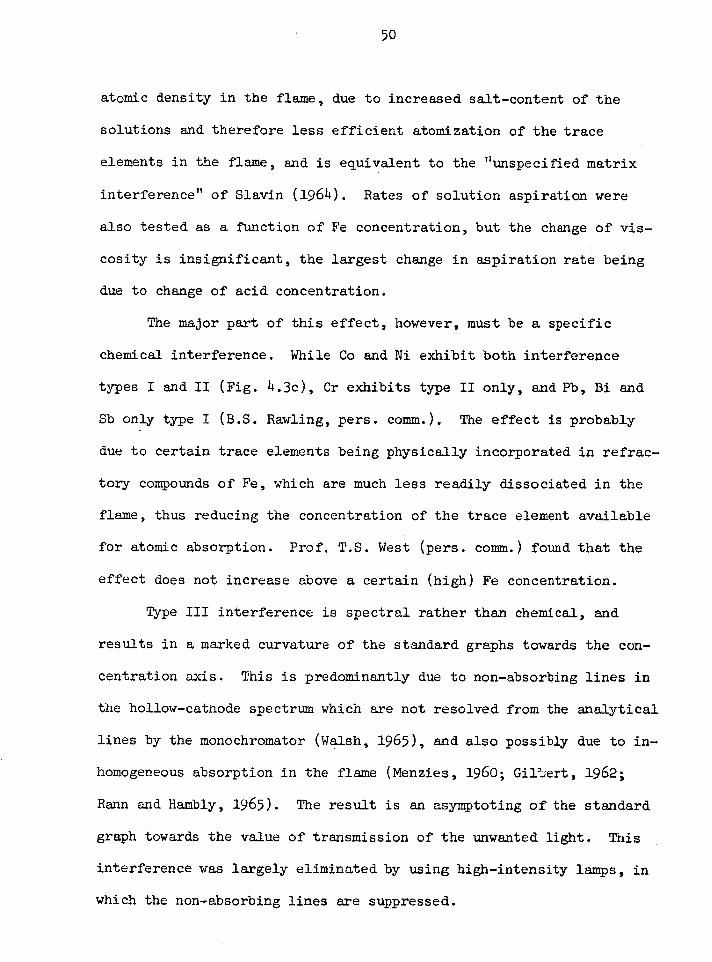
50
atomic density in the flame, due to increased salt-content of the
solutions and therefore less efficient atomization of the trace
elements in the flame, and is equivalent to the "unspecified matrix
interference" of Slavin (1964). Rates of solution aspiration were
also tested as a function of Fe concentration, but the change of vis-
cosity is insignificant, the largest change in aspiration rate being
due to change of acid concentration.
The major part of this effect, however, must be a specific
chemical interference. While Co and Ni exhibit both interference
types I and II (Fig. 4.3c), Cr exhibits type II only, and Pb, Bi and
Sb only type I (B.S. Bawling, pers. comm.). The effect is probably
due to certain trace elements being physically incorporated in refrac-
tory compounds of Fe, which are much less readily dissociated in the
flame, thus reducing the concentration of the trace element available
for atomic absorption. Prof. T.S. West (pers. comm.) found that the
effect does not increase above a certain (high) Fe concentration.
Type III interference is spectral rather than chemical, and
results in a marked curvature of the standard graphs towards the con-
centration axis. This is predominantly due to non-absorbing lines in
the hollow-cathode spectrum which are not resolved from the analytical
lines by the monochromator (Walsh, 1965), and also possibly due to in-
homogeneous absorption in the flame (Menzies, 1960; Gilbert, 1962;
Rann and Hambly, 1965). The result is an asymptoting of the standard
graph towards the value of transmission of the unwanted light. This
interference was largely eliminated by using high-intensity lamps, in
which the non-absorbing lines are suppressed.
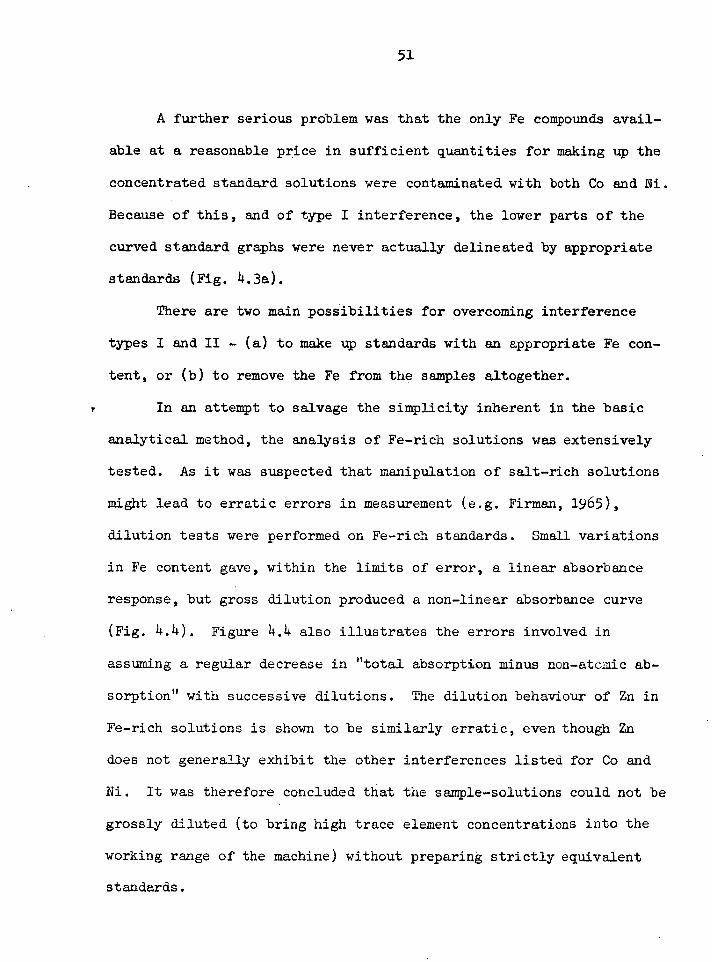
51.
A further serious problem was that the only Fe compounds avail-
able at a reasonable price in sufficient quantities for making up the
concentrated standard solutions were contaminated with both Co and Ni.
Because of this, and of type I interference, the lower parts of the
curved standard graphs were never actually delineated by appropriate
standards (Fig. 4.3a).
There are two main possibilities for overcoming interference
types I and II - (a) to make up standards with an appropriate Fe con-
tent, or (b) to remove the Fe from the samples altogether.
In an attempt to salvage the simplicity inherent in the basic
analytical method, the analysis of Fe-rich solutions was extensively
tested. As it was suspected that manipulation of salt-rich solutions
might lead to erratic errors in measurement (e.g. Firman, 1965),
dilution tests were performed on Fe-rich standards. Small variations
in Fe content gave, within the limits of error, a linear absorbance
response, but gross dilution produced a non-linear absorbance curve
(Fig. 4.4). Figure 4.4 also illustrates the errors involved in
assuming a regular decrease in "total absorption minus non-atcmic ab-
sorption" with successive dilutions. The dilution behaviour of Zn in
Fe-rich solutions is shown to be similarly erratic, even though Zn
does not generally exhibit the other interferences listed for Co and
Ni. It was therefore concluded that the sample-solutions could not be
grossly diluted (to bring high trace element concentrations into the
working range of the machine) without preparing strictly equivalent
standards.
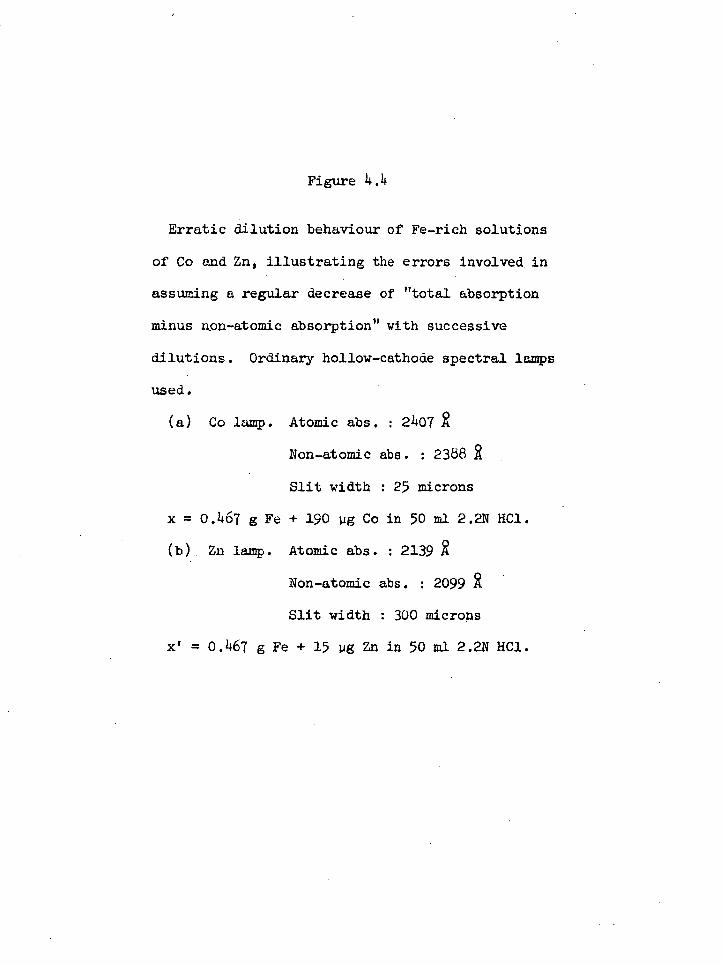
Figure 4.4
Erratic dilution behaviour of Fe-rich solutions
of Co and Zn, illustrating the errors involved in
assuming a regular decrease of "total absorption
minus iwn-atomic absorption" with successive
dilutions. Ordinary hollow-cathode spectral lamps
used.
(a) Co lamp. Atomic abs. : 2407 R Non-atomic abs. : 2388 R Slit width : 25 microns
x = 0.467 g Fe + 190 pg Co in 50 ml 2.2N HC1.
(b) Zn lamp. Atomic abs. : 2139 R Non-atomic abs. 2099 R Slit width : 300 microns
x' = 0.467 g Fe + 15 pg Zn in 50 ml 2.2N HC1.
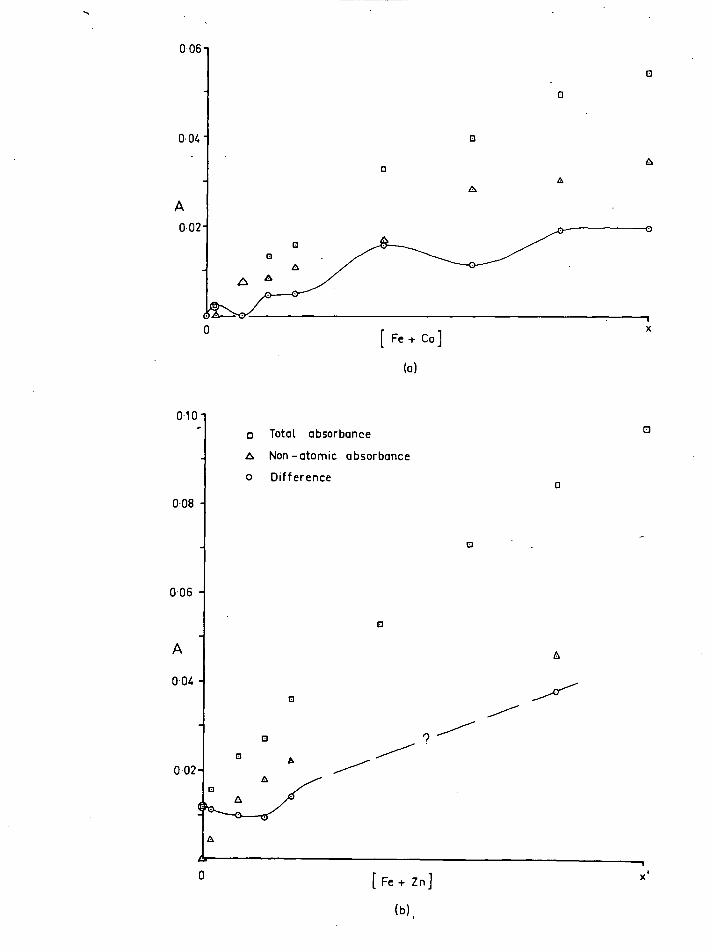
006
004
A 0.02
(a)
0
a
0 Total absorbance
A Non —atomic absorbance
o Difference
0
9
0 [ Fe + Zn}
(b) ,
52
Ideally, this procedure should have involved a prior determination
of the Fe content of the samples. As no Fe spectral lamp was immediately
available, the approximation was made that all pyrite samples were pure '
with the exception of the acid-insoluble residue. Standards were there-,.
fore prepared to cover the range of iron concentrations of 1 g (approx.)
per 50 ml sample solutions from which varying weights of residues had
been filtered. It was found convenient to (i) subtract NAA from both
sample and standard absorbances; (ii) read the Co or Ni concentrations
from the main standard graph, suitably adjusted for machine drift* ; arid .
(iii) calculate the correction for the appropriate Fe concentration.
The factor used was ± 3 ppm for ± 10% Fe concentration, derived from
standard lines representing Fe concentrations of 70, 80, 90, 100, 110%
of a 1 g pyrite per 50 ml concentration. Standards and samples were
made up in 2.2 M HC1.
It was eventually realized that this technique gave inaccurate and
imprecise answers, especially for Ni. The reason is not clear, but is
probably related both to the imprecision of the lower part of the
standard graphs, and to the poor monitoring of the Fe concentration,
the Fe in the solutions apparently interfering more significantly with
the Ni than with the Co. Examples of analyses of sulphide powders by
this method and by the following method are given in Table 4.4.
* This was considerable, due to burner blockage by Fe salts, and to thermal instability of the diffraction grating mounting in the AA3.
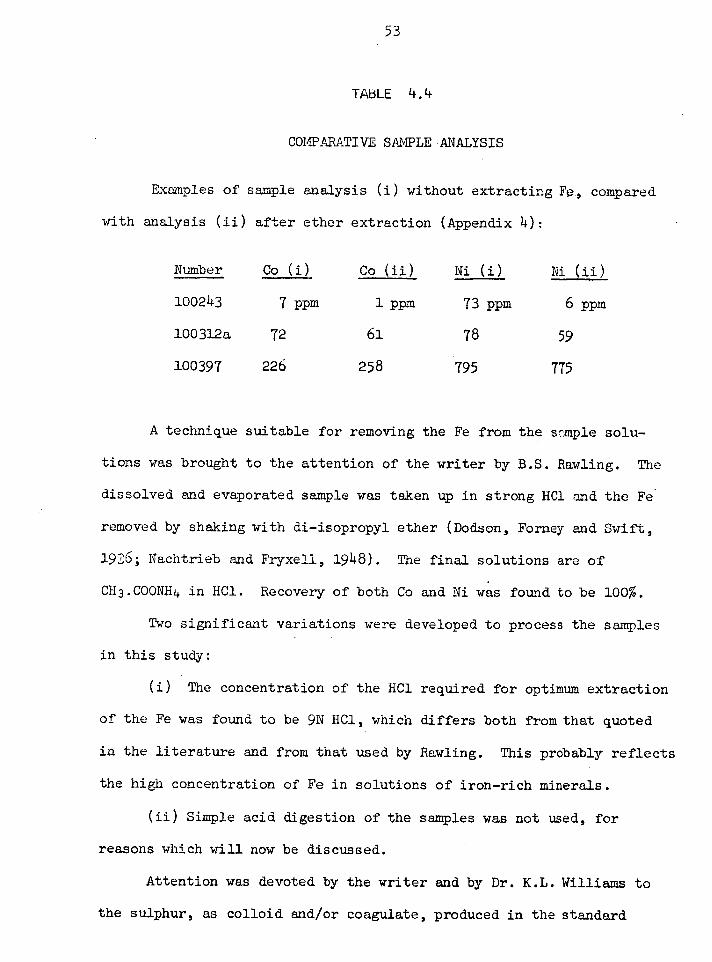
53
TAbLE 4.4
COMPARATIVE SAMPLE ANALYSIS
Examples of sample analysis (i) without extracting Fe, compared
with analysis (ii) after ether extraction (Appendix 4):
Number Co (i) Co (ii) Ni (i) Ni (ii)
100243 7 PPm 1 ppm 73 PPm 6 ppm
100312a 72 61 78 59
100397 226 258 795 775
A technique suitable for removing the Fe from the sample solu-
tions was brought to the attention of the writer by B.S. Rawling. The
dissolved and evaporated sample was taken up in strong HC1 and the Fe
removed by shaking with di-isopropyl ether (Dodson, Forney and Swift,
1936; Nachtrieb and Fryxell, 1948). The final solutions are of
CH3.COONH4 in HC1. Recovery of both Co and Ni was found to be 100%.
Two significant variations were developed to process the samples
in this study:
(i) The concentration of the HC1 required for optimum extraction
of the Fe was found to be 9N HC1, which differs both from that quoted
in the literature and from that used by Rawling. This probably reflects
the high concentration of Fe in solutions of iron-rich minerals.
(ii)Simple acid digestion of the samples was not used, for
reasons which will now be discussed.
Attention was devoted by the writer and by Dr. K.L. Williams to
the sulphur, as colloid and/or coagulate, produced in the standard
54
oxidizing HNO3 dissolution of pyrite.. It was thought probable that the
free S would interfere with absorption in the flame, and also produce
an erratic error due to variable viscosity of the solutions. * Tests by
the writer reveal no such interferences, nor were there chemical inter-
ferences with the ether extraction, or with Co and Ni recovery.
Four techniques have been used by the writer to dissolve pyrite:
(a) 72% HC104.
(b) Conc. HNO3.
(c)am HNO3, followed by a bromine-hydrogen peroxide mixture
(e.g. Sindeeva, 1964).
(d) Roasting to Fe203, followed by solution in HC1.
Method (d) was eventually incorporated in the analytical routine for
these reasons:
(i) Methods (a) and (c) are relatively expensive.
(ii) Where the sample was subjected to a two-acid treatment, it
was found more difficult to 'control the pH for ether extractions than
with a one-acid treatment.
(iii)Because of various technical difficulties, which could not
be overcome in the time available, the sulphur was not completely elim-
inated using any of the first three methods. Any S which happened to
remain in the solution was Very slow to clear from the aqueous phase
after shaking with ether.
(iv) Most important, the roasting procedure was the most versa-
tile, handling as it could both sulphides of several types, and oxides.
The S/SO4 ratio. in the original solution is a function of acid strength, which can vary due to e.g. filtering requirements.
55
Recovery of Co and Ni from the roast was found to be 100%, but
the technique cannot be extended to cover analysis of elements which
volatilize at the high operative temperatures. The efficiency of the
roasting method depends.pn the availability of oxygen to the roasting
bed. This was tested by roasting samples of a pyrite powder in
silica boats in a 1 inch diameter silica tube through which a controlled
air current was passed, the tube being heated by two Meker burners.
Although all products were shown by XRD to be Fe203, the colour of the
product ranged from rust red (highest air flow) to a deep mauve, the
former dissolving more readily than the latter. By carrying out the
roasting in a reasonably squat crucible, there is sufficient access of
air for satisfactory dissolution of the product.
The complete procedure for the preparation of standards and the
analysis of samples for Co and Ni is presented in Appendix 4. The
operating conditions and reliability tests of the analyses are given in
Tables 4.5 and 4.6. After the extraction of the Fe (eliminating inter- -
ference types I and II), NAA became zero, and the standard graphs could
be drawn through the origin. With the introduction of the high-
intensity lamps (eliminating interference type III), the graphs were
taken as straight lines up to absorbances of about 0.7 (20% transmission).
It is inadvisable to work at higher absorbances because of loss of
sensitivity and precision, preferred procedures being dilution of the
sample solutions, rotation of the slit burner, or use of a less sensiti-7
resonance line.
The coefficients of variation in Table 4.6 indicate that the over-
all precisions for Co and Ni are very similar. The 95% confidence
56
TABLE 4•5
Co AND Ni ANALYSES : ATOMIC ABSORPTION SPECTROPHOTOMETER
OPERATING CONDITIONS
Element Co Ni
Wavelength (() 2407 2320
Lamp current (mA) 14 14
Booster setting 100-200 200
Flame Air/acetylene Air/acetylene
Slit width (p) 25 or 50 50 or 100
Sensitivity (average maximum): 6.4* 6.5*
pg/m1 for 50% absorption
Standards 0.1-100 jig/m1 0.1-100 jig/m1
Percentage absorption
- lowest standard 1% 1%
- lowest sample 0% 0%
Dilutions used None None
Limit of quantitative 1 ppm 1 ppra
determination (in solid)
Limit of detection 0.5 ppm 0.5 ppm
(in solid)
Absorbance vs. concentration is linear to 80% absorption.
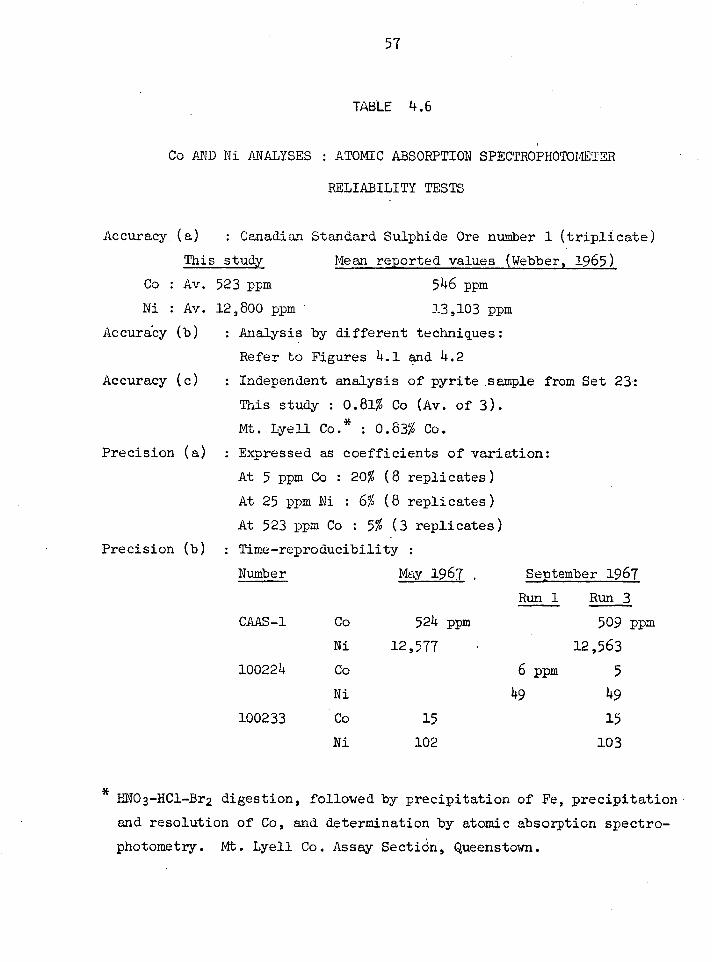
57
TABLE 4.6
Co AND Ni ANALYSES : ATOMIC ABSORPTION SPECTROPHOTOMETER
RELIABILITY TESTS
Accuracy- . (a) : Canadian Standard Sulphide Ore number 1 (triplicate)
This study Mean reported values (Webber, 1965)
Co : Av. 523 ppm 546 ppm
Ni : Av. 12,800 ppm 13,103 ppm
Accuracy (b) : Analysis by different techniques:
Refer to Figures 4.1 and 4.2
Accuracy (c) : Independent analysis of pyrite sample from Set 231
This study : 0.81% Co (Av. of 3).
Mt. Lyell Co. * : 0.83% Co.
Precision (a) : Expressed as coefficients of variation:
At 5 ppm co : 20% (8 replicates)
At 25 ppm Ni : 6% (8 replicates)
At 523 ppm Co : 5% ,(3 replicates)
Precision (b) : Time-reproducibility :
Number May 1967 , September 1967
Run 1 Run 3
CAAS-1 Co 524 ppm 509 PPm
Ni 12,577 12,563
100224 Co 6 ppm 5 Ni 49 49
100233 Co 15 15
Ni 102 103
HNO3-HC1-Br2 digestion, followed by precipitation of Fe, precipitation
and resolution of Co, and determination by atomic absorption spectro-
photometry. Mt. Lyell Co. Assay SectiOn, Queenstown.
58
limits for a single determination of either element are then tts, where .
t is Studenes t0.05 for the N-1 degrees of freedom on which the esti-
mate of the standard deviation was based (Sullivan, Timms and Young,
1968). The approximate 95% confidence intervals based on the quoted
precisions are:
At 5 ppm , ±2 ppm.
At 25 ppm , ±4 ppm..
At 523 ppm, ±108 ppm.
In other words, because of imprecision in sample homogenization,
processing, and analysis, the probability that two individual analyses
of 21 and 28 ppm are different will be less than 95%.
The final concentrations were calculated by an Algol Elliott 503
computer programme written by B. D. Johnson, two hundred of the analyses
having also been calculated manually. A total of 10 parameters for each
analysis were fed into this programme, including figures for drift of
the equipment as read from the chart record. The calculations were
designed to give the following basic information:
(1) (weight of Co or Ni) x 10 6 PPm
wt. of original sample - wt. of filtered residue
(2) (weight of Co or Ni) x 10 6 PPm
weight of original sample
(3) The Co:Ni ratio for each sample
For most analyses, the assumption was made (calculation 1) that a
filtered residue which had remained visibly inert during sample
preparation represented gangue, from which no Co and Ni were extractable.
If the filtered residue was a precipitate, say PbC12, formed during the
59
chenical preparation, some of the Co and Ni may have been held in trace
galena in the sample. The correct concentration in the main mineral
would then lie somewhere between answers (1) and (2), thus introducing
an uncertainty (which in practice is small; see Table 6.1). This is
another reason why the specimens were purified as much as possible
before analysis.
Selenium
X-ray fluorescence spectrography was used for analyzing Se, as
the sensitivity was adequate for the ranges of concentrations found in
Tasmanian sulphides (see Fig. 6.12). The operating conditions are
listed in Table 4.7. To prepare standards, Analar Se metal powder and
the appropriate sulphide were mixed in the gyratory swing-mill for
30 seconds.
As with the Ni analyses by XRF, the scattered background tech-
nique could not be made to work. Instead an empirical curve was
prepared relating peak minus background intensity to variation in
composition of accurately proportioned pyrite-quartz standards. It was
then assumed that the acid insoluble fraction of the pyrite samples
(known from the Co-Ni determinations) had the same mass absorption as
Si02, and a correction factor for the analysis was read from the
empirical curve. Concentrations of Se were then calculated with respect
to the pyrite fraction of the sample.
For sphalerite analyses, a natural sphalerite (10509) was used as
the standard base. The purified sphalerite samples did not vary in
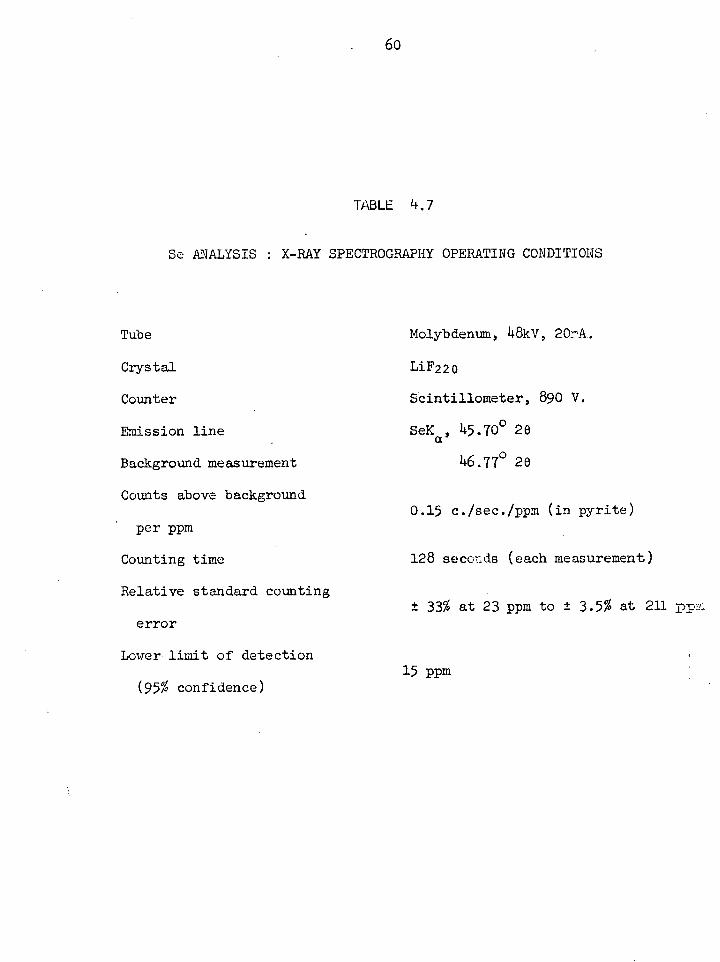
6o
TABLE 4•7
Se ANALYSIS : X-RAY SPECTROGRAPHY OPERATING CONDITIONS
Tube Molybdenum, 48kV, 20rA.
Crystal L1F220
Counter Scintillometer, 890 V.
Emission line SeKa , 45.70° 26
Background measurement 46.77° 20
Counts above background 0.15 c./sec./ppm (in pyrite)
per ppm
Counting time 128 sece7lds (each measurement)
Relative standard counting ± 33% at 23 ppm to ± 3.5% at 211 p .m
error
Lower limit of detection 15 ppm
(95% confidence)
61
mass absorption, except where the Fe contents changed, and as the latter
had been previously determined, the mass absorptions were suitably
adjusted.
Pure chalcopyrite, pure pyrrhotite, and pentlandite-pyrrhotite ore
were analysed using the sphalerite standards and recalculating with
respect to mass absorption.
The poor sensitivity of the analytical method was partially over-
come by counting for a total of 256 seconds on each sample. The
standard counting error varied regularly (Table 4.7), and was equivalent
to an uncertainty of t 7 ppm Se at all measured concentrations.
To test the precision, eight duplicate analyses, covering the
range of results, were carried out. The precision was expressed as the
relative deviation (C), according to the formula
Ed C = ±I n-1
where d is the percentage deviation of each observation from the arith-
metic mean of each pair of duplicates, and n is the number of duplicate
pairs. This yields a maximum precision of ± 6 ppm for all concentrations,
which is an underestimate in view of the level of counting error.
The accuracy of the results was tested by analysis of several
specimens by the Department of Mines Assay Laboratories, Tasmania, and
by the Australian Mineral Development Laboratories, Adelaide, South
Australia (ANDEL). The spectrophotometric method of analysis developed
by the Department of Mines is summarized in Appendix 5. The technique
used by ANDEL was a spectrophotometric method following separation of
the Se by coprecipitation as the metal with Te.
Figure 4.5
Comparison of Sc analyses of various sulphides
by X-ray fluorescence spectrography (this work),
spectrophotometry (Department of Mines Assay
Laboratory), and. precipitation-spectrophotometry
(Australian Mineral Development Laboratories).
Composition of the samples, and details of
analyses, are listed in Appendix 5.
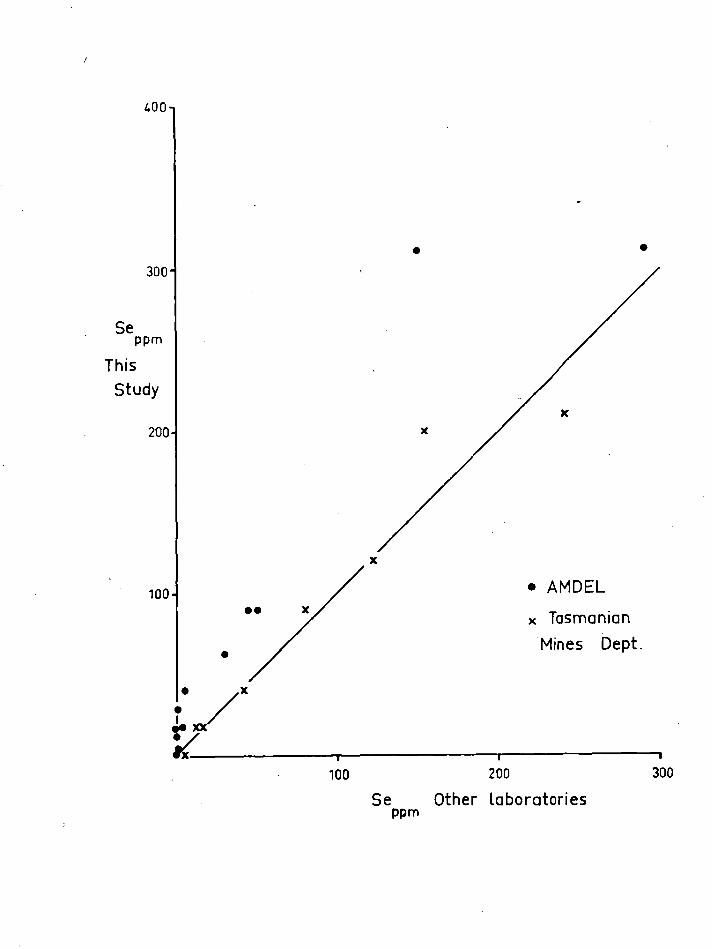
• AMDEL
x Tasmanian
Mines Dept.
100
•
400
300-
Se PPm
This Study
200-
100 200
300
Se Other laboratories PPm
62
A comparison of the three sets of analyses is given in Figure 4.5,
and in Appendix 5. Only those analyses in which no difficulties were
reported by the analysts were included in Figure 4.5. The Se results
obtained in this study by XRF, and those obtained by the Department of
Mines, are equivalent within the precision of measurement for both
groups of analyses below 100 ppm. Above 100 ppm there is less agreement :
The results obtained by AMDEL are consistently_lower than the other two
groups of results, which may be the result of incomplete precipitation
of Se.
A further check on accuracy was provided by comparison of the
analyses (distillation-colourimetric) of Edwards and Carlos (1954),
recalculated to the pure sulphides, of specimens from some of the sane
localities as those in the present study. These have been plotted in
Figure 6.12, and show good agreement.
The accuracy of the analyses thus established is considered
adequate for the subsequent interpretations.
Copper, Iron and Zinc
It was necessary in two investigations to estimate the proportions
of pyrite, chalcopyrite and sphalerite in already prepared samples.
The powdered and pilled samples were analyzed by X-ray spectrography
(linear calibration method) for Cu, Fe and Zn (Table 4.8), and the
amounts of the minerals calculated assuming stoichiometric proportions,
the average 2% Fe in sphalerite not interfering at the level of accuracy
required. The results are listed in Table 6.1.
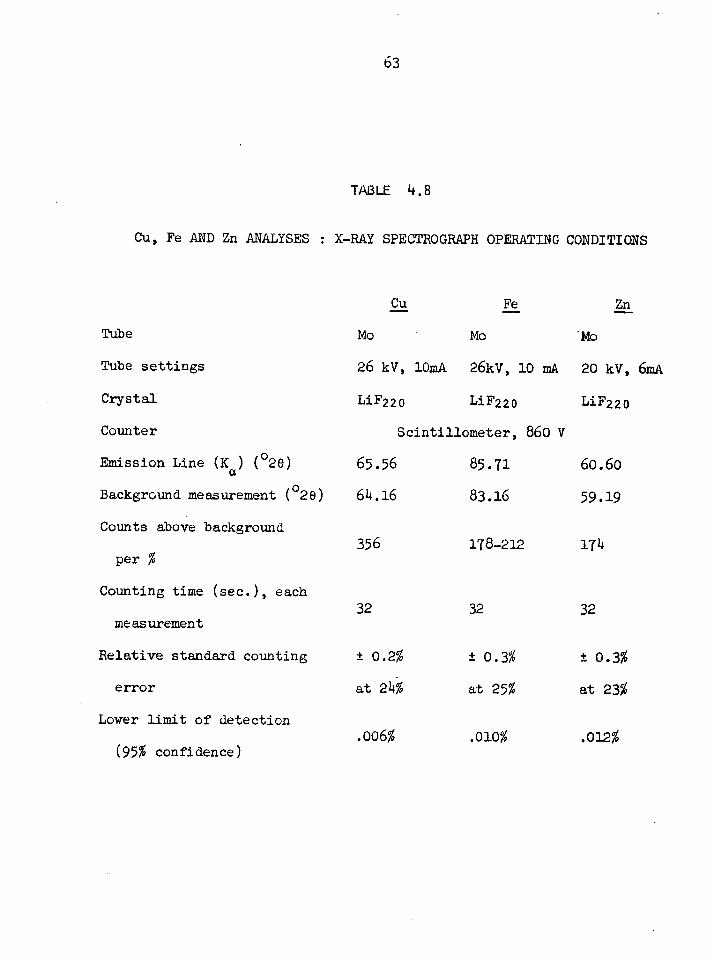
63
TABLE 4.8
Cu, Fe AND Zn ANALYSES : X-RAY SPECTROGRAPH OPERATING CONDITIONS
Tube
Tube settings
Crystal
Cu
Mo
26 kV, 10mA
L1F220
Fe
Mo
26kV, 10 mA
LiF220
Zn
'Mo
20 kV, 6mA
LiF220
Counter Scintillometer, 860 v
Emission Line (Ka ) ( °20) 65.56 85.71 60.60
Background measurement ( °28) 64.16 83.16 59.19
Counts above background
per % 356 178-212 174
Counting time (sec.), each
measurement 32 32 32
Relative standard counting ± 0.2% ± 0.3% ± 0.3%
error at 24% at 25% at 23%
Lower limit of detection .006% .010% .012%
(95% confidence)
The standards used were pure pyrite, chalcopyrite, and sphalerite,
the Canadian Standard Sulphide Ore number 1, and Cu, Pb and Zn concen-
trates from the Rosebery Mine analyzed by the Assay Department of the
Electrolytic Zinc Company. The standard graphs are shown in Figure 4.6.
Variation in iron caused the greatest variation in mass absorption, and
where it was known that the sample contained only pyrite and chalcopyrite,
an approximate empirical correction was made to the Fe standard graph in
terns of previously determined % Cu (Figure 4.6c).
Because strictly quantitative results were not necessary, accuracy
and precision tests were not performed. Inspection of Figure 4.6 and
Table 4..8 suggests limits of significant error of ± 10% of the Fe content,
and lower limits for Cu and Zn.
Figure 4.6
Standard graphs for XRF analysis of Cu, Fe and Zn:
(a) Cu;
(b) Fe;
(c) Conversion graph for Fe in pyrite-
chalcopyrite mixtures with respect to
% Cu;
(d) Zn.
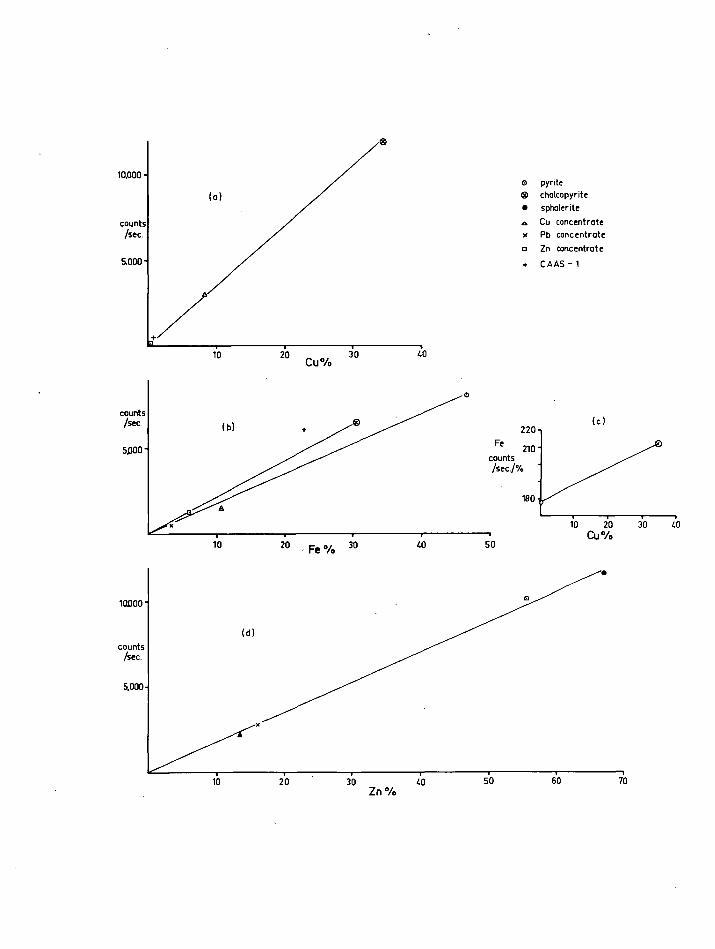
50 40
10000
counts /sec
5.000
O pyrite 4i) chalcopyrite • sphalerite
z. Cu concentrate x Pb concentrate
o Zn concentrate
+ CAAS — 1
10 20 30 Fe %
10 20 Cu% 30 40
10.000
counts /sec
5.000
(a)
220
Fe 210
counts /sec./%
1130
10 20 Cu /o
30 40
(c

65
5. METALLOGENESIS OF TASMANIA
Tasmania lies in the southernmost part of the Palaeozoic Tasman
Geosyncline, a major structure forming almost the entire eastern seaboard
of the Australian continent. It is probable that Tasmania is tectonically
related to Victoria, 150 miles to the north (Hills, 1965), but the geolo
gical features they share are few. These include Cambrian spilitic
vulcanism, and upper Palaeozoic orogenesis and plutonism with associated
Au and Sn mineralization. This restricted range of mineralization is
confined, however, to Tasmania's north-east corner. The western half of
the island is geologically quite unlike Victoria, with large areas of
Precambrian and Cambrian rocks, and a great time range (? Precambrian -
Devonian), and variation in type (Fe, Ni-Cr, Os-Ir, Cu-Au, Sn-W, Ag-Pb-
Zn) of mineralization.
GEOLOGICAL HISTORY
The geological history of Tasmania has been Well synthesized in
Spry and Banks (1962), and by Solomon (1965a) and Banks (1965), and the
following summary is based partly on these sources.
The geology of the island is shown in Figure 5.1. The outstanding:
feature is the widespread distribution of essentially horizontal Permian,
Triassic and later Systems, unconformably overlying lower Palaeozoic and
older rocks which were involved in the Devonian orogenesis. Primary
mineralization is restricted to the rocks below the unconformity.
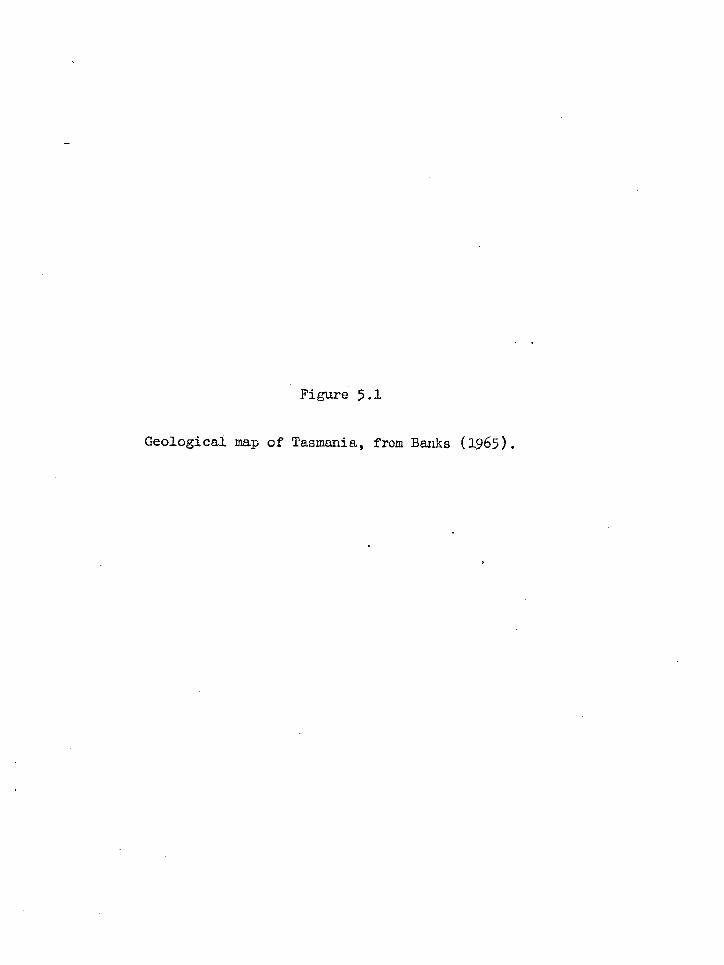
Figure 5.1
Geological map of Tasmania, from Banks (1965).
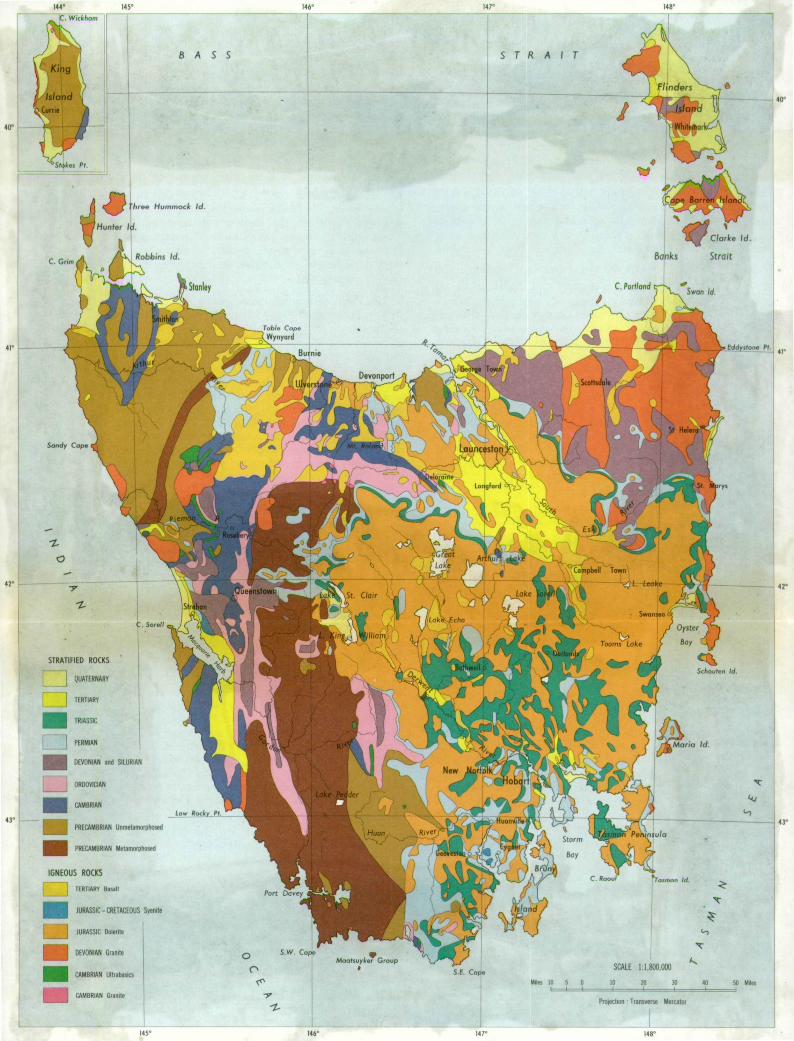
146* 148° 145 ° 147'
145 146' 148°
Id Root.d
SCALE 1:1.800,000
51, Miles 4?
STRAIT
IGNEOUS ROCKS
TERTIARY Basalt
1111 JURASSIC - CRETACEOUS Semite
JURASSIC Dinette
DEVONIAN Granite
11111 CAMBRIAN Ultrabasics
INE1 CAMBRIAN Gtanile
Port Davey
S.W. Co. 0 Maatsuyker Group
C‘
lr
• S.F. Cope
hr.. Hummock Id.
1 Clarke Ed.
Strait Banks Robbins Id. C. Grim
Hunter Id.
C. Portland
•01.' - X4M
s
-r449.-N V
Burnie
7abie Cape
Wynyord
Stanley Swan Id.
Eddystone Pt.
Sandy Cope
C. Soren
QUATERNARY
TERTIARY
TRIASSIC
PERMIAN
DEVONIAN and SILURIAN
ORDOVICIAN
CAMBRIAN
PRECAMBRIAN Unmetamorphosed
PRECAMBRIAN Melamorphosed
Pe • nsula
Oyster
Bay
4!]Q6 Schouten Id
Low Rocky , Pt.
STRATIFIED ROCKS
Maria Id.
ekr
2? 3? Mlles i t° 5 0 IT
Projection Transverse Mercator
BASS
66
The Precambrian rocks of western Tasmania are of two types -
metamorphosed and relatively unmetamorphosed. Spry (1962a) considered
the metamorphosed rocks to be older than the unmetamorphosed, and
separated them by the Frenchman Orogeny, an episode of regional meta-
morphism and basic igneous activity (Fig. 5.2). It has since been
found, however,that the age relationships are reversed in north-western
Tasmania. The Arthur Lineamert, a narrow belt of metamorphosed
Precambrian rocks extending from the Pieman River to Wynyard (Figs. 5.1,
5.2, 5.4), consists of psammitic and pelitic schists, with ortho-
amphibolites, one of which contains the Savage River magnetite deposit
(Fig. 5.4). Gee (1967) has shown that these rocks are metamorphic
derivatives of the unmetamorphosed Precambrian rocks, formed in a shear
zone during the Penguin Orogeny. The ortho-amphibolites are considered
by Gee to be metamorphosed equivalents of albite dolerites occurring in
the uametamorphosed rocks. Some of the dolerites were intruded as
dykes and sills during the early part of the Penguin folding, and one
of them, the Cooee Dolerite (Spry, 1962b), has been radiometrically
dated at 700 m.y. On geological grounds, the Penguin Orogeny is pre-
Middle Cambrian, and the combined evidence suggests an uppermost
Precambrian age. However its effects seem to have been restricted in
area, as discontinuities in the geological record at this time are much
less apparent to the south, where the unmetamorphosed Precambrian
passes upwards into a distinctive suite of sandstone, siltstone, and
dolomite - late Precambrian or early Cambrian - termed by Solomon (1965a)
the Success Creek phase (Fig. 5.2).
Figure 5.2
Summary of geological history and mineralization
of Tasmania, for the north-west coast (up to the
Cambrian), and the mineralized areas of the west
coast and north-east coast (up to the Devonian).
Partly after Solomon (1965).
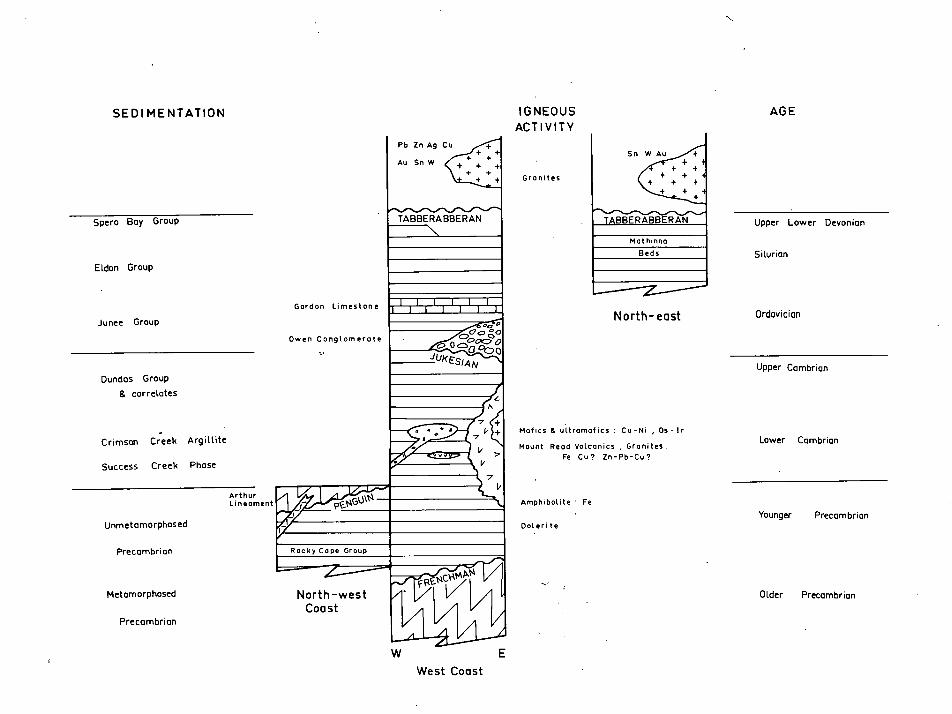
SEDI MENTATION IGNEOUS
AGE
ACTIVITY
West Coast
Granites
Upper Lower Devonian
Silurian
Lower Cambrian Mafics S uitramafics : Cu-Ni , Os- Ir
Mount Read Volcanics • Granites :
Fe Cu? Zn-Pb-Cu?
North-east Ordovician
Upper Cambrian
Amphibolite : Fe
Younger Precambrian Dol. erite
Older Precambrian
Precambrian Rocky Cape Group
Metamorphosed
Precambrian
North-west Coast
Spero Bay Group
Eldon Group
Junee Group
Dundas Group
& correlates
Crimson Creek Argillite
Success Creek Phase
111111 1111111
cga go° o czia 00.0
JUKEsIAN
7
71":. -_,L■ L,
7
ww TABBERABBERAN
Unmetamorphosed
Arthur Lineament
044
Gordon Limestone
Owen Conglomerate
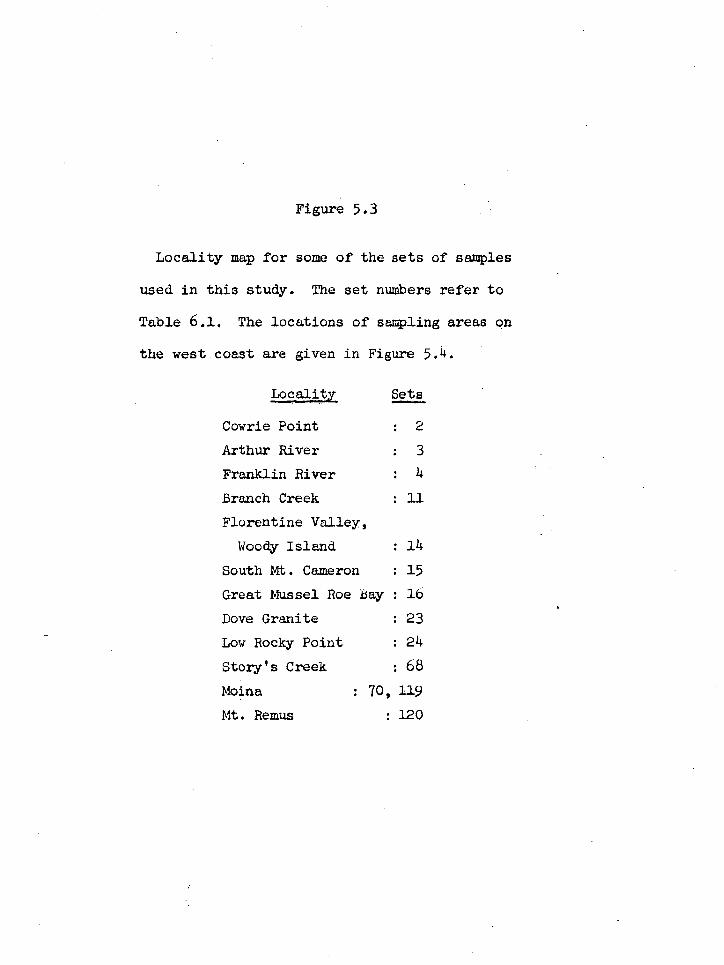
Figure 5.3
Locality map for some of the sets of samples
used in this study. The set numbers refer to
Table 6.1. The locations of sampling areas on
the west coast are given in Figure 5.4.
Locality Sets
Cowrie Point : 2
Arthur River : 3
Franklin River : 4
Branch Creek : 11
Florentine Valley,
Woody Island : 14
South Mt. Cameron : 15
Great Mussel Roe Bay : 16
Dove Granite
Low Rocky Point
Story's Creek
Moina
Mt. Remus
: 23
: 24
: 68
: 70, 119
: 120
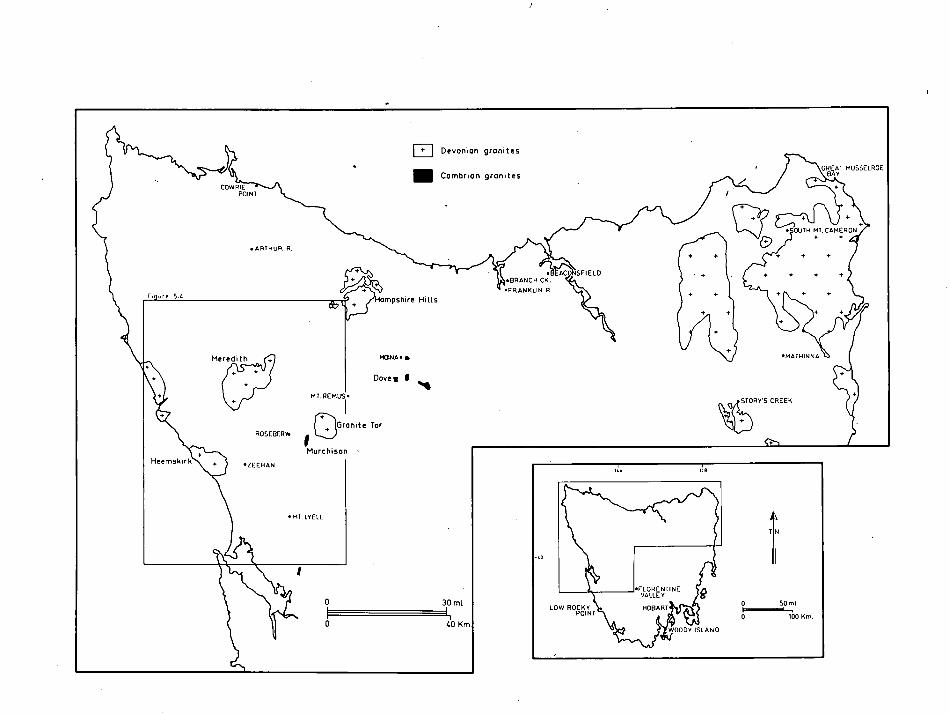
Devonian granites E Cambrion granites
GREAT MUSSELROE BAY
COWRIE POINT
• OUTH MT. CAMERON + +
• ARTHuR R.
• KINSFIELD •BRANCH CR. •FRANKLIN R.
_Sr 5.4 ampshire Hilts
MOINA • • •mATHINNA
Doves • '4111
MI. REMUS•
Granite Tor ROSEBERY•
MurchiSOn •
103,bSTORY'S CREEK
Heemskirk • ZEEHAN
• KiT LyELL
0
30 ml
40 Km
Figure 5.4
Geological sketch map of the mineralized area of the west coast
of Tasmania, from Solomon (1965). The location of this area is
shown on Figure 5.3.
Locality Sets
1. Mt. Lyell (see Fig. 5.5) 72-95
2. Dundas 60-67
3. Hercules (see Fig. 5.7) 117
4 • Cuni 19
5. Renison Bell (see Fig. 6.20) 51-55
6. Tullah (see Fig. 5.8) 121-124
7. Murchison Granite (see Fig. 5.8) 22
8. Que River 12
9. Valentine's Peak 71
10. Mt. Bischoff (see Figs. 6.18. 6.19) 30-50
11. Magnet 118
12. Cleveland 69, 128
13. Savage River 18
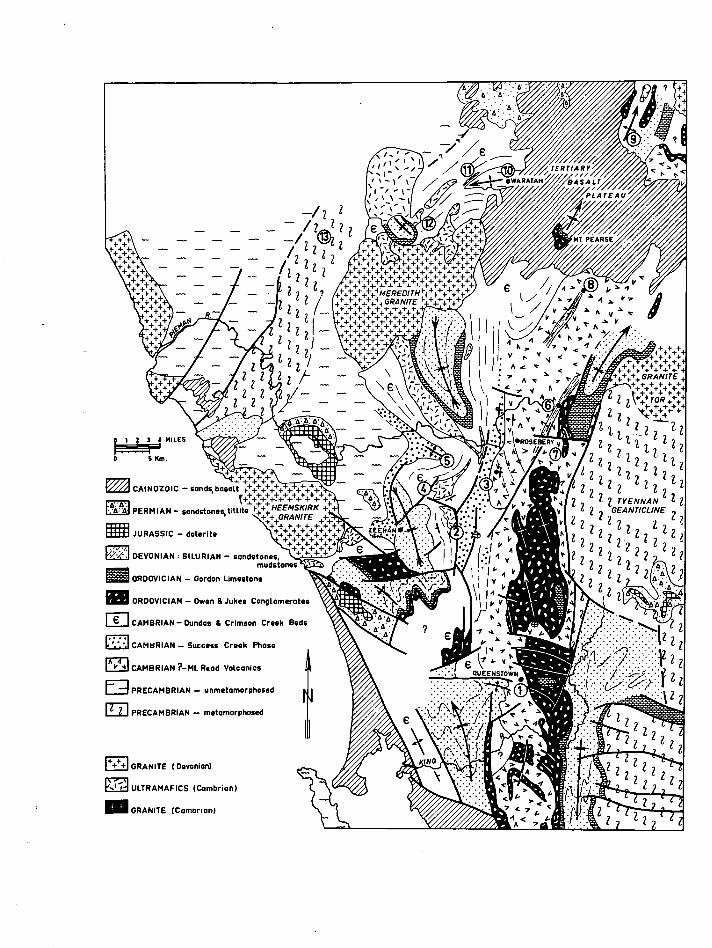
Z,TERTTARY//
_IIIWARATAM / °ASA /LT
/ PLATEAU
/ Mt PEARSE
1 2 3 1 MILES
5 Km.
FE] CAINOZOIC — sands, basalt 1. + + 4.
PERMIAN — sandstones, tillite 1-_,+„.HEEMSKIRK + '+;++ GRANITE
JURASSIC — dolerite
DEVONIAN : SILURIAN — sandstones, mudstones
M ORDOVICIAN — Gordon Limestone
El ORDOVICIAN — Owen 11 Jukes Conglomerates
CO CAMBRIAN — Dundas & Crimson Creek Beds
CAMBRIAN — Success Creek Phase
CAMBRIAN ?—Mt. Read Volcanics
rq PRECAMBRIAN — unmetamorphosed
FTI PRECAMBRIAN — metamorphosed
1 1 GRANITE ( Devonian)
• I ULTRAMAFICS (Cambrian)
11111 GRANITE (Cambrian)
67
Whereas the uametamorphosed successions discussed above were
deposited in a widespread miogeosyncline (Spry, 1962a; Solomon, 1965a),
in the (?) early Cambrian a eugeosyncline was initiated around the
western and northern margins of the Tyennan Geanticline, an emergent
block of Precambrian rocks in the mid-west of the island (Fig. 5.1).
This trough was filled with perhaps 20,000 feet of conglomerates,
greywackes, mudstones, and pyroclastics, and igneous rocks of the
spilite-keratophyre association. The mafic-ultramafic igneous activity
tended to be concentrated further out in the trough than the acid-
intermediate activity, which was confined mainly to a narrow belt (the
Mt. Read Volcanic arc) adjacent to the Tyennan Geanticline, although
intercalations of the two types occur.
In the Zeehan-Waratah area (Fig. 5.4), the unfossiliferous
Crimson Creek Argillite, 10,000 feet thick, concordantly overlying the
Success Creek phase, consists of unfossiliferous mudstone, greywacke
and shale (Blissett, 1962; Loftus-Hills, 1964), with spilitic lavas and
keratophyric tuffs (Solomon, 1965a). It passes upwards into the
fossiliferous Dun das Group (lower Middle Cambrian-middle Upper Cambrian),
a sequence of variable and impersistent paraconglomerates, greywackes,
siltstones, shales and tuffs, which show cyclic deposition. The
Cambrian sediments in general become coarser, and contain fewer
volcanics towards the top of the succession (Banks, 1965).
Associated with the early Cambrian spilites are mafic-ultramafic
complexes containing layered pyroxenites, harzhurgites, norites, and
bronzitites, with serpentinites, and agglomerates (Jack and Groves,
1964; Groves, 1965; Rubenach, 1967). The McIvor Hill Gabbro west of
68
Zeehan has been radiometrically dated at 518 t 133 m.y. (Brooks, 1966).
Some of these complexes were exposed to erosion at least by the lower
Middle Cambrian, as evidenced in several parts of Tasmania by detritus
in immediately overlying sediments, and it is possible that they were
wholly extrusive on the sea floor (Solomon, 1965a; Rubenach, 1967).
This ophiolite association may be the culmination of a period of basic
igneous activity begun in the late Precambrian With the albite dolerite
intrusions in the north-west, and spilitic.vulcanism in the Zeehan area
(Bliseett, 1962).
The age of the acid-intermediate igneous rocks - the Mt. Read
Volcanics and associated late-stage, high-level, sub-volcanic Darwin,
Murchison and Dove Granites - is a major problem. Immediately to the
west of Rosebery (Fig. 5.7a), the Volcanics appear to be almost iso-
clinally folded with the Rosebery "Series", which. has been correlated
with the Success Creek phase (Loftus-Hills et al., 1967). The Volcanics
could therefore be partly Precambrian, but in other parts of Tasmania
similar volcanics are known to be Upper Cambrian, and it appears that
the suite is regionally diachronous.
The Mt. Read Volcanics, about 10,000 feet thick, are largely
sodic quartz keratophyres and albite andesites, and include ignimbrites
and tuffs (Solomon, 1964). Coeval marine sedimentation occurred to the
west, but the only evidence for a sub-aqueous environment of deposition
for the Volcanics is a series of minor siltstone intercalations, one of
which contains upper Middle Cambrian marine fossils, and Solomon
(Solomon et al., in press) considers that much of the arc was probably
sub-aerial. The Volcanics contain the Rosebery, Mt. Lyell and
Mt. Farrell orebodies.
69
Cambrian eugeosynclinal deposition ceased with the onset of the
jukesian Movement. This created local unconformities between several
areas of Cambrian and Precambrian rocks, and the succeeding 15,000 -
20,000 feet of continental and marine miogeosynclinal sedimentary rocks.
The latter were then deposited without further major disturbance until
the upper Lower Devonian. In western Tasmania, these rocks consist of
the Ordovician Junee Group, which is comprised in part of the basal
Jukes Conglomerate and Owen Conglomerate, and the Lower to Upper
Ordovician Gordon Limestone; the Siluro-Devonian Eldon Group; and the
Lower Devonian Spero Bay Group. In north-eastern Tasmania the lower
Palaeozoic basement of Mathinna Beds, monotonous in lithology and
almost unfossiliferous, is Siluro-Devonian, and possibly Ordovician.
In the upper Lower - upper Middle Devonian, the whole of
Tasmania was subjected to the two-phase Tabberabberan Orogeny. In the
Upper Devonian, high-level post-tectonic granite batholiths and stocks
were intruded in a radiometrically dated succession from east (oldest)
to west across Tasmania and the 'small islands to the north (McDougall
and Leggo, 1965; Brooks and Compston, 1965).
METALLOGENIC HISTORY
In the following summary, "set" . numbers refer to the sample-
groups in Table 6.1, and "ore" refers to economic mineralization.
Localities of deposits are shown in Figures 5.3 and 5.4.
The Savage River magnetite deposit (set 18) lies within an ortho 7
amphibolite in the Arthur Lineament. The age of the original mafic
70
igneous intrusion has been interpreted as Older Precambrian (Spry,
1964), Upper Precambrian (Gee, 1967), and coeval with the Cambrian maficr
ultramafic complex at Bald Hill, four miles to the east (Urquhart, 1966).
Gee and Urquhart have discounted Spry's (1964) conclusion on structural
and chemical grounds. Gee's interpretation is the most likely, as both
the amphibolites and the Precambrian dolerites lack the Ni-Cu-Cr-Os-Ir
mineralization of the Bald Hill complex, but the question is unresolved.
The wall-rocks of the pyritic, titaniferous magnetite ore show
varying degrees of alteration to serpentine, magnesite, dolomite,
chlorite, and epidote. Tetlow (1960) and Hughes (1961) postulated a
magmatic segregation origin for the ore, but Hall and Solomon (1962)
commented that because of the small volume of the igneous bodies com-
pared with the size of the ore deposits, the concentration of ore
constituents probably occurred prior to emplacement of the host-rock..
Banks (1965) notes the further possibility of in. situ flowage differen-
tiation. However Urquhart (1966), citing mainly the apparent para-
genetic sequence, and the alteration of the amphibolite, proposes a
hydrothermal origin from a mafic source rock. The diversity of these
views may be more apparent than real, as Singewald (1917) has suggested,
and it is now commonly assumed (Park and MacDiarmid, 1964, p.217), that
many iron ores, especially titaniferuus iron ores, are late-stage
magmatic differentiates whose emplacement is assisted by coeval hydro-
thermal fluids. The amphibolite has undergone at least two periods of
metamorphism, and if the ore was syngenetic, it will have been similarly
affected.
The mafic-ultramafic igneous suite, which is probably mainly
Cambrian, contains extensive, at present sub-economic mineralization.
7]-
(i) Samples of magnetite have been taken from the Tenth Legion deposit
in the McIvor Hill gabbro (set 21). (ii) Nickel mineralization is
not uncommon in several of the complexes, and pyrrhotite-pentlandite ore
(set 19) has been analyzed from Cuni, a deposit associated with the
Serpentine Hill complex between Zeehan and Renison Bell, mainly to estabr
lish the Co/Ni ratio. (iii) Small spherical nodules (0.2 in. diam.)
occur in a spilite in the Bald Hill complex (set 20). They have a
complex internal structure, a euhedral pyrite nucleus being surrounded
by a pure pyrite core, which is succeeded by a subophitic texture of
silicate laths and interstitial pyrite. The textures suggest that the
nodules grew from a central nucleus, and are coeval with the host
spilite.
The Cambrian acid-intermediate volcanic rocks also contain dis-
tinctive mineralization which is almost certainly syngenetic. Typical
are magnetite-hematite veins, with or without pyrite, chalcopYrite and
barite, one of which was sampled at Low Rocky Point (set 24). Pyrite-
hematite was also sampled from the Powerful Mine in the Dove Granite
(set 23), and disseminated pyrite from the Murchison Granite (set 22).
Of less certain origin is mineralization (sets 25 and 26) in the volcanic
country rocks enclosing the host-rock shale of the Rosebery Zin-Pb-Cu
lode. This mineralization may be genetically related to the main lode,.
the origin of which is discussed below.
The Mount Lyell deposits at Queenstown are predominantly of pyrite-
chalcopyrite, occurring in chloritized and sericitized schistose
Mt. Read Volcanics. The ores, which have been described by Wade and
Solomon (1958) Solomon an Elms (1965), Solomon (1967), Markham (1968)
and Solomon et al.,(in press), are similar to those at Rio Tinto, Spain
72
(Solomon, pers. comm.). They occur adjacent to the base of upturned and
overturned Owen Conglomerate, the contact between the two rock units
having been faulted and folded in the Tabberabberan Orogeny.
Six main types of primary mineral concentrations have been sampled
in this study (Fig. 5.5):
(i) Massive pyrite with some chalcopyrite (e.g. the Blow, or
Mt. Lyell Nine, set 72).
(ii) Pyrite with chalcopyrite disseminated in schist, forming
poorly defined, steeply dipping and pitching lenses (e.g. the West Lyell
lenses, sets 77-80). Derived from these are remobilized quartz-sulphide
lenses in tensional gashes in the schist (sets 81-84).
(iii)Disseminated pyrite without chalcopyrite (e.g. the Blow,
sets 73-76; West Lyell, sets 85 -88; Cape Horn, sets 89-90).
(iv) Massive irregular chalcopyrite-bornite, with or without
pyrite (e.g. the North Lyell - Crown Lyell area, sets 91-93).
(v) Disseminated chalcopyrite, with some stratiform pyrite, and
barite (e.g. Lyell Comstock, set 94).
(vi) A small lens of banded Pb-Zn-Cu ore, similar to that at
Rosebery (Tasman and Crown Lyell, set 95).
Two main possibilities exist for the origin of the mineralization:
(i) It was associated with Tabberabberan plutonism in the
Devonian.
(ii) It was genetically related to the host volcanics, is there-
fore originally Cambrian, and has been metamorphosed into its present
configuration during the Devonian.
The evidence bearing on the age or genesis of the deposits is as
follows:
Figure 5.5
Geological and locality map of the Mt. Lyell area, by
Solomon (Solomon et a)., in press). The grid is the -
Mt. Lye).]. Co. mine grid.
0000001 Cr • Oh N
QUATERNARY
PLEISTOCENE MORAINE
ORDOVICIAN I- I
GORDON LIMESTONE I SHALES
al Tasman R. LYELL Crown LyeLl Shaft —
COMSTOCK I. UPPER OWEN CONGLOMERATE
ABOVE HAULAGE UNCONFORMITY
4000' N I" I 1 • *I
3200' N
CAMBRIAN • MT. LYELL . • .
MT. READ VOLCANICS, SOME SILTSTONE BEDS CAPE
HORN
CHERI
1600' N avr -a ORE BODIES
R SMALL ORE BODIES
CLEAVAGE • • • • • • • • • • • •
• • • • • • • 10_,_• • • • • • •
• • • • • • • • • • • • • • • • • •
00
NORTH LYELL CROWN LYELL
1600' S
WEST LYELL 3200' S
PRI NCE LYELL
5600' s 0. Lyel Mining Co.
Mill
BLOW PEN
0030'S
• • • • • • • • • • • • —0— •
0600' S • • " • • • • • • • ••••••• • • • • • • • • •
• • • • . • • • • • so • • • • • • • • • • • • • • ; • ; • ; • ; • ; • • ;
II UFO FEET
.0--OLIEENOT • • • • • • • • • • • /00 METRES
i;.••
g
UPPER OWEN CONGLOMERATE
MIDDLE OWEN CONGLOMERATE
LOWER OWEN CONGLOMERATE
UNDIFFERENTIATED OWEN CONGLOMERATE Eli
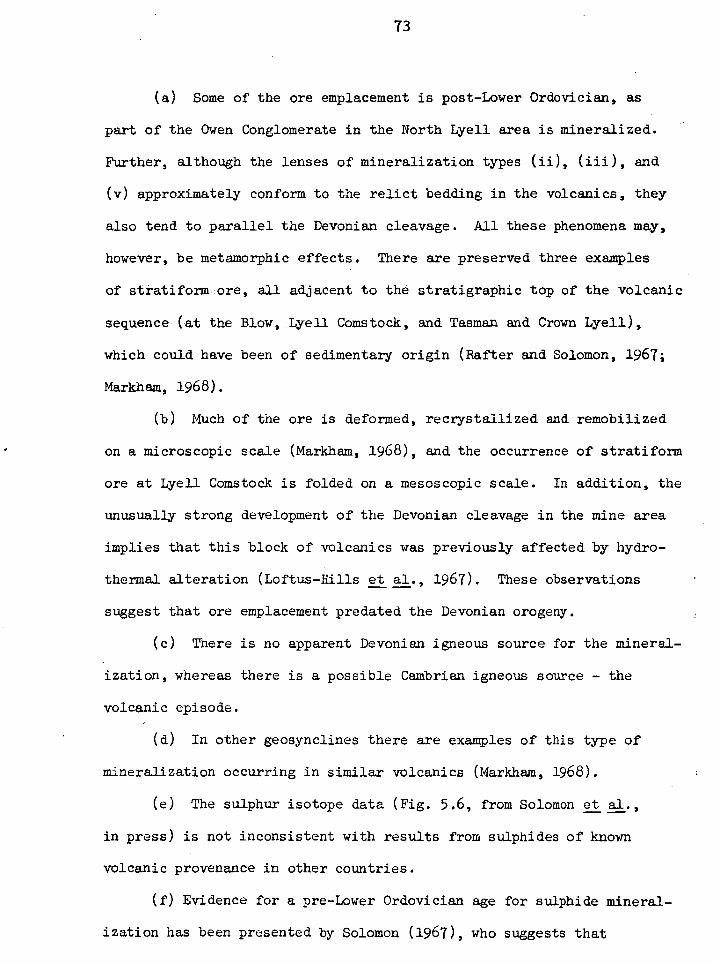
73
(a) Some of the ore emplacement is post-Lower Ordovician, as
part of the Owen Conglomerate in the North Lyell area is mineralized.
Further, although the lenses of mineralization types (ii), (iii), and
(v) approximately conform to the relict bedding in the volcanics, they
also tend to parallel the Devonian cleavage. All these phenomena may,
however, be metamorphic effects. There are preserved three examples
of stratiform ore, all adjacent to the stratigraphic top of the volcanic
sequence (at the Blow, Lyell Comstock, and Tasman and Crown Lyell),
which could have been of sedimentary origin (Rafter and Solomon, 1967;
Markham, 1968).
(b) Much of the ore is deformed, recrystallized and remobilized
on a microscopic scale (Markham, 1968), and the occurrence of stratiform
ore at Lyell Comstock is folded on a mesoscopic scale. In addition, the
unusually strong development of the Devonian cleavage in the mine area
implies that this block of volcanics was previously affected by hydro-
thermal alteration (Loftus-Bills et al., 1967). These observations
suggest that ore emplacement predated the Devonian orogeny.
(c) There is no apparent Devonian igneous source for the mineral-
ization, whereas there is a possible Cambrian igneous source - the
volcanic episode.
(d) In other geosynclines there are examples of this type of
mineralization occurring in similar volcanics (Markham, 1968).
(e) The sulphur isotope data (Fig. 5.6, from Solomon et al.,
in press) is not inconsistent with results from sulphides of known
volcanic provenance in other countries.
(f)Evidence for a pre-Lower Ordovician age for sulphide mineral-
ization has been presented by Solomon (1967), who suggests that
Figure 5.6
Distribution of S-isotope ratios (6S 34 per mil) from some
ores and sedimentary pyrites within the Mt. Read Volcanics;
from Solomon et al. (in press).
000 r.400
VIVI/
FREQUENCY SCALE
45 1 3 2 1
210 15
STIRLING VALLEY
0 0 0
110
ro- 7:7
15 10
-7
NEW NORTH MT. FARRELL o o+ x ++ x x++
5 0
MURCHISON
5 0
MT. LYELL
10 I21 071 315
40 30
25
20
• Barite Lode
FV rgrAV rgrAvg
grgarg AVM
F.g g WIC Wri1301313 fgrEIMIll•
ROSEBERY
40
35
Clue River nodules
25 20
15
10
HERCULES
FM I 1 35 30 20 15
1 I I RI 10 5 0
CI Pyrite
Chalcopyrite D Chalcocite Bornite IZ1 Barite El Barite Veins
0 Sphalerite Ell Galena in Mixed Sulphides,Steiner & Rafter (1966) El Pyrite in Siltstones
74
hematite bodies at the contact of the volcanics and the overlying Owen
Conglomerate could represent dehydrated Ordovician gossans.
It is apparent that there is considerable positive evidence for
a Cambrian volcanic origin for the ores.
The Rosebery and (essentially similar) Hercules ore bodies are
stratiform banded pyritic Zn-Pb-Cu ores of the Rammelsberg type. The
Rosebery lode occurs in a tuffaceous shale lens near the western margin
of the Mount Read Volcanics 20 miles north of Mount Lyell. The geology
has been summarized by Hall et al. (1953) and Hall at al. (1965).
The host rock shale of the orebodies (Fig. 5.7), which dips east
at about 45° , contains sedimentary pyrite (set 7). It is underlain by
altered and cleaved pyroclastic phases of the Mount Read Volcanics,
containing disseminated mineralization (set 25). Overlying the host
rock is a quartz- and carbonate-veined pyritic black shale (sets 5 and
6), followed by pyroclastics and massive lavas (set 26).
There are two spatially and compositionally distinct orebodies in
the mine - the banded pyrite-sphalerite-galena-chalcopyrite body, and
above it a banded stratiform barite-manganese carbonate orebody, with
some hematite-pyrite mineralization (set 107). Both are stratiform,
but the barite orebody is less continuous.
The origin of the ore is as problematical as for most similar
ores. At Rosebery the mineralization could be syngenetic with the
host rock shale, or epigenetic, either in the Cambrian (as a late •
volcanic episode) or in the Devonian. The present evidence pertaining
to genesis, much of which is due to Brathwaite (1967), is as follows:
Figure 5 .7
Geology of the Rosebery and Hercules deposits (after
mapping and compilation by Brathwaite). The grid is the
Tasmanian Transverse Mercator grid.
(a) Geological map of the Rosebery-Hercules area. For
detailed discussion of the problem of the relationship
between the Rosebery "Series" and the Mt. Read Volcanics,
see Loftus-Hills et al. (1967).
(b) Geological cross-section of the Rosebery Mine along
the line A-B in (a) above.
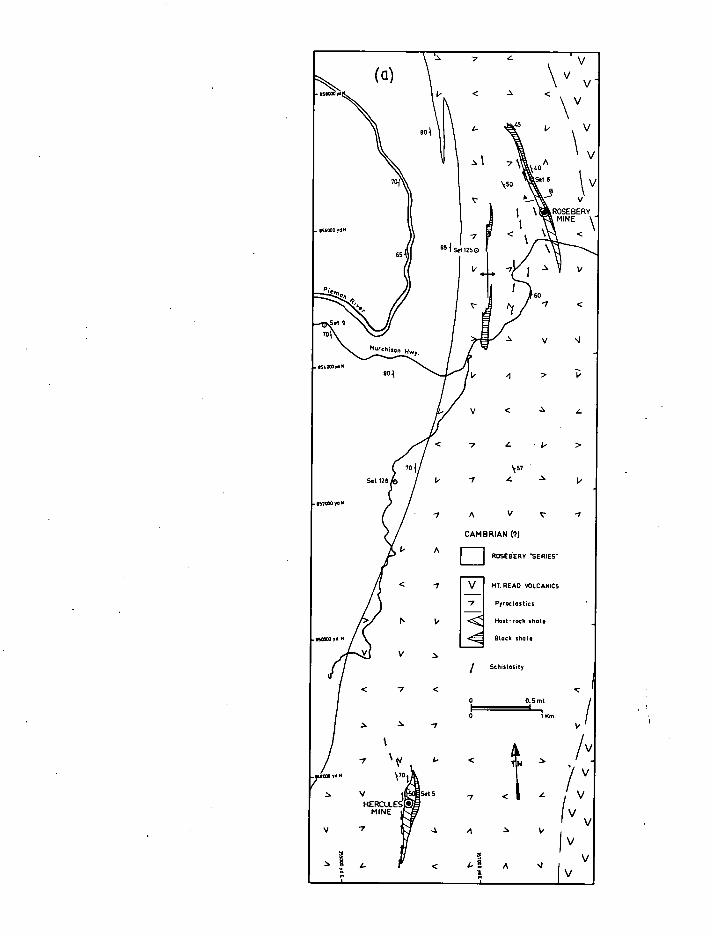
(a) 7 < V
\V v
< <
A
Sat 6
ROSE BERY MINE V
156000 Yd N
60
V
V
estoCOrsk
1
V < .1 4
'7 4 I/ >
\ Set 126 V
60.1
moor yo
A V 1
CAMBRIAN (7)
A ROSEBERY "SERIES"
MT. READ VOLCANICS
Pyroclostics
Host-rock shote
Black shale
V
ISchistosity
< 7 <
7 0 1Km.
0 0.5 mt
ss0X0p4 k
85 Set 1250
701
laCO) yd
V Set 5 4.
‘70 1
<
<
/V.
/ V
MINE VV
HERCULES 7
V 7 4 A V V
< a
Iv V
A Si
I V
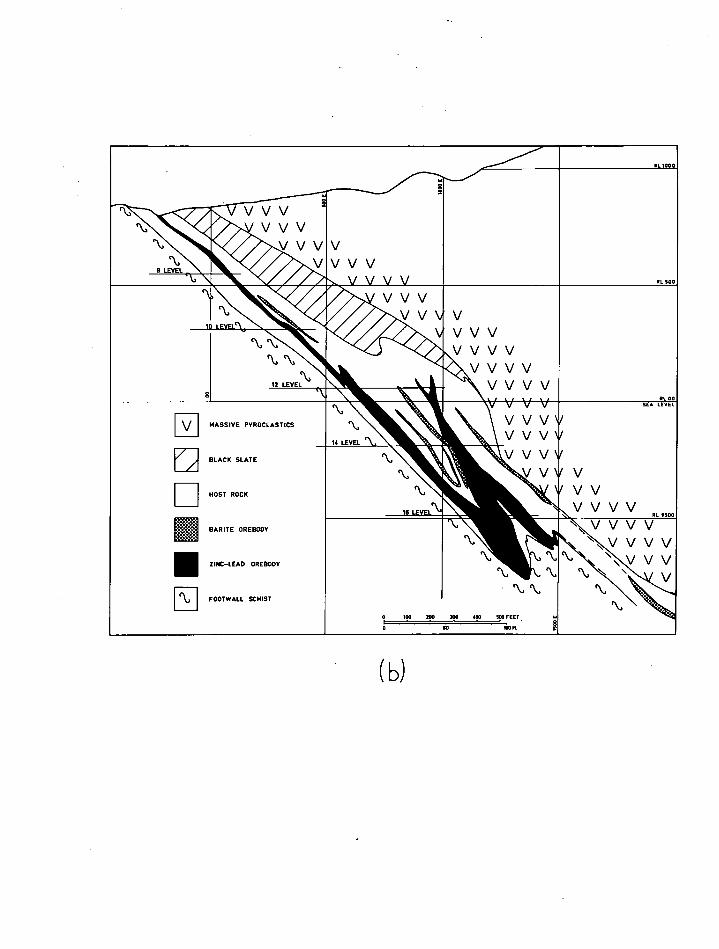
4
P\.., IIIII 11 LEVEL
V V V
V V V V ■
RI ¶000
;IL 500
2
V V V V
'\., A.._
10
'NV
■ LEVEL%
•P v v v v v v
VVVV
VVV V 01. 00
12 LEVEL
51 5 1 I 1 5.1
MASSIVE PYROCLASTICS ..k.o
14 LEVEL
\ SEA LEVEL
i
i
i V V
VVVV OIL 0$
V
KA
HOST ROCK
BARITE OREBODY
ZINC—LEAD OREBODY
FOOTWALL SCHIST
BLACK SLATE
10 LEVEL
- >..„ ?r.
•
o Ho mo
\
%
• % %
zoo um 0:0 FEET
00
\ V V V V \
N VVVV \
c\.. \ \tzttil
%
O so ow m.
(b)
75
(0 There is no outcropping Devonian source for the mineral-
ization, although there is undoubted Devonian mineralization within
two miles of the Rosebery Nine. However, volcanic emanations in the
Cambrian are another possible source for the metals.
(ii) The lodes were once believed to be en echelon (and due
to replacement), but are now known to be a single folded unit, locally
disrupted by shearing.
(iii)Fabric analysis indicates that although the Tabberabberan
cleavage, the host rock bedding, the ore-host rock contacts, and the
banding in the ore, are essentially coplanar, the last three of these
show an equally developed degree of preferred orientation, whereas
the cleavage shows a much higher degree of preferred orientation. This
suggests that the cleavage is independent of the other parameters,
which all appear to be related and to predate the cleavage.
(iv) In general the folding is much more intense in the ore than
in the wall-rocks, which are progressively less folded away from the
ore (Fig. 5.7b). This may be taken as evidence that the ore was em-
placed prior to Tabberabberan folding, and acted as an incompetent
medium during deformation.
(v) Despite the overall metamorphism of the ore, as shown by
crystalloblastic and deformation textures, there remain some framboidal
and colloform-like pyrite textures, and oolites occur in the associated
carbonate rocks.
(vi) Wall-rock sericitization and chloritization, and cleavage, -
are most strongly developed below the black shale horizon, and more
especially in the footwall of the mine. They are least developed in
the hangingwall, and away from the orebody.
76
(vii) The senior author in Hall et al. (1965) observed that an
undeformed basalt dyke in the mine was mineralized by galena and
chalcopyrite at its margins, and he deduced a post-Devonian orogeny,
epigenetic origin for the ore. However this occurrence is much better
explained as preferential rheomorphic mobilization during dyke emplace-
ment.
In summary, tlie evidence at present seems to favour a pre-
deformation origin for the ore, possibly by sedimentary processes syn-
genetic with host rock formation in the Cambrian, the ore solutions
having altered the country rock in their passage to the surface.
Two other occurrences of mineralization near the Rosebery Mine
were also sampled (Fig. 5.7a). In the footwall schist to the west of
the Rosebery Lode, a pyrite-galena-siderite-cassiterite vein occurs
at the Black P.A. Mine (set 125). The mineralogy of the ore suggests
it is related to the other Devonian fissure lodes of the region.
Further to the south, pyrite is disseminated in the Natone Volcanics,
a narrow band of tuff in the "Rosebery Series", which is the group of
sediments occurring immediately to the west of the margin of the Mount
Read Volcanics at Rosebery (Loftus-Hills eta].., 1967). There is no
geological avidence for the age of this pyrite.
At Tullah, 5 miles NE of Rosebery, on the opposite margin of the
Mount Read Volcanics, a steeply-dipping, probably overturned lens of
sediments (the "Farrell Slates") occurs in the Volcanics (Fig. 5.8).
This is intruded by a series of Pb-Ag-Cu fissure veins at the New North
Mt. Farrell Mine (set 124). Other smaller deposits occur nearby in
both the sediments and the adjacent Volcanics, and these have been
Figure 5.8
Geological map of the Tullah area (Mt. Farrell group of
mines), after Solomon and Brooks, in Hall and Solomon
(1962).
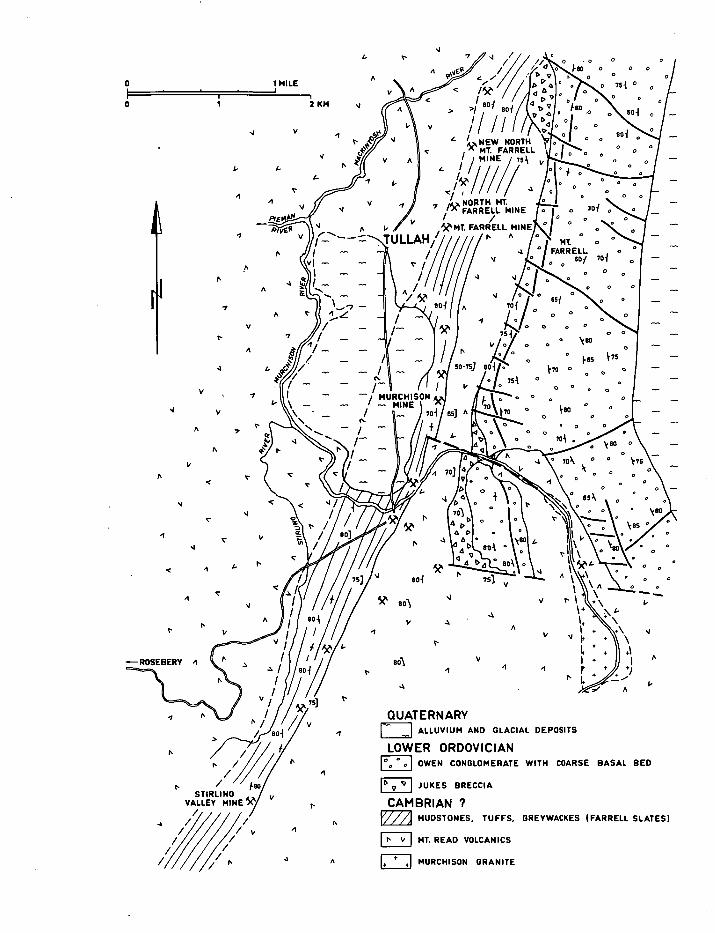
tea •
A
I - _I ALLUVIUM AND GLACIAL DEPOSITS
1 0 . . 01 OWEN CONGLOMERATE WITH COARSE BASAL BED
I ° Nr I JUKES BRECCIA
H vi
I+ + +I MT. READ VOLCANICS
MURCHISON GRANITE
4 0 V
A > >1
< G
r /
PR.' r. o
C. A
o * °
/ 0
e°1 801 4 t. V ho o v a o v
V V /I / / / D,
••■ 0 ° 0
c
I–
4 i 17 NEW NORTH
0
v V o ' * /, 'S MT. FARRELL 0 o o 0 0° oo
V A
o
k I/V ///// 4 a
. . 0 0
0 o o . °
o 0
( FARRELL MINE
-, /NORTH„,, I MT.
/
'X, Mt FARRELL MINE °
/ 0 i 0 .o .101 o
TULLAH/ r, A
/ V 4
/ o
/ •1 V
A / ,/ o / 5Z‘
8 ° A 70 0
7 0 v 0 o
0 o
N V o
o 0
7 . 0 \ 80
o
°° Fee V 75
so-753 801 o V70 0 . v o v 0 754 0 o
o o . A
o 0
80 0 o o 0
0
v I —
• 751 ° o
eo .I
1 MT. 0
o FARRELL
6” 701 o 0 0 0
•
-^
\ — -/
\ tj.
PS
MURCHISON — MINE
701 70 1.70 * ° 0
es] •
70]
701
1_ •
•
• • •
•
A eol 4
eol
O eol
V 4
75 A
A
• 5.
QUATERNARY
LOWER ORDOVICIAN
CAMBRIAN ? ffZ2] MUDSTONES, TUFFS, GREYWACKES (FARRELL SLATES)
1,
75]
A A
A
5.
A
A eo4
/ is
5. 75
V
■—ROSEBERY 4/
V I
N
80
/
eo STIRLING ‘,
VALLEY MINE )C PS
A
A
0 1MILE
0 1 12 KM
5.
V
c. 5.
Pre e0 mvEP
PS
—
/ —
4
/ — I / T.
° •
501 o
•
•
•
•
7
PS
V
77
sampled at the Zn-rich Murchison (set 123) and Stirling Valley (set 121)
Mines, and at the Tullah Ag-Pb Mine (set 122). All the mines at Tullah
are referred to as the Mt. Farrell group.
These ores have previously been grouped on the basis of their
mineralogy with the Devonian Pb-Ag-Zn ores at e.g. Zeehan, and assigned
a magmatic hydrothermal origin (Solomon, 1965b). Certainly some of the
ore has been emplaced later than the Devonian cleavage, but as Solomon
et al. (in press) have pointed out, certain characteristics suggest that
the ore might have been Cambrian, volcanic, and remobilized in the
Devonian:
(i) There is no obvious Devonian igneous source, whereas the ores
are associated with Cambrian volcanic rocks.
(ii) The sulphur isotope values are quite different from those in
the Pb-Ag-Zn ores at Zeehan, but are similar to those at Rosebery.
At the Magnet Mine, four miles west of Mt. Bischoff, a Pb-Ag-Zn
fissure vein system occurs within a complex zone of Cambrian pyroxenites t
spilites, and volcanic breccias (Solomon, 1964; Groves and Solomon,
1964). As there is little positive evidence for the age of the deposit,
the unlikely possibility that the ore is Cambrian has been investigated
by analyzing sphalerite for Se (set 118) and Cd (Appendix 2).
The only highly cobaltiferous Tasmanian mineral occurrence known
prior to this study (set 120) was at a Mo prospect at Mt. Remus, between
the Rosebery-TUllah and MOina areas (Nye, 1928; Stillwell, 1932).
Pyrite-molybdenite veins, some containing quartz, intrude Precambrian
schists, and seem to be related to an adjacent system of rnmifying acid
porphyry dykes. However, the age of these dykes is unknown, as they
78
could be intrusive phases either of the Cambrian volcanics, which out-
crop within half a mile, or of the Devonian Granite Tor granite, which
outcrops 51/2 miles to the south.
Major mineralization is associated with the Devonian granites
intruded after the Tabberabberan Orogeny. Intramagmatic cassiterite
and other sulphides occur in the Heemskirk Granite (sets 27-28) and in
some types of granite-in the north-east. There are several mineral
fields adjacent to granitic intrusions:
(a) East of the Heemskirk Granite is the Zeehan Pb-Ag field,
(sets 56-59) where the ore occupied fissures in Younger Precambrian to
Ordovician rocks. The field is mineralogically zoned with respect to
the source granite into cassiterite, pyritic, sidero-pyritic, and
sideritic groups (Park, 1955; Both and Williams, 1968). To the east of
Zeehan there is further Pb-Ag-Zn-Sb mineralization in the Dundas area
(sets 60-67).
(b) Three tin ore deposits occur north of Zeehan.. Renison Bell
is one mile from a granitic stock outcropping between the Heemskirk and
Meredith Granites; Cleveland is adjacent to the northern margin of the
Meredith Granite; and nearby Mt. Bischoff contains a porphyry dyke swarm
probably related to an apophysis of the Meredith Granite.
At Renison Bell and Mt. Bischoff (sets 30-55) the cassiterite-
pyrrhotite-pyrite ore occurs mainly in concordant replacement lenses,
particularly in dolomite (upper "Success Creek phase" and, at Renison
Bell, lower Crimson Creek Argillite), although there are associated vein
deposits (Gilfillan, 1965). The Mt. Bischoff area is mineralogically
zoned (Groves and Solomon, 1964; Groves, 1968) from central high-
T9
temperature pyrrhotite replacement Sn ore, to outer lower-temperature
pyritic vein Pb-Zn ore (see Chapter .6). At Cleveland (set 69) the
mineralogy is similar, with Sn-Cu replacement lodes strictly stratiform
in dolomitized Cambrian shales (Cox, 1968).
(c) Further to the north-east is the Hampshire Hills Granite.
A pyrite fissure vein in Cambrian (?) sediments associated with a por-
phyritic phase of this body has been sampled near Valentine's Peak
(set Ti).
(d) The Moina area, 30 miles east of Mt. Bischoff, contains several
small Devonian granites which have associated ores, as at the Shepherd
and Murphy Sn-W Mine (set 119) and the Round Hill Pb-Ag Mine (set 70),
both in Ordovician rocks. The Shepherd and Murphy samples are from con-
tact metamorphosed Gordon Limestone, and it is not certain whether they
represent recrystallized sedimentary pyrite or hypogene material,
although the latter origin is more likely.
(e) In the north-east of the island, the lodes adjacent to granites
are cassiterite-wolframite-quartz fissure veins in Mathinna Beds. At
Story's Creek (set 68) and Aberfoyle, the vein systems are truncated at
depth by the parent granites (Kingsbury, 1965).
The Au in quartz veins in Ordovician rocks and Mathinna Beds of the
north-eastern region (e.g. at Mathinna and Beaconsfield; Fig.5.3) are not
spatially related to outcrops of igneous rocks, but it is reasonably
assumed that they are genetically related to Devonian granites at depth.
.80
6. WALT, NICKEL, SELENIUM ANU CADMIUM 1h ORE MINERALS
In the first part of this Chapter, all the analyses are presented,
and the trends of trace-element concentrations for the ores of known
origin are discussed. The effect of depositional and post-depositional
variables on the dispersion of the trace elements in all the ores is
then examined in detail, so that some of the components of the overall .
trends can be established. It is then possible to evaluate the data
for the ores of uncertain origin, and to examine the possibility of
delineating metallogenic subprovinces.
All the analyses for Co, Ni and Se are presented in Table 6.1.
Analyses of Cd in sphalerite are listed in Appendix II.
TABLE 6.1
ANALYSES OF COBALT, NICKEL AND SELENIUM IN ORE MINERALS
This table contains half of the complete compilation available
in the Geology Department, University of Tasmania. Omitted here are
calculations of logarithms of analyses, Ni/Co ratios, original weights
of specimens, and full details of sample preparations. An example of
the omitted pages has been included in this table.
81
Arrangement of the Table
Sets
1. Mineral deposits of known age and (usually) origin:
(a) Sedimentary-diagenetic 1-17
(b) Precambrian and Cambrian, intramagmatic in
volcanics, granites, mafics and ultramafics 18-26
(c) Devonian intramagmatic and hydrothermal 27-71,
128-132
2. Other mineral deposits of uncertain origin:
(a) Mt. Lyell 72-95
(b) Rosebery -Hercules 96-117
(c) Magnet Mine 118
(d) Shepherd and Murphy Mine 119
(e)Mt. Remus prospect 120
(f) Tullah area mines (Mt. Farrell group) 121-124
(g) Other mineralization near Rosebery 125-126
(h) Lake George Mine, Captain's Flat, N.S.W. 127
Explanatory Notes
SAMPLE Numbers refer to powdered, concentrated samples taken from
specimens catalogued in the Geology Department, University of Tasmania,
except where stated otherwise.
The numbering system is as follows:
100121 PY 100122 PY
100124A PY 100124B PY
From two different specimens
From two different parts of the sane specimen
82
100125A PY 100125B CPY
100126A PY 100126A CPY
100127 PY 100127 CPY
From two different parts of the same specimen
Separated from the same sample of the specimen
Separated from the same sample of the specimen
MIN Mineral abbreviations: ASPY arsenopyrite
CA-R secondary carbonate, replacement
deposit
CA-V vein carbonate
CPY chalcopyrite
DOL primary dolomite
HM hematite
MG magnetite
MS marcasite
PO pyrrhotite
PO-M hand-magnet sensitive
PO-N not PO-M
PY pyrite
SL sphalerite
The mineral named refers to the powdered concentrate after sample
preparation, and is > 95% pure (in most cases > 99% pure) with respect
to ore minerals, except where stated otherwise.
CO1 Nil Co and Ni analyses in ppm. Concentrations in the mineral
calculated assuming none of the Co and Ni is in the acid-insoluble
residue.
CO2 N12 Co and Ni analyses in ppm. Concentrations calculated with
respect to the whole sample, including acid-insoluble residue.
83
SE Se analyses in ppm. Calculated concentration in the sulphide
component of the -sample.
SEM = Se ppm x 10 5 / S%. S calculated from the known proportion of
sulphide in the sample.
DS34 = 60 4 . Sulphur isotope' analyses performed for Dr. M. Solomon
and Mr. R.A. Both by Dr. T.A. Rafter (Institute of Nuclear Sciences,
D.S.I.R., New Zealand). Only those analyses are included here which
are of samples of specimens analyzed for Co-Ni and/or Se. Precision
is usually ± 0.1 per mil.
FT Diamond drillhole footage for core samples.
COMMENT This usually applies to the original specimen, except that
quoted analyses are of processed samples, thus:
PS Polished section grain-count analysis (> 400 points).
Percentage quoted is percentage of opaque minerals.
XRF X-ray fluorescence spectrograph analysis. Percentage quoted
is percentage of total sample.
preceding a comment : comment applies to all set samples until
next comment.
Compilation
The table was produced on an Elliot 503 computer, using an Algol
programme (U938,-3) written by B.D. Johnson to the author's specifications
The programme, explanatory flow chart, and original data are filed in
the Geology Department, University of Tasmania.
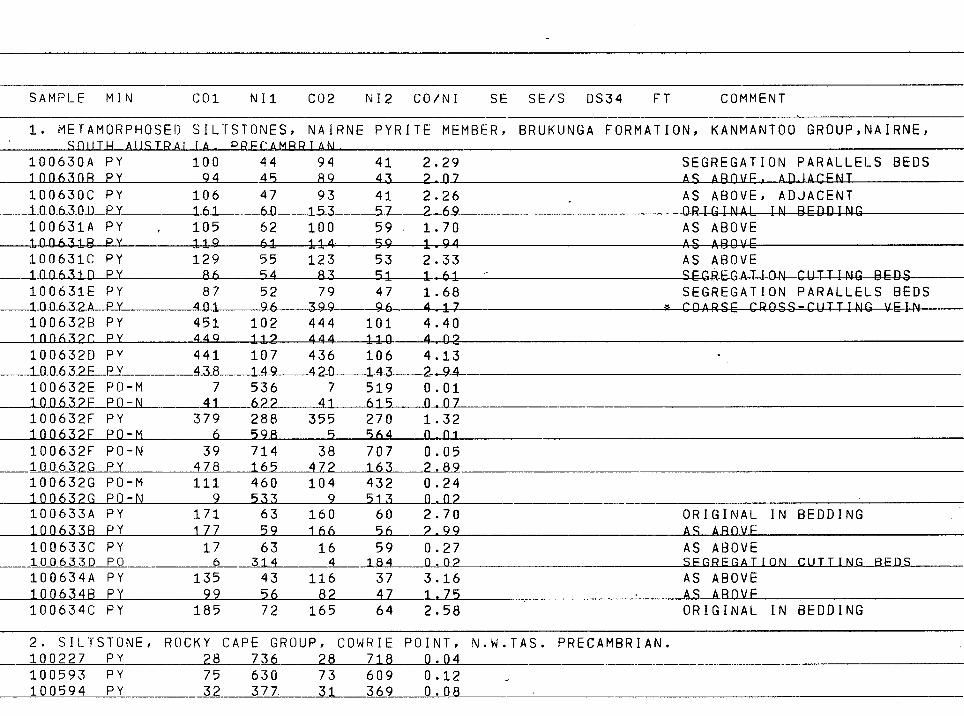
SAMPLE MIN CO1 Nil CO2 NI2 CO/NI SE SE/S DS34 FT COMMENT
1. METAMORPHOSED SILTSTONES, NAIRNE PYRITE MEMBER, SMITH AUSTRAL TA. PRFCAMBRIAN
BRUKUNGA FORMATION, KANMANTOO GROUP,NAIRNE,
100630A PY 100 44 94 41 2.29 SEGREGATION PARALLELS BEDS 100630R PY 94 45__ 89 43 2-07 AS ABOVE. ALJACENT 100630C PY 106 47 93 41 2.26 AS ABOVE, ADJACENT lan63op PY 161 60 153 _57 2 69 ORIGINAL IN BEDDING 100631A PY 105 62 100 59 1.70 AS ABOVE
____I11L.63113 PY 119 61 114 59 1.94 AS ABOVE 100631C PY 129 55 123 53 2.33 AS ABOVE
_10-16310 PY 86 54 83 51 1.61 SEGREGATION CUTTING BEDS 100631E PY 87 52 79 47 1.68 SEGREGATION PARALLELS BEDS 100622A PY 401 96 399 96 4.17 I _ 1006320 PY 451 102 444 101 4.40 100632r py 449 112 444 110 4.02 100632D PY 441 107 436 106 4.13 100-622F PY 438 149 421 143 _2-94 100632E PO-M 7 536 7 519 0.01 100632F P0-N
PY 41
379 02
288 41
355 615 ____O 07 270 1.32 100632F
100632F PO-M 6 598 5 564 0-0.1 100632F P0-N 39 714 38 707 0.05 100632G PY 478 165 472 163 2,89 100632G P0-M 111 460 104 432 0.24 100632G P0-N 9 533 9 513 n.112 100633A PY 171 63 160 60 2.70 ORIGINAL ININ BEDDING 1006330 PY 177 59 166 56 2.99 AS AR(IVF
100633C PY 17 63 16 59 0.27 AS ABOVE 1006330 PO 6 314 4 184 0.02 SFGRFGATION CUTTING AFDS
100634A PY 135 43 116 37 3.16 AS ABOVE 1006340 PY 99 56 82 47 1.75 AS AROVF 100634C PY 185 72 165 64 2.58 ORIGINAL IN BEDDING
2. SILTSTONE, 100227 PY
ROCKY 28
CAPE GROUP, 736 28
COWRIE 718
POINT, N.W.TAS. PRECAMBRIAN. 0.04
100593 PY 75 630 73 609 0.12 100594 PY 32 377 31 369 0.08
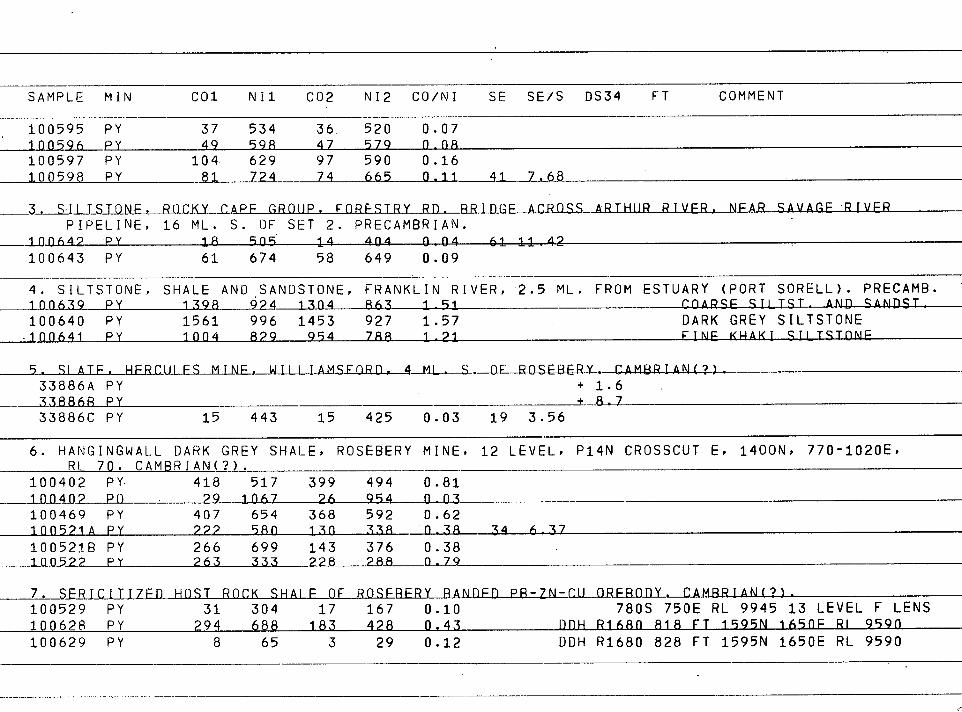
SAMPLE MIN CO1 NI1 CO2 NI2 CO/NI SE SE/S 0S34 FT COMMENT
100595 pY 100596 py 100597 PY 100598 py
37 534 36 520 0.07
49 598 47 579 n_n8
104 629 97 590 0.16
81 _124 74 665 0.11 41 7.68
RU PIPELINE, 16 ML. S. OF SET 2. PRECAMBRIAN.
_LOMA49 PY 18 505 14 404 0_04 100643 PY 61 674 58 649 0.09
1 • 8 •
4. SILTSTONE, SHALE AND SANDSTONE, FRANKLIN RIVER, 2.5 ML. FROM ESTUARY (PORT SORELL). PRECAMB.
110639 PY 1398 924 1304 863 1-51 rnAR
100640 PY 1561 996 1453 927 1.57 DARK GREY SILTSTONE .100641 PY 1004 829 954 788 1-21 FINE KHAKI SILTSTONP
5. SIATF, HFRcuips mINP. 15LI_LLIAMSFoRD.
33886A PY + 1.6
33886R PY + 8-7
33886C PY 15 443 15 425 0.03 19 3.56
6. HANGINGWALL DARK GREY SHALE, ROSEBERY MINE, 12 LEVEL, P14N CROSSCUT E, 1400N, 770 - 1020E, RL 70. CAMBRIAN(?).
100402 pY 100402 PO 100469 PY 100521A PY 1005219 PY 100522 PY
418 517 399 494 0.81
29 1067 26 954 0 03 407 654 368 592 0.62 222 5811 130 338 0-38 266 699 143 376 0.38 263 333 228 288 0.7
34 6-37
7. SERICITI7FILliaLT CH nREBOnY. CAMBRIAN(?). 100529 PY 31 304 17 167 0.10 780S 750E RL 9945 13 LEVEL F LENS
100628 PY 294 688 183 428 0.43 DOH R1680 818 FT 1595N 165nF RI 95911 100629 PY 8 65 3 29 0.12 DDH R1680 828 FT 1595N 1650E RL 9590
61 11_42
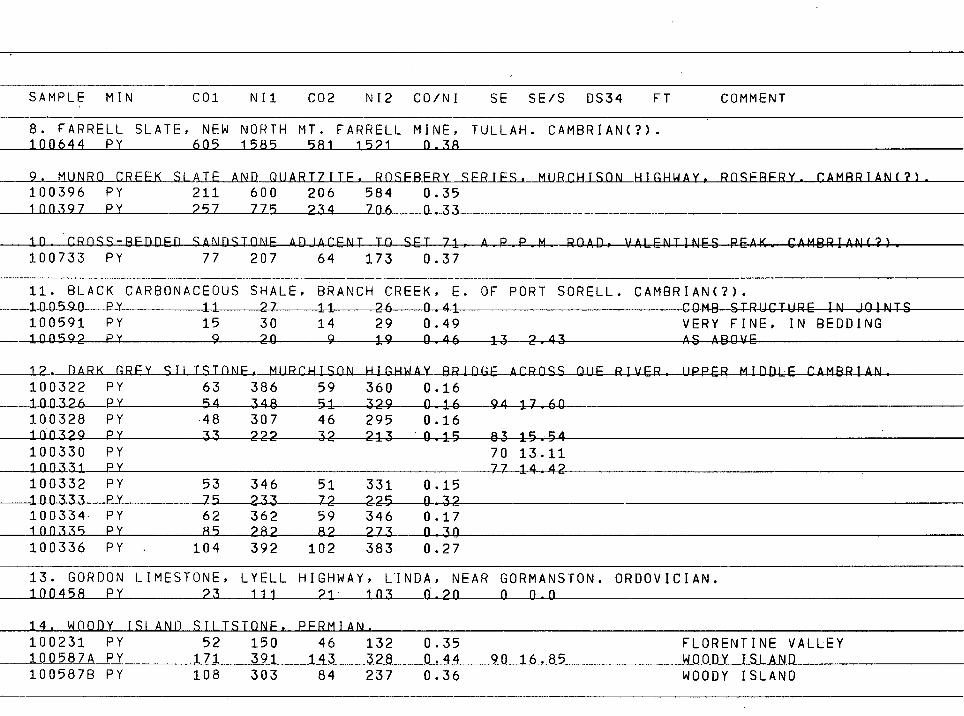
SAMPLE MIN CO1 Nil CO2 NI2 CO/NI SE SE/S DS34 FT COMMENT
8. FARRELL SLATE, NEW NORTH MT. FARRELL MINE, TULLAH. CAMBRIAN(?). 100644 PY 605 1585 581 1521 n 38
9. MUNRO CRFFK SLATE AND QUART7ITF. ROSEBFRY SFRIFS. MURCHISON HIGHWAY. ROSFRFRY. CAmRRIAN(?). 100396 PY 211 600 206 584 0.35 100.397 PY 257 775 234 706 0 33
10- CROSS-BEDDED SANUSTONLE ADJACENT TO SET 71, A.P.P.M. ROAD, VALENTINES PEAK. CAMBRIAN(?). 100733 PY 77 207 64 173 0.37
11. BLACK CARBONACEOUS SHALE, BRANCH CREEK, E. OF PORT SORELL. CAMBRIAN(?). 100590 PY
PY PY
11 15
9
27 30 20
11 14
9
26 0 '1 29 0.49 19 0.46 13
COMB STRUCTURE IN JOINTS VERY FINE, IN BEDDING
2.43 AS ABOVE
ACROSS QUE RIVER_ UPPER MIDDLE CAMBRIAN_
100591 100592
12.____D_ARKG_REy_ciiTSTONF, MURCHISON HIGHWAY_ BRIDGE 100322 PY 63 386 59 360 0.16 1-0_0326 PY 54 348 51 329 —0-46 94 17.60 100328 PY 48 307 46 295 0.16 100329 PY 33 222 32 213 0.15 83 15.54 100330 PY 70 13.11 100331 PY 77 14 42 100332 PY 53 346 51 331 0.15 10_0_333 PY 75 233 72 225 -4-32 100334 PY 62 362 59 346 0.17 1flfl335 PY 85 282 82 273 0-30
383 0.27 100336 PY . 104 392 102
13. GORDON LIMESTONE, LYELL HIGHWAY, LINDA, NEAR GORMANSTON. ORDOVICIAN. _1_0_0458 PY
14. WOODY ISI AND SIITSTONF, PFRMIAN 100231 PY 52 150 46 132 0.35 FLORENTINE VALLEY 100587A PY 171 391 143 328 0.44 90 1_6,85 WOODY 1St AND 100587B PY 108 303 84 237 0.36 WOODY ISLAND
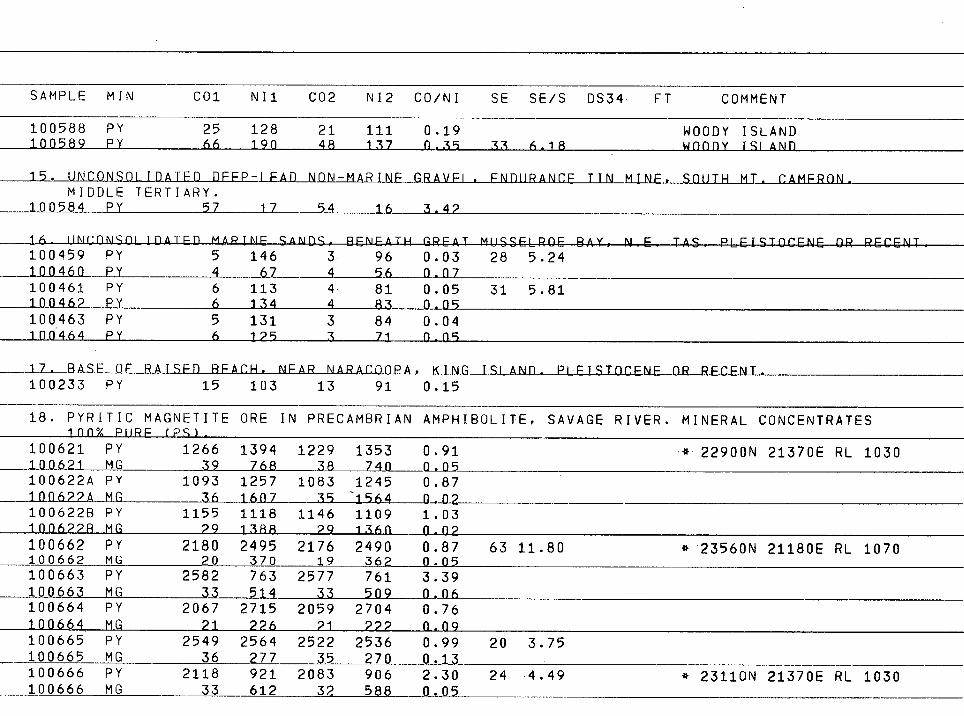
SAMPLE MIN CO1 Nil CO2 NI2 CO/NI SE SE/S DS34 FT COMMENT
100588 PY
25 128 21 111 0.19
WOODY ISLAND 100589 PY
66 190 48 137 0.39 33 6.18 wnnny tsIAND
15. UNCONSOI InATFD DFFP-I FAD NON-mARINF GRAvF1 ENDuRANrF TIN mINF. SOUTH MT. rAmFRON. MIDDLE TERTIARY.
PY 57 17 __54 3.42
k I 114.! k 4k1
100459 PY 146 3 96 0.03 28 5.24 _1_00460 PY 4 67 4 56 0_07
100461 PY 6 113 4 81 0.05 31 5.81 10462 PY 6 134 4 83 0.09
100463 PY 5 131 3 84 0.04 100464 py 6 125 3 71 0.0
17. RASF OF RAISFD BFAcH. PY 15 103
NFAR NARArnnpA,_ PI_E_I_SJL_CLEALE_IWL.EEXLEXT_. 13 91 0.15 100233
18. PYRITIC MAGNETITE 100% PHRF (PS).
ORE IN PRECAMBRIAN AMPHIBOLITE, SAVAGE RIVER. MINERAL CONCENTRATES
100621 PY 1266 1394 1229 1353 0.91 * 22900N 21370E RL 1030 11191621 MG 39 768 38 740 0-15 100622A PY 1093 1257 1083 1245 0.87 LE0622A MG 36 1607 35 1964 0 02 100622B Py 1155 1118 1146 1109 1.03 100622B MG 29 1388 29 1360 n.n2 100662 PY 2180 2495 2176 2490 0.87 63 11.80 * 23560N 21180E RL 1070 100662 MG 20 370 19 362 0.05 100663 PY 2582 763 2577 761 3.39 110663 MG 33 514 33 509 0.06 100664 PY 2067 2715 2059 2704 0.76 100664 MG 21 226 21 222 0.09 100665 PY 2549 2564 2522 2536 0.99 20 3.75 100665 MG 36 277 35 270 0.13 100666 PY 2118 921 2083 906 2.30 24 4.49 * 23110N 21370E RL 1030 100666 MG 33 612 32 588 0.05
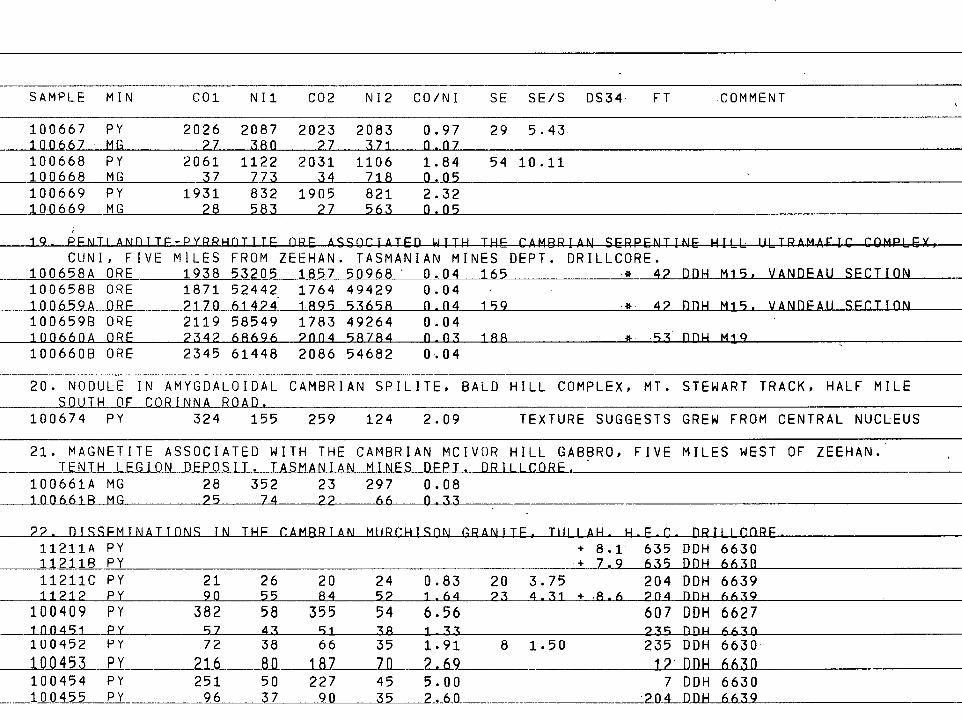
SAMPLE MIN CO1 NI1 CO2 NI2 CO/NI SE SE/S 0534 FT COMMENT
1871 52442, 2170 61424 2119 58549 2342 68696
2345 61448
1006588 ORE 100659A ORE 1006598 ORE 100660A ORE
1006608 ORE
1764 49429 0.04 1 . 895 53658 0.04 159 1783 49264 0.04 20(14 98784 0-03 188 2086 54682 0.04
* 42 DDH Mj5. VANDFAH SFCTI0N
* 93 nDH m19
100667 PY 100667 MG 100668 PY 100668 MG 100669 PY 100669 MG
2026 2087 2023 2083
27 380 27 371
2061 1122 2031 1106
37 773 34 718
1931 832 1905 821
28 583 27 563
0.97 29 5.43 0.07
1.84 54 10.11 0.05 2.32 0.05
PPNTLAmniTE-pypplAnTITE ORE ASSOCIATED WITH THE CAMBRIAN SERPENTINE HILL ULTRAMAFIC COMPLEX, CUNI, FIVE MILES FROM ZEEHAN. TASMANIAN MINES DEPT. DRILLCORE.
100658A ORE 1938 53205 1857 50968 ' 0.04 165 * 42 DDH M15, VANDFAU SFCTION
20. NODULE IN AMYGDALOIDAL CAMBRIAN SPILITE, BALD HILL COMPLEX, MT. STEWART TRACK, HALF MILE SOUTH OF CnRINNA
PY 324 ROAD.
155 259 124 2.09 TEXTURE SUGGESTS GREW FROM CENTRAL NUCLEUS 100674
21. MAGNETITE ASSOCIATED WITH THE TENTH LEGION DEPOSIT. TASMANIAN
CAMBRIAN MCIVOR HILL GABBRO, MINES DFPT. DRILLcoRE.
FIVE MILES WEST OF ZEEHAN.
100661A MG 28 352 23 297 0.08 LaafihiR MO 25 74 22 66 0-13
11211A PY + 8.1 635 DDH 6630 112118 PY + 7.9 635 DDH 6630 11211C PY 21 26 20 24 0.83 20 3.75 204 DDH 6639 11212 PY 90 55 84 52 1.64 23 4.31 + 8.6 204 nnH 6639
100409 PY 382 58 355 54 6.56 607 DDH 6627 1'10491 PY 97 43 91 38 1-33 235 DDw 6630 100452 PY 72 38 66 35 1.91 8 1.50 235 DDH 6630
110453 PY 216 80 187 _TO 2&9 12 DDH 6630 100454 PY 251 50 227 45 5.00 7 DDH 6630 100455 PY 96 37 90 35 2 ,60 .204 OnH 6639
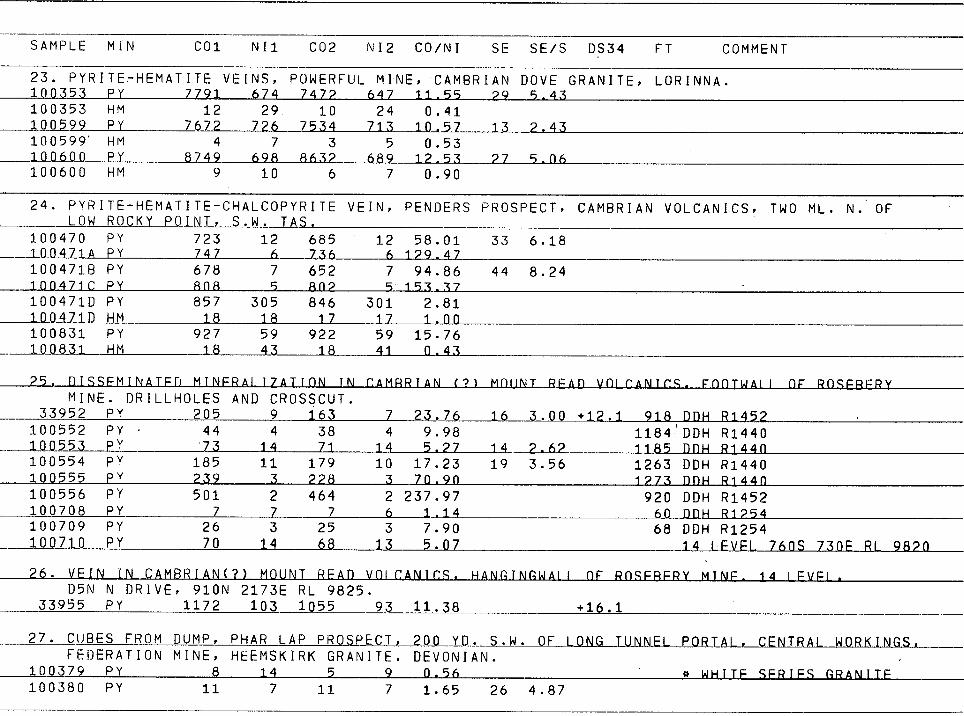
SAMPLE MIN CO1 Nil CO2 NI2 CO/NI SE SE/S DS34 FT COMMENT
23. PYRITE.-HEMATITE 100353 PY 7791
VEINS, 674
POWERFUL 7472
MINE, CAMBRIAN 647 11.55 29
DOVE GRANITE, LORINNA. 5 43
100353 HM 12 29 10 24 0.41 100599 PY 7672 726 7534 713 10.57 13 2.43 100599 HM 4 7 3 5 0.53 100_690 PY 8749 698 8632 689 12 53 27 5 06 100600 HM 9 10 6 7 0.90
24. PYRITE - HEMATITE-CHALCOPYRITE LOW ROCKY POINT, S.W. LAS.
VEIN, PENDERS PROSPECT, CAMBRIAN VOLCANICS, TWO ML. N. OF
100470 PY 723 12 685 12 58.01 33 6.18 100471A PY 747 6 736 6 129.47 1004718 PY 678 7 652 7 94.86 44 8.24 100471C PY 8118 5 802 5 153.37 1004710 PY 857 305 846 301 2.81 100471D HM 18 18 17 17 1.00 100831 PY 927 59 922 59 15.76
_100831 HM 18 43 18 41 0.43
25. OISSFMINATFD MINFRAI IZATION IN CAMBRIAN (7) mnuNT RPAD vnIcANIcs. FooTwAll (IF RnsEBERy MINE. DRILLHOLES AND CROSSCUT.
33952 PY 205 9 163 7 23_,_26 16 3.00 +12.1 918 DDH R1452 100552 PY 44 4 38 4 9.98 1184'DDH R1440 100553 PY 73 14 71 14 5.27 14 2.62 1185 ODH Rj44n 100554 PY 185 11 179 10 17.23 19 3.56 1263 DDH R1440 100555 PY 239 3 228 3 70.90 1273 DDH R1440 100556 PY 501 2 464 2 237.97 920 DDH R1452 100708 PY 7 7 7 6 1.14 60 ODH R1254 100709 PY 26 3 25 3 7.90 68 DDH R1254 100710 PY 70 14 68 13 5.07 14 I FVFL 76nS 730F RI 9820
26. VEIN IN CAMBRIAN(?) MOUNT RFAn VOICANICS. HANGINnwAII OF RDSFRFRY MINE. 14 IFVEI . D5N N DRIVE, 910N 2173E RL 9825.
33955 PY 1172 103 1055 93 11.38 +16.1
27. CUBES FROM DUMP, PHAR LAP PROSPECT, _OF LONG TUNNEL PORTAL, CELTRAL_WaRlillslaS_,_ FEDERATION MINE, HEEMSKIRK GRANITE. DEVONIAN.
100379 PY 8 14 5 9 0.56 * wHITF SFRIFS GRANITF 100380 PY 11 7 11 7 1.65 26 4.87
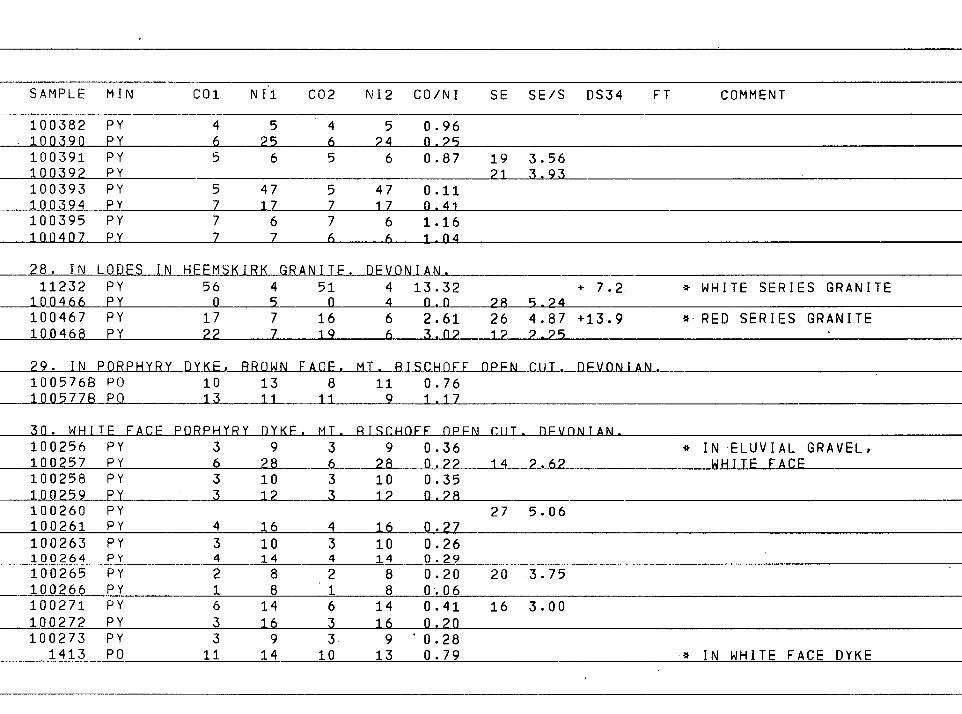
SAMPLE MIN CO1 NIl CO2 NI2 CO/NI SE SE/S DS34 FT COMMENT
100382 PY 4 5 4 5 0.96 100390 PY 6 25 24 0.25 100391 PY 5 6 5 6 0.87 100392 PY
19 21
3.56 3.93
100393 PY 47 47 0.11 II •
100395 PY 1.16 100407 PY 7 7 6 6 1-04
28. IN LODES IN HEEMSKIRK GRANITF. DEYDNIAN
11232 PY 56 4 51 4 13.32
100466 PY 0 5 n 4 0.0
100467 PY 17 7 16 6 2.61
100468 PY 2? 7 19 6 3.02
28 26 12
5.24 4.87 2.25
+ 7.2
+13.9
*
*
WHITE SERIES GRANITE
RED SERIES GRANITE
2.2_1__INEaftEELLYDfhtaiEIED_W_K_LALE,d_L-_aISC_HOFF OPEN Cul- OFVONIAN 1005768 100577B
PO PO
10 13
13 11
8 11
11 9
0.76 1.17
30. WHITF FACE PORPHYRY nYKF. MT. RISCHOFF OPEN CUT. DFVONTAN.
100256 PY 3 9 3 9 0.36 * IN ELUVIAL GRAVEL, 100257 PY 6 28 6 28 0.22 142.62 WHITE FACE 100258 PY 3 10 3 10 0.35 1_00259 PY 3 12 3 12 0.28 100260 PY 27 5.06 100261 PY 4 16 4 16 0.27 100263 PY 3 10 3 10 0.26 100264 PY 4 14 4 14 0.29 100265 PY 2 8 2 8 0.20 20 3.75 100266 PY 1 8 1 8 0.06 100271 PY 6 14 6 14 0.41 16 3.00 100272 PY 3 16 3 16 0.20 100273 PY 3 9 3 9 '0.28
1413 PO 11 14 10 13 0.79 * IN WHITE FACE DYKE
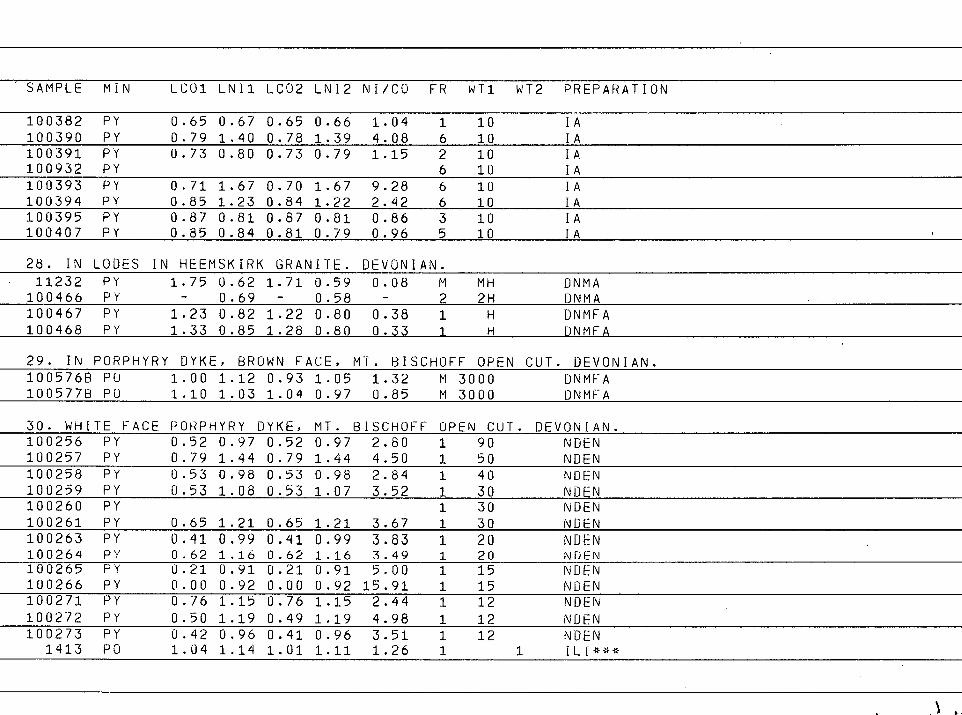
SAMPLE MIN LC01 LNI1 LCO2 LNI2 NI/CO FR wT1 WT2 PREPARATION
100382 PY 100390 PY 100391 PY 100932 PY
100393 PY 100394 PY 100395 PY 100407 PY
0.65 0.67 0.65 0.66 1.04 1 10
0.79 1.40 0.78 1.39 4.08 6 10
0.73 0.80 0.73 0.79 1.15 2 10 6 10
0.71 1.67 0.70 1.67 9.28 6 10
0.85 1.23 0.84 1.22 2.42 6 10
0.87 0.81 0.87 0.81 0.86 3 10
0.85 0.84 0.81 0.79 0.96 5 10
IA IA IA IA IA IA IA IA
28. IN LODES IN HEEMSKIRK GRANITE. DEVONIAN.
11232 PY 1.75 0.62 1.71 0.59 0.08 M MH ONMA
100466 PY - 0.69 - 0.58 - 2 2H DNMA
100467 PY 1.23 0.82 1.22 0.80 0.38 1 H DNMFA
100468 PY 1.33 0.85 1.28 0.80 0.33 1 H ONmFA
29. IN PORPHYRY DYKE, BROWN FACE, MT. BISCHOFF OPEN CUT. DEVONIAN. 100576B PO 1.00 1.12 0.93 1.05 1.32 M 3000 DNMFA 1005778 PO 1.10 1.03 1.04 0.97 0.85 M 3000 DNMFA
30. WHITE FACE PORPHYRY DYKE, MT. BISCHOFF OPEN CUT. DEVONIAN.
100256 PY 0.52 0.97 0.52 0.97 2.80 1 90 NDEN
100257 PY 0.79 1.44 0.79 1.44 4.50 1 50 NDEN
100258 PY 0.53 0.98 0.53 0.98 2.84 1 40 NDEN
100259 PY 0.53 1.08 0.53 1.07 3.52 1 30 NDEN
100260 PY 1 30 NDEN
100261 PY 0.65 1.21 0.65 1.21 3.67 1 30 NDEN
100263 PY 0.41 0.99 0.41 0.99 3.83 1 20 NDEN
100264 PY 0.62 1.16 0.62 1.16 3.49 1 20 NDEN
100265 PY 0.21 0.91 0.21 0.91 5.00 1 15 NDEN
100266 PY 0.00 0.92 0.00 0.92 15.91 1 15 NDEN
100271 PY 0.76 1.15 0.76 1.15 2.44 1 12 NDEN
100272 PY 0.50 1.19 0.49 1.19 4.98 1 12 NDEN
100273 PY 0.42 0.96 0.41 0.96 3.51 1 12 NDEN
1413 PO 1.04 1.14 1.01 1.11 1.26 1 1 ILI***
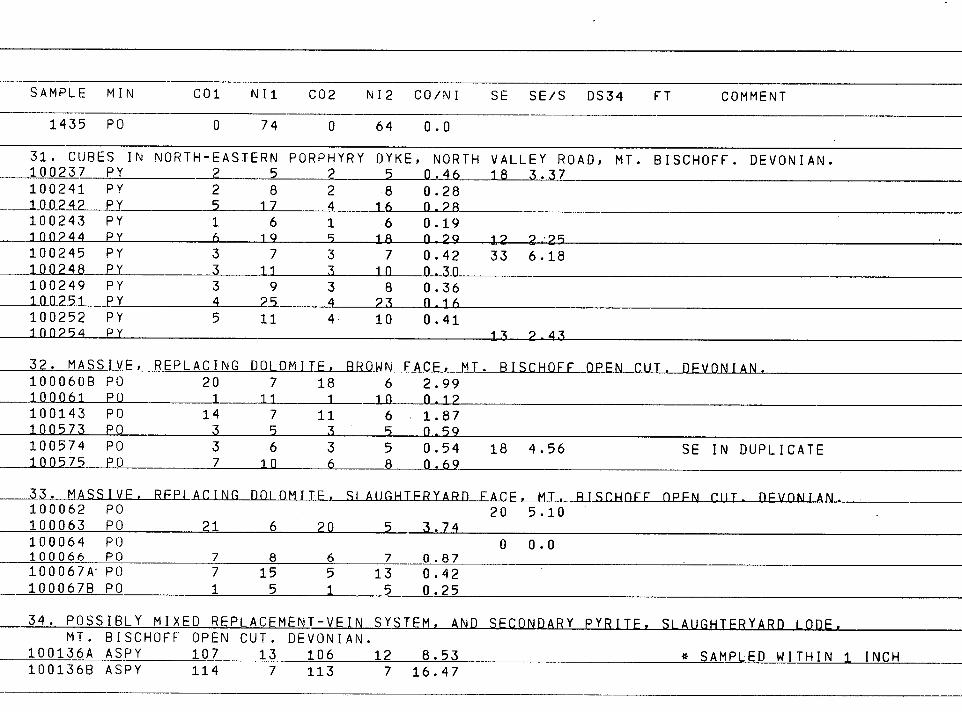
* SAMPLED WITHIN 1 INCH MT. BISCHOFF OPEN CUT. DEVONIAN.
100136A ASPy 107 13 106 12 8.53 100136B ASPy 114 7 113 7 16.47
SAMPLE MIN CO1 Nil c02 N12 CO/NI SE SE/S DS34 FT COMMENT
1435 PO 0 74 0 64 0.0
31. CUBES IN 100237 Py
NORTH-EASTERN PORPHYRY DYKE, NORTH 2 5 2 5 0.46
VALLEY ROAD, MT. 18 3.37
BISCHOFF. DEVONIAN.
100241 Py 2 8 2 8 0.28 100242 PY 5 17 4 16 0.28 100243 PY 1 6 1 6 0.19 100244 py 6 19 5 18 0-2 9 12 2 25 100245 PY 3 7 3 7 0.42 33 6.18 100248 PY 3 11 3 10 0.30 100249 py 3 9 3 8 0.36 10_0251 PY 4 25 4 23 0-16 100252 PY 5 11 4 10 0.41 100254 py 13 2-43
32. MASSIVE, REPLACING DOLOMITE, BROWN FAC_ Its F I" I Ilk 11
100060B PO 20 7 18 6 2.99 100061 po 1 i_i 1 10 n 12 100143 PO 14 7 11 6 1.87 100573 PO 3 5 3 5 0.59 100574 PO 3 6 3 5 0.54 18 4.56 SE IN DUPLICATE 1011575 PO 7 10 •6 8 0.69
33. MASSIVF. RFPIACING 0010MITF. SIAUGHTFRYARD FACE. MT. RISCHCFF nPFN CUT. DEVONIAN. 100062 PO 20 5.10 100063 PO 21 6 20 5 3.74 100064 PO 0 0.0 100066 PO 7 8 6 7 0.87 100067A - PO 7 15 5 13 0.42 100067B PO 1 5 1 5 0.25
34. POSSIBLY MIXED REPLACEMENT-VEIN SYSTEM, AND SECONDARY PYRITE, SIAUGHTFRYARD LODE.
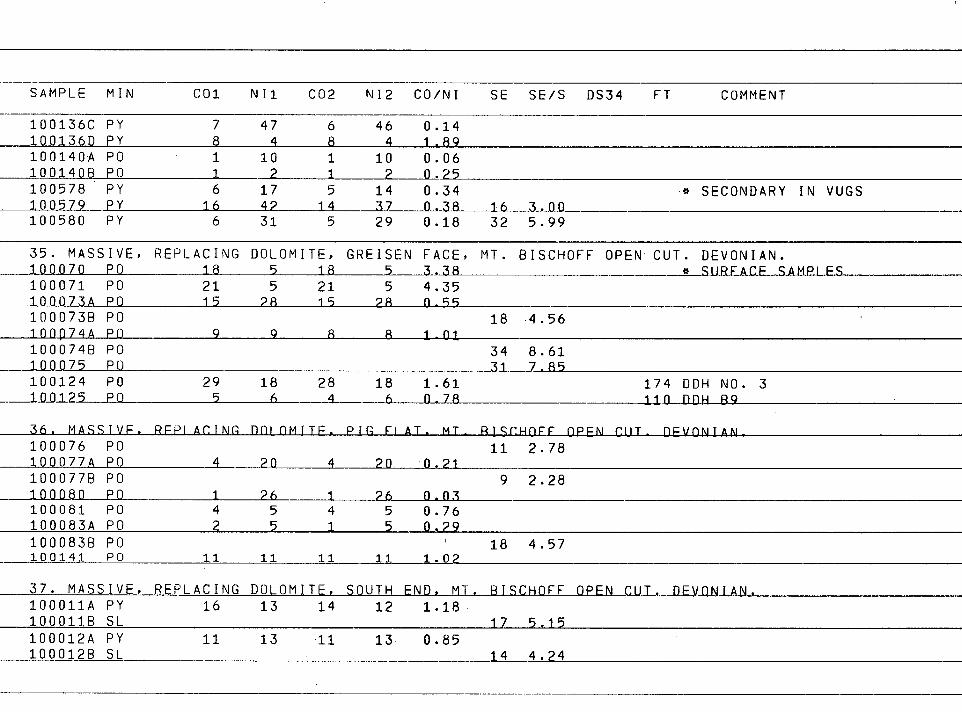
SAMPLE MIN CO1 NI1 CO2 NI2 CO/NI SE SE/S DS34 FT COMMENT
100136C PY 7 47 6 46 0.14 1001360 PY 8 4 8 4 1.89 100140A PO 1 10 1 10 0.06 1001408 PO 1 2 1 2 0.25 100578 PY 6 17 5 14 0.34 * SECONDARY IN VUGS 1_0_0579 PY 16 42 14 37 0 38 16 3.011 100580 PY 6 31 5 29 0.18 32 5.99
35. MASSIVE, REPLACING DOLOMITE, GREISEN FACE, MT. BISCHOFF OPEN CUT. DEVONIAN. 10_0070 PO 18 5 18 5 3..38 * SHRFACP SAMPLFS 100071 PO 21 5 21 5 4.35 100073A PO 15 28 15 28 0-55 100073B PO 18 4.56 100074A PO 9 9 8 8 1-01 1000748 PO 34 8.61 100075 PO 31 7 85 100124 PO 29 18 28 18 1.61 174 DDH NO. 3 _1120_1_25 PO 5 6 4 6 0-78 110 DDH 89
36. MASSIVF. RFPIACING nnintirTp. pin FLAT, MT - BISCHOFF OPEN CUT- DEVONIAN 100076 PO 11 2.78 100077A PO 4 20 4 20 0. 21
100077B PO 9 2.28 100080 PO 1 26 1 26 n 03 100081 PO 4 5 4 5 0.76 100083A PO 2 5 1 5 0.29 100083B PO 18 4.57 100141 PO 11 11 11 11 1.02
37. MASSIVE, REPLACING DOLOMITE, SOUTH END, MT. BISCHOFF OPEN CUT. DEVONIAN. 100011A PY 16 13 14 12 1.18 100011B SL 17 5.15 100012A PY 11 13 11 13 0.85 100012B SL 1A__4.24
SAMPLE MIN CO1 NI1 CO2 NI2 CO/NI SE SE/S DS34 FT COMMENT
100146 pY
1 5 1 5 0.23 100152 PY
6 5 6 5 1.09
38. MASSIVE, PROBABLY MIXED REPLACEMENT—VEIN SYSTEM, HAPPY VALLEY, MT. RISCHOFF OPEN CUT. DEVONIAN.
100679 py 13 16 13 16 0.81 100680 PY 6 20 6 20 0.32 1006814 PO 2 25 2 29 0 - 09 100681B Py ,210 43 209 43 4.88 1006818 PO 2 13 2 13 0,17 100682 py 14 44 14 44 0.32
1 11 1 11 0.10
39. VFTNS. IN ORTIIHOLFS. RRnwN FACP. MT- BLSCHoFF OPEN CUT DEVONIAN_ 100795A PO 2 75 2 73 0.02 270 DDH 850 1007958 PO 4 82 4 82 0.0c5
100796 PO 22 56 21 52 0.40 270 DDH 850 1007984 ASpy 209 134 205 131 1-96 60 DDH 852 1007988 ASpy 207 137 204 135 1.51 1008134 PY 18 28 17 28 0 - 62 DOH 8 5 7 1008138 Py 14 26 14 25 0.54
40. VEINS IN PORPHYRY (CF. SET 29), BROWN FACE, MT. BISCHOFF OPEN CUT. DEVONIAN. 1005764 PY 11 51 11 48 a 22_23_ 5.82 100577A PY 10 46 9 44 0.21
41. VEIN IN WHITE FACE PORPHYRY DYKE, IN GREISEN FACE DRILLHOLE, MT. BISCHOFF OPEN CUT. DEVONIAN.
100126 PY 13 8 13 8 1.65 589 DDH B9
42. VEIN, IN DRILLHOLE, GREISEN FACE, MT. BISCHOFF OPEN CUT. DEVONIAN. 1001274 PO 7 92 7 92 0.08 723 nnH R9 1001278 PO 7 109 7 108 0.07 100127C PO 5 71 5 69 0.07 1001270 PO 9 87 9 85 0.11
SAMPLE MIN . CO1 Nil CO2 NI2 CO/NI SE SE/S DS34 FT COMMENT
43. VEIN, GIBLIN LODE, SW. CORNER, MT. BISCHOFF OPEN CUT. DEVONIAN. 100703 PY 82 168 79 161 0.49 100704 PY 73 142 72 139 0.52
44. VEIN, IN DRILLHOLE, NEAR DON HILL, S. OF MT. BISCHOFF OPEN CUT. DEVONIAN. 100793A PY 4 15 4 15 0.26 1007938 PY 5 15 5 15 0.33
45. VEIN, THOMPSONS LODE, SW. OF MT. BISCHOFF OPEN CUT. DEVONIAN. 100017 SL 11 3.33
DISBFMINATFD IN CARHONATF
46-1LE_IIL,_AILLLttaLLAL_LILDI. TINSToNF CRFFK, SW OF MT. BISCHOFF OPEN CUT DEVONIAN-100027 SL 22 6.67 MASSIVE 100028 SL o 0-0 MASSIVE 100705 PY 2 9 2 9 0.25 100706 PY 3 9 3 8 0 41 100707 PY 3 4 3 4 0.76
47.VEIN, SILVER CLIFFS MINE, W. OF MT. BISCHOFF OPEN CUT. DEVONIAN. 100029 SI 9 2 27 100030 SL 9 2.27
48. VEIN, FOOKS LODE, SE. OF MT. BISCHOFF OPEN CUT. DEVONIAN. 100013 SL 17_ 5 15 MASSIVF
100015 SL 12 3.64 MASSIVE 100699 py 2 13 2 13 0.18 ACICHIAR IN OHART7
100700 PY 2 27 2 26 0.06 DISSEMINATED IN QUARTZ 100701 PY 36 37 33 34 0.97 WITH SL IN QUARTZ 100702 PY 70 103 69 101 0.68 WITH CARBONATE
49. VEIN, NORTH VALLEY LODE, N. OF MT. BISCHOFF OPEN CUT. DEVONIAN. 100009 SL 11 3.33 100010 SL 19 5.76 100675 PY 100 82 94 77 1.21 100676 PY 7 74 7 72 0.10
SAMPLE MIN CO1 Nil CO2 NI2 CO/NI SE SE/S DS34 FT COMMENT
100677 PY 57 66 40 47 0.86 100678 PY 23 34 21 30 0.70
50. VEIN, N. OF WARATAH RrvFR, N, OF MT. RISCHOFF OPFN CUT DEVONIAN. FOR FURTHER MT. BISCHOFF RESULTS SEE SET 129 ETC.
100162 PY 2 16 2 16 0.12 RANDFO PY-SI-CARRONATE
51. MASSIVE, REPH4CEMENT. RATTFRy wORKTNnS. RENTSnm 8E11 AlEvONIAN. 100023 100024
SL SL
11 20
3.33 6.06
100026 SL 4 1.21
52. MASSIVE, REPLACEMENT, NO. 1 HORIZON, BATTERY WORKINGS, RENISON BELL. DEVONIAN. 100118A PO 10 15 9 14 n 68 1001180 PO 10 18 10 17 0 58 1001180 PO 36 9.16 100120A PY 23 25 22 24 0.90 100120A PO 5 17 5 17 0.31 1001208 PY 28 28 28 27 1.01 in01211A PO 3 13 3 12 0.21 100121A PO 14 3.56 1001218 PY 35 52 34 51 0.67 1001210 PY 53 51 52 50 1.04
___10J11210 PO 1 11 1 11 n as 100121E PO 1 14 1 13 0.08 100121F PO 1 13 1 12 0.04 100123A PO 11 2.80 100123c p0 11 0 lo 0.0
53. MASSIVE, REPLACEMENT, NO.2 HORIZON, BATTERY WORKINGS. RFNISON RFII . DEVONIAN. 10901A
109018
PO PO
2 0.51 + ejj
19797A 197978
PY PY
65 134
30 41
64
132 30 40
2.13 3.32
197970 PY 139 28 139 28 5.00
SAMPLE MIN CO1 Nil CO2 NI2 CO/NI SE SE/S DS34 FT COMMENT
197970 PY 138 46 137 45 3.03 14 2.62 19797F PY 27 5 06 19797F PO 3 14 3 13 0.20 19797G PO 3 3 3 3 0.98 19797H PO 3 10 3 10 0.33 197971 PO 3 6 3 6 0.44 19797J PO 14 3.56
100093A PO 0 0-0 1000938 PO 6 14 6 13 0.43 100095A PO 0 0.0 1000958 PO 53 7 50 7 7.36 1000950 ASPY 103 5 96 5 19.87 100096 PO 7 9 6 9 0.74 100097A PO 18 4.58 1000978 PO 28 19 26 18 1.47 100099 PO 22 6 22 6 1.44
5_4. OISSFMINATFD IN QUARTZ GANGUF. NO 6 CROSSCUT, FPDFRAI lOoP. RFNSTON RPII OFVoN1AN 100102A 1001 020
PO PO
7
8
59
57 7 8
56 54
0.13 0.15
100104A PO 15 86 14 81 0.17 1001048 PO 15 93 14 88 0,1_6 100105 PO 21 103 19 95 0.20 100107 PO 36 105 33 94 0.35 18_4-58 100108A PO 12 111 12 109 0.11 1001088 PO 12 107 11 105 0.11 100108C PO 18 4.58 100115A PO 62 95 53 81 0.65 1001158 PO 7 1.78
55. VEIN TRANSECTING AND PROBABLY REPLACING SHALE. BATTERY OPEN CUT, RENISON BELL. DEVONIAN. 100284 PY 2 28 2 28 0.013 18 3.37 * vPIN 100291 PY 16 35 15 33 0.45 15 2.83 100292 PY 14 25 13 25 0.54 20 3_,15
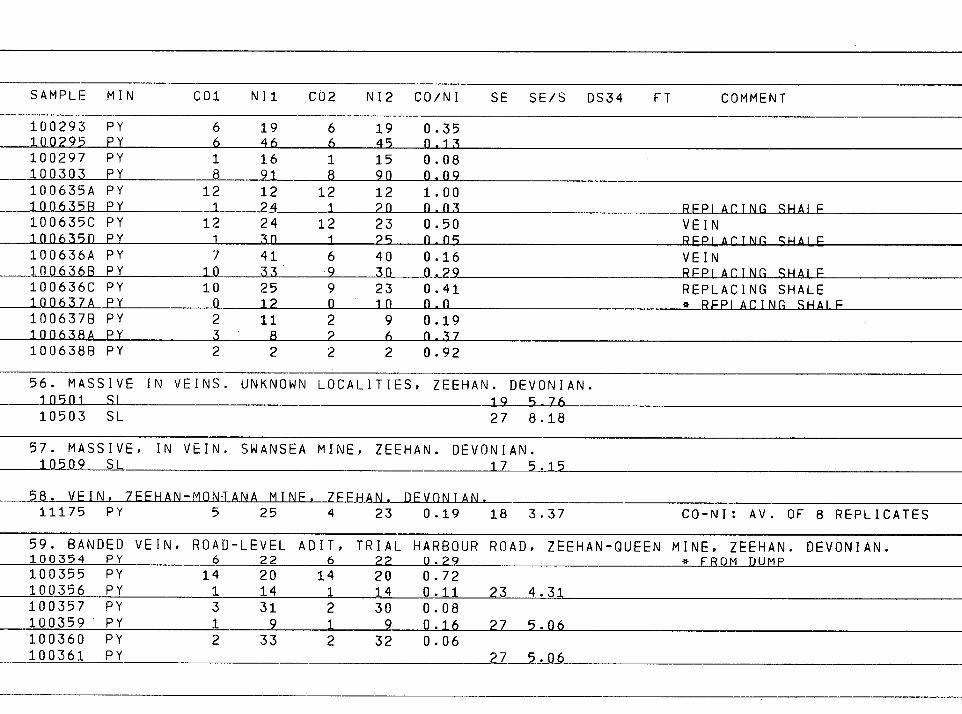
SAMPLE MIN CO1 Nil CO2 NI2 CO/NI SE SE/S DS34 FT COMMENT
100293 PY 6 19 6 19 0.35 100295 PY 6 46 6 45 0.13 100297 PY 1 16 1 15 0.08 100303 PY 8 91 8 90 0.09 100635A PY 12 12 12 12 1.00 1_0_06358 PY 1 24 1 20 n 03 REPLACING Smm E 100635C PY 12 24 12 23 0.50 VEIN 1006350 PY 1 30 1 25 0_05 REPLArINn SHALF 100636A PY 7 41 6 40 0.16 VEIN 1006368 PY 10 33 9 301.29 RFP1AcING SHAIF 100636C PY 10 25 9 23 0.41 REPLACING SHALE 1_00637A PY 0 12 0 10 n n * RPPIACING SHAIF 1006378 PY 2 11 2 9 0.19 100638A PY 3 8 2 6 0.37 1006388 pY 2 2 2 2 0.92
56. MASSIVE IN VEINS. UNKNOWN LOCALITIES, ZEEMAN. DEVONIAN. 10501 SI 19 5-76 10503 SL 27 8.18
57. MASSIVE, IN VEIN. SWANSEA MINE, ZEEMAN. DEVONIAN. 10509 SL 17 5.15
58. VEIN, 7FFHAN-MONTANA MINF. 7FFHAN. DEVONIAN. 11175 PY 5 25 4 23 0.19 18 3.37 Co-NI: Av. OF 8 REPLICATES
59. BANDED VEIN, ROAD-LEVEL ADIT, TRIAL HARBOUR ROAD, ZEEHAN-OUEEN MINE, ZEEHAN. DEVONIAN. 100354 PY 6 22 6 22 0.29 * FROM DUMP 100355 PY 14 20 14 20 0.72 100356 PY 1 14 1 14 0.11 23 4.31 100357 PY 3 31 2 30 0.08 100359 PY 1 9 1 9 0.16 27 5.06 100360 PY 2 33 2 32 0.06 100361 PY 27 5.06
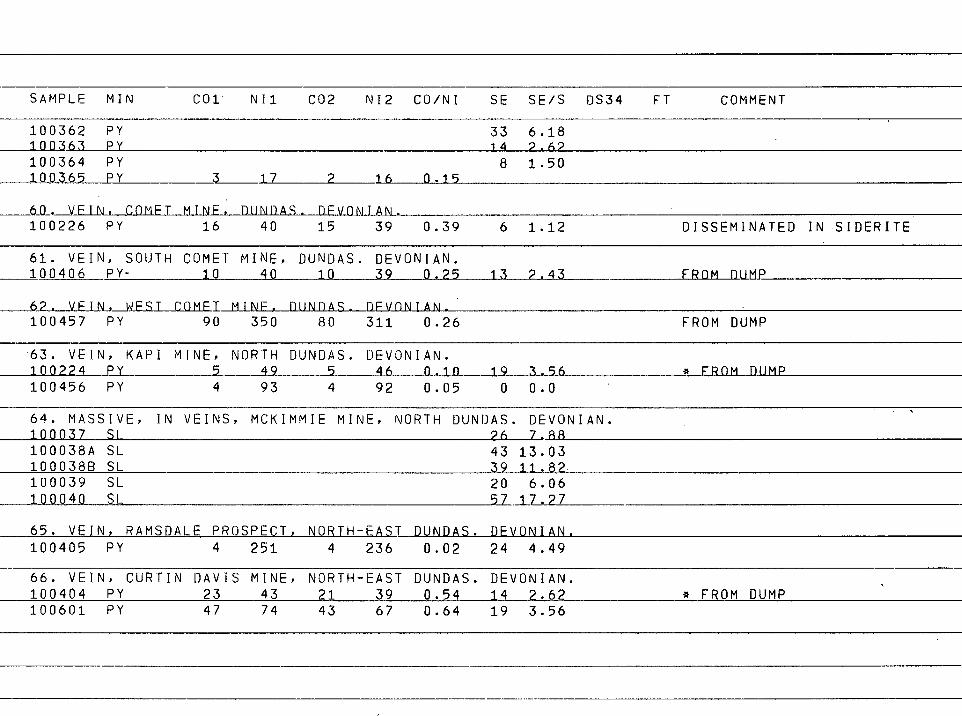
SAMPLE MIN CO1 Nil CO2 NI2 CO/NI SE SE/S oS34 FT COMMENT
100362 PY 33 100363 PY 14
6.18 2.62
100364 PY 8 100365 PY 3 17 2 16 0.15
1.50
1.12 DISSEMINATED IN 6D- VFIN, COmFT mINELLUAILLS-D_E_VILLIALAL 100226 PY 16 40 15 39 0.39 6
61. VEIN, SOUTH COMET MINE, DUNDAS. DEVONIAN. 100406 PY- 10 40 10 39 11.25 13 2.43 FROM OOMP
FROM DUMP ComFT mINF. noNnAs. nFvoNIAN.
100457 PY 90 350 80 311 0.26
• 63. VEIN, KAPI MINE, NORTH DUNDAS. DEVONIAN. 100224 PY 5 49 5 46 0-10 19 3.56
0.0
* FROM DUMP 100456 PY 4 93 4 92 0.05 0
64. MASSIVE, IN VEINS, MCKIMMIE MINE, NORTH DUNDAS. DEVONIAN. 100037 SL 26 7.88 100038A SL 43 13.03 100038B SL 39 11.82 100039 SL 20 6.06 100040 SL 57_1_7.27
65. VEIN, RAMSDALE PROSPECT, NORTH-EAST DUNDAS. DEVONIAN.
SIDERITE
100405 PY 4 251 4 236 0.02 24 4.49
66. VEIN, CURTIN DAVIS MINE, NORTH-EAST DUNDAS. DEVONIAN. 100404 PY 23 43 21 39 0.54 14 2.62 100601 PY 47 74 43 67 0.64 19 3.56
* FROM DUMP
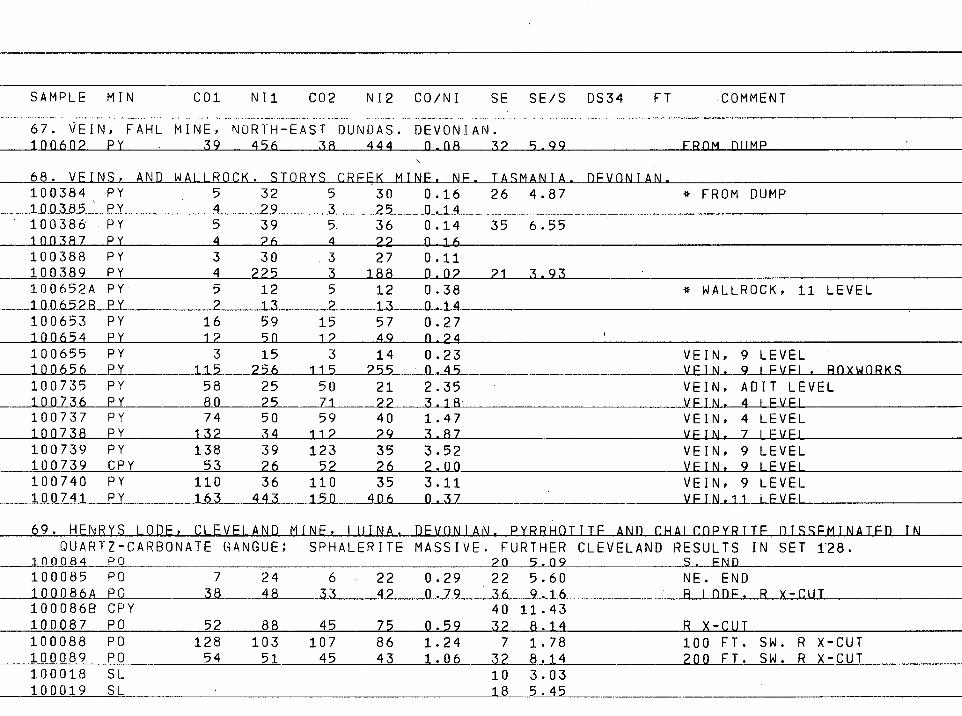
SAMPLE MIN CO1 Nil CO2 NI2 CO/NI SE SE/S DS34 FT COMMENT
67. VEIN, FAHL MINE, NORTH-EAST DUNDAS. DEVONIAN. 100602 py 39 456 38 444 0.08 32 5.99 FRnm nump
68. VE N ND w • • • hi F, NF. TASMANIA DEVONIAN. 100384 PY 5 32 30 0.16 26 4.87 * FROM DUMP 100385 PY 4 29 3 29 ft-14 100386 PY 5 39 5 36 0.14 35 6.55 1110387 PY 4 26 4 22 0 16 100388 PY 3 30 3 27 0.11 100389 PY 4 225 3 188 0.02 21 3.93 100652A PY 5 12 5 12 0.38 * WALLROCK, 11 LEVEL 100652R PY 2 13 2 13 0.14 100653 PY 16 59 15 57 0.27 100654 PY 12 50 12 49 0.24 100655 PY 3 15 3 14 0.23 VEIN, 9 LEVEL 100656 PY 115 256 115 255 vPiN. 9 FvF1 ROxwORKS 100735 PY 58 25 50 21 2.35 VEIN, ADIT LEVEL 100736 PY 80 25 71 22 3.18 VEIN. 4 lEvEl 100737 PY 74 50 59 40 1.47 VEIN, 4 LEVEL 100738 PY 132 34 112 29 3 87 VEIN. 7 LEvEI 100739 PY 138 39 123 35 3.52 VEIN, 9 LEVEL 100739 CPY 53 26 52 26 2.00 VEIN, 9 LEVEI 100740 PY 110 36 110 35 3.11 VEIN, 9 LEVEL 100741 PY 163 443 150 406 0 37 vFIN.11_ IFvFi
69. HENRYS LODE, CLEVEIAND MINE, lUINA,_DEVONIAN. PYRRHOTITF AND CHAICoPYRITF DISSEMINATED QUARTZ-CARBONATE GANGUE; SPHALERITE MASSIVE. FURTHER CLEVELAND RESULTS IN SET 128.
100084 PO 20 5.09 S. FNO
100085 PO 7 24 6 22 0.29 22 5.60 NE. END 100086A PO 38 48 33 42 • 0.79 36 9.16 R IODE. R x-CUT 1000868 CPY 40 11.43 100087 PO 52 88 45 75 0.59 32 8.14 R X-CUT 100088 PO 128 103 107 86 1.24 7 1.78 100 FT. SW. R X-CUT 100089 PO 54 51 45 43 1.06 32 8_11_4 200 FT. SW. R X-CUT 100018 SL 10 3.03 100019 SL 18 5.45
IN
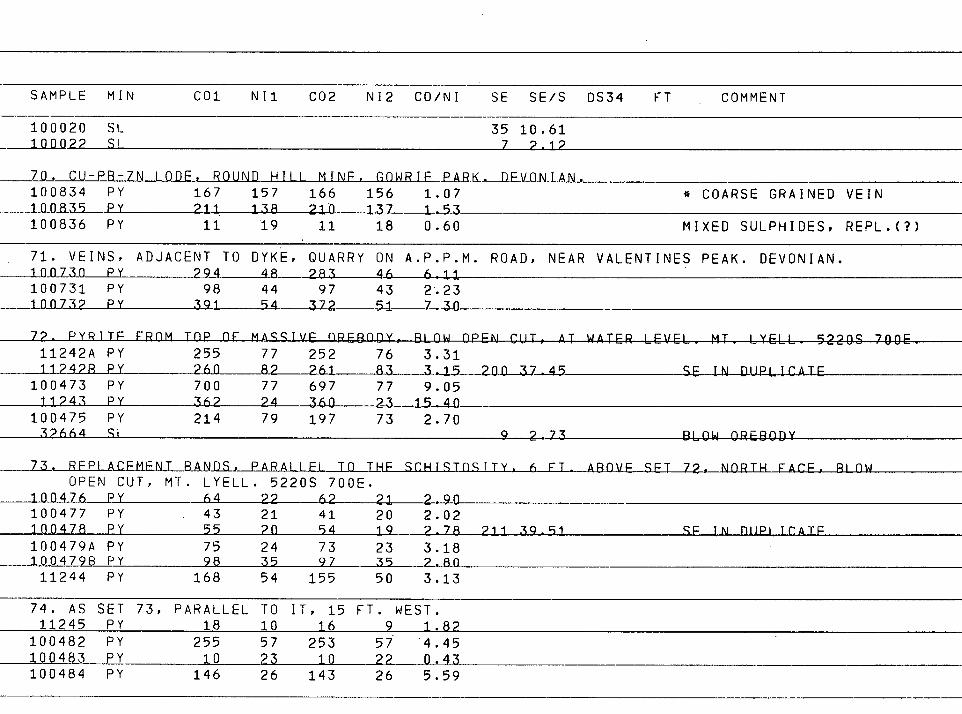
SAMPLE MIN CO1 Nil CO2 NI2 CO/NI SE SE/S 0S34 FT COMMENT
100020 SL 35 10.61 100022 SP 7 2.12
Z.D. CU-PR-7N 100F, ROUND Hill MINE. GOwRIF PARK—DEUOALIAN. 100834 PY 167 157 166 156 1.07
* COARSE GRAINED VEIN
10n835 Py 211 . 138 210 137 1-53 100836 PY 11 19 11 18 0.60
MIXED SULPHIDES, REPL.(?)
71. VEINS, ADJACENT TO DYKE, QUARRY ON A.P.P.M. ROAD, NEAR VALENTINES PEAK. DEVONIAN. 1n0731) PY 294 48 283 46 6-11
100731 PY 98 44 97 43 2.23
1_00732 PY 391 54 3 7 2 51 7 30
72. PYRITE FROM TOP or MASSIVE OREBODY, BLOW OPEN CUT, AT WATER LEVEL. MT . LYELL_ 5220S 700E_
11242A PY 255 77 252 76 3.31
11242R PY 26n 82 261 83 3.15 200 17 45 SE IN DUEL.I.C.A_LE
100473 PY 700 77 697 77 9.05
11243 PY 362 24 360 23 15 40
100475 PY 214 79 197 73 2.70
32664 si 9 2 73 BLOW OREBODY
73.REELALEEENT RANDS,EARALLE1_1_0LELE_SLELLSinsrry. 6 FT ABOVE SRT 72. NORTH FACE. BLOW OPEN CUT, MT. LYELL. 5220S 700E.
1nn476 PY 64 22 62 21 2 90
100477 PY 43 21 41 20 2.02
100478 PY 55 20 54 19 2.78 21 39.91 SE IN 0uPLTcATP
100479A PY 75 24 73 23 3.18
1004798 PY 98 35 97 35 2.80
11244 PY 168 54 155 50 3.13
74. AS SET 73, PARALLEL TO IT, 15 FT. WEST.
11245 PY 18 10 16 9 1.82
100482 PY 255 57 253 57 4.45
100483 PY 10 23 10 22 0.43
100484 PY 146 26 143 26 5.59
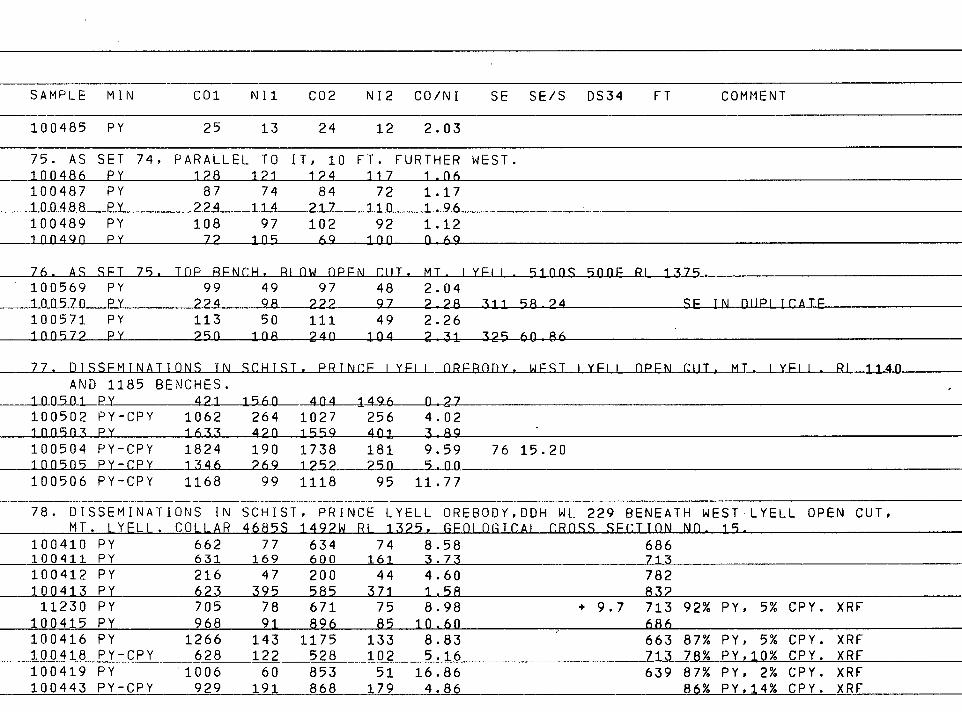
SAMPLE MIN CO1 NI1 CO2 NI2 CO/NI SE SE/S DS34 FT COMMENT
100485 PY 25 13 24 12 2.03
75. AS SET 74, PARALLEL TO IT, 10 FT. FURTHER WEST. 100486 PY 128 121 124 117 1.n6 100487 PY 87 74 84 72 1.17 100488 PY 224 114 217 110 1.96 100489 PY 108 97 102 92 1.12 inn4qn PY 72 105 69 100 0 69
76. AS SFT 75. TOP RFNcH. plow OPPN CHT. MT. iYPLL 5100S_50ME PL 13 7 5- 100569 PY 99 49 97 48 2.04 1105711 PY 224 98 222 97 2-28 311 58_24 cE I_N DUPLICATE 100571 PY 113 50 111 49 2.26 100572 PY 250 108 240 104 2 31 325 60 86
77, OISSFMINATIONS IN
BENCHES.
421 1062 1633
SCHIST. PRTNCF IYPII ORPBODY,__MFSI LYEIL OPEN CUT. MT. LYE' L - RL 1140
1560 404 1_4_9_6____0_2_7
264 1027 256 4.02
420 15 9 Q 4 01 3 89
AND 1185 1005_01_2Y 100502 PY-CPY 100903 PY 100504 PY-CPY 100505 PY-CPY 100506 PY-CPY
1824 1346 1168
190 269
99
1738 1252
1118
181 9.59
2511 5.00
95 11.77
76 15.20
78. DISSEMINATIONS IN MT. LYELL. COLLAR
SCHIST, PRINCE LYELL OREBODY,DDH wL 229 BENEATH wEST LYELL OPEN CUT, 4685S 1492W RL 1325, GFOIOGICAI CROSS SFCTION Nn. 19.
100410 PY 662 77 634 74 8.58 686 100411 PY 631 169 600 161 3.73 713
100412 PY 216 47 200 44 4.60 782 100413 py 623 395 585 371 1.58 832 11230 PY 705 78 671 75 8.98 + 9.7 713 92% PY, 5% CPY. XRF
100415 PY 968 91 896 85 10.60 , 686 100416 PY 1266 143 1175 133 8.83 663 87% PY, 5% CPY. XRF 100418 PY-CPY 628 122 528 102 5.16 713 78% PY,10% CPY. XRF 100419 PY 1006 60 853 51 16.86 639 87% PY, 2% CPY. XRF 100443 PY-CPY 929 191 868 179 4.86 86% PY,14% CPY. XRF
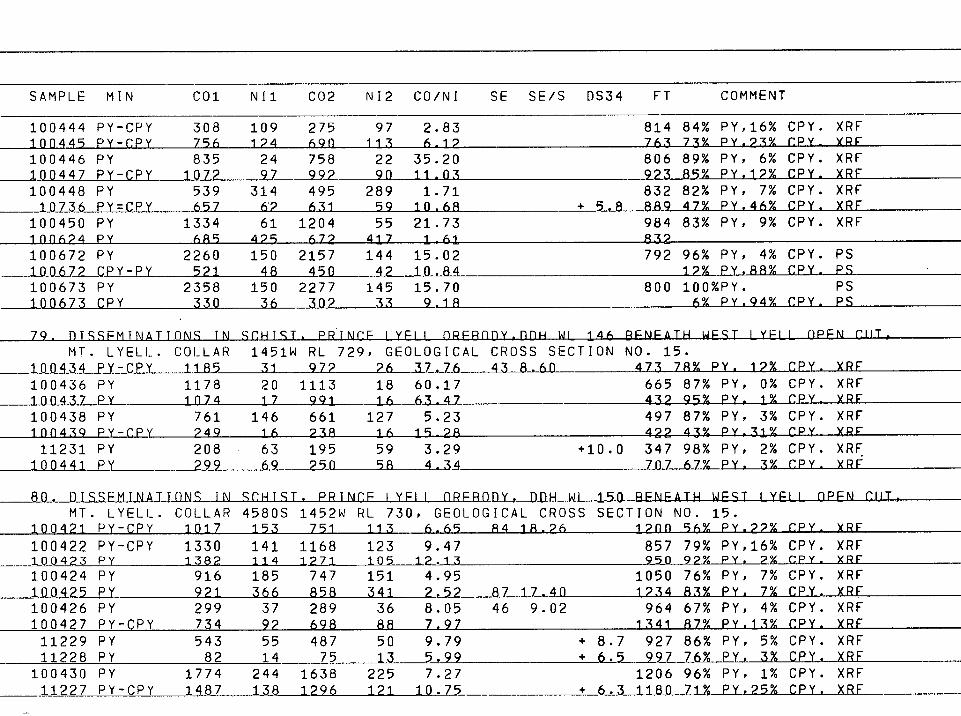
SAMPLE MIN CO1 Nil CO2 NI2 CO/NI SE SE/S DS34 FT COMMENT
100444 PY-CPY 308 109 275 97 2.83 814 84% PY,16% CPY. XRF
100445 PY-cPY 756 124 690 113 6 12 763 73% py.23% CPY. XRF
100446 PY 835 24 758 22 35.20 806 89% PY, 6% CPY. XRF
100447 PY-CPY 1072 97 992 90 11.n3 923 85% PY.12% (WY. xRF
100448 PY 539 314 495 289 1.71 832 82% PY, 7% CRY. XRF
10736 PY=CPY 657 62 631 59 10.68 + 5.8 889 47% PY.46% (WY. xRF
100450 PY 1334 61 1204 55 21.73 984 83% PY, 9% CRY. XRF
101)624 PY 685 425 672 417 1-61 832 100672 PY 2260 150 2157 144 15.02 792 96% PY, 4% CRY. PS
100672 CPY-PY 521 48 450 42 10-84 12% Py.88% CRY. PS
100673 PY 2358 150 2277 145 15.70 800 100%PY. PS
CPY 330 ___1_00673 36 302 33 9.18 A% Py.94% CPy. PS
79. nrssFmtNATTONs IN SCHIST. PRINCP LYEIL 09EBnDY.DDH wL 146 BENEATH WEST LYELL OPEN CUT, MT.
1_00434
LYELL. PY-CPY PY PY
PY PY-CPY
COLLAR 1185
1178 1074
761 249
1451W 31
20 17
146 16
RL 729, GEOLOGICAL CROSS SECTION NO. 15.
972 26_33.76 43 8-60 473 78% PY, 12%
1113 18 60.17 665 87% PY, 0%
991 16 63 47 432 95% PY, 1%
661 127 5.23 497 87% PY, 3%
238 16 15-28 422 43% PY,31%
('Py.
CPY. CPY- CPY. CPY
xRF
xRF
XRF xRF
XRP
100436 11)0437
100438 11)0439
11231 PY 208 63 195 59 3.29 +10.0 347 98% PY, 2% CPY. XRF. 100441 PY 299 69 250 58 4.34 707 67 0!. py. 3% cPy. xRF
; 1 W I • :1 11 . BENEATH WEST LYE 1L OPEN CUT, MT. LYELL. COLLAR 4580S 1452w RL 730, GEOLOGICAL CROSS SECTION NO. 15.
100421 PY-CPY 1017 153 751 113 6.65 84 18.26 12nn 56% PY.22% CPY. XRF
100422 PY-CPY 1330 141 1168 123 9.47 857 79% PY,16% CPY. XRF 100423 PY _1382 114 1271 105 12.13 950 92% PY. 2% CPY. XRF 100424 PY 916 185 747 151 4.95 1050 76% PY, 7% CPY. XRF
1004 5 PY 921 366 858 341 2.52 87 17.40 1234 83% Py. 7% CRY. XRF 100426 PY 299 37 289 36 8.05 46 9.02 964 67% PY, 4% CPY. XRF
100427 PY-CPY 734 92 698 88 7.97 1341 87% Py.13% cPY. xRF
11229 PY 543 55 487 50 9.79 + 8.7 927 86% PY, 5% CPY. XRF
11228 PY 82 14 75 13 5.99 + 6.5 997 76% PY, 3% CPY. XRF
100430 PY 1774 244 1638 225 7.27 1206 96% PY, 1% CPY. XRF
11227 PY-CPY 1487 138 1296 121 10.75 + 6.3_1180 71% PY,25% CRY. XRF
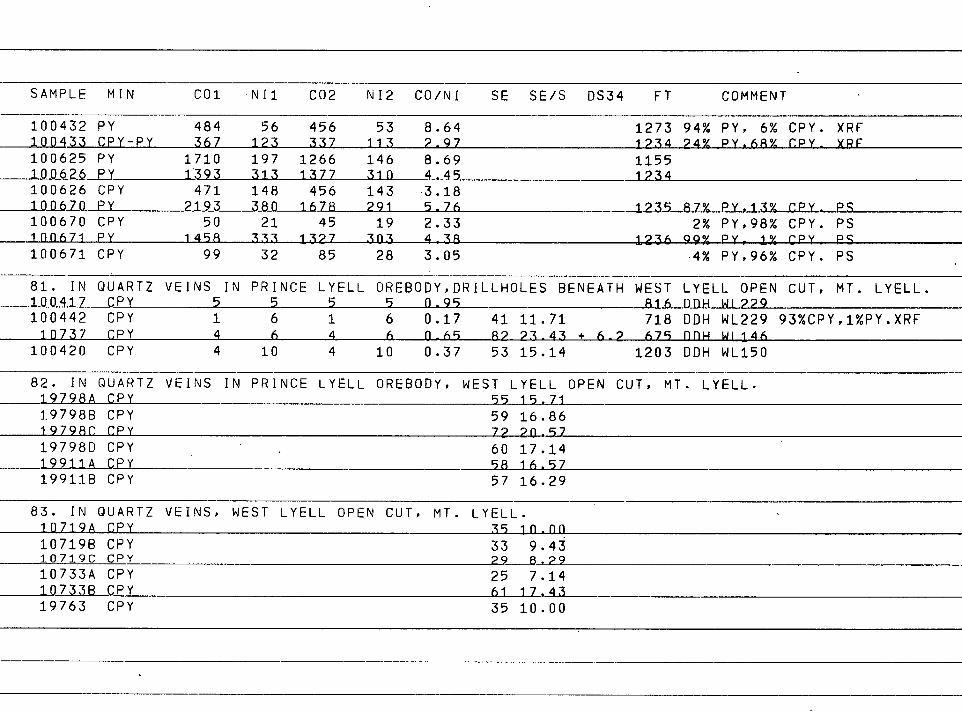
SAMPLE MIN CO1 NI1 CO2 NI2 CO/NI SE SE/S 0534 FT COMMENT
100432 PY 484 56 456 53 8.64 1273 94% PY, 6% CPY. XRF 100433 CRY-PY 367 123 337 113 2.97 1234 24% py.68% cpy. yRF 100625 PY 1710 197 1266 146 8.69 1155 100626 PY 1393 313 1377 310 4.45 1234 100626 CPY 471 148 456 143 3.18 100670 PY 2193 380 1678 291 5 76 1235 87% PY,13% cPy. ps 100670 CPY 50 21 45 19 2.33 2% PY,98% CPY. PS 100671 Py 1458 333 1_32 7 303 4 38 1236 99% PY, 1% CPY PS 100671 CPY 99 32 85 28 3.05 4% PY,96% CPY. PS
81. IN QUARTZ VEINS IN PRINCE LYELL OREBODy,DRILLHOLES BENEATH WEST LYELL OPEN CUT, MT. LYELL. _____1_00417 CRY 5 5 5 5 0.95 816 nnH w1229
100442 CPY 1 6 1 6 0.17 41 11.71 718 DDH WL229 93%CPY,1%PY.XRF 10737 CRY 4 6 4 6 0.69 82 23.43 + 6.2 675 nDH WL146
100420 CPY 4 10 4 10 0.37 53 15.14 1203 DDH WL150
82. IN QUARTZ VEINS IN PRINCE LYELL OREBODY, WEST LYELL OPEN CUT, MT. LYELL. 19798A CPY 55 15.71____ 19798B CRY 59 16.86 19798c cPy 7 2 211 97 19798D CRY 60 17.14 199_11A CRY 58 16.57 19911B CRY 57 16.29
83. IN QUARTZ VEINS, WEST LYELL OPEN CUT, MT. LYELL. 10719A CRY 35 10.00 10719B CRY 33 9.43 10719C CPY
10733A CRY 25 7.14 10733B CRY 61 17.43 19763 CRY 35 10.00
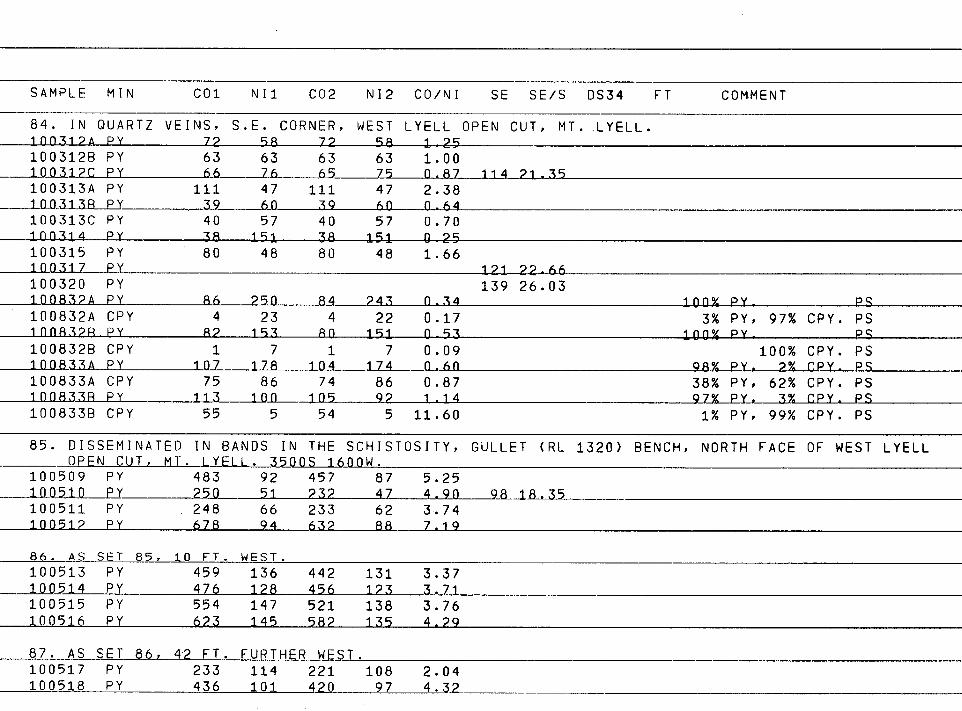
SAMPLE MIN CO1 Nil CO2 NI2 CO/NI SE SE/S 0S34 FT COKMENT
84. IN QUARTZ VEINS, 100312A PY
S.E.
72 58
63 63
66 76
111 47 , 39 611
40 57
38 151
CORNER 72 63 65
111 39 40 38
, WEST LYELL
58 1 25
63 1.00
75 0.87
47 2.38
60 0 64
57 0.70
151 0_25
OPEN CUT, MT. .LYELL.
114 21.35 1003128 PY
PY 100313A PY
PY 100313C PY 100314 PY 100315 PY 80 48 80 48 1.66 1_10317 121 22 66 100320 PY 139 26.03 1_00832A PY 86 2511 84 243 0.34 100% PY- Ps 100832A CPY 4 23 4 22 0.17 3% PY, 97% CPY. PS 1nn832R PY 82 193 80 151 0-53 100% PS 100832B CPY 1 7 1 7 0.09 100% CPY. PS 1 nn_B_3_3_AE_Y t0_7L7_ataA___tm0_ 60 98% PY. 2% CPY. PS 100833A CPY 75 86 74 86 0.87 38% PY, 62% CPY. PS 100833R PY 113 lon ins 92 1 14 97% PY. 3% CPY. PS 100833B CPY 55 5 54 5 11.60 1% PY, 99% CPY. PS
85. DISSEMINATED IN BANDS IN THE SCHISTOSITY, GULLET (RL 1320) BENCH, NORTH FACE OF WEST OPEN CUT, mi. LYELL. 3500S 1600w.
100509 PY 483 92 457 87 5.25 100510 PY 250 51 232 47 4.911 9a_18.39 100511 PY 248 66 233 62 3.74 100512 PY 678 94 632 88 7.19
86. AS SET 85, 10 FT. WEST. 100513 PY 459 136 442 131 3.37 100514 PY 476 128 456 123 3.71 100515 PY 554 147 521 138 3.76 100516 PY 623 145 582 135 4.29
87. AS SET 86, 42 FT. FURTHER WEST. 100517 PY 233 114 221 108 2.04 100518 PY 436 101 420 97 4.32
LYELL
SAMPLE MIN 001 Nil CO2 NI2 CO/NI SE SE/S D534 FT COMMENT
100519 PY
130 40 126 38 3.27
100520 PY 376 119 362 119 3-16
88: DISSEMINATFD IN BANDS IN THF SCHISTOSITY.HONFYPnT nRFRIMY.G1JlIFT(R1 FACE OF WEST LYELL OPEN CUT,MT. LYELL. 3000S 1150W.
100507 PY 532 42 510 40 12 68 100508 PY 442 38 421 36 11.59 47 8.80
1320)RFNCH,NORTH
89. DISSEMINATIONS IN SCHIST, CAPE HORN PYRITE BODY, COMSTOCK TRACK, NORTH OF WEST LYELL OPEN C U T ,_it L.J_Y_El I . ionnN 21004 RI 1925
100372A PY 143 68 99 47 2.09 38 7.12 100a72R PY 7 2i1 6 22 o 29 100372C PY 118 60 93 47 1.98 100372F PY 184 67 127 46 2.79 35 6-55 100373A PY 185 79 134 57 2.34 1001730 PY 40 7 47 1003730 PY 159 76 132 63 2.10 100.3144 PY 216 78 147 94 2 75 1003748 PY 41 7.68
90. DISSEMINATIONS IN QUARTZOSE SEGREGATIONS IN THE SCHISTOSITY, ASSOCIATED WITH SET 89. 100559 PY 393 269 381 262 L—A6 100560 PY 240 147 230 141 1.63
91. DISSEMINATIONS IN SERICITIC SCHIST, CROWN LYELL OREBODY 10E, MT. LYELL. 100496 PY 1498 122 1393 114 12.24 100497 PY 1611 99 1539 95 16.22 98 18.35 100498 PY 953 17 874 16 54.83 85 15.92 100499 PY
1152 137 1053 125 8.39 100500 PY
1041 112 988 107 9.26
92. MASSIVE, WITH BORNITE, NORTH LYEII , MT. IYFII 19796A CPY 82 23.43 19796B CPY 80 22.86
SAMPLE MIN CO1 NI1 CO2 NI2 CO/NI SE SE/S DS34 FT COMMENT
93. MASSIVE ORE, CROWN LYELL, MT. LYELL. 10738-2 CPY 10739-2 PY-CP 31805A CRY 31805C CPY 31805E CRY 318051 CRY 31805J CPY 100042 SL
-i26 93-14 116 22.31
- 3.6
- 2.5 - 2.8
43 12.29 18 10 86 31 9.39
94. MASSIVE, SECOND BENCH, LYELL COMSTOCK OPEN CUT, MT. LYELL. 5600N 800W RL 1650. 11234 PY 58 52_ 54 49 1-12 10 1 87 + 6 1 11235 11236
PY PY
62 42
57 54
58 38
53 49
1.10 0_79
+ 6.7 + 6_6
11237 100495
PY PY
50 40
51 44
45 37
46 41
0.98 0-.90
+ 6.3
95-MASSIVE. PY PY
DUMP AT
9
COLLAR
24
OF TASMAN
9 23
AND CROWN
0 40
LYELL SHAFT__,__M-__L 77 14.42 SE IN
111 • k
DUPLICATE 100369A 1003698 1003690 PY 6 17 6 17 0.38 100369E PY 14 28 14 28 n 51 11219A PY 149 77 116 59 1.95 11219R PY 130_24-14_ 11219E PY 4 17 4 17 0.22 11219F PY + 5.8
100371E PY 141 26.40 100403 PY 6 18 4 14 0.31 11238 PY 4 9 4 9 0.44 + 6.7 11239 PY 8 25 7 22 0.33 + 8.4 11240 PY 12 22 10 20 0.52 + 8.3 11241 PY 1 5 1 5 0.13 88 16.48 + 6.6 SF IN DUPI ICATF
I
SAMPLE MIN COI NI1 CO2 NI2 CO/NI SE SE/S DS34 FT COMMENT
96. MASSIVE, UNKNOWN LOCALITIES, ROSEBERY MINE. 10535A CPY + 9-6 10535D CPY + 9.0 105351 CPY 8 2.29 10535J CPY 24 6.86 105_35E_LRY 8 2 29 10535B SL + 9.9 10535P gi + 10 0 10535L SL 8 2.42 10535G SL 14 4 24 10535H SL 10 3.03
11764A CPY +13.5 19764D CPY +10.0 19764n CPY 197648 SL +12.2 19764E SL +12.6 19764F SL 12 3.64
27 7 71
97. BANDED SPHALERITIC ORE, 9 LEVEL, B LENS, ROSEBERY MINE. K35N STOPE, 3450N 75E RL 558. 100055 si 16 4.85 100056 SL 2 0.61 100057 SL 20 6.06
98
I
: 1
INE- MlON STOPE, 970N 320E RI_ 285 100052 SL 1.82
99. MASSIVE PYRITIC ORE, 12 LEVEL, HANGINGWALL OF B LENS, ROSEBERY MINE. 040N STOPE, 4030N 490E RL 30.
100548 PY 100549 PY 100550 PY 1D0551 PY
4 6 3 5 0.76 5 9 4 8 0.51 4 6 3 5 0.63 3 4 3 4 0.77 5 0.94
10_0. MASSIVE PYRITIC ORE, 12 LEVEL, FOOTWAII OF F LEUS,EaSEBERY_MINF. S. DRIVE 00N 700F RI 61. 100349 PY 1 9 1 9 0.10 12 2.25 100350A PY 1 8 1 8 0.11_ 0 00
SAMPLE MIN CO1 Nil CO2 NI2 CO/NI SE •SE/S 0S34 FT COMMENT
1003508 PY 10035nr. PY
0 5 n 16
0 0
5 0.0
16 0.0 7 1.31 1003500 PY 0 14 0 14 0.0 100350H PY 1 17 1 17 0.09 1003501 PY
PY _1110350J 3 18 2 18
3 2
17 0.16 lil 0 13
100350L PY 13 2.43
101. MEDIUM GRAINED PYRITIC ORE, 13 LEVEL, FOOTWALL OF D LENS, ROSEBERY MINE. N DRIVE 1100N 720E RL 9940. NOTF: SI =R110000
100536 PY 2 3 2 3 0.55 100537 PY 3 6 2 6 0 41 100538 PY 4 6 3 5 0.69 14 2.62 100539 PY 2 5 2 4 0-39 15 2 81
102. mASSIVF PYRIIIL_DRE_L_13LE/EL_,___EAN.GIAIGWIAII OF n LENS, ROSEBERY MINE. 8N x.-..ruT 720N 680E RL 9938.
1_0_05A0 PY 42 1 42 1 68-09 100541 PY 68 1 67 1 105.19 12 2.25 100542 PY 652 1 636 1 469-81 100543 PY 52 9 50 8 6.08
103. MEDIUM GRAINED PYRITIC ORE, 13 LEVEL, FOOTWALL OF E LENS, ROSEBERY MINE. .100N 830E RL 9940 10_0544 PY 5 9 4 7 n 61 100545 PY . 442 6 433 6 74.29 100546 PY 330 10 322 10 32.114 100547 PY 380 10 364 9 38.95 41 7.68
104. BANDED COARSE GRAINED PYRITIC ORE, 13 LEVEL, WITHIN F LENS, ROSEBERY MINE. 300N 1030E RL 9939.
100523 PY 49 6 43 5 8.70 100524A PY 64 6 62 6 10.57 10 1.87 SE IN OUP' ICATF 1005248 PY 65 14 62 13 4.74 100525 PY 22 97 15 69 0.22
100526 PY 51 7 47 6 7.33 16 3.00
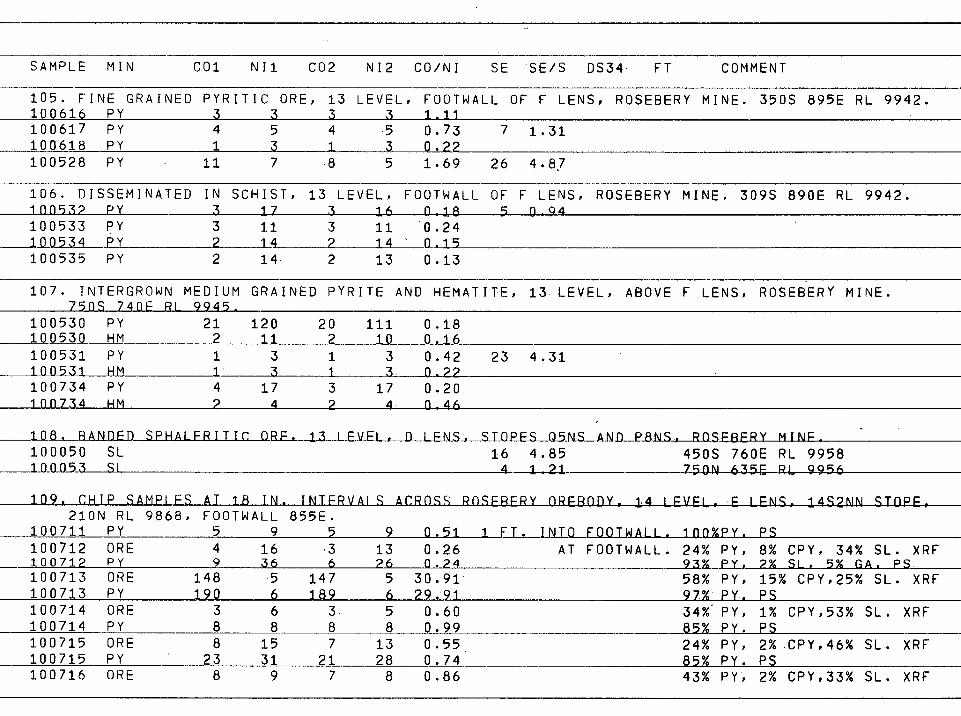
SAMPLE MIN CO1 Nil CO2 NI2 CO/NI SE SE/S DS34 FT COMMENT
105. FINE GRAINED PYRITIC ORE, 13 LEVEL, FOOTWALL OF F LENS, ROSEBERY MINE. 350S 895E RL 9942. 100616 PY 3 3 3 3 1.11 100617 PY 4 5 4 5 0.73 7 1.31 100618 PY 1 3 1 3 0.22 100528 PY 11 7 8 5 1.69 26 4.87
106. DISSEMINATED IN SCHIST, 13 LEVEL, FOOTwALL OF F LENS, ROSEBERY MINE. 309S 890E RL 9942. 100932 PY 3 17 3 16 0l8 5 0 94 100533 PY 3 11 3 11 0.24 10_0534__PY 2 14 ? 14 ' 0-15 100535 PY 2 14 2 13 0.13
107. INTERGROwN MEDIUM GRAINED PYRITE AND HEMATITE, 13 LEVEL, ABOVE F LENS, ROSEBERY MINE. 750S 740F M 9945.
100530 PY 21 120 20 111 0.18 100530 HM 2 11 2 10 0,16 100531 PY 1 3 1 3 0.42 23 4.31 100531 HM 1 3 1 3 0 22 100734 PY 4 17 3 17 0.20 100734 HM 2 4 2 4 o 46
108. RANDFD SPHAIFR_LLLC_QRE_,_L3_±_E_ALE_L_,_D_L_FN LSkND P8NS, ROSEBERY MINE. 100050 t011053
SL 51
16 4
4,85 1_21
•450S 760E RL 9958 750N 635E RL 9956
I • :1 II: !II L I . 210N RL 9868, FOOTWALL 855E.
100711 PY 5 9 5 9 0.51 FT. INTIE_FOOTWAII . 100%PY. PS 100712 ORE 4 16 3 13 0.26 AT FOOTWALL. 24% PY, 8% CPY, 34% SL. XRF 100712 PY 9 36 6 26 0.24 93% PY. 2% SL. 5% GA. PS
100713 ORE 148 5 147 5 30.91 58% PY, 15% CPY,25% SL. XRF 100713 PY 190 6 189 6 29.91 97% PY. PS 100714 ORE 3 6 3 5 0.60 34% PY, 1% CPY,53% SL. XRF 100714 PY 8 8 8 8 0.99 85% PY. PS 100715 ORE 8 15 7 13 0.55 24% PY, 2% •CPY,46% SL. XRF 100715 PY 23 31 21 28 0.74 85% PY. PS 100716 ORE 8 9 7 8 0.86 43% PY, 2% CPY,33% SL. XRF
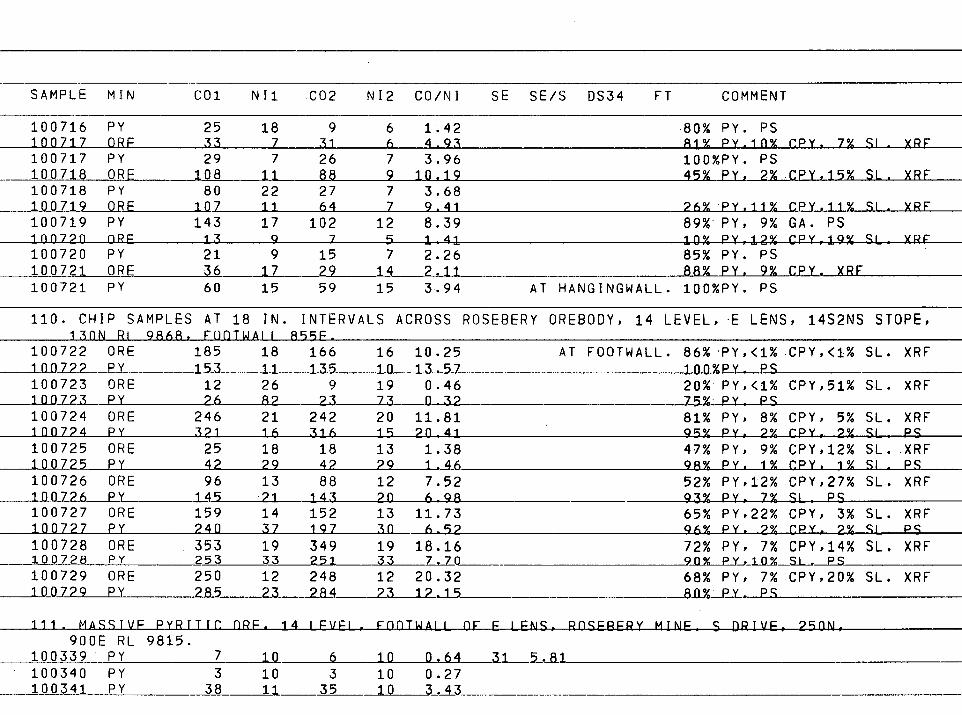
SAMPLE MIN CO1 NI1 CO2 NI2 CO/NI SE SE/S DS34 FT COMMENT
100716 PY 25 18 9 6 1.42 .80% . PY. PS 100717 ORE 33 7 31 6 4.93 81% PY.1[1% CPY. 70/fl SI . YRF 100717 PY 29 7 26 7 3,96 100%PY. PS 10071_8 _o_RE I08 11 88 110.19 45% PY, 2% CPY,15% SL. XRF 100718 PY 80 22 27 7 3.68 1Q_0719 ORE 107 11 64 7 9 41 26% PY.11% CPY.11% Si. XRF 100719 PY 143 17 102 12 8.39 89% PY, 9% GA. PS 100720 ORE 13 9 7 5 1 41 10% PY,12% CPY.19% qt.. XRF 100720 PY 21 9 15 7 2.26 85% PY. PS 100721 ORE •6 17 29 14 2.11 88% PY. 9% CPY. XRF 100721 PY 60 15 59 15 3.94 AT HANGINGWALL. 100%PY. PS
110. CHIP SAMPLES AT 18 IN 13nN RI 9868. F1)OTwAi1
INTERVALS 855P-
ACROSS ROSEBERY OREBODY, 14 LEVEL, E LENS, 14S2NS STOPE,
100722 ORE 185 18 166 16 10.25 AT FOOTWALL. 86% PY,<1% CPY,<1% SL. XRF 1_10722 PY 153 11 115 10 13 57 100%PY. Ps 100723 ORE 12 26 9 19 0.46 20% PY,<1% CPY,51% SL. XRF 1u72a_ PY 26 82 23 73 0-32 75% PY- PS 100724 ORE 246 21 242 20 11.81 81% PY, 8% CPY, 5% SL. XRF 100724 PY 321 16 316 15 20 41 95% PY, 2% CPY, 2% si._ PS 100725 ORE 25 18 18 13 1.38 47% PY, 9% CPY,12% SL. XRF 100725 PY 42 29 42 29 1._46 98% PY, 1% CPY. 1% SI . PS 100726 ORE 96 13 88 12 7.52 52% PY,12% CPY,27% SL. XRF 100726 PY 145 21 143 20 6 98 93% PY, 7% SL PS 100727 ORE 159 14 152 13 11.73 65% PY,22% CPY, 3% SL. XRF 100727 PY 240 37 197 30 6-52 96% PY, 2% CPY. 2% sl. PS 100728 ORE 353 19 349 19 18.16 72% PY, 7% CPY,14% SL. XRF 100728 PY 253 33 251 33 7.70 90% PY,10% SI . PS 100729 ORE 250 12 248 12 20.32 68% PY, 7% CPY,20% SL. XRF 10_0329 PY 285 23 284 23 12 15 80% PY- PS
1_1_1_–IALS_S±V_E_EXIILLI_C—CaLa_1_4LESS..L_,WALI OF E LENS, ROsEBERY MINE S DRIVE, 250N, 900E
100339 RL
PY 9815.
7 10 6 10 0.64 31 5._fil 100340 100341
PY PY
3 38
10 11
3 35
10 10
0.27 3.43
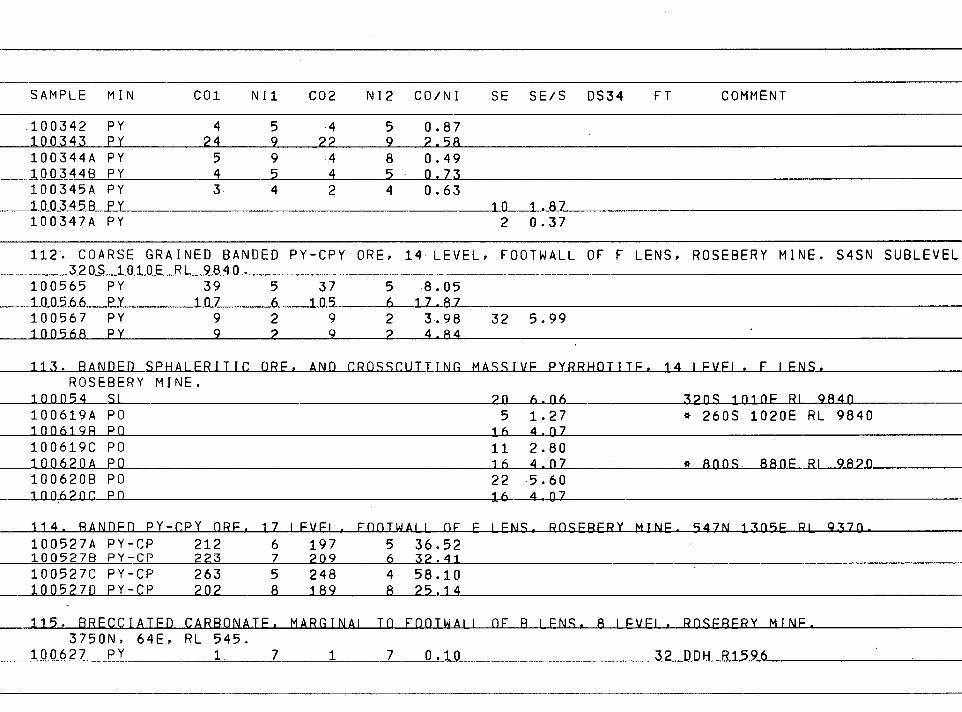
SAMPLE MIN CO1 NI1 CO2 NI2 CO/NI SE SE/S DS34 FT COMMENT
100342 PY 4 5 4 5 0.87 100343 PY 24 9 22 9 2.58 100344A PY 5 9 4 8 0.49 1003448 PY 4 5 4 5 0.73 100345A PY 3 4 2 4 0.63 10.0345R PY in 1.87 100347A PY 2 0.37
112. COARSE GRAINED 320S 101DE RL
BANDED 9840.
PY-CPY ORE, 14 LEVEL, FOOTWALL OF F LENS, ROSEBERY MINE. S4SN
100565 PY 39 5 37 5 8.05
100567 PY 9 2 9 2 3.98 32 5.99 100568 PY 9 2 9 2 4.84
SUBLEVEL
113. RANDED SPHAIERIII_LARE/_IAD_LROSSCULL ROSEBERY MINE.
JalciaLLLE,_14_LEALF1 • F 1FNS.
100054 SI
PO PO
20 5
16
6 06 1.27 4.07
320S 101nP RI 9840 * 260S 1020E RL 9840 100619A
100619R 100619C PO 11 2.80 100620A PO 16 4.07 *• 800s scioE RL 9820 1006208 PO 22 5.60 LID620C Pn 16_ 4 07
jta_5_4211__Laa5E__EL 100527A PY-CP 212 6 197 5 36.52 1005278 PY-CP 223 7 209 6 32.41 100527C PY-CP 263 5 248 4 58.10 100527D PY-CP 202 8 189 8 25.14
115. RRECCIATFO CARBONATF. MARGINAI To FOOTWAI1 flE R 1FNR. 8 IPVP1 ROSEREPY M1NP. 3750N, 64E, RL 545.
100627 PY 1 . 7 1 7 0.10 32 DDH R1596
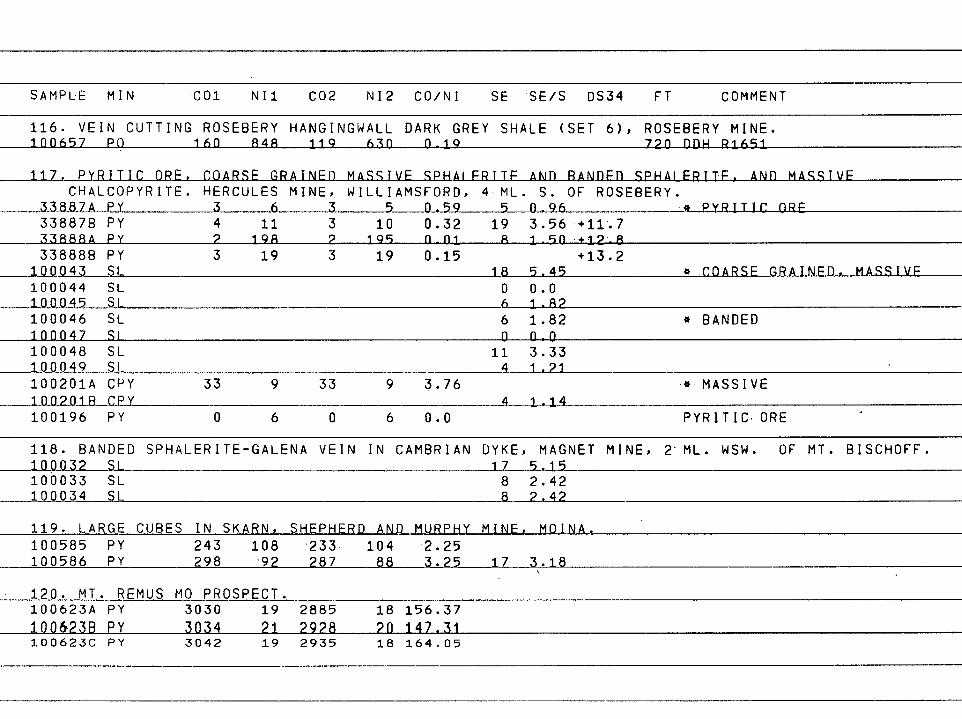
SAMPLE MIN CO1 NI1 CO2 NI2 CO/NI SE SE/S DS34 FT COMMENT
116. VEIN CUTTING 1nn657 PO
ROSEBERY 16fl 848
HANGINGWALL DARK GREY SHALE (SET 6), 119 630 0-19
ROSEBERY MINE. 7 20 DDI-1 R16q1
11/_, PYJIII1L_DRF, COARSE_GRAINED_IIASEI/E_SEHALERITF AND RANDFD SPHALFRITF, AND MASSIVF CHALCOPYRITE. HERCULES MINE, WILLIAMSFORD, 4 ML. S. OF ROSEBERY.
338.81A_PY 3 6 3 5______ 0.59 5 0.96 * PYRITIC ORF 33887B PY 4 11 3 10 0.32 19 3.56 +11.7 33888A PY 2 198 2 195 0-01 8 150 +1 2 -8 33888B PY 3 19 3 19 0.15 +13.2
100043 SL 18 5.45 * COARSF GRAINFD. MASSIVF 100044 SL 0 0.0 100045 SL 6 1.82 100046 SL 6 1.82 * BANDED 100047 SI 0 0-0 100048 SL 11 3.33 100049 SL 4 1.21 100201A CPY 33 9 33 9 3.76 * MASSIVE iniLacilil CPY 4 1_14 100196 PY 0 6 0 6 0.0 PYRITIC ORE
118. BANDED SPHALERITE-GALENA VEIN IN CAMBRIAN DYKE, MAGNET MINE, 2"ML. WSW. OF MT. BISCHOFF. 100032 $L 17 5.15 100033 SL 8 2.42 100034 SL 8 2.42
119. LARGE CUBES IN SKARN, SHEPHERD AND MURPHY MINE, MOINA. 100585 PY 100586 PY
243 108 298 92
•233 287
104 88
2.25 3.25 17 3: 18
120. MT. REMUS MO PROSPECT. 100623A PY 1006238 PY
3030 19 3034 21
2885 2928
18 20
156.37 147.31
100623C PY 3042 19 2935 18 164.05
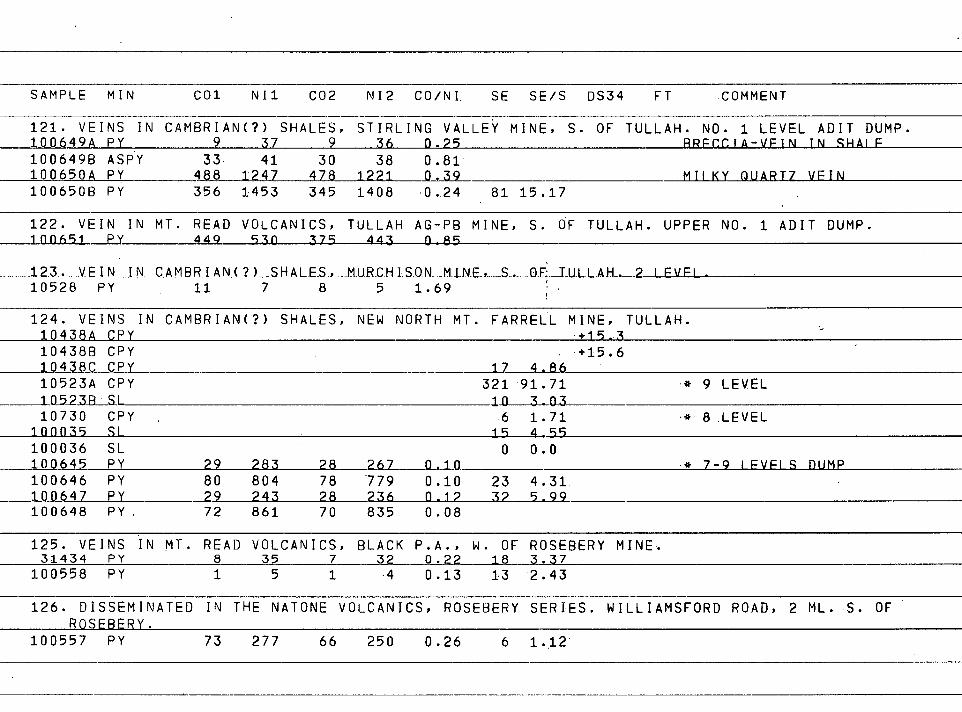
SAMPLE MIN CO1 Nil CO2 NI2 CO/NI SE SE/S DS34 FT COMMENT
121. VEINS IN CAMBRIAN(?) SHALES, STIRLING VALLEY MINE, S. OF TULLAH. NO. 1 LEVEL ADIT DUMP. 100649A PY 9 37 9 36 0.25 RRFCCIA - VFIN TN SHAIP
100649B ASPY 33. 41 30 38 0.81 100650A PY 488 1247 478 1221 0.39 Mu KY OUART7 VFIN 100650B PY 356 1453 345 1408 , 0.24 81 15.17
122. VEIN IN MT. READ VOLCANICS, TULLAH AG-PB MINE, S. OF TULLAH. UPPER NO. 1 ADIT DUMP. inn651 PY 449 930 375 443 0 85
123. VEIN IN CAMBRIAN(?) SHALES, MURCHISON MINF, TWULM±.P iFvF1 . 10528 PY 11 7 8 5 1.69
124. VEINS IN CAMBRIAN(?) SHALES, NEW NORTH MT. FARRELL MINE, TULLAH. 10438A CRY +19-3• 104388 CPY .+15.6 10438C CRY 17 4.86 10523A CRY 321 91.71 .* 9 LEVEL 10523R . SI 10 3-03 10730 CPY -6 1.71 .*• 8 .LEVEL
100035 SL 15 4.55 100036 SL 0 0.0 100645 PY 29 283 28 267 0.10 .* 7-9 IFVFIS nuMP 100646 PY 80 804 78 779 0.10 23 4.31. 100647 PY 29 243 28 236 0.12 32 5.99 100648 PY. 72 861 70 835 0.08
125. VEINS IN MT. READ VOLCANICS, BLACK P.A., W. OF ROSEBERY MINE. 31434 PY 8 35 7 32 0.22 La 3.37
100558 PY 1 5 1 4 0.13 13 2.43
126. DISSEMINATED IN THE NATONE VOLCANICS, ROSEBERY SERIES. WILLIAMSFORD ROAD, 2 ML. S. OF ROSEBERY.
100557 PY 73 277 66 250 0.26 6 1.12
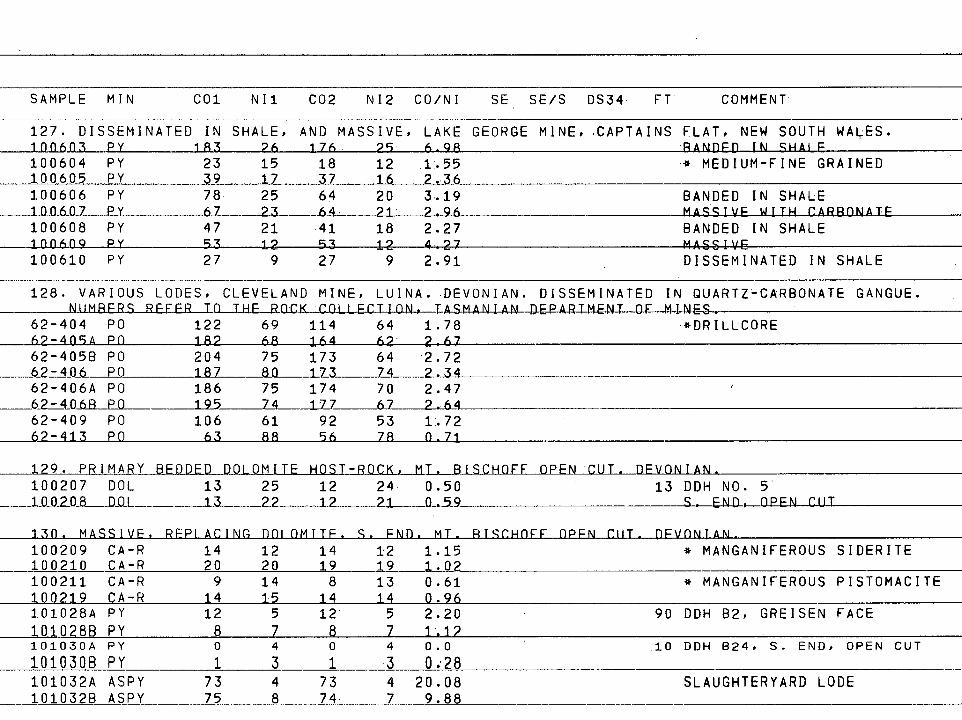
SAMPLE MIN CO1 Nil CO2 NI2 CO/NI SE SE/S DS34 FT COMMENT
127. DISSEMINATED IN SHALE, AND MASSIVE, LAKE GEORGE MINE, .CAPTAINS FLAT, NEW SOUTH WALES. 100603 PY 183 26 176- 29 6-98 BANDED IN SHALE 100604 PY 23 15 18 12 .1'..55 ,* MEDIUM-FINE GRAINED 100605 PY 39 17 37 16 2,36 100606 PY 78 , 25 64 20 3..19 BANDED IN SHALE 11106_03 EY 67 23 64. 21 2.96 mASSLVE__U_LIEL_C_ARROILA_LE______ 100608 PY 47 21 41 18 2.27 BANDED IN SHALE 100609 PY 53 12 53 12 4_27 MASSIVE 100610 PY 27 9 27 9 2.91 DISSEMINATED IN SHALE
128. VARIOUS LODES, CLEVELAND MINE, NumBERS REFER TO THP ROC
LUINA. DEVONIAN. DISSEMINATED IN QUARTZ-CARBONATE MINES_
GANGUE.
62-404 PO 122 69 114 64 1.78 •*DRILLCORE 62 - 409A PO 182 68 164 62 2 67 62-405B PO 204 75 173 64 2.72 627_4_06 PO 187 80 173 74 __2_..34_ 62-406A PO 186 75 174 70 2.47 62-40_63EO 1_9_52_411_7_____ 67 2 64 62-409 PO 106 61 92 53 1.72 62 - 413 PO 63 88 56 78 0.71_
129. PRIMARY BEDDED DOLOMITE HOST-ROCK, MT. RISCHOFF OPFN CUT. DEVONIAN. 100207 DOL 100_208 DOI
13 25 12 13 22 12
RFPIACING nninmrrF.
24 0.50 13 DDH NO. 5 21 0-59 S. END, OPEN CUT
S. FNn. MT. RISC:HOFF npPN cur. DEVONIAN. 130. MASSIVF, 100209 CA-R 100210 CA-R
14 20
12 20
14 19
12 19
1.15 * MANGANIFEROUS SIDERITE 1.02
100211 CA-R 100219 CA-R
9 14
14 15
8 14
13 14
0.61 0.96
* MANGANIFEROUS PISTOMACITE
101028A pY 1010288 PY
12 8
5 7
12 8
5 7
2.20 1.12
90 DDH 82, GREISEN FACE
101030A PY
1010308 PY 0
1 4
3 0
1 4
3 0.0
0.28 10 DDH B24, S. END, OPEN CUT
101032A ASPY 1010328 ASPY
73 75
4 8
73 74
4 7
20.08 9.88
SLAUGHTERYARD LODE
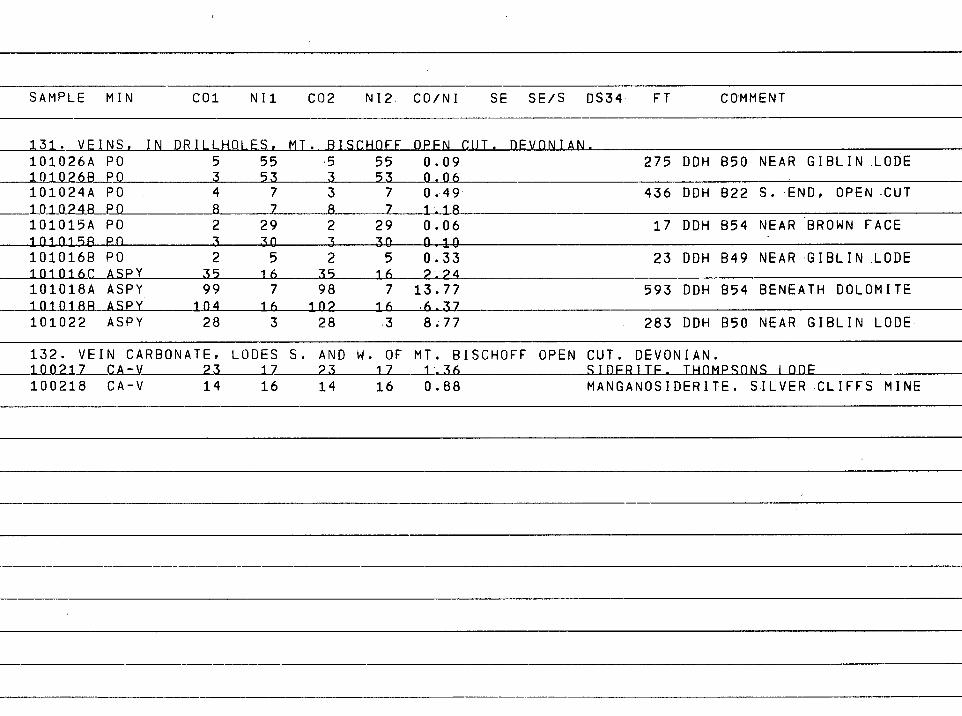
SAMPLE MIN CO1 Nil CO2 NI2 CO/NI SE SE/S DS34 FT COMMENT
131. VEINS, IN DRILLHOLES, MT. BiScHoFF OpFN CUT. nFvoNIAN. 101026A PO 5 55 .5 55 0.09 275 DDH 850 NEAR GIBLIN LODE 101026R PO 3 53 3 53 0.06 101024A PO 4 7 3 7 0.49 436 DDH 822 S. END, OPEN CUT
1_11_0248 PO 8 7 8 7 1.18 101015A PO 2 29 2 29 0.06 17 DDH 854 NEAR BROWN FACE 1010158 PO 3 30 3 30 0_10 1010168 PO 2 5 2 5 0.33 23 DDH B49 NEAR GIBLIN LODE 1_01_01_6C ASpY 35 16 35 16 2 24 101018A ASPY 99 7 98 7 13.77 593 DDH 954 BENEATH DOLOMITE ininiRR ASPY 104 16 102 16 '6.17 101022 ASPY 28 3 28 3 8.77 283 DDH 850 NEAR GIBLIN LODE
132. VEIN CARBONATE, LODES S. AND W. OF MT. BISCHOFF OPEN CUT. DEVONIAN. 100217 CA - v 23 17 23 17 _1-36 SIDPRITF. THnMPSnNS lonF 100218 CA-v 14 16 14 16 0.88 MANGANOSIDERITE. SILVER CLIFFS MINE
84
COBALT AND NICKEL ANALYSES
Sedimentary -Diagenetic
Pyrite which was confidently interpreted from field and textural
evidence to have been originally syngenetic with host sediments was
sampled from Tasmanian rocks of different ages, lithologies and degrees
of lithification and metamorphism. A summary of the field and textural
data is given in Table 6.1 (sets 2-17) and in Table 6.2. All samples
were shown by X-ray diffraction or mineragraphy to be pyrite, except
for one specimen in set 2 which contained some marcasite.
Some of the samples are somewhat unusual:
(a) The South Mt. Cameron (set 15) and King Island (set 17)
samples were included only for comparative purposes; both are terrestrial
whereas all the other pyrites are thought to be marine, and the King
Island pyrite at least is probably not syngenetic.
(b) There is a possibility that not all the pyrite in some of
the Rosebery hangingwall shale samples (set 6) is primary sedimentary, as
it proved difficult to remove all traces of minute cross-cutting pyritic
quartz veinlets. However sample nos. 100521-100522 are of pure segregated.
lenses.
The Co and Ni analyses are illustrated in Figure 6.1. Many of the
fields are elongate approximately parallel to lines of constant Co/Ni
ratio, indicating intake of Co and Ni by the crystallizing or re-
crystallizing suiphide from a constant Co-Ni supply. Because of the
wide sample spacing (tens of yards) within many sample sets, this must
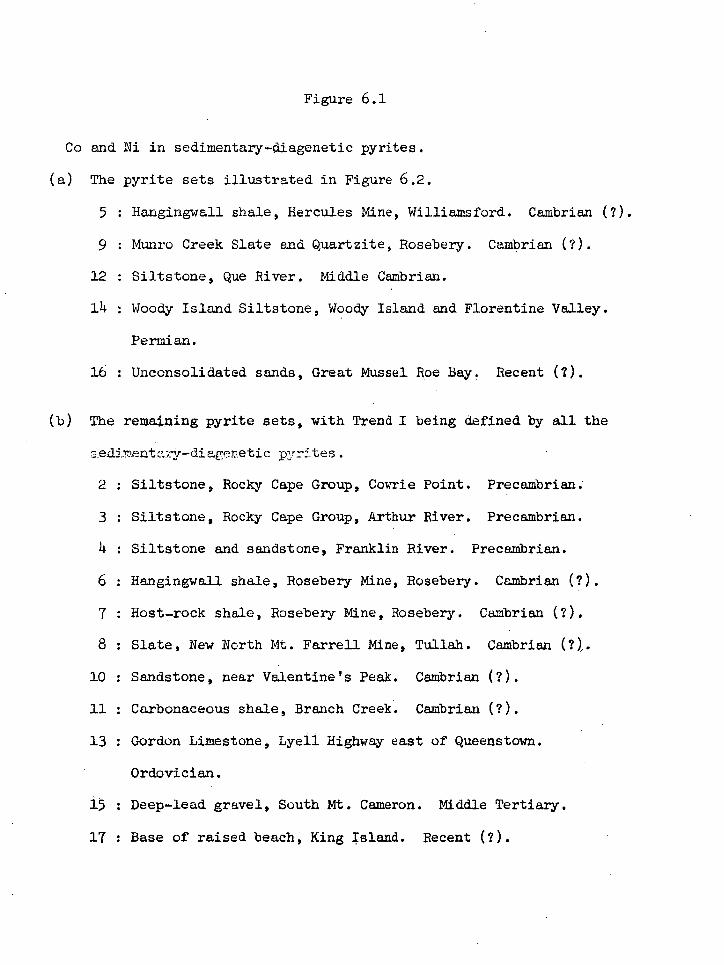
Figure 6.1
Co and Ni in sedimentary-diagenetic pyrites.
(a) The pyrite sets illustrated in Figure 6.2.
5 : Hangingwall shale, Hercules Mine, Williamsford. Cambrian (?).
9 : Munro Creek Slate and Quartzite, Rosebery. Cambrian (?).
12 : Si•tstone, Que River. Middle Cambrian.
14 : Woody Island Siltstone, Woody Island and Florentine Valley.
Permian.
16 : Unconsolidated sands, Great Mussel Roe Bay. Recent (?).
(b) The remaining pyrite sets, with Trend I being defined by all the
aedimentary-diagenetic pyrites.
2 : Siltstone, Rocky Cape Group, Cowrie Point. Precambrian
3 : Siltstone, Rocky Cape Group, Arthur River. Precambrian.
4 : Siltstone and sandstone, Franklin River. Precambrian.
6 : Hangingwall shale, Rosebery Mine, Rosebery. Cambrian (?).
7 : Host-rock shale, Rosebery Mine, Rosebery. Cambrian (?).
8 : Slate, New North Mt. Farrell Mine, Tullah. Cambrian 01.
10 : Sandstone, near Valentine's Peak. Cambrian (?).
11 : Carbonaceous shale, Branch Creek. Cambrian (?).
13 : Gordon Limestone, Lyell Highway east of Queenstown.
Ordovician.
15 : Deep-lead gravel, South Mt. Cameron. Middle Tertiary.
17 : Base of raised beach, King Island. Recent (?).
1000-
Co PPm
100-
12
14
.5
10-
1 10 100 Ni
1600 ppm
(a)
1000
CO PPm
100
•15
10
10 000 1000 1 100 Ni Pil ppm
(b)
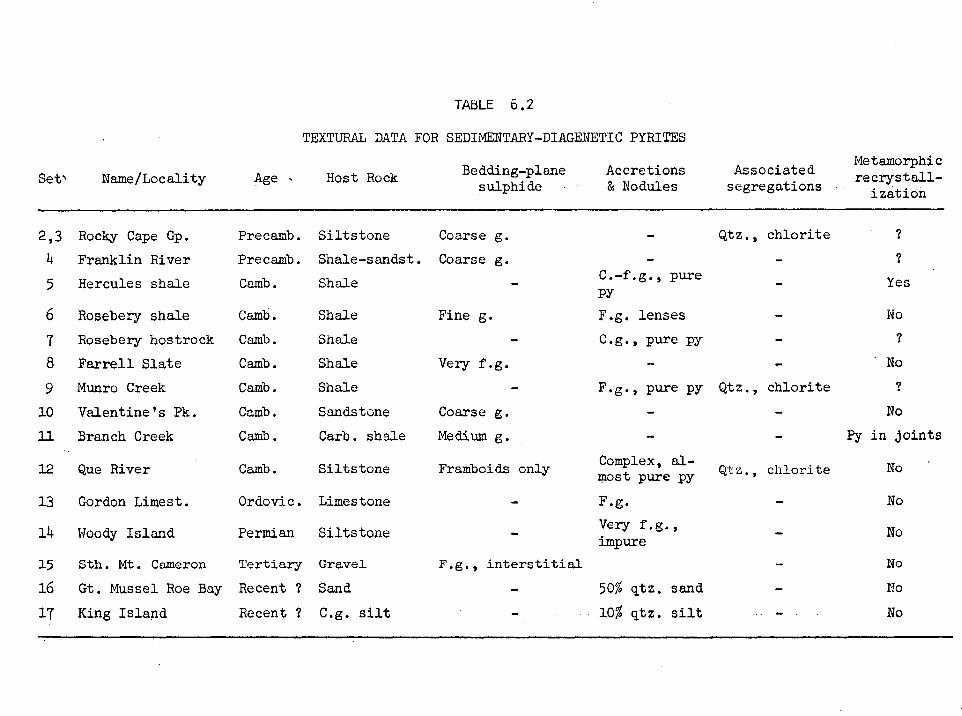
Set' Name/Locality Age •
TAULE 6.2
TEXTURAL DATA FOR SEDIMENTARY-DIAGENETIC PYRITES
Bedding-plane Accretions Host Rock sulphide & Nodules Associated segregations
Metamorphic recrystall-
ization
2,3
4
5
6
7
8
9
10
11
12
13
14
15
16
17
Rocky Cape Gp.
Franklin River
Hercules shale
Rosebery shale
Rosebery hostrock
Farrell Slate
Munro Creek
Valentine's Pk.
Branch Creek
Que River
Gordon Limest.
Woody Island
Sth. Mt. Cameron
Gt. Mussel Roe Bay
King Island
Precamb.
Precamb.
Camb.
Camb.
Camb.
CaMb.
Camb.
Camb.
Camb.
Camb.
Ordovic.
Permian
Tertiary
Recent ?
Recent ?
Siltstone
Shale-sandst.
Shale
Shale
Shale
Shale
Shale
Sandstone
Carb. shale
Siltstone
Limestone
Siltstone
Gravel
Sand
C.g. silt
Coarse g.
Coarse g.
Fine g.
Very f.g.
Coarse g.
Medium g.
Fratboidz only
-
-
F.g., interstitial
C.-f.g., pure PY
F.g. lenses
C.g., pure py
F.g., pure py
Complex, al- most pure py
F.g.
Very f.g., impure
50% qtz. sand
10% qtz. silt
Qtz., chlorite
Qtz., chlorite
Qtz., chlorite
Yes
No
' No
No
Py in joints
No '
No
No
No
No
No
86
reflect quite a large scale uniformity of trace element availability
within some sediments. This conclusion is supported by the similarity
of Co-Ni values in Rocky Cape Group pyrites samples 16 miles apart
(sets 2 and 3).
The fields lie below the line Co/Ni = 0.5, with the exception of
sets 4 and 15, which are discussed below:
(i) The Franklin River samples (set 4) are from three different
rock types containing pyrite of different grain-size, yet all show a
major enrichment in Co. Although dolerite, presumably Precambrian,
intrudes the Precambrian sediments within 400 yards of the sampling site
(A.B. Gulline, pers. comm.), no satisfactory explanation can at present
be given for this enrichment. The only other Tasmanian pyrite with
similar composition is that from the Savage River magnetite deposit
(set 18), the host rocks of which are probably metamorphosed Precambrian
dolerites.
(ii) Interpretation of the Co-rich deep-lead pyrite from South
Mt. Cameron (set 15) must await further analyses of this material.
Apart from the above sets, the Co-Ni concentrations generally fall
within the ranges listed in Chapter 3 (Table 3.3) for sedimentary pyrites,
The marked exception is that pyrite from the highly carbonaceous shale at
Branch Creek (set 11) shows very low Co and Ni values. Although this
anomaly requires further investigation with more samples, the following
possible explanation is proposed. In Table 6.3 are listed some prelim-
inary analyses by C.E. Gee (Geology Department, University of Tasmania)
of the sedimentary formations from which sample. sets 6, 12 and 11 were
taken. Assuming that all the Fe in the sediment was present as FeS2
which had the average Ni composition determined in this study, partition
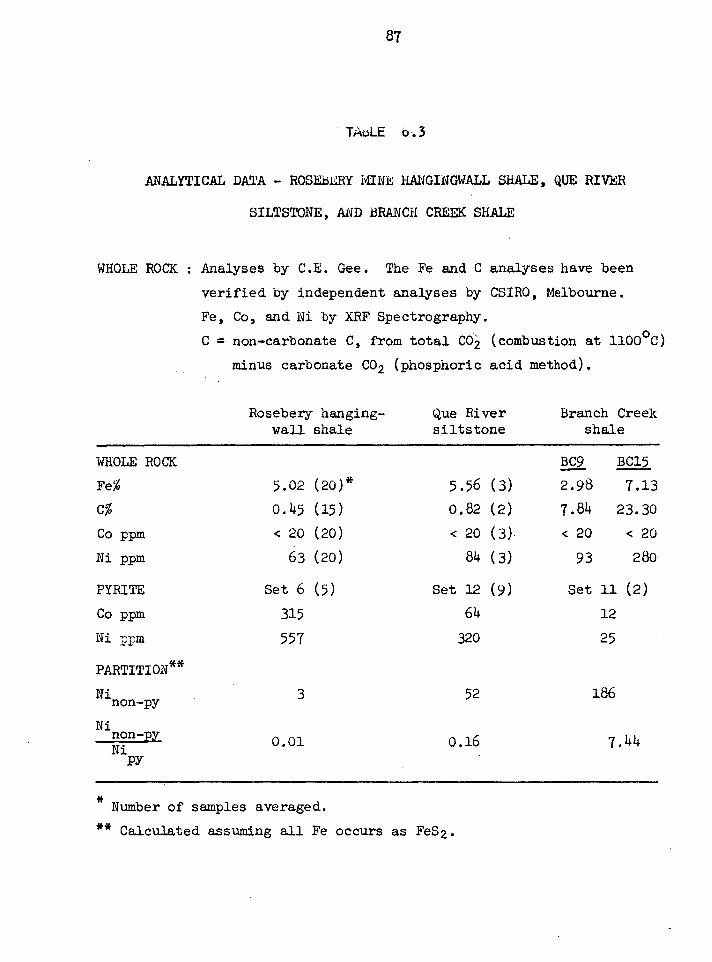
87
TABLE 6-.3
ANALYTICAL DATA - ROSEBERY MINE HANGINGWALL SHALE, QUE RIVER
SILTSTONE, AND BRANCH CREEK SHALE
WHOLE ROCK : Analyses by C.E. Gee. The Fe and C analyses have been
verified by independent analyses by CSIRO, Melbourne.
Fe, Co, and Ni by XRF Spectrography.
C = non-carbonate C, from total CO2 (combustion at 1100 °C)
minus carbonate CO2 (phosphoric acid method).
Rosebery hanging- wall shale
Que River siltstone
Branch Creek shale
WHOLE ROCK BC9 BC15
Fe% 5.02 (20) * 5.56 (3) 2.98 7.13
C% 0.45 (15) 0.82 (2) 7.84 23.30
Co ppm < 20 (20) < 20 (3) < 20 < 20
Ni ppm 63 (20) 84 (3) 93 280
PYRITE Set 6 (5) Set 12 (9) Set 11 (2)
Co ppm 315 64 12
Ni lopm 557 320 25
PARTITION**
Ninon-py 3 52 186
Ninon-py 0.01 0.16 7.44 Ni PY
Number of samples averaged.
** Calculated assuming all Fe occurs as FeS2.
88
of Ni between the pyrite and non-pyrite fractions could be calculated.
Two correlations are evident:
(a) In the Branch Creek shale, the total Ni content is approx-
imately proportional to the non-carbonate C content.
(b) The partition factor Ninon-py/Nipy in the three rocks is
also approximately proportional to the non-carbonate C content.
This preliminary evidence not only supports the contention that the
original Ni content of a carbonaceous shale can be mainly a function of
the content of carbonaceous material, but suggests that for constant Fe
content and metamorphic grade (as allowed by this study) the pyrite phase
will sequester a successively smaller proportion of the available Ni as
the carbonaceous content increases, the balance presumably being bonded
to the carbonaceous fraction.
The Co-Ni values do not appear to correlate with the age of the
sediments, but in view of the results of previous workers, correlations
were sought between trace element content and metamorphic grade. As
most of the sediments studied were relatively unmetamorphosed, an attempt
was made to relate Co-Ni content to the extent of recrystallization of
pyrite nodules. Because of the great variation observed in original
sedimentary textures, criteria for the extent of modification of the
textures during diagenesis or metamorphism were almost impossible to
define. Progressive increase in grain size and ejection of impurities
from nodules and crystals probably occur during recrystallization
(Pettijohn, 1956, p.203), but the initial variability of these para-
meters precludes the assigning of a texture to a particular stage of
recrystallization. This study suggests that very little modification
89
of original textures occurs until the sediment is quite strongly meta-
morphosed, because examples "a" (Recent) to "d" (Cambrian) in Figure 6.2
could all be original textures, and framboids are preserved in the
Cambrian sediments (and of course in much older sediments elsewhere).
On the other hand, it is only in Some of the older rocks (Que River
siltstone; Munro Creek Slate and Quartzite; Rocky Cape Group) that
chlorite*
(and sometimes quartz*, and possibly carbonaceous material)
is found intimately associated with the pyrite, sometimes in the form
of pressure shadows. These may be segregated impurities ejected from
the pyrite crystals and nodules during recrystallization, which has also
been responsible in some of these older rocks for rotating the bedding-
plane .pyrite into the cleavage. The sequence a-b, c-d, e, in Figure 6.2
could then represent a trend of increasing purification with recrystallir
zation, but such a trend shows no particular correlation with the CorNi
values.
Metamorphism as distinct from diagenetic recrystallization of a
pyrite nodule was established with some certainty in the case of the
large nodule in the Hercules shale (set 5; Fig. 6.2e). Plates 6.1 and
6.2 show textures in the outer rim of this nodule which were revealed
only after electrolytic etching. Euhedxal cores of growth-zoned pyrite
occur in grains which may themselves be growth-zoned (Plate 6.2), may
show a rim zone (Plates 6.1, 6.2), and often meet at triple-junction
points at approximately 1200 (Plate 6.1). More than one core may be
present in a grain (Plate 6.2). Han (1968) considered textures similar
to these (his Figs. 8a, b) to have formed by supergene alteration of
determined by X-ray diffraction.
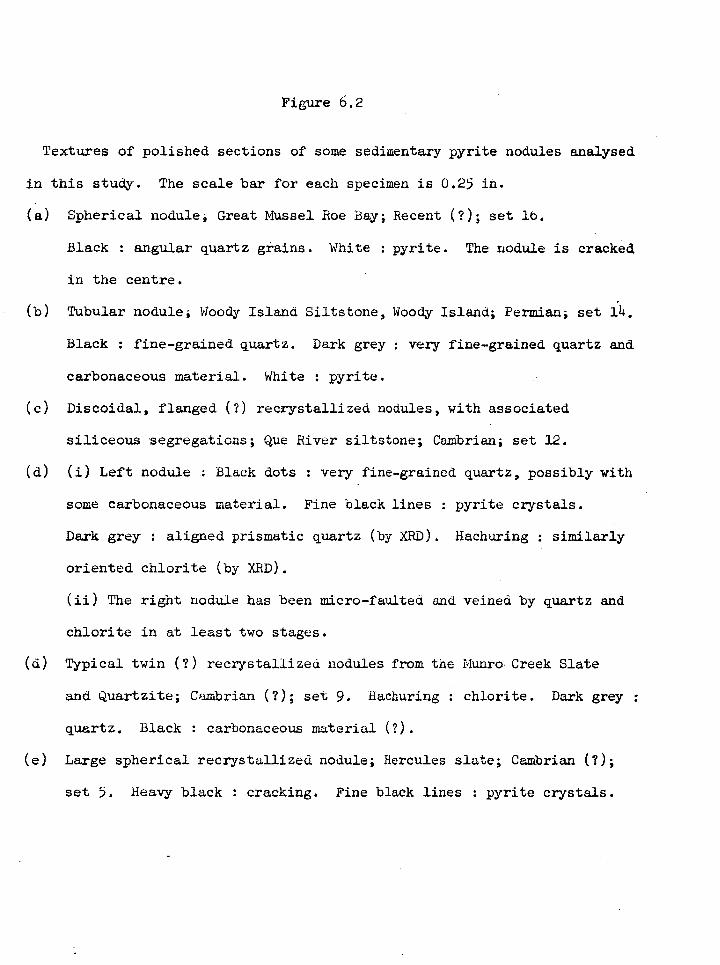
Figure 6.2
Textures of polished sections of some sedimentary pyrite nodules analysed
in this study. The scale bar for each specimen is 0.25 in.
(a) Spherical nodule; Great Mussel Roe Bay; Recent (?); set 16.
Black : angular quartz grains. White : pyrite. The nodule is cracked
in the centre.
(b) Tubular nodule; Woody Island Siltstone, Woody Island; Permian; set 14.
Black : fine-grained quartz. Dark grey : very fine-grained quartz and
carbonaceous material. White : pyrite.
(c) Discoidal, flanged (?) recrystallized nodules, with associated
siliceous segregations; Que River siltstone; Cambrian ; set 12.
(d) (i) Left nodule : Black dots : very , fine-grained quartz, possibly with
some carbonaceous material. Fine black lines : pyrite crystals.
Dark grey : aligned prismatic quartz (by XRD). Hachuring : similarly
oriented chlorite (by XRD).
(ii) The right nodule has been micro-faulted and veined by quartz and
chlorite in at least two stages.
(d) Typical twin (?) recrystallized nodules from the Munro. Creek Slate
and Quartzite; Cambrian (?); set 9. Hachuring : chlorite. Dark grey :
quartz. Black : carbonaceous material (?).
(e) Large spherical recrystallized nodule; Hercules slate; Cambrian (?);
set 5. Heavy black : cracking. Fine black lines : pyrite crystals.
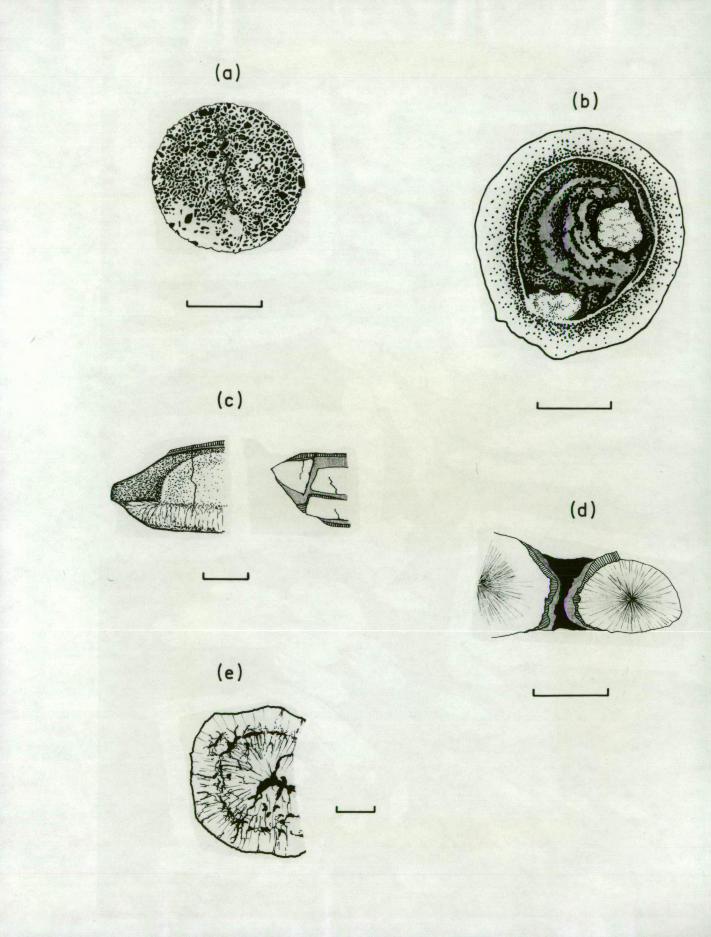
(a)
, •rro!te ..t.71 1,
(b)
(c)
(d)
(e)
Plate 6.1
Textures in a sedimentary pyrite nodule (33886) from
the Hercules Mine hangingwall shale (set 5). The polished
sections have been electrolytically etched.
TOP Pyrite grains, showing rim zones, and a growth-
zoned core (x 350).
BOTTOM Enlargement of the growth-zoned core in the top
illustration (x 1030).
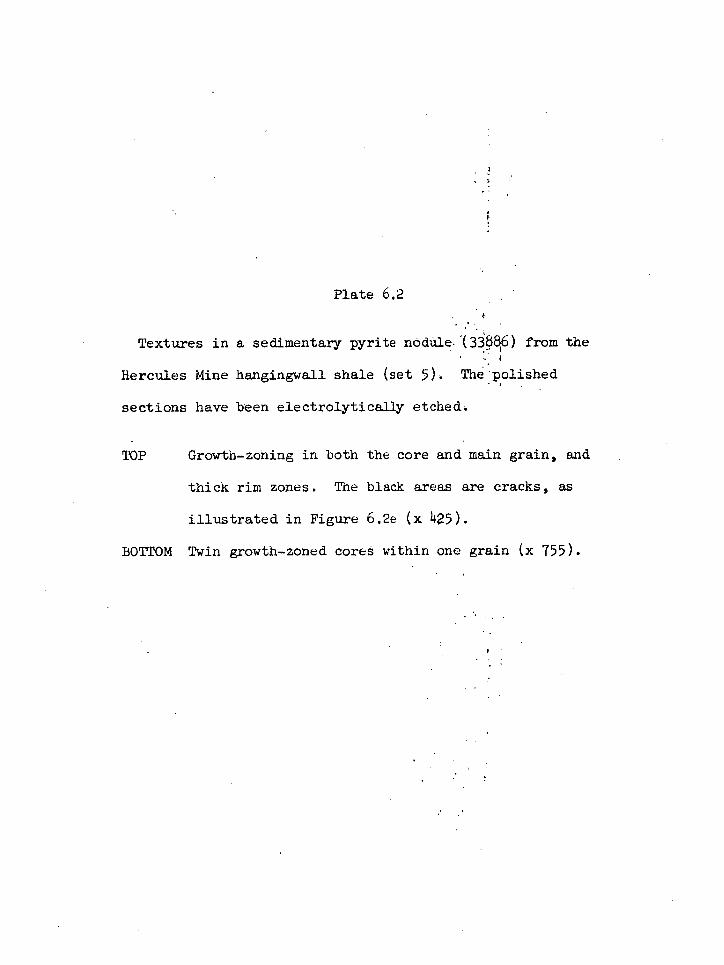
Plate 6.2
Textures in a sedimentary pyrite nodule. (336) from the 4
Hercules Mine hangingwall shale (set 5). The polished
sections have been electrolytically etched.
TOP Growth-zoning in both the core and main grain, and
thick rim zones. The black areas are cracks, as
illustrated in Figure 6.2e (x 425).
BOTTOM Twin growth-zoned cores within one grain (x 755).
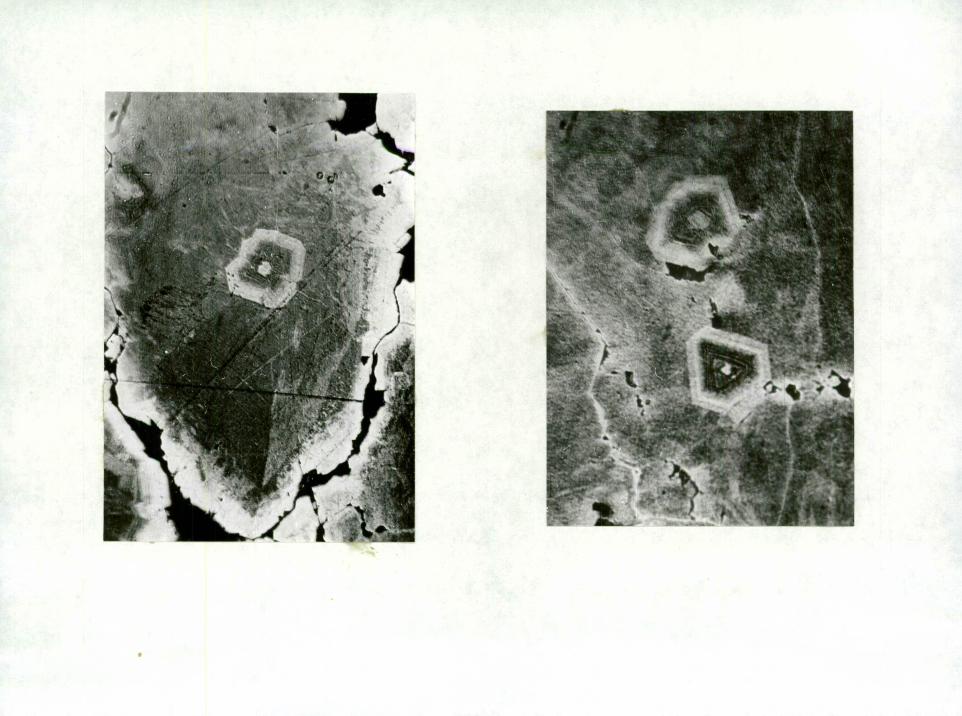
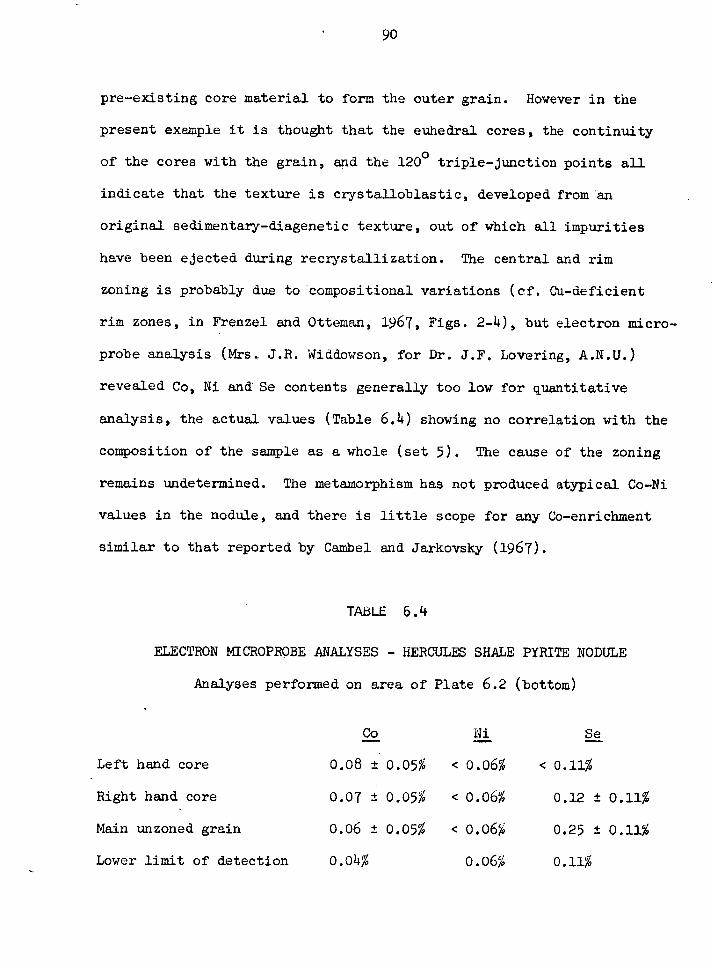
90
pre-existing core material to form the outer grain. However in the
present example it is thought that the euhedral cores, the continuity
of the cores with the grain, and the 120° triple-junction points all
indicate that the texture is crystalloblastic, developed from an
original sedimentary-diagenetic texture, out of which all impurities
have been ejected during recrystallization. The central and rim
zoning is probably due to compositional variations (cf. Cu-deficient
rim zones, in Frenzel and Otteman, 1967, Figs. 2-4), but electron micro-
probe analysis (Mrs. J.R. Widdowson, for Dr. J.F. Lovering, A.N.U.)
revealed Co, Ni and Se contents generally too low for quantitative
analysis, the actual values (Table 6.4) showing no correlation with the
composition of the sample as a whole (set 5). The cause of the zoning
remains undetermined. The metamorphism . has not produced atypical Co-Ni
values in the nodule, and there is little scope for any Co-enrichment
similar to that reported by Cambel and Jarkovsky (1967).
TABLE 6.4
PLECTRON MICROPROBE ANALYSES - HERCULES SHALE PYRITE NODULE
Analyses performed on area of Plate 6.2 (bottom)
Co Ni Se
Left hand core 0.08 t 0.05% < 0.06% < 0.11%
Right hand core 0.07 ± 0.05% < 0.06% 0.12 ± 0.11%
Main unzoned grain 0.06 ± 0.05% < 0.06% 0.25 ± 0.11%
Lower limit of detection 0.04% 0.06% 0.11%
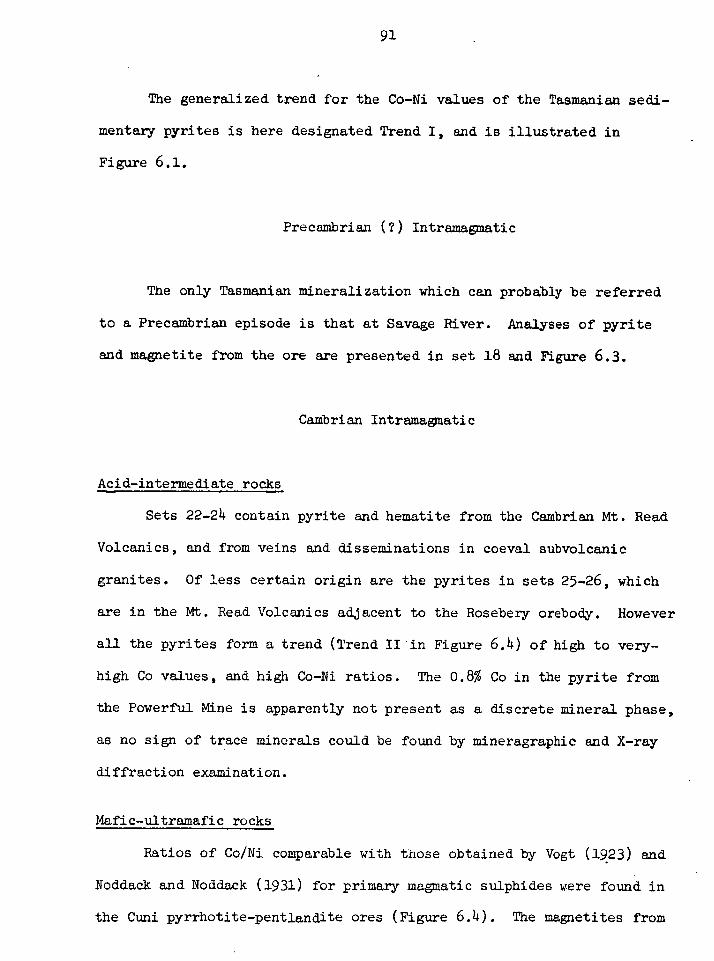
91
The generalized trend for the Co-Ni values of the Tasmanian sedi-
mentary pyrites is here designated Trend I, and is illustrated in
Figure 6.1.
Precambrian (?) Intramagmatic
The only Tasmanian mineralization which can probably be referred
to a Precambrian episode is that at Savage River. Analyses of pyrite
and magnetite from the ore are presented in set 18 and Figure 6.3.
Cambrian Intramagmatic
Acid-intermediate rocks
Sets 22-24 contain pyrite and hematite from the Cambrian Mt. Read
Volcanics, and from veins and disseminations in coeval subvolcanic
granites. Of less certain origin are the pyrites in sets 25-26, which
are in the Mt. Read Volcanics adjacent to the Rosebery orebody. However
all the pyrites form a trend (Trend II in Figure 6.4) of high to very-
high Co values, and high Co-Ni ratios. The 0.8% Co in the pyrite from
the Powerful Mine is apparently not present as a discrete mineral phase,
as no sign of trace minerals could be found by mineragraphic and X-ray
diffraction examination.
Mafic-ultramafic rocks
Ratios of Co/Ni comparable with those obtained by Vogt (1923) and
Noddack and Noddack (1931) for primary magmatic sulphides were found in
the Cuni pyrrhotite-pentlandite ores (Figure 6.4). The magnetites from
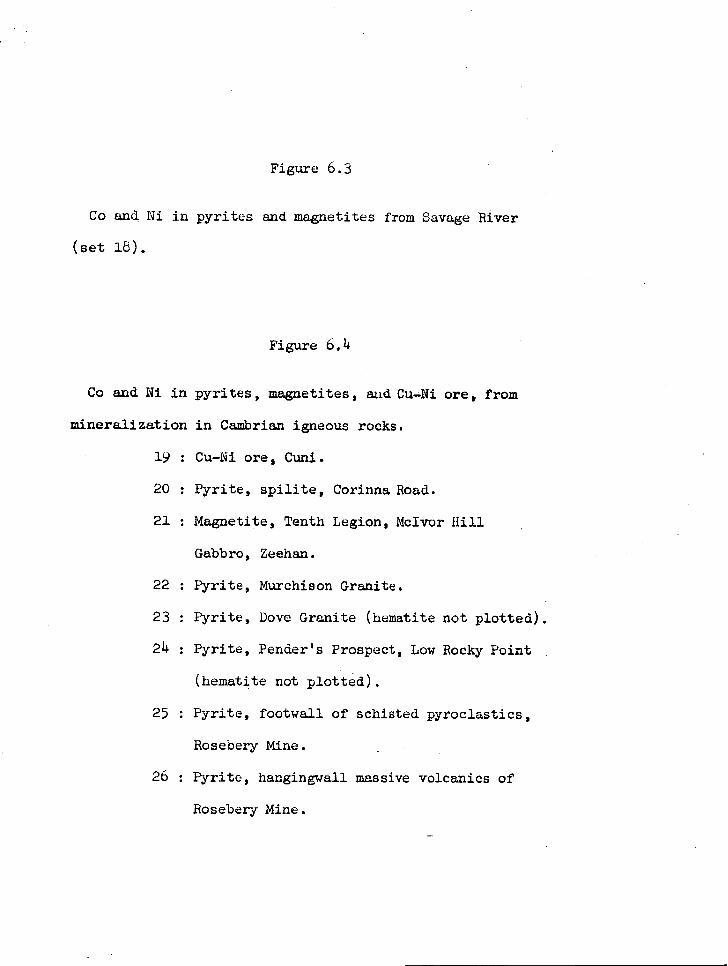
Figure 6.3
Co and Ni in pyrites and magnetites from Savage River
(set 18).
Figure 6.4
Co and Ni in pyrites, magnetites, and Cu- ,Ni ore, from
mineralization in Cambrian igneous rocks.
19 : Cu-Ni ore, Cuni.
20 : Pyrite, spilite, Corinna Road.
21 : Magnetite, Tenth Legion, McIvor Hill
Gabbro, Zeehan.
22 : Pyrite, Murchison Granite.
23 : Pyrite, Dove Granite (hematite not plotted).
24 : Pyrite, Fender's Prospect, Low Rocky Point
(hematite not plotted).
25 : Pyrite, footwall of schisted pyroclastics,
Rosebery Mine.
26 : Pyrite, hangingwall massive volcanics of
Rosebery Mine.
p y /
mg
10030-
/ Locality 1
/ Locality 2
/ / Locality 3
1000
CO PPm
100
10
10 loo
N i ppm lOoo
10000
27
Trend II / 19,
100 1000 ppm 1 1 '0% Ni
10000-
1000
CO PPm
100
10
1
92
the Tenth Legion deposit have similar Co/Ni ratios, but the Co and Ni
contents are much more like those in the magnetites at Savage River.
The spilite pyrite nodules, however, in accordance with their later
stage of derivation, are Co-enriched, and actually fall into Trend II
defined for the pyrites in acid-intermediate rocks.
Devonian Intramagmatic and Hydrothermal
The Devonian intramagmatic and hydrothermal vein and replacement
deposits are more numerous and cover a wider area than any other
category of deposit sampled in this study. Analyses of pyrite,
pyrrhotite, and chalcopyrite are summarized in Figures 6.5-6.6, but
pyrrhotite and arsenopyrite analyses from Mt. Bischoff and Benison Bell
are plotted in Figures 6.21 and 6.22.
These deposits show trends (Fig. 6.6b) to high Ni with low Co/Ni
ratio (III), to medium Co with Ni approximately constant (IV), and a
negative correlation trend (V). Trend V is followed only by the
Heemskirk'and Zeehan analyses. Although the analyses of Zeehan pyrites
by the writer and Williams (1968) are not coincident, their trends are
very similar. The extension of Trends III and V to high Ni values is
consistent with (although not caused by) the occurrence of Ni arsenides
and sulpharsenides in the ZeehanDundas area (Petterd, 1910; Stillwell,
1935; Williams, 1958, 1968; Both, 1966). As Williams (1958) noted,'this
Ni enrichment could be due to contamination of the Devonian mineralizing
fluids by the nickeliferous Cambrian igneous country rocks in the
area.
Figure 6.5
Co and Ni in pyrites and pyrrhotites from Devonian ores.
(a) Pyrites from all environments of deposition at Mt. Bischoff (B)
and at Benison Bell (R), and pyrrhotites from Cleveland (C).
For details see Figures 6.21, 6.22.
(b) Pyrites
W :
27, 26 :
56 :
59 :
60 :
61 :
62 :
63 :
65 :
66 :
from the Zeehan-Dundas area.
Results of analyses of pyrites from Zeehan by Williams
(1968). More details are given in Figure 6.29.
Lodes in the Heemskirk Granite.
Vein, Zeehan-Montana Mine, Zeehan.
Vein, Zeehan-,Queen Mine, Zeehan.
Vein, Comet Mine, Dundas.
Vein, South Comet Mine, Dundas.
Vein, West Comet Mine, Dundas.
Vein, Kapi Mine, north Dundas.
Vein, Ransdale Prospect, north-east Dundas.
Vein, Fahl Mine, north-east Dundas.
c,
1 000-
100-
CO PPm
10-
(a)
10 160 Ni ppm
1000-
100-
CO PPm
10-
100 1000
(b) Ni ppm
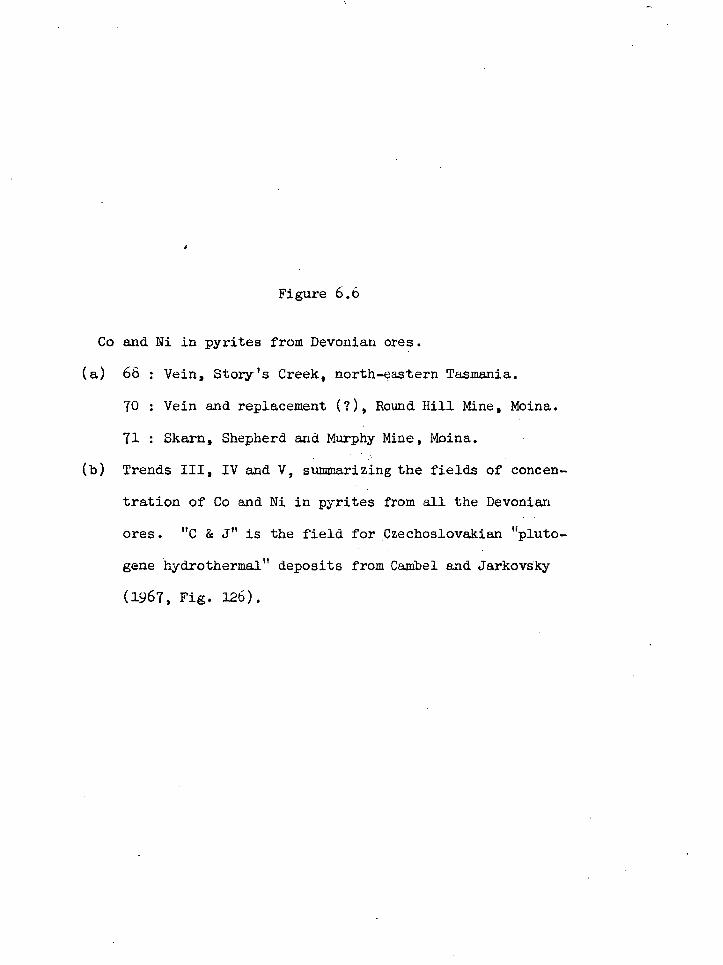
Figure 6.6
Co and Ni in pyrites from Devonian ores.
(a) 66 : Vein, Story's Creek, north-eastern Tasmania.
70 : Vein and replacement (?), Round Hill Mine, Moina.
71 : Skarn, Shepherd and Murphy Mine, Mbina.
(b) Trends III, IV and V, summarizing the fields of concen-
tration of Co and Ni in pyrites from all the Devonian
ores. "C & J" is the field for Czechoslovakian "pluto-
gene hydrothermal" deposits from Cambel and Jarkovsky
(1967, Fig. 126).
10000
1000
CO PPm
100
',.. ...- -...... _ .......-- \ ...--- \ .....- ..-
10
1
/
//
/// Trend V
1
,
Trend IV
//
Trend III
/
/ 1
/ 1 /
/ I
C$1.1
-, -- - - ---.
...- .
,-- . / \
/ / \
1
/1 /
/ /
:-
/
100 1000 1 0 000
/ /
/ /
/
\
/ /
/ /
/
0
/ /
/
1 10 N i ppm
(a)
100
1000
N i ppm
(b)
93
Included in Figure 6.6b for comparison is the trend for
Czechoslovakian hydrothermal deposits given by Cambel and Jarkovsky
(1967, fig. 126). Their trend is between trends III and IV, and the
Tasmanian pyrites have a relative deficiency in both Co and Ni.
Mt. Lyell
The analyses of pyrites and chalcopyrites have been grouped geo-
graphically, then subdivided with respect to mode of occurrence, in
Figures 6.7 - 6.8. Although the overall trend shows Co > Ni, both
linnaeite and pentlandite have been recorded from these ores (Edwards,
1939). Figure 6.8c includes the trend for Czechoslovakian volcanic
pyritic-Cu ores (Cambel and Jarkovsky, 1967, fig. 124).
Rosebery-Hercules District
The analyses for the sample sets from the main Zn-Pb-Cu lode are
given in Figure 6.9. Sets 109-110 are plotted in full in Figure 6.32.
The lode analyses have then been generalized and compared with the
other mineralization surrounding the lode, in Figure 6.10a. In Figure
6.10b are included the analyses of the Hercules lode, and of the samples
from the Black P.A. and the Natone Volcanics.
Figure 6.7
Co and Ni in pyrites and cha1copyrites from the West Lyell area.
(a) Disseminations in schist:
77 : Prince Lyell orebody, Open Cut.
78 : Prince Lyell orebody, DDH WL 229, beneath Open Cut.
79 : Prince Lyell orebody, DDH WL 146, beneath Open Cut.
80 : Prince Lyell orebody, DDH WI 150, beneath Open Cut.
(b) Disseminationr, in band in the schistosity:
85 : West of Honeypot orebody (Fig. 5.5), Open Cut.
86 : 10 ft. west of 85.
87 : 42 ft. west of 86.
88 : Honeypot orebody, Open Cut.
(c) Quartz veins formed by remobilization:
81 : Prince Lyell orebody, DDH WL 146, 150, 229.
614 : South-east corner, Open Cut.
1000
CO PPM
100
10000
10
CO PPm
10
1000
100
10 1 I 1 ; pp 100
m
10 N1 ; pp too m
(b)
(c)
1000
1000
Figure 6.8
Co and Ni in pyrites from Mt. Lyell lodes other than in the West Lyell
area.
(a) The Blow (Mt. Lyell) Open Cut:
72 : Top of massive Blow orebody.
73 : Replacement band parallel to schistosity, 6 ft. above 72.
74 : 15 ft. west of 73. .
75 : 10 ft. west of 74.
76 : Replacement band parallel to schistosity, about 50 ft. above 72.
(b) Mineralization to the north of the West Lyell Open Cut:
89 : Disseminations in schist, Cape Horn pyrite body.
90 ; Quartzose bands in the schist associated with 89.
91 : Disseminations in schist, Crown Lyell.
(c) Mineralization in the Comstock area:
94 : Massive, Comstock Open Cut.
95 : Massive, Tasman and Crown Lyell.
"C & J" is the general trend for epizonally metamorphosed ftvolcanic-
exhalative" pyritic Cu ores from Smolnik and Mnisek, Czechoslovakia
(Cambel and Jarkovsky, 1967, Fig. 124). About 25% of the analyses are
outside the field as given, with higher Ni contents up to 300 ppm.
1.
CO PPm
100
10-
1000 1000 G --).91
10000-
/
y CO PPm
100-
10
1 Ni ppm
(0) (b)
10 100 coo Ni PPm 10 100 200 1
89
10 100 Ni PPm
1000
(c)
Figure 6.9
Co and Ni in pyrites and pyritic ore from the main lode, Rosebery Mine.
The "lenses" refer to steeply pitching, thicker portions of the folded
orebody, which have previously been considered to be en echelon replace-
ment lodes. "B" lens is at the north of the mine, "F" lens at the south.
"Footwall" and "hangingwall" below refer to the "bottom" and "top"
portions of the lode itself.
B lens : 99 : Massive pyritic ore, hangingwall, 12 level.
115 : In brecciated carbonate, marginal to footwall, 8 level.
D lens : 101 : Medium-grained pyritic ore, footwall, 13 level.
102 : Massive pyritic ore, hangingwall, 13 level.
E lens : 100 : Massive pyritic ore, footwall, 12 level.
103 : Medium-grained pyritic ore, footwall, 13 level.
109, 110 : Those samples from 14 level S2N stope which were
purified >95% pyrite (see also Fig. 6.32).
111 : Massive pyritic ore, footwsll, 14 level, 80 ft. from 109.
114 : Banded pyrite-chalcopyrite ore, footwall, 17 level.
This field represents four quarters of a 4.6 g specimen.
F lens : 104 : Banded coarse-grained pyritic ore, centre of lode,
13 level.
105 : Fine-grained pyritic ore, footwall, 13 level.
106 : Disseminated in schist, footwall, 13 level.
112 : Coarse-grained banded pyrite-chalcopyrite ore, footwall,
14 level.
1\ I \
1 \ \ \
\--..._103
I 02
1 \ 114 st.N
1 \ \ / i ll°
1
/ 1 \
\ < 1 \
100/ 1 \ \ 1 \ \
\ i \
CO PPm
B Lens 0
D Lens
E lens
F lens
Ni ppm
Figure 6.10
Co and Ni in pyrites and pyritic ore, Rosebery-Hercules area.
(a) SummAry of results for samples across the section of the
Rosebery Mine (see Fig. 5.7b):
(i) Footwall of the mine : disseminated and veinlet pyrite
in schisted pyroclastics (25).
(ii) Main Lode (from Fig. 6.9).
(iii)Host rock shale, sedimentary pyrite (7).
(iv) Pyrite from the pyrite-hematite lode (107).
(v) Sedimentary pyrite, and pyrrhotite veinlets (triangles)
from the hangingwall dark grey shale (6, 116).
(vi) Pyrite vein in the hangingwall massive volcanics (26).
(b) (i) Pyrite from the Hercules Lode (117), and sedimentary
pyrite from the "slate" in the hangingwall of the lode
(5).
(ii) Pyrite from the Black P.A. Mine (125) and the . Natone
Volcanics (126).
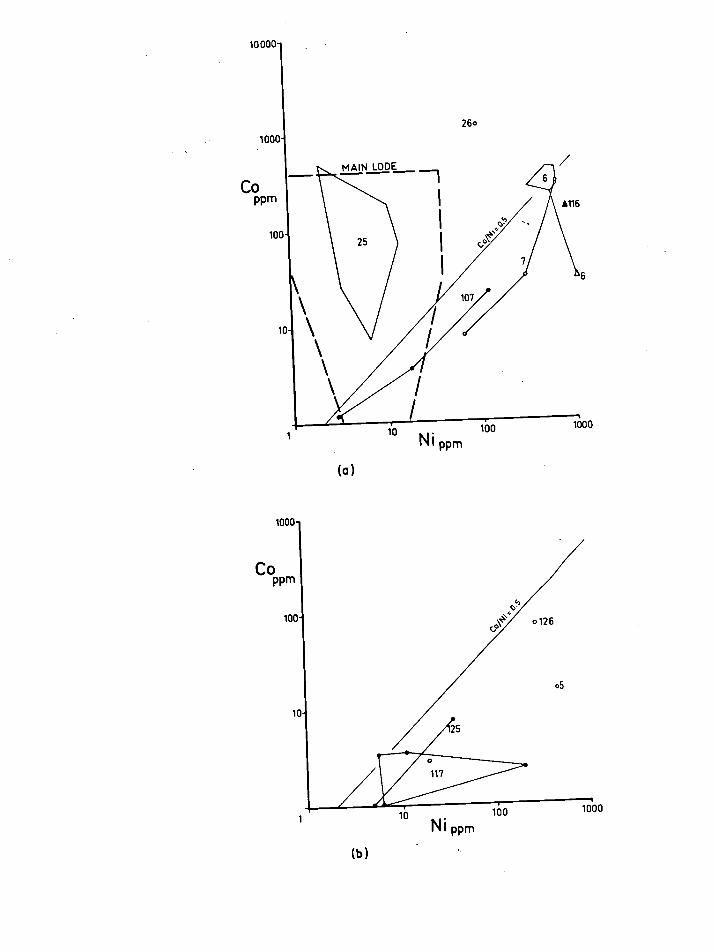
10
1
MAIN LODE n
I
1
1
1
/ /
/ /
2 6° 1000
10
Nippin
100 1000
(a)
co pPm
100
10 000
(b)
94
Mt. Farrell group, Mt. Remus
All analyses from the Mt.Farrellgroup of mines, including an
analysis of sedimentary pyrite, are plotted in Figure 6.11a.
Figure 6.11b includes the values for pyrites from the Mt. Remus
prospect.
Lake George, Captain's Flat, N.S.W.
As a test of the possible correlation of Co-Ni relationships in
stratiform banded Zn-Pb-Cu deposits within one geosyncline, specimens
(set 127) were collected on the surface and from drill core at the
Lake George Mine for comparison with the Rosebery specimens. The two
mines are 500 miles apart.
The genesis of the Lake George orebodies has been discussed by
Glasson and Paine (1965). While these authors maintain that in its
present position the ore is structurally controlled, there is also
strong evidence of stl'atigraphic control. As the ore is associated
with acid volcanics, and some at least of the pyrite is obviously syn-
genetic, the possibility exists of a volcanic-sedimentary origin for
all the ore (Stanton and Rafter, 1966).
The Co-Ni results are plotted in Figure 6.11b.
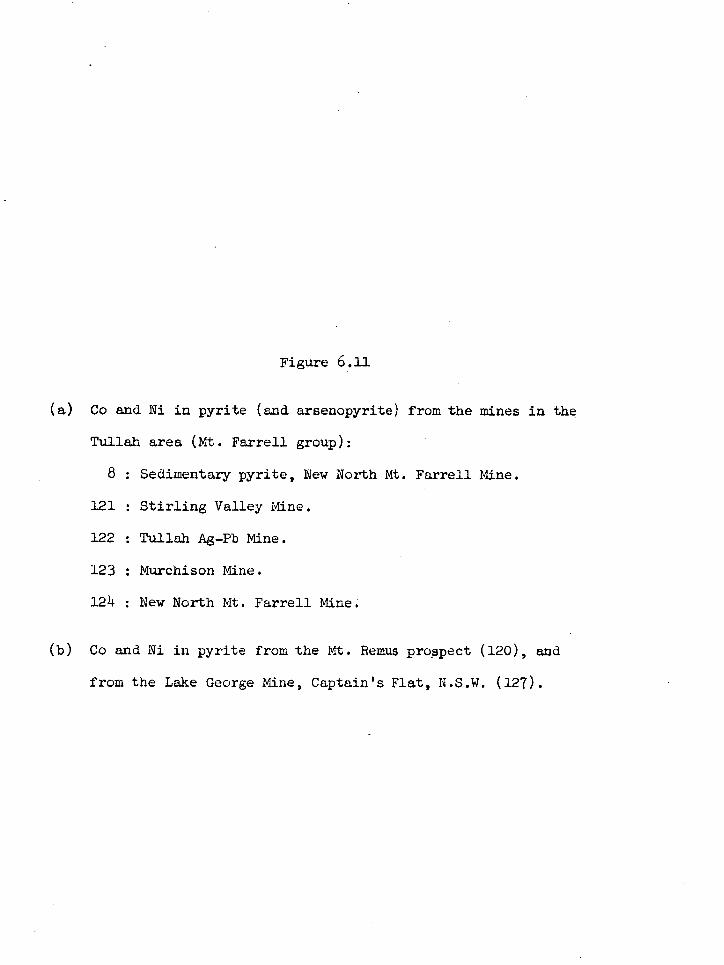
Figure 6.11
(a) Co and Ni in pyrite (and arsenopyrite) from the mines in the
Tullah area (Mt. Farrell group):
8 : Sedimentary pyrite, New North Mt. Farrell Nine.
121 : Stirling Valley Nine.
122 : Tullah Ag-Pb Mine.
123 : Murchison Mine.
124 : New North Mt. Farrell Mine.
(b) Co and Ni in pyrite from the Mt. Remus prospect (120), and
from the Lake George Mine, Captain's Flat, N.S.W. (127).
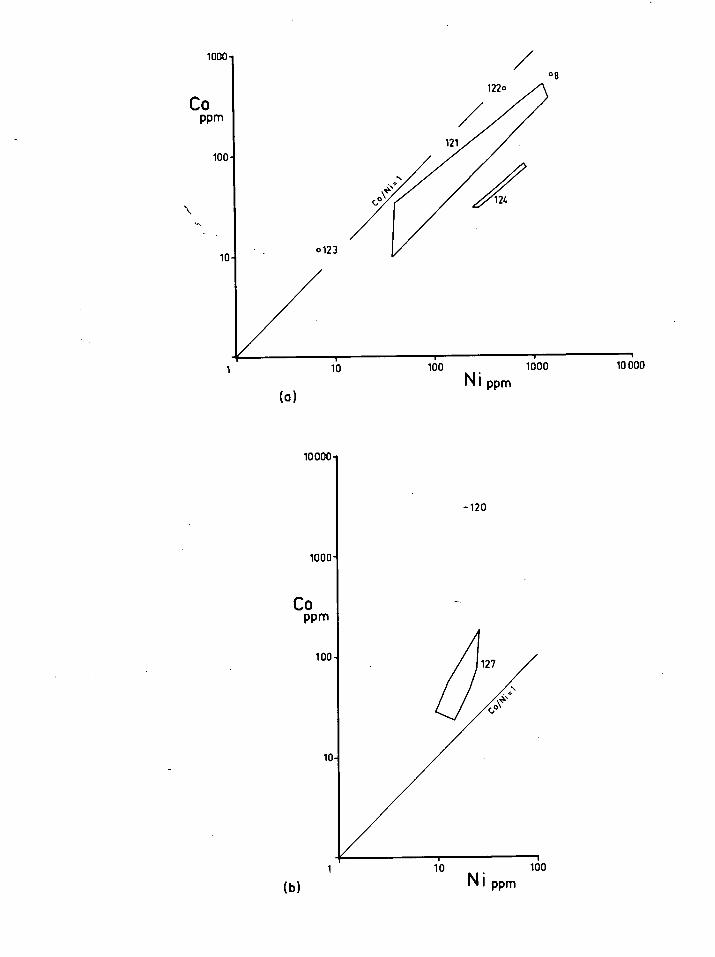
1000
O8
10 0123
CO PPm
100
1 1J 100 1000 10 000
Ni ppm (a)
10000
-120
1000 -
CO PPm
j127
10-
100
(b) Ni ppm
100
95
SELENIUM ANALYSES
All the Se results summarized in Figure 6.12 are differentiated
with respect to host mineral. The sedimentary pyrites have Se contents
which are high for a province which in general shows no gross Se
enrichment, and are much higher than the concentrations found in pyrites
from Victoria analyzed by Edwards and Carlos (1954), which have been
plotted at the top of Figure 6.12. Possible explanations are that most
Of the pyrites occur in shales, some of then carbonaceous, and several
of the pyrites may be recrystallized.
The Cambrian pentlandite-pyrrhotite ores from Cuni have consis-
tently high Se contents, although these are four times greater than
those found by Edwards and Carlos (1954) in a similar specimen from the
same deposit. The high values are consistent with enrichment of Se in
similar veins associated with magmatic Cu-Ni mineralization, as observed
in the Noril'sk group of deposits (Sindeeva,1964, p.185). Pyrites in
the Savage River ortho-amphibolite are slightly enriched in Se, but all
other classes of deposit show about the same range in concentration,
except for the notably enriched Mt. Lyell deposits.
Because of the variable partition of Se between different sulphides,
pyrite is Used here as an index mineral for detailed comparison of the
sample populations using the F variance ratio test of Snedecor (1946,
p.218). Selenium contents of the pyrites from the Devonian Pb-Zn-Ag
deposits and cassiterite-sulphide deposits are not significantly different.
The Devonian pyrites as a group do not differ significantly from the
pyrites syngenetic in the Cambrian acid-intermediate igneous rocks, but
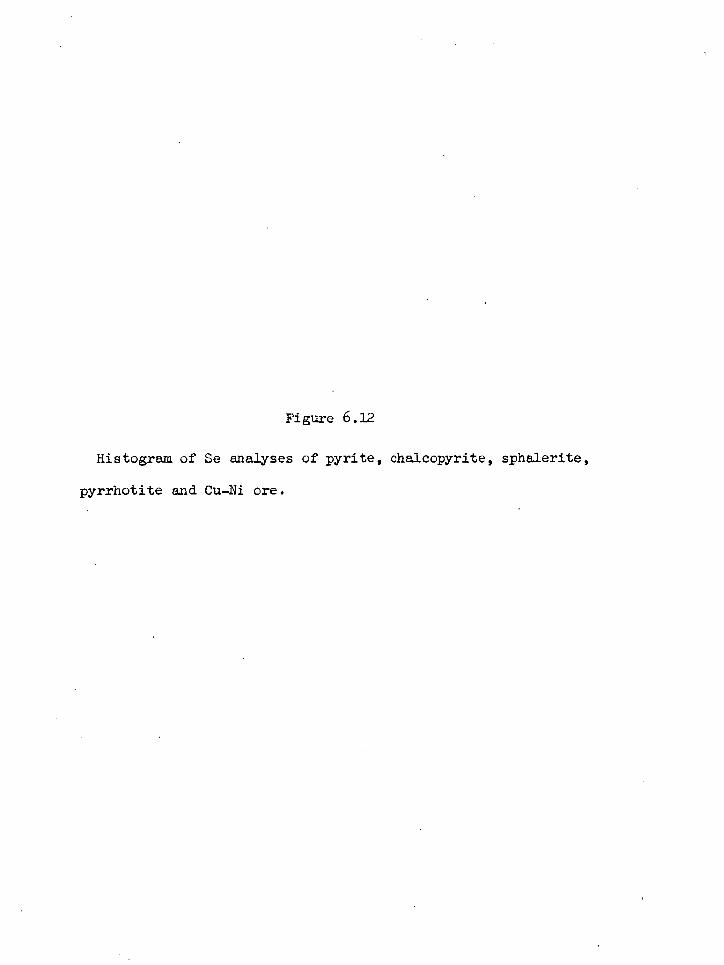
Figure 6.12
Histogram of Se analyses of pyrite, chalcopyrite, sphalerite,
pyrrhotite and Cu-Ni ore.
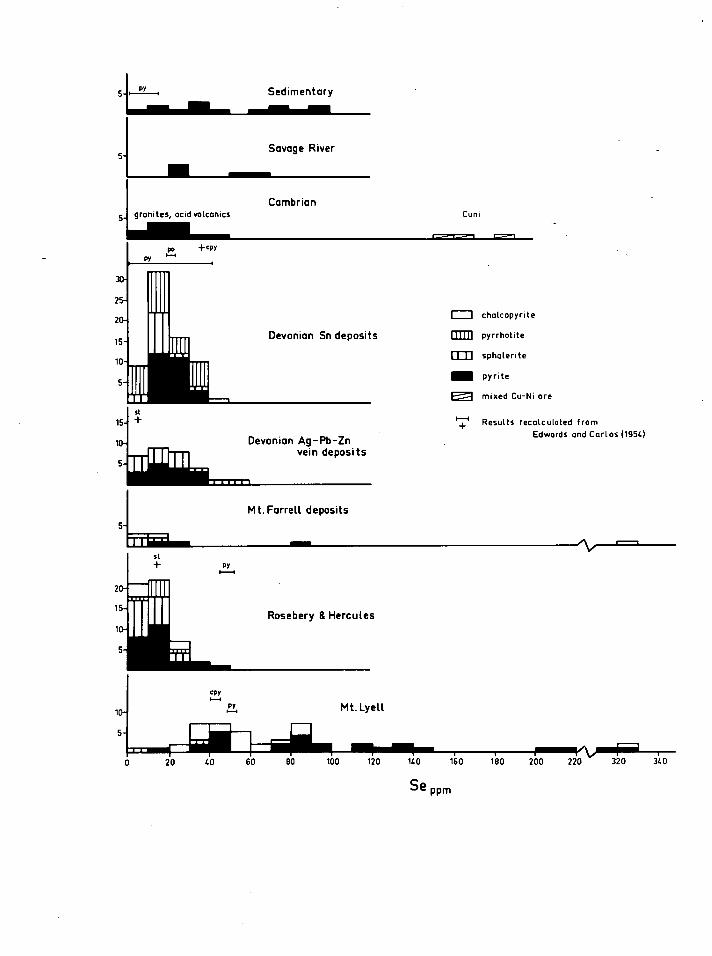
2 MIMI 1
: 11 1111 Rosebery & Hercules
10- Mt.Lyell cpy o—i
PY ■—■
Sedimentary
Savage River
Cambrian 5 granites, acid volcanics
oa +coy t•-■
Devonian Sn deposits
Devonian Ag-Pb-Zn vein deposits
Mt. Farrell deposits 5-
-rrigag.
Cuni
= chalcopyrite
Orn pyrrhotite
EED sphalerite
I=1 pyrite
Ef3 mixed Cu-Ni ore
IT' Results recalculated from
Edwards and Carlos (1954)
..
5
I—I
PY 1----1
5-
\,■Mil--,— 80 100 120 140 160 180 200 220 320 340
Se ppm
20 40 60
96
the Se contents of Rosebery-Hercules pyrites are significantly less
than both these groups, at the 99% and 95% confidence levels respec-
tively. The samples from the Mt. Farrell mines differ from all these
groups, except possibly Mt. Lyell, but there are insufficient results
for statistical analysis. No pyrites were available from the Magnet
Mine, but the Se contents of sphalerites were the sane as those in the
other (Devonian) Pb-Zn-Ag deposits in the area around Mt. Bischoff.
It appears from these results that there was a uniform avail-
ability of Se in mineralizing fluids derived from acid-intermediate
igneous activity in Cambrian and Devonian times, but that the Savage
River magnetite ore, the Cuni Cu-Ni.ore, and particularly the Mt. Lyell
pyritic Cu ore were all enriched in Se, whereas the Rosebery ore was
impoverished. The enrichment at Mt. Lyell is consistent with the
tentative identification in the ore of berzelianite, Cu 2..xSe (Edwards,
1939).
ANALYSES OF CADMIUM IN SPHALERITE
The distribution of Cd in sphalerites from the Devonian Pb-Zn-Ag
deposits (Fig. 6.13) is not significantly different (by F test) from
that in the Devonian cassiterite-sulphide deposits, and the average Cd
content of all these deposits is approximately equal to the average Cd
content of all sphalerites (Ivanov, 1964). These results indicate a
generally uniform availability of Cd during Devonian mineralization over
the sampled area. The Cd contents of sphalerites from Tullah and Magnet
are similar to those for the Devonian deposits.
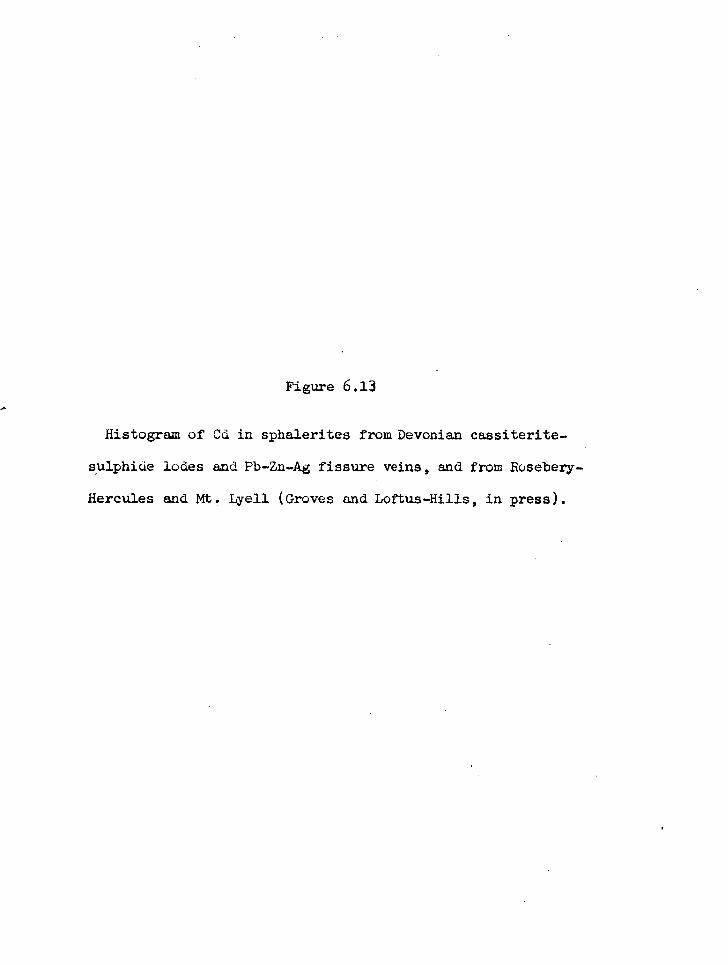
Figure 6.13
Histogram of Cd in sphalerites from Devonian cassiterite-
sulphide lodes and Fb-Zn-Ag fissure veins, and from Rosebery-
Hercules and Mt. Lyell (Groves and Loftus-Hills, in press).
• 10
2
2
a 2
10
2
a
2
1
6 (42 2
2 6
2
6 cc
10
6
2
2
10
2
1°-
a-
2-
-
MT BISCHOFF
CLEVELAND
•RENISON BELL
CASSITERITE — SULPHIDE DEPOSITS
WAR ATAH
ZEEHAN
TULLAH
DUNDAS
LEAD—ZINC— SILVER FISSURE VEINS
=
HERCULES
ROSE E3ERY
BANDED LEAD—ZINC DEPOSITS
MT LYELL
02 03 • 0 .4 05 0.6
CADMIUM IN SPHALERITE
97
There is a marked difference between Cd contents of sphalerite
from the Devonian deposits and from the Rosebery -Hercules ores, implying
distinctly different Zn/Cd ratios during deposition. The Cd values in
the Rosebery-Hercules sphalerites vary 0.09 - 0.20%, with an average
value of 0.15%, approximately half that for the Devonian deposits.
The few available sphalerite specimens from the Mt. Lyell area
show a variation 0.18 - 0.30% Cd, and average 0.26% Cd. Although this
rangy differs from those of both the Rosebery -Hercules deposits and
the Devonian ores, it is based on insufficient samples for confident
interpretation.
DEPOSITIONAL AND POST-DEPOSITIONAL VARIATIONS
Distribution Functions
The two largest homogeneous sample populations - 23 pyrites from
the dykes, and 26 pyrrhotites from the replacement deposits at
Mt. Bischoff - were examined for distribution patterns of Co and Ni.
Histogram of the distributions are plotted in Figure 6.14, on both
linear and logarithmic scales. All the Co and Ni values, when plotted
on linear scales, reveal the positively skewed distributions to be
expected for trace element data. However the logarithmic-scale plots
of the same data do not produce normal distributions, three of the
distributions retaining some positive skewness, and the Co data from
the dyke pyrites acquiring a negative skew, which is very different
from the equivalent Co distribution in the replacement deposits.
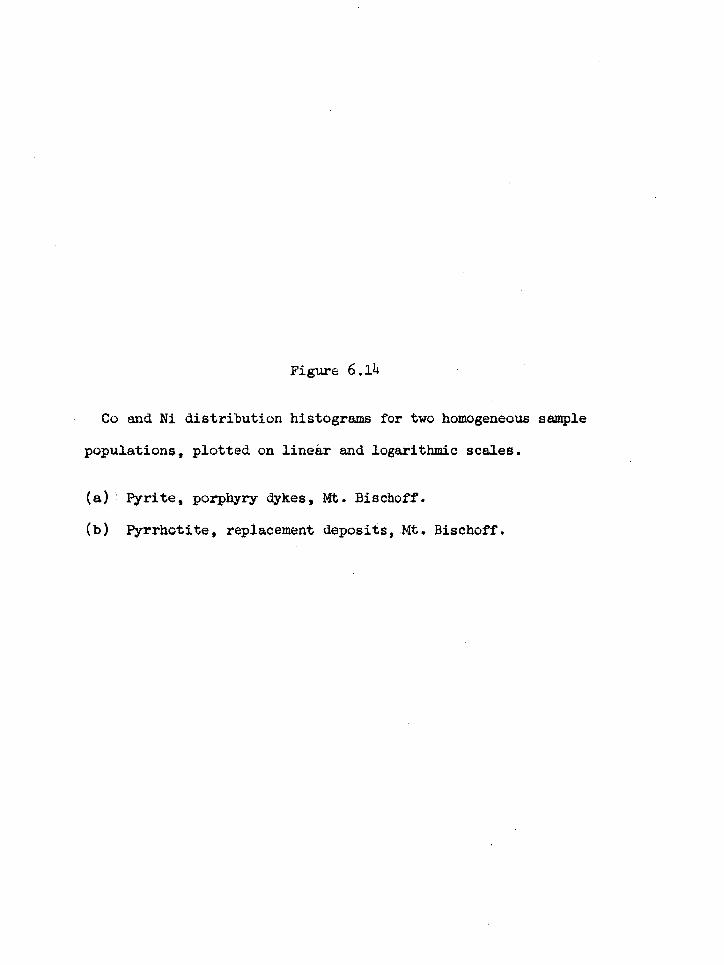
Figure 6.14
Co and Ni distribution histograms for two homogeneous sample
populations, plotted on linear and logarithmic scales.
(a) Pyrite, porphyry dykes, Mt. Bischoff.
(b) Pyrrhotite, replacement deposits, NM. Bischoff.
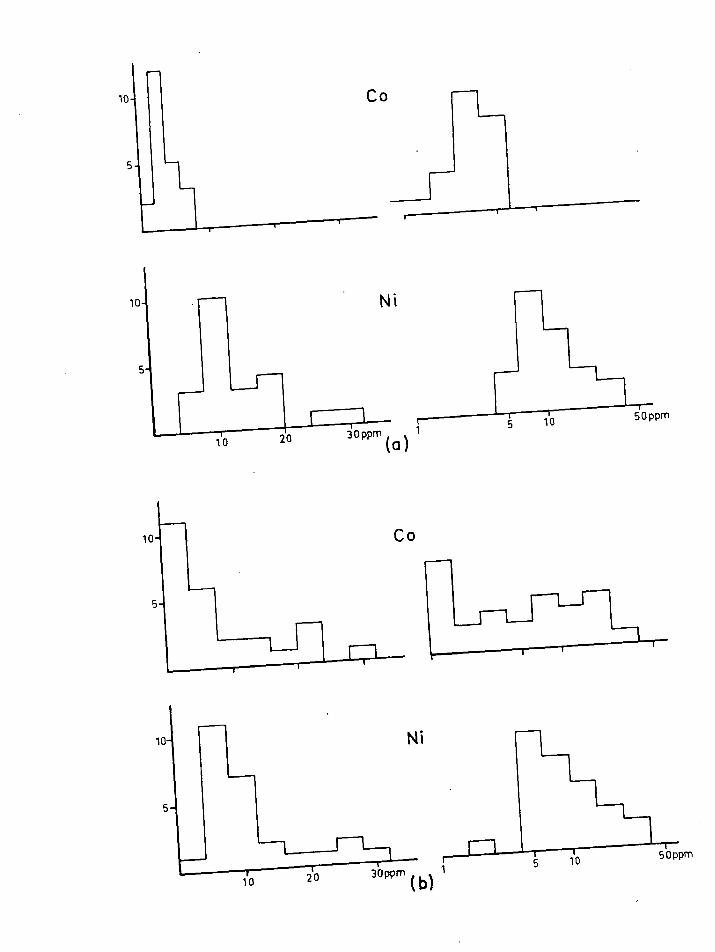
10 Ni
1 0
10 20 3Oppm to 1
5Oppm
98
The distribution functions for the Ni data are, however, remarkably
similar for the two modes of occurrence. The dissimilarity in Co dis-
tribution functions is much more likely to be related to the mode of
occurrence than to the host mineralogy, but as there is no theoretical
basis for element distribution functions in general, the observations
must remain empirical. Overall, the basic distribution functions for
Co and Ni in these sulphides approach more closely to lognormal than
to normal distributions, but they are not lognormal.
Variation within Single Minerals
In Figure 6.15 are plotted the Co-Ni analyses of those groups of
two, three or four samples of the same mineral, which were taken from
one hand specimen. The ranges of the groups do not vary greatly between
deposit types, which is contrary to the results of Rose (1967), who
reported a greater specimen-scale variation of trace elements in vein
deposits than in replacement deposits. The exceptions are the groups
from the Savage River, which show somewhat smaller ranges, possibly due
to local homogenization of trace element values during at least two
metamorphisms. The ranges in different minerals also appear to be
about the same.
The type of variation, however, can in some cases be correlated
with the mode of occurrence. Although there is an unexpected tendency
for variations of the type Co or Ni = k (k = a constant), this is more
marked in the vein deposits than in the replacement deposits, the
latter trending towards variations of the type Co/Ni = k (parallel
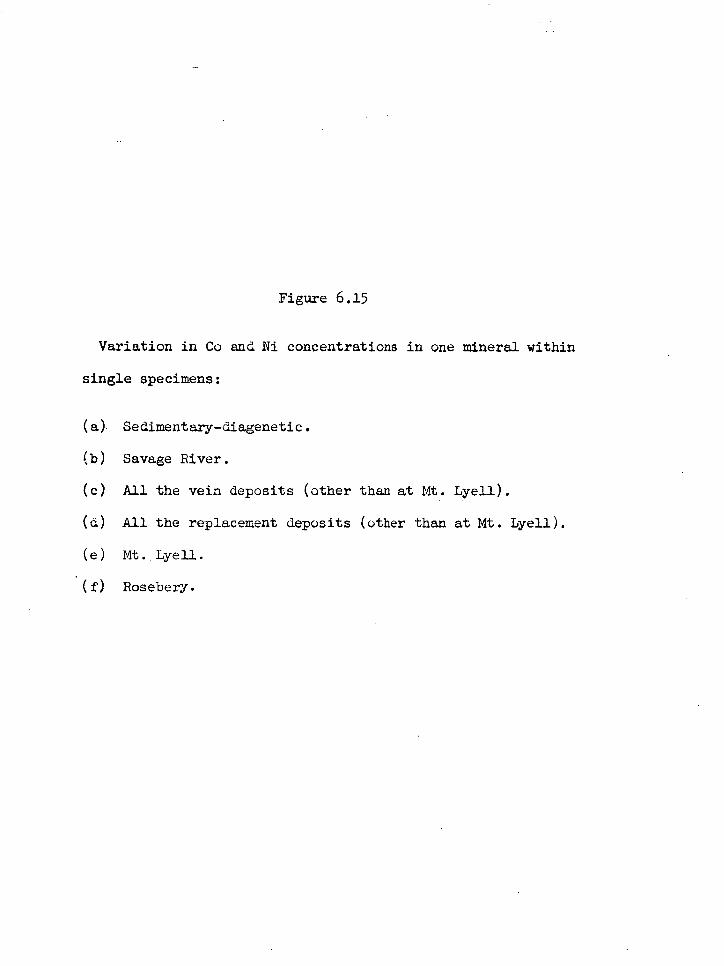
Figure 6.15
Variation in Co and Ni concentrations in one mineral within
single specimens:
(a) Sedimentary-diagenetic.
(b) Savage River.
(c) All the vein deposits (other than at Mt. Lyell).
(d) All the replacement deposits (other than at Mt. Lyell).
(e) Mt. Lyell.
.(f) Rosebery.
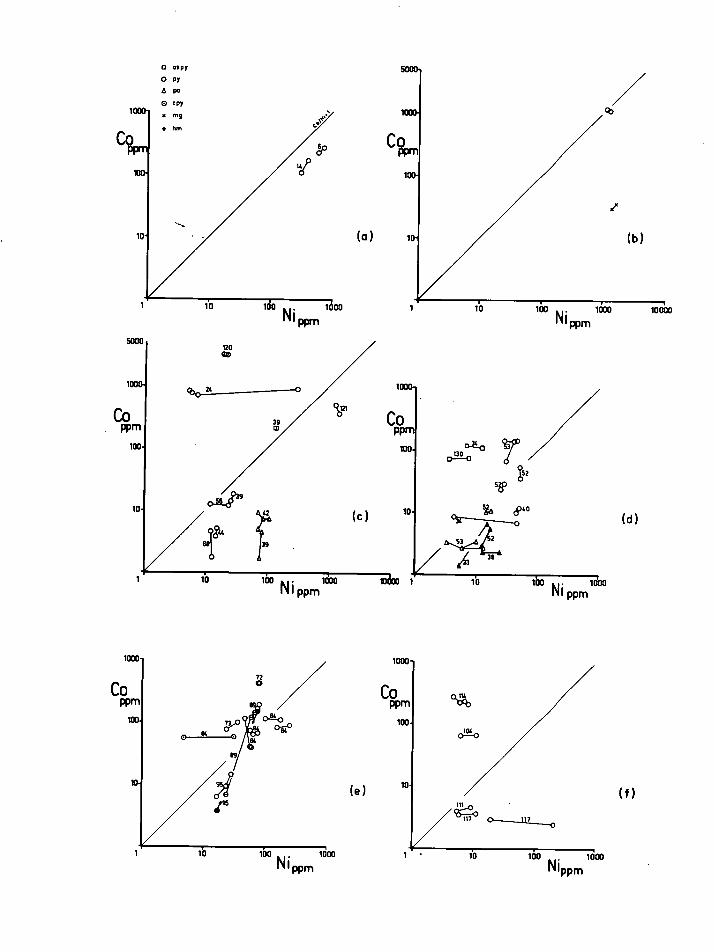
1000
Co PPm
1oo.
10. (e)
io too. el CO Nippm
117
,e4 38
10 1 '°° Ni
000 ppm
10 100 Ni
1 111 ppm
'52
(d
99
straight lines at 45° to the axes). This holds true both for the
Cambrian and Devonian veins, and for the Mt. Lyell replacement deposits
and remobilized veins (Fig. 6.15e). The Rosebery groups show a con-
sistent variation of the type Co = k. On the other hand, the two sedi-
mentary groups (Fig. 6.15a) show a very strong Co/Ni = k tendency.
A quanlitative explanation of these variation-types is that the
formation of sedimentary and replacement minerals occurs in solid media,
where the available Co and Ni, bound in a slowly diffusing, mainly
intergranular dispersed phase, are physically restrained from large
independent concentration variations, and will tend to vary sympatheti-
cally. In the vein situation, however, where the system is open, Co
and Ni can be incorporated into minerals independently, on the specimen
scale at least. A similar explanation was given by Rose (1967) for the
smaller trace-element variations he found in replacement deposits than
in vein deposits.
The types of specimen-scale Co-Ni variations outlined above are
reflected in the overall Co-Ni variations for whole sampling sites, and
for whole deposits. Thus several of the sedimentary pyrite fields in
Figure 6.1 are of the type Co/Ni = k; many of the Devonian hydrothermal
vein fields, and also trend IV, (Figs. 6.5 - 6.6), are of the type
Ni or Co = k.
In Figure 6.16 are plotted the Se analyses of groups of two,
three and four samples of the sane mineral taken from the same specimen.
The ranges of the groups appear to be about the same for different
minerals. These analyses show, however, a much greater tendency than
the Co-Ni groups for the absolute variation within the groups to remain
Figure 6.16
Variation of Se concentration in one mineral within single
specimens.
Figure 6.17
Distribution of Se concentrations in the different ore-
types at Mt. Lyell.
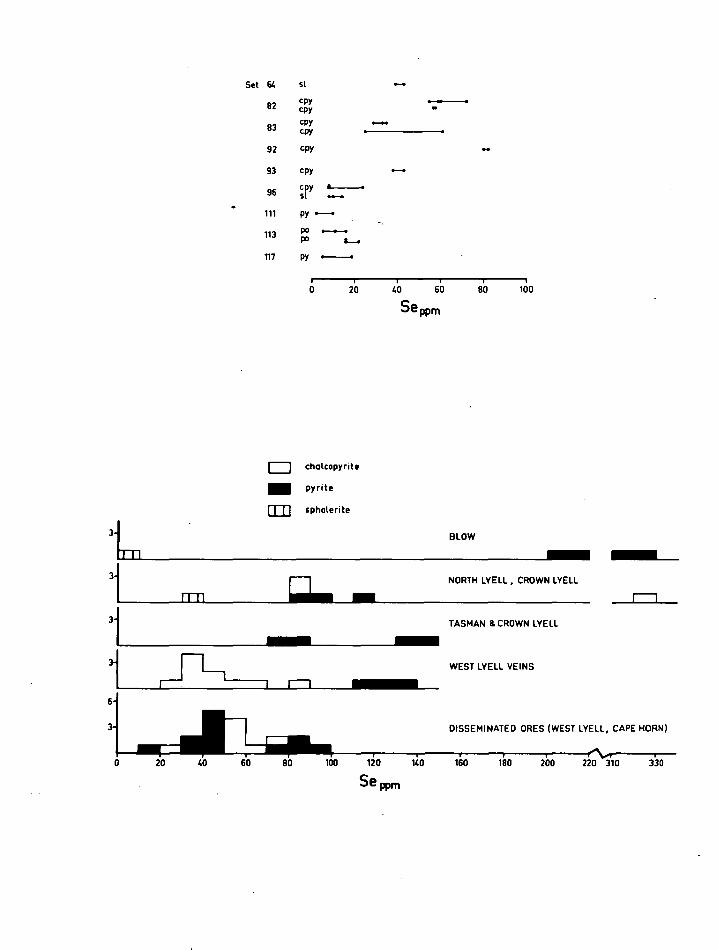
BLOW
NORTH LYELL , CROWN LYELL
TASMAN & CROWN LYELL
WEST LYELL VEINS
DISSEMINATED ORES (WEST LYELL, CAPE HORN)
n-Ti
7 I-1
6-
,
Set 64
82
83
92
93
96
111
113
117
sl
cpy cpy cpy cpy
F-411
0-0■11
ONO
0-40--. OW
CPY
cPy
cpy 111--6
111■0
•
sl 00-0
py
po 0.--411.-111
P3 11—.
py ..--.
0 20 40 60 80 180
Se PPm
= chalcopyrite
III pyrite
0:0 spholerite
20 40 60 80 100 120 140 160 180 200 220 310 330
Se PPm
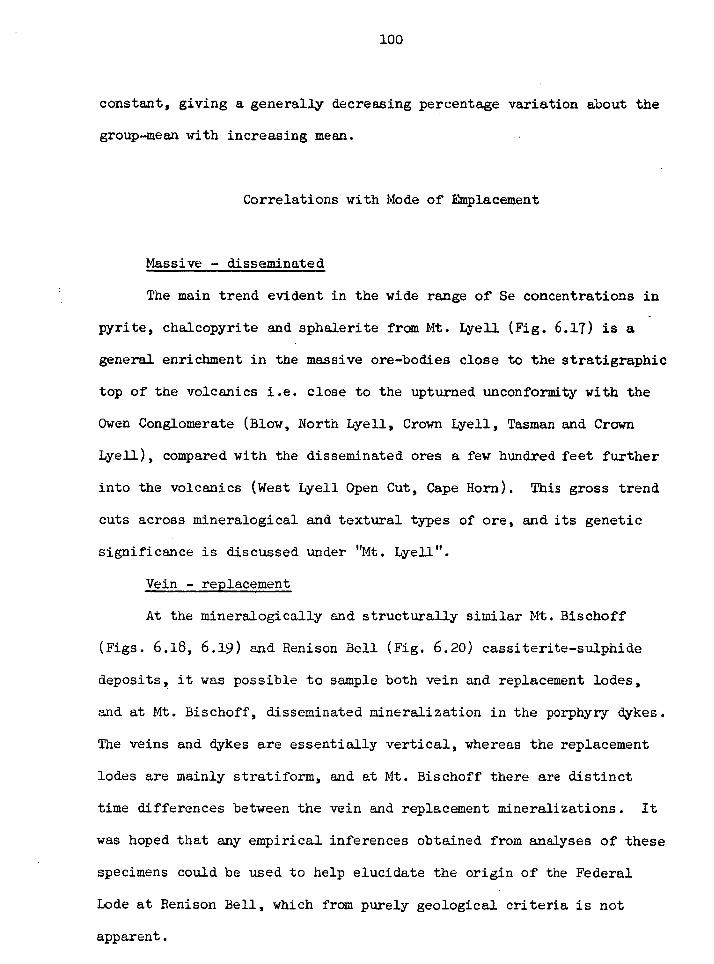
100
constant, giving a generally decreasing percentage variation about the
group-mean with increasing mean.
Correlations with Mode of Emplacement
Massive - disseminated
The main trend evident in the wide range of Se concentrations in
pyrite, chalcopyrite and sphalerite from Mt. Lyell (Fig. 6.17) is a
general enrichment in the massive ore-bodies close to the stratigraphic
top of the volcanics i.e. close to the upturned unconfoxmity with the
Owen Conglomerate (Blow, North Lyell, Crown Lyell, Tasman and Crown
Lyell), compared with the disseminated ores a few hundred feet further
into the volcanics (West Lyell Open Cut, Cape Horn). This gross trend
cuts across mineralogical and textural types of ore, and its genetic
significance is discussed under "Mt. Lyell".
Vein - replacement
At the mineralogically and structurally similar Mt. Bischoff
(Figs. 6.18, 6.19) and Renison Bell (Fig. 6.20) cassiterite-sulphide
deposits, it was possible to sample both vein and replacement lodes,
and at Mt. Bischoff, disseminated mineralization in the porphyry dykes.
The veins and dykes are essentially vertical, whereas the replacement
lodes are mainly stratiform, and at Mt. Bischoff there are distinct
time differences between the vein and replacement mineralizations. It
was hoped that any empirical inferences obtained from analyses of these
specimens could be used to help elucidate the origin of the Federal
Lode at Renison Bell, which from purely geological criteria is not
apparent.
Figure 6.18
(a) Locality map of the Mt. Bischoff Open Cut area (Groves,
1968).
(b) Geological map of Mt. Bischoff and the surrounding area
(Groves and Solomon, 1964). The line of section of
Figure 6.19 is shown as A—B.
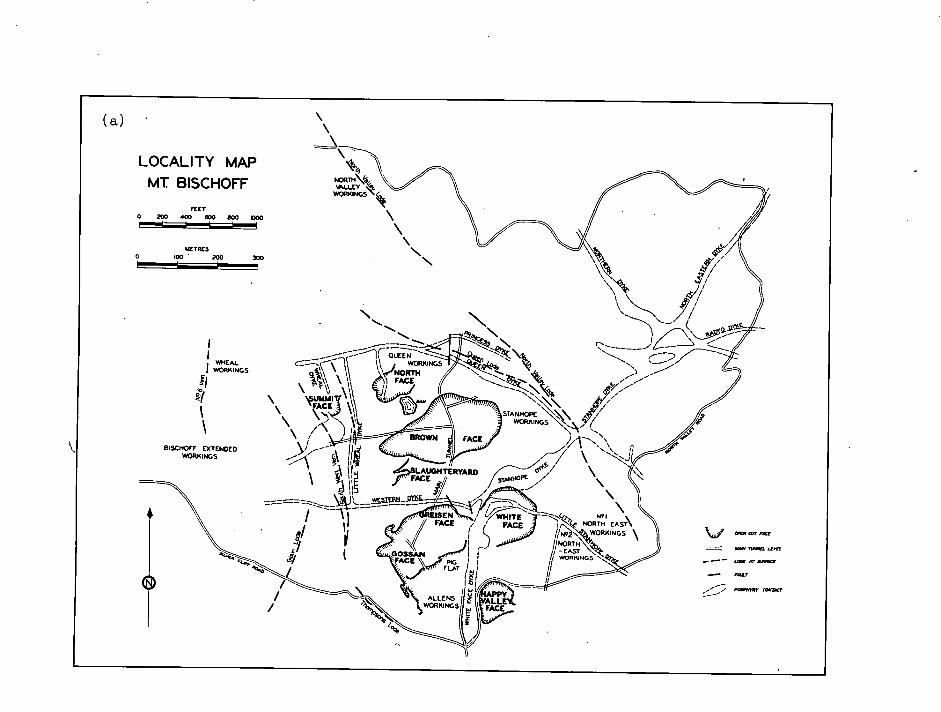
FEET 400 600 200 000 CCD
LOCALITY MAP MT BiscHOFF
wETREs I00 • 200
WHEAL WORKINGS
N !a yi\lk.
WORKINGSN .§t
■
ktc&I,,2( 4-444,
sTAN,..„NGS,z,„\\
\
AUGHTERYARD FACE sormom
NT1 I NORTH EAST\
Uppst■NWORKINGS
/1/4°RTN\ 5 // -EST ft WORKINos.N,S,
// Mat,
BiscHOFF EXTENDED WORKINGS
0.01 On Mx
OMNI 74IRILI LEHR
WAY A7' RAM.'
II ,../wrxr Onr
(a)
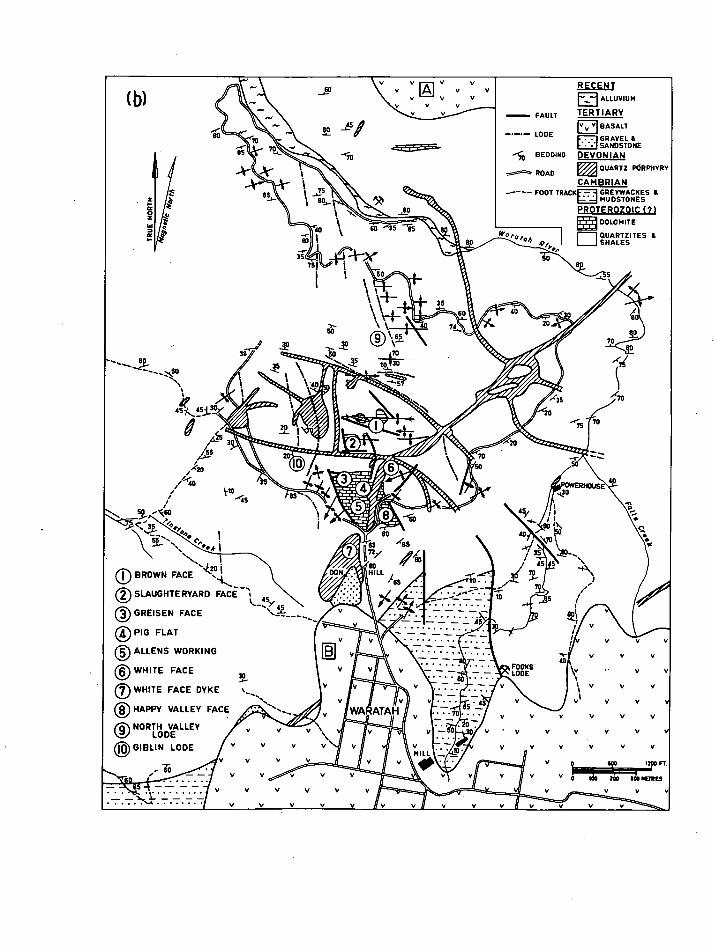
.•••-• 65
60
V
( b)
FAULT
—•-- LODE
••10 BEDDING
ROAD
RECENT ALLUVIUM
TERTIARY
211 BASALT
F—I GRAVEL & I • I SANDSTONE DEVONIAN
A QUARTZ PORPHYRY
CAMBRIAN FOOT TRACKE-- GREYWACKES
MU DSTONES PROTEROZOIC (71
DOLOMITE
QUARTZITES I SHALES
di? , 51,..151-1,
3 gs
:44 •
4. 4
N, I
0 BROWN FACE
0 SLAUGHTERYARD FACE
0 GREISEN FACE
(i)PIG FLAT
0 ALIENS WORKING
(2) WHITE FACE
0 WHITE FACE DYKE
0 HAPPY VALLEY FACE
NORTLF61 DVEALLEY
GIBLIN LODE
30
—45
✓ V
V V
✓ V V
V
GOO 1200 Ft
111111111111111 0 *50 200 150 MIRES
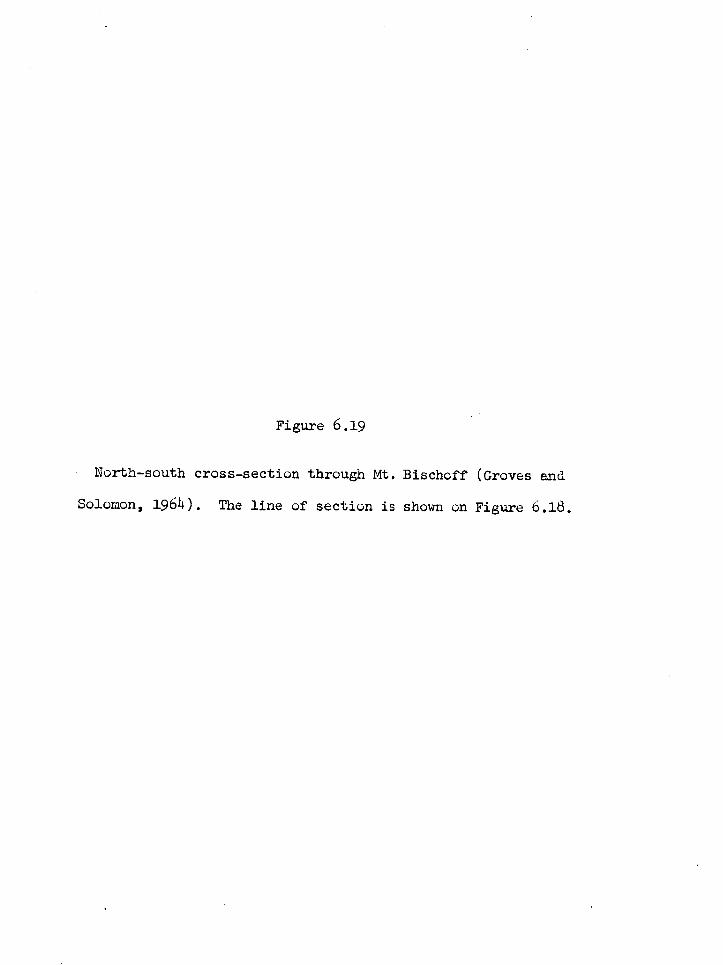
Figure 6.19
North-south cross-section through Mt. Bischoff (Groves and
Solomon, 1964). The line of section is shown on Figure 6.18.
TERTIARY
BASALT
DEVONIAN
EiEl QUARTZ PORPHYRY DYKES
CAMBRIAN PROTEROZOIC Irwra pm, DOLOMITE f= .71 GREYWACKE 8 MUDSTONE SANDSTONE IL SHALE
WARATAH RIVER MT. BISCHOFF SLAUGHTERYARD SYNCLINE A
NORTH VALLEY LODE BROWN FACE GREISEN FACE SYNCLINE
NORTH SOUTH
----\-----
" ,
soo n.
-- i .„..,.-
'. N 1 -_
•.. -.• ••
? '-- \
++ -- \-
+ -I- SCALE + + + 0 800 1200 FT.
AI / 1
/
a ■
A, /7171--71
Ar
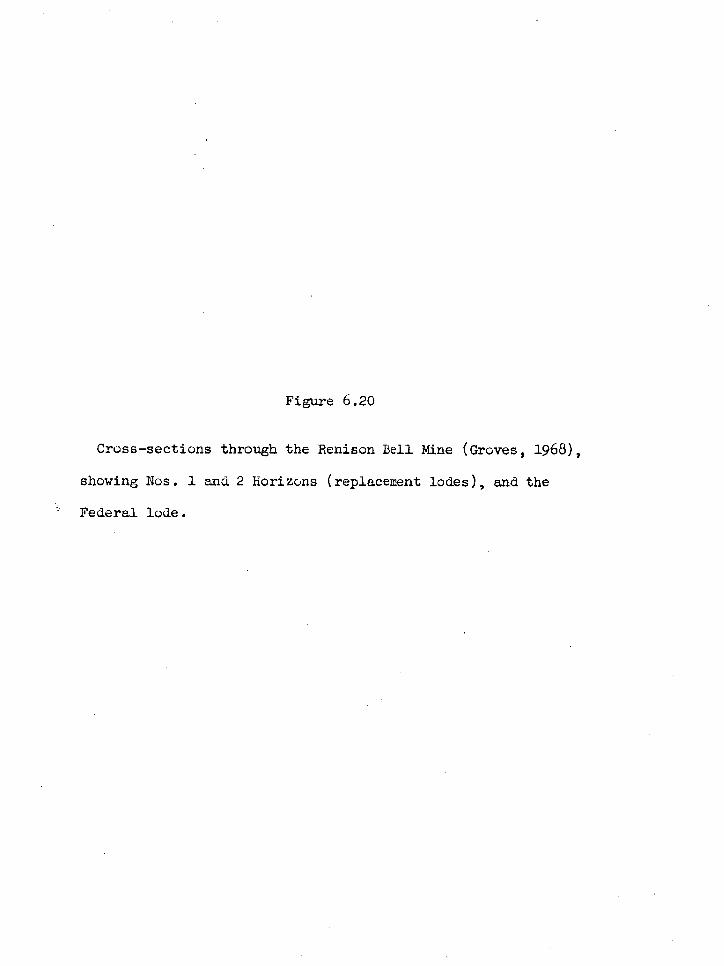
Figure 6.20
Cross-sections through the Renison Bell Mine (Groves, 1968),
showing Nos. 1 and 2 Horizons (replacement lodes), and the
Federal lode.
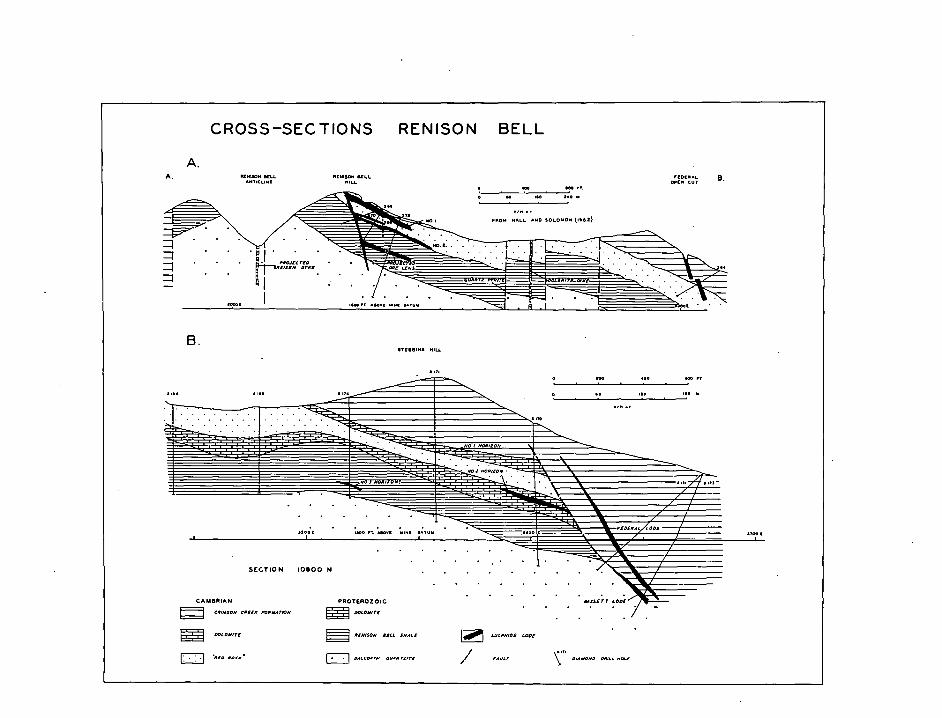
• f- .11,04774 CYAN rl Ire 'Akar
• el,
014.7102 OW". nrOal
S
SECTION 10800 N
CAMBRIAN PROTEROZOIC
r CRIMSON CREEK FORNACION DOLOMITE
M DOLOMITE RAWSON SELL SHALE SLILINIOE LODE
• 71
STOO
CROSS-SECTIONS RENISON BELL
A. A. RDILSON KU-
ANTICLINE VICNISON SILL
MILL rEDEPAL
Ont. CUT B.
B. NO LOU.
101
The analyses of arsenopyrite, pyrite and pyrrhotite at Mt. Bischoff
(Fig. 6.21a, c; Fig. 6.22a) reveal major differences between samples from
the vein, replacement and dyke mineralization.
(i) In the replacement deposits pyrrhotite has less Ni, and
arsenopyrite and pyrite less Co and Ni, than the same mineral in the
veins. The pyrite in the dykes contains even less Co and Ni than the rer
placement pyrite.
(ii) There is less variation of Co and Ni content in the replacement
deposits than in the vein deposits. The variation in the dyke pyrite is
smaller still.
The vein-replacement relationship was tested at Renison Bell in the
Battery Open Cut, where a pure pyrite vein a few inches wide cuts silt-
stones containing pyrite selectively replacing the beds (Plate 6.3).
The two types of pyrite are penecontemporaneous, a thin selvage of
replacement pyrite along the borders of the veins having been remobilize4
into the vein. The analyses of these materials (Figs. 6.21b, 6.22b) give
results consistent with those from Mt. Bischoff.
The apparent difference between the Co and Ni contents of pyrites
from the replacement ores of Nos. 2 and 1 Horizons at Renison Bell
(Fig. 6.21b) requires verification, as only one and two specimens res-
pectively were used. However the replacement pyrrhotites (Fig. 6.21d)
have similar ranges to those at Mt. Bischoff.
The equivalence of Co-Ni distributions in replacement pyrrhotites
and in replacement and vein pyrites at Renison Bell and Mt. Bischoff .
strongly suggests that identical variables are controlling the concen-
trations of Co and Ni in the replacement and vein depositional environ-
ments.. The control could be (a) a fortuitously similar temporal
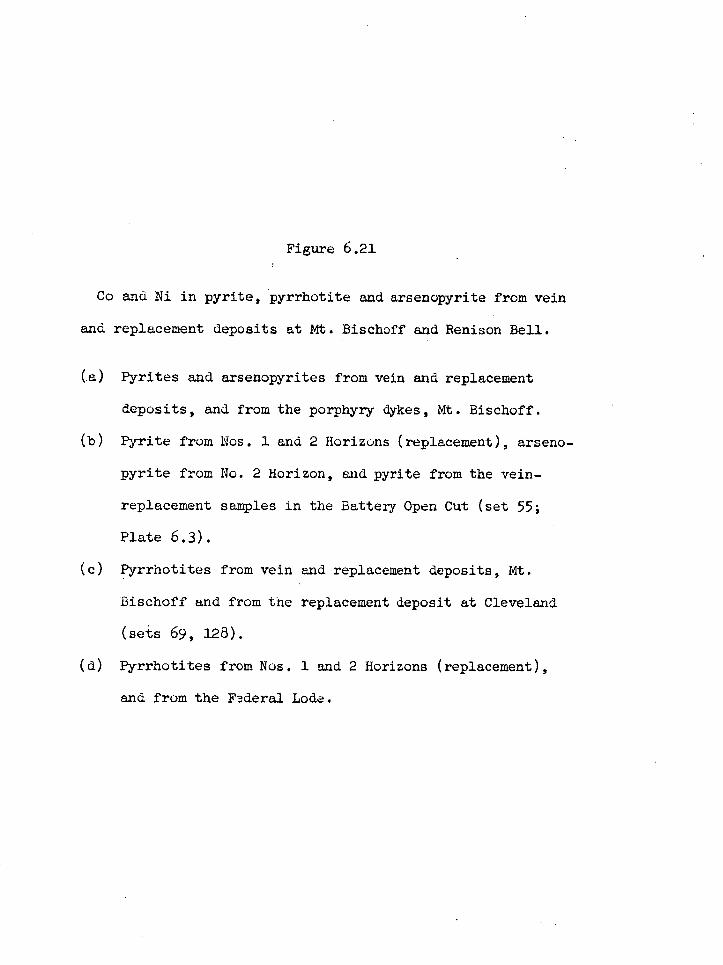
Figure 6.21
Co and Ni in pyrite, pyrrhotite and arsenopyrite from vein
and replacement deposits at Mt. Bischoff and Renison Bell.
(a) Pyrites and arsenopyrites from vein and replacement
deposits, and from the porphyry dykes, Mt. Bischoff.
(b) Pyrite from Nos. 1 and 2 Horizons (replacement), arseno-
pyrite from No. 2 Horizon, and pyrite from the vein-
replacement samples in the Battery Open Cut (set 55;
Plate 6.3).
(c) Pyrrhotites from vein and replacement deposits, Mt.
Bischoff and from the replacement deposit at Cleveland
(sets 69, 128).
(d) Pyrrhotites from Nos. 1 and 2 Horizons (replacement),
and from the Federal Lode.
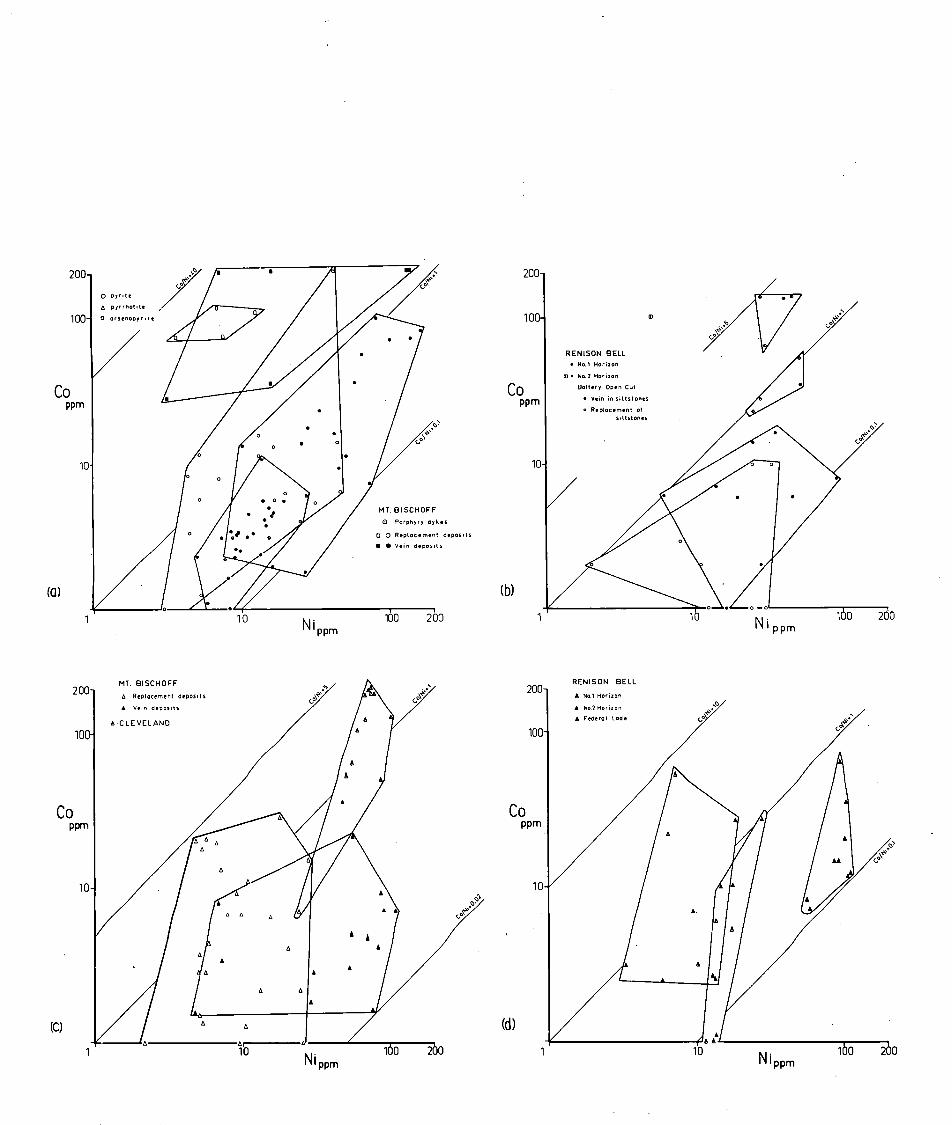
MT. BISCHOFF 0 Porphyry dykes
CI 0 Replocement deposits
• • Vein deposits
(0)
200
10
RENISON BELL • No.1 Horizon
03 • No.2 Horizon
Battery Open Cut
• Vein in siltst ones
• Replacement at siltstones
(b)
RENISON BELL
A No.1 Horizon
A No.? Horizon
• Federal Lode
(d) 10 110 2.0
Nippm
200 MT. BISCHOFF
A Replacement deposits
• vein deposits
•CLEVELAND
200
100-
Co PPm
10
(C)
to 260 Nippm
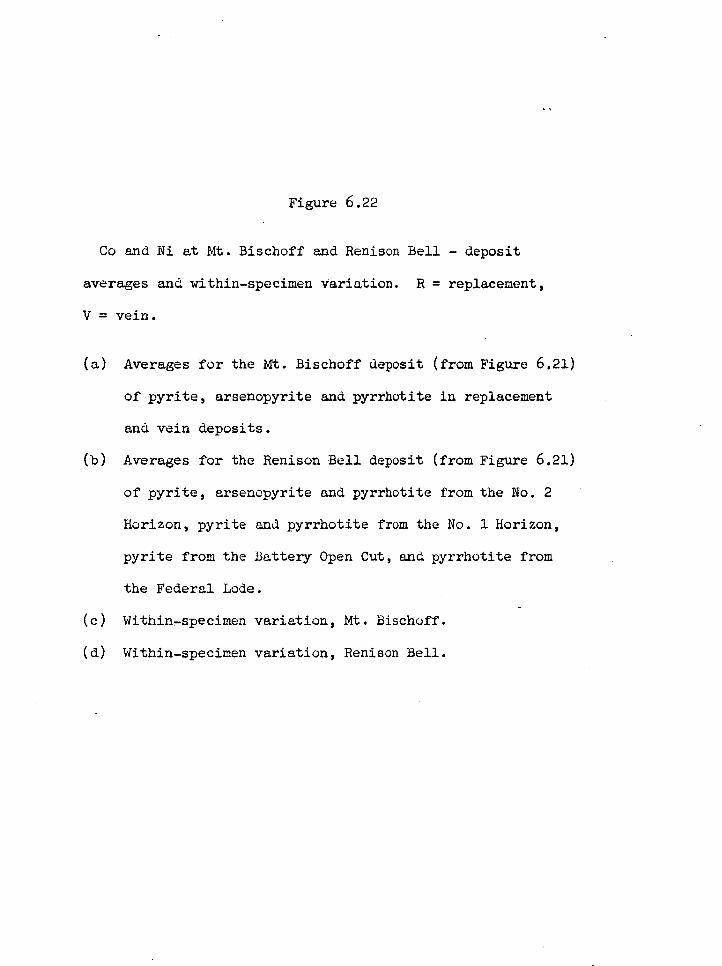
Figure 6.22
Co and Ni at Mt. Bischoff and Renison Bell - deposit
averages and within-specimen variation. R = replacement,
V = vein.
(a) Averages for the Mt. Bischoff deposit (from Figure 6.21)
of pyrite, arsenopyrite and pyrrhutite in replacement
and vein deposits.
(b) Averages for the Renison Bell deposit (from Figure 6.21)
of pyrite, arsenopyrite and pyrrhotite from the No. 2
Horizon, pyrite and pyrrhotite from the No. 1 Horizon,
pyrite from the Battery Open Cut, and pyrrhotite from
the Federal Lode.
(c) Within-specimen variation, Mt. Bischoff.
(d) Within-specimen variation, Renison Bell.
10 N pp M 100 200
CO PPm
10
20
100
RENISON BELL
Deposit oyeroges
e A No.1 Horizon
CD 0 Al No.2 Horizon
0 • Battery Open Cut
A Federal Lode
100 200 Ni ppm
10
/ / O R
R0\
(b)
(d)
RENISON BELL
Within -specimen variation
Rek
CO PPm
oil
10
FL/13) A
200-
100-
100- 0 Pyr)t•
pyrrnotite
inars•nopyrite
CO PPm
10
(a) 10
Ni ppm 100 200
10 NI ppm 160 200
MT. BISCHOFF
n - Specimen vorlat on
200
100
CO PPm
(A..0 2)
10
(c)
200- MT. BISCHOFF
Deposit overoges
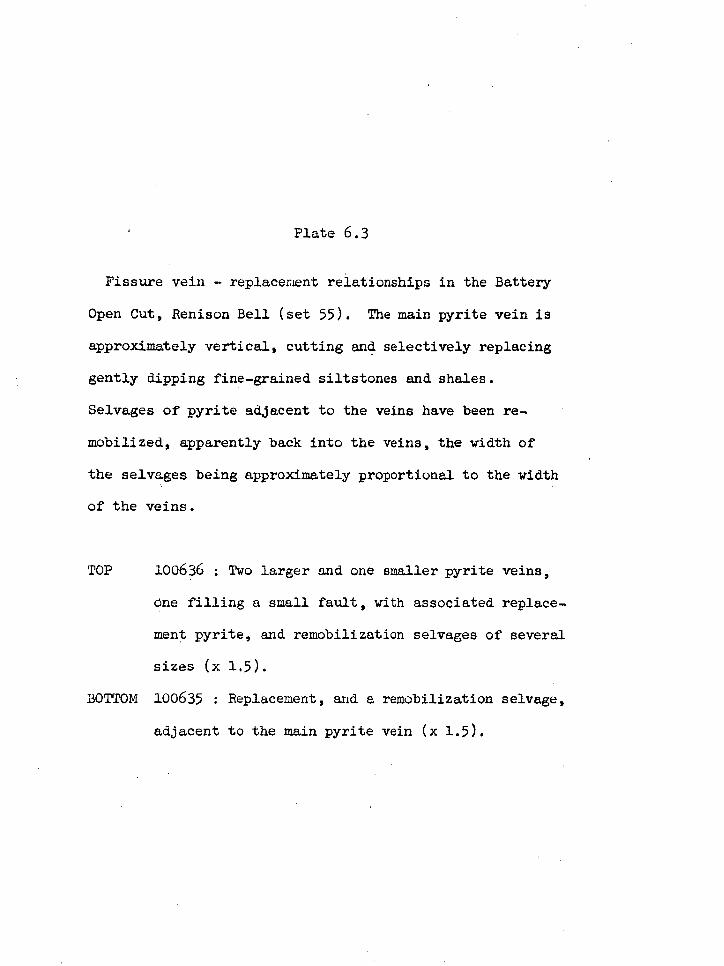
Plate 6.3
Fissure vein - replacement relationships in the Battery
Open Cut, Renison Bell (set 55). The main pyrite vein is
approximately vertical, cutting and selectively replacing
gently dipping fine-grained siltstones and shales.
Selvages of pyrite adjacent to the veins have been re-
mobilized, apparently back into the veins, the width of
the selvages being approximately proportional to the width
of the veins.
TOP 100636 : Two larger and one smaller pyrite veins,
One filling a small fault, with associated replace-
ment pyrite, and remobilization selvages of several
sizes (x 1.5).
BOTTOM 100635 : Replacement, and a remobilization selvage,
adjacent to the main pyrite vein (x 1.5).
102
variation in availability; or (b) a difference in physicochemical
processes between replacement and vein deposition. Because the two
deposits are 25 miles apart, and there is noprevious documentation of
Ni-enrichment with time of mineralizing solutions, variation in deposi-
tional processes appears to be the more likely explanation. The Ni-
enrichment in the Federal Lode at Renison Bell (Fig. 6.22b) would then
be empirical support for the lode being at least in part a vein deposit.
If Ni (and CO)- have been lost from the sulphide phases during
replacement reactions, possible repositories are carbonates and silicateg
in the host rock. However, analyses of primary dolomite, and of
secondary carbonate and vein carbonate (sets 129, 130, 132) reveal no
differences in Co-Ni contents between these minerals, and the where-
abouts of any elements which may have been subtracted remains speculative.
The pyrites at Mt. Bischoff and Renison Bell belong in Trend IV
along with other Devonian vein deposits (Fig. 6.6b). It may be noted
that replacement pyrrhotites from the Cleveland cupriferous cassiterite-
sulphide deposit have,a.quite different Co -Ni content .:td the Mt. Bischoff
and Renison Bell re151acement pyrrhotites, being enrcched about five-fold . •
in both elements.
Vein - sedimefitary
The writer was requested by Dr. R.J. George (University of . .
Adelaide) to compare the trace-element content of two, sets of sulphides
from the Nairne Pyrite deposit, South Australia, which'occurred respec-
tiveIY in bedding, and in cross-cutting "shear" veins.
The Nairne Pyrite Member of the Brukunga Formation of the Upper
Proterozoic-Cambrian (?) metamorphosed Kanmantoo Group (Thomson, 1965)
103
is a thick, lenticular unit, originally shale-greywacke, 20 miles long,
containing disseminated pyrite and pyrrhotite. The Nairne deposit
consists of three ore beds containing stratiform pyrite, separated by
predominantly greywacke waste beds. George (1967) has established from
rock analyses and mineralogical and textural studies that the ore beds
are significantly different from the waste beds only in their Fe and S
content. All rocks have undergone sillimanite-muscovite grade meta-
morphism, which has produced a dominant assemblage of quartz-muscovite-
albite-microcline.
The sulphides occur in three modes that are of interest in the
present study: primary sedimentary pyrite; vein pyrite and pyrrhotite
in tension gashes, remobilized from the sedimentary material; and
coarse-grained pyrrhotite-pyrite, with galena, chalcopyrite, sphalerite,
arsenopyrite, and Ag-Sb sulphosalts, in cross-cutting "shear" veins
about 8 in. wide. George (1967) has convincingly demonstrated the re-
mobilized nature of the tension gash sulphides, but his evidence for
the "shear" veins also being "lateral secretions" is not as conclusive.
LaGanza (1959) considered the base metal traces to represent a later
mineralization. This interpretation is supported by extensive regional
geochemical sampling by the South Australian Geological Survey, which
has shown that (a) other pyrite members to the north and south are low
in base metal content; and (b) Cu, Pb and Hg trace anomalies occur
where cross-cutting structures intersect the pyrite horizon (Thomson,
1965).
The results (set 1) of seven sedimentary pyrite analyses are
compared with analyses of seven pyrites from the "shear" veins in
Figure 6.23
Co and Ni in pyrites and pyrrhotites from the Nairne
Deposit, South Australia (set 1).
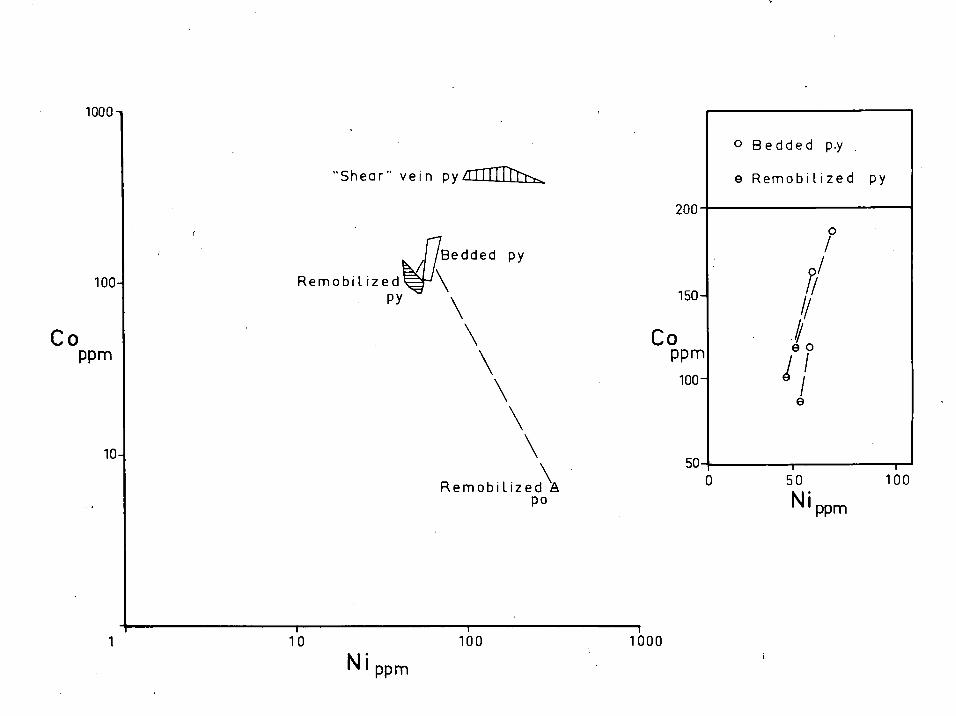
Bedded py
Remobilized PY
200
150
CO PPm
100
50
o Bedded p-y
e Remobilized py
1000-
"Shear" vein pydialTh.
Remobilized A po
50
Ni PPm
100
100
1000
100
CO PPm
10
1
N ppm
104
Figure 6.23. The two groups obviously belong to different populations,
but the "shear" veins have a higher concentration of both Co and Ni
than the sedimentary material, which is a trend opposite to that for
remobilization at Nairne as established in the next section. It would
appear that this constitutes further empirical evidence against the
sedimentary and "shear" vein minerals being genetically related.
Remobilization
One of the few Tasmanian ores studied which shows clear evidence
of remobilization is that in the West Lyell Open Cut at Mt. Lyell,
where discontinuous quartz-chalcopyrite-pyrite lenses (sets 81-84) up
to several feet in circumference, which have been derived from the
country rock (schist with disseminated sulphides: sets 77-80), occur
at the nodes of large-scale cleavage boudins in the schist (Solomon
et al., in press). The scale of the remobilization implies secondary
hydrothermal transport. The reduction of both the Co and Ni content
during remobilization of both pyrite and chalcopyrite can be observed
on a deposit scale by comparing Figures 6.7a and 6.7c. However, as
many of the samples on which those figures were based are < 95% single- .
mineral, another set of samples was more carefully processed to give
pyrite and chalcopyrite concentrates, the purity of which was estimated
mineragraphic ally by counting > 400 grains. The analyses of these con-
centrates were then cross-corrected to give the concentrations in the
pure sulphides. The results, presented in Table 6.5, and plotted in
Figure 6.24, verify the previously observed trend, and also reveal that
a greater proportion of Co is lost than of Ni, particularly in the pyrite.
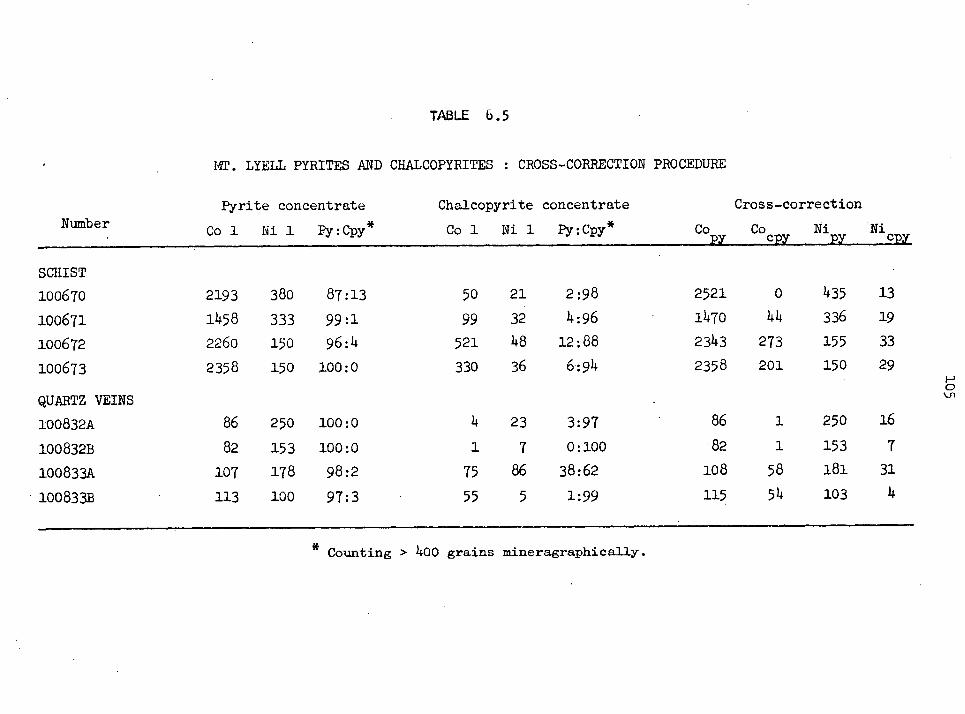
TABLE b.5
M. LYELL PYRITES AND CHALCOPYRITES : CROSS-CORRECTION PROCEDURE
Number Pyrite concentrate
Co 1 Ni 1 Py:Cpy*
Chalcopyrite concentrate
Co 1 Ni 1 Py:Cpy* Co py
Cross-correction
Co Ni c• py y Ni cpy
SCHIST
100670 2193 380 87:13 50 21 2:98 2521 0 435 13
100671 1458 333 99:1 99 32 4:96 1470 44 336 19
100672 2260 150 96:4 521 48 12:88 2343 273 155 33
100673 2358 150 100:0 330 36 6:94 2358 201 150 29
QUARTZ VEINS
100832A 86 250 100:0 4 23 3:97 86 1 250 16
100832B 82 153 100:0 1 7 0:100 82 1 153 7
100833A 107 178 98:2 75 86 38:62 108 58 181 31
100833B 113 100 97:3 55 5 1:99 115 514 103 4
Counting > 1400 grains mineragraphically
Figure 6.24
The effect of remobilization on the Co and Ni contents of %
pyrite and chalcopyrite, West Lyell Open Cut. Analyses
plotted have been cross-corrected (Table 6.5).
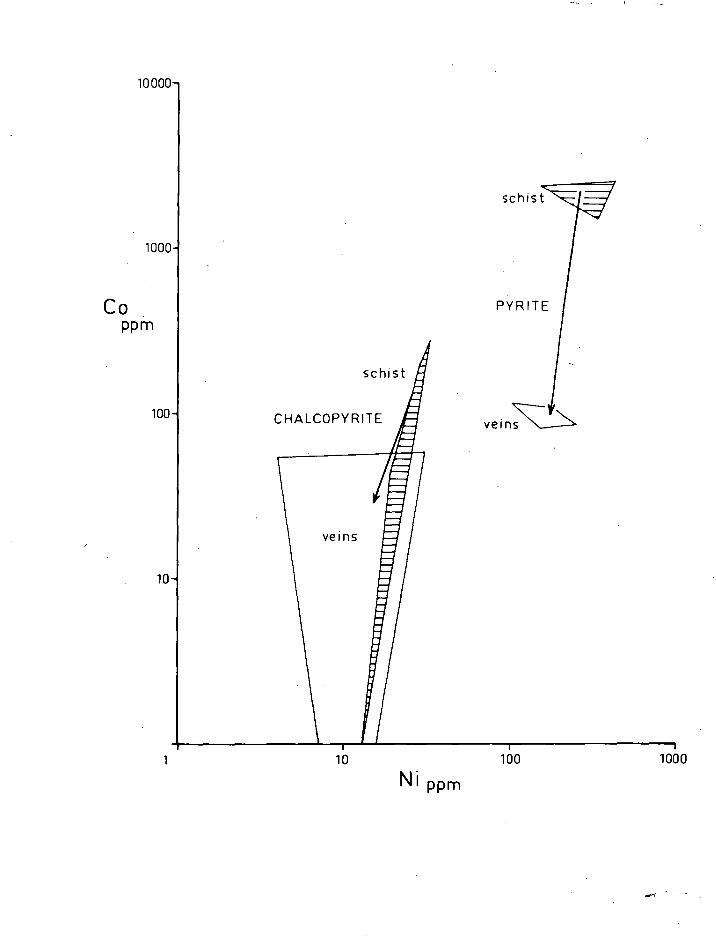
CHALCOPYRITE
veins
10000-
1 10
CO PPm
100-
10-
1000-
schist
100 1000
Ni ppm
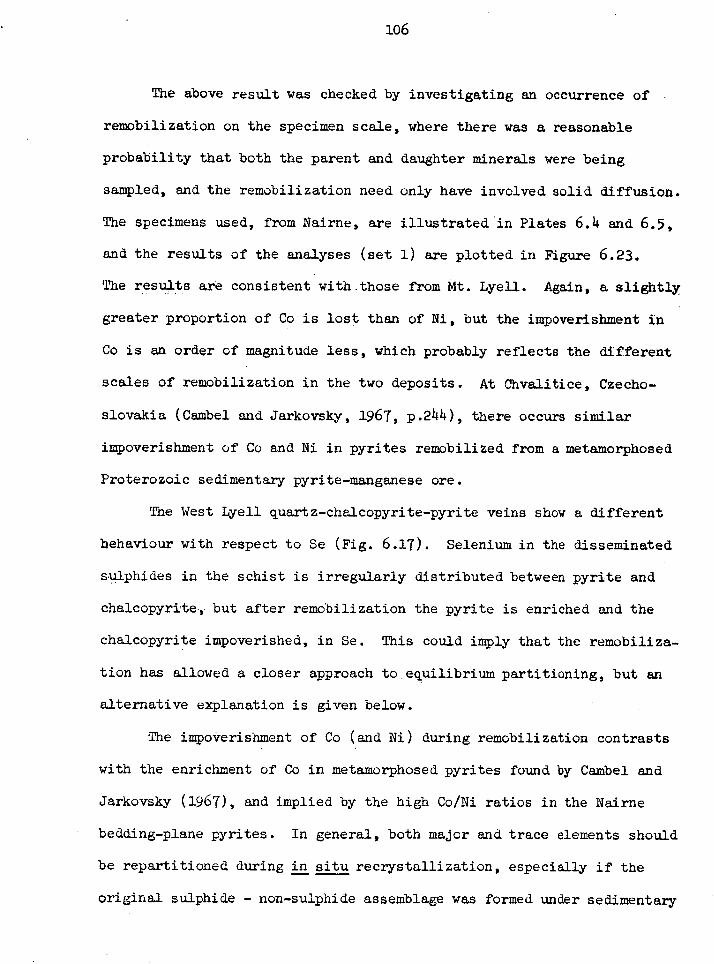
106
The above result was checked by investigating an occurrence of
remobilization on the specimen scale, where there was a reasonable
probability that both the parent and daughter minerals were being
sampled, and the remobilization need only have involved solid diffusion.
The specimens used, from Nairne, are illustrated in Plates 6.4 and 6.5,
and the results of the analyses (set 1) are plotted in Figure 6.23.
The results are consistent with.those from Mt. Lyell. Again, a slightly
greater proportion of Co is lost than of Ni, but the impoverishment in
Co is an order of magnitude less, which probably reflects the different
scales of remobilization in the two deposits. At ahvalitice, Czecho-
slovakia (Cambel and Jarkovsky, 1967, p.244), there occurs similar
impoverishment of Co and Ni in pyrites remobilized from a metamorphosed
Proterozoic sedimentary pyrite-manganese ore.
The West Lyell quartz-chalcopyrite-pyrite veins show a different
behaviour with respect to Se (Fig. 6..17). Selenium in the disseminated
sulphides in the schist is irregularly distributed between pyrite and
chalcopyrite,- but after remobilization the pyrite is enriched and the
chalcopyrite impoverished, in Se. This could imply that the remobiliza-
tion has allowed a closer approach to equilibrium partitioning, but an
alternative explanation is given below.
The impoverishment of Co (and Ni) during remobilization contrasts
with the enrichment of Co in metamorphosed pyrites found by Cambel and
Jarkovsky (1967), and implied by the high Co/Ni ratios in the Nairne
bedding-plane pyrites. In general, both major and trace elements should
be repartitioned during in situ recrystallization, especially if the
original sulphide - non-sulphide assemblage was formed under sedimentary
Plate 6.4
Remobilization textures in specimens (set 1) from the meta-
morphosed Nairne pyrite deposit, South Australia. (Specimens
by courtesy of Dr. R. George).
TOP 100630 : Coarse-grained metamorphic segregations of
bedding-plane pyrite (white) with a little pyrrhotite
(medium grey in top band), and of quartz (second band
from the top) (x 2.4).
BOTTOM 100633 : Coarse-grained metamorphic segregation of
pyrite (dull white) in the bedding planes, with a wide
remobilization selvage adjacent to a tension gash con-
taining pyrrhotite (bright white) (x 1.3). The Co and
Ni concentrations show sharp gradients across this
specimen:
po selvage py segregated py
Co pDm 6 17 177
Ni ppm 314 63 59
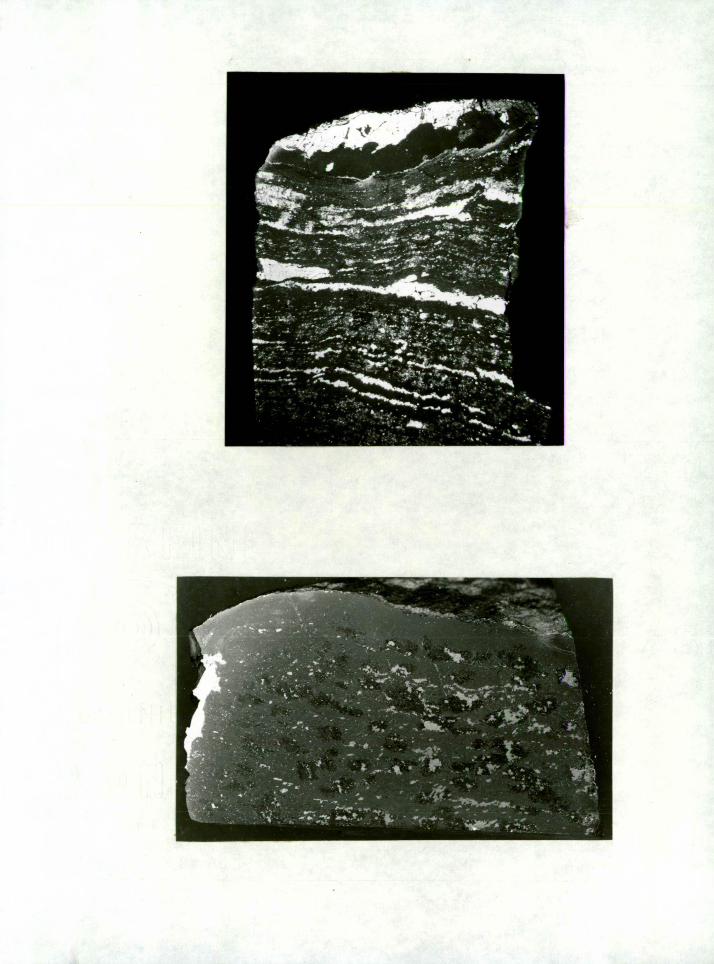
•■•• • .C. 1611 Ka.- . .. ,..,,
if, ,c • .0' • ' .%. 4111r T ...••••.--i-46.• ' '" - '"••• : .0.. ' - - '-' -
•■ ..--•-• - v. - - • •-•• , .. , . . _ . .1-•.• alphisk:' le'-' '406'.2.04"-7••• -'
ii. • 4 ' -
—..er
- Ir.-•. •_
a
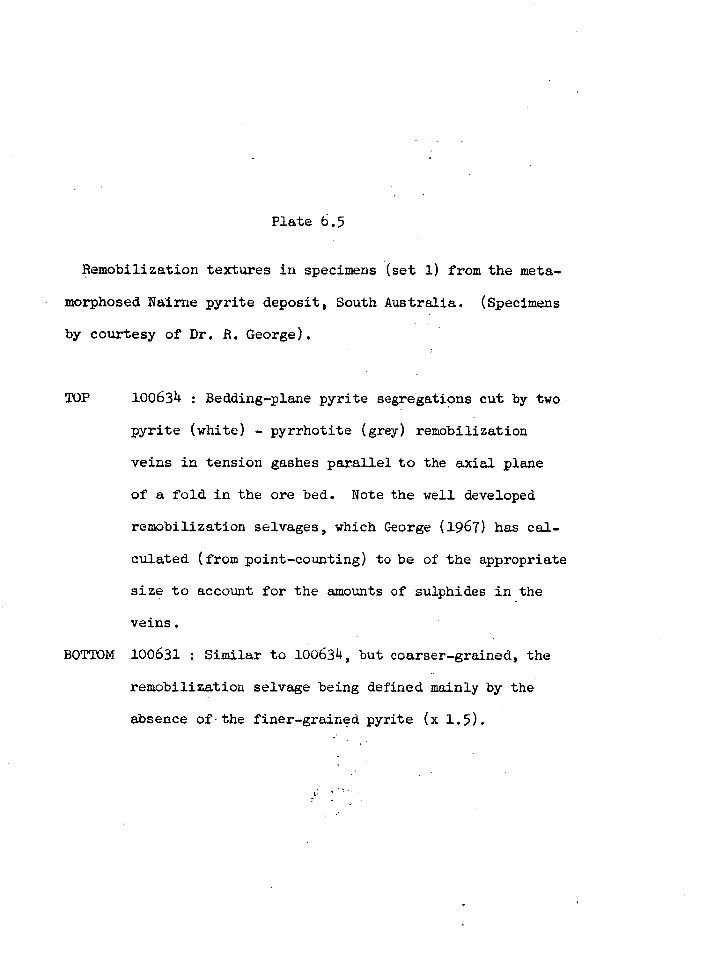
Plate 6.5
Remobilization textures in specimens (set 1) from the meta-
morphosed Nairne pyrite deposit, South Australia. (Specimens
by courtesy of Dr. R. George).
TOP 100634 : Bedding-plane pyrite segregations cut by two
pyrite (white) - pyrrhotite (grey) remdbilization
veins in tension gashes parallel to the axial plane
of a fold in the ore bed. Note the well developed
remobilization selvages, which George (1967) has cal-
culated (from point-counting) to be of the appropriate
size to account for the amounts of sulphides in the
veins.
BOTTOM 100631 : Similar to 100634, but coarser-grained, the
remobilization selvage being defined mainly by the
absence of-the finer-grained pyrite (x 1.5).
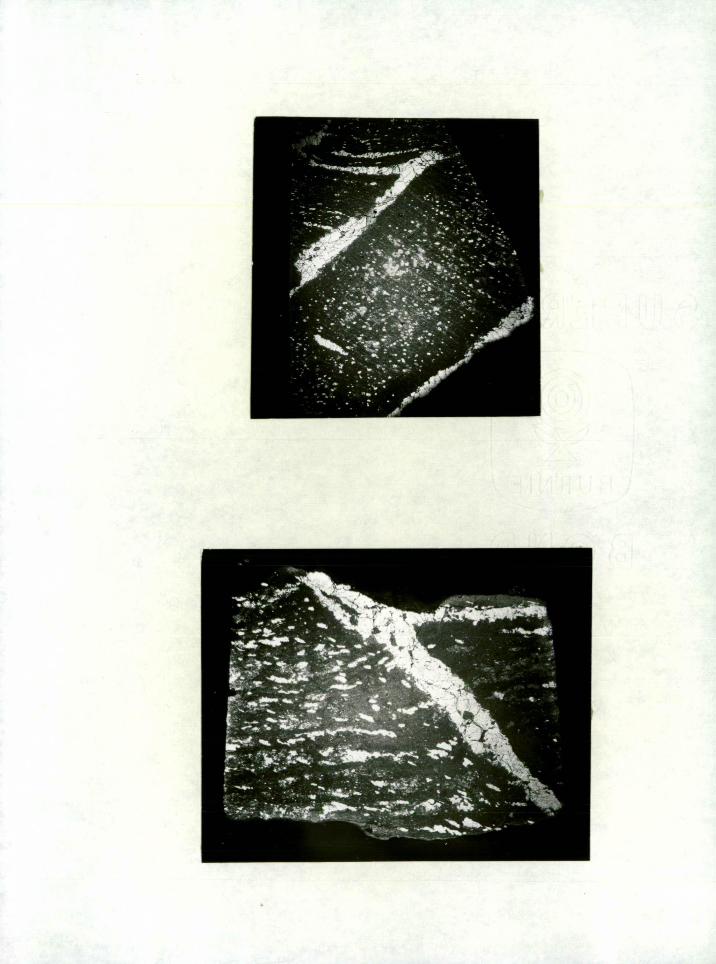
107
regimes Of T, P, Eh, and pH. At Nairne, the trace Ti in the original
clays has crystallized under high grade metamorphism as rutile (Edwards,
1949), and the major Fe has repartitioned between the sulphide and
silicate phases (George, 1967).
Remobilization, on the other hand, probably involves diffusion,
or hydrothermal transport, along structurally produced pressure
gradients (Reitan, 1960; Ramberg, 1961; Gresens, 1966), and changes in
Co, Ni and Se concentrations could be kinetic effects due to differentia;
mobility of elements in the "dispersed phase".
Partition between Minerals
Although the textures of most associated minerals examined in
this study show that they were not deposited contemporaneously, the
generalized distribution of Co and Ni between analyzed pairs (separated
from single crushed samples) of associated minerals (Figs. 6.22c, d,
6.25, 6.26) agrees quite well with the distribution in Figure 3.1.
Evidence particularly significant for pyrite-pyrrhotite partition is
given by the analyses of the specimen from Nairne shown in Plate 6.4
(bottom), which are presented in the caption, and in Figure 6.23. The
Co and Ni concentrations in the specimen have steep gradients with
respect to the pyrrhotite vein. Further, the relative Co-Ni concen-
trations in remobilized pyrrhotite and remobilized pyrites from other
specimens are almost identical with those suggested in Figure 3.1 on
generally less satisfactory evidence.
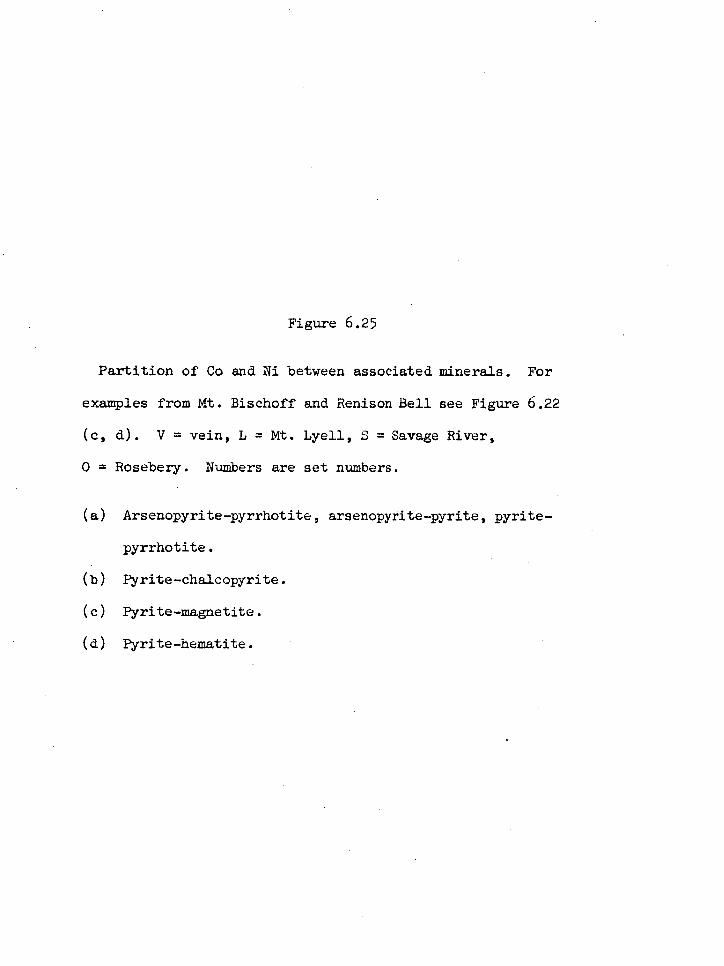
Figure 6.25
Partition of Co and Ni between associated minerals. For
examples from Mt. Bischoff and Renison Bell see Figure 6.22
(c, d). V = vein, L = Mt. Lyell, S = Savage River,
0 = Rosebery. Numbers are set numbers.
(a) Arsenopyrite-pyrrhotite, arsenopyrite-pyrite, pyrite-
pyrrhotite.
(b) Pyrite-chalcopyrite.
(c) Pyrite-magnetite.
(d) Pyrite-hematite.
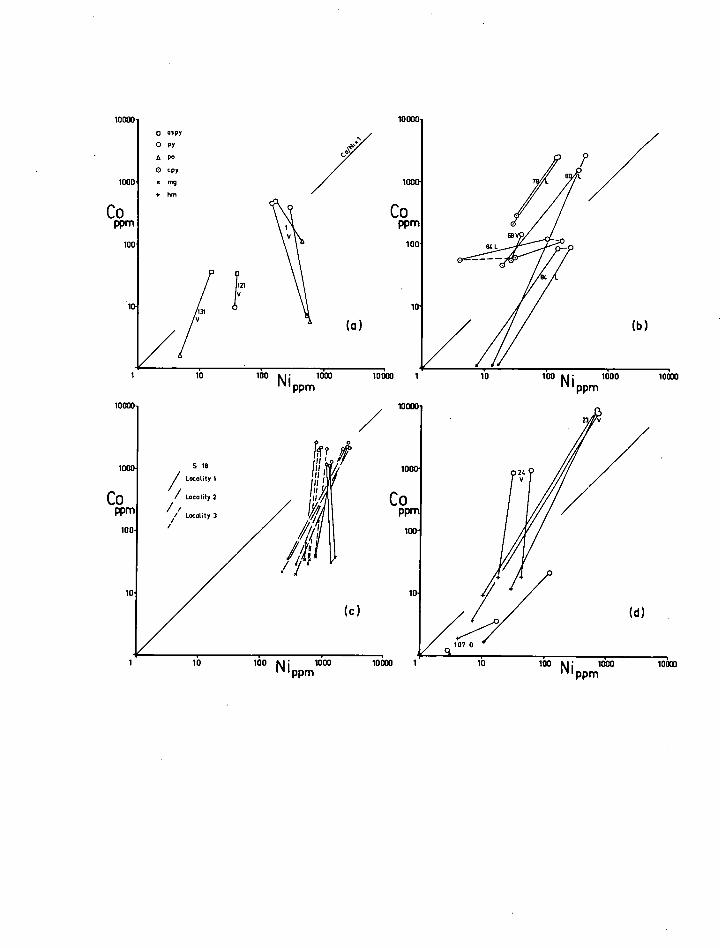
10000 o aspy
O PY
• po
o cpy
1000 ▪ hm
CO PPm
loo
10 131
V
S 18
/ Locality 1
/ Locality 2
// Locality 3
10 too ki loco " PPm
10 1 10 100 fJ 1000 10030 PPm
Figure 6.26
Averaged results of the partitioning of Co and Ni between
pyrite and other associated minerals in this study (cf. Fig. 3.1).
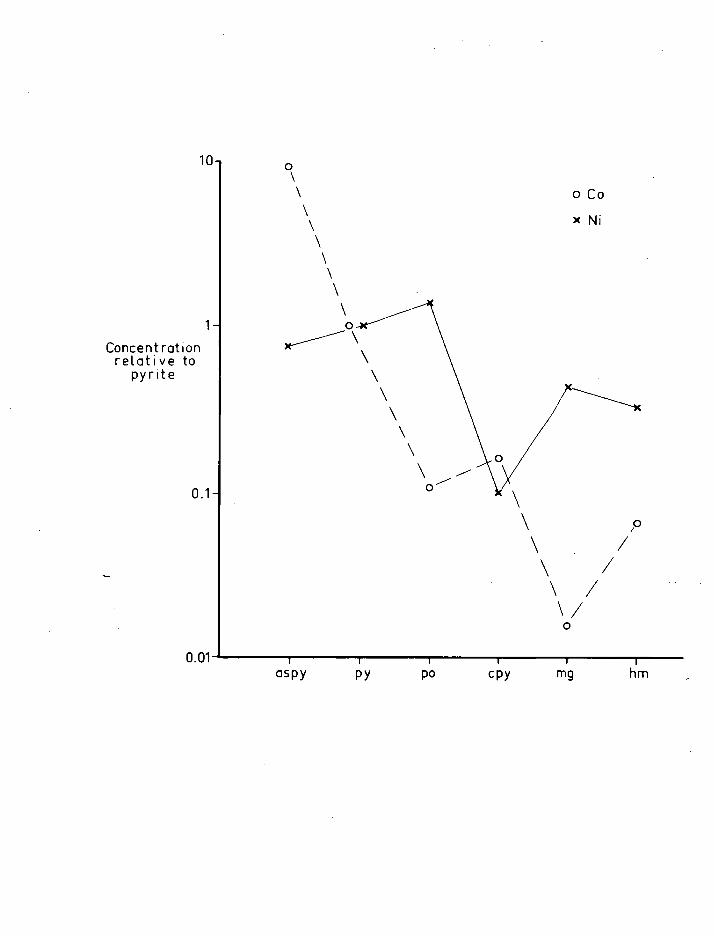
10
o Co
x Ni
Concentration relative to
pyrite
\ \
0.1-
0.01 him
I i I I 1 aspy PY po cpy mg
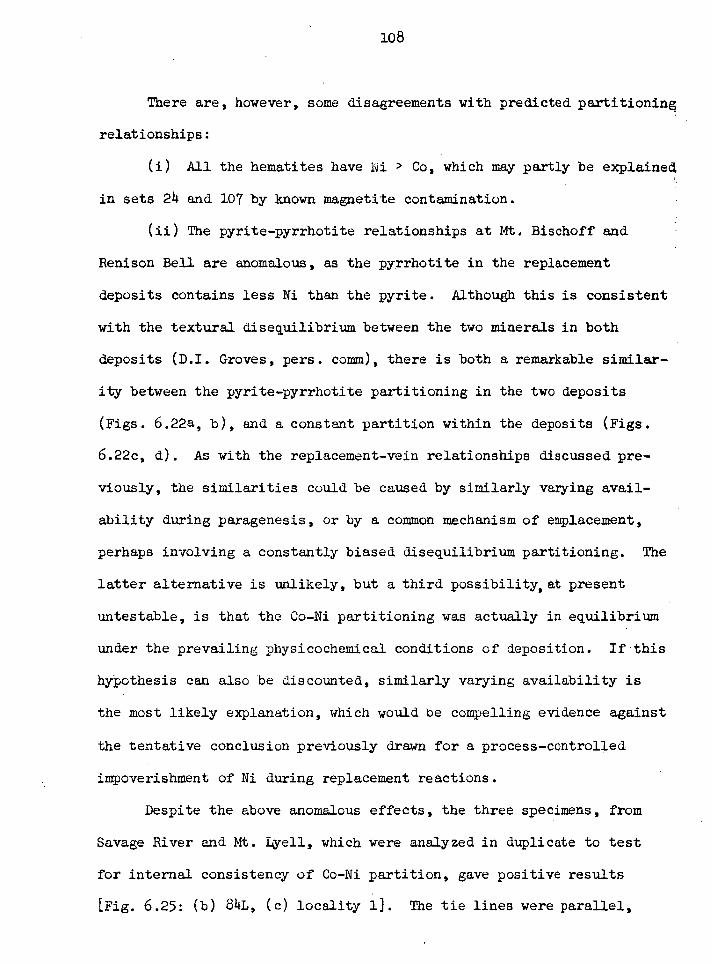
108
There are, however, some disagreements with predicted partitioning
relationships:
(i) All the hematites have Ni > Co, which may partly be explained
in sets 24 and 107 by known magnetite contamination.
(ii) The pyrite-pyrrhotite relationships at Mt. Bischoff and
Renison Bell are anomalous, as the pyrrhotite in the replacement
deposits contains less Ni than the pyrite. Although this is consistent
with the textural disequilibrium between the two minerals in both
deposits (D.I. Groves, pers. comm), there is both a remarkable similar-
ity between the pyrite-pyrrhotite partitioning in the two deposits
(Figs. 6.22a, b), and a constant partition within the deposits (Figs.
6.22c, d). As with the replacement-vein relationships discussed pre-
viously, the similarities could be caused by similarly varying avail-
ability during paragenesis, or by a common mechanism of emplacement,
perhaps involving a constantly biased disequilibrium partitioning. The
latter alternative is unlikely, but a third possibility, at present
untestable, is that the Co-Ni partitioning was actually in equilibrium
under the prevailing physicochemical conditions of deposition. If this
hypothesis can also be discounted, similarly varying availability is
the most likely explanation, which would be compelling evidence against
the tentative conclusion previously drawn for a process-controlled
impoverishment of Ni during replacement reactions.
Despite the above anomalous effects, the three specimens, from
Savage River and Mt. Lyell, which were analyzed in duplicate to test
for internal consistency of Co-Ni partition, gave positive results
[Fig. 6.25: (b) 84L, (c) locality 1]. The tie lines were parallel,
109
and in the direction predicted in Figure 3.1, and the partition ratios
of both Co and Ni for the mineral pairs were very similar for adjacent
pairs, thus suggesting equilibrium partitioning on a hilnd-specimen
scale. The partitions were derived from analyses which had either been
cross-corrected (Mt. Lyell, Table 6.5), or which were of > 99.5% pure
mineral (Savage River).
The consistency of variations at the specimen-scale and the
deposit-scale at Savage River and Mt. Lyell may be partly due to the
relatively large intrinsic difference in Co-Ni accommodation between
pyrite-chalcopyrite and pyrite-magnetite. Such large intrinsic
differences probably constitute the best explanation for the reasonable
agreement which is found between the results of workers analyzing Co-Ni
in ores which often are known to be in textural disequilibrium, and
between these results and the theoretical predictions. Because there
is not the same agreement between the results of investigations of Se
in different minerals, it is probable that any intrinsic differences in
Se accommodation between ore minerals is small. In this study, although
there are discernible trends of impoverishment of Se in sphalerite
(Fig. 6.12), the distribution between pyrite and chalcopyrite appears
to be variable (Figs. 6.12; 6.17 - West Lyell veins).
Dilution
Only in samples from the Stirling Valley Mine (set 121, Fig. 6.11)
were there observed effects which could best be explained by variable
abundance of suitable host minerals. There is a 20 to 30-fold enrichment
110
of Co and Ni in pyrite from the quartz veins compared with that in the
pyrite veins, which is probably due to the negligible tendency of the
Si02 structure to accommodate these trace elements, causing their
concentration in the pyrite.
Zoning
Three excellent opportunities existed in Tasmanian deposits for
testing the spatial distribution of Co and Ni in sulphides - at
Mt. Bischoff, Zeehan, and Story's Creek.
(i) At Mt. Bischoff (Fig. 6.18), Groves (1968) and Groves and
Solomon (in press) have established, from several criteria, a tempera-
ture gradient from the central part of the dyke swarm (Brawn Face)
outwards (Fig. 6.27). There are no uniform gradients of Co-Ni values
over the same interval (Fig. 6.28), but within the replacement lodes
the pyrrhotites show an increase in Ni from the Brown Face outwards
accompanied by an increase, and then a larger deurease, in Co
(Fig. 6.28, inset). The peculiar Co trend (which is similar to Se
zoning at the McIntyre Mine, Canada, noted on p.34) is paralled by a
decrease, and then a larger increase, in the (SS 34 values (Rafter and
Solomon, 1967) , the apex of both distributions occurring in the sane
area (Greisen Face - Pig Flat). This suggests that overall Zoning
trends of decreasing Co and increasing (58 34 values are complicated, by
additional unknown local variables.
(ii) Williams (1968) has analyzed pyrites from Zeehan, sampled
from the pyritic, sidero-pyritic, and sideritic zones, which are
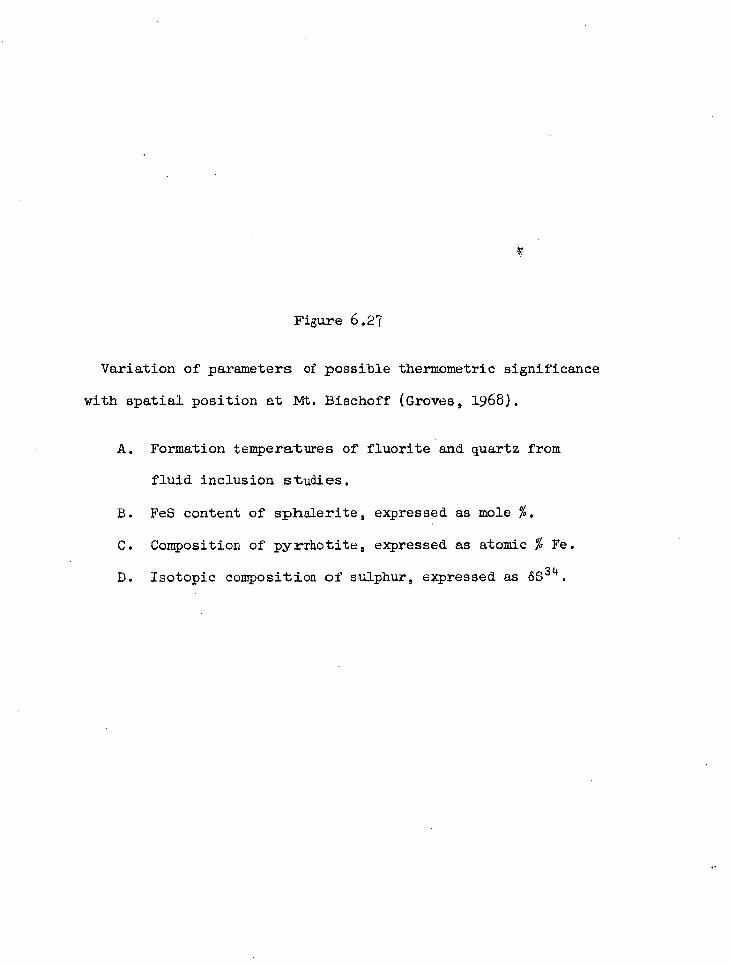
Figure 6 .27
Variation of parameters of possible thermometric significance
with spatial position at Id. Bischoff (Groves, 1968).
A. Formation temperatures of fluorite and quartz from
fluid inclusion studies.
B. FeS content of spholerite, expressed as mole %.
C. Composition of pyrrhotite, expressed as atomic % Fe.
D. Isotopic composition of sulphur, expressed as 604.
A
6°3
500
400
t 300
200
6
I RANGE
• IlE401
I
0 GAGE( AHILYSST
• 71I0 VALISES
25
3 20
* 15
10
0
I
46-4
i VIIGLE ANALYSIS OF NEXAGONAL FHANWOME
TWO NOV.= OF HEXAGONAL PrIGNIOWE
MAGI- OF COHNOSITION NO MINDER L7F I sAhste-s co- idol/OW*0C PY?4I7077TE
476-
47.4
47-2
If 470
466-
46 6-
0 WIFFIGHTE AHRITE
VI/ALERITE
a
-2
t§ A a
§ 4 91 § 4
F §1
INCREASING DISTANCE FROM CENTRE OF MOUNT BISCHOFF
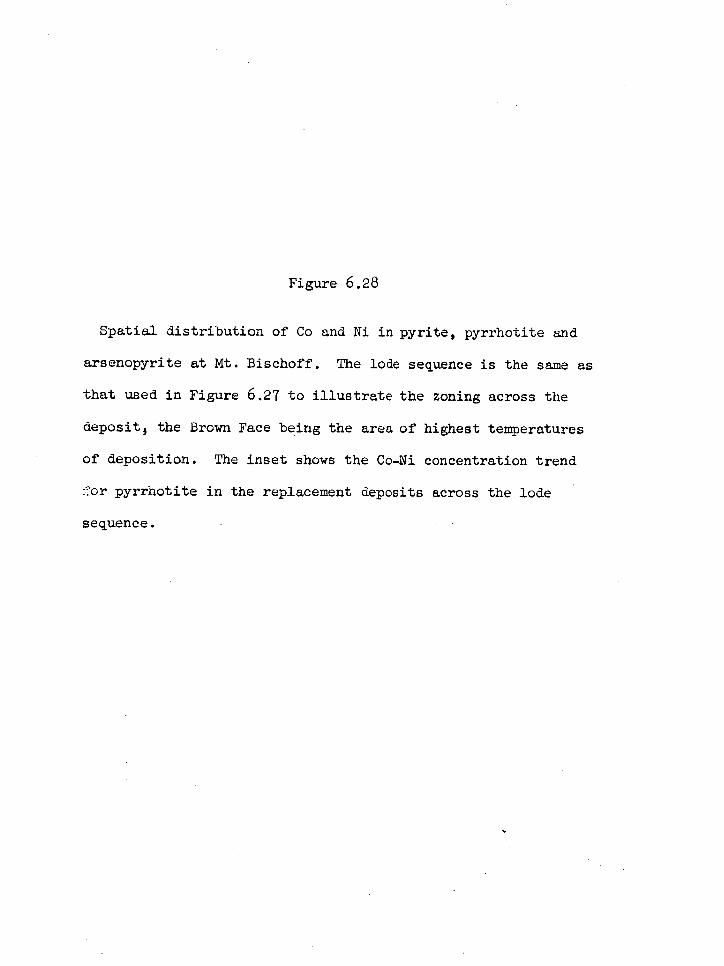
Figure 6.28
Spatial distribution of Co and Ni in pyrite, pyrrhotite and
arsenopyrite at Mt. Bischoff. The lode sequence is the same as
that used in Figure 6.27 to illustrate the zoning across the
deposit 5 the Brown Face being the area of highest temperatures
of deposition. The inset shows the Co-Ni concentration trend
for pyrrhotite in the replacement deposits across the lode
sequence.
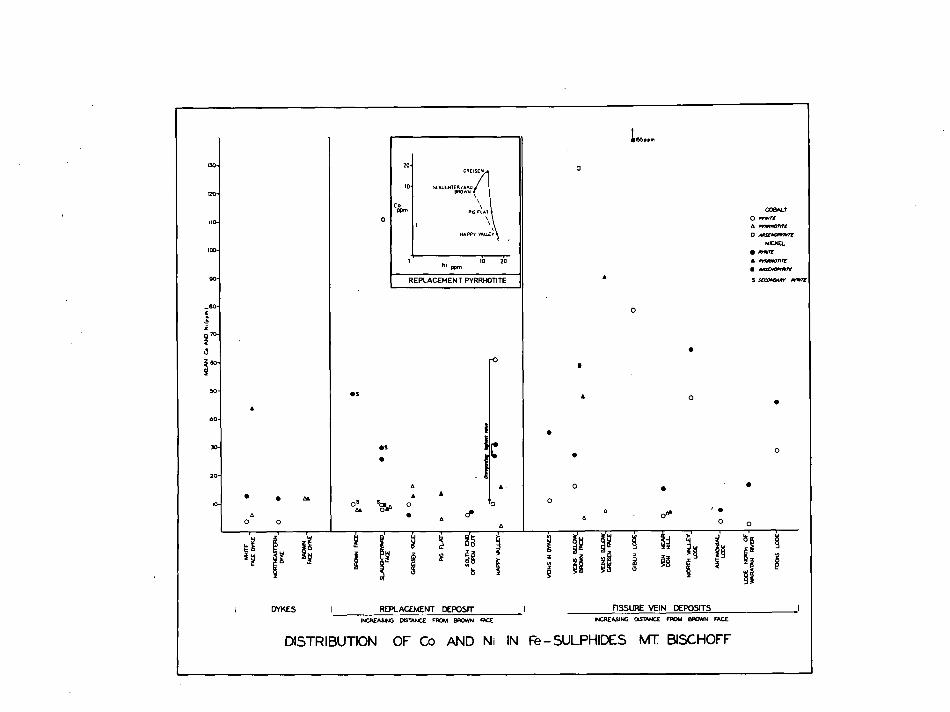
•
=GALT
0 7•10.717r
0 ARSENOMRIM
NICKEL
• MRIM
• AARRIOOTIM
• Aavoomart
S SE4414144m ARAM
•
a 0 • •
•
cp. •
0
• S
•
• os Son, o AN • cr
1215511 7011
20• ORE
10
SL AU GA TER y ASH BROwN
1 NAPPY VALLEY
Ni ib io
•
• •
REPLACEMENT PYRRHOTITE
g g n $4 l g r §§
4/
130,
20-
00-
100-■
90-
_110- F
2 70-
C
60-■
50-
40
30-
20
10
DYKES I REPLACEMENT DEPOSIT I FISSURE VEIN DEPOSITS INCREASING DIS1ANCE FROM e•ROWN 1ACE INCREASING DiSTAWE FROM •RowN FACE
DISTRIBUTION OF Co AND Ni IN Fe—SULPHIDES MT BISCHOFF
111
believed to represent zones of decreasing temperature of deposition
(Both and Williams, 1968). The Co-Ni analyses are plotted in Fig. 6.29a.
Williams found the pyritic and intermediate zone pyrites to have sig-
nificantly different Co contents (by F-test), and he also calculated
Co-Ni correlation coefficients of -0.58 and -0.84 for normal and loga-
rithmic coordinates respectively. He concluded that the limited data
supported the idea of Co content of pyrite decreasing with decreasing
temperature; and on the basis of the negative correlations, he inferred
an opposite, if less pronounced trend for Ni. He emphasised that
temperature was probably not the direct control of Co concentration.
(iii) At the Story's Creek Mine, the vein system is underlain
620 ft underground by an aplite cupola of the parent granite (Kingsbury,
1965). The (Sn + W) content and the Sn/W ratio are zoned with respect
to the granite, and it seems likely that a temperature gradient was
present during the formation of the veins. This is supported by fluid
inclusion studies (D. Patterson, pers. comm.). A preliminary survey of
the Co-Ni values in pyrite (set 68) shows an inverse relationship between
Co concentration and distance from the igneous source (Fig. 6.29b), for
an interval over which the fluid inclusion studies indicate a temperature
difference of 80°C.
In at least two of the three samples studied, therefore, there are
indications of a decrease in Co content of sulphides with increasing
distance from the igneous source and/or lower temperature-type of
deposit. These results support the inverse relationships between Co
concentration (in pyrite and sphalerite) and various parameters related
to "distance from the source" (e.g. inferred temperature, In/Pb ratios)
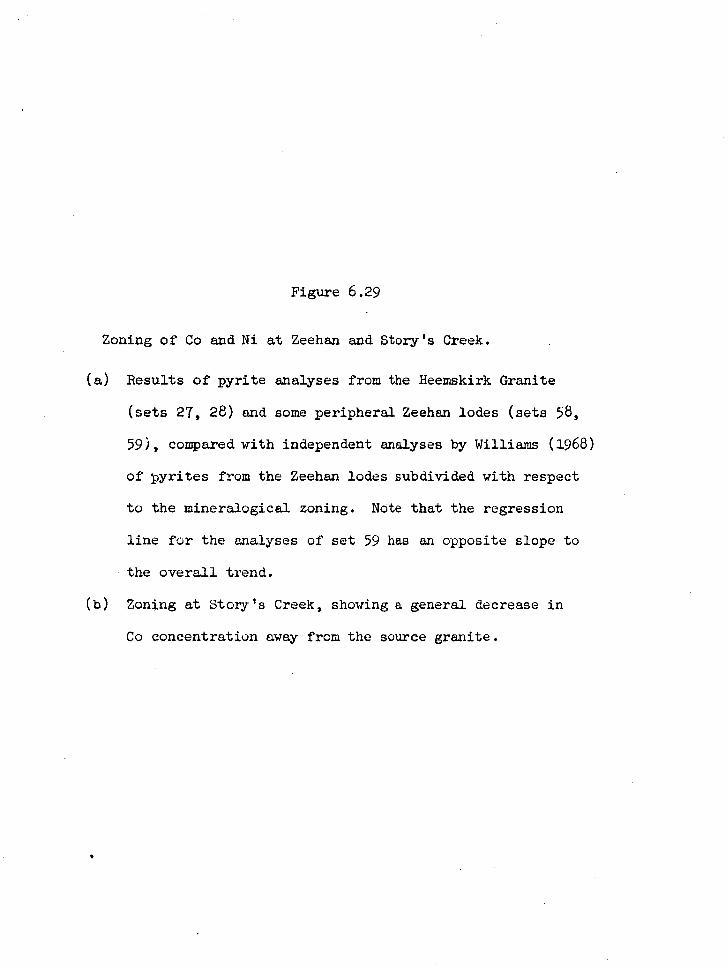
Figure 6.29
Zoning of Co and Ni at Zeehan and Story's Creek.
(a) Results of pyrite analyses from the Heemskirk Granite
(sets 27, 28) and some peripheral Zeehan lodes (sets 58,
59), compared with independent analyses by Williams (1968)
of pyrites from the Zeehan lodes subdivided with respect
to the mineralogical zoning. Note that the regression
line for the analyses of set 59 has an opposite slope to
the overall trend.
(b) Zoning at Story's Creek, showing a general decrease in
Co concentration away from the source granite.
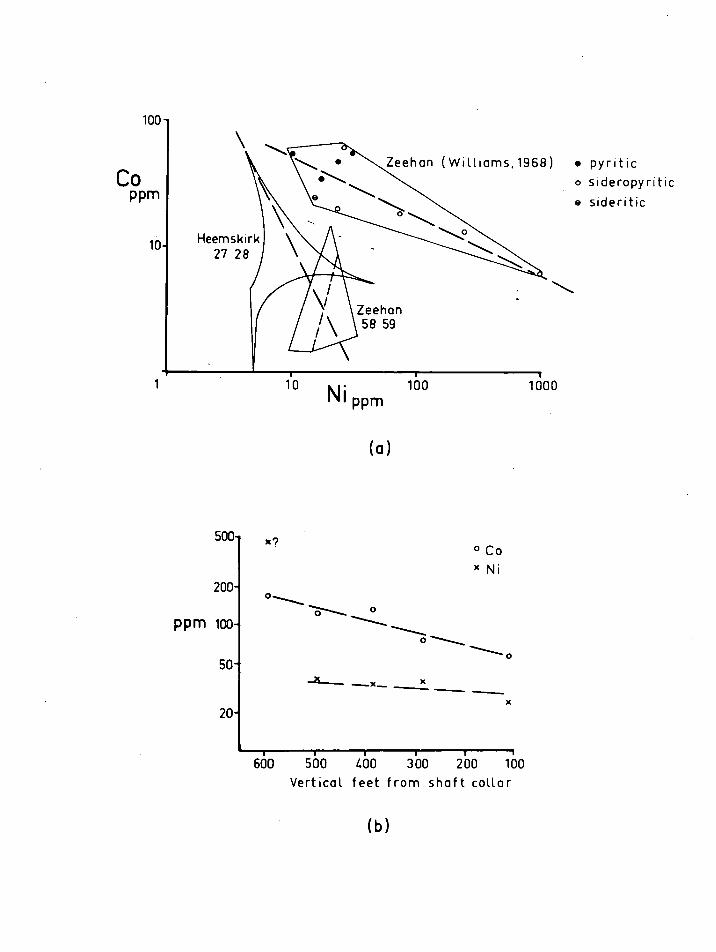
100
Zeehan (Williams, 1968) • pyritic o sideropyritic
• sideritic -,
CO PPm
Heemskirk 27 28
/
10- \
/\ /
Zeehan 58 59
110 io • 160 1 1 I ppm
(a)
g
1000
-2L---- —x_ x x
20-
660 500 460 300 200 100 Vertical feet from shaft collar
500
x?
200-
ppm 100-
50-
° Co x Ni
c-1------ ° ,.....
-------0
(b)
previously established by Gavelin and Gabrielson (1947), BiOrlykke and
Jarp (1950), Hawley (1952), and Rose (1967). A direct relationship
between Ni content and these parameters is suggested by the Mt. Bischoff
and Zeehan results.
Because of the controversy over the relationship between Cd content
of sphalerite and its Fe content and temperature of formation, the data
of Appendix 2 have been tested for the significance of such correlations,.
A plot of average Fe content against average Cd content, and the ranges 1
of contents, of sphalerites from the different areas is shown in Figure
6.30. There is no simple relationship between Fe and Cd if all the
deposits are considered together, and the Devonian cassiterite-sulphide
deposits and Pb-Zn-Ag fissure veins show opposite trends if grouped
separately. If, however, the spatial distribution is considered, i.e.
Waratah, Mt. Bischoff and Cleveland are grouped in one district (group 1),
and Zeehan, north-east Dundas and Renison Bell in another (group 2),
there is a negative correlation within each district between the average
Cd and Fe values for each deposit. The negative correlation becomes even
clearer when the Zeehan values are divided between the pyritic and
sideritic zones, and averaged. Further, Williams (1968) has found a good'
negative correlation (r = -0.92) between average Cd and Fe in sphalerites
from the Zeehan lodes (25 analyses from 14 localities).
The negative correlations of the averages within the two district
sets is not, however, shown by the individual analyses, as correlation
coefficients calculated for the latter are not significant at the 95%
level of confidence. Thus in western Tasmania Cd and Fe are dependent
variables on a regional scale, on a deposit scale (Zeehan), but not on
Figure 6.30
Plot of averaged Cd and Fe in sphalerites from the Devonian
lodes, and from Rosebery-Hercules and Mt. Lyell (Groves and
Loftus-Hills, in press). The bars represent the ranges of
values, the individual analyses being given in ApPendix 2.
-^
-
AVERAGE VALUES
• CASSITERITE — SULPHIDE DEPOSITS
A Pb - Zn- Ag FISSURE VEINS
0 BANDED Pb - Zn DEPOSITS
+ Cu DEPOSITS 0-5-
0.4-
TULL AH WAR ATAH
H MT BISCHOFF
3
0.2-
/— MT LYELL
- - - - -
-1 CLEVEL1ND
_fRENISON _TELL
ZEE HAN
N.E. DUNDAS
- .7
0.1-
0 1 1 8 12
WT. e/e Fe
1 18
113
a specimen scale. This discrepancy could be partly due to insufficiently
large sample populations, but the large ranges of concentrations for
each deposit (Fig. 6.30) suggest that additional local specimen-scale
variables are masking the regional correlation. The regional trends are
most simply ascribed to a varying availability of Cd in the ore forming
fluid related to distance from the source of the fluid.
Discussion
Trends I to V, defined from the undifferentiated Co-NI analyses
of pyrites, contain the following components due to depositional and
post-depositional processes:
(i) The trends to high Co, with Co/Ni > 1 (trends II and IV),
contain components due to remobilization (Mt. Lyell) and to zoning
(Story's Creek). The remobilization effect, although large, may be dis-
regarded in discussions of availability, and the zoning effect does not
substantially contribute to the outline of trend IV.
(ii) The trend to high Ni, with Co/Ni < 1 (trend III), contains
components due to differential enrichment in veins and replacement lodes
(Mt. Bischoff, Renison Bell), and to a large mineralogical dilution
effect within the Stirling Valley deposit. Neither of these components
is inconsistent with the trend as established by other Devonian ores.
(iii)The negative correlation trend between Co and Ni (trend V)
is wholly due to zoning of lodes across the Heemskirk-Zeehan field.
Further, the one lode for which several analyses are available (Zeehan-
Queen, set 59) follows trend III, normal to trend V (Fig. 6.29a).
114
Trend V cannot therefore be used as a basis for comparison of funda-
mental availability in other deposits.
Although the range of Cd values in the Devonian sphalerites is
partly caused by a district-scale zoning, this range is still quite
distinct from that of the Rosebery-Hercules sphalerites. Similarly,
the correlation of Se abundance with type of mineralization at Mt. Lyell
does not invalidate the comparisons already made between the range of
Se values in this deposit and in other deposits.
Thus, with the exception of Co-Ni trend V, the variations of con-
centrations of Co, Ni, Se and Cd due to the recognizable depositional
and post-depositional processes have contributed little to the boundaries
of the originally defined trends and groupings -, which may therefore be
interpreted as reflecting fundamental availability.
METALLOGENIC SUBPROVINCES
The Co-Ni and Se analyses of pyrites from the Devonian deposits
cannot be systematically subdivided on the basis of geographic distri-
bution. There appears to have been a uniform availability of these
elements during this epoch across Tasmania, in agreement with the con-
sanguinity of the east and west coast Devonian granites evident from
petrologic and radiometric relationships (Spry, 1962b; McDougall and
Leggo, 1965).
The values of Cd-Fe averaged for the different areas, as plotted
in Figure 6.30, suggest a varying availability of Cd between district
groups 1 and 2. This variation was tested by covariance analysis of Cd
115
on Fe for the individual analyses (Snedecor, 1946, p.318). It was
established at the 95% confidence level that the Fe content of the
sphalerites did not explain the difference in Cd content between the
two districts; after Cd was adjusted to a common Fe basis, the Cd con-
tents were still different. This small initial difference in avail-
ability of Cd between the Zeehan-Renison Bell and the Mt. Bischoff-
Cleveland districts is not shown by Co and Ni.
ORES OF UNCERTAIN ORIGIN
Savage River
The Co and Ni values in pyrite (Fig. 6.3) lie about the line
Co/Ni = 1, Co ranging 1000-2600 ppm and Ni 760-2700 ppm. They are
unlike the values in any other Tasmanian pyrites, thus precluding
empirical correlation withlocal ores of known origin. However, the
ranges of values are not incompatible with data from other countries.
Ortho-amphibolites in general, like the original mafic ingeous rocks,
have high Co and Ni, and Ni > Co (Taylor, 1965). Evans and Leake
(1960) give an example from Ireland with Co approximately constant at
10-46 ppm, and Ni ranging 6-465 ppm. The Ni vales in the amphibolites
of the Savage River similarly range 50-200 ppm * (E.B. Corbett, pers.
comm.), and if the Co values are assumed to be < 50 ppm, the enrich-
ments of Co and Ni in the pyrite are by approximate factors of 50 and
Analyses by XRF spectrograph, University of Tasmania.
n6
20 respectively relative to the present host rock. The different
partition ratios for Co and Ni are consistent with the crystallo-
chemical properties of pyrite, and are similar to ratios (Fe-sulphide
liquid/silicate liquid) calculated for Skaergaard by Wager et al.
(1957). Cambel and Jaxkovsky (1967, p.435) also consider that Ni con-
centrations in certain pyrites averaging 1680 ppm were derived from
ortho-amphibolites averaging 199 ppm Ni.
It has already been suggested that the ore was metamorphosed at
least twice, which may explain the apparent trace-element equilibrium
on a hand-specimen scale between pyrite and magnetite. Figure 6.3
shows that, in the data averaged for three localities, an increase in
Co is accompanied by a decrease in Ni . This effect is as great PY mg
and between localities as within localities (Fig. 6.25c), we is ascribed to
variation of Co and Ni during the original mineralization.
The Se values in the pyrites (Fig. 6.12) are too few for statis-
tical comparison with the other groups, but they are very much less
than the values in the pyrrhotite-pentlandite ore associated with the
mafic-ultramafic complex at Cuni.
There are insufficient trace element results to give a detailed
indication of mechanisms of emplacement of the Savage River ores, but
the data are consistent with abundances in sulphides in other ortho-
amphibolites.
UT
Mt. Lyell
The results of the analyses (Figs. 6.7, 6.8) may be summarized as
follows. Pyrite from disseminated and massive cupriferous mineralization
(Figs. 6.7a, 6.8a - 72, 6.8b 91) contains high Co and low Ni. Chalco-
pyrite from the sane ores contains less Co and Ni than the pyrite.
Pyrite from disseminated non-cupriferous mineralization (Figs. 6.7b
85 to 88, 6.8a - 73 to 76, 6.8b - 89 to 90) also contains somewhat less
Co and Ni, and that from the Pb-Zn ore at Tasman and Crown Lyell
(Fig. 6.8c - 95) contains little of either Co or Ni. As already dis-
cussed, pyrite and chalcopyrite remobilized from disseminated mineral-
ization (Fig. 6.7c) become impoverished in both Co and Ni.
These results indicate that Co in pyrite correlates grossly with
the Cu concentration, the lowest Co values being recorded either in
pyritic disseminations spatially separated from the Cu ore (as at the
Blow), or in areas which are generally Cu-deficient (as in the Cape Horn,
pyrite body, and at Comstock). This phenomenon does not, however, apply
over a wider area, because although there are other Cu ores in the
Cambrian acid-intermediate igneous suite which are Cu-rich and Co-rich
(set 24), there are Co-rich mineralizations that lack Cu (sets 22, 23).
It is interesting to note that Se is dispersed in this igneous suite
quite differently, being enriched only at Mt. Lyell, but not showing
the same correlation with Cu across the area.
Spatial distribution was tested by sampling several specimens
from each of four adjacent pyritic shoots in the schistosity at the
Blow (sets 73-76; Fig. 6.8a); several specimens from each of three
118
similar shoots in the West Lyell Open Cut (sets, 85-87; Fig. 6.7b); and
irregularly distributed specimens from each of three diamond-drill holes
through the Prince Lyell orebodies (sets 71-80; Figs. 6.7a, 6.31). The
results show that the Co/Ni ratio remains approximately constant within
individual shoots, but that successive shoots are demarcated over dis-
tances as small as 10 ft by variable Ni, and to a much less extent
variable Co. This implies stratification of Ni (and Co) in the plane of
the shoots. In the larger-scale Prince Lyell ore lenses (Fig. 6.31),
the Co and Ni concentrations have been averaged over 25 ft intervals
along the drill holes, and the resulting values define a limiting volume
for mutual dependence of Co and Ni concentrations of about 200 ft normal
to the lenses, and up to at least 1200 ft parallel to the lenses, once
again indicating gross stratification. However, the large-scale iso-
pleths of Ni, Co, and Cu values (the latter indicated by the lens outlines
in Fig. 6.31) are not quite parallel, which suggests either that the
stratification of elements is less likely to have been caused by simple
sedimentation than by large scale replacement, or possibly that later
metamorphism has slightly modified the dispersion patterns. The tendency
for Co to be enriched within the lenses of higher Cu-concentration is
further evidence for the correlation of Co and Cu within the deposit.
The banded Pb-Zn ores at Tasman and Crown Lyell, which are somewhat :
similar to the ore at Rosebery, display a variety of empirical correla-
tions. On the basis of Se, and of S-isotope analyses (Solomon et al.,
in press), these ores are little different from the other Mt. Lyell
mineralization, and quite different to the results for Rosebery. In
their Co and Ni values, however (Fig. 6.8c), they differ markedly from
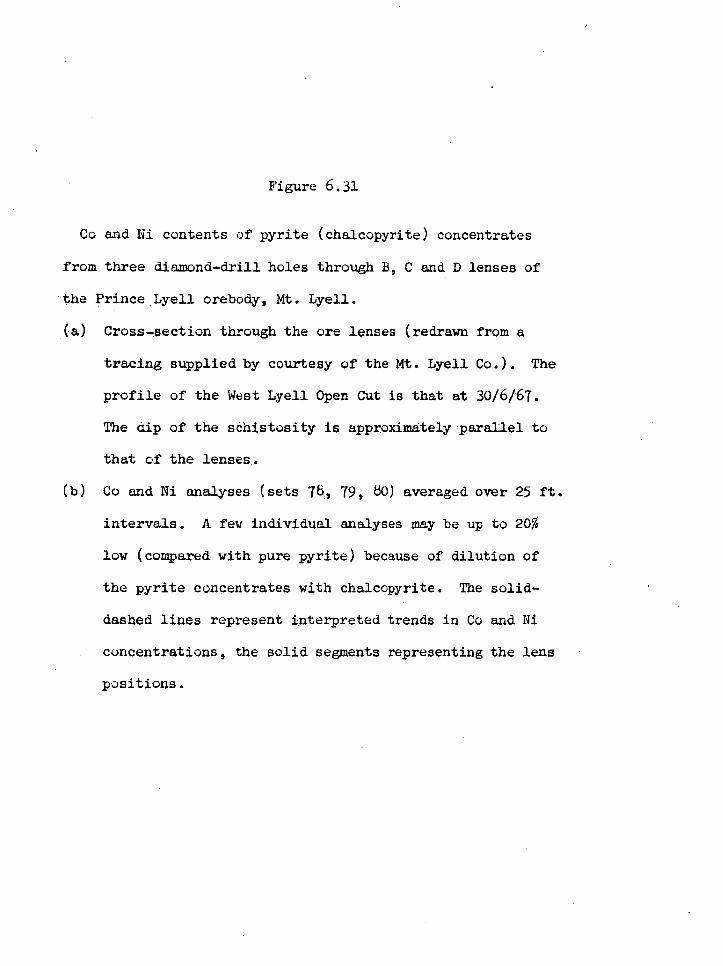
Figure 6.31
Co and Ni contents of pyrite (chalcopyrite) concentrates
from three diamond-drill holes through B, C and D lenses of
the Prince Lyell orebody, Mt. Lyell.
(a) Cross-section through the ore lenses (redrawn from a
tracing supplied by courtesy of the Mt. Lyell Co.). The
profile of the West Lyell Open Cut is that at 30/6/67.
The dip of the schistosity is approximately parallel to
that of the lenses.
(b) Co and Ni analyses (sets 76, 79, 80) averaged over 25 ft.
intervals. A few individual analyses may be up to 20%
low (compared with pure pyrite) because of dilution of
the pyrite concentrates with chalcopyrite. The solid-
dashed lines represent interpreted trends in Co and Ni
concentrations, the solid segments representing the lens
positions.
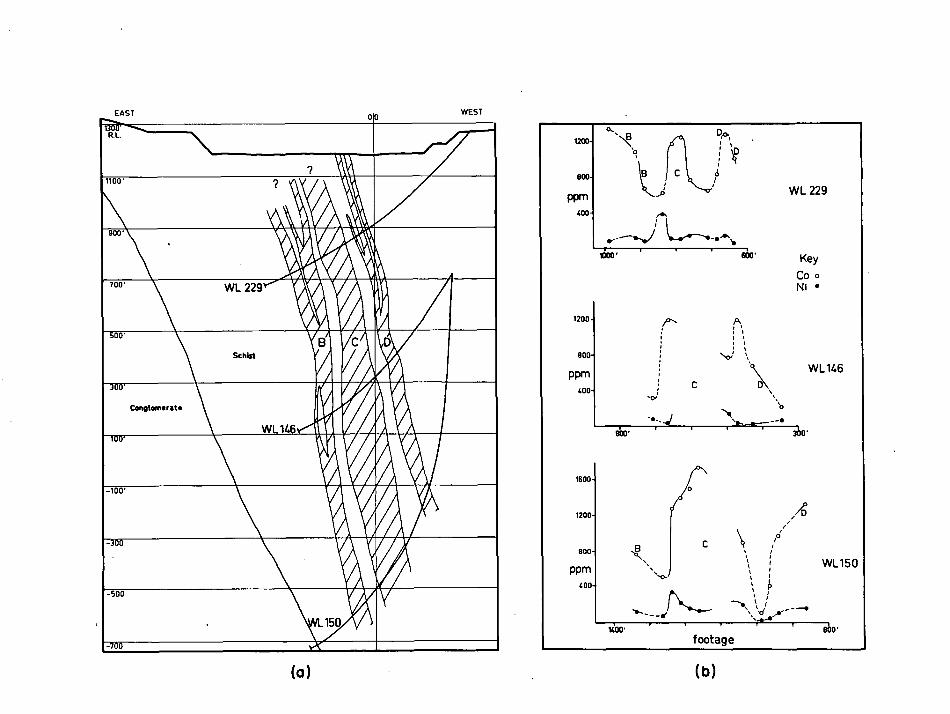
1200-
''p 800-
PPm £00-
WL 229
1200
80
PPm 400
WL146
\el
0
iv.L.
ki1100. I A 1 i
A 9
, , yr
900 wir m ilk Asik 700 111111KAW 4111C4
0 Schist
II
Conglomerate IF' .iiii At N
..
WIN A _„0 vf dt 01 l ' -500
150 *
-700
(a) ( b)
Key Co • NI •
1600
1200
800 , 1 1
PPm •, WL150
1400' footage
119
the other Mt. Lye11 ores, and lie within the range of values shown by
the Rosebery ores (Fig. 6.9).
The overall trend of the Co-Ni values in the Mt. Lyell deposit is
coincident with trend II, which was defined from the concentrations in
pyrites coeval with the Cambrian.acid-intermediate igneous activity.
This correlation is strong empirical support for a similar origin for
the Mt. Lyell ores. Evidence from this study that the mineralization
was due to the volcanic phase of this ingeous activity is based on
comparisons with data from ores in other countries:
(i) The Co-Ni values in the Cu ores, and the relative impoverish-
ment in the associated Pb-Zn ores, are consistent with values in several
similar ores in Europe and Canada for which a volcanic source of the
metals has been postulated (see Chapter 3).
(ii) The high concentrations of Se in sulphides at Mt. Lyell
(Fig. 6.12), in an otherwise low- to normal-Se province, are consistent
with enrichment in pyritic-Cu deposits in volcanic rocks elsewhere in
the world (Sindeeva, 1964). However, the pyrites from the Cambrian
volcanic rocks and sub-volcanic granites away from the Mt. Lyell area
are all low in Se, and it would appear that whatever process resulted in
Cu-rich ore fluids at Mt. Lyell also caused a concentration of Se.
(iii)The Se dispersion pattern (Fig. 6.17) is best explained by a
volcanic origin for the ores. As Se is particularly enriched in sur-
ficial volcanic processes, its concentration in the massive oreboddes at
Mt. Lyell (including the banded Pb-Zn deposit at Tasman and Crown Lyela),
which occur at the stratigraphic top of the Cambrian volcanic sequence,
is consistent with the surface origin which has previously been suggested
120
for several of these lodes, and for hematite-chert bodies at the sane
horizon (Solomon, 1967; Markham, 1968; Solomon et al., in press).
Rosebery-Hercules District
Samples, mainly of purified pyritic ore, from the Rosebery and
Hercules banded Zn-Pb-Cu lodes, show an enrichment in Co from 0 ppm to
650 ppm, but an extreme deficiency in Ni, most of the analyses falling
below 20 ppm (Fig. 6.9). The maximum Co values are one-third, and the
average Ni values one-twentieth, those at Mt. Lyell. The Se values,
and the Cd concentrations in sphalerites, are also significantly im-
poverished with respect to all the other ores analyzed, most significant1y
the Devonian ores. The Se values are very much less than in the similar
Tasman and Crown Lyell ore at Mt. Lyell,
A spatial distribution within the Rosebery lodes of increasing Co
from footwall to hangingwall was tentatively postulated from preliminary
analyses, and this was tested by systematic chip sanpling across the lode
at two sections 80 feet apart (sets 109, 110), one of these sections alsq
extending 1 ft into the footwall schist. These samples were analyzed
whole ("ORE" in sets 109, 110), and an attempt was then made to extract
pure pyrite concentrates ("Pr" in sets 109, 110). All original and puri-
fied samples were analyzed for Fe, Zn, Cu, Co and Ni, and the proportions
of sphalerite, pyrite and chalcopyrite calculated. The trends of CO-Ni
(Co2, Ni2) concentrations in ore (of variable mineralogy) were then
tested by comparing the Co-Ni (Col, Nil) concentrations in those purified .
samples which were > 95% pyrite, with the results given in Figure 6.32a, b.
Figure 6.32
Co and Ni analyses of Rosebery ore, and of pyrite concentrates
(>95% pure), with pyrite, chalcopyrite, and sphalerite contents
of the ore calculated from Fe, Cu and Zn analyses (sets 109,
110). Chip samples (100-900 g) were taken at 18 in. intervals
across the lode, normal to the banding, in E lens, 14 level.
Sections are east-west, looking north.
(a) 14S2NS stope.
(b) 14S2NN stope, 80 ft. north along strike from (a).
AAN
PPm •
Co
• • •
chalcopyrite
sphalerite
4 To
0
40
20
0
8
hangingwoll footwolt
Ni • •
pyrite
20 ppm
40—
20—
0 —
o Whole ore
A >95% pyrite
0 3
ft.
(a) (b)
121
The Co-Ni trends for the purified samples are not markedly different to
those for the whole ore, apparently because pyrite constituted such a
large proportion of the ore, and contained most of the Co. The sphalerite
contains only about 10 ppm Co (McLeod, 1965), even though sphalerite can
incorporate up to 21% Co (Hall, 1961). In both sections, Ni in pyrite
shows a general increase in concentration from footwall to hangingwal,
and Co shows two concentration peaks, approximately 5 and 18 feet from
the footwaIl. Both Co and Bi values are somewhat lower in set 109 than
set 110. It may be concluded that Co and Ni varied independently during ,
mineralization, but that both are highly stratified in the plane of the
orebody. The Volume defining the limits of mutual dependence of Co con-
centrations has dimensions of less than 6 ft normal to the banding, and
probably not much greater than 80 ft parallel to the banding along strike.
That the third dimension, parallel to the banding, may also be large, is
indicated (Fig. 6.9) by the equivalence of set 109 values with those in
set 111, 80 ft away down a 45 ° pitch to the north. Although the strati-
fication of trace elements across the two-measured sections is more
consistent than that of the major elements, this is a direct consequence ,
of the sampling interval, which exceeds the wavelengths of variation
(for the sample-size used) of the major elements, but not those of Co
and Ni. These Co-Ni distributions are further evidence for the chemical
layering of the ore parallel to the host rock contacts.
The Co-enrichment gives the Rosebery-Hercules ores a trend
similar to trend II, which is empirical support for association of the •
ores with Cambrian igneous activity. That the mineralization was assoc-
iated with the volcanic phase of this activity is suggested by the
122
striking similarity of the Co-Ni distributions with those in ores in
other countries which have been genetically linked with volcanic rocks.
Further, some of these other ores show the same relative Co-Ni relation-
ships in their pyritic-Cu and Pb-Zn ores as are shown by Mt. Lyell and
Rosebery-Hercules.
Evidence from this study that the Rosebery ore was sedimentary
is as follows:
(i) The trace elements, as well as the major elements, are highly
stratified, as at Rammelsberg (see p.28).
(ii) There is a large-scale zonation of Co-Ni values through the
mine suggestive of gradations between normal and Abnormal sedimentary
environments (Fig. 6.10a). The hangingwall shale contains pyrite and
pyrrhotite (sets 6, 116) with normal sedimentary Co-Ni values. The
pyrite in the host-rock shale (set 7) also appears to be sedimentary,
but the Co-Ni values show large and variable impoverishment. Over-
lapping the latter values are those from the pyrite-hematite lode
(set 107), just above F lens of the main lode. These in turn pass into
the Co-Ni field for the main lode. Taken in reverse sequence, the
gradual change in Co-Ni values could represent a gradual reestablishment
of normal sedimentary trace-element concentrations after an episode of
highly abnormal availability of metals to the sedimentary basin. The
equivalence of Co-Ni values in the footwall schist (set 25) and the main
lode further reinforces the interpretation of ore solutions rising
through the footwall to the site of open-cast deposition. The distinc-
tiveness of Co-Ni values in pyrite in the hangingwall volcanics (set 26)
can be explained by a separate mineralization in younger rocks.
123
None of the zonations described above is reflected in the Se or 6S 34
values.
If the ore is indeed sedimentary, the impoverishment in Ni,
unusual in normal sediments, requires explanation. At the time of
deposition, the normal agents of transport of Co and Ni in the sediment-
ary basin may have been completely excluded from the depositional site.
This is consistent with the massive nature of the ore, even at its strike
extremities. The high Co and low Ni could therefore be wholly due to the
volcanic exhalations.
The origin of the mineralization at the Black P.A. Mine, to the
west of the Rosebery Mine, is not revealed by the Co and Ni values (set
125), which are both low, and therefore ambiguous. However the pyrite in
the Natone Volcanics (set 126) has Co-Ni values similar to trend III, and
is therefore probably-Devonian.
Mt. Farrell
Minerals from the group of mines at Mt. Farrell contain Co-Ni
values (Fig. 6.11a) belonging to the Devonian trend III, and the Cd con-'
centrations in sphalerite (Appendix 2) fall within the range of the
Devonian deposits. Thus two independent empirical correlations point to -
a Devonian age for this mineralization. The spread of Se values
(Fig. 6.12), however, is similar to that at Mt. Lyell. Solomon et al.
(in press) have suggested that a volcanic (Cambrian) origin for the S at
Mt. Farrell is a distinct possibility, and the Se may have a similar
origin. Nevertheless, the Se enrichment would still remain essentially
124
unexplained, as the Mt. Farrell ores are not cupriferous, and Rosebery,.
which is mineralogically more similar and geographically closer to
Mt. Farrell than is Mt. Lyell, shows an impoverishment in Se.
Magnet
The Cd and Se contents of sphalerite from the Magnet Mine are
similar to those in the sphalerites from the other (Devonian) Pb-Zn-Ag
deposits in the area around Mt. Bischoff, which supports the consanguinity
of these ores.
Mt. Remus
The high Co values found in the pyrite (Fig. 6.11b) seem not to be
contained in independent minerals, as none of the latter were found by
mineragraphic examination by Stillwell (1932) or by mineragraphic and
X-ray diffraction examination by the author. The Co-Ni values belong to
trend II, and this mineralization is therefore probably related to the
Cambrian acid-intermediate igneous activity.
Lake George Mine, Captain's Flat, N.S.W.
The Co-Ni values from these samples have not been compared with
values in other minerals of known origin in the same area. However there
is a striking similarity between the trend of Co-Ni values from this
deposit (Fig. 6.11b), from Rosebery (Fig. 6.9), and especially from
125
Tasman and Crown Lyell (Fig. 6.8c). If this trend remains distinctive
after further investigation of other types of mineralization in the
Captain's Flat area, it would be suggestive of a common mineralizing
process for the three deposits.
Discussion
In three places - the Roebery, Hercules, and New North Mt. Farrell
Mines - contiguous lode and sedimentary pyrites were analyzed for Co and
Ni, and only at the last of these mines was there an overlap of trends
for the two types. The freedom from ambiguity shown by the other two
occurrences reflects the most striking difference in trends revealed by
this study - between the sedimentary-diagenetic trend I, and the Cambrian
acid-intermediate igneous trend II. The Devonian intramagmatic and
hydrothermal minerals, showing more diverse trends, are less easily used
for unambiguous empirical correlations.
The data of this study indicate significant differences in the dis-
persion characteristics of Co-Ni, Se, and S 32-04 . The overall avail-
ability trends of Co and Ni are alike for deposits of similar genesis
(e.g. the sedimentary pyrites; the volcanic pyrites). The gross avail-
ability of Se, however, seems to be much more closely related to the
composition of the mineralizing fluid (e.g. Mt. Lyell and Rosebery
are very different, which was already known), and the (50 4 values either
tend to be different for each deposit (Mt. Lyell, Rosebery, Mt. Farrell;
Fig. 5.6) or fortuitously alike for unrelated deposits (Mt. Lyell and
Renison Bell: Rafter and Solomon, 1967; Both et al., 1967). Further,
126
differences in depositional variables within deposits are reflected in
detail by the Co-Ni concentrations, but only in a general way by the Se
concentrations (at Mt. Lyell) and by the 60 4 values (zoning at
Mt. Bischoff and Heemskirk-Zeehan: Rafter and Solomon, 1967; Both et al.,
1967). The practical consequence for genetic interpretation is that
neither the Se nor 60 4 values are as useful as the Co-Ni values in
drawing empirical correlations within deposits, and between nearby
deposits. One is forced instead to rely on empirical correlations with
deposits in other metallogenic provinces, which for trace element studies
at least is less satisfactory, because ideally this requires establish-
ment of the background dispersion patterns in each area.
CONCLUSIONS
Processes
1. Distribution functions. Cobalt and nickel in the two largest
homogeneous sample populations (23 and 26 samples) show positively
skewed distributions which are not, however, exactly lognormal.
2. Variation within single minerals. The ranges of specimen-
scale variation of Co and Ni are similar for different types of deposits
and different minerals. However, in replacement and sedimentary-
diagenetic minerals, on both the hand-specimen and deposit scale,
variations tend towards the type Co/Ni = k, whereas the variation in
veins is more like Co or Ni = k.
127
The range of specimen-scale variation of Se tends to remain con-
stant for all mean Se concentrations.
3. Massive vs. disseminated. Selenium at Mt. Lyell is more
concentrated in the massive orebodies at the stratigraphic top of the
Mt. Read Volcanics than. in the stratigraphically lower disseminated
mineralization. This is interpreted in 17 (below).
4 • Vein vs. replacement. From the strikingly similar distri-
butions of Co and Ni between vein and replacement deposits at Mt.
Bischoff and Renison Bell, 25 miles apart, it is tentatively concluded
that the replacement process results in an impoverishment of Ni, and to
a less extent of Co.
5. Vein vs. sedimentary. The results of analyses from the sedi-
mentary pyrite-pyrrhotite deposit at Nairne, South Australia, do not
support the contention of George (1967) that cross-cutting "shear" veins
represent remobilized bedded sulphides.
6. Metamorphism. The Savage River magnetite deposit, probably
the most metamorphosed ore in Tasmania, shows homogenization of Co-Ni
values, and apparent specimen-scale equilibrium partitioning of Co and
Ni between pyrite and magnetite.
7. Remobilization. Analyses from Nairne and Mt. Lyell indicate
that both solid-state and hydrothernel remobilization of pyrite and
dhalcopyrite involve the expulsion of Co, and to a less extent Ni.
8. Partition between minerals. The irregularity of Se parti-
tioning is confirmed, and it is concluded that the differences in
intrinsic accommodation capabilities of the sulphides are probably small.
There is some evidence, however, for a general impoverishment in
sphalerite.
128
Cobalt and nickel show quite consistent partitioning, particularly
strong evidence being adduced for pyrite -pyrrhotite, pyrite-magnetite,
and pyrite-chalcopyrite relationships. Anomalous pyrite -pyrrhotite
partitioning at Mt. Bischoff and Renison Bell could not be satisfactorily
explained.
9. Dilution. There is a 20 to 30-fold impoverishment of Co and
Ni in pyrite from quartz veins compared with that from pure pyrite veins
at the Stirling Valley Mine, Tullah.
10. Zoning. Data from mineralogically (and in at least two cases,
thermally) zoned mineral deposits at Zeehan, Mt. Bischoff and Story's
Creek indicate general gradients of decreasing Co (two examples) and
Increasing. Ni(two examples) away from the centres.
A regional zonation of Cd with respect to Fe in sphalerites was
detected in the Devonian deposits, but it was heavily masked by local
variables. The zonation is interpreted as an increase in the Cd content
of the ore fluid with increasing distance from the source.
11. Effects of the processes. Except for the Co-Ni zoning at
Zeehan, the variations of the concentrations of Co, Ni, Se and Cd due to
the above depositional and post-depositional processes have contributed
little to the boundaries of the overall trends, which may be interpreted
as reflecting fundamental availability.
129
Mineralization of Known Origin
12. Sedimentary-diagenetic (Precambrian-Recent). The Tasmanian
samples contain normal Co-Ni values, with Co/Ni < 0.5 in most cases
(Trend I). There is no correlation of the Co-Ni values with age or
degree of recrystallization, although criteria for the latter were found
difficult to establish. Large-scale uniformity of Co/Ni ratios are found
in the pyrites within several sedimentary formations. The proportion of
Ni in the non-pyrite fraction of shales may be proportional to the
carbonaceous content, for constant Fe content and metamorphic grade.
The range of Se values is unusually large for a province which in
general shows little Se enrichment.
13. Cambrian. Pyrites in acid-intermediate volcanics and sub-
volcanic granites contain high Co/Ni ratios, ranging 1-150 (Trend II).
Pyrrhotite-pentlandite ore associated with the Serpentine Hill
mafic-ultramafic complex is enriched in Sc, and contains Co/Ni =
but magnetite from the McIvor Hill gabbro, with the same Co/Ni ratio,
contains much less Co and Ni. Pyrite from a spilite in the Bald Hill
complex is enriched in Co, and falls into trend II.
14. Devonian. The vein and replacement deposits show three
trends; to high Ni with low Co/Ni ratio (trend III), to medium Co with
Ni approximately constant (trend IV), and a negative correlation trend
(trend V). .Trend III Could be partly due to contamination of Devonian
mineralizing fluids by nickeliferous Cambrian igneous country rocks.
15. Metallogenic subprovinces. There may have been a slight
difference in the availability of Cd in the Devonian ore fluids in the
130
Zeehan -Benison Bell and Mt. Bischoff-Cleveland areas. No systematic
subdivision in terms of Co-Ni or Se is possible.
Mineralization of Uncertain Origin
16. Savage River (Fe). The Co and Ni contents of the pyrite
both range 1000-2500 ppm, unlike any other Tasmanian hypogene pyrites.
These values are not unreasonable for sulphides in an ortho-amphibolite,
but they give no indication of the mechanism of ore emplacement.
17. Mt. Lyell (pyritic-Cu). The Co and Nivalues lie within
trend II, indicating association of the ores with the Cambrian igneous
activity. The high Se, and high Co/Ni ratios, indicate a volcanic origin
for the ores, as these features are found in similar overseas ores assoc-
iated with volcanic rocks. The enrichment of Se in the stratigraphically
higher ores is consistent with their postulated open-cast environment of
deposition. The Co and Ni are even more strongly stratified, but in the
disseminated mineralization the large scale Co, Ni and Cu isopleths
intersect, which may imply an original replacement origin and/or meta-
morphic re-dispersion.
Within the deposit, Co correlates with Cu between ore shoots. In
the extreme case, the Tasman and Crown Lyell Pb-Zn ore is very different
in Co-Ni values from the rest of the Mt. Lyell lodes, but is similar to
Rosebery. On the other hand, the Se and 60 4 values for the Pb-Zn ore
are the sane as for the other lodes, but different to Rosebery.
18. Roseberv (Zn-Pb-Cu). The Co and Ni values, although much
less than those at Mt. Lyell, lie within trend II, indicating a Cambrian
131
igneous origin for the ores. The high Co/Ni ratio, and especially the
impoverishment in Ni, are typical of several overseas Pb-Zn deposits in
volcanic rocks. A sedimentary origin for the ore is supported by the
highly stratified distribution of the Co and Ni, and is strongly
suggested by the gradations of Co-Ni values between ore and adjacent and
overlying sedimentary-diagenetic mineralization. Nickel impoverishment
is explained by the exclusion of normal transporting agents of Ni from
the depositional site. Selenium and Cd are both impoverished with
respect to all other Tasmanian ores, which may also result from a sedi-
mentary environment of deposition.
19. Mt. Farrell (Ag-Pb-Zn). A Devonian origin for these ores
is indicated by the Co-Ni and Cd concentrations. The large range of
Se values, however, is unlike the range for the other Devonian deposits,
and the Se may have a Cambrian volcanic origin, as suggested for the S
in these ores by Solomon et al. (in press).
20. Magnet (Ag-Pb-Zn). The Cd and Se values in sphalerite
indicate that this ore is Devonian.
21. Mt. Remus (Mo). A Cambrian age is indicated by the Co-Ni
contents of pyrites in this mineral deposit.
22. Captain's Flat, N.S.W. (Pb-Zn-Cu). The Co-Ni values for
this deposit are remarkably similar to those in the Tasman and Crown .
Lyell deposit, and fall within the range for the Rosebery ores. This is
regarded as preliminary evidence for a common mineralizing process for
all these deposits.
132
Investigational Procedures
23. Scales of empirical correlations. Genetic studies using
trace elements usually require establishment of fundamental availability
trends. The closer the deposits whose trends are being compared, the
more reliable the correlations. For this reason, comparisons with
deposits outside the metallogenic province give less certain correlations
than intra-provincial comparisons. Nevertheless, many local studies may
eventually define general rules of dispersion (25, below).
24. Usefullness of techniques. Cobalt and nickel are sensitive
discriminators of common genesis between deposits, and of processes with,
in deposits. In Tasmania, Se and OS 34 values are more closely controlled
in their fundamental availability by other than genetic factors, and
within deposits they show little variation due to depositional processes.
Generalizations
25. Criteria for genesis. It is well established that sediment- -
ary-diagenetic pyrites are characterized by low Co/Ni ratios. In this
thesis, the evidence collated from the literature, together with new
data, strongly suggest that mineralization genetically associated with
geosynclinal vulcanism may also possess characteristic Co-Ni concentra-
tions, with
(a) high to very high Co/Ni ratios, and often marked impoverishment
in Ni;
133
(b) greater Co and Ni concentrations associated with Cu than with
Pb-Zn ores, both within and between deposits; and
(c) a tendency for Co to correlate with Cu within deposits.
134
REFERENCES
Agterberg, F.P., 1965: The technique of serial correlation applied to
continuous series of element concentration values in
homogenous rocks. J. Geol., 73, 142-154.
Andermann, G., and Kemp, J.W., 1958: Scattered X-rays as internal
standards in X-ray emission spectrography. Analyt. Chem.,
30, 1306-1309.
Anger, G., Nielsen, H., Puchelt, H., and Ricke, W., 1966: Sulfur iso-
topes in the Rammelsberg ore deposit (Germany). Econ.
Geol., 61, 511-536.
Auger, P.E., 1941: Zoning and district variations of the minor elements ■
in pyrite of Canadian gold deposits. Econ. Geol., 36,
401-423.
Babcan, J., 1966: Zur Geochemie des Selens des Slovakischen Teils der
Westkarpaten. Geol. Sb., Bratisl., 17, 1-6.
Badalova, S.T., Basitova, S.M., and Godunova, L.I., 1962: Distribution
of rhenium in the molybdenites of Middle Asia.
Geochemistry, 9, 934-939 •
Banks, M.R., 1965: Geology and mineral deposits. In Atlas of Tasmania.
Ed.: J.L. Davies. Lands and Surveys Department, Hobart.
Barton, P.B., and Skinner, B.J., 1967: Sulfide mineral stabilities.
In Geochemistry of Hydrothermal Ore Deposits.
Ed. H.L. Barnes. Holt, Rinehart and Winston, New York.
Belcher, C.B., and Kinson, K., 1964: The determination of nickel in iron
and steel by atomic absorption spectrophotometry.
Analytica chtm. Acta, 30, 64-67.
135
Berg, G., and Friedensburg, F., 1944: Nickel und Kobalt. Die .
metallischen Rohstoffe, ihre Lagerungsverhiltnisse und
ihre wirtschaftliche Bedeutung. Enke, Stuttgart,
Bergenfelt, S., 1953: Om fOrekomsten av selen i Skelleftefaltets
sulfidmaliner. Geol. Far. Stockh. F6rh., 75, 327-359.
Bethke, P.M., and Barton, P.B., 1961: Unit cell dimension verses compo-
sition in the systems : PbS-CdS, PbS-PbSe, ZnS-ZnSe, and
CuFeS1.90-0uFeSe1.90. Prof. EAR. U.S. geol. Surv., 424-B,
266-270.
Beyer, M., 1965: The determination of manganese, copper, chromium, nickel
and magnesium in cast iron and steel. Atomic Absorption
Newsletter 4, 212-223. Perkin Elmer Corporation.
Bilibin, Ye.A., 1955: Metallogenetic Provincesanci. Gosgeol-
tekhizdat, Moscow (Russian). Translated by the Canadian •
Geological Survey.
BOrlykke, H., and Jarp, S., 1950: The content of cobalt in some
Norwegian sulphide deposits. Norsk. geol.. Tidsskr., 28,
151-156.
Blissett, A.H., 1962: Geology of the Zeehan Sheet, 1 mile Geol. Map
Series K 55-5-50. Explan. Em. geol. Surv. Tasm. Boorman R.S., 1967: Subsolidus studies in the ZnS-FeS-Fe62 system.
Econ. Geol., 62, 614-632.
Both, R.A., 1966: The zoned ore deposits of the Zeehan mineral field.
M.Sc. thesis (unpublished). University of Tasmania.
136
Both, R.A., Rafter, T.A., and Solomon, M., 1967: Sulphur isotopes and
zoning of the Zeehan mineral field. In The Geology of
Western Tasmania. A Symposium (unpublished).
University of Tasmania.
, and Williams, K.L., 1968: . Mineralogical zoning in the lead-
zinc ores of the Zeehan field, Tasmania. Part I : Intro-
duction and review. J. geol. Soc. Aust., 15, 121-137.
Brathwaite, R.L., 1967: The structure of the Rosebery ore deposit.
In The Geolooy of Western Tasmania. A Symposium (unpub-
lished). University of Tasmania.
Brooks, C., 1966: The rubidium-strontium ages of some Tasmanian igneous
rocks. J. geol. Soc. Aust., 13, 457-469.
, and Compston, W., 1965: The age and initial 5r 87/Sr86 of the
Heemskirk Granite, western Tasmania. J. geophys. Res.,
70, 6249-6262.
Brooks, R.R., and Ahrens, L.H., 1961: Some observations on.the distri-
bution of thallium, cadmium and bismuth in silicate rocks
and the significance of covalency on their degree of assoc-
iation with other elements. Geochim. cosmochim. Acta, 23 1
100-115.
Burnham, C.W., 1959: Metallogenic provinces of the south-western United'
States and northern Mexico. New Mex. Inst. Min. Tech.
Bull. 65.
Burns, R.G., and Fyfe, W.S., 1967: Crystal-field theory and the geo-
chemistry of transition elements. In Researches in
Geochemistry, 2. Ed.: Ph.H. Abelson. Wiley, New York.
137
Byers, H.G., Miller, J.T., Williams, K.T., and Lakin, H.W., 1938:
Selenium occurrence in certain soils in the United States,
III. U.S. Dep. Agric. Tech. Bull., 60, 1-74.
Cambel, B., and Jarkovsky, J., 1965: Rare elements in pyrites from the
Western Carpathians and their possible use in the study
of mineralization genesis. Probl. Geochim., Akad. Nauk
SSSR, Inst. Geokhim. i Analit. Khim., (1965), 249-66.
(Russ.). [Chem. Abs., 64, 6311].
, 1967: Geochemie der Pyrite einiger Lager,
stitten der Tschechoslowakei. Slovenska Akademia Vied,
Bratislava.
Carr, M.H., and Turekian, K.K., 1961: The geochemistry of cobalt.
Geochim. cosmochim. Acta, 23, 9-60.
Carstens, C.W., 1941: Zur Geochemie einiger norwegischen Kiesvorkommen.
Kgl. Norske Videnskab. Selsk.,Forh. 14, 36-39.
, 1943: Ober den Co-Ni-Gehalt norwegischen Schwefelkiesvor-.. .
kommen. Kgl. Norske Videnskab. Selsk., Forh. 15, 165-168
Coleman, R.G., 1959: The natural occurrence of galena-clausthalite solid,
solution series. Am. Miner., 44, 166-175.
, and Delevaux, M., 1957: Occurrence of selenium in
sulfides from some sedimentary rocks of the Western United
States. Econ. Geol., 52, 499-527.
Cox, R., 1968: The use of comparative sampling methods at Cleveland
Mine, Tasmania. Proc. Australas. Inst. Min. Metall.,
no.226, 17-30.
Dana, J.D., 1944: prstem of Mineralogy, Volume I. 7th ed., by Palache,
C., Berman, H., and Frondel, C. Wiley, New York.
138
Darnley, A.G., 1966: Sulfur isotopes of some Central African sulfide
deposits. Econ. Geol., 61, 409-414.
Davidson, C.F., 1962: On the cobalt:nickel ratio in ore deposits.
Min. Mag., Lond., 106, 78-85.
Davidson, D.F., and Powers, H.A., 1959: Selenium content of some
volcanic rocks from western United States and Hawaiian
Islands. Bull. U.S. geol. Surv., 1084-C, 69-81.
Deans, T., 1950: The Kupferschiefer and the associated lead-zinc
mineralization in the Permian of Silesia, Germany and
England. Rept. 18th Int. Geol. Congr., 7, 340-352.
Deer, W.A., Howie, R.A., and Zussman, J., 1962: Rock-forming Minerals.
5 : Non-silicates. Longmans, London.
De Launay, L., and Urbain, G., 1910: Recherches sur la metallogenie des
blendes et des mineraux qui en derivant. Soc. geol.
France Bull., 10, 789-795.
Degens, E.T., 1965: Geochemistry of Sediments : A Brief Survey.
Prentice-Hall Inc., New Jersey.
Dodson, R.W., Forney, G.J., and Swift, E.H., 1936: The extraction of
ferric chloride from hydrochloric acid solutions by iso-
propyl ether. J. Am. chem. Soc., 58, 2573-2577.
Doe, B.R., 1962: Distribution and composition of sulphide minerals at
Balmat, New York. Bull. geol. Soc. Am., 73, 833-854.
Earley, J.W., 1949: Studies of natural and artificial selenides : I -
Klockmannite, CuSe. Am. Miner., 34, 435-440.
, 1950: Description and synthesis of the selenide minerals.
Am. Miner., 35, 337 -364.
139
Edwards, A.B., 1939: Some observations on the mineral composition of
Mt. Lyell copper ores. Proc. Australas. Inst. Min. Metall.,
no.114, 67-109.
, 1949: Pyrite deposit at Nairne, South Australia. Min. Rev.,
Adelaide, 90, 89-91.
, 1955: Cadmium in the Broken Hill lode. Proc. Australas.
Inst. Min. Metall., no.176, 71-96.
, and Carlos, G.C., 1954: The selenium content of some
Australian sulphide deposits. Proc. Australas. Inst. Min.
Metall., no.172, 31-63.
Ehrenberg, H., Pilger, A., and Schroder, F., 1954: Monographie das
Schwefelkies-Zinkblende-Schwerspatlager von Meggen
(Westfalen). Gesellsch. Dtsch. Metallhatten und Bergleute,
Clausthal, Zellerfeld.
El Shazly, E.M., Webb, J.S., and Williams, D., 1957: Trace elements in
sphalerite, galena and associated minerals from the British
Isles. Trans. Inst. Min. Metall., 66, 241-271.
Elliott,N., 1960: Interatomic distances in FeS2, CoS2 and N1S2. J. chem.
Phys., 33, 903-905.
Evans, B.W., and Leake, B.E., 1960: The composition and origin of the
striped amphibolites of Connemara, Ireland. J. Petrology,
1, 337- 363.
Faramazyan, A.S., and Zar'yan, R.N., 1964: Geochemistry of selenium and
tellurium in the ores of the Kadzharan deposit. Geochem.
Int., 1, 1103-1105.
14o
Firman, R.J., 1965: Interferences caused by iron and alkalies on the
determination of magnesium by atomic absorption spectro-
scopy. Spectrochim. Acta, 21, 341-343.
Fischer, M., and Hiller. J.E., 1956: Ober den thermoelektrischen Effekt
des Pyrits. Neues Jb. Miner. Abh., 89, 281-301.
Fleischer, M., 1955: Minor elements in some sulphide minerals. Econ.
Geol., 50th Anniv. Vol., 970-1024.
, 1959: The geochemistry of rhenium, with special reference
to its occurrence in molybdenite. Econ. Geol., 54, 1406-
1413.
Frank, C.W., Schrenk, W.G., and Meloan, C.E., 1966: A study of the
feasibility of the iron hollow cathode as a multi-element
atomic absorption unit. Analyt. Chem., 38, 1005-1008.
Frenzel, G., and Ottemann, J., 1967: Eine Sulfidparagenese mit kupfer-
haltigem Zonarpyrit von Nukundamu/Fiji. Mineralium
Deposita, 1, 307-316.
Friedman, I.I., 1949: A proposed method for the measurement of geologic
temperatures. J. Geol., 57, 618-619.
Fruth, I., and Maucher, A., 1966: Spurenelemente und Schwefel-Isotope
in Zinkblenden der Blei-Zink-Lagerstgtte von Gorno.
Mineralium Deposita, 1, 238-250.
Fryklund, V.C., and Fletcher, J.D., 1956: Geochemistry of sphalerite
from the Star Mine, Coeur d'Alene District, Idaho.
Econ. Geol., 51, 223-247.
, and Harner, R.S., 1955: Comments on minor elements in
pyrrhotite. Econ. Geol., 50, 339-344.
Gavelin, S., and Gabrielson, O., 1947: Spectrochemical investigations of,
sulphide minerals from the ores of the Skellefte District._
Arsb. Sver. geol. Unders., 41, 1-45.
Gee, R.D., 1967: The Proterozoic rocks of the Rocky Cape Geanticline.
In The Geology of Western Tasmania. A Symposium (unpub-
lished). University of Tasmania.
George, R.J., 1967: Metamorphism of the Nairne pyrite deposit. Ph.D.
thesis (unpublished). University of Adelaide.
Gilbert, P.T., 1962: Absorption flame photometry. Analyt. Chem., 34,
210R-224R.
Gilfillan, J.F., 1965: Tin ore deposits of Renison Bell. 8th Commonw.
Min. Metall. Congr., 1, 495-496.
Gjelsvik, T., 1968: Distribution of major elements in the wall rocks
and the silicate fraction of the Skorovass pyrite deposit,
Grong Area, Norway. Econ. Geol., 63, 217-231.
Glasson, K.R., and Paine, V.R., 1965: Lead-zinc-copper ore deposits of
Lake George Mines, Captain's Flat. 8th Commonw. Min.
Metall. Congr., 1, 423-431.
Goldschmidt, V.M., 1954: Geochemistry. Oxford Univ. Press, London.
, and Hefter, O., 1933: Zur Geochemie der Selen.
Nachr. Ges. Wiss. Gottingen, 2, 245-252.
, and Strock, L., 1935: Zur Geochemie der Selen. II.
Nachr. Ges. Wiss. Gottingen, N.F. Fachgr., 1, 123-142.
Gall, J., and Guillemin, C., 1964: Sites of trace elements in minerals
and rocks. Geochem. Int., 1 (5), 1025-1034.
Graton, L.C., and Harcourt, G.A., 1935: Spectrographic evidence on origin
of ores of Mississippi Valley type. Econ. Geol., 30, 800-824.
142
Green, J., 1959: Geochemical tables of the elements for 1959. Bull.
• geol. Soc. Am., 70, 1127-1184.
Gresens, R.L., 1966: The effect of structurally produced pressure
gradients on diffusion in rocks. J. Geol., 74, 307-321.
Grigoriev, D.P., 1961: Ontogeniya mineralov [Ontogeny of minerals]
Izdatel. L'vov. Univ., L'vov. 284 pp. (in Russian).
English translation, Israel Program for Scientific
Translations, Jerusalem, 1965. 250 pp.
Groves, D.I., 1965: The geology of the Heazlewood-Godkin area. Tech.
Rep. Dep. Mines Tasm., 10, 27-40.
, 1968: The cassiterite-sulphide deposits of western
Tasmania. Ph.D. thesis (unpublished). University of
Tasmania.
, and Loftus-Hills, G., (in press): Cadmium in Tasmanian
sphalerites. Proc. Australas. Inst. Min. Metall.
, and Solomon, M., 1964: The geology of the Mt. Bischoff
district. Pap. Proc. R. Soc. Tasm., 98, 1-22.
, (in press): Fluid inclusion studies on
quartz and fluorite from Mount Bischoff, Tasmania. Trans.
Inst. Min. Metall.
Gruszczyk, H., and Pouba, Z., 1968: Stratiform ore deposits of the
Bohemian Massif and of the Silesia•Cracow area.
23rd Int. Geol. Congr., Excursion Guide 23 AC.
Hall, G., Cottle, V.M., Rosenhain, P.B., and McGhie, R.R., 1953: The
lead-zinc deposits of Read-Rosebery and Mount Farrell.
5th Emp. Min. Metall. Congr., 1, 1145-1159.
143
Hall, G., Cottle, V.M., Rosenhain, P.B., McGhie, R.R.,and Druett, J.G.,
1965: Lead-zinc ore deposits of Read-Rosebery. 8th
Commonw. Min. Metall. Congr., 1, 485-489.
and Solomon, M., 1962: Metallic mineral deposits. J. geol.
Soc. Aust., 9, 285-309.
Hall, W.E., 1961: Unit-cell edges of cobalt and cobalt-iron bearing
sphalerites. Prof. Palo. U.S. geol. Surv., 424-B, 271-273.
Han, Tsu-Ming, 1968: Ore mineral relations in the Cuyuna sulfide deposit,
Minnesota. Nineralium Deposita, 3, 109-134.
Harris, J.F., 1965: Metallogenic studies in south eastern New South
Wales. Ph.D. thesis (unpublished). Australian National
University, Canberra.
Hawley, J.E. 1952: Spectrographic studies of pyrite in some Eastern
Canadian gold mines. Econ. Geol., 47, 260-304.
, and Nichol, I., 1959: Selenium in some Canadian sulphides.
Econ. Geol., 54, 608-628.
, 1961: Trace elements in pyrite, pyrrhotite
and chalcopyrite of different ores. Econ. Geol., 56,
467-487.
Hegemann, Fr., 1943: Die geochemische Bedeutung von Kobalt und Nickel
im Pyrit. Z. angew. Miner., 4, 122-239.
, and Leybold, Chr., 1954: Eine Methode zur quantitativen
spektrochemischen Analyse von Pyrit. Z. Erzbergb.
MetallhatWes., 7, 108-113.
Hills, E.S., 1965: Tectonic setting of Australian ore deposits. 8th
Commonw. Min. Metall. Congr., 1, 3-12.
144
Hirst, D.M., and Dunham, K.C., 1963: Chemistry and petrography of the
Marl Slate of S.E. Durham, England. Econ. Geol., 58,
., 912-94o.
Hughes, T.D., 1961: Savage River iron deposits - progress report.
Tech. Rep. Dep. Mines Tasm., 5, 163-179.
Ismailov, M.I., 1965: Distribution of selenium and tellurium in the
sulphides of the tungsten-molybdenum deposits of the
Zirabulak and Nuratinsk mountains. Geochem. Int., 5,
1014-1016.
Ivanov, V.V., 1964: Distribution of cadmium in ore deposits.
Geochemistry, 4, 757-768.
Jack, G., and Groves, D.I., 1964: Geology of the Mt. Meredith-Yellowband
Creek area. Tech. 1.22. Dep. Mines Tasm., 9, 27-37.
Kalman, Z.H., and Heller, L., 1962: Theoretical study of X-ray fluorescept
determinations of traces of heavy elements in a light
matrix. Analyt. Chem., 34, 946-951.
Kingsbury, C.J.R., 1965: Cassiterite and wolframite veins of Aberfoyle
and Story's Creek. 8th Commonw. Min. Metall. Congr., 1,
506-511.
Knitzschke, G., 1966: Zur Erzmineralisation, Petrographie, Hauptmetall-
und Spurenelementfarung des Kupferschiefers im SE-
Harzvorland. Freiberger ForschHft., 207, 1-147.
Koirtyohann, S.R., and Pickett, E.E., 1966a: Spectral interferences in
atomic absorption spectrometry. Analyt. Chem., 38,
585-587.
1 145
• Koirtyohann, S.R., and Pickett, E.E., 1966b: Light scattering by
particles in atomic absorption spectrometry. Analyt.
Chem., 38, 1087-1088.
Kolbe, P., and Taylor, S.R., 1966a: Major and trace element relationship
in granodiorites and granites from Australia and South
Africa. Contr. Miner. Petrol., 12,202-222.
, 1966b: Geochemical investigation of the
granitic rocks of the Snowy Mountains area, New South
Wales. J. geol. Soc. Aust., 13, 1-25.
Kraume, E., 1962: The zinc-lead-copper-ore deposits of Rammelsberg.
Unpublished excursion notes.
, Dahlgrun, F., Ramdohr, P., and Wilke, A., 1955: Die Erzlager
des Rammelsberges bei Goslar. Monogr. Dtsch. Blei-Zink-
Erzlagerstatten, Beih. geol. Jb., Heft 18.
Krauskopf, K.B., 1955: Sedimentary deposits of rare metals. Econ. Geol.,
50th Anniv. Vol., 411-463.
, 1956: Factors controlling the concentrations of
thirteen rare metals in sea-water. Geochim. cosmochim.
Acta, 9, 1-32.
Kullerud, G., 1953: The FeS - ZnS system : A geological thermometer.
Norsk geol. Tidsskr., 32, 61-147.
, 1959: Sulfide systems as geological thermometers. In
Researches in Geochemistry, 1. Ed.: Ph.H. Abelson.
Wiley, New York.
, and Yoder, H.S., 1965: Sulfide-silicate relations.
Carnegie Inst. Washington Year Book 64, 192-193.
146
La Ganza, ILL., 1959: Pyrite investigations at Nairne, South Australia.
Econ. Geol., 54, 895-902.
Le Riche, H.H., 1959: The distribution of certain trace elements in the
lower Lias of southern England. Geochim. cosmochim. Acta,
16, 101-122.
Liebenberg, C.J., 1961: The trace elements of the rocks of the Bushveld
Igneous Complex. Parts I and II. Pubis Univ. Pretoria
(n.s.), 12 and 13.
Loftus-Hills, G., 1964: The geology of the Dundas-Pieman River area.
B.Sc. (Hons.) thesis (unpublished). University of
Tasmania.
, and Solomon, M., 1967: Cobalt, nickel and selenium in
sulphides as indicators of ore genesis. Mineralium
Deposita, 2, 228-242.
, and Hall, R.J., 1967: The structure
of the bedded rocks west of Rosebery, Tasmania. J. geol.
Soc. Aust., 14, 333-338.
Lundegardh, per H., 1948: Some aspects to the determination and distri-
bution of zinc. K. LantbrHogsk. Annlr, 15.
Markham, N.L., 1968: Some genetic aspects of the Mt. Lyell mineralization.
Mineralium Deposita, 3, 199-221.
McCartney, W.D., 1965: Metallogy of post-Precambrian geosynclines.
Geol. Surv. Pap. Can., 65-6, 33-42.
McDougall, I., and Leggo, P.J., 1965: Isotopic age determinations on
granitic rocks from Tasmania. J. geol. Soc. Aust., 12,
295-333.
147
McIntyre, W.L., 1963: Trace element partition coefficients - a review of
theory and applications to geology. Geochtm. cosmochim.
Acta, 27, 1209-1264.
McLeod, I.R., 1965: 'Ferro-alloy metal ore deposits of Australia. 8th
Commonw. Min. Metall. Congr., 1, 46-48.
Menzies, A.C., 1960: A study of atomic absorption spectroscopy.
Analyt. Chem., 32, 898-904.
Miller,.A:R., Densmore, C.D., Degens, E.T., Hathaway, J.C., Manheim, F.T.,
McFarlin, P.F., Pocklington, R., and Jokela, A., 1966:
Hot brines and recent iron deposits in deeps of the Red Sea.
Geochim. cosmochim. Acta, 30, 341-359.
Mohr, P.A., 1959: The distribution of some minor elements between sulphi4e
and silicate phases of sediments. Univ. Coll. Addis Ababa,
Fac. Sc., Contrib. Geophys. Obs., Ser. A., 2.
Mookherjee, A., 1962: Certain aspects of the geochemistry of cadmium.
Geochim. cosmochim. Acta, 26, 351-360.
Murayyeva, L.P., Barabanov, V.F., and Kier, M.M., 1964: Investigation of
trace elements in pyrite from the tungsten deposits of
Eastern Transbaikaliya. Geochem. Int., 6, 1096-1102.
Nachtrieb, N.H., and Fryxell, R.E., 1948: The extraction of ferric
chloride by iscipropyl ether, II. J. Am. chem. Soc., 70,
3552-3557.
Neumann, H., 1950: Pseudomorphs of pyrrhotite after pyrite in the
Ballachulish slates. Mineralog. Mag., 29, 234-238.
Nicholls, G.D., and Loring, D.H., 1962: The geochemistry of some British
Carboniferous sediments. Geochim. cosmochim. Acta, 26,
181-223.
11+8
Noddack, I., and Noddack, W., 1931: Die Geochemie des Rheniums. Z. phys.
Chem., 154A, 207-244.
Norrish, K., and Chappell, B.W., 1967: X-ray fluorescence spectrography.
In Physical Methods in Determinative Mineralogy. Ed.:
J. Zussman. Academic Press, London.
Nye, P.B., 1928: Report on the molybdenite prospect at Mt. Remus.
Rep. Dep. Mines Tasm., (unpublished).
Paganelli, L., 1963: On the rhenium content of molybdenite of Mount
Mulat (Predazzo) and other Italian molybdenites. Geochim.
cosmochim. Acta, 27, 401- 404.
Park, Jr, C.F., 1955: The zonal theory of ore deposits. Econ. Geol.,
50th Anniv. Vol., 226-248.
, and MacDiarmid, R.A., 1964: Ore Deposits. Freeman,
San Francisco.
Petterd, W.F., 1910: Catalogue of the Minerals of Tasmania. Mines
Department, Hobart, Tasmania.
Pettijohn, F.J., 1956: Sedimentary Rocks. 2nd ed. Harper, New York.
Prokhorov, V.G., 1965: Minor elements in pyrites and the use of the
pyrites in prospecting for ore deposits. Geologiya Geofiz,
Novosibirsk, 9, 67-74. (Russ.). [Chem. Abs., 64, 1820].
Rafter, T.A., and Solomon, M., 1967: Sulphur isotope and oxygen isotope
studies of Tasmanian ore deposits. In The Geology of
Western Tasmania. A Symposium. (unpublished). University
of Tasmania.
Ramberg, H., 1961: A study of veins in Caledonian rocks around Trondheim
Fjord, Norway. Norsk. geol. Tidsskr., 41, 1-43.
1149
Rankama, K., and Sahama, Th.G., 1950: Geochemistry. University of
Chicago Press, Chicago.
Rann, C.S., and Hambly, A.N., 1965: Distribution of atoms in an atomic
absorption flame. Analyt. Chem., 37, 879-884.
Reitan, P.H., 1960: The genetic significance of two kinds of basified
zones near small pegmatite veins. Rept. 21st Int.:Geol.
Congr., 17, 102-107.
Ringwood, A.E., 1956: Melting relationships of Ni-Mg olivines and sOme
geochemical implications. Geochim. cosmochim. Acta, 10,
297-303.
Robinson, B.W., and Strens, R.G.J., 1968: Genesis of concordant deposits
of base metal sulphides : an experimental approach.
Nature, 217 (5128), 535- 536.
Roedder, E., 1960: Studies of primary fluid inclusions in sphalerite
crystals from the OH vein, Creede, Colorado (abs.).
Econ. Geol., 55, 1337.
Roscoe, S.M., 1965: Geochemical and isotopic studies, Noranda and
Matagami areas. Can. Min. metall. Bull., 58 (641), 965-97+.
Rose, A.W., 1967: Trace elements in sulfide minerals from the Central
district, New Mexico and the Bingham district, Utah.
Geochim. cosmochim. Acta, 31, 547-585.
Rosenfeld, I., and Beath, 0.A., 1964: Selenium : Geobotany, Biochemistry,
Toxicity and Nutrition. Academic Press, New York.
Rost, F; , 1939: Spektralanalytische Untersuchungen an Sulfidischen
Erzlagerstatten des ostbayerischen Grenzgebirges. Ein
Beitrag zur Geochemie von Nickel und Kobalt. Z. angew.
Miner., 2, 1-27.
150
Routhier, P., 1963: Les Gisements Metalliferes. Masson, Paris.
Rubenach, M., 1967: The Serpentine Hill complex. In The Geology of
Western Tasmania. A Symposium. (unpublished). University
of Tasmania.
Saager, R., and Mihalik, P., 1967: Two varieties of pyrite from the Basal
Reef of the Witwatersrand System. Econ. Geol., 62, 719-
731.
Sandell, E.B., 1959: Chemical Analysis, Vol. 3 : Colourimetric Determina-
tion of Traces of Metals. 3rd ed. Interscience, New York ?
, and Goldich, S.S., 1943: The rarer metallic constituents
of some American igneous rocks. Part I, J. Geol., 51, 99-
115. Part II, J. Geol., 51, 167-189.
Schneiderhohn, H., 1962: Erzlagerstatten. Gustav Fischer Verlag,
Stuttgart.
Schroll, E., 1950: Spurenelementparagenese (Mikroparagenese) ostalpiner
Zinkblenden. Oesterr. Akad. Wiss. Math.-naturwiss. Kl.,
Anz., 87, 21-25.
, 1951: Spurenelementparagenese (Mikroparagenese) alpiner
Bleiglanz. Oesterr. Akad. Wiss. Math.-naturviss. Kl., Anz.,
88, 6-12.
Schwarcz, H.P., 1967: The effect of crystal field stabilization on the
distribution of transition metals between metamorphic
minerals. Geochim. cosmochim. Acta, 31, 503-517.
Scott, S.D., and Barnes, H.L., 1967: Sphalerite geothermometry at 330 ° to
580°C. Econ. Geol., 62, 874-875.
Sindeeva, N.D., 1964: Mineralogy and types of deposits of selenium and
tellurium. John Wiley and Sons, New York.
151
Singewald, Jr, J.T., 1917: The role of mineralizers in ore segregations
in basic igneous rocks. Johns Hopkins Univ. Contr. Geol.,
(March, 1917), 24-35.
Sisler, H.H., Vanderwerf, C.A., and Davidson, A.W., 1949: General
Chemistry. Macmillan, New York.
Slavin, W., 1964: Atomic absorption instrumentation and technique -
a review. Atomic Absorption Newsletter 24, 15-31. Perkin
Elmer Corporation.
Smith, F.G., 1948: The ore deposition temperature and pressure at the
McIntyre Mine, Ontario. Econ. Geol., 43, 627-636.
Snedecor, G.W., 1946: Statistical Methods. 4th ed. Iowa State College
Press.
Solomon, M., 1964: The spilite-keratophyre association of west Tasmania
and the ore deposits at Mt. Lyell, Rosebery,and Hercules.
Ph.D. thesis (unpublished). University of Tasmania.
, 1965a: Geology and mineralization of Tasmania. 8th Commonw,
Min. Metall. Congr., 1, 464-477.
, 1965b: Lead-silver-zinc ore deposits at Mt. Farrell. 8th
Commonw. Min. Metall. Congr., 1, 490.
, 1967: Fossil gossans (?) at Mt. Lyell, Tasmania. Econ.
Geol., 62, 757-772.
, and Elms, R.G., 1965: Copper ore deposits of Mt. Lyell.
8th Commonw. Min. Metall. Congr., 1, 478-484.
, Rafter, T.A., and Jensen, M.L., (in press): Isotope studies
on the Rosebery, Mount Farrell and Mount Lyell ores,
Tasmania. Econ. Geol.
152
Spencer, D., 1966: Factors affecting element distribution in a Silurian
graptolite band. Chem. Geol., 1, 221-249.
Spry, A.H., 1962a: Precambrian rocks of Tasmania. J. geol. Soc. Aust.,
9, 107-126.
, 1962b: Igneous activity. J. geol. Soc. Aust., 9, 255-284.
, 1964: The Zeehan-Corinna area. Pap. Proc. R. Soc. Tasm.,
91, 95-108.
, and Banks, M.R., (Eds.), 1962: The Geology of Tasmania.
J. geol. Soc. Aust., 9, 107-362.
Stanton, R.L., and Rafter, T.A., 1966: The isotopic constitution of
sulphur in some stratiform lead-zinc sulphide ores.
Mineralium Deposita, 1, 16-29.
Steiner, A., and Rafter, T.A., 1966: Sulfur isotopes in pyrite, pyrrho-
tite, alunite and anhydrite from steam wells in the Taupo
volcanic zone, New Zealand. Econ. Geol., 61, 1115-1129.
Stillwell, F.L., 1932: The occurrence of cobalt and vanadium in the
Mt. Remus pyritic ore. Rep. Dep. Mines Tasm., (unpub-
lished).
, 1935: An occurrence of gersdorffite in north-east
Dundas, Tasmania. Proc. Australas. Inst. Min. Metall.,
no.100, 465-476.
Stoiber, R.E., 1940: Minor elements in sphalerite. Econ. Geol., 35,
501- 519.
Sullivan, J.V., Timms, A.B., and Young, P.A., 1968: Atomic absorption
analysis for nickel using a resonance detector. Proc.
Australas. Inst. Min. Metall., no.226, 31-36.
153
Suzuki, T., 1963: On the thermoelectric potential of pyrite. Tohoku
Univ. Sci. Rep., 8, 317-419.
Suzuoki, T., 1964: A geochemical study. of selenium in volcanic exhala-
tion and sulphur deposits. Chem. Soc. Japan, B, 37,
1200-1206.
Tauson, L.V., 1965: Factors in the distribution of the trace elements
during the crystallization of magmas. In Physics and
Chemistry of the Earth, 6. Pergamon Press, Oxford.
Taylor, S.R., 1965: The application of trace element data to problems
in petrology. In Physics and Chemistry of the Earth, 6.
Pergamon Press, Oxford.
Tetlow, P., 1960: Savage River iron. Tech. Rep. Dep. Mines Tasm., 4,
106-113.
Thomson, B.P., 1965: Geology and mineralization of South Australia.
8th Commonw. Min. Metall. Congr., 1, 270-284.
Tourtelot, H.A., 1964: Minor-element composition and organic carbon
content of marine and nonmarine shales of Late Cretaceous
age in the western interior of the United States.
Geochim. cosmochim. Acta, 28, 1579-1604.
Troshin, Yu.P., 1962: Gallium-Indium ratios in sphalerites of
Transbaikaliya. Geochemistry, no. )4 378-386.
Turekian, K.K., and Wedepohl, K.H., 1961: Distribution of the elements
in some major units of the earth's crust. Bull. geol.
Soc. Am., 72, 175-192.
Turneaure, F.S., 1955: Metallogenic provinces and epochs. Econ. Geol.,
50th Anniv. Vol., 38-98.
15 4
Urquhart, G., 1966: The magnetite deposits of the Savage River-Rocky
River region. Geol. Surv. Bull. Tasm., 48.
Vincent, E.A., and Bilefield, L.I., 1960: Cadmium in rocks and minerals
from the Skaergaard intrusion, East Greenland. Geochim.
cosmochim. Acta, 19, 63-69.
Vine, J.D., 1966: Element distribution in some shelf and eugeosynclinal
black shales. Bull. U.S. eol,. Surv., 1214-E.
Vogt, J.H.L., 1923: Nickel in igneous rocks. Econ. Geol., 18, 307-353.
Wade, M.L., and Solomon, M., 1958: Geology of the Mount Lyell mines,
Tasmania. Econ. Geol., 53, 367-416.
Wager, L.R., and Mitchell, R.L., 1951: The distribution of trace elements
during strong fractionation of basic magma - a further
, study of the Skaergaard intrusion, East Greenland.
Geochim. cosmochim. Acta, 1, 129-208.
, Vincent, E.A., and Smales, A.A., 1957: Sulphides in the
Skaergaard intrusion, East Greenland. Econ. Geol., 52,
855-903.
Walsh, A., 1965: Some recent advances in atomic absorption spectroscopy.
XII Colloquium Spectroscopicum Internationale. Hilger
and Watts, Exeter.
Wampler, J.M., and Kulp, J.L., 1964: An isotopic study of lead in sedi-
mentary pyrite. Geochim. cosmochim. Acta, 28, 1419-1458.
Warren, H.V., and Thompson, R.M., 1945: Sphalerites from western Canada.
Econ. Geol., 40, 309-335.
Wazny, H., 1965: Geochemische Untersuchungen der Unterzechsteinsedimente
in der Vorsudetischen Zone. Freiberger ForschHft., 193,
169-181.
155
Webber, G.R., 1965: Second report of analytical data for CAAS syenite
and sulphide standards. Geochim. cosmochim. Acta, 29,
229-248.
Wedepohl, K.H., 1964: Untersuchungen.am Kupferschiefer in Nordwest-
deutschland. Geochim. cosmochim. Acta, 28, 305-364.
, 1965: Untersuchungen an Proben von Kupferschiefer aus
Nordwestdeutschland und Diskussion seiner Bildungsbeding-
ungen. Freiberger ForschHft., 193, 107-121.
Williams, K.L., 1958: Nickel mineralization in western Tasmania. In
F.L. Stillwell Anniversary Volume, Australas. Inst. Min.
Metall., Melbourne.
, 1968: Hydrothermal zoning : A study of the lead-zinc
ores of Zeehan, Tasmania. Ph.D. thesis (unpublished).
Australian National University, Canberra.
Williams, K.T., and Byers, H.G., 1934: Occurrence of selenium in pyrites.
Ind. Engng. Chem. analyt. Edn, 6, 296-297.
Willis, J.B., 1963: Analysis of biological materials by atomic
absorption spectroscopy. In Methods of Biochemical
Analysis, 2. Ed.: D. Glick. Interscience, New York.
Wilson, H.D.B., 1953: Geology and geochemistry of base metal deposits.
Econ. Geol., 48, 370-407.
, and Anderson, D.T., 1959: The composition of Canadian
sulphide ore deposits. Can. Min. metall. Bull., 52,
619-631.
Wright, C.M., 1965: Syngenetic pyrite associated with a Precambrian
iron ore deposit. Econ. Geol., 60, 998-1019.
156
Yamaoka, K., 1962: Studies on the bedded cupriferous iron sulfide
deposits occurring in the Sambagawa metamorphic zone.
Tohoku Univ. Sci. Rep., 8, 317-319.
Zaryan, R.N., 1962: Selenium and tellurium in ores of the Kafan
deposit. Geochemistry, no.3, 267-274.
APPENDIX 1
CADMIUM AND IRON IN TASMANIAN SPHALERITES : SAMPLE PREPARATION ANU ANALYSIS
The Cd and Fe analyses listed in Appendix 2 were performed by three
different analysts: Gioves; AMDEL for Solomon (1964), and AMDEL for
Both (1966).
Cd Analyses
Groves' analyses
After mineragraphic examination, the sphalerite was hand-picked,
crushed, sieved (minus 22 plus 44 mesh), and electromagnetically
separated. For the fine-grained Rosebery and Hercules ore, the sieve
fraction used was minus 85 plus 100 mesh. Microscopic estimates of the
impurities ranged from 2% to 570. The concentrate was finally ground in
a gyratory swing-mill with Cr-steel grinding surfaces.
Analyses were carried out on 2 g. pressed pills using a Philips
vacuum X-ray spectrograph (PW 1540) with a Mo tube, a L1F200 crystal,
and a scintillation counter. Standards were prepared by mixing CdS
with a low-Fe sphalerite (100041) from the Swansea Mine, Zeehan, in a
gyratory swing-mill for 30 seconds.
Doe et al. (1961) have shown that less than 1% Mn does not markedly
affect sample absorption. The effect of Varying Fe content on the
absorption of the sphalerites was tested for each Cd standard with a
series of mineral mixtures with Fe contents of 0, 2, 6, 8, and 10%.
The sphalerites were prepared by mechanically mixing crushed pyrite
(11247) from Mt. Bischoff with the stock sphalerite (100041). The
maximum difference between measured Cd contents for different Fe contents
was o.o04%. The results are therefore given to ± 0.01% and the effects
of Fe content on the absorption of individual samples have not otherwise
been calculated.
Contamination of the sphalerites by other sulphides should depress
the Cd results by a maximum of 5% (i.e. 0.005 to 0.03% Cd in the
sphalerites analyzed by Groves) from the actual content of the sphalerite
alone, as the associated minerals usually have low Cd contents; Ivanov
(1964) recorded average values in galena, chalcopyrite and pyrite
generally less than 0.01% Cd.
The lower limit of detection (95% confidence) for Cd is 0.0012%.
The precision of the results expressed as the relative deviation (see
Chapter 4 - Selenium) was 5%.
Solomon's analyses
The analyses quoted by Solomon (1964) were determined using an
X-ray spectrographic technique, and several results were checked with
polarographic and colorimetric analyses. No accuracy was quoted for the
analyses, although the duplicate analyses by different techniques
indicate a maximum difference of 30% of the amount present.
Both's analyses
The analyses given by Both (1966) were obtained using an electron
microprobe technique, with one accurate spot analysis and several
approximate analyses as checks for each result. The analyses are
quoted as accurate to ± 30% of the amount present, although K.L. Willipms,
A.N.U. (personal communication) considers that the results are probably
considerably more accurate than this, with the exception of some Cd
values close to the detection limit.
Fe Analyses
The Fe contents of sphalerites from the cassiterite-sulphide
deposits and the Pb-Zn-Ag- veins of the Waratah District were computed
from cell-sizes of the sphalerites using the equation of Skinner, Barton
and Kullerud (1959). Iron contents for the other deposits, excluding
Zeehan, Rosebery and Mt. Lyell, were determined by X-ray spectrography
using those samples prepared for Cd analysis which were not contaminated
with pyrite and/or Fe-rich carbonate. The maximum uncertainty in the
analytical determination is ± 1.2 wt.% Fe.
The analyses of sphalerite from Zeehan were given by Both (1966),
from Mt. Lyell by Solomon (1964), and from Rosebery by Stillwell (1934).
APPENUIX 2
TAbLE A2.1
ANALYSES OF CADMIUM AND IRON IN TASMANIAN SPHALERITLS
Type of deposit Locality Number Wt .% Cd Fe
Analyst
DEVONIAN
CASSITERITE -SULPHIDE DEPOSITS
MT. BISCHOFF
North Valley lode
It
tt
S-end of open cut
Fook's lode
11
11
Thompson's lode
CLEVELAND
Henry's lode
11
11
11
11
RENISON BELL
No. 2 ore-body
Battery workings
100,007
100,008
100.009
100,010
100.012
100,013
100,014
100,015
100,016
100,017
100,018
100,019
100,020
100,021
100,022
100,023
100,024
0.31
0.32
0.29
0.32
0.31
0•34
0.33
0.34
0.34
0.33
0.31
0.25
0.25
0.27
0.29
0.21
0.21
6.9
6.3
5.7 7.1
8.9
10.3
10.6
10.6
11.0
12.0
9.3
12.5
10.3
9.9
12.1
11.3
A
A
A
A
A
A
A
A
A
A
A
A
A
A
A
A
A
Type of deposit Locality Number Wt.% Cd
Wt.% Fe
- Analyst
LEAD-ZINC FISSURE VEINS
Battery workings
ft
WARATAH
Antimonial lode
Silver Cliffs
11
ft
Magnet
II
If
TULLAH
New North Mt. Farrell
It
ti
f t
MUrchison Mine
N.E. DUNDAS
McKimmie Mine
ft
ZEEHAN
Swansea Mine ff
11
Oceana Mine
100,025
100,026
100,028
10,575
100,029a
100,0296
100,030
100,031
100,032
100,033
100,034
100,035
100,036
10,523a
10,5231)
10,528
11,199
100,037
100,038a
100,038b
100,039
100,040
100,041
10,490 P268
P254
0.21
0.20
0.31
0.31
0.34
0.33
0.21
0.27
0.54
0.42
0.32
0.29
0.30
0.33
0.36
0.36
0.37
0.24
0.31
0.34
0.26
0.24
0.29
0.34 0.27
0.6
13.7
7.9
7.1
6.8
6.0
6.1
9.8
6.3
4.4
8.1
6.4
5.5
6.0
8.0
8.3
6.1
2.6
2.5
2.5
4.5
2.2
1.9
1.6
1.7
A
A
A
A
A
A
A
A
A
A
A
A
A
A
A
A
A
A
A
A
A
A
A
A
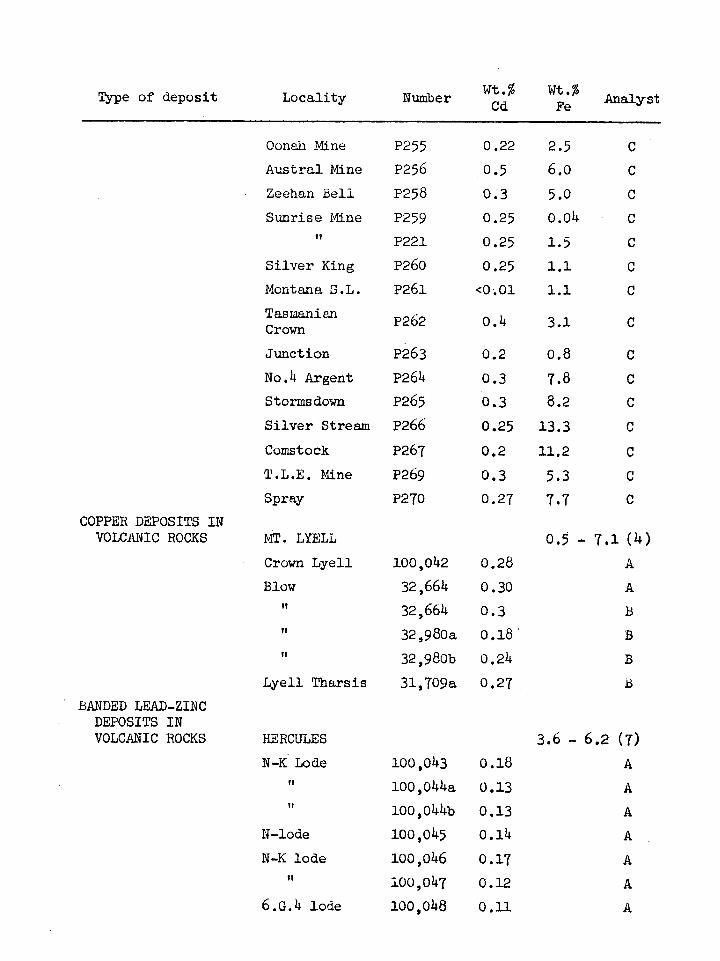
Type of deposit Locality Number Wt.% Cd
Wt.% Fe Analyst
Ounah Mine P255 0.22 2.5 C
Austral Mine P256 0.5 6.0 c Zeehan Bell P258 0.3 5.0 C
Sunrise Mine it
P259
P221
0.25
0.25
0.04
1.5
C
C
Silver King P260 0.25 1.1 C
Montana S.L. P261 <0.01 1.1 C
Tasmanian Crown P262 O. 3.1 C
Junction P263 0.2 0.8 c No. 4 Argent P264 0.3 7.8 c Stormsdown P265 0.3 8.2 C
Silver Stream P266 0.25 13.3 C
Comstock P267 0.2 11.2 C
T.L.E. Mine P269 0.3 5.3 c Spray P270 0.27 7.7 c
COPPER DEPOSITS IN VOLCANIC ROCKS MT. LYELL 0.5 - 7.1 (4)
Crown Lyell 100,042 0.28 A
Blow 32,664 0.30 A
32,664 0.3
32,980a 0.18
32,980b 0.24
Lyell Tharsis 31,709a 0.27
BANDED LEAD-ZINC DEPOSITS IN VOLCANIC ROCKS HERCULES 3.6 - 6.2 (7)
N-K Lode 100,043 0.18 A
100,044a 0.13 A
100,0441a 0.13 A
N-lode 100,045 0.14 A
N-K lode 100,046 0.17 A
100,047 0.12 A
6.G.4 lode 100,048 ma A
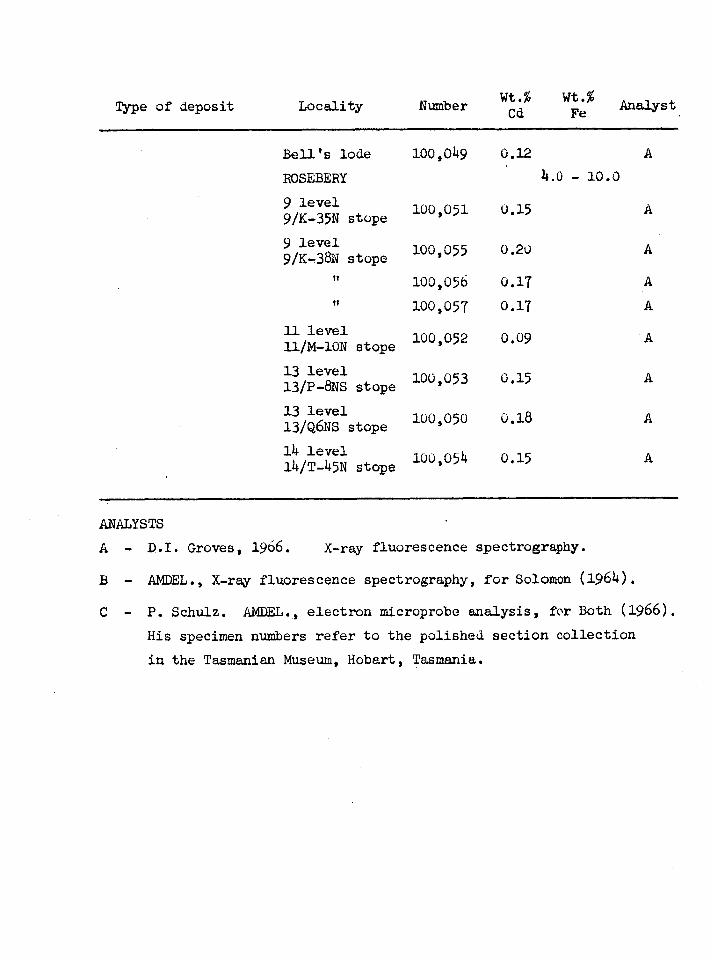
Type of deposit Locality Number Wt.% Cd
Wt.% Fe Analyst
Bell's lode
ROSEBERY
9 level 9/K-35N stope
9 level 9/K-38N stope
11 level 11/M-10N stope
13 level 13/P-8NS stope
13 level 13/Q6NS stope
14 level 14/T-45N stope
100,049
100,051
100,055
100,056
100,057
1 00,052
1 00,053
100,050
1 00,054
0.12
0.15
0.20
0.17
0.17
0.09
0.15
0.18
0.15
A
A
A
4.0 - 10.0
A
A
A
A
A
ANALYSTS
A - D.I. Groves, 1966. X-ray fluorescence spectrography.
B - ANDEL., X-ray fluorescence spectrography, for Solomon (1964).
C - P. Schulz. ANDEL., electron microprobe analysis, for Both (1966).
His specimen numbers refer to the polished section collection
in the Tasmanian Museum, Hobart, Tasmania.
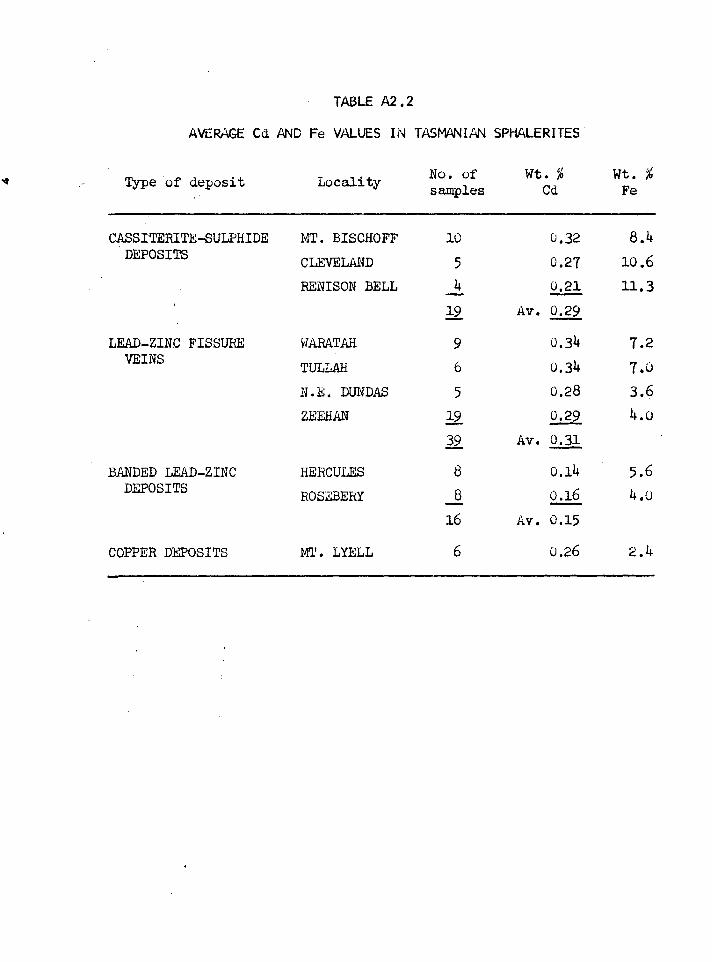
TABLE A2.2
AVERAGE Cd AND Fe VALUES IN TASMANIAN SPHALERITES
Type of deposit Locality No. of samples
Wt. % Cd
Wt. % Fe
CABSITERITE-SULPHIDE MT. BISCHOFF 10 0.32 8.4 DEPOSITS CLEVELAND 5 0.27 10.6
RENISON BELL 4 0.21 11.3
19 Av. 0.29
LEAD-ZINC FISSURE WARATAH 9 0.34 7.2 VEINS
TULLAH 6 0.34 7.0
N.B. DUNDAS 5 0.28 3.6
ZEEHAN 19 0.29 4.o
39 Av. 0.31
BANDED LEAD-ZINC HERCULES 8 0.14 5.6 DEPOSITS ROSEBERY 8 0.16 4.0
16 Av. 0.15
COPPER DEPOSITS MT. LYELL 6 0.26 2.4
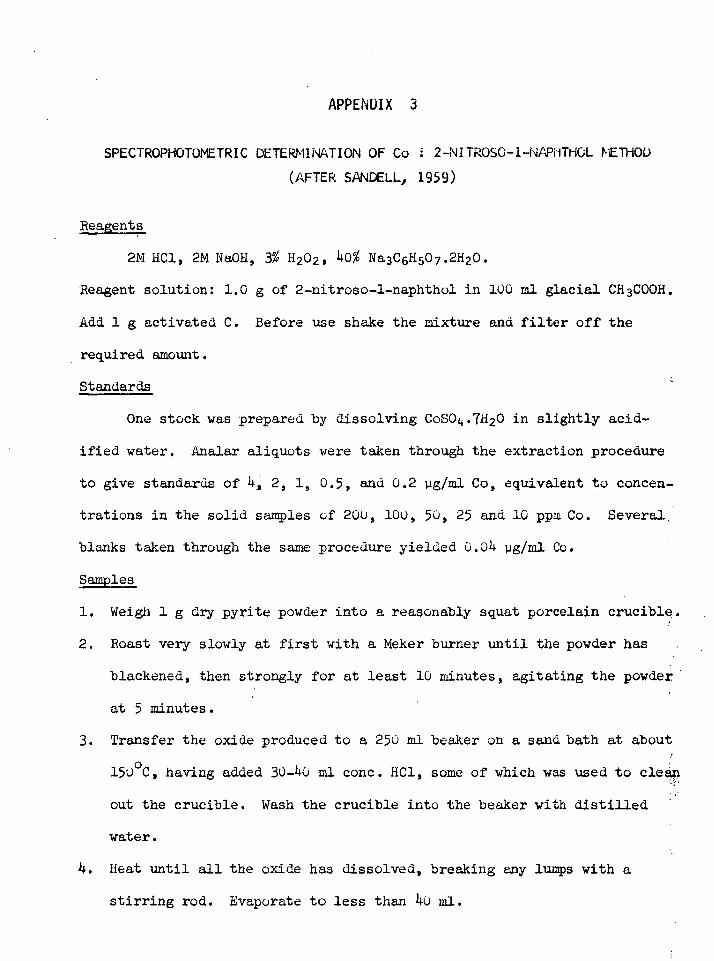
APPENDIX 3
SPECTROPHOTOMETRIC DETERMINATION OF Co : 2-NITROS0-1-NAP1ITHOL METHOD
(AFTER SANDELL, 1959)
Reagents
2M HC1, 2M NaOH, 3% H202, 40% Na3CO507.2H20.
Reagent solution: 1.0 g of 2-nitroso-1-naphthol in 100 ml glacial CH3COOH.
Add 1 g activated C. Before use shake the mixture and filter off the
required amount.
Standards
One stock was prepared by dissolving CoSO4.7H20 in slightly acid-
ified water. Analar aliquots were taken through the extraction procedure
to give standards of 4, 2, 1, 0.5, and 0.2 pg/m1 Co, equivalent to concen-
trations in the solid samples of 200, 100, 50, 25 and 10 ppm Co. Severa1.
blanks taken through the same procedure yielded 0.04 ug/m1 Co.
Samples
1. Weigh 1 g dry pyrite powder into a reasonably squat porcelain crucible.
2. Roast very slowly at first with a Meker burner until the powder has
blackened, then strongly for at least 10 minutes, agitating the powder
at 5 minutes.
3. Transfer the oxide produced to a 250 ml beaker on a sand bath at about
150oC, having added 30-40 ml conc. HC1, some of which was used to clean
out the crucible. Wash the crucible into the beaker with distilled
water.
4. Heat until all the oxide has dissolved, breaking any lumps with a
stirring rod. Evaporate to less than 4u mi.
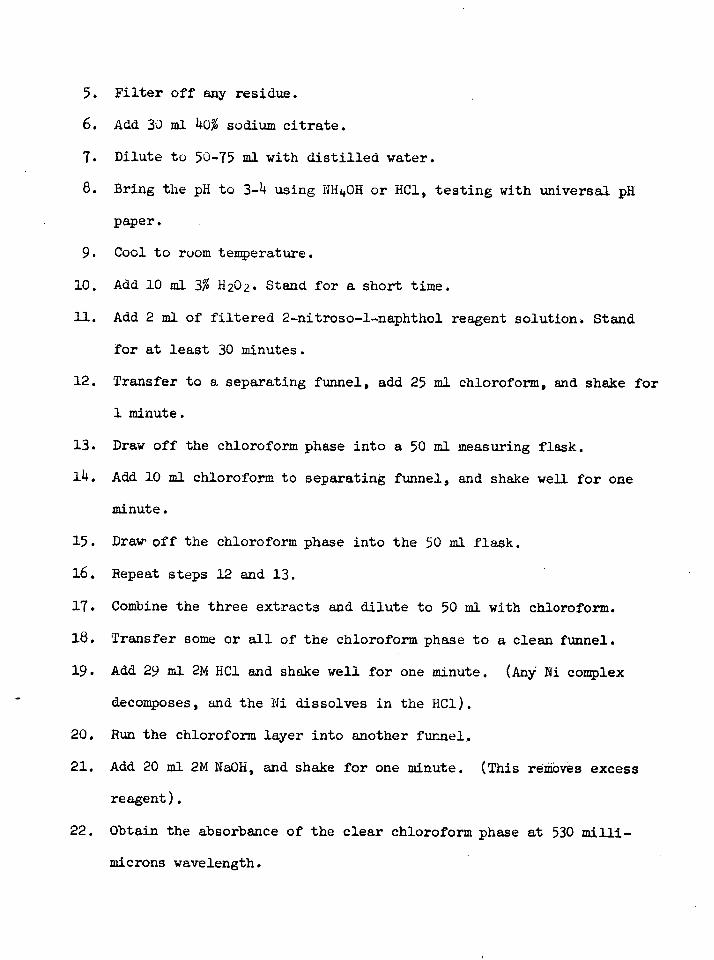
5. Filter off any residue.
6. Add 30 ml 40% sodium citrate.
7. Dilute to 50-75 ml with distilled water.
8. Bring the pH to 3-4 using NH4OH or HC1, testing with universal pH
paper.
9. Cool to room temperature.
10. Add 10 ml 3% H202. Stand for a short time.
11. Add 2 ml of filtered 2-nitroso-1-naphthol reagent solution Stand
for at least 30 minutes.
12. Transfer to a separating funnel, add 25 ml chloroform, and shake for
1 minute.
13. Draw off the chloroform phase into a 50 ml measuring flask.
14. Add 10 ml chloroform to separating funnel, and shake well for one
minute.
15. Draw off the chloroform phase into the 50 ml flask.
16. Repeat steps 12 and 13.
17. Combine the three extracts and dilute to 50 ml with chloroform.
18. Transfer some or all of the chloroform phase to a clean funnel.
19. Add 29 ml 2M HC1 and shake well for one minute. (Any : Ni complex
decomposes, and the Ni dissolves in the HC1).
20. Run the chloroform layer into another funnel.
21. Add 20 ml 2M NaOH, and shake for one minute. (This reMOves excess
reagent).
22. Obtain the absorbance of the clear chloroform phase at 530 milli-
microns wavelength.
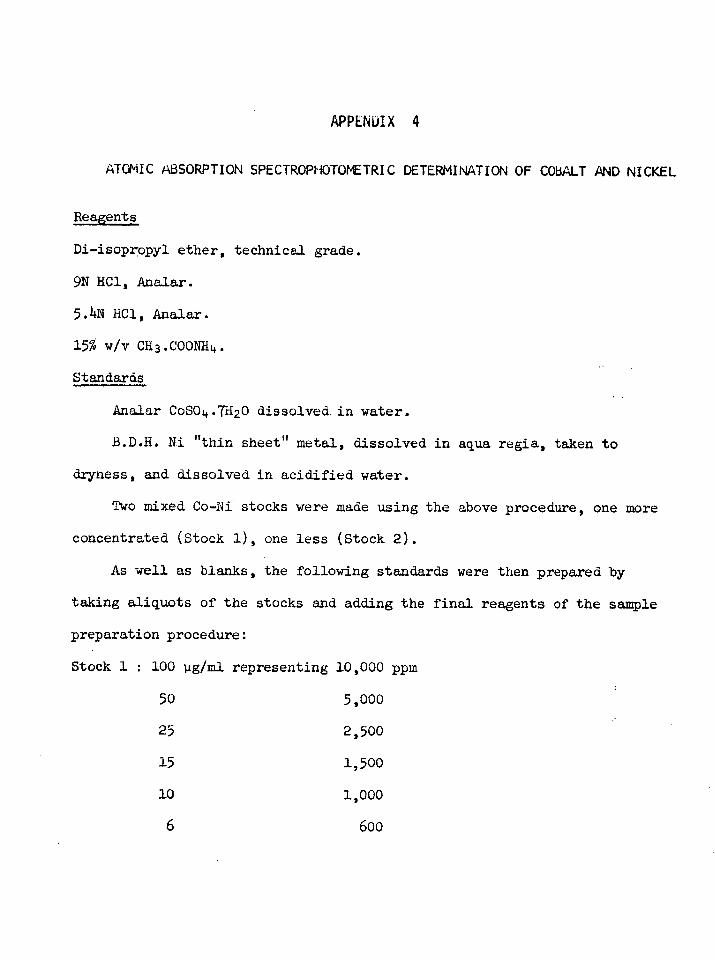
APPENUIX 4
ATOMIC ABSORPTION SPECTROPHOTOMETRIC DETERMINATION OF COBALT AND NICKEL
Reagents
Di-isopropyl ether, technical grade.
9N 11C1, Analar.
5.4N HC1, Analar.
15X, w/v CH3.COONH4.
Standards
Analar CoSO4.7H20 dissolved, in water.
B.D.H. Ni "thin sheet" metal, dissolved in aqua regia, taken to
dryness, and dissolved in acidified water.
Two mixed Co-Ni stocks were made using the above procedure, one more
concentrated (Stock 1), one less (Stock 2).
As well as blanks, the following standards were then prepared by
taking aliquots of the stocks and adding the final reagents of the sample
preparation procedure:
Stock 1 : 100 jig/m1 representing 10,000 ppm
50 5,000
25 2,500
15 1,500
10 1,000
6 600
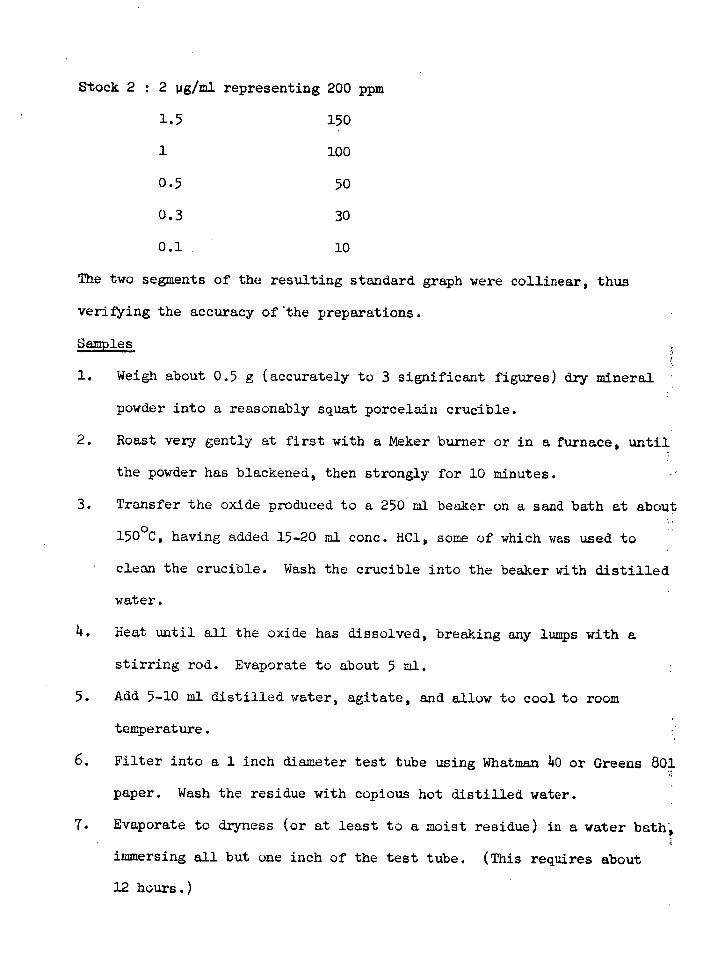
Stock 2 : 2 ug/m1 representing 200 ppm
1.5 150
1 100
0.5 50
0.3 30
0.1.. 10
The two segments of the resulting standard graph were collinear, thus
verifying the accuracy of...the preparations.
Samples
1. Weigh about 0.5 g (accurately to 3 significant figures) dry mineral •
powder into a reasonably squat porcelain crucible.
2. Roast very gently at first with a Meker burner or in a furnace, until
the powder has blackened, then strongly for 10 minutes.
3. Transfer the oxide produced to a 250 ml beaker on a sand bath at about
1500C, having added 15-20 ml conc. HC1, some of which was used to
clean the crucible. Wash the crucible into the beaker with distilled
water.
4. Heat until all the oxide has dissolved, breaking any lumps with a
stirring rod. Evaporate to about 5 ml.
5. Add 5-10 ml distilled water, agitate, and allow to cool to room
temperature.
6. Filter into a 1 inch diameter test tube using Whatman 40 or Greens 801
paper. Wash the residue with copious hot distilled water.
T. Evaporate to dryness (or at least to a moist residue) in a water bath .„
immersing all but one inch of the test tube. (This requires about
12 hours.)
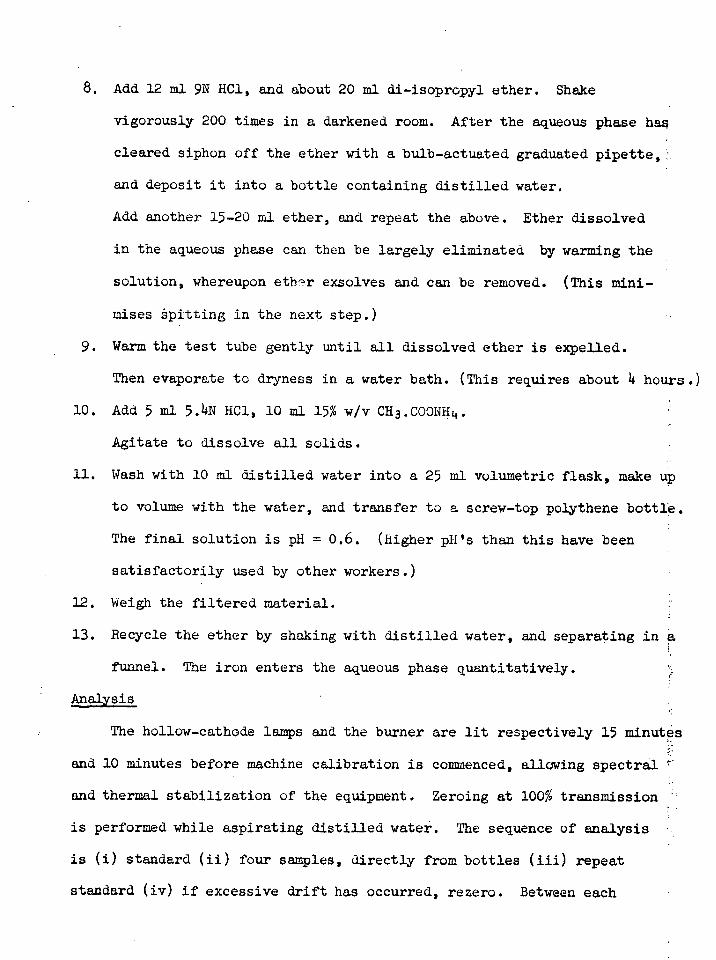
8. Add 12 ml 9N HC1, and about 20 ml di-isopropyl ether. Shake
vigorously 200 times in a darkened room. After the aqueous phase has
cleared siphon off the ether with a bulb-actuated graduated pipette,L
and deposit it into a bottle containing distilled water.
Add another 15-20 ml ether, and repeat the above. Ether dissolved
in the aqueous phase can then be largely eliminated by warming the
solution, whereupon ettlf?r exsolves and can be removed. (This mini-
mises 4itting in the next step.)
9. Warm the test tube gently until all dissolved ether is expelled.
Then evaporate to dryness in a water bath. (This requires about 4 hours.)
10. Add 5 ml 5.4N HC1, 10 ml 15% w/v CH3.000NH4.
Agitate to dissolve all solids.
11. Wash with 10 ml distilled water into a 25 ml volumetric flask, make Up
to volume with the water, and transfer to a screw-top polythene bottle.
The final solution is pH = 0.6. (higher pH's than this have been
satisfactorily used by other workers.)
12. Weigh the filtered material.
13. Recycle the ether by shaking with distilled water, and separating in a
funnel. The iron enters the aqueous phase quantitatively.
Analysis
The hollow-cathode lamps and the burner are lit respectively 15 minutes
and 10 minutes before machine calibration is commenced, allowing spectral
and thermal stabilization of the equipment. Zeroing at 100% transmission
is performed while aspirating distilled water. The sequence of analysis
is (0 standard (ii) four samples, directly from bottles (iii) repeat
standard (iv) if excessive drift has occurred, rezero. Between each
aspiration the system is purged with distilled water. The standards used
are approximately equivalent to the concentrations in the samples, unusual
concentrations being immediately covered by aspiration of an appropriate
standard. For very high Co and Ni concentrations, the burner is rotated
to reduce sensitivity, and thus bring the reading onto the linear part of
the standard graph; the resulting determination is less sensitive than
readings at lower concentrations, but is reproducible.
The following parameters are then compiled as data for computer
processing:
z : sample number
a : original sample weight
b : weight of burnt filtered residue and crucible
c : weight of crucible
i : volume of final sample solution
d : sample percentage transmission
e : blank percentage transmission interpolated graphically to the
time of sample aspiration
f : standard percent transmission
g : blank percentage transmission interpolated graphically to the
time of standard aspiration
h : value of standard in ug/ml.
APPEMX 5
INDEPENDENT SELENIUM ANALYSES
Department of Mines, Tasmania
The following summary of the technique of selenium analysis used by
the Assay Laboratories of the Department of Mines, Tasmania, has been
prepared by Mr. H. Wellington, Chief Chemist and Metallurgist.
The method relies on the formation of aselenium complex with 3,3'
diamino benzidene. The selenium is isolated in perchloric acid and the
complex developed under controlled pH conditions. The colour is extracted
with organic solvents and absorbance measured at 400 mi.
Reagents
Mixed Acid: 20% HC104 in HNO3.
Hydrochloric Acid: 50%.
Arsenic Solution: Dissolve 0.25 g As203 with 2 g NaOH in 200 m1
water.
Reducing Agent: 25% w/v aqueous NaH2P02.
E.D.T.A.: 5% w/v aqueous.
Ammonia Solution: 66% from 0.880 S.G.
Buffer solution: Dissolve 60 g ammonium formate in about 600 ml
water, add 200 m1 formic acid. Adjust pH to about 1.6 with 50%
HC1. Dilute.to-1 litre.
3,3' Diamino Benzidene: 0.5% w/v aqueous. Prepare immediately
before use. The solution decomposes rapidly at room temperature
(may be kept one day if refrigerated). N.B. Avoid contact with skin.
Standard Selenium Solution: Dissolve 50 mg of selenium in 10 ml
HNO3, boil to expel NO2 and cool. Dilute to 500 ml giving 100 ppm.
From this, prepare a solution of 5 ppm i.e. 5 ug Seim'.
Indicator Paper: Filter paper soaked in 0.1 per cent Thymol Blue
and dried.
A. Separation
1. Weigh 1.0 g of sample (containing up to 200 pg Se) into a 100 ml beaker
and add 5 ml water and 5 ml mixed acid. When reaction has 'ceased add a
further 15 ml of acid and evaporate to 1 ml. (Caution: Note 1).
2. Cool, add 50 ml 50% HC1, 2 ml arsenic solution and 15 ml reducing
solution. Boil for three minutes or until arsenic has precipitated
(black).
3. Filter hot through a porosity 4 sintered glass crucible, washing with
50% HC1. Discard the filtrate.
4. Place a 50 ml beaker under the crucible and without connecting vacuum,
rinse sides of crucible with 10 ml mixed acid and original beaker with
5 ml. Add this to the crucible and connect vacuum. Wash three times ,
with distilled water. A pipette was found ideal for the acid washes.
5. Apply vacuum and when filtered wash with distilled water. This should
be into a 50 ml beaker.
6. Evaporate to 1 ml. Cool. Note 1.
B. Colour Development
7. Add 1 ml E.D.T.A. and neutralize with ammonia solution using a pointed
glass rod to make a spall spot on the indicator paper. An orange
colour indicates the correct pH.
8. Transfer to test tube (8" x 1") with distilled water and dilute to
10 ml.
9. Add 2 ml buffer solution and 0.5 ml 3,3' diamino-benzidene solution.
Stand for ½ - 1 hour.
10. Add 2 ml ammonia solution and 5 ml toluene and shake vigorously.
Settle.
11. Pipette off 4 ml into a small test tube containing afew pieces of
magnesium perchlorate. Stand for 15 minutes or until turbidity clears,
adding more perchlorate if necessary.
12. Read the absorbance of the solution at 400 mu.
13. Run standards, starting from stage 1. Standards recommended are
0, 10, 25, 50 and 75 ug Se.
Notes
1. Beware of evaporating to dryness or even near dryness as serious loss
. of selenium occurs.
2. Isolation of the selenium by co-precipitation with arsenic has been
used. Of the elements that accompany arsenic there is no interference
from tellurium, antimony, bismuth, lead, silver or tin. Copper is
masked by E.D.T.A.
3. Solution of the co-precipitated selenium direct from the sintered
glass crucible allows the initial filtration of insoluble to be .
neglected. (In the case of a large insoluble an initial filtration
may be necessary). Wash with 50% HC1.
4. Optimum pH for complex development is 1.5-2.7, development taking
30 minutes, no change being observed in the next hour. Optimum pH
for extraction is 4.3-10.3. The use of the buffer facilitates the
change.
5. The colour may be extracted in toluene and absorbance measured at
400 mu. An absorbance at 420 mu has been reported as due to
impurities in the 3,3' diamino benzidene. Benzene was tried
(Stanton and McDonald, 1965) but found to be exceptionally prone to
turbidity.
6. Turbidity may occur after settling from the extraction. The method
used involved removal of the water with magnesium perchlorate, the
oxidising agent not attacking the complex. As a matter of procedure
this was done with all samples whether apparently turbid or not.
7. The calibration graph is linear to 100 pg selenium at an absorbance
of 1.8. Solutions up to 500 pg may be diluted, but it is better to
start with a smaller weight. Normally . standards to 75 pg selenium
are sufficient.
aproducibilitx
The replicate determinations are given in the following Table A5.1.
Comparison of independent analyses
Table A5.1 lists the detailed results of the independent analyses by
the author, the Tasmanian Mines Department, and the Australian Mineral
Development Laboratories.
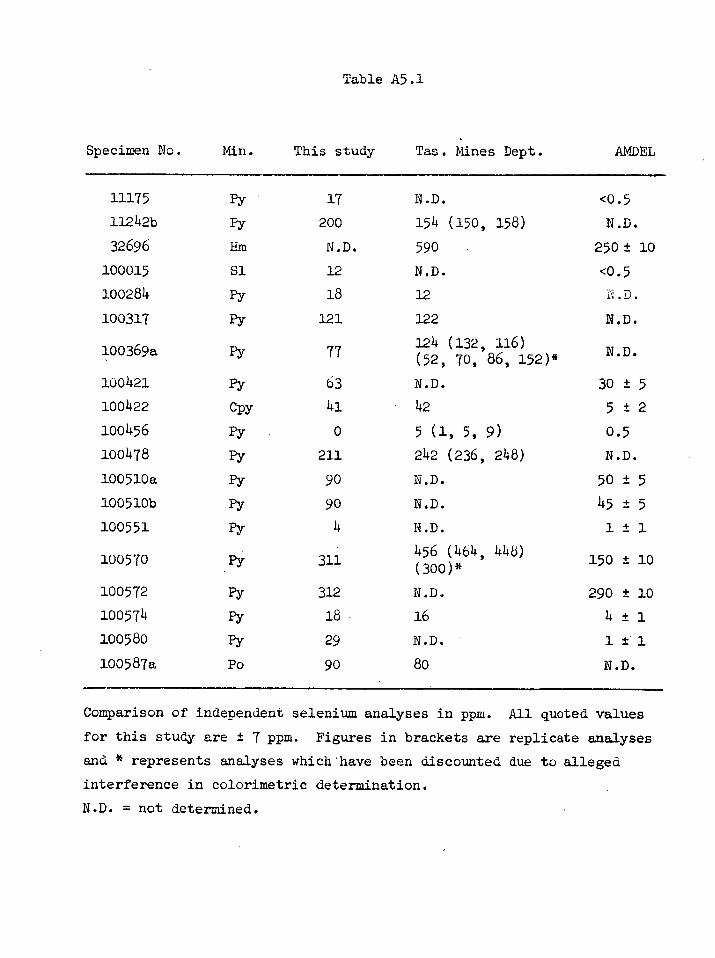
Table A5.1
Specimen No. Min. This study Tas. Mines Dept. ANDEL
11175 Py 17 N.D. <0.5
11242b Py 200 154 (150, 158) N.D.
32696 Hm N.D. 590 250 ± 10
100015 S1 12 N.D. <0.5
100284 Py 18 12
100317 Py 121 122 N.D.
100369a Py 77 124 (132, 116) (52, 70, 86, 152)*
N.D.
100421 Py 63 N.D. 30 ± 5
100422 Cpy 41 42 5 1 2
100456 Py o 5 (1, 5, 9) 0.5
100478 Py 211 242 (236, 248) N.D.
100510a Py 90 N.D. 50 ± 5
100510b Py 90 N.D. 45 ± 5 100551 PY 4 N.D. 1 ± 1
100570 Py 311 456 (464, 448) (300)*
150 ± 10
100572 Py 312 N.D. 290 ± 10
100574 Py 18 16 4 ± 1
100580 Py 29 N.D. 1 ± 1
100587a Po 90 80 N.D.
Comparison of independent selenium analyses in ppm. All quoted values
for this study are ± 7 ppm. Figures in brackets are replicate analyses
and * represents analyses which 'have been discounted due to alleged
interference in colorimetric determination.
N.D. = not determined.
REFERENCES : APPENDICES
Both, R.A., 1966: The zoned ore deposits of the Zeehan mineral field.
M.Sc. thesis (unpublished). University of Tasmania.
Doe, B.R., Chodos, A.A., Rose, A.W., and Godijn, E., 1961: The deter-
mination of iron in sphalerite by X-ray fluorescence
spectrometry. Am. Miner., 46, 1056-1063.
Ivanov, V.V., 1964: Distribution of cadmium in ore minerals.
Geochemistry, 4, 757-768.
Sandell, E.B., 1959: Chemical Analysis, Vol. 3 : Colourimetric
Determination of Traces of Metals. 3rd ed. Interscience,
New York.
Skinner, B.J., Barton, P.B. Jr., and Kullerud, G., 1959: Effect of FeS
on the unit cell edge of sphalerite. A revision.
Econ. Geol., 54, 1040-1046.
Solomon, M., 1964: The spilite-keratophyre association of west Tasmania
and the ore deposits at Mt. Lyell, Rosebery and Hercules.
Ph.D. thesis (unpublished). University of Tasmania.
Stanton, R.E., and McDonald, A.J., 1965: The determination of selenium
in soils and sediments with 3,3'-Diamino-benzidine.
Analyst, 90, 497-499.
Stillwell, F.L., 1934: Observations on the zinc-lead lode at Rosebery,
Tasmania. Proc. Australas. Inst. Min. Metall., no.94,
43-69.
Mineralium Deposita 2, 228-242 (1967)
Cobalt, Nickel and Selenium in Sulphides as Indicators of Ore Genesis
G. LoFTUs�HILLS and M. SOLOMON
University of Tasmania, Hobart, Australia
This article has been removed forcopyright or proprietary reasons.
REPRINTED FROM:
Journal of the Geological Society of Australia Vol. 14, Pt 2, pp. 333-338.
THE STRUCTURE OF THE BEDDED ROCKS WEST OF ROSEBERY, TASMANLk
By G. LOFTUS-HILLS, M. SOLOMON & R. J. HALL
SYDNEY 1967
This article has been removed for copyright or proprietary reasons.
Related Documents