Coating of metal implant materials with strontium Matthias J. Frank • Martin S. Walter • Hanna Tiainen • Marina Rubert • Marta Monjo • S. Petter Lyngstadaas • Ha ˚vard J. Haugen Received: 17 February 2013 / Accepted: 16 July 2013 / Published online: 26 July 2013 Ó Springer Science+Business Media New York 2013 Abstract The aim of this study was to show that cathodic polarization can be used for coating commercial implant surfaces with an immobilized but functional and bioavail- able surface layer of strontium (Sr). Moreover, this study assessed the effect of fluorine on Sr-attachment. X-ray photoelectron spectroscopy revealed that addition of fluo- rine (F) to the buffer during coating increased surface Sr-amounts but also changed the chemical surface com- position by adding SrF 2 alongside of SrO whereas pre- treatment of the surface by pickling in hydrofluoric acid appeared to hinder Sr-attachment. Assessment of the bio- availability hinted at a positive effect of Sr on cell differ- entiation given that the surface reactivity of the original surface remained unchanged. Additional SrF 2 on the sur- face appeared to reduce undesired surface contamination while maintaining the surface micro-topography and micro-morphology. Anyhow, this surface modification revealed to create nano-nodules on the surface. 1 Introduction Titanium based endosseous dental implants have shown steady improvements of their clinical performance over the recent years [1]. Most dental implants available on the market today feature a moderately rough, sand-blasted and acid-etched (SBAE) surface [2]. Despite the improved performance of such moderately rough endosseous dental implants, long-term bone resorption is still an issue with current commercially available implant systems [2, 3]. Moreover, patients who suffer from bone loss or generally poor bone quality are often not eligible for an endosseous dental implant [4–6]. Thus, the focus of current research in the field of endosseous dental implants is directed towards creating a bioactive surface that may help patients who cannot be treated with dental implants today. The desired implant should actively support peri-implant bone healing in order to allow the formation of strong, mature bone at the bone-implant interface that facilitates the necessary mechanical interlocking but also provides long term sta- bility in the alveolar bone. Coating of the surface with bioactive components that support bone healing appears a promising way of creating such a surface. Successful biochemical surface modifications with e.g. peptides, extracellular matrix proteins, hydroxyapatite, calcium phosphate, and fluorine (F) have shown promising results in supporting bone healing [7–11]. Yet, none of these modifications has shown sufficient evidence for long term success. A variety of studies has shown the positive effect of strontium (Sr) on bone healing [12–16]. A recently published review article by Marie et al. [12] summarized how strontium affects bone resorption and bone formation by activating pre-osteoblast replication as well as osteo- blast differentiation and survival. At the same time Sr was reported to reduce pre-osteoclast differentiation in addition M. J. Frank Á M. S. Walter Á H. Tiainen Á M. Monjo Á S. P. Lyngstadaas Á H. J. Haugen (&) Department of Biomaterials, Institute for Clinical Dentistry, University of Oslo, PO Box 1109, Blindern, 0317 Oslo, Norway e-mail: [email protected] URL: http://www.biomaterials.no M. J. Frank Á M. S. Walter Institute of Medical and Polymer Engineering, Chair of Medical Engineering, Technische Universita ¨t Mu ¨nchen, Boltzmannstrasse 15, 85748 Garching, Germany M. Rubert Á M. Monjo Department of Fundamental Biology and Health Sciences, Research Institute on Health Sciences (IUNICS), University of Balearic Islands, 07122 Palma de Mallorca, Spain 123 J Mater Sci: Mater Med (2013) 24:2537–2548 DOI 10.1007/s10856-013-5007-1

Welcome message from author
This document is posted to help you gain knowledge. Please leave a comment to let me know what you think about it! Share it to your friends and learn new things together.
Transcript
Coating of metal implant materials with strontium
Matthias J. Frank • Martin S. Walter •
Hanna Tiainen • Marina Rubert • Marta Monjo •
S. Petter Lyngstadaas • Havard J. Haugen
Received: 17 February 2013 / Accepted: 16 July 2013 / Published online: 26 July 2013
� Springer Science+Business Media New York 2013
Abstract The aim of this study was to show that cathodic
polarization can be used for coating commercial implant
surfaces with an immobilized but functional and bioavail-
able surface layer of strontium (Sr). Moreover, this study
assessed the effect of fluorine on Sr-attachment. X-ray
photoelectron spectroscopy revealed that addition of fluo-
rine (F) to the buffer during coating increased surface
Sr-amounts but also changed the chemical surface com-
position by adding SrF2 alongside of SrO whereas pre-
treatment of the surface by pickling in hydrofluoric acid
appeared to hinder Sr-attachment. Assessment of the bio-
availability hinted at a positive effect of Sr on cell differ-
entiation given that the surface reactivity of the original
surface remained unchanged. Additional SrF2 on the sur-
face appeared to reduce undesired surface contamination
while maintaining the surface micro-topography and
micro-morphology. Anyhow, this surface modification
revealed to create nano-nodules on the surface.
1 Introduction
Titanium based endosseous dental implants have shown
steady improvements of their clinical performance over the
recent years [1]. Most dental implants available on the
market today feature a moderately rough, sand-blasted and
acid-etched (SBAE) surface [2]. Despite the improved
performance of such moderately rough endosseous dental
implants, long-term bone resorption is still an issue with
current commercially available implant systems [2, 3].
Moreover, patients who suffer from bone loss or generally
poor bone quality are often not eligible for an endosseous
dental implant [4–6]. Thus, the focus of current research in
the field of endosseous dental implants is directed towards
creating a bioactive surface that may help patients who
cannot be treated with dental implants today. The desired
implant should actively support peri-implant bone healing
in order to allow the formation of strong, mature bone at
the bone-implant interface that facilitates the necessary
mechanical interlocking but also provides long term sta-
bility in the alveolar bone. Coating of the surface with
bioactive components that support bone healing appears a
promising way of creating such a surface. Successful
biochemical surface modifications with e.g. peptides,
extracellular matrix proteins, hydroxyapatite, calcium
phosphate, and fluorine (F) have shown promising results
in supporting bone healing [7–11]. Yet, none of these
modifications has shown sufficient evidence for long term
success. A variety of studies has shown the positive effect
of strontium (Sr) on bone healing [12–16]. A recently
published review article by Marie et al. [12] summarized
how strontium affects bone resorption and bone formation
by activating pre-osteoblast replication as well as osteo-
blast differentiation and survival. At the same time Sr was
reported to reduce pre-osteoclast differentiation in addition
M. J. Frank � M. S. Walter � H. Tiainen � M. Monjo �S. P. Lyngstadaas � H. J. Haugen (&)
Department of Biomaterials, Institute for Clinical Dentistry,
University of Oslo, PO Box 1109, Blindern, 0317 Oslo, Norway
e-mail: [email protected]
URL: http://www.biomaterials.no
M. J. Frank � M. S. Walter
Institute of Medical and Polymer Engineering, Chair of Medical
Engineering, Technische Universitat Munchen,
Boltzmannstrasse 15, 85748 Garching, Germany
M. Rubert � M. Monjo
Department of Fundamental Biology and Health Sciences,
Research Institute on Health Sciences (IUNICS), University of
Balearic Islands, 07122 Palma de Mallorca, Spain
123
J Mater Sci: Mater Med (2013) 24:2537–2548
DOI 10.1007/s10856-013-5007-1
to osteoclast function and survival, thus preventing bone
resorption [12]. The described properties made Sr an
interesting candidate for a surface coating that could
combine the mechanical properties of a titanium-based
implant with a moderately rough surface with the positive
effects of Sr on bone healing. Lyngstadaas and Ellingsen
suggested to use a polarization process to attach charged
biomolecules to the surface in order to stimulate bone
healing [17]. As Sr may be ionized easily, it appeared to be
a well-suited candidate for use in such a coating process.
The aim of this study was to show that cathodic polar-
ization can be used for coating commercially available
implant surfaces of grade IV titanium and titanium-zirco-
nium alloy with a moderately rough, hydrogen rich sand-
blasted and acid-etched surface with an immobilized but
functional and bioavailable surface layer of Sr.
During a series of experiments preceding this study
(unpublished data) we observed a possible beneficial influ-
ence of fluorine on the amount of Sr that may be coated to a
surface. It appeared as if fluorine supported the attachment of
Sr to the surface by cathodic polarization. Hence, a further
aim of this study was to explore the effect of additional
fluorine on the coating-process. This was done either by
adding additional sodium-fluoride to the process or by pre-
treatment of the samples by pickling in hydrofluoric acid.
This study used XPS to examine the surface coverage and to
evaluate the chemical composition and the binding states of
the surface components. Bio-availability was assessed by
evaluation of the gene expression levels of collagen-1 (Coll-
1), alkaline phosphatase (ALP), and osteocalcin (OC) of
osteoblastic MC3T3-E1 cells to Sr-coated surfaces.
2 Materials and methods
2.1 Samples
This study used coin-shaped samples made of grade IV
titanium (Ti) and a titanium-zirconium alloy (TiZr) con-
taining 13 to 17 % zirconium [18]. Surfaces were sand-
blasted with large-grit (0.25–0.5 mm) aluminum oxide
particles and acid etched in a mixture of hydrochloric and
sulfuric acid at 125–130 �C for 5 min (SBAE). The samples
were handled under nitrogen cover gas and stored in
0.9 % NaCl solution to obtain a surface comparable with the
commercially available SLActive� surface (Institut Strau-
mann AG, Basel, Switzerland). This surface modification
has been previously described in other studies [19, 20].
Coin-shaped samples with a diameter of 4.5 mm and a
height of 2 mm were used for evaluating the feasibility of
the coating, the effect of fluorine on the surface coating, and
the effect of the modification on the surface. The setup used
for cathodic polarization of these coins consisted of a power
supply (Protek Dual DC power, Korea) connected to the
sample cathode and a platinum anode, a datalogger (NI
DAQPad, National Instruments, Asker, Norway) and a
magnetic stirrer with heating (IKA-RET Control Visc C,
VWR, Kaldbakken, Norway). The platinum electrode had a
cylindrical shape and the samples were always placed in the
center of the Pt-electrode to ensure an equal horizontal and
vertical distance between the two electrodes for all samples.
The pH was monitored by a pH electrode (Schott N62,
SCHOTT Instruments GmbH, Mainz, Germany), which was
driven by a power supply (Xantrex XDL 56-4P, Burnaby,
Canada). The temperature was measured by a Pt100 device
(Pt100, IKA Labortechnik, Staufen, Germany). The coating
of TiZr SBAE with Sr was done for 60 min while the output
current density was set to 0.54 mA/cm2. Ti SBAE was
coated with Sr for 60 at a current density of 1.3 mA/cm2
[21]. The electro-coating was done in a buffer made of
0.25 M strontium-acetate and acetic acid at pH 5 at a tem-
perature of 21 �C. Ultra-pure, 99.995 % trace metal free
strontium-acetate (Sigma Aldrich, Prod. #437883-5G) was
used for reducing the effect of trace elements on the process.
Two groups used a modified version of this Sr-buffer. One
group contained an additional 0.1 M of sodium-chloride
(Sr ? NaCl) in the buffer and a second group contained an
additional 0.1 M of sodium-fluoride (Sr ? NaF) in the
buffer. This was done to monitor the effect of Na-ions on the
process independently of the fluorine. The last group used
modified SBAE samples that were pickled in 0.2 %
hydrofluoric acid (Sr ? HFp) for 2 min prior to electro-
coating in the regular Sr-buffer. After the coating process
the coins were rinsed in deionized water for 10 s and then
air-dried in a laminar flow cabin. Thereafter the samples
were stored in Eppendorf tubes prior to further usage. Five
groups with different surface modifications were included in
the first part of this study. Besides the unmodified SBAE
surface of both materials, this study included a group that
was only polarized using a buffer made of sodium-acetate
and acetic acid. This kind of polarization has been used in
our previous study and has been shown to alter the surface
hydrogen levels and the surface micro- and nano-mor-
phology [21]. Thus, a polarized only surface was added to
assess the effect the different Sr-coatings on the biological
response independent of the surface modifications induced
by the polarization itself. An overview of the different
groups and the coating conditions is provided in Table 1.
2.2 Chemical characterization
The X-ray photoelectron spectroscopy (XPS) analysis was
carried out on an Axis UltraDLD XP spectrometer (Kratos
Analytical Limited, Manchester, United Kingdom). The
instrument resolution was 1.1 eV for the survey scans and
0.55 eV for the detail scans for the employed settings,
2538 J Mater Sci: Mater Med (2013) 24:2537–2548
123
determined by measuring of the full width at half maximum
(FWHM) of the Ag 3d5/2 peak obtained on sputter cleaned
silver foil. The emission of the photoelectrons from the
sample was 90� (normal to sample surface), and the inci-
dence angle of the X-rays was 33.3� (or 56.7� between
X-ray incidence direction and captured photoelectron
emission direction). For the survey spectra, a hybrid lens
mode was used with slot aperture at 80 eV pass energy. The
survey scan was executed at between 0 eV and 1,100 eV
binding energy. For the detail spectra, a hybrid lens mode
with slot aperture was used at a pass energy of 20 eV. A
detail spectrum was recorded for Sr 3d. The energy shift
due to surface charging was below 1 eV based on the C 1s
peak position relative to the established BEs, therefore the
experiment was performed without charge compensation.
All samples were referenced to C 1s at 284.5 eV.
An ion selective electrode (Orion Fluoride ISE with
Orion 4-Star Plus Benchtop pH/ISE Meter, Thermo Sci-
entific, Beverly, MA, USA) was used to assess the amount
of free F-ions in the Sr ? NaF buffer before and during
coating (F-electrode).
2.3 Surface topography and morphology
characterization
All scanning electron microscope (SEM) images in this study
were taken by a Quanta 200 FEG (FEI Hillsboro, Oregon,
USA) field-emission SEM. Its Schottky field emission gun
(FEG) allowed high spatial resolution. All samples were
sputtered with platinum for 1 min prior to imaging and
mounted on the sample holder with conductive carbon tape.
2.4 Cell study
An in vitro cell study was performed to compare the per-
formance of the polarized and Sr-coated groups with the
respective SBAE groups. The murine osteoblastic cell line
MC3T3-E1 was obtained from the German Collection of
Microorganisms and Cell Cultures (DSMZ, Braunschweig,
Germany). MC3T3-E1 cells were routinely cultured at 37 �C
in a humidified atmosphere of 5 % CO2, and maintained in
a-MEM supplemented with 10 % fetal calf serum (FCS) and
antibiotics (50 IU penicillin/ml and 50 lg streptomycin/ml).
Cells were subcultured 1:5 before reaching confluence using
PBS and trypsin/EDTA. All experiments were performed in
the same passage of the MC3T3-E1 cells. The coins were
placed in a 96-well plate (4.5 mm well) and 7 9 103 cells
were seeded on each well to study cell differentiation after
14 days and lactate dehydrogenase (LDH) activity after
24 h. This study used a group size of n = 8 samples per
group for all groups. The same number of cells was cultured
in parallel in plastic culture dishes during all experiments as a
reference. Trypan blue stain was used to determine total and
viable cell number. For the experiments, MC3T3-E1 cells
were maintained for 14 days on the implants in a-MEM
supplemented with 10 % FCS and antibiotics. Culture media
was changed every other day. To study cell differentiation,
cells were harvested after 14 days and collagen 1 (Coll-1),
alkaline phosphatase (ALP) and osteocalcin (OC) gene
expression were analyzed using real-time RT-PCR. The
detailed methods used for LDH activity, RNA isolation,
Real-time RT-PCR, the sequences of sense and antisense
primers were exactly the same as they have been described
by Satue et al. [22].
2.5 Statistical analysis
Data were compared by a two way ANOVA in SigmaPlot
11 (Systat Software, San Jose, California, USA). A nor-
mality test was performed; once this was passed, all sam-
ples were compared in pairs using the Holm-Sidak method.
ANOVA was performed on ranks when the normality test
failed, using the Tukey test for pairwise comparison. The
results of the cell study were compared by the Student’s
Table 1 Different surface
modification groups used in this
study
The given abbreviations were
used in combination with the
abbreviations Ti and TiZr for
the materials used in this study
(titanium and titanium-
zirconium alloy)
Group Surface modification
SBAE Sand-blasted and acid-etched surface that was comparable
to the Straumann SLActive� surface
pol Polarized only group
2 M Acetic acid and sodium-acetate buffer, pH = 5
Sr Sr-coated group
0.25 M Acetic acid and Sr-acetate buffer, pH = 5
Sr ? NaCl Sr-coated group with additional NaCl in the buffer
0.25 M Acetic acid and Sr-acetate buffer with 0.1 M NaCl, pH = 5
Sr ? NaF Sr-coated group with additional NaF in the buffer
0.25 M Acetic acid and Sr-acetate buffer with 0.1 M NaF, pH = 5
Sr ? HFp Sr-coated group with pickling in 0.2 % HF for 2 min before electro-coating
0.25 M Acetic acid and Sr-acetate buffer, pH = 5
J Mater Sci: Mater Med (2013) 24:2537–2548 2539
123
t test using the program SPSS� 19 (IBM Corporation,
Armonk, NY, USA) for Windows�. Significance levels
were set to significant *P B 0.05 and highly significant
**P B 0.01. The Spearmen rank correlation study between
Sr and F levels from the XPS analysis was performed
by the same software package. The results were interpreted
as follows: no correlation if |r| \ 0.3, correlation if
0.3 B |r| \ 0.5, and strong correlation if 0.5 B |r| B 1 [23].
A negative r indicated a negative correlation while a
positive r indicated a positive correlation. Significance
levels were set to significant *P B 0.05 and highly sig-
nificant **P B 0.01. All data were displayed as arithmetic
mean values with standard deviation when the data were
distributed normally and as median values with interquar-
tile range when the data were not distributed normally.
3 Results
3.1 Chemical surface characterization
Evaluation of the surface chemistry was done by XPS with
particular focus on quantifying the strontium (Sr 3d),
fluorine (F 1s), and titanium (Ti 2p) surface ratio of each
surface. The complete results of the general surface com-
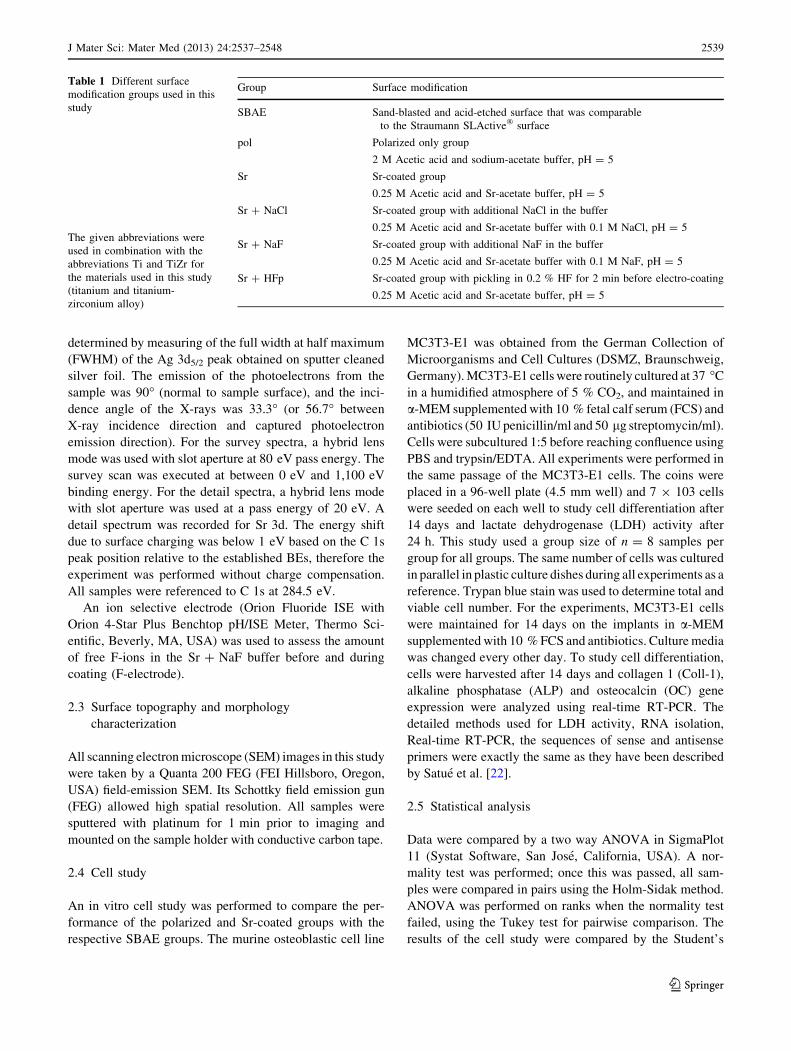
position are presented in Table 2. The specific binding-
state of strontium was assessed by analysis of the Sr 3d
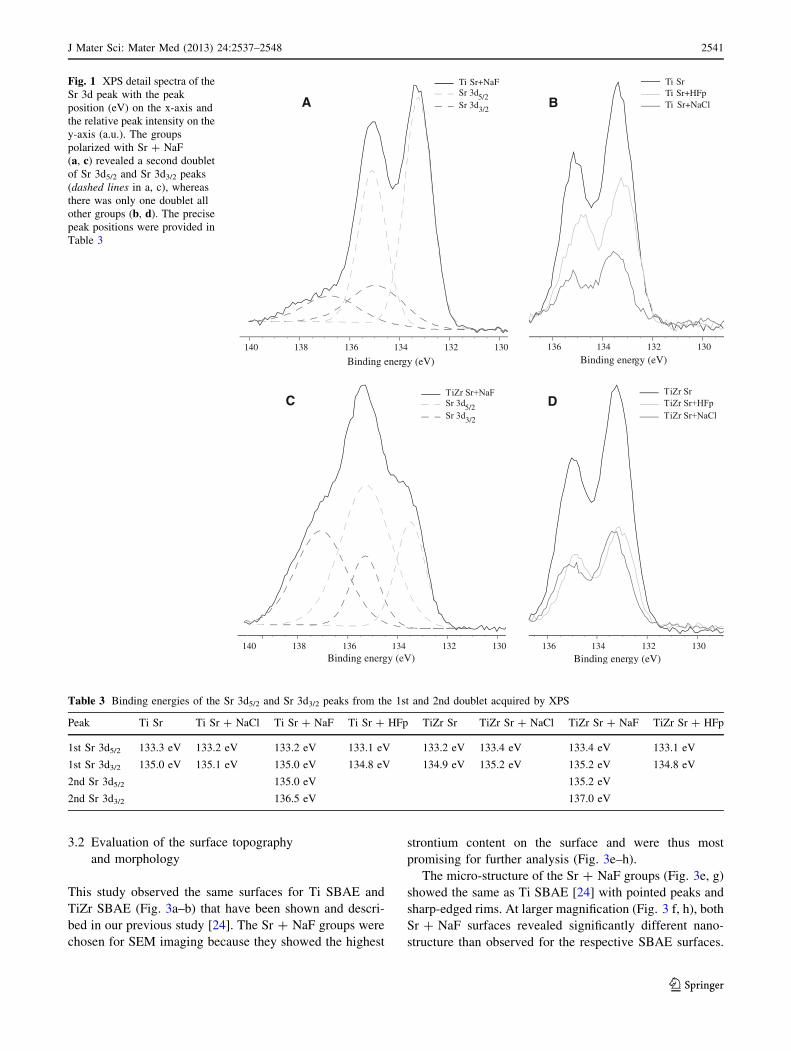
detail spectrum (Fig. 1).
The Sr ? NaF groups showed the highest strontium
content of all groups at similar concentrations for Ti (4.26
at.%) and TiZr (4.08 at.%). Although the Sr-groups showed
the second highest strontium content for both materials, the
total concentration differed over 1 at. % between Ti (2.17
at.%) and TiZr (3.74 at.%). There was no clear trend for an
increased strontium content of either the Sr ? NaCl group
or the Sr ? HFp group. Anyhow, it appeared as if fluorine
only increased the strontium content of a surface, when it
was present in the buffer during polarization. In addition,
the Spearman rank correlation study revealed no significant
correlation between the strontium content and the F content
of a sample (Table 4). Although the Sr ? NaF group
showed the highest F content of all groups, the F content of
the other groups appeared rather random as e.g. the
Sr ? HFp group showed significantly different F levels for
Ti and TiZr.
The Sr 3d detail spectra of the Sr ? NaF group revealed
a second doublet of Sr 3d5/2 and Sr d3/2 peaks that was not
observed for any other group (Fig. 1). It was of particular
interest that the of Sr 3d5/2 peak of the first doublet and the
Sr 3d3/2 peak of the second doublet had the same binding
energy at 135.0 eV for Ti and at 135.2 eV for TiZr
(Table 3). The second doublet was visible as a shoulder in
the detail spectra of the Sr ? NaF groups that stretched up
to almost 140 eV (Fig. 1a, c). Anyhow, the Sr 3d detail
spectra of Ti Sr ? NaF and TiZr Sr ? NaF were not
identical since TiZr Sr ? NaF showed a combined first Sr
3d3/2 and second Sr 3d5/2 peak that had a higher intensity
than the first Sr 3d5/2 peak (Fig. 1c). Moreover, the peak
position of the first Sr 3d5/2 peak of TiZr Sr ? NaF
appeared to be marginally shifted towards a higher binding
energy (133.4 eV) compared to the other TiZr groups.
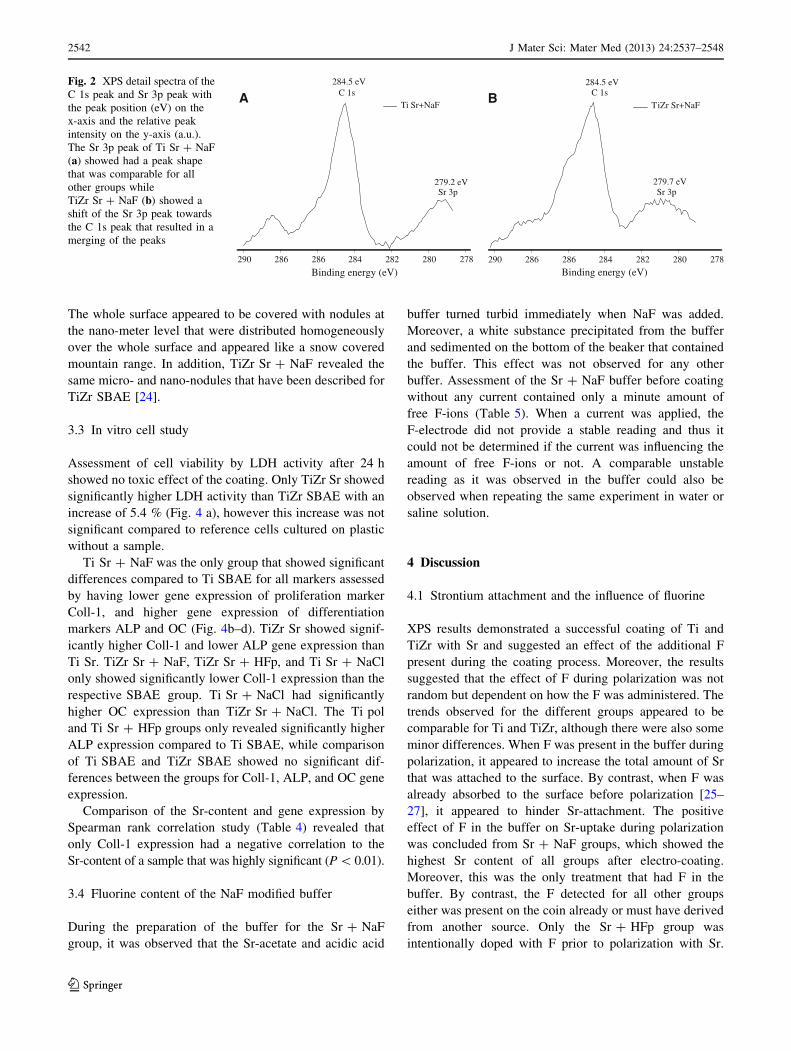
The detail spectra of the C 1s peak with the adjoined Sr
3p1/2 peak revealed clearly separated Sr 3p1/2 peaks for all
samples comparable to the peak illustrated for Ti Sr ?
NaF (Fig. 2 a) except for TiZr Sr ? NaF (Fig. 2 b) that
showed a shift of the Sr 3p1/2 peak towards the C 1s peak
that led to a merging of the two peaks. In addition to the
C 1s peak at 284.5 eV, two C 1s peaks at 285.9 ± 0.2 eV
and 288.3 ± 0.5 eV were revealed by Gaussian peak fitting
for samples of both materials.
All Sr-coated Ti samples revealed some general trends.
The titanium content of the outer surface was about 5–6
at.% lower and the oxygen content was reduced by at least
5 at.% to almost 12 at.% compared to Ti SBAE. Minor
amounts of the trace elements copper, chloride, silicium and
zinc were observed for some groups (results not shown).
Table 2 XPS element analysis for all groups
Name Ti SBAE
(at.%)
Ti Sr
(at.%)
Ti
Sr ? NaCl
(at.%)
Ti
Sr ? NaF
(at.%)
Ti
Sr ? HFp
(at. %)
TiZr
SBAE
(at.%)
TiZr Sr
(at.%)
TiZr
Sr ? NaCl
(at.%)
TiZr
Sr ? NaF
(at.%)
TiZr Sr
HFp (at.%)
O 1s 54.24 45.14 46.98 48.90 42.37 53.73 44.25 44.53 41.74 44.14
C 1s 22.74 31.58 28.42 21.60 25.47 20.72 30.38 28.81 26.39 31.48
Sr 3d 2.17 0.51 4.26 1.14 3.74 1.55 4.08 1.34
F 1s 1.29 2.03 1.87 5.70 4.98 0.78 3.14 1.21 7.43 1.70
Cl 2p 0.23 0.90 0.78 0.78 1.55 1.31 2.18 1.03 0.77
Ti 2p 21.73 16.07 17.89 17.57 17.43 19.43 11.91 12.36 13.06 14.56
Na KLL 1.24 0.85 4.50 0.78 0.86
Zr 3d 2.9 2.09 2.08 1.94 1.47
In addition, minor amounts of the trace elements copper, silicium, nitrogen and zinc were observed for some groups (results not shown)
2540 J Mater Sci: Mater Med (2013) 24:2537–2548
123
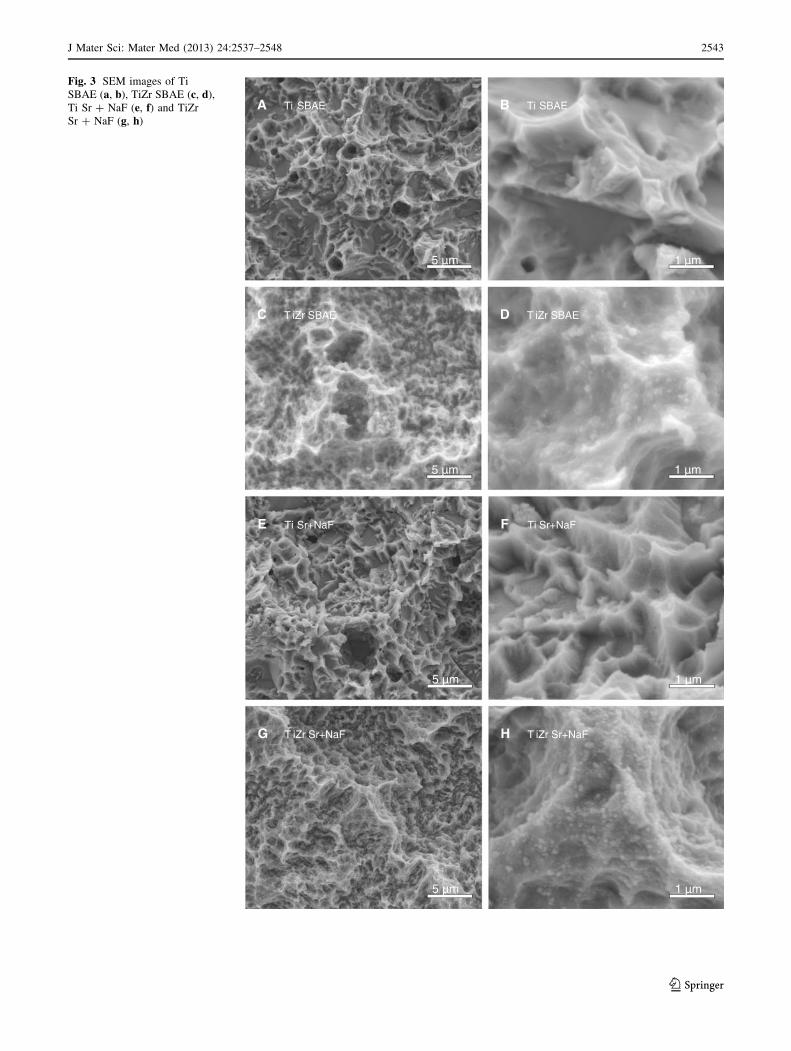
3.2 Evaluation of the surface topography
and morphology
This study observed the same surfaces for Ti SBAE and
TiZr SBAE (Fig. 3a–b) that have been shown and descri-
bed in our previous study [24]. The Sr ? NaF groups were
chosen for SEM imaging because they showed the highest
strontium content on the surface and were thus most
promising for further analysis (Fig. 3e–h).
The micro-structure of the Sr ? NaF groups (Fig. 3e, g)
showed the same as Ti SBAE [24] with pointed peaks and
sharp-edged rims. At larger magnification (Fig. 3 f, h), both
Sr ? NaF surfaces revealed significantly different nano-
structure than observed for the respective SBAE surfaces.
A
C
B
D
140 138 136 134 132 130
Binding energy (eV)
Ti Sr+NaFSr 3d5/2Sr 3d3/2
136 134 132 130
Binding energy (eV)
Ti SrTi Sr+HFpTi Sr+NaCl
140 138 136 134 132 130Binding energy (eV)
TiZr Sr+NaFSr 3d5/2Sr 3d3/2
136 134 132 130
Binding energy (eV)
TiZr SrTiZr Sr+HFpTiZr Sr+NaCl
Fig. 1 XPS detail spectra of the
Sr 3d peak with the peak
position (eV) on the x-axis and
the relative peak intensity on the
y-axis (a.u.). The groups
polarized with Sr ? NaF
(a, c) revealed a second doublet
of Sr 3d5/2 and Sr 3d3/2 peaks
(dashed lines in a, c), whereas
there was only one doublet all
other groups (b, d). The precise
peak positions were provided in
Table 3
Table 3 Binding energies of the Sr 3d5/2 and Sr 3d3/2 peaks from the 1st and 2nd doublet acquired by XPS
Peak Ti Sr Ti Sr ? NaCl Ti Sr ? NaF Ti Sr ? HFp TiZr Sr TiZr Sr ? NaCl TiZr Sr ? NaF TiZr Sr ? HFp
1st Sr 3d5/2 133.3 eV 133.2 eV 133.2 eV 133.1 eV 133.2 eV 133.4 eV 133.4 eV 133.1 eV
1st Sr 3d3/2 135.0 eV 135.1 eV 135.0 eV 134.8 eV 134.9 eV 135.2 eV 135.2 eV 134.8 eV
2nd Sr 3d5/2 135.0 eV 135.2 eV
2nd Sr 3d3/2 136.5 eV 137.0 eV
J Mater Sci: Mater Med (2013) 24:2537–2548 2541
123
The whole surface appeared to be covered with nodules at
the nano-meter level that were distributed homogeneously
over the whole surface and appeared like a snow covered
mountain range. In addition, TiZr Sr ? NaF revealed the
same micro- and nano-nodules that have been described for
TiZr SBAE [24].
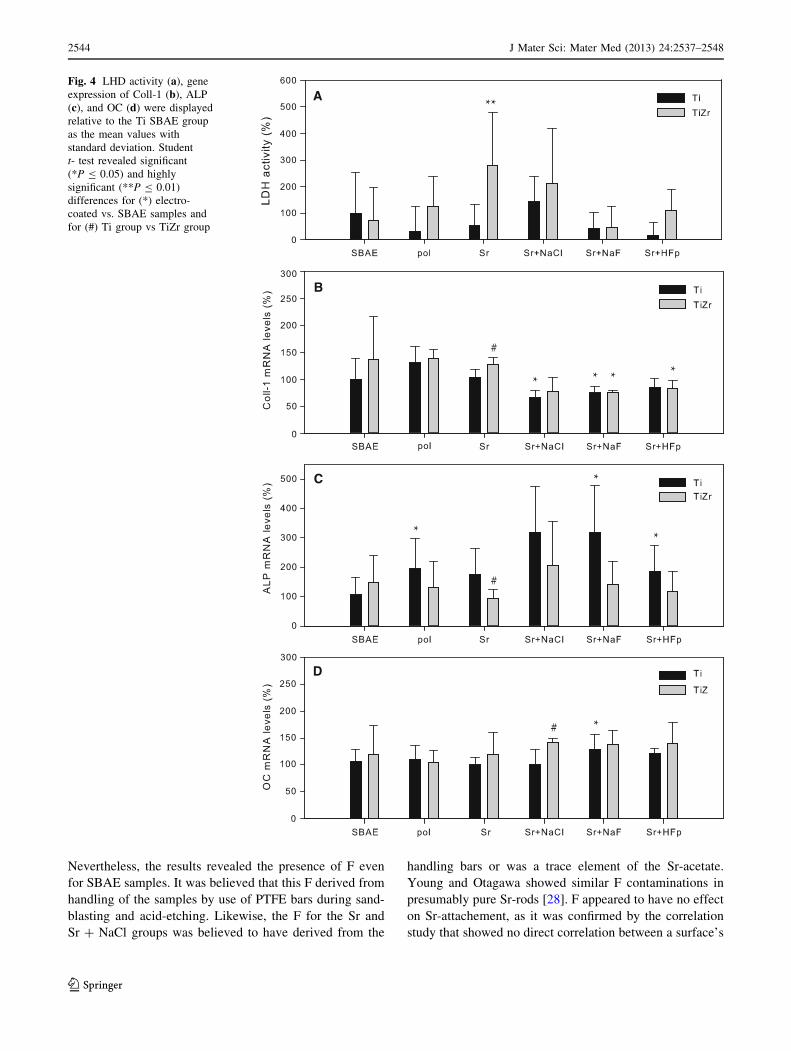
3.3 In vitro cell study
Assessment of cell viability by LDH activity after 24 h
showed no toxic effect of the coating. Only TiZr Sr showed
significantly higher LDH activity than TiZr SBAE with an
increase of 5.4 % (Fig. 4 a), however this increase was not
significant compared to reference cells cultured on plastic
without a sample.
Ti Sr ? NaF was the only group that showed significant
differences compared to Ti SBAE for all markers assessed
by having lower gene expression of proliferation marker
Coll-1, and higher gene expression of differentiation
markers ALP and OC (Fig. 4b–d). TiZr Sr showed signif-
icantly higher Coll-1 and lower ALP gene expression than
Ti Sr. TiZr Sr ? NaF, TiZr Sr ? HFp, and Ti Sr ? NaCl
only showed significantly lower Coll-1 expression than the
respective SBAE group. Ti Sr ? NaCl had significantly
higher OC expression than TiZr Sr ? NaCl. The Ti pol
and Ti Sr ? HFp groups only revealed significantly higher
ALP expression compared to Ti SBAE, while comparison
of Ti SBAE and TiZr SBAE showed no significant dif-
ferences between the groups for Coll-1, ALP, and OC gene
expression.
Comparison of the Sr-content and gene expression by
Spearman rank correlation study (Table 4) revealed that
only Coll-1 expression had a negative correlation to the
Sr-content of a sample that was highly significant (P \ 0.01).
3.4 Fluorine content of the NaF modified buffer
During the preparation of the buffer for the Sr ? NaF
group, it was observed that the Sr-acetate and acidic acid
buffer turned turbid immediately when NaF was added.
Moreover, a white substance precipitated from the buffer
and sedimented on the bottom of the beaker that contained
the buffer. This effect was not observed for any other
buffer. Assessment of the Sr ? NaF buffer before coating
without any current contained only a minute amount of
free F-ions (Table 5). When a current was applied, the
F-electrode did not provide a stable reading and thus it
could not be determined if the current was influencing the
amount of free F-ions or not. A comparable unstable
reading as it was observed in the buffer could also be
observed when repeating the same experiment in water or
saline solution.
4 Discussion
4.1 Strontium attachment and the influence of fluorine
XPS results demonstrated a successful coating of Ti and
TiZr with Sr and suggested an effect of the additional F
present during the coating process. Moreover, the results
suggested that the effect of F during polarization was not
random but dependent on how the F was administered. The
trends observed for the different groups appeared to be
comparable for Ti and TiZr, although there were also some
minor differences. When F was present in the buffer during
polarization, it appeared to increase the total amount of Sr
that was attached to the surface. By contrast, when F was
already absorbed to the surface before polarization [25–
27], it appeared to hinder Sr-attachment. The positive
effect of F in the buffer on Sr-uptake during polarization
was concluded from Sr ? NaF groups, which showed the
highest Sr content of all groups after electro-coating.
Moreover, this was the only treatment that had F in the
buffer. By contrast, the F detected for all other groups
either was present on the coin already or must have derived
from another source. Only the Sr ? HFp group was
intentionally doped with F prior to polarization with Sr.
ATi Sr+NaF
279.2 eVSr 3p
284.5 eVC 1s
290 286 286 284 282 280
Binding energy (eV)278
BTiZr Sr+NaF
279.7 eVSr 3p
284.5 eVC 1s
290 286 286 284 282 280
Binding energy (eV)278
Fig. 2 XPS detail spectra of the
C 1s peak and Sr 3p peak with
the peak position (eV) on the
x-axis and the relative peak
intensity on the y-axis (a.u.).
The Sr 3p peak of Ti Sr ? NaF
(a) showed had a peak shape
that was comparable for all
other groups while
TiZr Sr ? NaF (b) showed a
shift of the Sr 3p peak towards
the C 1s peak that resulted in a
merging of the peaks
2542 J Mater Sci: Mater Med (2013) 24:2537–2548
123
A Ti SBAE B Ti SBAE
C T iZr SBAE D T iZr SBAE
5 µm
5 µm 1 µm
1 µm
E Ti Sr+NaF F Ti Sr+NaF
G T iZr Sr+NaF H T iZr Sr+NaF
5 µm
5 µm 1 µm
1 µm
Fig. 3 SEM images of Ti
SBAE (a, b), TiZr SBAE (c, d),
Ti Sr ? NaF (e, f) and TiZr
Sr ? NaF (g, h)
J Mater Sci: Mater Med (2013) 24:2537–2548 2543
123
Nevertheless, the results revealed the presence of F even
for SBAE samples. It was believed that this F derived from
handling of the samples by use of PTFE bars during sand-
blasting and acid-etching. Likewise, the F for the Sr and
Sr ? NaCl groups was believed to have derived from the
handling bars or was a trace element of the Sr-acetate.
Young and Otagawa showed similar F contaminations in
presumably pure Sr-rods [28]. F appeared to have no effect
on Sr-attachement, as it was confirmed by the correlation
study that showed no direct correlation between a surface’s
A
B
C
D
**
*
*
**
*
#
#
* * *
#
Fig. 4 LHD activity (a), gene
expression of Coll-1 (b), ALP
(c), and OC (d) were displayed
relative to the Ti SBAE group
as the mean values with
standard deviation. Student
t- test revealed significant
(*P B 0.05) and highly
significant (**P B 0.01)
differences for (*) electro-
coated vs. SBAE samples and
for (#) Ti group vs TiZr group
2544 J Mater Sci: Mater Med (2013) 24:2537–2548
123
Sr-content and F-content. Moreover, Ti Sr showed more Sr
than F on the surface and Ti Sr ? NaCl showed compa-
rably high F levels and comparably low Sr levels, which
indicated that there was no imperative presence of F for
binding Sr.
The results of the XPS analysis allowed hypothesizing
on the mechanisms involved in binding Sr on the surface
during the coating and the role of F in this process. As the
results for Sr-coated groups without F in the buffer revealed
only a single doublet of Sr peaks (Fig. 1b, d) at almost
identical binding energies, it was concluded that Sr was
bound to the surface the same way for these groups. Like-
wise, the first doublet observed for the Sr ? NaF group
showed a similar binding energy and was believed to have
derived from the same component while the second doublet
of this group represented a component that was only present
for this treatment. As a multitude of possible bonds has
been reported for the specific binding energy of the doublet
with Sr 3d5/2 at 133.5 ± 0.2 eV, the binding energy itself
could not be used to define the nature of this component
[29]. The results presented by Vasquez et al. [29] for the Sr
3d peak showed a characteristic shift of this peak towards
higher binding energies for certain compounds. When
comparing the results of the study at hand to the results
presented by Vasquez et al., it was believed that the Sr 3d5/2
at 133.5 ± 0.2 eV was referring to SrO whereas the second
doublet with the Sr 3d5/2 peak at 135.4 ± 0.1 eV was
associated to SrF2. The Sr ? NaF group was the only group
that had F and Sr present in the buffer. These elements have
a natural affinity to form SrF2, which is highly insoluble in
aqueous solution and thus precipitate from the buffer [30].
This was supported by the observations made during the
preparation of the buffer that resulted in a turbid buffer
solution. Assessment of the F-ion content revealed there
was only a negligible amount of ionized F in the Sr ? NaF
buffer. The turbidity of the buffer and the lack of free F-ions
in the buffer supported the hypothesis of SrF2 formation
and precipitation in the Sr ? NaF buffer, although an
influence of the current on liberating F-ions could not be
excluded entirely. The precipitated SrF2 may have devel-
oped a dipole moment that led to adsorption of SrF2 at the
sample’s surface during polarization [31]. Alternatively, the
precipitated SrF2 may have developed a surface charge as it
is commonly observed for solid particles that are dispersed
in polar solutions. In either case, the precipitated SrF2 was
likely bond to the sample’s surface due to the charged
sample surface and its high surface roughness and the
complex surface chemistry that included titanium-hydride
and titanium-hydroxide on the surface that may have bond
SrF2 by hydrogen bonds and van der Waals forces. More-
over, the Ti–O–H-Sr film that was developing on the sur-
face simultaneously (lower energy Sr 3d5/2 doublet) may
have further embedded the SrF2 particles. This may also
explain the unusual peak positions observed in the XPS.
This hypothesis agreed with the findings of this study as it
may explain the positive effect of F in the Sr-buffer on
increasing surface Sr-levels while F already present
appeared to have no beneficial effect on Sr-binding. Any-
how, the precise mechanism involved in the incorporation
of Sr and the role of F in the buffer during in this process
remained unknown.
Comparison of the results of this study to the results
presented by Young and Otagawa for the analysis of pure
strontium after argon ion etching may explain the presence
of the additional C 1s peaks at higher binding energies
[28]. Their study concluded that a C 1s peak of such a
higher binding energy indicated the presence of SrCO3.
Moreover, they also concluded that the shift in the Sr 3d5/2
binding energy was not greater than 1 eV for the SrO to
SrF2 transition and that SrO, SrCO3, and Sr(OH)2 could not
be distinguished by the Sr 3d5/2 peak.
When comparing Ti Sr ? NaF to TiZr Sr ? NaF, the
second doublet with the Sr 3d5/2 peak at 135.4 ± 0.1 eV
was more dominant for TiZr Sr ? NaF. It appeared as if
the alloying element Zr had a positive effect on adsorbing
SrF2 onto the surface. This finding was supported by the
analysis of the C 1s and Sr 3p peaks that also showed a
tendency towards higher binding energies.
Apart from the results for Sr and F, the results for Sr-
coated samples of both materials revealed some common
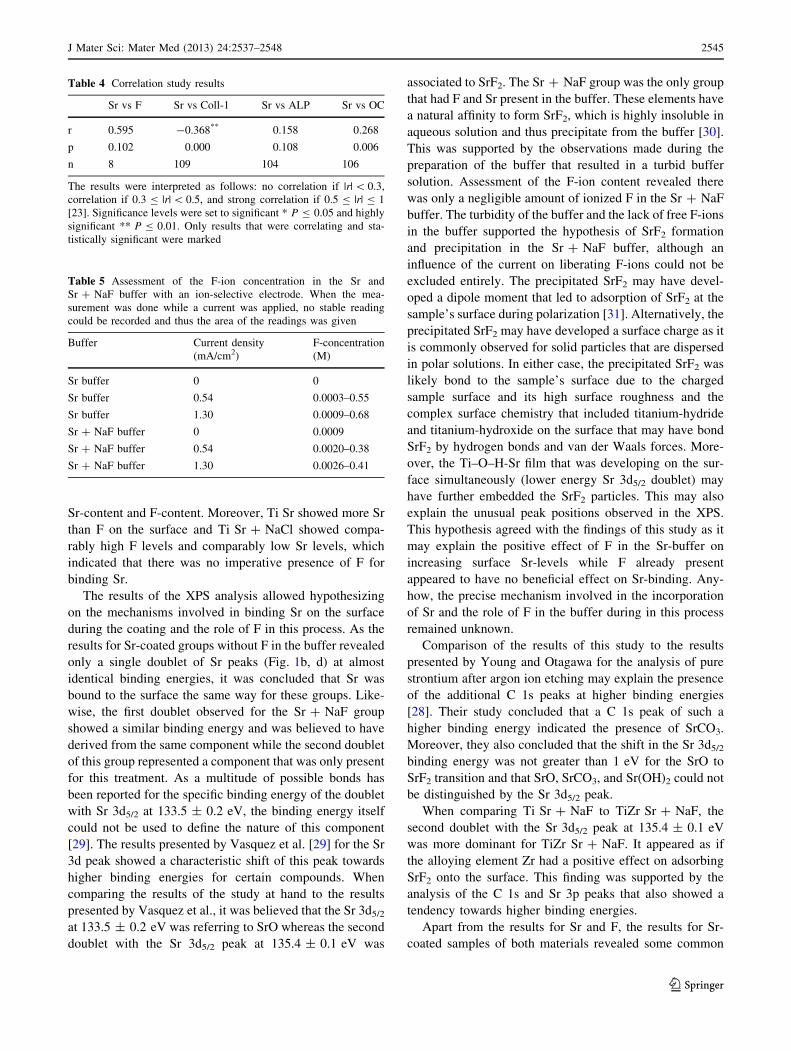
Table 4 Correlation study results
Sr vs F Sr vs Coll-1 Sr vs ALP Sr vs OC
r 0.595 -0.368** 0.158 0.268
p 0.102 0.000 0.108 0.006
n 8 109 104 106
The results were interpreted as follows: no correlation if |r| \ 0.3,
correlation if 0.3 B |r| \ 0.5, and strong correlation if 0.5 B |r| B 1
[23]. Significance levels were set to significant * P B 0.05 and highly
significant ** P B 0.01. Only results that were correlating and sta-
tistically significant were marked
Table 5 Assessment of the F-ion concentration in the Sr and
Sr ? NaF buffer with an ion-selective electrode. When the mea-
surement was done while a current was applied, no stable reading
could be recorded and thus the area of the readings was given
Buffer Current density
(mA/cm2)
F-concentration
(M)
Sr buffer 0 0
Sr buffer 0.54 0.0003–0.55
Sr buffer 1.30 0.0009–0.68
Sr ? NaF buffer 0 0.0009
Sr ? NaF buffer 0.54 0.0020–0.38
Sr ? NaF buffer 1.30 0.0026–0.41
J Mater Sci: Mater Med (2013) 24:2537–2548 2545
123
trends among the different groups. The decreased titanium
levels observed for all Sr-coated samples indicated a
masking effect of the surface coating. Such a masking
effect has previously been described by Morra et al. [32]
for a surface coating with collagen. Sr was not the only
element that adsorbed on the surface during electro-coat-
ing. Trace elements, such as Cu, Na, Cl, Zn, and Si, also
attached to the surface during polarization and also masked
the surface. These trace elements were believed to have
derived from impurities in the acetic acid or from the NaCl
the coins were stored in prior to coating. Besides the
masking of the original surface, all Sr-coated samples
showed a trend towards decreased surface oxygen and
increased surface carbon content. The decrease in surface
oxygen was believed to have been a direct result of the
polarization process, while the increase in carbon may have
had two possible sources. The hydrogen-rich, reactive
surface created by the polarization process was believed to
be more reactive and thus would take up carbon from the
surrounding air. Another, more likely carbon source was
remaining contaminations from the acetate buffer that had
not been removed during the rinsing of the samples due to
the high surface roughness. Handling of the samples after
coating with nitrile gloves may also have contaminated the
surface with carbon. This may also explain the elevation in
N observed for most of the coated samples.
4.2 Surface topography and morphology
Sr ? NaF surface modification revealed visible changes to
the surface nano-topography compared to the SBAE sur-
faces [24]. XPS analysis that revealed this group had a
significant amount of SrF2, which is usually crystalline
[33], on the surface. Thus, it was likely that the observed
nano nodules could have been precipitated, crystalline
SrF2. Yet, this could not be confirmed as the resolution of
the SEM did not allow a precise analysis of the surface
structure itself.
4.3 Assessment of the biological response
The biological response of the osteoblastic MC3T3-E1
cells to Sr-coated Ti and TiZr revealed a positive effect of
the surface modification. When comparing the results of
the study at hand to the temporal expression presented by
Quarles et al. [34] and Monjo et al. [35], it was believed
that the Ti pol group tended towards a marginally earlier
differentiation of the cells compared to Ti SBAE. By
contrast, TiZr pol did not show any significant difference in
cell differentiation compared to TiZr SBAE. As the pol
groups did not have any Sr on the surface, it was concluded
that the surface modification itself had a beneficial effect to
the biological response for Ti independent of the Sr. None
of the surface modifications was toxic to the cells as the
absolute values were comparably low. However, the
increased LDH activity of TiZr Sr explains the gene
expression profile of this group, with higher gene expres-
sion of the proliferative marker Coll-1 and lower expres-
sion of the differentiation marker OC. As the treatment
resulted in a marginally increased LDH activity that was
still non-toxic, the cells cultured on this surface were still
in a proliferative stage rather than in a differentiation stage.
The observations made for Sr ? NaF modified groups
were in accordance with the the findings of Marie et al. [12,
13] who reported that Sr supported bone formation by
activating pre-osteoblast replication and osteoblast differ-
entiation and survival. It has been shown that Sr increases
ALP and collagen-I gene expression and leads to increased
mineralization in MC3T3-E1 cells [36, 37]. It has been
demonstrated that Sr activates the calcium-sensing recep-
tor, calcineurin-NFAT (nuclear factor of activated T cells)
and Wnt signalling pathways in the mechanism that con-
trols bone formation [36, 37]. Anyhow, there was only a
correlation between expression of Coll-1 and the Sr content
of a surface in this study.
It appeared that the surface that had additional SrF2
alongside a majority of Sr bound as SrO on the surface
performed best in terms of cell differentiation as it was
concluded from the Ti Sr ? NaF group. It was believed
that this surface had the best combination of bioavailable
SrO and SrF2. It has been shown for polyacid-modified
composite resins that SrF2 released F-ions in different
solutions [38–40]. Thus, the additional SrF2 did not only
provide bioavailable Sr but also F that has also been shown
to have a positive effect of cell differentiation [7–11].
Furthermore, it was believed that the unreactive SrF2 on
top of the reactive surface shielded it from undesired
contaminations during handling and storage [19, 41, 42]. It
has been established that Sr-oxides strongly chemisorb
carbon dioxide and water to form surface carbonate and
surface hydroxide [28]. XPS analysis supported this con-
clusion as the Sr ? NaF groups had the lowest carbon and
nitrogen content of all Sr-coated groups. The maintained
reactivity of the surface in combination with bioavailable
Sr was likely to have triggered the improved cell differ-
entiation by the aforementioned mechanism. This may also
have been the reason why the groups that had SrO but no
SrF2 did not show any significant difference in cell dif-
ferentiation against the SBAE surface that was already
highly reactive [19]. This was supported by the XPS results
that also showed comparably lower surface carbon and no
nitrogen for the SBAE groups. On the other hand TiZr
Sr ? NaF had more SrF2 than SrO on the surface but
showed no significantly increased cell differentiation
despite its low surface contamination. It appeared that there
was an ideal surface ratio of SrO and SrF2 content that
2546 J Mater Sci: Mater Med (2013) 24:2537–2548
123
triggered the increased cell differentiation. As this study
did not use protective cover gas to prevent surface con-
taminations after the coating, this may offer a chance to
further improve the described surface although it may also
make a group without SrF2 just as reactive while offering
bioavailable Sr from the SrO at the same time.
5 Conclusion
It was concluded that F appeared to support the attachment
of Sr to the surface, when was present in the buffer during
polarization. By contrast, when F was already absorbed to
the surface before polarization, it appeared to hinder Sr-
attachment. The XPS results and analysis of the buffer
suggested that the presence of F in the buffer led to the
formation of SrF2 that attached to the surface. SEM images
showed nano-nodules that were homogeneously distributed
over the whole surface of Sr ? NaF groups and may have
been related to the precipitated SrF2. It was concluded that
a combination of bioavailable Sr from the Sr-oxide and a
SrF2 layer that maintained the reactive surface while
maintaining active amounts of Sr bioavailable from the
SrO was most desirable in terms of cell differentiation.
Acknowledgments This work was supported by the Norwegian
Research Council (Grants No. 203034 and 203036) and the Ministerio
de Ciencia e Innovacion del Gobierno de Espana (Torres Quevedo
contract to MR, and Ramon y Cajal contract to MM). The study
materials, titanium based coins, were kindly provided by Institut
Straumann AG, Basel, Switzerland. The authors are especially
thankful for the excellent technical support and assistance from
Martin Fleissner Sunding (Department of Physics, University of Oslo)
for the XPS analysis.
References
1. Albrektsson T, Sennerby L, Wennerberg A. State of the art of oral
implants. Periodontol 2000. 2008;47:15–26.
2. Wennerberg A, Albrektsson T. Current challenges in successful
rehabilitation with oral implants. J Oral Rehabil. 2011;38:
286–94.
3. Albouy JP, Abrahamsson I, Persson LG, Berglundh T. Sponta-
neous progression of peri-implantitis at different types of
implants—an experimental study in dogs. I: clinical and radio-
graphic observations. Clin Oral Implants Res. 2008;19:997–1002.
4. Palma-Carrio C, Maestre-Ferrin L, Penarrocha-Oltra D, Penar-
rocha-Diago MA, Penarrocha-Diago M. Risk factors associated
with early failure of dental implants—a literature review. Med
Oral Patol Oral Cir Bucal. 2011;16:e514–7.
5. Moy PK, Medina D, Shetty V, Aghaloo TL. Dental implant
failure rates and associated risk factors. Int J Oral Maxillofac
Implants. 2005;20:569–77.
6. Heitz-Mayfield LJ. Peri-implant diseases: diagnosis and risk
indicators. J Clin Periodontol. 2008;35:292–304.
7. Morra M. Biochemical modification of titanium surfaces: pep-
tides and ECM proteins. Eur Cell Mater. 2006;12:1–15.
8. Taxt-Lamolle SF, Rubert M, Haugen HJ, Lyngstadaas SP,
Ellingsen JE, Monjo M. Controlled electro-implementation of
fluoride in titanium implant surfaces enhances cortical bone
formation and mineralization. Acta Biomater. 2010;6:1025–32.
9. Le Guehennec L, Soueidan A, Layrolle P, Amouriq Y. Surface
treatments of titanium dental implants for rapid osseointegration.
Dent Mater. 2007;23:844–54.
10. Zhao L, Chu PK, Zhang Y, Wu Z. Antibacterial coatings on titanium
implants. J Biomed Mater Res B Appl Biomater. 2009;91:470–80.
11. Petzold C, Gomez-Florit M, Lyngstadaas SP, Monjo M. EPA
covalently bound to smooth titanium surfaces decreases viability
and biofilm formation of Staphylococcus epidermidis in vitro.
J Orthop Res. 2012;30:1384–90.
12. Marie PJ, Felsenberg D, Brandi ML. How strontium ranelate, via
opposite effects on bone resorption and formation, prevents
osteoporosis. Osteoporos Int. 2011;22:1659–67.
13. Marie PJ, Ammann P, Boivin G, Rey C. Mechanisms of action
and therapeutic potential of strontium in bone. Calcif Tissue Int.
2001;69:121–9.
14. Peng S, Zhou G, Luk KD, Cheung KM, Li Z, Lam WM, et al.
Strontium promotes osteogenic differentiation of mesenchymal
stem cells through the Ras/MAPK signaling pathway. Cell
Physiol Biochem. 2009;23:165–74.
15. Tsiridis E, Gamie Z, Conaghan PG, Giannoudis PV. Biological
options to enhance periprosthetic bone mass. Injury. 2007;38:704–13.
16. Maimoun L, Brennan TC, Badoud I, Dubois-Ferriere V, Rizzoli
R, Ammann P. Strontium ranelate improves implant osseointe-
gration. Bone. 2010;46:1436–41.
17. Lyngstadaas SP, Ellingsen JE, Astra Tech AB. Medical Prosthetic
Devices and implants having improved biocompatibility. WO
Patent: WO/2002/045,764; 2002.
18. Bernhard N, Berner S, De Wild M, Wieland M. The binary TiZr
Alloy—a newly developed Ti alloy for use in dental implants.
Forum Implantol. 2009;5:30–9.
19. Rupp F, Scheideler L, Olshanska N, de Wild M, Wieland M,
Geis-Gerstorfer J. Enhancing surface free energy and hydrophi-
licity through chemical modification of microstructured titanium
implant surfaces. J Biomed Mater Res A. 2006;76:323–34.
20. Szmukler-Moncler S, Bischof M, Nedir R, Ermrich M. Titanium
hydride and hydrogen concentration in acid-etched commercially
pure titanium and titanium alloy implants: a comparative analysis
of five implant systems. Clin Oral Implants Res. 2010;21:944–50.
21. Frank MJ, Walter MS, Bucko MM, Pamula E, Lyngstadaas SP,
Haugen HJ. Polarization of modified titanium and titanium-zir-
conium creates nano-structures while hydride formation is mod-
ulated. Appl Surf Sci 2013.
22. Satue M, Petzold C, Cordoba A, Ramis JM, Monjo M. UV
photoactivation of 7-dehydrocholesterol on titanium implants
enhances osteoblast differentiation and decreases Rankl gene
expression. Acta Biomater. 2013;9:5759–70.
23. Borenstein M, Cohen J, Rothstein HR, Pollack S, Kane JM. A
visual approach to statistical power analysis on the microcom-
puter. Behav Res Meth Ins C. 1992;24:565–72.
24. Frank MJ, Walter MS, Lyngstadaas SP, Wintermantel E, Haugen
HJ. Hydrogen content in titanium and a titanium–zirconium alloy
after acid etching. Mat Sci Eng C. 2013;33:1282–8.
25. Taxt-Lamolle S. Surface structure, chemistry and bio-perfor-
mance of titanium implants modified by hydrofluoric acid. Oslo:
Doctoral thesis, Faculty of Dentistry, University of Oslo; 2010.
26. Lamolle SF, Monjo M, Rubert M, Haugen HJ, Lyngstadaas SP,
Ellingsen JE. The effect of hydrofluoric acid treatment of tita-
nium surface on nanostructural and chemical changes and the
growth of MC3T3-E1 cells. Biomaterials. 2009;30:736–42.
27. Wilhelmsen W, Grande AP. The influence of hydrofluoric acid
and fluoride ion on the corrosion and passive behaviour of tita-
nium. Electrochim Acta. 1987;32:1469–74.
J Mater Sci: Mater Med (2013) 24:2537–2548 2547
123
28. Young V, Otagawa T. Xps Studies on Strontium Compounds.
Appl Surf Sci. 1985;20:228–48.
29. Vasquez RP. X-ray photoelectron-spectroscopy study of Sr and Ba
compounds. J Electron Spectrosc Relat Phenom. 1991;56:217–40.
30. Kmetko J, Yu C, Evmenenko G, Kewalramani S, Dutta P.
Organic-template-directed nucleation of strontium fluoride and
barium fluoride: epitaxy and strain. Phys Rev B. 2003;68:085415.
31. Beaumont JH, Harmer AL, Hayes W, Spray ARL. Zero-phonon
lines in CaF 2 and SrF 2. J Phys C. 1972;5:1489.
32. Morra M, Cassinelli C, Cascardo G, Cahalan P, Cahalan L, Fini
M, et al. Surface engineering of titanium by collagen immobili-
zation—surface characterization and in vitro and in vivo studies.
Biomaterials. 2003;24:4639–54.
33. Bochner RA, Abdulrahman A, Nancollas GH. Crystal-growth of
Sr Fluoride from aqueous-solution. J Chem Soc Faraday Trans.
1984;80:217–24.
34. Quarles LD, Yohay DA, Lever LW, Caton R, Wenstrup RJ.
Distinct proliferative and differentiated stages of murine MC3T3-
E1 cells in culture: an in vitro model of osteoblast development.
J Bone Miner Res. 1992;7:683–92.
35. Monjo M, Rubert M, Ellingsen JE, Lyngstadaas SP. Rosuvastatin
promotes osteoblast differentiation and regulates SLCO1A1
transporter gene expression in MC3T3-E1 cells. Cell Physiol
Biochem. 2010;26:647–56.
36. Takaoka S, Yamaguchi T, Yano S, Yamauchi M, Sugimoto T.
The calcium-sensing receptor (CaR) is Involved in Sr Ranelate-
induced osteoblast differentiation and mineralization. Horm
Metab Res. 2010;42:627–31.
37. Fromigue O, Hay E, Barbara A, Marie PJ. Essential role of
nuclear factor of activated T cells (NFAT)-mediated Wnt sig-
naling in osteoblast differentiation induced by strontium ranelate.
J Biol Chem. 2010;285:25251–8.
38. Geurtsen W, Leyhausen G, Garcia-Godoy F. Effect of storage
media on the fluoride release and surface microhardness of four
polyacid-modified composite resins (‘‘compomers’’). Dent Mater.
1999;15:196–201.
39. Sales D, Sae-Lee D, Matsuya S, Ana ID. Short-term fluoride and
cations release from polyacid-modified composites in a distilled
water, and an acidic lactate buffer. Biomaterials. 2003;24:1687–96.
40. Xu X, Burgess JO. Compressive strength, fluoride release and
recharge of fluoride-releasing materials. Biomaterials. 2003;24:
2451–61.
41. Massaro C, Rotolo P, De Riccardis F, Milella E, Napoli A,
Wieland M, et al. Comparative investigation of the surface
properties of commercial titanium dental implants—part I:
chemical composition. J Mater Sci Mater Med. 2002;13:535–48.
42. Taborelli M, Jobin M, Francois P, Vaudaux P, Tonetti M,
Szmukler-Moncler S, et al. Influence of surface treatments
developed for oral implants on the physical and biological
properties of titanium. (I) Surface characterization. Clin Oral
Implants Res. 1997;8:208–16.
2548 J Mater Sci: Mater Med (2013) 24:2537–2548
123
Related Documents


![Ion-Doped Silicate Bioceramic Coating of Ti-Based Implant€¦ · anchorage result in implant failure and loosening[4-9]. Furthermore, a fibrous layer is formed at the interface between](https://static.cupdf.com/doc/110x72/5fa4c8cbf8fe347606697476/ion-doped-silicate-bioceramic-coating-of-ti-based-implant-anchorage-result-in-implant.jpg)


