Coastal swimming patterns of white sharks (Carcharodon carcharias) at Mossel Bay, South Africa Ryan Johnson & Marthán N. Bester & Sheldon F. J. Dudley & W. Herman Oosthuizen & Michael Meÿer & Lisa Hancke & Enrico Gennari Received: 27 August 2008 / Accepted: 31 March 2009 / Published online: 9 May 2009 # Springer Science + Business Media B.V. 2009 Abstract Between June and December 2005, active and passive acoustic telemetry was used to exam- ine fine scale movements of 13 white sharks (Carcharodon carcharias) (ten passive, three active) at Mossel Bay. A total of 24 active trackings (ranging from 2 h to 103 h in duration) were conducted. Patterns of rate of movement (ROM), swimming linearity (LI), swimming bearing, and instantaneous swimming speed (ISS) were assessed. A conversion quotient (Q) of 1.21 between ISS and ROM (10 min sample interval) was calculated suggesting ROM is a good indicator of white shark activity. The mean ROM for tracked sharks was 0.52 m·s −1 , with a greatest sustained ROM of 1.33 m·s −1 (4.8 km·h −1 ). Sharks displayed greatest LI and ROM during directional travels between the three persistent aggregation sites. The majority of the shark move- ment was, however, non-linear as the sharks repeat patrolled at the three aggregation sites. Two of these sites were not associated with pinniped presence, and sharks typically patrolled back and forth parallel to the shore line at a comparatively low ROM which suggested resting. The third aggregation site was adjacent to Seal Island, and despite low LI, sharks displayed a high ROM, indicating high activity levels. We propose that the high ROM is related to maximising search area when patrolling to hunt Cape fur seals (Arctocephalus p. pusillus). Environ Biol Fish (2009) 85:189–200 DOI 10.1007/s10641-009-9477-4 R. Johnson : E. Gennari Oceans Research, P.O. Box 1767, Mossel Bay 6500, South Africa R. Johnson (*) : M. N. Bester Mammal Research Institute, Department of Zoology & Entomology, University of Pretoria, Pretoria 0002, South Africa e-mail: [email protected] S. F. J. Dudley Natal Sharks Board, Private Bag 2, Umhlanga Rocks 4320, South Africa S. F. J. Dudley Biomedical Resource Unit, University of KwaZulu-Natal, Private Bag X54001, Durban, South Africa W. H. Oosthuizen : M. Meÿer Marine and Coastal Management Branch, Department of Environmental Affairs and Tourism, Private Bag X2, Roggebaai, South Africa L. Hancke Cape Technical University, Cape Town, South Africa E. Gennari South African Institute for Aquatic Biodiversity, Private Bag 1015, Grahamstown 6140, South Africa

Welcome message from author
This document is posted to help you gain knowledge. Please leave a comment to let me know what you think about it! Share it to your friends and learn new things together.
Transcript

Coastal swimming patterns of white sharks(Carcharodon carcharias) at Mossel Bay, South Africa
Ryan Johnson & Marthán N. Bester &
Sheldon F. J. Dudley & W. Herman Oosthuizen &
Michael Meÿer & Lisa Hancke & Enrico Gennari
Received: 27 August 2008 /Accepted: 31 March 2009 /Published online: 9 May 2009# Springer Science + Business Media B.V. 2009
Abstract Between June and December 2005, activeand passive acoustic telemetry was used to exam-ine fine scale movements of 13 white sharks(Carcharodon carcharias) (ten passive, three active)at Mossel Bay. A total of 24 active trackings (rangingfrom 2 h to 103 h in duration) were conducted.Patterns of rate of movement (ROM), swimminglinearity (LI), swimming bearing, and instantaneousswimming speed (ISS) were assessed. A conversionquotient (Q) of 1.21 between ISS and ROM (10 minsample interval) was calculated suggesting ROM isa good indicator of white shark activity. The meanROM for tracked sharks was 0.52 m·s−1, with agreatest sustained ROM of 1.33 m·s−1 (4.8 km·h−1).
Sharks displayed greatest LI and ROM duringdirectional travels between the three persistentaggregation sites. The majority of the shark move-ment was, however, non-linear as the sharks repeatpatrolled at the three aggregation sites. Two of thesesites were not associated with pinniped presence, andsharks typically patrolled back and forth parallel tothe shore line at a comparatively low ROM whichsuggested resting. The third aggregation site wasadjacent to Seal Island, and despite low LI, sharksdisplayed a high ROM, indicating high activitylevels. We propose that the high ROM is related tomaximising search area when patrolling to hunt Capefur seals (Arctocephalus p. pusillus).
Environ Biol Fish (2009) 85:189–200DOI 10.1007/s10641-009-9477-4
R. Johnson : E. GennariOceans Research,P.O. Box 1767, Mossel Bay 6500, South Africa
R. Johnson (*) :M. N. BesterMammal Research Institute,Department of Zoology & Entomology,University of Pretoria,Pretoria 0002, South Africae-mail: [email protected]
S. F. J. DudleyNatal Sharks Board,Private Bag 2,Umhlanga Rocks 4320, South Africa
S. F. J. DudleyBiomedical Resource Unit, University of KwaZulu-Natal,Private Bag X54001,Durban, South Africa
W. H. Oosthuizen :M. MeÿerMarine and Coastal Management Branch,Department of Environmental Affairs and Tourism,Private Bag X2, Roggebaai, South Africa
L. HanckeCape Technical University,Cape Town, South Africa
E. GennariSouth African Institute for Aquatic Biodiversity,Private Bag 1015,Grahamstown 6140, South Africa

Keywords White shark . Rate of movement .
Activity patterns . Habitat use
Introduction
The white shark (Carcharodon carcharias) is a largemarine predator, the movement patterns of whichappear to be characterized by periods of fidelity ataggregation sites interspersed by periods of sustainedswimming (Boustany et al. 2002; Bonfil et al. 2005;Bruce et al. 2006; Weng et al. 2007). In South Africa,white sharks are conspicuous inhabitants in the coastalwaters off the south Western Cape (Kock and Johnson2006) where, documented aggregation sites are often,but not exclusively, aligned with islands containingrookeries of Cape fur seals (Arctocephalus pusilluspusillus) (Compagno et al. 1997; Kock et al. 2002;Johnson 2003). Documenting the fine scale movementand activity patterns of white sharks within suchaggregation sites provides insights into how, and why,they utilize these chosen habitats in time and space.
Active and passive ultrasonic telemetry has beensuccessfully used to describe fine scale movementpatterns in various species of sharks (Gruber et al.1988; Sundström et al. 2001, Voegeli et al. 2001;Rechisky and Wetherbee 2003). Rate of movement(ROM: the distance travelled by an animal over acertain time period, also known as point-to-pointswimming speed or speed over the ground), instanta-neous swimming speed (ISS: speed of the animalthrough the water), swimming linearity and swimmingorientation have frequently been used as indices toboth quantify and qualify how a species interacts withits surrounding environment (Sundström et al. 2001).
Carey et al. (1982) completed the first and onlymultiple day active track of a white shark, followingan individual for 83 h over a distance of 190 km.Despite absence of GPS technology, this studycalculated an overall ROM of 3.2 km·h−1 based onobvious landmarks. Strong et al. (1992) trackedseven white sharks at offshore islands in the LowerSpencer Gulf, Australia, which included two contin-uous tracks of over 24 h. They described threebehavioural patterns, including downstream circlingin the remnants of a chum slick, island patrolling,and inter island cruising. They also calculated anaverage ROM of 3.2 km·h−1 (n=145, 15 mininterval), similar to that observed by Carey et al.
(1982). Subsequent tracking by Goldman andAnderson (1999) were limited to discrete periods oftime during daylight hours at the Farallon Islands,California, where they determined a lower averageROM of 2.3 km·h−1 (std. dev. = 0.6, n=20, 1 mininterval), possibly related to the non-linear nature ofthe tracks, which were characterized by a combina-tion of along shore sweeps and on-offshore move-ments. Klimley et al. (2001a) deployed a radio-acousticpositioning setup to passively examine presence andswimming patterns of white sharks adjacent to apinniped colony (Año Nuevo Island, California). Anumber (three out of six) of the studied sharks preferreda ‘back and forth’ swimming pattern parallel to theisland’s shoreline. Klimley et al. (2001b) documentedbursts of speed of 6 m·s−1 and 7 m·s−1, the fastedrecorded speeds for a white shark. Bonfil et al. (2005)presented the first swimming speed data of a longdistance migration, based on smoothed geolocationpositional fixes, by a 360 cm female white shark.While traversing from South Africa to the Australia’swestern seaboard, she maintained a mean swimmingspeed of 4.7 km·h−1.
At present, the swimming and activity patterns ofwhite sharks have been described from acoustic andsatellite telemetry at either (a) offshore pinnipedislands (Strong et al. 1992; Goldman and Anderson1999; Klimley et al. 2001a) or (b) offshore localitiesnot associated with landmasses (Carey et al. 1982;Bonfil et al. 2005). No published information on thefine scale swimming patterns of white sharks at nearshore (mainland) coastal localities (<2,000 m), orwithin South Africa is available. The aim of this studyis to address this lack of information by describing nearshore swimming patterns of white sharks at MosselBay, South Africa, a known coastal aggregation site.
Materials and methods
Study site
Mossel Bay (34°08′S, 22°07′E) is a semi-closed baysituated on the south western coast of South Africa(Fig. 1). White sharks in this area have been studiedsince 2001, although a commercial cage-divingoperator has kept records of white shark sightingssince 1995. There is also an island (Seal Island) in thebay, located 800 m from the shore, on which ca 4,000
190 Environ Biol Fish (2009) 85:189–200
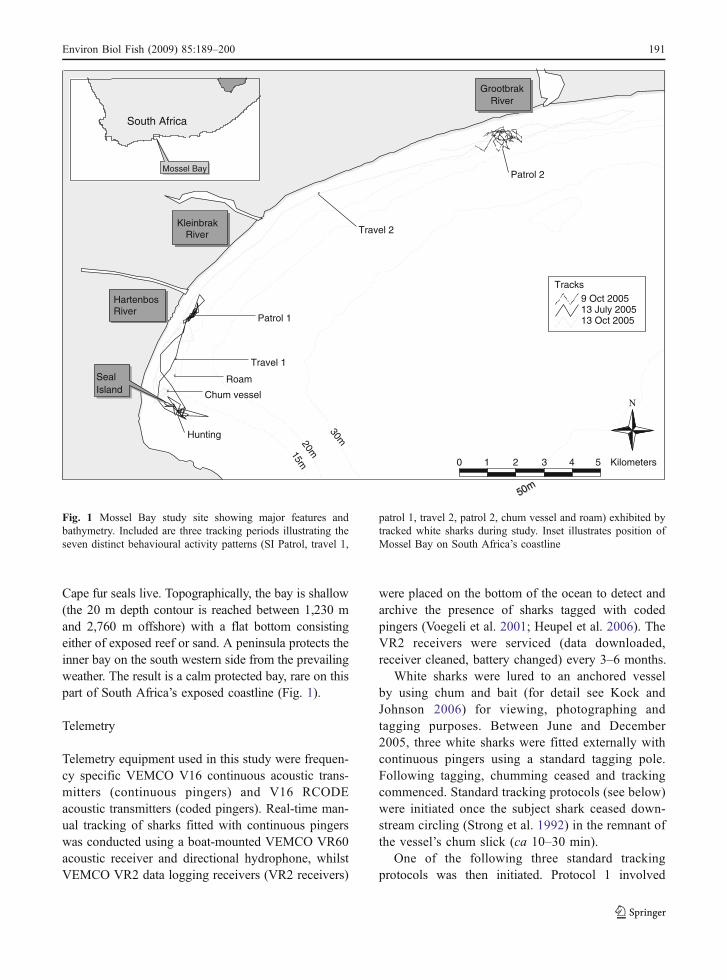
Cape fur seals live. Topographically, the bay is shallow(the 20 m depth contour is reached between 1,230 mand 2,760 m offshore) with a flat bottom consistingeither of exposed reef or sand. A peninsula protects theinner bay on the south western side from the prevailingweather. The result is a calm protected bay, rare on thispart of South Africa’s exposed coastline (Fig. 1).
Telemetry
Telemetry equipment used in this study were frequen-cy specific VEMCO V16 continuous acoustic trans-mitters (continuous pingers) and V16 RCODEacoustic transmitters (coded pingers). Real-time man-ual tracking of sharks fitted with continuous pingerswas conducted using a boat-mounted VEMCO VR60acoustic receiver and directional hydrophone, whilstVEMCO VR2 data logging receivers (VR2 receivers)
were placed on the bottom of the ocean to detect andarchive the presence of sharks tagged with codedpingers (Voegeli et al. 2001; Heupel et al. 2006). TheVR2 receivers were serviced (data downloaded,receiver cleaned, battery changed) every 3–6 months.
White sharks were lured to an anchored vesselby using chum and bait (for detail see Kock andJohnson 2006) for viewing, photographing andtagging purposes. Between June and December2005, three white sharks were fitted externally withcontinuous pingers using a standard tagging pole.Following tagging, chumming ceased and trackingcommenced. Standard tracking protocols (see below)were initiated once the subject shark ceased down-stream circling (Strong et al. 1992) in the remnant ofthe vessel’s chum slick (ca 10–30 min).
One of the following three standard trackingprotocols was then initiated. Protocol 1 involved
KleinbrakRiver
GrootbrakRiver
50m50m
#
Hunting
#
Travel 1
#
Travel 2
SealIsland
#
Patrol 1
#
Patrol 2
#
Roam#
Chum vessel
15m20m
30m
HartenbosRiver
0 Kilometers
N
13 Oct 200513 July 20059 Oct 2005
Tracks
South Africa
Mossel Bay
1 2 3 4 5
Fig. 1 Mossel Bay study site showing major features andbathymetry. Included are three tracking periods illustrating theseven distinct behavioural activity patterns (SI Patrol, travel 1,
patrol 1, travel 2, patrol 2, chum vessel and roam) exhibited bytracked white sharks during study. Inset illustrates position ofMossel Bay on South Africa’s coastline
Environ Biol Fish (2009) 85:189–200 191

obtaining a positional fix of the tagged shark at10 min intervals using a Magellan GPS device. Thenext step was to cut the boat’s engines, and whilstdrifting, to submerge a VR2 receiver to one meter todetermine if any sharks tagged with coded pingerswere nearby. At the same time environmental data,such as, light intensity (day, sunset, dusk, night,dawn, sunrise) were recorded. Other data, such as,bottom structure (reef, mixed, sand), water tempera-ture (°C) and water depth (m) were collected using theboat’s echo-sounder. Between 2 min and 5 min(depending on signal strength) prior to the nextrequired positional fix, submerged instrumentationwas removed and a single engine was used toreposition the vessel. A second tracking protocol(protocol 2) of obtaining positional fixes at ca 5 minintervals was followed when the shark was near(ca 500 m) Seal Island. Protocol 2 enabled us tomaintain contact with the shark despite the islandcausing depletion in signal strength, and to ensure thatany attempted attack on a pinniped was witnessed. Athird opportunistic tracking protocol (protocol 3) wasadopted when a shark swam at the surface for aprolonged period of time. This involved maintainingthe tracking vessel ca 20 m behind the shark andtaking positional fixes every min. This trackingdistance from the shark was determined based onobservational investigations that revealed approacheswithin ca 5 m of the shark would occasionally resultin disturbed behaviour (e.g. diving and alteringcourse). As no disturbed behaviour was observed ata following distance of 20 m or more, a decision wasmade to maintain a tracking distance of at least 20 mfrom the shark to prevent the boat presence frominfluencing the behaviour and movements of the shark.
Tracking was conducted by teams of two to fourpersons working 12–24 h shifts. On most occasions,assistance provided by the local tourism operators, orthe presence of a second research vessel, allowedtracking to continue uninterrupted when changingshifts. However, occasionally the tracking boat had toreturn to the harbour to change crews, unavoidablycreating data gaps of 40–70 min in the continuous track.
VR2 receivers continuously archived the date andtime when any RCODE tagged white shark wasnearby a given VR2 receiver (environmental con-ditions had a major impact on VR2 detection field,average range determined at 300 m). Such dataarchived by four VR2 receivers situated at two widely
spaced localities (Grootbrak and Hartenbos, Fig. 1)was used to examine ROM by RCODE tagged sharksswimming along the coast.
Data analysis
Data generated during tracking protocols ‘2’ and‘3’ (5 min and 1 min sampling intervals respec-tively) were aggregated to increase the samplinginterval to ca 10 min for standardization purposes.All recorded tracks of shark movements werethen plotted onto a digital chart of Mossel Bay usingArcview 3.2 and assessed using the animal move-ment analysis extension (AMAE: Hooge andEichenlaub 2000). ROM was then calculated bydividing this displacement distance with thecorresponding sample interval. Although ROMdoes not represent swimming speeds, it does giveinsight into relative activity. To examine if ROMpatterns were dependent on time of day, measure-ments collected were pooled into (a) four categories(i.e. daylight, dusk (±1 h from sunset), night anddawn (±1 h from sunrise)) and (b) hourly, thentested using ANOVA and Tukey’s HSD test. Asecond estimate of ROM used time intervals ofRCODE tagged sharks that travelled betweenwidely spaced (>10 km) VR2 receivers at Groot-brak and Hartenbos. To calculate the distancesbetween receivers, locations were plotted on adigital chart, with 600 m subtracted from eachmeasurement (~300 m detection field for eachreceiver) to determine a more accurate estimate ofdistance between receiver detection fields.
The overall swimming linearity of each track wascalculated using AMAE, with the resultant statistictermed ‘angular concentration’ (r). Angular concentra-tion ranges from 0 (completely non-linear swimming)to 1 (straight line swimming) (Batschelet 1981).Rayleigh’s z-test was used to test for significantlinearity in swimming pathways for individual tracks.Variation in ROM may be caused by change in ISS,but also may result from variation in swimminglinearity, current strength or vertical movement. Duringsuccessive sample intervals, an index of swimminglinearity (LI) was calculated using the followingequation developed by Bell and Kramer (1979):
LI ¼ Fn � F1ð Þ=D
192 Environ Biol Fish (2009) 85:189–200

where Fn = the third position taken, F1 = the firstposition taken, D = the total distance travelled duringthe interval.
Swim bearings between consecutive positions wereestablished using standard trigonometry techniques(cosine rule). Calculated bearings were pooled into 12intervals (30° range) with 0° representing due north.Data was separated into ‘shark activity’ groupings,and bearing frequency was examined for randomnessusing chi square analysis.
Data recorded during tracking protocol 3 (1 minsample interval) was used to (a) calculate theapproximate ISS of a shark, as well as, (b) compareISS with ROM. ROM calculated at one-min intervalswas assumed to reflect ISS of the shark for that period.Comparable ROM measurements were established byaggregating this protocol 3 data to increase the sampleinterval to 10 min. To establish a conversion quotient(Q) between ROM and ISS the following calculationwas made Q = ISSmean / ROMmean.
Results
Three female white sharks were tracked 24 timesbetween June 2005 and December 2005 for acombined period of 477 h (Table 1), during which atotal of 2,531 positional fixes (mean interval10.3 min, range 3.0–68.0 min) were obtained fromwhich 2409 ROM measurements and 2029 LI record-ings were calculated. The mean ROM of the threewhite sharks was 0.52 m·s−1 (range 0.00–1.98 m·s−1),whilst mean ROM between the three sharks differedsignificantly (ANOVA, F (2, 2405) = 39.4, P<0.01).Pairwise analysis revealed that the mean ROM ofGWS-001 was significantly less than that of GWS-002 (Tukey’s HSD test, GWS-002 ≠ GWS-001),although the small sample size (n=3) restricts theevaluation of this finding’s biological importance(Tables 1 and 2).
The angular concentration (r) of the 24 tracksshowed that the majority of tracks (87.5%) were non-linear, indicating a high degree of habitat re-use in thestudy site (Table 1). Three tracks (20, 21 and 22)showed significant linearity in terms of their overallangular concentration (Table 1). These tracks wereunique in that the shark swam in a sustained northeastdirection from the Hartenbos to the Grootbrak site(e.g. 13 October track, Fig. 1).
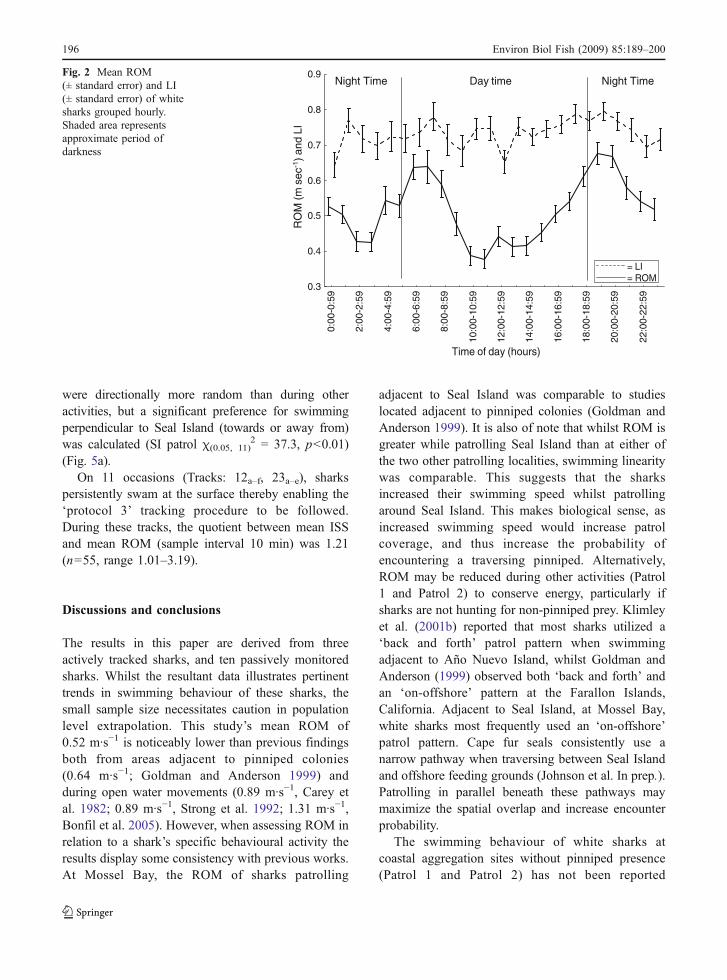
ROM was significantly affected by light con-ditions (F(3, 2404) =26.635, p<0.01). with the highestvalues during dusk and dawn (Tukey’s HSD test,Dusk = Dawn ≠ Night ≠ Day). LI was also affectedsignificantly by light levels (ANOVA, F(3,2271) =3.201, p<0.05, S) peaking at dusk (Tukeys HSD test,Dusk ≠ Night = Day = Dawn). However, hourlyobservations indicated that the crepuscular peaks ofROM were not mirrored by LI patterns (Fig. 2).
Amongst the five natural behaviours (excludingactivities related to the cage diving operation i.e.‘roam’ and ‘chum vessel’), the mean ROM differedsignificantly (ANOVA F(4, 2344) = 206.0, p<0.01).Pairwise comparison identified four distinct groupings(Tukey’s HSD test, Travel 2 = Travel 1 ≠ SI Patrol ≠Patrol 2 ≠ Patrol 1) with the greatest ROM measuredas sharks travelled between the patrolling localities(SI patrol, Patrol 1, Patrol 2). In addition, ROM washigher whilst patrolling Seal Island than patrolling atthe other localities (Fig. 3). Furthermore, a significantinteraction effect was observed with respect to sharkactivity and light levels with respect to ROM(F(11, 2200) =3.3216, p<.01). Graphically, this signif-icant interaction effect derives from the sharksdisplaying a greater ROM whilst hunting in daylightas opposed to other light conditions.
Swimming LI was also significantly influenced byshark activity (ANOVA F(4, 1977) = 53.24, p<0.01).Pairwise analysis revealed three distinct groups(Tukey’s HSD test, Travel 2 = Travel 1 ≠ Patrol 2 ≠Patrol 1 = SI Patrol), with LI greatest as sharkstravelled between patrolling localities (Fig. 3). Nointeraction effect existed between light levels andshark activity with respect to LI, (MANOVA,F(11,2204) =1.51, p=0.12).
During the three overall linear tracks, LI meas-urements confirmed that sharks utilized a nearstraight line swimming pattern parallel to thecoastline (Track 20: 0.998, Track 21: 0.992, Track22: 0.995). The mean ROM during these threetracks (Track 20: 1.05, Track 21: 0.93, Track 22:0.89 m·s−1) differed significantly amongst oneanother (ANOVA, F(2, 54) = 7.098, p<0.01), butlikely resembled ISS. VR2 listening stations placedat Grootbrak and Hartenbos closely resembled thestart and finish positions of the straight lineswimming portions of the three tracks. Ten whitesharks fitted with RCODE transmitters made a totalof 239 swims between these widely spaced receivers.
Environ Biol Fish (2009) 85:189–200 193

The quickest swim was made by a 350 cm male(RCODE-532) that completed the 11.23 km swimin 02h20, at a sustained ROM of 1.33 m·s−1
(4.8 km·h−1). Significant difference in ROM betweenHartenbos and Grootbrak existed with respect toshark total length (Kruskal-Wallis, H (4,239) = 63.69,p<0.01), with larger sharks moving between thereceivers more quickly than their smaller conspe-cifics (Fig. 4). Pair wise analysis revealed twosignificant groupings, namely sharks greater or lessthan 325 cm TL (Multiple comparison ‘p’ values,350=400≠300=250=200).
The swim orientation of the sharks appeared to beclosely aligned with shoreline topography during fourof the five shark activities (Fig. 5a–e). Sharkspatrolling at Grootbrak (Patrol 2, χ(0.05, 11)
2=211.7,p<0.01) and Hartenbos (Patrol 1, χ(0.05, 11)
2 = 706.3,p<0.01) preferred to swim back and forth parallel tothe coastline rather than perpendicular to it (Fig. 5c, d).As expected, the swim bearings between the threepatrolling sites also consisted of swimming mainlyparallel to the coastline (Travel 1, χ(0.05, 11)
2 = 209.7,p<0.01; Travel 2, χ(0.05, 11)
2 = 204.7, p<0.01)(Fig. 5b, e). Swim patterns adjacent to Seal Island
Table 1 Summary of white shark tracking data from Mossel Bay, South Africa, 2005
Transmitter(Reference No.)
TL Sex Track Start date Duration (h) Distance (km) ROM(m s−1)
Linearity (r)
51 khz (GWS-001) 420 F Individual track data 1 8-Jul-2005 10 22.2 0.638 0.032
2 9-Jul-2005 9 8.3 0.263 0.057
3 10-Jul-2005 9 7.0 0.214 0.126
4 12-Jul-2005 24 45.1 0.534 0.043
5 18-Jul-2005 17 22.6 0.380 0.054
6 26-Jul-2005 78 89.5 0.379 0.014
7 16-Aug-2005 103 160.0 0.469 0.006
8 8-Sep-2005 4 8.5 0.600 0.152
9 4-Oct-2005 11 11.7 0.340 0.024
10 7-Oct-2005 11 20.5 0.585 0.071
11 18-Oct-2005 18 31.9 0.587 0.014
12 22-Oct-2005 54 126.8 0.677 0.016
Combined data 348 554.1 0.472
54 khz (GWS-002) 360 F Individual track data 13 9-Sep-2005 8 13.9 0.486 0.049
14 16-Sep-2005 13 24.8 0.567 0.041
15 21-Sep-2005 14 9.3 0.372 0.075
16 22-Sep-2005 6 11.9 0.568 0.167
17 28-Sep-2005 2 2.6 0.307 0.241
18 2-Oct-2005 24 51.3 0.628 0.037
19 9-Oct-2005 10 13.4 0.387 0.088
20 13-Oct-2005 12 32.2 0.732 0.211
21 21-Oct-2005 12 36.5 0.842 0.333
22 30-Oct-2005 11 29.9 0.796 0.445
23 4-Dec-2005 4 10.1 0.666 0.189
Combined data 110 236.0 0.612
81 khz (GWS-003) 280 F Individual track data 24 14-Nov-2005 13 25.3 0.550 0.027
Combined data 13 25.3 0.550
Data from individual tracks and pooled data for each tracked white shark are included. TL = estimated total length (cm). ROM = meanrate of movement throughout track. Angular concentration (r) is a relative measure of linearity from 0 through to 1 for each track, with1 representing straight line trajectory. Bold: movements that differ significantly from random (P<0.05, Rayleigh’s z-test)
194 Environ Biol Fish (2009) 85:189–200

Tab
le2
Activity
patternsof
trackedwhite
sharks
Activity
Descriptio
nPossiblebehaviou
rfunctio
n(s)
51kh
z%
oftim
e54
khz
%of
time
81kh
z%
oftim
eCom
bined
data
%of
time
nn
nn
SIPatrol
(S.Island
)Meand
eringsw
immingin
waters
adjacent
to(typ
ically
seaw
ard
of)SealIsland
(Fig.1)
Hun
tingCapefurseals
183
8.9
6810
.50
025
110
.0
Travel
1Nearstraight
linesw
immingbetween
Hartenb
osandSealIsland
patrollin
glocalities(Fig.1).
Travelbetweenpatrollin
gsites
205
10.3
6611.9
00
251
10.0
Patrol1
(Hart)
Meand
eringsw
immingin
watersop
posite
Hartenb
osriverandtown(Fig.1)
Hun
tingteleost/elasmob
ranch
prey,resting,
social
1298
73.8
277
44.1
00
1575
62.7
Travel
2Nearstraight
linesw
immingbetweenHartenb
osand
Grootbrak
patrollin
glocalities(Fig.1).
Travelbetweenpatrollin
glocalities
00.0
629.3
00
622.5
Patrol2
(G.brak)
Meand
eringsw
immingin
watersop
posite
Grootbrak
riverandtown(Fig.1)
Hun
tingteleost/elasmob
ranch
prey,resting,
social
984.8
9820
.775
100
308
12.3
Chu
mvessel
Interactingwith
commercial
cage
diving
vessel
(CDV)anchored
atno
rthern
side
ofSealIsland
(Fig.1)
Scaveng
eon
proffered
fish
baits
211.2
131.9
00
341.4
Roa
mCirclingin
generalarea
ofCDV
follo
wingits
departure(Fig.1).
Attemptingto
relocate
chum
ming
vessel
200.9
101.6
00
301.2
Fiveactiv
ities
areconsidered
natural(Travel1,
Travel2,
Patrol1,
Patrol2,
SIPatrol)whilsttheremaining
two(Roam,C
hum
vessel)aredeem
edun
natural,as
they
areinextricably
linkedto
thecommercial
cage
diving
operationin
MosselBay.Fun
ctionrepresentsthepo
ssible
motivation(s)
ofeach
activ
ity.In
additio
n,theprevalence
(‘n’
and‘%
oftim
e’)of
each
activ
ityisillustrated
forsharks
individu
ally
andcombined
Environ Biol Fish (2009) 85:189–200 195
were directionally more random than during otheractivities, but a significant preference for swimmingperpendicular to Seal Island (towards or away from)was calculated (SI patrol χ(0.05, 11)
2 = 37.3, p<0.01)(Fig. 5a).
On 11 occasions (Tracks: 12a–f, 23a–e), sharkspersistently swam at the surface thereby enabling the‘protocol 3’ tracking procedure to be followed.During these tracks, the quotient between mean ISSand mean ROM (sample interval 10 min) was 1.21(n=55, range 1.01–3.19).
Discussions and conclusions
The results in this paper are derived from threeactively tracked sharks, and ten passively monitoredsharks. Whilst the resultant data illustrates pertinenttrends in swimming behaviour of these sharks, thesmall sample size necessitates caution in populationlevel extrapolation. This study’s mean ROM of0.52 m·s−1 is noticeably lower than previous findingsboth from areas adjacent to pinniped colonies(0.64 m·s−1; Goldman and Anderson 1999) andduring open water movements (0.89 m·s−1, Carey etal. 1982; 0.89 m·s−1, Strong et al. 1992; 1.31 m·s−1,Bonfil et al. 2005). However, when assessing ROM inrelation to a shark’s specific behavioural activity theresults display some consistency with previous works.At Mossel Bay, the ROM of sharks patrolling
adjacent to Seal Island was comparable to studieslocated adjacent to pinniped colonies (Goldman andAnderson 1999). It is also of note that whilst ROM isgreater while patrolling Seal Island than at either ofthe two other patrolling localities, swimming linearitywas comparable. This suggests that the sharksincreased their swimming speed whilst patrollingaround Seal Island. This makes biological sense, asincreased swimming speed would increase patrolcoverage, and thus increase the probability ofencountering a traversing pinniped. Alternatively,ROM may be reduced during other activities (Patrol1 and Patrol 2) to conserve energy, particularly ifsharks are not hunting for non-pinniped prey. Klimleyet al. (2001b) reported that most sharks utilized a‘back and forth’ patrol pattern when swimmingadjacent to Año Nuevo Island, whilst Goldman andAnderson (1999) observed both ‘back and forth’ andan ‘on-offshore’ pattern at the Farallon Islands,California. Adjacent to Seal Island, at Mossel Bay,white sharks most frequently used an ‘on-offshore’patrol pattern. Cape fur seals consistently use anarrow pathway when traversing between Seal Islandand offshore feeding grounds (Johnson et al. In prep.).Patrolling in parallel beneath these pathways maymaximize the spatial overlap and increase encounterprobability.
The swimming behaviour of white sharks atcoastal aggregation sites without pinniped presence(Patrol 1 and Patrol 2) has not been reported
0:00
-0:5
9
2:00
-2:5
9
4:00
-4:5
9
6:00
-6:5
9
8:00
-8:5
9
10:0
0-10
:59
12:0
0-12
:59
14:0
0-14
:59
16:0
0-16
:59
18:0
0-18
:59
20:0
0-20
:59
22:0
0-22
:59
Time of day (hours)
0.3
0.4
0.5
0.6
0.7
0.8
0.9
RO
M (
m s
ec-1
) and
LI
= LI= ROM
Night TimeNight Time Day timeFig. 2 Mean ROM(± standard error) and LI(± standard error) of whitesharks grouped hourly.Shaded area representsapproximate period ofdarkness
196 Environ Biol Fish (2009) 85:189–200

previously. This activity pattern was typically definedby low ROM (0.42 m·s−1 and 0.51 m·s−1) and non-linear swimming (LI: 0.69 and 0.81). This pattern wasparticularly evident at Hartenbos, a habitat particularlyused by white sharks during hiatuses between morningand evening patrolling bouts at Seal Island. Suchcharacteristics appear consistent with high degree ofmeandering that could be explained by either restingor aggregating for social purposes. The ROM and LIat the Grootbrak patrolling locality were higher than atHartenbos. Such a pattern may result if, in addition toresting and social purposes, white sharks are attractedto this habitat because of teleost and elasmobranchprey availability, as Grootbrak represents a popularfishing site for kob species (Argyrosomus japonicusand/or A. indorus) (personal obvservations). IncreasedROM and LI may arise if sharks are actively searchingfor this and/or other fish prey. White sharks at bothHartenbos and Grootbrak typically utilized a ‘back andforth’ patrol pattern parallel to the coastline. Adoptionof this pattern may be related to navigational andorientation clues or restricting movements to withinpreferred depth contours.
When our data was restricted to ‘travelling’behaviours (Travel 1, Travel 2), white sharks atMossel Bay displayed similar ROM to the findingsof both the Carey et al. (1982) and Strong et al.(1992), whose subjects’ movements was frequently
characterized by near linear swimming. This indicatesa degree of consistency between widely separatedstudies. The fastest sustained ROM we recorded(1.33 m·s−1) was similar to the previous fastest of1.31 m·s−1, reported by Bonfil et al. (2005). TheseROMs may approximate the top end of white sharks’swimming speed when not actively chasing prey.When examining the ROM of sharks during sustainedtravel, larger sharks (>325 cm TL) appeared to swimquicker than smaller conspecifics, thereby suggestingsustained swimming speed may be a function of bodylength. This may have implications in terms of theability to conduct long distance migrations for the firsttime, such as those observed previously (Boustany etal. 2002; Bonfil et al. 2005; Weng et al. 2007). Inaddition, larger sharks could possess greater navigationand orientation experience, enabling them to movebetween sites quickly. As expected, LI and ROMduring ‘travelling’ behaviour were high. The pattern ofhigh ROM and LI may be explained if the areastraversed represented poor quality habitats that lackedattractive resources for white sharks (e.g. food).Adopting near linear swim patterns offers efficientmovement through such areas, whilst remaining near toshore offers a conspicuous sensory cue for orientationand navigation purposes. Such a pattern is similar tothe ‘island patrolling’ pattern observed by Strong et al.(1992), in which it was hypothesized that subject
Patrolling 1 Travelling 1 SI Patrol Patroling 2 Travelling 2
Shark activity
0.4
0.6
0.8
1.0
RO
M (
m s
ec-1
) an
d LI
= ROM= LI
n = 1482
n = 1226
n = 261
n = 214
n = 243n = 218
n = 301
n = 266
n = 62
n = 58
Fig. 3 Relationshipbetween natural behaviouralactivities (as defined inTable 2) and the mean ROM(± standard error) andswimming linearity LI(± standard error) of themanually tracked whitesharks
Environ Biol Fish (2009) 85:189–200 197

sharks swam in a near linear pattern between islandspotentially hosting pinniped food resources.
Frequently, ROM has been used to elicit informationon a species’ diel activity patterns. As such, constant(whale shark, Rhincodon typus, (Gunn et al. 1999),nocturnal (blue shark, Prionace glauca, Sciarrotta andNelson 1977), diurnal (tiger shark, Galeocerdo cuvier,Tricas et al. 1981) and crepuscular (lemon shark,Negaprion brevirostris, Gruber et al. 1988) patternshave been reported in shark species, although intraspe-cific variation exists (Sundström et al. 2001). Withinthis study, both sharks (GWS-1 and GWS-2) displayedcrepuscular patterns of activity, with ROM greatestduring dawn and dusk. This pattern appears to begenerated by the fact that the ‘Travel 1’ and ‘SIPatrolling’ activities are typically associated with dawnand dusk when white sharks swim to Seal Islandand patrol for traversing pinnipeds. These temporalwindows for patrolling Seal Island may be related toeither optimal environmental conditions for hunting(e.g. light condition favourable for detecting prey) orprey behaviour (e.g. highly abundant and accessible).No multiple day tracks at Grootbrak (Patrol 2) werecarried out during this study. The reported crepusculardiel pattern may differ markedly at Grootbrak wherewhite sharks there are not targeting pinniped prey, butpossibly fish prey.
ROM is occasionally incorrectly thought to repre-sent ISS (Sundström et al. 2001). Reduction inswimming linearity and increasing the sample interval
will cause ROM to increasingly underestimate ISS.As such, differences in published ROM of whitesharks may have been generated in part by differenttracking protocols rather than biological differences inswimming speed. The use of a combination oftechniques has enabled the relationship betweenROM and ISS to be established for three species ofshark. For the lemon shark (Q=1.67) (Sundström etal. 2001) and blue shark (Prionace glauca) (Q=1.08(daytime), 1.56 (night time)) (Sciarrotta and Nelson1977) ISS was up to 50% greater than ROM, whilstthe ISS for the scalloped hammerhead (Sphyrnalewini) was reported as 2.3 (ISS=1.5 km·h−1, ROM=0.66 km·h−1) times higher than its corresponding ROM(Lowe et al. 1998). The present study suggests ISS isin the order of 1.21 times higher than the equivalentROM for white sharks in Mossel Bay. Such a valuesupports the assumption that variations in presentedROM are likely to indicate variation in swimmingspeed and activity, particularly when information onswimming linearity is available. It remains clear,however, that greater consistency in tracking protocols
200 250 300 350 400
Total length (cm)
0.0
0.1
0.2
0.3
0.4
0.5
0.6
0.7
0.8
0.9
RO
M (
m s
ec-1
)
Median 25%-75% n = 239
Fig. 4 ROM of 10 RCODEtagged white sharks swim-ming between the VR2receivers at Hartenbos andGrootbrak against estimatedshark total length
Fig. 5 a–e Combined circular plots of the movement bearingconcentration of three white sharks manually tracked at MosselBay (Fig. 5a: SI Patrol, 5b: Travel 1, 5c: Patrol 1, 5d: Patrol 2,5e: Travel 2). Bearing concentrations are separated by sharkactivity and examined for randomness using χ2 analysis.Individual bearings are pooled into 30’ intervals. Light grayshapes represent position of landmass(s) with respect toapproximate geographic positions
b
198 Environ Biol Fish (2009) 85:189–200

10 20 30 40
120
150
180
210
240
270
300
330
0
30
60
90
e
10 20
120
150
180
210
240
270
300
330
0
30
60
90C
b
10 20
120
150
180
210
240
270
300
330
0
30
60
90
a
10 20
120
150
180
210
240
270
300
330
0
30
60
90
d
10 20
120
150
180
210
240
270
300
330
0
30
60
90
c
Environ Biol Fish (2009) 85:189–200 199

between studies would enable more robust inter- andintra-specific comparisons.
References
Batschelet E (1981) Circular statistics in biology. Academic,London
Bell WJ, Kramer E (1979) Search and anemotactic orientationof cockroaches. J Insect Physiol 25:631–640. doi:10.1016/0022-1910(79)90112-4
Bonfil R, Meyër MA, Scholl MC, Johnson RL, O’Brian S,Oosthuizen WH, Swanson S, Kotze D, Patterson M (2005)Transoceanic migration, spatial dynamics, and populationlinkages of white sharks. Science 310:100–103.doi:10.1126/science.1114898
BoustanyAM,Davis SF, Pyle P, Anderson SD, Le Boeuf BJ, BlockBA (2002) Satellite tagging: expanded niche for white sharks.Nature 412(6867):35–36. doi:10.1038/415035b
Bruce BD, Stevens JD, Malcolm H (2006) Movements andswimming behaviour of white shark (Carcharodoncarcharias) in Australian waters. Mar Biol (Berl)150:161–172. doi:10.1007/s00227-006-0325-1
Carey FG, Kanwisher JW, Brazier O, Gabrielson G, Casey JG,Pratt H (1982) Temperature and activities of a white shark(Carcharodon carcharias). Copeia 2:254–260. doi:10.2307/1444603
Compagno LJV, Marks MA, Fergusson IK (1997) Threatenedfishes of the world—Carcharodon carcharias (Linnaeus,1758) (Lamnidae). Environ Biol Fishes 50:61–62.doi:10.1023/A:1007308406137
Goldman KJ, Anderson S (1999) Space utilisation andswimming depth of white shark (Carcharodon carcharias)at the South Farallon Islands, central California. EnvironBiol Fishes 56:351–364. doi:10.1023/A:1007520931105
Gruber SH, Nelson DR, Morrissey JF (1988) Patterns ofactivity and space utilization of lemon sharks, Negaprionbrevirostris, in a shallow Bahamian lagoon. Bull Mar Sci43(1):61–76
Gunn JS, Stevens JD, Davis TLO, Norman BM (1999)Observation of the short-term movements and behaviourof whale sharks (Rhincodon typus) at Ningaloo Reef,Western Australia. Mar Biol (Berl) 135:553–559. doi:10.1007/s002270050656
Heupel MR, Semmens JM, Hobday AJ (2006) Automatedacoustic tracking of aquatic animals: scales, design anddeployment of listening station arrays. Mar Freshw Res57:1–13. doi:10.1071/MF05091
Hooge PN, Eichenlaub B (2000) Animal movement extension toArcview. ver. 2.0. Alaska Science Center—Biological ScienceOffice, U.S. Geological Survey, Anchorage, AK, USA
Johnson RL (2003) Behavioural ecology of the white shark(Carcharodon carcharias) at Dyer Island, South Africa.MSc Thesis, University of Pretoria, Pretoria, South Africa
Klimley PA, Le Boeuf BJ, Cantara KM, Richert JE, Davis SF,Van Sommeran S (2001a) Radio acoustic positioning toolfor studying site-specific behaviour of white sharks andother large marine species. Mar Biol (Berl) 138:429–446.doi:10.1007/s002270000394
Klimley PA, Le Boeuf BJ, Cantara KM, Richert JE, Davis SF,Van Sommeran S, Kelly JT (2001b) The hunting strategyof white sharks (Carcharodon carcharias) near a sealcolony. Mar Biol (Berl) 138:617–636. doi:10.1007/s002270000489
Kock A, Johnson R (2006) White shark abundance: Not acausative factor in numbers of shark bite incidences. In: NelDC, Peschak TP (eds) Finding a balance: White sharkconservation and recreational safety in inshore waters ofCape Town, South Africa: Proceedings of a specialistworkshop. WWF South Africa report series—2006/Marine/001, pp 1–19
Kock AA, Fallows CG, Griffiths CL (2002) Predatory activityof great white sharks (Carcharodon carcharias) around aCape fur seal colony. BSc Thesis, Percy FitzpatrickInstitute, University of Cape Town, South Africa
Lowe CG, Holland KN, Wolcott TG (1998) A new acoustic tailbeat transmitters for fishes. Fish Res 36:275–283.doi:10.1016/S0165-7836(98)00109-X
Rechisky EL, Wetherbee BM (2003) Short-term movements ofjuvenile and neonate sandbar sharks, Carcharhinusplumbeus, on their nursery grounds in Delaware Bay.Environ Biol Fishes 68:113–128. doi:10.1023/B:EBFI.0000003820.62411.cb
Sciarrotta TC, Nelson DR (1977) Diel behaviour of the blueshark, Prionace glauca, near Santa Catalina Island,California. US Fish Bull 75:519–528
Sundström LF, Gruber SH, Clermont SM, Correia JPS, deMarignac JRC (2001) Review of elasmobranch behav-ioural studies using ultrasonic telemetry with specialreference to the lemon shark, Negaprion brevirostris,around Bimini Islands, Bahamas. Environ Biol Fishes60:225–250. doi:10.1023/A:1007657505099
Strong WR, Murphy RC, Bruce BD, Nelson DR (1992)Movements and associated observations of bait attractedwhite sharks (Carcharodon carcharias): a preliminaryreport. Aust J Mar Freshwater Res 43:13–20. doi:10.1071/MF9920013
Tricas TC, Taylor LR, Naftel G (1981) Diel behaviour of thetiger shark, Galeocerdo cuvier, at French Frigate Shoals,Hawaiian Islands. Copeia 1981:904–908. doi:10.2307/1444199
Voegeli FA, Smale MJ, Webber DM, Andrade A, O’Dor RK(2001) Ultrasonic telemetry, tracking and automatedmonitoring technology for sharks. Environ Biol Fishes60:267–281. doi:10.1023/A:1007682304720
Weng KC, Boustany AM, Pyle P, Anderson SD, Brown A,Block BA (2007) Migration and habitat of white sharks(Carcharodon carcharias) in the eastern Pacific Ocean.Mar Biol (Berl) 152(4):877–894. doi:10.1007/s00227-007-0739-4
200 Environ Biol Fish (2009) 85:189–200
Related Documents