Coastal Observations of Weather Features in Senegal during the AMMA SOP-3 Period. G. Jenkins 1 , P. Kucera 2 , E. Joseph 1 , J. Fuentes 3 , A. Gaye 4 , J. Gerlach 5 , F. Roux 9 , N. Viltard6 , M. Papazzoni 6 , A. Protat 6,7 , D. Bouniol 8 , A. Reynolds 10 , J. Arnault 9 , D. Badiane 4, F. Kebe4, M. Camara 11 , S. Sall 4 Department of Physics and Astronomy, Howard University, Washington DC 2. National Center for Atmospheric Research, Boulder CO 3. Department of Meteorology, The Pennsylvania State University, University Park PA 4. Laboratory for Atmospheric-Oceanic Simeon Fongang (LPAO-SF) Cheikh Anta Diop University, Dakar Senegal 5. NASA Wallops Flight Facility, Wallops, VA 6. LATMOS (Laboratoire Atmospheres, Milieux, Observations Spatiales), Vélizy, France 7. CAWCR (Centre for Australian Weather and Climate Research), Melbourne, Australia 8. GAME/CNRM, CNRS/M6t6o-France, Toulouse, France 9. Laboratoire d’Aérologie, Observatoire Midi-Pyr6n6e, 14 av. Belin, F-31400 Toulouse, France 10. NASA Goddard Space Flight Center, Greenbelt, MD 11. Department of Physics, University of Ziguinchor, Ziguinchor, Senegal Abstract During 15 August through 30 September 2006, ground and aircraft measurements were obtained from a multi-national group of students and scientists in Senegal. Key measurements were aimed at investigating and understanding precipitation processes, thermodynamic and dynamic environmental conditions, cloud, aerosol and microphysical processes and spaceborne sensors (TRMM, CloudSat/Calipso) validation. Ground and

Welcome message from author
This document is posted to help you gain knowledge. Please leave a comment to let me know what you think about it! Share it to your friends and learn new things together.
Transcript

Coastal Observations of Weather Features in Senegal during the AMMA SOP-3 Period.
G. Jenkins 1 , P. Kucera2, E. Joseph1 , J. Fuentes3 , A. Gaye 4 , J. Gerlach 5, F. Roux9, N.
Viltard6, M. Papazzoni6 , A. Protat6,7, D. Bouniol8 , A. Reynolds 10 , J. Arnault9, D.
Badiane4, F. Kebe4, M. Camara 11 , S. Sall4
Department of Physics and Astronomy, Howard University, Washington DC
2. National Center for Atmospheric Research, Boulder CO
3. Department of Meteorology, The Pennsylvania State University, University ParkPA
4. Laboratory for Atmospheric-Oceanic Simeon Fongang (LPAO-SF) Cheikh AntaDiop University, Dakar Senegal
5. NASA Wallops Flight Facility, Wallops, VA6. LATMOS (Laboratoire Atmospheres, Milieux, Observations Spatiales), Vélizy,France7. CAWCR (Centre for Australian Weather and Climate Research), Melbourne,Australia8. GAME/CNRM, CNRS/M6t6o-France, Toulouse, France9. Laboratoire d’Aérologie, Observatoire Midi-Pyr6n6e, 14 av. Belin, F-31400Toulouse, France10. NASA Goddard Space Flight Center, Greenbelt, MD
11. Department of Physics, University of Ziguinchor, Ziguinchor, Senegal
Abstract
During 15 August through 30 September 2006, ground and aircraft measurements were
obtained from a multi-national group of students and scientists in Senegal. Key
measurements were aimed at investigating and understanding precipitation processes,
thermodynamic and dynamic environmental conditions, cloud, aerosol and microphysical
processes and spaceborne sensors (TRMM, CloudSat/Calipso) validation. Ground and

aircraft instruments include: ground based polarimetric radar, disdrometer
measurements, a course and a high-density rain gauge network, surface chemical
measurements, a 10 m flux tower, broadband IR, solar and microwave measurements,
rawinsonde and radiosonde measurements, FA-20 dropsonde, in situ microphysics and
cloud radar measurements. Highlights during SOP3 include ground and aircraft
measurements of squall lines, African Easterly Waves (AEWs), Saharan Air Layer
advances into Senegal, and aircraft measurements of AEWs—including the perturbation
that became Hurricane Isaac.
2

1. Introduction
During NH summer season (JJAS), precipitation events occur on multiple spatial
and temporal scales in West Africa. African Easterly Waves, mesoscale convective
systems (squall lines, mesoscale convective complexes, non-squall tropical clusters) and
local convection generate precipitation at various timescales. AEWs are found on 3-5
day timescales (Burpee, 1975) and MCSs can be associated with AEWs but are often
found to have a diurnal cycle with many MCSs occurring between 1800 and 0600 LST
(Mathon and Laurent, 2000). MCSs are known to contribute to a large fraction of rain
in West Africa (D’Amato and Lebel, 1998). Squall lines can propagate westward across
West Africa, moving faster than AEWs (Fortune, 1980, Gaye et al. 2005). Results from
two field experiments (GATE and COPT-81) during the 1970s and 1980 provide much of
our understanding about MCSs (Houze 1977; Chong et al. 1987; Roux, 1984; Roux,
1988), while more recent studies have focused on satellite-derived properties of MCSs in
West Africa (Laing et al. 1999; Nesbitt et al. 2000; Sealy et al. 2003).
Once AEWs move from continental to oceanic conditions, approximately 10%
can develop into tropical systems (tropical depression, storms or hurricanes). Past
studies have linked Atlantic hurricanes to wet conditions in West Africa but the direct
link or processes remain unclear (Gray and Landsea 1992; Landsea and Gray 1992).
Limited aircraft and ground-based studies have had the opportunity to examine
developing tropical cyclones off the coast of Senegal (Zipser and Gautier, 1977; Sall and
Sauvageot, 2005; Zipser et al. 2009). During the summer of 2006, in concert with the
African Monsoon Multidisciplinary Analysis campaign (Redelsperger et al. 2006),
downstream measurements were undertaken during the Special Observing Period 3, 15

August-30 September 2006. Aircraft and ground measurements were deployed in Cape
Verde for the period of August 15-September 15 (Zipser et al. 2009) and Senegal for the
period of August 15-September 30th. The measurements and highlights from the field
campaign in Senegal are presented in this paper.
The country of Senegal is centered between 12-17N and 11-18 W, a Sahelian
country that is bound to the north by arid conditions and to the south by humid
conditions. Senegal borders the Eastern Atlantic Ocean and there are elevated regions to
the southeast (Fouta Djallon mountains). The coastal location of Senegal provides a
unique setting for ground-base and aircraft measurements to examine: (a) the evolution of
MCS as they transition from continental to maritime environmental conditions; (b)
westward propagating AEWs which could potentially developing into tropical cyclones
over the Eastern Atlantic; (c) SAL intrustions and associated environmental changes.
During the period of August 15-September 30 th, there were approximately 7-9
AEWs, and four (4) of these waves were linked to tropical cyclones (TS-Debby,
Florence, Gordon, Helene). The AEW that was later associated with Hurricane Issac was
passed to the south of Senegal. There were a number of Saharan Air Layer (SAL)
intrusions into Senegal during August and September, which we describe in Section 3.
Finally there were 5 squall lines that entered Senegal during SOP3 (19 August, 31
August, 2 September, 11, September, 22 September).
2. Ground and Aircraft Measurements
During the SOP3 period, operations were conducted from Dakar
(14.73N, 17.5W) and Kawsara (14.66N, 17.10W) Senegal. During the period of 15
4

August -30 September normal 2 times per day radiosoundings were launched from the
airport at Dakar and the French Falcon FA-20 aircraft deployed from Dakar during the
period of 15-30 September, 2006. Kawsara served as the primary observation site
between 19 August – 30 September 2006 (Table 1). However, continuous NPOL radar
and precipitation measurements occurred throughout the SOP3 period. Aerosol Optical
Thickness (AOT) measurements from the Aerosol Robotic Network (AERONET) were
collected from Mbour, Senegal (14.39N, 16.59W). A course and a high-density rain
gauge network (Figures 1a and 1b) were deployed throughout the observation period.
Table 1 gives a breakdown of the ground measurements during the SOP3.
Six (6) hour NCEP Reanalysis and Space-Borne observations from the Tropical
Rainfall Measurement Mission (TRMM) are included in Section 3 for four squall lines
(19 August, 31 August – 1 September and 11 September). Two radiosoundings that are
not available from Dakar Senegal (23 August, 26 August) are replaced by soundings from
Kawsara. 26 September radiosounding from Dakar, Senegal was not available. From 15
August 15- 20 September 2006 the UK ATD Lightning Detection Network, based on
VLF Arrival Time Difference (ATD) principles, which measures cloud-to-ground (CG)
lightning flashes was employed for continental and oceanic lightning measurements
(Keogh et al. 2007).
There were a number of flights by the NASA DC-8 near or over Senegal, but
most flights were directed over the tropical Eastern Atlantic (Zipser et al. 2009). The
FA20 dedicated a number of flights to Senegal and the extreme eastern Atlantic because
of its shorter endurance when compared to the DC-8 and for studies of the modification
of the microphysical properties of convective systems as they transition from inland to

open ocean. The FA20 with its cloud radar, backscatter lidar, in situ cloud microphysics
instruments in combination with the ground-based NPOL polarimetric Doppler radar
provide a unique opportunity of examining aerosol, microphysics, cloud properties and
precipitation. Table 1 provides a description of aircraft measurements during the SOP3.
Thirteen FA20 flights have been conducted with three main scientific objectives:
(1) sample the mesoscale dynamics with dropsondes in order to initialize a mesoscale
model (2) characterize the microphysical and radiative properties of stratiform and
cirriform parts of convective systems inland and over the ocean, as well as the
modulation of the convective activity by the SAL intrusions with the RALI observations,
and 3) produce collocated datasets between RALI and CloudSat / CALIPSO in order to
assess the calibration of these space-borne sensors, only a few months after launch.
Seven flights have been conducted to address the microphysics and A-Train
validation objectives (September 18, 20, 21, 22, 26 morning, 26 afternoon, and 27), and
one flight was dedicated to the characterization of the SAL by the RALI / LNG lidar (29
September). Four of these flights include a flight segment below the A-Train swath, four
flights have been performed over the ocean and three over land or at the transition
between land and ocean. One flight was dedicated to an accurate calibration of the
RALI/RASTA cloud radar instrument (28 September). Highlights of results obtained
with this dataset are given in section III-c.
Four AEWs (the so-called Perturbations A, B, C, and D) have been observed with
dropsondes released from the SAFIRE (Service des Avions Frangais Instrument6s pour la
Recherche en Environnement) / FA20 aircraft on 16, 18-19, 23 and 25, 26, 27 September
6

2006, respectively. Dropsonde data related to Perturbation D have been analysed in
Arnault and Roux (2009) so we only focus here on the first three observed perturbations.
Eight (8) to 12 dropsondes were launched during each of the four flights of SOP-3
Phase III in order to document the mesoscale characteristics of Perturbations A, B and C.
The dropsonde sampling covered horizontal domains of approximately 500 km x 500 km
with a distance of about 150 km between each sonde (see Figs. 19, 21 and 23 for the
location of dropsonde samplings). More precisely: 8 successful dropsondes were
launched during flight 67 between 14:52 UTC and 16:42 UTC on 16 September; 10
during flight 68 between 14:44 UTC and 16:46 UTC on 18 September; 12 during flight
69 between 11:11 UTC and 13:12 UTC on 19 September; 9 during flight 73 between
11:18 UTC and 13:18 UTC on 23 September.
The dropsonde data allowed us to deduce three-dimensional fields of wind
components, temperature and humidity using the technique developed by Moine (2001).
Vertical cross-sections of these composite fields are discussed in parallel with ECMWF
(European Centre for Medium-range Weather Forecast) analyzed heights and winds at
pressure levels 300, 700 1000 hPa, and Meteosat-9 images in the water vapour channel at
7.3 µm (Figs. 19, 21 and 23), in order to document the synoptic and convective
environment of Perturbations A, B and C.
3. Results
In this section, we summarize important features for the three 15 day periods: 15-31
August, 1-15 September and 16-30 September. Figure 1c shows the accumulated daily
rain for the rain gauge located near the NPOL radar at Kawsara. The heaviest rain event
occurred on Julian day 250 (7 September) with the passage of and AEW. Moderate
7

precipitation fell on Julian day 231 with the passage of a squall line, which produced a
significant region of stratiform rain that fell for a long duration.
a.) SOP3 Phase 1 (August 15-August 31 st )
i. AEW and SAL intrusions
Figure 2a-f show NCEP reanalysis and radiosondes from Dakar Senegal for 15-31
August 2006. The NCEP meridional wind (Figure 1a) show three AEWs passing Dakar
during this 15-day period with the trough axis denoted by the letter T. The wave passage
on 21 August was associated with the formation of Tropical Depression (later TS Debby)
whose northern rain-band passed Dakar, Senegal (Jenkins et al. 2008). Strong winds
between 700-500 hPa are found at Dakar from the reanalysis and observed data at Dakar
(Figures 2b, 2c). Strong zonal winds are found on 24 August and 30-31 August from the
Dakar sounding. The NCEP reanalysis specific humidity shows several periods of dry
intrusions (Figure 2d), which are associated with northerly winds on 18, 21 and 24
August (Figure 2a). The radiosounding data from Dakar also confirms these as low
relative humidity days (Figure 2e) with warm temperature perturbations located near 850
hPa during these time periods (Figure 2f). Aerosol Optical Thickness (AOT) from
Mbour Senegal also show peaks on 18, 20 and 24 August (Figure 3). Although high
AOT values are found on 28 August, there is no evidence of a SAL event based on a
relatively moist sounding at Dakar.
ii. Observed Squall lines
8

There were two squall lines on 19 and 31 August that propagated into Senegal.
Ground-based observations from Kawsara were not available for the 19 August squall
line, but TRMM overpasses were available along with synoptic and upper air
observations from Dakar. The squall line that entered Senegal had its origins in Western
Niger on the morning of 18 August, propagated westward into Mali and entered Senegal
by 1200 UTC 19 August (Figures 4a, b). METEOSAT derived cloud top temperatures
warmed as the system entered into Senegal but cooled with increased lightning
concentrated as the squall line approached the coastline (Figures 4c, d). The SAL
outbreak which occurred on August 18 was still evident from the 1200 UTC 19 August
and 0000 UTC 20 August sounding at Dakar (not shown), suggesting that the increase in
lightning and colder cloud tops may indicate some convective cloud invigoration through
dust/cloud microphysics interactions (Jenkins et al. 2008).
A TRMM precipitation radar (PR) overpass of this squall line as it entered into
Senegal at 1147 UTC 19 August shows a north-south band of high reflectivity with the
convective core showing > 35 dBZ values below 5 km followed by a stratiform rain
region (Figures 5a, 5b). Strong northeasterly winds found above 800 hPa are found prior
to the squall line arriving at Dakar but shift to Southwest following the squall line
passage from the surface through 500 hPa (Figures 5c,d).
A second squall line that originated in Central Mauritania late on 30 August
propagated towards the Southwest crossing into Senegal at approximately 0400 UTC, 31
August (not shown). The Squall line was associated with a fast moving jet streak at 700-
600 hPa in southern Mauritania with strong convection entering Senegal at 0600 UTC
(Figure 6a). The squall line crossed Kawsara at approximately 0800 UTC with areas of

lightning concentrated along the path of the squall line and near the coastline (Figures 6
b, c, d). Evidence of a low latitude trough is seen to the southeast of Senegal.
A TRMM overpass of the Squall line at 0535 UTC shows a leading band of
convection that is oriented from NW to SE and maximum reflectivity values of 40-45
dBZ (Figure 7a). A vertical cross-section at 15.1N shows a leading edge convective
tower that reached above 10 km, with an area of trailing stratiform rain (Figure 7b).
Vertical profiles of wind at Kawsara at 0000 UTC and 1152 UTC show an increase in
wind speed in the lower (surface – 850 hpa) and mid troposphere (700-500 hPa) and a
shift in winds with a southerly component to a northerly component (Figures 7c, d).
0800 UTC NPOL radar analysis of the squall line at 4 km altitude also show the
leading band of convection with dBZ values in the range of 40-50 dBZ, similar to the
TRMM estimates (Figure 8a). The leading convective cell is confined to altitudes
somewhat less than the TRMM PR (10 km) and is consistent with warming cloud top
temperatures as the squall line moves southwestward. The trailing stratiform rain is
found to extend more than 80 km behind the leading line (Figure 8b) Flux tower
measurements at Kawsara show significant changes in near surface values at
approximately 8 AM, consistent with the time of the NPOL estimates. A 1.5 hPa
increase in surface pressure, a 3C reduction in temperature, a 7 m/s increase in wind
speeds and a sharp shift in wind directions from 320 to 70 is noted with the passage of
the squall line (Figures 8c, d)
b.) SOP3 Phase II (Sept 1-Sept 15)
10

i. AEW and SAL intrusions
Figure 9a-f show NCEP reanalysis and radiosondes from Dakar Senegal for 1- 15
September 2006. The NCEP meridional wind (Figure 9a) show three AEWs passing
Dakar during this 15 day period. The wave passage on 2 September was associated with
the disturbance that later formed into Hurricane Gordon. The wave passage on 11/12
September was associated with the formation of Tropical Depression 8 (later Hurricane
Helene). Strong winds between 700-500 hPa are found at Dakar from the reanalysis and
observed data at Dakar at the beginning of the month and in the Sept 11-12 period
(Figures 9b, 9c). Strong winds are also found at Dakar from the sounding data on
September 8 with the passage of a non-developing AEW. The NCEP reanalysis specific
humidity show several periods of dry intrusions (Figure 9d) which are associated with
northerly winds on 4-6, 11 September (Figure 9b). The radiosounding data from Dakar
also confirms these as low relative humidity days (Figure 9e) with warm temperature
perturbations located near 850 hPa during these time periods (Figure 2f). Elevated
Aerosol Optical Thickness (AOT) values from Mbour, Senegal are found on 4 and 10
September (Figure 3b).
ii. Observed Squall lines
There were two squall lines on 2 and 11 September that moved into Senegal and
were linked to AEWs. The squall line that moved Senegal on 1 September developed in
association with an AEW over Burkina Faso, developed MCC-like features and moved
into Western Mali, where it took on squall line characteristics. At approximately 1800
UTC the squall line entered Senegal with cloud top temperatures less than 200K as it
11

approached the coastline (Figures 1 0a-c). Numerous lightning strikes are found during
the evening of 1 September and early morning hours of 2 September (Figure 1 0d).
TRMM PR observations at 1858 UTC 1 September show a north-south
convective band with maximum reflectivity values o5 35 dBz (Figure 1 1a). A convective
core near 14.1N shows the deep convective core confined to 5 km altitude with trailing
stratiform rain (Figure 1 1b). Wind speeds increased below 700 hPa after the Squall line
passage but were reduced near 500 hPa (Figure 1 1c) The winds were northeasterly above
800 hPa just prior (0000 UTC 2 September) to the squall line passage with a southerly
component afterwards (Figure 11 d).
NPOL radar data at 4 km altitude show a strong line of convection that is oriented
north-south with maximum reflectivity values greater than 45 dBZ (Figure 12a). The
vertical cross section shows strong convection extending to altitudes greater than 10 km
with an area of trailing stratiform rain (Figure 12b). A 1.5 hPa increase in surface
pressure and a 2-3 C decrease in temperature occur with the passage of the squall line at
approximately 0100 UTC, consistent with conceptual models and observations of MCS
passage (Houze, 1977). A 4 m-s- 1 increase in wind speed is noted near the time of
passage with a shift to easterly winds after the passage of the squall line (Figures 12 c, d).
A squall line on 11 September was generated in response to a strong westward
moving AEW that developed into Tropical Depression 8 on 12 September. The squall
line first appeared on at 0200 UTC 11 September and cloud top temperatures continued
to cool during the early morning hours (Figures 13 a, b). By 1000 UTC the squall line
was separated into two parts, with the southern part of the squall lines reaching the
coastline at approximately 1000 UTC (Figures 13c). Lightning was concentrated in
12

eastern Senegal with the 0600 UTC streamlines showing a vortex near the Guinea border
(Figure 13d).
1000 UTC NPOL radar data at 4 km altitude examining the southern portion of
the squall line shows 35-45 dBZ values with this squall line (Figure 14a). The convective
core was confined to altitudes lower than 5 km (Figure 14b). While only a trace of
precipitation fell at Kawsara at approximately 1300 UTC, an increase in surface pressure
and wind speeds, a decrease surface temperature, a shift in wind direction are noted
primarily between 1000 and 1300 UTC). Smith et al. (2009) provide a detailed analysis
of the 11 September Squall line.
iii. TRMMMicrophysical Characteristics of Observed Squall lines
The TRMM Microwave Imager (TMI) provides indications of cloud properties
such as liquid and ice cloud water, precipitation mass associated with falling hydrometers
(rain and ice) and latent heat release. Figure 15 shows the precipitation mass for rain and
ice for the three squall lines where overpasses were available: 19, 31 August and 1
September 2006. The squall line of 19 August moved into dry air similar to the 11
September 11 squall line. This is reflected in the small precipitation mass found for
liquid water (Figure 15a) on 19 August when compared to the 31 August and 1
September squall lines where liquid water is found in amounts greater than 1 g/m 3
(Figures 15b, 15c). The latter squall lines had colder cloud tops and produced greater
amounts of lightning during their passage.
A number of studies have shown that West African MCSs have large quantities of
ice as determined by 85 GHz polarized corrected temperatures (PCT) (Mohr and Zipser,
13

1996) along with significant amounts of lightning. Figures 15d-f show only modest
amounts of ice mass above 6 km in the 19 August Squall line, but the squall lines on 31
August and 1 September show large ice mass in the upper troposphere. This is consistent
with PCT values which are 170-190K for the 19 August Squall Line but are less than
130K for both 31 August and 1-2 September squall lines (not shown). Larger
precipitation masses (ice and liquid) are also consistent with much larger latent heat
release values on 31 August and 1-2 September (Not shown).
c.) SOP3 Phase III (Sept 16-Sept 30) and the FF-20 Aircraft missions
i. AEW and SAL intrusions
Figure 16a-f show NCEP reanalysis and radiosondes from Dakar Senegal for 16-
30 September 2006. Meridional winds show approximately 3 AEW on 16, 19 and 26
September with the AEW on 19 September being associated with Hurricane Isaac (Figure
16 b). There is evidence of an AEW on September 23 (Perturbation C) in the lower
troposphere, which was sampled by the FA20 and discussed below. Strong zonal winds
are found at mid levels during the period of 17 September and 27-30 September in the
NCEP reanalysis. The sounding data from Dakar shows a mid-level jet maximum on 19
September with a secondary low and mid level wind maximum during the period of 27-
30 September (Figure 16c). Dry air in the NCEP reanalysis is found during the time
periods of 17 , 21-23 and 27-30 September. This likely represents the retreat of the
monsoon and end of the wet season as indicated by the lack of accumulated rain (Figure
1c), especially after Julian day 261 (18 September). Radiosounding data from Dakar
shows the highest relative humidity confined to less than 850 hPa for most of the period
14

except near 26 September (Figure 16 f). Warm anomalies are found on 19, 22 September
and 27-30 September (Figure 16 f).
ii. FA/20 and September 22 Squall lines
On 22 September 2006 a mature storm, originating from the merging of less-
organised small scale convective cells in the early morning of 22 September 2006 at the
Malian-Guinean frontier, reached the Kawsara region at approximately 1330 UTC,
(Figure 17a). Its northern edge was sampled by the NPOL radar. An active line of
precipitation may be observed at the leading edge of the system (Figure 17a) even if the
larger convective activity (based on MSG colder brightness temperature) seems to be
located more to the south. This system continued to propagate south-westward during the
afternoon and dissipated rapidly as it reached the ocean. This system was of particular
interest for the CloudSat validation since an A-Train overpass occurred at 1430 UTC
(Figure 17e). This event was also the purpose of a Falcon 20 flight (between 1415 and
1630 UTC) with a very good (spatial and temporal) co-location of the measurements
along the spaceborne track. The simultaneous sampling in this deep precipitation system
highlights the occurrence of multiple scattering in the spaceborne radar beam in the
presence of strong attenuation (Bouniol et al. 2008). The amount of multiple scattering
contamination has been estimated as large as 4 dB (+/- 2 dB) in this particular case and
needs therefore to be corrected if quantitative use of the CloudSat radar reflectivity is to
be made in these strong convective systems (ongoing work). The comparison of Figure
17d and e shows that the RASTA measurements during the AMMA campaign were
lacking sensitivity, which hampered their use for the characterization of the thinnest
West-African anvils.
15

In addition to the CloudSat overpass , the cross-track organisation of the
convective system was also sampled by RASTA (Figure 17d). In addition to A-Train
product evaluation, another objective of the Falcon-20 missions was also to obtain a
characterization of the microphysical and radiative properties as the convective systems
reached the coastal environment. By making use of simultaneous radar and in-situ probes
measurements onboard the Falcon 20 aircraft, Bouniol et al. (2009) retrieved mean
properties in the various region s of this particular MCS. For each particular region a
“most representative” density-diameter relationship (expressed as a power-law
relationship between ice hydrometeor density and maximum diameter) was proposed.
This case was sampled at a nearly constant altitude (about 8 km altitude), but a rather
large variability in the retrieved density –diameter relationship was found with denser
hydrometeors in the thicker regions sampled (close to graupel density of Locatelly and
Hobbs, 1974)) and less dense hydrometers at the edges (southernmost and easternmost
regions presenting lower reflectivity values in the Figure 17d), as expected. The
variability of the particle size distribution has also been studied in Bouniol et al. (2009).
For this particular case, it has been found that in the central portions of convective
systems the particle size distribution was well approximated by an exponential function,
while a larger slope was observed for the edges of the convective system.
The RASTA observations collected during AMMA SOP3 have also been
considered as a whole in order to characterize the statistical microphysical and radiative
properties of the stratiform anvils generated by the deep convective activity in the
Senegal region (land and ocean). One objective was to determine potential variability of
these properties over land and ocean. Therefore, from the five Doppler measurements of
the RASTA radar, the vertical wind component, w, was first separated from the terminal
fall velocity of the ice hydrometeors VF . Vertical profiles of the sum of these two
contributions have been retrieved in a first step using a variational technique similar to
that described in Protat and Zawadzki (1999), but adapted to the geometry of
16

observations of RASTA. Then the so-called V F- Z approach (Protat et al. 2003, Delano‘ et
al. 2007) has bee n used to separate the two contributions. For all microphysical flights,
the RASTA radar reflectivity and a temperature profile have also been used to retrieve
the ice water content IWC (using the relationship recently proposed by Matrosov and
Heymsfield 2008 for the ice part of convective systems), and the visible extinction a
(using the Heymsfield et al. 2005 relationship), from which the effective radius, which is
proportional to the ratio of IWC to , has been obtained.
A highlight of the main results is provided in Figs. 18, 19, and 20. First, a single
VF- Z relationship has been worked out using all the Dakar flights (Fig. 18). From this
figure, which displays the sum (V F+w) as a function of 95 GHz radar reflectivity, a large
(expected) spread around the fitted curve is obtained. In the V F -Z approach this spread is
attributed to the contribution from the vertical wind speed (see Protat et al. 2003), which
therefore indicates that vertical wind speed s are roughly within the range +/-2 m-s -1 to in
these West-African stratiform anvils. As also shown by the fitted curve in Fig. 18, the
terminal fall velocities range from 0.4 ms -1 for the smallest reflectivities (and therefore
the smaller ice particles, presumably pristine ice crystals) to 1.7 ms -1 for the largest radar
reflectivities (presumably corresponding to the ice aggregates formed when particles fall
within the anvil and start aggregating with others in a warmer environment). These values
are what is generally expected for ice hydrometeors (Mitchell, 1996).
The statistical , dynamical and microphysical properties of the anvils sampled
during AMMA SOP3 over Dakar have also been derived from a composite of all the
Falcon 20 flights. A highlight of these statistical properties of West-African anvils is
given in Fig. 19 as a mean vertical profile of terminal fall velocity, vertical wind
component, ice water content, visible extinction, and effective radius. From this figure
several interesting features appear. First in terms of mesoscale dynamics (Fig. 19a), the
RASTA observations do confirm the earlier findings from GATE and COPT-81 that the
ice part of stratiform anvils is generally characterized by a slow ascending vertical
17

motion (e.g., Chong et al. 1987), with an order of magnitude of 10-20 cms -1 , peaking at 8-
8.5 km altitude. This is in good agreement with the anvil observations from GATE and
COPT-81 (e.g., Chong et al. 1987; Gamache and Houze 1982). However, we find that
mesoscale downward motions dominate in average above 8.5 km altitude, with peak
values of about -40 cms 1 , which is an unexpected feature not documented in earlier
studies. This feature clearly requires further investigations. The vertical profile of
terminal fall velocity is characterized by a very small trend with height, with values of
about -0.9 ms-1 . It must be recalled however that the air density decreases exponentially s
with height, therefore this constant vertical profile can be interpreted as much smaller
particles at higher heights than at lower heights, which is expected in stratiform anvils
due to aggregation processes. These suggestions are consistent with the respective
vertical shapes of the IWC (Fig. 19c), visible extinction (Fig. 19d), and effective radius
(Fig. 19e) profiles. The largest vertical variation observed is for the effective radius, with
mean values increasing from 40 mm at 13 km to 110 mm at 6 km, just above the melting
layer (around 5 km) indicating that aggregation is a dominant mechanism, as expected.
Consistent with this result is the slight increase in visible extinction, which is very
sensitive to the particle concentration by definition. This vertical variation of the effective
radius and extinction is in very good agreement with that found using ground-based
radar-lidar observations over Niamey, Niger, and Darwin, Australia (Protat et al. 2009),
although the absolute values are much larger, which is expected since the dataset used in
Protat et al. (2009) primarily consists of non-precipitating anvils and cirrus clouds
generated by the deep convective activity. However, aggregation of ice particles is not
the only microphysical process active because ice water content was also observed to
increase with temperature (or decreasing with height), probably reflecting the growth of
ice crystals by water vapour deposition as the ice crystals fall within the anvil.
This statistical characterization of the microphysical and radiative properties of
stratiform anvils offers the unique opportunity to derive statistical relationships between
18

these bulk microphysical properties specifically tailored for West-African squall line
anvils. These statistical relationships can be used either as a validation tool for different
types of models or as direct statistical parameterizations in these models. For instance, a
model in which ice water content is held as a prognostic variable could use the V F- IWC
relationship proposed in the present work in order to diagnose at each time step the ice
hydrometeor fall speed. Among the different statistical relationships, this V F- IWC
relationship has been extensively studied with observations in order to provide
observational constraints to ice cloud and precipitating ice fall speeds in global
circulation models (e.g., Heymsfield and Donner, 1990; Rotstayn, 1997, Morrison and
Gettelman, 2008). As highlighted recently in Sanderson et al. (2008), this fall spe ed
parameter is one of the two producing most uncertainties in climate projections, and as
discussed in Deng and Mace (2008), the fall speed parameterization as a function of ice
water content appears to be still very different from one model to another. Such a
statistical relationship derived from our cloud radar observations of West-African
stratiform regions of squall lines is given in Fig. 20. A non-linear regression provides the
following relationship:
VF = 0.894 IWC 0.269
with VF in ms-1 , and IWC in gm-' . For the sake of comparisons, two widely-used fall
speed parameterizations from Rotstayn (1997) and Morrison and Gettelman (2008) are
also displayed. From this figure, it appears clearly that the parameterization derived from
our observations produce fall speeds which agree fairly well with the formulation of
Rotstayn (1997) for the largest IWCs but not for IWCs smaller than 0.' gm -' . In contrast,
the Morrison and Gettelman (2008) parameterization agrees reasonably well with the fall
speeds corresponding to these IWCs smaller than 0.' gm -' , but produces significant
underestimations of fall speeds associated with the largest IWCs, which as discussed in
19

Sanderson et al. (2008) probably has a very large impact on climate projections derived
from the GCMs using this parameterization. This large underestimation of fall speeds
associated with large IWC values is fairly consistent with the findings of Deng and Mace
(2008), who showed that this Morrison and Gettelman (2008) fall speed parameterization
was in fact more appropriate for cirrus clouds, since it agrees closely with the latest
parameterization of cirrus fall speeds from Deng and Mace (2008).
iii. Dropsonde measurements ofPerturbations A, B, C during SOP3 Phase III
Perturbation A
On 16 September morning, the so-called Perturbation A was associated with a
closed cyclonic circulation in the low to mid-levels and deep convection off the West
African coast (Fig 19). However, during the afternoon, a mid-latitude trough was
approaching the region of Cape Verde Islands from northwest (Fig. 19h and i) while the
mid-level anticyclonic circulation of the AEW ridge east of Perturbation A was
increasing (Fig. 19e and f). The increased southeasterly flow east of Perturbation A
sheared its mid-level cyclonic circulation. The convective activity dissipated while
moving northward on 16 September evening and Perturbation A failed to further develop.
A composite vertical cross section from dropsonde data on 16 September (Fig.
20) confirms that Perturbation A was associated with cyclonic vorticity (up to +6 10 -5 s-1)
and relatively moist air (relative humidity > 90 %) from the surface up to 9 km, west of
19º W. Fig. 20 also reveals the adverse influence of relatively dry (relative humidity < 70
%) and anticyclonic (up to -2 10-5 s-1 ) air at mid level from the west. This observation
suggests the intensification of the AEW ridge east of Perturbation A was related to dry
anticyclonic Saharan air, probably in relation with the dynamics of the Saharan heat low.
20

This dry air could also explain the weakening convective activity on 16 September
afternoon (Fig. 19l). The southerly flow in the mid and upper levels, which sheared the
cyclonic circulation of Perturbation A, is also visible in Fig. 20.
Perturbation B
The so-called Perturbation B was associated with a low-level closed vortex which
crossed the Mauritanian coast (between 15 and 20° N) on 18 September afternoon, a
weak mid-level cyclonic circulation further south (10 - 15° N), and weak convective
activity off the West African coast (Fig. 21). The low and mid-level cyclonic circulations
merged during the night of 19 to 20 September, in association with disorganized
convection. A remarkable characteristic of Perturbation B is that it remained weakly
active while moving westward, until it developed after the passage of a mid-latitude
trough and spawned Hurricane Isaac on 27 September near (26° N, 53° W).
Composite vertical cross-sections from the dropsonde data of 18 and 19
September show a substantial moistening of the atmosphere between the surface and 6
km, with relative humidity increasing from 60 to 80 % (Fig. 22). On 18 September, the
system was associated with cyclonic vorticity (up to +4 10 -5 s-1 ) between 3 and 8 km and
anticyclonic vorticity (up to -8 10-5 s -1 ) below 3 km, as the dropsonde sampling was done
south of the northern low-level vortex (Fig. 21). This is a typical signature of an AEW
trough with maximum intensity at mid-level. On 19 September, low level vorticity was
less anticyclonic (up to -2 10 -5 s-1 ), which corresponds to a more favourable environment
for cyclogenesis. However the lack of convective development prohibited any further
evolution.
Perturbation C
21

0n 23 and 24 September, the so-called Perturbation C was off the West African
coast and was associated with a weak low to mid-level cyclonic circulation, anticyclonic
conditions in the upper levels and weak convective activity (Fig. 23). This system failed
to further develop. A composite vertical cross-section from the dropsonde data shows that
Perturbation C was embedded in a relatively dry (relative humidity < 80 %) and weakly
anticyclonic (up to - 2 10 -5 s-1 ) air on 23 September between 1 and 4 km (Fig. 24). The
presence of this dry air in the low levels certainly limited the convective activity observed
by Meteosat-9 at that time. The flow was however weakly cyclonic between 4 and 9 km
(up to 2 10-5 s-1 ), as the dropsonde sampling was done south enough not to be influenced
by the northern upper-level anticyclonic flow.
4. Summary and Discussion
During the period of 18 August and 30 September, ground based and aircraft
measurements were conducted in Senegal as part of the AMMA SOP3 observing period.
During this period our observations show:
• Ten (10) Easterly waves passing over or south of Senegal
• 7-8 SAL intrusions into Senegal
• 5 Squall lines
AEW passage through Senegal on 20 August, 02, 11 and, 19 September was
associated with downstream developing tropical cyclones. Flux Tower measurements
from Kawsara on 31 August and 02 August show significant surface observation changes
with the passage of these systems. TRMM overpasses along with ground based lightning
measurements suggest much stronger squall lines compared with 19 August, 11 and 22
22

September. In the latter three cases, SAL intrusions produced hostile environmental
conditions with stable, dry vertical profiles.
FA20 aircraft measurements included Calipso/Cloudsat validation and provide a
direct measurement of meso-scale ascent and descent during the 22 September Squall
line. Dropsondes from the FA20 confirm cyclonic vorticity at mid-levels in perturbations
A, B and C and identified the role of upper level features (troughs and ridges) in the non-
development of perturbation A. Upper level circulations also played a role in the non-
development case of perturbation D (Arnault and Roux, 2009).
This field campaign is the first large-scale experiment in coastal zones since the
GATE field campaign of 1974. Additional measurements are required for understanding
the interactions between the SAL, AEWs and MCSs (particularly squall lines). The
potential hazards from MCSs or strong convection with AEWs need to be measured and
monitored for welfare of vulnerable populations in West Africa. Moreover, because a
large fraction of Atlantic hurricanes evolve from AEWs, which may threaten US, Central
American or Caribbean communities, it is critical to maintain and increase West African
observations that are used for better numerical weather model initialization. This field
campaign also provided a unique opportunity for students in Senegal and the United
States to help advance scientific knowledge (Smith et al. 2009) and future opportunities
should be encouraged (Jenkins et al. 2009).
Acknowledgement
We are thank US and Senegalese students Nyasha George, Deanne Grant, Marcia
DeLonge, Aaron Pratt, Stephen Chan, Daniel Robertson, Segayle Walford, Tamara
Battle, Christopher Foltz, Aaron Pratt, Andrew Newmann , Samo Diatta, Thioro Fall for
23

their extraordinary efforts during SOP3. We also thank D. Tanre for use of the Mbour
AERONET data. This work was funded by NASA Grant # NNX06AC78G.
References
Arnault, J., F. Roux, 2009: Failed cyclogenetic evolution of a West African monsoon
perturbation observed during AMMA SOP-3, to be submitted to J. Atmos. Sci.
Burpee, R. W., 1975 : Some features of synoptic-scale waves based on compositing
analysis of GATE data. Mon. Weather Rev., 103, 921-925.
Chong, M, P., P. Amayenc, G. Scialom, J Testud, 1987: A Tropical Squall Line Observed
during the COPT-81 Experiment in West Afirca. Part 1: Kinematic Structure Inferred
from Dual Doppler Radar Data, MWR, 115, 670-694.
D’Amato, N. and T. Lebel, 1998: On the characteristics of the rainfall events in the Sahel
with a view to the analysis of climatic variability, Int. J. Climatol., 18, 955-974.
Deng, M., and G. G.Mace, 2008: Cirrus cloud microphysical properties and air motion
statistics using cloud radar Doppler moments: Water content, particle size, and
sedimentation relationships. Geophys. Res. Letters, VOL. 35, L17808,
doi:10.1029/2008GL03 5054.
Fortune, M., 1980 M. Fortune (1980) Properties of African squall lines inferred from time
lapse satellite imagery. Monthly Weather Review, 108, 153-168
Gaye A. T., A. Viltard, P. de Felice, 1995: Squall lines and rainfall over West Africa
during summer 1986 and 87, Meteor. and Atmos. Physics, 90, 215-224.
Gray, W. M. and C. Landsea, 1992: African Ranfall as a precursor of hurricane-related
destruction on the U.S. east coast, BAMS, 73, 1352-1364.
Heymsfield, A. J., and L. J. Donner (1990), A scheme for parameterizing ice-cloud water
content in general circulation models, J. Atmos. Sci., 47, 1865–1877.
Houze, R. A, 1977: Structure and Dynamics of a Tropical Squall-Line System, MWR,
105, 1540-1567.
Jenkins, G.S., A. Pratt, A. Heymsfield, 2008: Possible linkages between Saharan dust and
Tropical Cyclone Rain Band Invigoration in Eastern Atlantic during NAMMA-06, ,
doi:10.1029/2008GL034072, GRL.
24

Jenkins, G. S. and A. T. Gaye, 2009:
Kalnay, E. M. Kanamitsu, R. Kistler, W. Collins, and al.,1996 : The NCEP/NCAR 40
year reanalysis project. Bull. Amer. Meteor. Soc., 77, 437-471.
Keogh, S. J., E. Hibbett, J. Nash, J. Eyre, 2007: The Met Office Arrival Time Difference
(ATD) system for thunderstorm detection and lightning location. Forecasting
Research Technical Report No. 488.
Laing, A.G. and J. M. Fritsch, A. J. Negri, Contribution of Mesoscale Convective
Complexes to Rainfall in Sahelian Africa: Estimates from Geostationary Infrared and
Passive Microwave Data, J. Applied Meteorology, 38, 957-964, 1999.
Landsea C., and W. Gray, The strong association between the Western Sahelian Monsoon
Rainfall and Intense Atlantic Hurricanes, J. Climate 5, 435-453, 1992.
Mathon V. and H. Laurent, Life cycle of Sahelian mesoscale convective cloud systems,
Q. J. R. Meteorol. Soc., 127, 377-406, 2001.
Mohr, K. I., and E. J. Zipser, Defining mesoscale convective systems by the 85-GHz ice
scattering signatures, BAMS, 77, 1179-1188, 1996.
Moine, M.-P., 2001: Structure et evolution à m6so6chelle de perturbations cycloniques de
l’Atlantique Nord pendant FASTEX. These de l’Université Paul Sabatier – Toulouse
III (France).
Morrison, H., and A. Gettelman (2008), A new two-moment bulk stratiform cloud
microphysical scheme in the Community Atmosphere Model (CAM3), part I:
Description and numerical tests, J. Clim.,21, 3642 -3659.
Nesbitt, S. W.,,and E. J.. Zipser and D. J. Cecil. 2000: A Census of Precipitation Features
in the Tropics Using TRMM: Radar, Ice Scattering, and Lightning Observations.
Journal of Climate: 13, 4087–4106.
Protat, A., J. Delanoe, A. Plana-Fattori, P. T. May, and E. O'Connor: The statistical
properties of tropical ice clouds generated by the West-African and Australian
monsoons from ground-based radar-lidar observations. Quart. J. Roy. Meteor. Soc..
Accepted.
Redelsperger, J-L. et al. (2006), African Monsoon Multidisciplinary Analysis: An
International Research Project and Field Campaign, BAMS, 87, 1739-1746.
25

Rotstayn, L. D. (1997), A physically based scheme for the treatment of stratiform clouds
and precipitation in large-scale models. I: Description and evaluation of the
microphysical processes, Q. J. R. Meteorol. Soc., 123, 1227– 1282.
Roux, F., J. Testud, M. Payen, B. Pinty, 1984: West African Squall-Line Thermodynamic
Structure Retrieved from Dual-Doppler Radar Observations, JAS, 41, 3104-3121.
Roux, F., 1988: The West African Squall Line Observed on 23 June 1981 during COPT
81: Kinematics and Thermodynamics of the Convective Region, JAS, 45, 406-426.
Sall, S. M, and H. Sauvageot, 2005: Cyclogenesis of the African Coast: The Case of
Cindy in August 1999, MWR, 133, 2803-2813.
Sanderson, B. M., C. Piani, W. J. Ingram, D. A. Stone, and M. R. Allen (2008), Towards
constraining climate sensitivity by linear analysis of feedback patterns in thousands
of perturbed-physics GCM simulations, Clim. Dyn., 30, 175–190.
Sealy, A, G. S. Jenkins and S. C. Walford 2003: Seasonal/regional comparisons of rain
rates and rain characteristics in West Africa using TRMM observations, JGR,
108, DOI 10. 1029/2002JD002667.
Smith, J. W., et al. 2009: Linkages between an 11 September 2006 West African Squall
Line and Saharan Air Layer Outbreak during NAMMA-06, manuscript in
Preparation for JAS.
Zipser E. J., and C. Gautier, 1978: Mesoscale Events with a GATE Tropical depression,
MWR, 106,789-805.
Zipser E. J, Twohy CH, Tsay SC, Thornhill KL, Tanelli S, et al. (2009) The Saharan Air
Layer and the Fate of African Easterly Waves NASA's AMMA 2006 Field
Program to Study Tropical Cyclogenesis: NAMMA. Bulletin of the American
Meteorological Society: In Press.
26
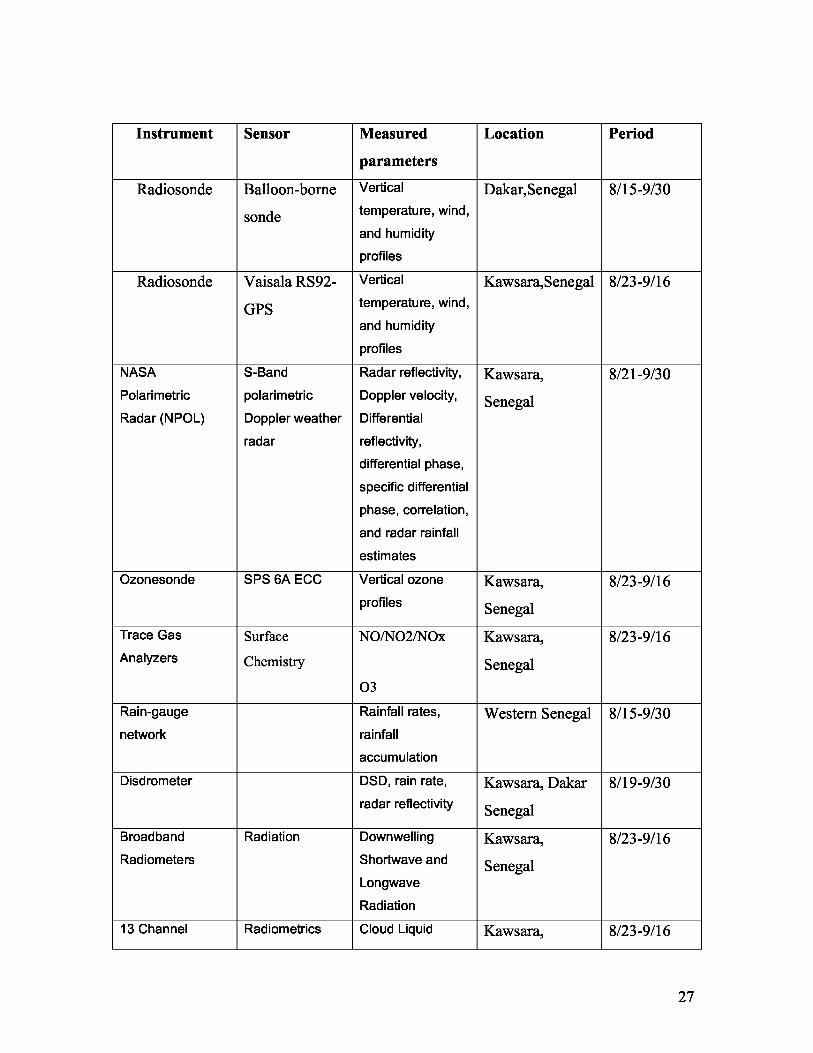
Instrument Sensor Measured Location Period
parameters
Radiosonde Balloon-borne Vertical Dakar,Senegal 8/15-9/30
sonde temperature, wind,
and humidity
profiles
Radiosonde Vaisala RS92- Vertical Kawsara,Senegal 8/23-9/16
GPS temperature, wind,
and humidity
profiles
NASA S-Band Radar reflectivity, Kawsara, 8/21-9/30Polarimetric polarimetric Doppler velocity, SenegalRadar (NPOL) Doppler weather Differential
radar reflectivity,
differential phase,
specific differential
phase, correlation,
and radar rainfall
estimates
Ozonesonde SPS 6A ECC Vertical ozone Kawsara, 8/23-9/16profiles Senegal
Trace Gas Surface NO/NO2/NOx Kawsara, 8/23-9/16Analyzers Chemistry Senegal
O3
Rain-gauge Rainfall rates, Western Senegal 8/15-9/30network rainfall
accumulation
Disdrometer DSD, rain rate, Kawsara, Dakar 8/19-9/30radar reflectivity Senegal
Broadband Radiation Downwelling Kawsara, 8/23-9/16Radiometers Shortwave and Senegal
Longwave
Radiation
13 Channel Radiometrics Cloud Liquid Kawsara, 8/23-9/16
27

Microwave MVP-300 Water Content SenegalRadiometer and Vertical
Profile of Water
Vapor
Automated Sun Yankee MFRSR- Spectral Total, Kawasara, 8/23-9/16Photometer 7 Direct, and Diffuse Senegal
Irradiance
Derived Aerosol
and Cloud Optical
Properties
Mircotops Aerosol Optical 8/23-9/16Depth
10 meter flux LI-COR CO2/H2O Kawsara, 8/23-9/16tower Senegal
Kipp and Zoen Broadband Net
CNR1 Radiometer
RALI instrument Radar FA-20 (Dakar) 9/16-9/30(RASTA cloud 5 beam Doppler reflectivity andradar and LNG Cloud radar +
Dopplerlidar) three-
wavelengths velocity, lidar
backscatter lidar backscatter,
cloud
microphysical
and radiative
properties
In-situ FSSP, 1D-P, Insitu -Cloud FA-20 (Dakar) 9/16-9/30microphysical 2D-C, and 2D-P microphysics
probes
Dropsondes VAISALA RD93 Vertical profiles of FA-20 (Dakar) 9/16-9/30temperature, wind
, relative humidity
Table 1: Senegal SOP3 measurements.
28

Figure 1. Rain Gauge Network and August 18-September 30 th Daily Rain Accumulation
at Kawsara
Figure 2. (a) 8/15-8/31 NCEP V, (b) NCEP U, (c) NCEP Specific humidity, (d) Dakar
Wind Speed (e) Dakar Relative Humidity (f) Dakar potential temperature differences.
Figure 3. AOT at 440 microns at Mbour Senegal for (a) 15-31 August, (b) 1-30
September.
Figure 4. 19 August Cloud Top Temperatures at (a) 0600 UTC, (b) 1200 UTC, (c) 1600
UTC, (d) NCEP 1200 UTC 700 hPa streamlines overlain with lightning from 1200-1800
UTC.
Figure 5. (a) 19 August TRMM maximum reflectivity from 1143 UTC overpass (b)
TRMM cross section of reflectivity at 13.2N (c) vertical profiles of wind speed from
Dakar on 19 August 1200 UTC and 20 August 0000 UTC. (d) same as c except wind
direction.
Figure 6. 31 August Cloud Top Temperatures at (a) 0600 UTC, (b) 1200 UTC, (c) 1600
UTC, (d) NCEP 1200 UTC 700 hPa streamlines overlain with lightning from 1200-1800
UTC.
Figure 7. (a) 31 August TRMM maximum reflectivity from 0535 UTC overpass (b)
TRMM cross section of reflectivity at 15.1N (c) vertical profiles of wind speed from
Kawsara on 31 August 0000 UTC and 1152 UTC. (d) same as c except wind direction.
29

Figure 8. 31 August Kawsara measurements of : (a) 0800 UTC NPOL Radar 4 km
reflectivity, (b) NPOL cross-section of reflectivity (dBz), (c) Flux tower 1.5 m pressure
and temperature, (d) 12 m wind speeds and direction.
Figure 9. (a) 9/1-9/15 NCEP V, (b) NCEP U, (c) NCEP Specific humidity, (d) Dakar
Wind Speed (e) Dakar Relative Humidity (f) Dakar potential temperature differences.
Figure 10. Cloud Top Temperatures at (a) 01 Sept. 2000 UTC, (b) 02 Sept 0000 UTC,
(c) 02 Sept. 0200 UTC, (d) NCEP 0000 UTC 02 Sept. 700 hPa streamlines overlain with
lightning from 2000-0400 UTC.
Figure 11. (a) 01 Sept TRMM maximum reflectivity from 1858 UTC overpass (b)
TRMM cross section of reflectivity at 15.1N (c) vertical profiles of wind speed from
Kawsara on 02 Sept 0000 UTC and 1152 UTC. (d) same as c except wind direction.
Figure 12. 01-02 Sept Kawsara measurements of : (a) 0000 UTC 2 Sept NPOL Radar 4
km reflectivity, (b) NPOL cross-section of reflectivity (dBz), (c) Flux tower 1.5 m
pressure and temperature, (d) 12 m wind speeds and direction.
Figure 13. 11 September Cloud Top Temperatures at (a) 0200 UTC, (b) 0600 UTC, (c)
1000 UTC, (d) NCEP 0600 UTC 700 hPa streamlines overlain with lightning from 0300-
1000 UTC.
Figure 14. 11 September Kawsara measurements of : (a) NPOL Radar 4 km reflectivity,
(b) NPOL cross-section, (c) Flux tower 1.5 m pressure and temperature, (d) 12 m wind
speeds and direction.
Figure 15. TRMM microphysical properties for (a) 19 August precipitation water; (b) 31
August precipitation water; (c) 01 September precipitation water; for (a) 19 August
30

precipitation ice; (b) 31 August precipitation ice; (c) 01 September precipitation ice.
Units in g/m3;
Figure 16. (a) 9/16-9/30 NCEP V, (b) NCEP U, (c) NCEP Specific humidity, (d) Dakar
Wind Speed (e) Dakar Relative Humidity (f) Dakar potential temperature differences.
Figure 17. Meteosat brightness temperature in the 10.8 m channel for the 22 September
2006 (a) at 1330 UTC (b) 15 UTC (c) 1630 UTC with NPOL reflectivity at 2 km height
superimposed. Black dashed lines show 100, 200 and 300 km range from Kawsara. (d)
RASTA 94 GHz reflectivity composite (e) CloudSat 94 GHz reflectivity with ground
track shown by the black solid lines.
Figure 18. Scatterplot of Nadir Doppler Velocity versus radar reflectivity measured by
the RASTA 95 GHz Doppler radar for all the Falcon 20 flights during AMMA SOP3.
The non-linear regression to these data points is shown as a red line, and the a and b
parameters are also given.
Figure 19. Mean vertical profile of (a) vertical air motion, (b) terminal fall velocity, (c)
ice water content (IWC), (d) visible extinction (a), and (e) effective radius. These mean
vertical profiles have been derived from all the Falcon 20 flights during AMMA SOP3.
Figure 20. The statistical relationship between terminal fall velocity of ice crystals and
ice water content derived from all Falcon 20 flights (blue data points, and red line for the
fit to the data points) and from two GCM parameterization of the same statistical
relationship: the Rotstayn (1997) parameterization of precipitating and cloud ice, and the
Morrison and Gettelman (2008) parameterization of precipitating ice.
31

Figure 21. (a-c) Horizontal cross sections of geopotential height (m) and horizontal wind
at 1000 hPa analysed by ECMWF; (d-f) as (a-c) except at 700 hPa; (g-i) as (a-c) except at
300 hPa; (j-l) brightness temperature (°C) in the water vapour channel at 7.3µm from
Meteosat-9. These images are from 16 September 2006 at 00 UTC (top: a, d, g and j) till
17 September 2006 at 00 UTC (bottom: c, f, i and l) with a time interval of 12 hours.
Heights and brightness temperature scales are indicated on the top left of each column.
During flight 67 on 16 September 2006, 8 successful dropsondes were launched between
14:52 and 16:42 UTC within an area delimited by the black squares in (b, e, h, k). The
dashed lines indicate the location of the zonal cross-sections represented in Fig. 22.
Figure 22. (a) zonal cross-section of relative vorticity (s -1 ) obtained with dropsonde data
of flight 67 in AMMA SOP-3 (the location of these zonal cross-sections is indicated by
the dashed lines in Fig. 21). The horizontal axis indicates longitude in degrees and the
vertical axis gives the altitude in meters; (b) as (a) except for relative humidity (%). The
grey shaded scale of relative vorticity (relative humidity) is indicated on the top (bottom)
right. The horizontal velocity is represented by arrows with the scale indicated in the
bottom right.
32

Figure 23. As in Fig. 21, except from 18 September 2006 at 00 UTC (top: a, d, g and j)
till 20 September 2006 at 00 UTC (bottom: e, j, o and t). During flight 68 on 18
September 2006, 10 successful dropsondes were launched between 14:44 and 16:46 UTC
within an area delimited by the black squares in (b, g, l, q). The dashed lines indicate the
location of the zonal cross-sections represented in fig. 24a, b. During flight 69 on 19
September 2006, 12 successful dropsondes were launched between 11:11 and 13:12 UTC
within an area delimited by the black squares in (d, i, n, s). The dashed lines indicate the
location of the zonal cross-sections represented in Figs. 22c, d.
Figure 24. (a) as Fig. 22a, except for flight 69; (b) as Fig. 22a, except for flight 68; (c) as
Fig. 22b, except for flight 68; (d) as Fig. 22b, except for flight 69. The locations of these
zonal cross-sections are indicated by the dashed lines in Fig. 23.
Figure 25. As in Fig. 21, except from 23 September 2006 at 00 UTC (top: a, d, g and j)
till 24 September 2006 at 00 UTC (bottom: c, f, i and l). During flight 73 on 23
September 2006, 9 successful dropsondes were launched between 11:18 and 13:18 UTC
within an area delimited by the black squares in (b, e, h, k). The dashed lines indicate the
location of the zonal cross-sections represented in Fig. 26.
Figure 26. (a) as Fig. 22a, except for flight 73; (b) as Fig. 22b, except for flight 73. The
location of these zonal cross-sections is indicated by the dashed lines in Fig. 25.
33

.&pye
Figure 1. Rain Gauge Network and August 18-September 30 th Daily Rain Accumulationat Kawsara, Senegal.
34

35

Figure 2. (a) 8/15-8/31 NCEP V, (b) NCEP U, (c) NCEP Specific humidity, (d) DakarWind Speed (e) Dakar Relative Humidity (f) Dakar potential temperature differences.
36

:duli57ND-dy
Figure 3. AOT at 440 microns at Mbour Senegal for (a) 15-31 August, (b) 1-30September.
37

Figure 4. 19 August Cloud Top Temperatures at (a) 0600 UTC, (b) 1200 UTC, (c) 1600UTC, (d) NCEP 1200 UTC 700 hPa streamlines overlain with lightning from 1200-1800UTC.
38

;0 is 10 ;20 }56 }55 145
Figure 5. (a) 19 August TRMM maximum reflectivity from 1143 UTC overpass (b)TRMM cross section of reflectivity at 13.2N (c) vertical profiles of wind speed fromDakar on 19 August 1200 UTC and 20 August 0000 UTC. (d) same as c except winddirection.
39

Figure 6. 31 August Cloud Top Temperatures at (a) 0600 UTC, (b) 1200 UTC, (c) 1600UTC, (d) NCEP 1200 UTC 700 hPa streamlines overlain with lightning from 1200-1800UTC.
40

` 3- r^l0.is 18. :20 pW.}35" i46 I&Y
Figure 7. (a) 31 August TRMM maximum reflectivity from 0535 UTC overpass (b)TRMM cross section of reflectivity at 15.1N (c) vertical profiles of wind speed fromKawsara on 31 August 0000 UTC and 1152 UTC. (d) same as c except wind direction.
41

M
Figure 8. 31 August Kawsara measurements of: (a) 0800 UTC NPOL Radar 4 kmreflectivity, (b) NPOL cross-section of reflectivity (dBz), (c) Flux tower 1.5 m pressureand temperature, (d) 12 m wind speeds and direction.
42

43

Figure 9. (a) 9/1-9/15 NCEP V, (b) NCEP U, (c) NCEP Specific humidity, (d) DakarWind Speed (e) Dakar Relative Humidity (f) Dakar potential temperature differences.
44

Figure 10. Cloud Top Temperatures at (a) 01 Sept. 2000 UTC, (b) 02 Sept 0000 UTC,(c) 02 Sept. 0200 UTC, (d) NCEP 0000 UTC 02 Sept. 700 hPa streamlines overlain withlightning from 2000-0400 UTC.
45

^^^— t ,540:. __
a y.
IN 3 L3W1SNf ,72.6^12:6^12: ^Yf14 ! ^A'r17M'1,1.&1^1'. 67i 1'1:^1YI1'7%' I ------^ti^.--`^L
G b0. 8.0. 104.]24.i r4.]6U.r-110.r 57 -.1Qr -20' ' ^UTa
Figure 11. (a) 01 Sept TRMM maximum reflectivity from 1858 UTC overpass (b)TRMM cross section of reflectivity at 15.1N (c) vertical profiles of wind speed fromKawsara on 02 Sept 0000 UTC and 1152 UTC. (d) same as c except wind direction.
46

o ao 47} 5Cr BG a - ^ r^ 1 I¢Picio ,c e . along ;cross sock W .; ,rn }, tir, r,
i^jAy9I .)4 '_?4,?.i1i L74^,.7 54 '.'il '7A5.4, x,4..5
,J^li^nl Day
Figure 12. 01-02 Sept. Kawsara measurements of : (a) 0000 UTC 2 Sept NPOL Radar4 km reflectivity, (b) NPOL cross-section of reflectivity (dBZ), (c) Flux tower 1.5 mpressure and temperature, (d) 12 m wind speeds and direction.
47

Figure 13. 11 September Cloud Top Temperatures at (a) 0200 UTC, (b) 0600 UTC, (c)1000 UTC, (d) NCEP 0600 UTC 700 hPa streamlines overlain with lightning from 0300-1000 UTC.
48

iin
Figure 14. 11 September Kawsara measurements of: (a) NPOL Radar 4 km reflectivity,(b) NPOL cross-section, (c) Flux tower 1.5 m pressure and temperature, (d) 12 m windspeeds and direction.
49

.0.21.
1014. :fl!6 iff:'8 `1; 1;251
Figure 15. TRMM microphysical properties for (a) 19 August precipitation water; (b) 31August precipitation water; (c) 01 September precipitation water; for (a) 19 Augustprecipitation ice; (b) 31 August precipitation ice; (c) 01 September precipitation ice.Units in g/m3;
50

51

Figure 16. (a) 9/16-9/30 NCEP V, (b) NCEP U, (c) NCEP Specific humidity, (d) DakarWind Speed (e) Dakar Relative Humidity (f) Dakar potential temperature differences.
52

Figure 17. Meteosat brightness temperature in the 10.8 m channel for the 22 September2006 (a) at 1330 UTC (b) 15 UTC (c) 1630 UTC with NPOL reflectivity at 2 km heightsuperimposed. Black dashed lines show 100, 200 and 300 km range from Kawsara. (d)RASTA 94 GHz reflectivity composite (e) CloudSat 94 GHz reflectivity with groundtrack shown by the black solid lines.
53

R3ift%livit`i dBz+^Y ( _.)
Figure 18. Scatterplot of Nadir Doppler Velocity versus radar reflectivity measured bythe RASTA 95 GHz Doppler radar for all the Falcon 20 flights during AMMA SOP3.The non-linear regression to these data points is shown as a red line, and the a and bparameters are also given.
54

^0',%, S0!2- l0 9 9,^L1 `112- (40) $0, !80 900; 920;
9 ZINC; I'g7m 3] l L g a, Y 1 ]); ^RLE'r^N^'m^,
Figure 19. Mean vertical profile of (a) vertical air motion, (b) terminal fall velocity, (c)ice water content (IWC), (d) visible extinction (a), and (e) effective radius. These meanvertical profiles have been derived from all the Falcon 20 flights during AMMA SOP3.
55

Figure 20. The statistical relationship between terminal fall velocity of ice crystals andice water content derived from all Falcon 20 flights (blue data points, and red line for thefit to the data points) and from two GCM parameterization of the same statisticalrelationship: the Rotstayn (1997) parameterization of precipitating and cloud ice, and theMorrison and Gettelman (2008) parameterization of precipitating ice.
56

Figure 21. (a-c) Horizontal cross sections of geopotential height (m) and horizontal windat 1000 hPa analysed by ECMWF; (d-f) as (a-c) except at 700 hPa; (g-i) as (a-c) except at300 hPa; (j-l) brightness temperature (°C) in the water vapour channel at 7.3µm fromMeteosat-9. These images are from 16 September 2006 at 00 UTC (top: a, d, g and j) till17 September 2006 at 00 UTC (bottom: c, f, i and l) with a time interval of 12 hours.Heights and brightness temperature scales are indicated on the top left of each column.During flight 67 on 16 September 2006, 8 successful dropsondes were launched between14:52 and 16:42 UTC within an area delimited by the black squares in (b, e, h, k). Thedashed lines indicate the location of the zonal cross-sections represented in Fig. 22.
57

Figure 22. (a) zonal cross-section of relative vorticity (s -1 ) obtained with dropsonde dataof flight 67 in AMMA SOP-3 (the location of these zonal cross-sections is indicated bythe dashed lines in Fig. 21). The horizontal axis indicates longitude in degrees and thevertical axis gives the altitude in meters; (b) as (a) except for relative humidity (%). Thegrey shaded scale of relative vorticity (relative humidity) is indicated on the top (bottom)right. The horizontal velocity is represented by arrows with the scale indicated in thebottom right.
58

Figure 23. As in Fig. 21, except from 18 September 2006 at 00 UTC (top: a, d, g and j)till 20 September 2006 at 00 UTC (bottom: e, j, o and t). During flight 68 on 18September 2006, 10 successful dropsondes were launched between 14:44 and 16:46 UTCwithin an area delimited by the black squares in (b, g, l, q). The dashed lines indicate thelocation of the zonal cross-sections represented in fig. 24a, b. During flight 69 on 19September 2006, 12 successful dropsondes were launched between 11:11 and 13:12 UTCwithin an area delimited by the black squares in (d, i, n, s). The dashed lines indicate thelocation of the zonal cross-sections represented in Figs. 22c, d.
59

Figure 24. (a) as Fig. 22a, except for flight 69; (b) as Fig. 22a, except for flight 68; (c) asFig. 22b, except for flight 68; (d) as Fig. 22b, except for flight 69. The locations of thesezonal cross-sections are indicated by the dashed lines in Fig. 23.
60

Figure 25. As in Fig. 21, except from 23 September 2006 at 00 UTC (top: a, d, g and j)till 24 September 2006 at 00 UTC (bottom: c, f, i and l). During flight 73 on 23September 2006, 9 successful dropsondes were launched between 11:18 and 13:18 UTCwithin an area delimited by the black squares in (b, e, h, k). The dashed lines indicate thelocation of the zonal cross-sections represented in Fig. 26.
61

Figure 26. (a) as Fig. 22a, except for flight 73; (b) as Fig. 22b, except for flight 73. Thelocation of these zonal cross-sections is indicated by the dashed lines in Fig. 25.
62

Coastal Observations of Weather Features in Senegal during the AMMA SOP-3 Period
Greg Jenkins, Paul Kucera, Everette Joseph, Jose Fuente, Amadou Gaye, John Gerlac,Frank Roux, Nicolas Viltard, Mathieu Papazzoni, Alain Protat, Dominique Bouniol,Amber Reynolds, Joel Arnault, D. Badiane, Cheikh Mouhamed Fadel Kebe, Moctar
Camara, Saidou Sall
Submitted to the Journal of the Atmospheric Sciences
Popular Summary
In 2006, the NASA African Monsoon Multidisciplinary Analyses (NAMMA)field campaign investigated the factors that control the fate of African Easterly waves(AEWs) as they transition from over the continent to the tropical eastern Atlantic Ocean.The Saharan Air Layer (SAL) frequently accompanies AEWs, introducing dry, dusty airinto convective storm systems. During Special Observing Period 3 (SOP3), 15 August –30 September 2006, ground and aircraft measurements of squall lines, SAL outbreaks,and several AEWs, some of which went on to form tropical cyclones, were investigated.Measurements were aimed at investigating and understanding precipitation processes,environmental conditions, cloud, aerosol, and microphysical processes, and space bornesensor validation (TRMM, CloudSat/Calipso).
AEWs are known to initiate convection over West Africa and are often associatedwith mesoscale convective systems (MCSs) that contribute to a large fraction of yearlyrainfall. Understanding rainfall characteristics in West Africa is of paramount importanceto a region suffering from desertification. In addition, approximately 10% of AEWsdevelop into tropical systems. During SOP3, there were approximately 7-9 AEWs andfour of these waves were linked to tropical cyclones Debby, Florence, Gordon, andHelene.
During the NAMMA field experiment, ground and aircraft instruments were usedto study meteorological phenomena on a variety of different spatial scales. Rainfallmeasurements were obtained with the ground-based NASA Polarimetric (NPOL) radar,Tropical Rainfall Measurement Mission Precipitation Radar (TRMM PR), and rain gaugenetworks. Environmental conditions were obtained using NCEP Reanalyses, a 10 meterflux tower, and radiosondes/dropsondes, which allowed for the creation of three-dimensional fields of wind, temperature, and humidity. Measurements of cloudmicrophysics were obtained using in situ measurements and cloud radar from the FA-20aircraft and the UK ATD Lightning Detection Network that measured cloud-to-ground(CG) lightning over both the continent and eastern Atlantic.
The work highlighted within this paper shows that potential hazards from MCSsor other large rainfall producing convection associated with AEWs need to be measuredand monitored for the welfare of vulnerable populations in West Africa. The NAMMAfield campaign was the first large-scale experiment in a coastal zone known to serve asthe birthplace of many hurricanes since the GATE field campaign of 1974. The ability to

improve initiation of weather forecast models from observations in West Africa may helpto protect the lives of Americans living along hurricane prone coastal regions.
Related Documents